09-10 April 2024
CFMC SSC Meeting

Caribbean Queen Triggerfish USVI SEDAR 80 Stock Assessments
09-10 April 2024
CFMC SSC Meeting
Presentation Outline
● Review of relevant term
● Summary of data and methods
● Review of data and stock assessment results
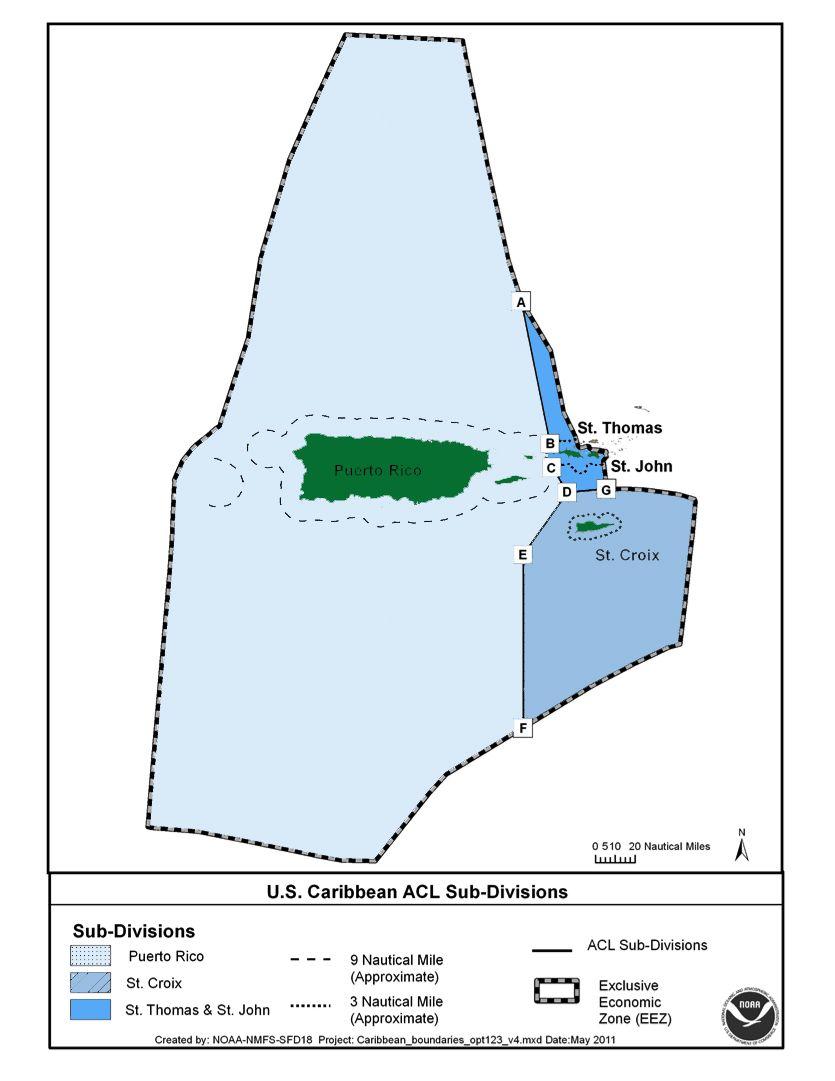
○ St. Thomas and St. John (STTJ)
○ St. Croix (STX)
U.S. Department of Commerce | National Oceanic and Atmospheric Administration | National Marine Fisheries Service Page 2
Caribbean Queen Triggerfish USVI SEDAR 80 Stock Assessments
Relevant Terms
Stock Synthesis:
- Statistical age-structured population modeling framework.
- Simulates the dynamics of the stock (mortality, maturity, growth, etc.) and dynamics of the fishery (selectivity, effort, etc.).
- Flexible in ability to use diversity of age, size, and aggregate data from fisheries and surveys.
Model fitting with a maximum likelihood approach:
- determine parameter values that make our observed data most probable.
- achieve a good match (minimize the difference) between the simulated data and the real data.
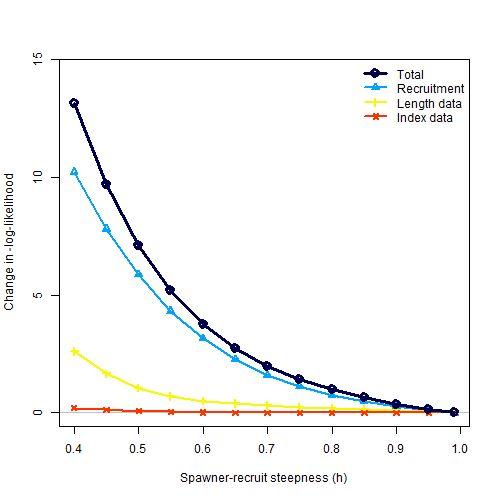
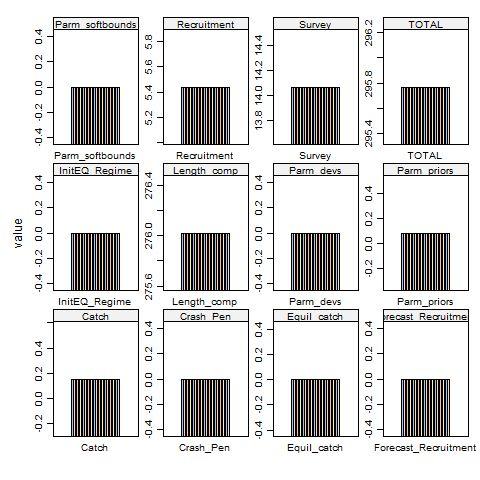
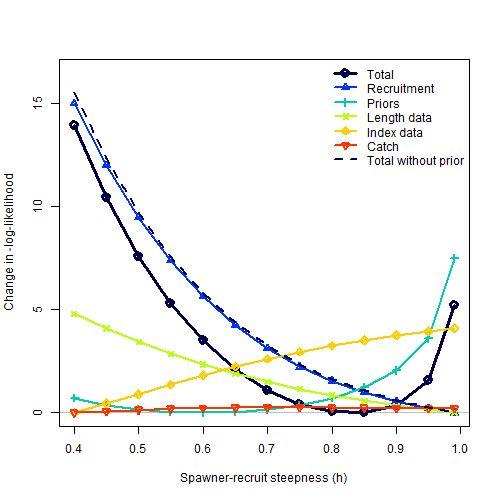
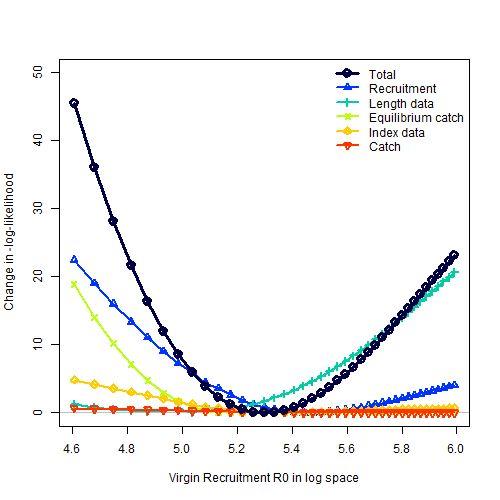
Likelihood profile: Iteratively run a Stock Synthesis model to evaluate model performance across a range of values of an input parameter.
U.S. Department of Commerce | National Oceanic and Atmospheric Administration | National Marine Fisheries Service Page 3
Example of likelihood components plotted across a likelihood profile. The example is shown for St. Croix Steepness
U.S. Department of Commerce | National Oceanic and Atmospheric Administration | National Marine Fisheries Service Page 4
Size based selectivity: the proportion of the size class which is available and vulnerable to the gear
Domed shaped selectivity: assumes that the largest or oldest members of a demographic group are not fully-vulnerable to fishing
Double-normal selectivity: (6 parameters)
- p1 – peak: beginning size for the plateau.
- p2 – top: width of plateau.
- p3 – ascending width.
- p4 – descending width.
- p5 – initial: selectivity at first bin.
- p6 – final: selectivity at last bin.
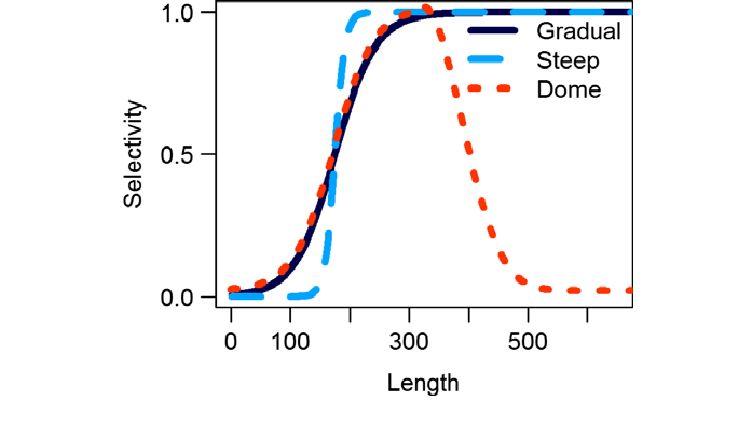
Illustrated example of three different size-based selectivities.
U.S. Department of Commerce | National Oceanic and Atmospheric Administration | National Marine Fisheries Service Page 5
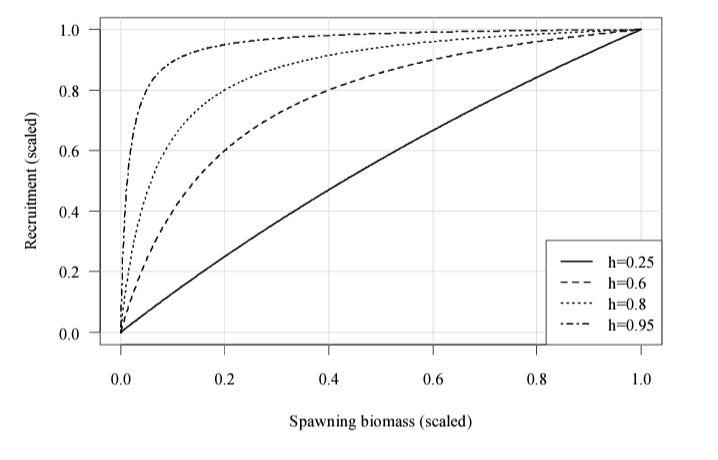
Stock recruitment relationship: The relationship between the spawning biomass and the resulting recruitment.
Steepness (h): recruitment compensation; a higher value of steepness translates into higher expected productivity, particularly at low levels of spawning biomass
R0 (R zero or r not): recruitment at unfished conditions.
U.S. Department of Commerce | National Oceanic and Atmospheric Administration | National Marine Fisheries Service Page 6
Informative Priors: provide additional information about the true value of the parameter.
Diffuse priors: provide only weak information about the value of a prior and serve to manage model performance during execution.
Jitter: Iteratively run a Stock Synthesis model with different starting parameter values.
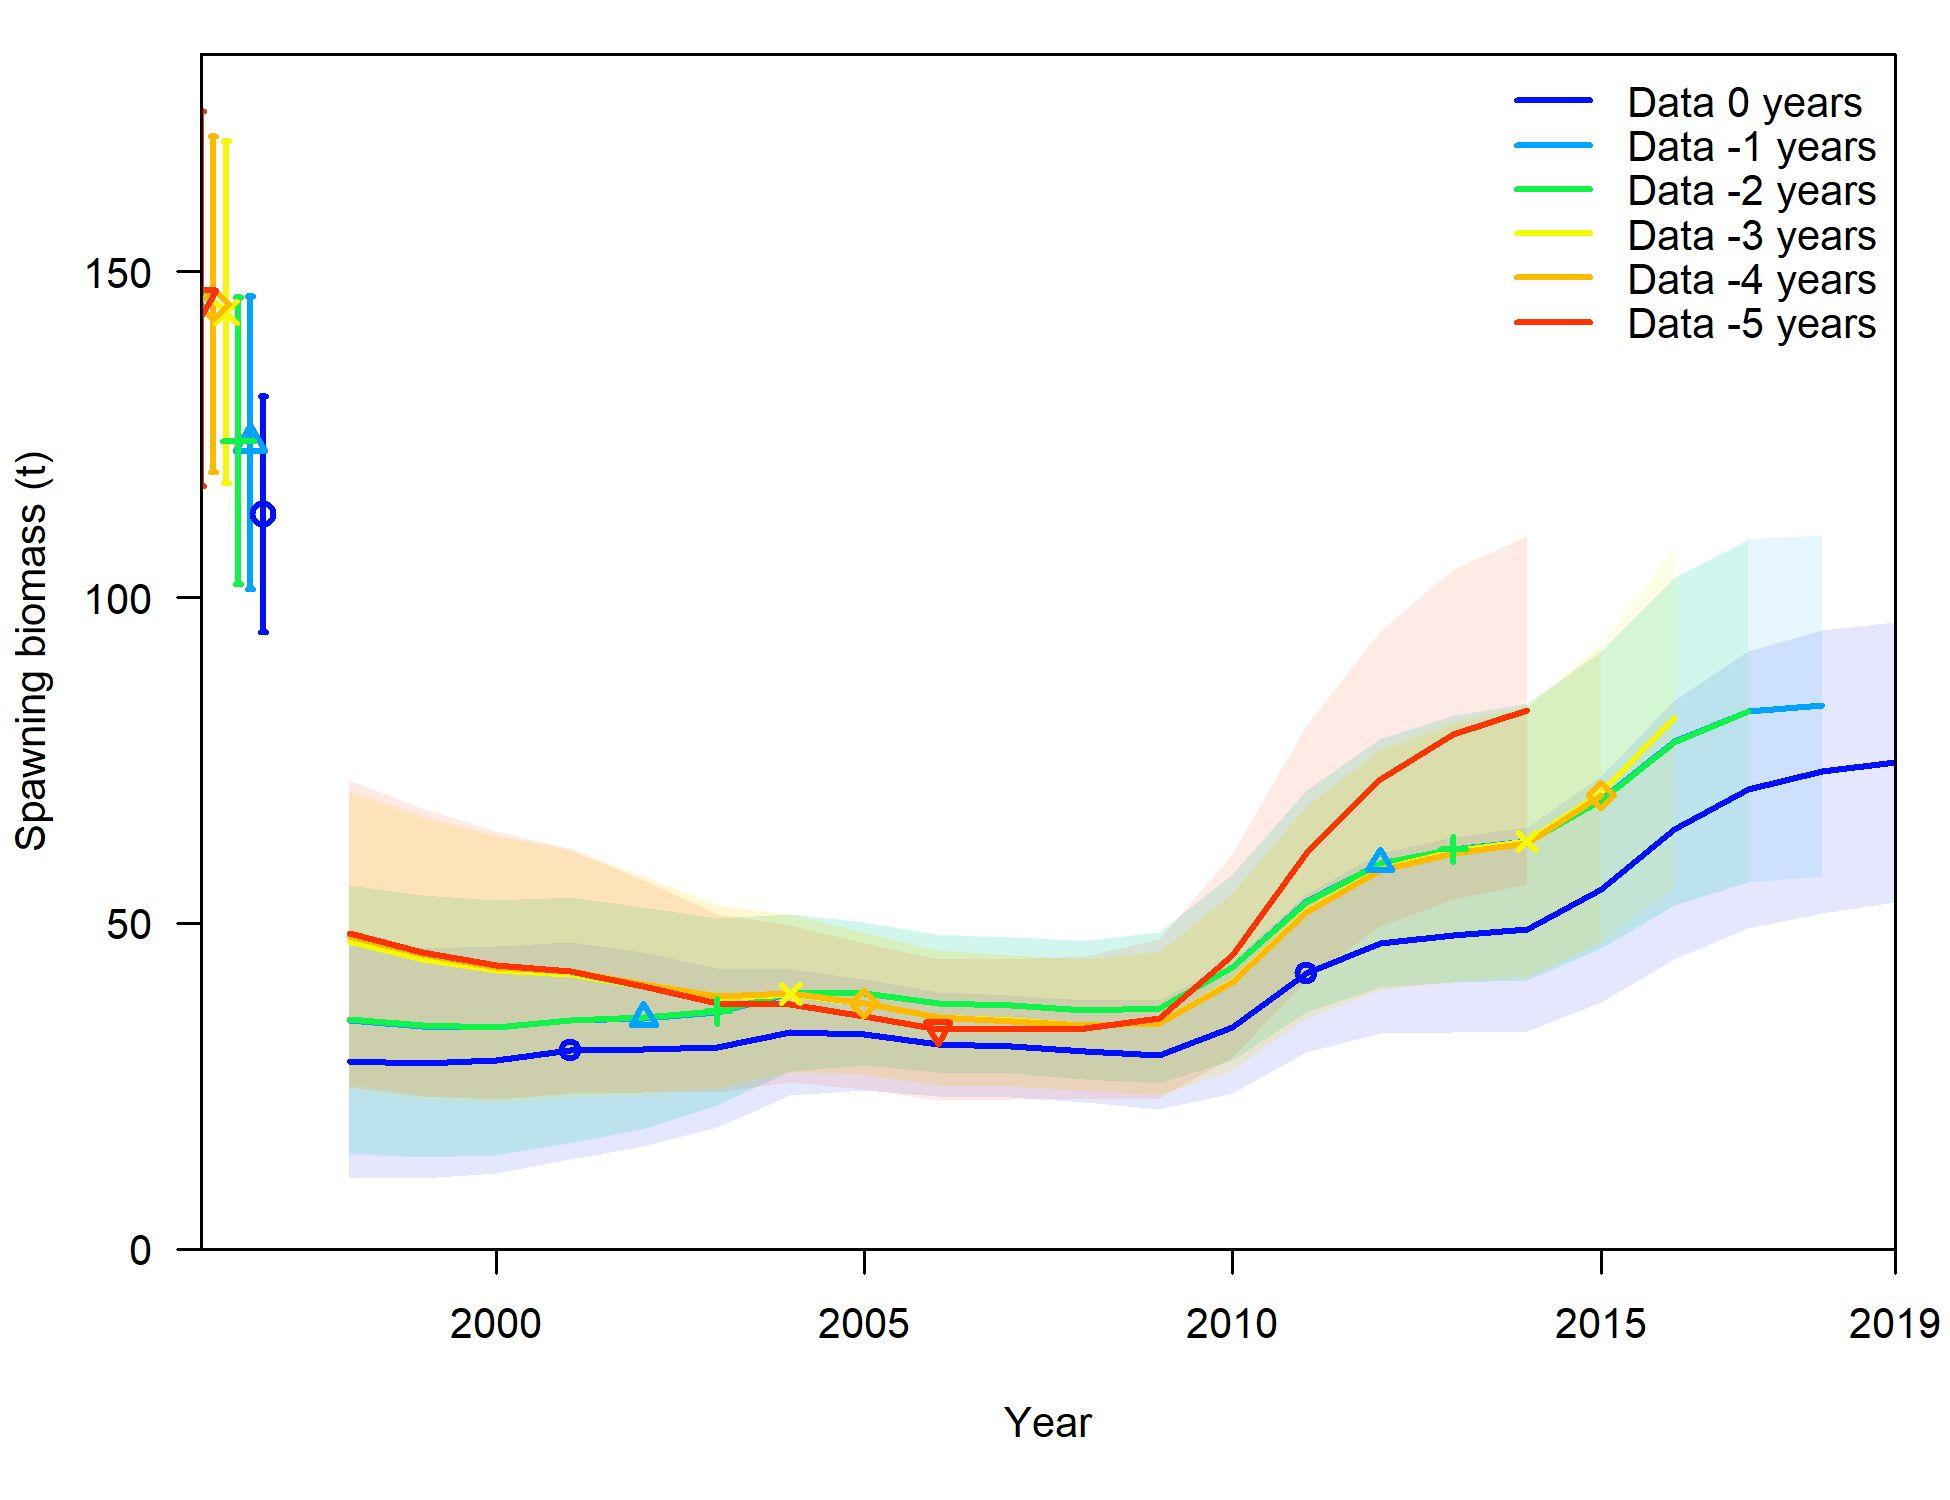
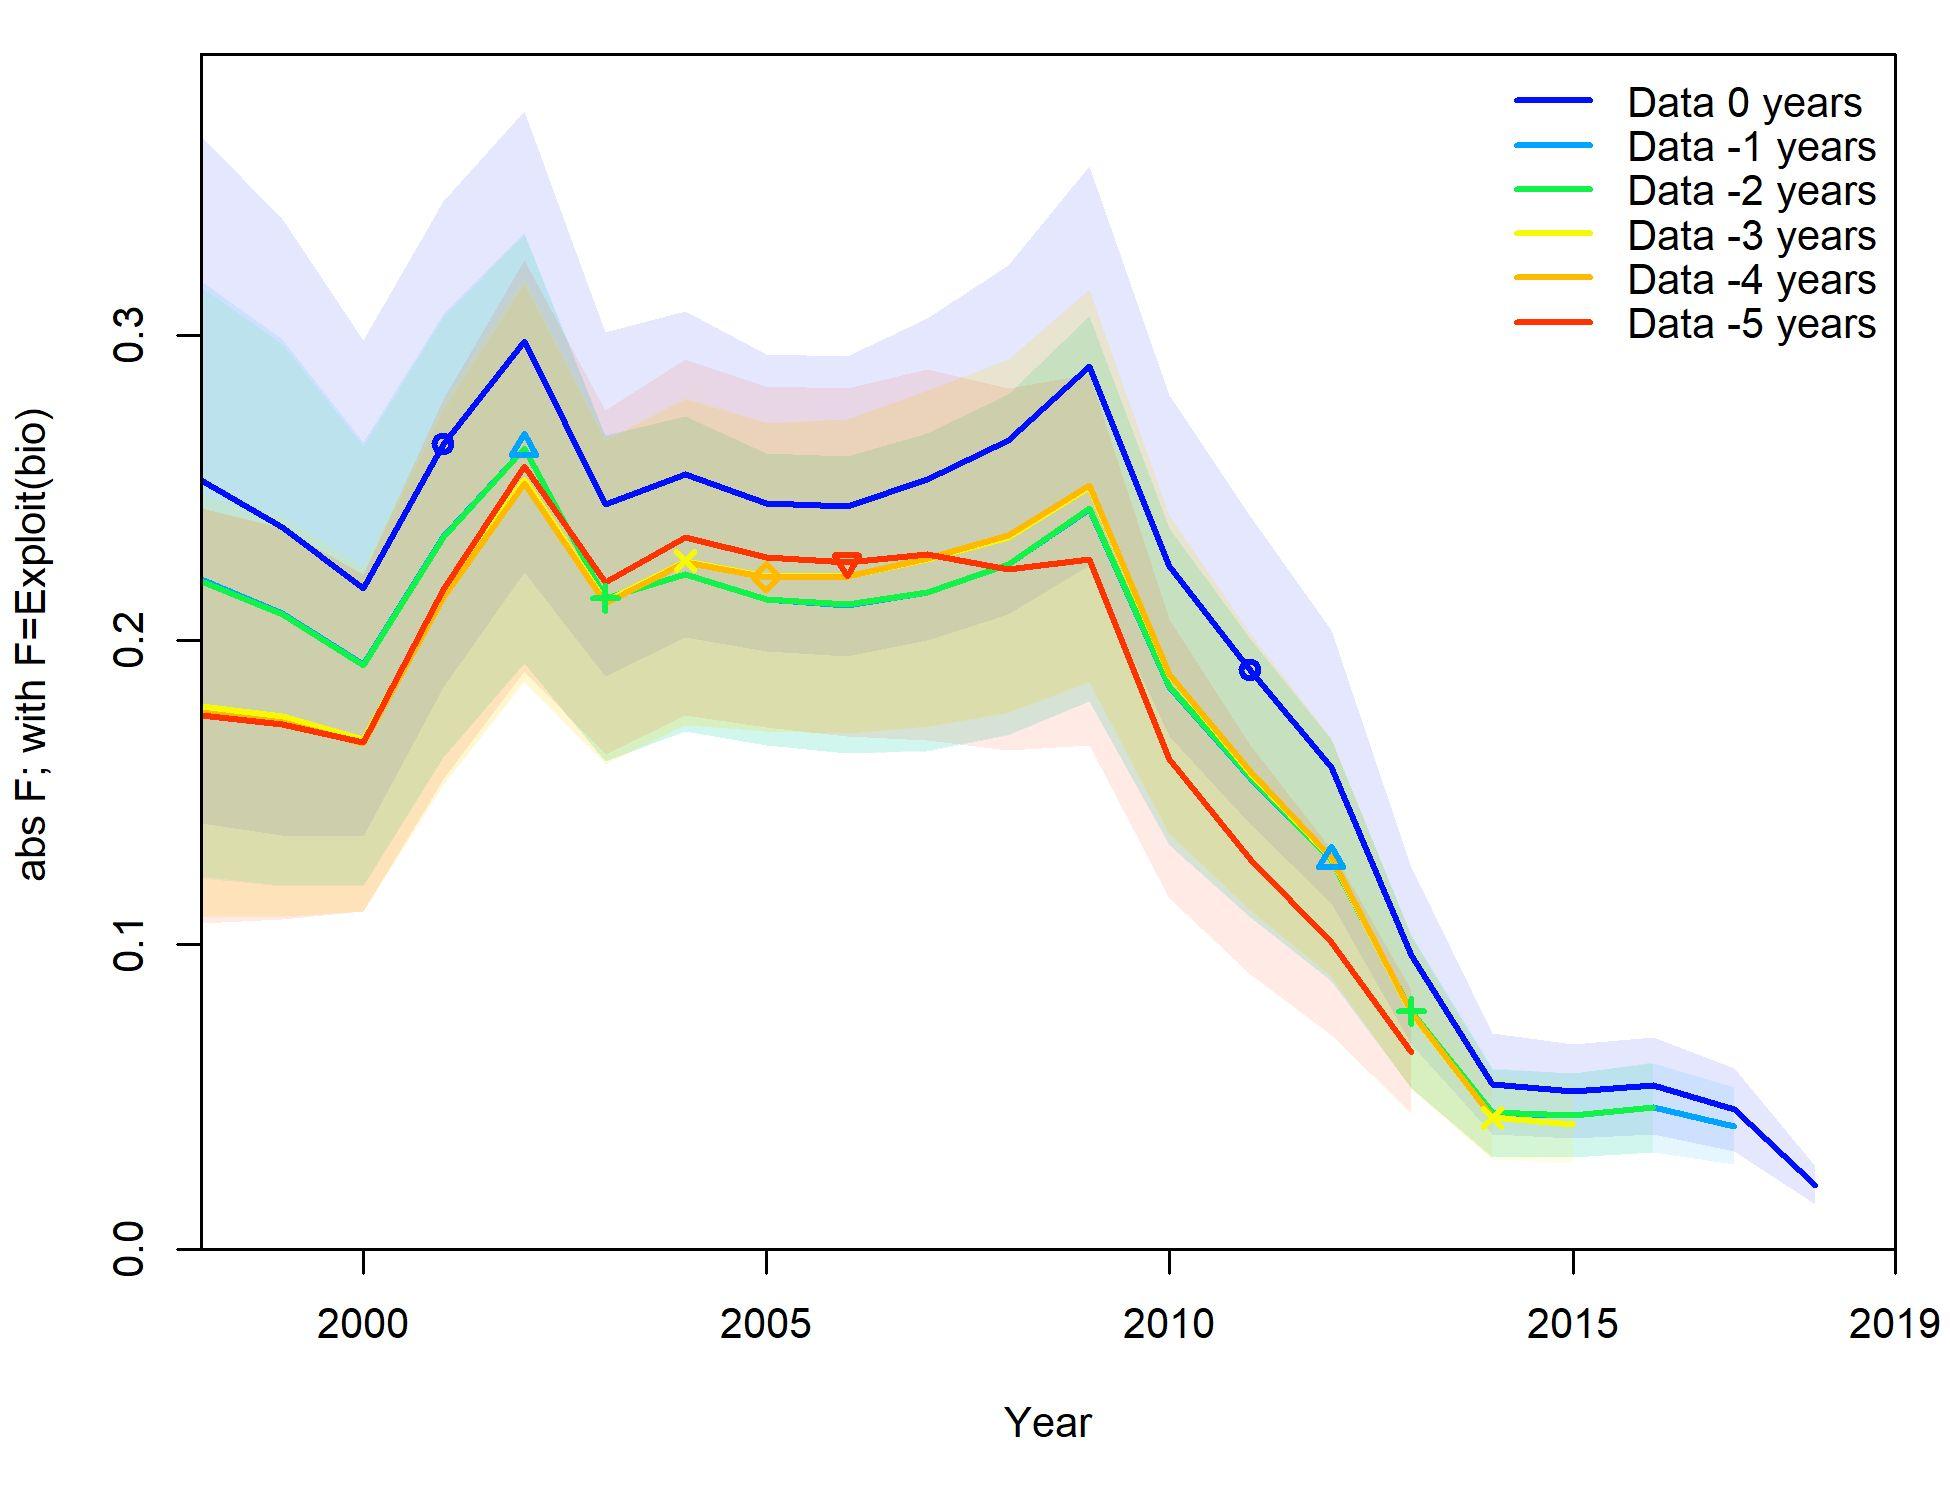
Retrospective: Adjusts the model end year and disregards data after this year.
U.S. Department of Commerce | National Oceanic and Atmospheric Administration | National Marine Fisheries Service Page 7
U.S. Department of Commerce | National Oceanic and Atmospheric Administration | National Marine Fisheries Service Page 8
Example of jitter (left) and retrospective (right). The examples are shown for St. Croix.
Forecast/Projection: Estimates of future yields under specified fishing scenarios
Uncertainty Grid: Iteratively run a Stock Synthesis model to structurally evaluate and potentially combine results across different axes of uncertainty in model dynamics.
Axes of uncertainty: Includes but is not limited to the uncertainty in the biological parameters of fish stocks, fishery exploitation patterns and information content of the data used in stock assessments.
U.S. Department of Commerce | National Oceanic and Atmospheric Administration | National Marine Fisheries Service Page 9
U.S. Department of Commerce | National Oceanic and Atmospheric Administration | National Marine Fisheries Service Page 10
Summary of data and methods
Summary of Data and Methods
Summary of Data:
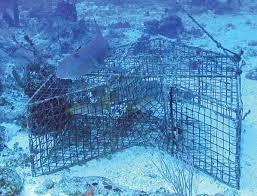
1. Fishery-dependent removal estimates and length composition
2. Fishery-independent index of abundance and length composition
3. Growth, maturity, mortality, and connectivity
Summary of Methods:
4. Model development, fit, jitter, and retrospective diagnostics
5. Major assumptions and likelihood profiles
6. Uncertainty grid, projection, and model estimates of Fishing Mortality and OFL
U.S. Department of Commerce | National Oceanic and Atmospheric Administration | National Marine Fisheries Service Page 12
1. Fishery-dependent removal estimates and length composition
● Annual species-specific landings for major commercial fleets
● Known target and take of specific sizes, however, no data on discards or discard mortality
● Observed commercial length composite including years with low sampling effort
Used to inform:
● Model start year
● Dome-shaped fleet-specific selectivity
● Fishing mortality at the start of the time series


U.S. Department of Commerce | National Oceanic and Atmospheric Administration | National Marine Fisheries Service Page 13
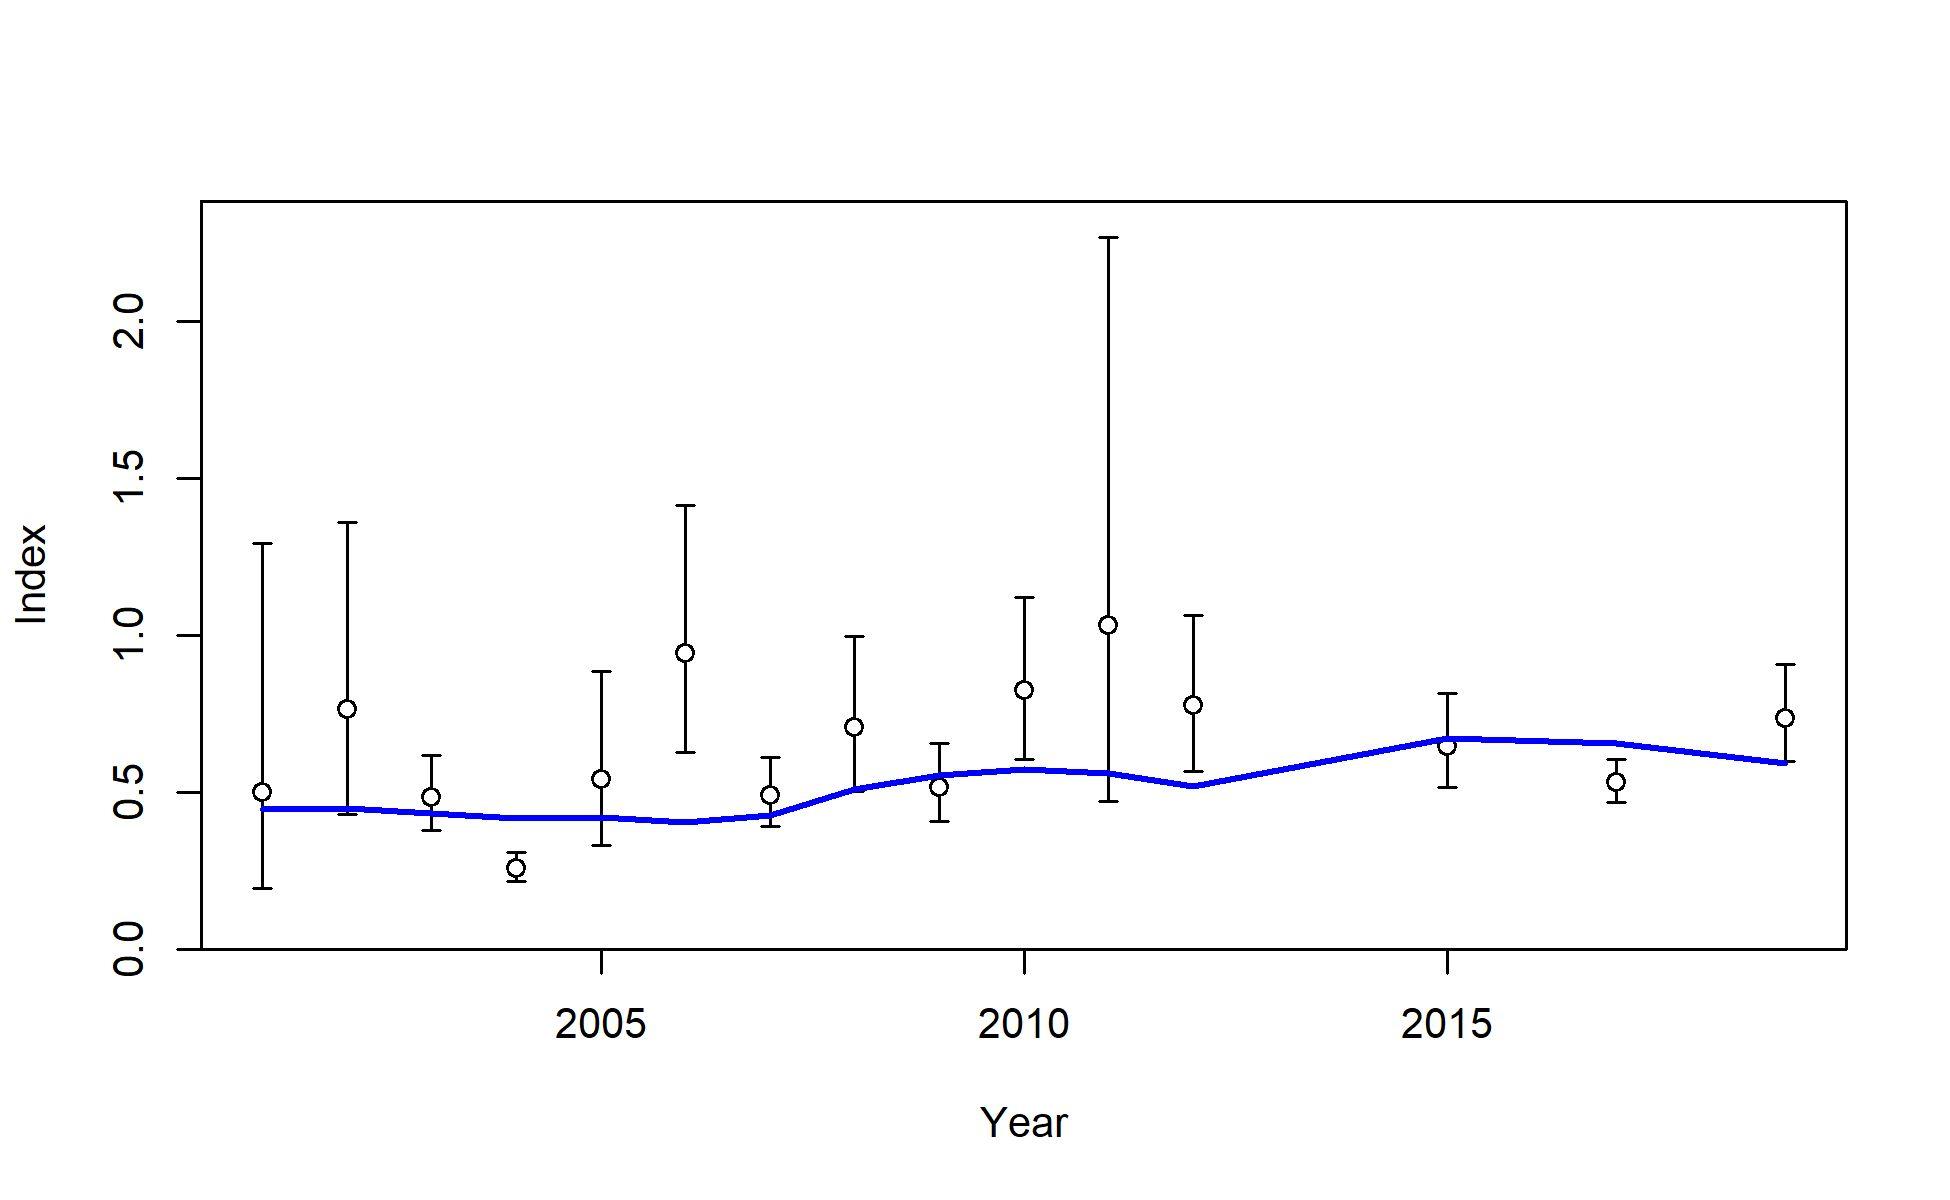
2. Fishery-independent index of abundance and length composition
● Stratified survey design (Grove et al., 2022)
● Maximum depth of 30 meters; ancillary observations from deeper survey (STT only)
● Observed length composition removing years with low numbers of observed Queen
Triggerfish (<30 fish)
Used to inform:
● Near Logistic Dome-shaped survey selectivity
● Recruitment (annual length compositions)
U.S. Department of Commerce | National Oceanic and Atmospheric Administration | National Marine Fisheries Service Page 14
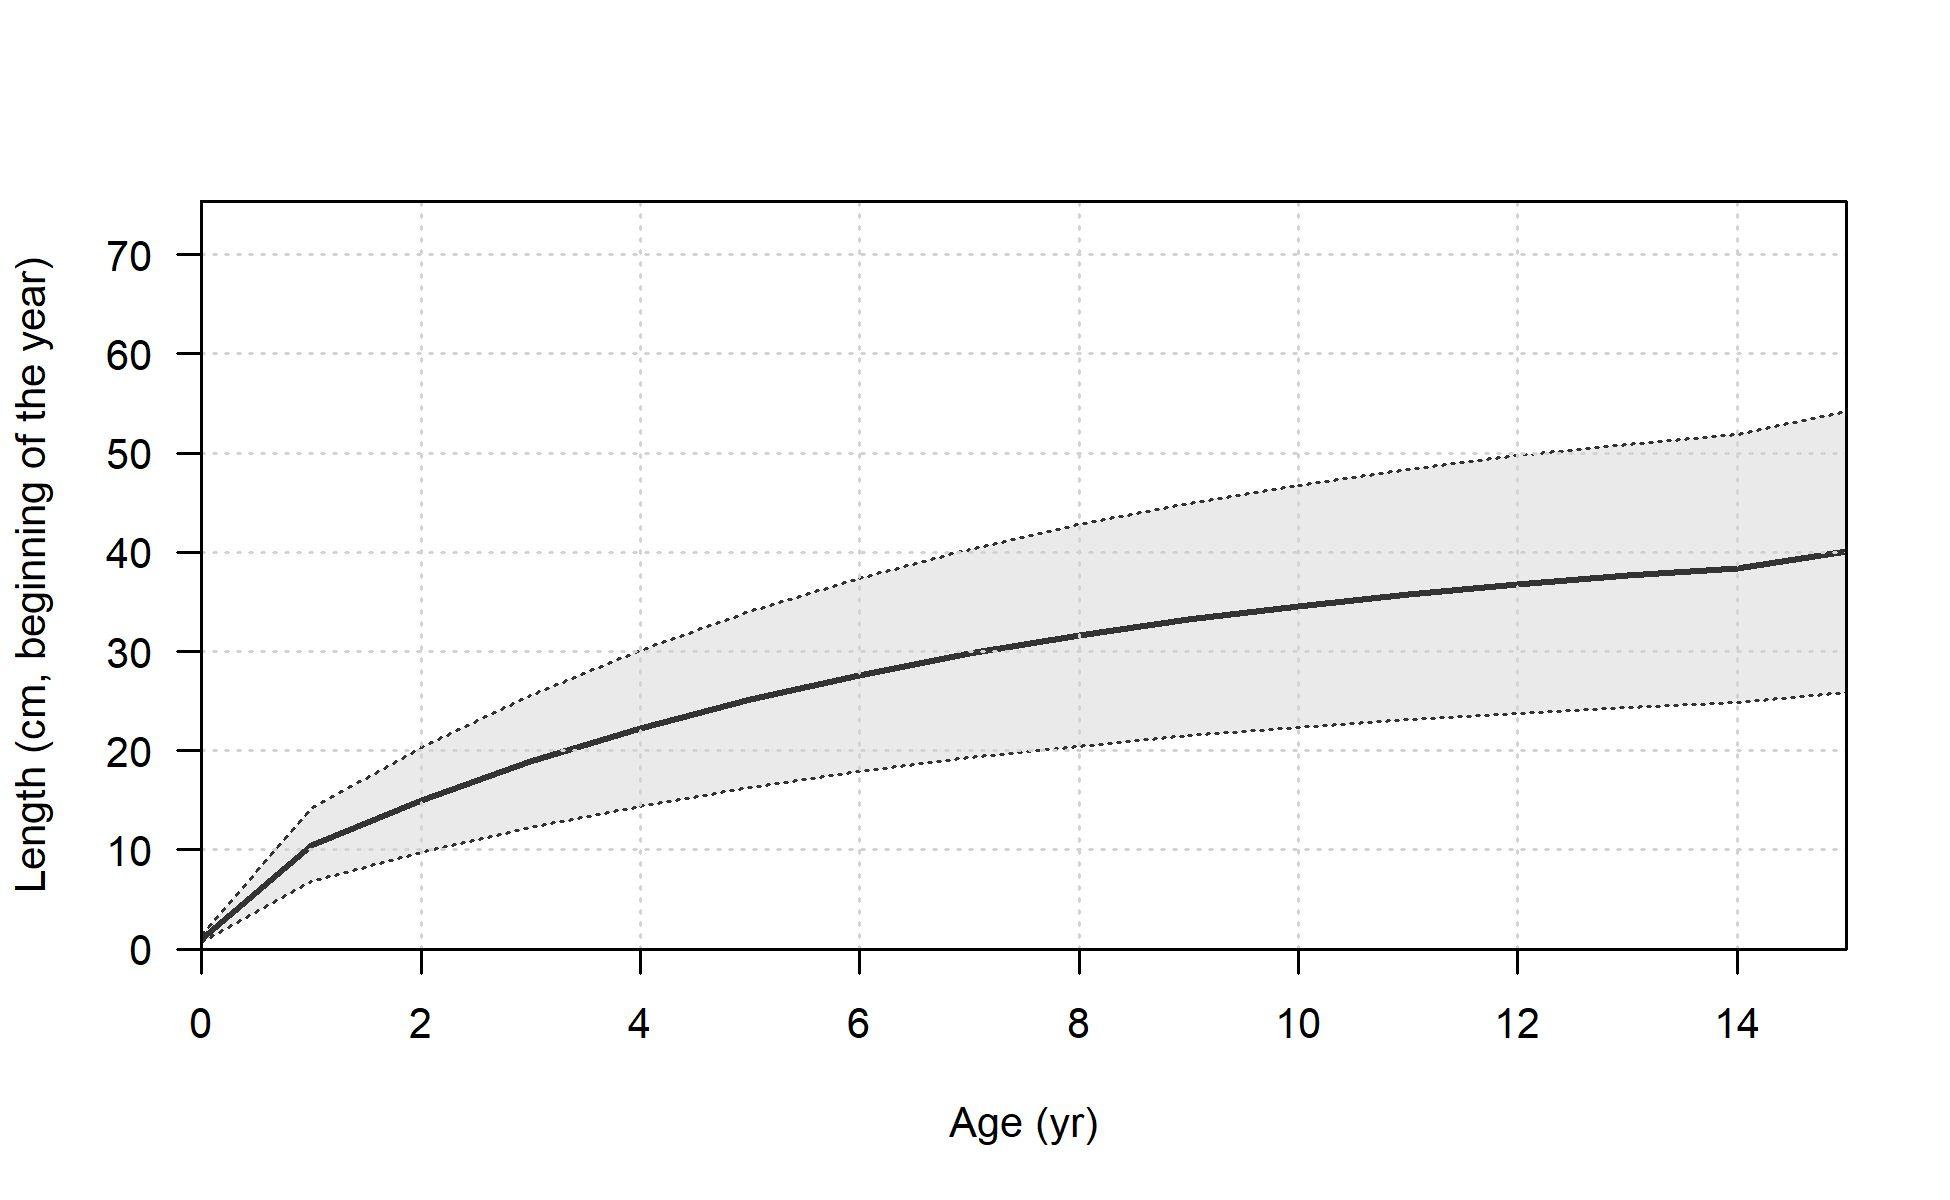
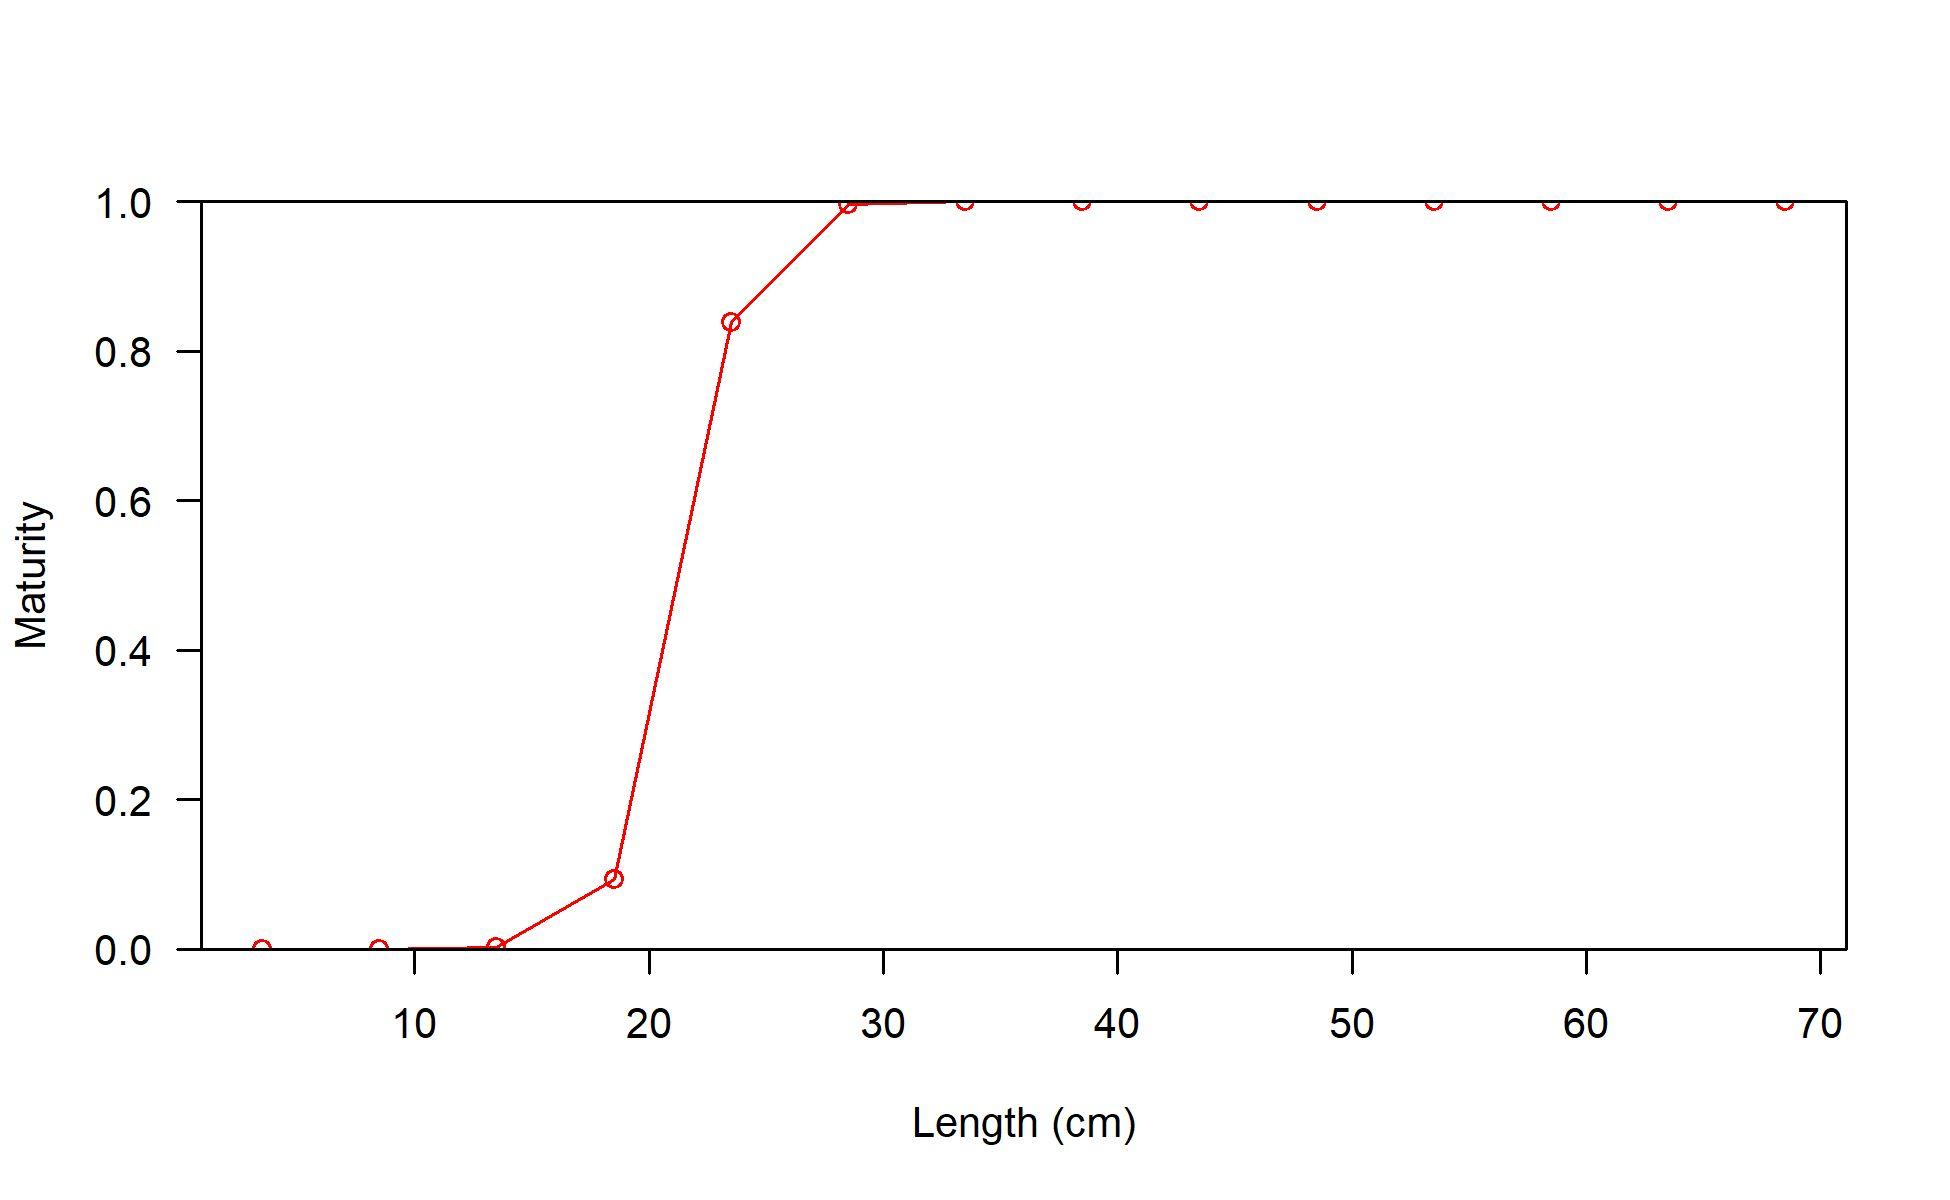
3. Growth, maturity, mortality, and connectivity
● Life history from cooperative, local, and recent studies (Shervette and Rivera-Hernandez 2022)
○ Maximum age of 23 in Caribbean; 40
○ 2,045 otoliths collected between 2012 and 2021
○ eye lens core radiocarbon age validation
● High connectivity across the region (Antoni, 2017).
Used to inform:
● Operating model stock dynamics for Growth, Longevity, Natural Mortality, and Maturity
● Fixed Steepness (0.99) and Sigma R (0.6)
U.S. Department of Commerce | National Oceanic and Atmospheric Administration | National Marine Fisheries Service Page 15
4. Model development, fit, jitter, and retrospective diagnostics
● Model development methods balanced model complexity with model stability and incorporated 4 key changes base on past SSC discussions:
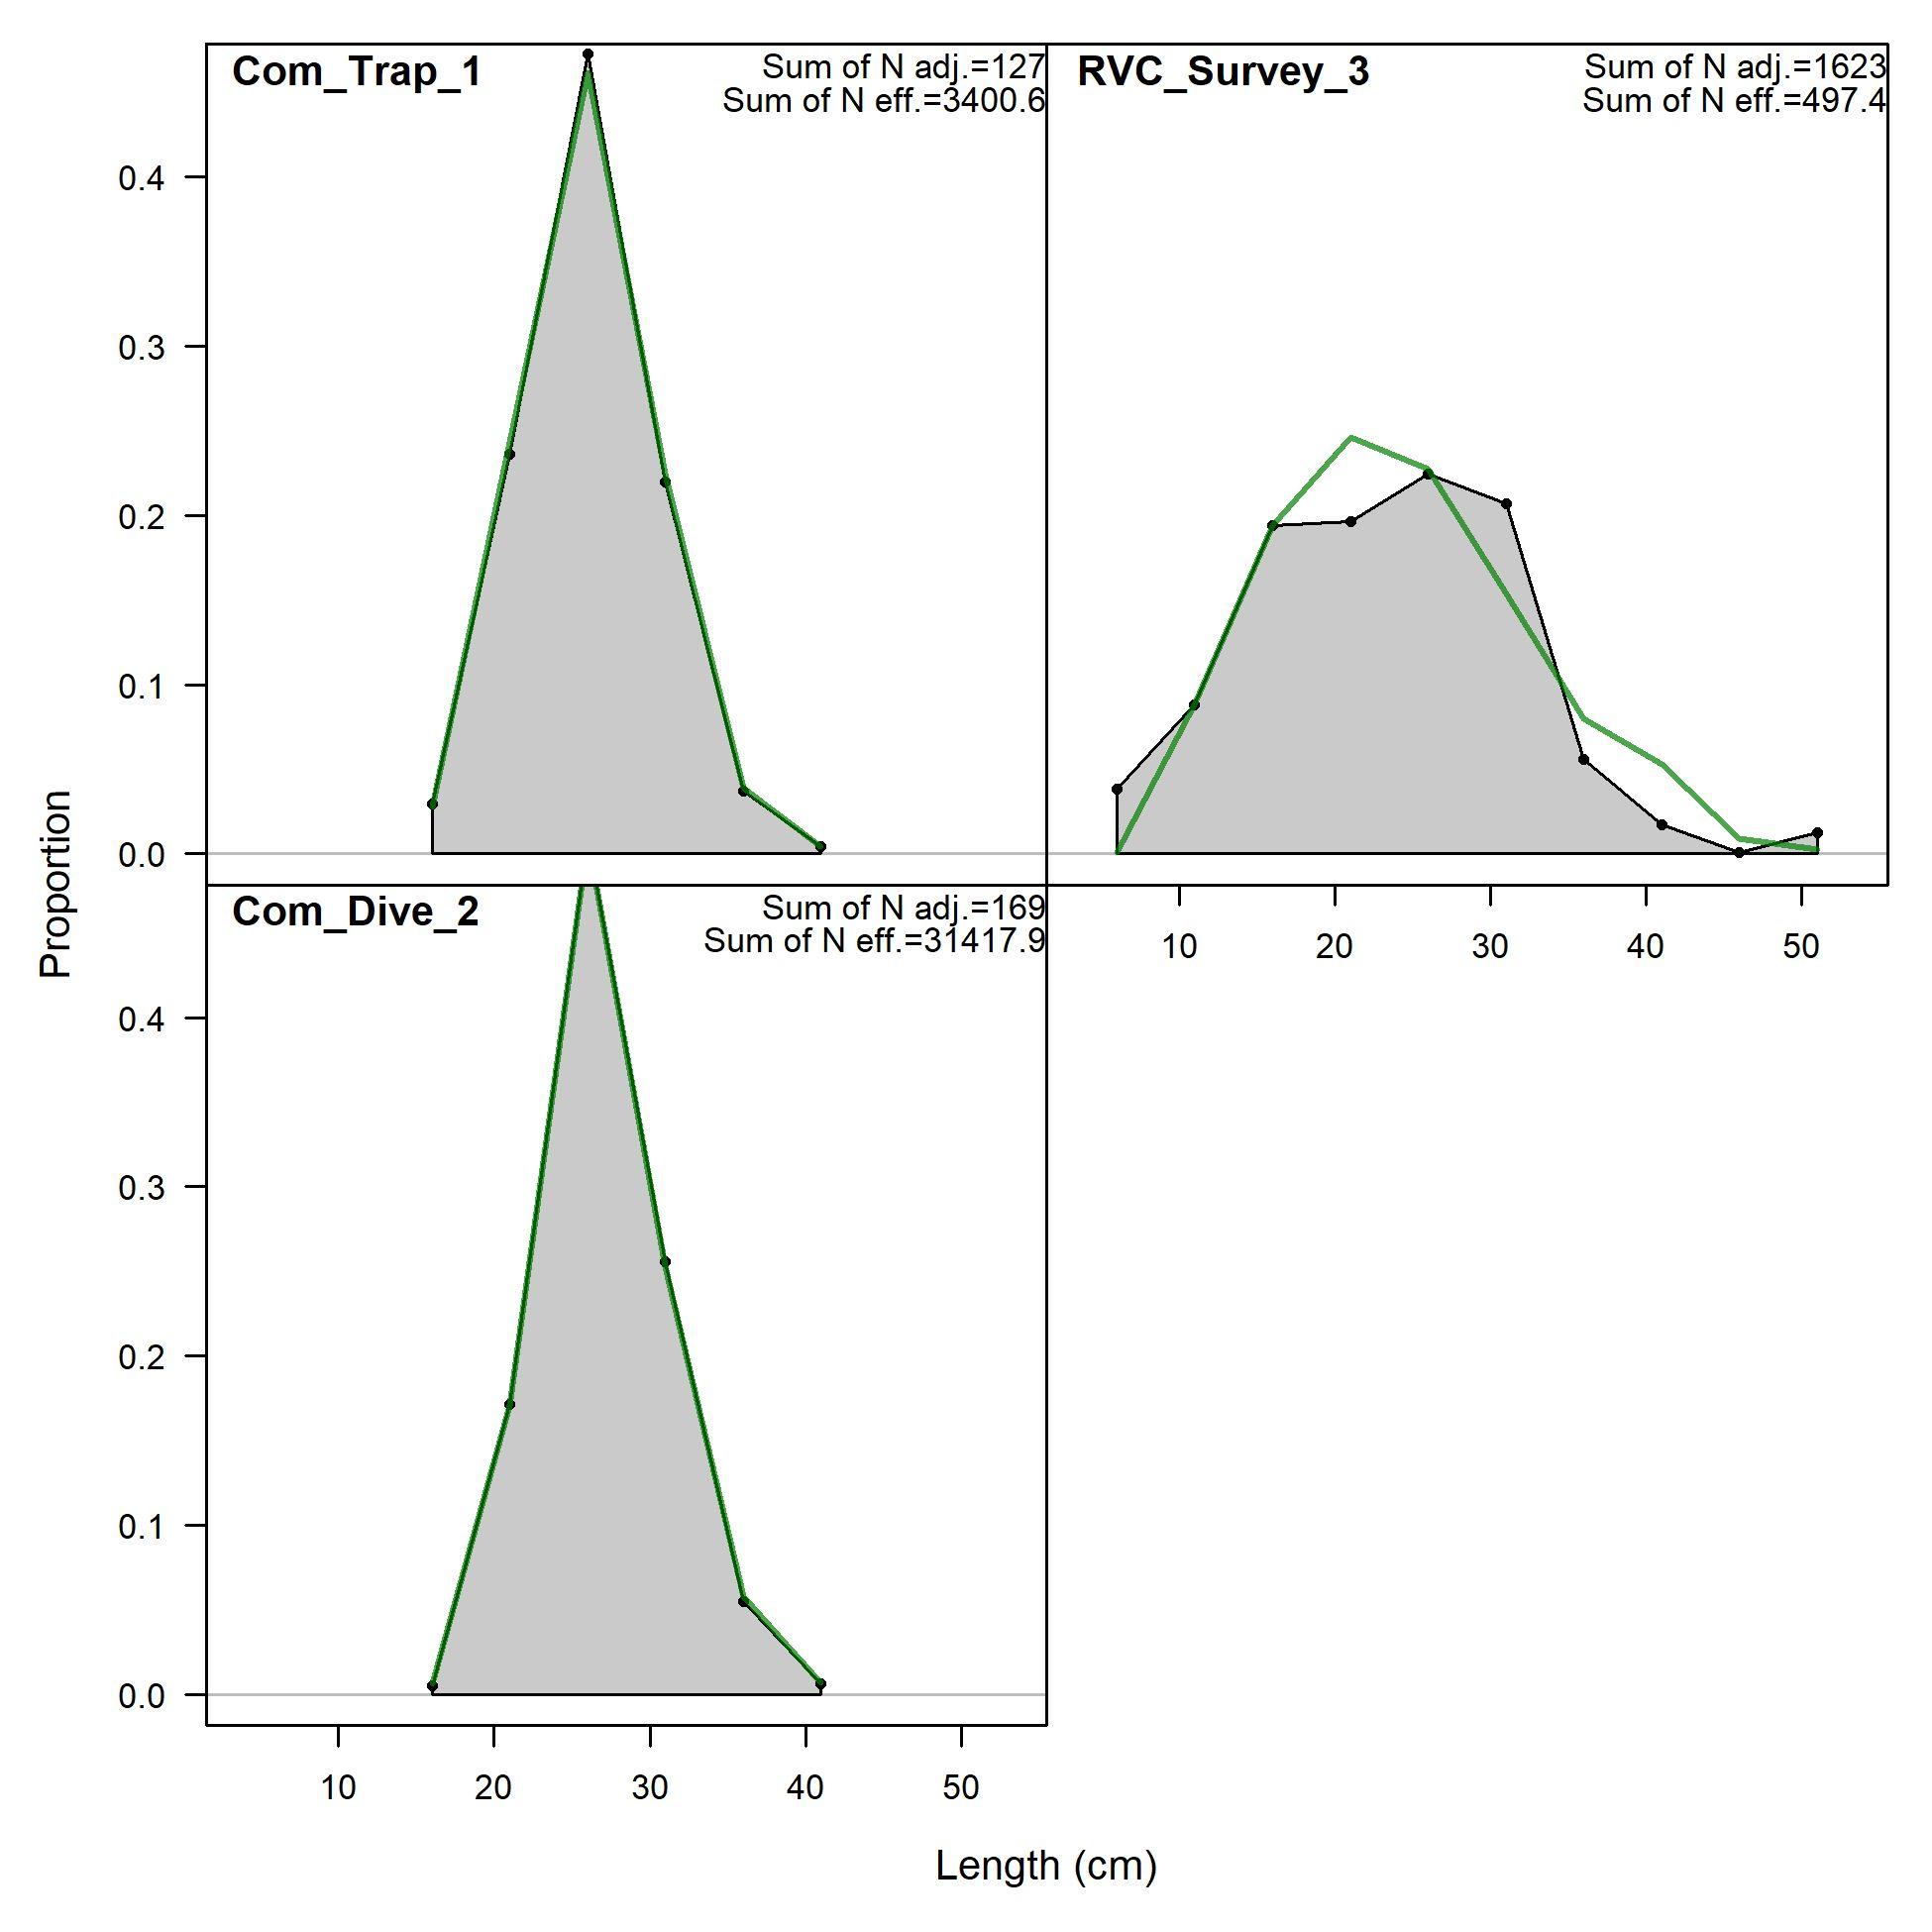
○ Simplifying the length composition data (super-year composite for commercial fleets) and removal of low samples from the NCRMP RVC survey
○ Dome-shaped selectivity for commercial fleets and the NCRMP survey
○ Fixing steepness at 0.99
● A maximum likelihood approach was used to assess the goodness of model fit to each data source (e.g., catch, indices, compositions, etc.)
● Jitter analysis used to investigate model stability.
● Retrospective analysis to investigate consistency of terminal year model estimates
● Stabilizing jitter and retrospective diagnostics required using priors on selectivity parameters that were not being well informed by the model and fixing the length associated with the initial ascending limb of the domed selectivity.
U.S. Department of Commerce | National Oceanic and Atmospheric Administration | National Marine Fisheries Service Page 16
5. Major assumptions and likelihood profiles
● Model assumptions:
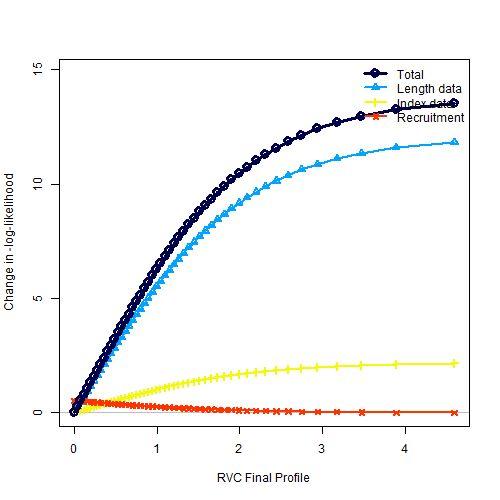
○ For the reference model, the final parameter of the NCRMP Reef Visual Census Survey selectivity was fixed at 0.90. This decision was informed by modeling discussions and evidence of a similar range of sizes with higher proportions of larger Queen Triggerfish observed in deep areas of St. Thomas and St. John.
○ High regional connectivity; no unit stock and therefore no estimable spawner-recruit relationship
○ Fisheries existed prior to start year of models
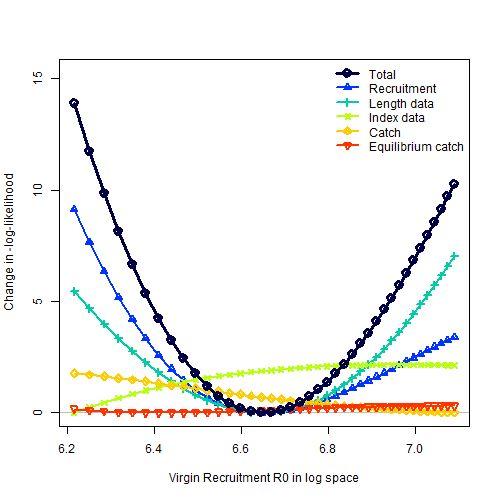
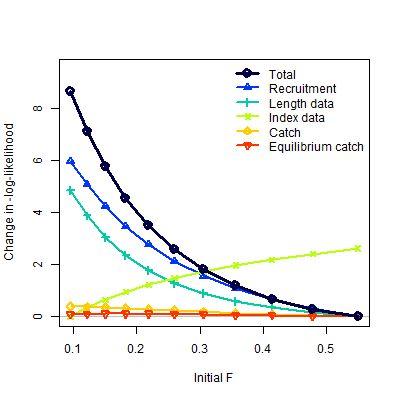
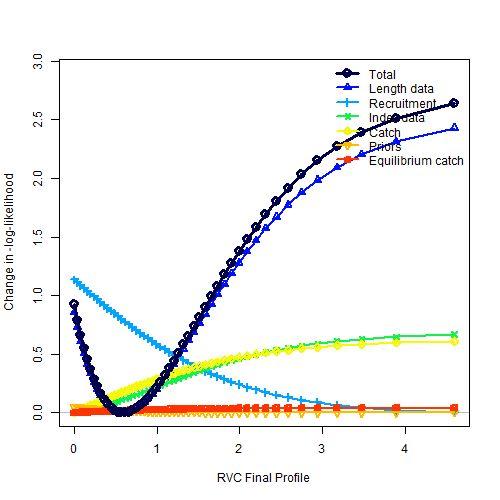
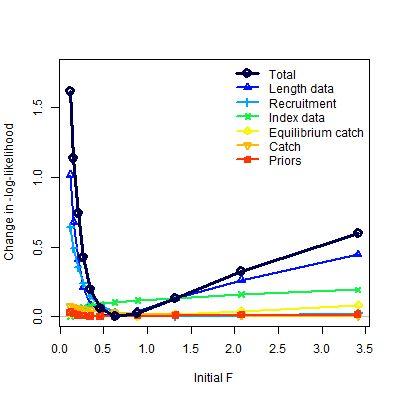
● Profile likelihoods used to examine the stability of a given parameter estimate and to see how each data source influences the estimate.
○ Steepness
○ Descending limb of the NCRMP Survey selectivity
○ Initial equilibrium catch
○ Unfished recruitment
U.S. Department of Commerce | National Oceanic and Atmospheric Administration | National Marine Fisheries Service Page 17
6. Uncertainty grid, projection, and model estimates of F and OFL
● Projections were developed for the reference model, as well as across a factorial grid of model runs to capture uncertainty across key data assumptions.
○ Finalized landings statistics through 2022. The geometric mean of the most recent three years of landings was used as the interim catch for 2023.
○ MFMT = FMSY or a proxy; in this case, FSPR 40%.
○ Future recruitment based on mean recruitment
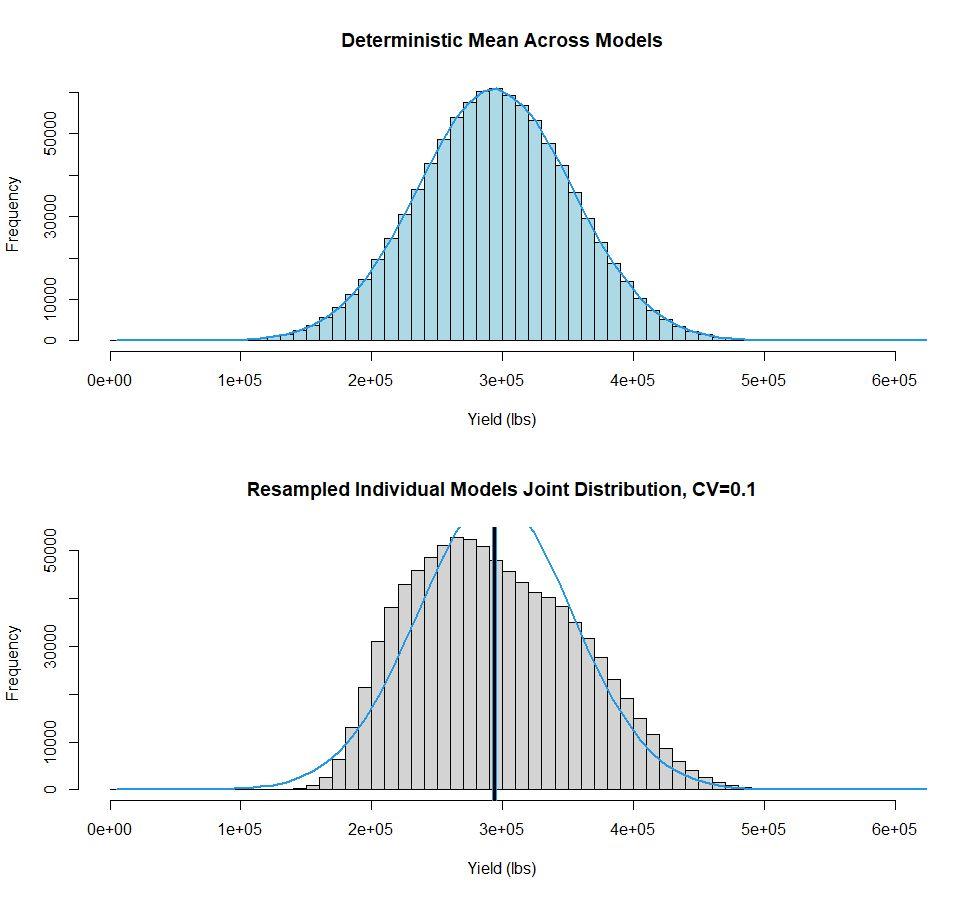
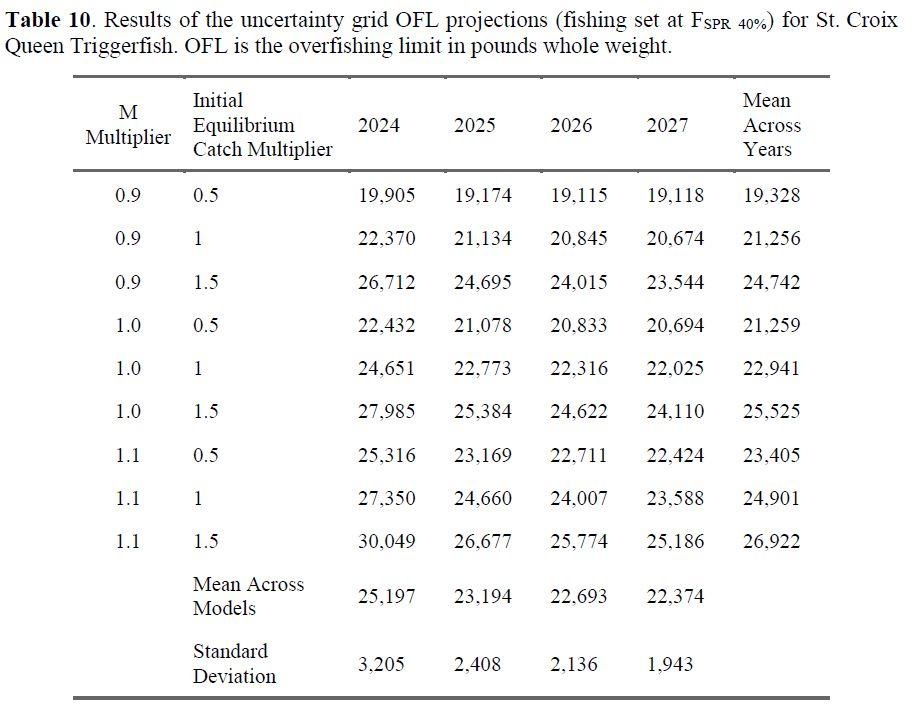
● The uncertainty grid included 9 runs permuted across three multipliers of initial equilibrium catch (0.5, 1, and 1.5) and three multipliers of natural mortality (0.9, 1, and 1.1) relative to the reference model.
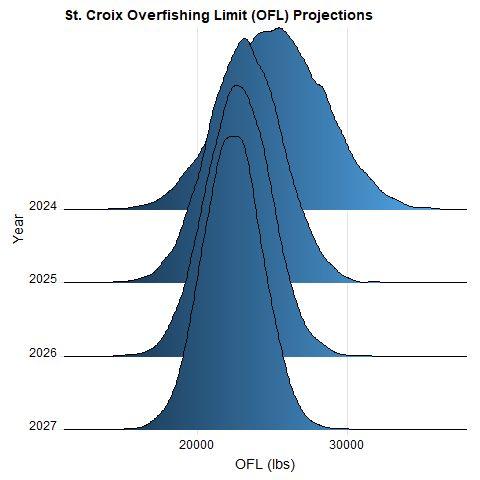
○ The OFL obtained across these runs were bootstrapped utilizing a normal distribution with the mean and standard deviation derived across each model run in the uncertainty grid approach.
○ FCurrent calculated as a three-year geometric mean (2017 – 2019).
U.S. Department of Commerce | National Oceanic and Atmospheric Administration | National Marine Fisheries Service Page 18
Caribbean Queen Triggerfish
USVI SEDAR 80 Stock Assessments
09-10 April 2024
CFMC SSC Meeting
Presentation Outline
● Summary of data and methods
● Review of data and stock assessment results
○ St. Thomas and St. John (STTJ)
■ Discussion and recommendations
○ St. Croix (STX)
■ Discussion and recommendations

Questions? ¿Preguntas?
Review of data and stock assessment results
St. Thomas and St. John (STTJ)
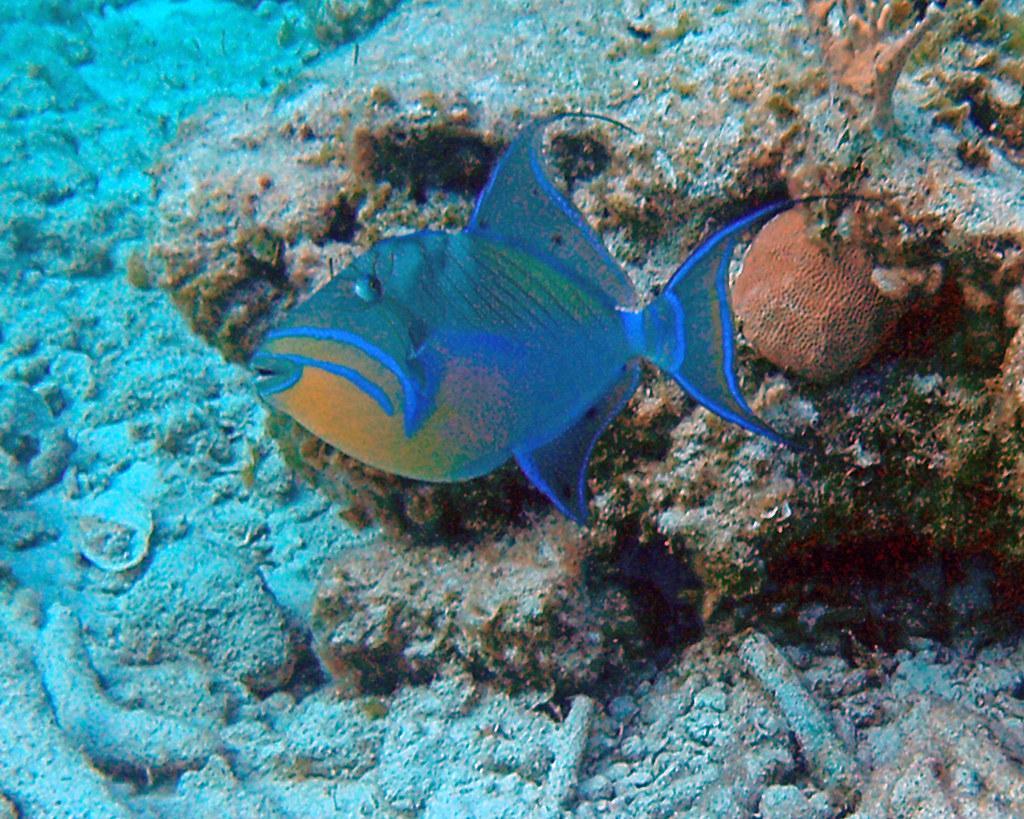
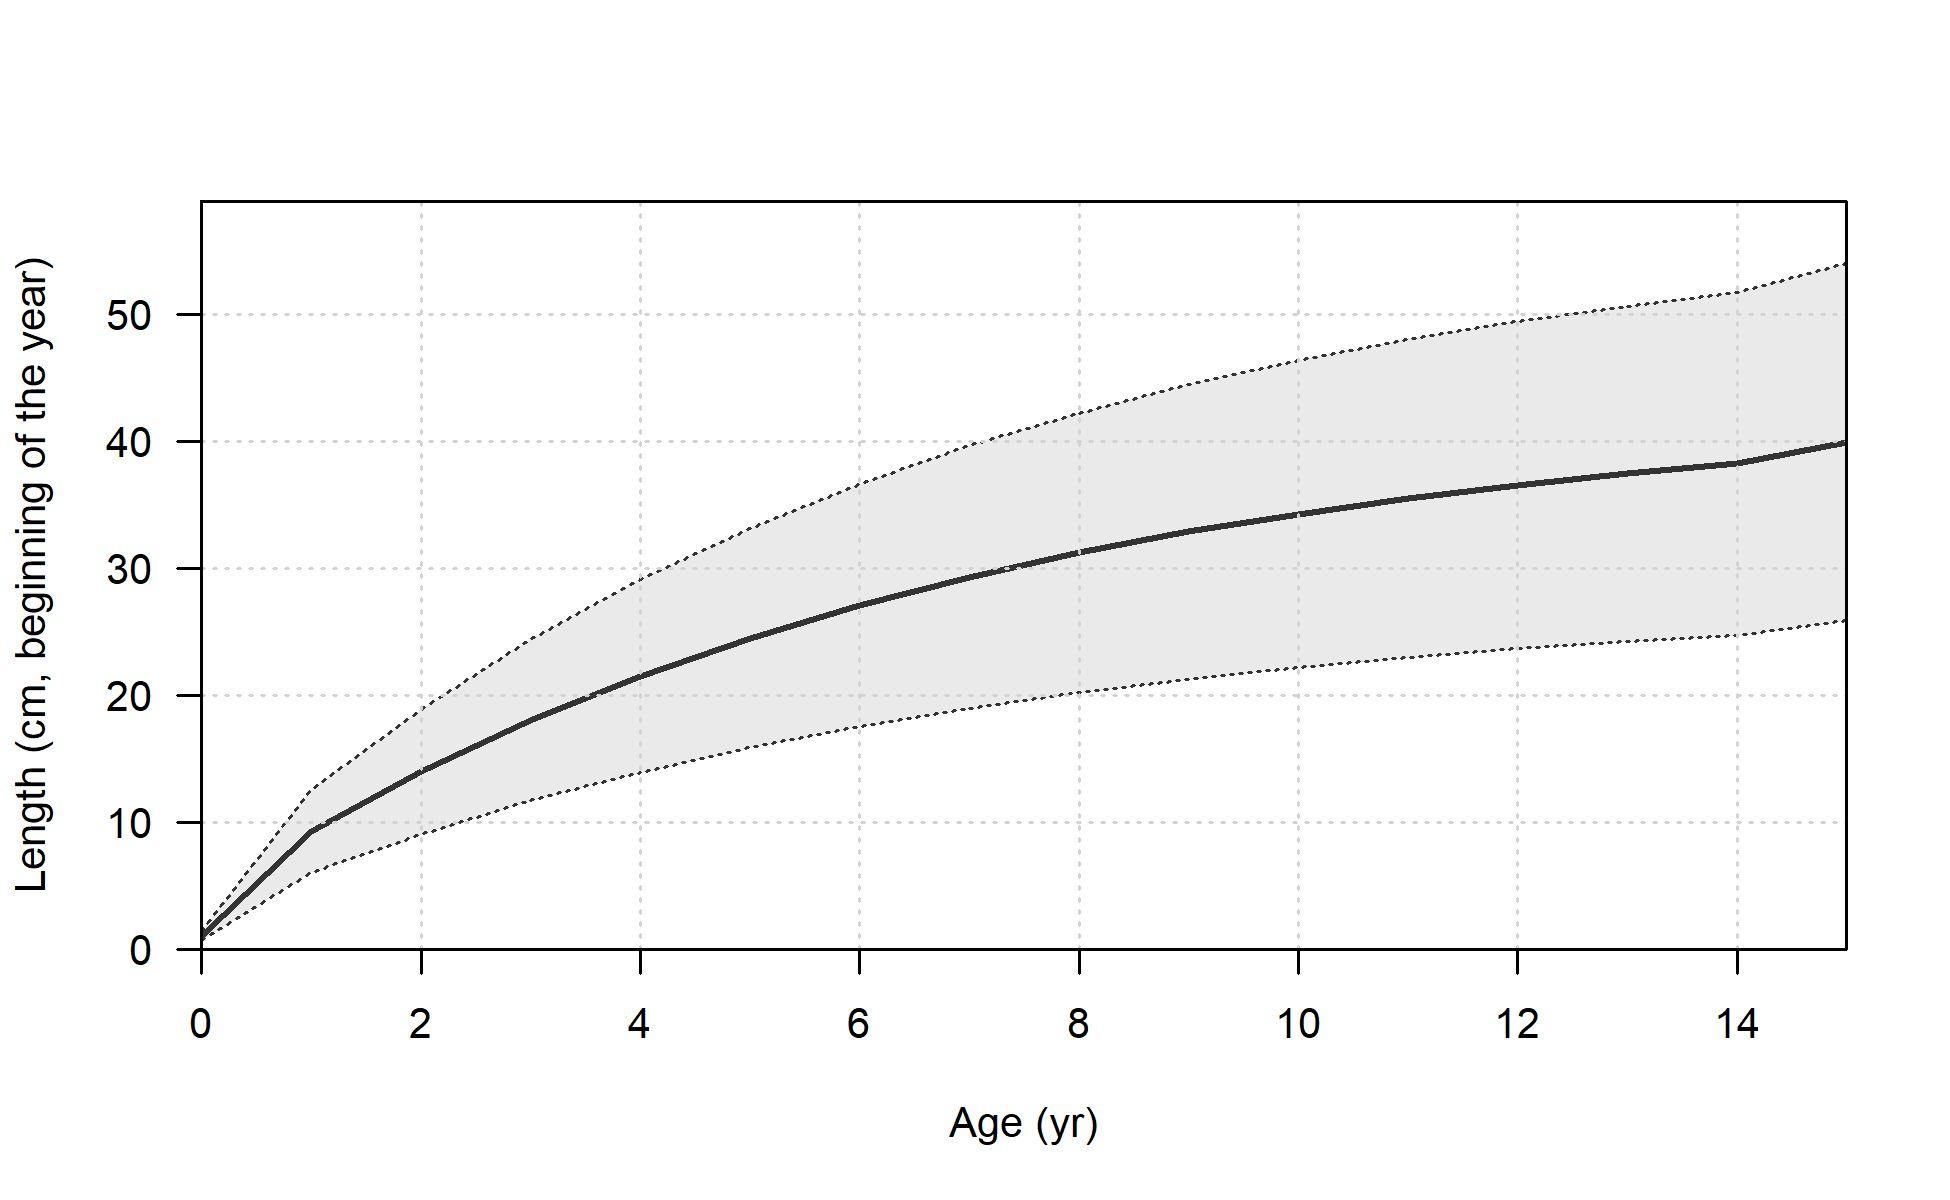
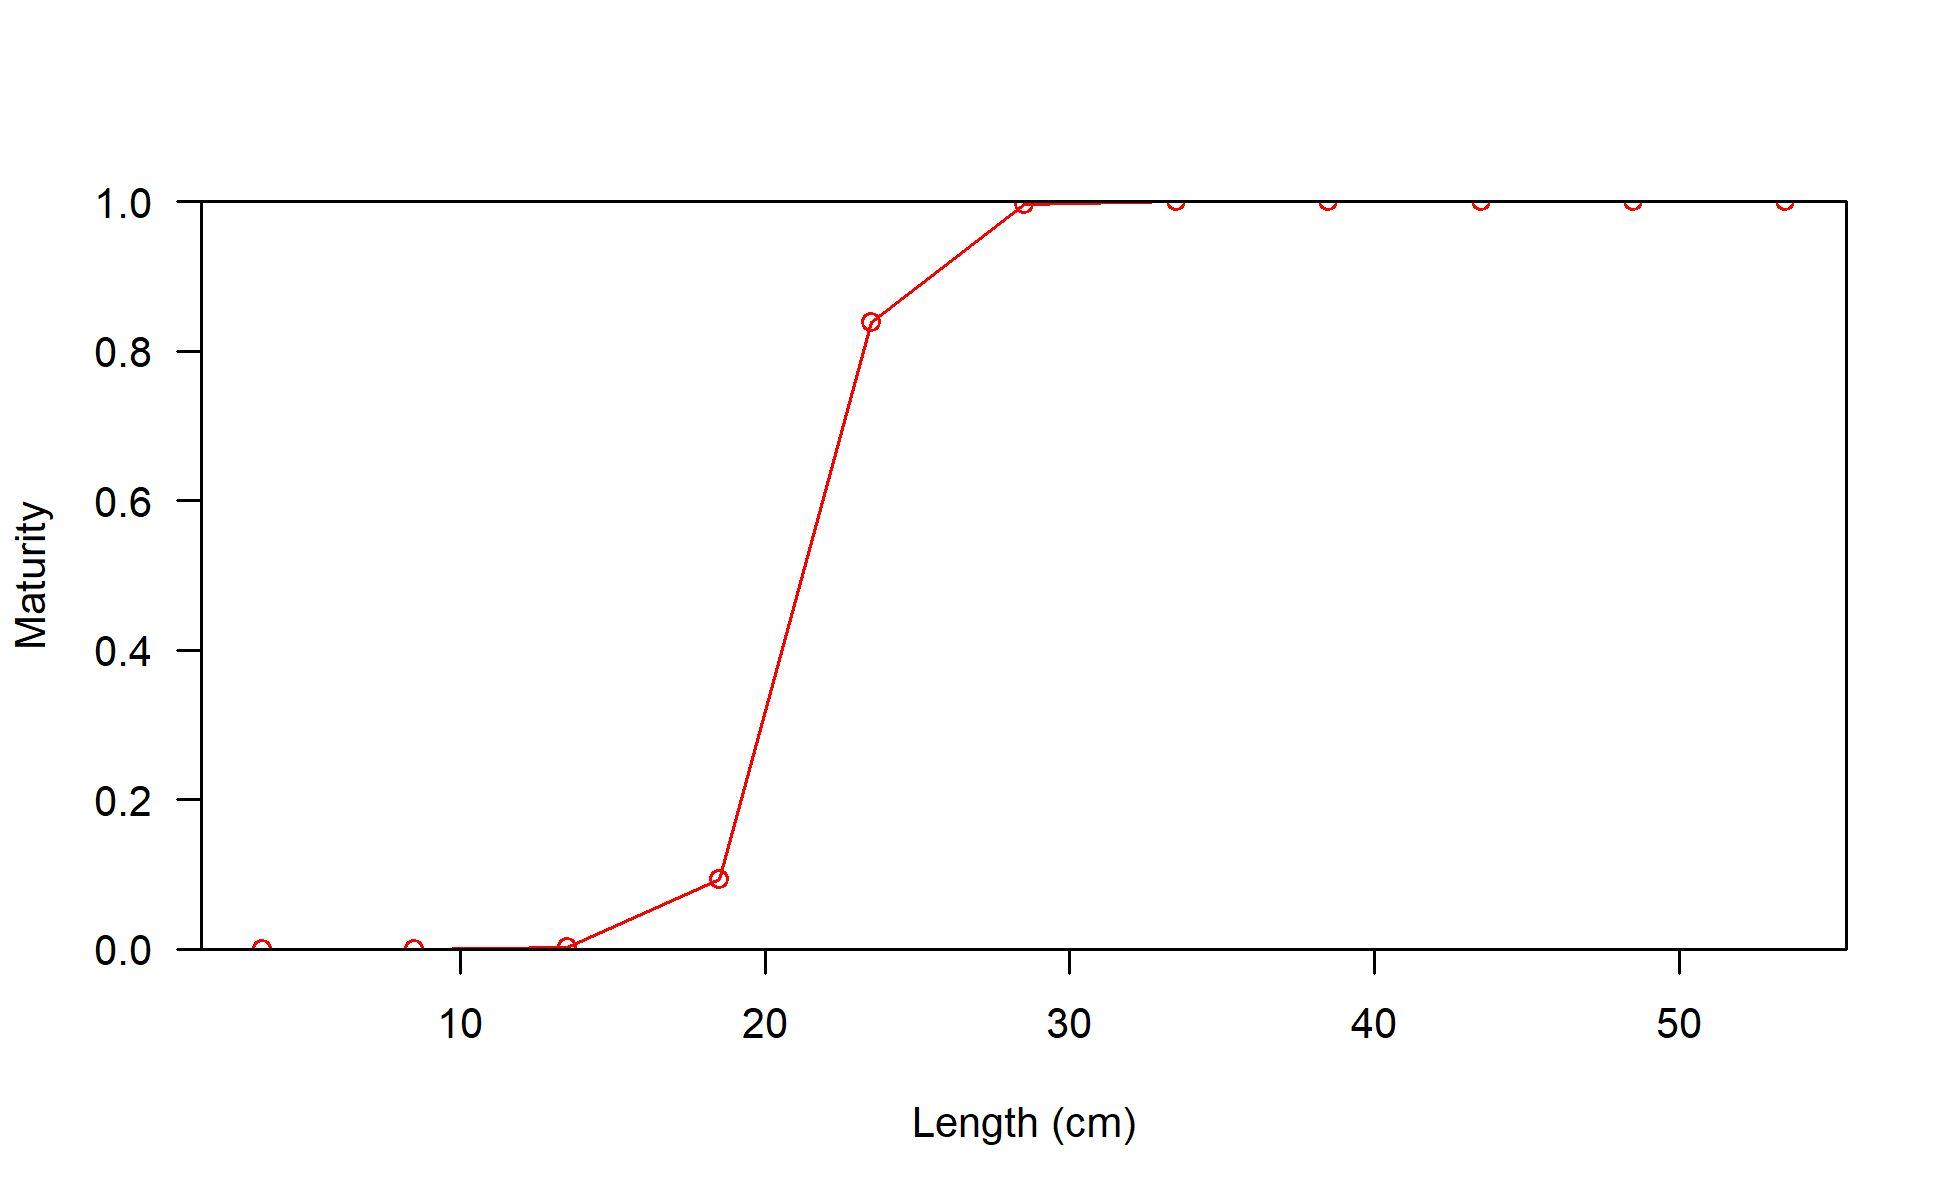
Biology
U.S. Department of Commerce | National Oceanic and Atmospheric Administration | National Marine Fisheries Service Page 21
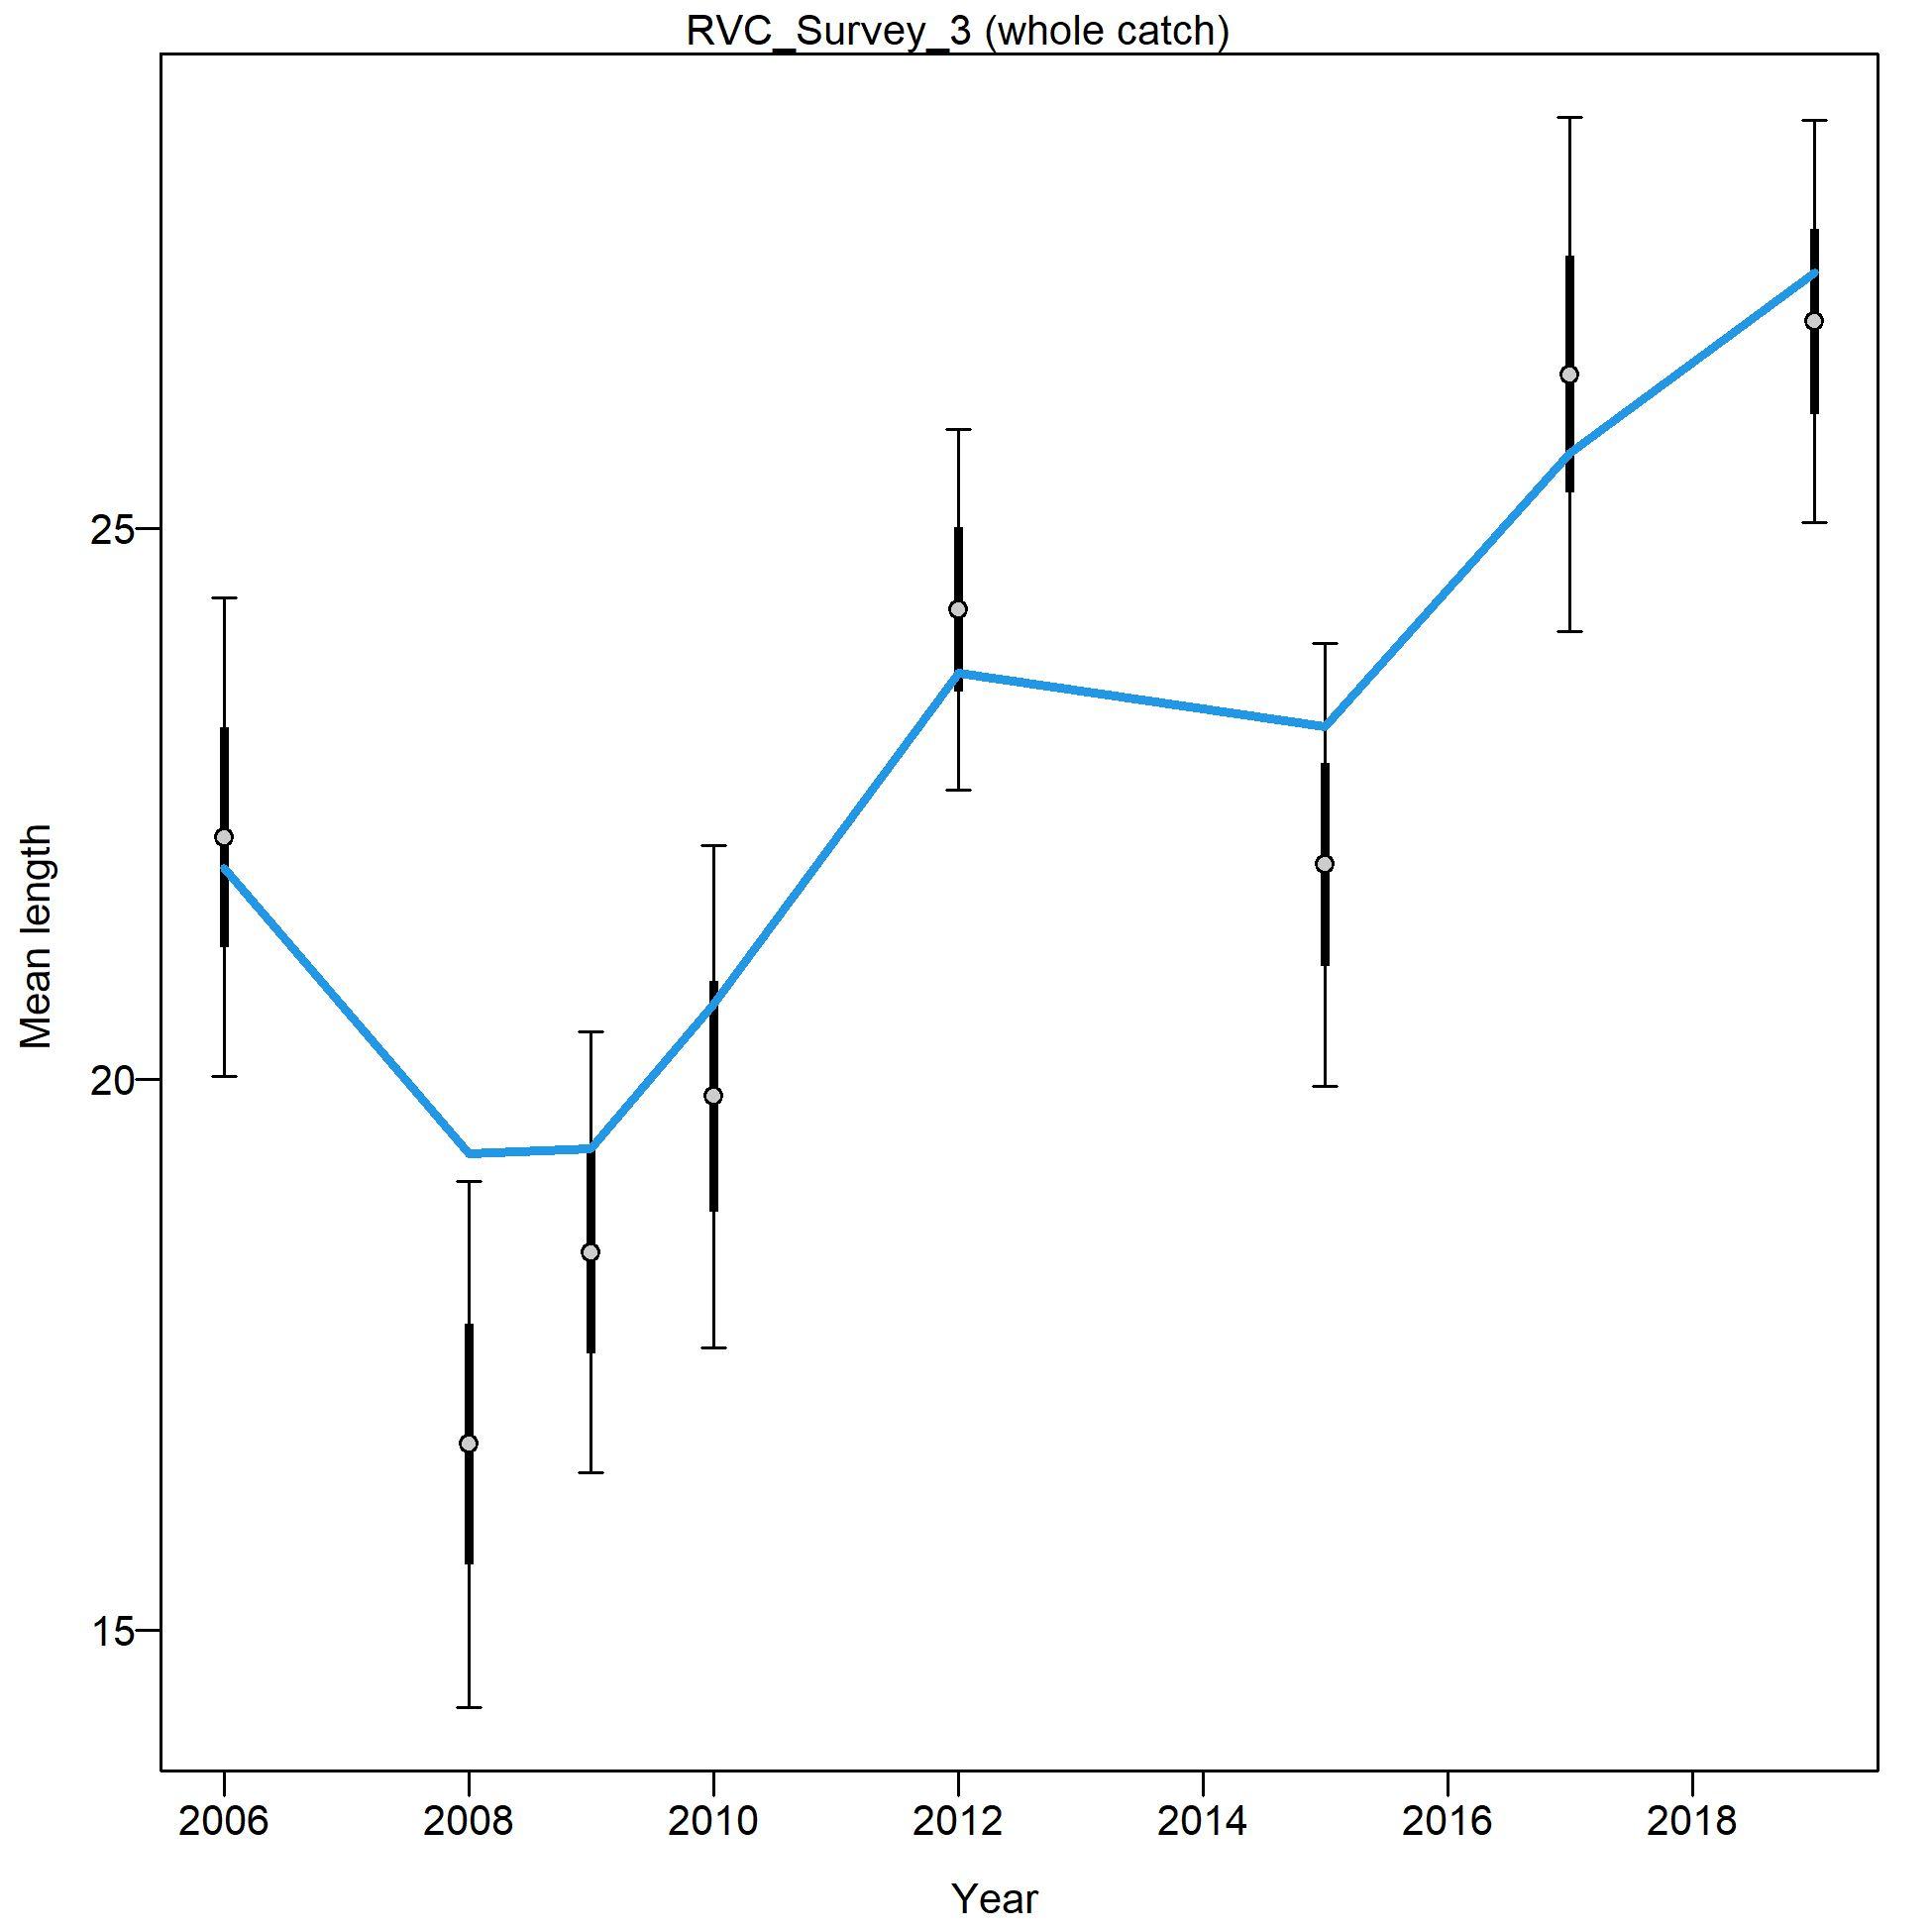
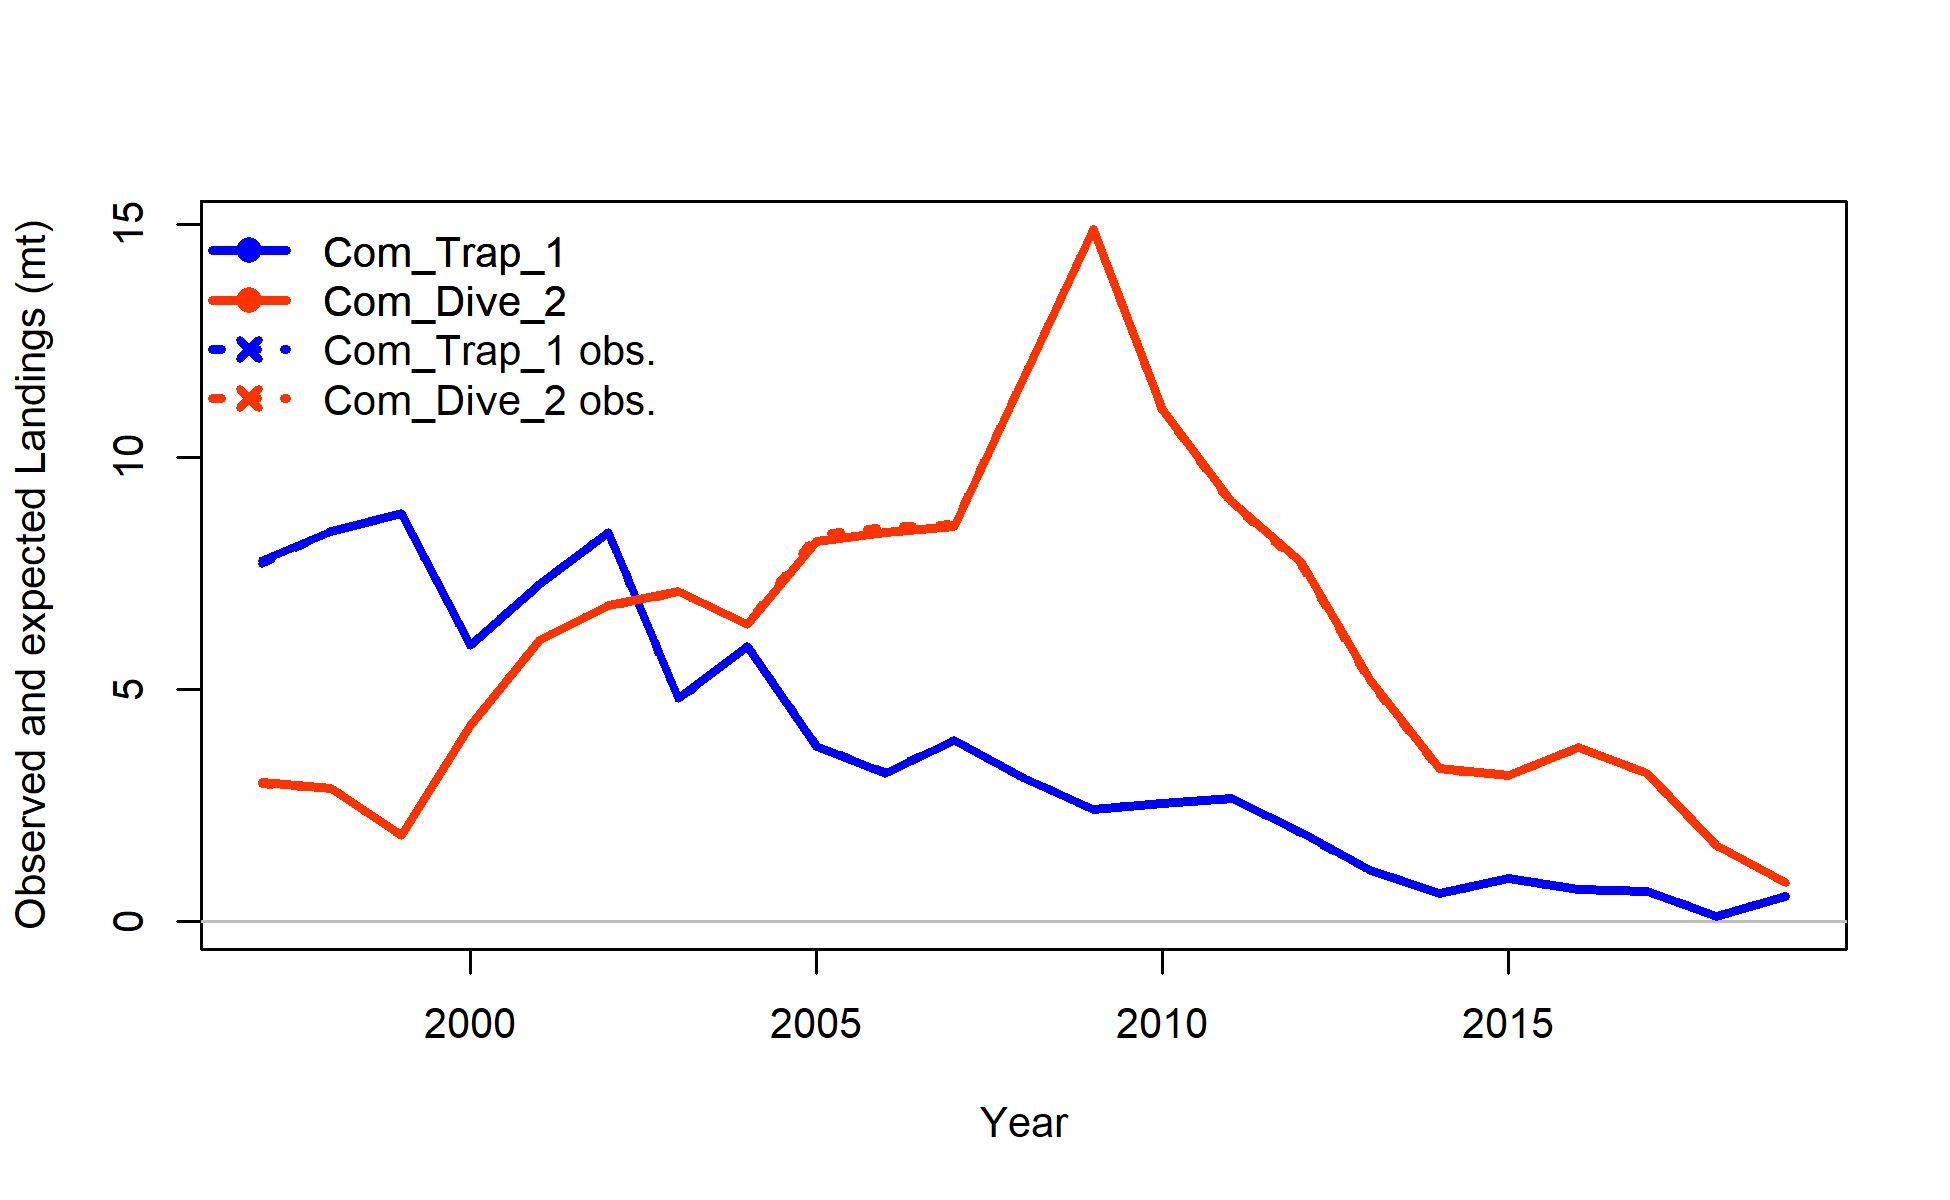
Fit to data
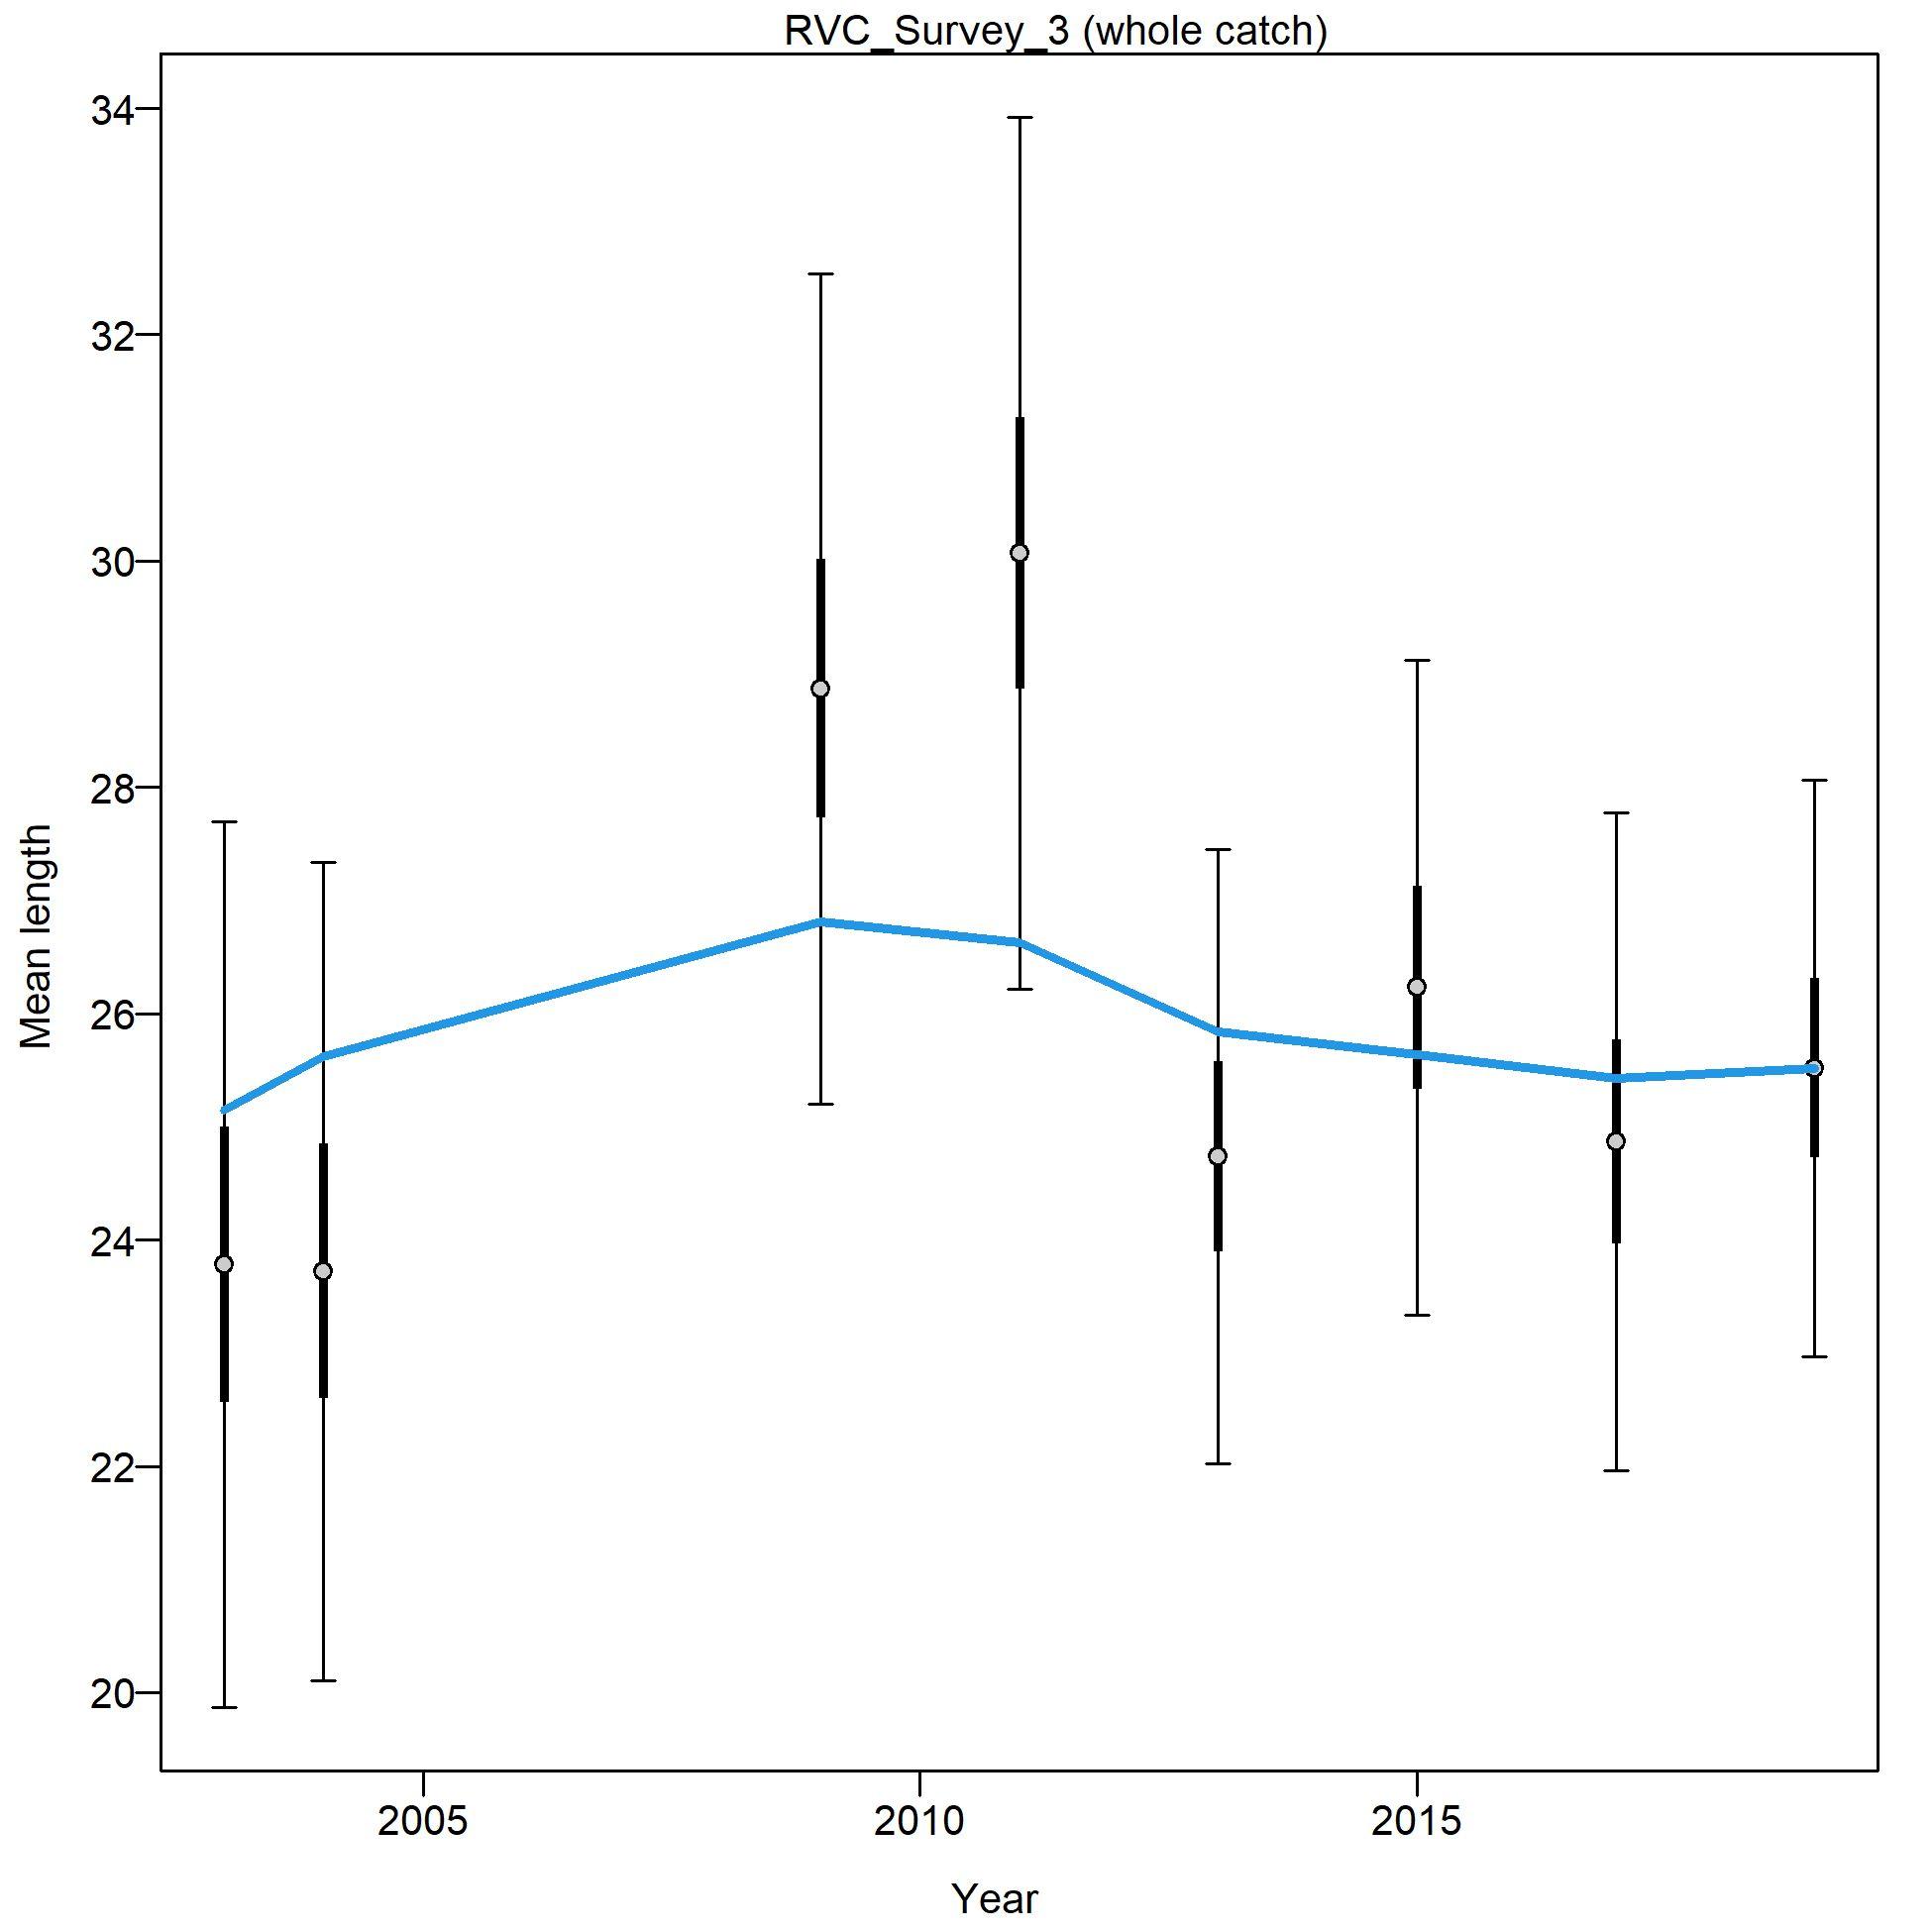
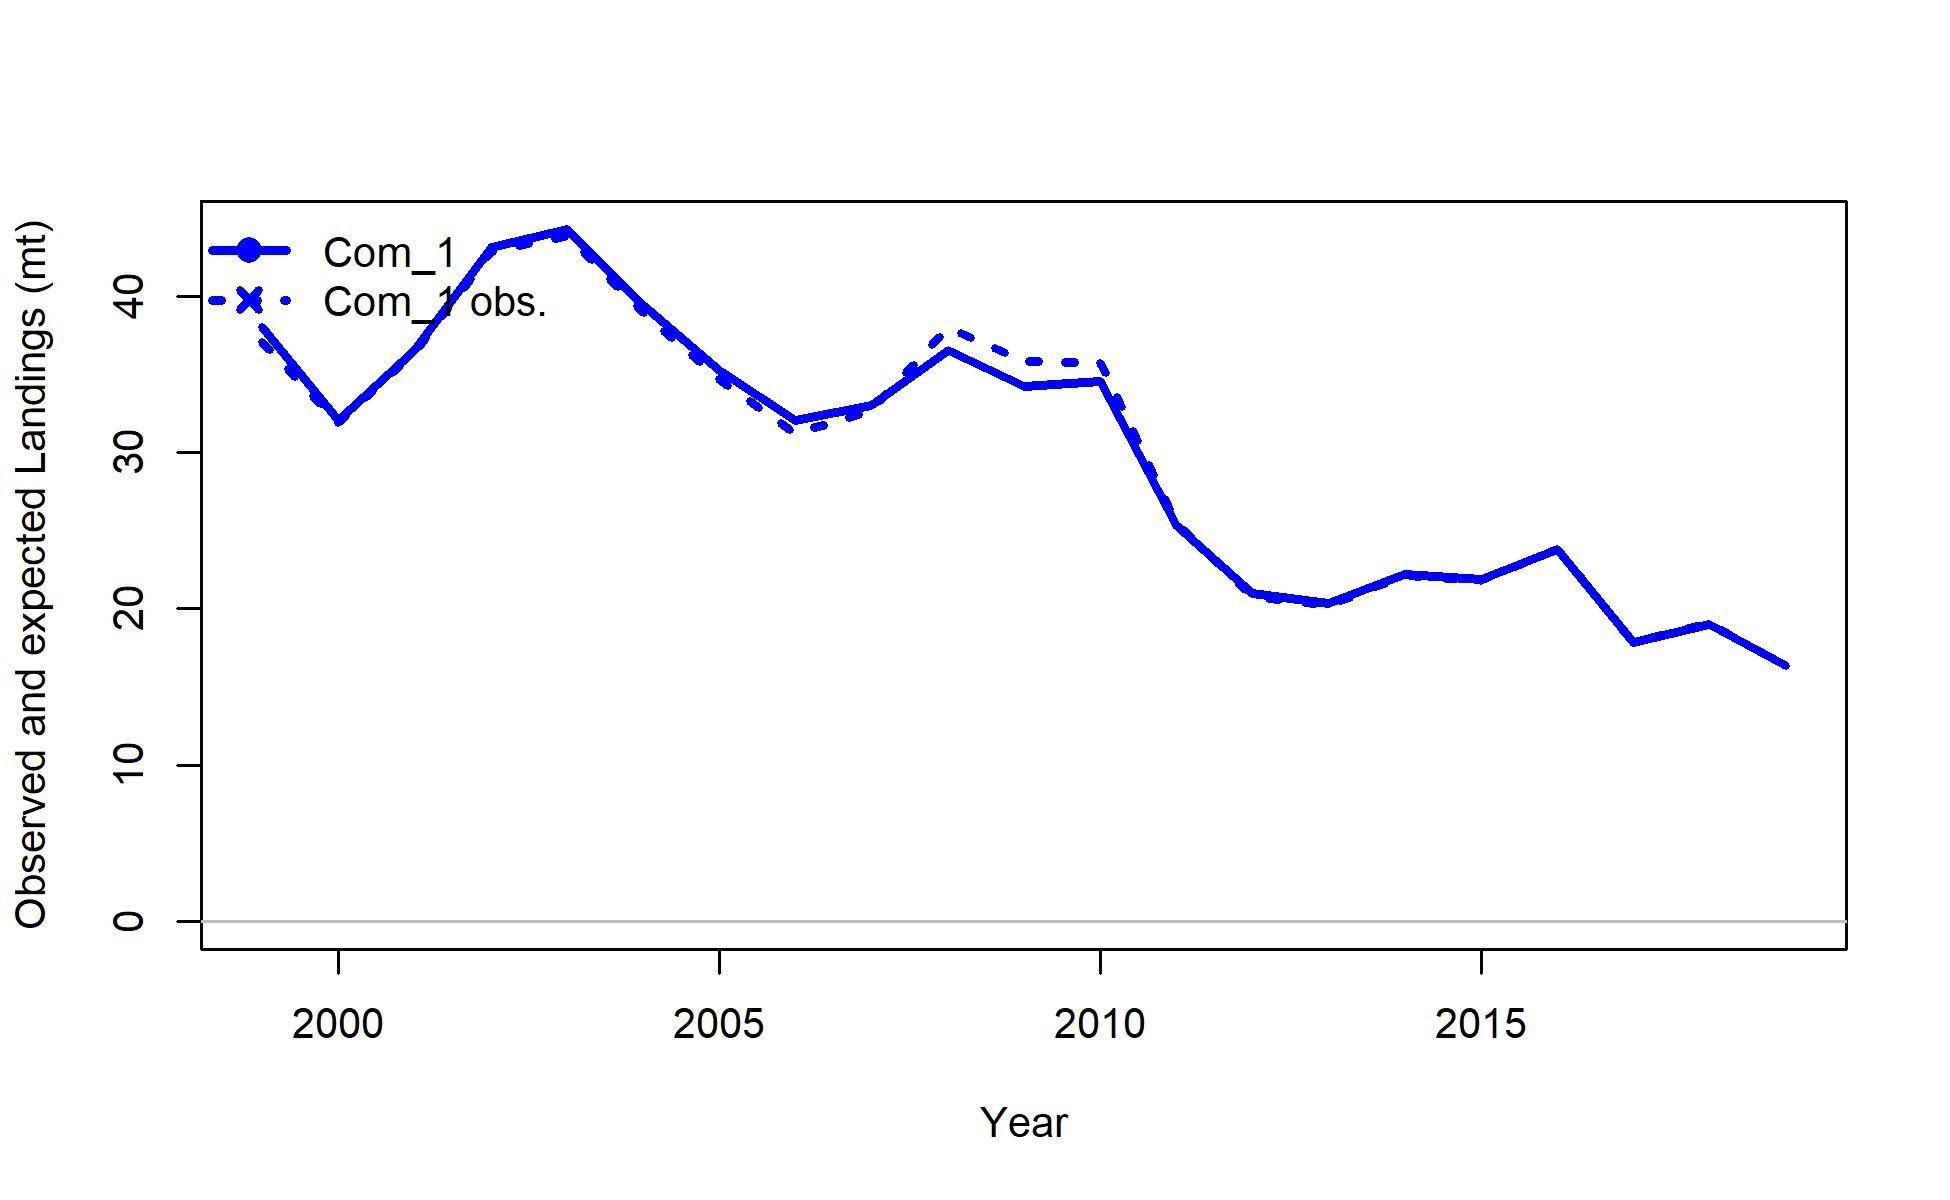
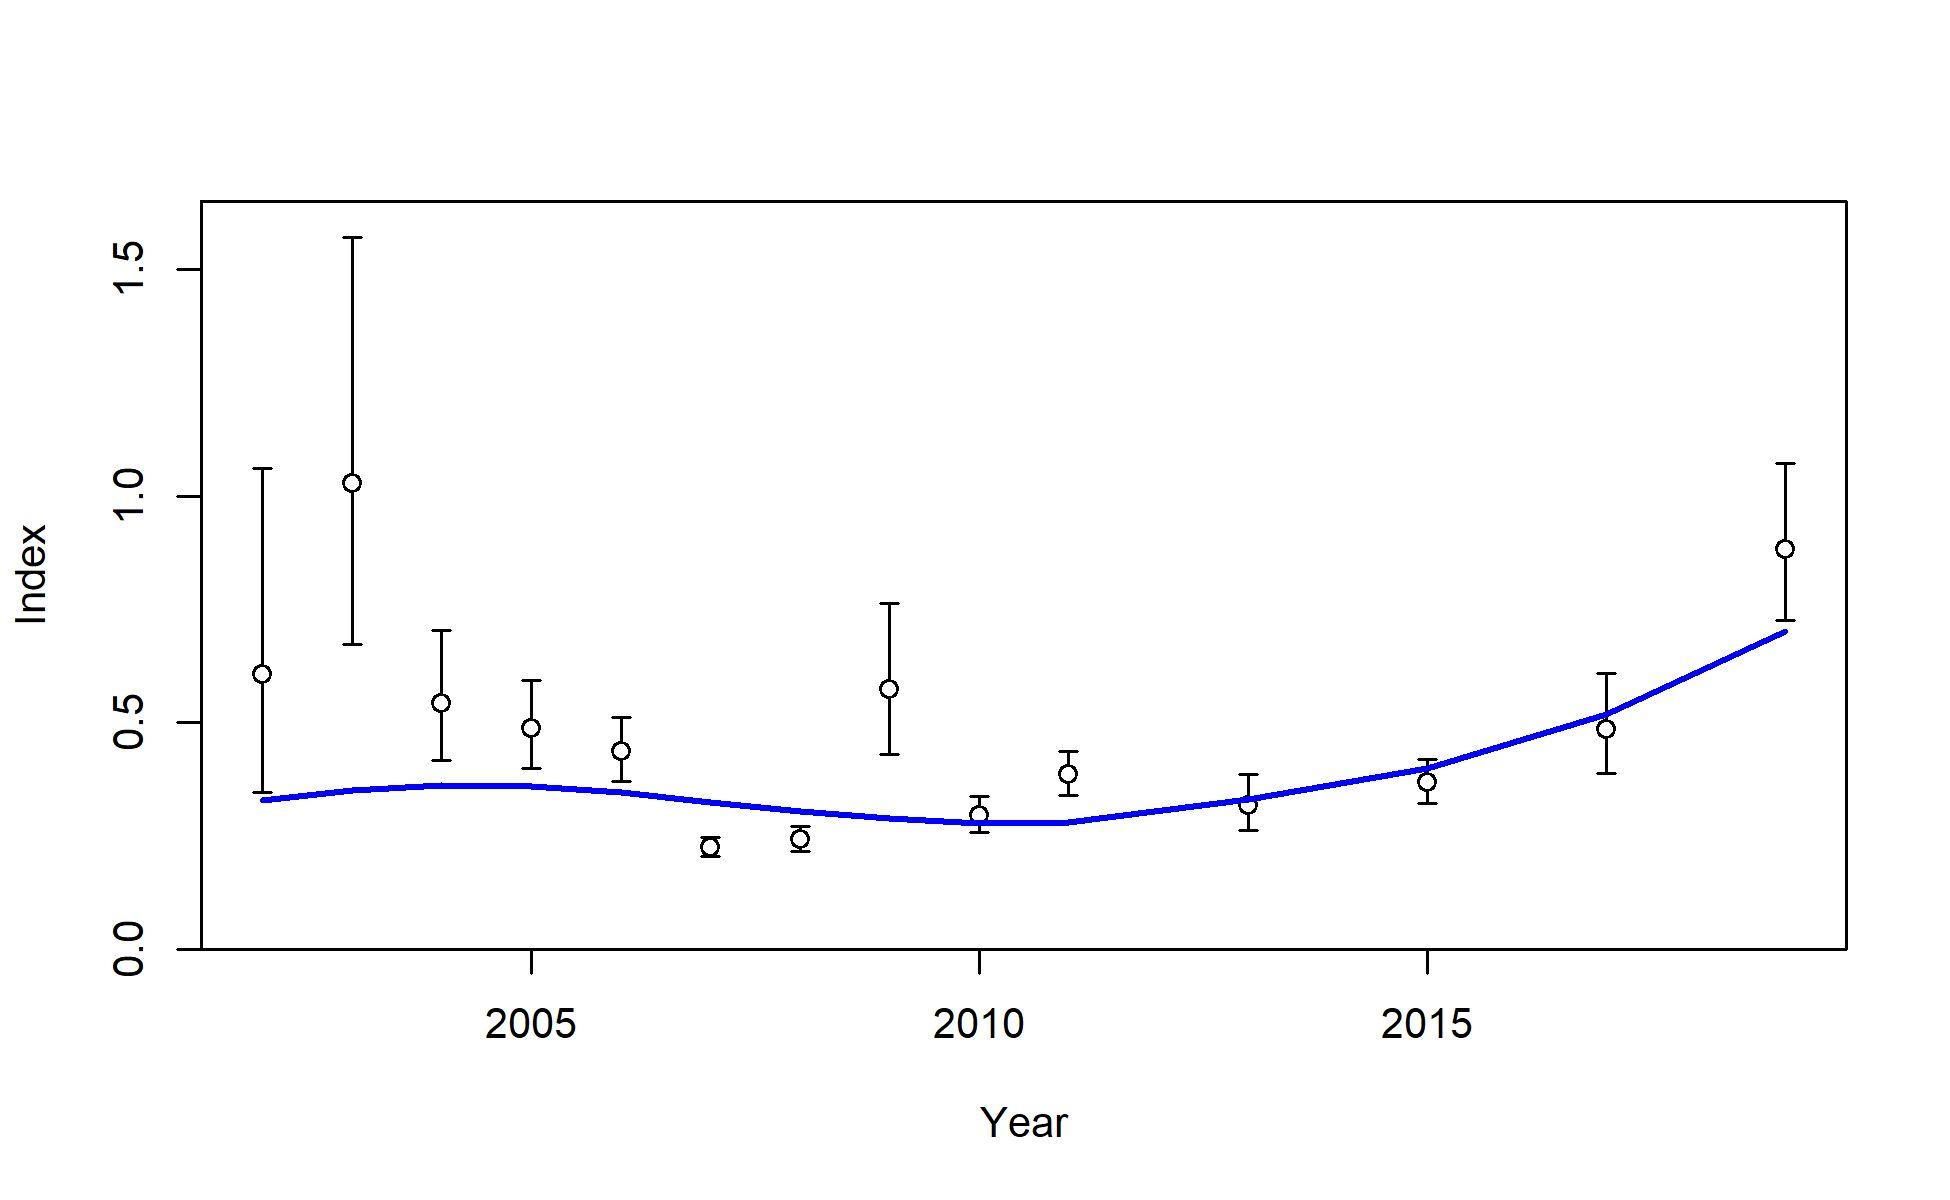
U.S. Department of Commerce | National Oceanic and Atmospheric Administration | National Marine Fisheries Service Page 22
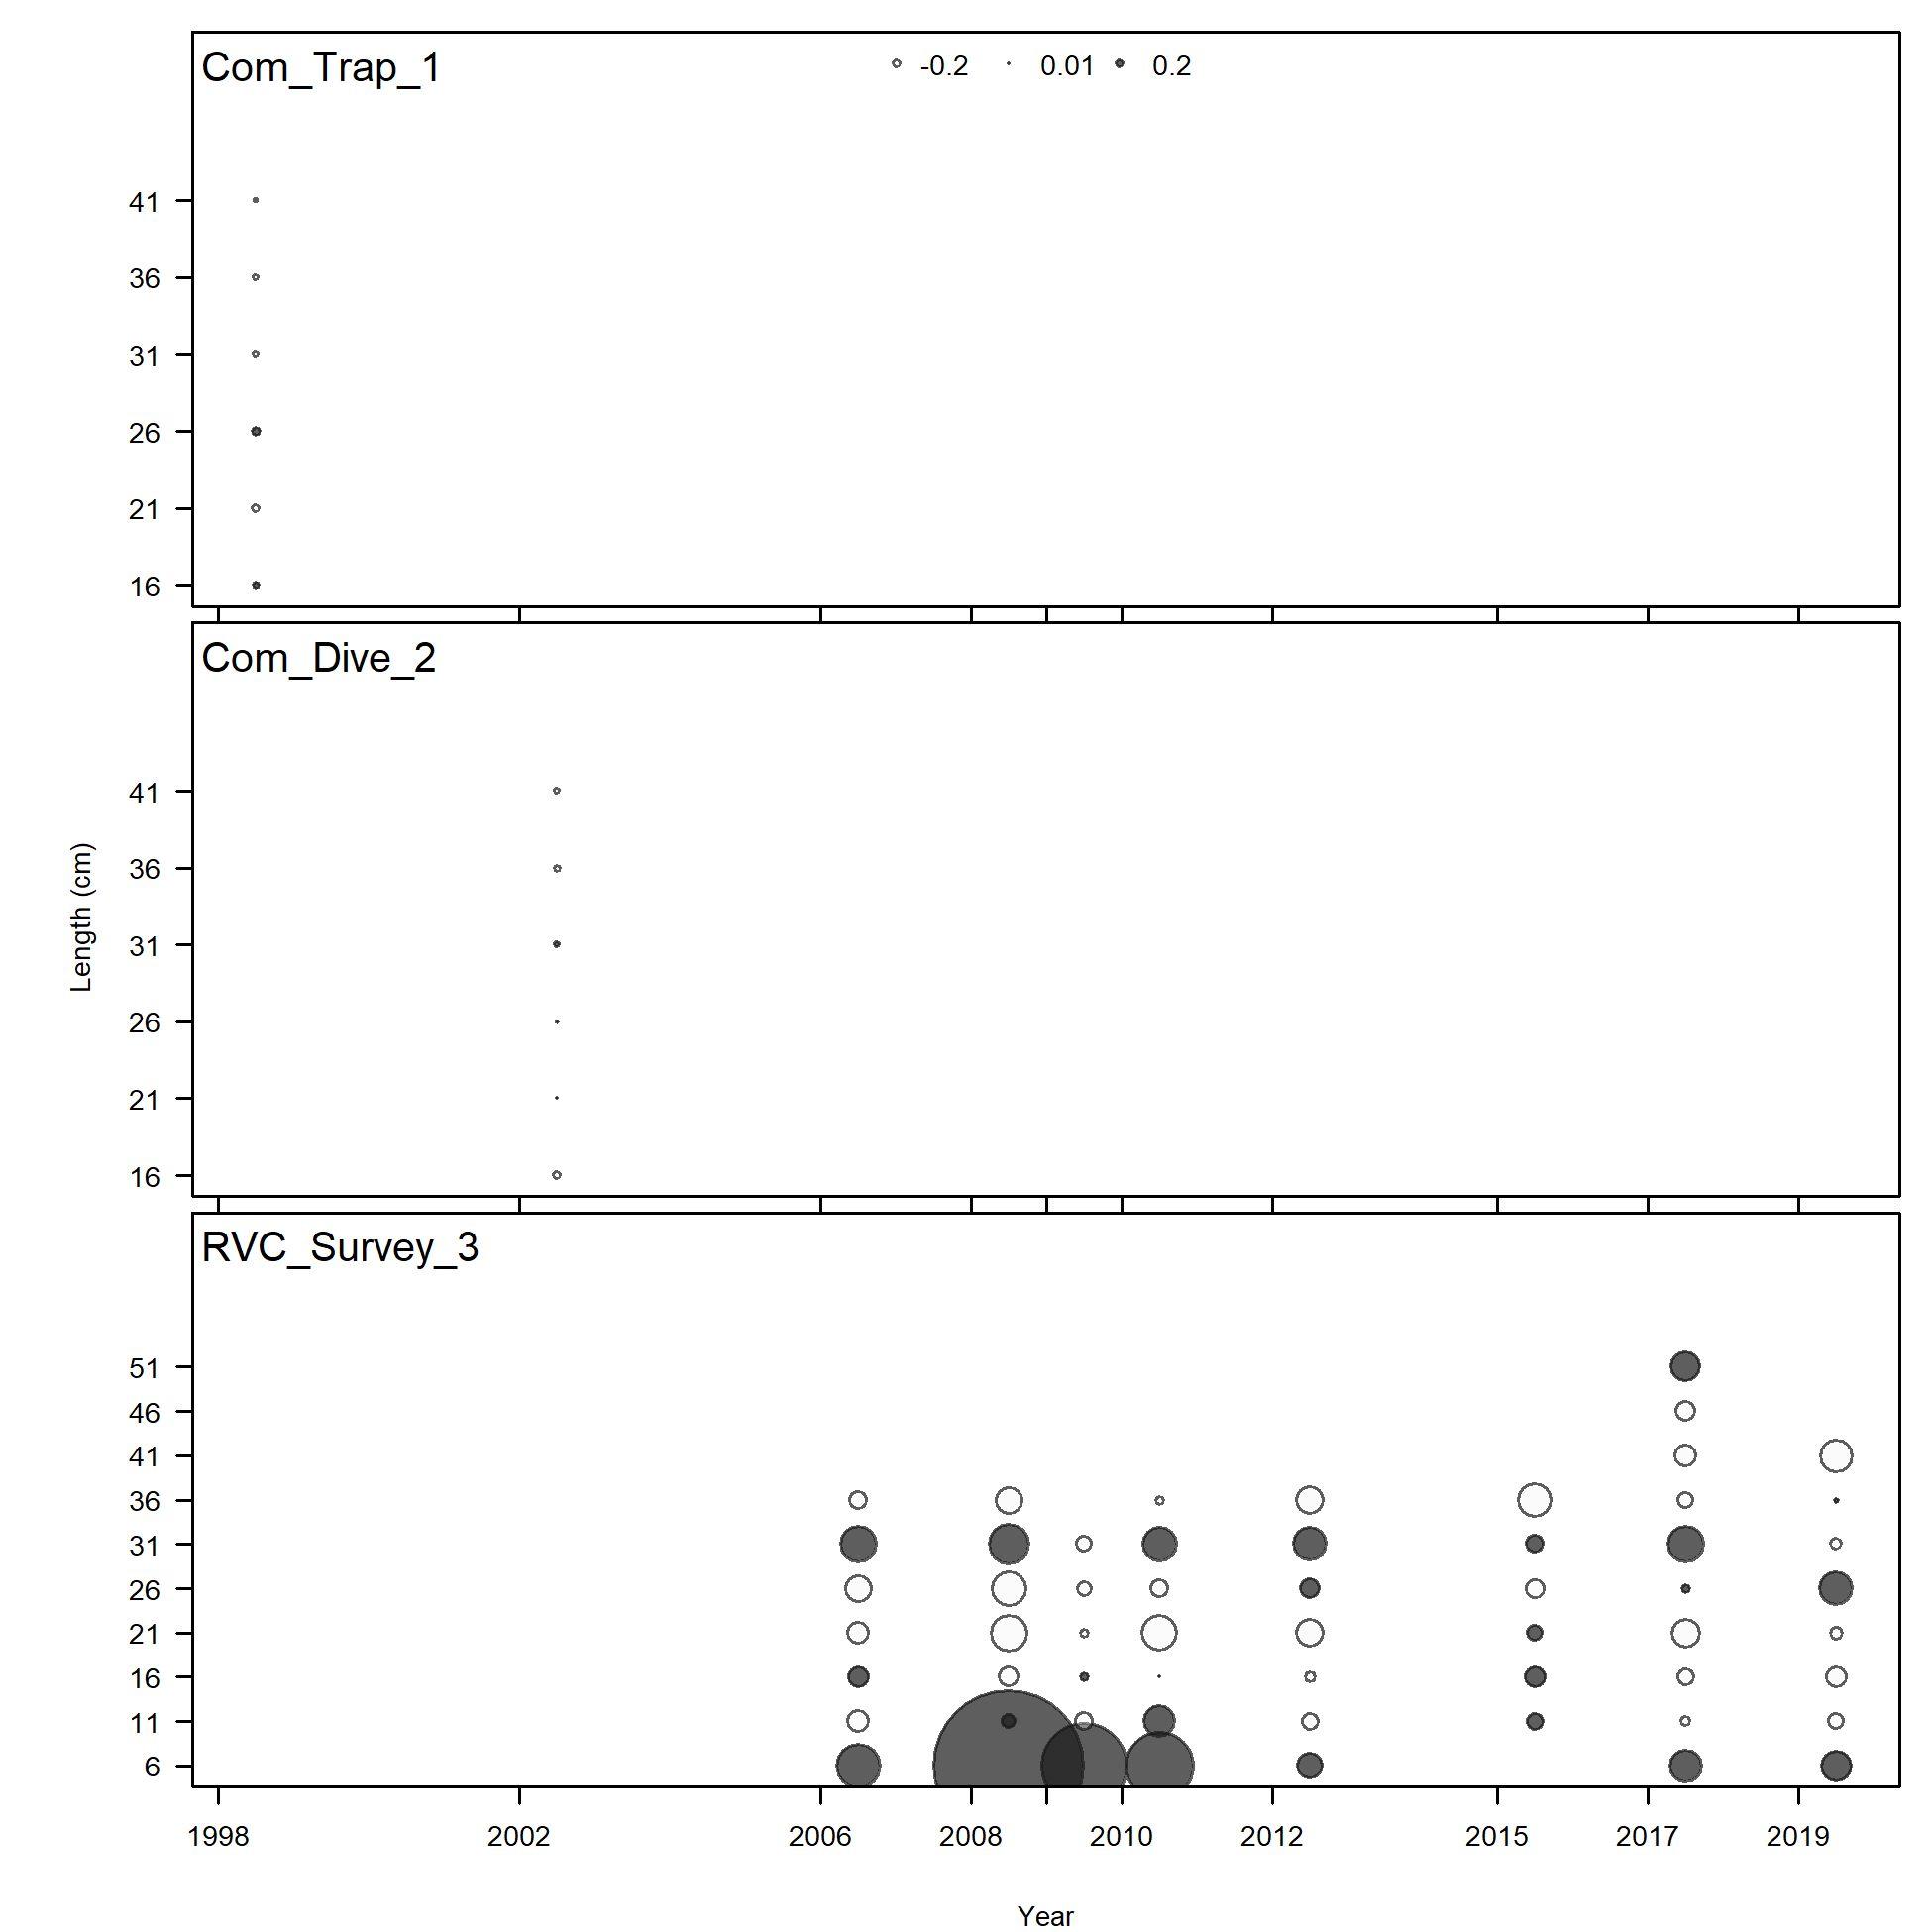
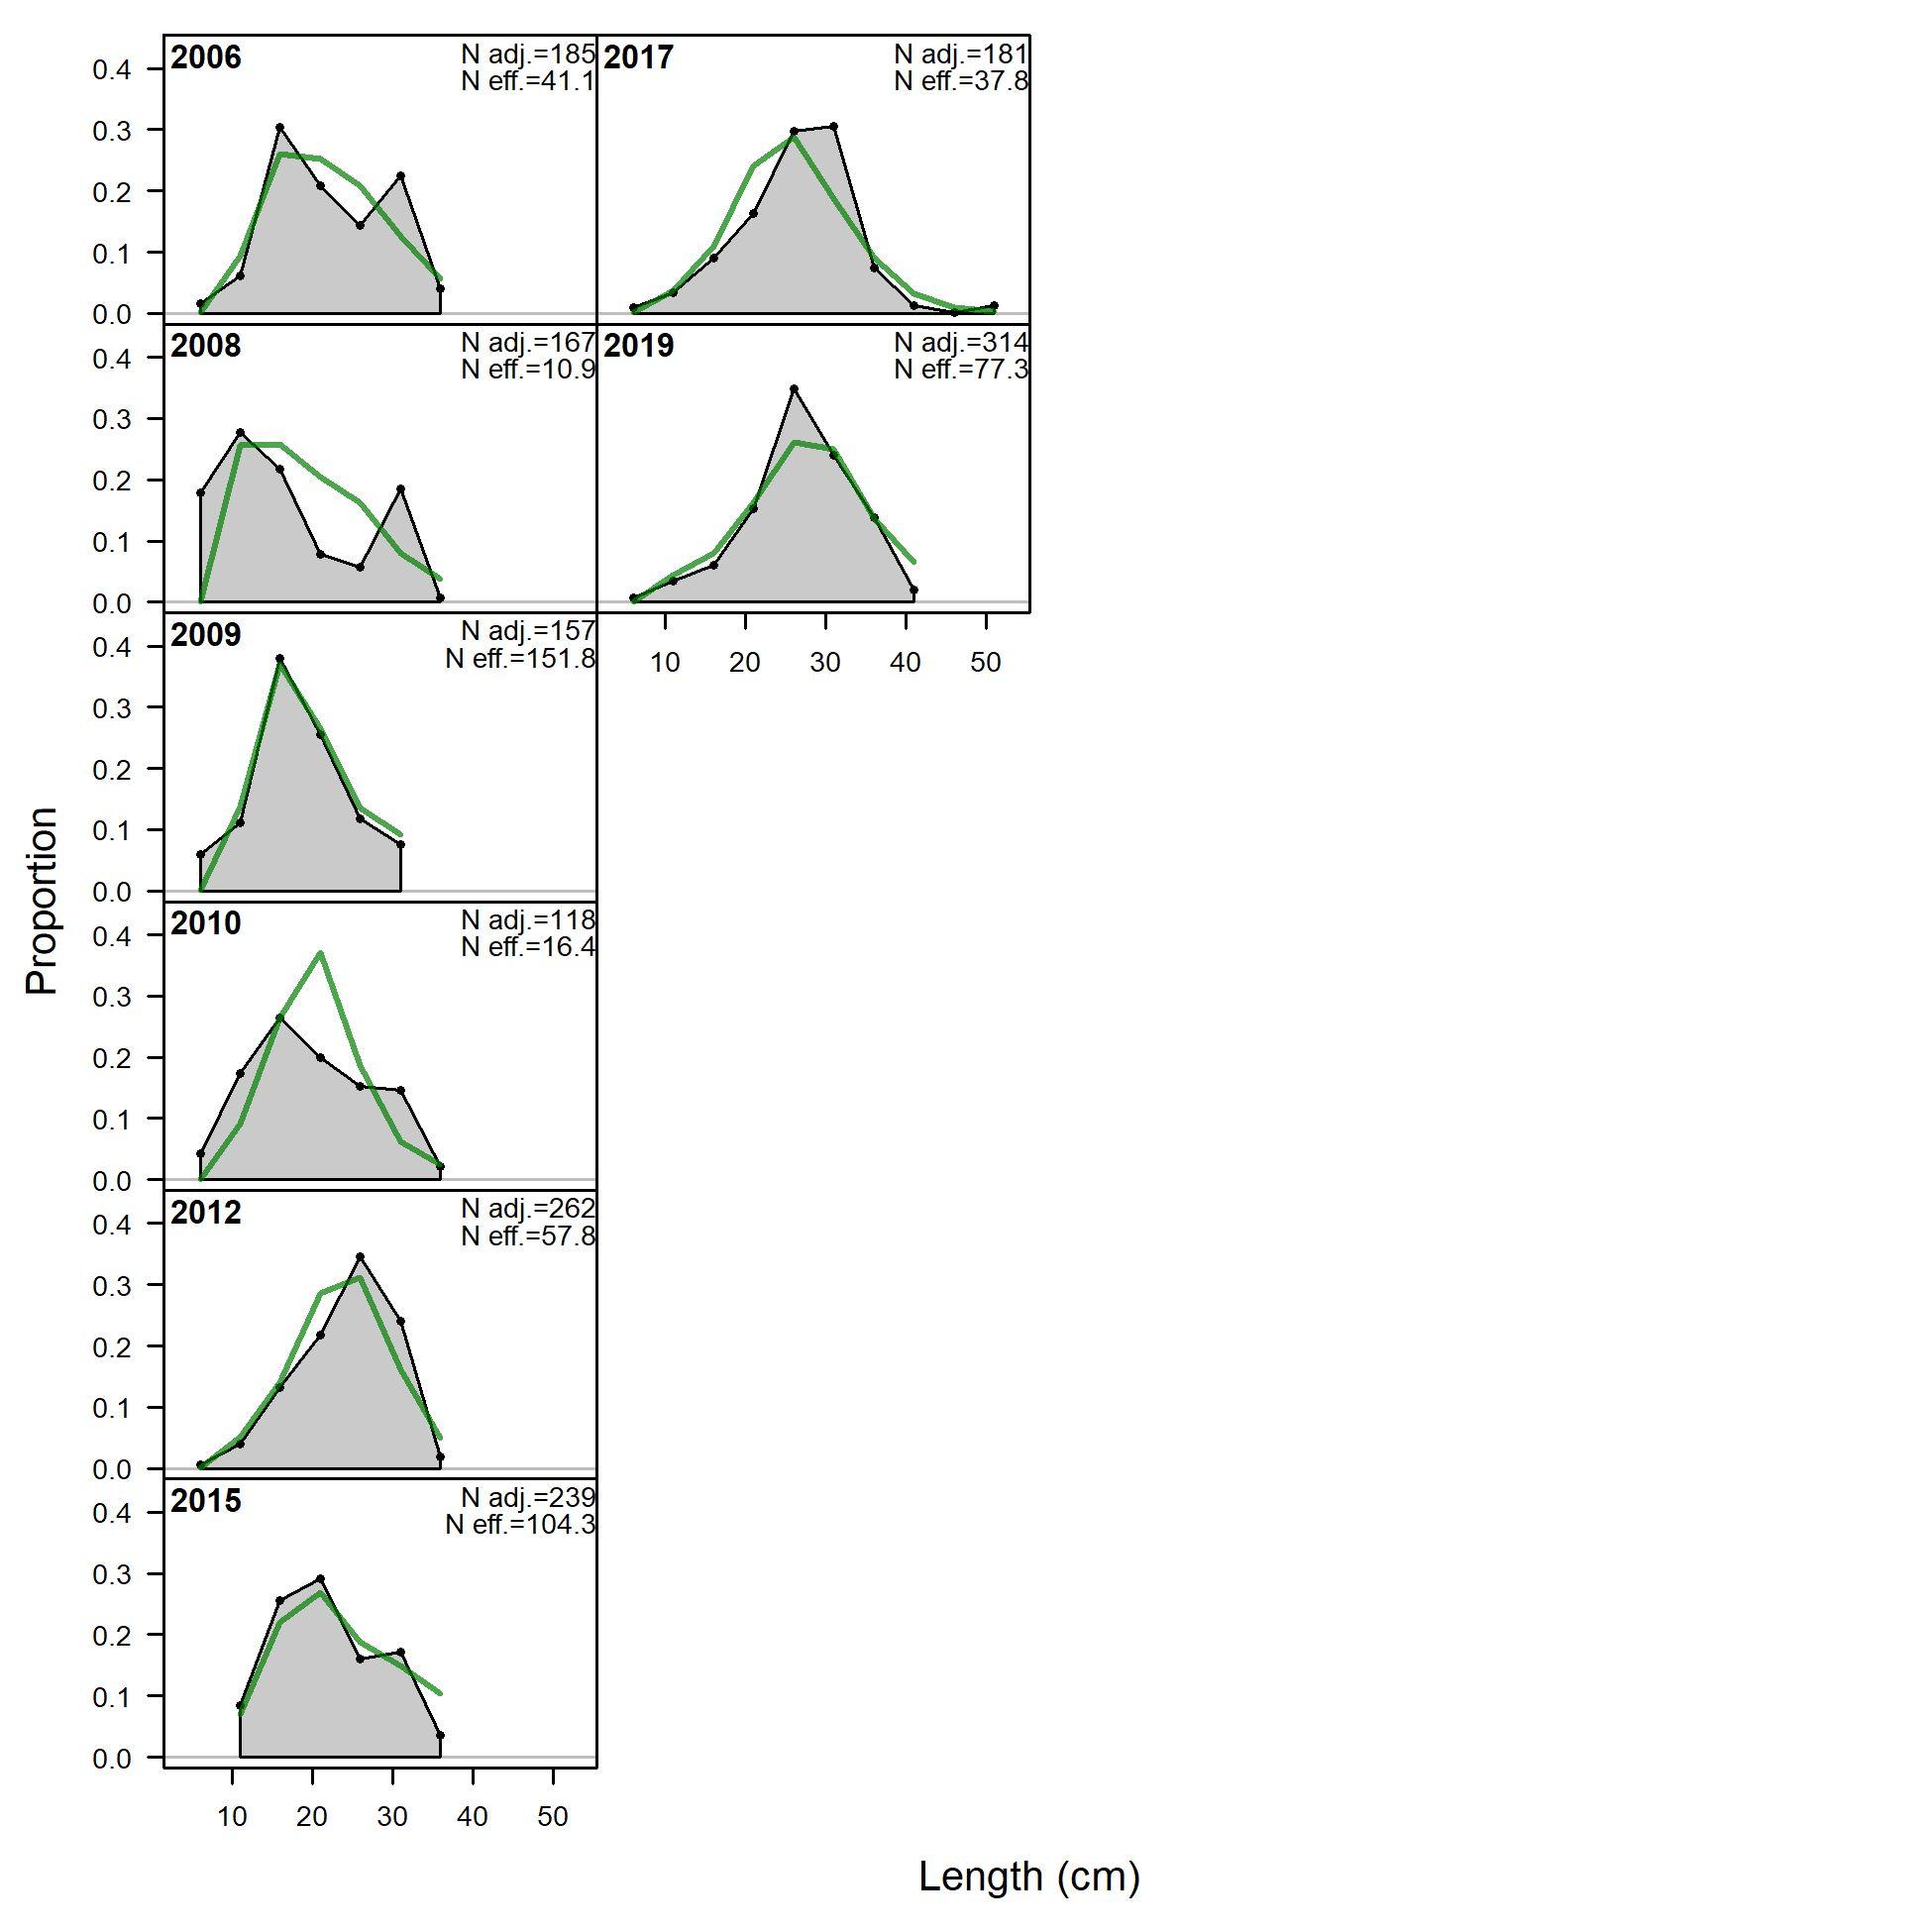
Fit to data
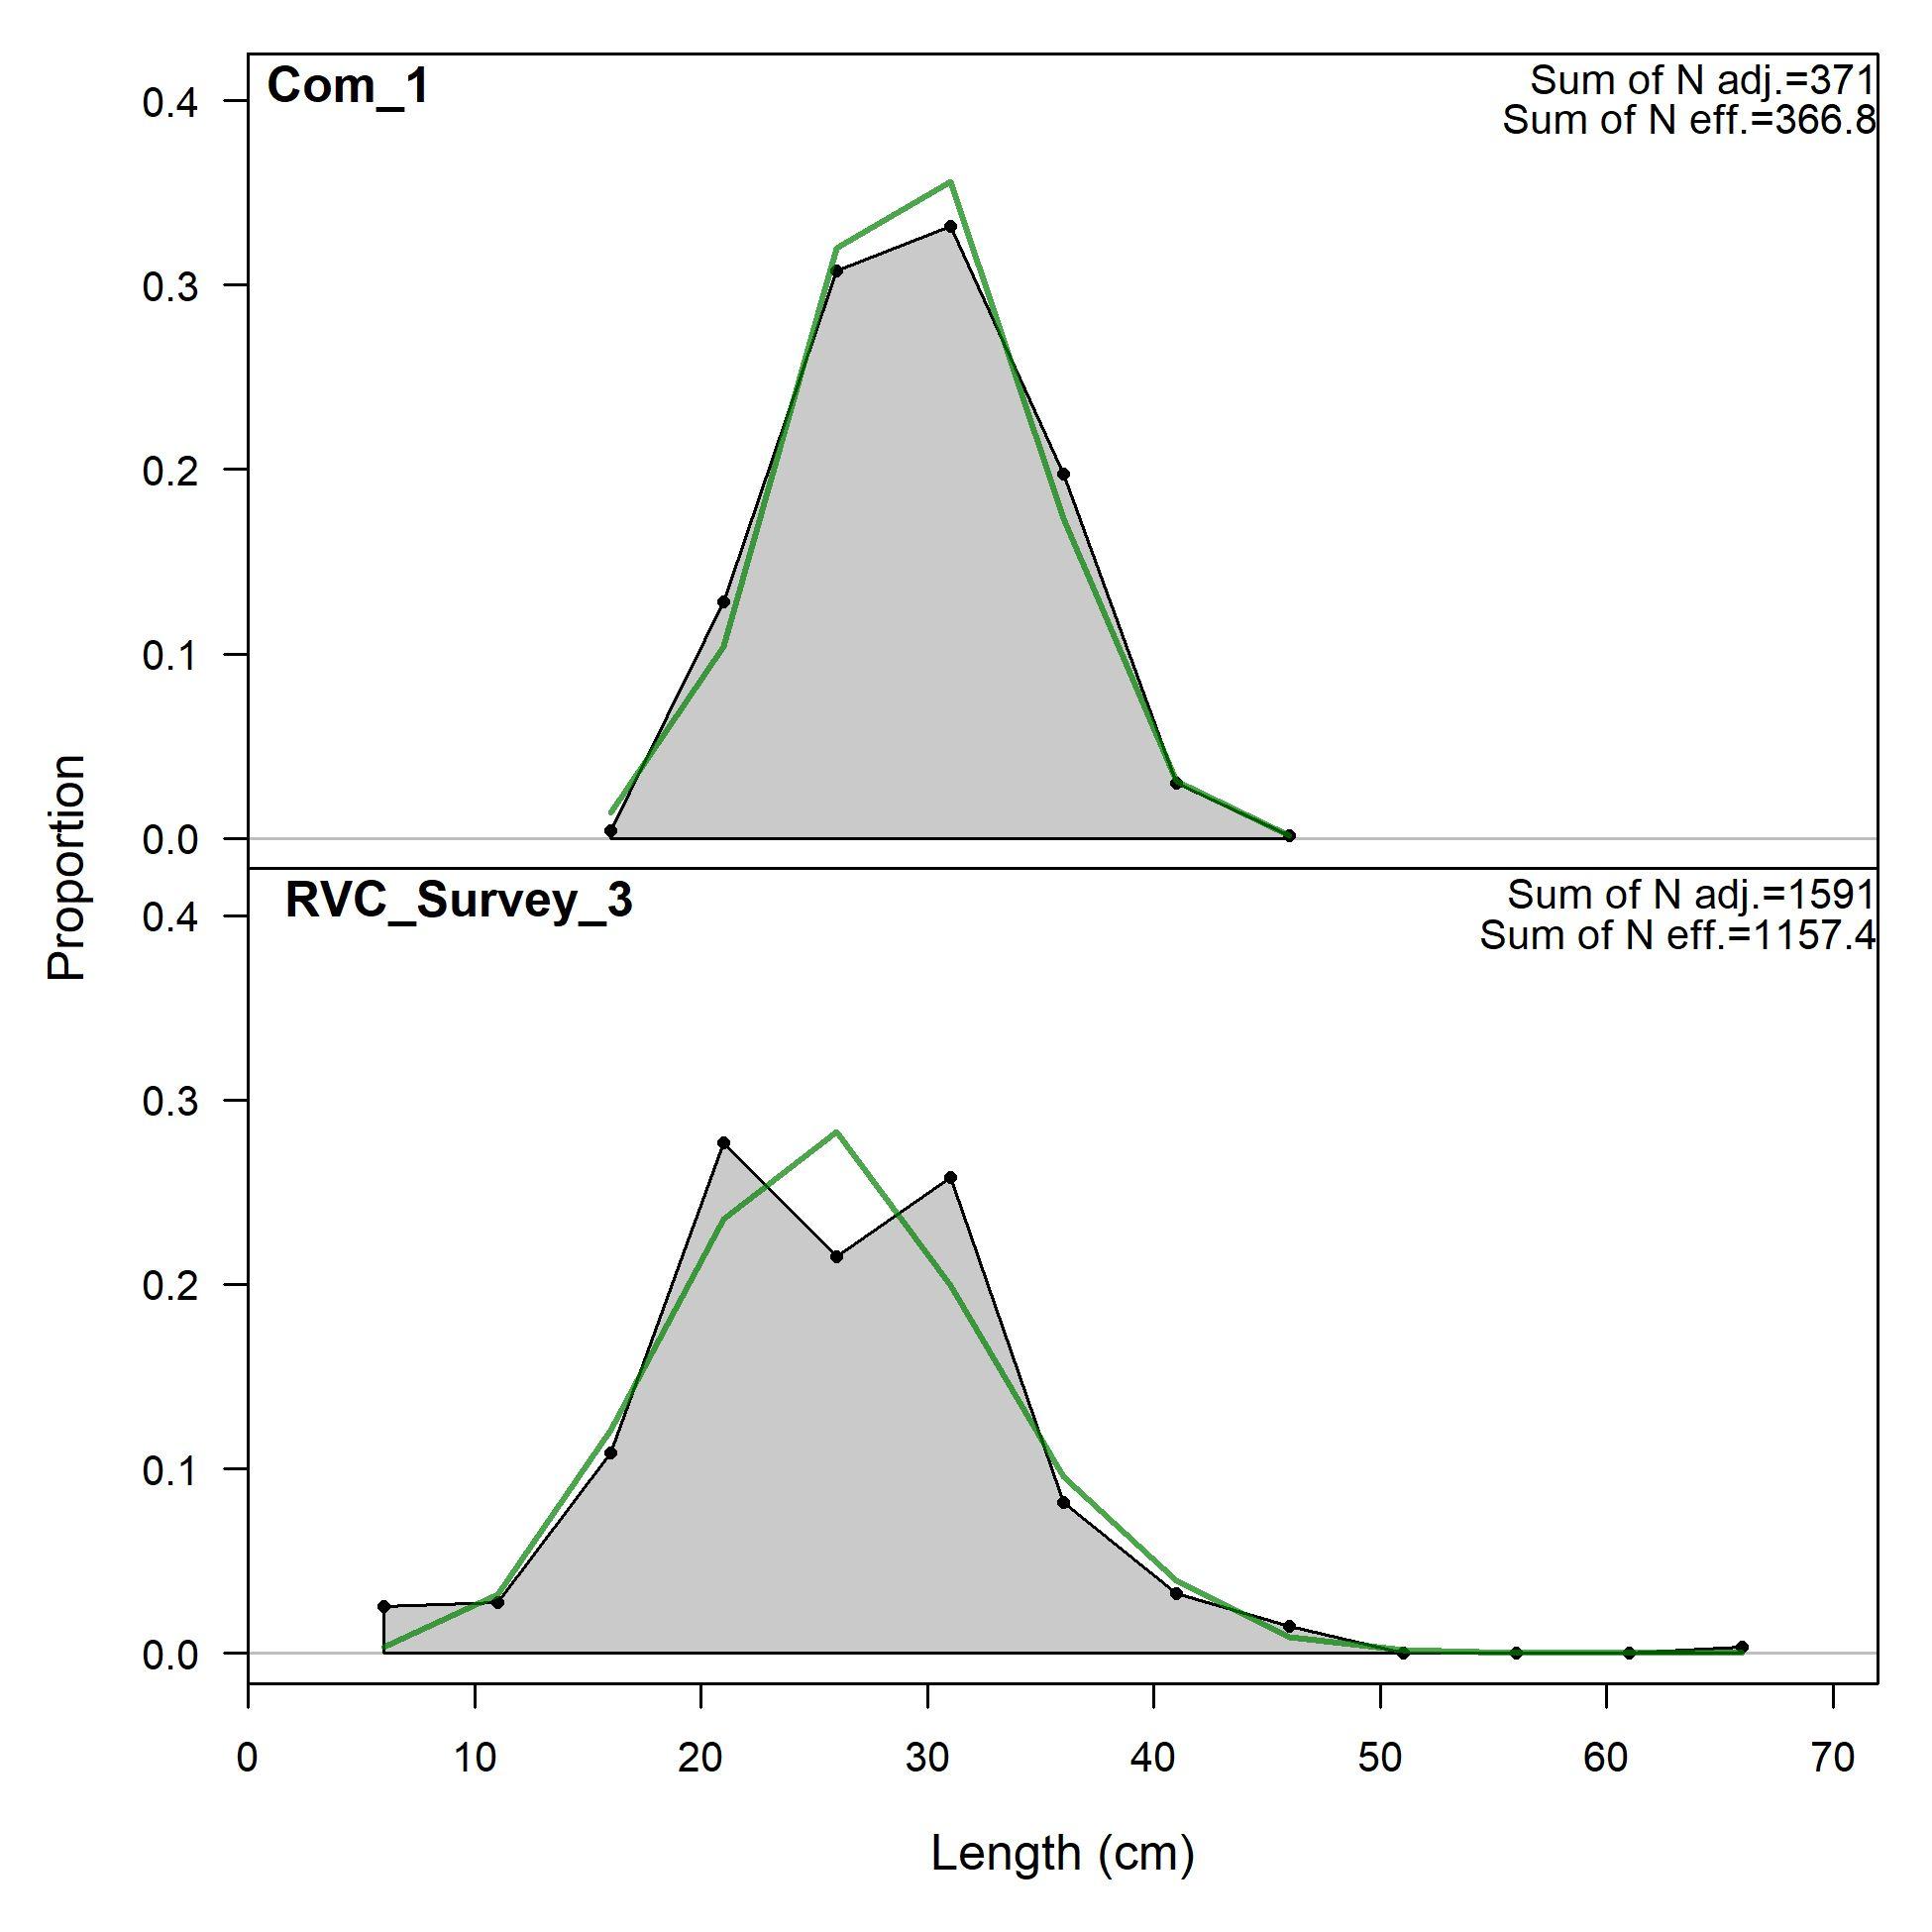
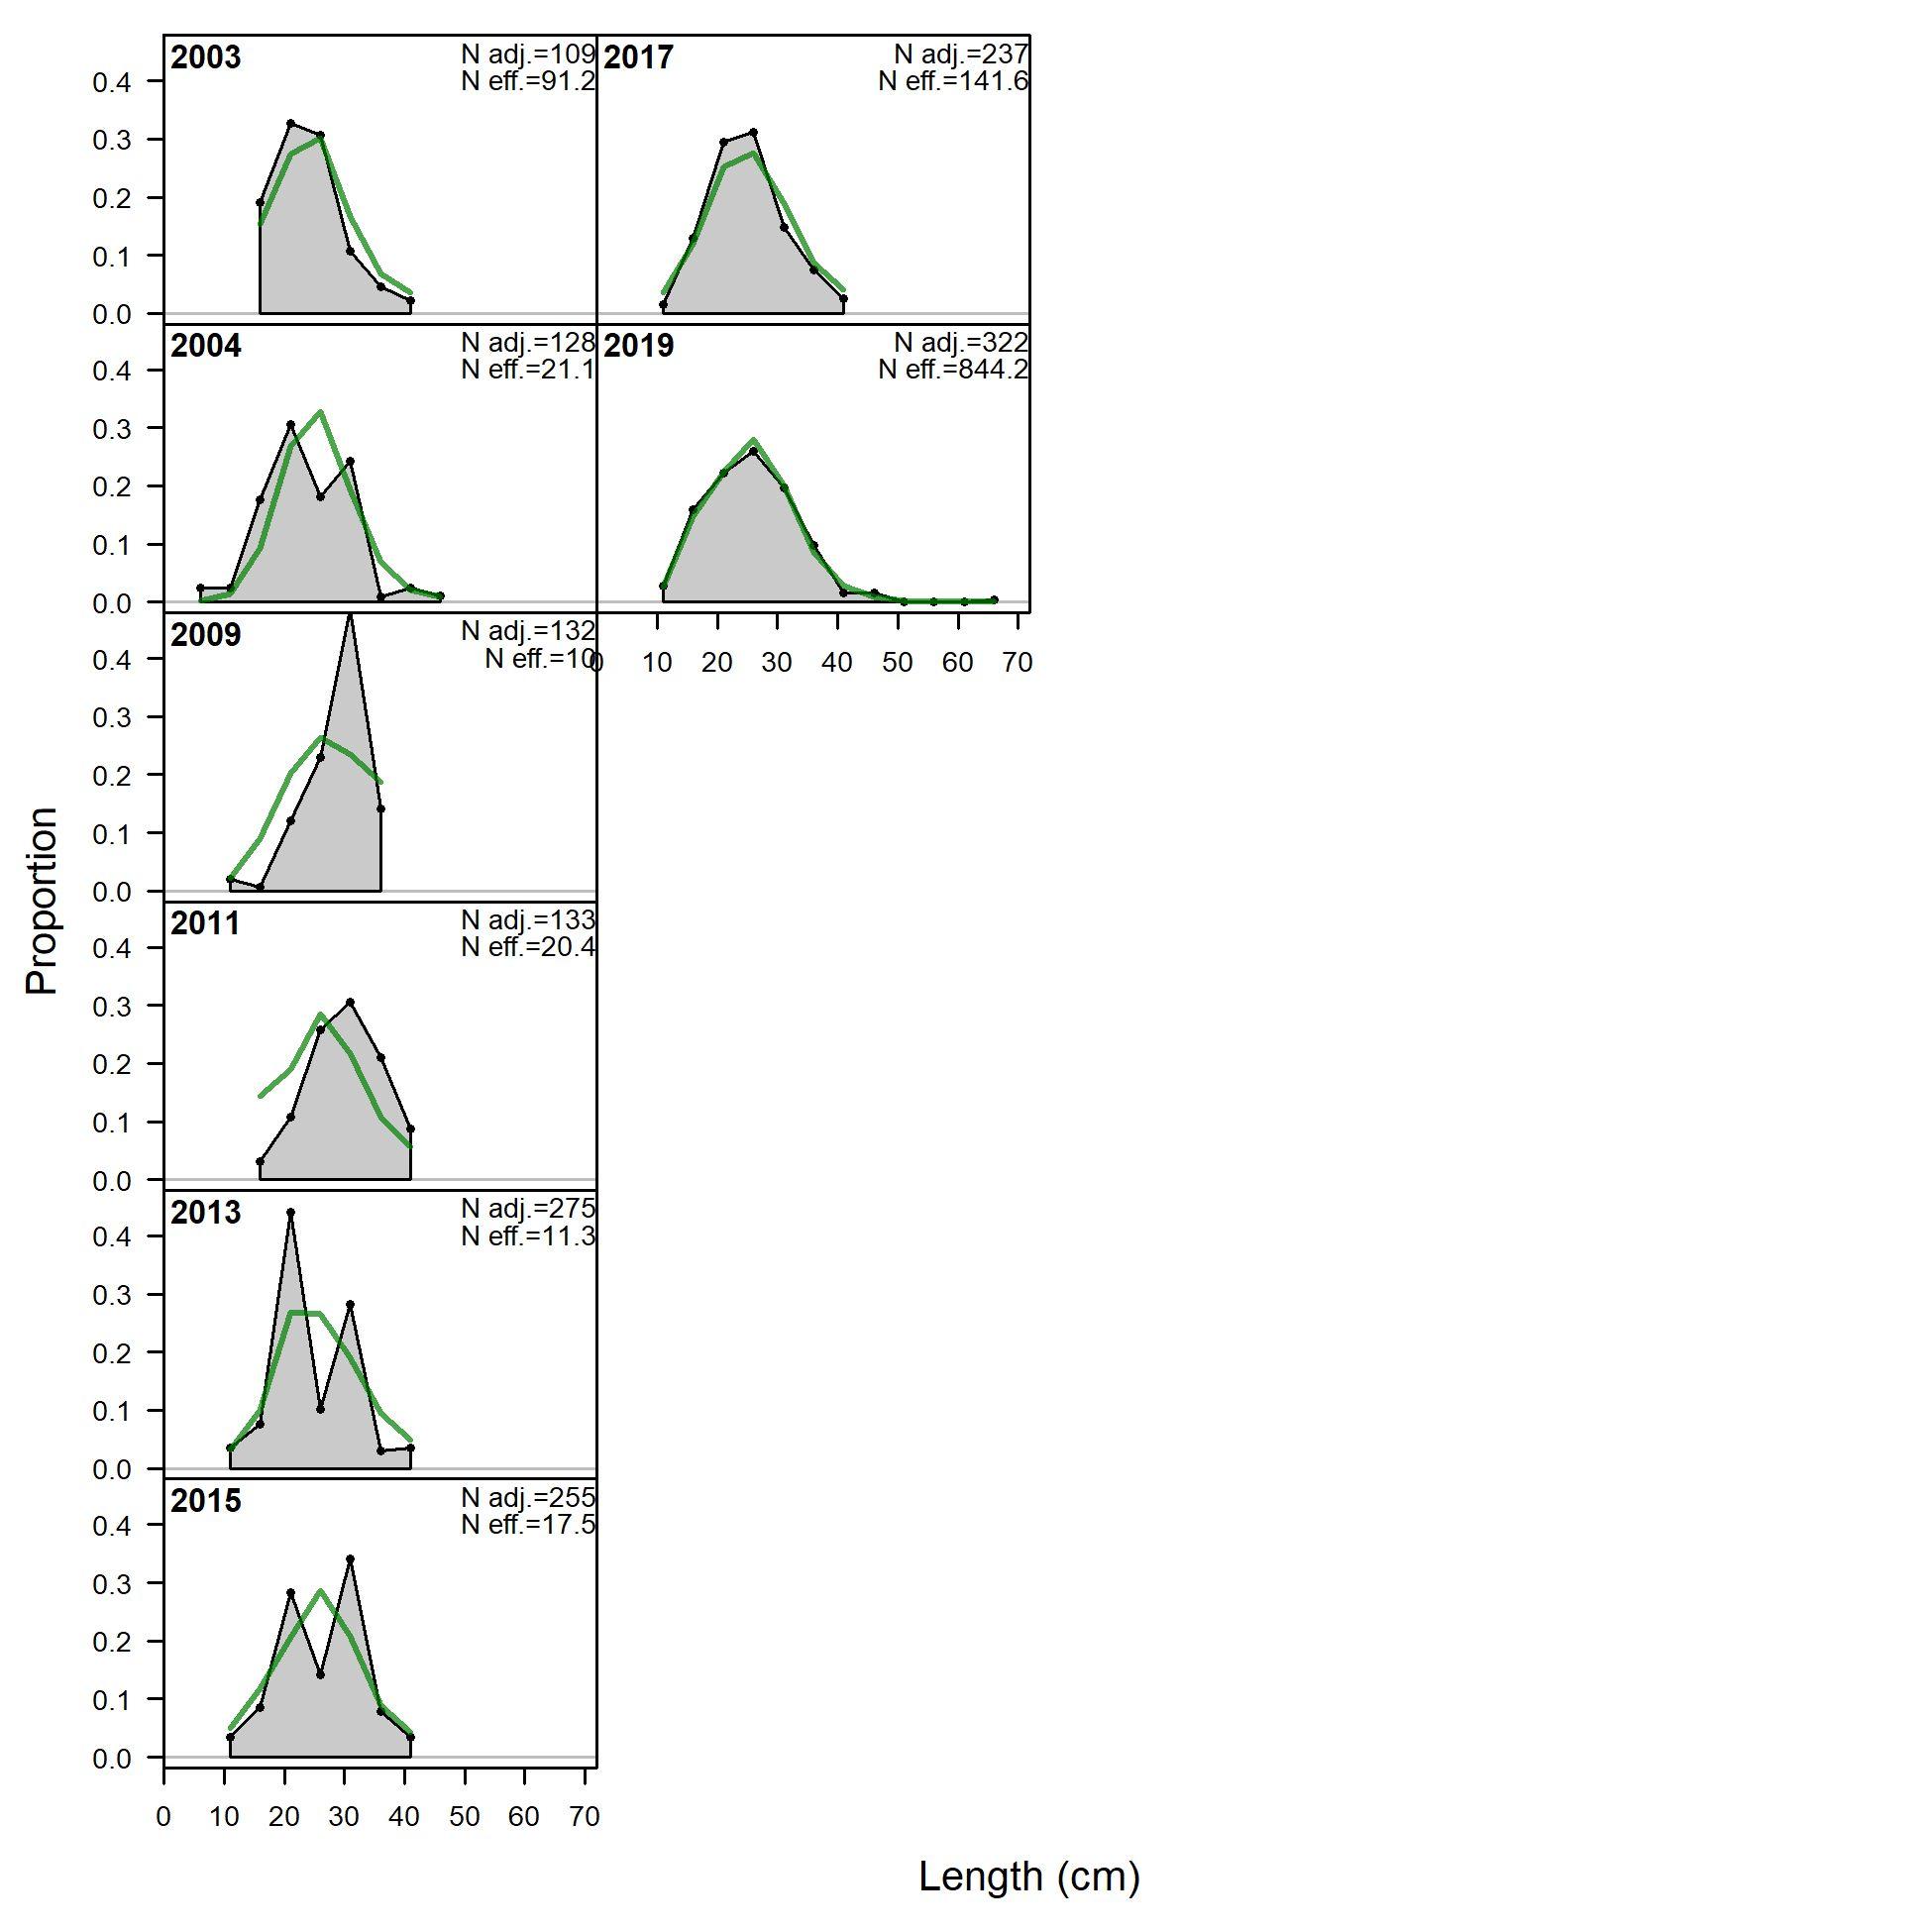
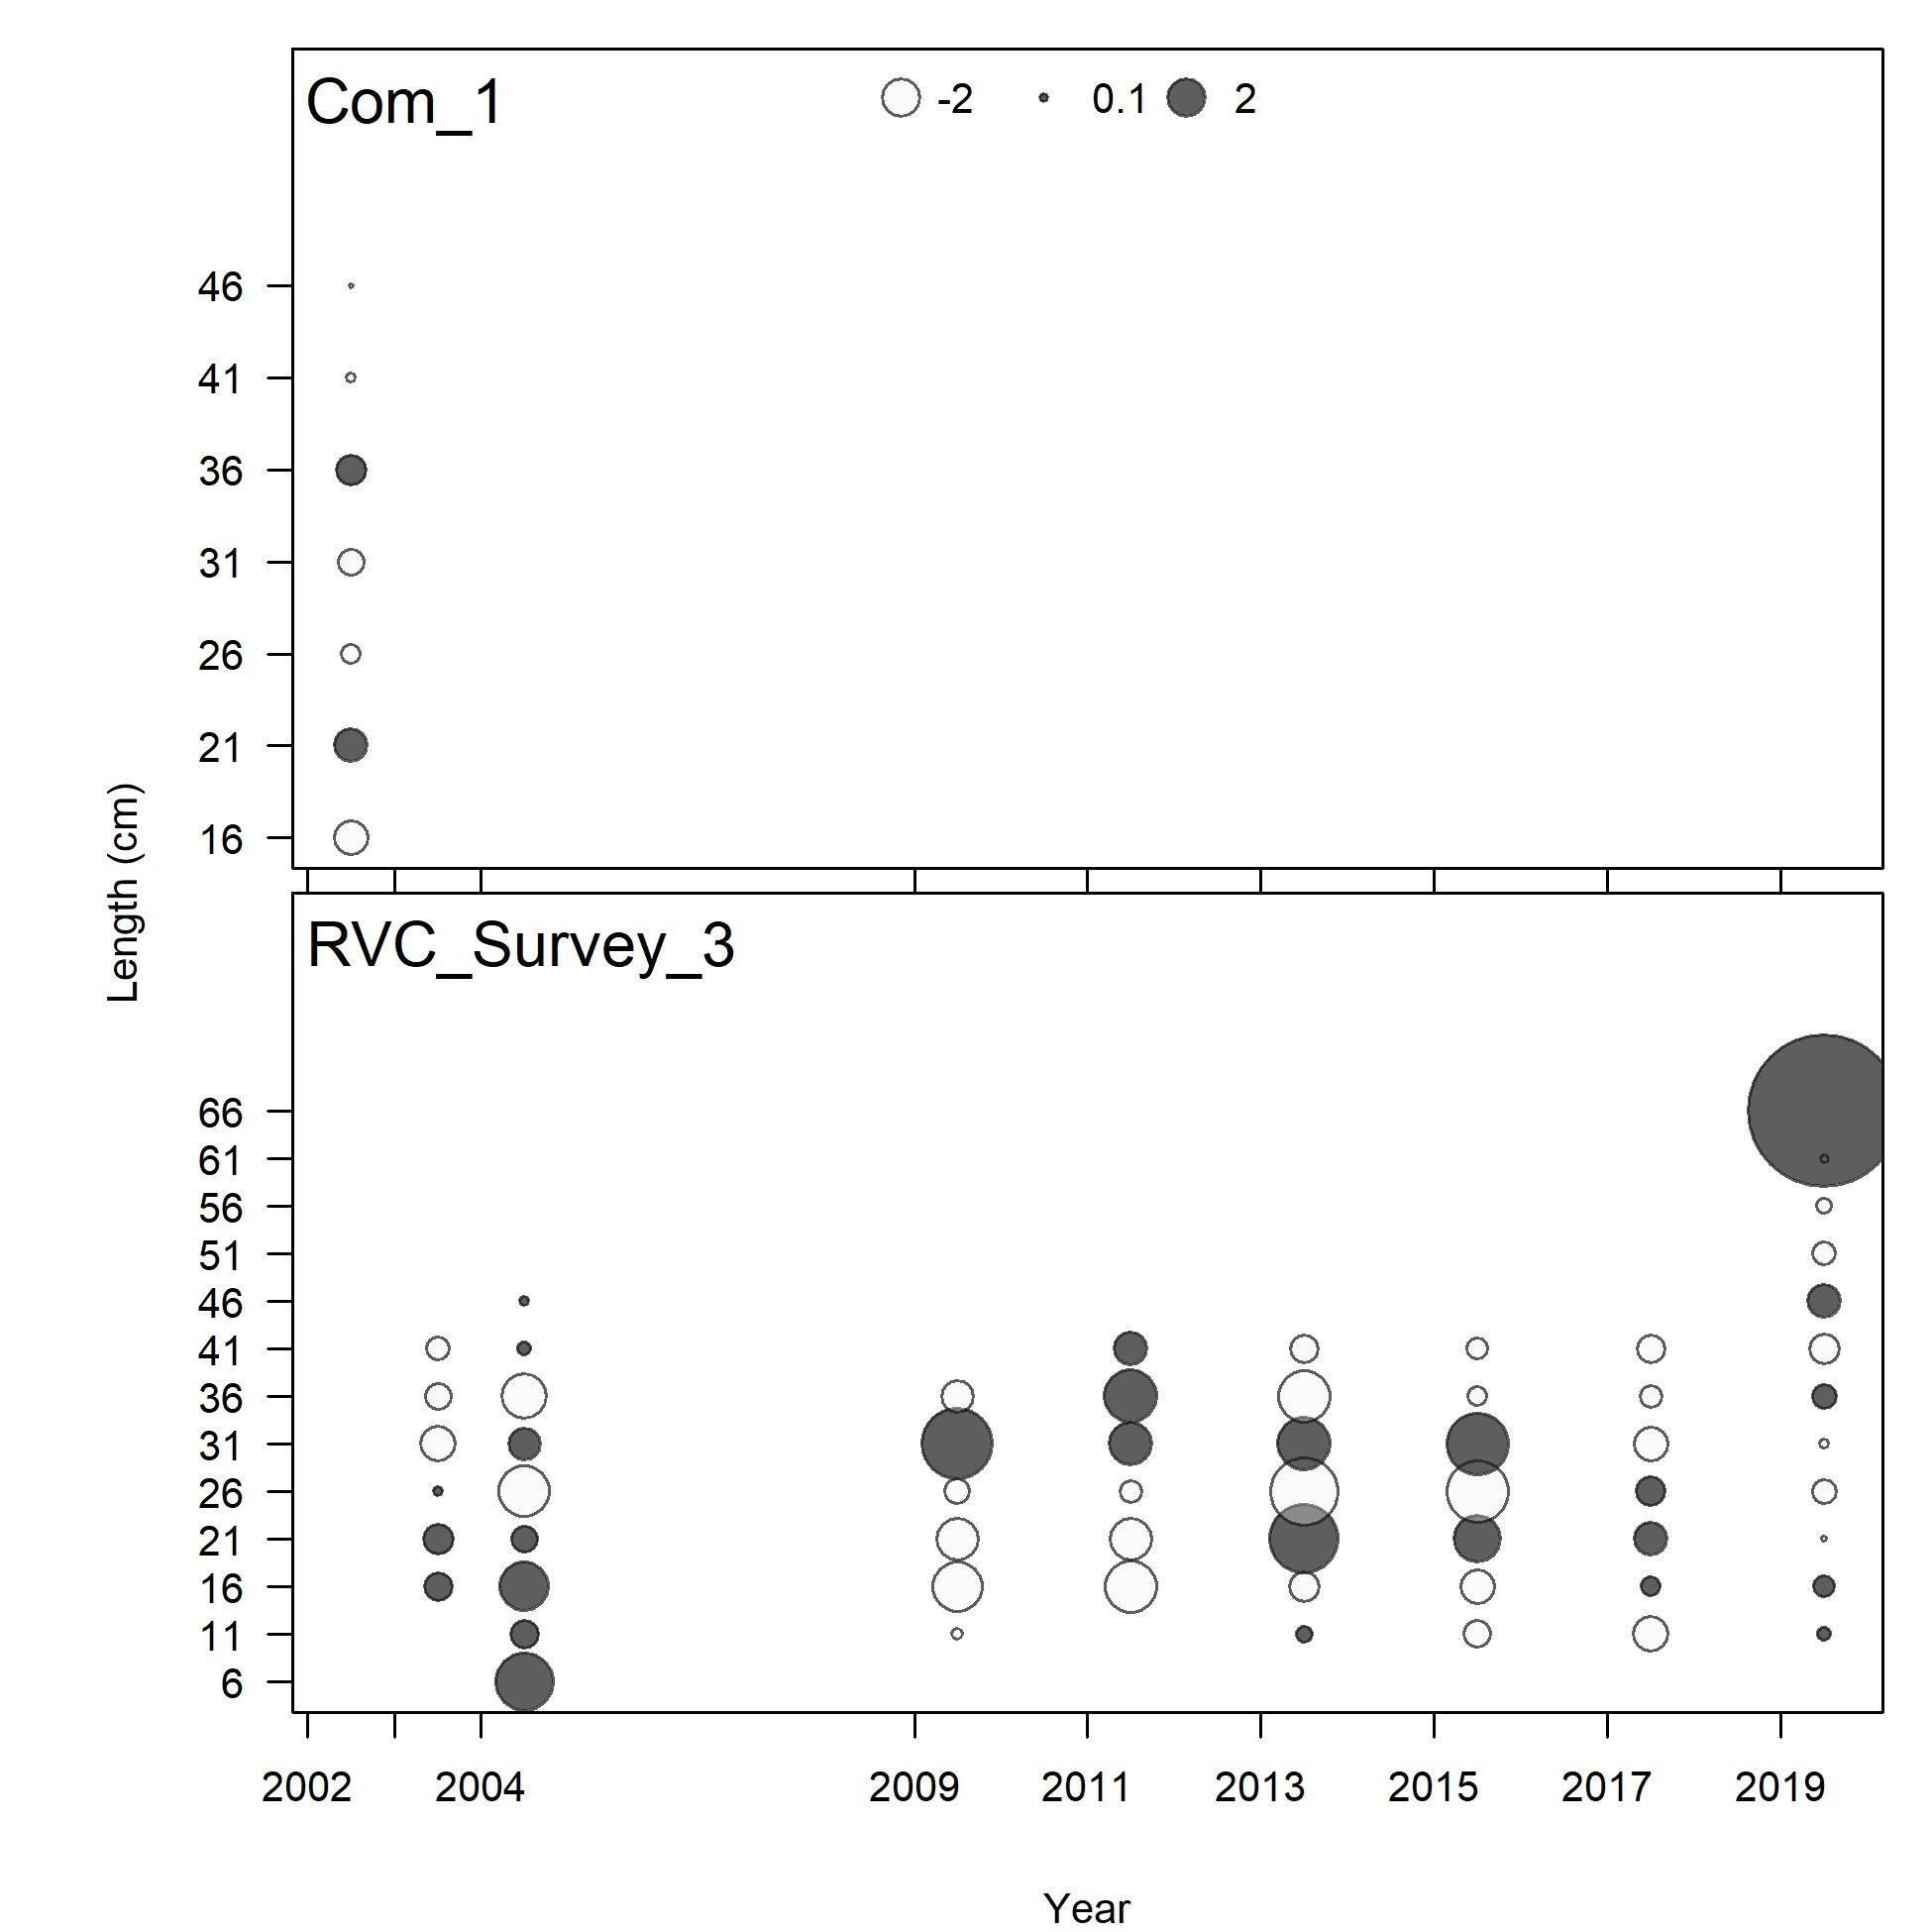
Page 23
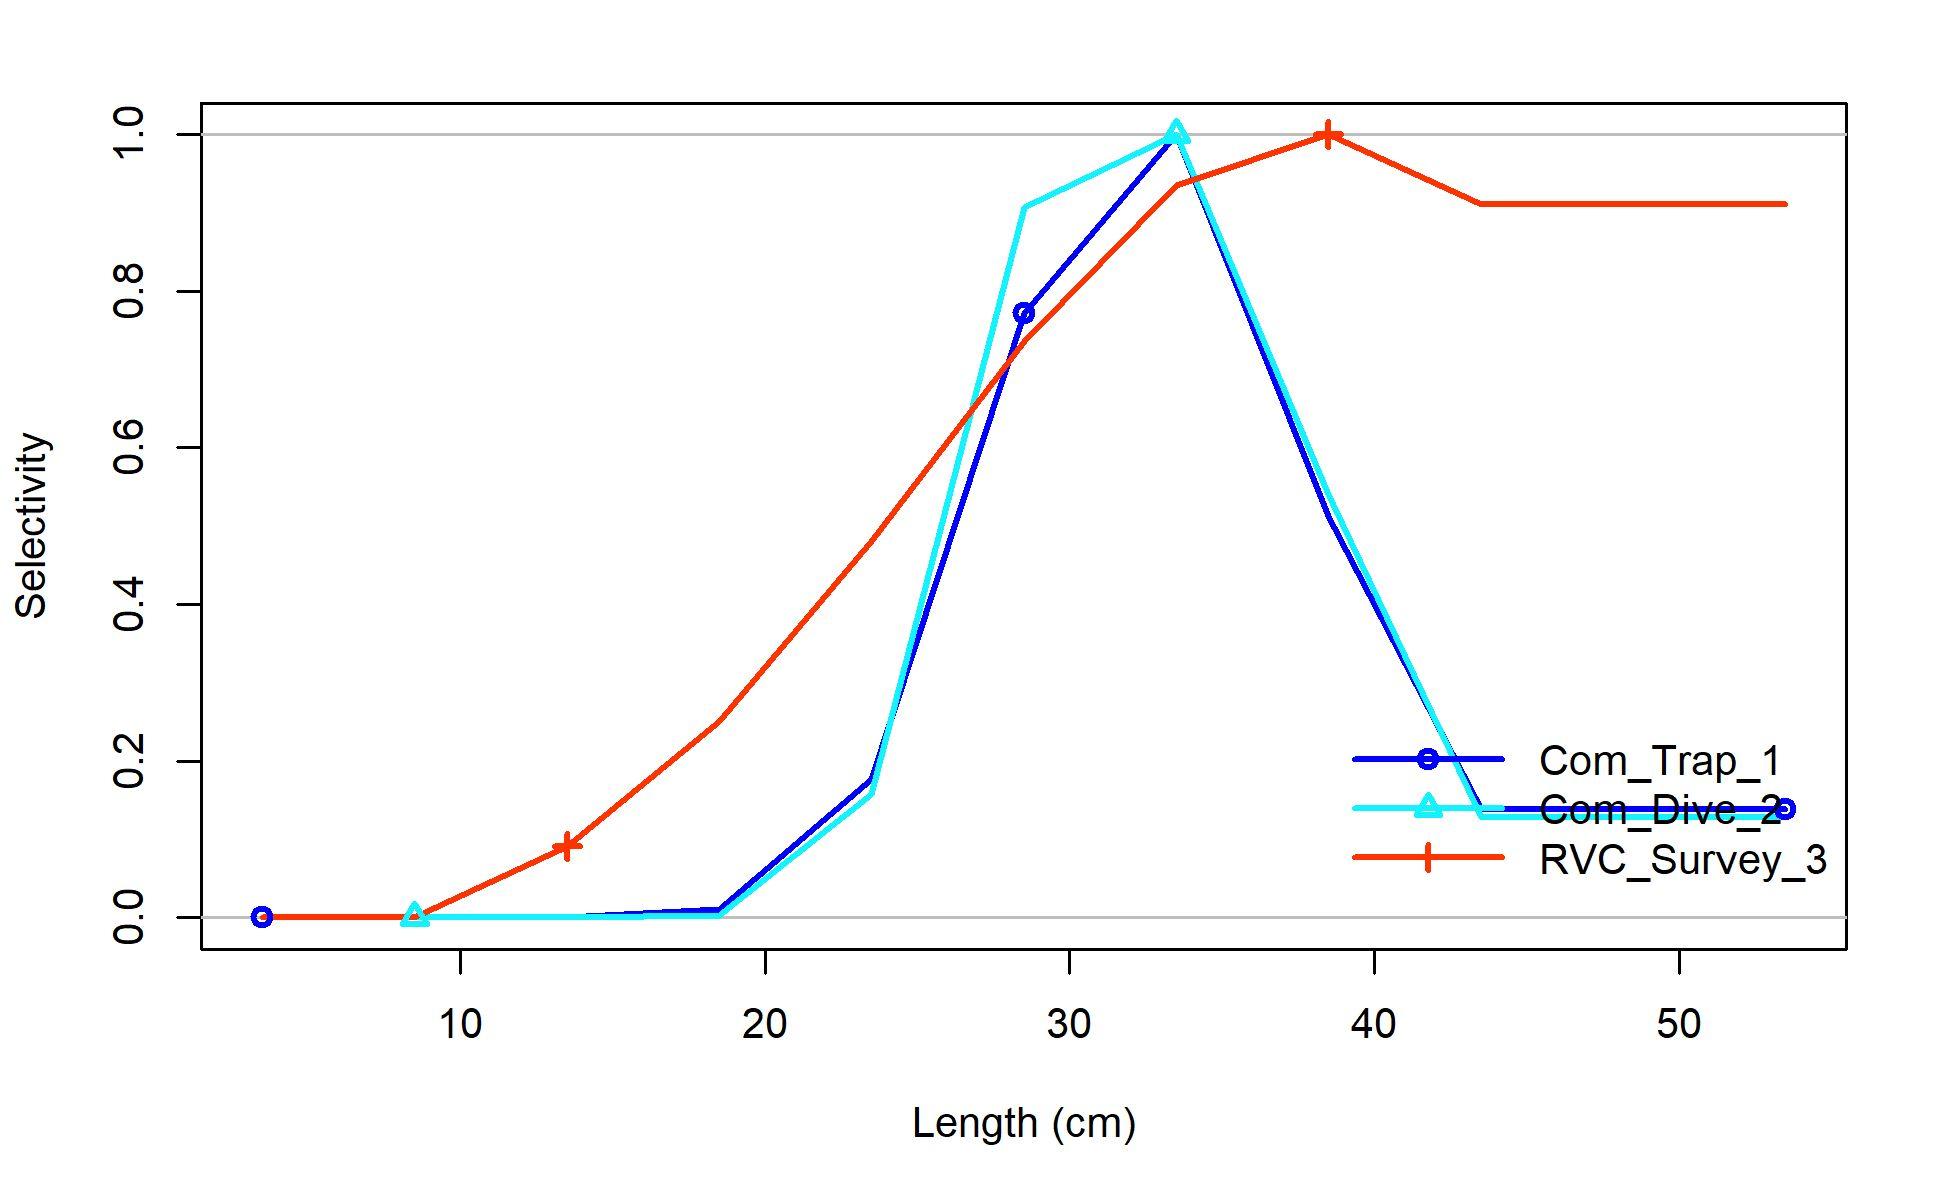
Estimated length selectivity
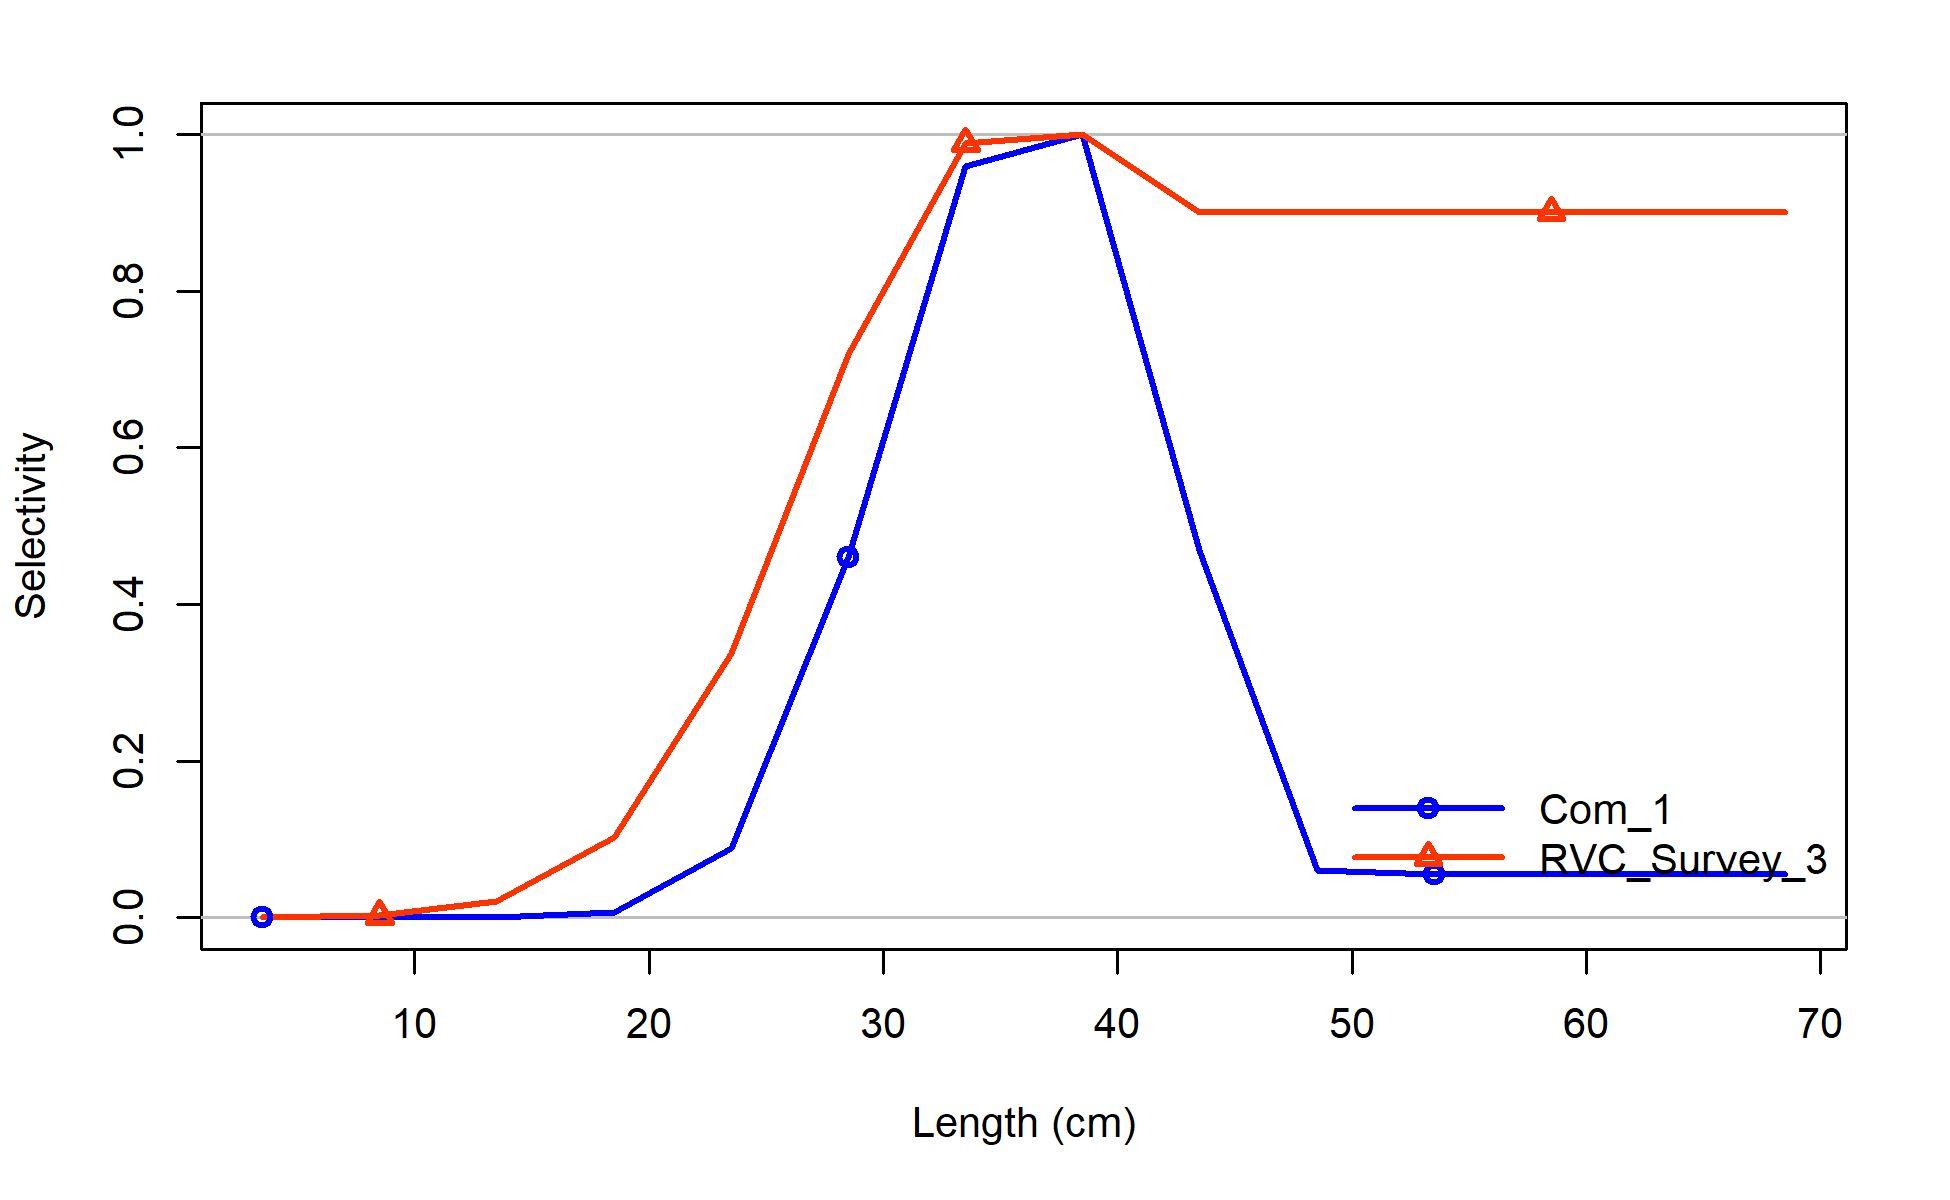
U.S. Department of Commerce | National Oceanic and Atmospheric Administration | National Marine Fisheries Service Page 24
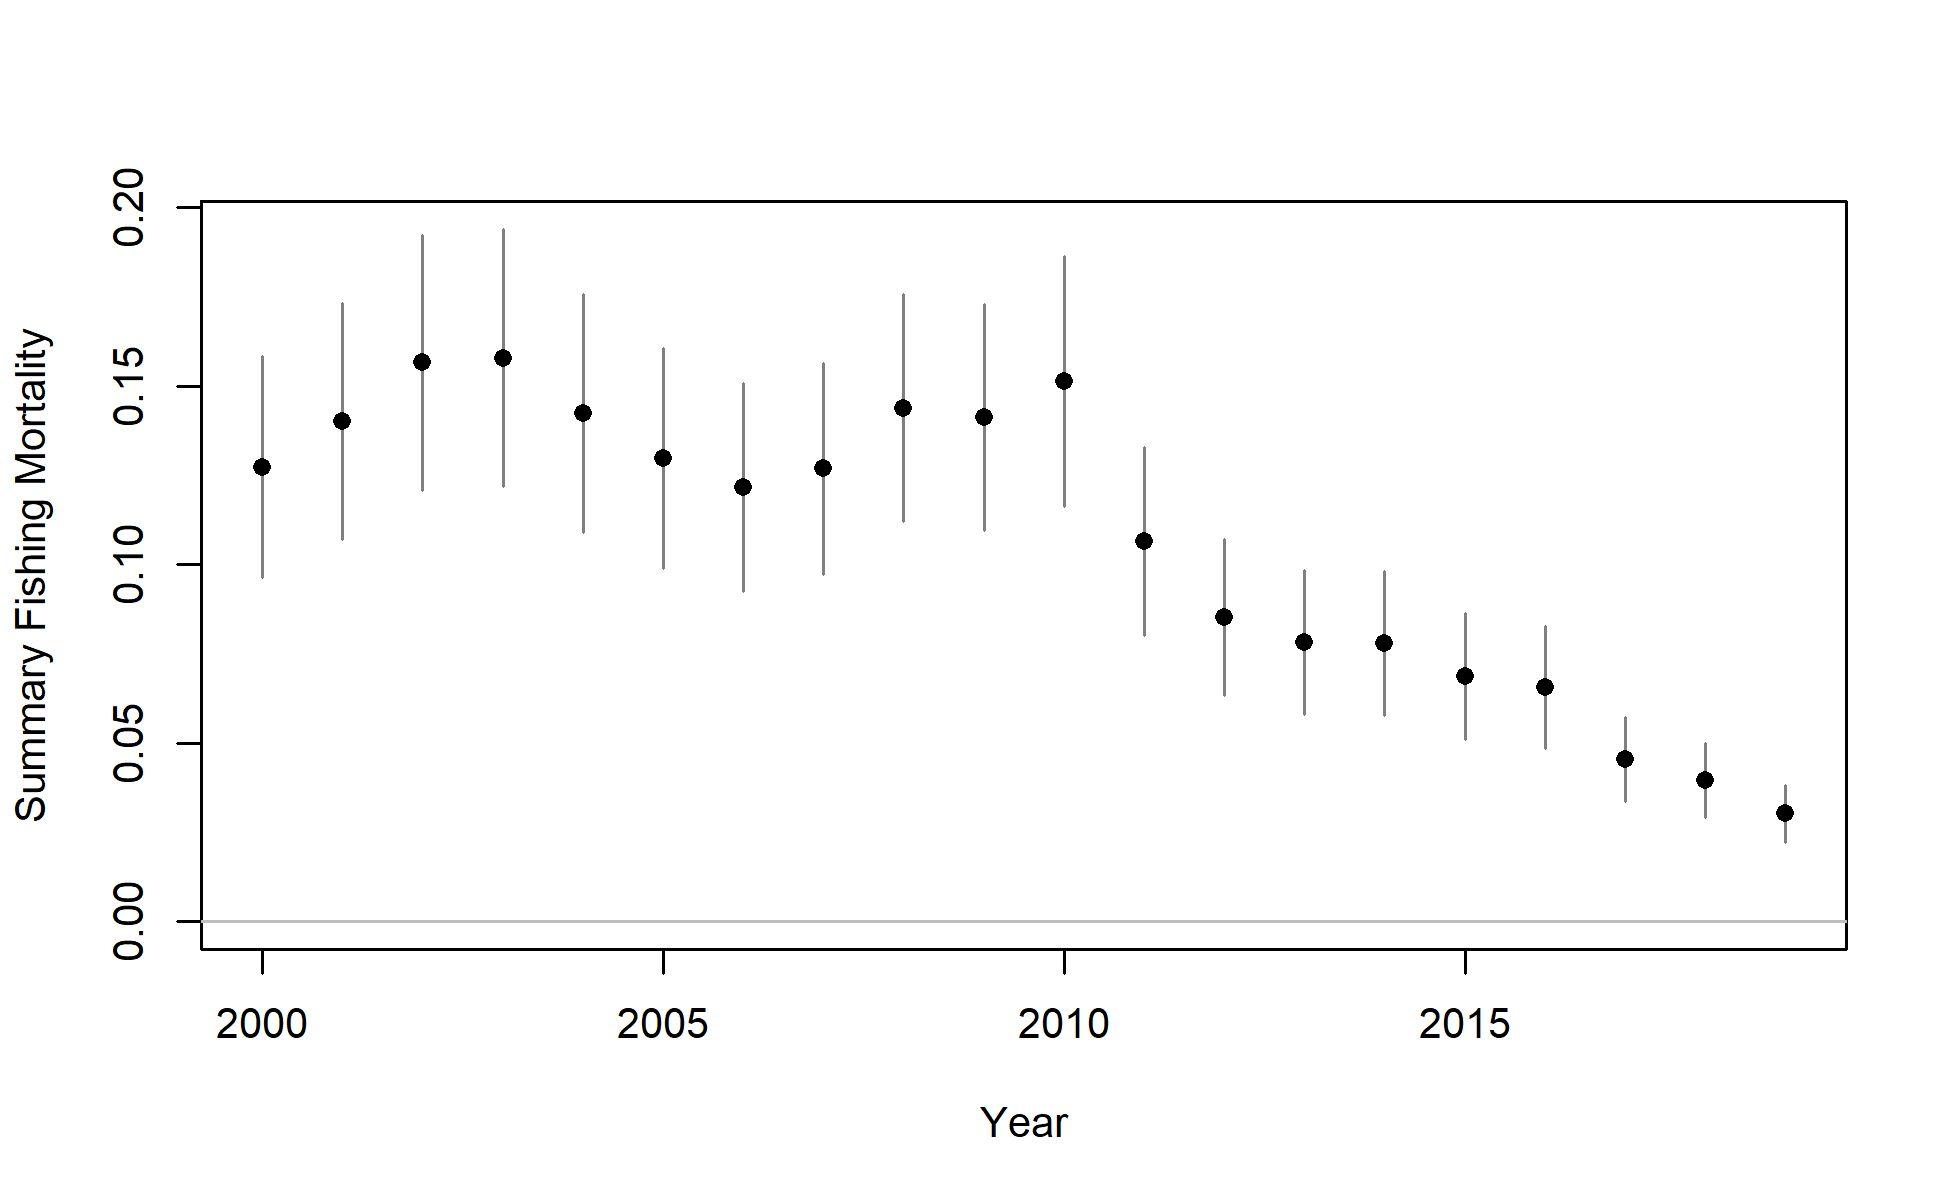
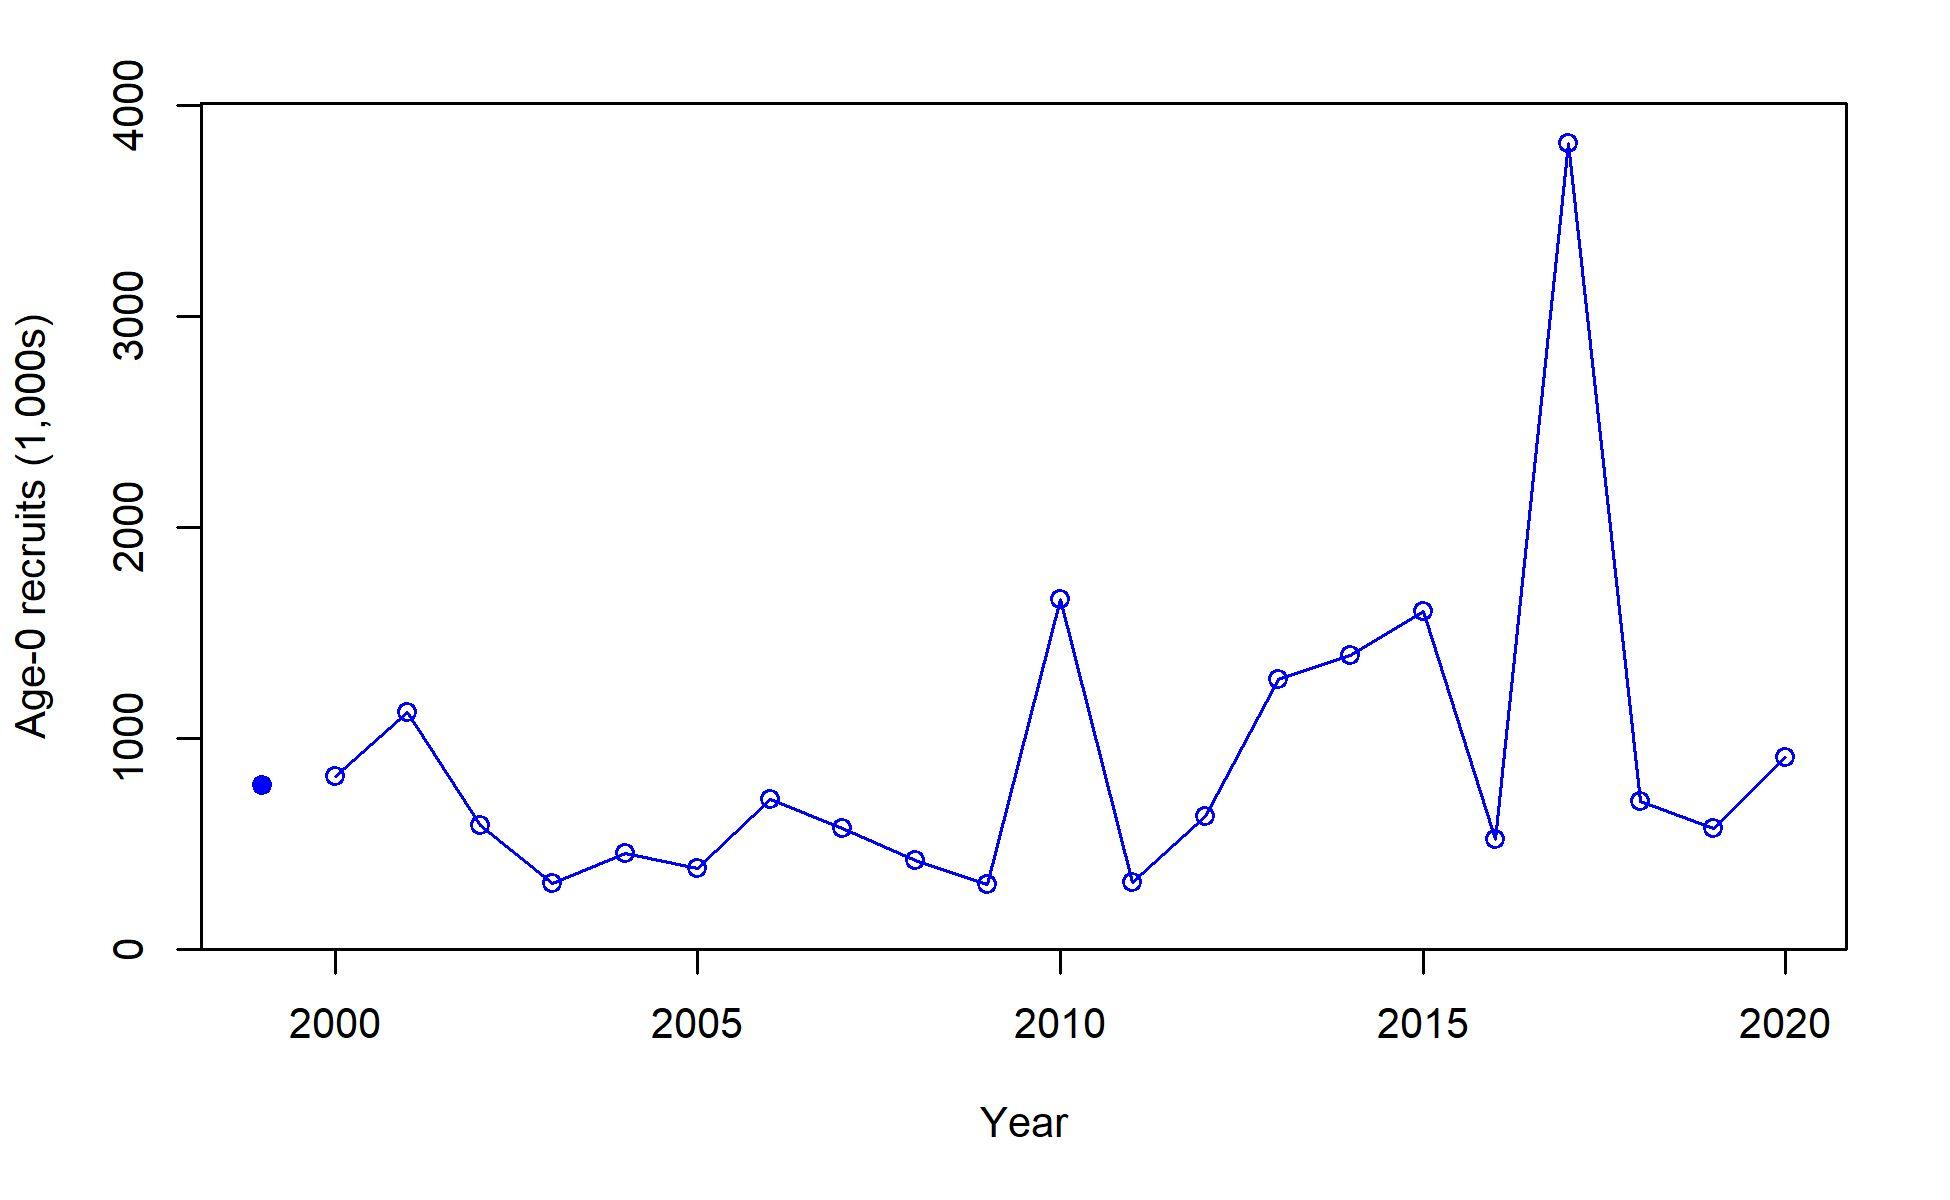
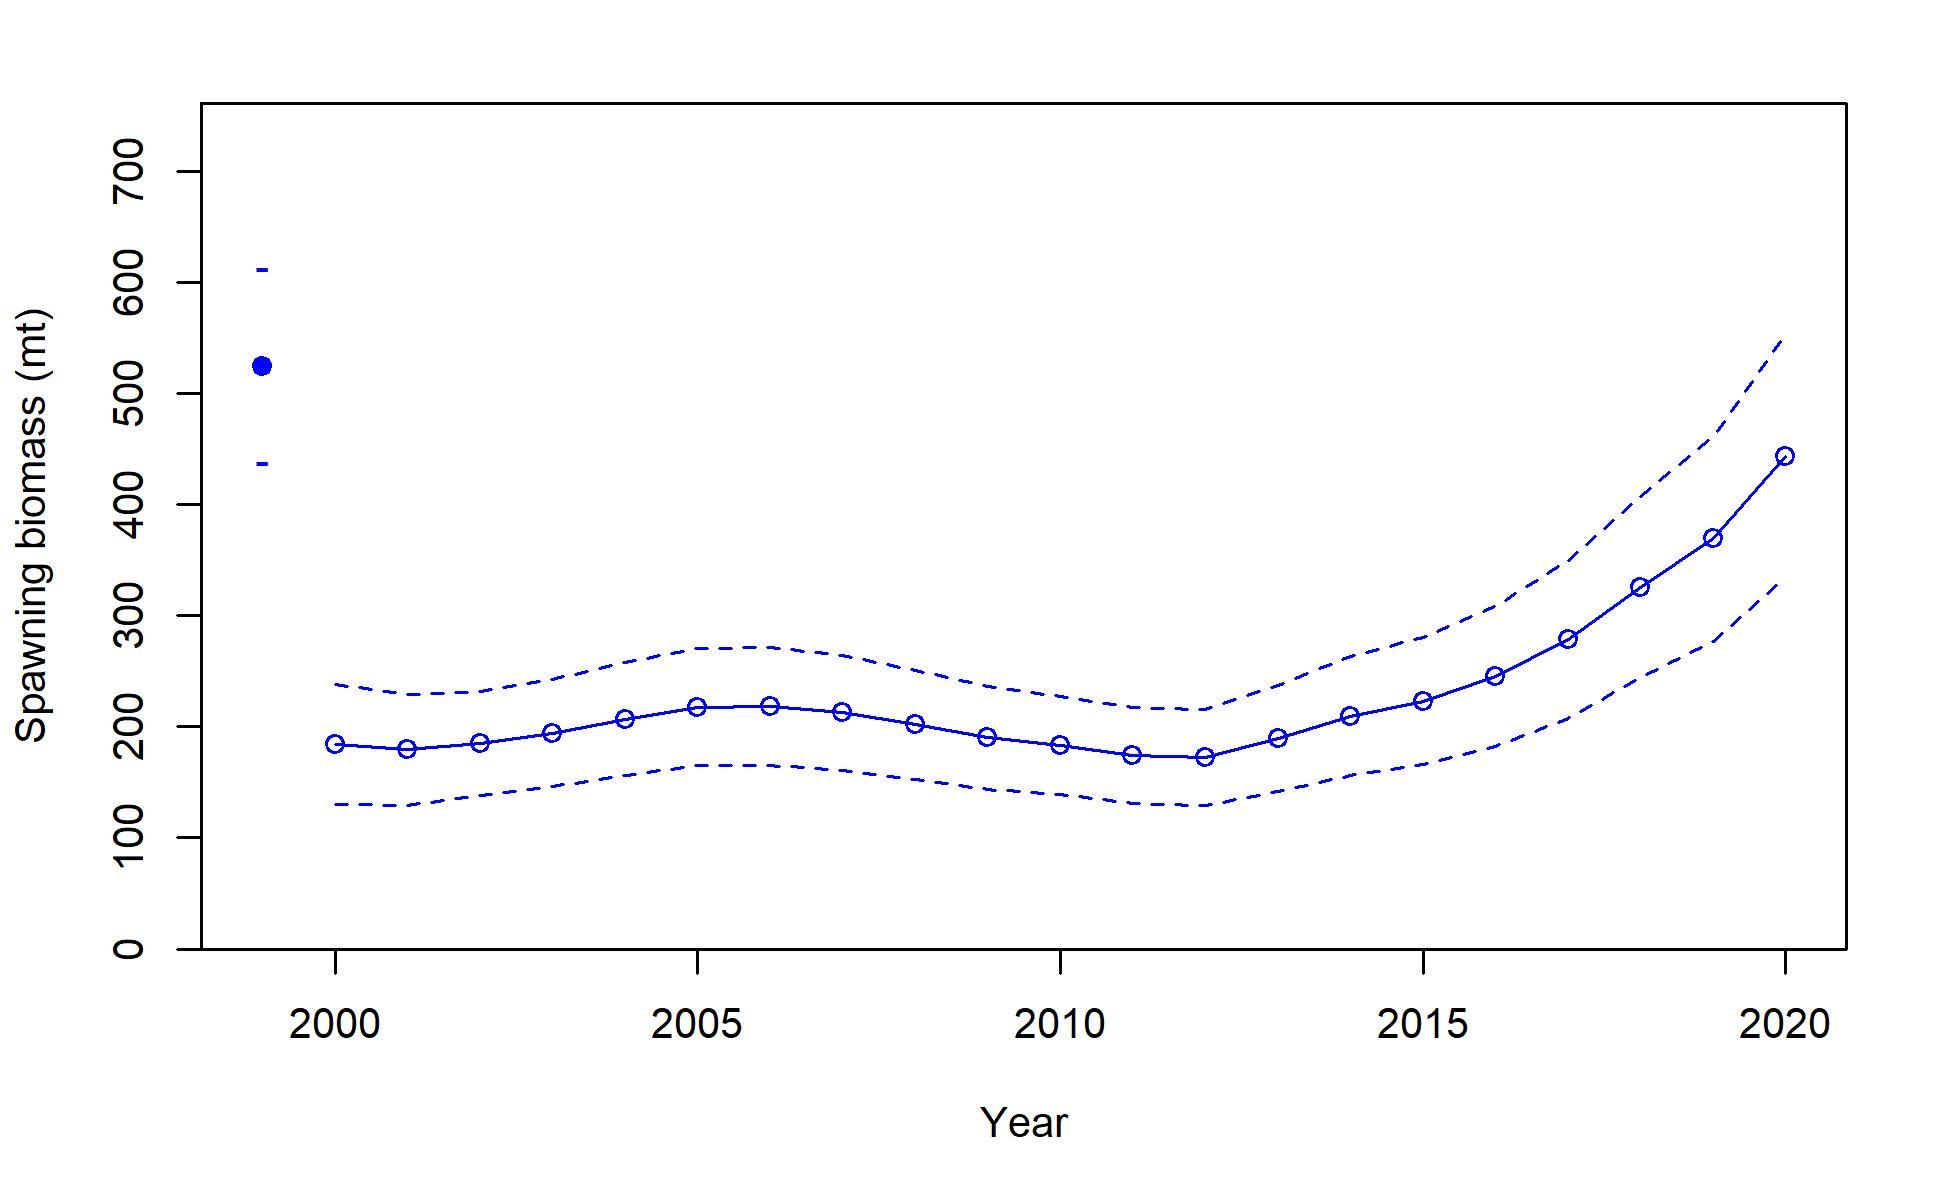
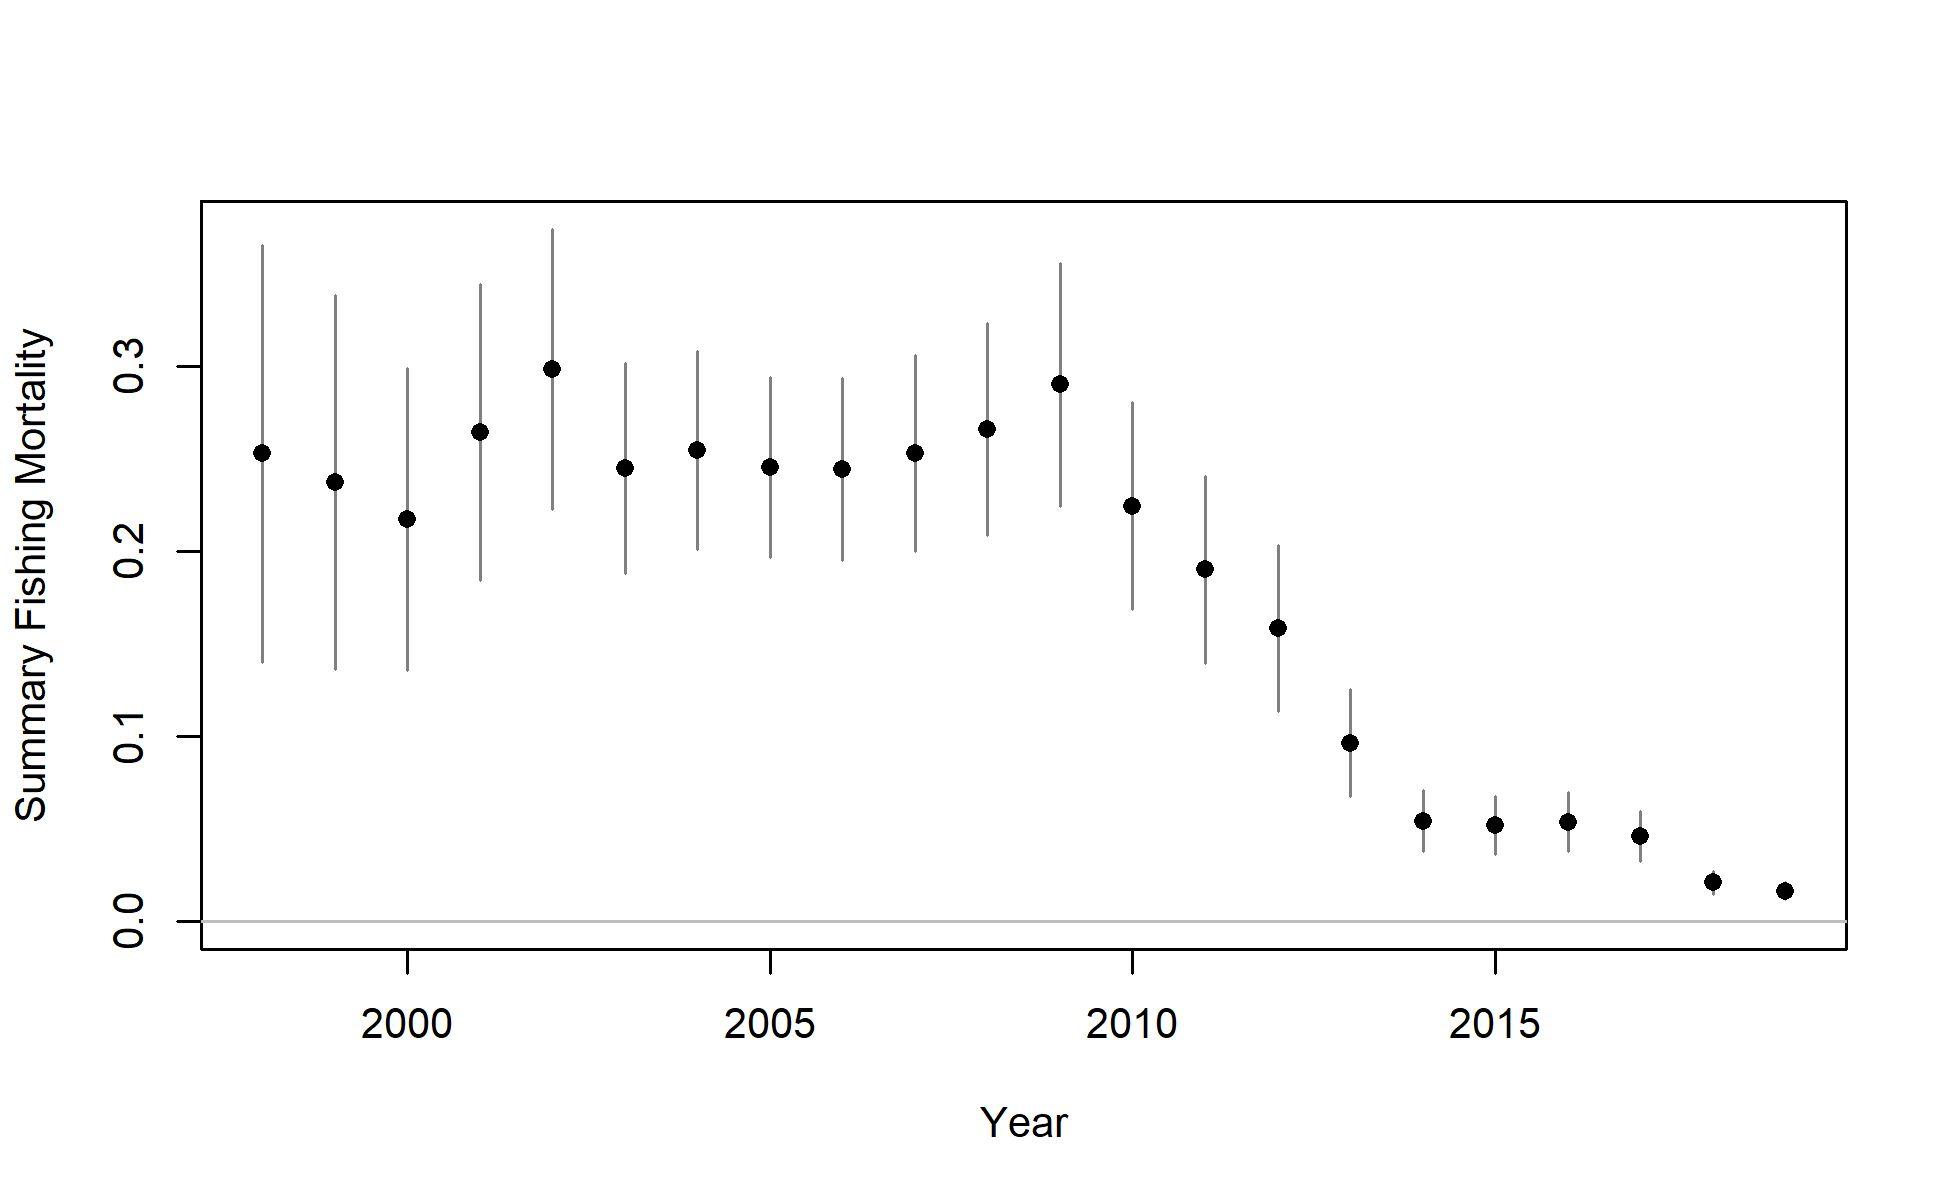
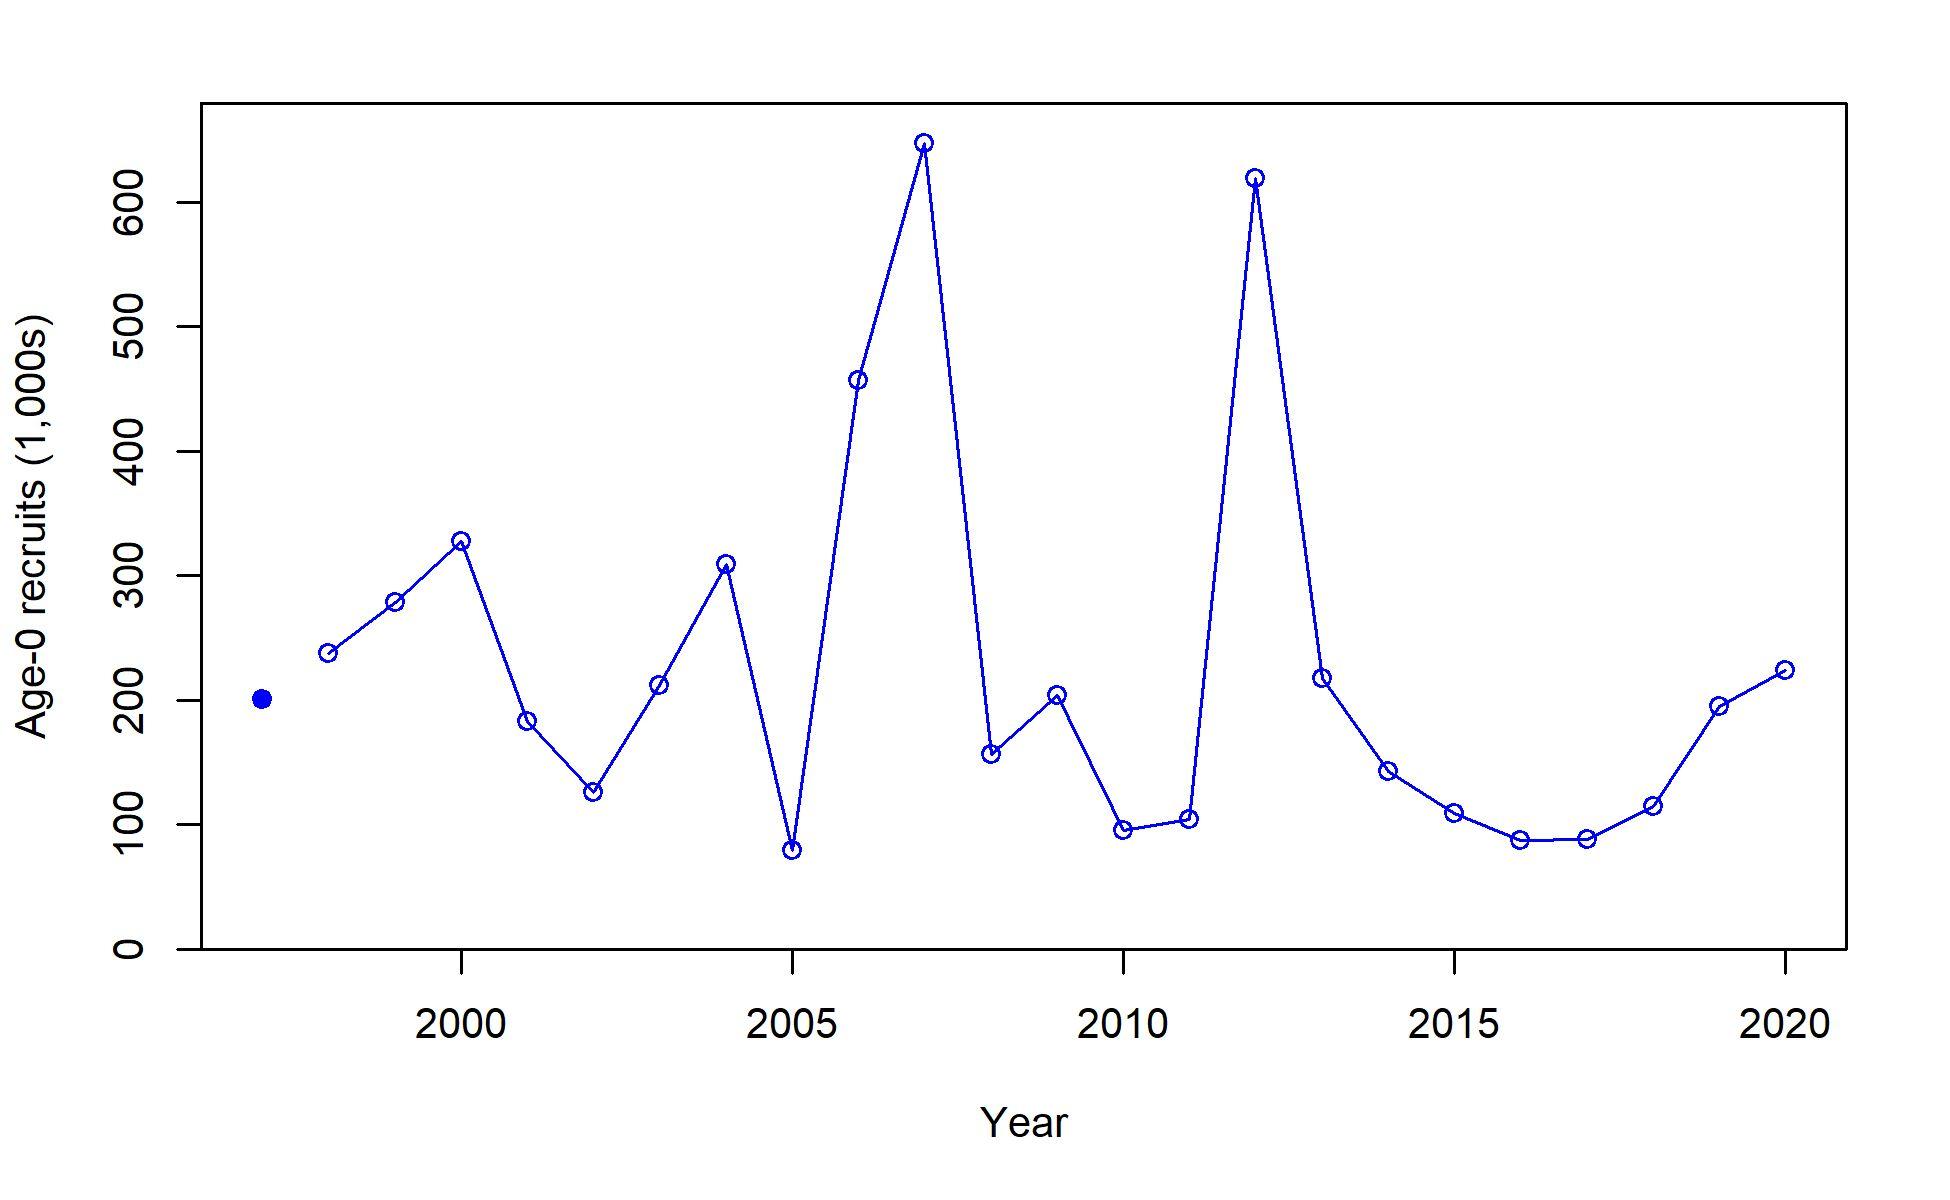
Derived Quantities
(F, Recr., and SSB)
U.S. Department of Commerce | National Oceanic and Atmospheric Administration | National Marine Fisheries Service Page 25
Jitter
U.S. Department of Commerce | National Oceanic and Atmospheric Administration | National Marine Fisheries Service Page 26
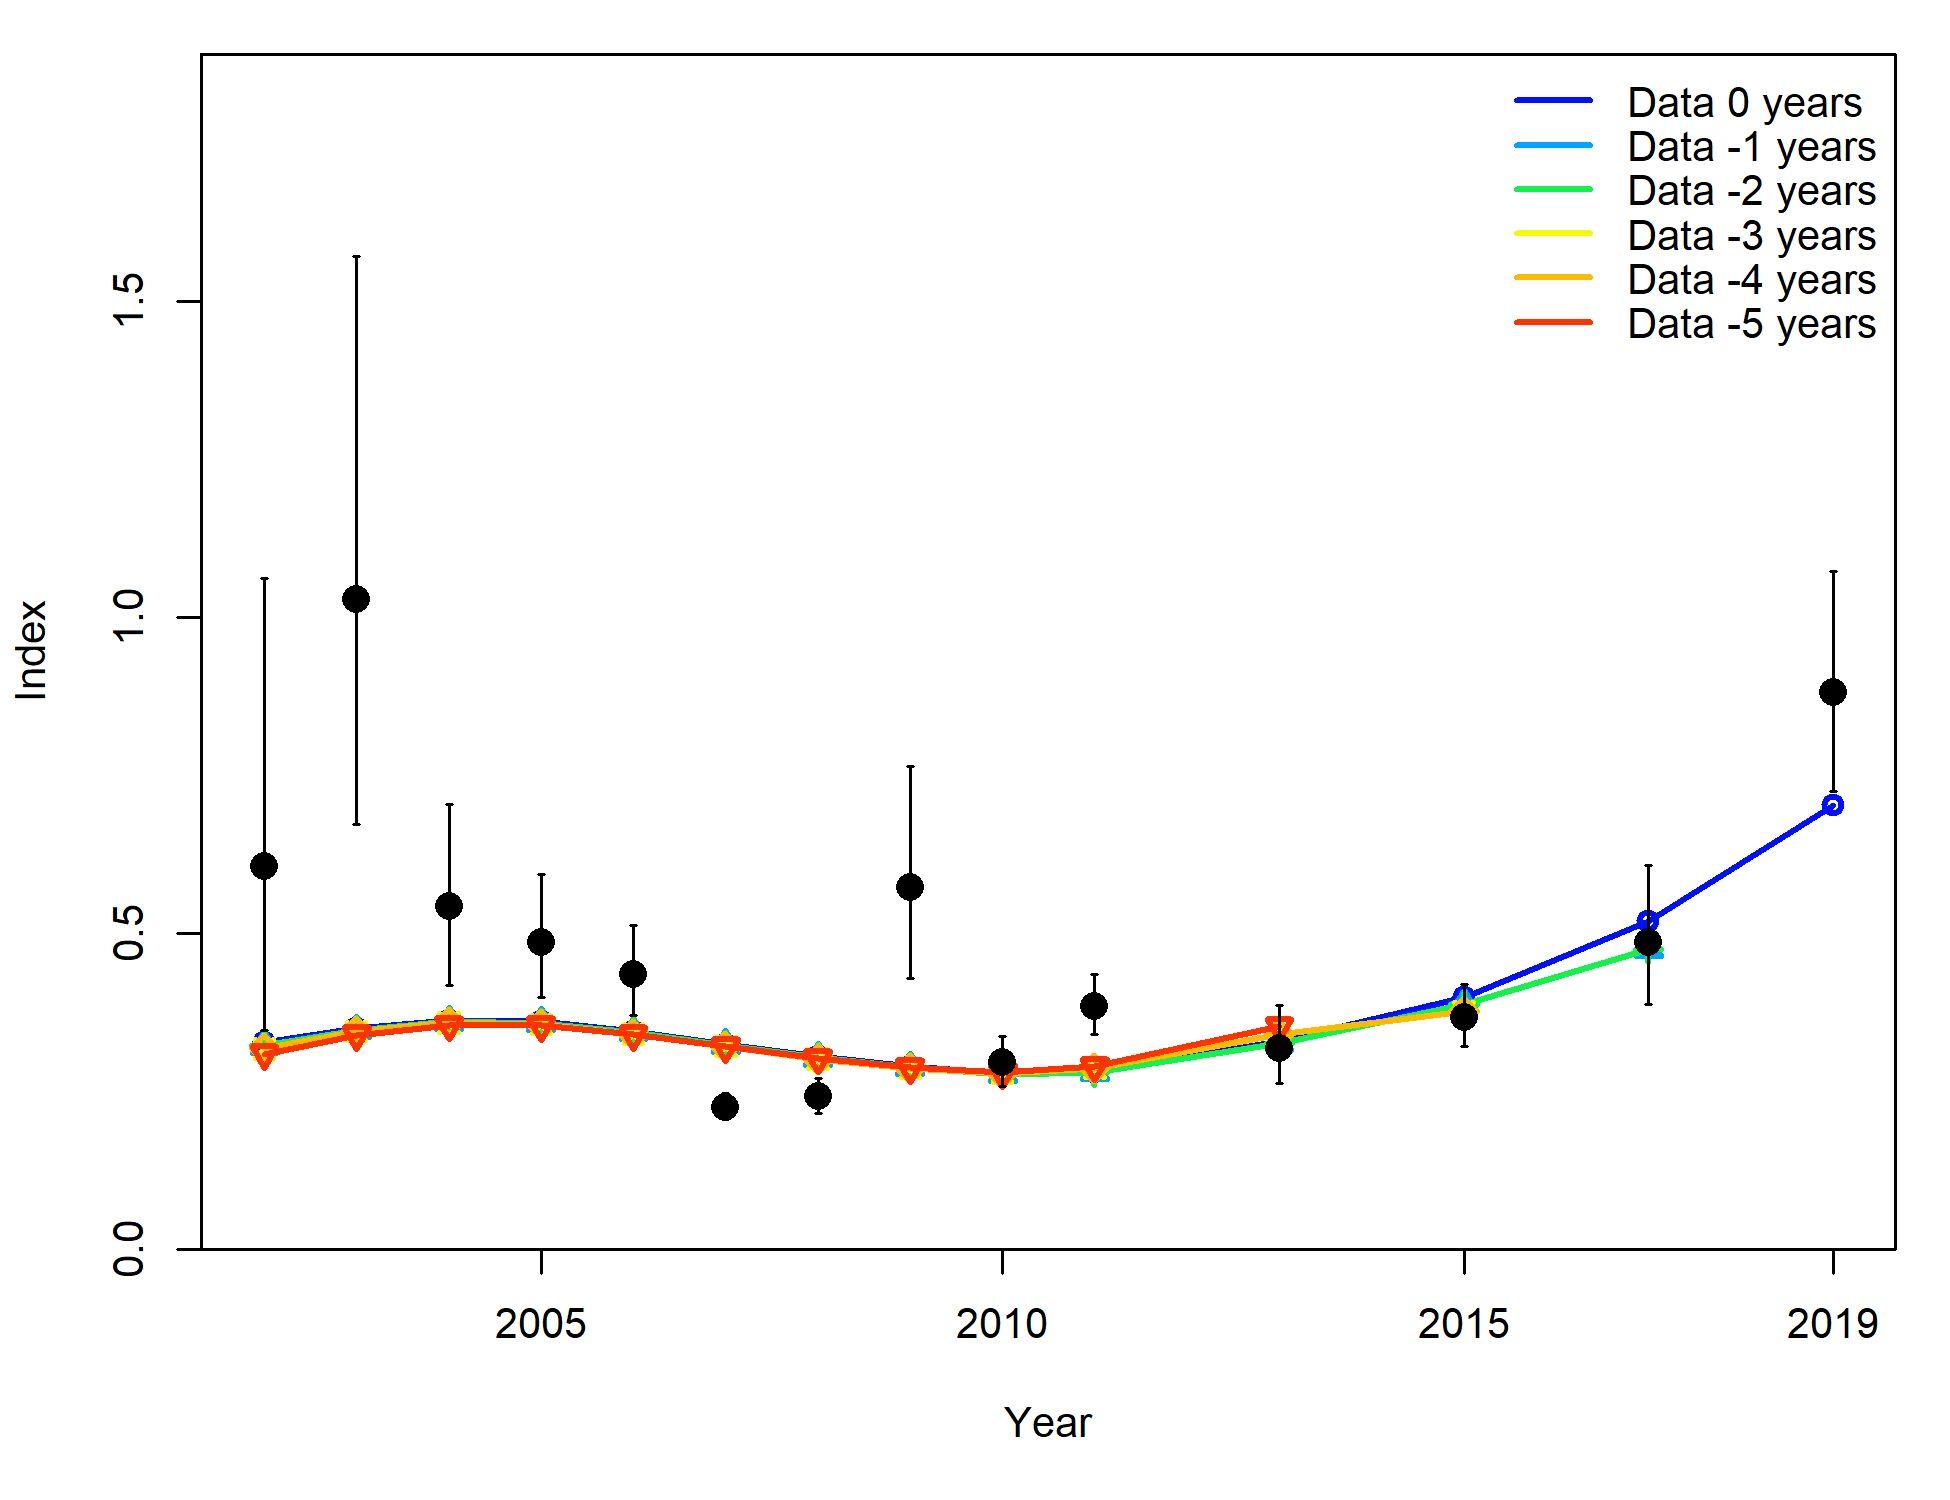
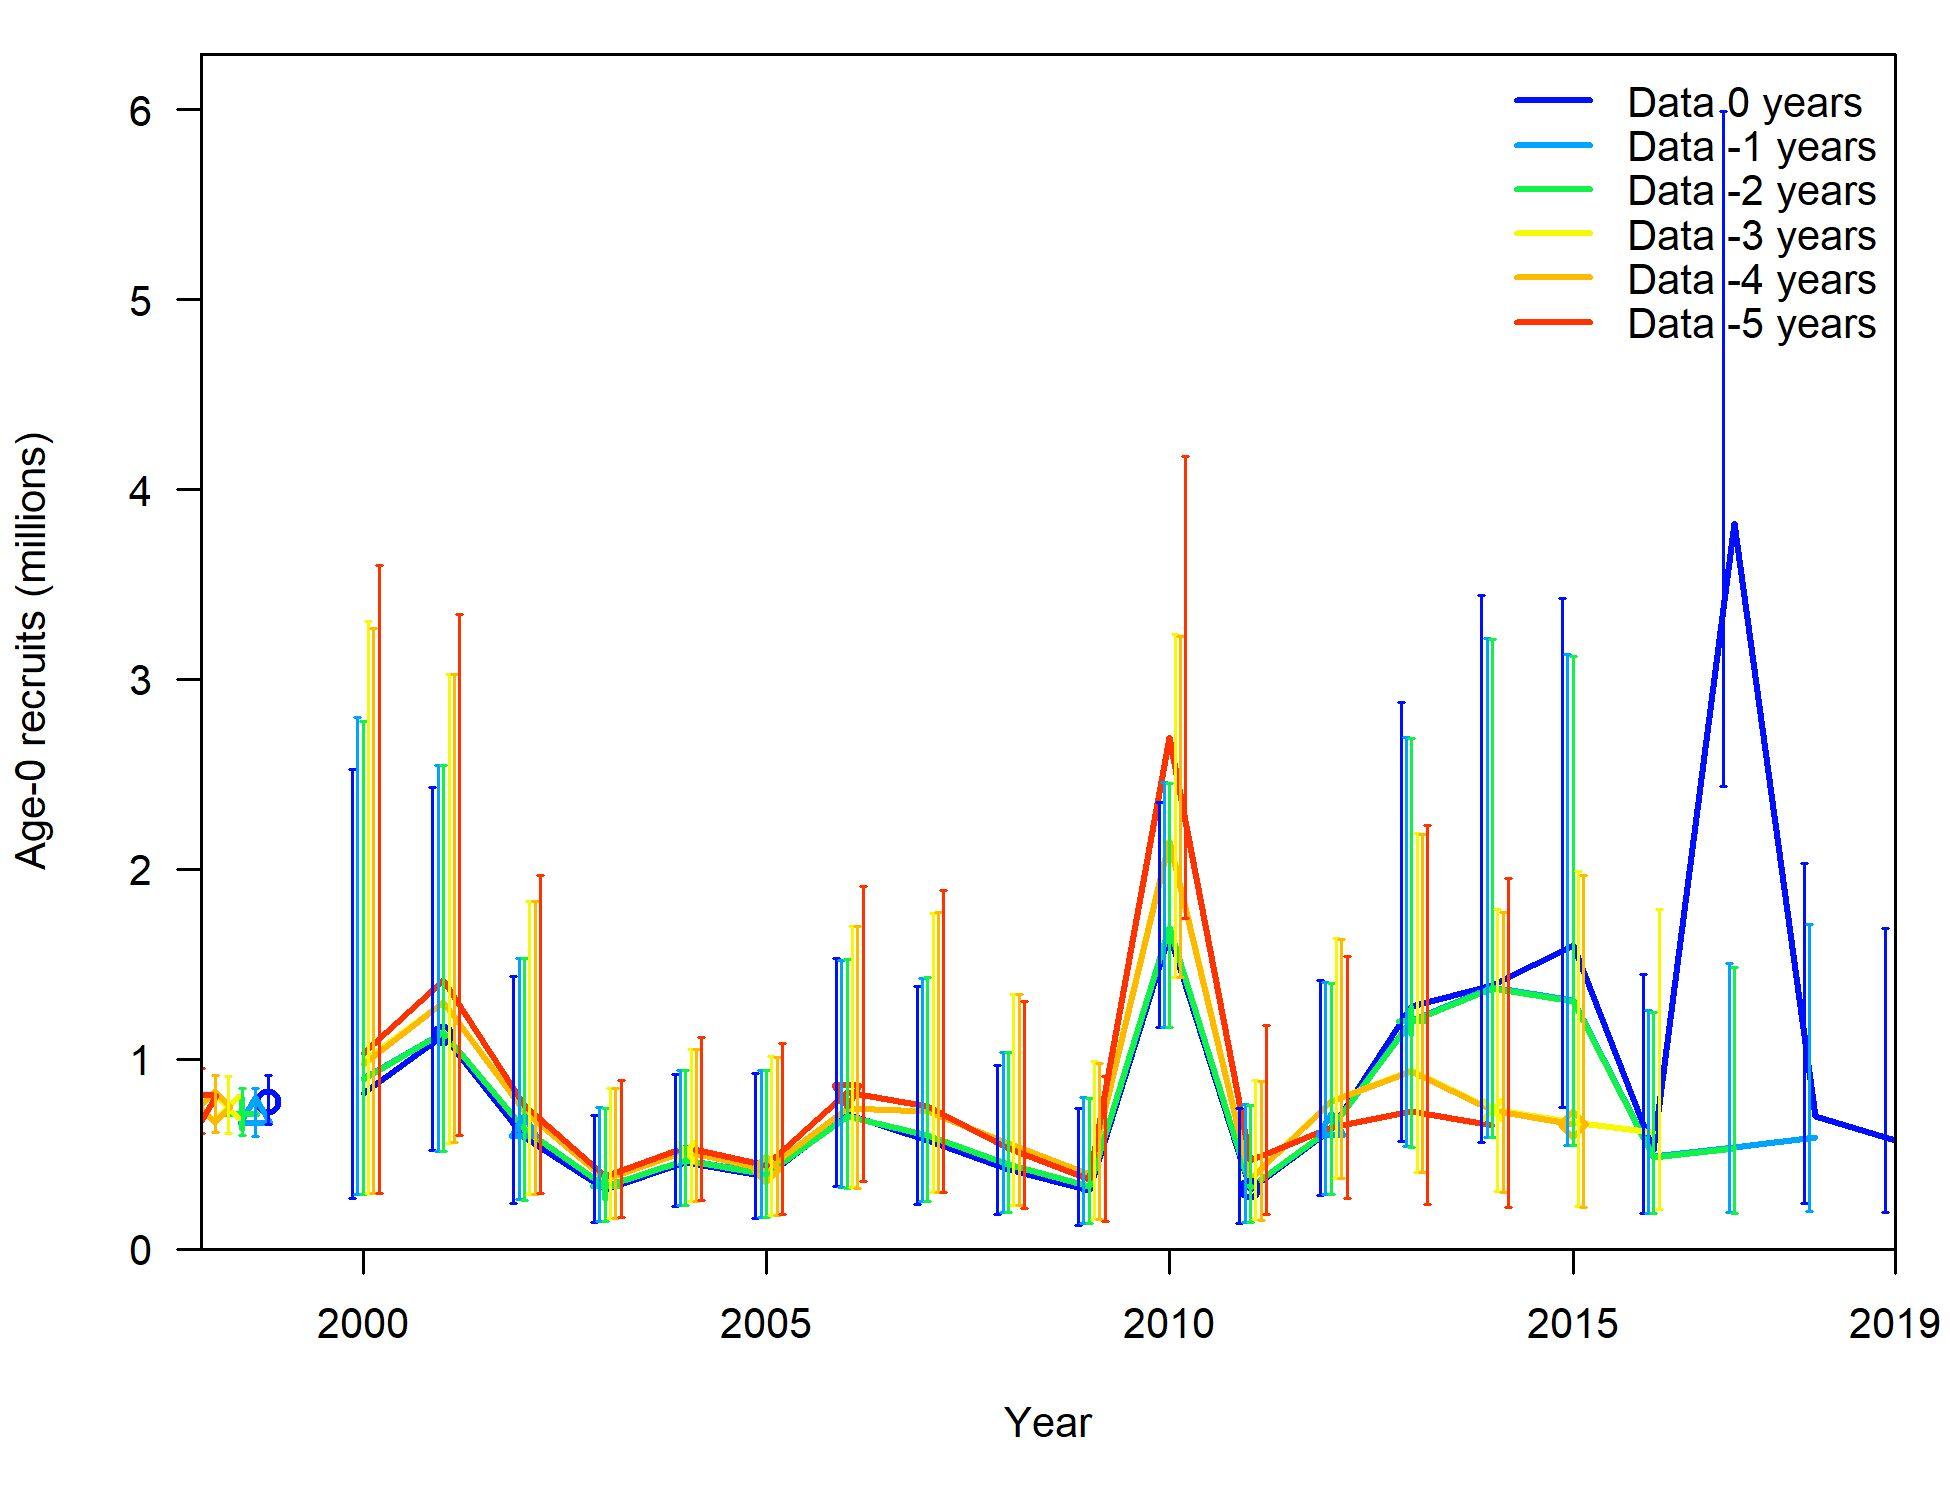
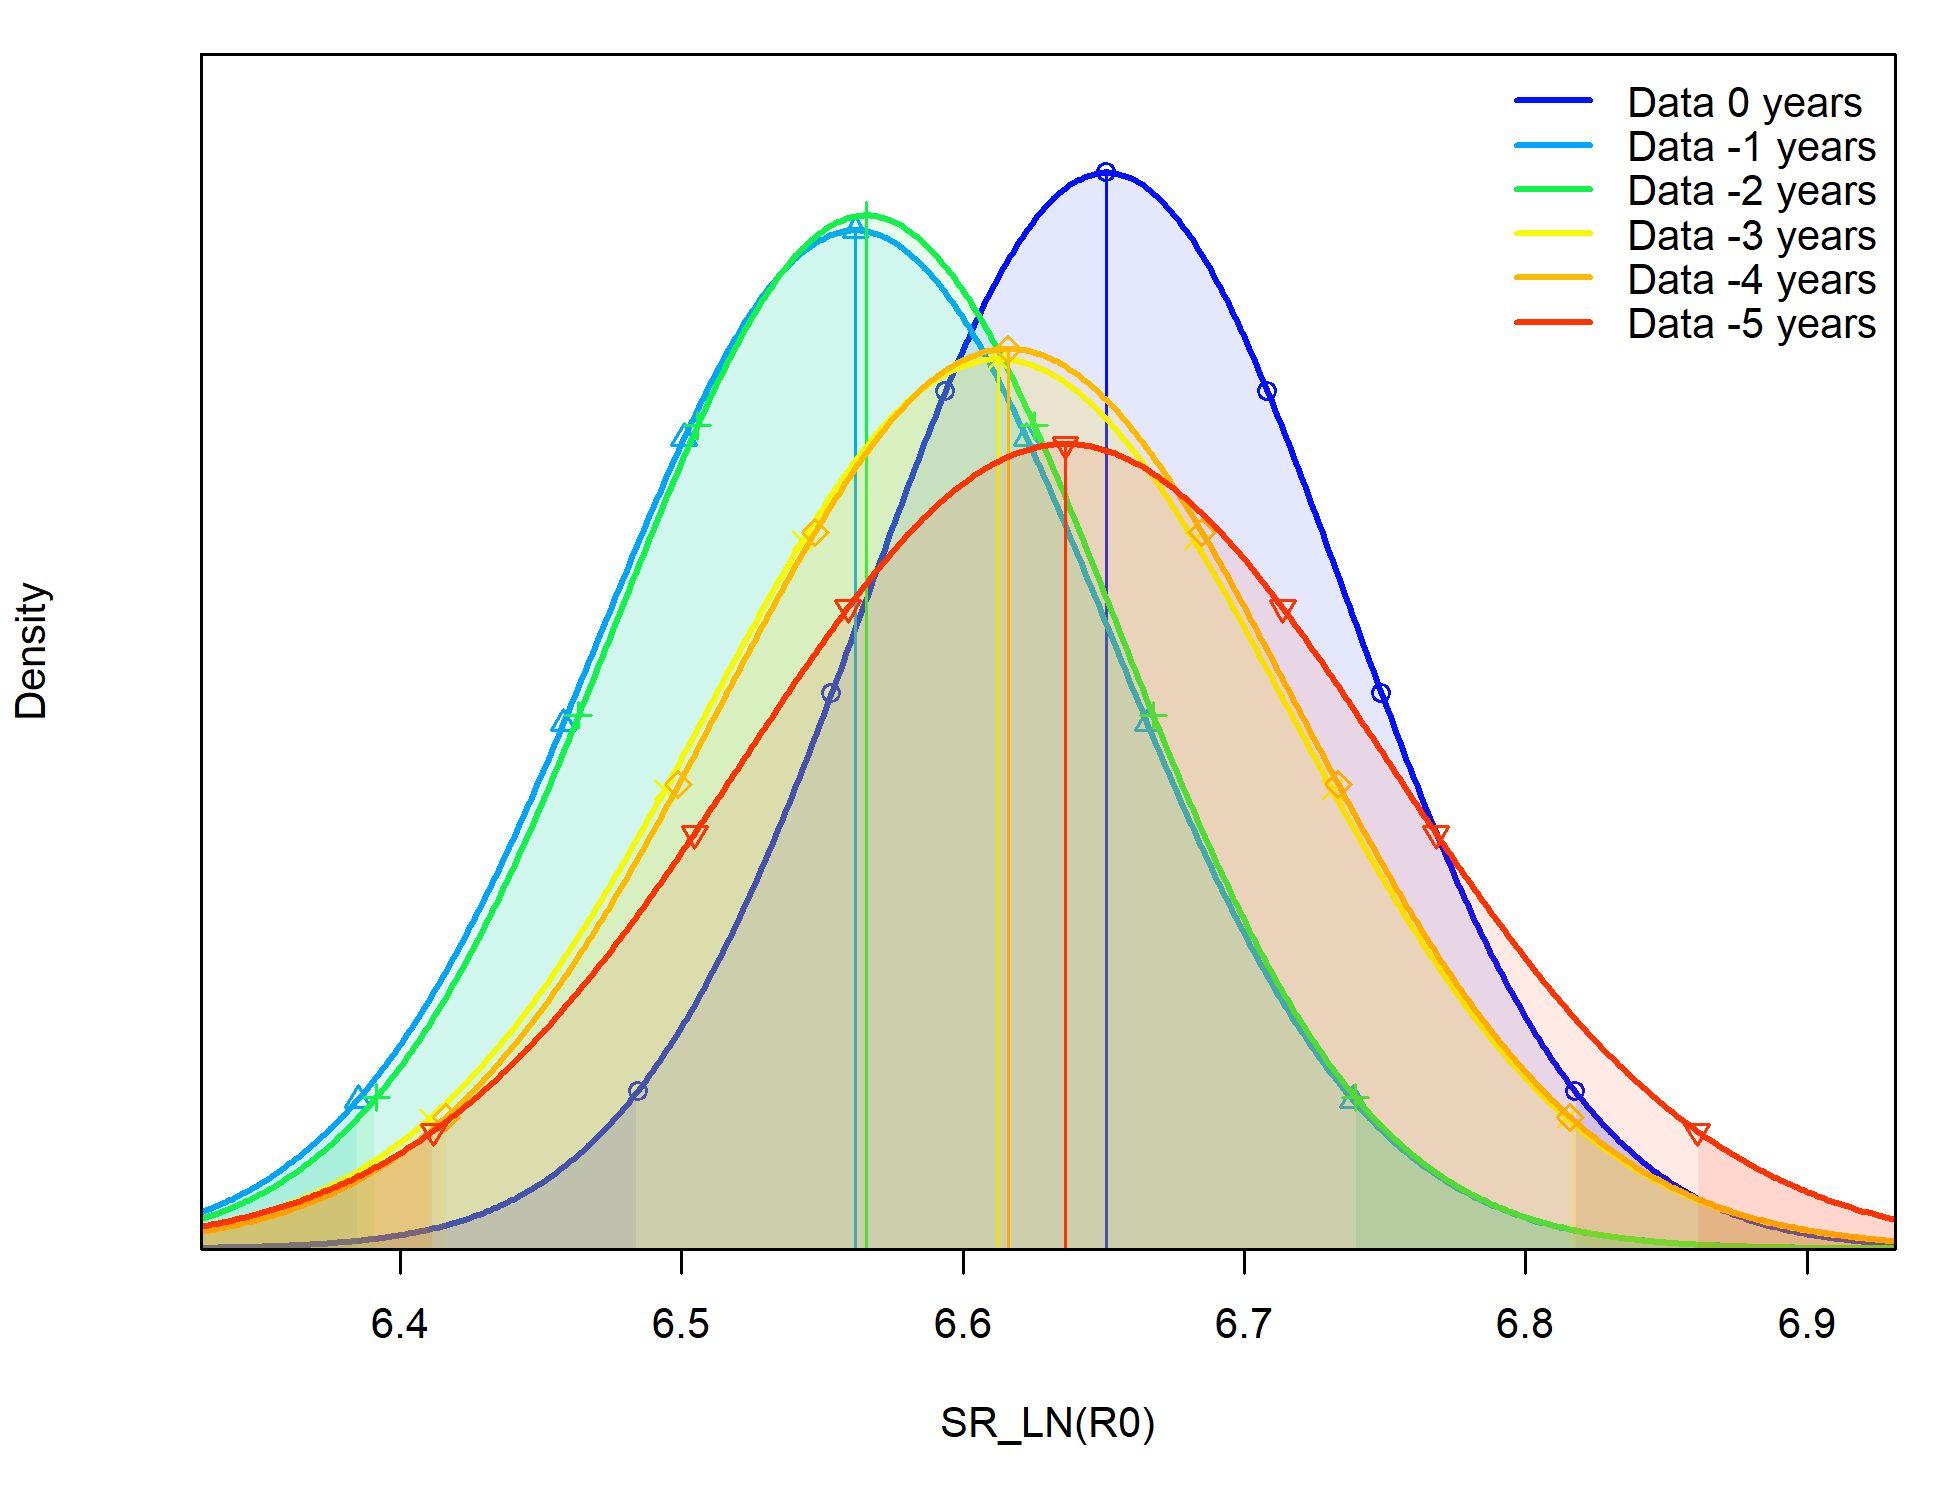
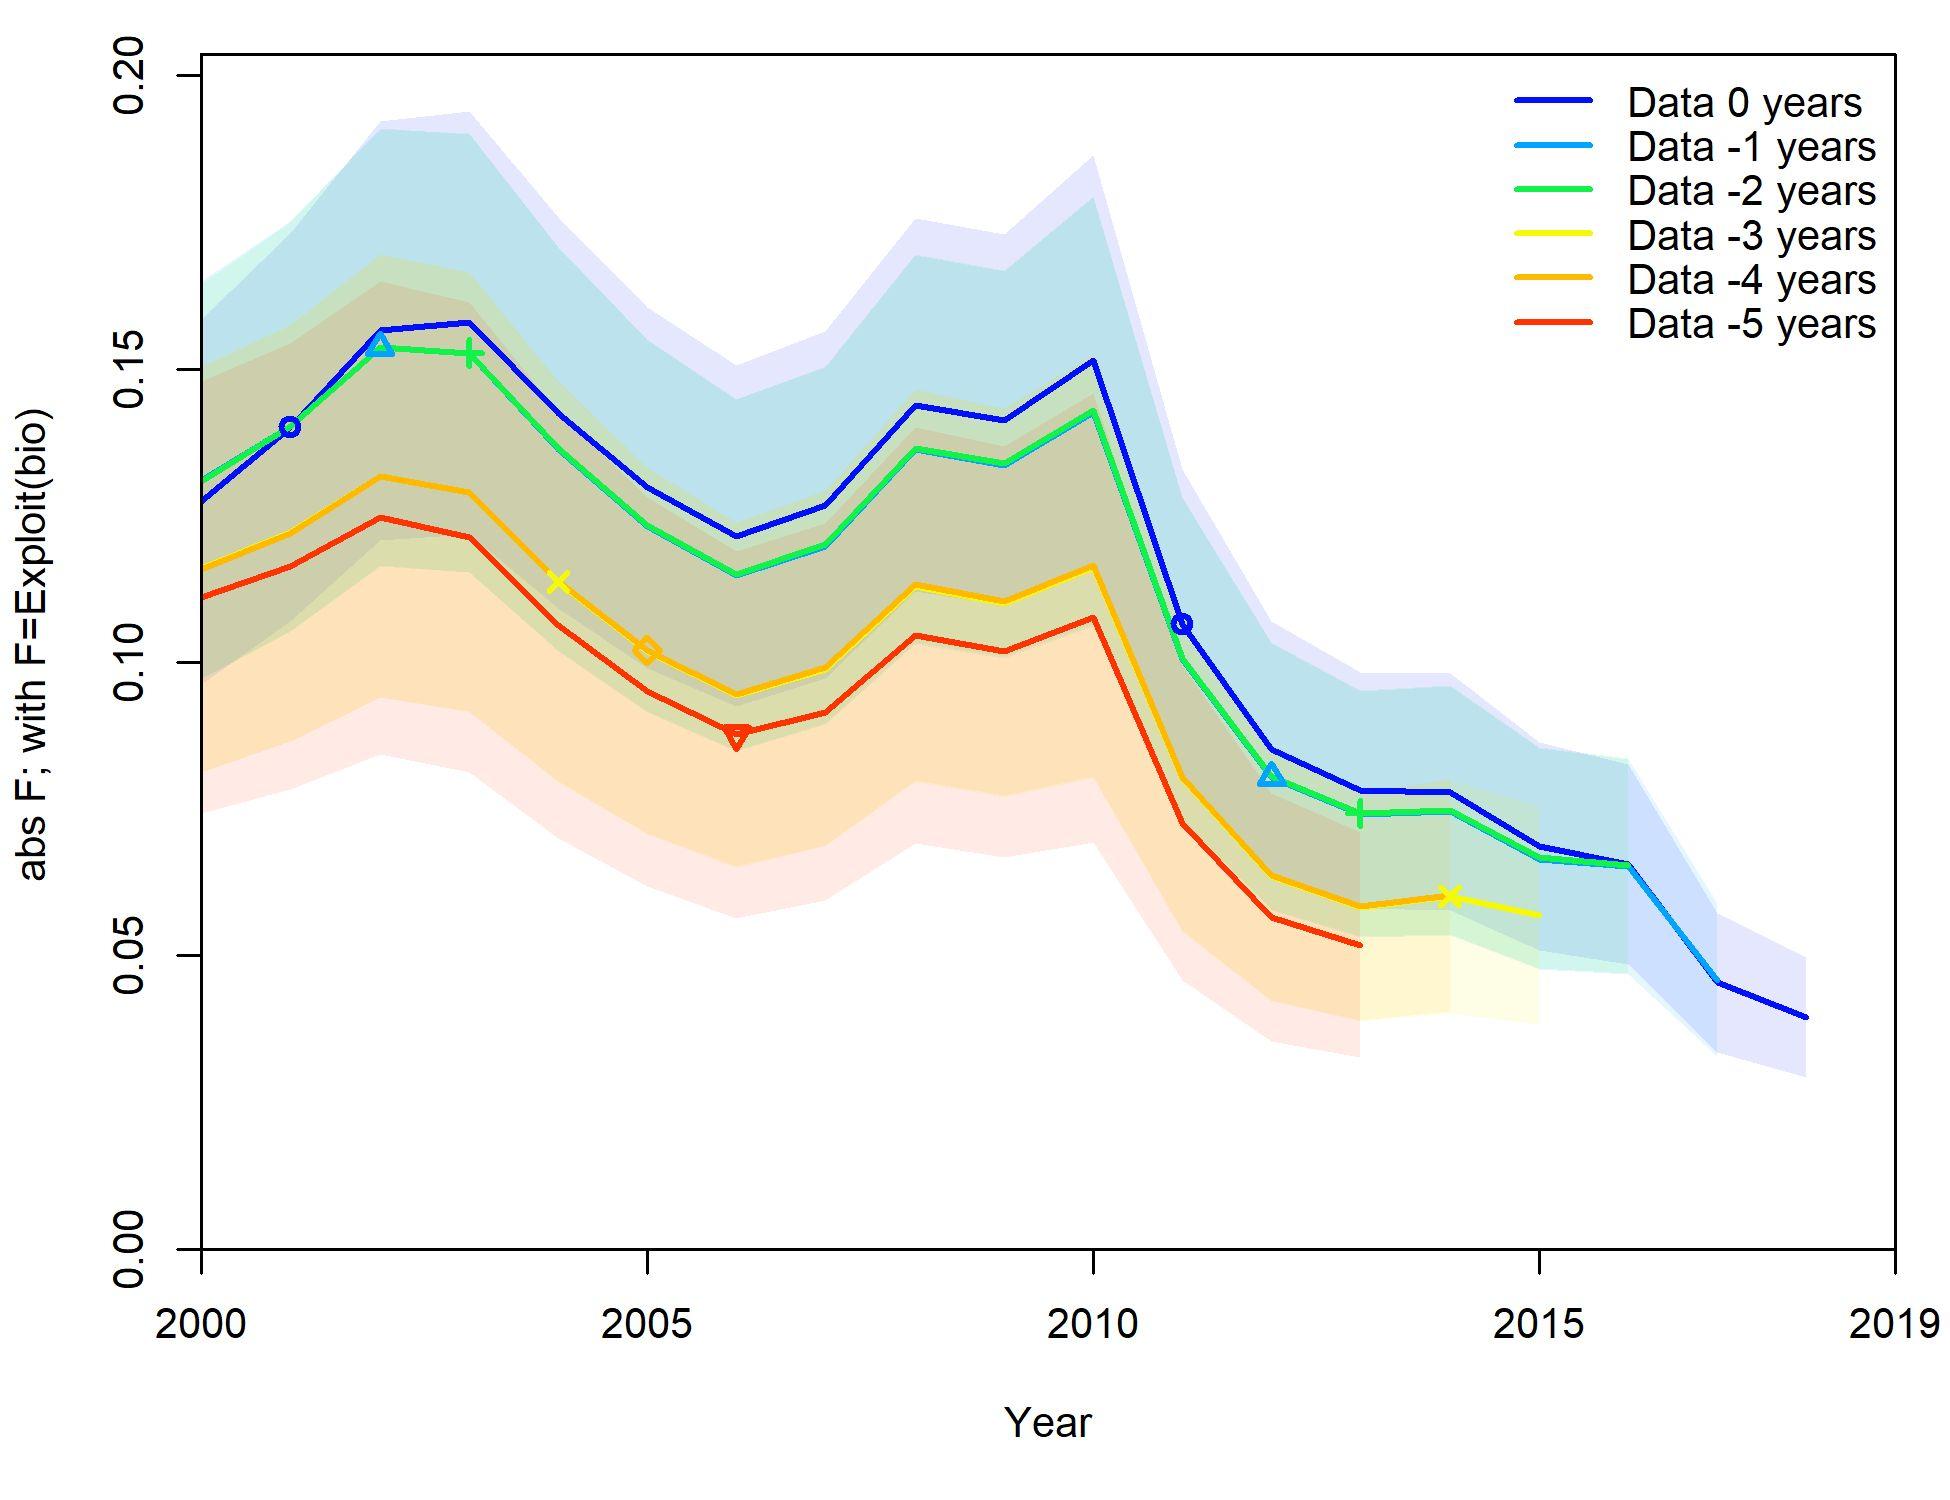
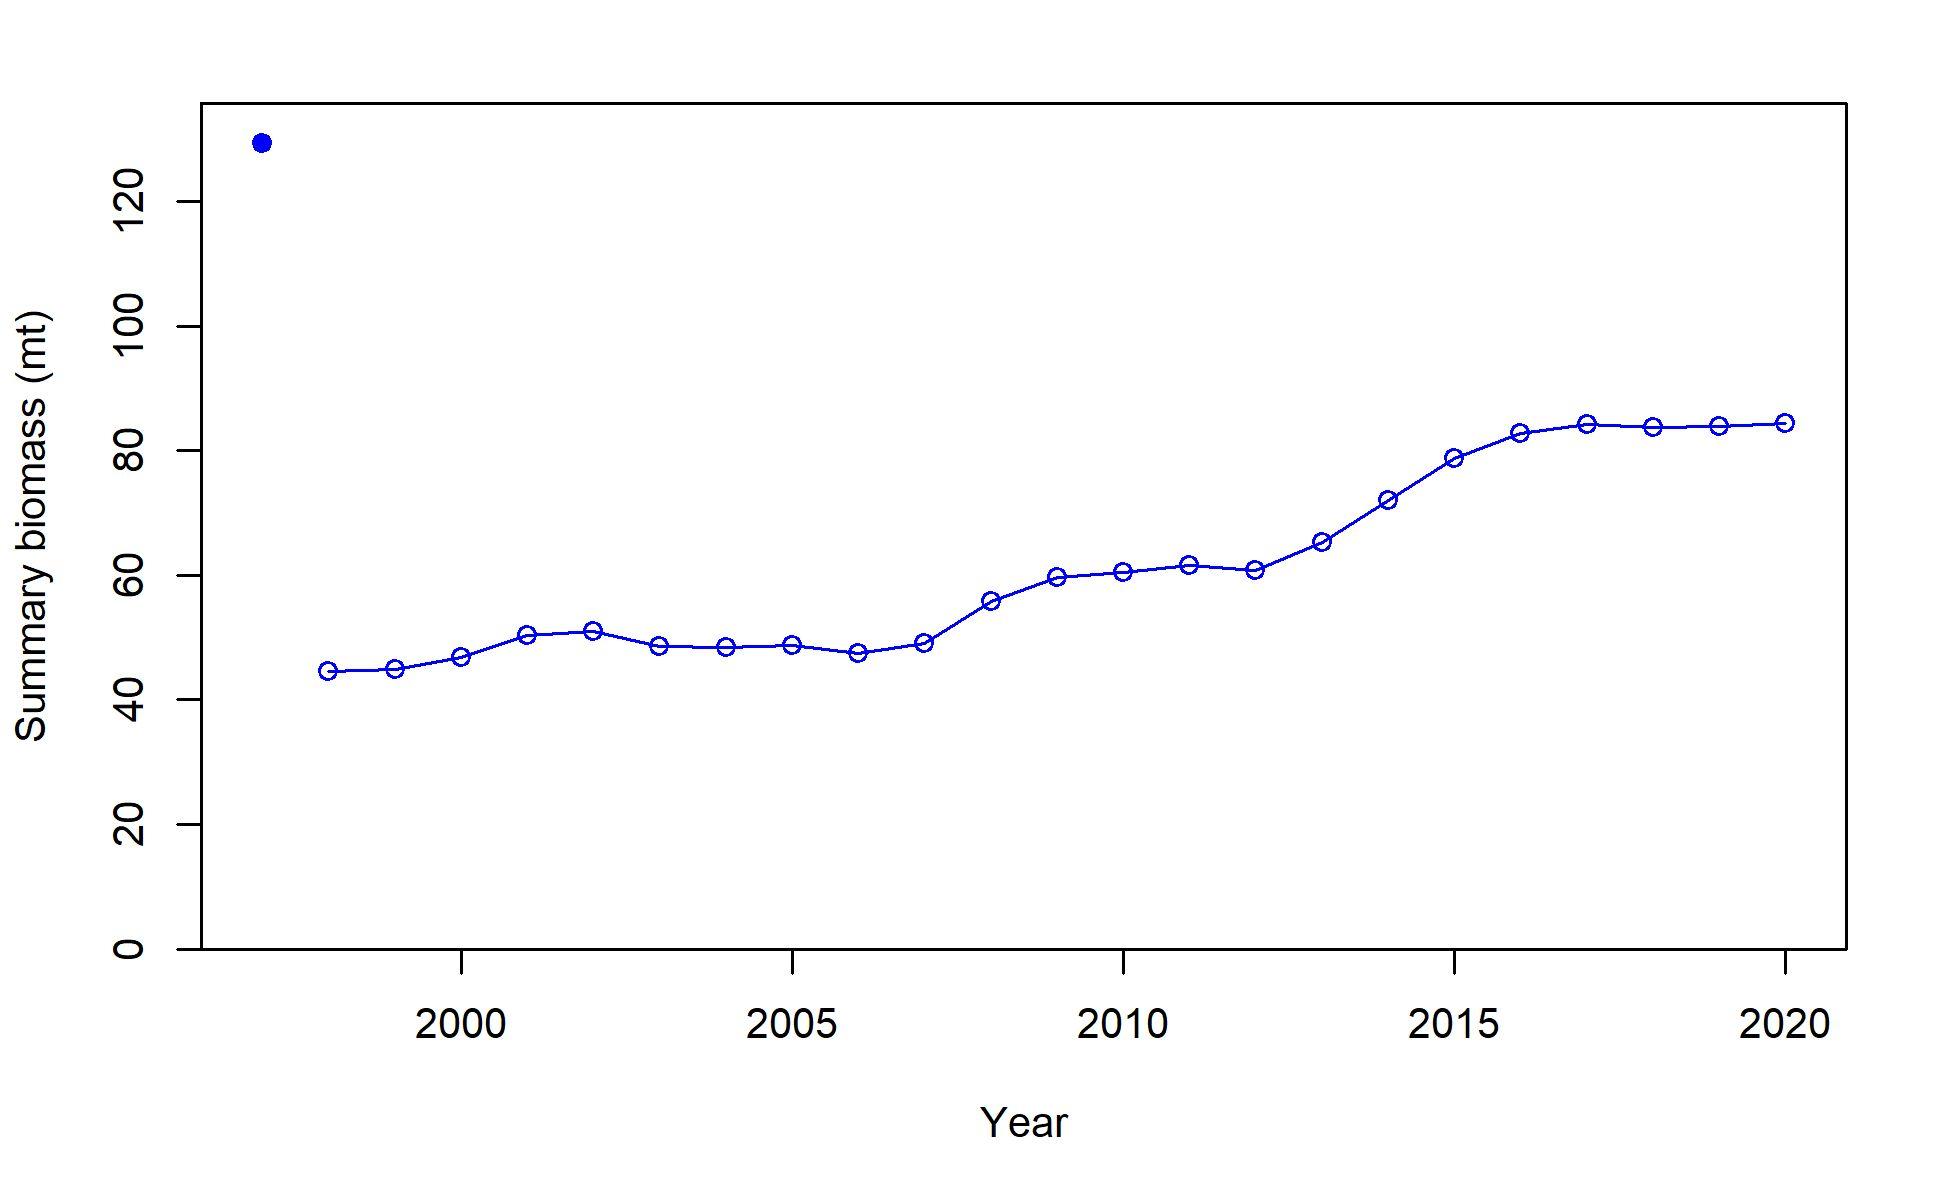
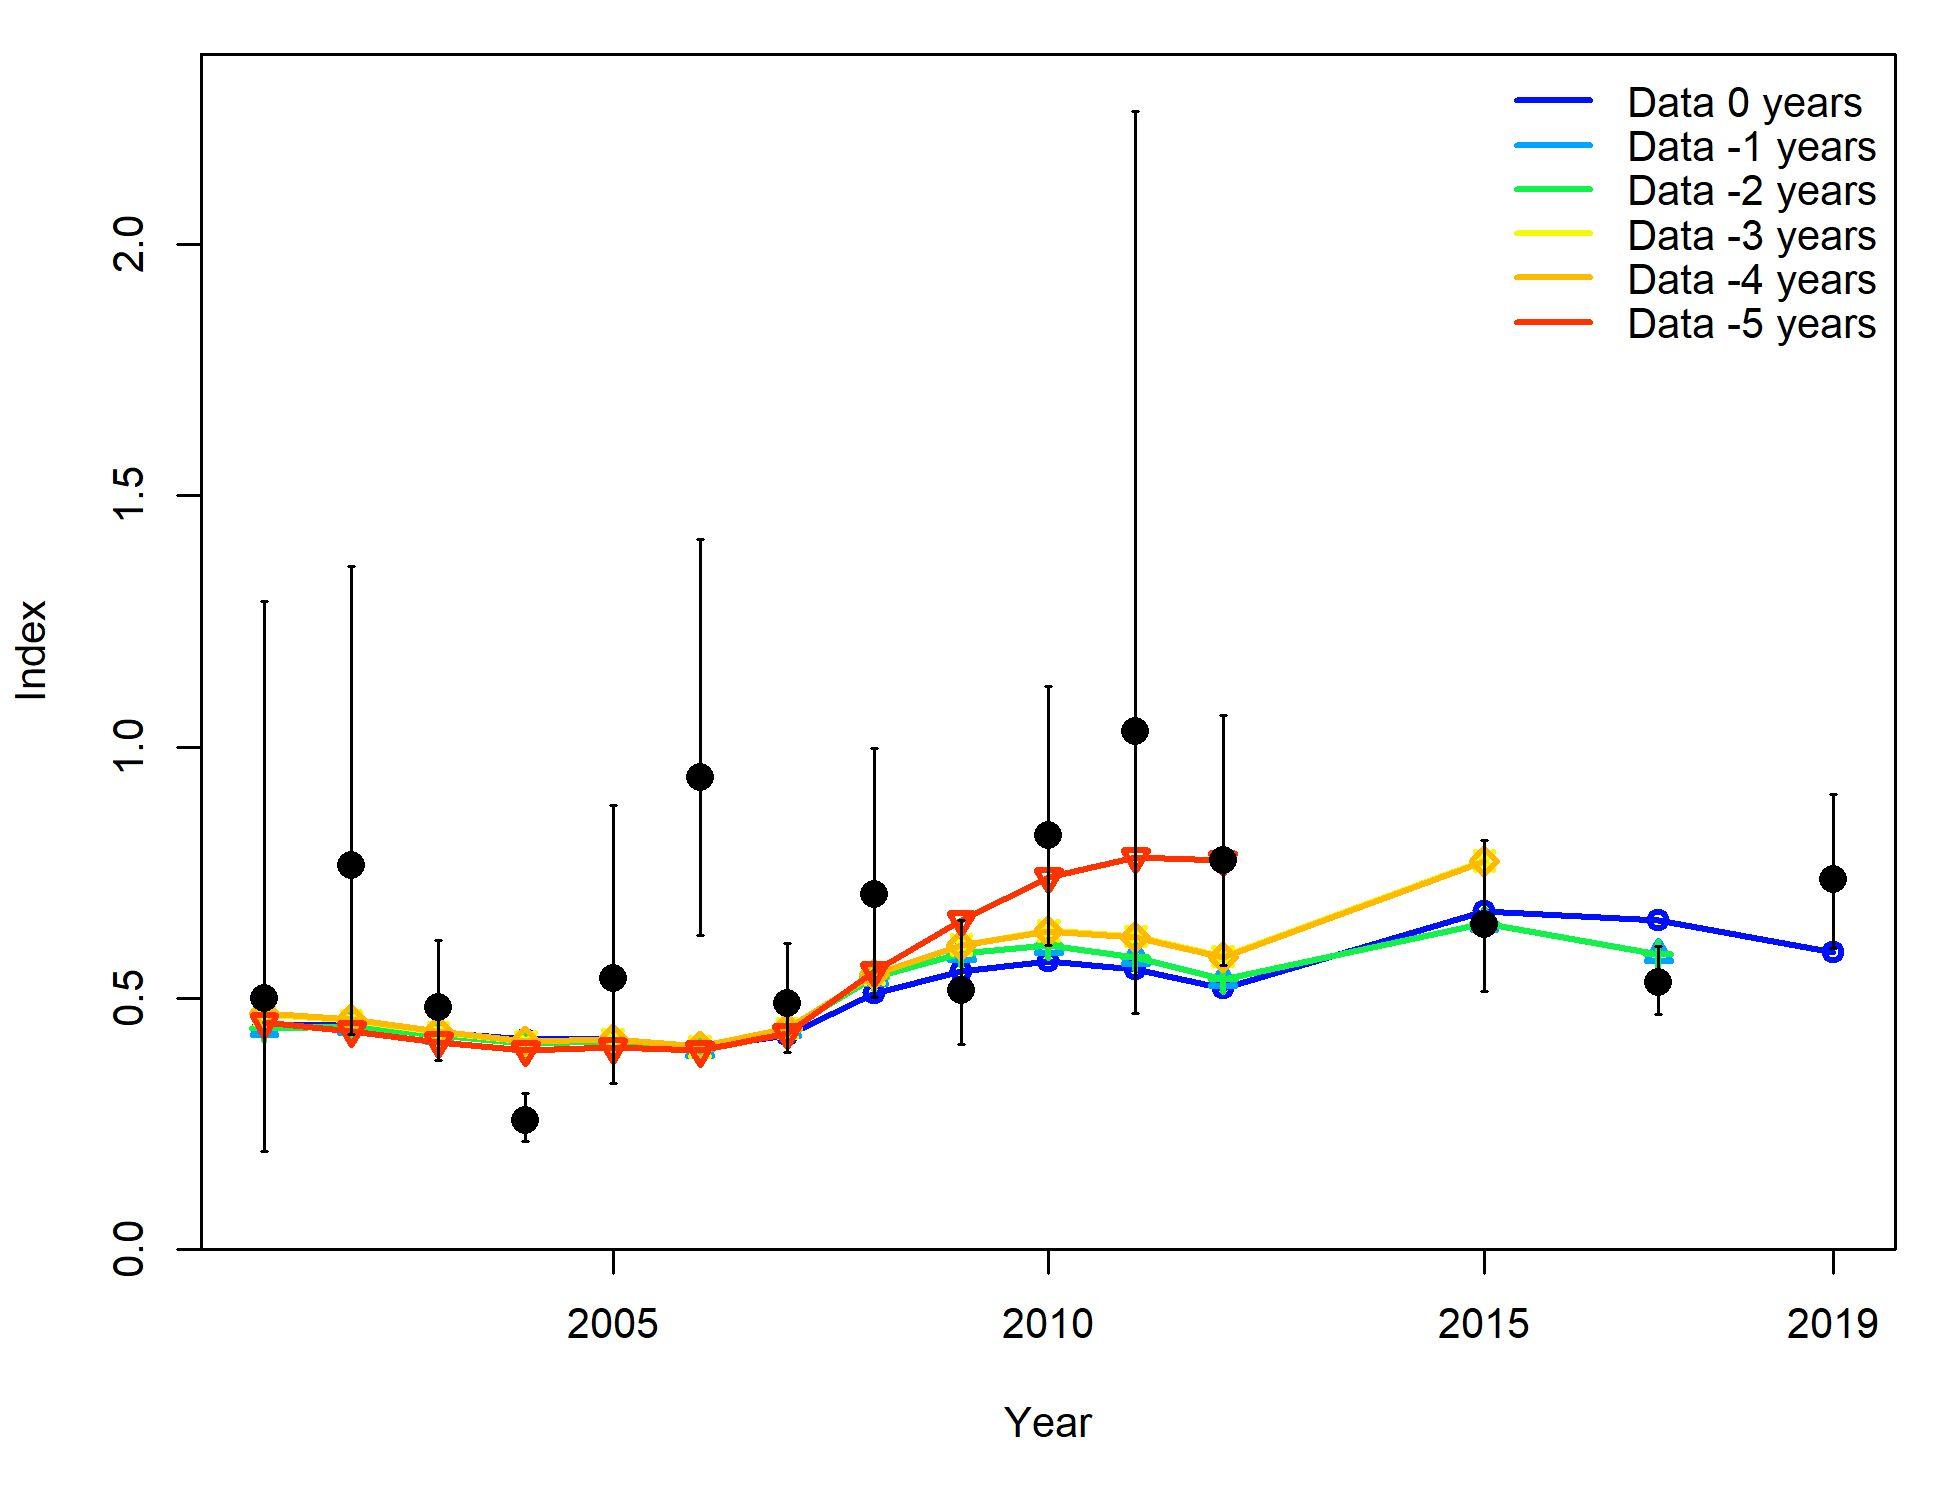
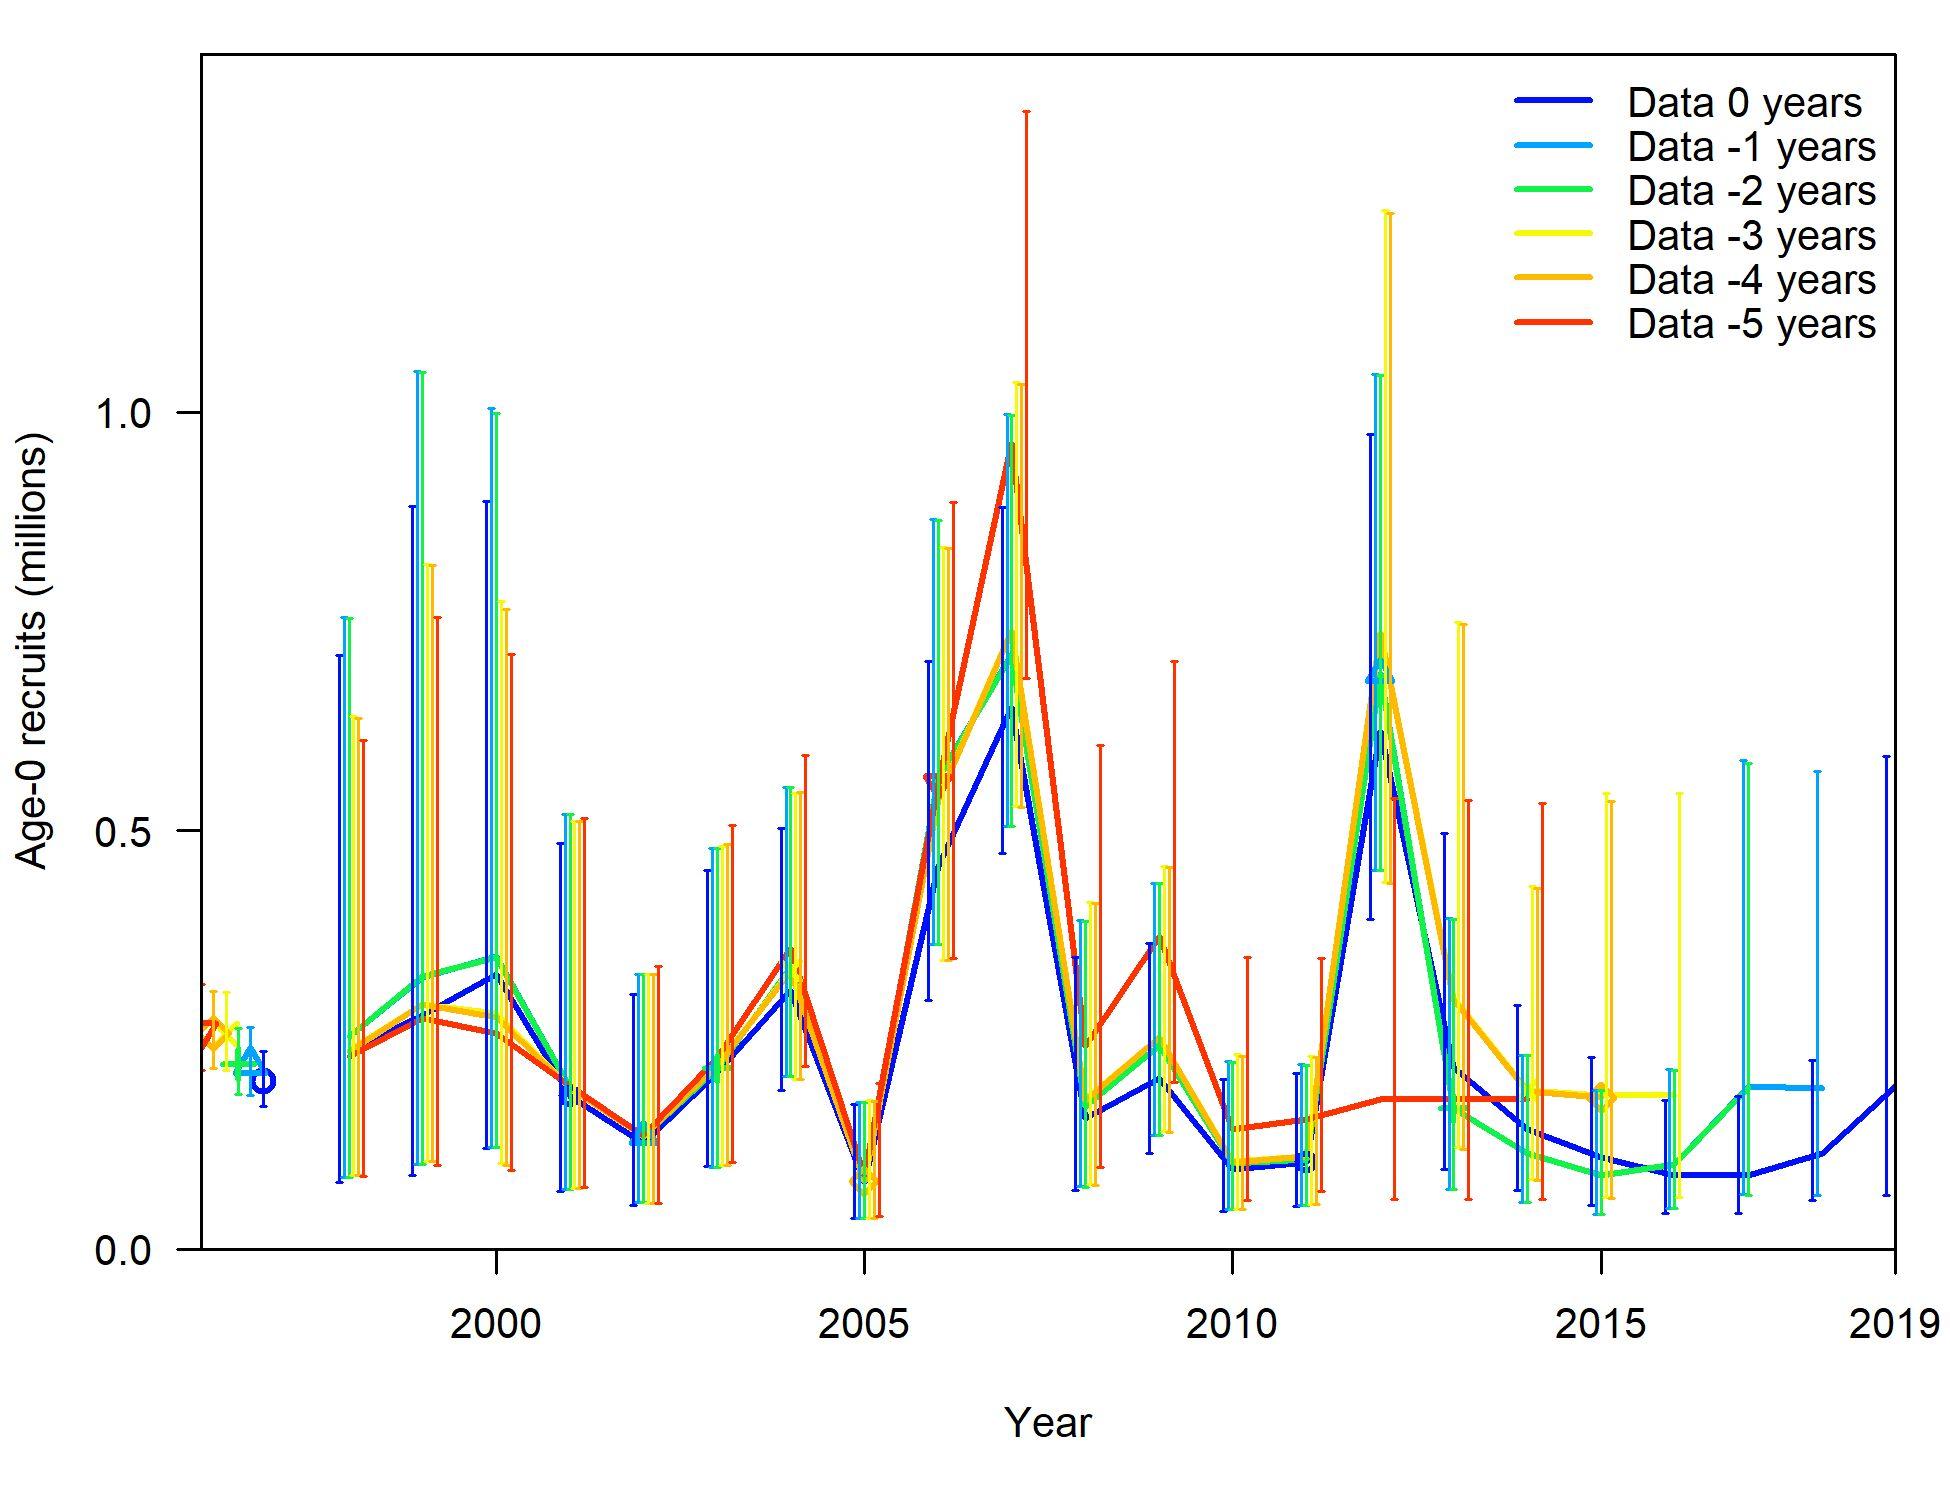
Retrospective
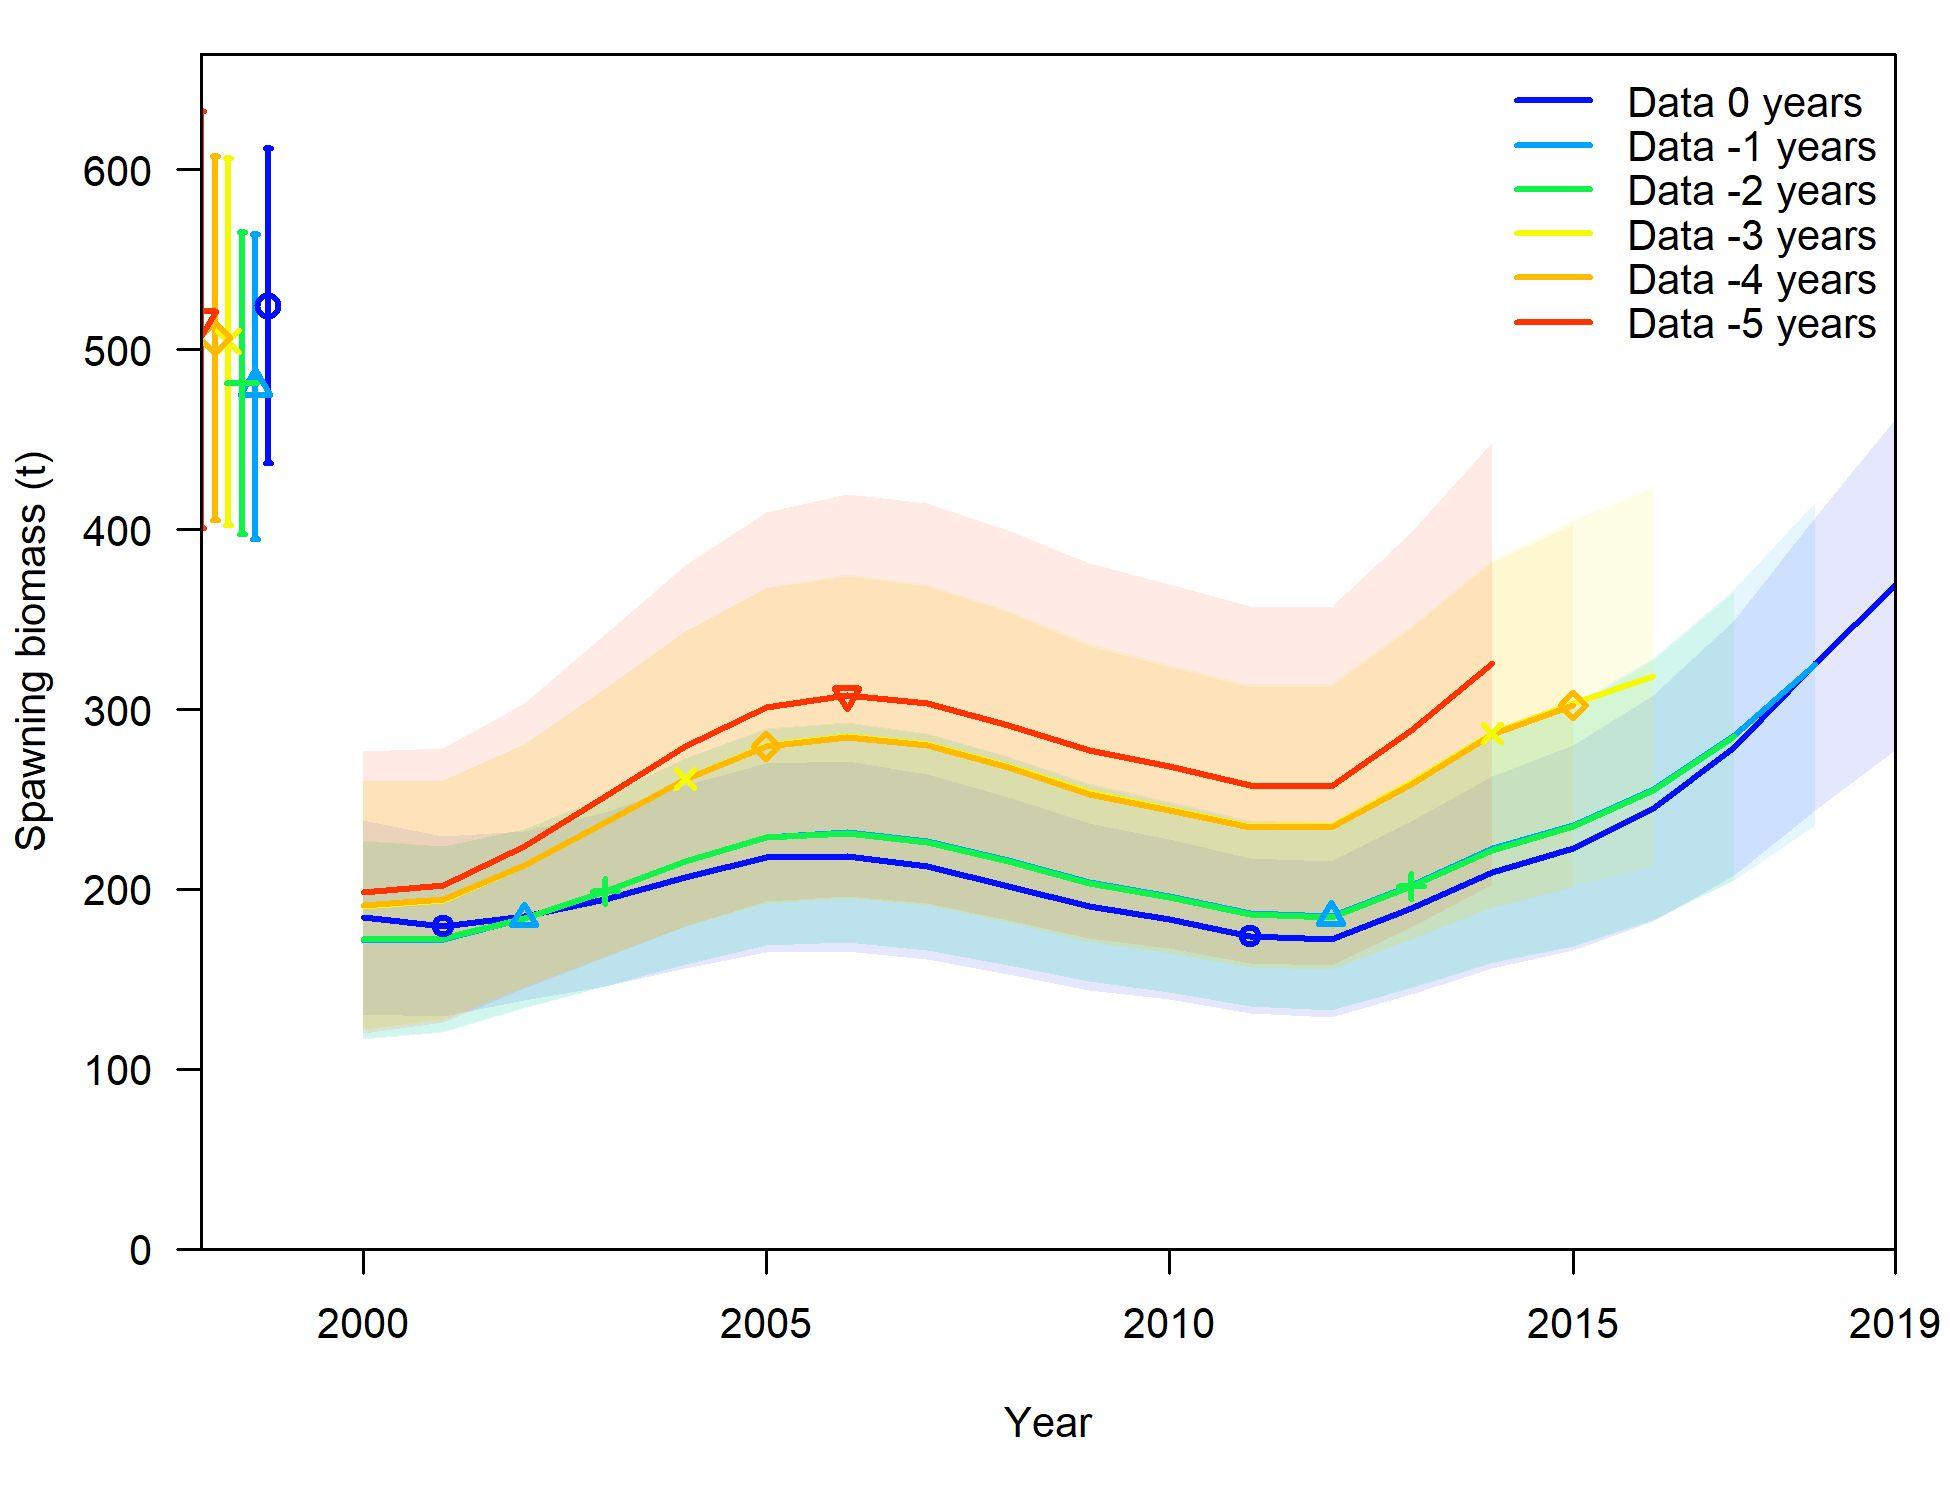
National Oceanic and Atmospheric Administration | Page 27
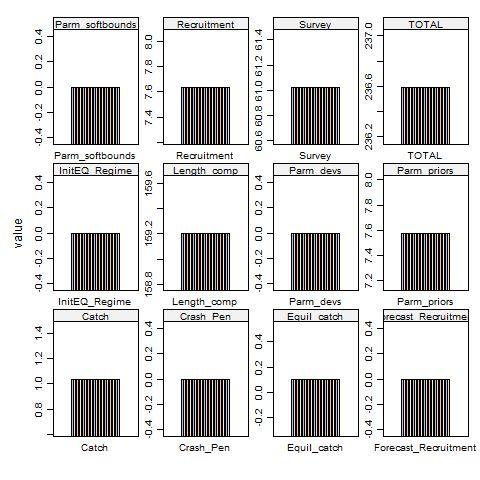
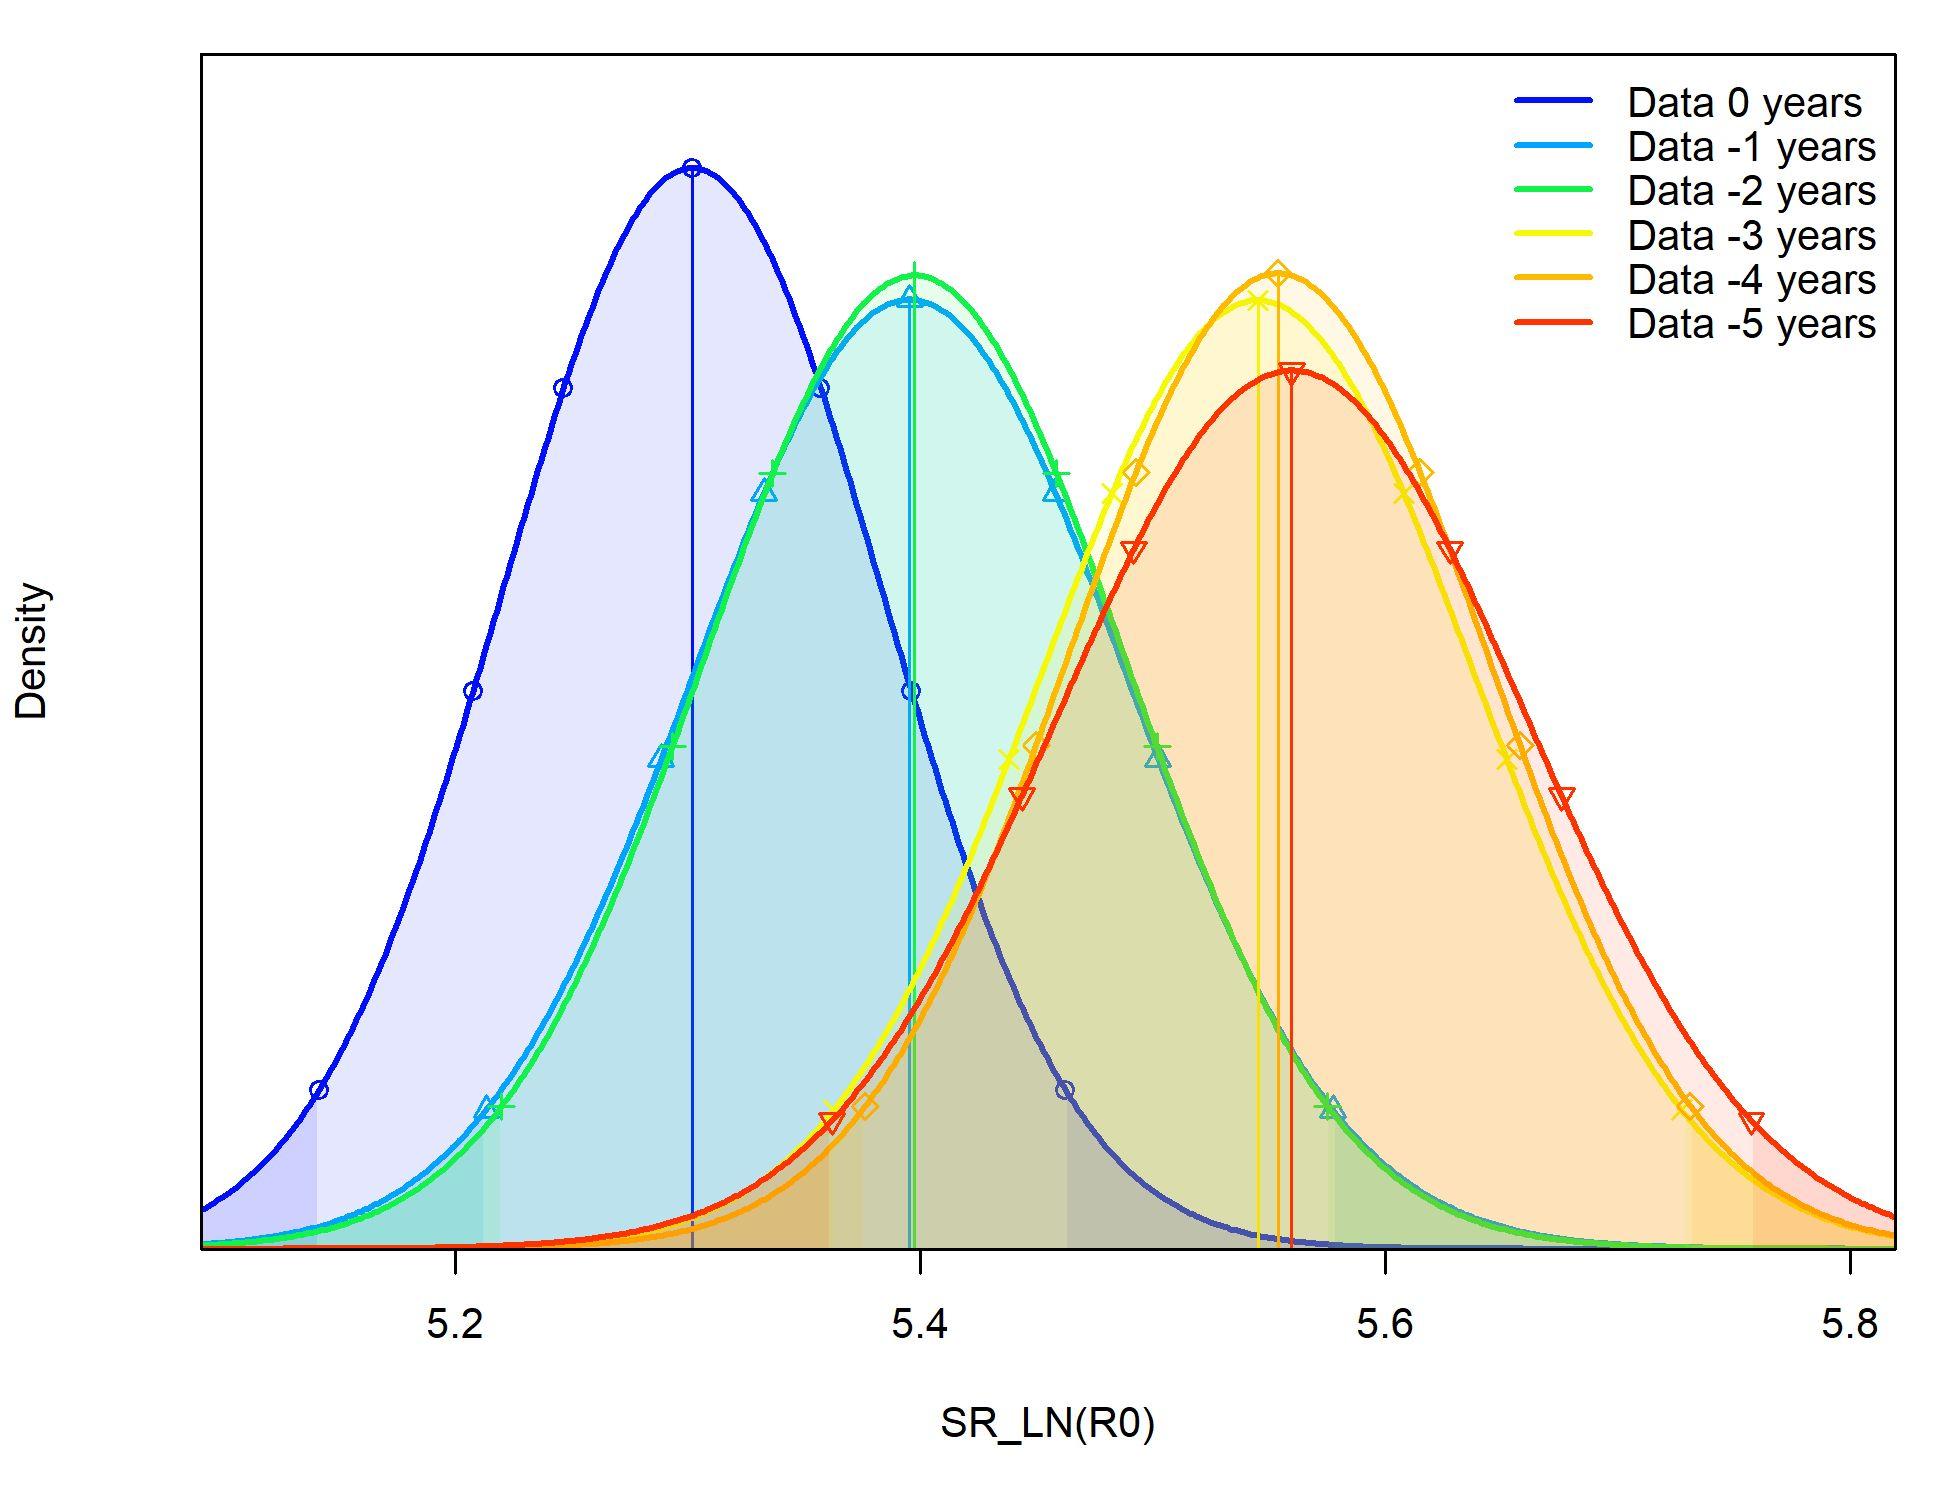
Likelihood profiles
Steepness and Unfished Recruitment
U.S. Department of Commerce | National Oceanic and Atmospheric Administration | National Marine Fisheries Service Page 28
Likelihood profiles
Initial F and Final Survey Selectivity
U.S. Department of Commerce | National Oceanic and Atmospheric Administration | National Marine Fisheries Service Page 29
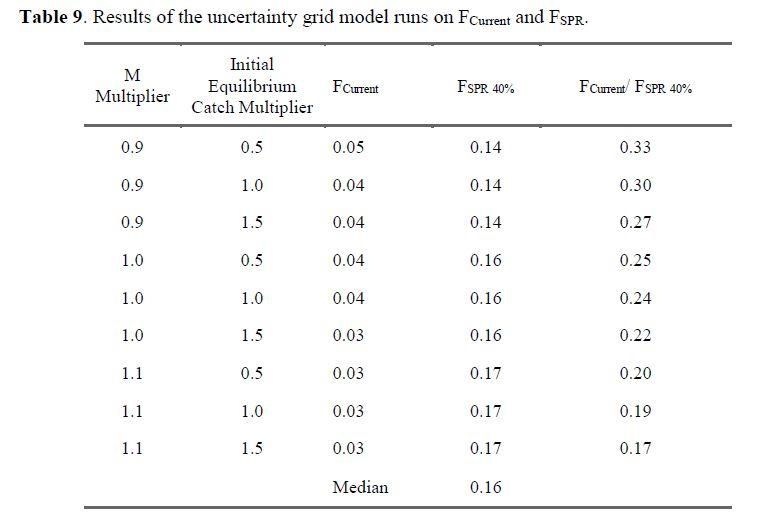
F Current & F SPR 40%
● The median FSPR 40% across the models in the uncertainty grid was 0.16.
● All runs within the uncertainty grid suggest that overfishing is not occurring.
U.S. Department of Commerce | National Oceanic and Atmospheric Administration | National Marine Fisheries Service Page 30
U.S. Department of Commerce | National Oceanic and Atmospheric Administration | National Marine Fisheries Service Page 31
Current Catch Limits in Pounds SYL 205,621 ABC 102,810 ACL 97,670 Recent years of catch in Pounds 2019 35,971 2020 38,152 2021 40,723 2022 28,685
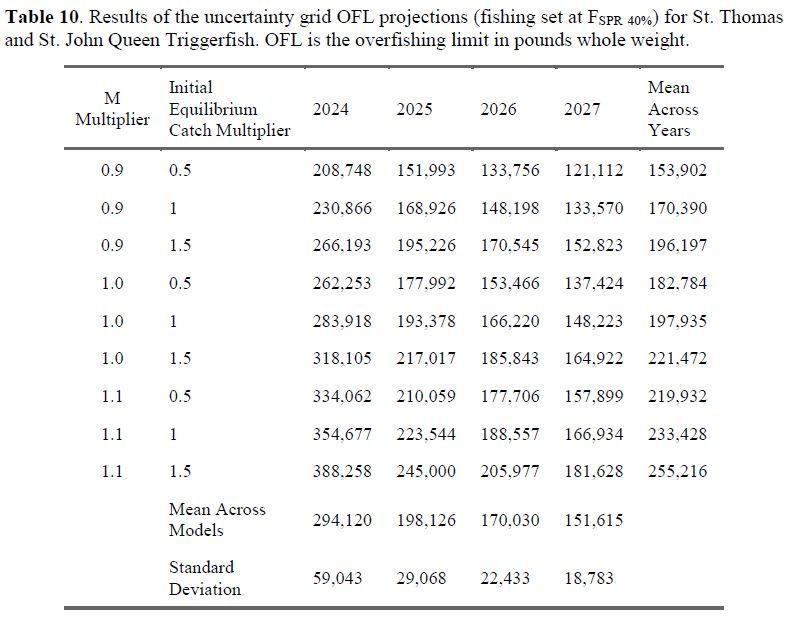
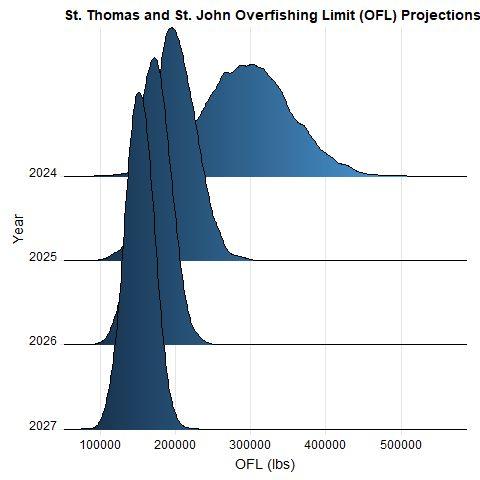
OFL Projections & Uncertainty Grid
Summary
● Integrated assessment using length and index of abundance and modeling best practices
● SS framework allows explicit assumptions and tools for exploring key uncertainties
● Conflicting signals across relatively few sources of data and assumptions required for selectivity and stock unit recruitment connectivity (steepness)
● Results suggest that overfishing is not occurring.
● Reference model diagnostics stable but unable to confidently estimate MSY and stock status.
● Short-term harvest levels that prevent overfishing (i.e. OFL, ACL) estimated by assuming that future recruitment will continue at recent levels.
U.S. Department of Commerce | National Oceanic and Atmospheric Administration | National Marine Fisheries Service Page 32
U.S. Department of Commerce | National Oceanic and Atmospheric Administration Page 33
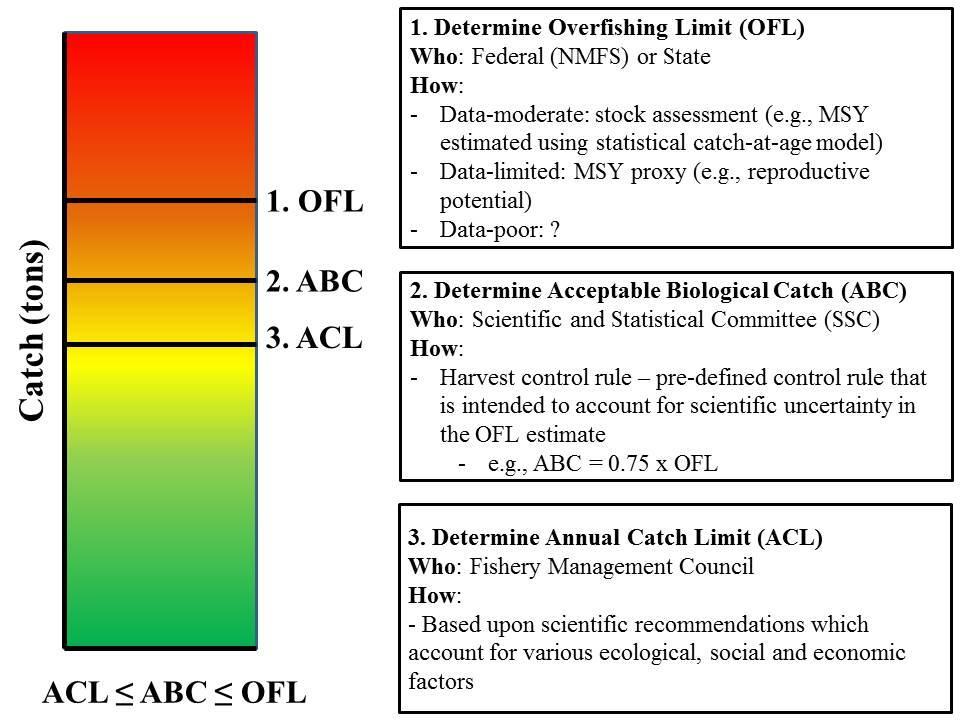
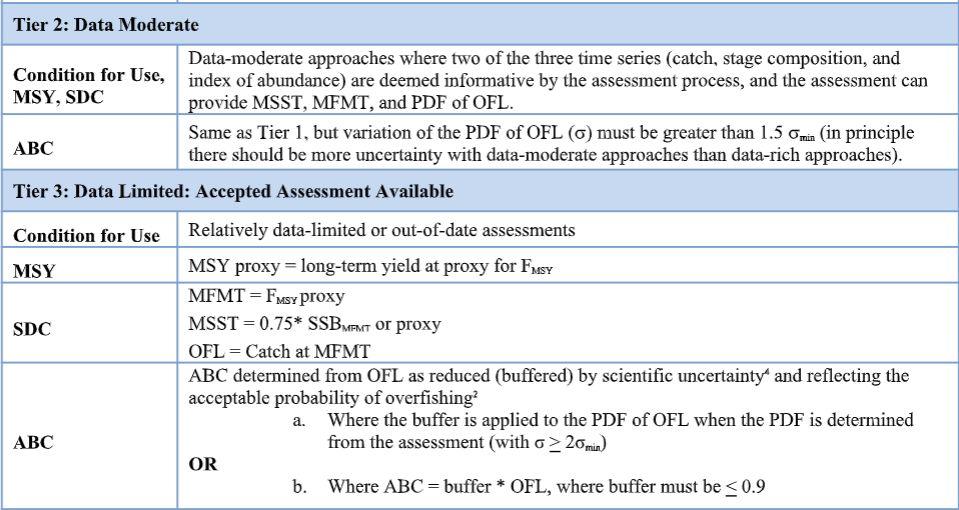
Caribbean Fishery Management Council Acceptable Biological Catch Control Rule
General data research recommendations
● Continue collecting species- and gear-specific landings.
● Increase numbers of port-sampled length measurements.
● Document fleet-specific targeting and discarding behavior to support domed selectivity.
● Continue fishery-independent index of abundance and observed length composition
● Continue examinations of growth, in particular focus on collection of larger individuals for better characterizing the L∞ parameter.
● Support enhanced stock demographic studies and in particular research focused on quantifying connectivity patterns between island platforms.
U.S. Department of Commerce | National Oceanic and Atmospheric Administration | National Marine Fisheries Service Page 35
General assessment research recommendations
If SEDAR 80 methods deemed applicable and results accepted as BSIA:
● Consider interim data-limited applications.
● Consider a management strategy evaluation (MSE) to identify data needs and ensure management advice is robust to key uncertainties.
● Consider exploration and inclusion of environmental indicators.
U.S. Department of Commerce | National Oceanic and Atmospheric Administration | National Marine Fisheries Service Page 36
Caribbean Queen Triggerfish
USVI SEDAR 80 Stock Assessments
09-10 April 2024
CFMC SSC Meeting
Presentation Outline
● Summary of data and methods
● Review of data and stock assessment results
○ St. Thomas and St. John (STTJ)
■ Discussion and recommendations
○ St. Croix (STX)
■ Discussion and recommendations
Questions? ¿Preguntas?
Review of data and stock assessment results St. Croix (STX)
Biology
U.S. Department of Commerce | National Oceanic and Atmospheric Administration | National Marine Fisheries Service Page 39
Fit to data
U.S. Department of Commerce | National Oceanic and Atmospheric Administration | National Marine Fisheries Service Page 40
Fit to data
Estimated length selectivity
U.S. Department of Commerce | National Oceanic and Atmospheric Administration | National Marine Fisheries Service Page 42
Derived Quantities
(F, Recr., and SSB)
U.S. Department of Commerce | National Oceanic and Atmospheric Administration | National Marine Fisheries Service Page 43
Jitter
U.S. Department of Commerce | National Oceanic and Atmospheric Administration | National Marine Fisheries Service Page 44
Retrospective
U.S. Department of Commerce | National Oceanic and Atmospheric Administration Page 45
Likelihood profiles
Steepness and Unfished Recruitment
U.S. Department of Commerce | National Oceanic and Atmospheric Administration | National Marine Fisheries Service Page 46
Likelihood profiles
Initial F and Final Survey Selectivity
U.S. Department of Commerce | National Oceanic and Atmospheric Administration | National Marine Fisheries Service Page 47
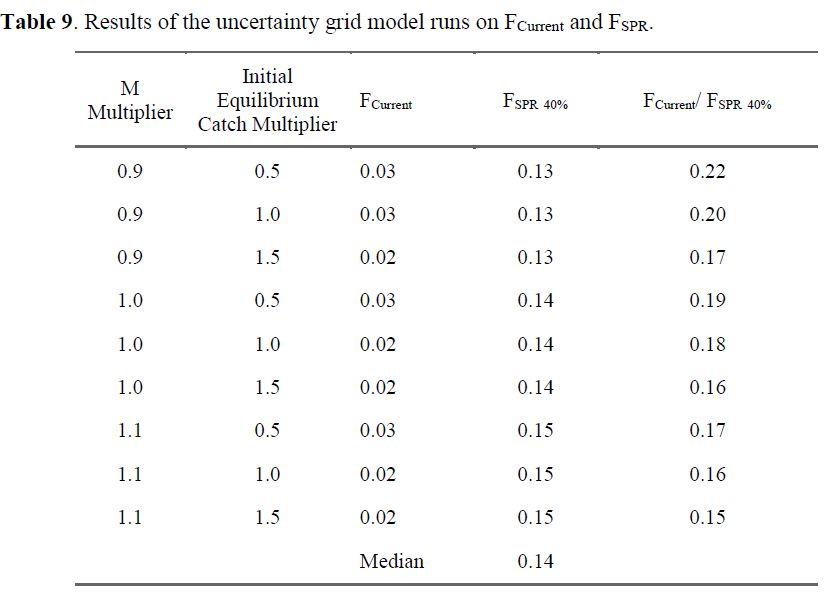
F Current & F SPR 40%
● The median FSPR 40% across the models in the uncertainty grid was 0.14.
● All runs within the uncertainty grid suggest that overfishing is not occurring.
U.S. Department of Commerce | National Oceanic and Atmospheric Administration | National Marine Fisheries Service Page 48
U.S. Department of Commerce | National Oceanic and Atmospheric Administration | National Marine Fisheries Service Page 49
Current Catch Limits in Pounds SYL 45,158 ABC 22,579 ACL 21,450 Recent years of catch in Pounds 2019 2,592 2020 4,342 2021 9,350 2022 4,387
OFL Projections & Uncertainty Grid
Summary
● Integrated assessment using length and index of abundance and modeling best practices
● SS framework allows explicit assumptions and tools for exploring key uncertainties
● Conflicting signals across relatively few sources of data and assumptions required for selectivity and stock unit recruitment connectivity (steepness)
● Results suggest that overfishing is not occurring.
● Reference model diagnostics stable but unable to confidently estimate MSY and stock status.
● Short-term harvest levels that prevent overfishing (i.e. OFL, ACL) estimated by assuming that future recruitment will continue at recent levels.
U.S. Department of Commerce | National Oceanic and Atmospheric Administration | National Marine Fisheries Service Page 50
Caribbean Queen Triggerfish
USVI SEDAR 80 Stock Assessments
09-10 April 2024
CFMC SSC Meeting
Presentation Outline
● Summary of data and methods
● Review of data and stock assessment results
○ St. Thomas and St. John (STTJ)
■ Discussion and recommendations
○ St. Croix (STX)
■ Discussion and recommendations
Questions? ¿Preguntas?
Caribbean Fishery Management Council Acceptable Biological Catch Control Rule
U.S. Department of Commerce | National Oceanic and Atmospheric Administration Page 53
