Carilion Rockbridge Community Hospital
CarilionClinic.org/community-health-assessments

Carilion Rockbridge Community Hospital
CarilionClinic.org/community-health-assessments
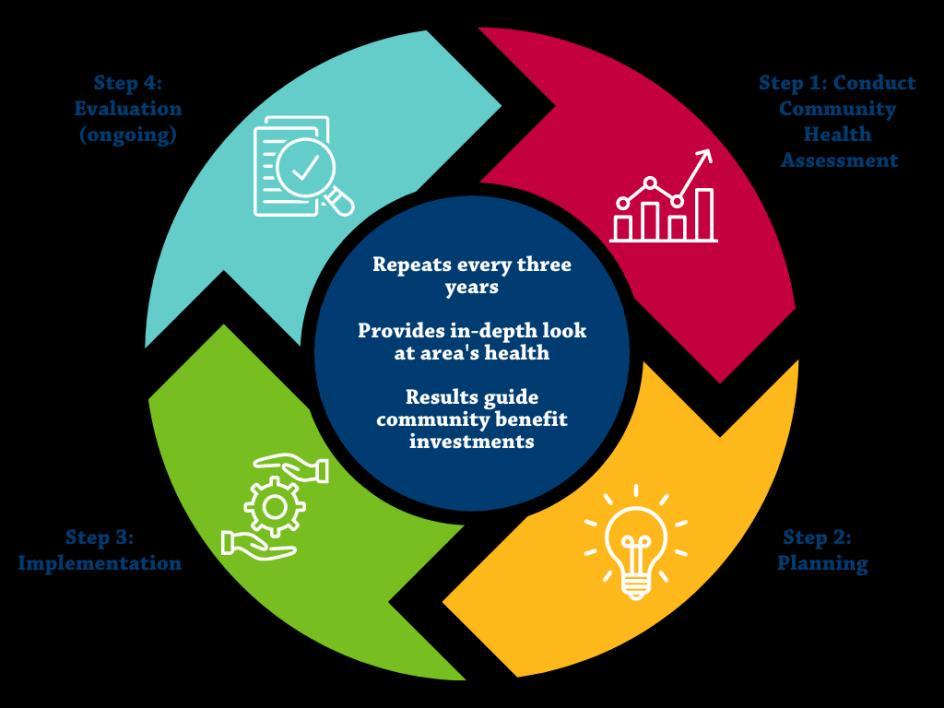
Carilion Clinic is committed to joining with our partners to pursue the essential work of improving and maintaining the health of the Rockbridge Area in accordance with our mission Periodically assessing the health concerns of each community is a key component of addressing community needs. Every three years, the Rockbridge Area Community Health Assessment (RACHA) aims to uncover issues, indicate where improvement is needed and track and promote progress in key areas so that there is demonstrated, ongoing change. The CHA process and the public availability of its findings enable and empower our community to effectively improve and maintain health.
Carilion, Live Healthy Rockbridge (LHR) and the Central Shenandoah Health District (CSHD) collaborated to conduct the 2024 RACHA alongside additional community partners, all of whom comprise the Community Health Assessment Team (CHAT). After review and discussion of the data collected, the 2024 RACHA led the CHAT to identify seven priority health issues in the community.
Carilion believes in continuous quality improvement. The triennial CHA serves as a formal way of identifying community needs and developing plans to address them It shapes the ways we support our mission in the community and encourages collaboration and alignment with clinical teams Not only does this process identify current needs and disparities, but also helps to ensure we are regularly evaluating and shifting to meet emerging needs
In collaboration with the CHAT, we identify key health needs to align resources and other efforts for the following three years. The CHAT reviews extensive data, asks questions and participates in a consensus-building prioritization process. The 2024 RACHA resulted in the following health priorities:


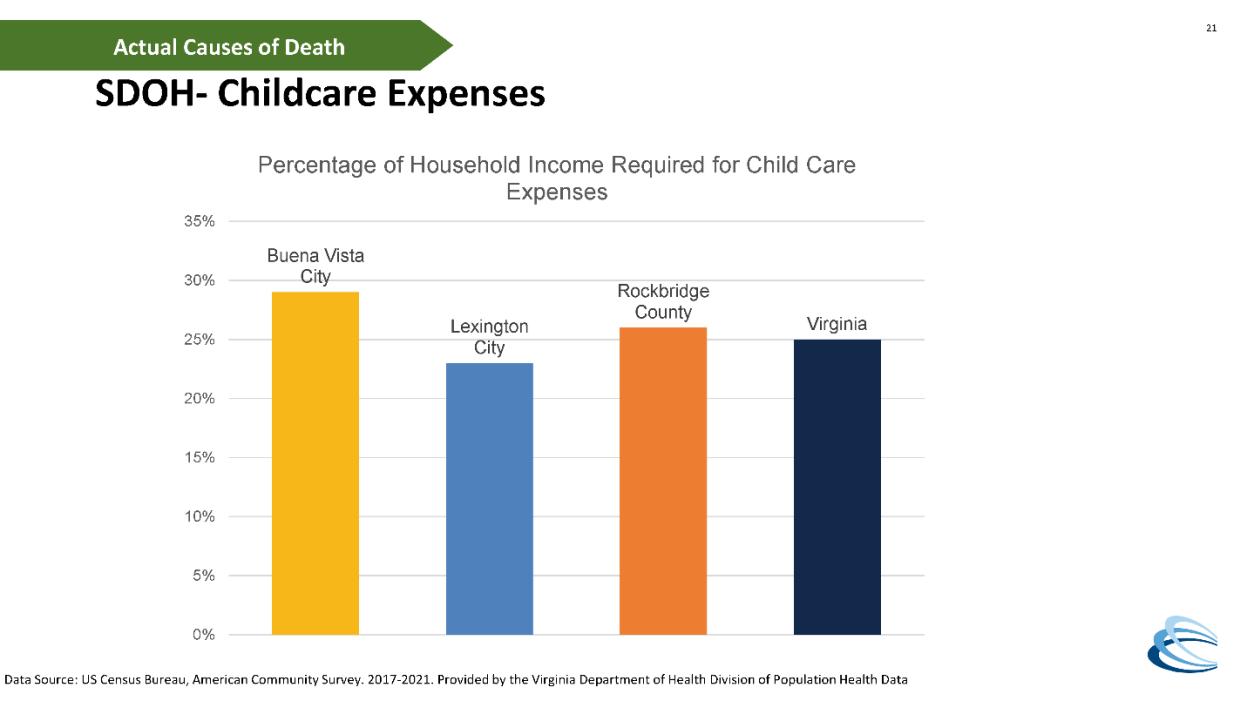
The CHA process focused on prioritizing health conditions and outcomes, rather than a broader focus on their root causes. We recognize that access to healthcare and other services and the social determinants of health (SDOH) are key facilitators of good health and well-being. As such, we are focused on those and other health factors as a strategic component of action planning The key drivers of each priority health condition, as identified by the CHAT, are discussed in the corresponding sections of this report.
This document was approved by the CRBH Board of Directors on July 18, 2024, and formally adopted as the 2024 Rockbridge Area Community Health Assessment.
This document has been produced to benefit the community. Carilion encourages the use of this report for planning purposes and is interested in learning of its utilization. Comments and questions are welcome and can be submitted to Carilion at communityoutreach@carilionclinic.org
Members of the leadership team reviewed all documents prior to publication. Every effort has been made to ensure the accuracy of the information presented in this report; however, accuracy cannot be guaranteed. Members of the Rockbridge Area CHAT cannot accept responsibility for any consequences that result from the use of any information presented in this report.
Carilion began conducting CHAs prior to the IRS adoption of the 501(r)(3) standard which requires not-for-profit hospitals to conduct a Community Health Needs Assessment (CHNA) every three years. While meeting the CHNA requirement, Carilion maintains the longstanding formal name Community Health Assessment for our process and reports. A crosswalk of this document based on the 501(r)(3) standards can be found in Appendix A.
The CHA Leadership Team collaborates to guide major functions of the CHA, including CHAT recruitment, data collection/analysis and shaping meeting structure. In addition to Carilion staff, membership includes leadership from Central Shenandoah Health District, the Rockbridge Area Health Center and Rockbridge Area Community Services. Carilion organizes and facilitates leadership team meetings.
• Carilion Clinic:
o Shirley Holland, VP, Community Health and Development
o Molly Roberts, Manager, Community Benefit
o Ashley Hash, Community Health Improvement Program Manager
o Holly Ostby, Community Health Improvement Program Manager
o Nicholas (Nick) Bilbro, Community Benefit Analyst
• Central Shenandoah Health District:
o Laura Lee Wight, Population Health Manager
• Rockbridge Area Health Center:
o Suzanne Sheridan, Executive Director
• Rockbridge Area Community Services:
o BreAnne Rogers, Executive Assistant and Communications Coordinator
The CHAT is a dynamic group of health and human service agency leaders, individuals/organizations serving/representing the interests of priority populations and local representatives from various community sectors. The following community partner organizations participated in the 2024 RACHA:
Organization
Anthem Medicaid
Buena Vista City
Carilion Clinic
Central Shenandoah Health District
ConnectionsPlus Healthcare and Hospice
Organization Type
Insurance Provider
Local Government Representative
Healthcare
Health District
Healthcare FOR Swimming
Girl Scouts - Skyline Council
Grace Episcopal Church
Lexington City
Lexington City Office on Youth
Lexington-Rockbridge Chamber of Commerce
Live Healthy Rockbridge Kids
Natural Bridge State Park
Project Horizon
Rockbridge Area Community Services
Rockbridge Area Health Center
Physical Activity
Youth Services
Faith Community
Local Government Representative
Youth Services
Chamber of Commerce
Youth Services
State Park
Domestic Violence
Mental Health
FQHC
Organization
Rockbridge Area Prevention Coalition
Rockbridge Area Relief Association
Prevention Services
SDOH-Focused Organization
Rockbridge Area Transportation System Transportation
Rockbridge Baths Community Organization Community Organizer
Rockbridge Community Health Foundation Foundation
Rockbridge County
TAP Head Start
United Way of Rockbridge
Valley Program for Aging Services
Virginia Cooperative Extension
Washington and Lee University
Local Government Representative
SDOH-Focused Organization
United Way
Senior Services
Food Access
Higher Education
To see a list of specific 2024 CHAT participants, please see Appendix B.
Additional data support was provided by the Virginia Department of Health Division of Population Health Data.
• Khristina Morgan, Community Health Epidemiology Regional Coordinator
• LeeAnn Gardner, Community Health Epidemiologist, Central Shenandoah Health District
• Taiwo Ilechie, Community Health Epidemiologist, Roanoke City and Alleghany Health Districts
The first step in the ongoing community health improvement process is to conduct a CHA. Every three years, Carilion follows the formal process described below to identify community needs and develop plans to address them. The 2024 RACHA officially began on September 19, 2023 with a data presentation and concluded with the final CHAT meeting on June 18, 2024.
Carilion Rockbridge Community Hospital (CRBH) is located in Lexington, Virginia. CRBH is a not-for-profit, 25-bed critical access hospital dedicated to quality care and patient comfort. Offering both inpatient and outpatient services, CRBH also impacts the health of the community through its Swing Bed program extended recovery for patients with skilled care needs before transitioning home.
The service areas for Carilion’s CHAs are determined by unique patient origin of the hospital in each respective market. Focus is placed on areas that are considered Medically Underserved Areas (MUAs) and Health Professional Shortage Areas (HPSAs).
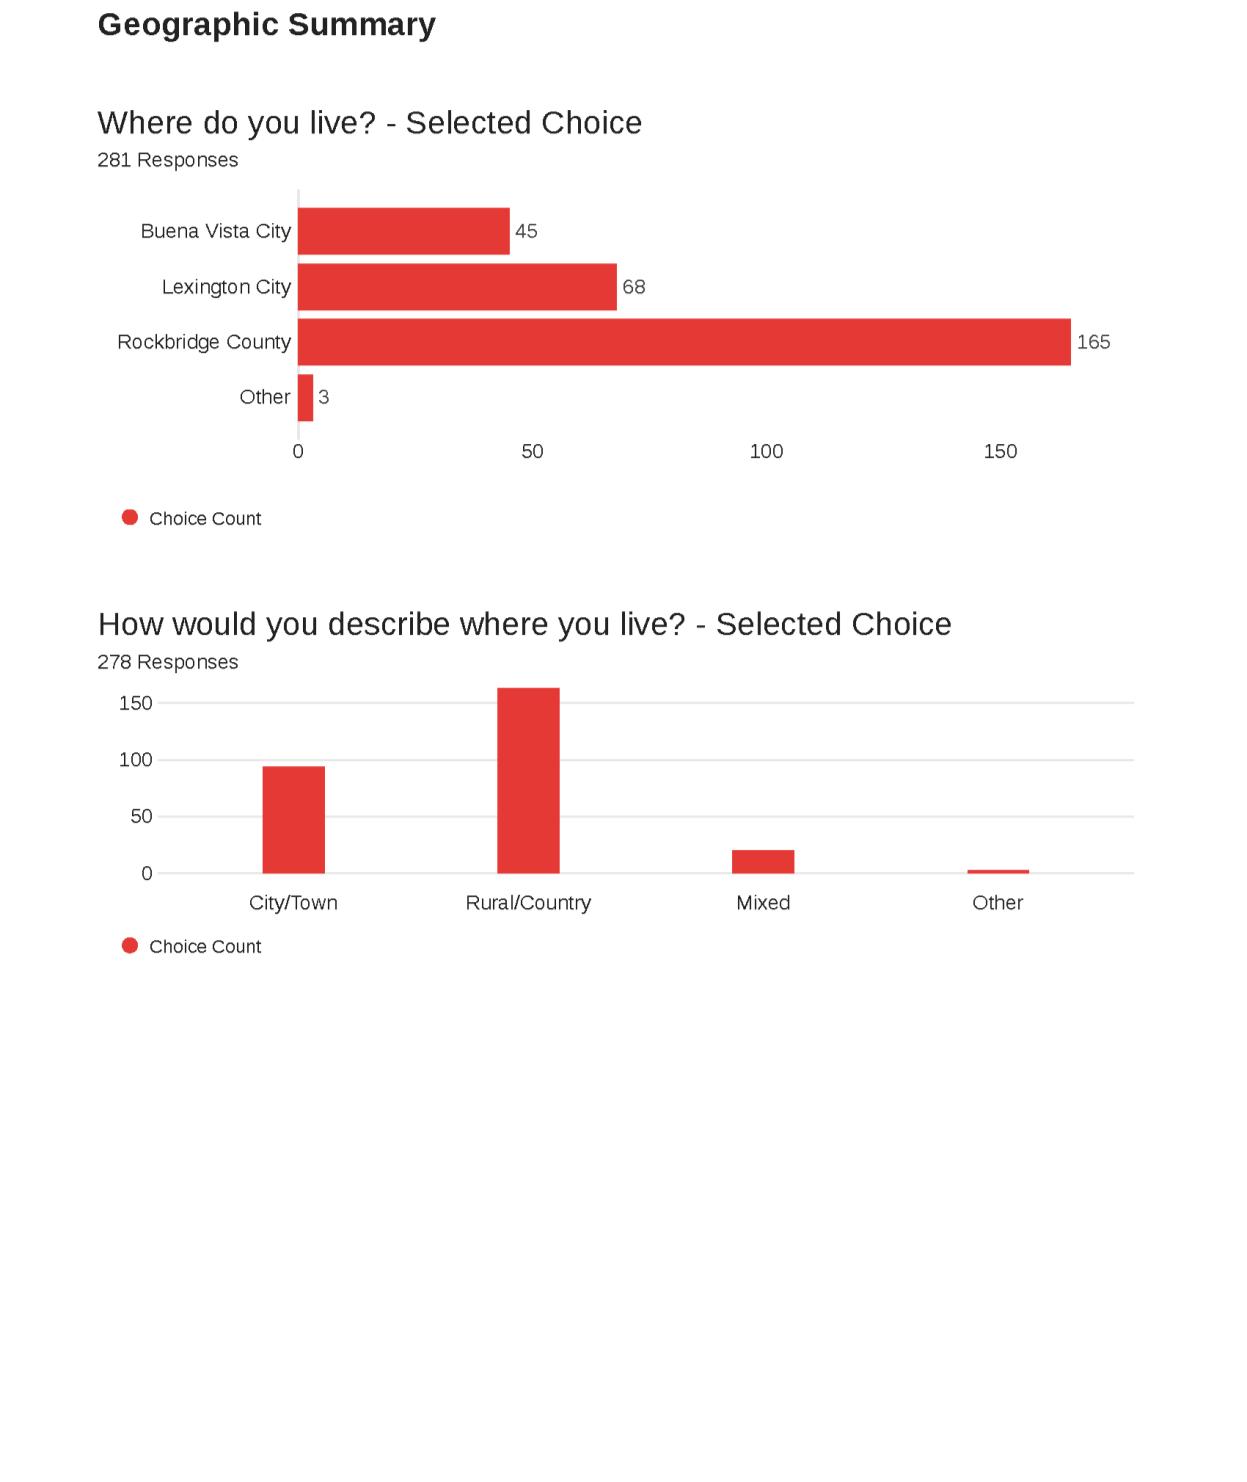
In fiscal year 2023, CRBH served 13,267 unique patients. Patient origin data revealed that during this year, 94% of patients served by CRBH lived in the following localities:
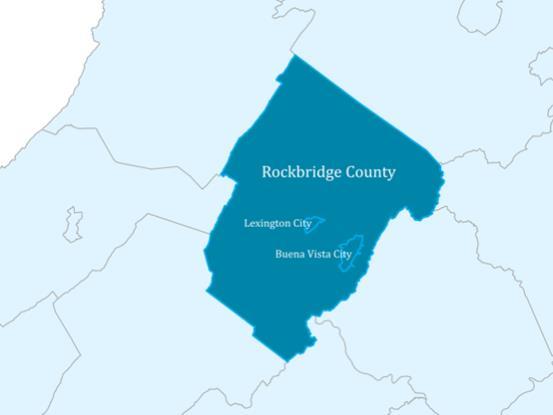
• Rockbridge County and Lexington City (67%)
• Buena Vista City (27%)
The Rockbridge Area includes the independent cities of Lexington and Buena Vista, as well as Rockbridge County
In addition to Carilion, key safety net providers in the region include the Rockbridge Area Health Center (a federally qualified health center), Rockbridge Area Community Services, local offices of the Virginia Department of Health (VDH) and other service organizations. Despite these entities’ presence, many low-income, uninsured and underinsured residents do not have sufficient access to affordable healthcare services. The localities within the service area have significant disparities in size, population and SDOH The Weldon Cooper Center for Public Service predicts positive population change by 2040 for all three localities.1
1 https://www.coopercenter.org/virginia-population-projections
1.
Source: US Census Bureau, ACS, 2018-2022
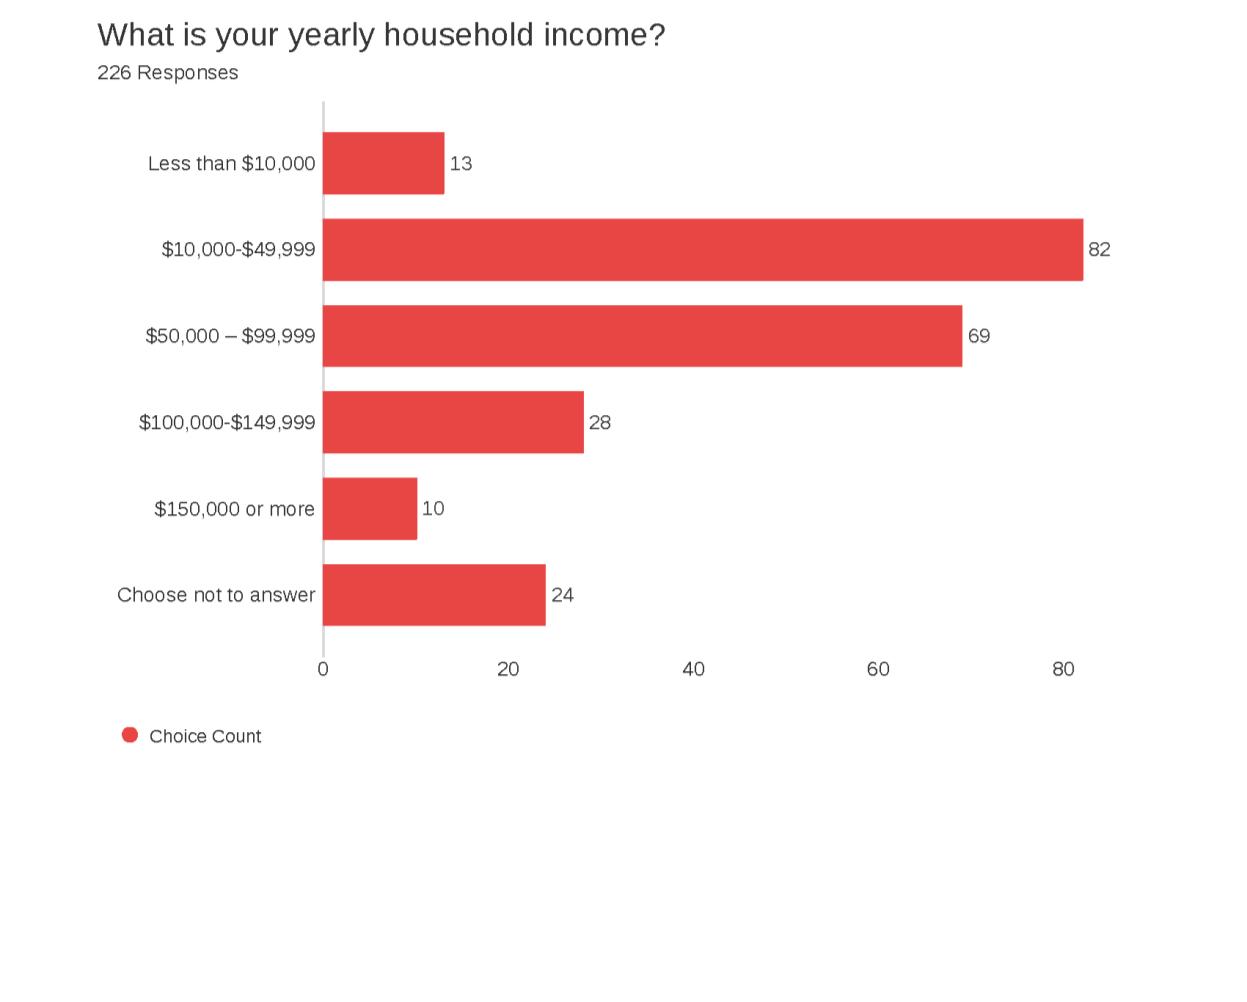
Table 2. Income Data for the RACHA Service Area
Source: US Census Bureau, ACS, 2018-2022
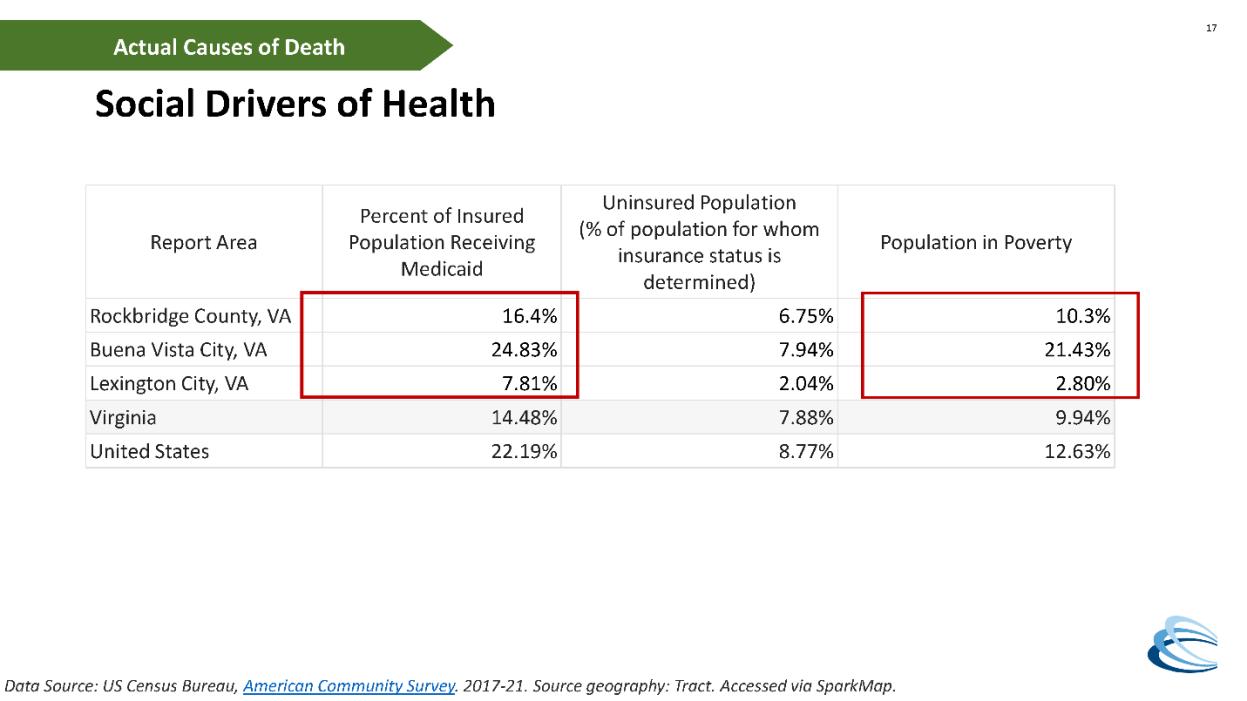
Specific to CRBH inpatients and outpatients in fiscal year 2023, 20.05% received Medicaid while 3.39% were self-pay, a proxy for uninsured 2
2 Strata internal data
Source: US Census Bureau, ACS, 2018-2022
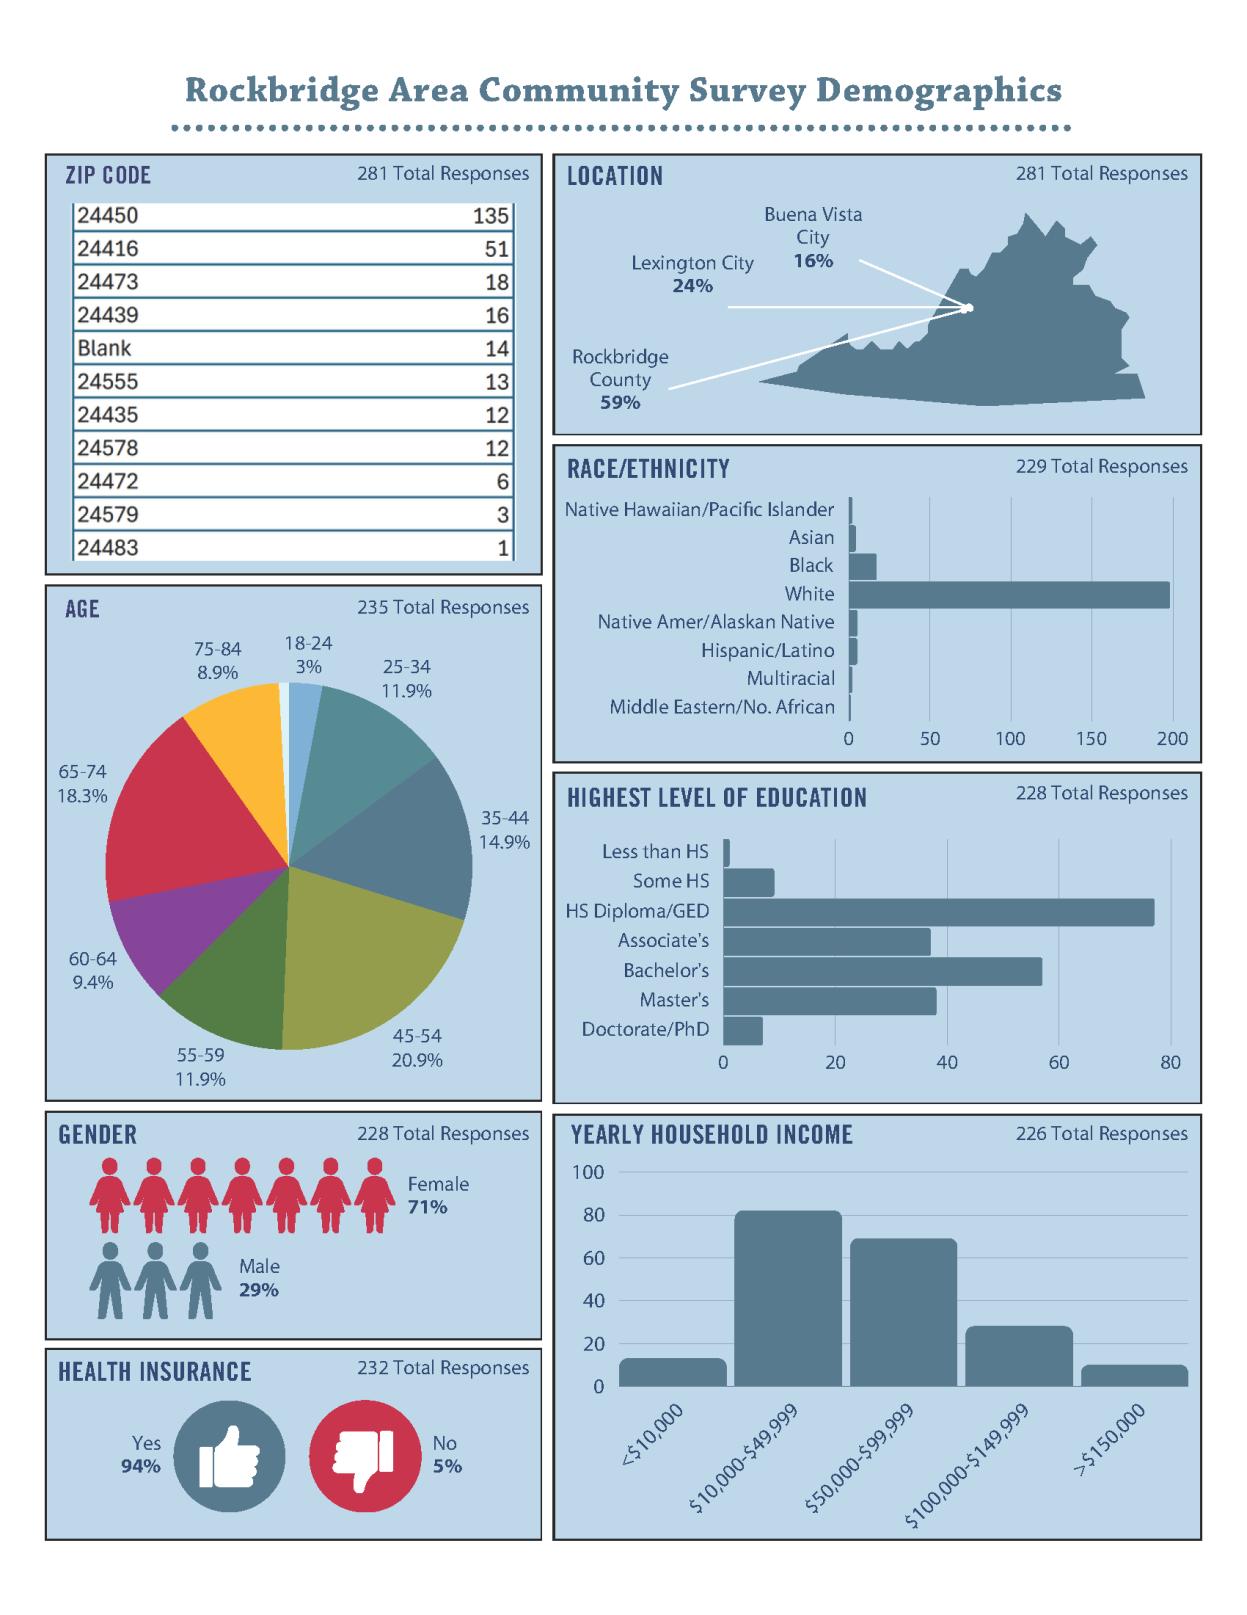
Lexington City, at the center of the service area, is more racially and ethnically diverse than the rest of the Rockbridge Area. All localities are below the state average for the percentage of the population identifying as Hispanic or Latino, with the highest percentage (5.1%) in Lexington City.
Table 4. Racial Demographics, RACHA Service Area
Source: US Census Bureau, ACS, 2018-2022
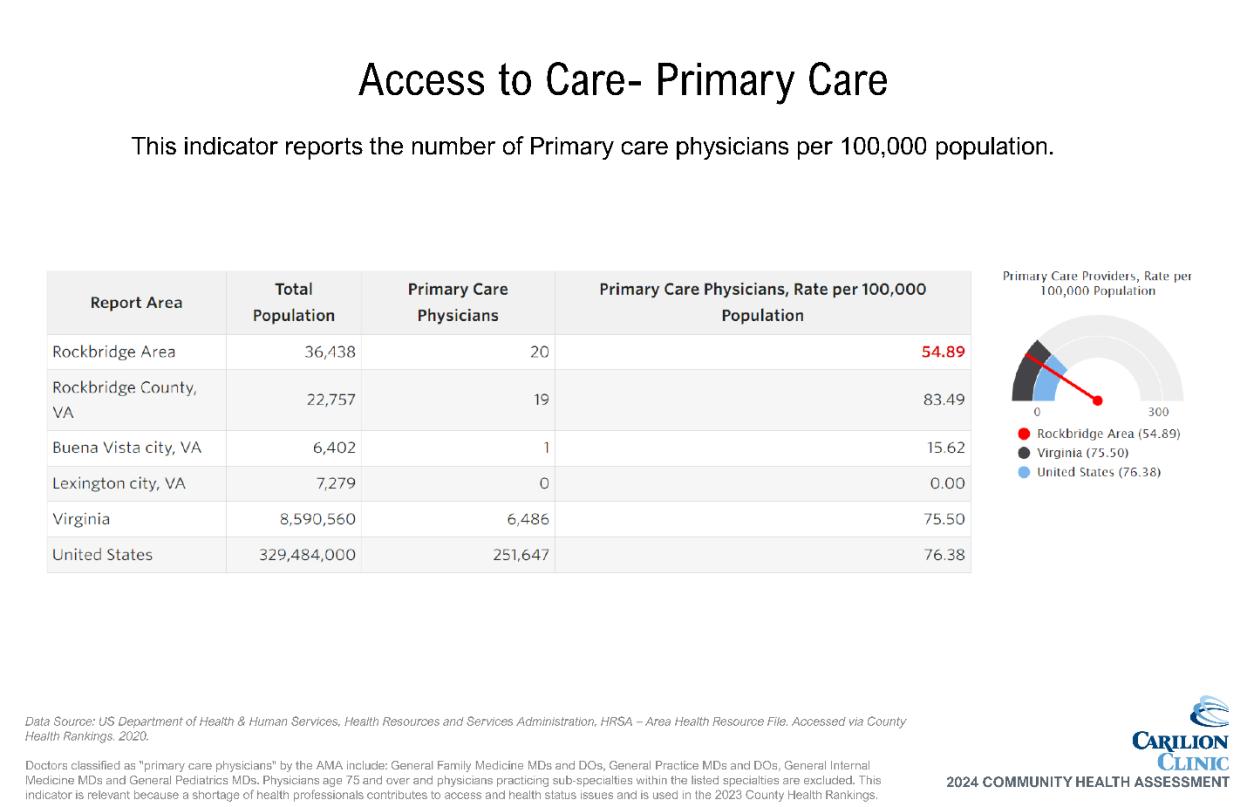
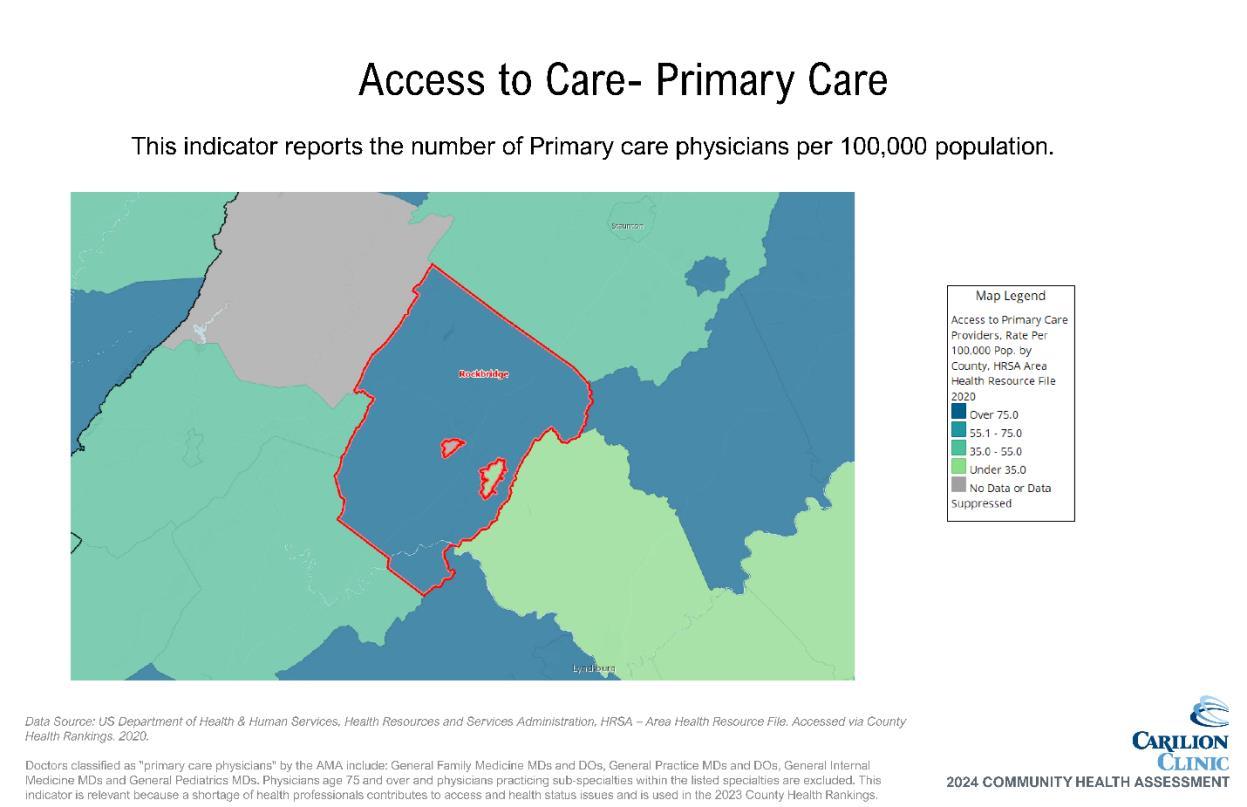
The region is divided into urban and rural areas, which vary greatly in the economic means of the residents who live there. The low-income population in the Rockbridge Area is designated as a MUA. 3 The entire Rockbridge service area is designated as a low-income HPSA for primary care, dental health and mental health 4
The target population for Carilion’s CHA projects consists of underserved/vulnerable populations disproportionately impacted by SDOH, including poverty, race/ethnicity, age, education, access and/or lack of insurance. Data are reviewed where available by different life stages, including parents of children and adolescents, women of child-bearing age, adults and the elderly. Other considerations include race, ethnicity and income levels. All patients are included in this assessment regardless of insurance payments or financial assistance eligibility. Distinct efforts are taken to ensure the CHA reflects those residing in MUAs and HPSAs.
A 48-member CHAT participated in the assessment activities. Hearing voices from across our service area is crucial to a CHA’s success. Broad-interest community reach is a main qualification when inviting individuals to join the CHAT. In addition to Live Healthy Rockbridge, we also invited representatives from the CSHD, local governments, the local school system, social service organizations, other community organizers and nonprofit leaders.
The CHAT met five times throughout the process, with each meeting serving a distinct purpose.
• Meeting 1a: Introduction and Overview of the Process
• Meeting 1b: Launch of Community Health and Well-Being Survey
• Meeting 2: Data Presentation and Data Walk
• Meeting 3: Prioritization of Needs and Discussion
• Meeting 4: Action Planning: Key Drivers and Impact/Feasibility Activity
Each meeting built on the one prior and fostered dialogue amongst CHAT members. Meetings were held in person and virtually with interactive opportunities to participate and engage with data and facilitated discussions with other CHAT members
The CSHD team was engaged from the beginning of the planning process (spring of 2023) throughout the assessment period and all CHAT meetings CSHD’s involvement helped shape all aspects of this assessment. The team identified community partners to serve on the CHAT, provided discussion points and suggestions on structure of CHAT meetings and offered feedback on the prioritized needs. Additionally, CSHD representatives were active on the CHAT and participated in all activities including the Stakeholder Listening Session and the prioritization activity.
In addition to CSHD, the CHAT included other individuals or organizations serving or representing the community’s medically underserved, low-income and minority populations. Examples include:
• Federally Qualified Health Centers (Rockbridge Area Health Center)
• Public school systems (e.g., Rockbridge County Public Schools)
3 https://data.hrsa.gov/tools/shortage-area/mua-find
4 https://data.hrsa.gov/tools/shortage-area/hpsa-find
• Community-based social support organizations (e.g., Rockbridge Area Relief Association)
These organizations and individuals helped gather community input by distributing the Community Health Survey. CHAT member input was solicited through the Stakeholder Survey and Listening Session. Combined, these efforts led to the identification and prioritization of community health needs.
Various data were collected and shared regularly with the CHAT, including primary and secondary data on health outcomes, health status, socioeconomic factors and quality of life. Secondary data served as a key driver of the process, with primary data adding community context and perspectives to understand the needs of subpopulations within the community.
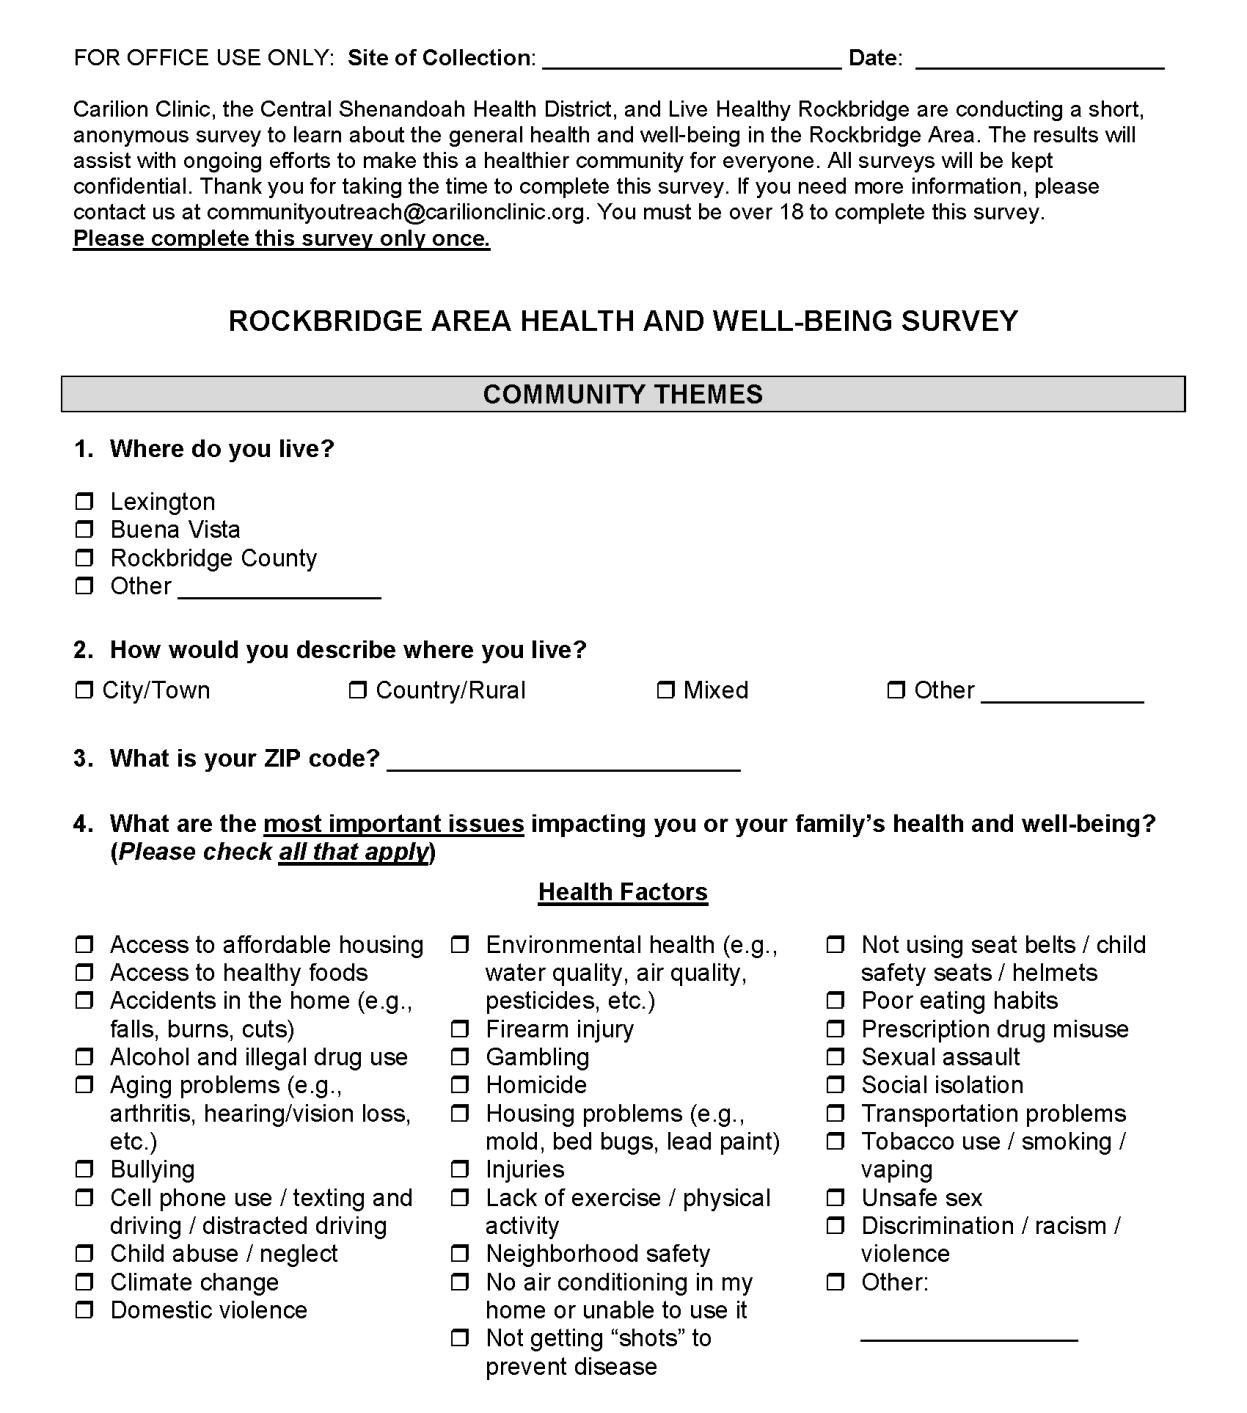
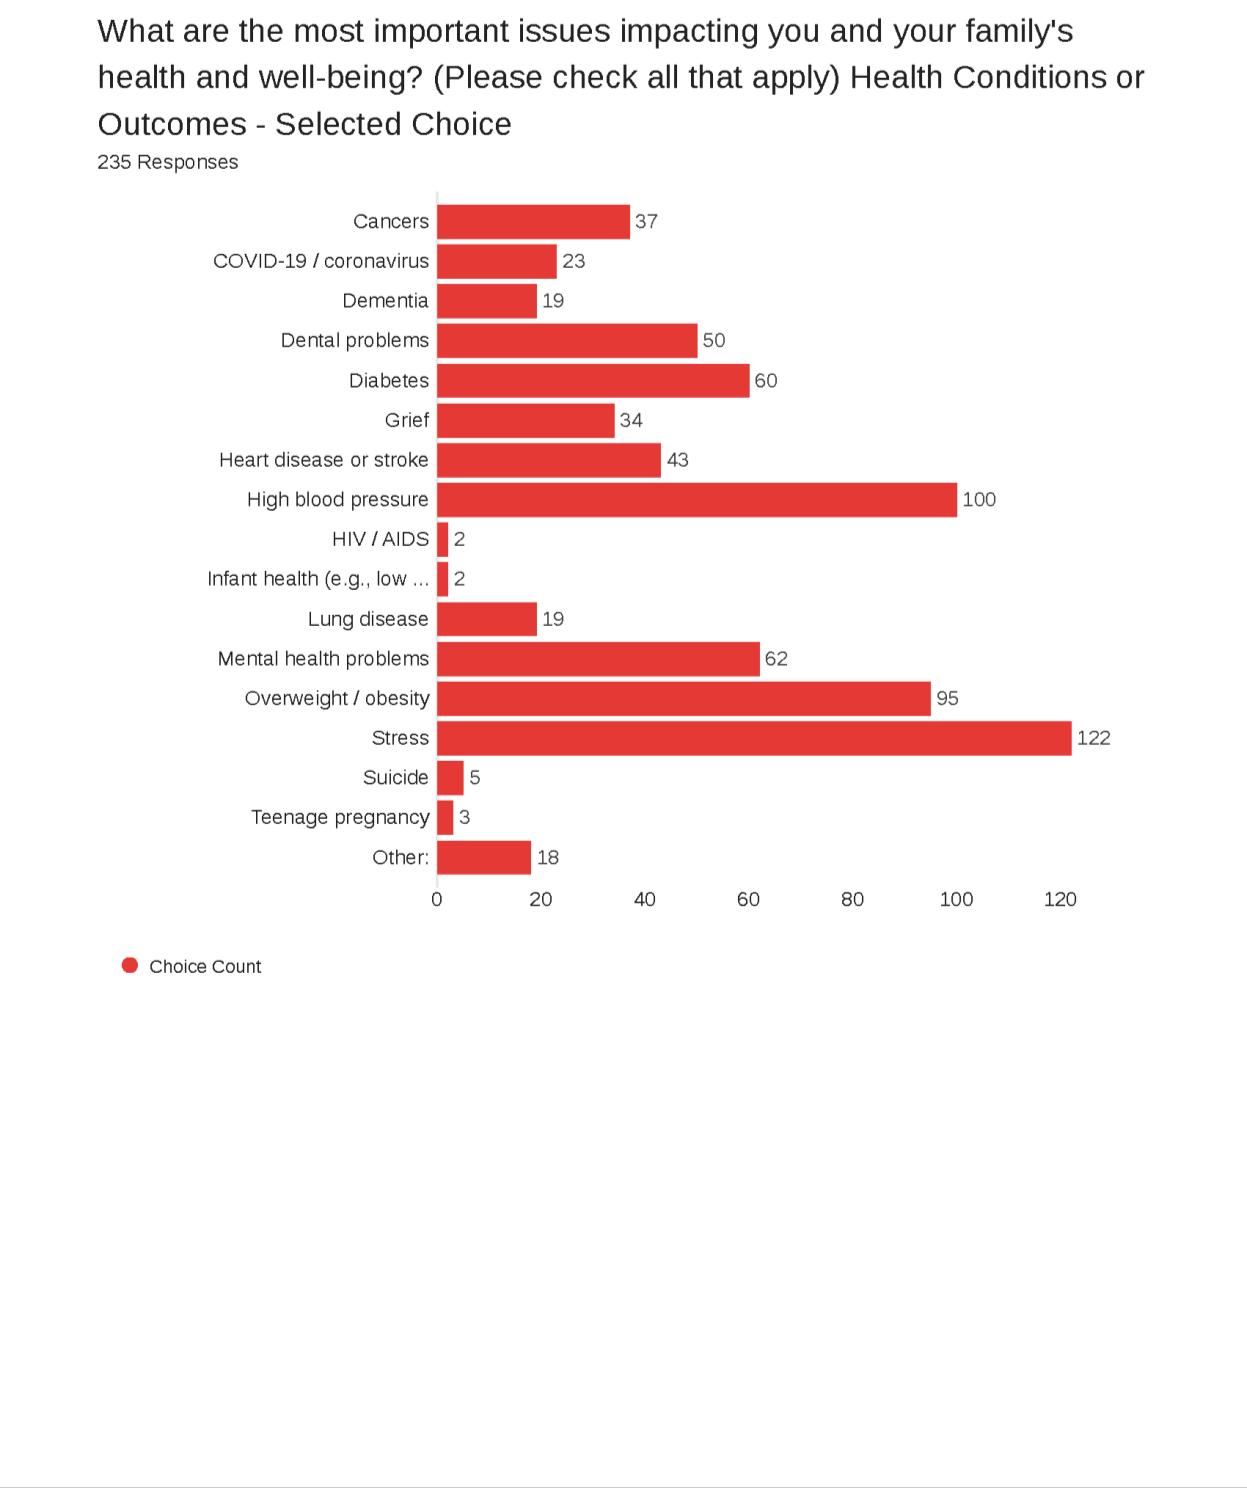
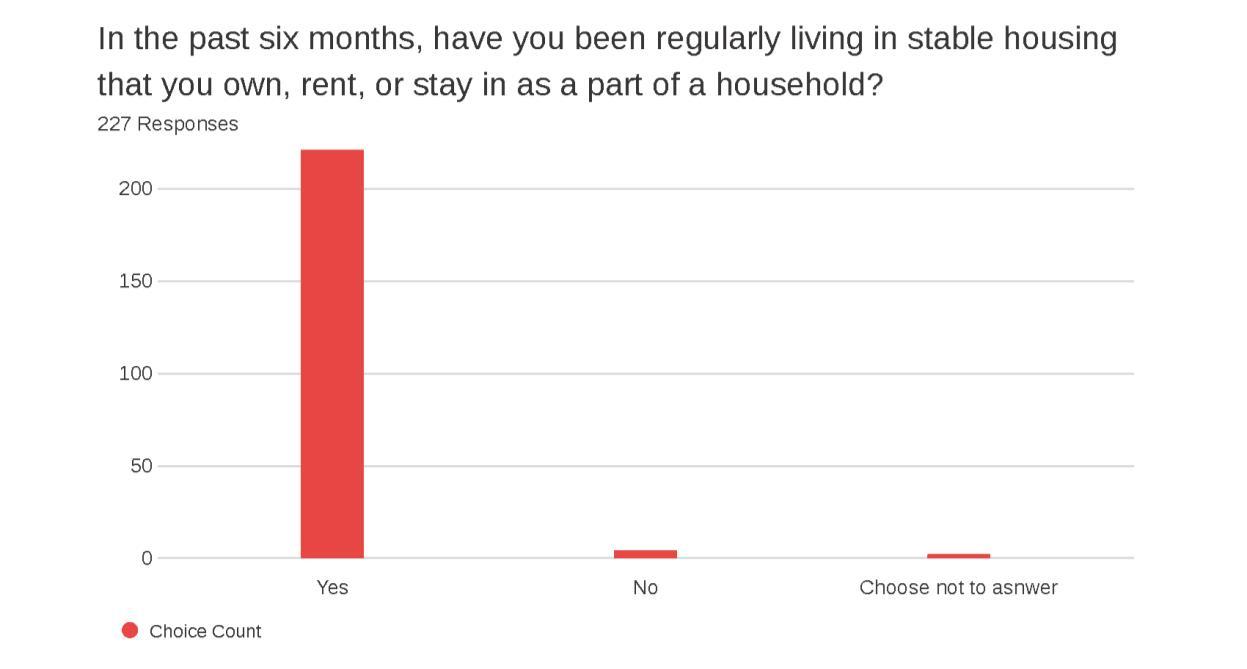
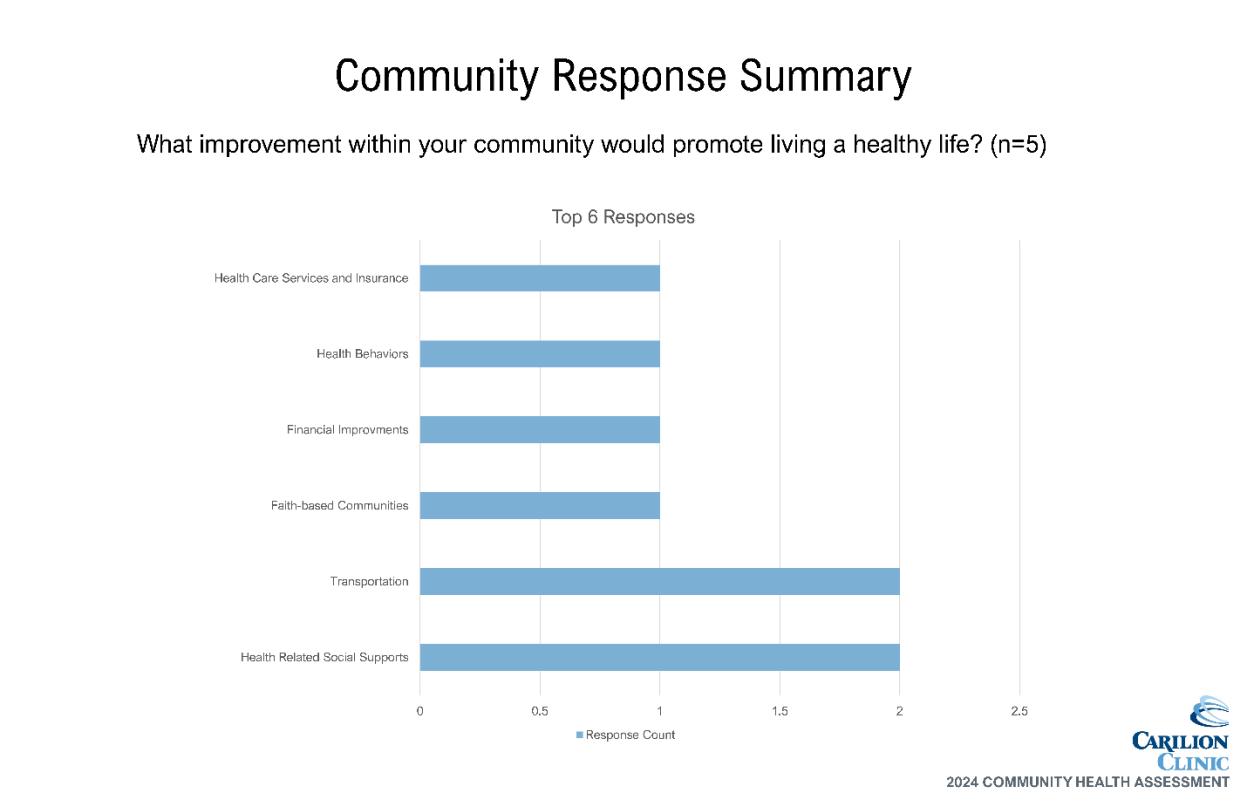
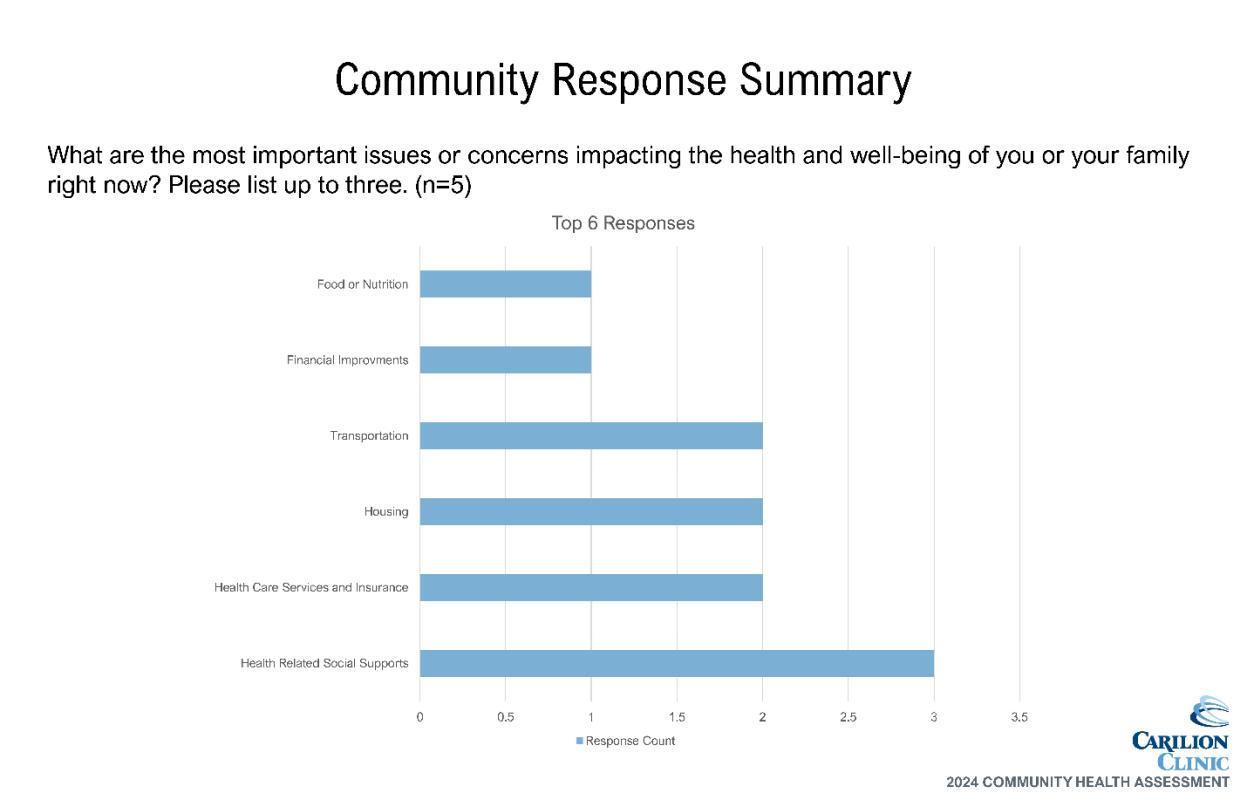
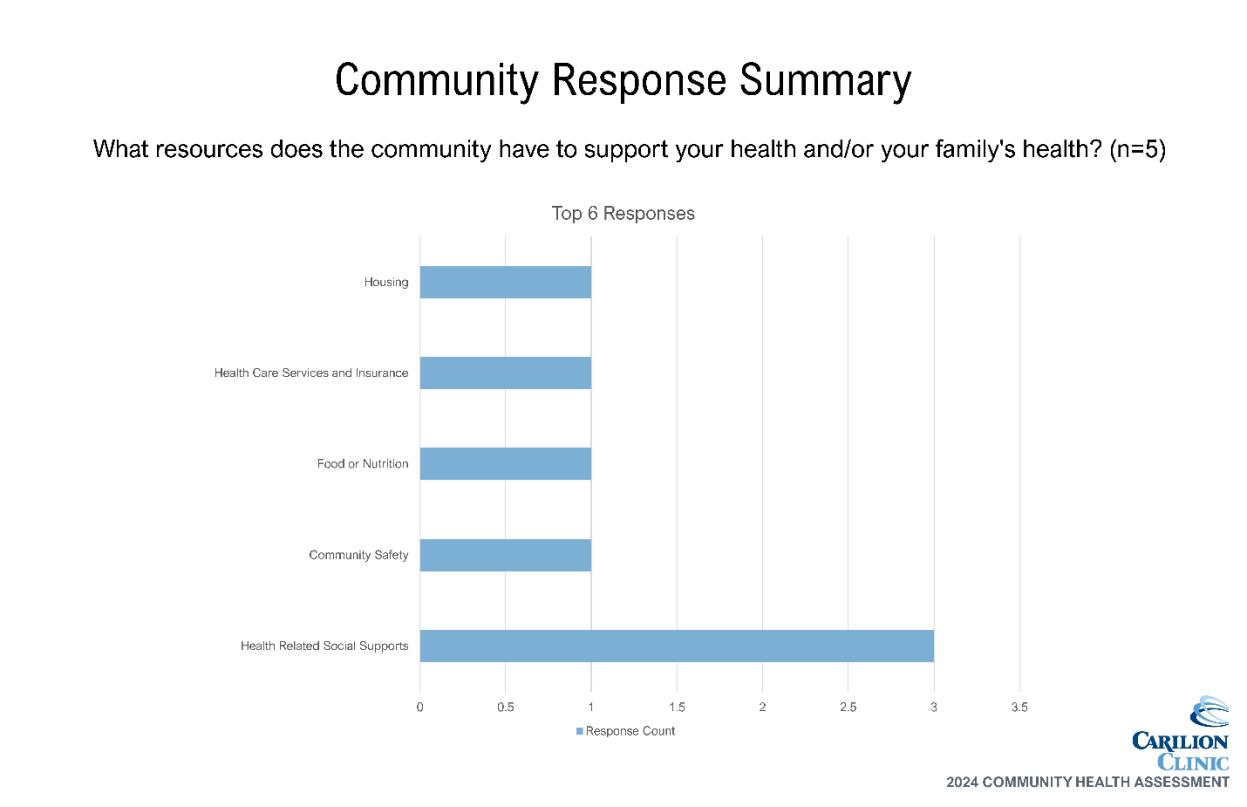
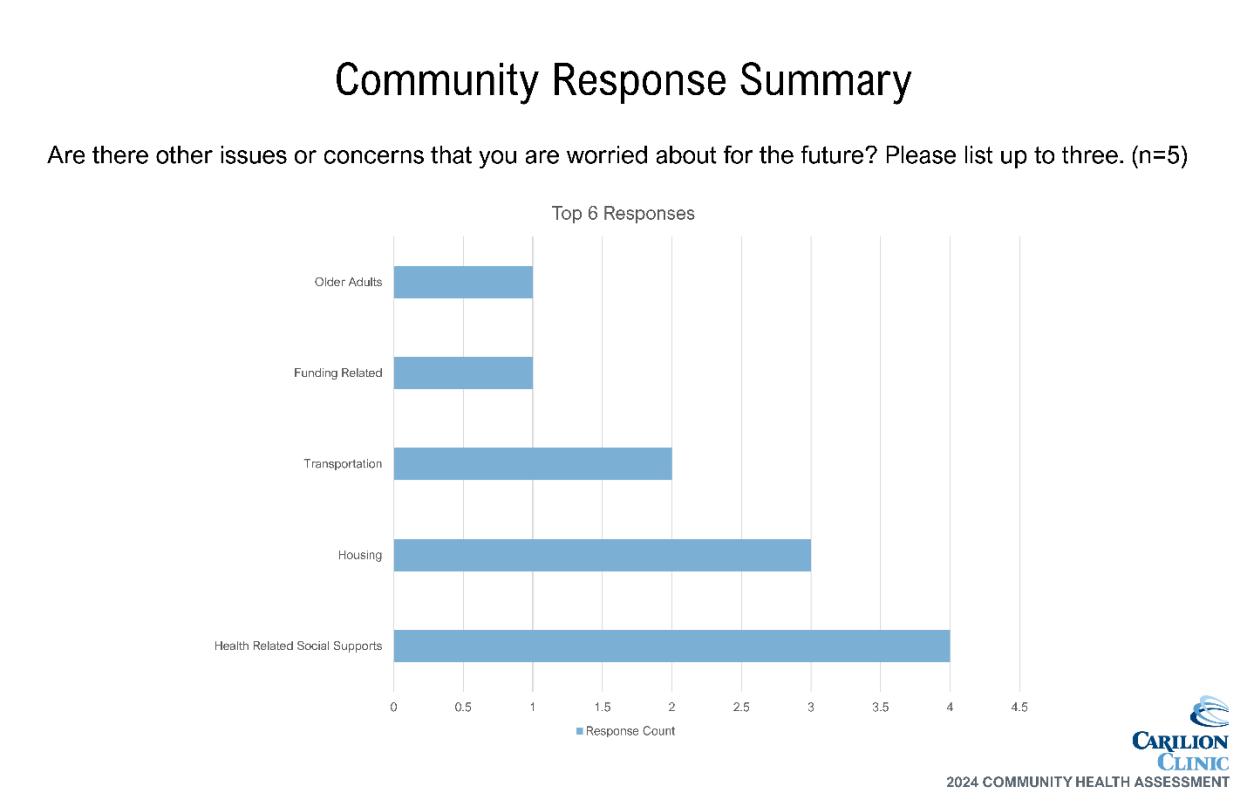
A Community Health and Well-Being Survey was conducted as part of the RACHA. This survey was used to evaluate the community’s health and identify potential geographic areas to target improvements. Input and oversight of survey development was provided by the CHAT and the CHA Leadership Team.
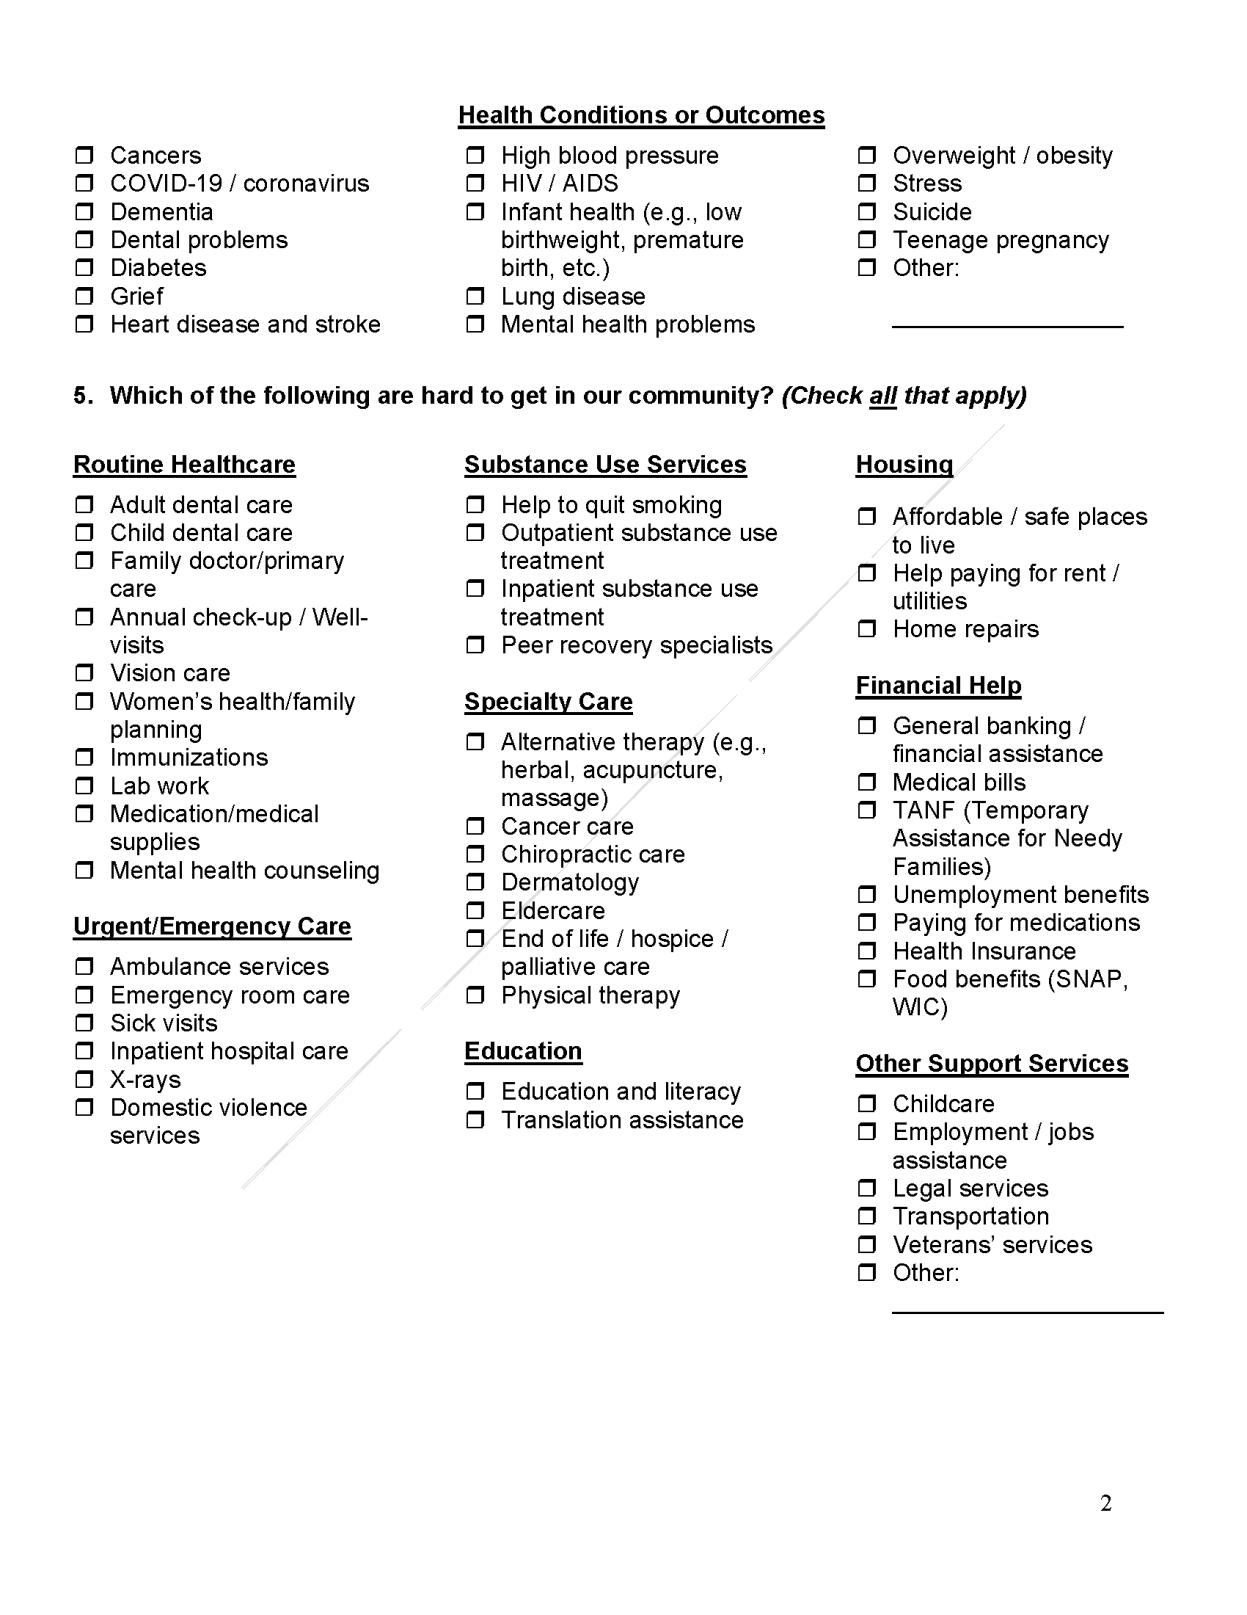
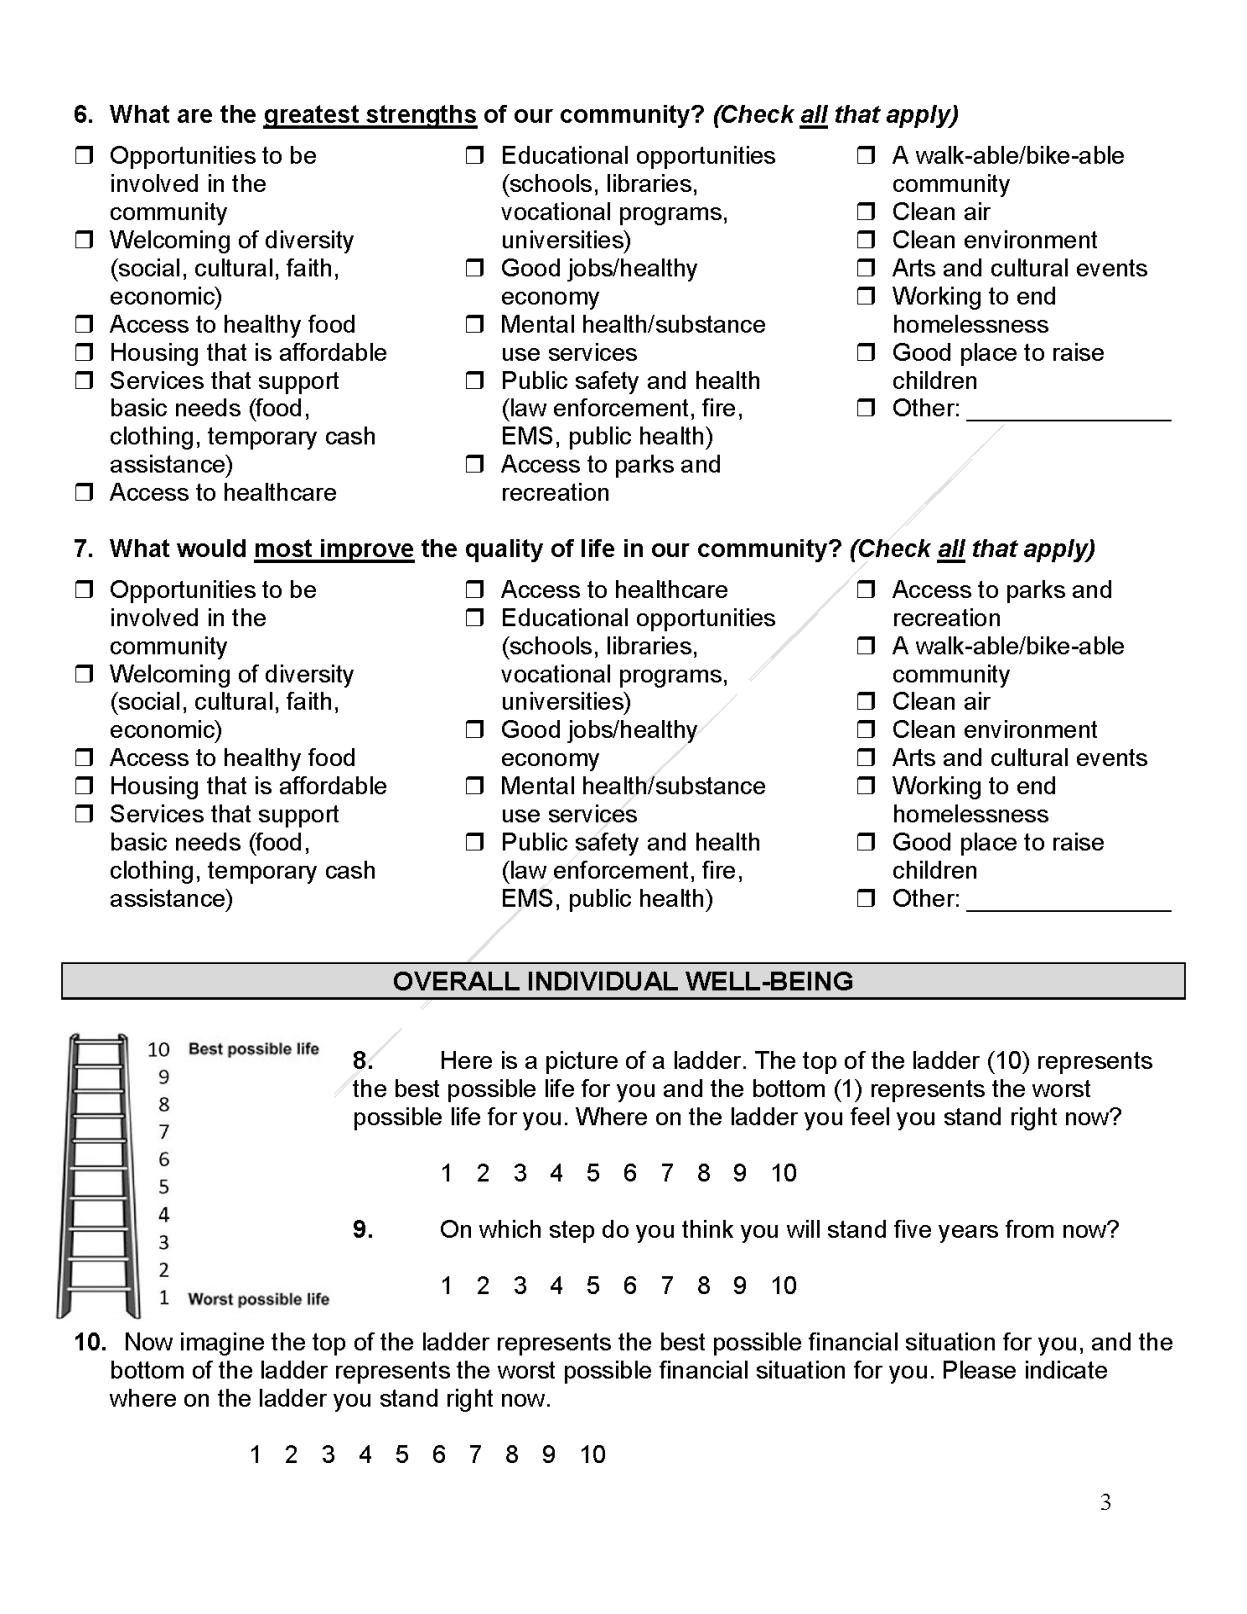
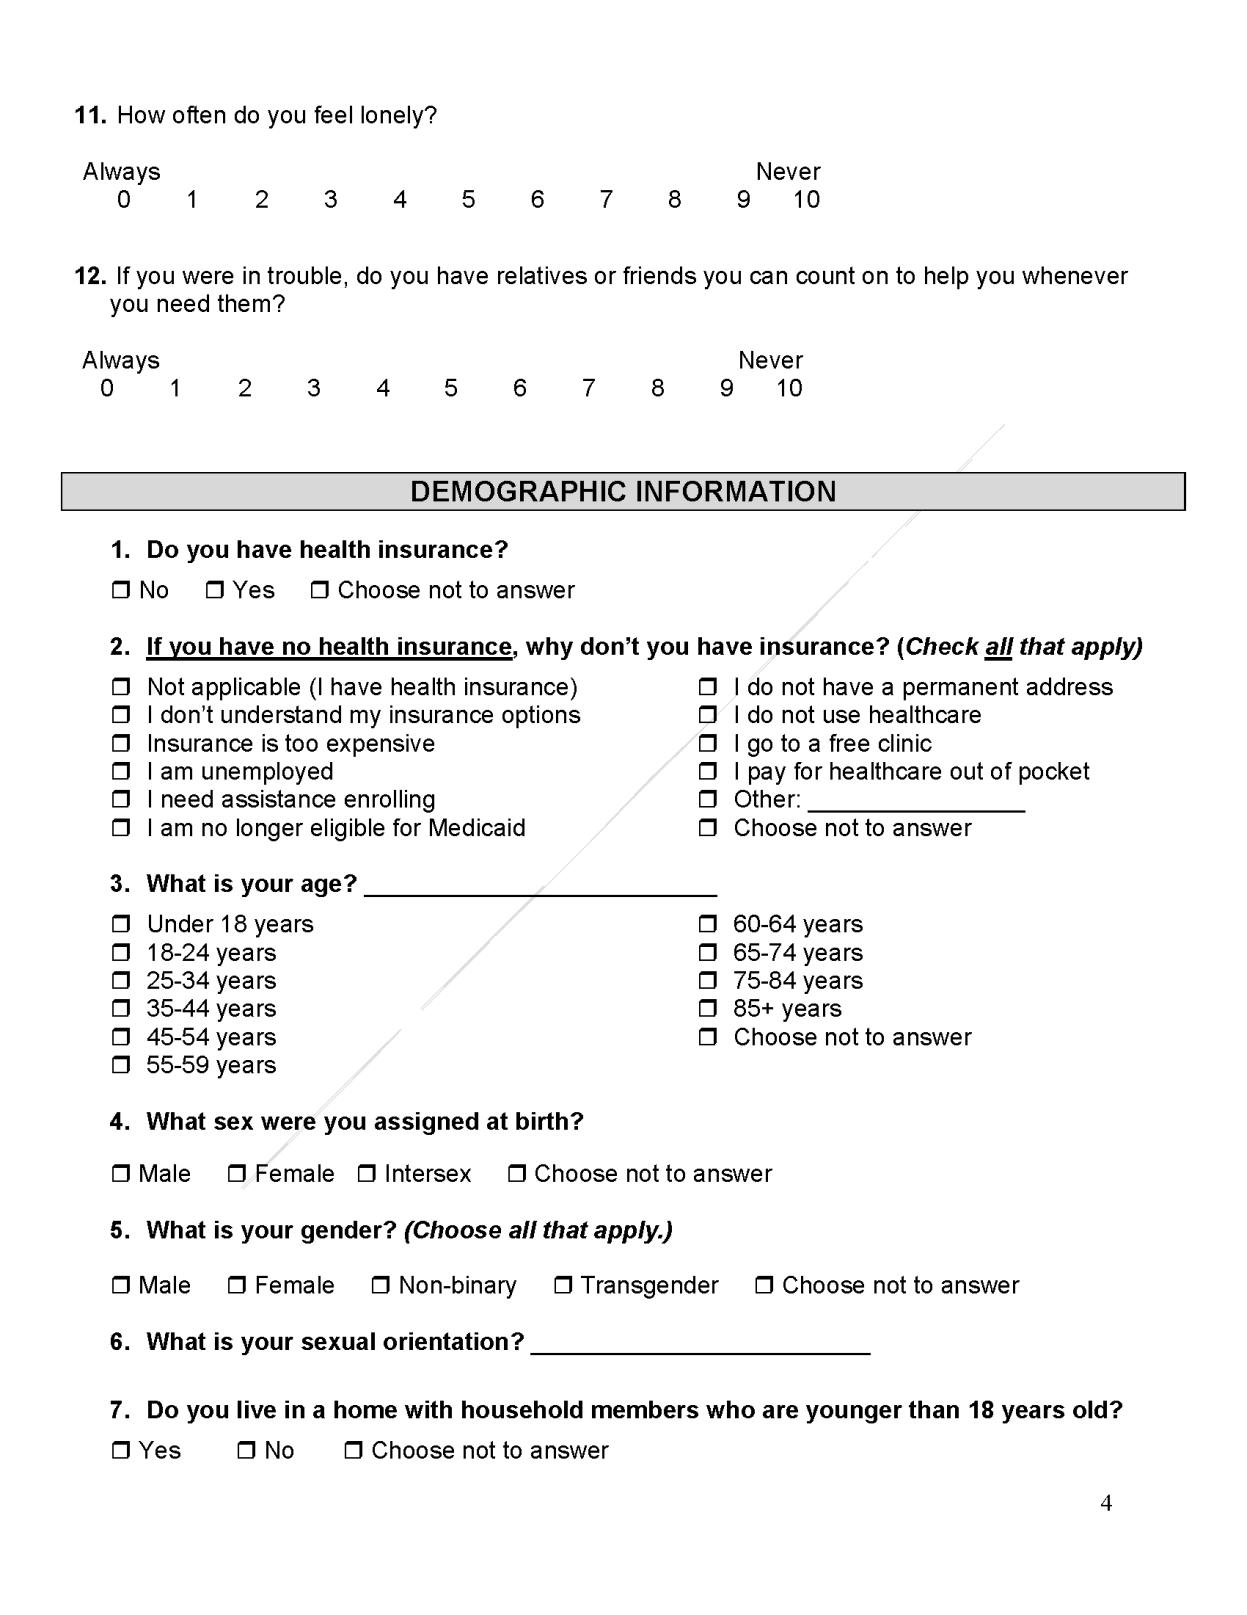
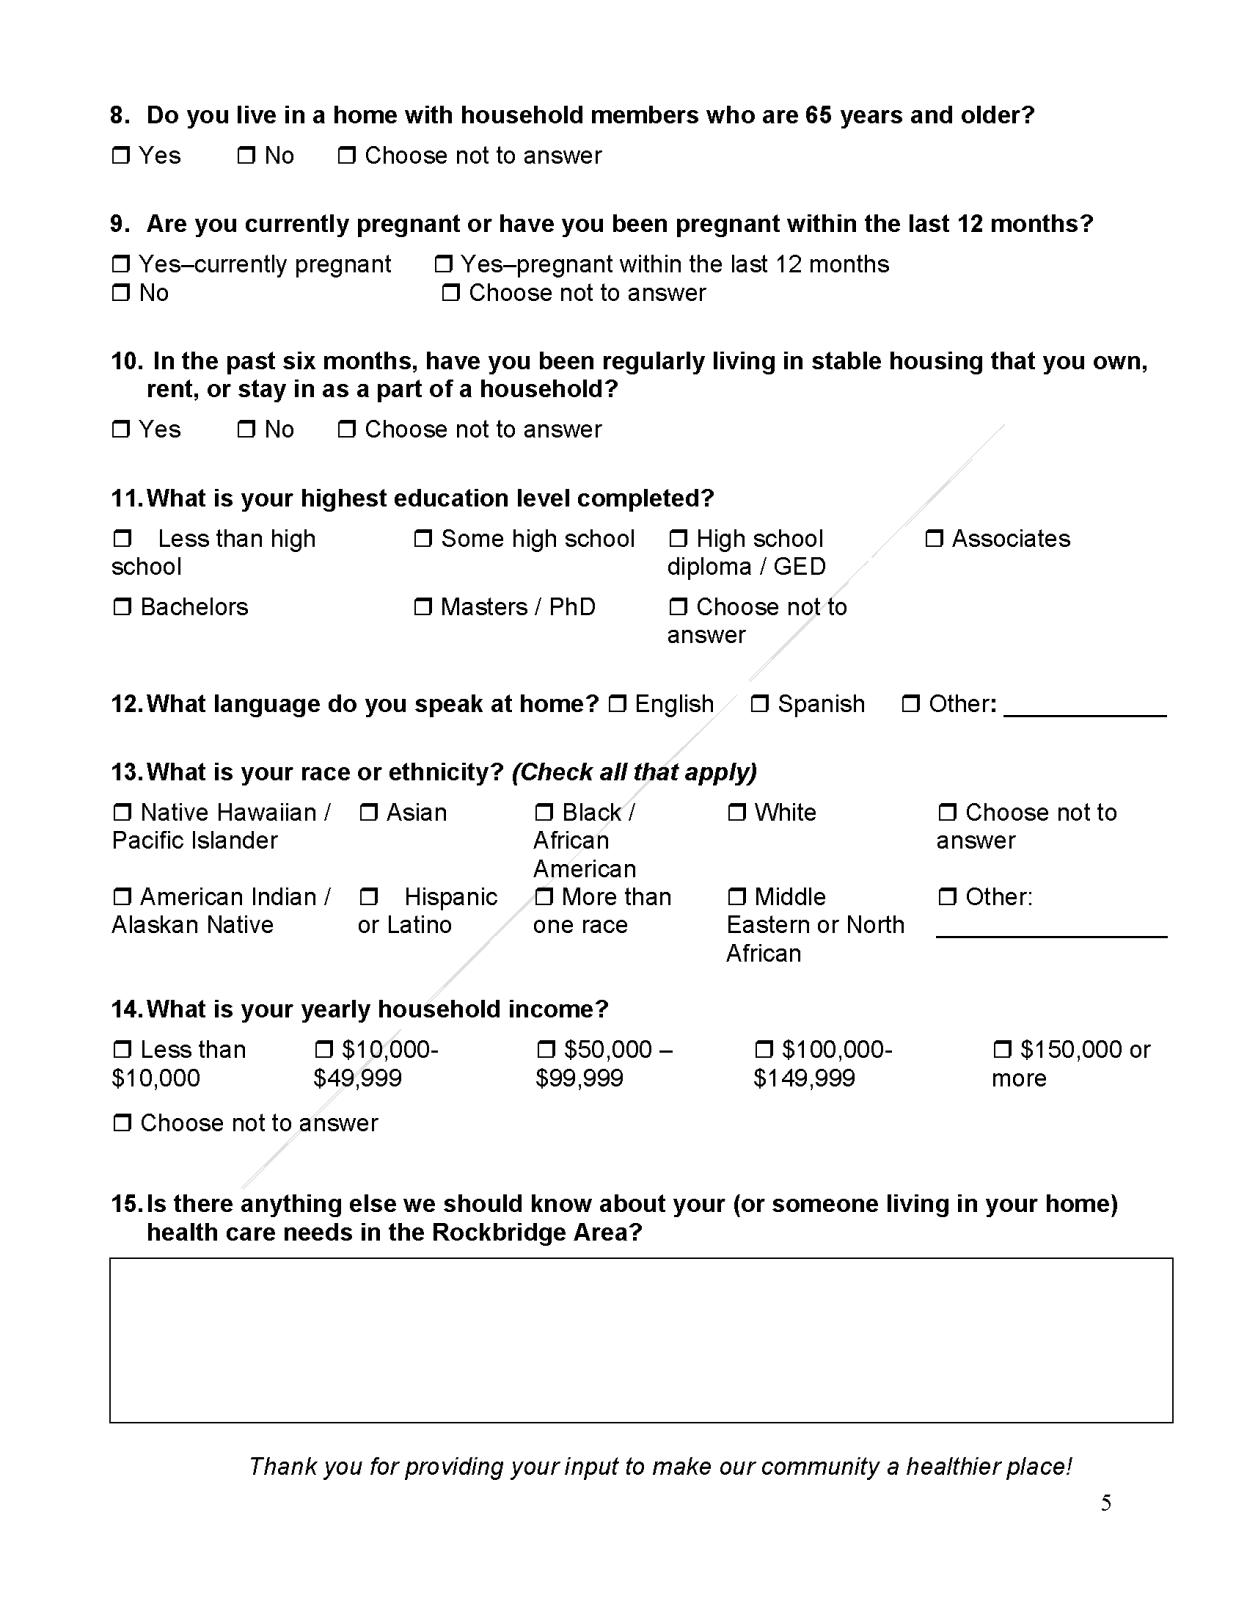
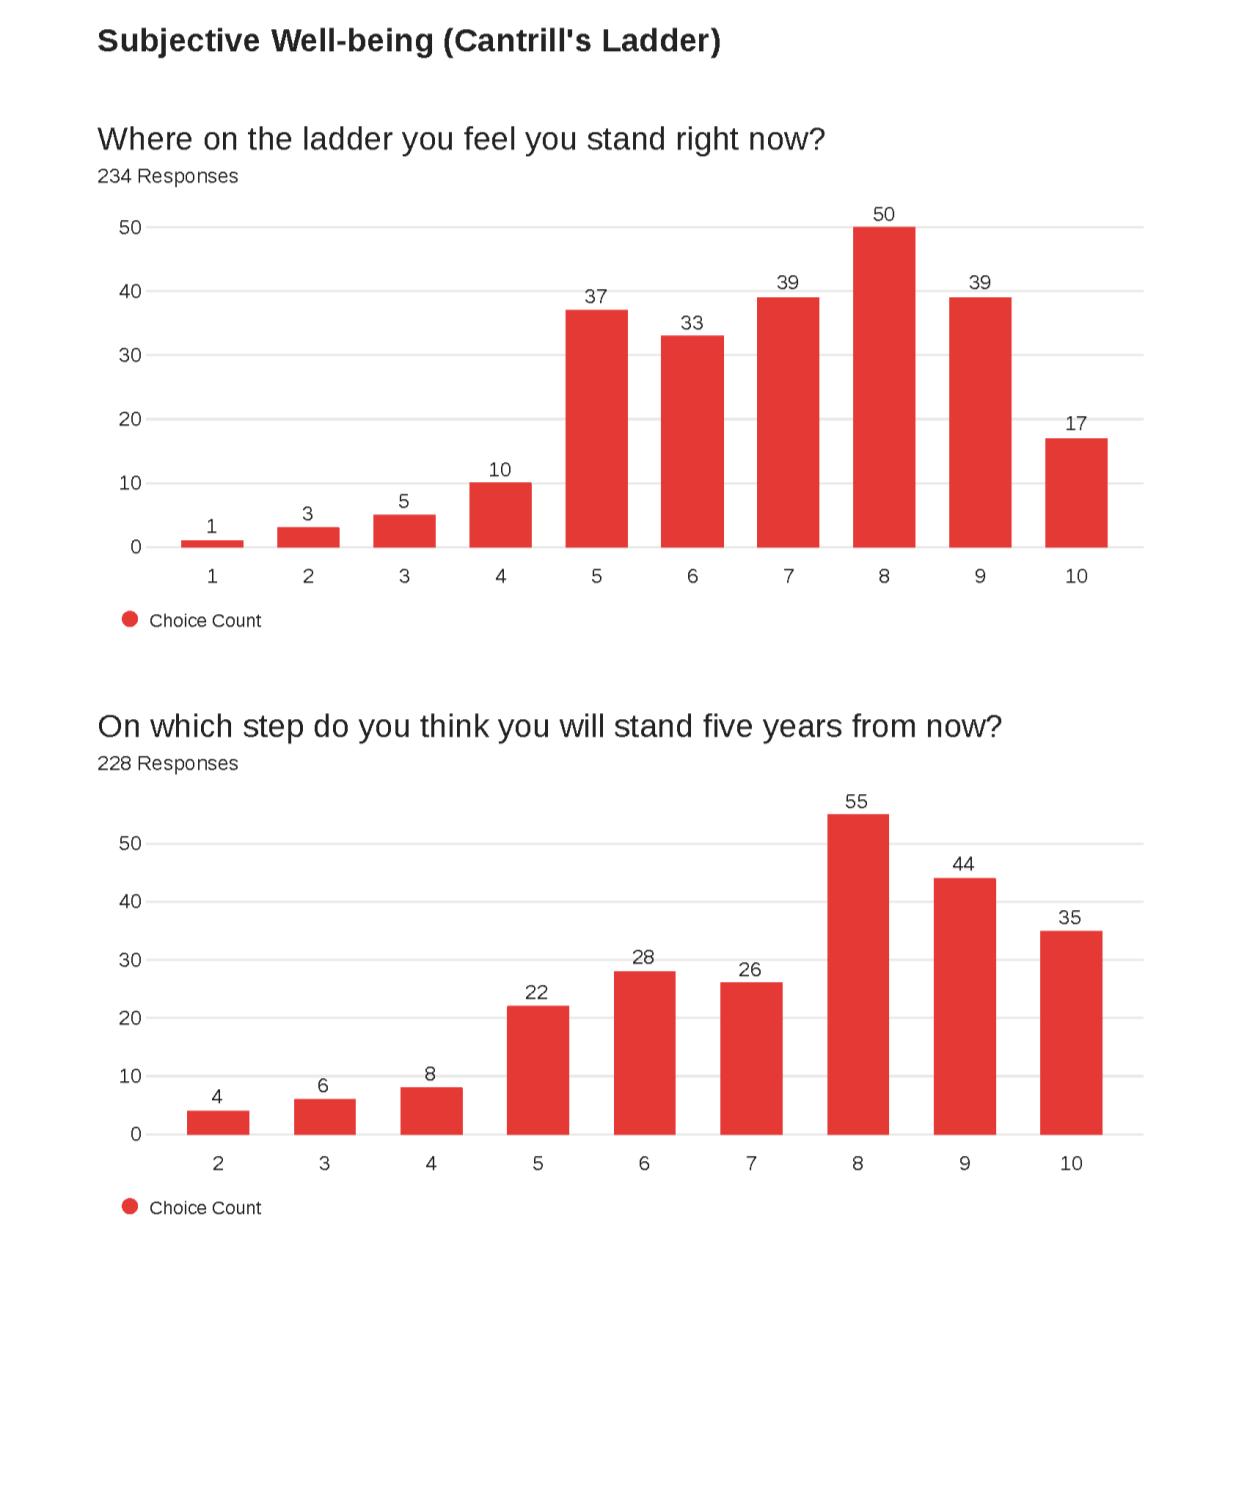
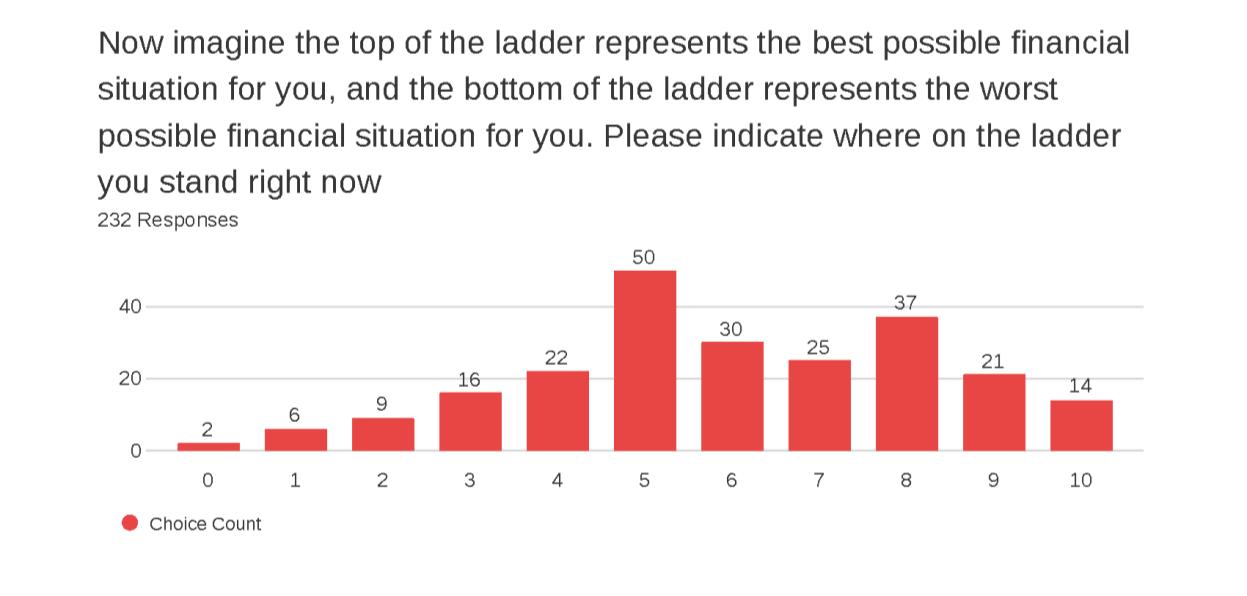
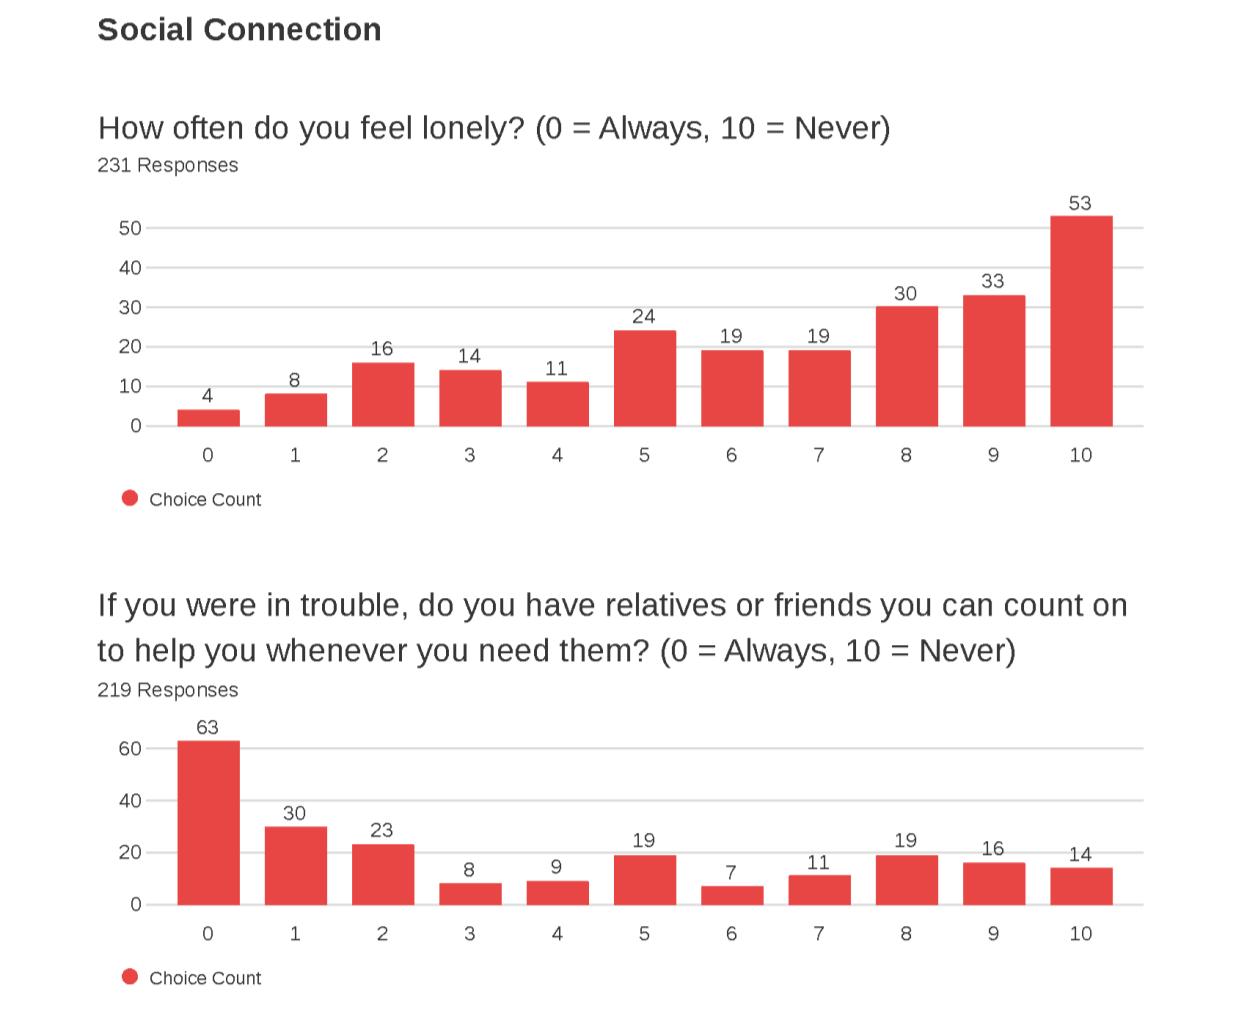
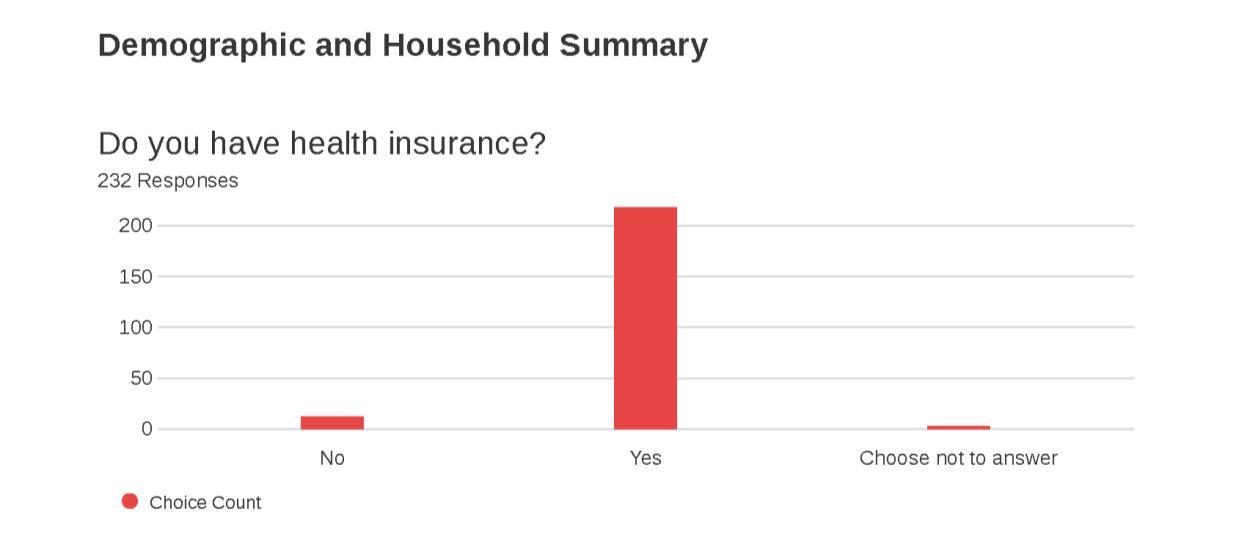
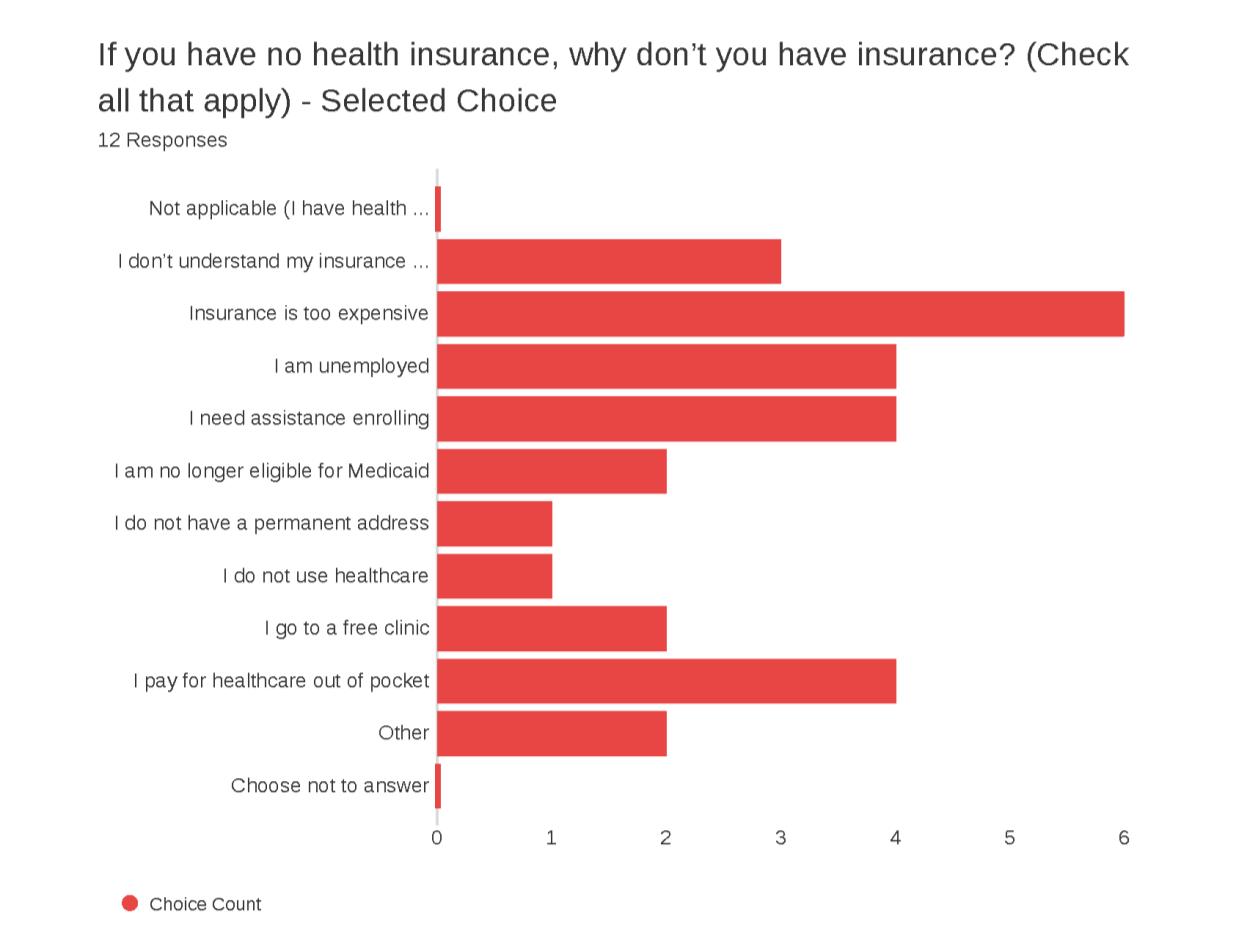
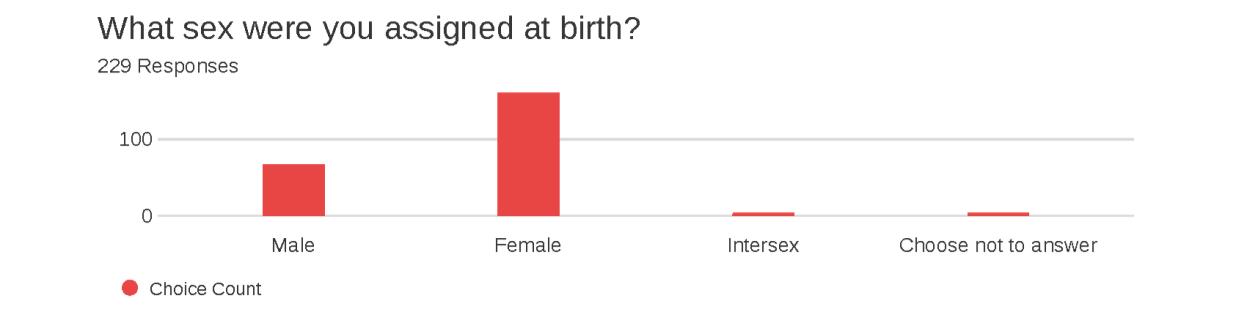
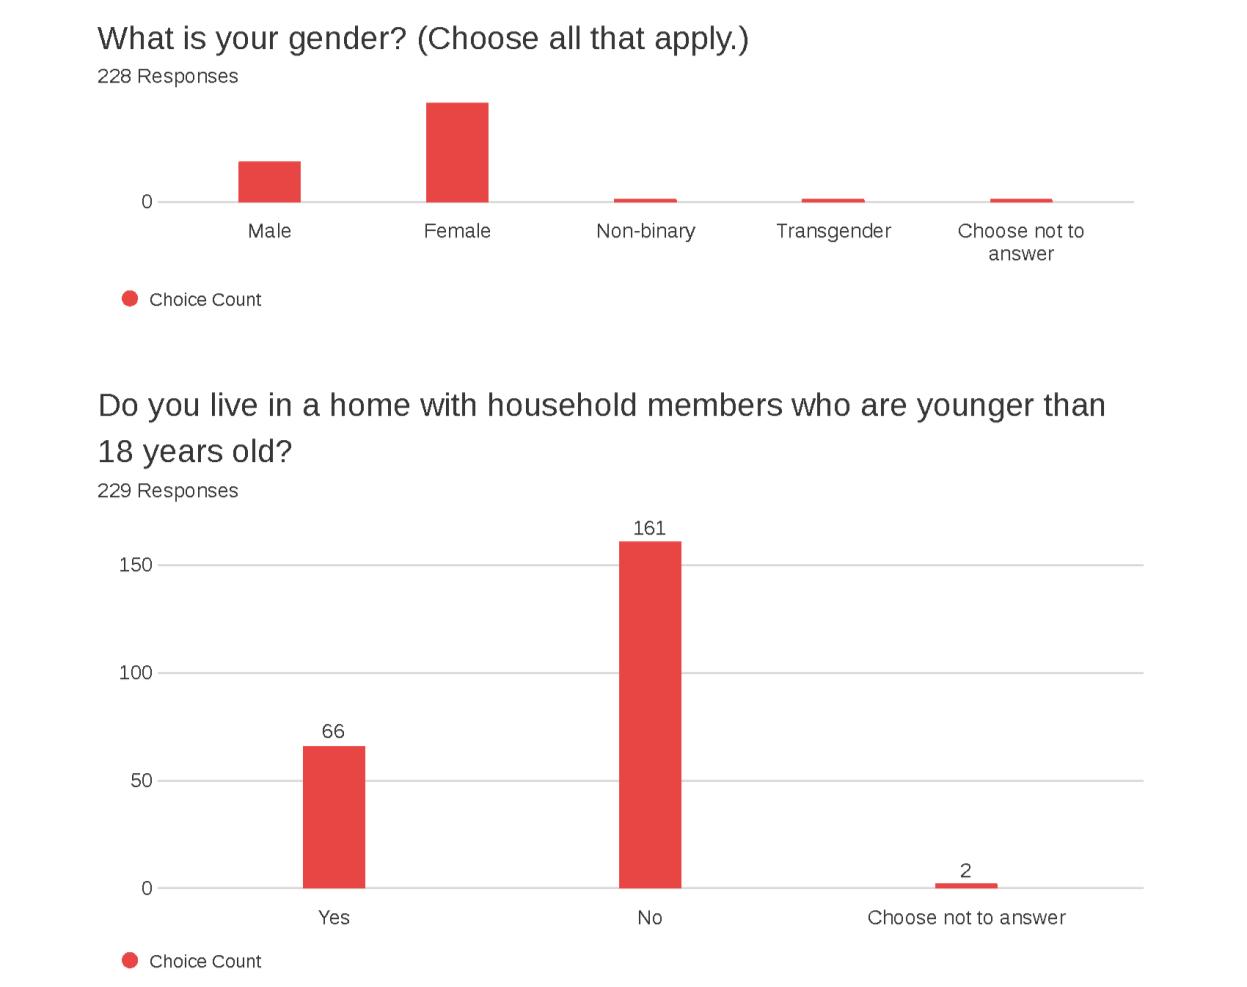
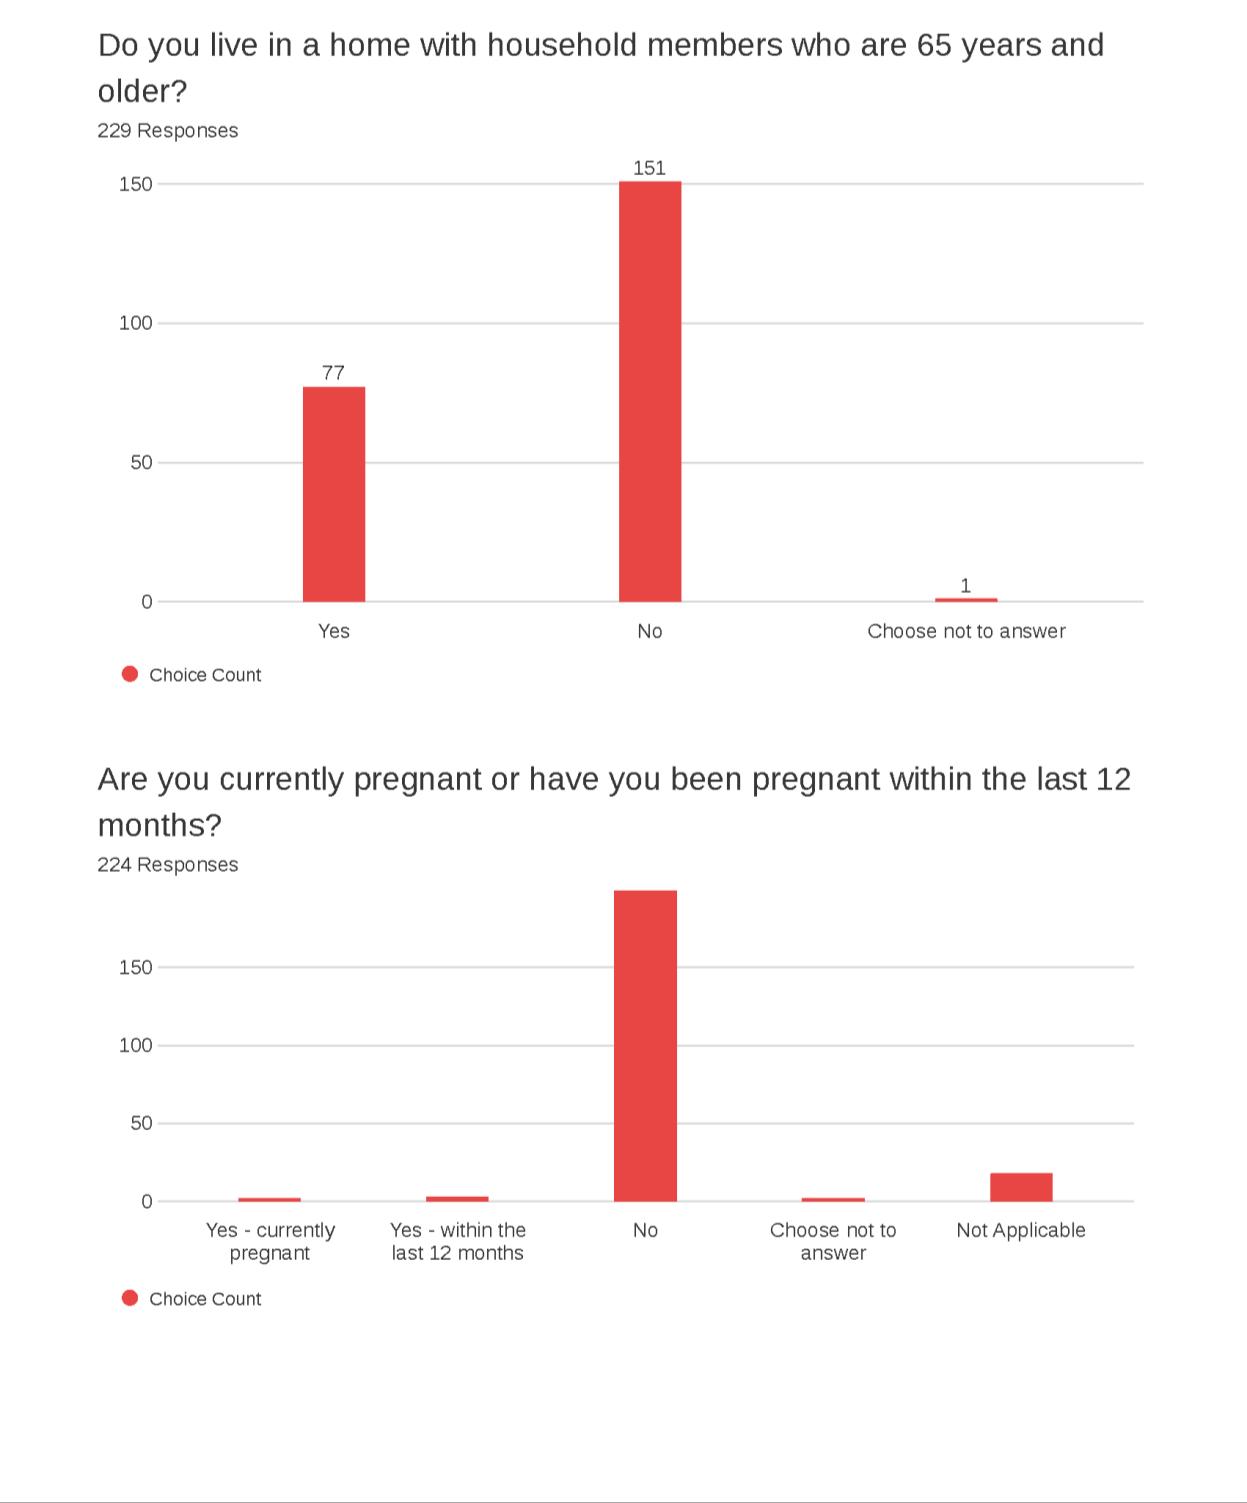
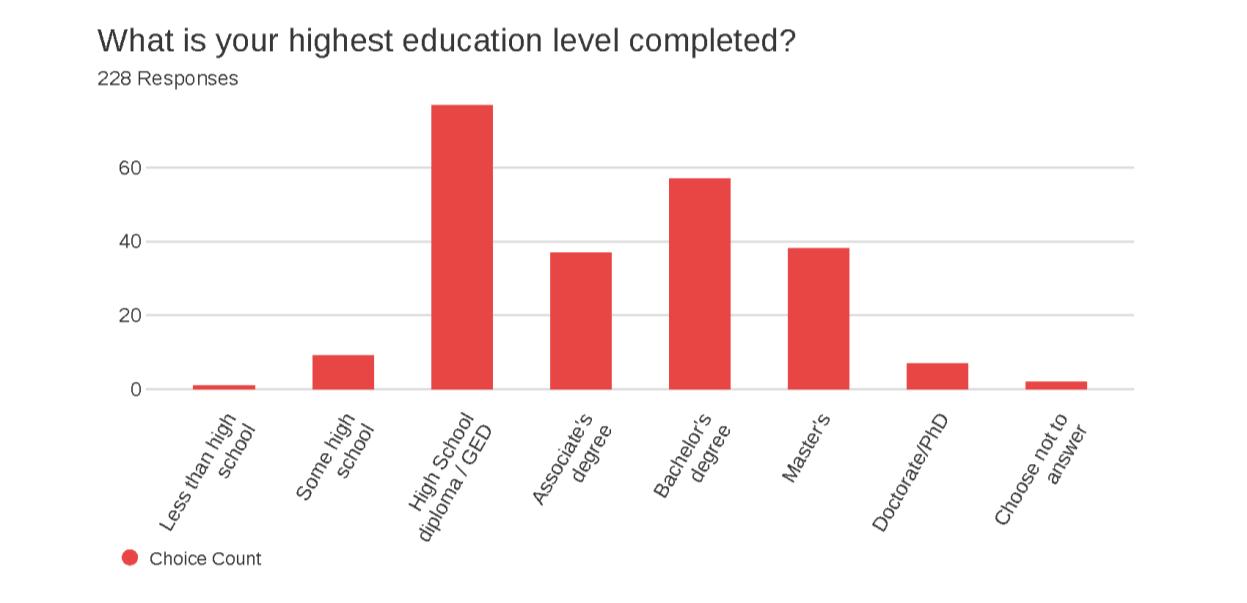
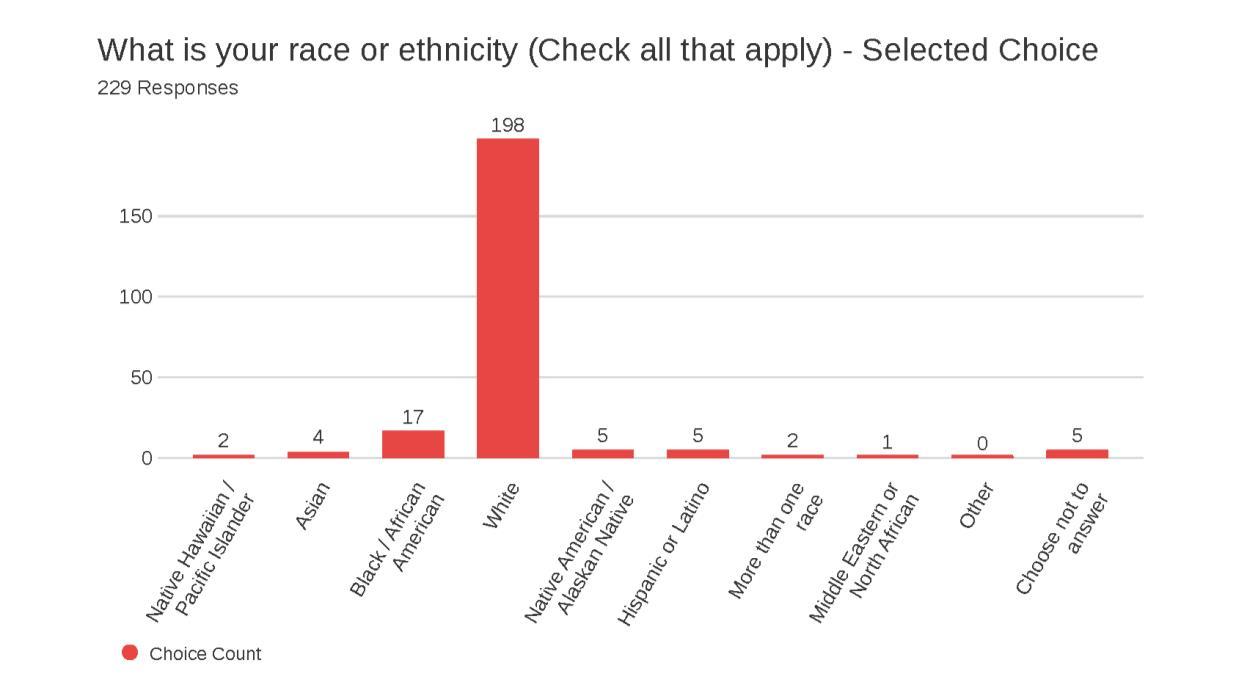
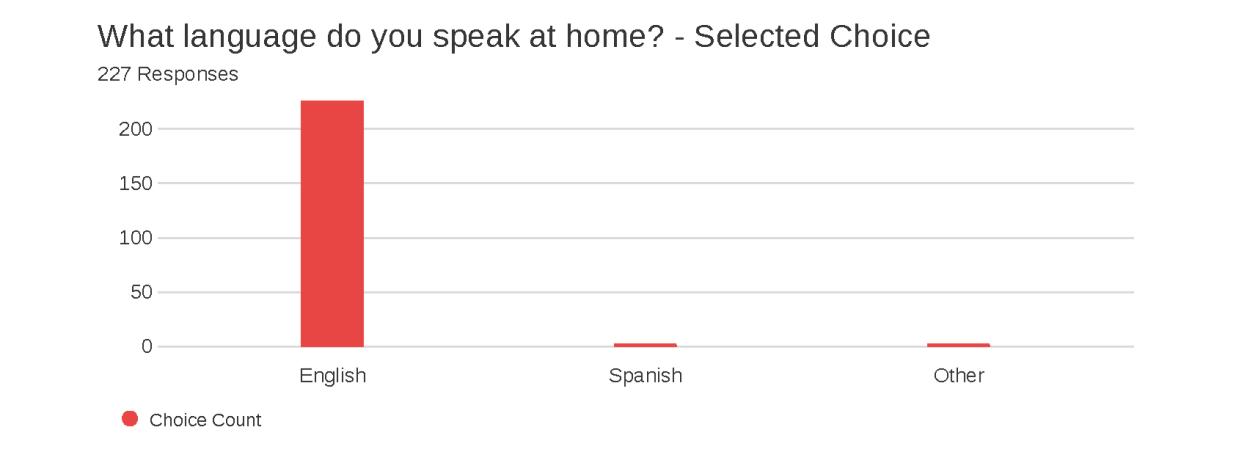
A 27-question survey instrument was utilized. It asked questions about access to care and other services, health status, community strengths, quality of life, subjective well-being and demographics (Appendix C: Community Health and Well-Being Survey). The survey instrument included commonly used questions and metrics from the following established community surveys:
• Cantril’s Ladder
• Community Themes and Strengths Assessments, National Association of County and City Health Officials, Mobilizing for Action through Planning and Partnerships
• Community Healthy Living Index, YMCA
• Behavioral Risk Factor Surveillance System, Centers for Disease Control and Prevention (CDC)
• National Health Interview Survey, CDC
• Youth Risk Behavior Surveillance System, CDC
• Martin County Community Health Assessment, Martin County, North Carolina
• Previous Rockbridge Area Community Health Surveys
The population of interest for the survey was Rockbridge Area residents 18 years of age and older. Surveys were distributed from October 2023 through December 2023. A drawing for a $50 grocery store gift card was offered as an incentive for those completing the survey.
The following subpopulations were especially targeted for sampling:
• Underserved/vulnerable populations disproportionately impacted by SDOH, including:
o Poverty
o Race/ethnicity
o Education
o Lack of insurance
A non-probability sample method was used, where respondents were not randomly selected. Although the survey was available to all residents living in the Rockbridge Area, oversampling of
the targeted subpopulations occurred through specific outreach efforts through community partners. Oversampling ensured that needs and assets specific to this subpopulation of interest were captured.
The survey instrument was available in both English and Spanish via the following methods:
• Qualtrics link and QR code
• Phone line (888-964-6620)
• Paper surveys (collected by volunteers and/or staff of partner agencies)
Outreach strategies for survey distribution included:
• Social media
• Flyers and posters distributed throughout the community with survey QR code, URL and phone line information
• Survey URL posted on partner agency websites
• Recruitment of participants on site at CHAT member organizations
In total, 281 surveys were collected and validated. Full survey results and validation methodology can be found in Appendix D
All responses were entered into Qualtrics by survey respondents or, in the case of surveys completed on paper, by Carilion staff. Surveys were analyzed and reported using Qualtrics and Microsoft Excel.
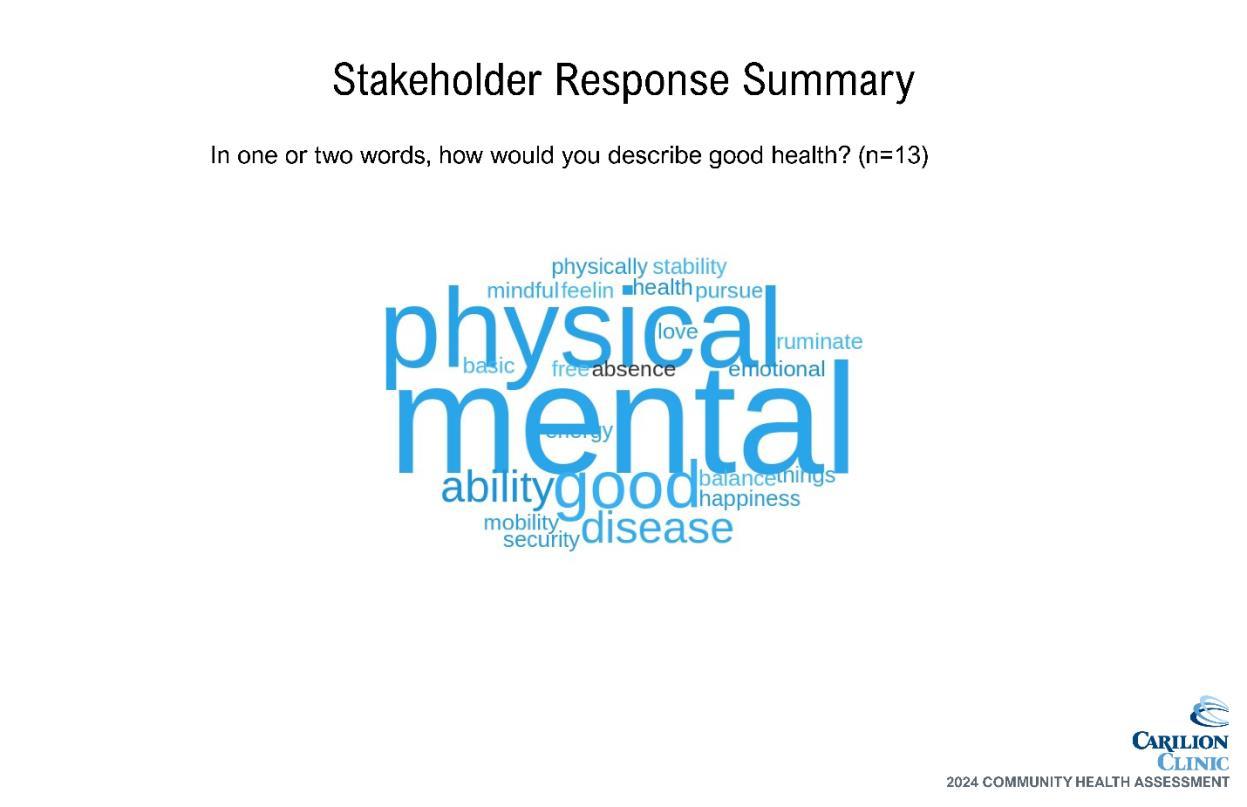
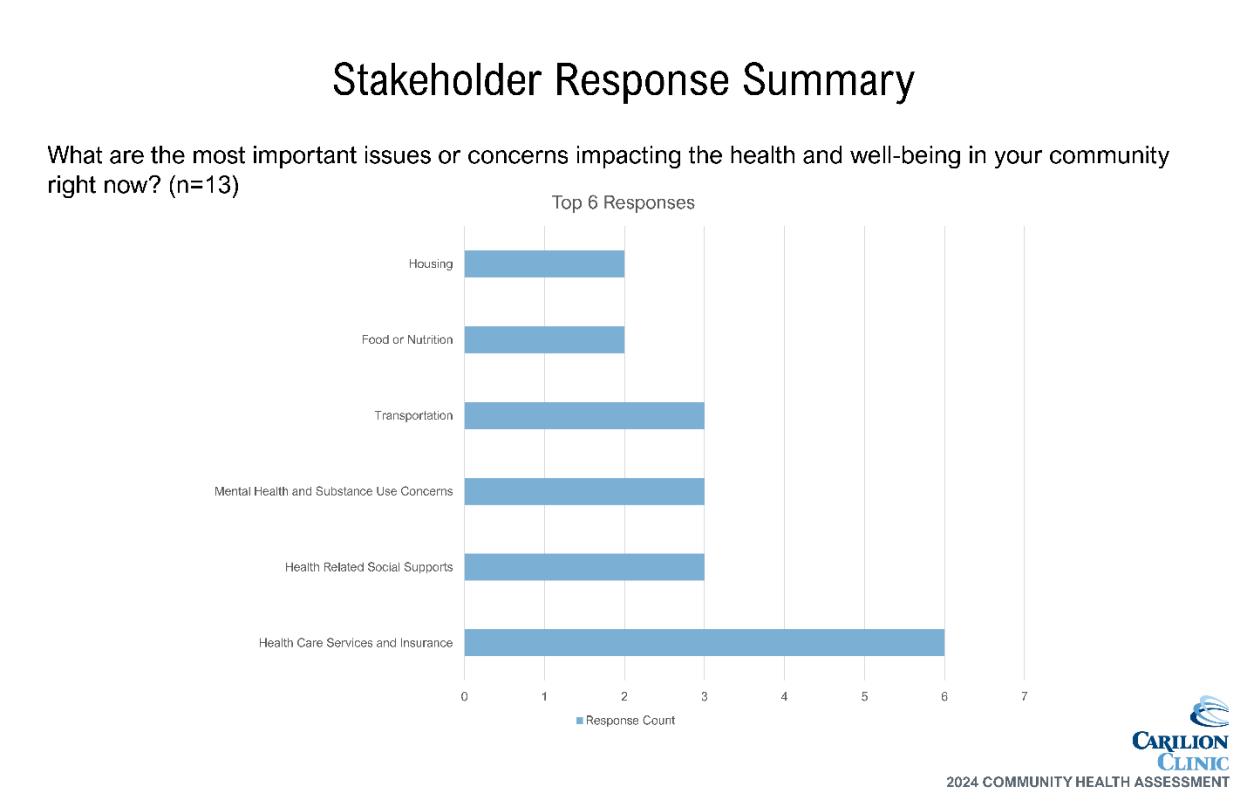
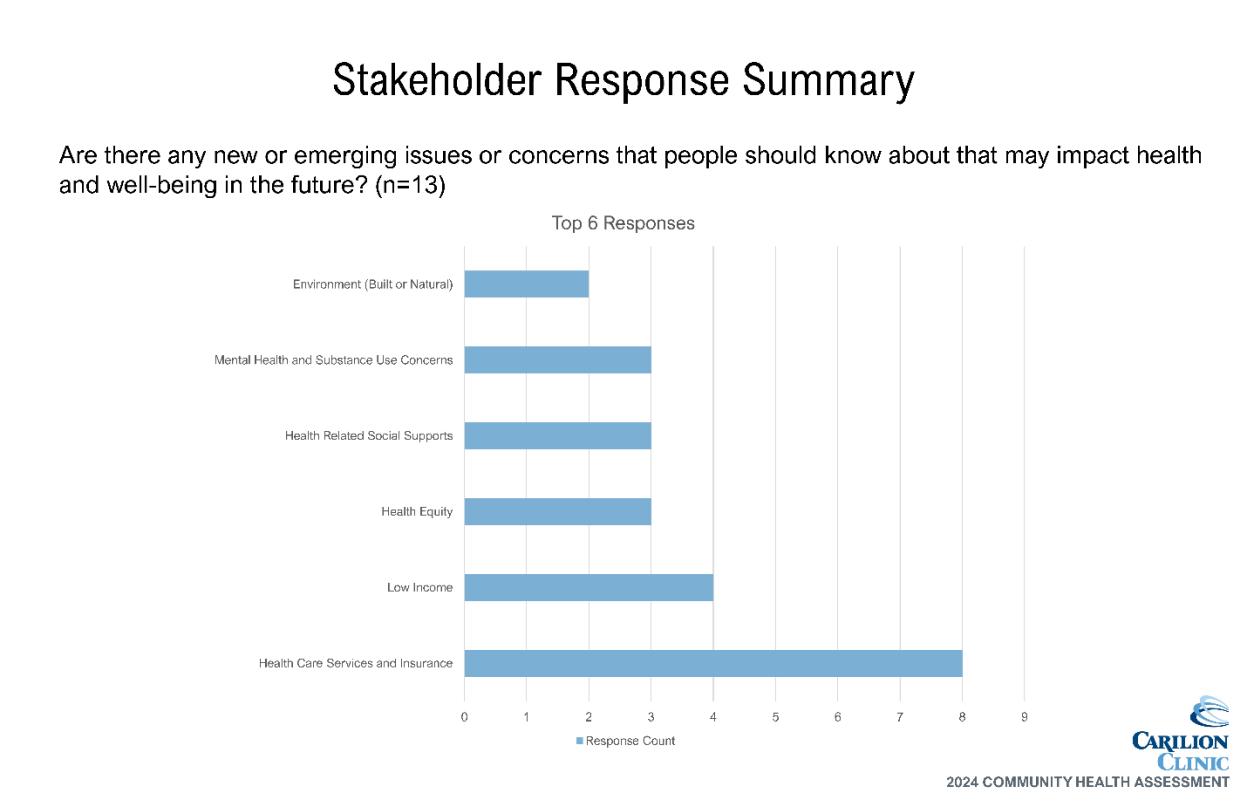
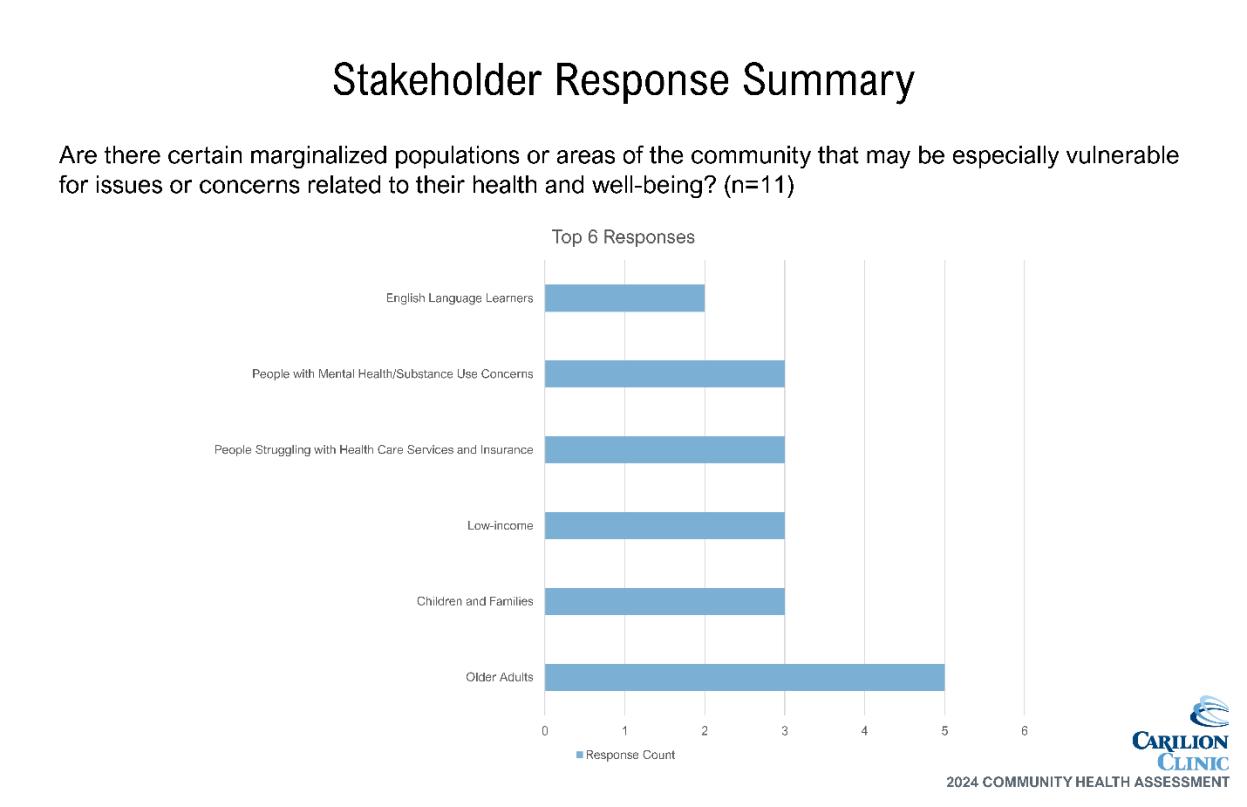
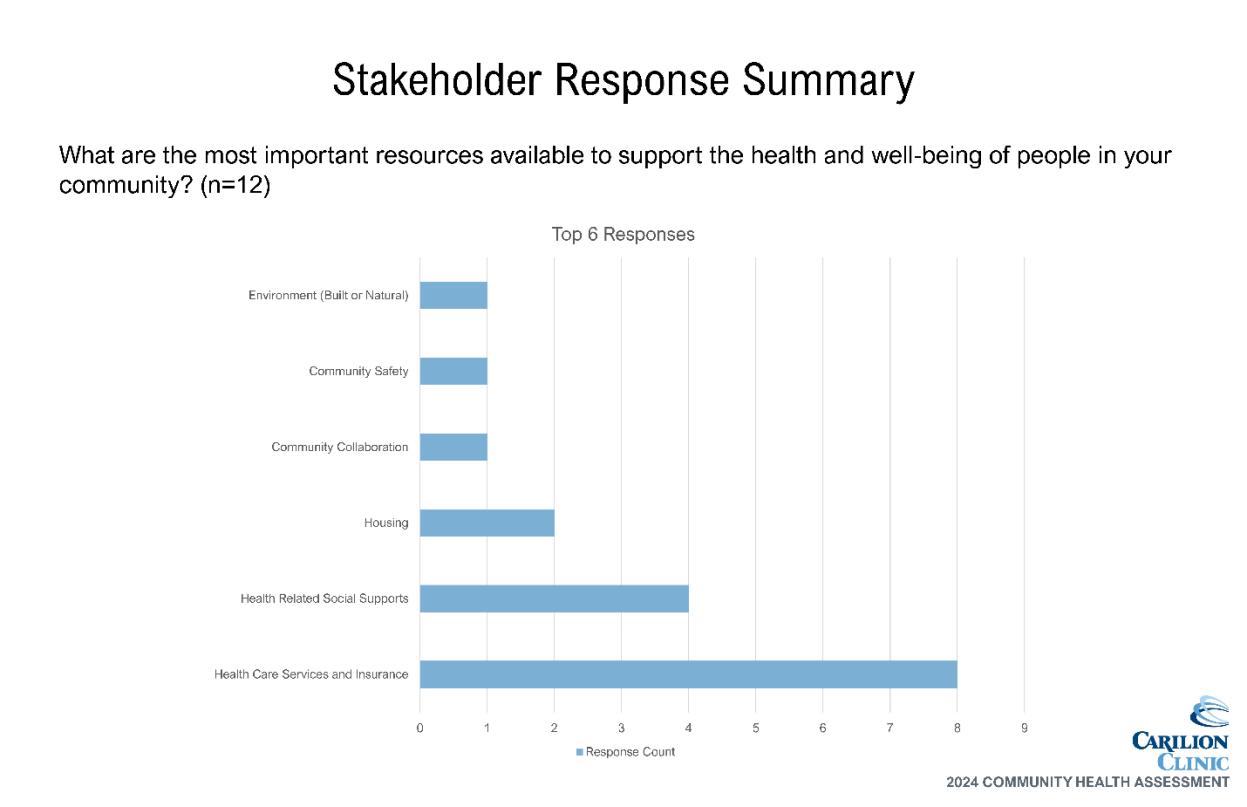
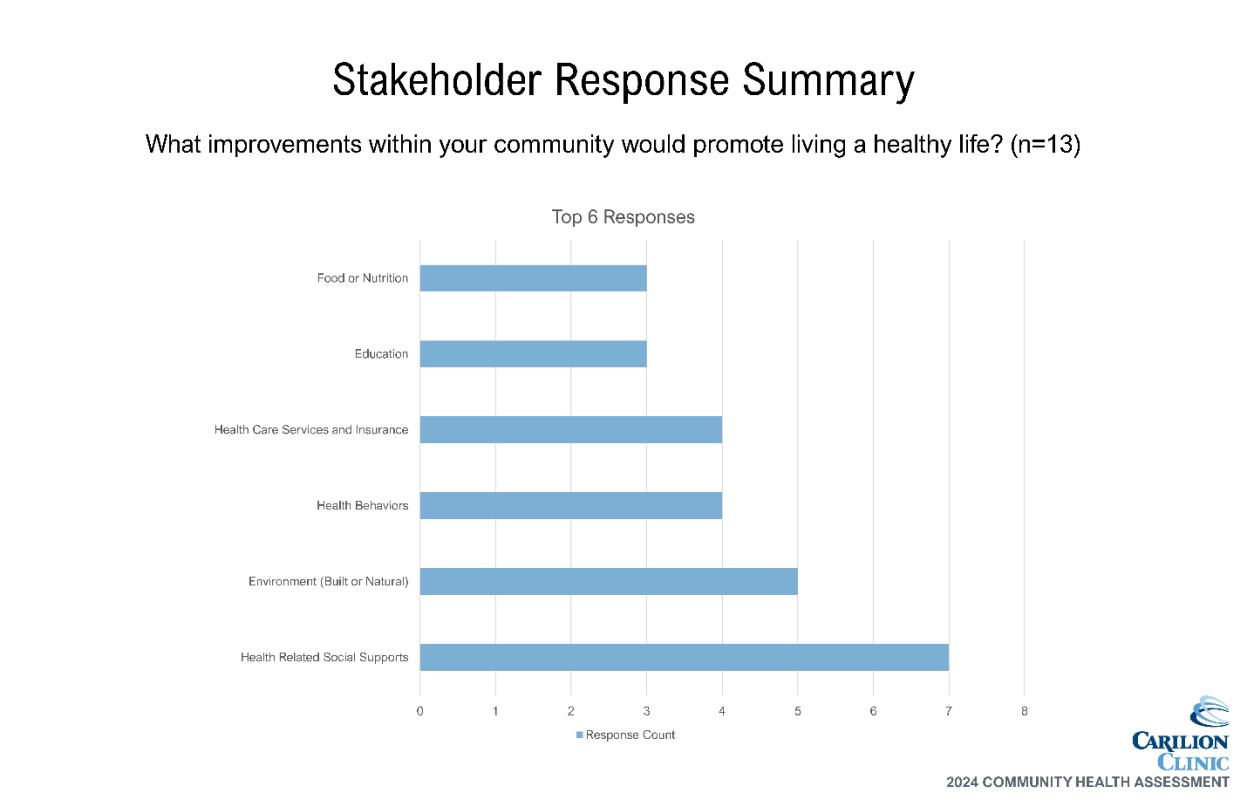
CHAT members were invited to provide an additional perspective on the needs and barriers to health faced by our community. Carilion staff from across the organization facilitated small group discussions. To quantify focus group data, CHAT members were asked to complete the Stakeholder Survey. A summary of the data can be found in Appendix E.
Community stakeholders, leaders and providers were encouraged to complete the Stakeholder Survey after participating in a listening session. The survey was also shared with leaders who may not have attended a listening session. The online survey was shared at the CHAT meetings and via email. Surveys were analyzed and reported using Qualtrics and Microsoft Excel.
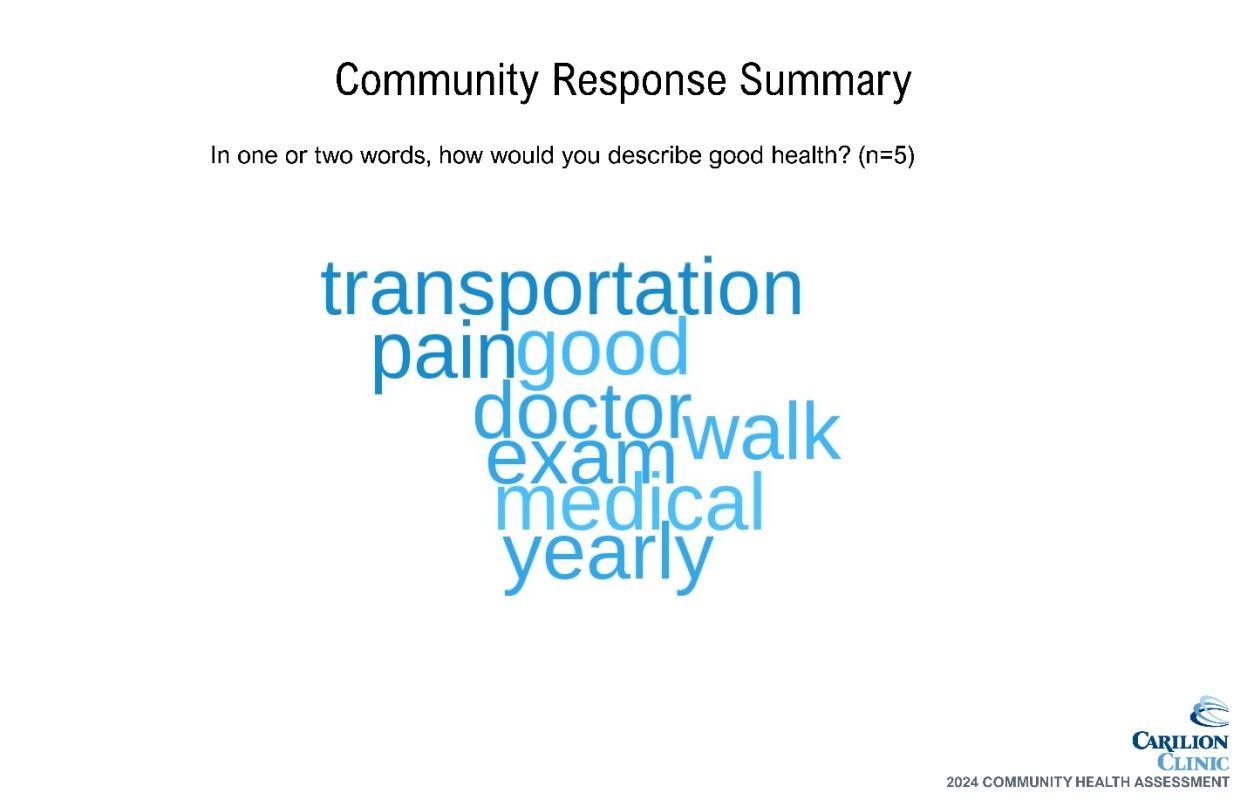
Community members were invited to participate in Community Listening Sessions to collect qualitative data to further understand health-related needs. A facilitated listening session was held with clients of the Rockbridge Area Health Center. A summary of the data can be found in Appendix E.
Secondary data came from two primary sources: SparkMap and the VDH Division of Population Health Data. SparkMap is a product from the University of Missouri that quickly and accurately aggregates data across geographies for 80+ indicators from publicly available sources such as the American Community Survey, County Health Rankings and the CDC. Secondary data analysis was provided through SparkMap’s tables, maps and visual diagrams depicting indicators that are better or worse than the state average, trends over time and comparisons across different population segments such as race and life cycle.
A team of VDH epidemiology staff provided and analyzed data from specific VDH departments a critical component of the data walk. Data provided included mortality due to specific chronic diseases, incidence rates of sexually transmitted infections, sociodemographic data, cancer rates and others. VDH also provided data broken down by gender and race/ethnicity for many health topics. All data shared with the CHAT for review can be found in the final section of this document, Appendix H
Table 5. Data Sharing Summary
Data Description
Community Demographic Data
Health Factors Data
Health Outcomes Data
Community Health & Well-Being Survey
Community Listening Sessions (CLS)
Stakeholder CLS
Secondary - CHAT 1a Presentation
Secondary
- CHAT 1a Presentation
- CHAT 2 Overview in Presentation - Data Packet Email prior to CHAT 3
Secondary - CHAT 1a Overview in Presentation
- CHAT 2 Data-Walk - Data Packet Email prior to CHAT 3
Primary - Data Packet Email prior to CHAT 3
Primary - Data Packet Email prior to CHAT 3
Primary - Data Packet Email prior to CHAT 3
Using their community knowledge, data collectively reviewed and additional data requested and shared, CHAT members were asked to complete an electronic survey to prioritize community health needs. Prioritization topics included specific health conditions or outcomes reflecting those conditions that contribute to morbidity and mortality in the service area. The prioritization survey matched the structure utilized during the data walk at CHAT Meeting 2. This resulted in the identification of 13 community health needs.
During CHAT Meeting 3, members completed a voting activity via Microsoft Teams polling to further refine the priority list. A discussion ensued to determine the final prioritized needs based on scope of issue, burden on community and feasibility to address at the community level based on CHAT member perspectives and perceptions Appendix F summarizes the prioritization activity, including the results of each exercise component.
The 2021 RACHA and the subsequent Implementation Strategy were posted publicly though multiple electronic channels and shared widely by community partners. An email address was provided for submission of written comments, but none were received for consideration in the identification and prioritization of health needs in the 2024 RACHA.
The final CHAT meeting served as a springboard into both hospital and community action planning. The prioritized needs were again reviewed and a two-part activity ensued. CHAT members identified key drivers of the prioritized health outcomes/conditions using the Robert Wood Johnson County Health Rankings framework as reference. Following the identification of drivers, an impact and feasibility analysis was completed in small groups to help identify leading strategies for community change.
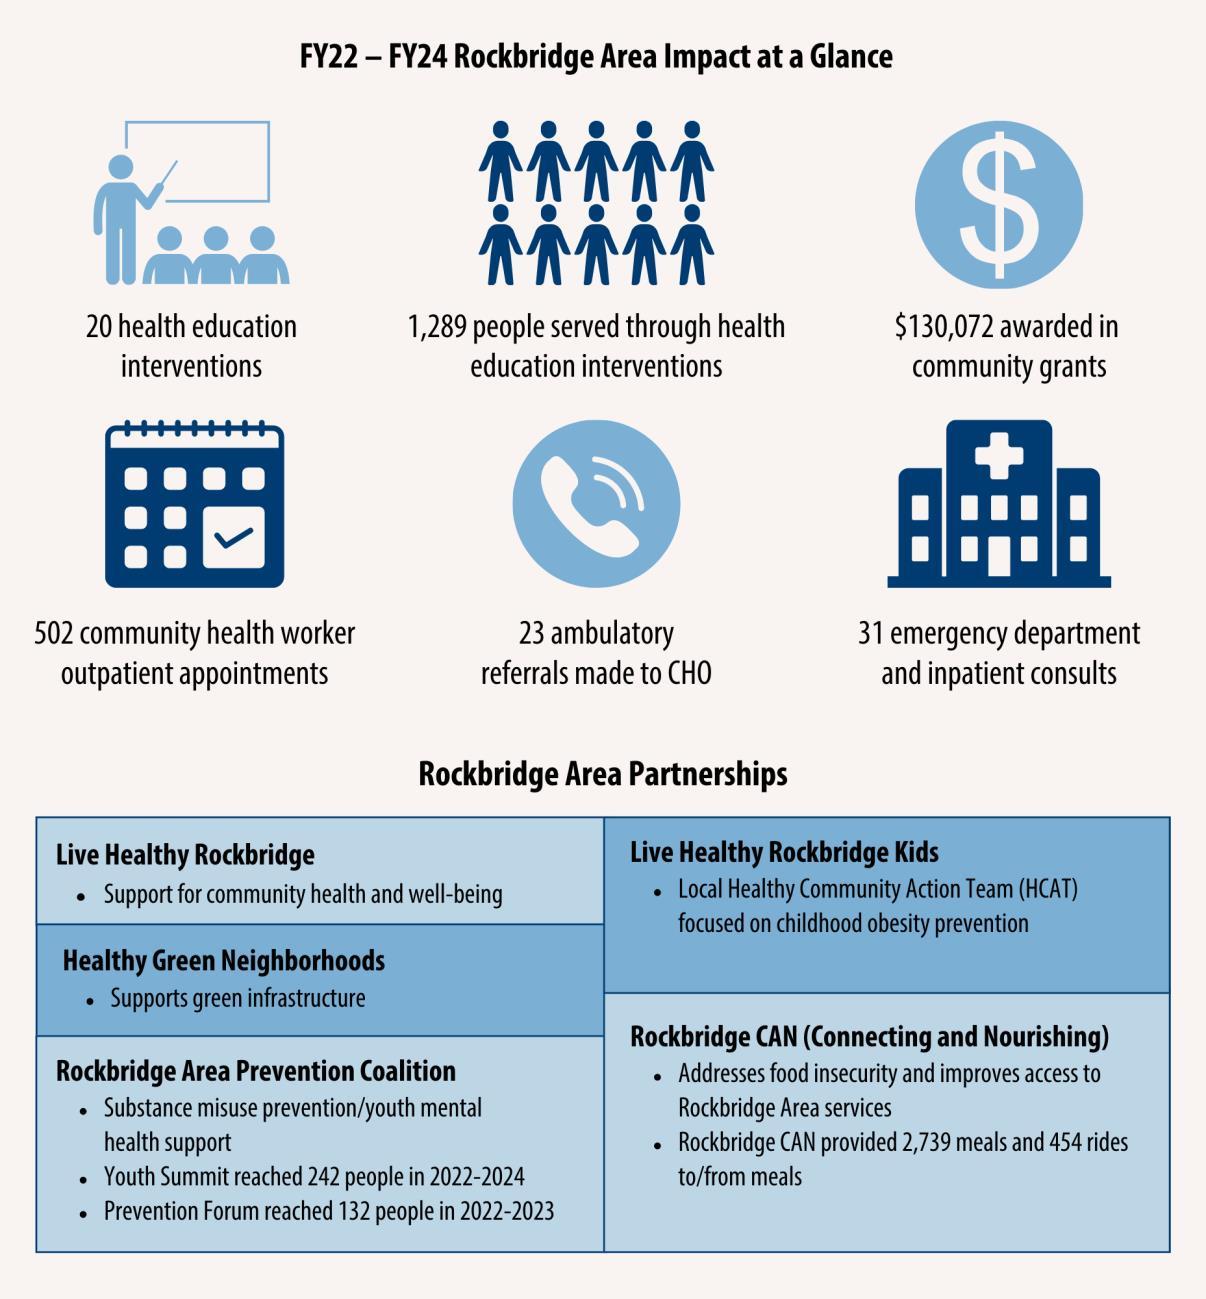
The prioritized needs established in the 2021 RACHA fell into four categories: mental health, socioeconomic factors, health behaviors and COVID-19. Key strategies included health education, grant funding to address SDOH, a community health worker intervention and support for the efforts of community partners in addressing community needs, both directly and indirectly. Below is a snapshot of outcomes from these efforts through June 30, 2024.
Carilion is part of a growing movement of health system stewards committed to unlocking our community’s potential to thrive. We, along with key partners, strive to identify and address health and socioeconomic factors that impact our communities’ health and well-being. We know that where you live is an important contributing factor of health status and outcomes. We are committed to advancing a culture of health where policies, systems, education, research and resources align for optimal health status.
Our mission calls for us to meaningfully address health inequities and disparities. Equity is a key lens for the CHA process, guiding our actions as we seek to understand community health needs. As we move forward into developing community heath improvement strategies, we will remain focused on identifying and serving those who need it most, seeking to broaden the potential for everyone across our communities to thrive.
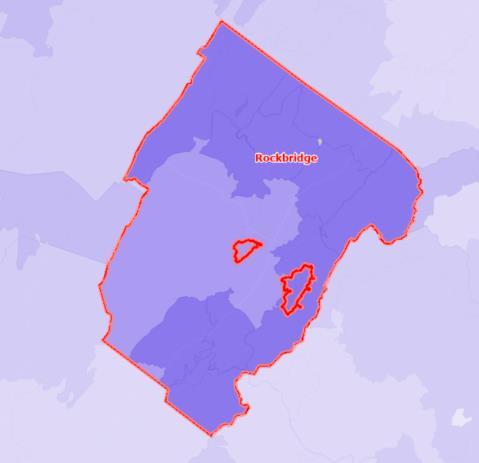
The Area Deprivation Index (ADI), a tool developed by the University of Wisconsin-Madison, sheds light on what are considered disadvantaged areas of the community based on census block groups (neighborhoods).5 This granular data helps emphasize the importance of conditions that shape our daily lives. The image below shows the extreme variation seen across the service area in ADI scores and illustrates challenges experienced in the most rural locations. Data used in creating the index includes factors for income, education, employment and housing quality some of the key social determinant factors that influence health outcomes.
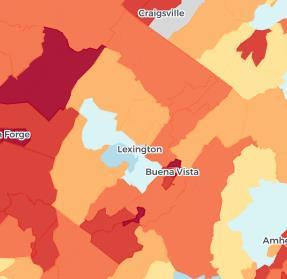
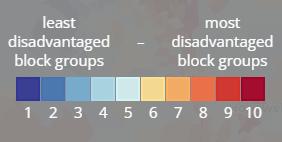
5 https://www.neighborhoodatlas.medicine.wisc.edu/
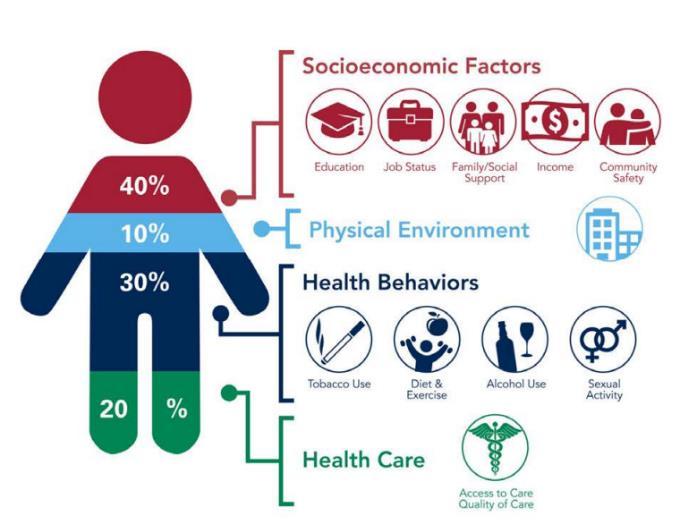
As we work to improve health equity across our region, our guiding principles include improving access to care and addressing SDOH This assessment focuses on those principles in the context of specific prioritized health outcomes To expect a shift in health outcomes, we must focus on improving the underlying factors that lead to them seen in the figure below in a coordinated manner. We will be addressing specific SDOH needs as aligned with the CHA focus areas.

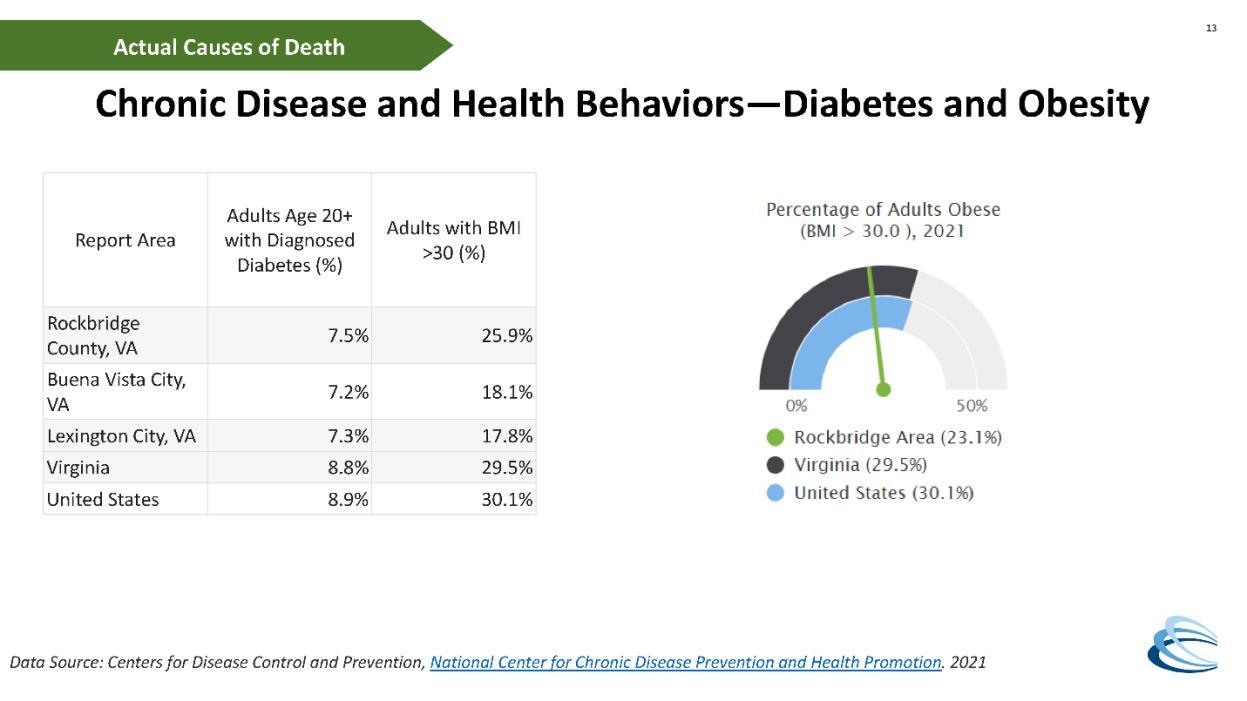
Our prioritization process resulted in the elevation of three specific chronic diseases for focus: overweight/obesity, heart disease and hypertension. The following data indicates potential areas of opportunity.
Data shows need
• Residents of the service area have a higher-than-average occurrence of:
o Physically unhealthy days
o Obesity
o Heart disease
Community indicates need
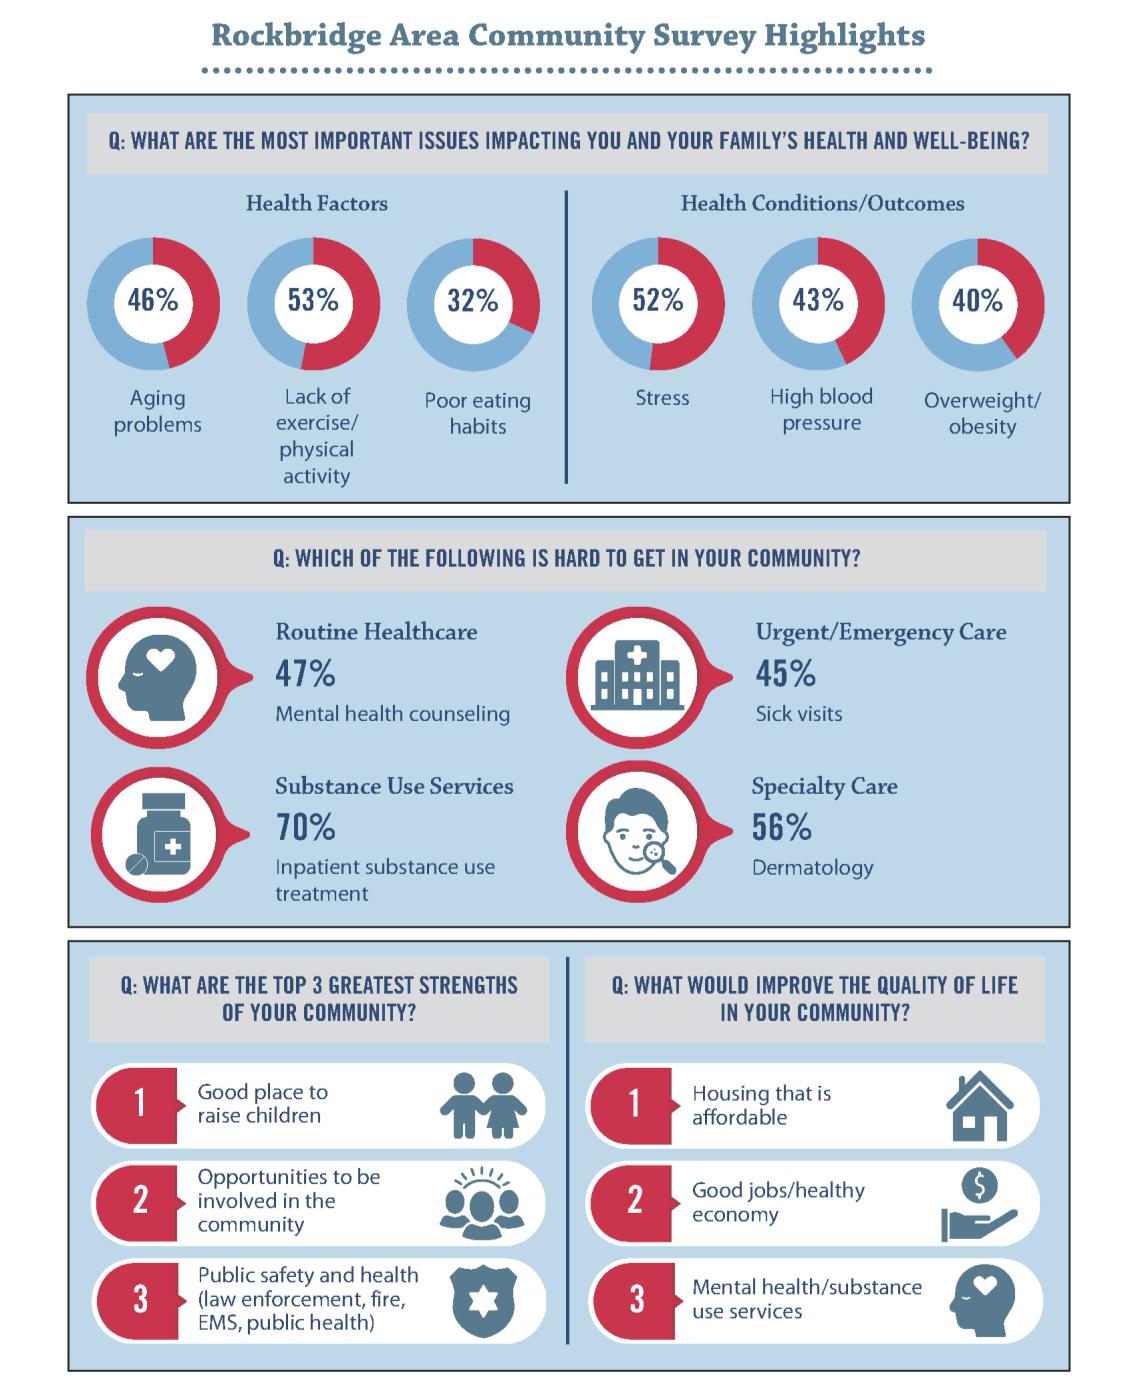
• Concern for overweight/obesity and high blood pressure indicated through community survey
• Stress, a contributing factor of chronic disease, was also identified as a concern through the community survey
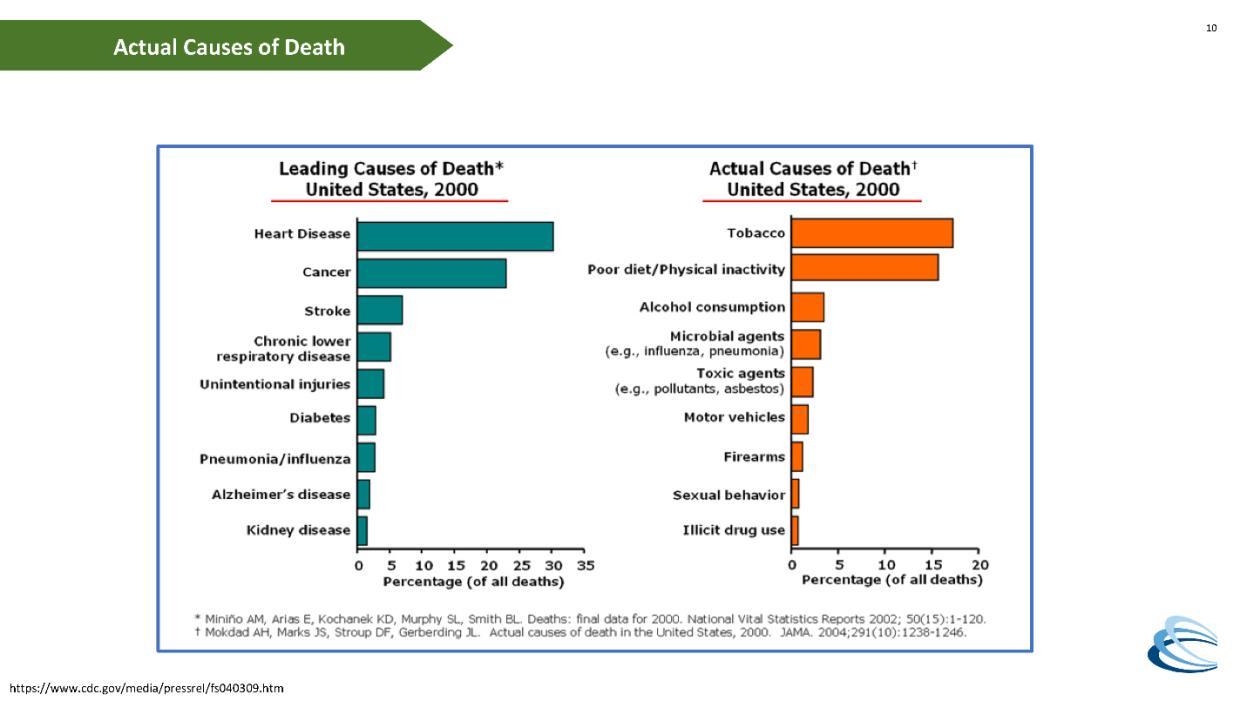
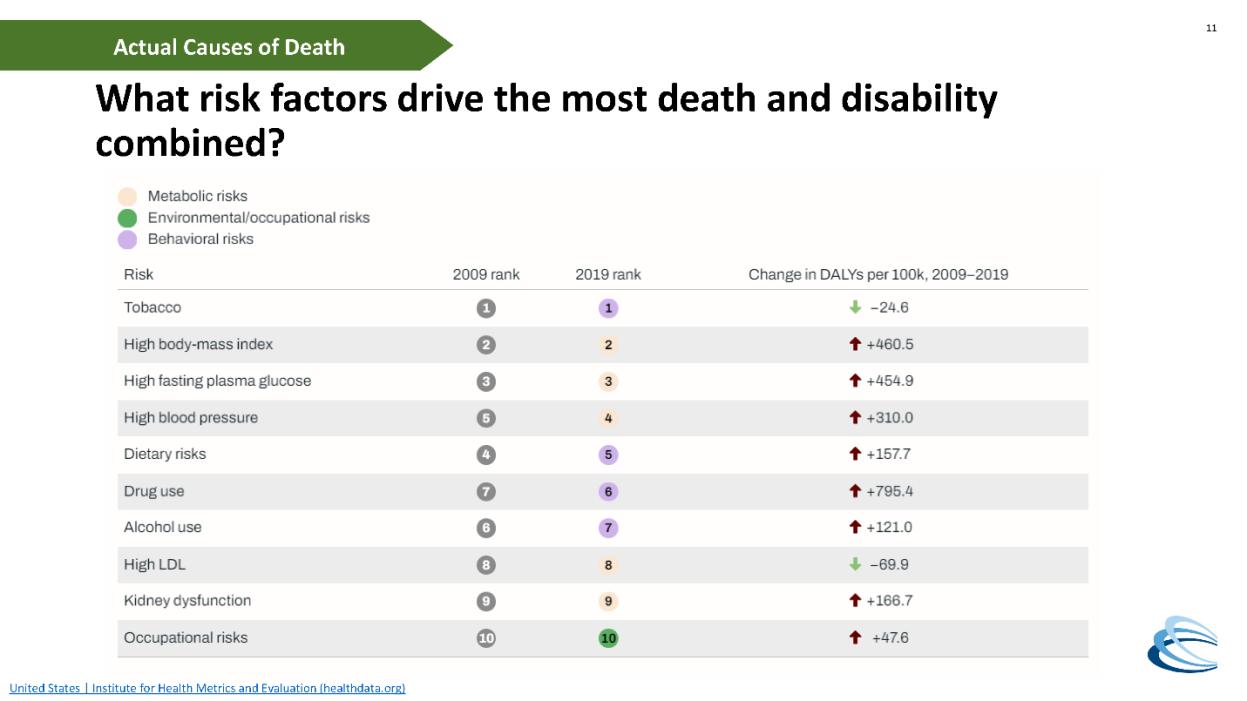
According to the Institute for Health Metrics and Evaluation (IHME), high body-mass index (BMI), high blood pressure and dietary risks are within the top 10 risks driving death and disability. In other words, these are some of the key impacts on overall health, well-being and life expectancy.6 Additionally, chronic diseases are a leading driver of health care costs.7
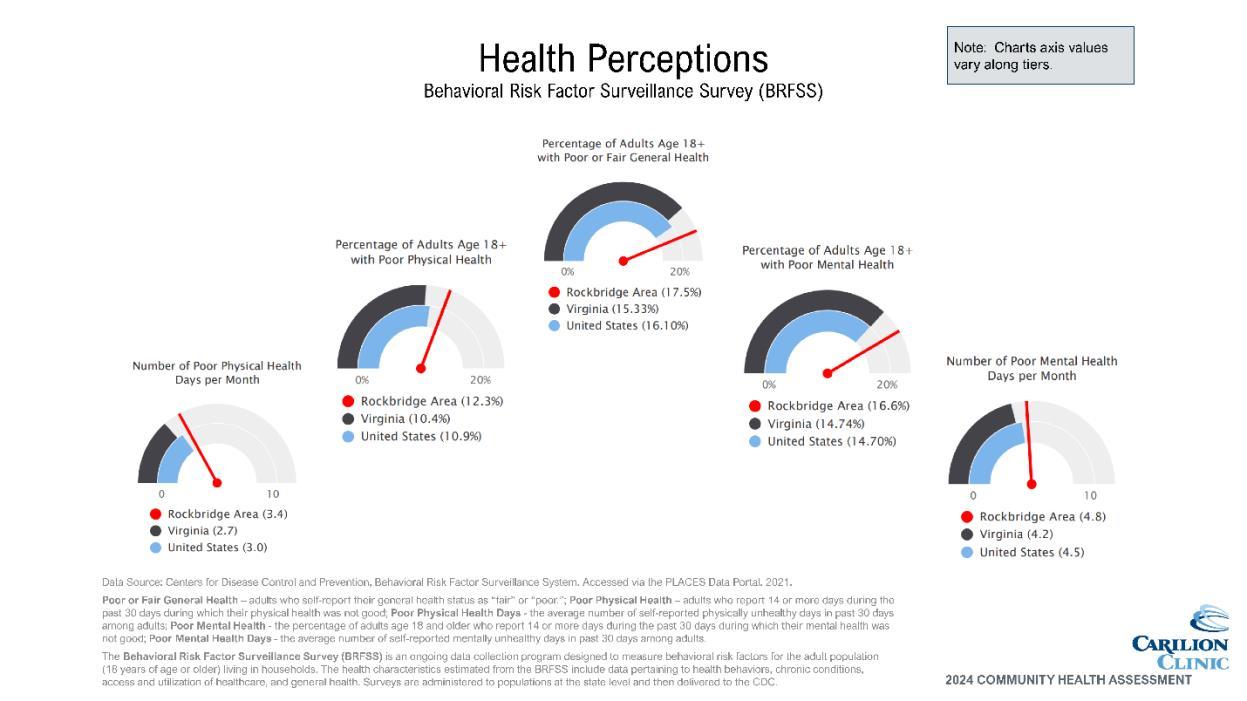
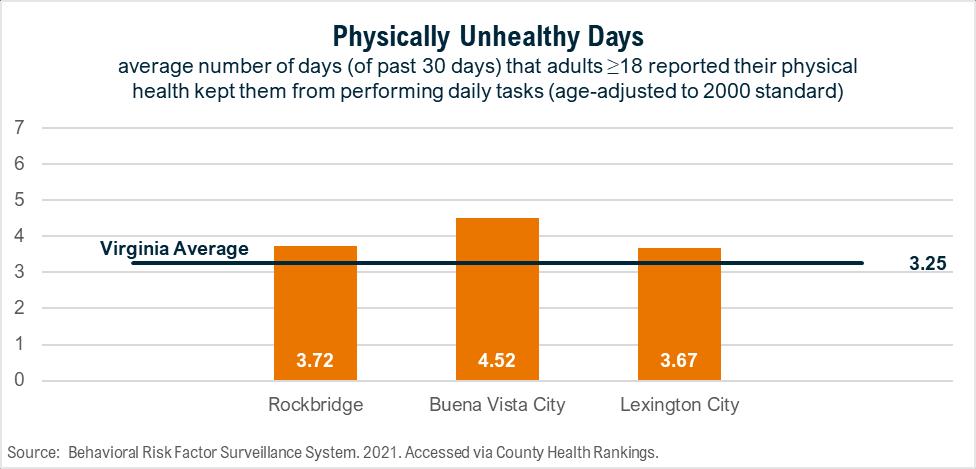
Data below shows physically unhealthy days and obesity across all service area localities as reported by the CDC’s Behavioral Risk Factor Surveillance System (BRFSS). In both metrics, Buena Vista leads the service area as the highest.
Figure 3. Physically Unhealthy Days
6 United States | Institute for Health Metrics and Evaluation (healthdata.org)
7 https://www.cdc.gov/chronic-disease/about/index.html
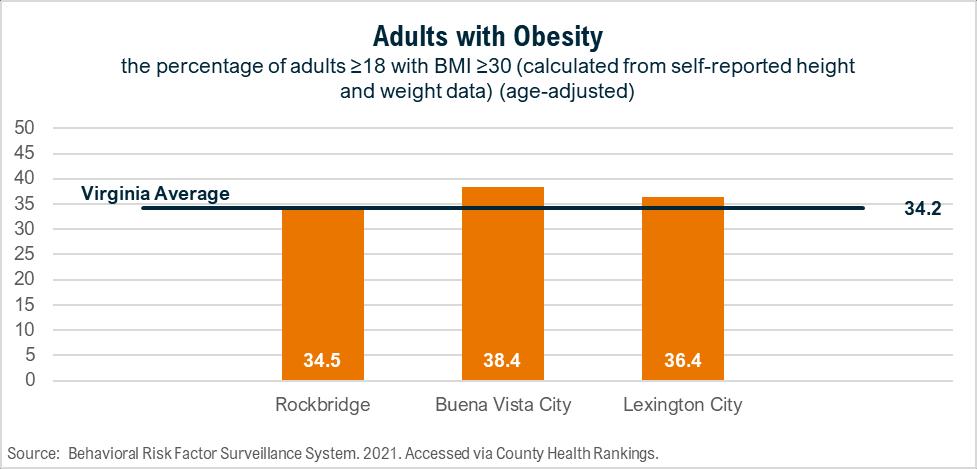
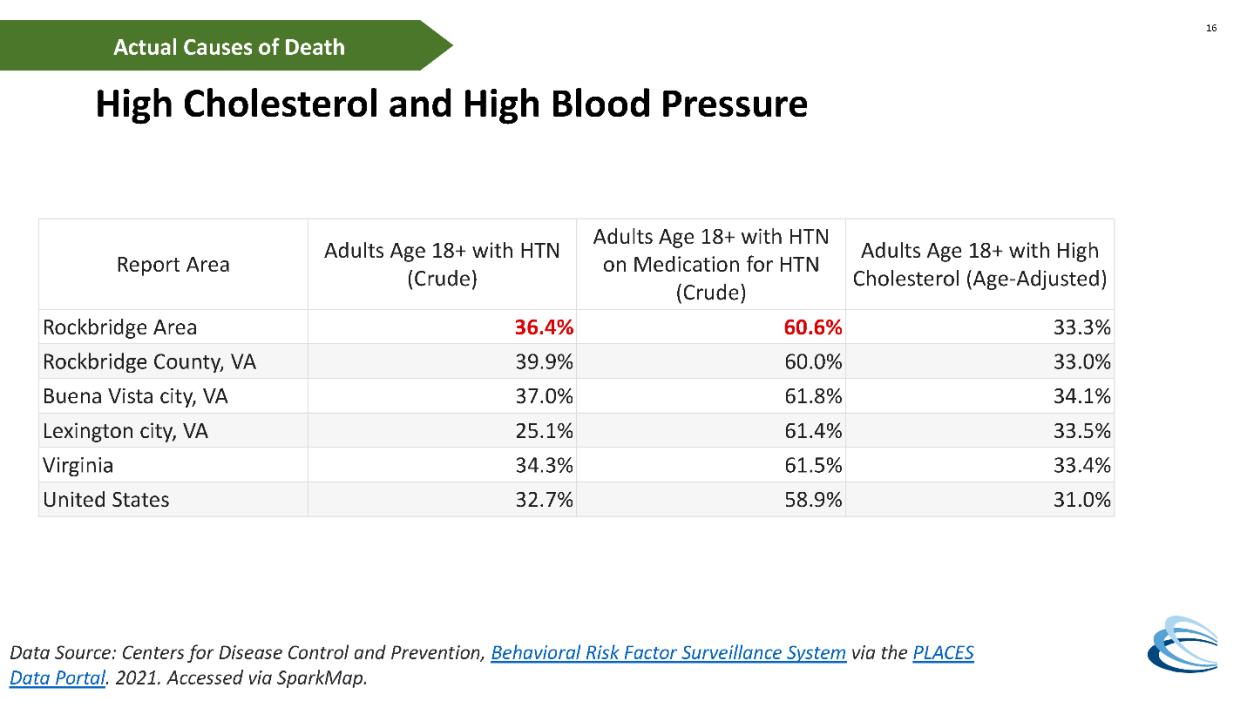
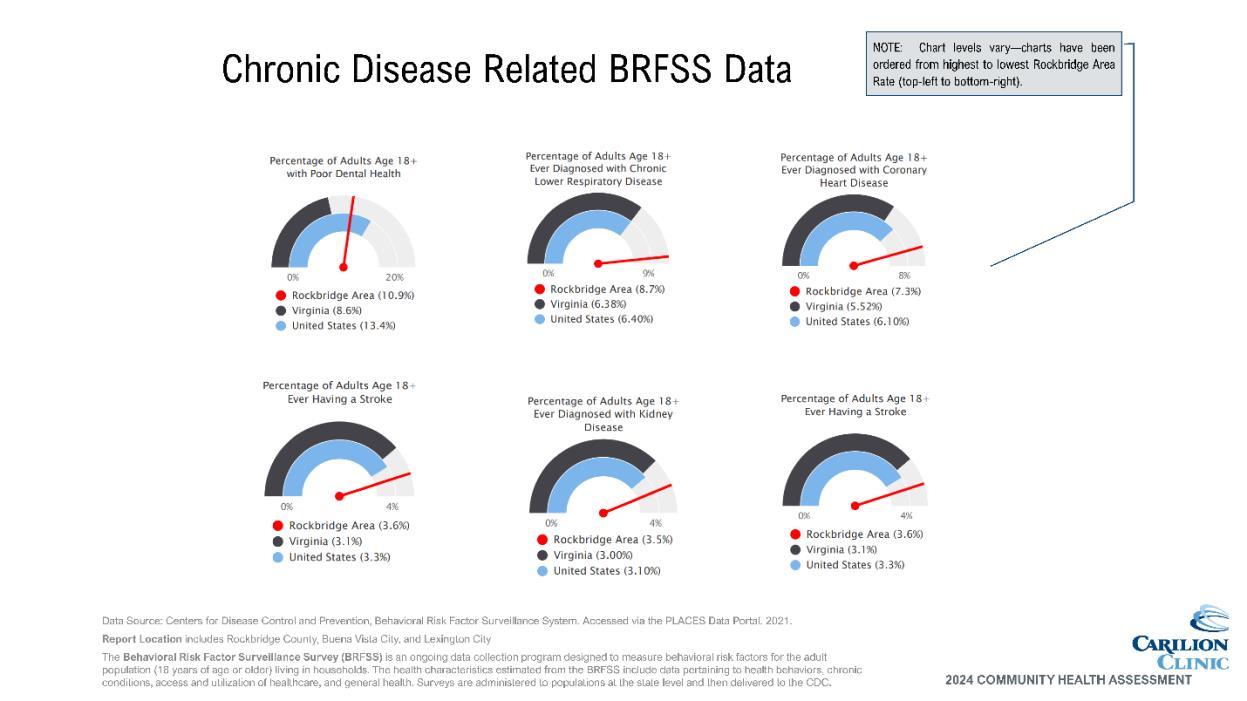
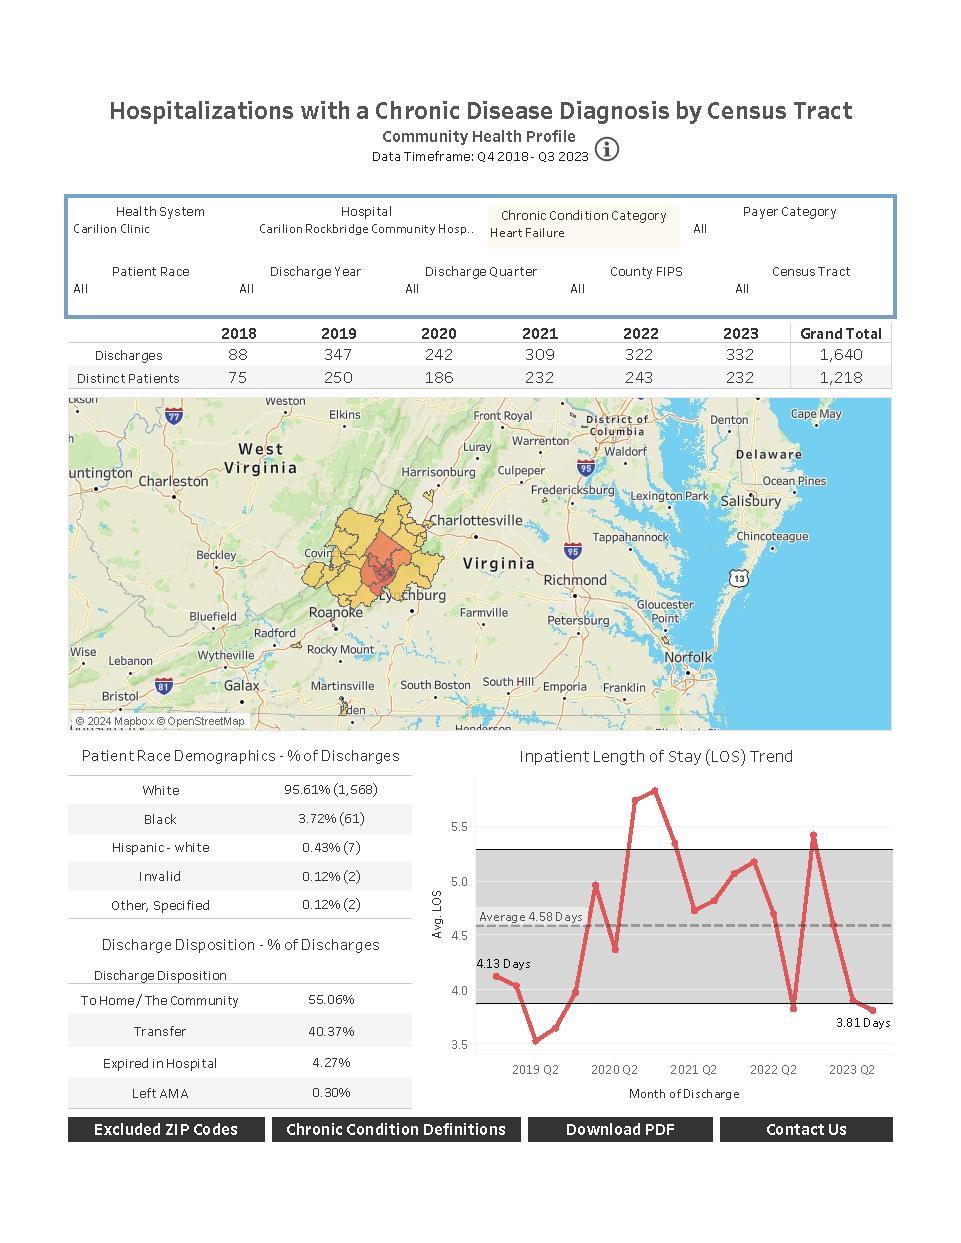
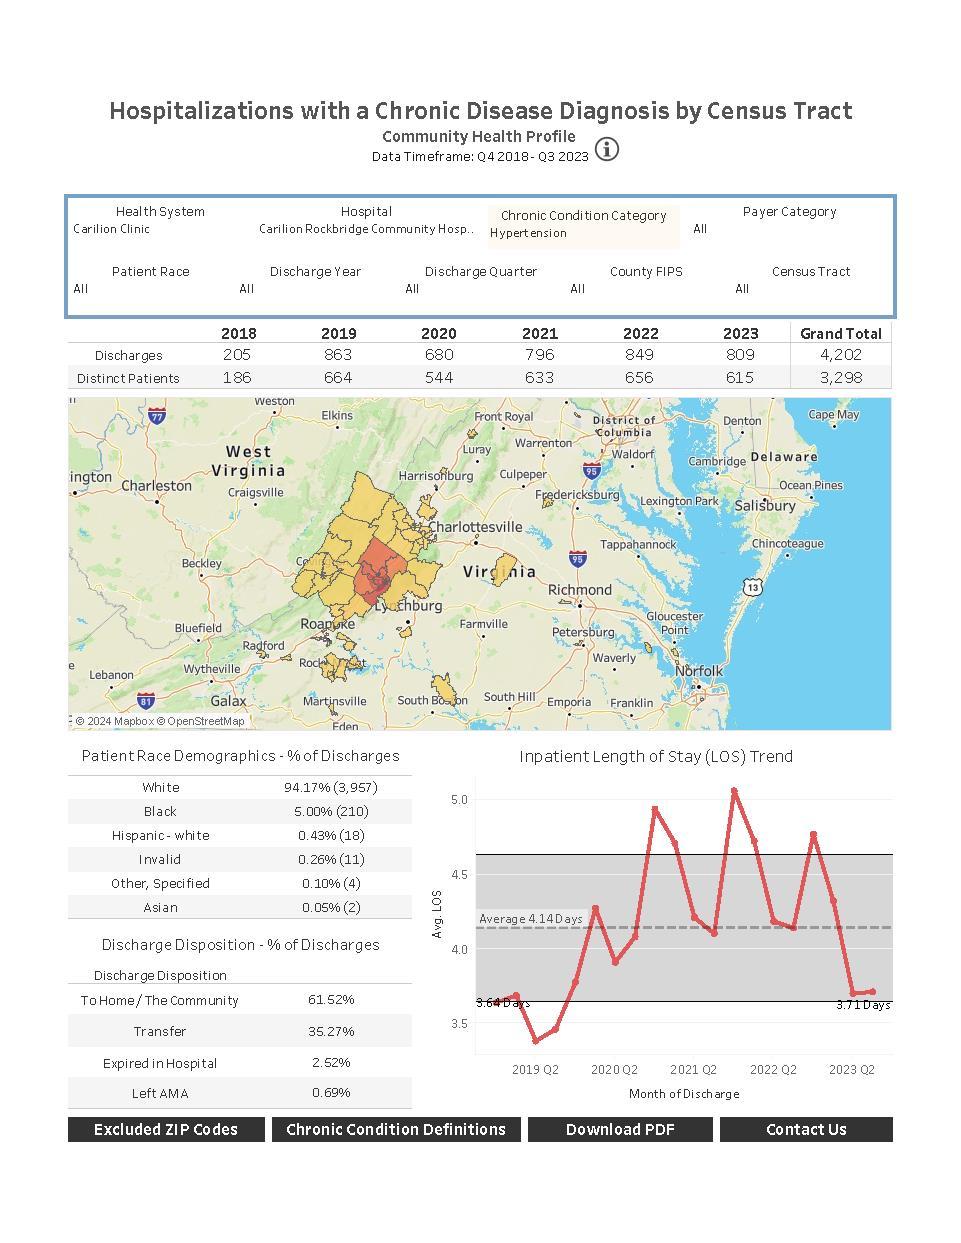
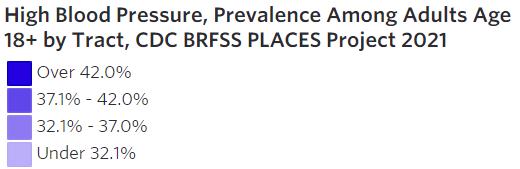
Heart disease and high blood pressure are also reported through BRFSS. While the service area is fairly close to Virginia’s average, all localities have slightly higher rates with the highest burden in Buena Vista. When reviewing by census tract, key differences are apparent. The most rural, outlying areas of the county have higher rates of hypertension compared to the less rural areas with more resources.
Figure 5 Heart Disease
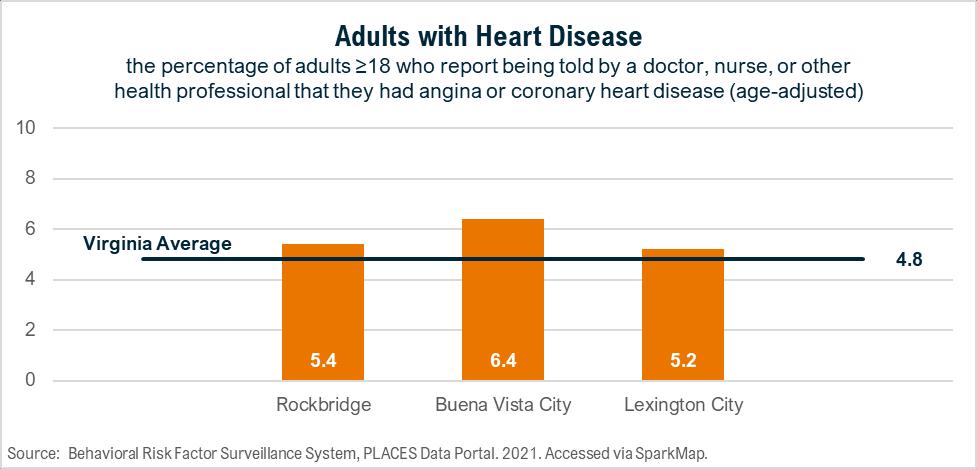
Source: Centers for Disease Control and Prevention, Behavioral Risk Factor Surveillance System: 2021 Accessed via SparkMap.
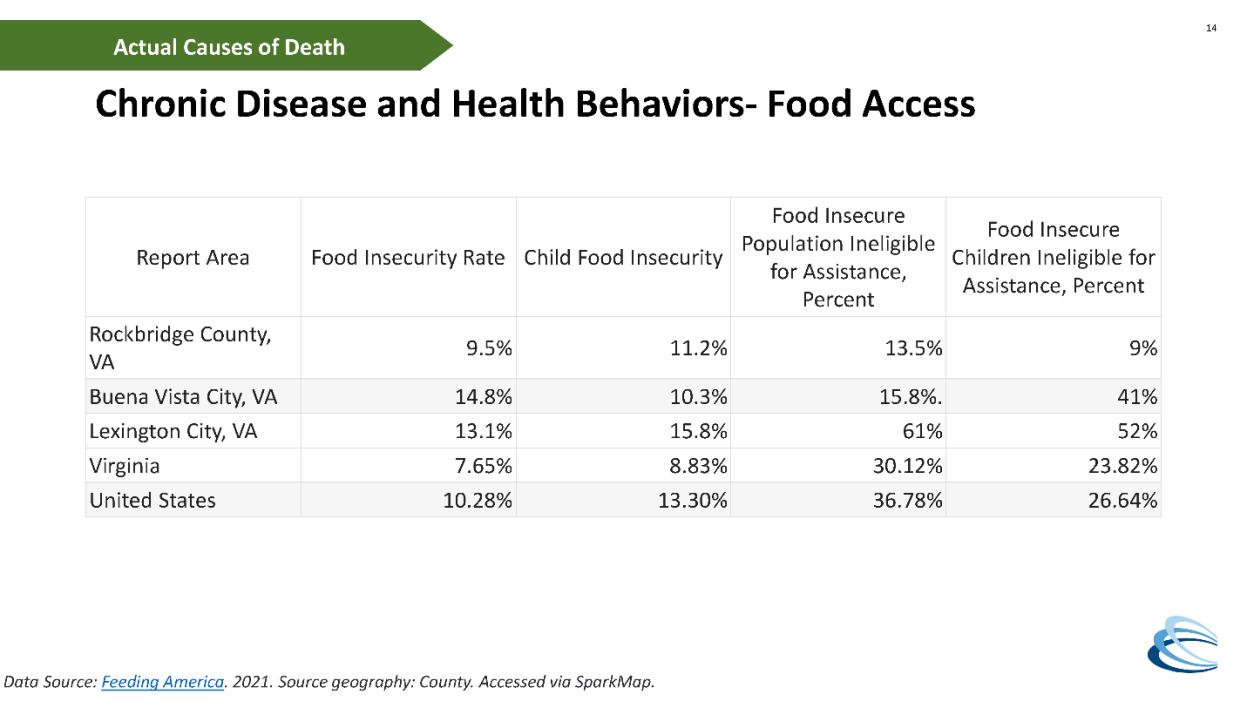
Community partners identified many key drivers of these chronic diseases, including access to healthy foods, knowledge and time to prepare healthy foods, physical activity, culture/readiness to change and the impact of stress and trauma According to the CDC, many preventable chronic diseases are caused by the same behaviors, which include smoking, poor nutrition, lack of physical activity and excessive alcohol use. By adopting strategies to influence these behaviors, we can ultimately impact multiple diseases with coordinated strategies
A detailed list of community partners is available in Appendix G. Key resources to address chronic diseases in the Rockbridge Area include:
• Carilion health education programming
• Virginia Cooperative Extension nutrition education
• Live Healthy Rockbridge Kids programs and initiatives
• Natural Bridge State Park
• Rockbridge Outdoors
• Rockbridge Community Health Foundation funding
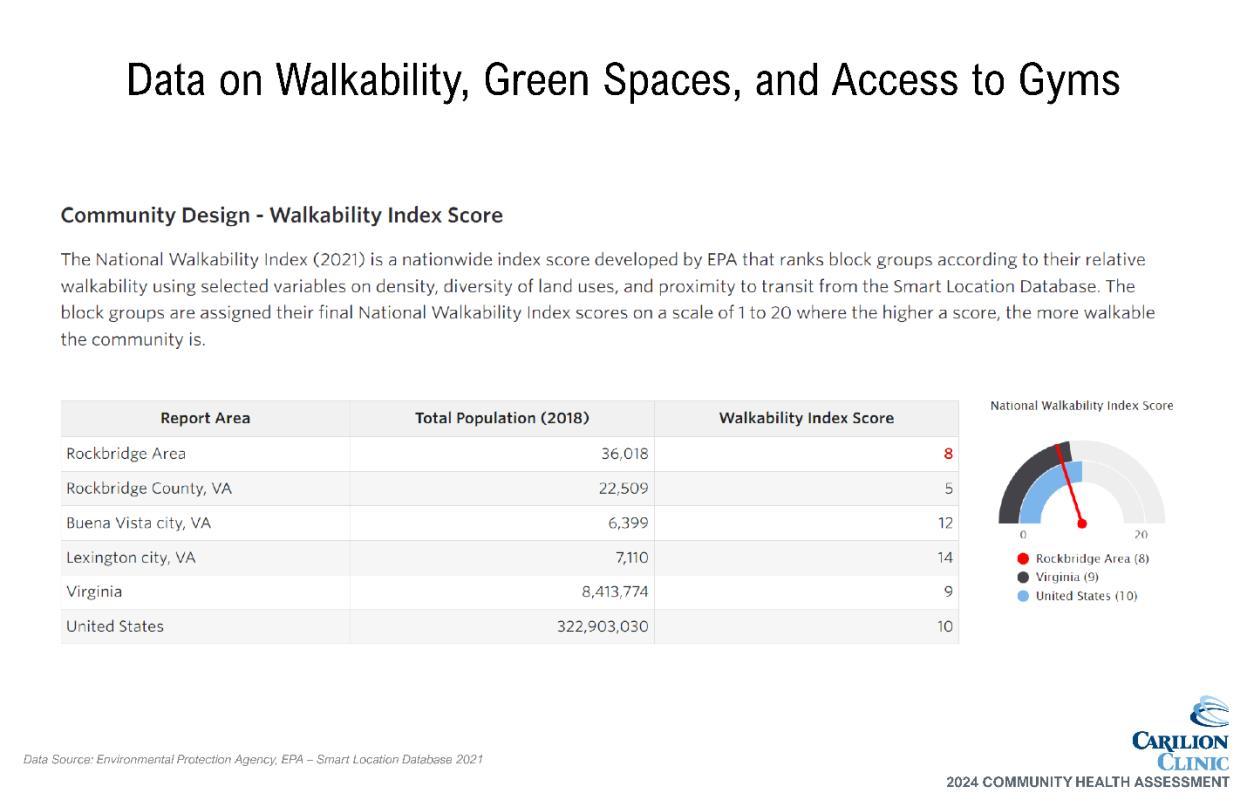
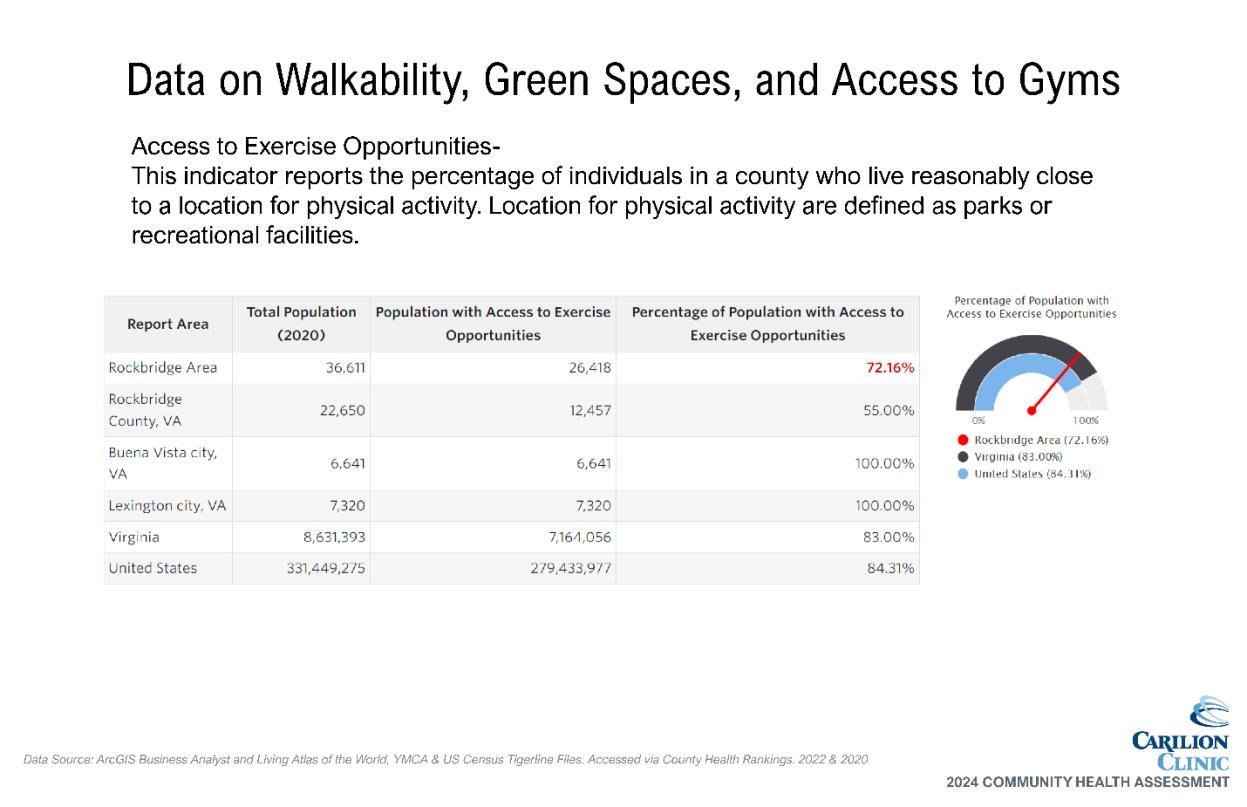
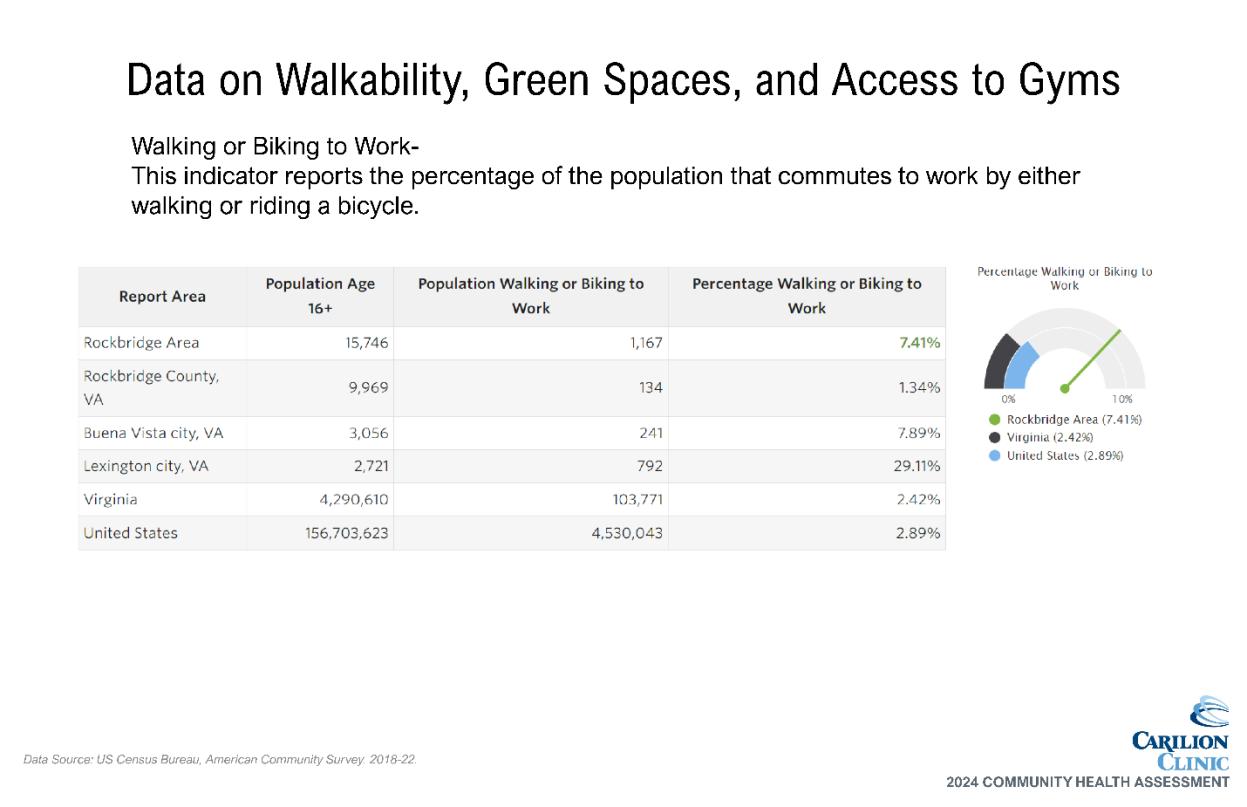
• Green infrastructure/walkable community initiatives

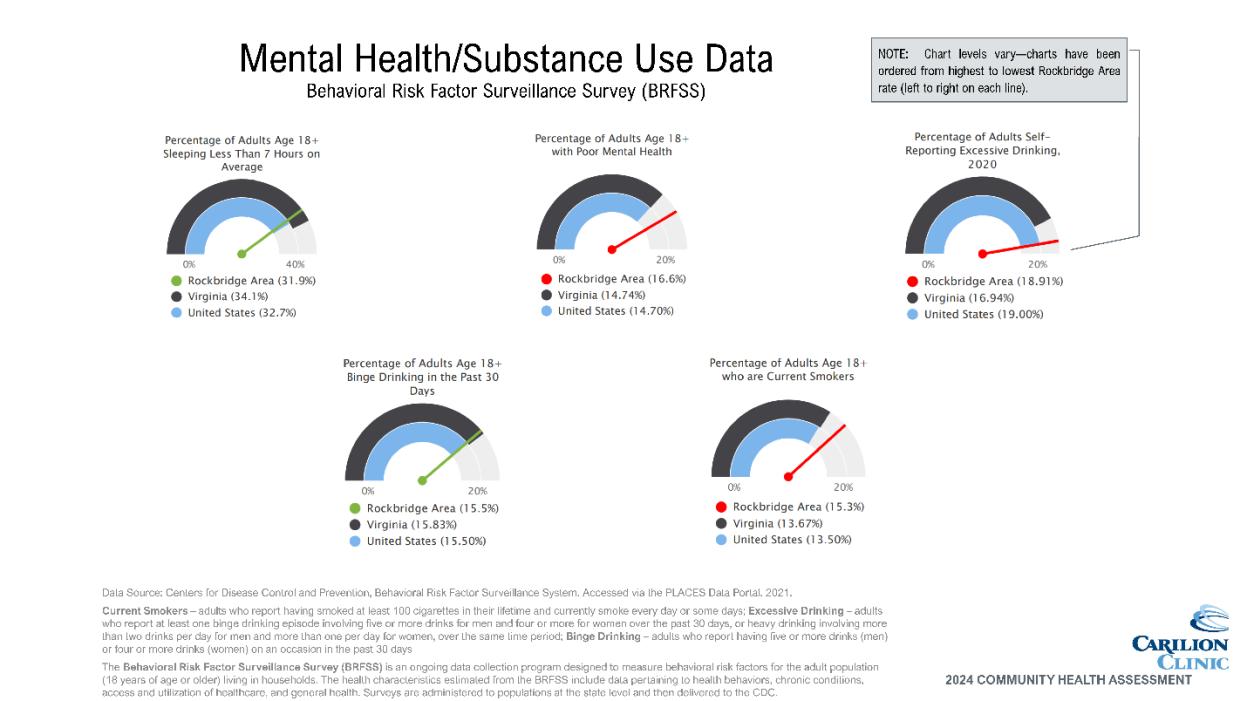
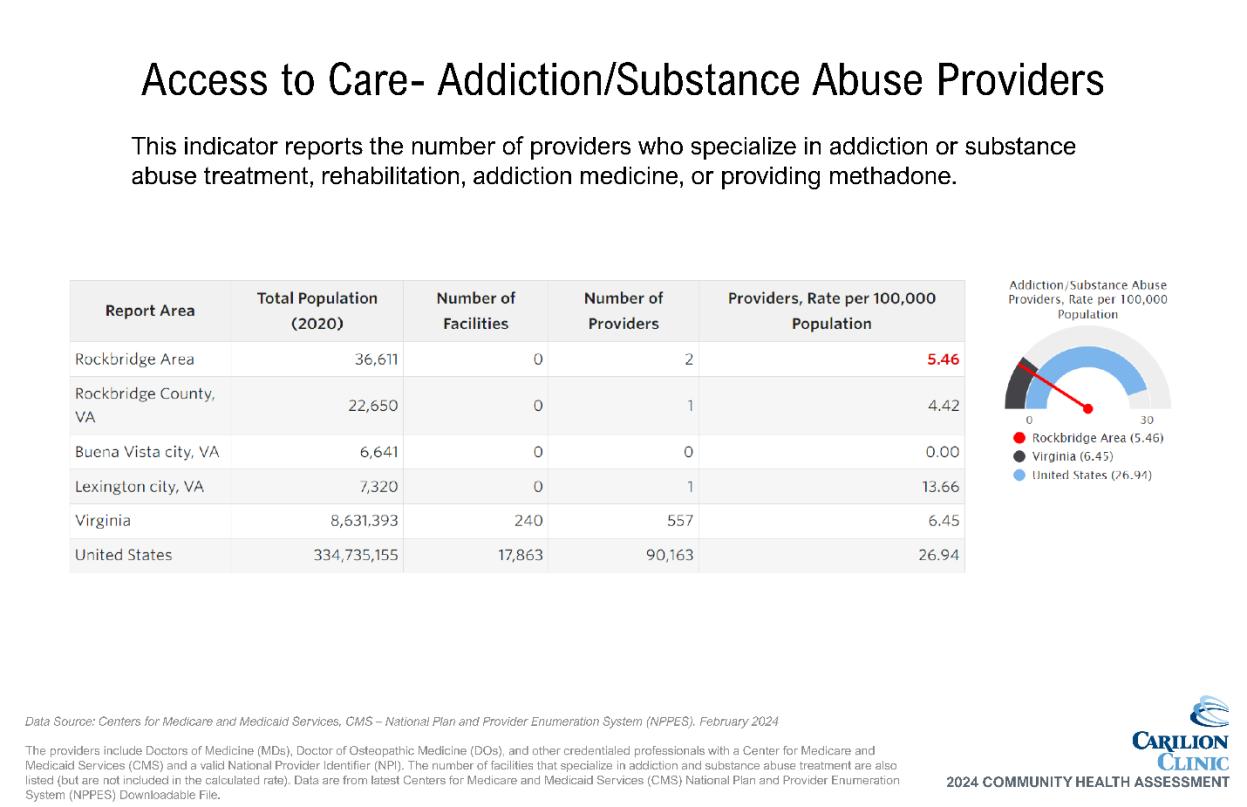
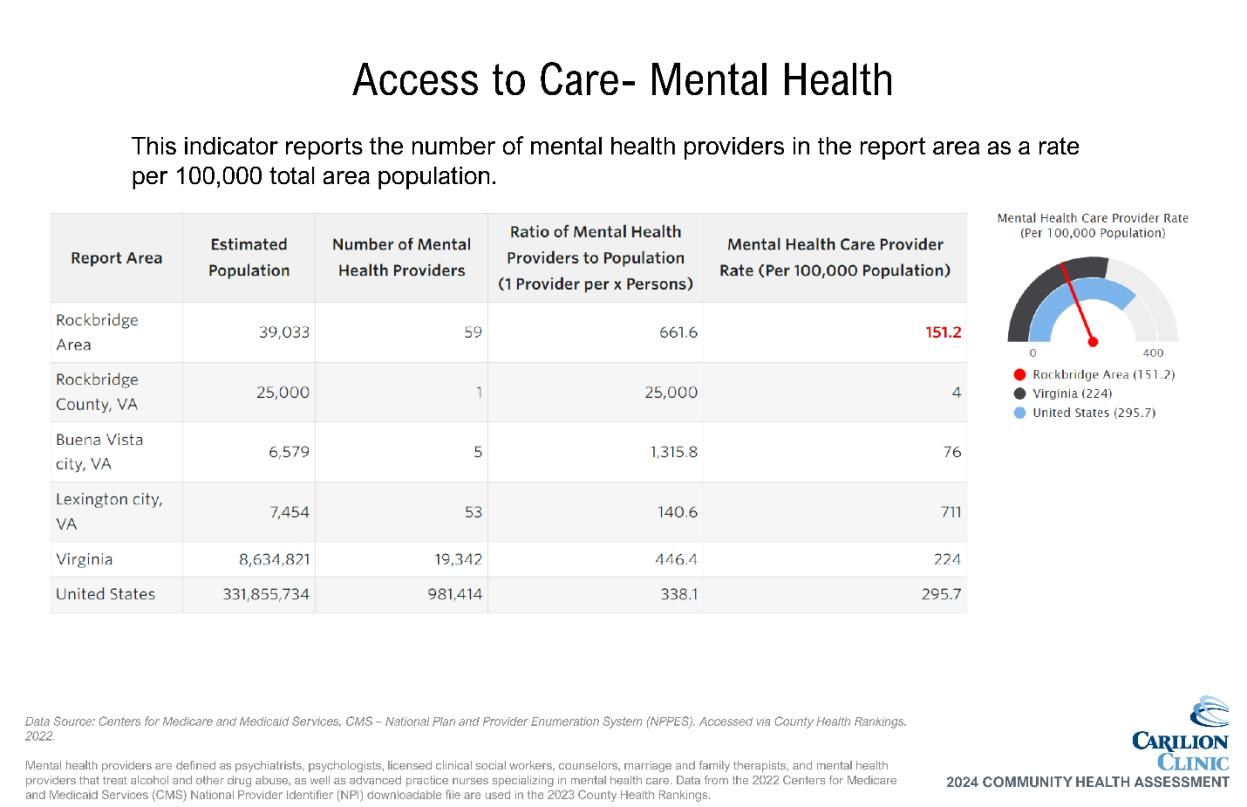
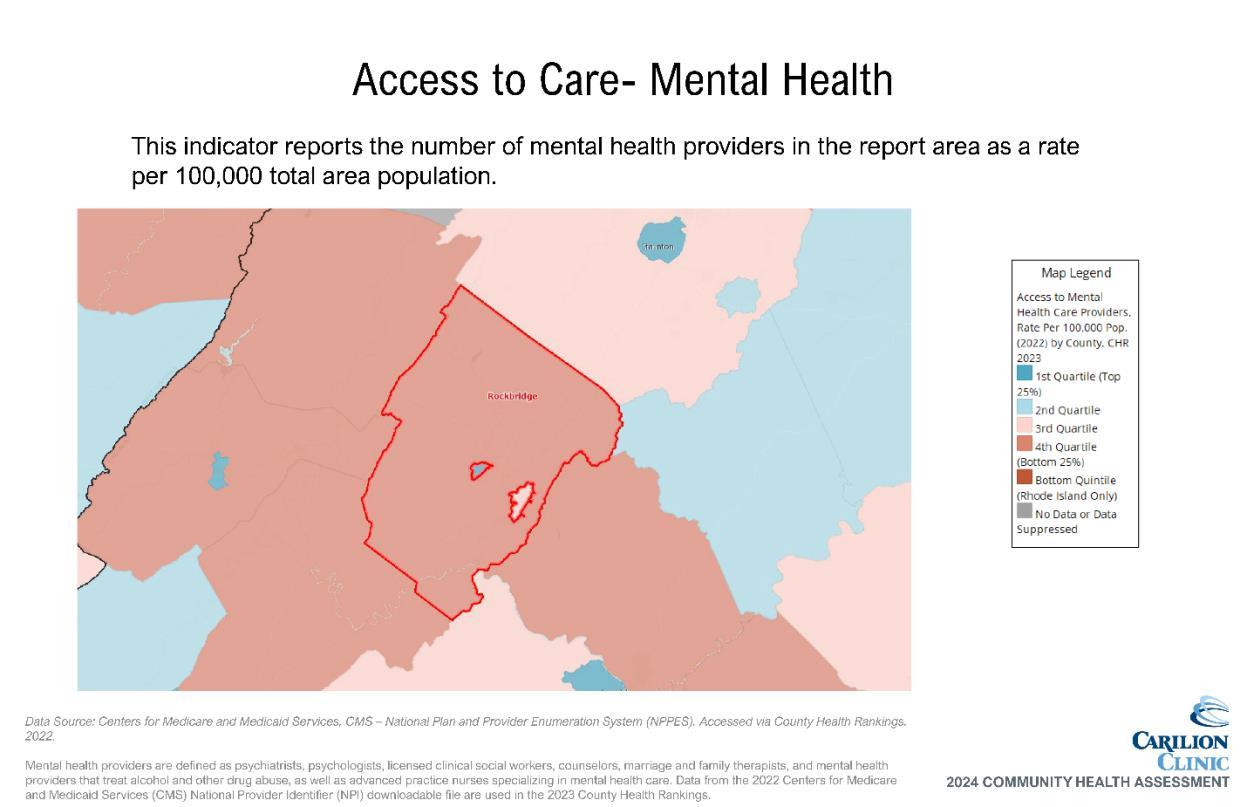
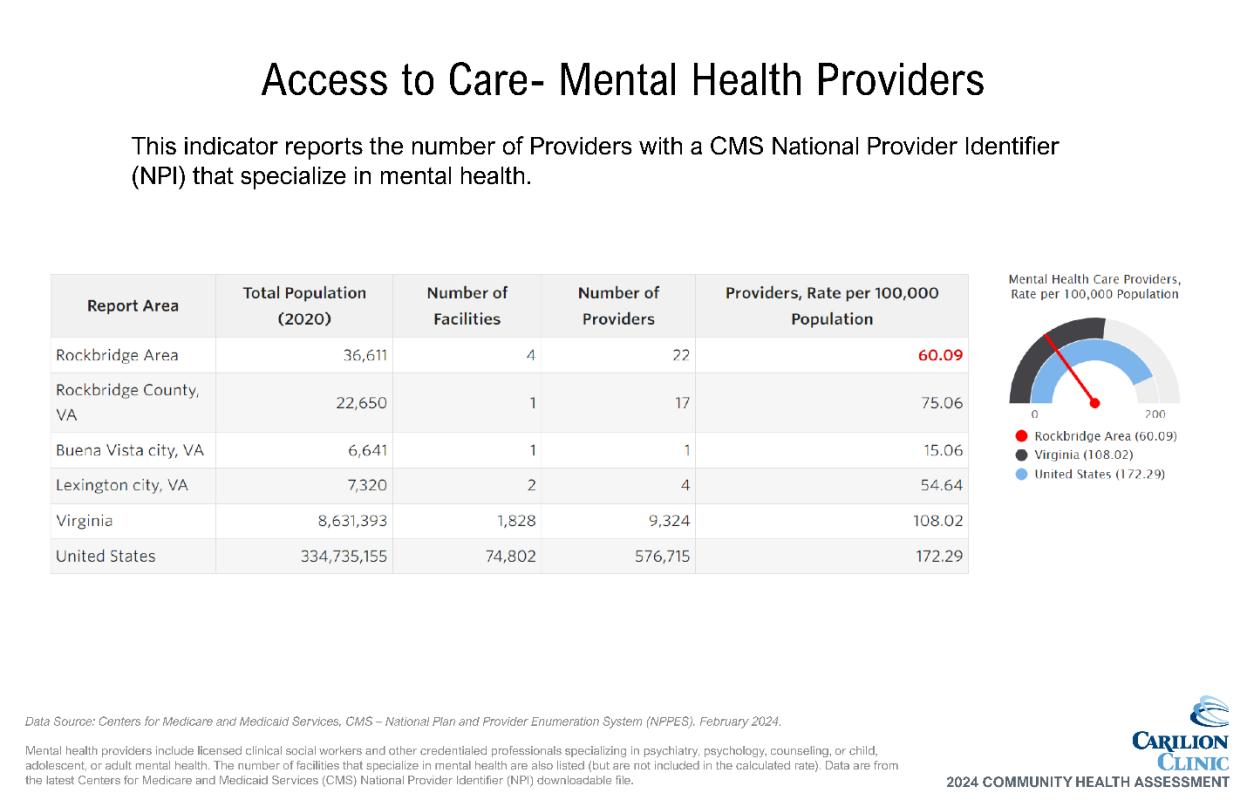
Our prioritization process resulted in the elevation of mental health challenges, substance use and depression as focus areas. The following data indicates potential areas for opportunities.
Data shows need
• Compared to Virginia’s average, residents of the Rockbridge Area have a higher occurrence of:
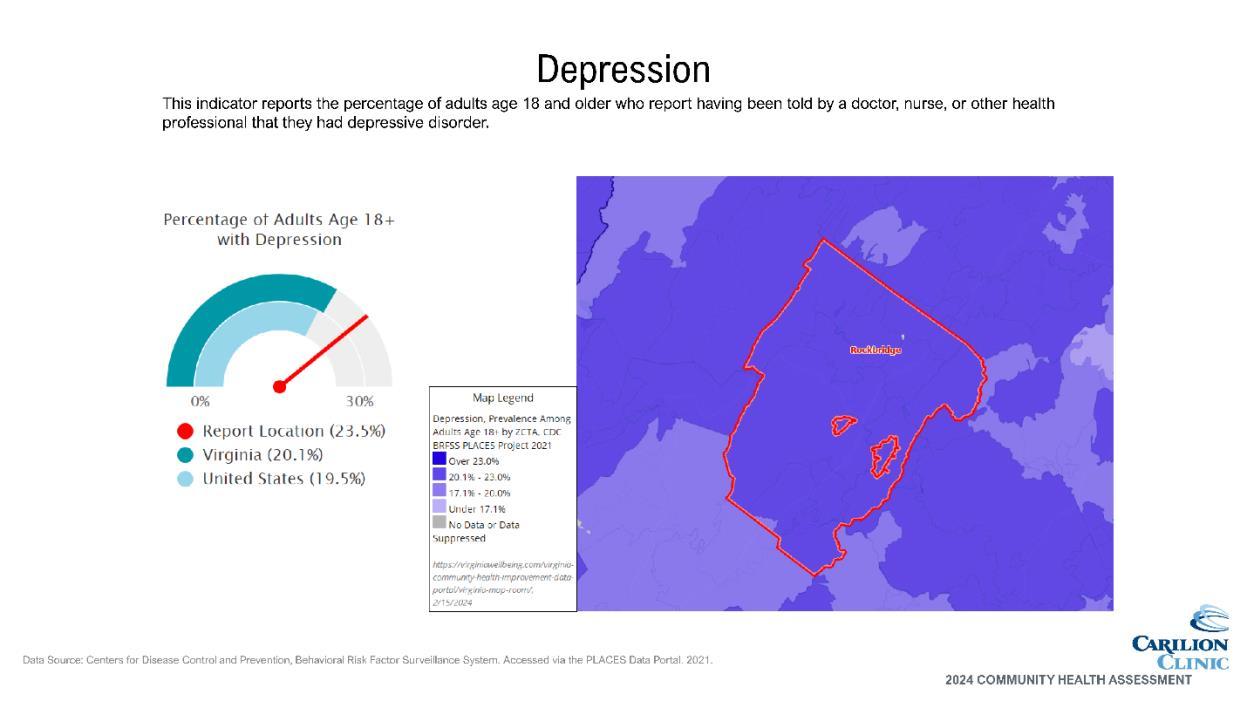
o Depressive disorder
o Cigarette smoking
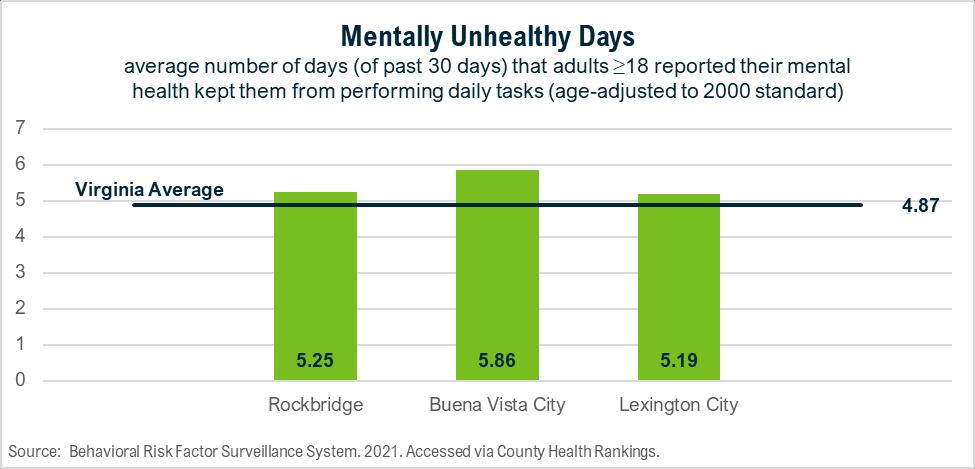
• Higher occurrence of mentally unhealthy days than physically unhealthy days; mentally unhealthy days higher than Virginia average
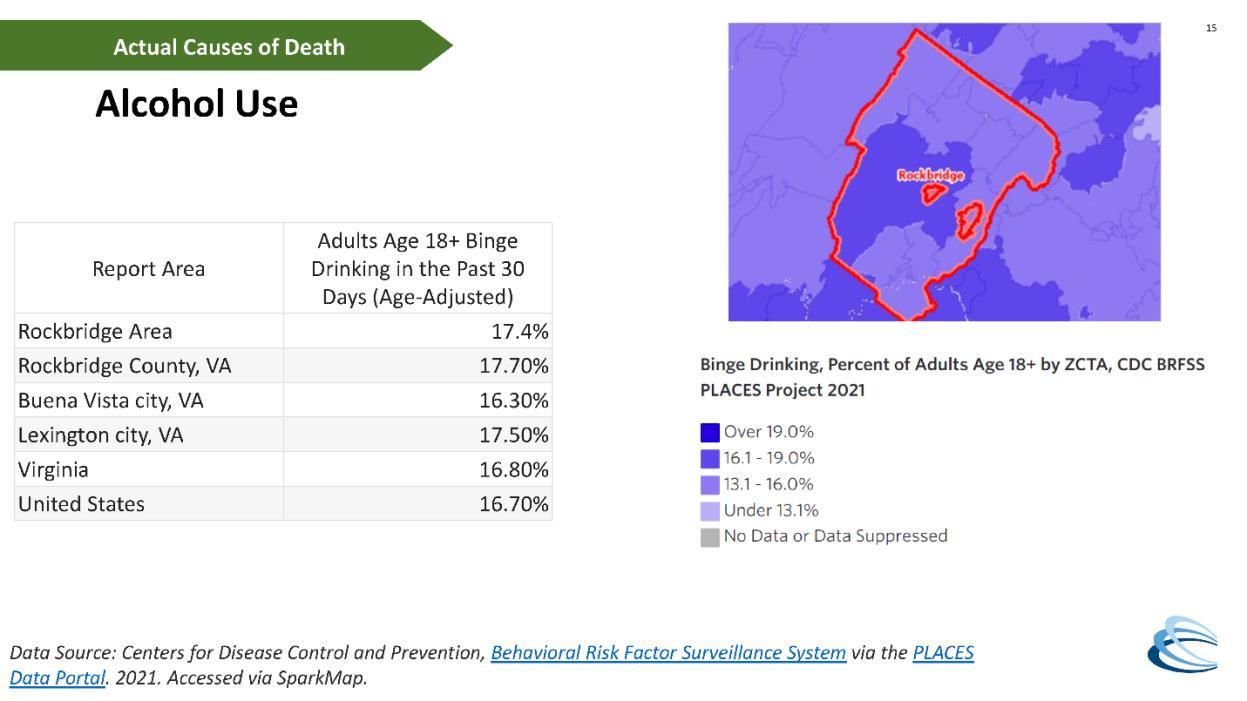
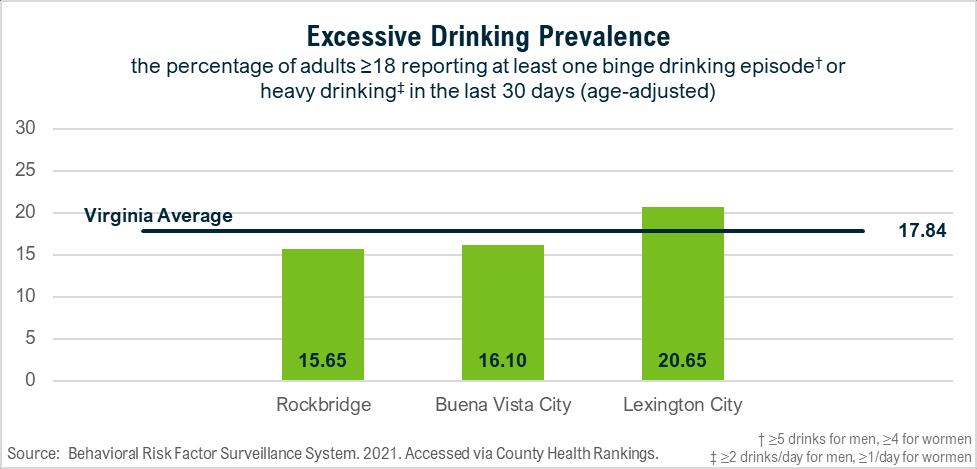
• Heavy drinking varies, with the highest prevalence in Lexington
Community indicates need
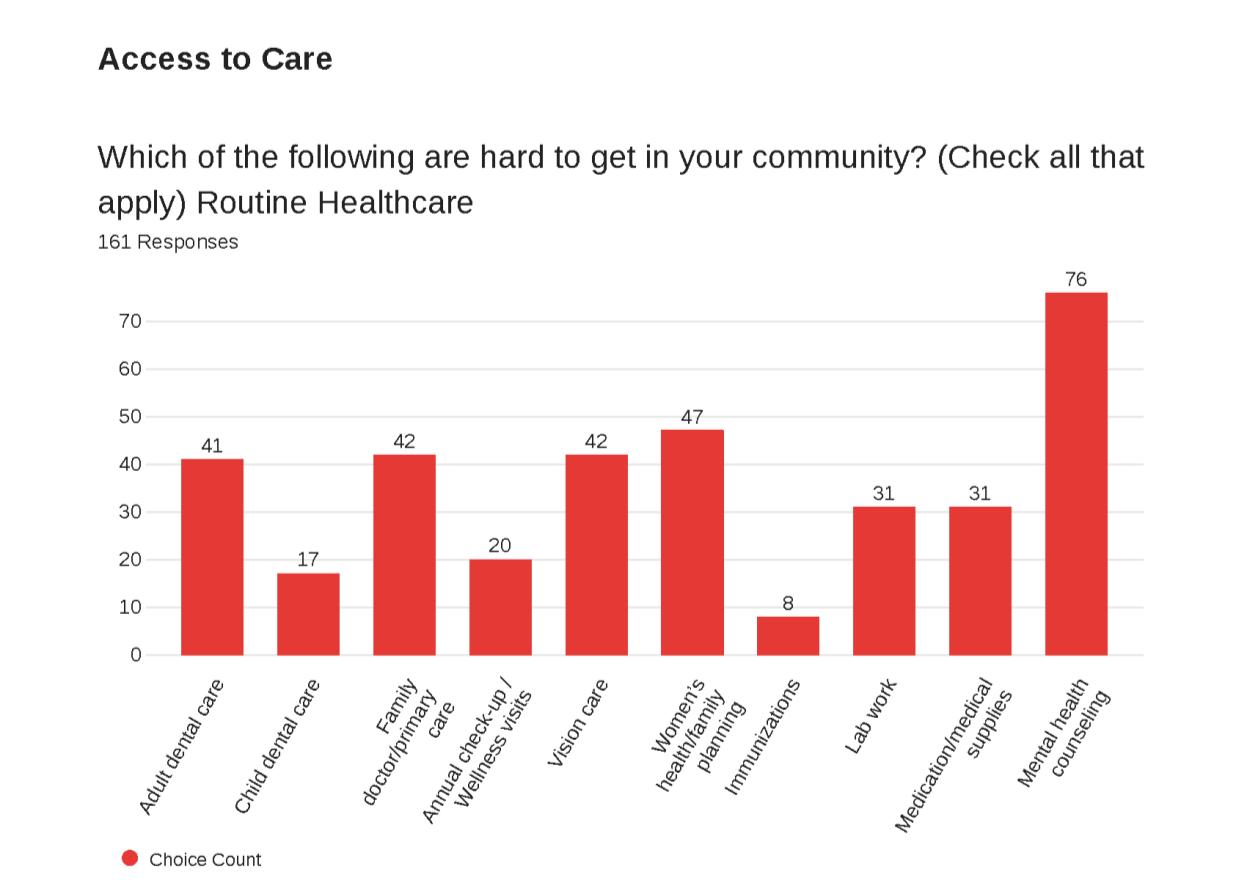
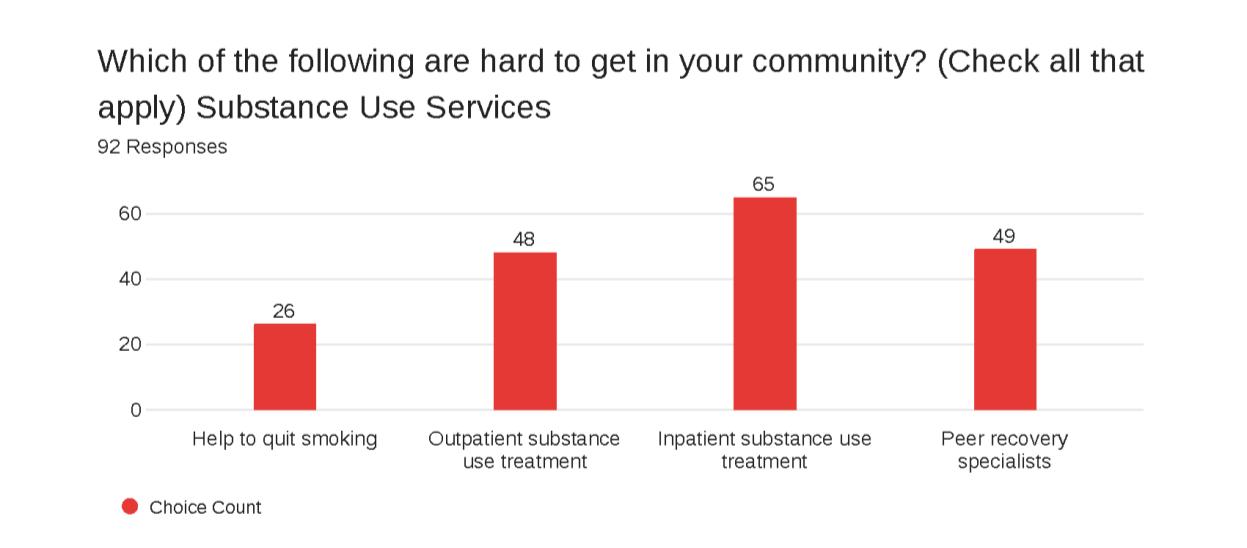
• Concern for access to mental health counseling and outpatient substance use treatment indicated through community survey
• Mental health and substance use services were indicated as a top potential quality of life improvement in the Rockbridge Area
According to IHME research, drug use disorders are the number two cause of death and disability in the United States. Depressive disorders and anxiety disorders, both mental health challenges, are ranked at fifth and eighth, respectively.8 All of these health conditions have been worsening in recent years, especially in relation to the impacts of the COVID-19 pandemic.
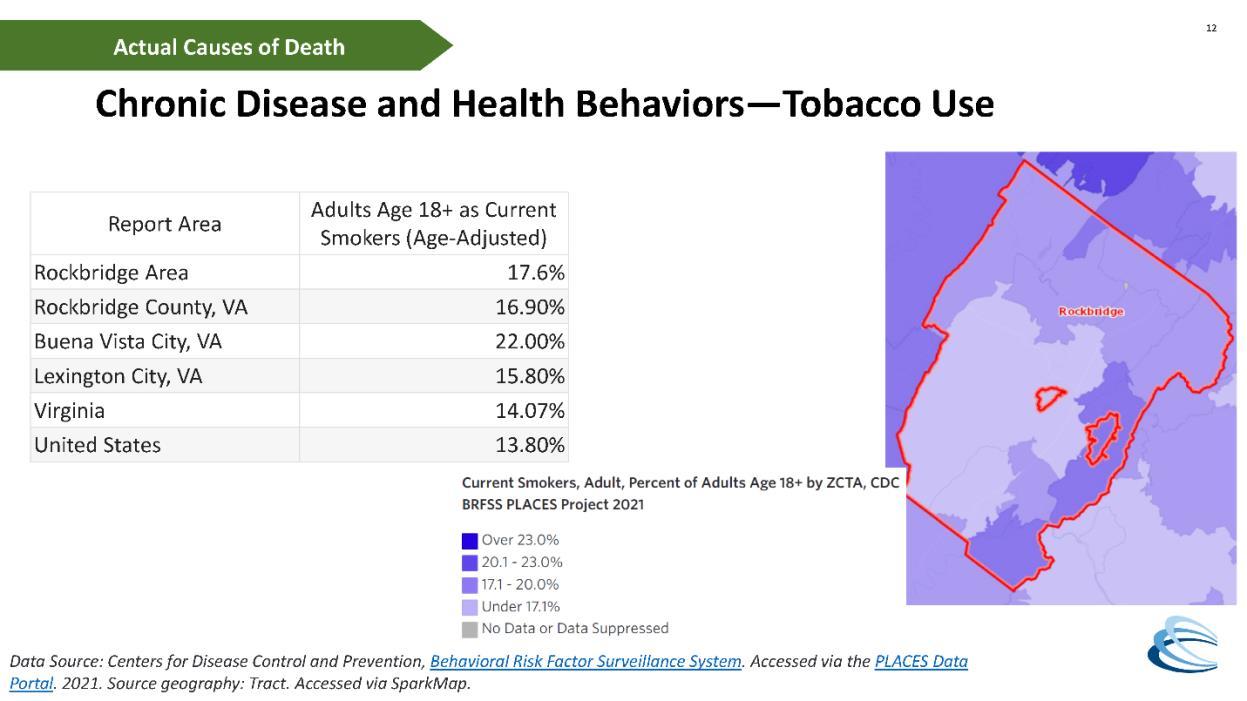
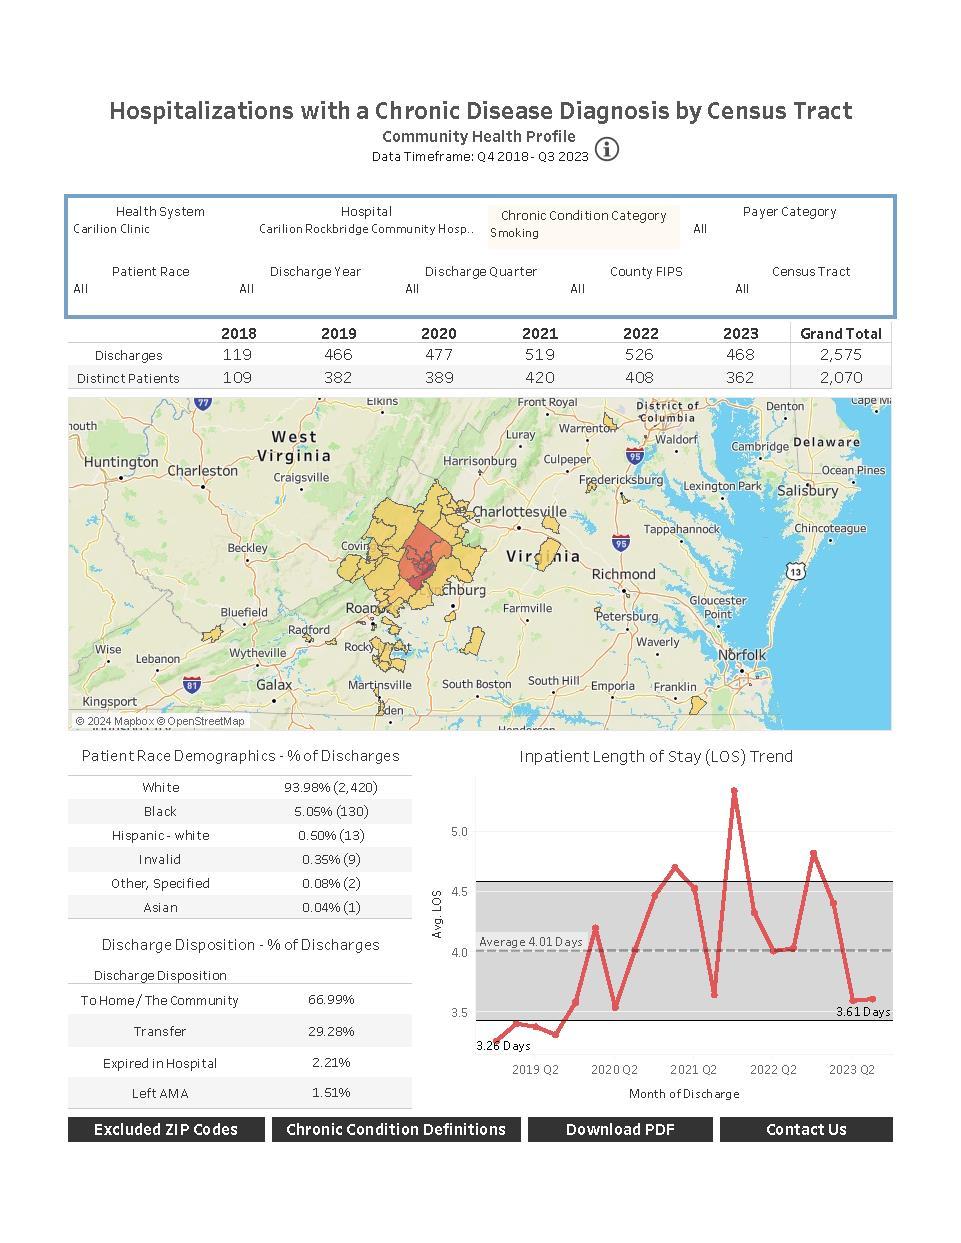
Prevalence of adult depression, mentally unhealthy days and cigarette smoking is reported through BRFSS for the service area localities. All are higher than Virginia’s average, with Buena Vista experiencing the highest rates for all three metrics Despite a strong body of evidence on the negative health impacts of tobacco use, nearly 10% more adults in Buena Vista smoke cigarettes than Virginia’s average.
8 United States | Institute for Health Metrics and Evaluation (healthdata.org)
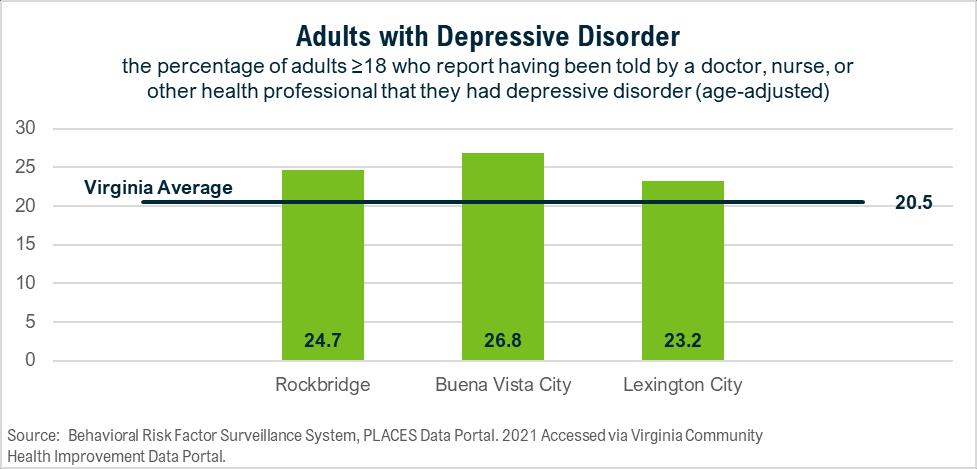
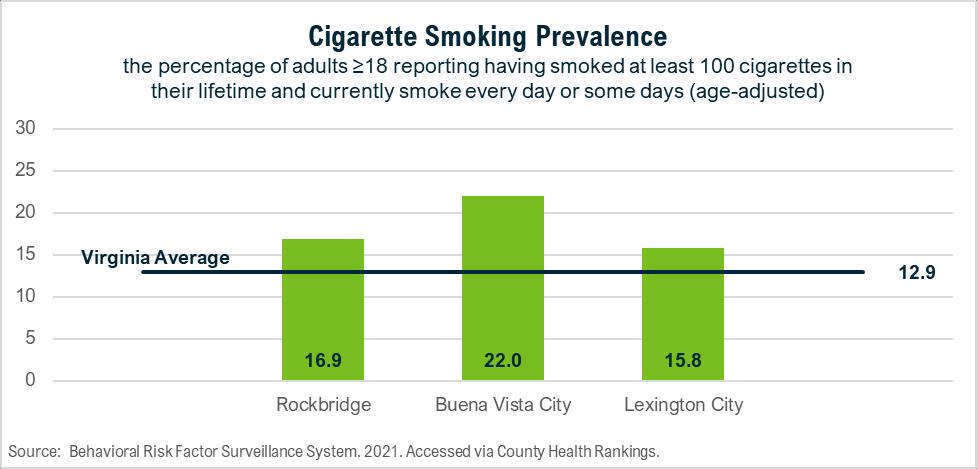
Figure 8. Mentally Unhealthy Days
Lexington City stands out with a higher rate of excessive alcohol use than Virginia.
Figure 9. Excessive Drinking
Community partners identified many key drivers of substance use, including poverty, trauma, mental health challenges, cultural acceptance and easy access to substances. Identified drivers of mental health challenges included trauma, stigma, financial circumstances and housing instability. Mental health and substance use are intertwined. Both areas can benefit from some of the same strategies, especially related to prevention. However, there are key differences in
effective strategies with individuals who are actively experiencing challenges in those topic areas, which allows for all community partners to have a role in the work to address them.
A detailed list of community partners is available in Appendix G. Key resources to address mental health and substance use in the Rockbridge Area include:
• Counseling, treatment and prevention services
• Harm reduction and other recovery services
• Rockbridge Area Prevention Coalition prevention education

Our prioritization process resulted in the elevation of interpersonal violence as a focus area. The following data indicates potential areas for opportunities.
Data shows need
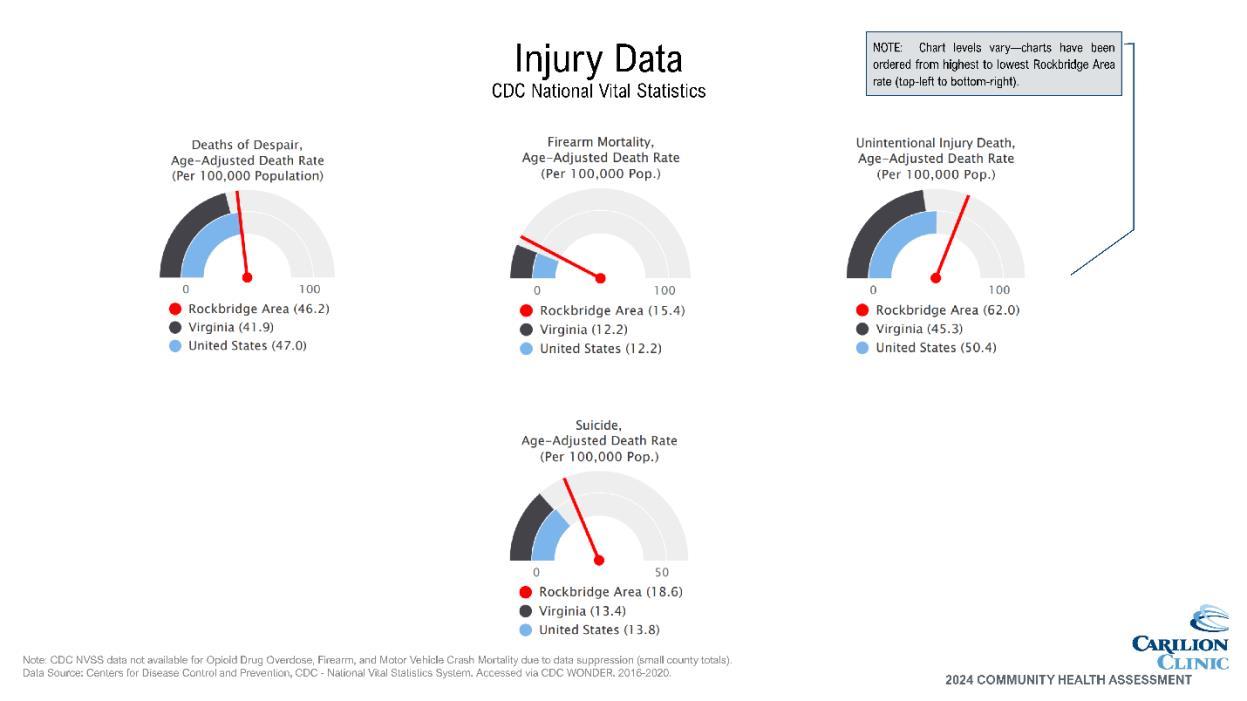
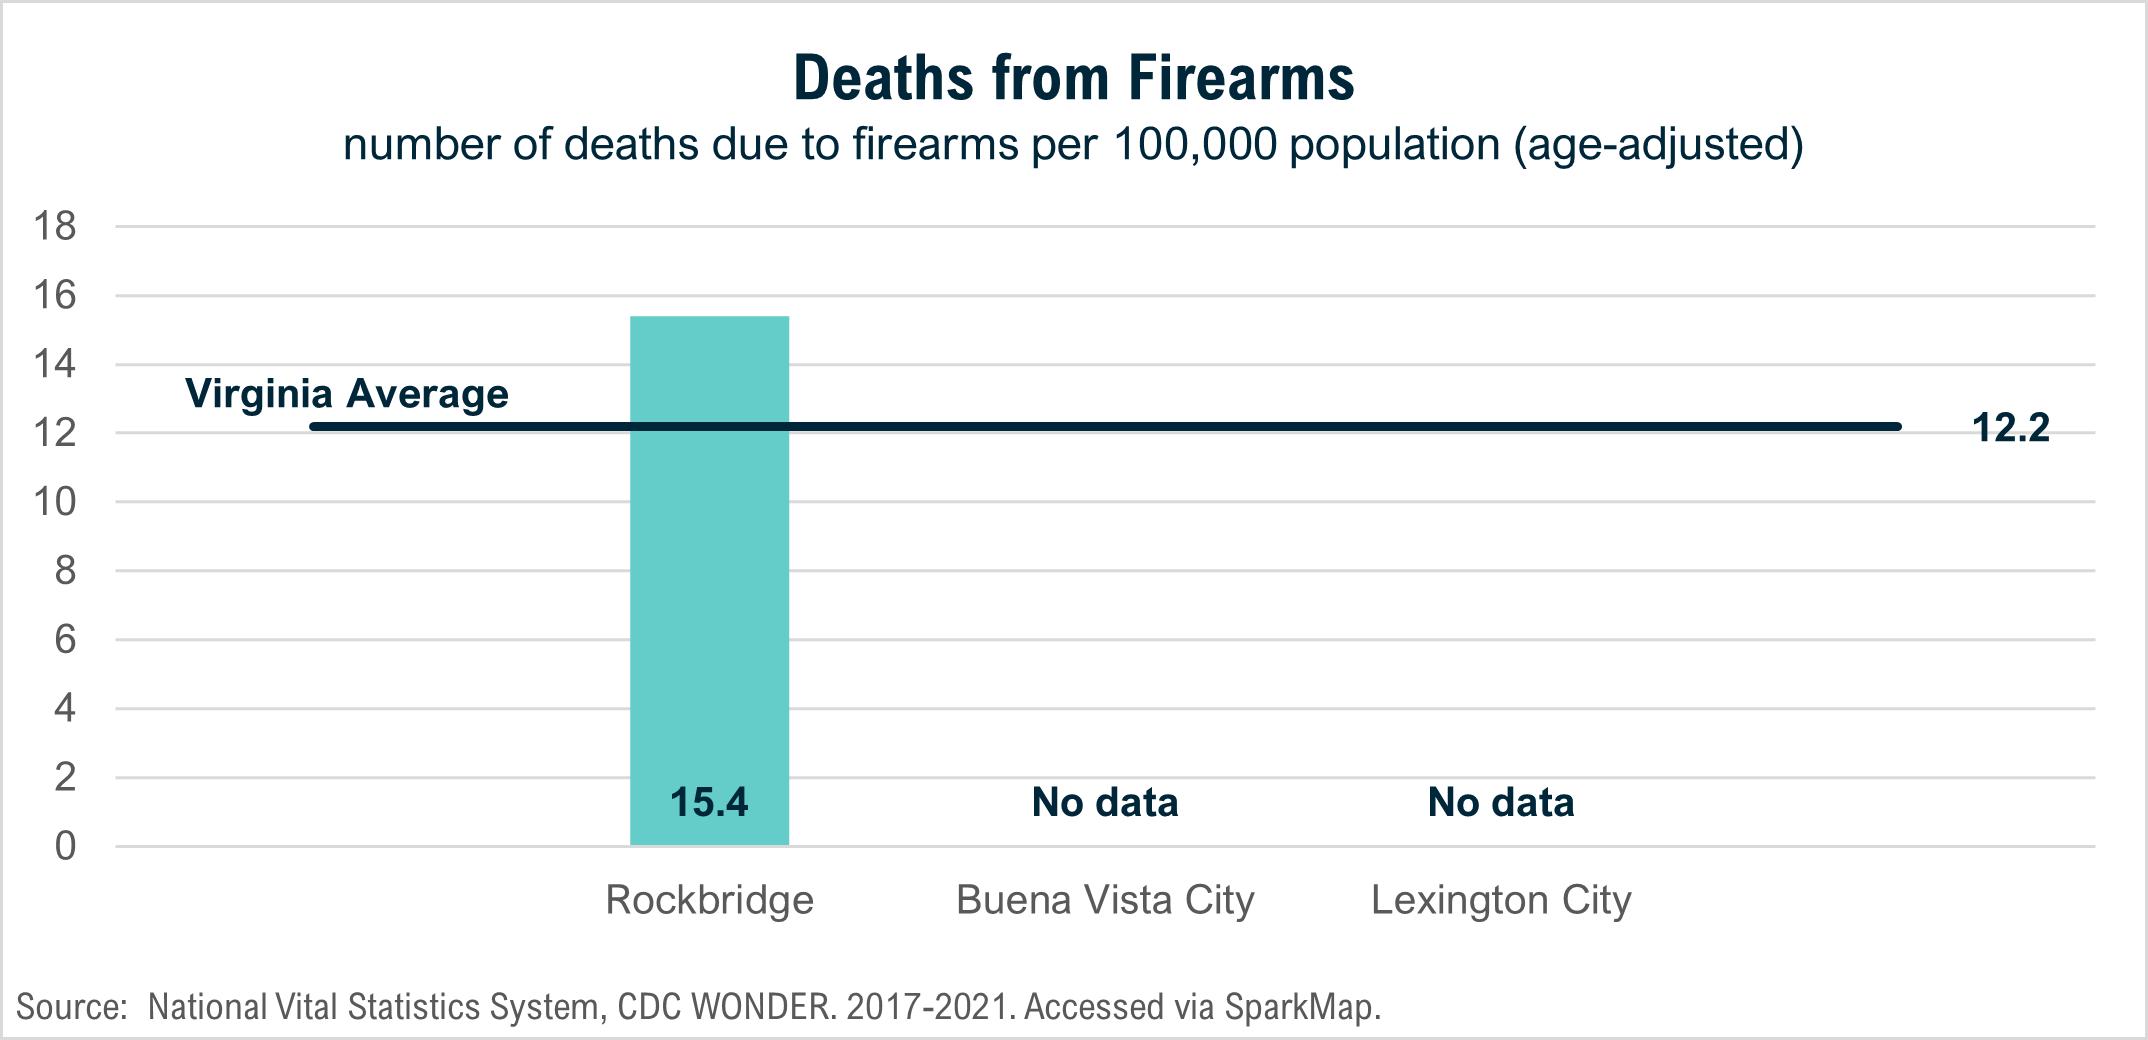
• Deaths from firearms are higher than average in Rockbridge County
• Deaths from accidents are higher in Rockbridge County and Buena Vista City
Community indicates need
• Concern about domestic violence and bullying indicated through community survey
The American Public Health Association issued a policy brief in 2018 recommending that violence be deemed a public health crisis.9 Since that time, data shows that violence in our communities has increased. Violence as defined by the policy brief refers to “the intentional use of physical force or power, threatened or actual, against oneself, another person, or against a group or a community, which either results in or has a high likelihood of resulting in injury, death, psychological harm, maldevelopment, or deprivation.” This encompasses a wide range of challenges including child maltreatment, elder maltreatment, intimate partner violence, bullying and broader community violence.
The impact of violence is far-reaching and includes not only the directly affected individual, but also those who are exposed indirectly and the community at-large. Gun violence, for example, continues to be an issue of national concern and negatively impacts entire groups of people in addition to direct victims. While the independent cities within the service area do not have a sufficient number of deaths from firearms for reporting purposes, Rockbridge County does see this occurring at a rate higher than the Virginia average.
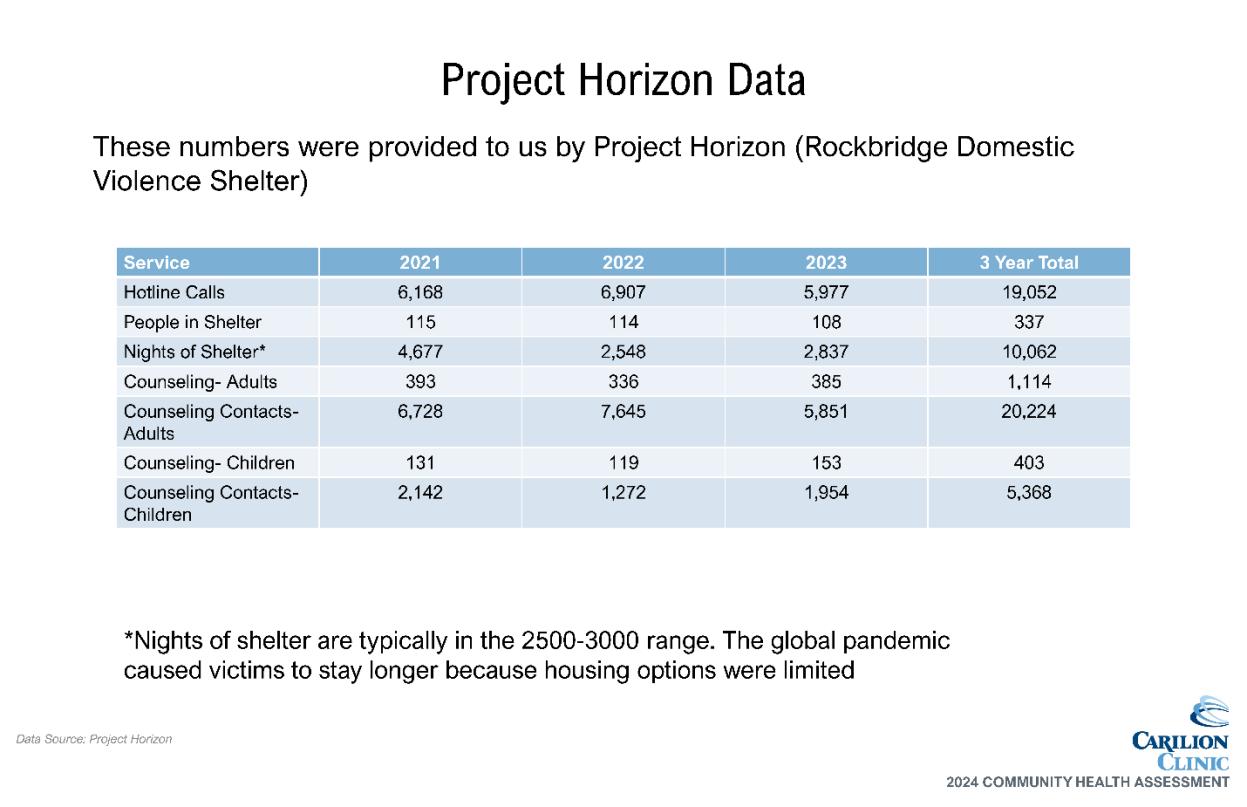
Additional Rockbridge Area data supports a continued need for domestic violence services provided by Project Horizon. Their hotline regularly receives more than 6,000 calls a year, and they provide services including shelter and counseling to an average of more than 600 people a year.
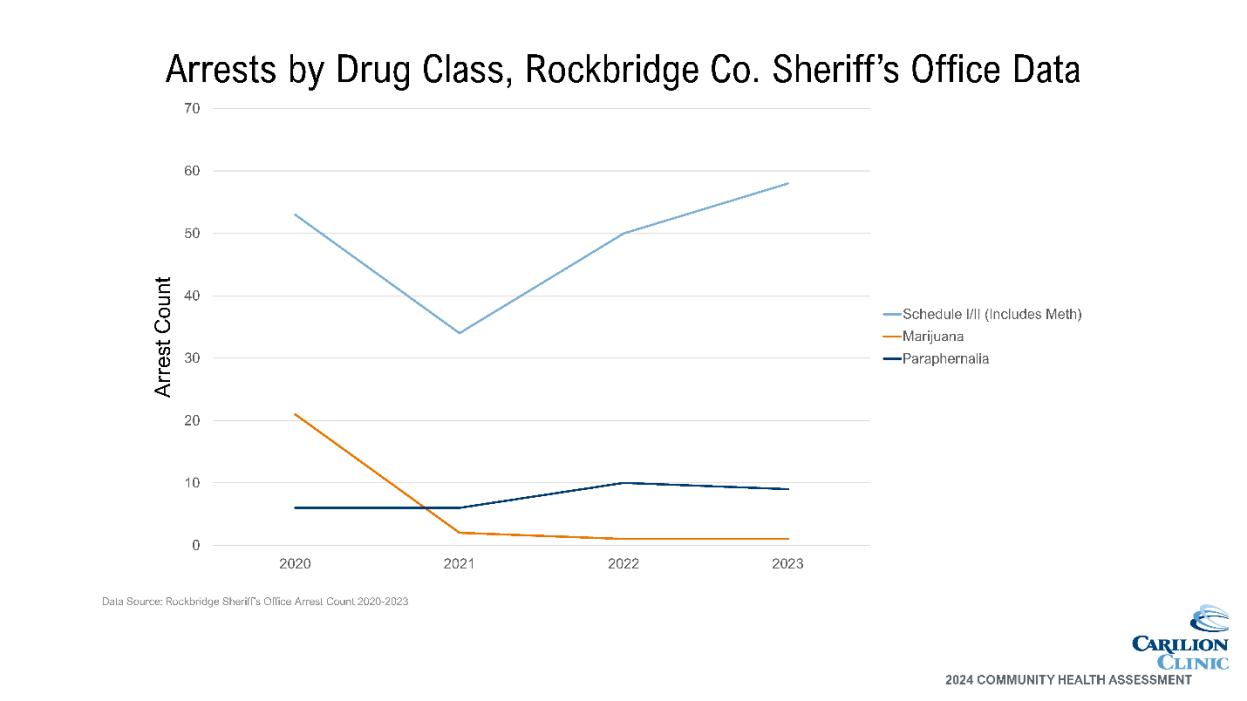
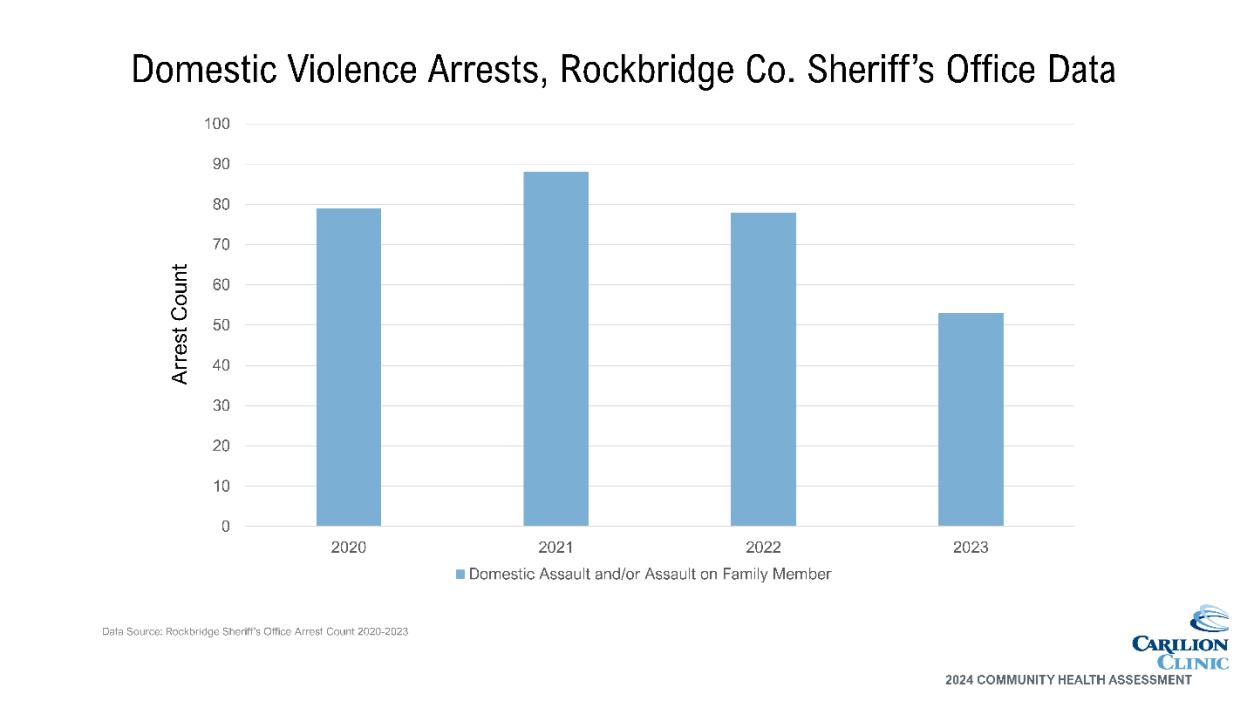
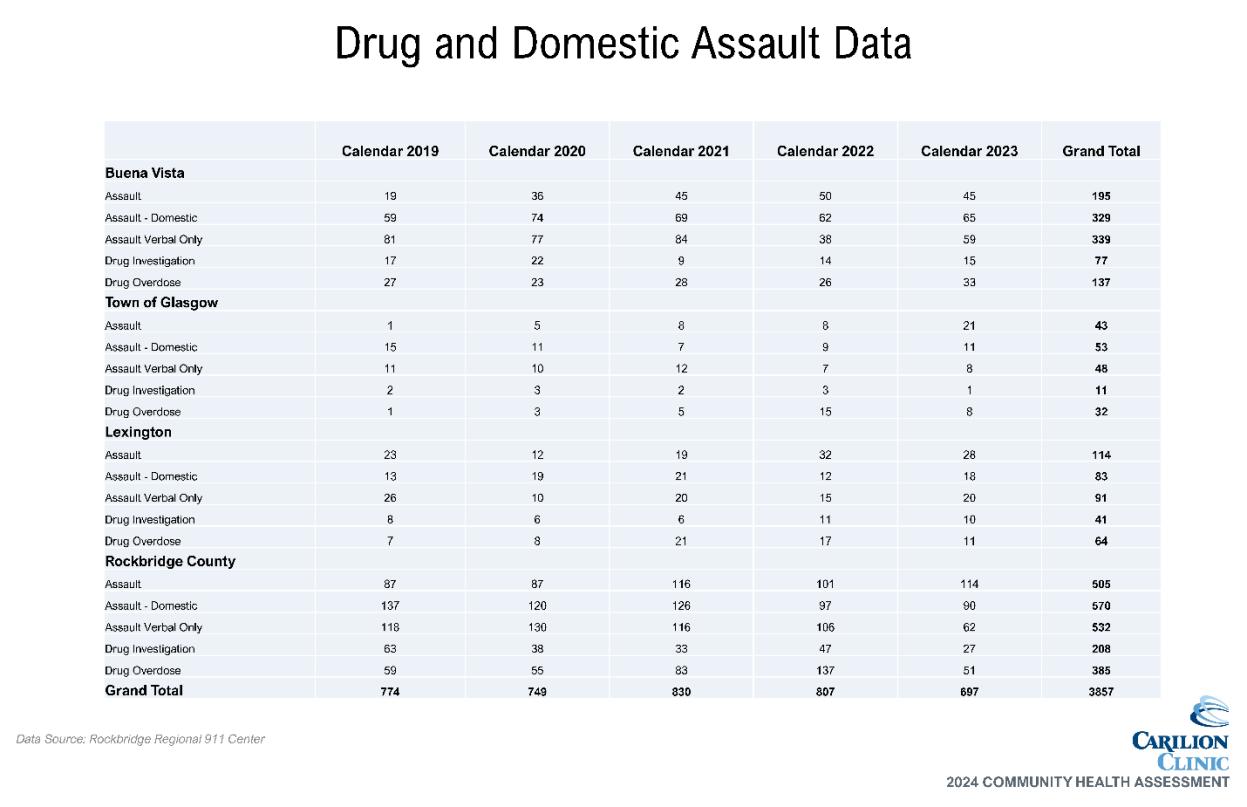
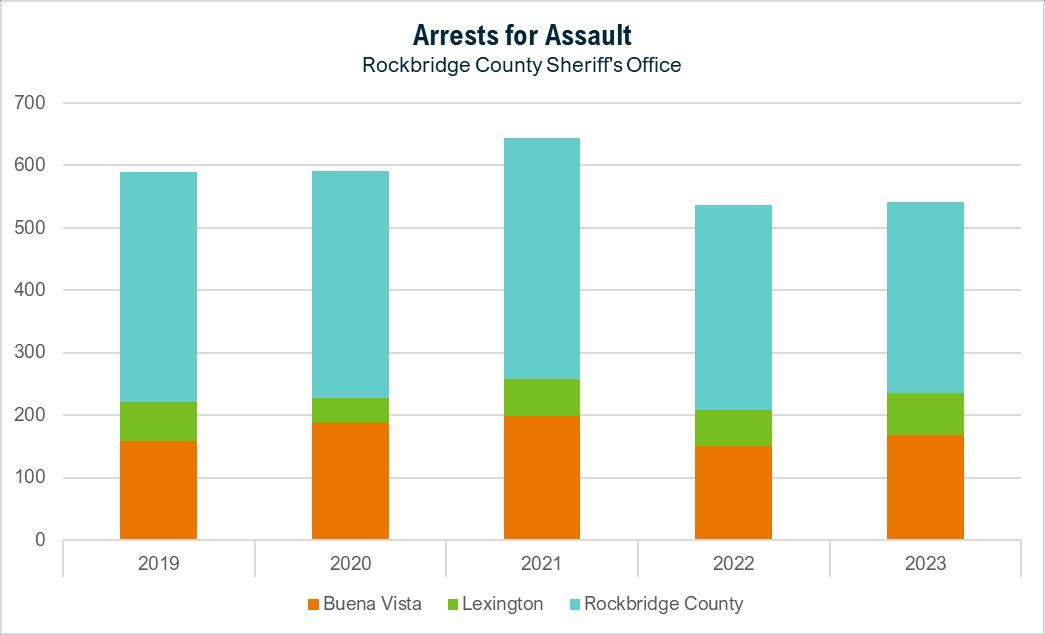
Data provided by the Rockbridge County Sheriff's Office also indicates a high burden of violence in the community with 500–600 arrests a year for assault, including verbal and domestic assault.
9 https://apha.org/policies-and-advocacy/public-health-policy-statements/policydatabase/2019/01/28/violence-is-a-public-health-issue
Community partners identified many key drivers of interpersonal violence, including mental health and substance use challenges, lack of family/social support, lack of community connection, trauma, unhealthy relationships and lack of support services Interpersonal violence can be very closely related to both SDOH and mental health and substance use challenges, further emphasizing the importance of cross-cutting strategies to address multiple health priorities.
Resources Available
A detailed list of community partners is available in Appendix G. Key resources to address interpersonal violence in the Rockbridge Area include:
• Project Horizon
• Law enforcement
• Crisis intervention team
Carilion Rockbridge Community Hospital Health Improvement Strategy
Carilion will continue to work with partners and develop a Community Health Improvement Plan for the Rockbridge Area, with expected completion before the end of calendar year 2024. Key focus areas will include not only the priority health outcomes, but also cross-cutting ways to address those outcomes by improving access to care and addressing SDOH.
Carilion will also participate in a planning process with LHR, leading to the development of a community-wide strategic plan to address health needs in conjunction with hospital-specific strategies. This community-wide plan will be reviewed and updated regularly with LHR partners to reflect completed and ongoing initiatives and emerging needs.
Appendix A: IRS Compliance Crosswalk
501R Requirement
Define the community served. Take into account the geographic area served.
Take into account target populations served.
into account principal functions
Does not delineate to exclude medically underserved, low-income, or minority populations.
Account for patents without regard to insurance payments or FAP eligibility.
Assess the health needs of the community. Identify significant health needs
Prioritize those needs. 13
Health needs include requisites for improvement of maintenance of health status in the community at large.
F
Health Needs Include requisites for improvement of maintenance of health status in particular parts of the community. Appendix F
Identify resources potentially available to address them. Appendix G
Solicit and take into account input from persons representing the broad interests of the community, including those with special knowledge of public health.
Include all of the following sources to Identify and prioritize significant health needs and identify potentially available resources: Public health department official. 5, 10
Members of medically underserved, low-income, and minorities in community served, or individuals/organizations serving or representing them. 5-6, 10-11
Written comments received on the hospital facilities most recent conducted CHNA and implementation strategy.
Document the CHNA in a written report that is adopted for the hospital facility by an authorized body.
Definition of community served and how this was determined. 7-10
Description of process and methods used to conduct the CHNA. 7-13
Description of how broad-interested community input was solicited and taken into account. 10-14
Description of the process and criteria used to identify needs as significant. 10-13 Appendix F
Prioritize the significant needs. 13, Appendix F
Description of resources potentially available to address identified significant health needs. 19, 23, 26 Appendix G
Evaluation of impact of actions taken to address previous CHNAidentified significant health needs. 14
Describe the data and other information used in the assessment. 17-26; Appendix H
Describe the method of collecting and analyzing this data and information. 7-13
Identify any CHNA- related collaborative or contracted parties n/a
Describe how Carilion takes into account input received from persons representing broad interests of the community:
Input provided. 5, 7-13
How and over what time period input provided. 5, 7-13
Name, nature, and extent of organizations providing input. 5-6, Appendix B
Describe medically underserved, low-income, or minority populations being represented by those providing input. 5-6, 10-11 Appendix B
Adopted by Board 3
First Name Last Name Organization Type Organization
Marylin Alexander Local Government Representative Lexington City Council
Lori Ashbridge FQHC Rockbridge Area Health Center
Leslie Ayers Local Government Representative Rockbridge County Board of Supervisors, FOR Swimming
Beth Bland Senior Services VPAS, Maury River Senior Center
Nick Bilbro Healthcare-Carilion Carilion Clinic
Sade Bowers Health District Virginia Department of HealthHealth Educator
Malcolm Brownlee Community Organizer United Way and Rockbridge Baths Community Organization
Jenna Cline Mental Health Rockbridge Area Community Services
Patti Cook FQHC Rockbridge Area Health Center
Elisabeth Copp Youth Services Girl Scouts - Skyline Council
Anna Crockett Faith Community Rockbridge Community Health Foundation and Grace Episcopal Church
Jenny Davidson Higher Education Washington and Lee University
Alessandra Del Conte Dickovick Higher Education Washington and Lee University
Jen Dent United Way United Way of Rockbridge
LaTonya Douglas SDOH focused organization Tap Head Start
Tammy Dunn Youth Services Lexington City Office on Youth
Carol Fitzgerald Domestic Violence Project Horizon
Brandy Flint Local Government Representative Rockbridge County, Director of Economic Development
Melissa GladwellSayre Senior Services VPAS, Maury River Senior Center
Shirley Holland Healthcare-Carilion Carilion Clinic
Jutta Hopkins Healthcare - Hospice ConnectionsPlus Healthcare
Julie Jenkins Chamber of Commerce Chamber of Commerce
First Name Last Name Organization Type Organization
Jim Jones State Park Natural Bridge State Park
Jan Kaufman Higher Education Washington and Lee University Health Promotion
Greg Madsen Healthcare-Carilion Carilion Rockbridge Community Hospital
Dorina Mattioli Mental Health Rockbridge Area Community Services Trauma Informed Care Network
Erynn Miller Healthcare-Carilion Carilion Clinic
Monique Moore SDOH focused organization Tap Head Start
Hattie Myers Local Foundation Rockbridge Community Health Foundation
Alex Neal SDOH focused organization Tap Head Start
Stephanie NoelBranch Healthcare-Carilion Carilion Clinic Internal Medicine
Holly Ostby Healthcare-Carilion Carilion Clinic
Rebecca Owen Food Access Virginia Cooperative Extension FCS SNAP-Ed Agent
Jennifer Palmer CSB Live Healthy Rockbridge Kids
Malachi Palmer Prevention Services Rockbridge Area Prevention Council
Lindsey Perez SDOH focused orgs Rockbridge Area Resource Association
Vicki Pickle Healthcare-Carilion Carilion Rockbridge Community Hospital
Kristina Ramsey Local Government Representative BV City - Economic Development
Stephanie RiCharde Transportation Rockbridge Area Transportation System
Molly Roberts Healthcare-Carilion Carilion Clinic
BreAnne Rogers CSB Rockbridge Area Community Services
Suzanne Sheridan FQHC Rockbridge Area Health Center
Justin Skinner Insurance Provider Anthem Medicaid
First Name Last Name Organization Type Organization
Tasha Walsh Healthcare - Hospice Rockbridge Area Health Center
Michelle Watkins Transportation VPAS, Maury River Senior Center
Laura Lee Wight Health District Virginia Department of HealthPopulation Health
Alexa Williams Healthcare Rockbridge Area Health Center
Christian Worth United Way United Way of Rockbridge
Appendix C: Community Health and Well-Being Survey
Due to the nature of the Community Health and Well-Being Survey and its public availability through online methods, data validation was necessary To validate survey responses, data was filtered by zip codes within Carilion’s entire service area. These responses were used for further data analysis.
Method Using their community knowledge, data collectively reviewed, and additional data shared, CHAT members were asked to complete an electronic survey to prioritize community health topics prior to CHAT meeting 3:
• The survey matched the structure utilized during the data walk at CHAT Meeting 2
• First prioritized broad categories, then specific topics within those categories
• CHAT facilitators ranked the following to develop results:
o Broad categories (resulting top 3 indicated by bold type below)
o Topics within each of the 3 top broad categories
o Remaining topics
• Results include:
o Top 3 topics of each of the top 3 broad categories
o Top 4 topics of the remaining categories
Results* Mental Health/Substance Use
• Substance use
• Poor mental health
• Overdoses
Chronic Disease
Using the results of the Prioritization Survey, the group was asked to individually choose 5 topics to prioritize:
• The CHAT facilitators hung pages around the meeting room, each with one of the topics from the Prioritization Survey results.
• Utilizing a poll within the Teams meeting, each attendee was asked to choose the top 5 topics they felt were the most important to address in the next three years.
• The voting results were available immediately.
• The CHAT was presented with the top 5-7 topics. The number of results presented depended on any ties and how closely votes were distributed. If topics were additional (i.e. not in the true top 5), CHAT facilitators noted this to the group and separated them visually on the screen.
Top 6:
• Substance use
• Poor mental health
• Overweight/obesity
• High blood pressure
• Depression
The group was asked to reflect on the results of the dot voting exercise. The following points were made during that discussion:
• Mental Health vs. Substance Use vs. Depression
o Mental Health should be considered separately from Substance Use
o Depression can be included with poor mental health
o Substance Use should include tobacco use, vaping and cover all ages
• High blood pressure and heart disease can be combined.
• Domestic Violence had nearly as many votes as the other top needs and should be included
Top 5:
• Substance use
• Poor mental health/depression
• Overweight/obesity
• Overweight/obesity
• Diabetes
• Heart disease
Injury/Violence
• Firearm injuries/deaths
• Domestic violence/intimate partner violence
• Motor vehicle crashes
Maternal/Child Health & Infectious/Communicable Disease
• Teen pregnancy
• Infant mortality
• STIs
• Hepatitis C
• Heart Disease
Additional:
• Domestic violence/intimate partner violence
• Heart disease/high blood pressure
• Interpersonal Violence
o Domestic violence
o Child abuse
o Elder abuse
*Results are not presented in any ranked order.
The following organizations have been identified in the community that address the prioritized needs. Additional community resources are available, but the included list was considered representative of the primary organizations addressing each topic area at the time of this report’s publication.
Alcoholics Anonymous of Rockbridge Co. Alcohol/Substance Abuse Programs (540) 261-3411
AMC: Crossroads
Mental Health and Substance Use
Chronic Disease
Interpersonal Violence
Health Services (540) 332-4060
Rockbridge Area Community Services (RACS) Mental Health and Alcohol/Substance Abuse Programs (540) 463-3141
Eagle’s Nest Clubhouse
Abuse Programs (540) 261-2870
League of Therapists Mental Health Services (540) 264-0100 The Coffee House of Rockbridge Mental Health Services (540) 463-4482
Boxerwood Nature Center and Woodland Garden Enviromental Education (540) 463-2697
Bridge to Hope Food Pantry Food Pantry (540) 460-9131
Buena Vista Health Department
(540) 985-8078 Carilion Rockbridge Community Hospital Health Services (540) 458-3300 Lexington/Rockbridge County Health Department Health Services (540) 463-3185
Natural Bridge/Glasgow Food Pantry Food Pantry (540) 291-2578 RARA Food Pantry Food Pantry (540) 464-8484
Rockbridge Area Health Center Health Services (540) 464-8700
Rockbridge Area Relief Association Food Services (540) 463-6642 The Community Table Food Services (540) 416-1828
Blue Ridge CASA for Children Children Advocacy (540) 213-2272
Buena Vista Victim/Witness Assistance Program Domestic Violence Services (540) 261-2523 DSS- Adult Protective Services Children and Elder Advocacy (540) 463-7143 Lexington Victim/Witness Assistance Program Domestic Violence Services (540) 464-5917 Project Horizon Domestic Violence Services (540) 463-2594
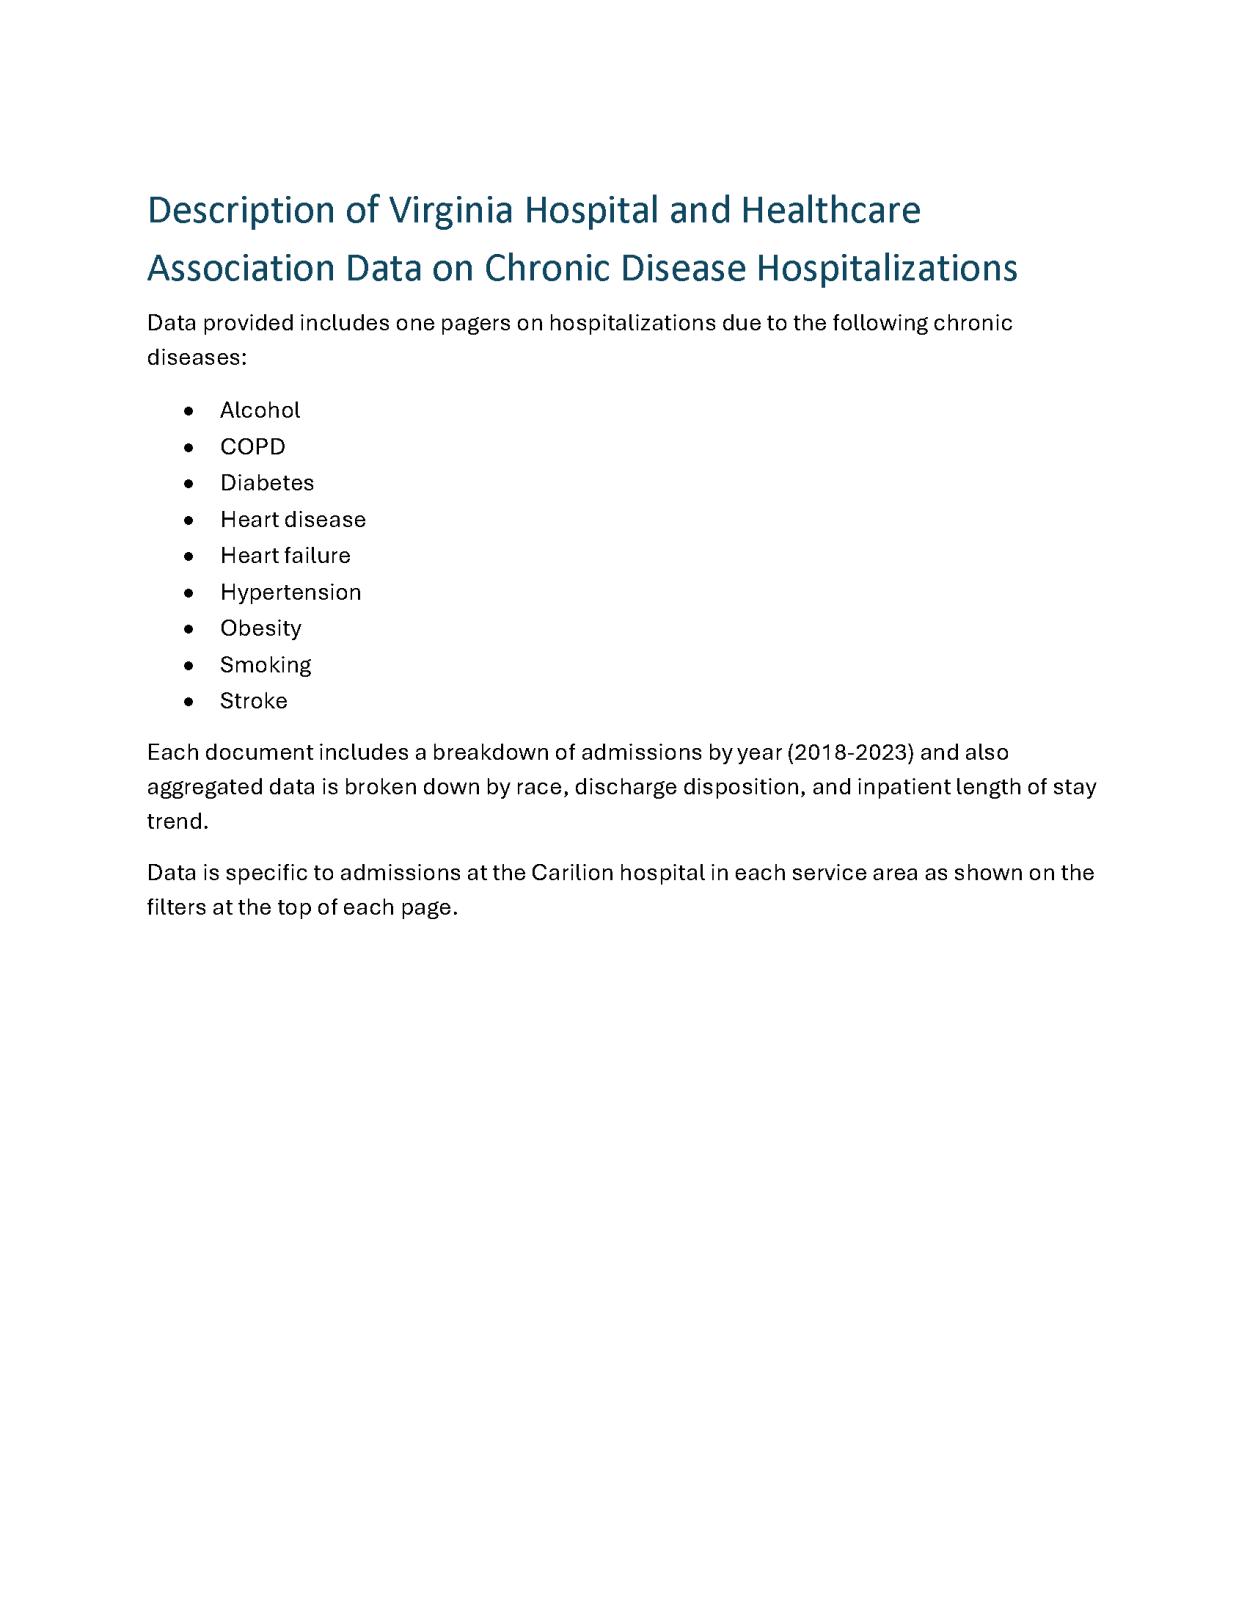
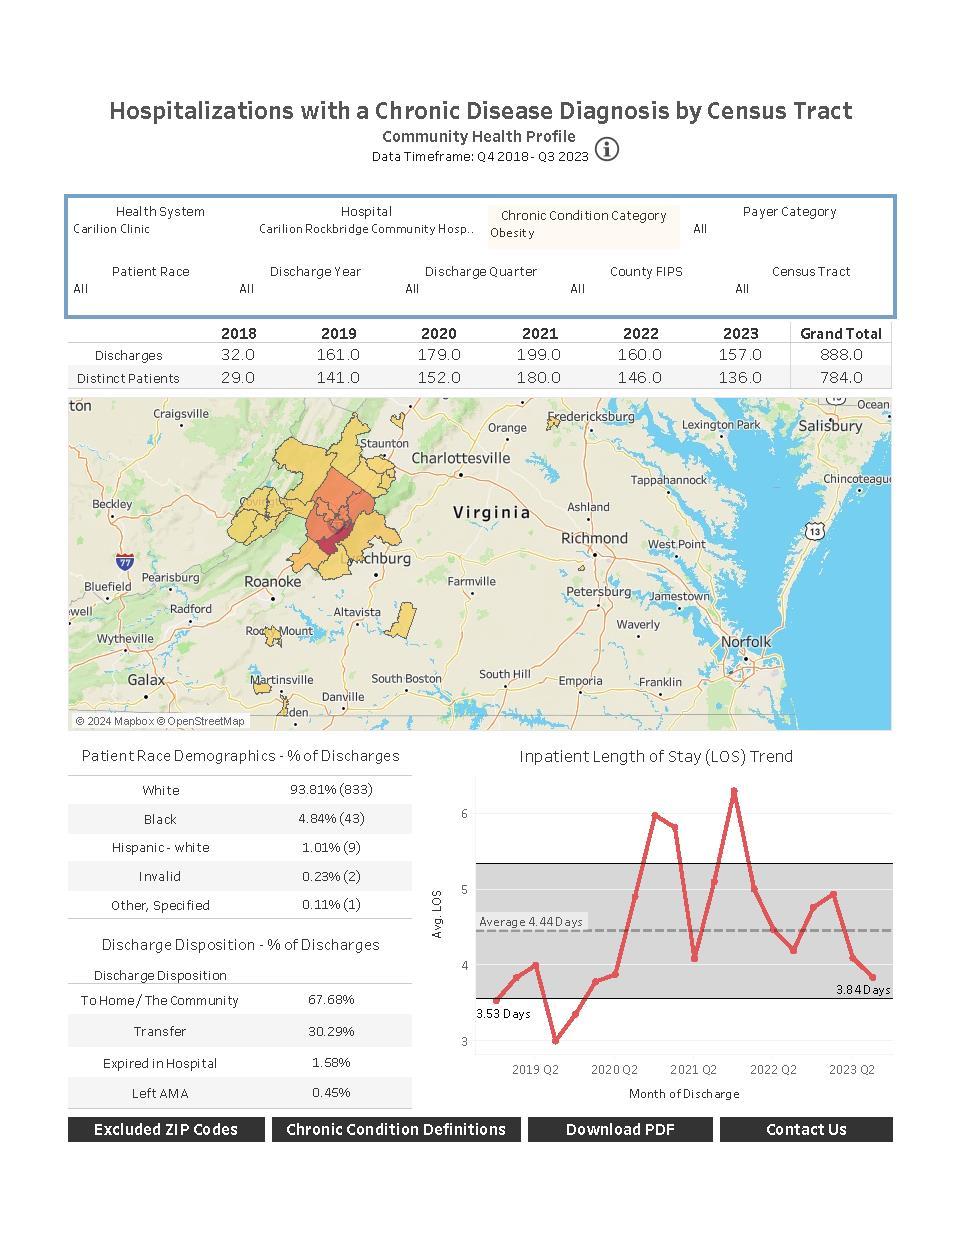
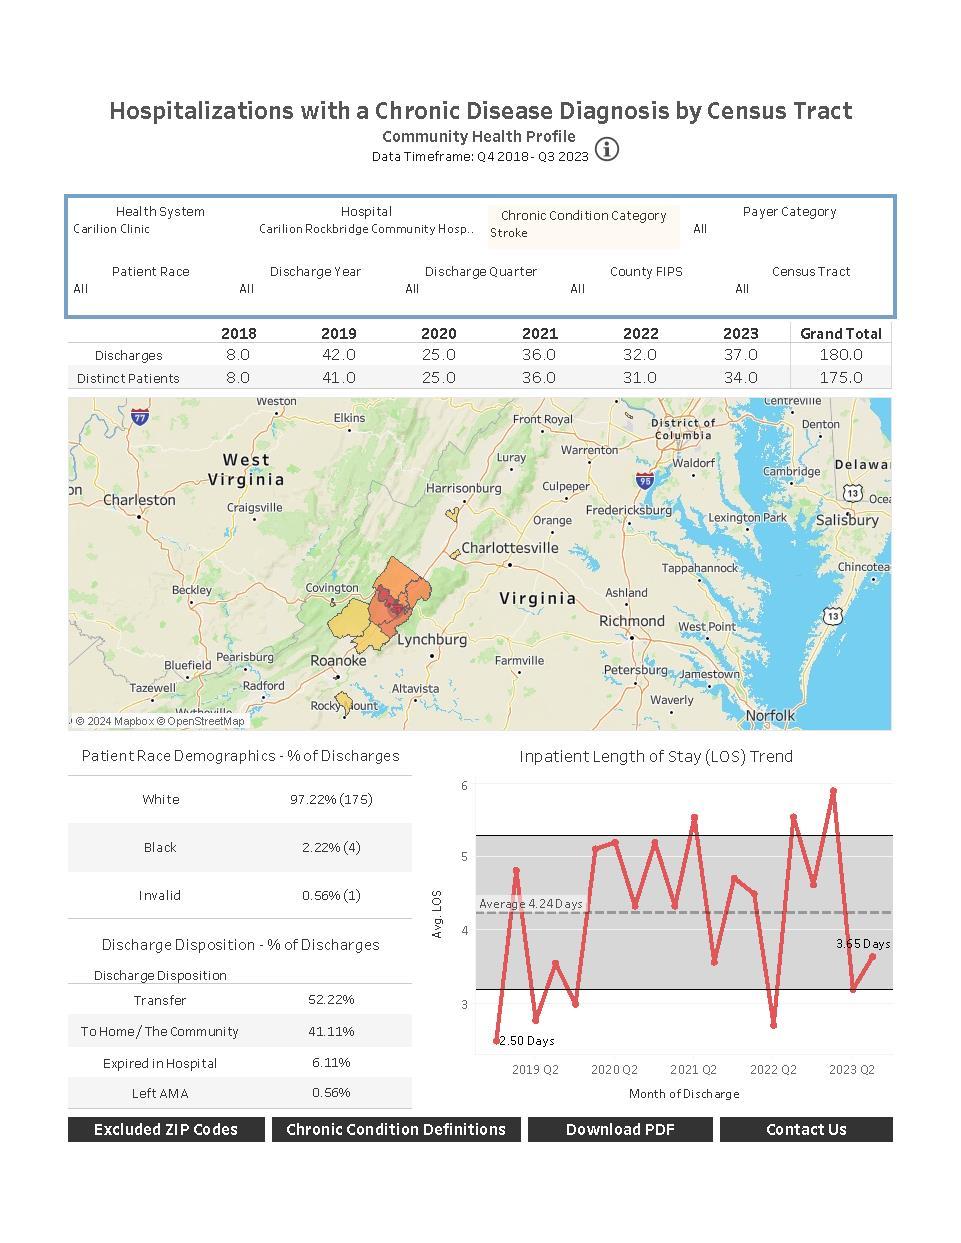
The following pages include secondary data shared with the CHAT as well as chronic disease hospitalization data access through the Virginia Hospital and Healthcare Association (VHHA) Analytics data portal.
Key Takeaways: Secondary Data shared with the CHAT for Data Walk
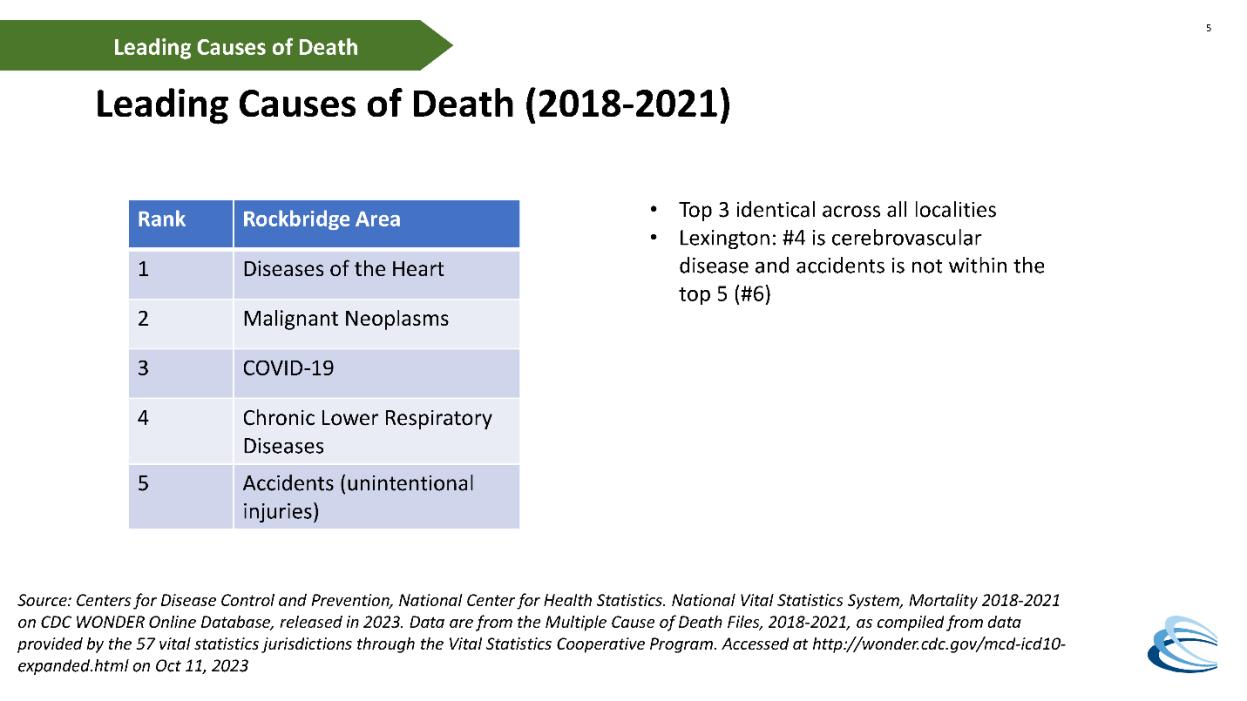
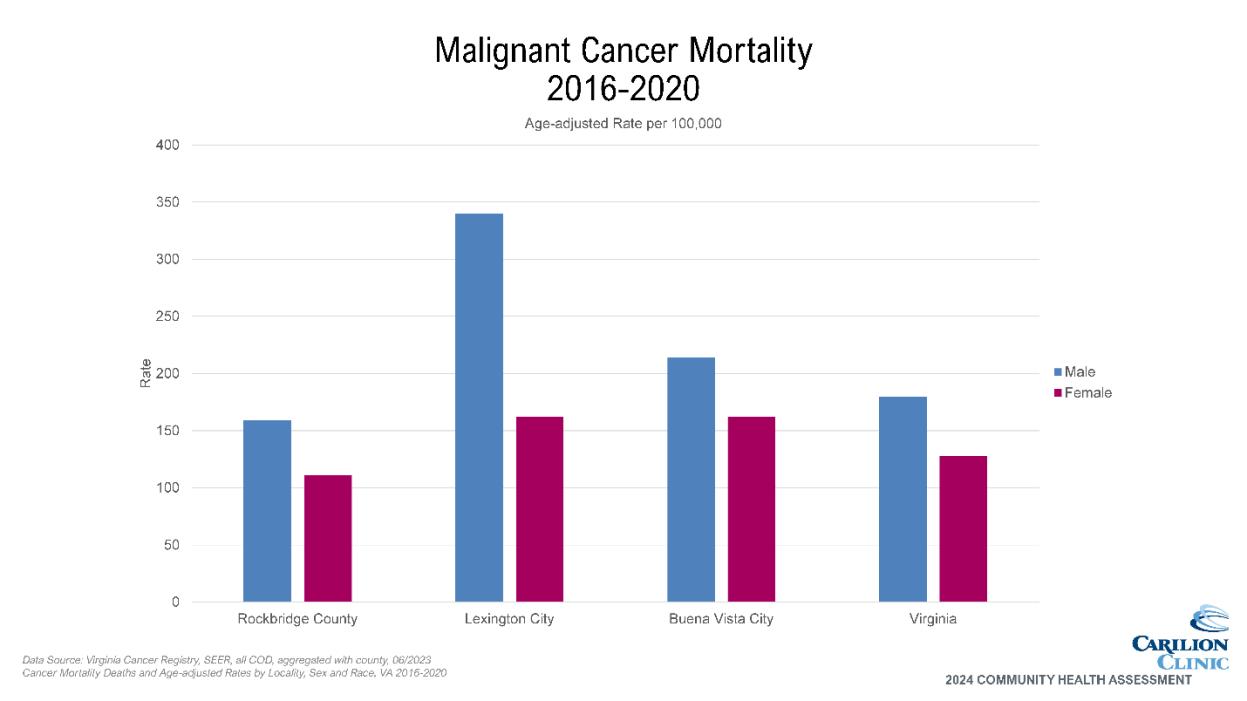
Leading causes of death (2018-2021); generalized across service area
1. Diseases of the heart
2. Malignant neoplasms
3. COVID-19
4. Chronic lower respiratory diseases
5. Accidents (unintentional injuries) [includes overdoses]
Mental Health/Substance Use
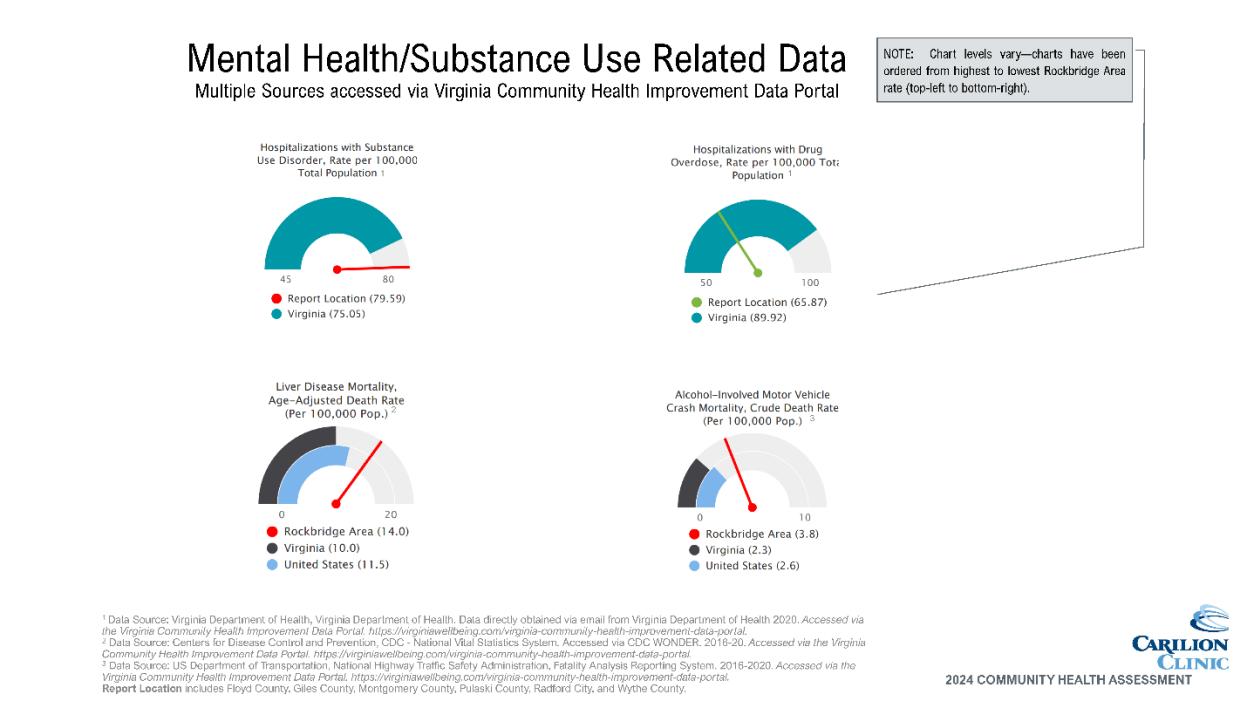
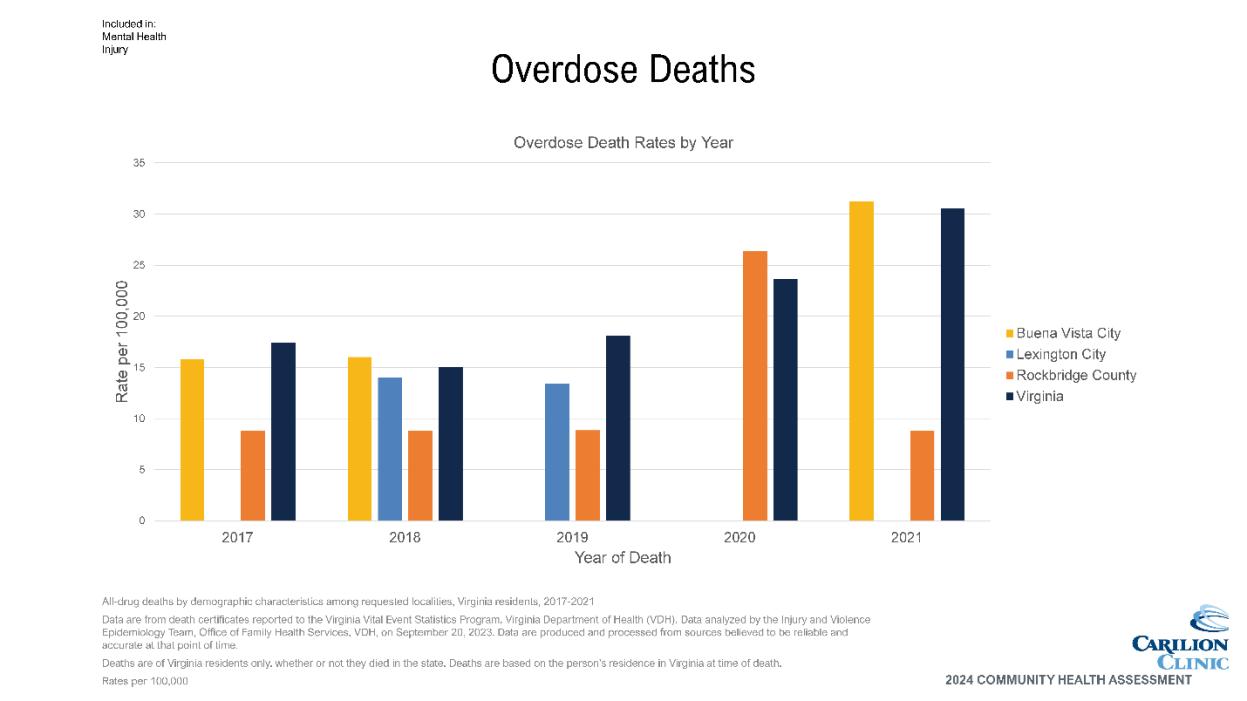
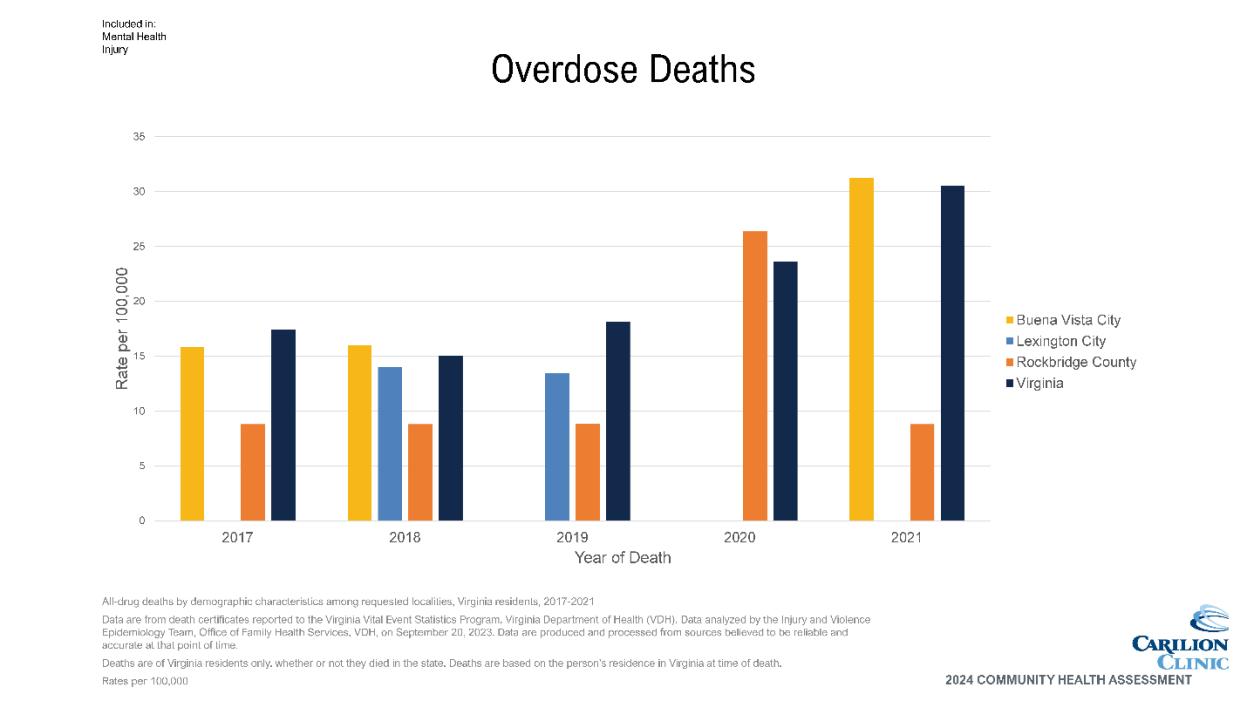
• Overdose deaths vary by year and locality, sometimes higher than Virginia and sometimes lower.
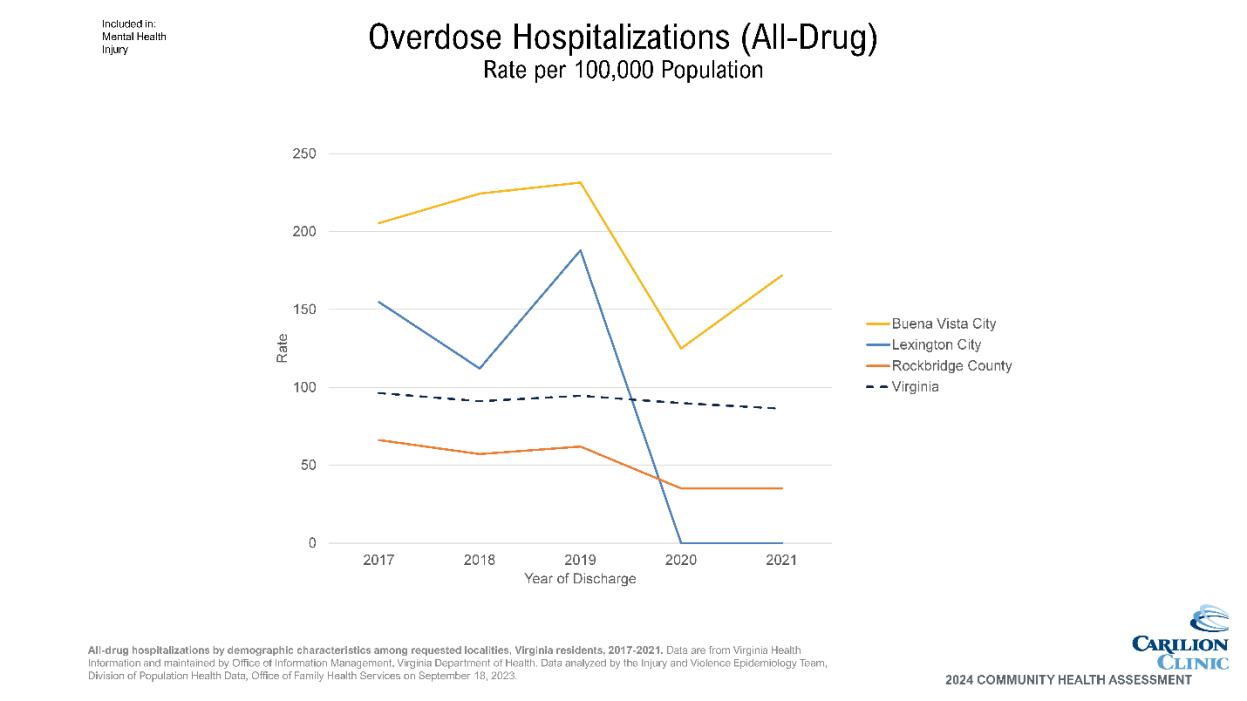
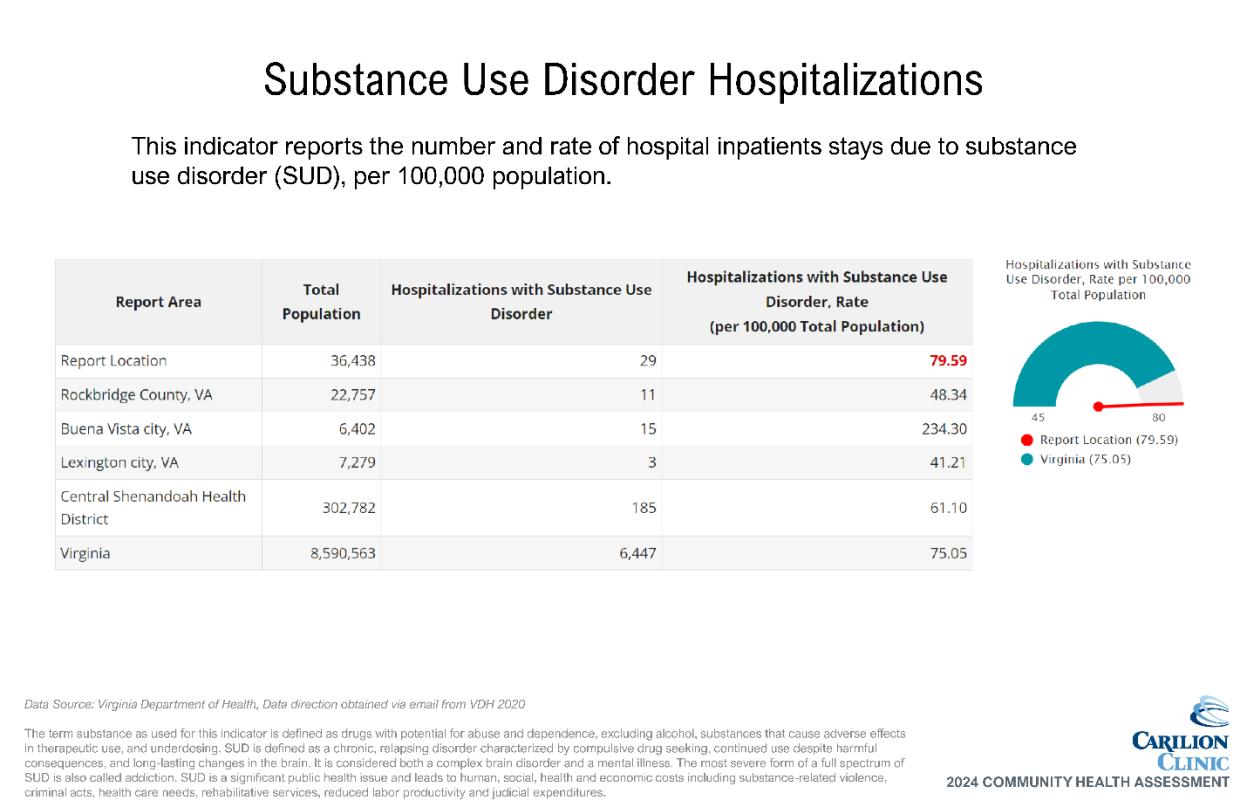
• Overdose hospitalizations are highest for Buena Vista, and regularly higher than Virginia. Rockbridge County hospitalizations are lower than the Virginia average. This metric includes all hospitalizations, even those that end in a fatality.
• Self-reported data on adults with depression indicates a higher percentage across service area than Virginia and the US.
Maternal/Child Health
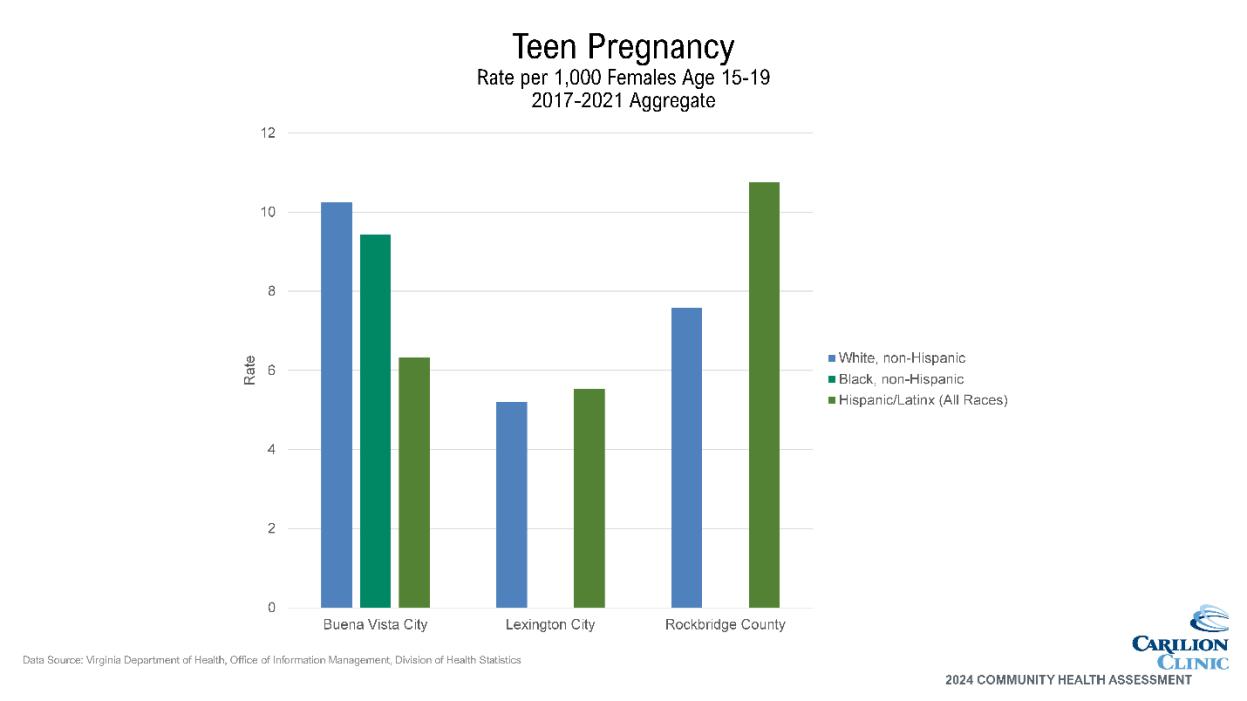
• Teen pregnancy rates appear higher for Hispanic/LatinX females in Rockbridge County than other localities or race/ethnicities.
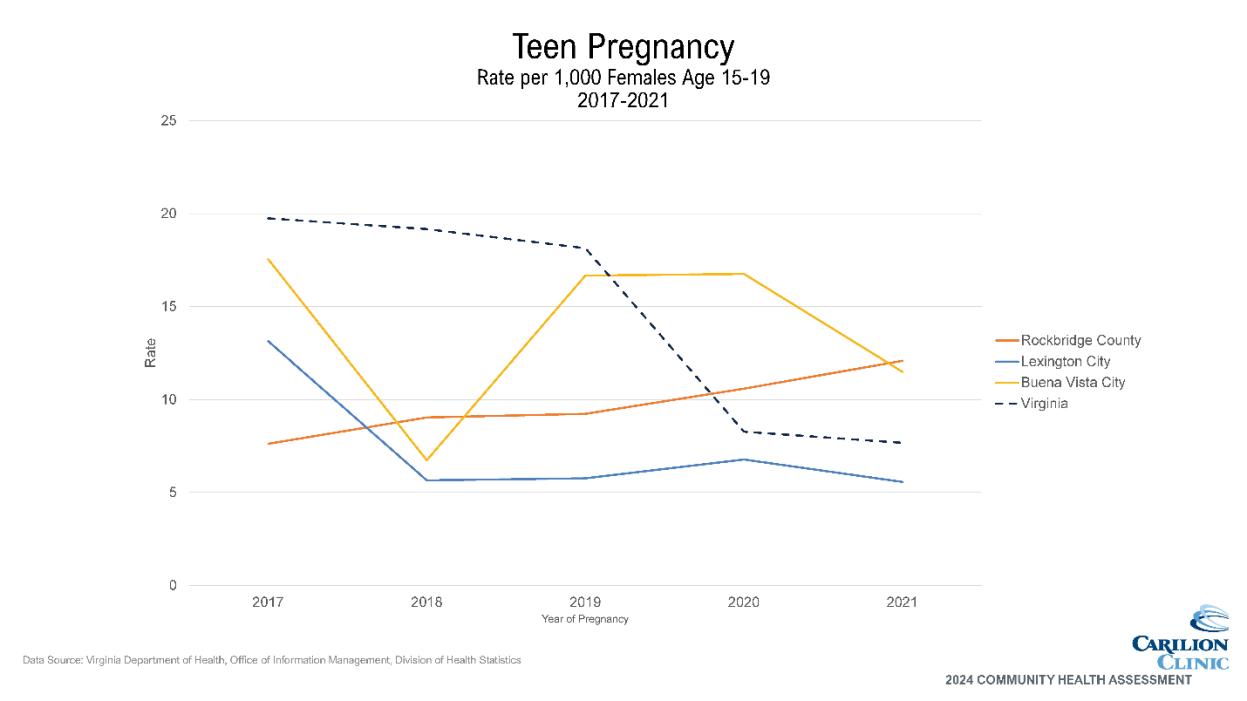
• Teen pregnancy has generally been highest in BV across service area, though in 2021 Rockbridge County surpassed BV. Rockbridge County seems to be increasing in trend, while the other localities may be decreasing.
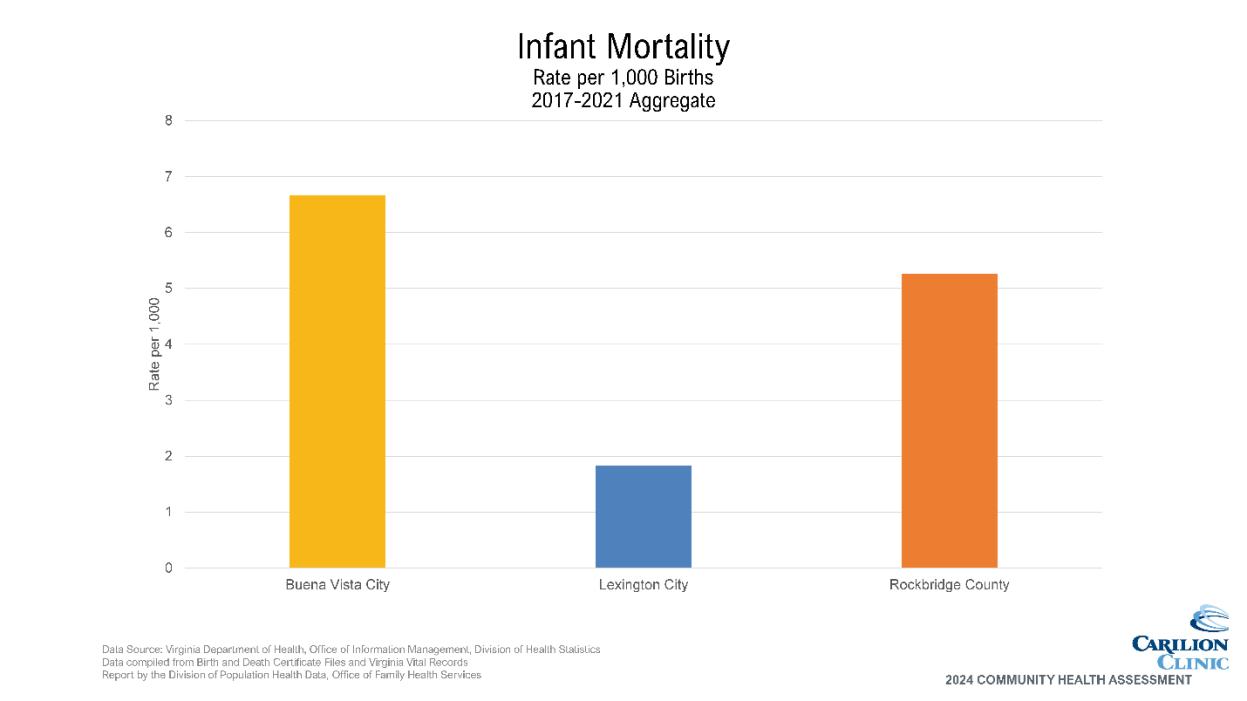
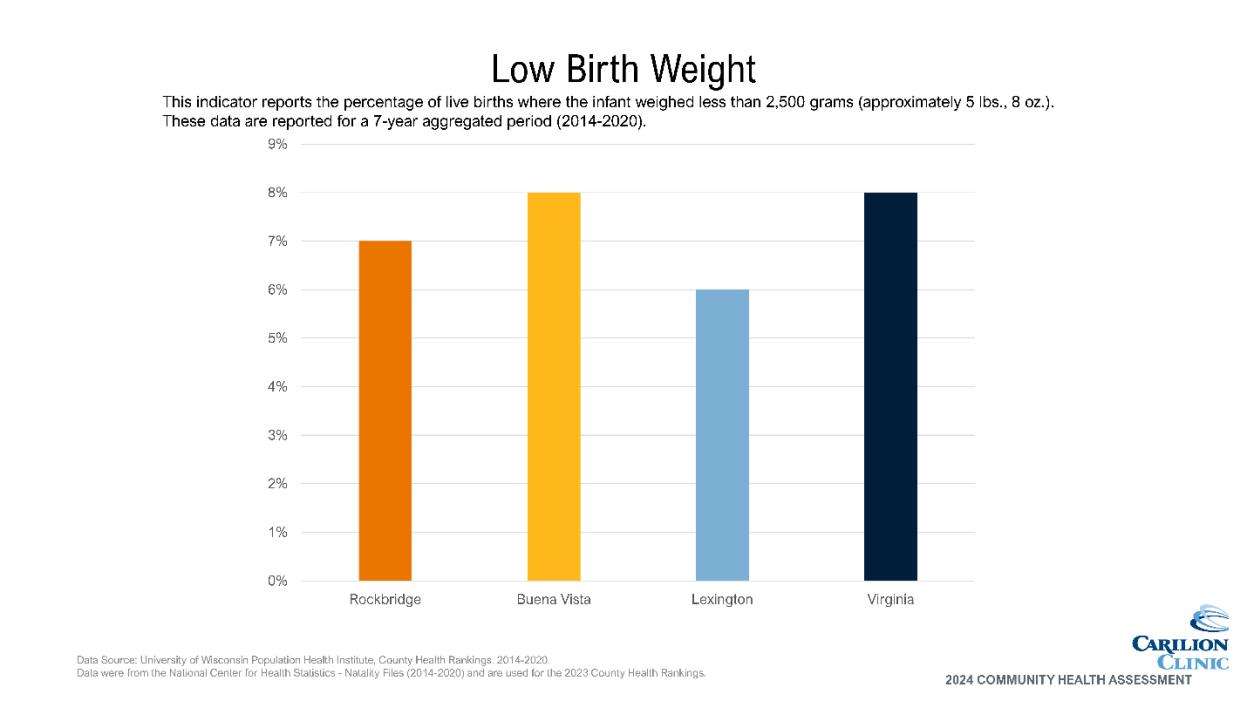
• Buena Vista is comparable to VA with percentage of births meeting the criteria for low birthweight. Rockbridge and Lexington are both less than the state average.
Injury/Violence
• According to Rockbridge County Sherriff’s Office, arrests for domestic assault/assault on family member are declining.
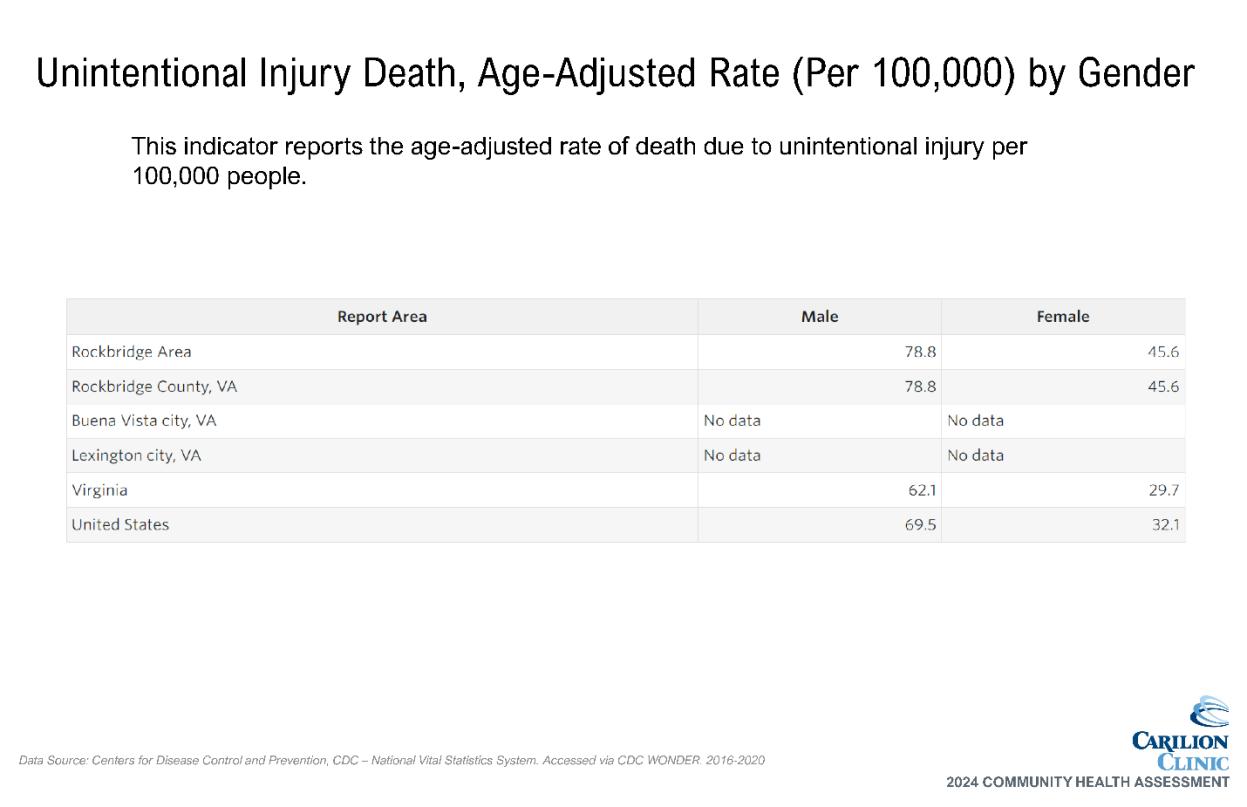
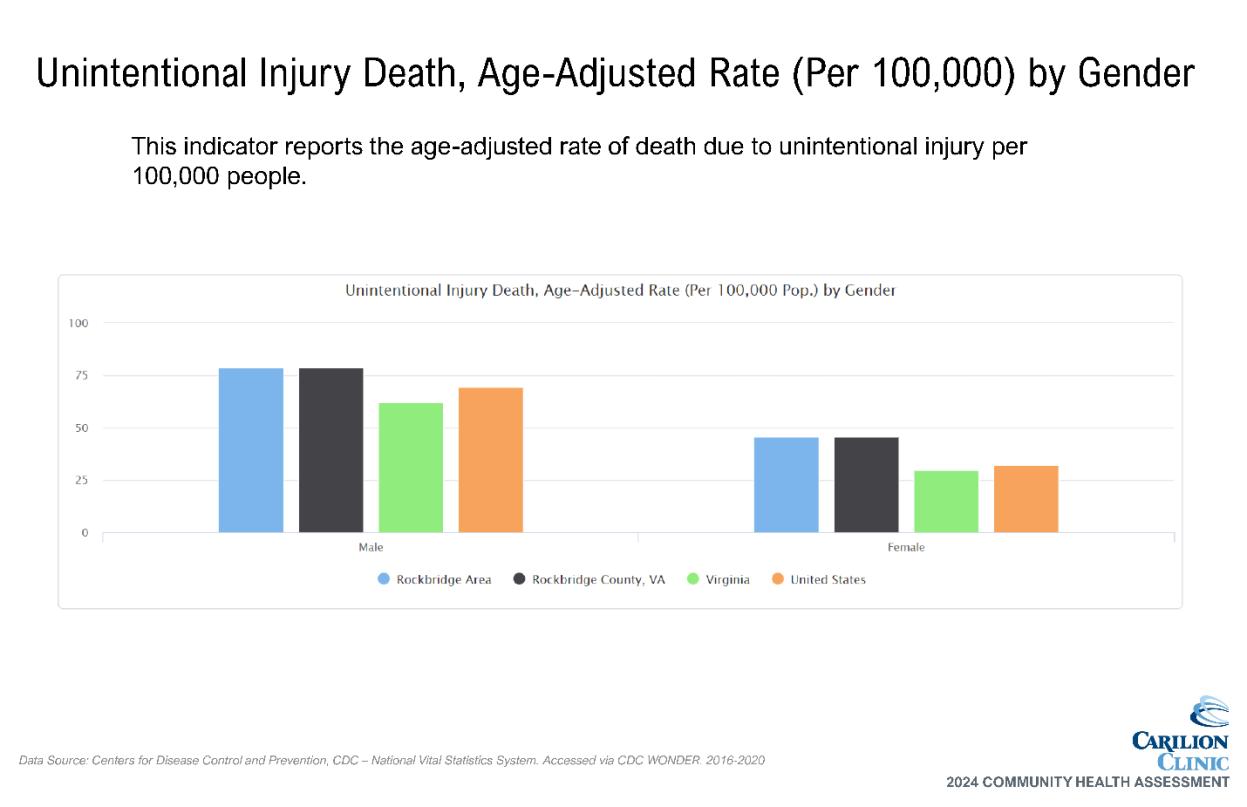
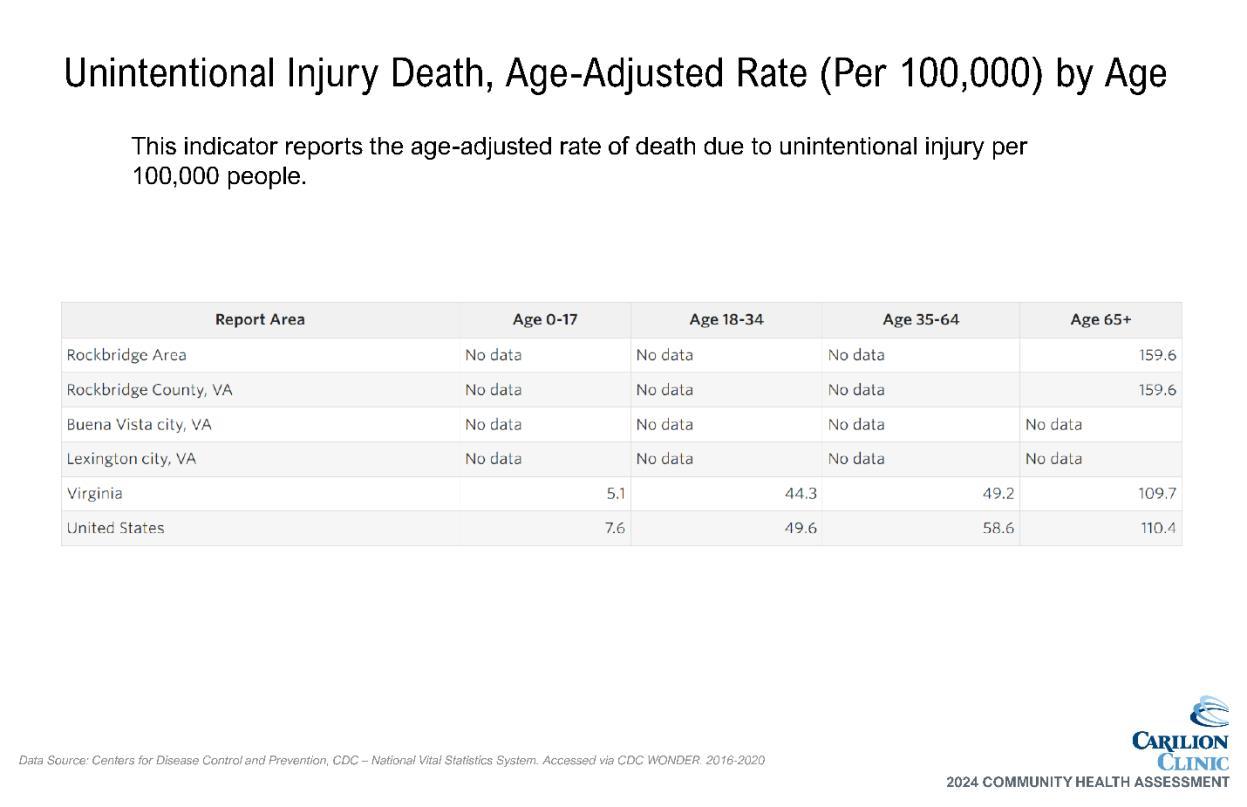
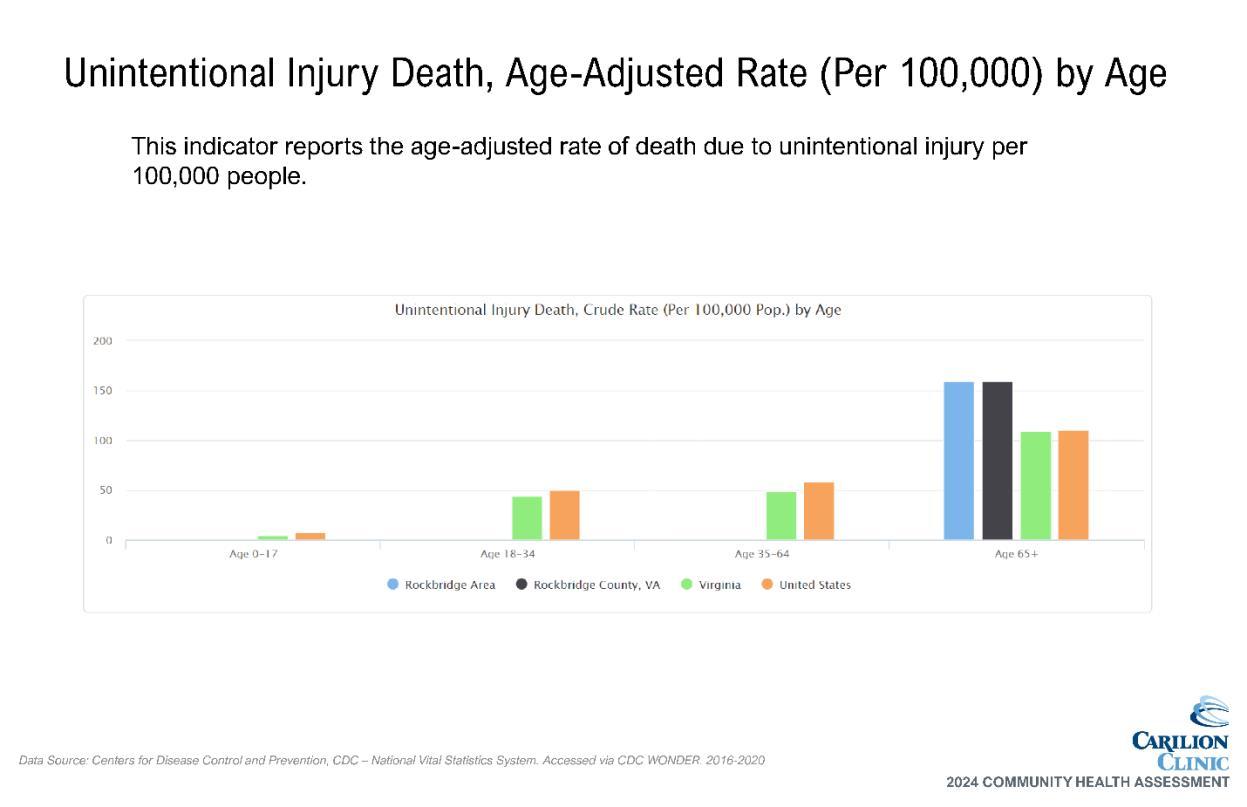
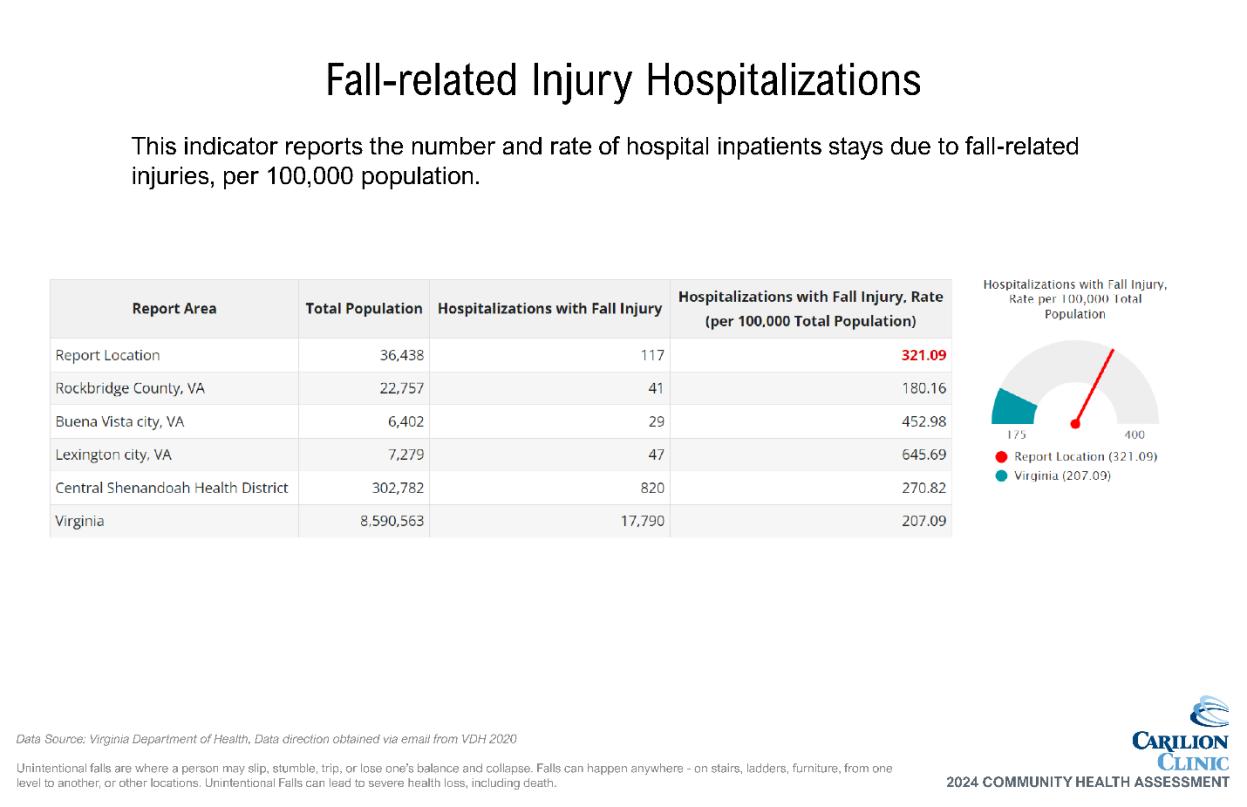
• The Unintentional Injury death rate for the Rockbridge Area is higher than that of VA and the US.
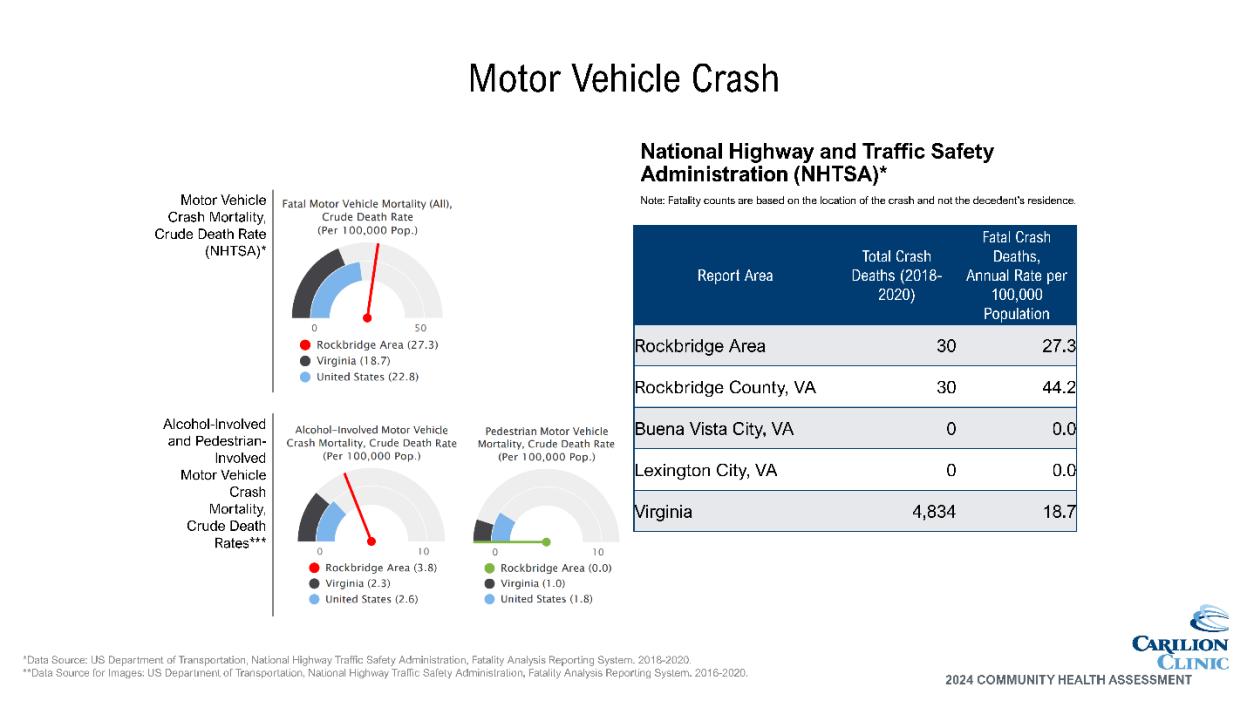
• Motor Vehicle fatalities are also higher.
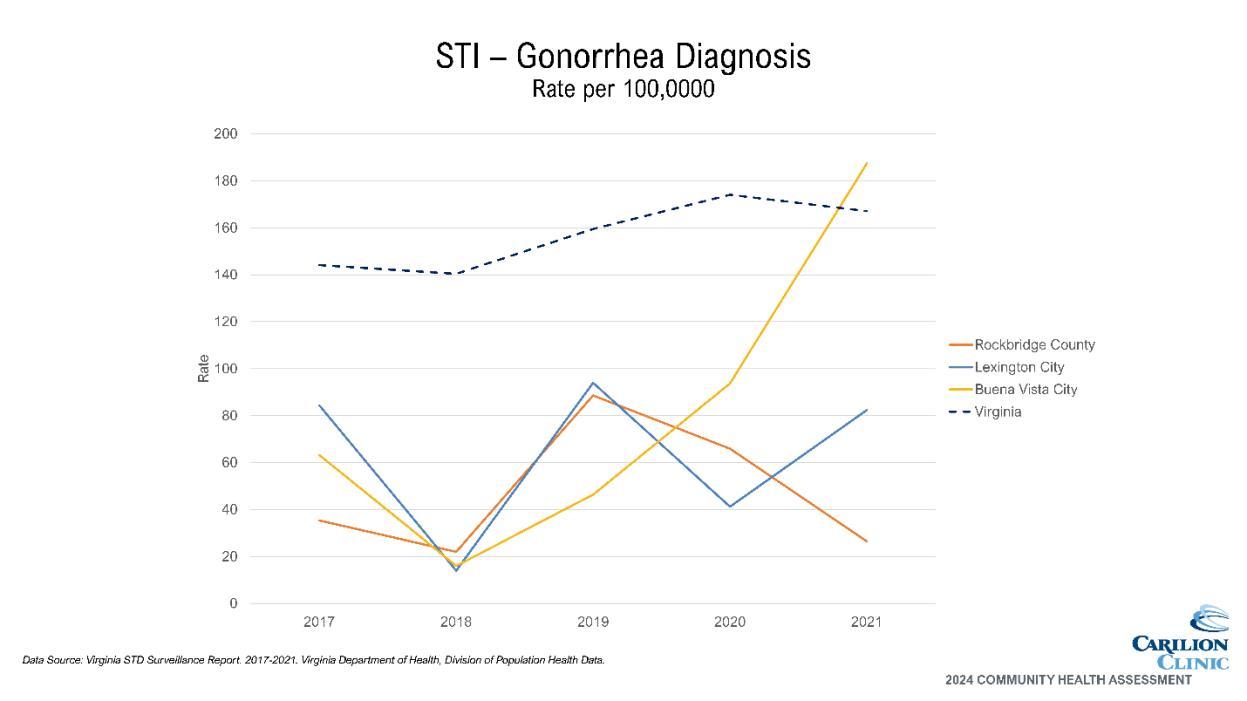
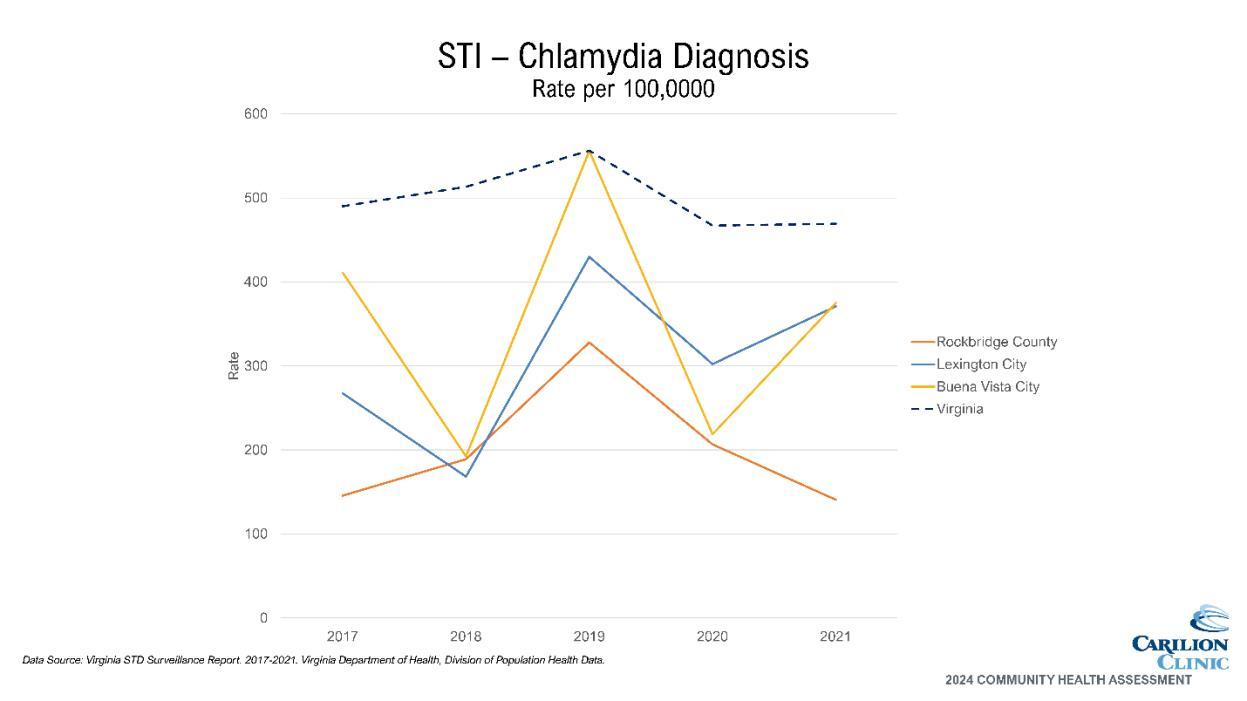
Infectious/Communicable Disease
• Buena Vista is significantly surpassing the rest of the service area with rates of gonorrhea diagnoses and trending upwards, as is Lexington. Rockbridge County rates are decreasing.
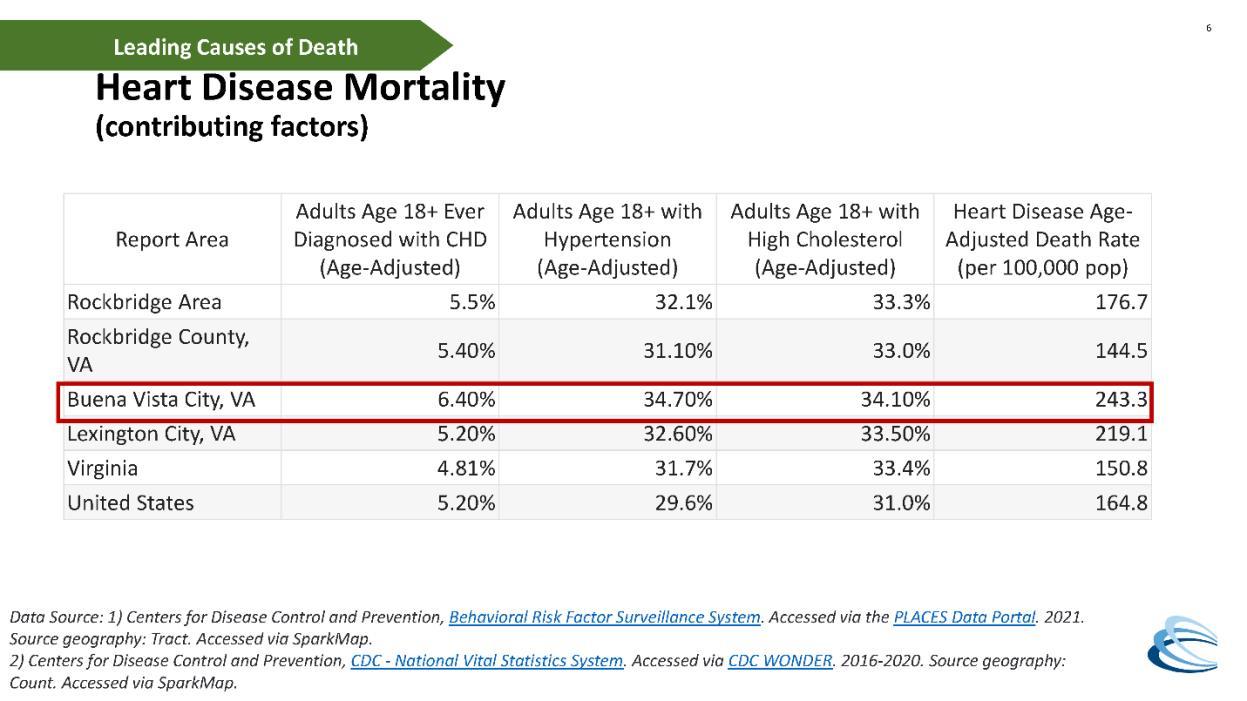
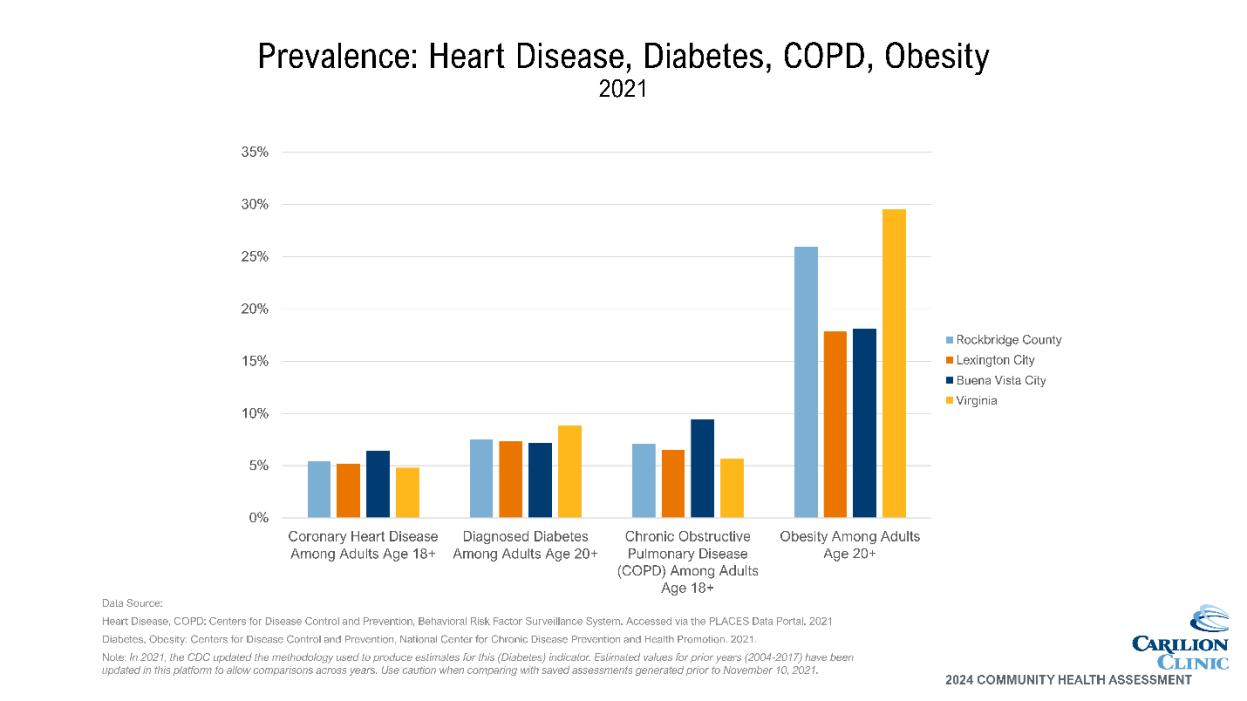
• Chronic disease hospitalizations are highest for hypertension and diabetes. Buena Vista and Lexington have the highest rates, surpassing that of VA and of Rockbridge County, which is lower than the state average.
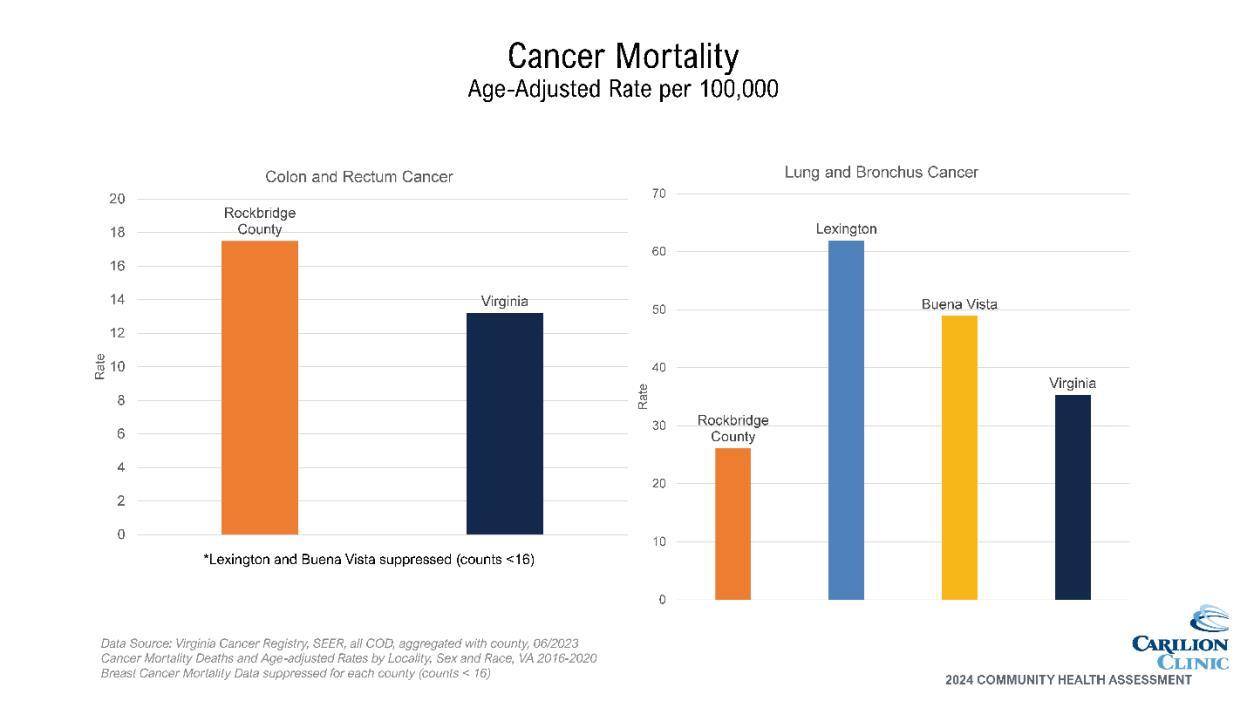
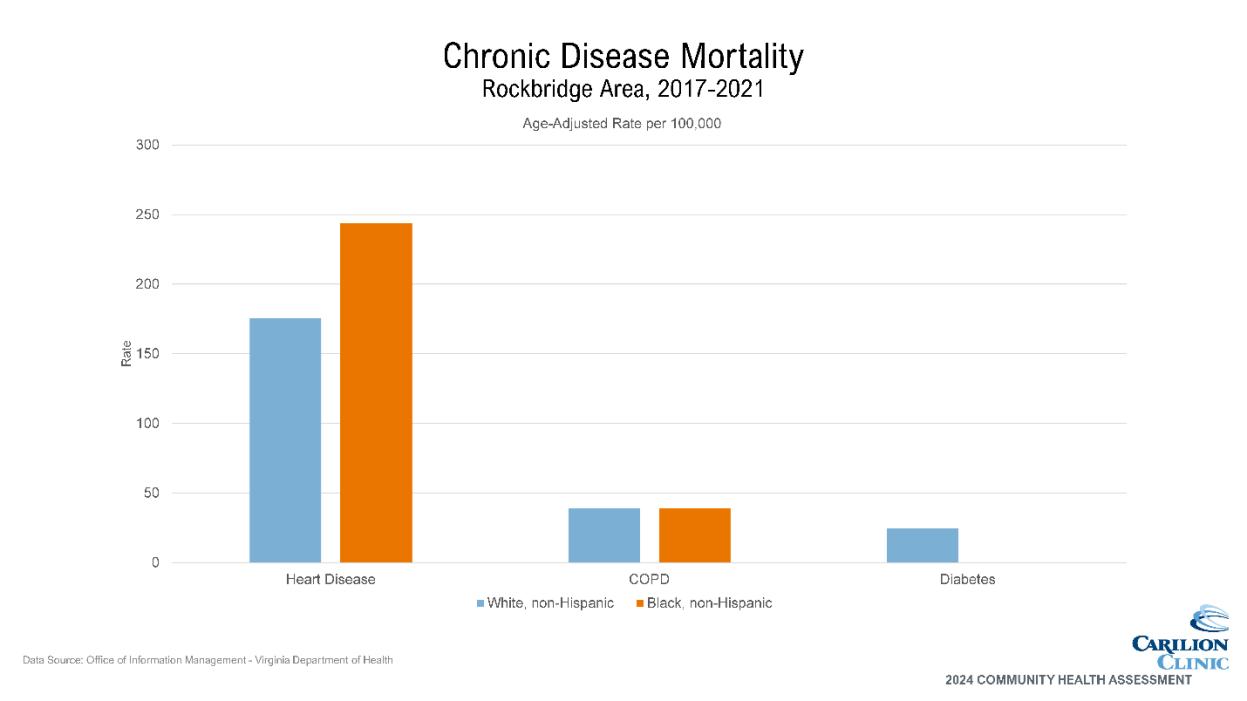
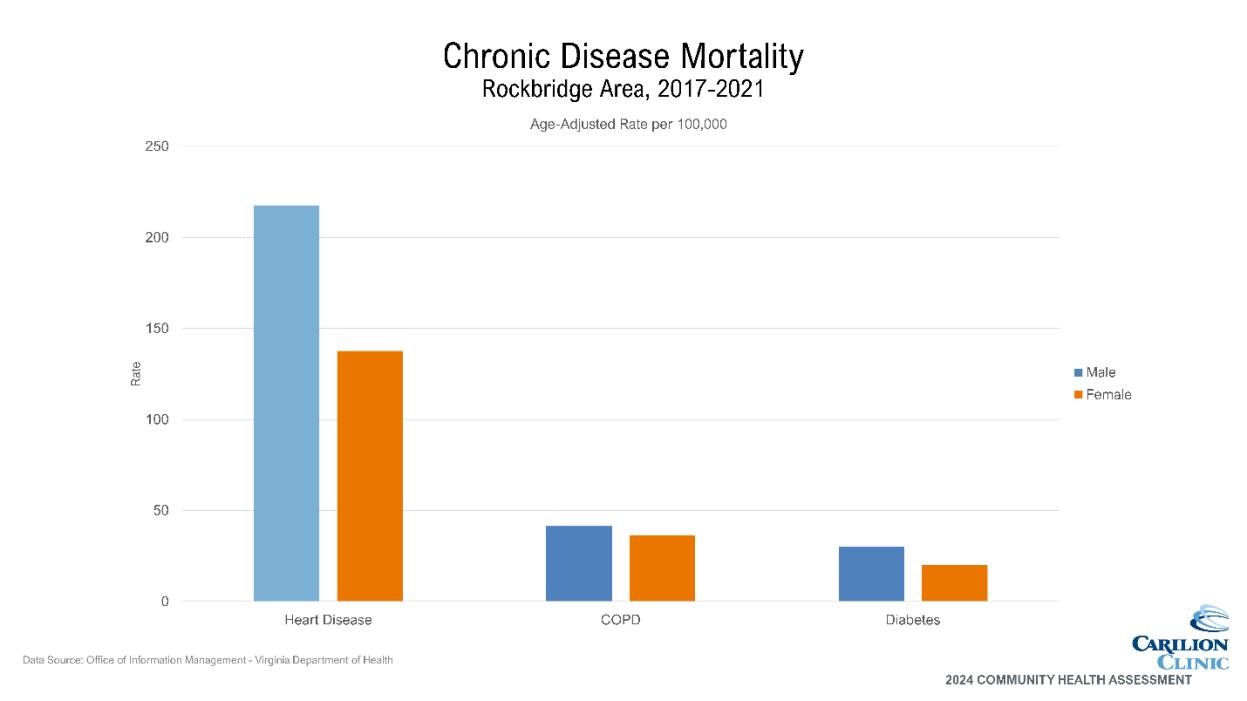
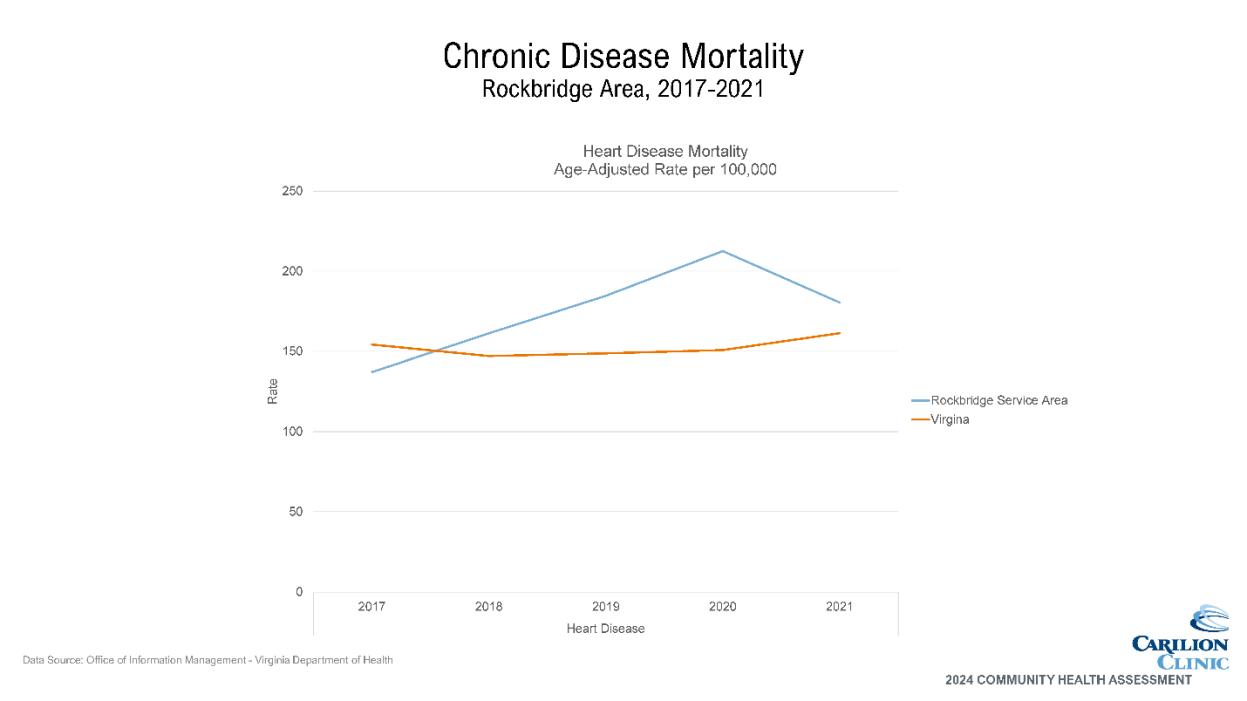
• Mortality due to heart disease is higher across the service area than Virginia.
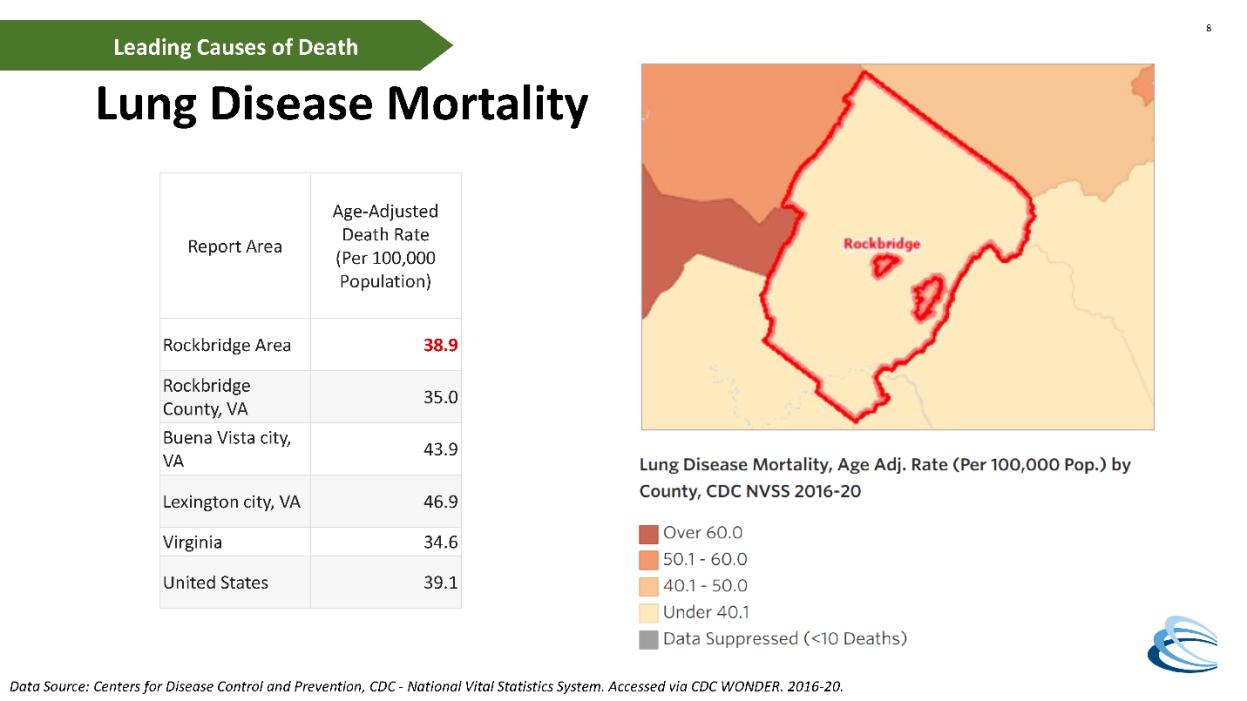
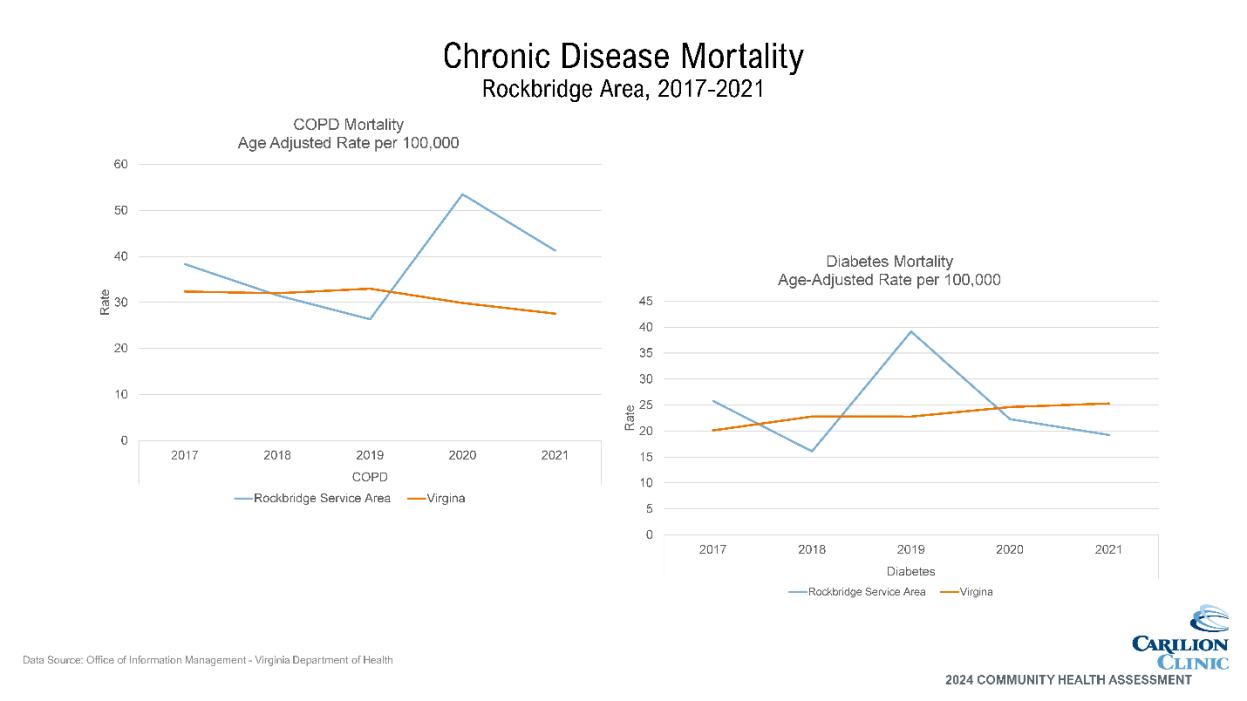
• Mortality due to COPD jumped above the VA rate in 2020 and remained higher than VA in 2021.
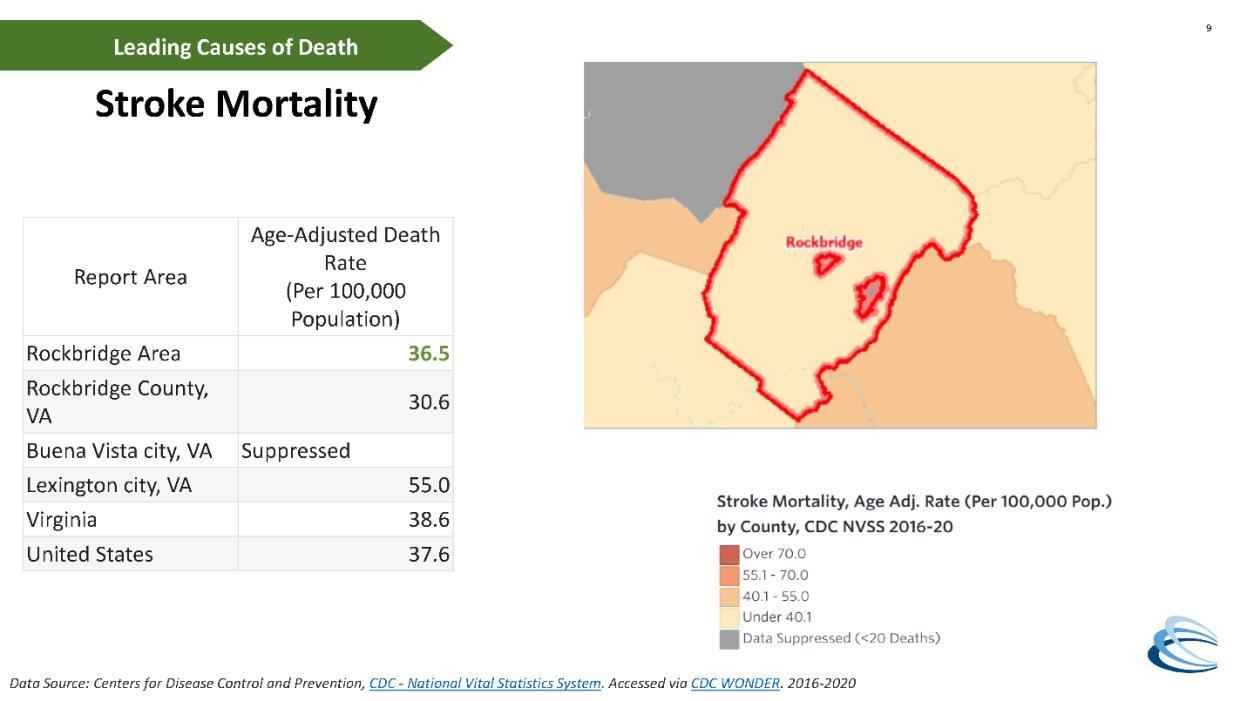
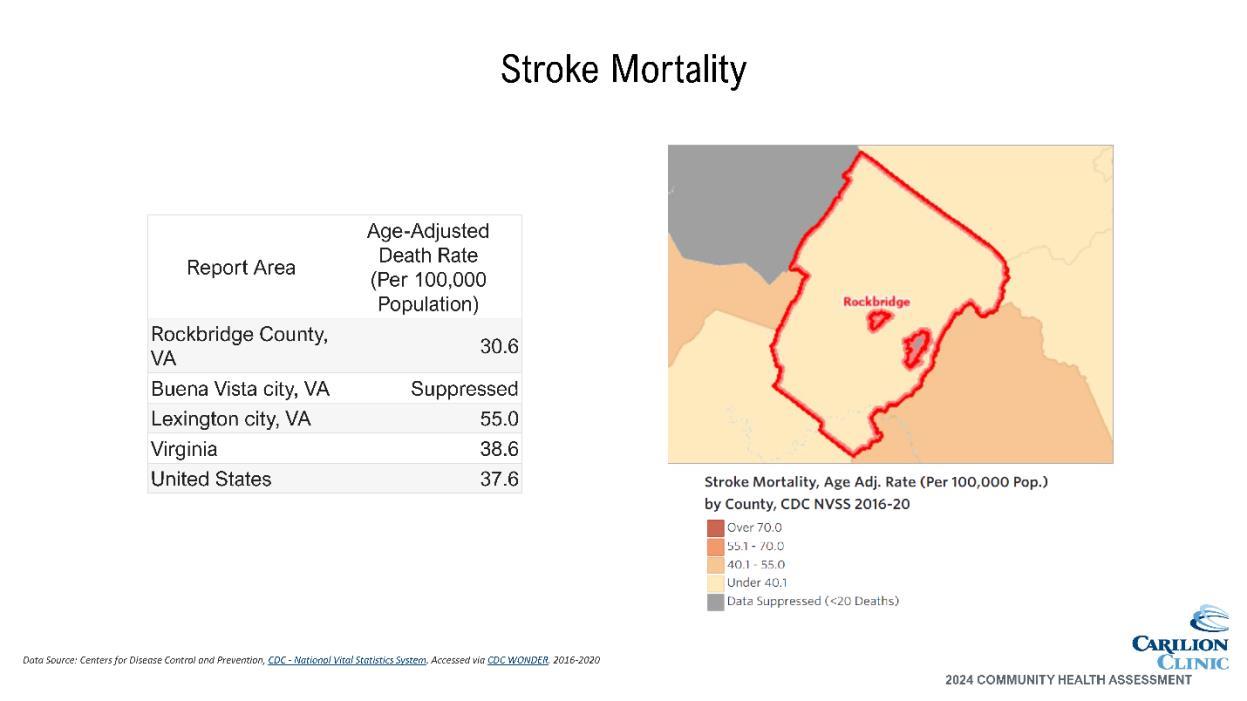
• Lexington has a much higher stroke mortality rate than the rest of the service area and the VA and US averages.
• Percentage of adults self-reporting obesity is highest in Rockbridge County, though all localities are lower than the VA average.