FISCAL 2022YEAR-23 BUDGET


Morgen Fry, Management Analyst, Office of the City Manager
Craddock Stropes, Public Works Admin.
Geoff Patnoe, Assistant City Manager
Jeff Murphy, Director, Community Development
Faviola Medina, City Clerk Services Manager, Office of the City Clerk
Bridget Desmarais, Management Analyst
Gary Barberio, Deputy City Manager, Community Services
Sheila Cobian, Director, Legislative and Constituent Services
Jason Rosado, City Treasurer’s Office
Budget preparation team
Scott Chadwick, City Manager
Chad Kantner, Parks & Recreation
Mickey Williams, Chief, Police Department
Department budget preparers & reviewers
Richard Schultz, Library & Cultural Arts
Conrad Avila, Finance
Jeremy Bates, Senior Management Analyst
Mike Calderwood, Chief, Fire Department
Maria Callander, Director, Information Technology
Jason Haber, Director, Intergovernmental Affairs, Office of the City Manager
Esther Lan, Transportation
Tom Mallory, Communications & Engagement
Kim Riboni, Finance
Zach Korach, Director, Finance
Mandy Mills, Director, Housing & Homeless Services
Paz Gomez, Deputy City Manager, Public Works
David Graham, Chief Innovation Officer, Innovation & Economic Development
James Wood, Jr., Director, Public Works Environmental Sustainability
Debbie Porter, Human Resources
Pat Downie, City Clerk’s Office
Finance team
Shawn Gaskari, Fleet & Facilities
Robyn Nuschy, City Attorney’s Office
Tom Frank, Director, Public Works Transportation
Bradley Northup, Fleet & Facilities
Cindy Anderson, Police Department
Kristina Ray, Director, Communication & Engagement
Megan Powers, Environmental Sustainability Sarah Reiswig, Risk Management
Laureen Ryan, Community Development Sarah Sanders, Risk Management
Laura Rocha, Deputy City Manager, Administrative Services
Suzanne Smithson, Director, Library & Cultural Arts
Cindie McMahon, City Attorney
Debbie Jo McCool, Library & Cultural Arts
Zach Korach, Finance Director
Brent Gerber, Information Technology
Brigid Drury, Finance Manager
John Maashoff, Manager, Public Works Fleet & Facilities
Shoshana Aguilar, Utilities
Sue Armstrong, Communication & Engagement
Baq Taj, Engineering Manager, Public Works Construction Management & Inspections
Vicki Quiram, Director, Public Works Utilities
Ed Garbo, Risk Management
Jennie Marinov, Fire Department
Judy Von Kalinowski, Director, Human Resources
Kyle Lancaster, Director, Parks & Recreation
Fiona Everett, Library & Cultural Arts
Kayla Hanner, Finance
Kaylin McCauley, City Council Roxanne Muhlmeister, Finance
Bonnie Elliott, Parks & Recreation
Cynthia Vigeland, Community Services
Leadership team
E 1 Organization Chart .......................................................................................................................E 2 Community Services Administration E 3 Community Development E 5 Housing & Homeless Services ......................................................................................................E 16 Library & Cultural Arts E 26 Parks & Recreation.......................................................................................................................E 41
TABLE OF CONTENTS
Manager’s Transmittal Letter A 1 Readers Guide ..............................................................................................................................A 4 Budget Process A 5 Public Engagement.......................................................................................................................A 7 Strategic Plan A 7 About Carlsbad A 12 Organization Chart A 23 Fiscal Issues and Financial Management A 25 Financial Management Policies....................................................................................................A 29 Appropriation Limit A 33 Debt Management .......................................................................................................................A 34 Basis of Budgeting........................................................................................................................A 36 Budgetary Fund Structure A 37
INTRODUCTION
OPERATING BUDGET
PUBLIC WORKS
City
Summary C 1 Organization Chart C 2 Fire Department...........................................................................................................................C 3 Police Department C 10
C OMMUNITY S ERVICES
Summary
Summary D 1 Organization Chart D 2 Public Works Administration........................................................................................................D 3 Construction Management & Inspection D 5 Environmental Sustainability .......................................................................................................D 7 Fleet & Facilities ...........................................................................................................................D 14 Transportation D 19 Utilities .........................................................................................................................................D 26
PUBLIC SAFETY
Overview B 1 Revenue B 2 Expenditures ................................................................................................................................B 13 Personnel Allocations………………………………………………………………………………………………………………B 20 Schedule of Projected Fund Balances ..........................................................................................B 22 Schedule of Revenue Estimates B 24 Schedule of Budget Expenditures ................................................................................................B 30
...........................................................................................................................H
.........................................................................................F
Office of the City Council G 3
Projected Fund Balances for Fiscal Year 2021 22 I 16
Summary G 1
Office of the City Attorney G 9
Organization Chart F 2 Administrative Services Administration F 3 Finance F 5
.....................................................................................................I
Unfunded Projects 15
Investing in Digital Transformation H 2
Projected Fund Balances for Fiscal Year 2022 23 17 Revenue Projections Schedule I 18
CAPITAL IMPROVEMENT PROGRAM
Overview I 1
Future Projects I 14
Projects to Foster a Vibrant Civic Engagement Culture ...............................................................H 24 Projects to Enhance Accessibility and Transparency H 25 Projects to Promote Security and Sustainability Through Connectivity ......................................H 29
STRATEGIC DIGITAL TRANSFORMATION INVESTMENT PROGRAM
Projects to Pursue Communitywide Digital Transformation........................................................H 10
Detail Five year Schedule of Projects by Connected Carlsbad Goal H 39
Funding Sources 41
........................................................................I
Human Resources 7 Information Technology F 14
Information Technology Strategy H 3
Office of the City Manager 7
...........................................................................................................G
F 1
Revenues I 12
Miscellaneous Non Departmental 18
Investing in our Quality of Life 2 Project Evaluation I 2
New Capital Improvement Projects I 5
................................................................................................I
Calculation of Future Fees............................................................................................................I 15
.......................................................................................................................G
Future Growth and Development 13
Office of the City Clerk 11
Project Evaluation 2
Detail Five year Schedule of Projects by Fund.............................................................................H 40
........................................................................................................................F
Project Funding Sources H 41
ADMINISTRATIVE SERVICES
Fiscal Year 2022 23 Roadmap H 42
.......................................................................................................................I
Communication & Engagement G 13
Future Projects H 37
Overview ......................................................................................................................................H 1
........................................................................................................................H
Projects to Build Capacity for Data driven Decision Making H 18
Summary
Office of the City Treasurer G 5
.................................................................................................................G
Innovation & Economic Development 16
POLICY & LEADERSHIP
...............................................................................................F
Estimated Total Appropriations by Goal 8
......................................................................................................................H
Fiscal Year 2022-23 Appropriations I-3
Organization Chart 2
Five year Roadmap 43
......................................................................................H
Capital Improvement Program Summary by Fund 41 Glossary of Capital Project Funding Sources 3
Budget Expenditure Schedule 19
............................................................J
.....................................................................................................................................J-1
Resolutions Adopting the Budget 37
Detail 15-Year Schedule of Capital Projects 1
Planned Major Capital Outlay Items Fiscal Year 2022 23 1 Out of State Travel Budget Fiscal Year 2022 23 J 2 Fund Classifications and Descriptions 5 Department/Fund Relationship 1
General Fund Forecast J 19
.................................................................................I-2
J
APPENDICES
................................................................................................J
................................................................................I-5
Acronyms 5 Budget Communications J-17
......................................................................................................I
Glossary J-13
...................................................................................................J-1
I

• Adding four new full time lifeguard positions that will enable Monroe Street Pool to be open more hours. The city eliminated enough part time positions to offset the cost of three of the four new lifeguard positions.
Thanks to the City Council’s clear direction, the fiscal year 2022 23 city budget reflects strategic investments in the community’s top priorities including promoting public safety, protecting the environment and maintaining Carlsbad’s excellent quality of life.

• Beginning the planning process for Carlsbad’s newest park.
Community character
One of the community’s core values is maintaining Carlsbad’s small town beach community character. The fiscal year 2022 23 budget includes programs to enhance Carlsbad’s defining attributes and help the community feel connected, which include:
City Council goals
The budget provides the resources for work plans to achieve the goals set by City Council through its recent strategic planning process.
Budget overview
• Completing the development of objective design standards for multifamily homes citywide and in the Village and Barrio areas.
Dear City Council:
• Stepping up efforts to reduce homelessness in Carlsbad and its effects on the community.
• Building a temporary fire station on the site of the old power plant along the coast, as part of a comprehensive plan to ensure the city’s Fire Department is prepared to meet the community’s future needs.
The city’s financial health is supported by the City Council’s prudent budget policies, including setting aside funding for ongoing investments in digital and physical infrastructure. I would also like to acknowledge our city departments, which found new ways to make taxpayer dollars go further, reducing their operations and maintenance spending by an average of 2% during a year with 8% inflation in San Diego County
The $198.4 million fiscal year 2022 23 General Fund operating budget maintains all core city services at their current levels and continues more than a dozen programs approved by the City Council in recent years to enhance Carlsbad’s quality of life All city departments continue to follow a data driven approach to budgeting, which has allowed the City Council to make strategic decisions about where to focus resources and how to phase in larger investments over time.
Quality of life and safety
A 1
Carlsbad is one of the safest cities in the region thanks to investments in the city’s Police Department, Fire Department and critical infrastructure New and continued investments in the fiscal year 2022 23 budget include:
Organizational efficiency and excellence
• Hosting a new beach clean up event to involve the community in environmental protection.
• Managing the preservation of 6,200 acres of protected wildlife habitat.
• Expanding the light post banner program, which enhances a sense of place and promotes Carlsbad as a destination.
• Expanding community engagement and transparency, including livestreaming nearly 200 public meetings of city boards and commissions, in addition to City Council meetings.
By aligning the City Council, the community and city employees around common goals, the city will operate more efficiently and save money. New and recent investments include:
Economic vitality
A 2
• Continuing to partner with local and regional organizations to strengthen the economy.
• Increasing technical support to develop more data and GIS projects, improving operations and creating a better customer experience.
• Expanding arts grants in the community.
Environmental sustainability
Carlsbad is taking a strategic approach to environmental sustainability, striving to be a model for how to leverage partnerships and innovation to achieve climate goals. New and continued investments in the fiscal year 2022 23 budget that work toward this goal include:
• Advancing new environmental sustainability programs including phasing out more single use plastics in Carlsbad.
• Scaling the successful Life in Action Recruiter pilot program to double the number of job seekers and companies participating in this program, which connects qualified workers directly to Carlsbad companies.
• Meeting with local businesses on a regular basis so the city can support their needs.
• Adding a new position that will allow the city to increase assistance to those in need of affordable rental housing from 550 households a year to 600. About 60% of the cost for this position is eligible for federal reimbursement.
• Planting 500 trees to meet the goals of the Community Forest Management Plan
• Funding regular maintenance to keep several recent park improvements at top quality, including a new neighborhood park on the site of the former Buena Vista Reservoir and a new dog park at Poinsettia Community Park.
• Implementing a new fraud and ethics hotline to model best practices for fiscal responsibility
• Implementing the city’s new organics composting program.
• Completing an update to the city’s Climate Action Plan.
• Starting a new business process improvement program to identify operational resource efficiency opportunities.
• Making changes to city streets so they are more inviting to walkers and bikers.
The City of Carlsbad has a strong and diverse economy that combines a thriving small business community with leading industries of the future. Economic vitality supports the city’s financial stability and ensures more residents have the jobs they want right in their own backyards. The fiscal year 2022 23 budget includes:
The $42.6 million Capital Improvement Program budget covers construction or rehabilitation projects planned in the next fiscal year for major city infrastructure, including streets, libraries, parks, fire stations and administrative facilities, pipes, sewers and drains.
A 3

Capital Improvement Program
Scott Chadwick City Sincerely,Manager
General Fund reserve
The fiscal year 2022 23 budget includes 24 new full time positions. About 70% of these are police, fire and lifeguard positions. Others are needed to maintain utilities infrastructure, provide more affordable housing and manage the city’s data and technology needs. The city reduced part time positions by the equivalent of about 6 full time positions in next year’s budget for a net increase of 18.
After 35 years of rapid growth, we are approaching a time when the needs will shift to maintaining what has been built and protecting our excellent quality of life. It also represents a shift in revenue sources.
The City Council has a policy to maintain the equivalent of 40% of the annual General Fund operating budget in a reserve account. This helps ensure that during economic downturns, such as those caused by COVID 19, the city can continue to meet the community’s needs. In June 2022 the city was projected to have $116 million in reserves, or 63% of the annual General Fund operating budget.
Over the years, the city’s use of technology has become as critical to city operations as traditional infrastructure. The fiscal year 2022 23 budget includes $3.9 million of estimated new appropriations for the city’s Strategic Digital Transformation Investment Program as part of the five year expenditure plan for future digital transformation and technology projects.
Strategic Digital Transformation Investment Program
Projects prioritized by the City Council include installing new lighting and traffic circles in the Barrio, bringing the Monroe Street Pool expansion to voters and focusing on sustainable mobility projects.
The city is working on several strategies to address these changes. A citizens committee was appointed by the City Council to develop a new framework for managing growth in a way that protects our quality of life and the city’s financial health. Additionally, the City Council’s new 5Year Strategic Plan will help focus our resources on those things most important to the community as we prepare for the future
Looking to the future
City staff will continue to provide regular updates to the City Council and the public about the city’s budget priorities and overall financial health. By working together, we will continue to be well-positioned to deliver on our community’s vision for the future.
Changes to the budget
The City of Carlsbad Capital Improvement Program reflects the city’s ongoing commitment to maintaining the highest standards of quality facilities for our community today and in the future.
• Major city digital transformation projects (online permitting, records management system, police computer aided dispatch system, hardware and software, security strategy, etc.) included in this year’s budget
The following information is included in the four main sections of the budget:
Introduction
• The economic and fiscal issues facing the city
• An overview of where the city gets the money (“revenue”) to fund daily operations
• Information about the city, its size, its demographics, the city government structure and other background
READERS GUIDE
• A big picture summary of city staffing levels, spending broken out into different categories and other aggregate information
• How projects are identified and prioritized
Some of the information included in this budget document is required by state law. Other details are provided for context and transparency. More than anything, city staff have prepared this budget to serve as a practical guide and tool for ensuring the City of Carlsbad lives up to its standard of being the best run government, period.
• Detailed budgets for all city functional areas
• Sources of funding and long term plan
• Major city construction projects (roads, water and wastewater system, parks, etc.) included in this year’s budget
• How projects are identified and prioritized
A 4
Capital Improvement Program
• Financial management policies
Operating Budget
INTRODUCTION
• How the budget is prepared and approved
More than a spending plan, the annual budget is also intended to provide a window into the complex and dynamic economic environment within which your local government operates. As such, this document reviews local, state and national trends affecting city finances, as well as demographic information, regulations and policies that affect how, when and where the city invests resources.
Strategic Digital Transformation Investment Program
• Input city staff received from the public and how it has been incorporated into city spending priorities
The annual budget is the most significant expression of how City Council policies are translated into daily operations. In this document, you will see where the city gets the money it uses to carry out its mission and how that money will be spent during the fiscal year that begins July 1, 2022.
• Sources of funding and long term plan
The City Council has the authority to approve the annual budget and may amend it during the year if needed. The legal level of budgetary control is at the fund level, which means spending in each different type of fund may not exceed the budgeted amount without City Council approval. Additional information regarding the budgetary controls can be found in the resolution approving the annual operating budget in the appendices.
December
A 5
The City Council sets the overall policy direction for the City of Carlsbad and helps staff prioritize programs, projects and services to support that direction. Public input plays a critical role in setting both the long range policy direction of the city and decisions about day to day spending. The city operates on a fiscal year that begins July 1. City staff in all departments prepare individual budgets for their functional areas. These budgets are then combined into an overall city budget that is presented to the City Council each spring for review and input.
January
BUDGET PROCESS

City staff hold a budget kick off meeting to discuss priorities for the upcoming budget cycle, any changes to the budget process compared to last fiscal year, and the calendar for submission of required budget forms. Departments begin developing their budget submissions. Staff gather input from the community to help inform the specific projects and initiatives under each goal theme in the five year strategic plan.
City Council begins development of a five year strategic plan. The City Council develops themes based on public input and the Carlsbad Community Vision.
Departments present their budgets, including significant changes and requests for new funding, to the Finance Department. Finance Department staff provide feedback to each department in preparation for their budget presentations to the City Manager. Departments submit estimates for current fiscal year end revenues and expenditures to Finance.
Staff present the preliminary budget to the City Council for consideration. After this public meeting, staff amends the preliminary budget document for any City Council directed changes.
Departments provide their budget submissions to the Finance Department. These submissions include any requests departments make to amend their budgets, such as:
• Additional funding for personnel changes, such as new personnel and reclassifications
Departments present their budgets for the upcoming fiscal year to the City Manager in individual meetings. Based on feedback from these meetings, the City Manager decides which requests will move forward for City Council consideration. Finance Department staff prepare the preliminary budget document.
• Movement of existing departmental budget for different purposes Submissions also include general information about existing personnel allocations, requested out of state travel and budget for professional and outside services. Finance Department staff review submissions, analyze requested budgets, and work with departments to make any necessary changes.
A 6
• Additional funding for maintenance and operations
April
The City Council holds workshops to prioritize Capital Improvement Program projects.
At a public hearing, staff present the final proposed budget to the City Council for consideration and adoption.
March
June
The City Council holds workshops to consider public input and finalize strategic plan goal themes.
May
• Transferring funding for departmental reorganizations
February
1. Establish a common vision that will help align long term policy priorities, day to day operations, and resources with the community’s most important values, needs and aspirations.
Starting in December 2021, the City Council developed themes based on input received through a wide variety of public engagement programs during the past 24 months and the nine core values that make up the Carlsbad Community Vision. These themes are:
• Economic Vitality: Foster a healthy economy
• 2020 21 Budget Priorities
• Quality of Life and Safety: Prioritize the safety and well being of the community
The City of Carlsbad is committed to engaging community members in decisions affecting their lives. There is perhaps no greater opportunity to shape these decisions than the creation of the annual city budget
• Lowering the Railroad Tracks Through the Village and Barrio
• Homeless Response
• Organizational Excellence & Fiscal Health: Be a model for effective and efficient local government
This input is considered by city staff and the City Council in making decisions about resource priorities. See below for more specific information regarding the public’s involvement in the City Council’s five year strategic plan.
• Civilian Oversight of Police
The City of Carlsbad is committed to engaging community members in decisions affecting their lives. There is perhaps no greater opportunity to shape these decisions than the creation of the annual city
3. Identify agreed upon priorities, timelines and performance measures.
encourages input throughout the year by promoting opportunities to provide input at meetings of the City Council, boards, commissions, and committees. City staff also seek input on specific projects and initiatives. Over the past 24 months, these opportunities have included:
• South Carlsbad Coastline
• Parks and Recreation Priorities
• Age Friendly Community Plan
PUBLIC ENGAGEMENT
A 7
• COVID Community Needs
• Potential Locations for Future Housing
• Sustainability & Natural Environment: Protect the environment and natural resources
FIVE-YEAR STRATEGIC PLAN
• Barrio Pedestrian Lighting Improvement Project
Thebudget.city
• Monroe Street Pool Improvements
• Housing Element Update
• City Digital Transformation
2. Build momentum for major goals by maintaining a focused effort over multiple years.
• New City Hall and Civic Center
• Community Character: Maintain Carlsbad’s unique community character
In 2021, the City Council decided to evolve its annual goal setting into the creation of a five year strategic plan. The benefits of a five year plan include:
The City Council then asked staff to gather input from the community that could be used to help inform the specific projects and initiatives under each goal theme in the five year strategic plan. In January and February 2022, city staff gathered input from nearly 2,000 community members through a public workshop, online survey and virtual ideas board.
Topics of interest

A 8
The chart below shows the topics of greatest interest among those who provided input:

By taking this approach, the fiscal year 2022 23 budget is already aligned with the five year strategic plan. Once the plan is finalized, it will serve as a road map for budgets through fiscal year 2026 27 by identifying specific, measurable objectives to be achieved during this timeframe. The public will continue to be engaged in refining specific projects and initiatives within the strategic plan as it is implemented. This input will, in turn, also be incorporated into the annual budget process.
How the input was used
A 9
The City Council five year strategic plan is scheduled to be completed in fall 2022. However, public input on the major themes to be addressed in the plan was shared with all city departments to consider when developing their proposed budgets for fiscal year 2022 23. Raw data, including verbatim comments, were also shared with city staff to provide greater nuance and context.
Among the four public facing City Council goal themes, quality of life and safety received more than twice as many comments and ideas as the other themes.

Summary of Homeless Workplan Objective Costs
3. Enhancing Clinical Services at La Posada Emergency Shelter Agreement with Catholic Charities 180,000 180,000 180,000 540,000
1
year. 2 Personnel costs for one sergeant and two officers (salary, benefits, overtime, vehicle replacement). Personnel costs increased
ProposedOBJECTIVEStaffing/Program 2020 21
• Reduce the homeless unsheltered population, among those who want help, by 50% within five years, with quarterly reports until we decrease the unsheltered homeless population or five years.
• 3 new positions in Police Department
costs plus one time equipment purchases. 4 Voucher related expenses potentially 100% reimbursable through FEMA/Project RoomKey until September 30, 2021, which would proportionally reduce city costs. 5 One month
22 (Director position
program cost. Any unexpended amount to carry forward to FY 2021 22. 6 Covers expenses helping individuals secure employment such as bus passes, clothing vouchers, background checks, printing.
• 5 new positions in Community Services Branch
Prior to the five year strategic plan, the Carlsbad City Council had for many years participated in an annual goal setting process that helped inform budget priorities. In early 2021, the City Council held a series of workshops and established four goals. Goals one and four were completed in fiscal year 2021 22. Goals two and three, listed below, have costs carrying over into the fiscal year 2022 23 budget.
Reduce the homeless unsheltered population, among those who want help, by 50% within five years, with quarterly reports until we decrease the unsheltered homeless population or five years.
FISCAL YEAR 2021-22 GOALS
4. Operate a Carlsbad Hotel/Motel Voucher Pilot Program
Hotel/Motel Voucher Program4 260,0005 2,940,000 3,200,000 Program Manager 123,7951 124,7351 130,9711 137,5201 144,3961 661,4171 Animal services contract TBD TBD TBD TBD TBD TBD Community Resource Center Services Agreement with CRC 350,000 350,000 700,000 Homeless Action Subcommittee Program Costs Create a new Housing and Homeless Services Department Director 20,593 247,1131 259,4691 272,4421 286,0641 300,3681 1,386,0491 Housing Services Manager 182,2261 186,0871 195,3921 205,1611 215,419 984,285 Management 123,795 124,735 130,971 137,520 144,396 661,417 $610,710 (salary, FY2021 reflects upper range). 5% per 5% per two months personnel estimated
6.
1
1
Personnel cost increased
$4,901,913 $2,010,759 $1,587,796 $1,478,186 $1,552,096 $12,141,460 1 Mid range personnel costs
1. Employments & Benefits Specialist Contract Services $120,000 $120,000 $240,000 Operational expenses 20,0006 20,0006 40,0006
1
benefits) plus one time equipment purchases in
Homeless Outreach Team staffing $330,1172,3 614,9842 645,7332 $678,0202 $711,9211,2 $747,5172 3,728,2922,3 Social workers (Co. of SD Pilot Program)
A 10
Resource Needs
• Bring the Fire Department into conformance with Standards of Cover evaluation.
Goal #2
7.
1
1 TOTAL
1
FY
2. Additional Homeless Outreach Team Officers & Social Workers
• Funding: See below
Analyst
year. 3 Reflects
The budgetary considerations for these work plans can be found below. Additional details about these priorities are included in department program summaries.
FY 2021 22 FY 2022 23 FY 2023 24 FY 2024 25 FY 2025 26 TOTAL
1
5.
GOAL
• FT Emergency Medical Technician equipment ($83,358)
• Temporary Fire Station 7 operating costs, 6 months ($35,000)
• 3 Captain promotions, 6 months ($46,119)
• 2 PT Emergency Medical Technicians, 6 months ($35,854)
A 11
Goal #3
• PT Emergency Medical Technician equipment ($33,888)
• FT Emergency Medical Technician equipment ($333,432)
Fiscal Year 2021 22 ($2,607,050)
Fiscal Year 2021 22 ($935,000)
• 3 FTE Emergency Medical Technicians, 6 months ($129,750)
• 9 FTE Paramedic Firefighters, 6 months ($715,302)
• Fire engine supplies ($21,150)
Public Works Resource Needs
• 3 PT FTE Emergency Medical Technicians, 6 months ($53,781)
• PT Emergency Medical Technician equipment ($50,832)
Fiscal Year 2022 23 ($2,049,911)
• Fire engine outfitting ($172,600)
• Fire engine ($806,000)
• New CIP project for Fire Station 6 ($35,000 for office to bedroom conversion)
• Two ambulances ($580,000)
• 12 FTE Emergency Medical Technicians, 6 months ($519,000)
• New CIP project for Temporary Fire Station 7 ($900,000) *includes community outreach for $50,000 Fiscal Year 2022 23 ($15,000,000)
Bring Fire Department into conformance with Standards of Cover evaluation.
• Ambulance outfitting ($260,000)
• Ambulance supplies ($78,300)
• Paramedic Firefighter equipment ($556,974)
• 3 Engineer promotions, 6 months ($11,997)
• New CIP project for permanent Fire Station 7 ($15M) in 5 7 years plus property acquisition
Fire Department Resource Needs
• Reserve apparatus ($133,624)
A 12

CARLSBAD,CALIFORNIA
The City of Carlsbad is situated in north San Diego County where a great climate, beautiful beaches and lagoons, and abundant natural open space combine with world class resorts, family attractions, well planned neighborhoods, a diverse business sector and a charming village atmosphere to create the ideal California experience.

A 13

The City of Carlsbad is a municipal corporation following the council manager form of government. The City Council, the city’s legislative body, defines the policy direction of the city. The city manager oversees the day to day operations of the city. The City of Carlsbad also has an elected City Clerk and City Treasurer.
The City Council consists of an elected mayor and four elected council members. Each serves a four year term. In 2017, the city switched to a system where City Council members are elected by district instead of at large or citywide. District boundaries were updated following the 2020 Census.

A 14
Districts
CITYGOVERNMENT
Charter city
There are two types of cities in California: charter and general law. Charter cities follow the laws set forth in the state’s constitution along with their own adopted “charter” document. General law cities follow the laws set forth by the state legislature.
In 2008, City of Carlsbad residents voted to approve the charter city measure, Proposition D, by 82%. The charter gives the City of Carlsbad more flexibility on such issues as purchasing and contracting, because the process mandated by the state can be expensive and cumbersome, causing project delays. Certain affairs, such as traffic and vehicle regulation, open and public meetings laws, certain planning and environmental laws, and eminent domain, remain matters of state authority even as a charter city.

Named for a famed 19th Century European spa whose mineral springs were found to be remarkably similar to those found here, the City of Carlsbad’s history reflects the heritage of many cultures. The shoreline of the city’s Agua Hedionda Lagoon was home to the indigenous Luiseño and Diegueños Indians for centuries before the arrival of the Spaniards. The area known today as Carlsbad was once a territory of Spain and then Mexico. The City of Carlsbad was incorporated in 1952 and today is home to more than 100,000 people. Guided by an award winning growth management plan approved by voters in 1986, the City of Carlsbad has matured into a well rounded community where parks, roads and other infrastructure have kept pace with development. Now that the period of rapid growth is coming to an end, the city is focused on sustaining an excellent quality of life for residents and continuing to foster a strong sense of community.
A 15
Our history
A 16
DEMOGRAPHICS

A 17

A 18
% of GF Revenue 49.6% 17.6% 10.5% 1.4% Per Capita $1,569.42 $555.69 $331.90 $42.99
Carlsbad 115,585 $198,445,022
National City 61,471 $66,215,913
Population(2022est.) GeneralBudgetFund PropertyTax SalesTax OccupancyTransientTax BuildingPermits
The table below shows General Fund revenue comparisons with neighboring jurisdictions for fiscal year 2021 22 adopted budgets. Population estimates for 2021 and total General Fund budgets are included for additional context.
% of GF Revenue 26.1% 50.2% 3.0% 1.6% Per Capita $222.91 $428.24 $25.56 $13.92
Escondido 150,679 $125,773,960
% of GF Revenue 16.1% 58.4% 2.4% 0.6% Per Capita $174.40 $632.10 $26.03 $6.88
% of GF Revenue 27.7% 34.2% 1.7% 1.7% Per Capita $287.28 $354.10 $17.20 $17.97
Oceanside 173,048 $185,760,494
% of GF Revenue 30.6% 24.5% 0.8% 0.5% Per Capita $292.33 $233.90 $7.90 $4.47
% of GF Revenue 41.0% 24.7% 14.5% 0.5% Per Capita $705.18 $424.99 $249.19 $7.79
El Cajon 105,638 $92,148,947
HOW CARLSBAD COMPARES
San Marcos 93,585 $89,423,393
% of GF Revenue 53.5% 17.0% 3.9% 0.7% Per Capita $646.79 $205.03 $47.41 $7.89
Vista 100,291 $103,851,942
Encinitas 61,515 $97,592,155
% of GF Revenue 42.2% 14.6% 5.8% 1.9% Per Capita $461.08 $159.19 $63.60 $20.71
San Clemente 63,380 $81,159,560
MAJOR REVENUE SOURCES
% of GF Revenue 26.1% 40.6% 1.7% 0.9% Per Capita $217.55 $338.55 $14.60 $7.30
Newport Beach 83,727 $244,186,089
STATISTICS
% of GF Revenue 62.9% 17.5% 3.7% 2.1% Per Capita $944.65 $263.19 $55.60 $30.89
Taxpayer
Park Hyatt Aviara Resort $160,542,900 0.46%
Top property tax contributors

% of Total City Net Assessed Value

Legoland California, LLC $252,623,430 0.72%
La Costa Glen Retirement Community $276,265,671 0.78%
The Forum Shopping Center $206,583,259 0.59%
A 19
The Shoppes at Carlsbad $178,546,161 0.51%
Property tax per capita
La Costa Town Center, LLC $154,861,764 0.44%
The chart below shows fiscal year 2022 23 Property Tax revenue per capita comparison with other jurisdictions:
Grand Pacific Carlsbad LP $160,427,282 0.46%
2021 AssessedTaxableValue
Poseidon Water Desalination Plant $424,822,973 1.21%
Levine Investments Limit Partnership $182,685,818 0.52%
La Costa Resort & Spa $240,911,267 0.68%
Sales tax per capita
A 20
The chart below shows fiscal year 2022 23 Sales Tax revenue per capita comparison with other jurisdictions:
Building permit fee revenue per capita
Transient occupancy tax per capita
$$200.00$100.00 $700.00$600.00$500.00$400.00$300.00$-$50.00$100.00$150.00$200.00$250.00$300.00$350.00$-$5.00$10.00$15.00$20.00$25.00$30.00$35.00$40.00$45.00$50.00
The chart below shows fiscal year 2022 23 building permit fee revenue per capita comparison with other jurisdictions:
The chart below shows fiscal year 2022 23 Transient Occupancy Tax revenue per capita comparison with other jurisdictions:
Top industries

Top employers
A 21
BUSINESS SECTOR
Company size by employees

Viasat Information Technology 2,481 Legoland California Hospitality and Tourism 2,300 Thermo Fisher Scientific Life Sciences 1,982 Omni La Costa Resort & Spa Hospitality and Tourism 1,300 Carlsbad Unified School District Education 1,092 TaylorMade Golf Company Action Sports 960 City of Carlsbad Government 748 Nortek Security & Control Information Technology 637 HM Electronics, Inc. Information Technology 571 Gemological Institute of America Research and Education 555
Name Industry Employees
Lowe’s Home Center
Alphatec Spine
Vons Grocery Company Costco Wholesale Life Technologies Fashionphile
Genmark Diagnostics Premier Chevrolet of Carlsbad Apple Stores Hoehn Motors
Premier Kia of Carlsbad Bob Baker /Jeep/RamChrysler/Dodge
A 22
Jaguar/Land Rover Carlsbad Shell Service Stations
Bob Baker Hyundai Ken Grody Ford Tesla Bob Baker Mazda Legoland California Toyota Lease Trust Bob Baker Subaru Legoland Food & Beverage Toyota Scion Chevron Service Stations Lexus Carlsbad
Top sales tax generators

A 23

A 24
FISCAL ISSUES & FINANCIAL MANAGEMENT
A 25
Toquarters.spawn
Prior to the pandemic, the city boasted a low unemployment rate of 2.9%. At the height of the pandemic, unemployment spiked to 13.8%. Over the past two years, the unemployment rate has had some correlation to the prevalence of COVID 19 in the region. However, despite the Delta and Omicron surges, which caused an uptick in unemployment at the state level in December 2021 (6.5%), unemployment continued to fall at the county and city level. The unemployment rate in March 2022 was 4.2% at the state level, 3.4% at the county level, and 3.1% in Carlsbad. This is 0.2% above pre pandemic lows. Currently, many employers are citing difficulty in finding and retaining workers. In March 2022, nationally, there were 1.9 open jobs for every unemployed worker. This is one underlying cause to increased wage pressures and difficulty in retaining employees.
economic recovery, several federal, state and local programs were approved, providing substantial resources for businesses. These include the American Rescue Plan; the Paycheck Protection Program, for which Carlsbad companies were recipients at a higher rate than any other North County city in the first round; the State of California Small Business Relief Program; and the City of Carlsbad’s Economic Recovery and Revitalization Initiative. Most health order restrictions on businesses have now been lifted since the fiscal year 2021 22 budget was adopted on June 8, 2021, and the results have been positive across most of the city’s revenue streams. While the city is beginning to have a clearer picture of our revenue outlook, economic uncertainty resulting from inflation and geopolitical conflict has created strong demand for conservative revenue projections into the future.
At the time of developing the Fiscal Year 2022 23 Proposed Budget, the world, nation, state and city continues to grapple with the ongoing economic effects of COVID 19. In the City of Carlsbad, the most profound effects have been concentrated in the restaurant, travel, entertainment, and leisure and hospitality sectors. Hospitality and tourism businesses have been hard hit over the past two years with fluctuating health order restrictions and consumer confidence impacting travel. Hotel occupancy in January 2022 was significantly lower than January 2019 levels. However, occupancy rose sharply in recent months, with March 2022 occupancy (75.5%) nearly matching March 2019 occupancy levels (76.5%). With the Omicron surge behind us, tourism leaders are optimistic that individual and family travel could continue to rise.
A 26
National interest rates, which dropped significantly during the pandemic, have now eclipsed pre pandemic rates for all categories. One year rates are currently at 1.63%, ten year rates are currently at 2.32%, and 30 year rates are at 2.44%. With current inflation concerns, the Federal Reserve has begun to raise interest rates and indicates plans for further rate increases over the next several
Maintaining good fiscal health must remain a top priority. Meeting this objective preserves the city’s ability to continue providing important programs and services to the community. Past economic challenges and prudent financial planning have provided opportunities for developing solutions to address lost revenues while preserving vital services. Revenues, along with the local economy, are expected to continue to recover as COVID 19 restrictions lessen, but this recovery will be partially offset by the end of federal and state aid that was provided as well as uncertainties surrounding rising inflation and geopolitical conflict. Expenditures and revenues will need to be closely monitored as a result. Disciplined spending and long term financial planning remain critical to ensuring the future sustainability of important city programs and services.
ECONOMIC AND FISCAL ISSUES FACING THE CITY
• Have sufficient resources to provide programs and services for the stakeholders;
It is important to stress that the Forecast is not a budget. The Forecast does not dictate expenditure decisions, but rather highlights the need to prioritize the allocation of the city’s limited resources to ensure the continuation of core city services. The purpose of the plan is to provide the City Council, key stakeholders, and the public an overview of the city’s fiscal health based on various financial and service level assumptions over the next ten years. It also allows for the discussion of necessary steps to be initiated during the development and implementation of future budgets. The Forecast is intended to look beyond the annual budget cycle and serve as a planning tool to bring a long term perspective to the budget process. The Forecast also takes into consideration Council Policies that need to be met on an annual basis including General Fund reserve guidelines, pension funding guidelines, etc. Should projected expenditures exceed projected revenues in any given year, the City Manager will need to identify steps to mitigate the shortfalls prior to presenting a balanced budget to the City Council for consideration during the annual budget development process.
• Have sufficient long term information to guide financial decisions;
The city prepares a long term financial model for both capital and operating needs. It is imperative that the city plan for the impacts of development, the construction and operation of new public facilities, and planning resources needed to build them. The city prepares a ten year operating forecast for the General Fund, a five year Strategic Digital Transformation Investment Program, and a fifteen year Capital Improvement Program. As part of the new Strategic Digital Transformation Investment Program and the Capital Improvement Program, the city annually calculates the amounts needed to pay for the projects and calculates the anticipated operating budget impacts. In this way, the city can anticipate the effects of development from both a capital and an operating perspective.
• Establish mechanisms to identify early warning indicators; and
• Attain and maintain financial sustainability;
Long Term Financial Planning
One important initiative the city has undertaken to ensure its financial health is the development of an Infrastructure Replacement Fund. With this fund, the city sets aside a portion of General Fund revenues on an annual basis for major maintenance and replacement of its infrastructure. Much of the city’s infrastructure is relatively new; thus, the city is just now experiencing the impact of maintenance requirements. By setting aside funds now, the city’s residents can be assured that the proper maintenance and replacement will be performed, as needed, on streets, parks and many facilities for which the city is responsible.
• Identify changes in expenditure or revenue structures needed to deliver services or to meet the goals adopted by the City Council.
It should be noted that the Forecast is a snapshot in time and will change as additional information is made available and incorporated into the fiscal projections. COVID 19 and the economic uncertainty associated with the pandemic period has increased the volatility of projecting future revenues.
• Identify potential risks to on going operations in the long term financial planning process and communicate these risks on an annual basis;
A 27
Strategic planning begins with determining the city's fiscal capacity based upon long term financial forecasts of recurring available revenues and future financial obligations. Prior to the adoption of the annual budget, the finance department will prepare a Ten Year Financial Forecast (“Forecast”) that evaluates known internal and external issues impacting the city's financial condition. The methodology for preparing the Forecast can be found in the appendix of this document. The Forecast is intended to help the city:
The American Rescue Plan Act of 2021 was passed on March 11, 2021 which allocated $12.6 million in COVID 19 recovery funds to the city. The American Rescue Plan Act provides an infusion of resources to help turn the tide on the pandemic, address its economic fallout and lay the foundation for a strong recovery. In accordance with the American Rescue Plan Act, funds are allowed to be used through Dec. 31, 2024 and may be used to:
• Replace lost public sector lost revenue,
Employee retirement costs continue to require ongoing prudent fiscal management. The City Council issued a pension funding policy to codify its commitment to ensure that resources will be available to fulfill the city’s contractual retirement promises to its employees, and to minimize the chance that the funding of these benefits will interfere with providing essential services to the community. The policy outlines a funding discipline to ensure that adequate resources will be accumulated in a systematic and disciplined manner to fund the long term cost of benefits to the plan participants and annuitants. Overall funding levels of the city’s plans are reviewed annually to ensure the city’s funding level remains at least 80% the city’s minimum targeted level. While this enhances the city’s funding position, risks remain in the system. Required employer contributions will continue to increase over the next few years and actual contribution increases could exceed expectations if future investment return rates or other factors are unfavorable.
A 28
Revenue and expenditure growth projections
• Support immediate economic stabilization, and
American Rescue Plan Act
• Support urgent COVID 19 response efforts,
• Address systemic public health and economic challenges.
The city’s Forecast considers the annual growth of all currently known elements of city revenues and expenditures. Projecting revenues is particularly difficult when considering the short term impacts of COVID 19 on the economy, leaving the timing of an economic rebound and future growth volatility uncertain. When forecasting expenditures, some of the major factors considered are rising healthcare and workers’ compensation costs, underperforming pension programs, and general inflation in both personnel and operating expenditures. Currently, the city projects expenditure growth will outpace revenue growth in the near future. To support the increase in ongoing costs, the city will need to consider alternative options, such as ways to increase economic activity that will drive sustainable increases in the city’s current revenue base, an expansion of the city’s revenue base, or a reduction of the city’s current service offerings and associated costs.
The funds are restricted from being used to offset tax cuts or for pension liabilities. These funds are provided in two tranches: the first tranche, in which $6.3 million was received in May 2021, and the second tranche, was received in June 2022. The city has appropriately used the funds as a replacement of revenue to partially offset the negative economic impacts from the pandemic. To substantiate the use of these funds for revenue replacement, the American Rescue Plan Act requires the city to demonstrate the extent of revenue reduction. Following the final guidance from the U.S. Department of the Treasury, the city’s current projected revenue loss from the COVID 19 pandemic is estimated to be more than the $12.6 million in funding awarded to the city
Major expenditure categories will be projected on a ten year basis. The city will operate on a current funding basis. Expenditures will be budgeted and controlled so as not to exceed current revenues plus the planned use of any accumulated fund balances. Annual budgeted operating expenditures shall not exceed annual operating revenues, including budgeted use of reserves, unless directed by the City Council.
Council Policy No. 87 General Fund Surplus Policy outlines the use of surplus funds resulting from unrestricted General Fund actual revenues exceeding total actual expenditures, encumbrances, and commitments for a given fiscal year. It is the intent of the city to use all surplus funds generated to meet reserve policies, and the reduction or avoidance of long term liabilities. The city will not use year end surplus funds to fund ongoing operations unless otherwise approved by the City Council.
The development and maintenance of balanced and reliable revenue streams will be the primary revenue objective of the city. Efforts will be directed to optimize existing revenue sources while periodically reviewing potential new revenue sources. One method to maximize existing revenue sources it to promote a healthy business climate. Revenue estimates will be prepared on an annual basis during the preparation of the budget and major revenue categories will be projected on a ten year basis. Revenues will be estimated conservatively using accepted standards and estimates provided by the state and other governmental agencies. Alternative revenue sources will be periodically evaluated to determine their applicability to meet identified city needs. Sources of revenue will be evaluated and modified as necessary to assure a diversified and growing revenue base that improves the city’s ability to handle fluctuations in individual revenue sources.
Revenue Policies
The City Manager shall prepare and submit to the City Council annually a proposed operating, strategic digital transformation investment program and capital improvement program budget each year, and the budgets will be adopted by June 30 of each year. Budget status reports are prepared monthly, distributed to all departments and posted on the city’s website. Because the budget is based on estimates, from time to time, it is necessary to make adjustments to finetune the line items within it. Various levels of administrative control are utilized to maintain the budget’s integrity. Program managers are accountable for the line item level of control of their individual program budgets. Department heads are accountable for the fund level of control for funds within their departments. The Finance Department oversees the general level of accountability related to budgetary integrity through systematic checks and balances and various internal controls.
Expenditure and Budget Policies
FINANCIAL MANAGEMENT POLICIES
A 29
Revenues from “one time” or limited duration revenue sources will not be used for ongoing operating expenses. Fees and charges for services will be evaluated and, if necessary, adjusted annually to ensure that they generate sufficient revenues to meet service delivery costs. The city will establish user charges at a level generally related to the full cost (operating, direct, indirect and capital costs) of providing the service, unless the City Council determines that a subsidy from the General Fund is in the public interest. The city will also consider market rates and charges levied by other municipalities of similar size for like services in establishing rates, fees and charges. Enterprise and internal service funds will be self supporting.
• Respond to the challenges of a changing economic environment, including prolonged downturns in the local, state or national economy; and
The City Manager is authorized to approve the carryforward of any unencumbered and unspent and unencumbered budget for a particular item equal to or less than $100,000 into the following fiscal year. These items will be one time expenditures and not for ongoing services, programs or personnel. Any remaining surplus funds in excess of reserve and pension liability deficiencies and items equal to or greater than $100,000 will be brought forward for City Council approval.
The city adheres to long range financial planning which forecasts revenues and expenditures over a long term period, using assumptions about economic conditions, future spending scenarios, and other salient variables. Financial planning allows the city to execute overall strategies to support the process of aligning financial capacity with long term service objectives. Financial forecasts are updated at least once a year, or more often, if unexpected changes in economic conditions or other unforeseen circumstances exist. Any significant changes will be reported to the City Manager and the City Council. Otherwise, these financial forecasts will be used as a tool during the development of the annual budget process and to set utility rates as needed.
• Demonstrate continued prudent fiscal management and creditworthiness.
Reserve Policies
The city formally mandates the levels at which reserves shall be maintained for the General Fund and informally sets minimum target levels for the enterprise and internal service funds.
• Reduce the risk of financial impacts resulting from a natural disaster or other catastrophic events;
A 30
Council Policy No. 74 General Fund Reserve Policy was most recently updated and approved by the City Council in June 2019. The purpose of the policy is to establish a target minimum level of designated reserves in the General Fund to:
The Wastewater Fund and Water Operating Fund Reserves will target a reserve funding level of 40%. The reserve amount is calculated by dividing unassigned fund balance by total budgeted operating expenses plus replacement transfers plus budgeted debt service payments. The annual budget process and the setting of utility user rates and charges will be used to achieve and maintain the target reserve level.
The city will use surplus funds to replenish any General Fund deficiencies, up to the minimum level as set forth in Council Policy No. 74 General Fund Reserve Policy and then any pension liability deficiencies, as defined in City Council Policy No. 86 Pension Funding Policy.
The city commits to maintaining General Fund reserves (the term reserve refers to any unassigned fund balance) at a target of 40% of General Fund annual operating expenditures. The total reserve level will be calculated using the prior year’s adopted General Fund budgeted expenditures.
At the discretion of the City Council, reserve levels in excess of the 40% target requirement may be used for one time opportunity cost purposes. Reserve funds will not be spent for any function other than the specific direction in the annual budget or by a separate City Council action.
As a general budget principle concerning the use of reserves, the City Council decides whether to appropriate funds from reserves. Reserve funds will not be spent for any function other than the specific purpose of the reserve account from which they are drawn without specific direction in the annual budget or by a separate City Council action.
Investment Policy
the city is unable to meet the minimum combined pension funded ratio of 80% with current resources (i.e., without borrowing or using reserves), the Finance Director will identify a reasonable period to return to a minimum 80% funded ratio status.
Pension Funding Policy
The city has established a formal Investment Policy. It is the policy of the City of Carlsbad to invest public funds not required for immediate day to day operations in safe, liquid and medium term investments that shall yield an acceptable return while conforming to all California statutes. It is intended that the policy cover the investment activities of all contingency reserves and inactive cash under the direct authority of the city. Investments of the city and its component units will be made on a pooled basis; however, investments of bond proceeds will be held separately if required.
The Vehicle Asset Replacement Fund shall maintain a minimum reserve level defined as the amount of accumulated depreciation of capitalized Fleet assets based on the original cost of each capitalized asset, and up to a maximum reserve level defined as the accumulated depreciation based on the estimated replacement cost of each capitalized asset.
The city’s Council Policy No. 86 Pension Funding Policy embodies funding and accounting principles to ensure that resources will be available to fulfill the city’s contractual promises to its employees. The policy objectives include using actuarially determined contributions, or ADC, provided by CalPERS, funding the full amount of the ADC each year, maintaining no less than a combined minimum of 80% funded ratio, and demonstrating accountability and transparency by communicating all information necessary for assessing the city’s progress toward meeting its pension funding
Theshortfall.RiskManagement
Inobjectives.theevent
The city’s Workers’ Compensation Fund will maintain a minimum reserve equal to the estimated outstanding claims as calculated by a third party administrator. Additional reserve amounts may be set aside as deemed appropriate based on a third party actuarial study completed at two year intervals. During the annual budget process, the target confidence level will be compared with the projected fund balance, and, if the projected fund balance is greater than or lesser than the target, a plan to adjust the fund balance will be considered, using either or both increasing revenues through interdepartmental charges and one time cash contributions from those funds contributing to the
A 31
Technology Asset Replacement Fund shall maintain a minimum reserve level defined as the amount of accumulated depreciation of capitalized assets based on the original cost of each capitalized asset, and up to a maximum reserve level defined as the accumulated depreciation based on the estimated replacement cost of each capitalized asset.
Fund (General Liability) will maintain a minimum reserve equal to the estimated outstanding claims as calculated by a third party administrator. Additional reserve amounts may be set aside as deemed appropriate based on a third party actuarial study completed at two year intervals. During the annual budget process, the reserve level will be compared with the projected fund balance, and, if the projected fund balance is greater than or lesser than the target, a plan to adjust the fund balance will be considered, using either or both increasing revenues through interdepartmental charges and one time cash contributions from those funds contributing to the
Theshortfall.Information
The city’s Council Policy No. 91 Long Term General Fund Capital Funding Policy ensures the needs of the city are met and demonstrates continued prudent fiscal management by providing a funding source for long term, large value capital purchases. Many city assets demand large capital expenditures, examples include roads, building, parks, and information technology infrastructure. The city funds the General Fund portion of these necessary investments by adopting an annual budget that includes a transfer from the General Fund to one or more of the city’s long term capital funds. These long term capital funds include the General Capital Construction Fund, the Infrastructure Replacement Fund and the Technology Investment Capital Fund. The city commits to targeting a transfer to the city’s long term capital funds of 6% of budgeted General Fund revenues. The transfers are proposed during the annual budget process or on an as needed basis for the City Council’s Fullconsideration.versionsof these policies and other City Council policies are available on the city’s website at www.carlsbadca.gov/city hall/laws policies/council policies.
A 32
Long Term General Fund Capital Funding Policy
Gann Appropriation Limit
Appropriations Subject to Limit
% Population growth within Carlsbad 0.9992 Growth in California per capita income X 1.0755 Net Increase Factor 1.0746
• Growth in California per capita income.
$600$500$400$300$200$100$$700 2019
The City of Carlsbad’s appropriation limit is currently almost three and a half times its annual appropriations. With such a large margin, it is unlikely that the city will reach the appropriation limit in the foreseeable future. 2020 2021 2022 2023
The appropriations limitation imposed by the state, otherwise known as the Gann Limit, creates a restriction on the amount of revenue that can be appropriated in any fiscal year. The basis for calculating the limit began in fiscal year 1978 79 and is increased based on population growth and inflation. The appropriation limit applies only to those revenues defined as proceeds of taxes.
• Population growth within San Diego County, AND
• Growth in non residential assessed valuation due to new construction in the city.
• Population growth of Carlsbad AND
The factors used to calculate the fiscal year 2022 23 Limit were:
The formula is outlined below:
• Growth in California per capita income, OR
Current Appropriation of Proceeds of Taxes (Subject to the Limit) $170,799,505
Fiscal Year 2021 22 Expenditure Limit $542,095,062
Appropriations Limit by Fiscal Year
Fiscal Year 2022 23 Limit (2021 22 Limit x Factor) $582,535,354
A 33
• Population growth of Carlsbad, OR
Millions
APPROPRIATION LIMIT
The city currently has approximately $56.5 million of debt outstanding as of June 30, 2022. Of that $56.5 million, $1.95 million is Redevelopment Tax Allocation Bonds, $12.4 million is water construction loans and the remainder is debt of financing districts. Outstanding debt obligations of financing districts (special districts and/or assessment districts) within the city do not obligate the City of Carlsbad and are not paid from the city’s General Fund. No new debt is anticipated to be issued for the General Fund in the upcoming year.
The Government Code of the State of California has established maximum general obligation debt limits for local governments within the state. The city’s outstanding general obligation debt should not exceed 15% (as adjusted by 25% per the law) of total assessed property value. As of June 30, 2021, the city’s calculated debt limit for general obligation debt was $1.4 billion.
A 34
DEBT MANAGEMENT
The City of Carlsbad has a AAA credit rating and is widely acknowledged for its financial stability and responsible management of resources. The use of debt has always been a primary issue in the development of the Capital Improvement Program and the policies to implement the city’s Growth Management Program. Over the years, the city has issued millions of dollars of bonds and Certificates of Participation to fund streets, buildings, sewer and water facilities, open space acquisitions, and other infrastructure projects. The city is continually evaluating its outstanding debt as well as potential future issues to ensure that interest costs are kept at a minimum and the use of the bond funds is appropriate.
2005 Construction Loan 600,673 46,186 646,859 1,847,446 93,133 1,940,578 9,694,504 2,595,825 12,290,329
Debt Service Payments Total from Inception to Maturity
2006 Construction Loan 502 2027 5,745,655 Fund phase II of Industrial Park Pipelines
Debt Service Payments from FY 22-23 to Maturity
Principal Repayment Bond Retirement Outstanding
State Water Resources Control Board Loans
Purpose
A 35
Unrated
2013 Reassessment District (AD 2012-1)
CFD #3 2016 Improvement Area 2
CFD #3 2016 Improvement Area 1
2014 Construction Loan 507 2050 4,804,281 Fund phase III of Industrial Park Pipelines
Debt Issue Name Principal Interest Total Principal Interest Total Principal Interest Total
Limited Obligation 585,000 248,785 833,785 3,225,000 831,257 4,056,257 19,600,000 18,007,741 37,607,741 Improvement Bonds
2014 Construction Loan 4,804,281 780,424 5,584,705 4,804,281 780,424 5,584,705
CFD #3 2016 Improvement Area 1
Totals 56,542,381$
CFD #3 2016 Improvement Area 2
Tax Allocation Bonds Tax Increment 802 AAA 2023 1,950,000$ Refund 1988 bonds and obtain additional redevelopment funds
2005 Construction Loan 502 2025 1,847,446 Fund phase II of Industrial Park Pipelines
City of OutstandingCarlsbadDebtIssues
Totals 5,298,146$ 1,429,766$ 6,727,912$ 56,542,381$ 13,869,845$ 70,412,226$ 121,581,331$ 66,198,553$ 187,779,884$
Debt Service Payments During FY 2022-23
2006 Construction Loan 1,097,473 132,150 1,229,623 5,745,655 402,459 6,148,113 19,382,546 5,174,387 24,556,933
Limited Obligation 1,195,000 456,633 1,651,633 21,780,000 7,226,741 29,006,741 31,300,000 16,891,222 48,191,222 Improvement Bonds
State Water Resources Control Board Loans
1998 Rancho Carrillo (AD 96-1)
Special Tax Bonds Special District 434 Unrated 2036 6,575,000 Refunding of CFD 1
Limited Obligation Assessment 420 Unrated 2035 21,780,000 Refund Poinsettia/College/Cannon Improvement Bonds District
Special Tax Bonds 360,000 174,363 534,363 6,575,000 1,480,644 8,055,644 8,290,000 2,537,069 10,827,069
Special Tax Bonds 510,000 293,475 803,475 10,615,000 2,950,513 13,565,513 13,015,000 4,738,675 17,753,675
Special Tax Bonds Special District 434 Unrated 2038 10,615,000 Refunding of CFD 2
1993 Redevelopment
UserRecycledWaterFees
2013 Reassessment District (AD 2012-1)
Tax Allocation Bonds 950,000$ 78,175$ 1,028,175$ 1,950,000$ 104,675$ 2,054,675$ 15,495,000$ 15,473,210$ 30,968,210$
Debt Issue Name Source Fund Rating Year at 6/30/22
Limited Obligation Assessment 209 Unrated 2028 3,225,000 Fund improvements within Rancho Carrillo Improvement Bonds District
1998 Rancho Carrillo (AD 96-1)
1993 Redevelopment
• Capital project funds
A 36
Fiduciary funds are used if the city has a fiduciary or custodial responsibility for assets. The city currently budgets for one fiduciary fund, the Successor Agency to the Former Carlsbad Redevelopment Agency.
Internal Controls exist with the accounting system to ensure safety of assets from misappropriation, unauthorized use or disposition, and to maintain the accuracy of financial record keeping. These internal controls must be established consistent with the sound management practices based on the cost and benefit of the controls imposed. The cost of a control should not be excessive in relation to its benefit as viewed by city management. The internal controls in existence within the city’s system are sufficient to ensure, in all material aspects, both the safety of the city’s assets and the accuracy of the financial record keeping system.
• Special revenue funds
Proprietary fund budgets are adopted using the full accrual basis of accounting whereby revenue projections are developed recognizing revenues expected to be earned in the period, and expenditure estimates are developed for all expenses anticipated to be incurred during the fiscal year. The city's proprietary fund types consist of enterprise and internal service funds because the city has municipally owned utilities or other enterprise activities.
BASIS OF BUDGETING
The city's Governmental fund budgets consist of:
The legal level of Budgetary Control is the fund level, and expenditures should not exceed budgeted amounts at the fund level. Budgetary control is maintained through the city’s accounting system, as well as through monthly reporting on all revenue and expenditure accounts and other special reports summarizing the financial position of the city. The City Council adopts the formal budget for all funds prior to the beginning of each fiscal year and may amend the budget, as necessary by City Council action, throughout the year. All unencumbered, unspent appropriations expire at year end unless specifically carried into the new fiscal year in accordance with Council Policy No. 87 General Fund Surplus Policy
The city budgets on a modified accrual basis for all funds except for its enterprise and internal service funds, which are budgeted on a full accrual basis. This is consistent with the city’s basis of accounting as reported in its Annual Comprehensive Financial Report.
To summarize, under this basis, revenues are estimated for the fiscal year if they are susceptible to accrual, e.g. amounts can be determined and will be collected within the current period. Principal and interest on general long term debt are budgeted as expenditures when due, whereas other expenditures are budgeted for liabilities expected to be incurred during the current period or shortly thereafter to pay current liabilities.
• The General Fund
Controls on the use and transfers of budget funds are outlined in the adopted budget resolution in the appendix of this document.
Detailed descriptions of each fund and a department/fund budget relationship matrix can be found in the appendix of this document. The various funds are grouped as follows:
A 37
• Community Activity Grants
• Recreation Donations
General Fund
Special Revenue Funds
• Public Safety Grants
• Community Facilities District 1
• Transportation Development Act (TDA)
Capital Project Funds
• Library Gifts and Bequests
• Tyler Court Apartments
• Bridge and Thoroughfare District 3 Cannon Road West
• Median Maintenance District
• Lighting and Landscaping District 2
BUDGETARY FUND STRUCTURE
• Citizens’ Option for Public Safety (COPS)
• Senior Program Donations
• Rental Assistance/Section 8 Program
• Bridge and Thoroughfare District 2 Poinsettia Lane/Aviara Parkway
• Gas Tax Road Maintenance and Rehabilitation
• General Capital Construction (GCC)
• Infrastructure Replacement (IRF)
• Park in Lieu Fees (PIL)
• Buena Vista Channel Maintenance District
• Street Tree Maintenance District
• Parking in Lieu Fees
• Planned Local Drainage Area Fees (PLD)
• Habitat Mitigation Fee
• Agricultural Mitigation Fee
GOVERNMENTALFUNDS
• Affordable Housing
• Local Cable Infrastructure
• Technology Investment Capital
The budget of the city is organized based on funds, each of which is considered to be a separate accounting entity. The operations of each fund are accounted for by providing a separate set of self balancing accounts that comprise its assets, liabilities, fund equity, revenues and expenditures.
• Cultural Arts Donations
• TransNet
• Street Lighting Maintenance District
• Traffic Impact Fees (TIF)
• Public Facilities Fees (PFF)
• Gas Tax
• Community Development Block Grant
• Library and Arts Endowments
• Grants Federal
• Police Asset Forfeiture
• Industrial Corridor Park Fees
• Recycled Water Operations
• Potable Water Connection
PROPRIETARY FUNDS
• Workers’ Compensation
• Wastewater Operations
• Watershed Protection
Private Purpose Trust Fund
• Successor Agency to the Redevelopment Agency
• Information Technology Operations
• Vehicle Replacement
• Recycled Water Replacement
• Risk Management
• Wastewater Replacement
• Solid Waste Management
• Potable Water Replacement
A 38
• Potable Water Operations
• The Crossings Golf Course
• Vehicle Maintenance
• Information Technology Replacement
Enterprise Funds
• Wastewater Connection
FIDUCIARY FUND
• Recycled Water Connection
Internal Service Funds
A 39
In preparing the budget for fiscal year 2022 23, the city has once again followed CSMFO’s award criteria. This budget document will be submitted to CSMFO for the fiscal year 2022 23 budget award program.
The California Society of Municipal Finance Officers, or CSMFO, recognizes those entities with highly professional budget documents with two levels of certificates. The first level is the “Meritorious Budget Award,” which requires the entity to meet a very specific list of criteria defined by CSMFO. The second level is the “Operating Budget Excellence Award,” which requires that the organization meet even higher criteria which effectively enhances the usability of the document.

Government Finance Officers Association of the United States and Canada, or GFOA, presented a Distinguished Budget Presentation Award to City of Carlsbad, California, for its Annual Budget for the fiscal year beginning July 1, 2021. To receive this award, a governmental unit must publish a budget document that meets program criteria as a policy document, as a financial plan, as an operations guide and as a communications device.

A 40
This award is valid for a period of one year only. In preparing the budget for fiscal year 2022 23, the city has once again followed GFOA’s award criteria. This budget document will be submitted to GFOA for the fiscal year 2022 23 budget award program.
OPERATING BUDGET OVERVIEW
• Public Safety
• Public Works
• Policy & Leadership
• Community Services
Information about the city’s approach to planning for and funding digital transformation efforts throughout the city is included in the Strategic Digital Transformation Investment Program section

• Administrative Services
Detailed summaries of department services and expenditures are included within the five main sections of the operating budget following this overview. The five city branches include:
This section includes a summary of the revenues and expenditures included in the fiscal year 2022 23 operating budget. Spending is presented by funding source, department and type, such as personnel or maintenance and operations. For context, previous years’ spending levels are often presented alongside this information.
Information about capital projects, such as construction of roads and pipelines, the development of parks and construction and maintenance of city facilities, is included in the Capital Improvement Program section.
B 1
B 2
The Operating Budget for fiscal year 2022 23 totals $342.3 million, with revenues for the year estimated at $339.8 million. General Fund revenues are estimated at $198.8 million and General Fund budgeted expenditures are $198.4 million, which includes $2.7 million in one time expenditures funded from General Fund revenues to operationalize the City Council’s goals and priorities. Excluding the one time expenditures, the General Fund budgeted operating expenditures are $195.7
OPERATING BUDGET REVENUE SUMMARY
REVENUE SUMMARY BY FUND TYPE (in Millions)
Estimated Budgeted $ % 2021-22 2022-23 Change Change
General Fund 204.9$ 198.8$ (6.2)$ -3.0% Special Revenue 18.9 17.9 (1.0) -5.0% Enterprise 84.8 89.6 4.7 5.6% Internal Service 30.5 33.1 2.6 8.4%
Fund
Revenuemillion.estimates
Successor Agency Housing Trust 1.1 0.5 (0.6) -52.2% Total 340.2$ 339.8$ (0.4)$ -0.1%
for the Operating Budget indicate the city will receive a total of $339.8 million in fiscal year 2022 23, a change of 0.1% or $0.4 million below the estimated fiscal year 2021 22 revenues. General Fund revenues are expected to increase by $20 million compared to the prior year’s adopted revenues and decrease $6.2 million or 3% compared to fiscal year 2021 22 estimates. Special Revenue funds are projected to decrease by 5.0% or $1.0 million over fiscal year 2021 22 estimates. Enterprise Fund revenues are projected to increase by 5.6% or $4.7 million in the upcoming fiscal year. Internal service funds are increasing consistently with service level additions in other departments. The Successor Agency Housing Trust revenues are expected to decrease by $0.6 million as the loan owed to the General Fund was fully repaid by the end of fiscal year 2020 21. More detailed information on the city’s revenue sources is provided in the following discussion.
The following table shows the total operating revenues anticipated to be received by the city for fiscal year 2021 22, as well as those budgeted for fiscal year 2022 23.

B 3
Total 204.9$ 198.8$ (6.2)$ -3.0%
GENERAL FUND REVENUES (In Millions)
Business License Tax 6.8 6.2 (0.6) -8.6%
Franchise Taxes 6.3 7.0 0.7 11.4%
Development Revenues 3.7 2.9 (0.9) -23.5%
Property Tax 79.7$ 81.5$ 1.8$ 2.3% Sales Tax 50.3 49.1 (1.2) -2.4%
The COVID 19 pandemic has created immense uncertainty in the city’s revenues, most notably in sales tax and transient occupancy tax. The fiscal year 2021 22 adopted budget had anticipated continued adverse impacts from the pandemic with moderate recovery; however, current estimations indicate sales tax and transient occupancy tax will reach historically high levels. While sales tax revenues were budgeted at $43.9 million and transient occupancy tax was budgeted at $18.4 million, actual revenues are estimated at $50.3 million and $28.1 million, respectively. This was mainly due to the staggered lessening of COVID 19 restrictions coupled with pent up demand and inflationary increases. While recovery from the pandemic was accelerated compared to original estimates, new uncertainty surrounding the economy is rising. Significant inflationary increases and its impacts on disposable income, tourism and the housing market indicate that maintaining a conservative outlook for the city’s revenues in the future is most prudent.
General Fund revenues provide a representative picture of the local economy. These revenues are of particular interest as they fund basic city services such as Police, Fire, Library & Cultural Arts, Street and Park Maintenance and Recreation programs. The table below provides a summarized outlook of the General Fund revenues.
Transient Occupancy Tax 28.1 28.8 0.7 2.5%
Just over 80% of General Fund revenues are derived from three sources property tax, sales tax, and transient occupancy tax. Sales tax receipts and TOT revenues tend to be much more sensitive to changes in economic conditions, unlike property tax revenues, which remain relatively stable because of the mitigating effect of Proposition 13, which limits annual growth in assessed values.
All Other Revenue 30.0 23.3 (6.7) -22.4%
Property tax, the largest source of General Fund revenues, is expected to grow by 6% over last year’s adopted budget and 2.3% over the fiscal year 2021 22 estimated amount. While the residential real estate market in Carlsbad has seen significant increases in values, commercial property assessed values are still expected to remain relatively flat. Due to the uncertainty and slowdown of economic activity created from the COVID 19 pandemic, commercial property transactions have been limited during the prior year. Proposition 8 allows owners to have their property temporarily revalued if market value is lower than the factored base year value, posing a risk that commercial property values could temporarily decrease. While recovery from the pandemic has commenced, new uncertainties have grown surrounding the economy, specifically inflation and impacts on disposable income and the housing market. Commercial property prices are not anticipated to increase significantly on an annual basis.
General Fund
Estimated Budgeted $ % 2021-22 2022-23 Change Change
TaxPropertySalesTax
Fiscal Year
Changes in property tax revenues lag behind changes in the housing market, as the tax revenue for the upcoming fiscal year is based on assessed values from the previous January. Thus, the taxes to be received for fiscal year 2022 23 are based on assessed values as of January 1, 2022.
Property and Sales Tax Revenues
Assessed values on the residential real estate are expected to grow modestly, capped by California’s Proposition 13. Proposition 13, adopted in 1978, limits the annual increase in assessed values for property. Under this proposition, assessed values (and the related property tax) can grow by no more than 2% per year. The value upon which the tax is based is only increased to the full market value upon the sale of a property. The maximum increase of assessed values when properties are not sold is by the change in California’s Consumer Price Index, which was 1.036% in 2021 22 below the 2% cap for the first time since 2016 17. Residential activity has been driven by low interest rates on mortgages, pent up demand that built during the shutdown and an increase in the ability to work remotely. Increasing rates and diminishing pent up demand as we exit the pandemic will have an impact compared to past experience. The median price of a single family residence in Carlsbad based on resale data from Zillow is $1.4 million, up by 28.5% year over year in March 2022.
Millions$
B 4
$29 $31 $33 $35 $35 $35 $41 $38 $44 $50 $49$51 $50 $54 $57 $62 $65 $68 $72 $77 $80 $82
Property taxes tend to grow slowly unless there is a significant amount of development related activity. In past decades the city has seen robust growth in property tax revenue due to new development, high turnover of existing homes, and double digit growth in housing prices. However, as opportunities for new development and growth lessen, development related revenues have slowed. In addition to recent interest rate increases, slower development combined with minimal commercial property transactions and tax reform has caused a slowing in property tax growth in the city.
Sales Tax by Category Fourth Quarter
Sales Tax revenues generally move in step with economic conditions and overall Carlsbad’s economy has been neutral during the pandemic. The restrictions resulting from the COVID 19 pandemic have led to increases in segments like auto sales, construction, drug store sales, chemical products, food markets and recreational products, while others like restaurants and general retail took a major hit. The city has also benefitted from sales tax revenues on internet sales generated as a result of the Wayfair or AB147 law that went into effect in October 2019.
Asestimates.indicate
Until fiscal year 2019 20 sales tax revenues had improved markedly, peaking in fiscal year 2018 19 at $40.8 million. The onset of the pandemic in March 2020 resulted in swift reductions in sales tax revenues and the city ended the year with $38 million in sales tax revenues. During fiscal year 2020 21, impacts of COVID 19 on sales tax generally correlated with shelter in place mandates. As restrictions were lifted, recovery was realized as fiscal year 2020 21 ended with $44 million in sales tax revenues. However, fiscal year 2021 22 experienced the most accelerated recovery the city is estimated to end the year at a historic high of $50 million in sales tax revenues. Much of this recovery resulted from the easing of restrictions and pent up demand. As we move forward into fiscal year 2022 23, much uncertainty remains surrounding market and economic conditions like inflation and impacts to disposable income. As a result, a conservative estimate of $49.1 million is budgeted for fiscal year 2022 23 which represents a decrease of $0.9 million, or 2%, over fiscal year 2021 22
Revenues received under Proposition 72, a 0.5 cent increase in California sales tax for the funding of local public safety services, is included in sales tax revenues.
B 5
d in the chart above, the city’s sales tax base is heavily weighted in the transportation (comprised heavily of new auto sales) and general retail sectors, which combined account for over half of taxable sales in Carlsbad. New auto sales are highly elastic or responsive to changes in price in comparison to economic trends, and tax revenues from new auto sales fell precipitously during the recession, from $6.7 million in 2007 to $4.4 million in 2009. Since that dip, auto sales tax revenues hit a high of $12.2 million for the four quarters ended December 31, 2021. With general retail sales tax suffering for the year ended December 31, 2020, the most recent four quarters have shown full recovery increasing nearly 75% and reaching historic levels.
Transportation,30.5% Construction, 2.4% General20.4%Retail,BusinessMarketsRestaurantsMiscellaneous,0.6%&,13.3%toBusiness,12.7%CountyPool,20.1%
2021
TOT has historically increased as new hotels such as the two hotels at the Legoland California Resort, Cape Rey Carlsbad Beach Resort and the Westin Hotel have opened. The city saw the opening of the Home2Suites and the Springhill Suites hotels during fiscal year 2021 22, but the impact of new openings has been overshadowed by the COVID 19 disease containment and suppression measures. As we navigate through the pandemic, TOT revenues are anticipated to Accordingincrease.
Franchise Tax revenue has stabilized in recent years and is projected at $7.0 million in fiscal year 2022 23. Franchise taxes are paid by certain industries that use the city’s right of way to conduct their business. The city currently has franchise agreements for cable TV service, solid waste services, cell sites, fiber optic antenna systems and gas and electric services. The solid waste franchise fee experienced minor revenue increases that mirror growth in population and changes in rate structures. Cable TV franchise revenue is expected to decrease by 5% from $1.44 million to $1.36 million over the next fiscal year due to decreases in the number of paid subscription services. This
The third highest General Fund revenue source is Transient Occupancy Tax, also known as TOT or hotel tax. TOT was the revenue category most adversely impacted by COVID 19. From historic highs of $26 million in fiscal year 2018 19, year over year decreases of 27% and 16% were experienced. As of last year, TOT was expected to increase approximately 47%, marking the beginning of an anticipated 3 year recovery. However, this recovery was accelerated with the easing of restrictions and pent up demand which resulted in TOT revenues reaching new historic highs. In fiscal year 2021 22 TOT is estimated at approximately $28 million. While group business travel has yet to fully return to pre pandemic levels, uncertainty around rising inflation and diminishing pent up demand drive a more conservative estimate in fiscal year 2022 23.
to a report from Tourism Economics, San Diego County tourism will see significant growth in visitation demand of around 36% in calendar year 2022 and another 9% in calendar year 2023. The projected rebound is driven by lifted travel restrictions and the regions attractiveness for leisure travel, offset by weak group and business travel. The following few years are expected to increase steadily as group and business travel become more prevalent and increases in available rooms continue. The City of Carlsbad currently has approximately 4,812 hotel rooms, 668 timeshares, and over 357 registered vacation rentals.
$15 $17 $20 $22 $22 $24 $26 $19 $16 $28 $2935302520151050 2013 2014 2015 2016 2017 2018 2019 2020 2021 2022e 2023e Millions$ Fiscal Year
Transient Occupancy Taxes
B 6
Business license taxes are closely tied to the health of the local economy and are projected to increase to $6.2 million in fiscal year 2022 23. This represents growth of $0.4 million or 7% when compared to last year’s adopted budget. Increases in business license taxes are in line with projected sales tax revenue increase as businesses either pay taxes based on the amount of their gross receipts or based on set fees. There are currently about 9,591 licensed businesses in the City of Carlsbad, 77 more than in the prior year with 6,327 of them located in the city.
trend will most likely continue in future years as more subscribers cut cable services and move to online streaming services.
San Diego Gas & Electric pays franchise taxes for the use of the public land over which they transport gas and electricity. The city also receives an “in lieu” franchise tax based on the value of gas and electricity transported on SDG&E lines, but purchased from another source. The “in lieu” tax captures the franchise taxes on gas and electricity that is transported using public lands, which would not otherwise be included in the calculations for franchise taxes due to deregulation of the power industry. This revenue source is expected to remain flat over the next several years.
Development related revenues are derived from fees for planning, engineering and building permits, and fees paid by developers to cover the cost of reviewing and monitoring development activities, such as plan checks and inspections. These revenues are difficult to predict as many of the planning and engineering activities occur months or years before any actual development.

B 7
Income from investments and property include interest earnings as well as rental income from city owned land and facilities. The city is expected to earn about $2.8 million in interest on its General Fund investments for fiscal year 2022 23 and another $2.7 million in rental and lease income. The yield on the city’s portfolio is forecasted to average 1.5% and cash balances are expected to
In April 2021, a new franchise agreement for solid waste was approved with Republic Services of San Diego. The General Fund receives 7.5% of revenues collected. Revenue is expected to increase overall to reflect the increased costs associated with a new organics composting program mandated by state law and to provide new services based on feedback from the community.
Interdepartmental charges are generated through engineering services charged to capital projects, reimbursed work from other funds and miscellaneous interdepartmental expenses charged to funds outside the General Fund for services performed by departments within the General Fund. Miscellaneous interdepartmental charges are expected to decrease by 1%.
Over the last 10 years development related revenues have fluctuated in line with increases and decreases in residential, commercial and industrial development. In fiscal year 2022 23 the city expects a 24% decrease in development related revenues to approximately $2.9 million. This follows higher than anticipated development activity occurring in fiscal year 2021 22. The projected decrease in development related revenues is tied to the volume and type of development projected to be permitted, multi family versus single family, and a drop in the revenues derived from building fees which occur in the early stages of development.
Transfer taxes are those taxes paid to the county upon the transfer of interests in real estate. The tax is $1.10 per $1,000 of property value, split equally between the county and the city. Carlsbad expects to receive approximately $1.6 million in transfer taxes for fiscal year 2022 23 which is a 22% increase from the fiscal year 2021 22 adopted budget and relatively consistent with current year estimates. The residential real estate market continues remains strong; however, this will likely be influenced by rising interest rates. Housing prices are continuing to increase in Carlsbad and inventories remain low.
remain flat as increases in receipts are projected to be offset by increases in expenditures as the City Council’s goals are operationalized.
Overall and as reflected in the bar chart above, General Fund revenues are expected to be down $6.2 million or 3% from fiscal year 2021 22 estimates. This is largely due to the final American Rescue Plan Act payment of $6.3 million received in fiscal year 2021 22 and the recovery from COVID 19 exceeded original timing expectations. As the city moves out of the pandemic, uncertainty surrounding inflation, diminishing pent up demand and impacts to the housing market contribute to a conservative outlook that will be monitored into the future.
Other intergovernmental revenues include miscellaneous receipts received from the state or federal governments as well as local school districts. The city received its two annual American Rescue Plan Act payments in fiscal year 2020 21 and fiscal year 2021 22 totaling $12.6 million. With the funding ending in fiscal year 2021 22, intergovernmental revenues will decrease substantially in fiscal year 2022 23.
B 8
Ambulance fee revenues are estimated to increase $1.3 million over last year’s adopted budget. This increase is due to the Fire Department’s addition of two new ambulances as approved in the Standards of Cover, which will enable the Fire Department to transport more patients
General Fund Revenues
$100$50$$150 $250$200 2014 2015 2016 2017 2018 2019 2020 2021 2022e 2023e Millions$ Fiscal Year
All other revenues include recreation fees, other licenses and fees, fines and forfeitures, transfers in and other charges and fees. The estimate for fiscal year 2022 23 totals $5 million and is expected to remain relatively flat over the previous fiscal year.
• Federal Grants (Rental Assistance and Community Development Block Grants)
• Special fees and assessments (Affordable Housing and Maintenance Assessment Districts)
In the late 1990s the city experienced revenue growth between 9% and 17% due to the opening of new hotels, restaurants, retail centers and new home development. Those levels of planned growth were not sustainable. As new development slows, it will be increasingly more difficult to produce double digit growth in revenues. In fact, revenue growth has now slowed to 4% over the last ten years. A recovering economy is certainly driving General Fund revenues higher, but this growth comes from a lower revenue base due to the impacts of the COVID 19 crisis. The city’s revenues, excluding COVID 19 related subsidies, are not projected to fully recover to pre COVID 19 levels until fiscal year 2022 23 and then revenue growth is forecasted to stabilize at between 2 4% in the following years.
Other Funds
B 9
• Donations (Library, Cultural Arts, Recreation and Senior Donations)
City staff develop 5 year and 10 year forecasts as part of the budget process. While long term projections are inherently less reliable than short term projections, they can help detect potential budget issues early and help the city plan for the future. Details on the city’s General Fund forecast, including information on both revenue and expenditure assumptions, are available in an appendix to this document.
Revenues from Special Revenue funds are expected to total $17.9 million, an increase of $4.0 million or 29% from the fiscal year 2021 22 adopted budget. Funds collected in this category are restricted to specified purposes. The types of programs supported within Special Revenue funds are those funded by specific revenue streams such as:
Rental$11.4M,Assistance64% Affordable Maintenance$0.5M,CDBG$0.5M,Housing3%3%Districts$4.0M,22%DonationsandGrants$0.5M,3% All $1.0M,Others5% Special Revenue Funds FY 2022 23 Budgeted Revenues $17.9 Million
Compared to the fiscal year 2021 22 adopted budget, the most noteworthy changes in the Special Revenue funds occurred in the Rental Assistance Fund where increases of $3.9 million are expected to occur. These revenues are federally funded and tend to fluctuate from year to year.
The Successor Agency Housing Trust Fund revenues are budgeted at $0.5 million which represents a 52% decrease over fiscal year 2021 22 estimates. Although the Carlsbad Redevelopment Agency has been dissolved, the California Department of Finance has approved the repayment of the approximately $8.1 million (plus accrued interest) loaned to both the city’s former redevelopment areas by the General Fund as well as debt service payments remaining on the former agency’s 1993 Tax Allocation Refunding Bonds. All outstanding loans and interest accrued will have been paid to the city by the end of fiscal year 2020 21 and only debt service payments remain. Payments are distributed annually from available property tax revenues allocated by the state to the successor agency.
Enterprise fund revenues for fiscal year 2022 23 are projected at $89.6 million representing an increase of 5.6% or $4.7 million over the current year estimates. The revenue breakdown by activity is shown in the graph below.
B 10
The Water Enterprise Fund revenue for fiscal year 2022 23 is estimated at $47.0 million representing a decrease of $0.7 million or 1.5% when compared to current year revenue estimates. This decrease is driven by one time SDCWA refunds received in fiscal year 2021 22 that are not expected in fiscal year 2022 23. Projected revenues for Recycled Water of $8.7 million are expected to increase by $0.2 million or 2% as minor customer growth is expected and a 1% increase in rates is forecasted.
Enterprise funds are similar to a business in that rates are charged to support the operations that supply the good and/or service. Carlsbad enterprise funds include water and recycled water delivery, wastewater services, solid waste management and the operation of a municipal golf course. The fiscal year 2022 23 operating budget reflects additions for an updated sewer master plan as well as significant increases for Water Authority rate increases for purchases water.
Water$47.0M,Operations52%
Enterprise Funds
FY 2022 23 Budgeted Revenues $89.6 Million
Recycled Water $8.7M, 10% ManagementSolid$19.3M,WastewaterOperations21%Waste,$5.0M,6%GolfCourseOperations,$9.6M,11%
Internal Service funds project estimated revenues of $33.1 million for fiscal year 2022 23 representing an 8.4% or $2.6 million increase over fiscal year 2021 22 Internalprojections.Service funds account for services provided within the city itself, from one department to another and on a cost reimbursement basis. These include programs such as the self insurance funds for Workers’ Compensation and General Liability (Risk Management), as well as Vehicle Maintenance and Replacement, and Information Technology. Departments pay for these services and therefore the rates charged are based on the cost to provide the service. The goal of an Internal Service fund is to match budgeted expenses with charges to the departments.
Estimated revenues from operations of the Golf Course of $9.6 million are expected to increase slightly by $0.6 million or 7% when compared to current year estimates. $7.5 million was conservatively budgeted in fiscal year 2021 22; however, outdoor activities such as golf experienced tremendous growth throughout the pandemic.
A recent actuarial review of the Workers’ Compensation fund determined that the city should continue to set aside cash reserves in anticipation of future Workers’ Compensation claims. To achieve this, charges to city departments need to increase by 10 15% annually over the next several years. These planned increases went into effect in fiscal year 2021 22 and are continuing into fiscal year 2022 23. The fiscal year 2022 23 operating budget includes $5.3 million for Workers’ Compensation and $4.0 million for Risk Management. This represents a $0.4 million and $0.6 million increase over the previous fiscal year estimates, respectively.
B 11
Forecasted revenues for Wastewater are $19.3 million representing a 24% or $3.8 million increase over the current year estimate. This estimated increase is largely driven by rate increases of 20% in both 2022 and 2023 to support rising treatment costs and aging infrastructure costs.
Information Technology charges to departments have increased by 11.0% or $1.6 million when compared to fiscal year 2021 22 estimates. The main reason for this increase is due to a reorganization of personnel within the city. Employees within the Business Systems Associate series
Vehicle Maintenance and Replacement charges are budgeted at $3.3 million and $4.0 million, respectively. Vehicle replacement costs rise when the number of vehicles and the price of new vehicles or the cost to maintain those vehicles increases. For example, many older generation sedans at the end of their useful life are now being replaced with hybrid and plug in hybrids at a higher per unit cost. There have also been significant cost increases over the last several years in specialized vehicles such as fire trucks and ambulances. The total number of vehicles that the Replacement charge is collecting on has increased for two additional reasons: the city added vehicles to its fleet, largely in the Fire and Police departments; and vehicles previously deferred for replacement were replaced thereby restarting the collection cycle.
Solid Waste Management revenues are projected to increase by 22% to $5.0 million when compared to current year estimates. This increase is mainly driven by a storm water reimbursement of $1.3 million from the city’s new waste hauler contract.

Internal Service Fund Allocation Methodology
• Vehicle Maintenance Comprised of a combination of fixed and variable maintenance charges. Fixed maintenance charges are based on a three year average of maintenance costs in combination with budgeted labor costs. Variable maintenance charges are based on actual costs.
• Information Technology Operations Based on a combination of computers per department as a percentage of citywide computers for citywide maintenance/licensing and costs charged directly to individual departments for items specific to a department.
B 12
• Vehicle Replacement Based on equipment assigned to departments.
Most of the revenue for the city’s internal service funds are generated from internal services charges. The expenses of each fund are budgeted for and then allocated to other funds on an annual basis. Each internal service fund uses a different allocation basis to charge other funds for its costs, summarized below.
• Workers’ Compensation Based on a combination of personnel count and five year average claims costs by department.
(9.49 total FTE) were transferred from various departments citywide to the Information Technology Department. Consequently, the Information Technology budget and corresponding charges have increased to account for these new personnel costs.
• Information Technology Replacement Based on a combination of equipment and hardware specifically assigned to a department and for infrastructure hardware an allocation based on computers per department as a percentage of citywide computers.
The city also contracts with an outside consultant to develop a professionally prepared cost allocation plan. The goal of this effort is to define the total cost of applicable administrative or “indirect services” overhead costs to various departments, revenue funds, and grant funded programs. For the purposes of budgeting, the city uses the full cost allocation plan to allocate all reasonably identifiable administrative overhead costs to receivers of these services within the organization. This internal budgeting tool establishes overhead support costs at the department level and allows the city to charge out overhead costs incurred in the General Fund to non General Fund departments on an annual basis. In years where a new cost allocation plan is not developed, chargebacks are increased by a percentage factor based on a weighted average of salary increases and the West Urban CPI.
• General Liability Based on a combination of personnel count, five year average claims costs by department and vehicles assigned to departments.
OPERATING BUDGET EXPENDITURE SUMMARY
Personnel costs make up approximately 62.6% of the General Fund budget. The total personnel budget for fiscal year 2022 23 is $124.1 million which is $7.8 million or 6.7% greater than the previous year’s total personnel budget of $116.3 million. In fiscal year 2022 23, the budget proposes including a line item for “vacancy savings.” This represents the estimated amount of budgeted personnel savings that will be realized by the end of the fiscal year. Vacancy savings are realized when vacant or new positions take longer than expected to fill or when they are filled at a lower cost than budgeted
Budget Budget $ % 2021-22 2022-23 Change Change
By Fund Type (In Millions)
GENERAL FUND SUMMARY By Expenditure Type (In Millions)
The General Fund contains most of the discretionary revenues that support basic core city services. However, this should not diminish the importance of the other operating funds as they also contribute to the array of services available within Carlsbad. The remainder of this section will provide more information about the budgeted expenditures by fund and program.
The city’s Operating Budget for fiscal year 2022 23 totals $342.3 million, which represents an increase of about $25.2 million or 8.0% as compared to the adopted fiscal year 2021 22 budget. A summary of the changes in each of the city’s programs will be discussed below. Further information about each program can be found in the individual program summary pages.
General Fund 184.6$ 198.4$ 13.8$ 7.5% Special Revenue 15.4 17.3 1.9 12.3% Enterprise 86.4 92.9 6.5 7.5% Internal Service 29.6 32.6 3.0 10.1% Successor Agency Housing Trust 1.1 1.1 0.0% Total 317.1$ 342.3$ 25.2$ 8.0%
Personnel 116.3$ 124.1$ 7.8$ 6.7% Personnel, gross 116.3 126.1 9.8 8.4% Vacancy Savings (2.0) (2.0) 0.0% Maintenance & Operations 60.3 59.2 (1.1) -1.8%
The total Operating Budget for the General Fund for fiscal year 2022 23 is $198.4 million which is $13.8 million or 7.5% more than the previous year’s Adopted Budget of $184.6 million. These changes are discussed in more detail on the following pages.
BUDGET EXPENDITURE SUMMARY
Subtotal 184.6$ 198.4$ 13.8$ 7.5%
Capital Outlay 0.9 1.5 0.6 71.9% Transfers 7.1 13.6 6.5 90.3%
B 13
Budget Budget $ % 2021-22 2022-23 Change Change
B 14
o Four Senior Lifeguards (Parks & Recreation), with part time reduction
Salaries and Wages 79.8$ 83.3 3.5 4.5% Salaries and Wages, gross 79.8 85.3 5.5 6.9% Vacancy Savings (2.0) (2.0) 0.0% Retirement Benefits 19.8 23.0 3.2 16.0% Health Insurance 10.4 10.7 0.3 3.3% Other Personnel 6.3 7.1 0.8 12.2%
Total 116.3$ 124.1$ 7.8$ 6.8%
The part time additions include:
o Senior Engineer 5 year limited term (Fleet & Facilities)
o Client Systems Associate Administrator (Information Technology), with part time reduction
• Three counseling associates and one counseling supervisor totaling 1.18 full time equivalents (Police)
Tsavings.hetable
This mechanism is being proposed for multiple reasons. (1) Budgeting for vacancy savings reduces the total amount of the General Fund budget, (2) budgeted personnel costs more closely align with actual personnel costs over the course of the fiscal year, (3) historically, the city would bring recommendations to repurpose budget savings at the mid year point of the fiscal year; this mechanism pre emptively achieves that objective, and (4) budgeting vacancy savings will achieve alignment with the city’s 10 year forecast which has historically included a line item for vacancy
• Non General Fund
• Building Maintenance Worker (Fleet & Facilities)
• An Administrative Secretary FTE increase (Administrative Services Administration)
• General Fund
o Parks Planner 5 year limited term (Parks & Recreation)
Budget Budget $ % 2021-22 2022-23 Change Change
Personnel Costs (In GENERALMillions)FUND
o Strategic Plan Analyst (Innovation & Economic Development), with part time reduction
o Management Analyst (Police)
o Housing Assistant (Housing & Homeless Services)
o Management Analyst (Utilities)
above shows the breakdown of personnel costs for the General Fund. General Fund salaries include full and part time staff costs and are expected to increase in fiscal year 2022 23 by $3.5 million or 4.5%. The increase is primarily due to 24.0 new full time positions and 3.4 full time equivalent part time positions proposed for the next fiscal year.
o Twelve Emergency Medical Technicians (Fire)
The full time additions include:
• Three Emergency Medical Technicians (Fire)
In addition, costs have increased due to contracted and anticipated wage and benefit increases for budgeted positions in fiscal year 2022 23.
o Utility Locator (Utilities)
Retirement Benefits Cost
In support of CalPERS strategies for plan sustainability and as part of the city’s strategic, long term approach to financial management, the city actively manages its unfunded pension liability. Since fiscal year 2016 17, the City Council has approved additional discretionary contributions of $56.4 million to decrease future costs of the city’s unfunded actuarial liability and strive to achieve a funded status of 80% in accordance with City Council Policy Statement No. 86. This active management helps ensure that resources are available to fulfill the city’s contractual promises to its employees and minimizes the chance that funding these pension benefits will interfere with the city’s ability to provide essential public services.
B 15
To ensure the city maintains a balanced budget and continuously analyzes its use of taxpayer dollars, departments were asked to reduce their existing budget for fiscal year 2022 23 and decrease discretionary spending wherever possible. Even with the approval of additional budget items, General Fund departments were able to reduce their maintenance and operations budget requests by 1.8% overall. This was accomplished despite the increase in costs for certain mandatory fees and unavoidable costs such as SDG&E rate increases and other rising contracted services costs.
CalPERS administers the city’s defined benefit pension plan and costs have been increasing in past years as CalPERS addresses a structural shortfall in plan assets to cover unfunded liabilities. As part of CalPERS’ strategy to ensure the plan’s sustainability, CalPERS deliberately raised participating agencies’ contributions over several years to improve the plan’s long term funded status. The pension system continues to pursue tactics in support of its strategy to ensure plan sustainability such as investing in assets with the objective of achieving a long term rate of return that meets or exceeds 7%. While pension costs are increasing, there is some downward pressure on costs as new employees receive lower pension benefits. CalPERS has taken significant steps to ensuring plan sustainability, but still poses a significant risk on the city’s cost profile.
General Fund Health Insurance costs in the General Fund are increasing by $0.3 million or 3.3% over the prior year. This increase is largely due to estimating maximum health insurance coverage and associated costs for new and current employees. Other Personnel Costs include workers’ compensation expenses and other miscellaneous costs such as Medicare, unemployment and disability which are increasing collectively by $0.8 million or 12.2%.
Maintenance and Operations costs represent about 29.8% of the total General Fund budget and include the budgets for all program expenses other than personnel, capital outlay and transfers. Overall, total maintenance and operations costs are projected at $59.2 million which represents a decrease of about $1.1 million or 1.8% for fiscal year 2022 23 when compared to fiscal year 2021 22.
Capital Outlay includes budgeted equipment purchases over $1,000. Capital outlay purchases of $1.5 million are budgeted in the General Fund for fiscal year 2022 23. The majority is associated with the purchase of a fire engine in the Fire Department and is related to the City Council goal to bring the Fire Department into conformance with Standards of Cover evaluation.
In support of CalPERS strategies for plan sustainability, and as part of the city’s strategic, long term approach to financial management, the city actively manages its unfunded pension liability.
As the city completes major capital projects, the costs of maintaining and operating the facilities and improvements, including additional personnel if necessary, are added to departmental operating budgets. In this budget cycle, two five year limited term positions were added for a senior engineer and parks planner to assist with the capital improvement project workload in the near future. The total annual cost for these two positions included in the city’s operating budget is $301,126.
$119 $121 $129 $171 $148 $168 $164 $211 $200 $198$250$200$150$100$50$2014 2015 2016 2017 2018 2019 2020 2021 2022e 2023e millions)(in$ Fiscal Year
Operating Costs Associated with Capital Investments
Advances
Expenditures in the General Fund remained flat until fiscal year 2015 16 budget reflected an 8.2% increase in expenditures due primarily to increased personnel costs, and the fiscal year 2016 17 expenditures included $25.3 million in one time costs, including $10.5 million for a transfer to the Capital Improvement Program for Fire Station 2 replacement, and $14.8 million to pay of the golf course construction bonds.
Advances and repayments of prior advances are amounts anticipated to be transferred from the General Fund to other city funds and are expected to be repaid to the General Fund in future years. No General Fund advances are included in this year’s Operating Budget.
The expenditures for fiscal year 2017 18 reflect a substantial decrease due to the one time costs reflected in fiscal year 2016 17 for the defeasance of the golf course bonds of $14.8 million and the transfer of $10.5 million to the General Capital Construction Fund for the reconstruction of Fire Station 2. These cost reductions were partially offset by an additional one time payment to CalPERS to address the city’s unfunded pension liability, the addition of nine staff members, additional legal and expert costs associated with the county airport expansion and the Safety Training Center lawsuit, higher personnel costs due to normal salary and benefit increases, higher mutual aid costs, and the filling of prior year vacancies.
Expenditures in fiscal year 2018 19 reflect an additional one time $20 million payment to CalPERS to further bring down the city’s unfunded pension liability. Fiscal year 2019 20 included the addition of 34 new full time employees but was largely offset due to the city’s response to the COVID 19 pandemic and the need to reduce discretionary spending as much as possible during the unprecedented time.
B 16
History of General Fund Expenditures
GENERAL FUND EXPENDITURES
Budget Budget $ % 2021-22 2022-23 Change Change
Fiscal year 2020 21 expenditures reflect an additional one time $10 million payment to CalPERS to further bring down the city’s unfunded pension liability. The increase was largely offset by the continuation COVID 19 pandemic and the city’s efforts to curb and defer expenditures.
Fiscal year 2021 22 expenditures reflect the plan to reinstate city services back to pre pandemic levels and operationalize the City Council’s goals. The increase includes $5.9 million in one time costs associated with the goals, and the addition of 18 new full time and 6.7 part time employees which are mostly associated with the goals. The city also made an additional one time $6.4 million payment to CalPERS to bring down the city’s unfunded pension liability.
A detailed description of each department’s budget can be found in the department program summaries.
Total 184.6$ 198.4$ 13.8$ 7.5%
Public Works - Facilities 6.6 6.8 0.2 3.3%
Public Safety - Police 48.8 51.2 2.4 5.1% Public Works - Administration 1.9 1.4 (0.5) -25.8%
Policy & Leadership Group 8.1$ 8.5$ 0.4$ 4.2% Administrative Services - Administration 0.5 0.6 0.1 31.5% Administrative Services - Finance 5.6 5.5 (0.1) -2.8% Administrative Services - Human Resources 5.0 5.3 0.3 6.2% Administrative Services - Innovation & Economic Dev. 1.2 2.5 1.3 104.5% Community Services - Administration 0.7 0.7 3.0% Community Services - Community Development 10.5 10.4 (0.1) -1.1% Community Services - Housing & Homeless Services 5.9 3.1 (2.8) -46.9% Community Services - Library & Cultural Arts 13.8 14.1 0.3 2.2% Community Services - Parks & Recreation 19.2 21.2 2.0 10.5% Public Safety - Fire 33.5 37.8 4.3 12.6%
Program Expenditures
Public Works - Construction Mgmt. & Inspection 3.0 3.3 0.3 9.1% Public Works - Environmental Management 1.3 1.2 (0.1) -9.6%
Public Works - Transportation 8.4 9.7 1.3 15.5% Non-Departmental 10.6 15.1 4.5 43.1%
By(InDepartmentMillions)
B 17
Another way of looking at the General Fund budget is by program. The chart below compares the total fiscal year 2022 23 budget to those amounts adopted in the previous year. A detailed description of each department, its services, budget summary and department accomplishments and priorities can be found in the department program summary pages.
General Fund Reserves
Projected unassigned balance at June 30, 2022 $115.7 million Plus: projected fiscal year 2022 23 surplus $ 0.4 million Equals: projected unassigned balance at June 30, 2023 $116.1 million
General Fund Summary
Changes in Other Funds
Transfers are amounts anticipated to be transferred from the General Fund to another city fund. The transfers included in the adopted budget are as follows:
$1.4 million to the Median Maintenance and Street Tree Maintenance Special Revenue Funds to cover cash shortfalls as annual assessments collected from property owners do not cover annual operating expenditures. Annual assessments can only be increased with a majority vote of the property owners.
$332,000 to the Storm Water Program for reimbursement for the General Fund portion of Storm Water expenses.
$11.9 million split evenly between the Infrastructure Replacement Fund, General Capital Construction Fund and the Technology Investment Capital Fund ($3.96 million each). This will fund major new construction, maintenance and/or replacement of city infrastructure and facilities and the city’s future technology needs. This represents 6% of budgeted General Fund revenues and is in line with the requirements set forth in Council Policy No. 91 Long Term General Fund Capital Funding Policy.
Special Revenue funds, budgeted at $17.3 million show an increase in expenditures of 12.3% or $1.9 million when compared to fiscal year 2021 22. Spending in most programs is expected to remain at similar or slightly higher levels over the prior year.
Expenditure increases of $2.5 million or 31.8% are planned in the Rental Assistance Fund largely because of program expansion and corresponding increase in rental assistance payments. This reflects additional revenue received from federally funded programs to assist more lower income households in Carlsbad.
Fiscal Year 2022 23 General Fund Operating Surplus General Fund fiscal year 2022 23 revenue estimates $198.8 million General Fund fiscal year 2022 23 proposed expenditures $198.4 million Projected operating surplus for fiscal year 2022 23 $ 0.4 million
Enterprise funds total $92.9 million which represents an increase of $6.5 million or 7.5% over the fiscal year 2021 22 adopted budget. The Potable Water and Recycled Water funds continue to operate and maintain critical infrastructure systems and provides the safe delivery of drinking water, conservation outreach and treated irrigation water. The Wastewater fund provides reliable wastewater collection services.
The Operating Budget for fiscal year 2022 23 provides a balanced General Fund budget for the coming fiscal year with General Fund revenue estimates exceeding General Fund budgeted expenditures by $0.5 million. This projected surplus will be added to city reserves to be used in accordance with the city’s adopted reserve policy.
B 18
The Internal Service funds total $32.6 million and represents an overall increase of $3.0 million or 10.1% over fiscal year 2021 22. Much of the increase in Workers’ Compensation and Risk Management costs is attributable to rising insurance liability rates, claims filed and administrative costs. Vehicle Maintenance and Replacement and Information Technology expenditure increases correspond with the city’s efforts to continue to modernize, upgrade and invest in needed equipment, systems and applications. More detail regarding the increase in Information Technology due to the reorganization of personnel can be found in the internal service fund piece of the revenue summary section earlier in this document.
B 19
While the projected cumulative change in the city’s non major funds’ ending balances is not significant, several major funds are projected to see changes in their fund balances greater than 10 percent. The Water Operations Fund is expected to decrease by approximately 12% by the end of fiscal year 2021 22 and another 10% by the end of fiscal year 2022 23. This is largely due to increasing operations costs and cash transfers to account for depreciation. The Recycled Water Operations Fund is expected to decrease significantly by the end of fiscal years 2021 22 and 2022 23. This decrease includes timing of capital projects that are completed prior to an opportunity to apply for a reimbursement grant, including a low interest State Revolving Fund loan which would be awarded in subsequent years. The Golf Course Fund is anticipated to increase by nearly 78% by the end of fiscal year 2021 22 and 10% at the end of fiscal year 2022 23. This is largely due to the strong performance of The Crossings during the pandemic. Lastly, the Wastewater Operations Fund will increase by almost 30% by the end of fiscal year 2022 23, mainly due to revenue from rate increases structured to meet capital improvement goals.
The budget for the Successor Agency Housing Trust Fund for fiscal year 2022 23 is approximately the same as the prior year’s adopted budget of $1.1 million. The Recognized Obligation Payments Schedule (ROPS) identifies financial commitments of the former Redevelopment Agency, including the remaining scheduled debt service payments on the Redevelopment Agency bond issue, the outstanding loan from the city’s General Fund and minor allowable administrative costs. The last debt service payment on the bond issue is scheduled for September 2023 and the city loan will be paid off by the end of fiscal year 2021 22. These obligations are to be paid from semi annual property tax increment revenue received by the Successor Agency.
Changes to Fund Balance
The proposed budget for 2022-23 includes reorganization of (9.0) FTE from various departments to Information Technology and (4.0) FTE from Information Technology to Innovation & Economic Development.
PERSONNEL ALLOCATIONS
Fire 97.75 97.75 111.00 112.00 123.00 Police 184.00 184.00 186.00 186.00 187.00
Information Technology 35.00 37.00 37.00 37.00 43.00
Innovation & Economic Development 2.00 4.00 4.00 4.00 9.00
Human Resources 17.00 17.00 17.00 18.00 18.00
Communication & Engagement 7.00 7.00 7.00 9.00 9.00
City Treasurer 1.00 1.00 1.00 1.00 1.00
Finance 31.00 31.00 28.00 28.00 26.00
City Council 2.00 2.00 2.00 2.00 2.00
City Manager 12.00 7.00 7.00 7.00 7.00
Community Development 63.75 61.75 53.00 52.00 52.00
Hourly Full-Time Equivalent Personnel 199.97 186.59 193.81 185.65 180.90 Total 947.72 934.34 967.06 968.40 987.65
Community Services - Administration 0.00 3.00 3.00 3.00 3.00
TheNotes:adopted budgets for fiscal years 2019-20 to 2021-22 include various reorgnizations and personnel transfers between departments.
Total Full-Time Personnel 747.75 747.75 773.25 782.75 806.75
*The ending budget for 2021-22 takes into account full-time personnel changes approved mid-year, including: the transfers of (1.0) FTE from Community Development to Housing & Homeless Services and (1.0) FTE from Utilities to Human Resources, the addition of (6.0) FTE in Environmental Sustainability and (1.0) FTE in Fire, and the conversion of hourly FTE to add (0.50) FTE to Library & Cultural Arts and (2.0) FTE to Communications & Engagement.
Housing & Homeless Services 0.00 0.00 14.00 15.00 16.00
Public Works 172.75 172.75 177.75 182.75 182.75
Library & Cultural Arts 52.50 52.50 52.50 53.00 51.00
City Attorney 8.00 8.00 8.00 8.00 8.00
Administrative Services - Administration 0.00 0.00 3.00 3.00 3.00
City Clerk Services 7.00 7.00 7.00 7.00 7.00
Parks & Recreation 55.00 55.00 55.00 55.00 59.00
B 20
Adopted Adopted Adopted Final* Adopted Budget Budget Budget Budget Budget Department 2019-20 2020-21 2021-22 2021-22 2022-23
B 21
Total Enterprise Funds 58,338,338 84,829,096 90,106,547 53,060,887 -9.1%
Workers' Compensation 5,935,084 4,891,730 4,246,463 6,580,351 10.9%
Library Gifts and Bequests 1,654,623 200,816 216,363 1,639,076 -0.9%
Vehicle Replacement 19,141,279 3,999,451 4,540,000 18,600,730 -2.8%
Information Technology 8,320,615 14,858,482 13,892,500 9,286,597 11.6%
Total Internal Service Funds 37,092,086 30,497,805 29,929,483 37,660,408 1.5%
Total Special Revenue Funds 34,510,118 18,867,909 16,678,998 36,699,029 6.3%
Tyler Court Apartments 330,598 641,000 485,000 486,598 47.2%
Solid Waste Management 11,991,468 4,084,447 4,017,239 12,058,676 0.6%
* For the General Fund only, this represents unassigned fund balance.
Community Development Block Grant 266,637 1,492,368 1,548,299 210,706 -21.0%
Lighting and Landscaping District 2 4,615,763 687,680 398,124 4,905,319 6.3%
Special Revenue Funds
Total Operating Funds 242,370,573$ 340,184,182$ 337,976,688$ 244,578,067$ 0.9%
Public Safety Grants 196,696 196,696 0.0%
Senior Donations 336,216 14,037 19,000 331,253 -1.5%
B 22
Library and Arts Endowments 270,832 2,800 6,000 267,632 -1.2%
Water Operations 30,390,857 47,723,538 51,321,219 26,793,176 -11.8%
Golf Course 2,119,080 8,957,000 7,306,826 3,769,254 77.9%
Risk Management 2,668,730 3,392,080 3,740,520 2,320,290 -13.1%
Vehicle Maintenance 1,026,378 3,356,062 3,510,000 872,440 -15.0%
Agricultural Mitigation Fee 1,025,623 223,100 1,248,723 21.8%
Internal Service Funds
SCHEDULE OF PROJECTED FUND BALANCES
Buena Vista Channel Maintenance District 1,502,960 115,000 106,500 1,511,460 0.6%
Cultural Arts Donations 338,366 51,826 82,491 307,701 -9.1%
Enterprise Funds
Recreation Donations 292,508 28,234 45,782 274,960 -6.0%
Successor Agency Housing Trust Fund 1,431,269 1,067,000 1,038,500 1,459,769 2.0%
Street Tree Maintenance District 159,543 910,000 950,000 119,543 -25.1%
Police Asset Forfeiture 259,469 918 20,000 240,387 -7.4%
Projected Projected Beginning Ending Change as % of Fund Balance Estimated Estimated Fund Balance July 1, 2021 Fund July 1, 2021 Revenues Expenditures June 30, 2022 Fund Balance
Affordable Housing 16,702,385 1,815,000 200,000 18,317,385 9.7%
Rental Assistance 235,713 9,682,700 9,597,000 321,413 36.4%
General Fund 110,998,762$ * 204,922,372$ 200,223,160$ 115,697,974$ * 4.2%
Street Lighting Maintenance District 2,862,534 927,000 849,000 2,940,534 2.7%
Citizens' Option for Public Safety 304,670 186,034 266,106 224,598 -26.3%
Community Activity Grants 1,125,132 12,000 15,000 1,122,132 -0.3%
Local Cable Infrastructure 941,429 288,600 467,962 762,067 -19.1%
Median Maintenance District 84,768 1,315,000 1,160,000 239,768 182.9%
Parking In Lieu Fee 1,200,349 12,000 49,675 1,162,674 -3.1%
Habitat Mitigation Fee 65,100 65,100 0.0%
Recycled Water Operations 5,652,330 8,537,611 11,403,789 2,786,152 -50.7%
Wastewater Operations 8,184,603 15,526,500 16,057,474 7,653,629 -6.5%
Library Gifts and Bequests 1,639,076 264,900 394,467 1,509,509 -7.9%
Cultural Arts Donations 307,701 25,500 131,750 201,451 -34.5%
Local Cable Infrastructure 762,067 260,000 395,006 627,061 -17.7%
Community Activity Grants 1,122,132 13,500 30,000 1,105,632 -1.5%
Affordable Housing 18,317,385 495,000 393,385 18,419,000 0.6%
Citizens' Option for Public Safety 224,598 201,000 265,705 159,893 -28.8%
Median Maintenance District 239,768 1,315,000 1,329,900 224,868 -6.2%
Street Lighting Maintenance District 2,940,534 920,000 1,065,393 2,795,141 -4.9%
Total Special Revenue Funds 36,699,029 17,917,410 17,321,198 37,295,241 1.6%
Lighting and Landscaping District 2 4,905,319 730,000 338,070 5,297,249 8.0%
Solid Waste Management 12,058,676 4,999,230 5,801,402 11,256,504 -6.7%
Enterprise Funds
Internal Service Funds
Habitat Mitigation Fee 65,100 65,100 0.0% Library and Arts Endowments 267,632 6,000 261,632 -2.2%
Water Operations 26,793,176 46,990,138 49,715,832 24,067,482 -10.2%
Beginning Ending Change as % of Fund Balance Estimated Adopted Fund Balance June 30, 2022 Fund June 30, 2022 Revenues Budget June 30, 2023 Fund Balance
Rental Assistance 321,413 11,403,180 10,409,089 1,315,504 309.3%
SCHEDULE OF PROJECTED FUND BALANCES
Recycled Water Operations 2,786,152 8,730,496 11,206,521 310,127 -88.9%
Vehicle Replacement 18,600,730 3,969,367 5,293,745 17,276,352 -7.1%
Buena Vista Channel Maintenance District 1,511,460 116,000 195,245 1,432,215 -5.2%
Community Development Block Grant 210,706 527,154 636,728 101,132 -52.0%
Workers' Compensation 6,580,351 5,314,620 4,507,014 7,387,957 12.3% Risk Management 2,320,290 3,993,370 3,780,570 2,533,090 9.2%
General Fund 115,697,974$ * 198,764,175$ 198,445,022$ 116,017,127$ * 0.3%
Successor Agency Housing Trust Fund 1,459,769 510,000 1,068,845 900,924 -38.3%
Total Operating Funds 244,578,067$ 339,824,280$ 342,318,824$ 242,083,523$ -1.0%
Total Internal Service Funds 37,660,408 33,062,331 32,565,436 38,157,303 1.3%
* For the General Fund only, this represents unassigned fund balance.
Street Tree Maintenance District 119,543 920,000 880,235 159,308 33.3% Tyler Court Apartments 486,598 648,637 540,716 594,519 22.2%
B 23
Projected Projected
Police Asset Forfeiture 240,387 125,000 115,387 -52.0%
Public Safety Grants 0.0% Recreation Donations 274,960 31,539 81,009 225,490 -18.0%
Special Revenue Funds
Senior Donations 331,253 16,000 50,500 296,753 -10.4%
Golf Course 3,769,254 9,574,000 9,195,000 4,148,254 10.1%
Total Enterprise Funds 53,060,887 89,570,364 92,918,323 49,712,928 -6.3%
Information Technology 9,286,597 16,487,619 15,477,967 10,296,249 10.9%
Wastewater Operations 7,653,629 19,276,500 16,999,568 9,930,561 29.8%
Parking In Lieu Fee 1,162,674 15,000 53,000 1,124,674 -3.3%
Agricultural Mitigation Fee 1,248,723 15,000 1,263,723 1.2%
Vehicle Maintenance 872,440 3,297,355 3,506,140 663,655 -23.9%
Business License Tax 5,704,577 6,827,000 6,242,000 -8.6% (585,000)
Homeowners Exemption 346,499 350,000 353,000 0.9% 3,000 Other Intergovernmental 9,496,508 7,156,915 617,309 -91.4% (6,539,606)
Building Permits 1,355,056 1,400,000 900,000 -35.7% (500,000)
Charges for Services
Ambulance Fees 2,781,450 3,500,000 3,850,000 10.0% 350,000 Recreation Fees 1,604,571 2,007,840 2,315,500 15.3% 307,660
Other Revenue Sources 1,887,817 1,470,693 1,168,650 -20.5% (302,043)
Transfer Tax 1,786,174 1,697,000 1,570,000 -7.5% (127,000)
Transient Occupancy Tax 15,583,688 28,091,000 28,803,000 2.5% 712,000
Licenses and Permits
Other Licenses and Permits 1,043,924 1,095,700 963,000 -12.1% (132,700)
Fines and Forfeitures 423,380 216,170 210,750 -2.5% (5,420)
Interdepartmental Charges 5,146,044 5,290,471 5,236,449 -1.0% (54,022)
General Fund Taxes
Intergovernmental
Property Tax 76,822,535$ 79,710,000$ 81,508,000$ 2.3% 1,798,000$ Sales Tax 43,726,520 50,323,000 49,123,000 -2.4% (1,200,000)
Total Taxes 149,397,305 172,893,589 174,204,000 0.8% 1,310,411
Planning Fees 365,766 682,500 456,000 -33.2% (226,500)
Total General Fund 182,239,603$ 204,922,372$ 198,764,175$ -3.0% (6,158,197)$ * Interest is calculated on an amortized cost basis.
2021-22 2022-23 Change as % Difference 2020-21 Estimated Estimated of 2021-22 2021-22 to Revenue Source Actuals Revenue Revenue Estimated 2022-23
Building Department Fees 808,485 761,000 895,317 17.7% 134,317 Engineering Fees 477,352 895,500 608,900 -32.0% (286,600)
Total Licenses And Permits 2,398,980 2,495,700 1,863,000 -25.4% (632,700)
Total Charges For Services 7,503,389 9,448,039 9,630,017 1.9% 181,978
Other Charges or Fees 1,465,765 1,601,199 1,504,300 -6.1% (96,899)
Franchise Tax 5,773,811 6,245,589 6,958,000 11.4% 712,411
Total Intergovernmental 9,843,007 7,506,915 970,309 -87.1% (6,536,606)
SCHEDULE OF REVENUE ESTIMATES
Income from Investments and Property 5,639,681 5,600,795 5,481,000 -2.1% (119,795)
B 24
Total Agriculutural Mitigation Fee 6,599 223,100 15,000 -93.3% (208,100)
Affordable Housing
Agricultural Mitigation Fees 4,696 210,100 -100.0% (210,100)
Other Revenue 22,727 900,000 30,000 -96.7% (870,000)
Total Citizens' Option For Public Safety 293,819 186,034 201,000 8.0% 14,966
Cultural Arts Donations
Buena Vista Channel Maintenance
Federal Grant 1,440,502 1,322,368 527,154 -60.1% (795,214)
Total Buena Vista Channel Maintenance 142,017 115,000 116,000 0.9% 1,000
Donations 58,342 48,000 25,000 -47.9% (23,000)
SCHEDULE OF REVENUE ESTIMATES
Total Cultural Arts Donations 59,474 51,826 25,500 -50.8% (26,326)
Community Activity Grants
Total Habitat Mitigation Fee 16,611 65,100 -100.0% (65,100)
Interest Income 2,036 12,000 13,500 12.5% 1,500
Special Revenue Funds
Total Community Dev. Block Grant 1,606,714 1,492,368 527,154 -64.7% (965,214)
B 25
2021-22 2022-23 Change as % Difference 2020-21 Estimated Estimated of 2021-22 2021-22 to Revenue Source Actuals Revenue Revenue Estimated 2022-23
Assessment Fees 138,603 100,000 100,000 0.0%
Mitigation Fees 16,962 64,500 -100.0% (64,500) Interest Income (351) 600 -100.0% (600)
Agricultural Mitigation Fee
Affordable Housing Fees 273,120$ 467,000$ 120,000$ -74.3% (347,000)$ Property Tax 0.0%
Interest Income 3,414 15,000 16,000 6.7% 1,000
Total Community Activity Grants 2,036 12,000 13,500 12.5% 1,500
Interest Income 27 0.0% Other Revenue 166,185 170,000 -100.0% (170,000)
Interest Income 245,794 448,000 345,000 -23.0% (103,000)
Interest Income 1,903 13,000 15,000 15.4% 2,000
State Funding (AB3229) 292,465 185,000 200,000 8.1% 15,000 Interest Income 1,354 1,034 1,000 -3.3% (34)
Interest Income 1,132 3,826 500 -86.9% (3,326)
Citizens' Option for Public Safety
Community Development Block Grant
Total Affordable Housing 541,641 1,815,000 495,000 -72.7% (1,320,000)
Habitat Mitigation Fee
B 26
Federal Grant 123,843 196,696 -100.0% (196,696)
Library And Arts Endowment Fund
2021-22 2022-23 Change as % Difference 2020-21 Estimated Estimated of 2021-22 2021-22 to Revenue Source Actuals Revenue Revenue Estimated 2022-23 Special Revenue Funds - Continued
Parking In Lieu Parking In Lieu Fees 44,960 0.0%
Median Maintenance
Interest Income 490$ 2,800$ $ -100.0% (2,800)$
Assessment Fees 349,925 365,000 365,000 0.0% Other 700,267 950,000 950,000 0.0%
Public Safety Grants
Total Library And Arts Endowment Fund 490 2,800 -100.0% (2,800)
Assessment Fees 663,794 645,500 680,000 5.3% 34,500 Interest Income 10,257 42,180 50,000 18.5% 7,820
Interest Income 373 5,184 539 -89.6% (4,645)
Total Local Cable Infrastructure Fund 302,747 288,600 260,000 -9.9% (28,600)
Total Recreation Donations 16,817 28,234 31,539 11.7% 3,305
Asset Forfeitures 5,751 0.0% Interest Income (288) 918 -100.0% (918)
Total Lighting And Landscaping Dist. 2 674,051 687,680 730,000 6.2% 42,320
Gifts and Bequests 243,427 183,232 250,800 36.9% 67,568
Interest Income 2,477 12,000 15,000 25.0% 3,000
Cable Fees 302,404 280,000 260,000 -7.1% (20,000) Interest Income 343 8,600 -100.0% (8,600)
Recreation Donations
Total Library Gifts/Bequests 250,001 200,816 264,900 31.9% 64,084
Total Parking In Lieu 47,437 12,000 15,000 25.0% 3,000
Local Cable Infrastructure Fund
Police Asset Forfeiture
SCHEDULE OF REVENUE ESTIMATES
Total Police Grants 123,843 196,696 -100.0% (196,696)
Total Median Maintenance 1,050,192 1,315,000 1,315,000 0.0%
Donations 16,444 23,050 31,000 34.5% 7,950
Interest Income 3,900 17,584 14,100 -19.8% (3,484)
Library Gifts/Bequests
Total Police Asset Forfeiture 5,463 918 -100.0% (918)
Lighting And Landscaping District 2
Special Revenue Funds - Continued Rental Assistance
Tyler Court Apartments
Rental Income 604,339 640,000 646,672 1.0% 6,672
Street Lighting
Other Revenue 10,000 10,000 0.0%
Interest Income 4,956 30,000 30,000 0.0%
Senior Donations
Federal Grant 8,745,835$ 8,984,000$ 10,072,680$ 12.1% 1,088,680$ Other Revenue 383,582 698,700 1,330,500 90.4% 631,800
Total Rental Assistance 9,129,417 9,682,700 11,403,180 17.8% 1,720,480
SCHEDULE OF REVENUE ESTIMATES
B 27
Total Street Lighting 853,410 927,000 920,000 -0.8% (7,000)
Total Senior Donations 3,568 14,037 16,000 14.0% 1,963
Total Special Revenue Funds 16,204,254$ 18,867,909$ 17,917,410$ -5.0% (950,499)$
Other Revenue 2,127 1,000 1,965 96.5% 965 Interest Income 1 0.0%
Street Tree Maintenance
Assessment Fees 471,086 470,000 470,000 0.0% Other Revenue 354 440,000 450,000 2.3% 10,000
Total Street Tree Maintenance 471,440 910,000 920,000 1.1% 10,000
Other Revenue 162,059 157,000 150,000 -4.5% (7,000)
Donations 3,000 2,000 4,000 100.0% 2,000
Interest Income 568 2,037 2,000 -1.8% (37)
Assessment Fees 686,395 740,000 740,000 0.0%
2021-22 2022-23 Change as % Difference 2020-21 Estimated Estimated of 2021-22 2021-22 to Revenue Source Actuals Revenue Revenue Estimated 2022-23
Total Tyler Court Apartments 606,467 641,000 648,637 1.2% 7,637
Trash Surcharge 3,049,951 3,000,000 2,100,000 -30.0% (900,000)
Other Revenue 730,663 565,247 1,920,130 239.7% 1,354,883
Interest Income (91,990) (64,000) (64,000) 0.0%
Interest Income 10,852 30,000 19,000 -36.7% (11,000)
Golf Course Operations Charges for Services 8,105,675 8,830,000 9,466,000 7.2% 636,000
Other Revenue 55,544,802 97,000 89,000 -8.3% (8,000)
2021-22 2022-23 Change as % Difference
Interest Income (11,915) 95,000 95,000 0.0%
7,151,961 7,200,000 7,366,000 2.3% 166,000 Ready-to-Serve charge 1,209,044 1,300,000 1,339,000 3.0% 39,000
Wastewater Operations Service Charges 14,007,136 15,304,000 19,000,000 24.2% 3,696,000
Other Revenue 3,260,648 1,711,544 388,544 -77.3% (1,323,000)
Other Revenue 276,035 101,611 89,496 -11.9% (12,115)
Water Sales
Total Water Operations 49,140,505 47,723,538 46,990,138 -1.5% (733,400)
Total Enterprise Funds 141,012,129$ 84,829,096$ 89,570,364$ 5.6% 4,741,268$
New Account Charges 130,028 130,000 130,000 0.0%
Misc. Sewer 19,614 (19,000) -100.0% 19,000 Engineering Overhead 16,199 19,000 25,000 31.6% 6,000
Other Revenue 1,499,601 84,500 91,500 8.3% 7,000
Engineering Overhead 20,822 40,000 42,000 5.0% 2,000 Service Connection Fees 43,351 20,000 20,000 0.0%
Solid Waste Management Recycling Fees (AB939) 337,133 360,000 800,000 122.2% 440,000
Total Solid Waste Management 4,134,621 4,084,447 4,999,230 22.4% 914,783
SCHEDULE OF REVENUE ESTIMATES
Interest Income 16,881 140,200 160,100 14.2% 19,900
Total Golf Course Operations 63,661,329 8,957,000 9,574,000 6.9% 617,000
Recycled Water Operations
Penalty Fees 5,815 74,150 161,750 118.1% 87,600
Total Recycled Water Operations 8,545,050 8,537,611 8,730,496 2.3% 192,885
28,691,928$ 28,500,000$ 29,000,000$ 1.8% 500,000$ Ready-to-Serve charge 12,301,894 12,300,000 12,300,000 0.0%
2020-21 Estimated Estimated of 2021-22 2021-22 to Revenue Source Actuals Revenue Revenue Estimated 2022-23
Water Sales
Penalty Fees (11) 43,000 65,000 51.2% 22,000
B 28
Property Tax 4,469,981 4,418,344 4,418,344 0.0%
Penalty Fees (7) 19,000 19,000 0.0%
Total Wastewater Operations 15,530,624 15,526,500 19,276,500 24.2% 3,750,000
Enterprise Funds Water Operations
Back-Flow Program Fees 167,089 175,000 175,000 0.0%
Interest Income 48,949 354,500 354,500 0.0%
Total Trust Funds 3,782,355$ 1,067,000$ 510,000$ -52.2% (557,000)$
Total Workers' Compensation 4,131,801 4,891,730 5,314,620 8.6% 422,890
3,207,532 3,291,562 3,272,355 -0.6% (19,207)
Other Revenue 33,250 58,000 20,000 -65.5% (38,000)
Interdepartmental Charges
Total Operating Funds 371,170,684$ 340,184,182$ 339,824,280$ -0.1% (359,902)$
Internal Service Funds
Interest Income 1,928 46,000 47,000 2.2% 1,000
2021-22 2022-23 Change as % Difference
Vehicle Maintenance
Other Revenue 2,212,056 225,000 -100.0% (225,000)
Information Technology
Total Risk Management 2,369,817 3,392,080 3,993,370 17.7% 601,290
Other Revenue 1,522,556 225,000 200,000 -11.1% (25,000)
Total Information Technology 13,745,088 14,858,482 16,487,619 11.0% 1,629,137
Trust SucssessorFundsAgency
SCHEDULE OF REVENUE ESTIMATES
Property Tax Increment
2020-21 Estimated Estimated of 2021-22 2021-22 to Revenue Source Actuals Revenue Revenue Estimated 2022-23
Other Revenue 59,053 40,000 -100.0% (40,000)
Housing Fund
Risk Management
2,872,200 3,574,451 3,575,367 0.0% 916
Interest Income 49,260 200,000 194,000 -3.0% (6,000)
B 29
Interest Income 39,441 142,000 140,000 -1.4% (2,000)
Interdepartmental Charges
Total Vehicle Replacement 4,444,016 3,999,451 3,969,367 -0.8% (30,084)
1,880,304$ 4,524,730$ 5,174,620$ 14.4% 649,890$
Total Internal Service Funds 27,932,343$ 30,497,805$ 33,062,331$ 8.4% 2,564,526$
Interest Income 768,871 7,000 10,000 42.9% 3,000
2,308,836 3,306,080 3,946,370 19.4% 640,290
Interdepartmental Charges
Interest Income 839 6,500 5,000 -23.1% (1,500)
Interdepartmental Charges
Interdepartmental Charges
12,530,344 14,752,389 16,408,619 11.2% 1,656,230
Other Revenue 1,243,014 46,700 -100.0% (46,700)
3,013,484 1,060,000 500,000 -52.8% (560,000)
Total Vehicle Maintenance 3,241,621 3,356,062 3,297,355 -1.8% (58,707)
Interest Income (28,270) 59,393 79,000 33.0% 19,607
Vehicle Replacement
Total Successor Agency Housing Fund 3,782,355 1,067,000 510,000 -52.2% (557,000)
Workers' Compensation
City Attorney 1,910,060 2,036,466 2,033,136 2,037,136 2,033,508 -0.2%
Communication & Engagement 1,651,700 1,493,938 2,031,550 1,771,173 1,979,186 11.7%
2019-20 2020-21 Estimated 2021-22 2022-23 of 2021-22 Department Actuals Actuals Expenditures Budget Budget Budget
Library & Cultural Arts 13,030,148 12,344,689 14,030,250 13,780,555 14,088,425 2.2%
Transportation 7,583,250 7,553,800 9,230,700 8,405,466 9,707,559 15.5%
Public Works Administration 1,768,613 1,808,997 1,800,000 1,941,613 1,440,649 -25.8%
Other Miscellaneous Expenditures 3,860,320 1,055,650 55,000 100,000
Police 44,841,600 47,615,546 48,936,163 48,756,017 51,240,884 5.1%
City Manager 2,574,961 1,939,537 2,042,542 2,112,097 2,156,145 2.1%
2021-22
Community Development 10,328,444 10,715,350 9,893,000 10,502,061 10,384,700 -1.1%
Public Safety
City Treasurer 215,784 235,400 278,000 250,752 249,945 -0.3%
Total Miscellaneous Non-Departmental Expenditures 6,397,819 3,109,546 1,765,000 2,922,000 1,021,658 -65.0%
Change as %
Total Policy And Leadership Group 7,945,450 7,400,353 8,454,467 8,121,602 8,465,166 4.2%
COVID-related 910,211 245,579 150,000
Total Administrative Services 11,017,610 11,597,625 12,270,656 12,424,907 14,070,699 13.2%
SCHEDULE OF BUDGET EXPENDITURES
Construction Management & Inspection 2,944,509 2,728,545 2,760,000 2,990,665 3,262,768 9.1%
Miscellaneous Non-Departmental Expenditures
Administrative Services
Innovation & Economic Development 1,097,395 1,427,603 1,252,000 1,264,626 2,585,951 104.5%
B 30
Fleet & Facilities 5,537,243 5,341,736 5,830,000 6,555,934 6,768,736 3.2%
Community Contributions 7,983 2,595
Fire 25,620,353 30,712,871 34,651,000 33,521,412 37,756,943 12.6%
City Council 466,528$ 487,977$ 632,975$ 649,975$ 652,220$ 0.3%
Finance 5,617,702 5,810,863 5,950,000 5,632,387 5,472,176 -2.8%
Total Public Safety 70,461,953 78,328,417 83,587,163 82,277,429 88,997,827 8.2%
Total Public Works 18,592,467 18,463,531 20,464,997 21,175,903 22,339,501 5.5%
Community Services Administration 654,001 862,511 656,221 675,917 3.0%
Public Works
Dues & Subscriptions 71,519 72,714 75,000 80,000 80,000 0.0%
Legal Services 697,114 755,312 500,000 1,200,000 1,000,000 -16.7%
General Fund
Environmental Management 758,852 1,030,453 844,297 1,282,225 1,159,789 -9.5%
Professional Services 39,195 34,194 35,000 42,000 41,658 -0.8%
Housing & Homeless Services 1,488,217 5,901,431 3,134,115 -47%
Human Resources 4,302,513 4,359,159 4,542,911 4,959,011 5,264,775 6.2%
Total Community Services 40,942,774 40,500,672 46,903,073 49,999,648 49,450,171 -1.1%
Personnel Related 152,582 184,337 200,000 850,000 1,050,000 23.5%
Policy And Leadership Group
Vacancy savings (2,000,000)
Property Tax & Other Administration 658,895 759,165 750,000 750,000 750,000 0.0%
Administration 525,745 568,883 747,797 31%
City Clerk 1,126,417 1,207,035 1,436,264 1,300,469 1,394,162 7.2%
Community Services
Parks & Recreation 17,584,182 16,786,632 20,629,095 19,159,380 21,167,014 10.5%
Public Safety Grants 126,353 117,267 196,696
Total General Fund 168,924,239$ 216,412,690$ 200,223,160$ 184,569,489$ 198,445,022$ 7.5%
Transfer To LLD#1 (Medians & Trees) 950,000 700,000 1,390,000 1,190,000 1,400,000 -14.4%
Transfer To Storm Water Program 303,052 281,040 322,000 322,000 332,000 0.0%
Local Cable Infrastructure Fund 207,119 336,001 467,962 345,000 395,006 14.5%
Median Maintenance 1,077,147 1,036,374 1,160,000 1,369,415 1,329,900 -2.9%
Transfer to General Capital Construction Fund 5,111,500$ 4,500,000$ 13,133,056$ 5,353,000$ 3,956,000$ -59.2%
Subtotal General Fund 168,924,239 216,412,690 200,223,160 184,069,489 197,945,022 7.5%
B 31
SCHEDULE OF BUDGET EXPENDITURES
Transfer from Infrastructure Replacement Fund (5,070,000) (5,070,000) 0.0%
Transfer to Technology Investment Capital Fund 10,656,000 3,956,000
Community Activity Grants 15,000 30,000 30,000 0.0%
Library Gifts/Bequests 217,268 144,279 216,363 384,270 394,467 2.7%
Parking In Lieu 47,547 48,244 49,675 50,000 53,000 6.0%
Police Asset Forfeiture 122,365 54,225 20,000 170,000 125,000 -26.5%
General Fund - Continued Transfers
Total Miscellaneous Non-Departmental 19,963,985 60,122,092 28,542,804 10,070,000 14,621,658 45.2%
Recreation Donations 28,289 26,165 45,782 82,591 81,009 -1.9%
Street Lighting 633,162 777,332 849,000 971,246 1,065,393 9.7%
Tyler Court Apartments 497,143 474,209 485,000 640,987 540,716 -15.6%
Affordable Housing 868,053$ 4,674,625$ 200,000$ 811,197$ 393,385$ -51.5% Agricultural Mitigation Fee
Contingencies 500,000 500,000 0.0%
Lighting And Landscaping District 2 353,503 287,307 398,124 376,001 338,070 -10.1%
Community Development Block Grant 324,153 936,783 1,548,299 638,299 636,728 -0.2%
Other Miscellaneous Transfers 2,090,114 47,031,506 993,748 -100.0%
Total Special Revenue Funds 15,336,873$ 19,080,316$ 16,678,998$ 15,389,705$ 17,321,198$ 12.6%
Citizens' Option For Public Safety 247,072 263,590 266,106 266,106 265,705 -0.2%
Transfer to Infrastructure Replacement Fund 5,111,500 4,500,000 5,353,000 5,353,000 3,956,000 0.0%
Library And Arts Endowment Fund 6,000 6,000 6,000 0.0%
Rental Assistance 7,832,253 9,024,886 9,597,000 7,898,443 10,409,089 31.8%
Change as % 2019-20 2020-21 Estimated 2021-22 2022-23 of 2021-22 Department Actuals Actuals Expenditures Budget Budget Budget
Cultural Arts Donations 29,510 25,447 82,491 131,750 131,750 0.0%
Special Revenue Funds
Senior Donations 20,592 5,367 19,000 79,600 50,500 -36.6%
Street Tree Maintenance 575,205 750,272 950,000 943,555 880,235 -6.7%
Total Transfers 13,566,166 57,012,546 26,777,804 7,148,000 13,600,000 90.3%
Flower Fields Grant Program 943,272 Habitat Mitigation Fee 1,115,129 16,961
2021-22
Buena Vista Channel Maintenance 71,738 80,982 106,500 195,245 195,245 0.0%
Wastewater Operations 13,504,660 13,053,207 16,057,474 16,057,473 16,999,568 5.9%
Total Enterprise Funds 78,851,451$ 80,177,810$ 90,106,547$ 86,396,957$ 92,918,323$ 7.5%
Self-Insured Benefits 66,103 1,834,163
Enterprise Funds
Workers' Compensation 3,714,494$ 3,408,864$ 4,246,463$ 3,933,699$ 4,507,014$ 14.6% Risk Management 2,515,711 2,675,135 3,740,520 3,207,702 3,780,570 17.9%
Vehicle Maintenance 2,951,752 3,239,389 3,510,000 3,516,373 3,506,140 -0.3%
Solid Waste Management 4,508,618 5,003,349 4,017,239 5,183,474 5,801,402 11.9% Golf Course Operations 7,715,414 6,832,769 7,306,826 7,231,000 9,195,000 27.2%
Total Internal Service Funds 21,566,821$ 27,417,369$ 29,929,483$ 29,573,585$ 32,565,436$ 10.1%
SCHEDULE OF BUDGET EXPENDITURES
Water Operations 45,018,846$ 47,685,382$ 51,321,219$ 47,821,220$ 49,715,832$ 4.0% Recycled Water Operations 8,103,913 7,603,103 11,403,789 10,103,790 11,206,521 10.9%
2021-22
Trust Funds
Total Operating Funds 285,077,981$ 343,328,087$ 337,976,688$ 316,997,231$ 342,318,824$ 8.0%
Successor Agency Housing Fund 398,597$ 239,902$ 1,038,500$ 1,067,495$ 1,068,845$ 0.1%
Vehicle Replacement 2,165,563 2,342,065 4,540,000 4,546,033 5,293,745 16.4% Information Technology 10,153,198 13,917,753 13,892,500 14,369,778 15,477,967 7.7%
Total Trust Funds 398,597$ 239,902$ 1,038,500$ 1,067,495$ 1,068,845$ 0.1%
Change as % 2019-20 2020-21 Estimated 2021-22 2022-23 of 2021-22 Department Actuals Actuals Expenditures Budget Budget Budget
Internal Service Funds
B 32
442 339 police@carlsbadca.gov2100
PUBLIC SAFETY
We are proud to serve the Carlsbad community, working in partnership to deliver on the city mission at the highest possible level every day.
The City of Carlsbad’s public safety services create and maintain a safe community for all who live, work and play in our city. This important work is carried out by the dedicated men and women of the Police and Fire departments. Highly specialized divisions cover all aspects of modern law enforcement, fire prevention, response and recovery, emergency medical services, and emergency preparedness and operations.

C 1
Michael Calderwood Fire Chief
442 339 2141 FireMail@carlsbadca.gov
Mickey Williams Chief of Police


2019-20Actual 2020-21Actual 2021-22Budget 2022-23Budget
Operating Expenses
Professional & Contract Services 1,580,819 1,534,169 1,794,255 1,863,645 Supplies & Materials 961,736 720,270 1,151,247 1,154,382 Repair & Maintenance 64,630 95,569 75,360 91,623
FIRE
|
Full Time Positions 97.75 97.75 111.00 123.00 Hourly/FTE Positions 5.50 5.50 10.00 11.50
Other Personnel Expenses 1,123,689 846,659 1,634,029 1,789,390 Personnel Services Subtotal 20,008,509 24,440,328 25,544,578 28,535,003
Interdepartmental Charges 2,197,374 3,131,180 3,837,054 4,361,857
• Community Risk Reduction & Resiliency
PUBLIC SAFETY
C 3
• Emergency Operations
Personnel Services
Salaries & Wages 13,153,994$ 15,933,650$ 16,999,835$ 18,570,048$ Retirement Benefits 4,300,847 5,984,047 4,691,363 5,879,146 Health Insurance 1,429,979 1,675,972 2,219,351 2,296,419
Other Operating Expenses 282,528 184,161 240,918 281,933
Capital Outlay 524,757 607,194 878,000 1,468,500
• Fire Administration
Operating Expenses Subtotal 5,611,844 6,272,543 7,976,834 9,221,940
TOTAL EXPENDITURES 25,620,353$ 30,712,871$ 33,521,412$ 37,756,943$
FIRE DEPARTMENT: SUMMARY
Personnel Services Salaries & Wages $695,613 $639,039 $651,125 $594,716 Retirement Benefits 181,407 259,731 160,039 119,010 Health Insurance 80,967 81,704 90,006 70,744 Other Personnel Expenses 40,160 44,937 81,234 76,379 Personnel Services Subtotal 998,147 1,025,411 982,404 860,849
Other Operating Expenses 11,769 12,704 1,900 1,400
The Fire Department enhances the quality of life for all who live, work and play in the city through excellence in emergency and support services. Fire Administration provides leadership, strategic planning and organizational support across all department programs.
• Monitor budgets, contracts, procurement and accounting processes
• Oversee mutual aid reimbursement
TOTAL EXPENDITURES $3,948,806 $4,930,887 $5,485,118 $5,933,965
• Manage webpage and social media content
Operating Expenses
ABOUT
|
Account: 0012253001225100122100012200
PUBLIC SAFETY
• Research and support grant programs and opportunities
• Maintain records management
2019-20Actual 2020-21Actual 2021-22Budget 2022-23Budget
Professional & Contract Services 1,007,505.00 1,112,072 1,284,590 1,372,150 Supplies & Materials 35,817 48,304 83,161 83,486 Repair & Maintenance 700 23 400 475 Interdepartmental Charges 1,787,324 2,653,052 3,132,663 3,615,605
Capital Outlay 107,544 79,321.00
Full Time Positions 5.00 5.00 5.00 4.00 Hourly/FTE Positions 0.00 1.00 0.50 0.50
Fund: General
SERVICES
C 4
FIRE DEPARTMENT: ADMINISTRATION
• Administer directives, policies and procedures
Operating Expenses Subtotal 2,950,659 3,905,476 4,502,714 5,073,116
• Compile data and analyze business intel
• Completed Standards of Cover Work Plan Objective 1 to support City Council goal
• Maintained COVID 19 Task Force to address city personnel needs and concerns
• Relocated administration personnel to temporary trailers during office renovations
• Adopt best practice based response time policy by type of risk
• Revise Memorandum of Understanding for Emergency Medical Services with the County of San Diego
• Provided city issued mobile phones to all full time fire personnel
• Launched online request and payment system for fire incident and medical record reports
• Acquire property for permanent Fire Station 7
GOALS
• Implement Standards of Cover Work Plan Objective 2 to support City Council goal
RECENT ACCOMPLISHMENTS
C 5
• Developed new mission, values and motto statements
• Oversee Ambulance Service Fee Study
• Initiate Fire Station Master Plan
• Evaluate First Responder Feasibility Study
ABOUT
• Deliver emergency medical services
Other Personnel Expenses 1,005,506 712,311 1,364,798 1,536,207
Professional & Contract Services 408,093 200,794 229,985 227,315 Supplies & Materials 847,181 637,130 996,159 999,469 Repair & Maintenance 60,777 92,615 74,960 91,148
• Perform high risk technical search and rescues
• Organize response and support operations for natural or man made disasters
TOTAL EXPENDITURES $19,493,890 $23,120,065 $25,099,789 $28,869,069
• Coordinate Fire Explorer Program for high school and college students
• Deploy mutual aid assistance across the state
C 6
• Maintain state mandated professional licenses, certificates and continuing education credits
Other Operating Expenses 231,617 164,002 227,518 259,033
FIRE DEPARTMENT: EMERGENCY OPERATIONS
Account: 0012252001225000122001222029
Operating Expenses Subtotal 1,884,235 1,806,892 2,646,412 3,384,420
Personnel Services Salaries & Wages $11,522,735 $13,968,465 $15,013,507 $16,604,025 Retirement Benefits 3,841,669 5,207,222 4,139,927 5,327,255
2019-20Actual 2020-21Actual 2021-22Budget 2022-23Budget
Operating Expenses
• Extinguish structure and wildland fires
Emergency Operations is an all hazard first responder agency safeguarding lives, property and the environment.
Fund: General
Capital Outlay 260,876 527,873 878,000 1,468,500
Full Time Positions 82.00 82.00 94.00 107.00 Hourly/FTE Positions 4.00 3.50 8.50 10.50
• Investigate and mitigate hazardous materials
• Develop and supervise health and wellness programs
SERVICES
• Offer SWAT Medic Program to support law enforcement agencies
|
PUBLIC SAFETY
• Provide lifeguard services at North Beach and Agua Hedionda Lagoon
Personnel Services Subtotal 17,609,655 21,313,173 22,453,377 25,484,649
Interdepartmental Charges 75,691 184,478 239,790 338,955
Health Insurance 1,239,745 1,425,175 1,935,145 2,017,162
• Recruited and onboarded first community health nurse
FYActual2021 FY Estimated2022 FY Projected2023
• Disposed of and purchased new firefighting foam in compliance with health and environmental laws
• Converted one ambulance to new staffing model consisting of one paramedic firefighter and one EMT instead of two paramedic firefighters consistent with Standard of Cover work plan
• Recruit additional EMTs to convert all ambulances to new staffing model
• Ordered second utility terrain vehicle to support open space emergency responses
SIGNIFICANT CHANGES IN THIS YEAR’S BUDGET
• Modified medical priority dispatching to improve resource availability and response times
• Replaced all fire station mattresses
C 7
• Hired additional paramedic firefighters and EMTs to deploy two new ambulances
• Submit congressional funding proposal for North Zone Technical Rescue Team
01:57 01:58 01:59
• Sponsored Assembly Bill 1672 allowing USLA certified open water lifeguards to work at swimming pools
EMS customer survey overall satisfaction rating 95.5% 94.5% 95%
• Retained aerial ladder truck as reserve apparatus
• Added 12 full time EMT positions and three part time EMT positions to meet City Council Standards of Cover goal in accordance with approved work plan
• Procure, outfit and deploy new engine
• Implement automated narcotic tracking system to comply with recordkeeping requirements
• Replace Very High Frequency radios required for large incidents
• Accepted donation for second rescue watercraft to support lifeguard emergency responses
• Co sponsored Assembly Bill 1682 allowing lifeguard water vessels to travel over five mph near swimmers and beaches while performing rescues
• Operationalize temporary Fire Station 7
• Respond to at least 90% of requests for assistance within 2 minutes
• Procured, outfitted and deployed two new ambulances
RECENT ACCOMPLISHMENTS
• Established Emergency Medical Technician Program, creating an entry level position for emergency operations
• Execute quarterly training plan for North Zone Technical Rescue Team
Time from request to first unit being en route (90th percentile)
• Maintain EMS satisfaction rating above 95% Performance Measure
• Completed office to bedroom conversion at Fire Station 6
GOALS
• Finalize plans and specifications for new urban search and rescue apparatus
• Created and managed in house COVID 19 testing program for all city employees
• Attained United Lifesaving Association Lifeguard Program Accreditation
• Installed carport to create additional apparatus storage at Fire Station 6
• Operationalized temporary Fire Station 2 during rebuild of new station
• Retrofit fire station plymovent systems with magnetic couplers
• Coordinated onsite mobile clinic offering specialized medical tests and exams for firefighters
• Remodeled storage room for personal protective equipment at Fire Station 5
• Review code compliance on construction plan submittals
C 8
• Install and test smoke alarms in Carlsbad homes
Operating Expenses
Other Operating Expenses 39,142 7,455 11,500 21,500
• Respond to hazard inquires and complaints
TOTAL EXPENDITURES $2,177,657 $2,661,919 $2,936,505 $2,953,909
SERVICES
Other Personnel Expenses 78,023 89,411 187,997 176,804
ABOUT Community Risk Reduction & Resiliency mitigates all types of hazardous conditions and ensures incident response readiness.
Professional & Contract Services 165,221 221,303 279,680 264,180 Supplies & Materials 78,738 34,836 71,927 71,427 Repair & Maintenance 3,153 2,931 0
• Coordinate outreach and education programs promoting fire safety tips and prevention
Interdepartmental Charges 334,359 293,650 464,601 407,297
• Disseminate public emergency notifications and conduct large scale emergency evacuations
Personnel Services
• Complete construction inspections for new buildings and remodeling projects
Capital Outlay 156,337 0 Operating Expenses Subtotal 776,950 560,175 827,708 764,404
• Create and manage emergency planning and training for city staff
FIRE DEPARTMENT: COMMUNITY RISK REDUCTION & RESILIENCY
• Investigate cause and origin for suspicious or large loss fires
• Conduct code compliance inspections for schools, care facilities, hotels, motels and apartment complexes
• Provide mass care and sheltering training and capability
PUBLIC SAFETY
Account: 0012240 0012243 Fund: General
• Oversee Hazard Reduction Program with identification and abatement of brush fire hazards
Salaries & Wages $935,646 $1,326,146 $1,335,203 $1,371,307
Personnel Services Subtotal 1,400,707 2,101,744 2,108,797 2,189,505
2019-20Actual 2020-21Actual 2021-22Budget 2022-23Budget
|
• Manage Emergency Operations Center resources and operations to maintain hazard environment and threat situational awareness
Retirement Benefits 277,771 517,094 391,397 432,881 Health Insurance 109,267 169,093 194,200 208,513
Full Time Positions 10.75 10.75 12.00 12.00
Hourly/FTE Positions 1.50 1.00 1.00 0.50
• Adopt 2022 California Fire Code with local amendments
• Updated Emergency Operations and Continuity of Operations plans
• Participate in countywide Multi Jurisdiction Hazard Mitigation Plan update
C 9
• Manage emergency planning, training and engagement activities with businesses, community groups and other agencies
• Extend smoke alarm installation program to all Carlsbad residents
• Complete audit of Knox Box Program a program that provides first responders with safe and immediate to a residential property in the event of an alarm or an emergency and update city key issuance policy
• Develop Wildland Fire Homeowners Association Education Program
• Reclassed wildland urban interface inspector as full time position to support expanded year round hazard reduction program
• Coordinated marine oil spill incident response for beach inspections and cleanup support
• Obtained certification to issue Wireless Emergency Alert messages in accordance with Senate Bill 833
• Co chair Ready Carlsbad Business Alliance Committee of Carlsbad Chamber of Commerce
• Expand emergency shelter staffing to sustain an additional mass care shelter
• Work with property owners to reduce the number potential fire hazards on private property and achieve increased compliance with applicable safety requirements
• Format fuel modification plans plans requiring landscaped areas adjacent to new buildings be dedicated for permanent vegetation management activities to improve community safety and reduce property loss during wildfire emergencies for GIS programs used in field operations
• Conduct community risk assessments for emergency planning of natural, technological and man made hazards and threats
• Implemented EOC virtual capability for off site incident response operations
• Completed state mandated annual fire inspections in accordance with Senate Bill 1205
• Provided smoke alarm installations within all city mobile home parks
Noncompliant parcels requiring weed abatement by city 3 3 3
• Initiate structural and technology upgrades for EOC
• Formed internal Arson Investigation Program
RECENT ACCOMPLISHMENTS
• Lead Carlsbad Emergency Management Administrative Team
• Assisted in reopening city facilities and return of volunteers following COVID 19 restrictions
• Represent Carlsbad in Unified San Diego County Emergency Services Organization
Performance Measure
• Maintain 100% compliance with mandated inspections under Senate Bill 1205
FYActual2021 FY Estimated2022 FY Projected2023
Compliance with Senate Bill 1205 mandated inspections 100% 100% 100% Parcels notified of potential fire hazards 150 142 150
• Created hazard reduction webpage on city website with fire hazard severity zone map in accordance with Assembly Bill 38
• Implemented new cost recovery fees and billing process for state mandated fire inspections
• Coordinate with Information Technology to develop cybersecurity training and exercises
GOALS
• Maintained year round COVID 19 and wildfire situational awareness and support in EOC
• Coordinate Carlsbad Community Emergency Response Team volunteer program
Other Operating Expenses 523,438 319,389 447,893 614,600
Professional & Contract Services 1,882,137 2,209,244 1,824,038 1,816,720 Supplies & Materials 773,126 454,203 479,273 469,405 Repair & Maintenance 223,380 185,356 291,920 260,425
POLICE DEPARTMENT: SUMMARY
TOTAL FUNDING 45,337,390$ 48,050,628$ 49,192,123$ 51,631,589$
Health Insurance 2,403,416 2,533,373 2,948,776 2,942,943
POLICE
|
TOTAL EXPENDITURES 45,337,390$ 47,964,280$ 49,192,123$ 51,631,589$
Operating Expenses
Interdepartmental Charges 6,648,956 6,548,607 7,730,391 7,723,463
2019-20Actual 2020-21Actual 2021-22Budget 2022-23Budget
Capital Outlay 894,837 601,499 3,150 3,200 Operating Expenses Subtotal 10,945,874 10,318,298 10,776,665 10,887,813
Full Time Positions 184.00 184.00 186.00 187.00 Hourly/FTE Positions 2.00 2.00 2.00 3.18
Personnel Services Salaries & Wages 22,752,120$ 23,442,173$ 24,974,039$ 25,853,833$ Retirement Benefits 7,281,652 10,176,003 7,408,450 8,353,791
General Fund 44,841,600$ 47,615,546$ 48,756,017$ 51,240,884$ Special Revenue Fund 495,790 435,082 436,106 390,705
• Administration • Field Operations • Support Operations • Professional Services • Police Grants & Asset Forfeiture
Other Personnel Expenses 1,954,328 1,494,433 3,084,193 3,593,209 Personnel Services Subtotal 34,391,516 37,645,982 38,415,458 40,743,776
PUBLIC SAFETY
C 10
|
Fund: General ABOUT
RECENT ACCOMPLISHMENTS
Interdepartmental Charges 3,980,129 3,801,221 3,963,301 4,273,139
Full Time Positions 6.00 5.00 6.00 7.00 Hourly/FTE Positions 0.00 0.00 0.00 0.00
2019-20Actual 2020-21Actual 2021-22Budget 2022-23Budget
PUBLIC SAFETY
• Conducted six Police Citizens Academy sessions and one city Citizens Academy
• Respond to residents’ concerns, City Council inquiries and public records requests
Salaries & Wages 821,721$ 787,934$ 784,994$ 882,956$
SERVICES
• Developed a teambuilding workshop for supervisors
• Develop and manage programs that reduce crime, encourage resident engagement and improve community safety
Operating Expenses
Retirement Benefits 220,721 364,243 248,162 229,062
Other Operating Expenses 296,796 254,782 269,050 360,550 Capital Outlay 387,738 24,651 3,200 Operating Expenses Subtotal 5,717,850 5,084,445 5,290,432 5,633,139
Other Personnel Expenses 60,964 44,743 100,331 117,598 Personnel Services Subtotal 1,171,047 1,272,258 1,216,814 1,330,000
POLICE DEPARTMENT: ADMINISTRATION
C 11
• Implemented a weekly command staff video to effectively relay relevant information within the department
TOTAL EXPENDITURES 6,888,897$ 6,356,703$ 6,507,246$ 6,963,139$
This division includes personnel who develop and administer functions and programs that support the city’s and the Police Department’s statement of values in a manner responsive to the city and its residents. This division also establishes policies and long range plans to meet department goals and city needs.
Health Insurance 67,641 75,338 83,327 100,384
Professional & Contract Services 989,252 975,152 1,005,741 949,000 Supplies & Materials 53,123 20,810 42,800 38,250 Repair & Maintenance 10,812 7,829 9,540 9,000
• Began remodel of the Police & Fire Headquarters
• Provide support to divisions to assist with meeting goals
Account: 00121220012110
• Assist staff with individual and team development
Personnel Services
SIGNIFICANT CHANGES IN THIS YEAR’S BUDGET
GOALS
• Use more innovative technology to provide the most efficient and effective service
• Added one Management Analyst position to support the administration division in budget preparations, contract and grant administration, purchasing, records requests and other tasks
C 12
• Respond to growing number of calls for service while maintaining current level of service
• Reach more community members through the department’s social media platforms
2019-20Actual 2020-21Actual 2021-22Budget 2022-23Budget
Interdepartmental Charges 2,020,193 2,049,500 2,994,818 2,725,205
TOTAL EXPENDITURES 22,502,040$ 24,004,780$ 25,425,065$ 25,217,285$
|
ABOUT
• Respond to calls for emergency and non emergency services
Professional & Contract Services 383,518 399,966 452,713 507,620 Supplies & Materials 285,787 200,037 145,870 167,230 Repair & Maintenance 21,700 17,224 21,500 21,400
Operating Expenses
Account: 0012115 2121 0012123 2125 Fund: General
Full Time Positions 97.00 99.50 102.00 96.00 Hourly/FTE Positions 0.00 0.00 0.00 0.00
• Utilize new and existing resources to address complaints and quality of life issues
Salaries & Wages 12,465,034$ 12,759,559$ 14,026,507$ 13,676,425$ Retirement Benefits 4,363,257 5,894,379 4,367,113 4,643,888 Health Insurance 1,282,302 1,348,171 1,650,258 1,492,109
Other Personnel Expenses 1,067,474 807,276 1,661,386 1,847,458 Personnel Services Subtotal 19,178,067 20,809,385 21,705,264 21,659,880
C 13
• Enforce laws and ordinances, preserve the peace, and provide for the protection of life and property through proactive programs of enforcement and prevention
Other Operating Expenses 120,622 24,550 101,750 135,950 Capital Outlay 492,153 504,118 3,150 Operating Expenses Subtotal 3,323,973 3,195,395 3,719,801 3,557,405
The Field Operations Division includes patrol, traffic, canines, lagoon patrol and police rangers. The Police Department compares its average response time to different priority level calls to national averages. The national average response time for Priority 1 calls is less than six minutes. The average response time for Priority 1 calls in the city is 5.2 minutes.
SERVICES
PUBLIC SAFETY
POLICE DEPARTMENT: FIELD OPERATIONS
• Take reports at incidents including crimes, arrests, collisions and conduct field interviews
The FBI Index is used to measure crime in the city. The FBI Index includes homicide, rape, robbery, aggravated assault, burglary, larceny/theft and motor vehicle theft. In 2021, the city’s violent crime rate was 2.18 per 1,000 population and the property crime rate was 17.39 per 1,000 population. The county average is 3.74 for violent crime and 16.14 for property crime
• Provide emergency services, preventative patrol, traffic enforcement and special enforcement in the community
Personnel Services
Police activities/Calls for service 90,760 99,562 112,323 110,448 107,156
FYActual2021
Suspects arrested with License Plate Recognition* 91 115 Vehicles recovered with License Plate Recognition* 66 117
FY Estimated2022 FY Projected2023
Total phone calls 149,715 156,488 157,587 162,055 162,541
RECENT ACCOMPLISHMENTS
• Received an approval rating of 4.45 out of 5, based on 1,257 crime victims surveyed, when asked if they felt their crime report was handled effectively
• Achieved average response times as follows, including maintaining a response time under the national average of six minutes for Priority 1 calls:
Number of cases 8,643 8,705 8,774 8,222 8,704 9 1 1 calls 29,144 32,509 33,061 31,642 36,154
*Automated license plate reader technology, also known as License Plate Recognition, is used by the Police Department to convert data associated with vehicle license plates for official law enforcement purposes, including identifying stolen or wanted vehicles, stolen license plates and missing persons. License Plate Recognition may also be used to gather information related to active warrants, homeland security, electronic surveillance, suspect interdiction and stolen property recovery. The statistics above show the number of suspects apprehended and vehicles recovered using license plate readers. Figures cannot be projected or estimated for upcoming fiscal years.
• Implement the new computer aided dispatch system, including integration with current system, for effective interoperability
Police Activity CY 2017 CY 2018 CY 2019 CY 2020 CY 2021
• Adopted new de escalation policy
• Instituted a program to comply with Assembly Bill 481 regarding use, acquisition and funding of military equipment
o Priority 2: 16.8 minutes
• Implemented a daily activities log to enhance communication between all divisions within the police department
• Executed a Memorandum of Understanding with the Mobile Crisis Response Team for as needed cooperation on mental health calls
o Priority 3: 22.1 minutes
GOALS
• Partner with outside agencies to increase security and awareness and address traffic complaints for the city’s special events
C 14
o Priority 1: 5.2 minutes
• Continue to work on department’s technology foundation to be more effective and efficient, acquire more timely and accurate data, and support a data driven approach to policing
Performance Measure
Account: 0012126 2138 0012142 2145 Fund: General
SERVICES
• Assist in the coordination of diversion, prevention and education activities
PUBLIC SAFETY
• Investigate and follow up on crime and incident reports as they relate to the family
• Provide follow up investigations leading to the identification and apprehension of persons responsible for the commission of crimes
Professional & Contract Services 333,919 701,550 219,584 158,100 Supplies & Materials 188,682 131,782 101,685 106,225 Repair & Maintenance 152,667 123,598 210,155 184,750
Health Insurance 1,006,231 1,036,172 1,134,731 1,234,254
• Provide public safety communication including answering 9 1 1 and other calls and dispatching appropriate emergency personnel
POLICE DEPARTMENT: SUPPORT OPERATIONS
• Collect and process evidence collected in the field by police employees
Salaries & Wages 8,770,923$ 9,094,750$ 9,421,936$ 10,337,845$ Retirement Benefits 2,484,212 3,649,345 2,596,604 3,203,873
|
C 15
2019-20Actual 2020-21Actual 2021-22Budget 2022-23Budget
The Support Operations Division includes the Crime Suppression Team, Homeless Outreach Team, SWAT Team, Crisis Negotiation Team, Investigations Division, Family Services, Communications and Records.
Interdepartmental Charges 627,478 661,781 739,416 688,898
Other Operating Expenses 89,170 24,218 41,050 91,100 Capital Outlay 9,538 44,857 Operating Expenses Subtotal 1,401,454 1,687,786 1,311,890 1,229,073
Other Personnel Expenses 760,993 590,381 1,225,238 1,495,059 Personnel Services Subtotal 13,022,359 14,370,648 14,378,509 16,271,031
Full Time Positions 77.00 73.50 73.00 78.00 Hourly/FTE Positions 1.00 1.00 1.00 2.18
• Provide support to divisions to assist with meeting goals
ABOUT
Personnel Services
Operating Expenses
TOTAL EXPENDITURES 14,423,813$ 16,058,434$ 15,690,399$ 17,500,104$
• Assist in the preservation of all life and ensure a safe resolution to critical incidents
CY 2017 CY 2018 CY 2019 CY 2020 CY 2021
• Executed a Memorandum of Understanding with the District Attorney’s Office and North County allied agencies for the North County Family Justice Center program, which will be an integrated service for victims of domestic violence, abuse, sexual assault and related crimes to seek therapy, forensic evidentiary exams, case management and other support
• Implemented the Hotel Voucher Pilot Program and provide vouchers through the department’s Homeless Outreach Team
• Responded to 6,010 transient related calls for service last year
• Reduce the homeless unsheltered population in line with City Council goals
C 16
GOALS
• Created a storefront for the Homeless Outreach Team at the Visitor’s Center in the downtown area in response to increasing transient issues
Violent crime clearance rate 48% 46% 55% 59% 46% Property crime clearance rate 10% 11% 9% 10% 11%
FYActual2021 FY Estimated2022 FY Projected2023
RECENT ACCOMPLISHMENTS
• Solved each of the city’s two homicides and one attempted homicide
• Received an approval rating of 4.17 out of 5, based on 1,217 crime victims surveyed, when asked about satisfaction of their case being reviewed
• Initiate grant funded program for several detectives to work directly out of the North County Family Justice Center to improve cross coordination between law enforcement agencies, prosecutors, victim advocacy and criminal justice
Performance Measure
• Implemented the Homeless Engagement Leading to Progress, or HELP, mobile application
Number of individuals contacted through outreach activities New 3,060 3,060 Percent of contacts that accept services New 38% 38% Number of individuals that are provided housing New 161 161
POLICE DEPARTMENT: PROFESSIONAL SERVICES
• Installed new software program Veritone to track data in accordance with the Racial and Identity Profiling Act
PUBLIC SAFETY |
TOTAL EXPENDITURES 1,026,850$ 1,195,629$ 1,133,307$ 1,560,356$
The Professional Services Division supports the Police Department in the form of training, internal affairs, professional standards and personnel recruitment and hiring.
2019-20Actual 2020-21Actual 2021-22Budget 2022-23Budget
Personnel Services
• Investigate resident complaints
• Provide information to the media to inform the public regarding crime activity in the city
Account: 0012140 Fund: General ABOUT
• Help improve the quality of life for city residents through crime prevention awareness and education, and help reduce the fear of crime through the dissemination of information
RECENT ACCOMPLISHMENTS
C 17
• Recruit new employees, organize testing programs and conduct mandated pre employment investigations and Peace Officer Standards and Training
Salaries & Wages 503,843$ 630,925$ 605,257$ 826,783$ Retirement Benefits 176,752 217,449 159,444 240,880 Health Insurance 40,062 66,100 67,863 99,534
• Installed new software program DogPro to track canine training and activities
Other Personnel Expenses 53,656 44,399 80,661 114,163 Personnel Services Subtotal 774,313 958,873 913,225 1,281,360
Operating Expenses
• Establish, maintain and enforce department professional standards and coordinate all department training
Other Operating Expenses 16,850 12,389 26,043 17,000 Capital Outlay Operating Expenses Subtotal 252,537 236,756 220,082 278,996
SERVICES
Professional & Contract Services 115,827 114,576 86,000 142,000 Supplies & Materials 95,531 76,962 73,918 87,700 Repair & Maintenance 6,701 480 5,725 275 Interdepartmental Charges 17,628 32,349 28,396 32,021
Full Time Positions 3.00 5.00 4.00 5.00 Hourly/FTE Positions 1.00 1.00 1.00 1.00
• Eliminate personnel vacancies in the police department
C 18
• Instituted a new comprehensive Internal Affairs policy
GOALS
• Received an approval rating of 4.61 out of 5, based on 1,312 crime victims surveyed, when asked if their call was handled in a respectful, attentive, and expeditious manner
POLICE DEPARTMENT: POLICE GRANTS & ASSET FORFEITURE
Professional & Contract Services 59,621 18,000 60,000 60,000 Supplies & Materials 150,003 110,960 115,000 70,000 Repair & Maintenance 31,500 36,225 45,000 45,000
Interdepartmental Charges 3,528 3,756 4,460 4,200 Other Operating Expenses 3,450 10,000 10,000 Capital Outlay 5,408 27,873 Operating Expenses Subtotal 250,060 200,264 234,460 189,200
• Used the Citizens’ Option for Public Safety grant to fund one full time sworn officer position
Account: 121 122 124123 Fund: Special Revenue Asset Forfeiture Special Revenue COPS Fund Special Revenue Public Safety Grants
• Used the Justice Assistance Grant to purchase electric bicycles for Homeless Outreach Team
Other Personnel Expenses 11,241 7,634 16,577 18,931 Personnel Services Subtotal 245,730 234,818 201,646 201,505
2019-20Actual 2020-21Actual 2021-22Budget 2022-23Budget
|
Operating Expenses
• Grants are used to purchase police equipment, supplement staffing costs and assist with training
• Continue to seek grant funding for necessary equipment
PUBLIC SAFETY
Health Insurance 7,180 7,592 12,597 16,662
GOALS
TOTAL EXPENDITURES 495,790$ 435,082$ 436,106$ 390,705$
C 19
Personnel Services Salaries & Wages 190,599$ 169,005$ 135,345$ 129,824$ Retirement Benefits 36,710 50,587 37,127 36,088
Full Time Positions 1.00 1.00 1.00 1.00 Hourly/FTE Positions 0.00 0.00 0.00 0.00
ABOUT
RECENT ACCOMPLISHMENTS
Police grants include federal and state asset forfeiture, the Citizens’ Option for Public Safety, the Justice Assistance Grant, and the Urban Areas Security Initiatives Program.
SERVICES
• Used the Homeland Security Grant to purchase police radios and field equipment
C 20

This includes administration of the Capital Improvement Program, a 15 year plan that encompasses road and traffic improvements; storm drain systems; major facilities maintenance, repairs and renovation; water and wastewater infrastructure; construction of civic buildings and other infrastructure projects. Public Works plays a key role in promoting environmental sustainability, enhancing transportation options and protecting public health and safety.

D 1
PUBLIC WORKS
Paz DeputyGomezCity Manager, Public Works
442 339 paz.gomez@carlsbadca.gov2751
Public Works is responsible for planning, providing and maintaining the infrastructure that supports a high quality of life in the City of Carlsbad. From buildings and vehicles to roads and habitat, to safe, reliable water supplies and more Public Works oversees responsible and sustainable management practices for a wide variety of city assets.

Repair & Maintenance 43,340 11,916 61,087 2,100
SERVICES
Operating Expenses Subtotal 572,055 479,699 620,229 373,118
• Transitioned internal contract status reports to on demand dashboards
• Received the American Public Works Association, San Diego and Imperial Counties Chapter Award of Merit for outstanding public service
ABOUT
Public Works Administration provides leadership and strategic vision for the entire Public Works Branch, which is comprised of the Construction Management & Inspection, Fleet & Facilities, Environmental Sustainability, Transportation and Utilities departments. It provides administrative support services with a focus on strategic alignment to the Community Vision and City Council goals.
Other Personnel Expenses 40,863 26,532 35,412 29,465
D 3
• Updated contract templates to facilitate use of anticipated federal funding
Health Insurance 93,826 100,656 111,713 72,660
• Expanded functionality of DocuSign to facilitate expedited contract execution
• Facilitated an update of the city’s engineering manual and other relevant engineering standards
Interdepartmental Charges 234,074 178,004 250,925 236,729
• Provide leadership and management support, operating budget oversight, CIP oversight, contract administration and records management
Salaries & Wages $869,253 $907,628 $961,907 $782,418
Other Operating Expenses 35,653 9,354 23,000 21,910 Capital Outlay 0
Full Time Positions 7.60 7.85 7.85 5.90 Hourly/FTE Positions 1.00 1.00 1.50 1.60
Retirement Benefits 192,616 294,482 212,352 182,988
PUBLIC WORKS ADMINISTRATION|
Professional & Contract Services 224,989 261,134 243,078 94,078 Supplies & Materials 33,999 19,291 42,139 18,301
Operating Expenses
Personnel Services Subtotal 1,196,558 1,329,298 1,321,384 1,067,531
Account: 0018310
RECENT ACCOMPLISHMENTS
Fund: General
• Support communications and outreach activities for major CIP projects
2019-20Actual 2020-21Actual 2021-22Budget 2022-23Budget
Personnel Services
• Partnered with GIS staff to continually improve and update the internal project submittal app, public dashboard and reporting for the CIP
TOTAL EXPENDITURES $1,768,613 $1,808,997 $1,941,613 $1,440,649
• Engage in planning, design and implementation of an enterprise asset management system
• Complete an update of the city’s procurement policy and administrative order
• Continue to update and streamline standard contract language and processes
• Engage in the planning, design and implementation of a citywide portfolio project management system, including CIP project management
• Continue to develop and operationalize formal consultant and contractor performance evaluation processes
D 4
• Continue to focus on employee coaching, development and training for staff at all levels throughout the department
• Digitize the processing of bonds related to contracts
• Continue implementing a strategy to digitize all Public Works records per the city’s records retention schedule
GOALS
2019-20Actual 2020-21Actual 2021-22Budget 2022-23Budget
Other Personnel Expenses 76,561 46,267 60,268 68,741 Personnel Services Subtotal 2,263,283 2,375,952 2,208,877 2,509,267
RECENT ACCOMPLISHMENTS
Other Operating Expenses 23,186 4,413 14,260 14,260
Capital Outlay 619 Operating Expenses Subtotal 681,226 352,593 781,788 753,501
PUBLIC WORKS |
• Inspect and oversee private development grading
Personnel Services
Salaries & Wages 1,616,877$ 1,561,351$ 1,540,617$ 1,744,289$ Retirement Benefits 363,304 553,180 354,060 430,099
SERVICES
CONSTRUCTION MANAGEMENT & INSPECTION
Professional & Contract Services 236,426 21,836 323,519 321,130 Supplies & Materials 21,498 22,538 51,732 13,027 Repair & Maintenance 1,713 54 6,314 314 Interdepartmental Charges 397,784 303,752 385,963 404,770
• Inspect and oversee stormwater and improvements
D 5
• Oversee all construction activity in the public right of way
• Manage construction of CIP projects and public works contracts for all city asset managing departments
• Developed and implemented a comprehensive inspection tracking and data management system following treatment control best management practices that has received regional and national industry recognition
Account: 00185XX Fund: General ABOUT Construction Management & Inspection ensures safe construction of CIP and private development projects in compliance with legal, regulatory and contractual requirements.
Operating Expenses
TOTAL EXPENDITURES 2,944,509$ 2,728,545$ 2,990,665$ 3,262,768$
Full Time Positions 17.70 15.20 15.20 16.20 Hourly/FTE Positions 1.00 1.00 0.50 0.50
• Implemented COVID 19 safety measures to allow all inspectors and project managers to operate remotely or semi remotely while still providing a full range of essential construction management and inspection services
Health Insurance 206,541 215,154 253,932 266,138
• Provided construction inspection services for private development projects such as Carlsbad Village Lofts, Springhill Suites hotel, and ensured safe work in the right of way for 5G communications infrastructure installation throughout the city
FYActual2021 FY Estimated2022 FY Projected2023
• Continue to partner with property owners to reduce pollution and improve water quality through the city’s Treatment Control Best Management Practices program
• Maintained stormwater compliance through training, education, outreach and enforcement actions resulting in zero construction related notices of violation from the Regional Water Quality Control Board to date
• Provided construction management and inspection services on several significant CIP projects, including water valve replacements and pipelines, El Camino Real and College Boulevard intersection improvements, El Camino Real and Cannon Road bridge, Calavera Hills Community Park Gateway Improvements, Poinsettia Park dog park, Barrio Lighting Project, and various traffic calming projects
Measure
Response rate for Treatment Control Best Management Practices Verification of Maintenance 75% 82% 75% Construction stormwater violations on CIP projects 0 0 0
D 6
• Continue a strong commitment to stormwater regulation compliance and preservation of the natural environment by avoiding violations levied by regional regulatory agencies at city construction
Performancesites
• Continue to partner with the City Attorney’s Office on development of a contractor performance evaluation process to improve accountability during e of a public works project
• Continue to leverage project management tools and processes to improve efficiency and effectiveness within the department
GOALS
• Continue to provide construction management services for parks, transportation, water, sewer and storm drain infrastructure projects
• Developed and implemented a certified in house Qualified Stormwater Pollution Prevention Plan Developer and Practitioner Program for eligible city staff to achieve cost savings and maintain compliance with state stormwater permit program
Capital Outlay 135,000 Operating Expenses Subtotal 2,018,308 2,447,095 2,977,140 2,672,702
TOTAL FUNDING 3,522,459$ 4,043,047$ 4,616,364$ 5,124,889$
Personnel Services
ABOUT
ENVIRONMENTAL SUSTAINABILITY
Other Personnel Expenses 78,150 (28,258) 46,921 68,964 Personnel Services Subtotal 1,504,151 1,595,952 1,639,224 2,452,187
D 7
The General Fund portion of the Environmental Sustainability Department budget includes the Climate Action Plan & Habitat Management Division, and coordination of the municipal component of the National Pollutant Discharge Elimination System Municipal Stormwater Permit in the Watershed Protection Division. These divisions integrate components of the Environmental and Sustainability Guiding Principles and support the Carlsbad Community Vision areas of open space and the natural environment, sustainability and access to recreation and active, healthy lifestyles.
Salaries & Wages 1,051,026$ 1,087,903$ 1,146,936$ 1,657,905$ Retirement Benefits 227,608 372,361 262,396 400,937 Health Insurance 147,367 163,946 182,971 324,381
2019-20Actual 2020-21Actual 2021-22Budget 2022-23Budget
General Fund 758,852 1,030,453 1,282,225 1,159,789 Enterprise Fund 2,763,607 3,012,594 3,334,139 3,965,100
TOTAL EXPENDITURES 3,522,459$ 4,043,047$ 4,616,364$ 5,124,889$
• Climate Action Plan & Habitat Management
ENVIRONMENTAL SUSTAINABILITY: SUMMARY
Other Operating Expenses 39,804 21,564 21,121 29,021
Full Time Positions 11.05 11.95 11.95 17.60 Hourly/FTE Positions 1.50 1.50 1.50 1.50
PUBLIC WORKS |
• Watershed Protection
Operating Expenses
Professional & Contract Services 1,309,916 1,815,862 2,179,279 1,596,311 Supplies & Materials 169,537 55,053 65,661 70,161 Repair & Maintenance 32 18 580 80 Interdepartmental Charges 499,019 554,598 710,499 842,129
• Sustainable Materials Management
Salaries & Wages 291,260$ 280,637$ 305,009$ 309,498$
• Participate in groups such as the SANDAG Regional Energy Working Group, Climate Science Alliance and ReCAP Stakeholder Working Group
Account: 00151300015110
Full Time Positions 2.55 2.65 2.65 2.55 Hourly/FTE Positions 0.50 0.50 0.50 0.50
Operating Expenses
• Provide leadership and citywide coordination to ensure compliance with Habitat Management Plan regulations
PUBLIC WORKS |
Professional & Contract Services 292,711 529,967 751,738 299,750 Supplies & Materials 11,832 20,354 11,807 12,607
D 8
• Coordinate updates to the CAP document, as directed by City Council
Fund: General
ENVIRONMENTAL SUSTAINABILITY: CLIMATE ACTION PLAN & HABITAT MANAGEMENT
• Oversee and coordinate implementation of the Home Energy Score Assessment program and Carlsbad Green Business Network
Health Insurance 31,793 33,130 38,654 36,087 Other Personnel Expenses 10,134 8,461 11,954 12,152
Repair & Maintenance 22 9 50 50
Interdepartmental Charges 41,114 59,536 87,011 97,342 Other Operating Expenses 11,948 480 7,268 6,668 Capital Outlay
Personnel Services Subtotal 401,225 420,107 424,351 430,287
• Coordinate preparation of a communitywide greenhouse gas inventory and forecast
Retirement Benefits 68,038 97,879 68,734 72,550
• Perform outreach and education related to CAP activities and respond to public inquiries
• Coordinate with multiple city departments to oversee CAP implementation, collect CAP implementation monitoring data and prepare an annual report
• Research and monitor upcoming regulations, funding opportunities, and activities related to climate mitigation and adaptation
SERVICES
2019-20Actual 2020-21Actual 2021-22Budget 2022-23Budget
TOTAL EXPENDITURES 758,852$ 1,030,453$ 1,282,225$ 846,704$
• Monitor regional climate change preparedness activities
• Monitor GHG emissions data from SANDAG and incorporate into CAP; data is released every two years and the department is currently awaiting 2020 data
Operating Expenses Subtotal 357,627 610,346 857,874 416,417
Personnel Services
Green Business Network participants 6 15 30
D 9
• Work with other city staff to ensure that projects are implemented in a manner consistent with the Habitat Management Plan
• Began comprehensive update of the CAP
• Continue implementation and monitoring of adopted CAP, and complete a comprehensive CAP update
Acreage goal added to Habitat Management Plan area 96% 96% 96%
• Served as a board member for the San Diego Regional Climate Collaborative
• Maintain collaborative relationships with the U.S. Fish and Wildlife Service, California Department of Fish and Wildlife and California Coastal Commission staff to ensure solutions oriented Habitat Management Plan implementation
GOALS
• Continue implementing wildlife movement program
• Increase number of participants in the Green Business Network
• Meet annual goal for acres added to Habitat Management Plan area
RECENT ACCOMPLISHMENTS
• Coordinate with local and regional stakeholders to monitor, manage and conduct outreach for shot hole borer and Ward’s weed, the highest priority threats to the preserve system
• Continue implementation of the Carlsbad Green Business Network and Home Energy Score Assessment Program
• Expand volunteer program to protect high priority species and habitats
FYActual2021 Estimated2022 Projected2023
Performance Measure
• Serve as liaison between city staff and regulatory agencies
• Implement an inspection program to identify potential threats to native species and habitats
• Coordinate with various city departments on regulatory requirements for private development projects and CIP projects
FY
• Oversee preserve managers to ensure Habitat Management Plan compliant biological management, monitoring and reporting
• Conducted required stormwater inspections at municipal facilities
• Served on the Technical Advisory Group for the Connecting Wildlands and Communities Project and Environmental Mitigation Program Working Group for SANDAG
FY
Personnel Services
ABOUT
Salaries & Wages 228,125$ 259,845$ 277,837$ 825,400$
Other Personnel Expenses 7,919 7,920 11,340 35,238 Personnel Services Subtotal 309,391 396,948 391,456 1,256,809
Retirement Benefits 46,319 92,946 61,719 202,509 Health Insurance 27,028 36,237 40,560 193,662
Operating Expenses
• Prepare state and county grant applications with the City Council’s approval, appropriate funds, implement grant activities, track expenses and submit reports
Professional & Contract Services 520,799 894,703 834,447 785,547 Supplies & Materials 152,884 29,339 35,013 39,213
Repair & InterdepartmentalMaintenanceCharges 115,212 136,392 217,584 322,694
Other Operating Expenses 14,731 15,723 3,833 12,833 Capital Outlay 135,000
Operating Expenses Subtotal 803,626 1,076,157 1,090,877 1,295,287
TOTAL EXPENDITURES 1,113,017$ 1,473,105$ 1,482,333$ 2,552,096$
Fund: EnterpriseGeneral
• Work with other staff to improve the city’s waste reduction, diversion and recycling program
General Fund 313,085 Enterprise Fund 1,113,017 1,473,105 1,482,333 2,239,011
TOTAL FUNDING 1,113,017$ 1,473,105$ 1,482,333$ 2,552,096$
PUBLIC WORKS
Account: 520XXXX0015120
Full Time Positions 2.80 2.80 2.80 9.65 Hourly/FTE Positions 0.50 0.50 0.50 0.50
This budget includes oversight and coordination of the city’s Sustainable Materials Management Division. Consistent with the General Plan, this division coordinates the implementation of a citywide waste reduction and recycling program to maintain compliance with rigorous state regulations related to diversion and disposal of solid waste. The Sustainable Materials Management Division staff oversee the franchise agreement for waste hauling and recycling services, Palomar Transfer Station agreement for disposal services, composting service contract, various waste reduction and diversion outreach and education contracts, and proper disposal of household hazardous waste.
|
• Represent the city at meetings with CalRecycle, businesses, residents and other stakeholders
D 10
SERVICES
ENVIRONMENTAL SUSTAINABILITY: SUSTAINABLEMANAGEMENTMATERIALS
2019-20Actual 2020-21Actual 2021-22Budget 2022-23Budget
0
• Work with partners to increase outreach to construction companies to improve diversion of construction and demolition material
• Engage businesses and residents to decrease waste and increase recycling
• Executed the Palomar Transfer Station contract amendment extension
• Added six new full time positions and implementation funding for the City Council approved sustainable materials management plan, funded largely by the city’s new solid waste franchise agreement
• Monitor newly negotiated waste diversion and recycling programs at Palomar Transfer Station targeting self haulers
• Provide outreach and implement a new solid waste collection program for food waste for residential and commercial customers
SIGNIFICANT CHANGES IN THIS YEAR’S BUDGET
• Participated in food recovery and organics recycling conferences to learn about best practices for successful program implementation
• Increased outreach and education by developing a multi family guide, commercial organic and recycling brochures, and other outreach materials, including social media posts
GOALS
RECENT ACCOMPLISHMENTS
• Continue tracking per capita disposal rate in pounds per person per day to verify accuracy
D 11
• Plan, prepare and arrange for a seamless transition to a new franchise hauler for solid waste collection, disposal and recycling processing, which will become effective on July 1, 2022
• Coordinate outreach and education targeted at increasing recycling for residents, businesses, municipal employees and the public
• Review, prioritize and implement improvements based on feedback from CalRecycle in the mandatory commercial recycling and construction and demolition recycling programs
• Coordinate annual Earth Month and Earth Day events promoting recycling, proper disposal of household hazardous waste, composting and beach cleanup
• Conduct annual rate analysis to determine cost effective practices
• Completed the Sustainable Materials Management Implementation Plan
• Prepare and submit required annual recycling, composting, and disposal reports to CalRecycle as required by Senate Bill 1016
• Reviewed special event applications for compliance with recycling and trash best practices
• Increase waste diversion in the commercial sector by implementing outreach to targeted high trash generating businesses with low diversion rates
• Reduce number of businesses without recycling services to zero
• Participate in regional activities with SANDAG Solid Waste Technical Advisory Committee
• Facilitated the Carlsbad Food Recovery focus group to learn about best practices and barriers to food recovery in the city
Per capita disposal rate 7.7 lbs. 7.7 lbs. 7.5 lbs. without recycling services 37 13
Businesses
Performance Measure FYActual2021 FY Estimated2022 FY Projected2023
• Support residents’ quality of life by responsibly managing environmental resources
PUBLIC WORKS |
D 12
• Represent the city at meetings with the Environmental Protection Agency, Regional Board, San Diego County Co permittees, Carlsbad Watershed, environmental nonprofit groups and other stakeholders
SERVICES
Personnel Services Subtotal 793,535 778,897 823,417 765,091
2019-20Actual 2020-21Actual 2021-22Budget 2022-23Budget
ENVIRONMENTAL SUSTAINABILITY: WATERSHED PROTECTION
Personnel Services
Professional & Contract Services 496,406 391,192 593,094 511,014 Supplies & Materials 4,821 5,360 18,841 18,341 Repair & Maintenance 10 9 530 30 Interdepartmental Charges 342,693 358,670 405,904 422,093 Other Operating Expenses 13,125 5,361 10,020 9,520
TOTAL EXPENDITURES 1,650,590$ 1,539,489$ 1,851,806$ 1,726,089$
• Participate with neighboring cities in the Carlsbad Watershed as the Principal Co permittee, serving as a liaison with the Regional Board, ensuring submittal of annual reports and participating in the San Diego County Co permittees Regional Program Planning Committee
Full Time Positions 5.70 6.50 6.50 5.40 Hourly/FTE Positions 0.50 0.50 0.50 0.50
Account: 5215110
ABOUT
Salaries & Wages 531,641$ 547,421$ 564,090$ 523,007$ Retirement Benefits 113,251 181,536 131,943 125,878 Health Insurance 88,546 94,579 103,757 94,632 Other Personnel Expenses 60,097 (44,639) 23,627 21,574
Operating Expenses
Fund: Enterprise
Operating Expenses Subtotal 857,055 760,592 1,028,389 960,998
Capital Outlay
• Assess businesses to ensure the use of proper best management practices and pollution prevention activities, prevent discharges into the MS4, and protect receiving waters; this may require follow up visits, targeted education or enforcement
This budget includes leadership and stewardship of the city’s resources, specifically protecting our creeks, lagoons and ocean. The Environmental Sustainability Department’s Watershed Protection Division coordinates the citywide watershed protection program and helps the city maintain compliance with the National Pollutant Discharge Elimination System Municipal Stormwater Permit issued by the San Diego Regional Water Quality Control Board.
Actual2021 FY Estimated2022 FY Projected2023
FY
GOALS
• Implement a public outreach program to promote behavior changes that reduce the discharge of pollutants into the MS4 and protect water quality in our receiving waters
• Plan for implementation of the revised Municipal Stormwater Permit which will include new requirements to control trash
Emergency response times under 45 minutes for illicit discharges
• Conduct all annual inspections of existing development and water quality monitoring required by the Municipal Stormwater Permit
• Implement a monitoring program to evaluate Municipal Separate Storm Sewer System or MS4 discharges, including receiving water monitoring, MS4 outfall discharge monitoring, sediment quality monitoring and various special studies
• Submitted the Carlsbad Watershed Management Area Water Quality Improvement Plan and the Jurisdictional Runoff Management Program Annual Reports to the Regional Board
• Participated virtually in Creek to Bay Cleanup, Coastal Cleanup Day and other outreach and education activities within the city and regionally
• Respond to at least 90% of illicit discharge emergencies within 45 minutes
• Implement all required strategies and numeric goals of the Water Quality Improvement Plan
D 13
RECENT ACCOMPLISHMENTS
Performance Measure
• Implement additional water quality monitoring of the Agua Hedionda Lagoon in coordination with the City of Vista and the County of San Diego, as required by the San Diego Regional Water Quality Control Board
• Worked inter departmentally to coordinate on National Pollutant Discharge Elimination System MS4 Trash Amendments implementation
100% 100% 90% Illicit discharges detected and eliminated 100% 100% 100%
• Detect and eliminate 100% of illicit discharges
• Conduct illicit discharge detection and elimination into the MS4 as required by the Municipal Stormwater Permit, including responding to and investigating potential illicit discharges in the city, performing field screening at major outfalls, and managing a public hotline
• Incorporate innovative methods to implement the city’s Jurisdictional Runoff Management Program in conjunction with the Carlsbad Watershed Water Quality Improvement Plan and submit required reports to the San Diego Regional Water Quality Control Board
• Managed the contract for a watershed coordinator to assist the watershed agencies with updating and implementing the Water Quality Improvement Plan and report to optimize the watershed’s compliance with the Municipal Stormwater Permit
• Act as the lead division for planning and implementation of the statewide Trash Amendments and incorporate them into the next Municipal Stormwater Permit
• Worked inter departmentally to implement the Municipal Stormwater Permit
• Compile the annual Jurisdictional Runoff Management Program report and prepare new program documents at the beginning of each Municipal Stormwater Permit cycle
Other Personnel Expenses 147,381 24,440 123,948 127,194 Personnel Services Subtotal 3,360,892 3,768,684 4,179,776 4,321,764
General Fund 5,537,243$ 5,341,736$ 6,555,934$ 6,768,736$ Internal Service Fund 5,117,315$ 5,581,454$ 8,062,406$ 8,799,885$ Special Revenue Fund 47,547$ 48,244$ 50,000$ 53,000$
Personnel Services
Operating Expenses
Interdepartmental Charges 456,089 545,549 845,389 790,453
Professional & Contract Services 1,213,791 980,637 926,458 887,571 Supplies & Materials 2,039,396 1,984,228 2,264,266 2,168,528 Repair & Maintenance 988,080 988,227 1,501,669 1,510,660
Salaries & Wages 2,341,840$ 2,496,346$ 2,850,454$ 2,954,275$ Retirement Benefits 494,036 800,794 599,384 644,987 Health Insurance 377,635 447,104 605,990 595,308
D 14
TOTAL EXPENDITURES 12,134,181$ 10,359,059$ 14,668,340$ 15,621,621$
FLEET & FACILITIES: SUMMARY
FLEET & FACILITIES
Other Operating Expenses 386,241 354,678 403,614 645,900
Capital Outlay 3,689,692 1,737,056 4,547,168 5,296,745 Operating Expenses Subtotal 8,773,289 6,590,375 10,488,564 11,299,857
TOTAL FUNDING 10,702,105$ 10,971,434$ 14,668,340$ 15,621,621$
Full Time Positions 30.15 31.90 35.10 34.95 Hourly/FTE Positions 9.50 9.50 7.75 6.90
• Facilities
PUBLIC WORKS |
2019-20Actual 2020-21Actual 2021-22Budget 2022-23Budget
• Fleet Maintenance & Replacement
Account: 315511000153200015310 Fund: SpecialGeneralRevenue Parking in Lieu
PUBLIC WORKS |
Personnel Services Subtotal 2,376,031 2,592,333 2,914,825 3,050,956
• Operate and lease the Safety Training Center for public safety personnel training
D 15
Salaries & Wages 1,675,451$ 1,707,594$ 2,000,062$ 2,108,360$ Retirement Benefits 347,710 534,701 410,206 444,822
• Maintain city owned facilities including building exteriors, interiors, cleaning and custodial services, as well as set up of offices and meeting rooms
Professional & Contract Services 1,159,427 928,046 887,115 848,228 Supplies & Materials 660,540 486,622 689,973 629,735 Repair & Maintenance 606,276 647,211 1,117,575 1,100,566
ABOUT
Capital Outlay 94,949 27,574 1,135 3,000 Operating Expenses Subtotal 3,208,759 2,797,647 3,691,109 3,770,780
TOTAL EXPENDITURES 5,584,790$ 5,389,980$ 6,605,934$ 6,821,736$
FLEET & FACILITIES: FACILITIES
Total Funding 5,584,790$ 5,389,980$ 6,605,934$ 6,821,736$
Full Time Positions 20.45 21.65 24.85 24.85 Hourly/FTE Positions 8.50 8.50 6.75 5.90
Interdepartmental Charges 331,450 383,863 600,750 561,904
The Facilities Division provides safe and comfortable working spaces at city facilities and maintains quality indoor public spaces. Additionally, this division oversees the design and construction work for new city facilities and building renovation projects and operates the Safety Training Center.
Personnel Services
Health Insurance 271,227 294,081 416,216 406,963
Other Personnel Expenses 81,643 55,957 88,341 90,811
General Fund 5,537,243$ 5,341,736$ 6,555,934$ 6,768,736$ Special Revenue Fund 47,547 48,244 50,000 53,000
Other Operating Expenses 356,117 324,331 394,561 627,347
SERVICES
• Provide building construction, improvements, renovations, repairs and relocations
Operating Expenses
2019-20Actual 2020-21Actual 2021-22Budget 2022-23Budget
• Provided facilities and support for 152 Fire Department training days and 104 Police Department training days
• Complete the Fire Station 2 replacement and Carlsbad City Library fire alarm system replacement
• Replaced lighting fixtures to energy efficient LED fixtures at the MiraCosta Las Palmas Facility, State Street parking lots, City of Carlsbad Faraday Center and the Carlsbad Recycled Water Facility
• Began construction of the Police and Fire Headquarters renovation project
• Obtained a conditional use permit for Temporary Fire Station 7
• Retrofitted 86 fluorescent can light fixtures to energy efficient LED fixtures and added 68 new LED light fixtures to both indoor shooting ranges, increasing lighting on the range for safety
• Begin construction on the Calavera Hills Community Park roof replacement project
• Completed 1,539 work orders as of April 2022, including reconfiguration of Faraday Center to accommodate changing space needs
Custodial cost ($/square foot) $2.66 $2.43 $3.00
RECENT ACCOMPLISHMENTS
Building maintenance ($/square foot) $2.25 $2.25 $2.58
• Completed the Fire Station 6 dorm conversion project
• Continue the city facility and parking lot light pole and fixture replacement project
• Increase the city’s investment in custodial and building maintenance to meet industry standards for high quality facilities
FYActual2021 FY Estimated2022 FY Projected2023
• Recycled 3,218 pounds of brass shell casings, 5,315 pounds of lead and copper from indoor shooting range activities, and 4,967 pounds of scrap metal
• Added one part time building maintenance worker position to provide opportunities for entry levelPerformanceexperienceMeasure
• Initiate various refurbishment and repair projects at the Safety Training Center
• Added one limited term Senior Engineer position to facilitate delivery capital projects
• Obtain a conditional use permit for planned new Public Works headquarters
• Complete plans and specifications for the Senior Center roof replacement project
• Supported 183 training days for 17 outside law enforcement agency leases
• Perform a facilities conditions assessment throughout the city and continue development of a Facility Asset Management System
SIGNIFICANT CHANGES IN THIS YEAR’S BUDGET
• Awarded revised citywide contracted custodial services contracts that leverage technology to ensure contractor performance
D 16
GOALS
Operating Expenses
D 17
2019-20Actual 2020-21Actual 2021-22Budget 2022-23Budget
The fleet maintenance program funds labor, parts, services, fuel and oil necessary to maintain the city’s fleet of vehicles and equipment. The fleet maintenance program is funded through charges based on vehicle type and utilization.
Retirement Benefits 146,326 266,093 189,178 200,165
Professional & Contract Services 54,364 52,591 39,343 39,343 Supplies & Materials 1,378,856 1,497,606 1,574,293 1,538,793 Repair & Maintenance 381,804 341,016 384,094 410,094 Interdepartmental Charges 124,639 161,686 244,639 228,549
The city’s fleet consists of 456 vehicles and equipment necessary to complete the city’s mission of delivering quality and efficient services. The fleet maintenance & replacement programs enable departments to achieve their operational mission in a safe, efficient manner.
PUBLIC WORKS |
Other Operating Expenses 30,124 30,347 9,053 18,553
FLEET & FACILITIES: FLEET MAINTENANCE & REPLACEMENT
Capital Outlay 3,594,743 1,709,482 4,546,033 5,293,745
Operating Expenses Subtotal 5,564,530 3,792,728 6,797,455 7,529,077
Full Time Positions 9.70 10.25 10.25 10.10 Hourly/FTE Positions 1.00 1.00 1.00 1.00
The fleet vehicle replacement program is funded through a replacement charge for each vehicle or equipment in service, determined by actual costs of vehicle procurement divided by the expected life of the vehicle. This program funds asset replacement and vehicle outfitting. Cost effective vehicle procurement is achieved through cooperative purchasing agreements and bidding processes. Revenue is collected from the sale of retired city fleet assets at auction.
Account: 62154616205460
TOTAL EXPENDITURES 6,549,391$ 4,969,079$ 8,062,406$ 8,799,885$
Fund: Vehicle Maintenance Fund Vehicle Replacement Fund
Other Personnel Expenses 65,738 (31,517) 35,607 36,383 Personnel Services Subtotal 984,861 1,176,351 1,264,951 1,270,808
Salaries & Wages 666,389$ 788,752$ 850,392$ 845,915$
Personnel Services
Health Insurance 106,408 153,023 189,774 188,345
ABOUT
RECENT ACCOMPLISHMENTS
• Evaluate the city fleet on an annual basis to identify units eligible for replacement in accordance with Administrative Order No. 3 and calculate estimated acquisition costs
• Completed an update of Administrative Order No. 3
• Annually assess vehicles for conversion to alternative fuel options in support of the CAP goal to increase the proportion of fleet low and zero emissions vehicle miles traveled to 25% of all city related vehicle miles traveled by 2035
Performance Measure FYActual2021 FY Estimated2022 FY Projected2023 Fleet vehicles ready for active service 95% 95.4% 95% Vehicle miles traveled by low/zero emission vehicles 7% 18% 25%
• Assess and improve fleet database and data management systems and techniques
GOALS
• Advise on development of specifications for purchase of replacement units that satisfy client department performance requirements while optimizing life cycle return on investment in alignment with the CAP
• Provide reliable, cost effective fuel management by maintaining sufficient fuel supplies for emergencies and monitoring fuel tanks in accordance with state and county regulations
• Activated 42 new vehicles and equipment, including five hybrid compact light duty trucks
• Maintain records related to fleet asset inventory and work order history through management of the AssetWorks fleet maintenance database
• Manage the Fleet Replacement Committee, made up of city staff from various departments, to make recommendations for unit replacement, retention or disposal
• Executed an agreement with SDG&E to leverage the Power Your Drive for Fleets Make Ready Infrastructure Program, which is anticipated to install up to 26 level 3 DC fast chargers at the fleet maintenance facility over the next five years
D 18
• Implement a pilot GPS/vehicle telematics system in the city’s fleet of police vehicles
• Achieved recognition from Government Fleet magazine and the American Public Works Association as one of the Top 50 Leading Fleets in the nation
• Provide safe and appropriately maintained vehicles for use by city staff, inspect vehicles per requirements of the biennial inspection of terminals and smog programs, and maintain 24/7 road call services for emergency vehicles
• Purchase replacement units through the public bidding process or through cooperative purchasing programs
SERVICES
Other Personnel Expenses 190,282 111,136 158,902 170,886 Personnel Services Subtotal 4,928,840 5,484,742 5,655,804 5,945,659
D 19
• Traffic, Mobility, Transportation Engineering & Streets Maintenance
Interdepartmental Charges 1,809,816 1,656,409 2,078,913 2,426,231
Full Time Positions 44.15 43.90 43.70 43.60 Hourly/FTE Positions 1.50 1.50 1.94 1.50
Personnel Services
Salaries & Wages 3,342,066$ 3,507,800$ 3,862,555$ 4,066,074$ Retirement Benefits 844,103 1,283,466 912,785 1,037,649
• Lighting & Landscaping Districts
PUBLIC WORKS |
Operating Expenses
Capital Outlay 20,431 37,838 Operating Expenses Subtotal 5,455,319 5,203,213 6,139,589 7,195,010
TRANSPORTATION
2019-20Actual 2020-21Actual 2021-22Budget 2022-23Budget
Health Insurance 552,389 582,340 721,562 671,050
Professional & Contract Services 1,192,636 1,052,886 1,414,487 1,970,070 Supplies & Materials 307,500 313,052 491,620 486,620 Repair & Maintenance 1,523,237 1,545,047 1,461,074 1,573,574
• Storm Drain Maintenance & Engineering
Other Operating Expenses 601,699 597,981 693,495 738,515
TOTAL EXPENDITURES 10,384,159$ 10,687,955$ 11,795,393$ 13,140,669$
General Fund 7,583,250 7,553,800 8,405,466 9,707,559 Enterprise Fund 1,745,011 1,990,755 1,849,335 1,836,302 Special Revenue Fund 1,058,403 1,145,621 1,542,492 1,598,708
TOTAL FUNDING 10,386,664$ 10,690,176$ 11,797,293$ 13,142,569$
TRANSPORTATION: SUMMARY
D 20
Other Operating Expenses 92,825 114,006 91,424 91,424
Account: 52163100016310
Repair & Maintenance 489,089 556,986 495,293 495,293
Capital Outlay 5,397 5,688 0 0
TRANSPORTATION: STORM DRAIN MAINTENANCE & ENGINEERING
• Perform inspection and maintenance of the storm drain system
RECENT ACCOMPLISHMENTS
ABOUT
• Address various drainage infrastructure and stormwater maintenance issues citywide
Professional & Contract Services 273,790 313,103 310,165 460,165 Supplies & Materials 17,854 24,207 50,321 50,321
Operating Expenses Subtotal 1,145,820 1,257,094 1,321,076 1,419,431
• Completed engineering design and advertised for construction bids of the Phase I Magnolia Avenue Storm Drain Improvements Project
TOTAL EXPENDITURES $2,106,646 $2,342,191 $2,242,434 $2,334,079
General Fund 361,635 351,436 393,099 497,777 Enterprise Fund 1,745,011 1,990,755 1,849,335 1,836,302
Interdepartmental Charges 266,865 243,104 373,873 322,228
Operating Expenses
• Optimize maintenance efforts by monitoring and addressing new and ongoing drainage issues
2019-20Actual 2020-21Actual 2021-22Budget 2022-23Budget
TOTAL FUNDING 2,106,646$ 2,342,191$ 2,242,434$ 2,334,079$
Salaries & Wages $660,516 $678,142 $620,841 $632,248 Retirement Benefits 150,123 242,324 141,276 150,992 Health Insurance 114,475 143,182 133,684 105,010
The Transportation Storm Drain Maintenance and Engineering divisions are responsible for maintaining and improving the city’s storm drain infrastructure.
PUBLIC WORKS |
Full Time Positions 9.75 8.60 7.10 7.00 Hourly/FTE Positions 0.50 0.50 0.98 0.50
• Completed engineering design of the Highland Hoover Storm Drain Realignment Project
Other Personnel Expenses 35,712 21,449 25,557 26,398
SERVICES
• Completed construction of the Segovia Way Drainage Improvements Project
• Develop plans, specifications, and estimates, and provide project or design management of projects involving storm drain assets
Personnel Services
Fund: EnterpriseGeneral Storm Drain Maintenance
Personnel Services Subtotal 960,826 1,085,097 921,358 914,648
• Inspected 100% of high priority storm drain inlets, removing an estimated 17 tons of sediment and debris
• Completed approximately 1,800 lane miles of street sweeping monthly, removing an estimated 1,100 tons of debris that otherwise would pollute the city’s storm drain system
Agua Hedionda Lagoon Channel cleaned in fiscal year 100% 100% 100%
• Completed 307 litter removal requests
• Clean 100% of the Agua Hedionda Lagoon and Buena Vista Channels
D 21
FYActual2021 FY Estimated2022 FY Projected2023
• Establish a maintenance and assessment program for the city’s storm drain infrastructure
• Studied Lanakai Lane ponding issue
Performance Measure
• Investigated maintenance responsibilities for the drainage channel near the Omni La Costa Golf Course
• Complete update of the city’s Drainage Master Plan
• Completed 72 storm drain maintenance requests and 35 storm drain emergency responses
Buena Vista Channel cleaned and reported for permitting 100% 100% 100%
• Inspected 34,000 linear feet of storm drain pipeline with CCTV technologies
GOALS
Capital Outlay 13,507 27,456 0 0
SERVICES
• Conduct traffic and mobility planning, oversee engineering and signals operations, and serve as liaison with the Traffic and Mobility Commission
• Provide world class customer service and high quality maintenance of public right of way assets
2019-20Actual 2020-21Actual 2021-22Budget 2022-23Budget
Personnel Services
Interdepartmental Charges 1,179,917 1,078,681 1,293,885 1,691,441
Other Operating Expenses 189,770 178,242 228,307 246,307
TOTAL EXPENDITURES $7,221,615 $7,202,364 $8,012,367 $9,209,782
• Perform roadside maintenance including street signs, street legends, striping, graffiti and trash removal, pothole and sidewalk repairs
TRANSPORTATION: TRAFFIC, MOBILITY, TRANSPORTATION ENGINEERING & STREETS MAINTENANCE
• Develop plans, specifications, and estimates, and provide project or design management of projects involving street assets
Operating Expenses
PUBLIC WORKS |
Traffic, Mobility, Transportation Engineering and Streets Maintenance divisions maintain and improve the road infrastructure and keep people moving. They are responsible for enhancing mobility and safety citywide through ongoing transportation planning, streets and traffic engineering, streets maintenance, and signal operations activities.
Account: 00187001860018410XXXX
D 22
Fund: General ABOUT
Salaries & Wages $2,556,495 $2,691,623 $3,103,140 $3,275,276 Retirement Benefits 664,780 990,832 737,703 846,719
Health Insurance 417,216 421,434 569,967 548,203 Other Personnel Expenses 147,916 84,948 127,206 137,663 Personnel Services Subtotal 3,786,407 4,188,837 4,538,016 4,807,861
Full Time Positions 32.45 33.15 34.65 34.65 Hourly/FTE Positions 1.00 1.00 0.97 1.00
Professional & Contract Services 841,857 643,718 892,270 1,296,784 Supplies & Materials 250,825 263,515 367,080 362,080 Repair & Maintenance 959,332 821,915 692,809 805,309
Operating Expenses Subtotal 3,435,208 3,013,527 3,474,351 4,401,921
• Update the city’s Engineering Standards in accordance with the General Plan’s Mobility Element
• Implement the enhanced annual roadway restriping program
• Completed College Boulevard Speed Feedback Signs Project
• Incorporate citywide pavement condition assessment data into the city’s GIS database
• Resolve 100% of graffiti removal requests within 96 hours
• Address the Traffic Impact Fee guidelines and implement solutions
• Update the Transportation Impact Analysis Guidelines and the multimodal level of service methodology
• Implement the Enterprise Asset Management program
• Update Transportation Demand Management program
D 23
• Completed the El Camino Real and College Boulevard Improvements Project
GOALS
• Completed 308 street sign related work orders and replaced 163 signs that were knocked down
• Initiated update of the city’s multimodal level of service methodology
• Implemented the Transportation Demand Management framework plans and best practices
• Completed 121 street paint work orders, 39 pressure washing sidewalks, and 223 graffiti requests
• Completed design of the Carlsbad Boulevard Pedestrian Improvements Project and processed agreements with Caltrans for the project
• Apply new traffic hardware and technology based monitoring solutions to manage safe traffic flow and safety during high traffic periods and emergency response
• Resolve 100% of dead animal removal requests within 24 hours
RECENT ACCOMPLISHMENTS
• Revise the Carlsbad Residential Traffic Management Program
• Completed 183 work orders including 33,729 square feet of sidewalk and asphalt
• Completed the engineering design of the 2021 Sidewalk Improvements Project
• Complete the Growth Management Plan Monitoring Report
• Prepared the Growth Management Plan annual monitoring report for the circulation section
• Complete Phase 2 of the citywide streetlight LED fixture replacement program along collector and industrial streets
Performance Measure FYActual2021 FY Estimated2022 FY Projected2023 Dead animal removal requests resolved within 24 hours 100% 100% 100% Graffiti removal requests resolved within 96 hours 100% 100% 100%
• Completed the ADA Ramps Improvement Project
• Continue implementation and development of the Coordinated Traffic Signal Program
Operating Expenses
D 24
Other Operating Expenses 319,104 305,733 373,764 400,784
Full Time Positions 1.95 2.15 1.95 1.95 Hourly/FTE Positions 0.00 0.00 0.00 0.00
ABOUT
SERVICES
Account: 164163162
Personnel Services Subtotal 181,607 210,808 196,430 223,150
Fund: Special Revenue Street Light Maintenance Special Revenue Buena Vista Channel Special Revenue LLD 2
Other Personnel Expenses 6,654 4,739 6,139 6,825
TRANSPORTATION: BUENA VISTA CHANNEL, LIGHTING & LANDSCAPING DISTRICTS
Professional & Contract Services 76,989 96,065 212,052 213,121 Supplies & Materials 41,326 27,551 76,119 76,119 Repair & Maintenance 74,816 166,146 272,972 272,972 Interdepartmental Charges 363,034 334,624 411,155 412,562
• Maintain and repair streetlamps and decorative lighting
Salaries & Wages $125,055 $138,035 $138,574 $158,550 Retirement Benefits 29,200 50,310 33,806 39,938 Health Insurance 20,698 17,724 17,911 17,837
2019-20Actual 2020-21Actual 2021-22Budget 2022-23Budget
• Ensure adequate funds are collected to administer and maintain the Buena Vista Creek Channel from Jefferson Street east to the South Vista Way bridge
Capital Outlay 1,527 4,694 0 0
The Transportation Engineering Division provides oversight of the Buena Vista Creek Channel Maintenance Assessment District, which is the maintenance assessment district that funds the costs of streetlights, street trees and medians within the district boundaries covering newer developments in the city. The Transportation Department also provides maintenance of decorative lighting and oversight of the Lighting & Landscaping District 2.
TOTAL EXPENDITURES $1,058,403 $1,145,621 $1,542,492 $1,598,708
Operating Expenses Subtotal 876,796 934,813 1,346,062 1,375,558
Personnel Services
PUBLIC WORKS |
• Bid and complete installation of Phase II of the citywide streetlight replacement program
D 25
• Track and monitor areas for plant and trash removal for flood capacity purposes
FY Projected2023
FYActuals2021
• Completed annual vegetation clearing and trash removal from the Buena Vista Creek Channel Maintenance District
RECENT ACCOMPLISHMENTS
• Completed installation of over 130 LED streetlight fixtures in response to burnouts and completed 172 streetlight repairs
• Track and monitor service times to ensure timely service for service requests
• Completed planning and design of Phase 2 of the citywide streetlight replacement program
• Completed 272 streetlight and electrical maintenance service requests
• Identify and optimize continuing needs for environmental permitting and monitoring
FY Estimated2022
• Clear vegetation from three drainage outfalls entering the Buena Vista channel from the City of Oceanside
Performance Measure
Progress on the Citywide Streetlight Replacement Program Phase completed1 andPlanningdesignofPhase2complete;readytobid authorizeBid,andstartPhase2
GOALS
• Collaborate and coordinate with the Police Department Homeless Outreach Team on clean up efforts
• Completed plans and specifications for Phase 2 of the citywide light replacement program
Professional & Contract Services 12,243,229 13,077,777 16,094,280 16,567,837 Supplies & Materials 26,320,992 28,380,456 30,850,200 31,665,871 Repair & Maintenance 237,760 437,870 746,143 579,693
Interdepartmental Charges 4,558,343 4,808,776 5,265,754 5,618,106
• Operations
UTILITIES
TOTAL EXPENDITURES 67,360,699$ 68,341,692$ 73,982,483$ 77,921,921$
• Operations
Other Personnel Expenses 869,027 753,440 271,187 303,472 Personnel Services Subtotal 7,991,049 8,475,620 8,797,186 9,226,543
Salaries & Wages 5,036,676$ 5,025,225$ 6,132,712$ 6,423,971$ Retirement Benefits 1,184,777 1,786,928 1,351,556 1,517,057 Health Insurance 900,569 910,027 1,041,731 982,043
UTILITIES: SUMMARY
Operating Expenses
Wastewater
2019-20Actual 2020-21Actual 2021-22Budget 2022-23Budget
PUBLIC WORKS
Potable Water
Full Time Positions 62.10 61.95 63.95 64.50 Hourly/FTE Positions 0.50 0.50 0.50 0.50
Other Operating Expenses 15,923,990 12,648,726 12,228,920 14,227,621
Capital Outlay 85,336 512,467 36,250 Operating Expenses Subtotal 59,369,650 59,866,072 65,185,297 68,695,378
D 26
• Recycled Water Operations
Personnel Services
|
PUBLIC WORKS |
ABOUT
• Meet water related health, safety and environmental regulations
Personnel Services
To ensure drinking water is available on demand and customers can rely on receiving safe, high quality water, the Carlsbad Municipal Water District provides ongoing maintenance and repair of the following: nine storage reservoirs or tanks, 455 miles of pipeline, 17 pressure zones, 71 pressure regulating stations, three pumping stations, 14,369 valves, 4,441 fire hydrants and 30,320 potable meters. CMWD purchases potable water from its wholesale water provider, the San Diego County Water Authority, which includes desalinated water from the Carlsbad Desalination Plant.
Account: 5016310
• Comply with state and federal drinking water standards for sampling and reporting
Fund: Enterprise
Other Personnel Expenses 111,934 932,144 128,488 142,351
• Deliver safe drinking water and fire flow demand
2019-20Actual 2020-21Actual 2021-22Budget 2022-23Budget
Personnel Services Subtotal 3,656,555 4,774,755 4,178,303 4,327,387
TOTAL EXPENDITURES 45,752,126$ 47,685,382$ 47,821,220$ 49,715,832$
Other Operating Expenses 8,581,187 6,479,626 4,274,370 5,267,601
D 27
Professional & Contract Services 7,345,483 7,339,768 8,534,600 8,568,654 Supplies & Materials 23,299,719 25,652,887 27,412,700 28,010,084 Repair & Maintenance 185,173 299,762 452,050 361,250 Interdepartmental Charges 2,663,442 2,722,945 2,969,197 3,161,356
Capital Outlay 20,567 415,639 19,500
UTILITIES: POTABLE WATER OPERATIONS
• Educate the public regarding water conservation and rebate programs, perform leak detection studies and comply with conservation laws
• Clean tanks and perform required maintenance on potable reservoirs
• Coordinate with other water agencies and the San Diego County Water Authority on regional water related projects
SERVICES
• Operate infrastructure, including reservoirs, pressure regulating stations, pump stations, transmission and distribution pipelines, valves, meters, and other apparatus
Operating Expenses
Operating Expenses Subtotal 42,095,571 42,910,627 43,642,917 45,388,445
Salaries & Wages 2,459,473$ 2,456,258$ 2,906,467$ 3,020,543$ Retirement Benefits 569,526 853,829 635,085 707,921 Health Insurance 515,622 532,524 508,263 456,572
Full Time Positions 30.30 29.50 30.55 30.95 Hourly/FTE Positions 0.50 0.45 0.20 0.00
Measure
• Stay within industry benchmark for water main breaks of 3.4 to 19.4 breaks per 100 miles of pipeline, per the American Water Works Association
SIGNIFICANT CHANGES IN THIS YEAR’S BUDGET
• Performed 2021 Lead and Copper sampling to comply with the new Lead and Copper Rule
GOALS
• Awarded Utility of the Future recognition from the Water Environment Federation for 2021
• Minimize costs while continuing to provide high levels of service at acceptable risk
maintenancePerformance
• Began implementation of the recently completed Potable Water Master Plan
• Completed the Urban Water Management Plan Update
Pipeline breaks per 100 miles of pipe 2.0 <3.4 <3.4
D 28
Potable water use reduction compared to baseline average 20% 25% 25%
• Completed the Poinsettia 61 pressure regulating station
FYActual2021 FY Estimated2022 FY Projected2023
• Comply with state conservation requirements, including reducing potable water use by at least 25% compared to 10 year average from 1999 2008.
• Replaced potable water pipeline crossings under Interstate 5, which received the 2022 Outstanding Project Award from the American Society of Civil Engineers
• Completed cost of service study updates and received guidance from the CMWD Board on three years of future rates
RECENT ACCOMPLISHMENTS
• Completed design of the new Supervisory Control and Data Acquisition system
• Completed tank maintenance and cleaning on one potable reservoir
• Optimize asset management by increasing the use of technology to improve and manage the infrastructure system more efficiently and effectively
• Create inventory of lead service lines to comply with the new EPA Lead and Copper regulations
• Update the Drought Response Plan and the Potable Water Master Plan
• Initiate construction of the Palomar Airport waterline replacement project, water main replacements in the downtown and coastal areas, one new pressure regulating station and replacement of two existing pressure regulating stations
• Added one Management Analyst position to support financial management of the Utilities department, include maintaining financial models, managing funding sources, cost of service study updates and more
• Work with the state’s Department of Water Resources and the State Water Resources Control Board on implementation of Senate Bill 606 and Assembly Bill 1668, which require the setting of agency water use efficiency standards, performance measures and variances
• Added one Utility Locator position to reduce costs related to contract agreements for markouts and allow current staff to focus on core job duties related to infrastructure
Professional & Contract Services 1,180,930 1,339,480 2,045,680 2,008,860 Supplies & Materials 2,783,276 2,397,182 3,084,500 3,034,650 Repair & Maintenance 34,144 61,170 68,943 66,743 Interdepartmental Charges 591,195 690,574 837,662 936,905
Personnel Services
Salaries & Wages 1,036,826$ 1,033,183$ 1,279,473$ 1,354,365$ Retirement Benefits 247,059 375,927 290,484 310,948 Health Insurance 135,911 141,496 212,783 189,818
Account: 5026310 Fund: Enterprise ABOUT
Full Time Positions 12.20 13.00 13.30 12.75 Hourly/FTE Positions 0.00 0.05 0.10 0.50
2019-20Actual 2020-21Actual 2021-22Budget 2022-23Budget
UTILITIES: RECYCLED WATER OPERATIONS
D 29
Capital Outlay 11,183 67,841 7,000 Operating Expenses Subtotal 6,635,992 6,047,785 8,263,735 9,288,238
Operating Expenses
TOTAL EXPENDITURES 8,103,913$ 7,603,103$ 10,103,790$ 11,206,521$
PUBLIC WORKS |
The Carlsbad Municipal Water District provides ongoing water treatment and maintenance and repair of the recycled water system’s three storage tanks, four pump stations, three pressure reducing stations, five pressure zones, 95 miles of pipelines, 815 valves and 961 meters. CMWD’s Cross Connection Control and Backflow program ensures a safe supply of drinking water by preventing cross contamination from the recycled system into the potable system, in accordance with federal and state regulations. CMWD also purchases and delivers recycled water from the Vallecitos Water District’s Meadowlark Water Reclamation Facility.
Other Operating Expenses 2,035,264 1,491,538 2,226,950 3,234,080
CMWD owns the Carlsbad Water Recycling Facility which is located next to the Encina Wastewater Authority treatment plant. CMWD takes treated wastewater from that plant and further treats it to State of California Title 22 recycled water quality standards and then delivers this water to customers for irrigation and certain industrial uses. This effort reduces the amount of wastewater that would normally be released by the wastewater treatment plant into the ocean outfall, reduces dependence on imported drinking water, and provides customers with a reliable local supply of water for non potable purposes. Recycled water is not subject to state water conservation requirements.
Other Personnel Expenses 48,125 4,712 57,315 63,152 Personnel Services Subtotal 1,467,921 1,555,318 1,840,055 1,918,283
• Test water quality, cross connections and backflows
SERVICES
D 30
Performance Measure
Pipeline breaks per 100 miles of pipe 0 <3.4 <3.4
• Convert sites from potable water to recycled water as service becomes available
• Began implementation of the 2019 Recycled Water Master Plan
RECENT ACCOMPLISHMENTS
• Deliver recycled water
• Perform annual backflow tests at 278 sites and 619 recycled use site walk through inspections
• Meet health, safety and environmental regulations of recycled water
• Completed design of the new Supervisory Control and Data Acquisition system
GOALS
• Stay within industry benchmark for water main breaks of3.4 to 19.4 breaks per 100 miles of pipeline, per the American Water Works Association
• Commence construction of a 1.5 million gallon storage tank
• Operate and maintain infrastructure, including the Carlsbad Water Recycling Facility, reservoirs, pressure regulating stations, pump stations, pipelines, valves and meters
• Maintain recycled water cost at or below 75% of potable water cost
• Conducted pre build activities for the recently completed design of a 1.5 million gallon storage tank, and applied approximately $900,000 grant from the U.S. Bureau of Reclamation towards its funding
• Complete Segment 5 retrofit conversions and connect customers to the expanded system
• Completed cost of service study updates and received guidance from the CMWD Board on three years of future rates
• Connected 25 customers to the new recycled pipeline segment
• Treat wastewater to meet State of California Title 22 recycled water requirements
FYActual2021 FY Estimated2022 FY Projected2023
Cost of recycled water as percent of potable water cost 71% 71% 73%
• Collect wastewater and convey it to the Encina Wastewater Authority treatment plant
Salaries & Wages 1,540,377$ 1,535,784$ 1,946,772$ 2,049,063$ Retirement Benefits 368,192 557,172 425,987 498,188 Health Insurance 249,036 236,007 320,685 335,653
Full Time Positions 19.60 19.45 20.10 20.80 Hourly/FTE Positions 0.00 0.00 0.20 0.00
UTILITIES: WASTEWATER OPERATIONS
SERVICES
Interdepartmental Charges 1,303,706 1,395,257 1,458,895 1,519,845
Professional & Contract Services 3,716,816 4,398,529 5,514,000 5,990,323 Supplies & Materials 237,997 330,387 353,000 621,137 Repair & Maintenance 18,443 76,938 225,150 151,700
Capital Outlay 53,586 28,987 9,750 Operating Expenses Subtotal 10,638,087 10,907,660 13,278,645 14,018,695
PUBLIC WORKS |
• Operate and maintain infrastructure such as lift stations, wet wells, gravity sewer mains, force mains, manholes and other elements
Account: 5116310
Fund: Enterprise
D 31
Personnel Services Subtotal 2,866,573 2,145,547 2,778,828 2,980,873
2019-20Actual 2020-21Actual 2021-22Budget 2022-23Budget
TOTAL EXPENDITURES 13,504,660$ 13,053,207$ 16,057,473$ 16,999,568$
• Meet health, safety and environmental regulations of wastewater operation
• Conduct closed circuit camera review of pipelines to determine pipeline integrity
ABOUT
The Utilities Department is responsible for providing wastewater services to approximately 85,000 customers within the city’s service area. The Wastewater Division provides reliable wastewater collection services and delivers wastewater to the Encina Wastewater Authority’s treatment plant. After treatment, the water is further treated to state Title 22 recycled water standards at the Carlsbad Municipal Water District’s Water Recycling Facility and then delivered as recycled water to customers for irrigation and certain industrial uses, reducing the amount that reaches the ocean outfall. The Wastewater Division maintains a sanitary sewage collection system that includes 11 wastewater lift stations and wet wells and about 265 miles of mainlines and 6,056 access holes. The department implements a robust wastewater asset management program to minimize the total cost of owning and operating utility assets while continuing to deliver high levels of service at acceptable levels of risk
Personnel Services
Other Personnel Expenses 708,968 (183,416) 85,384 97,969
Operating Expenses
Other Operating Expenses 5,307,539 4,677,562 5,727,600 5,725,940
• Initiate the design of upgrades at two sewer lift stations
• Conduct public outreach regarding what can go into drains to prevent spills other issues
• Coordinate with the Encina Wastewater Authority as part of the Encina Joint Powers Authority
• Began implementation of the recently completed Sewer Master Plan
• Constructed the $5.5 million Foxes Landing Lift Station Replacement project
• Completed design of the new SCADA system
• Started construction of the Villas Lift Station Replacement project
• Meet or exceed the American Water Works Association benchmark rate for combined utilities for wastewater system reliability of 0.2 to 7.0 overflows per 100 miles of pipeline
• Complete the generator replacement project at two additional lift stations for system reliability where the existing generators have met the end of their useful life
• Awarded $4.6 million in low interest financing with the State Revolving Fund for the wastewater portion of the SCADA project
• Average less than 0.38 spills per 100 miles of pipe
• Completed closed circuit camera inspections of several large diameter interceptor sewers that convey wastewater from collector pipelines to the Encina Wastewater Authority treatment facility to assess their integrity
• Update the cost of services study and present updated rates to the City Council
Department goal for amount of sewer pipe cleaned per year 93% 95% 100%
• Completed cost of service study updates and received guidance from the CMWD Board on three years of future rates
• Completed analysis of the North Batiquitos Lift Station force main
• Clean sewer pipe in line with the department’s preventive maintenance schedule
• Initiate the design of upgrades at two sewer lift stations
Performance Measure FYActual2021 FY Estimated2022 FY Projected2023
GOALS
Rate of spills per 100 miles of pipe 0 <0.38 <0.38
RECENT ACCOMPLISHMENTS
• Prevent wastewater spills to protect the environment
D 32
• Administer city’s Fats, Oils, and Grease program
• Community Development

• Housing & Homeless Services
These city service areas ensure the city’s planning and building policies are carried out, foster lifelong learning, support strong neighborhoods, administer affordable housing and homeless response programs, attend to the community’s health and wellness, and promote transparency in government.
442 339 gary.barberio@carlsbadca.gov2822
E 1
COMMUNITY SERVICES
• Real Estate
Gary DeputyBarberioCityManager, Community Services
• Parks & Recreation
The Community Services Branch includes programs, services and events that support Carlsbad's excellent quality of life. The branch includes the following key areas of focus:
• Library & Cultural Arts

RECENT ACCOMPLISHMENTS
• Launched an online scheduling tool that allows residents to schedule appointments remotely and the Customer Self Service portal to allow for online submission of basic permits
• Developed informational bulletins to help the public understand complex land use issues
• Issued over 4,700 building permits valued at over $132 million and completed over 18,000 building inspections
ABOUT
Salaries & Wages $ 446,413$ 394,529$ 421,382$ Retirement Benefits 93,183 95,454 104,509 Health Insurance 58,369 66,574 60,862 Other Personnel Expenses 10,862 14,055 15,275 Personnel Services Subtotal 608,827 570,612 602,028
Full Time Positions 0.00 3.00 3.00 3.00 Hourly/FTE Positions 0.00 0.00 0.00 0.00
COMMUNITY SERVICES ADMINISTRATION|
Account: 0012410
TOTAL EXPENDITURES $ 654,001$ 656,221$ 675,917$
2019-20Actual 2020-21Actual 2021-22Budget 2022-23Budget
SERVICES
Functional areas include department management, budget oversight, and real estate services. The Community Services branch ensures that the city’s planning, land development engineering, building, and code enforcement policies are carried out, that affordable housing and homelessness programs are administered, that lifelong learning is fostered, that library and cultural arts services are delivered, that the city’s health and wellness are advanced through parks, recreation and senior services, and that the city’s real estate assets are well managed.
Fund: General
E 3
The Community Services Branch provides programs and services that promote and support Carlsbad’s excellent quality of life. Community Services Administration provides leadership to the Community Services branch.
Operating Expenses Professional & Contract Services 13,319 26,500 19,400 Supplies & Materials 14 9,600 4,850 Repair & InterdepartmentalMaintenanceCharges 30,900 38,509 43,639
Other Operating Expenses 941 11,000 6,000 Capital Outlay Operating Expenses Subtotal 45,174 85,609 73,889
Personnel Services
• Closed over 1,266 code enforcement cases
• Served over 700 individuals at risk or experiencing homelessness, placed over 40 individuals in shelters and over 40 individuals in permanent housing, completed over 30 encampment clean ups and provided monthly rental assistance to 550 lower income households
• Added over 500 trees to the city’s tree inventory
• Complete comprehensive update of the city’s Real Estate Strategic Plan
• Receive City Council approval of Veterans Memorial Park Master Plan
• Complete design for technology upgrades at Schulman Auditorium and Cannon Art Gallery
• Complete new Civic Center site selection process
E 4
• Implemented a new Code Enforcement Case Prioritization and Process Guide and developed specific key performance indicators based on internal audit recommendations
• Updated Inclusionary Housing City Council Policies and the Inclusionary Housing In lieu fee
• Continue to identify and implement process improvements that help simplify and streamline development permit intake, routing, and customer service interactions
• Provided $5.25 million from the Housing Trust Fund to three affordable housing projects
• Install public art at the Learning Center, New Village Arts Theatre and Fire Station 2
• Obtain reaccreditation from the Commission for the Accreditation of P&R Agencies
• Complete Phase I work with City Council appointed citizen’s committee for Growth Management Program Update
• Issued over 1,131 engineering permits and completed over 2,059 permit reviews
GOALS
• Complete objective design standards citywide and in the Village & Barrio Master Plan
• Opened Buena Vista Reservoir Park and upgraded Calavera Hills Community Park Gateway
• Obtained approval of Local Coastal Program Update from City Council
• Updated City Council Policy No. 64 Wireless Communication Facilities
• Upgraded the library’s patron, materials management and materials handling systems
• Update the city’s building codes to comply with new state building code, by January 2024 and implement an automated solar permitting platform consistent with Senate Bill 379
• Completed new Lease and Construction & Reimbursement Agreement for New Village Arts
• Provide 25 new rental vouchers for non elderly, disabled participants
• Complete the Parks & Recreation Master Plan Update
• Completed an update and expansion of the city’s Memorial Program
• Assess library hours of service and optimize them to meet changing needs of the community
• Update the city’s grading ordinance
• Add 500 new trees to the city’s tree inventory
• Completed the sale of 11 city owned dwelling units to lower income households
• Renewed License Agreements with Verizon at Maerkle and La Costa High Reservoirs
• Update the city’s Homeless Response Plan
• Completed new Lease Agreements for Mira Costa and Callaway Golf
• Presented three author visits and four exhibits and guest artists in the Cannon Art Gallery
• Implement a building inspection self certification program allowing individuals to self certify
• Implement code enforcement audit recommendations, including a procedural manual, training program and streamlined online tracking system
• Release RFP for disposition of the Foussat & Mission Property in Oceanside and Golf Course Lots 4 and 5
General Fund 10,328,444$ 10,715,350$ 10,502,061$ 10,384,700$ Special Revenue Fund 11,580,003$ 15,127,464$ $ $
Operating Expenses
Personnel Services Subtotal 7,937,307 8,747,521 7,744,817 7,968,646
Salaries & Wages 5,652,228$ 5,777,438$ 5,429,177$ 5,603,577$ Retirement Benefits 1,294,082 1,991,612 1,224,663 1,262,610 Health Insurance 756,976 806,470 869,369 873,634
SERVICES |
E 5
Personnel Services
Other Operating Expenses 9,074,710 9,635,563 35,050 25,450
TOTAL EXPENDITURES 22,307,044$ 26,082,716$ 10,502,061$ 10,384,700$
COMMUNITY DEVELOPMENT • Administration • Land Development Engineering • Planning • Building • Code Enforcement
Operating Expenses Subtotal 14,369,737 17,335,195 2,757,244 2,416,054
Other Personnel Expenses 234,021 172,001 221,608 228,825
TOTAL FUNDING 21,908,447$ 25,842,814$ 10,502,061$ 10,384,700$
COMMUNITY DEVELOPMENT: SUMMARY
Summary level figures presented above for 2019 20 and 2020 21 actuals include divisions now organized under the department Housing & Homeless Services, formed in 2021 22.
2019-20Actual 2020-21Actual 2021-22Budget 2022-23Budget
Professional & Contract Services 2,531,666 1,927,057 1,526,910 955,683 Supplies & Materials 309,712 278,436 104,287 97,114
Capital Outlay 1,107,230 4,213,749
COMMUNITY
Repair & Maintenance 593 65 370 370
Interdepartmental Charges 1,345,826 1,280,325 1,090,627 1,337,437
Full Time Positions 63.75 61.75 53.00 52.00 Hourly/FTE Positions 12.00 12.00 9.00 9.00
ABOUT
• Provide organizational leadership and administrative support
Operating Expenses Subtotal 349,075 320,916 589,703 424,197
TOTAL EXPENDITURES 1,498,084$ 1,574,963$ 1,863,721$ 1,748,987$
Personnel Services Subtotal 1,149,009 1,254,047 1,274,018 1,324,790
2019-20Actual 2020-21Actual 2021-22Budget 2022-23Budget
Interdepartmental Charges 143,904 211,596 168,149 341,090
Account: 0013010 0013012 Fund: General
• Manage contract administration and records
E 6
Health Insurance 117,598 112,639 126,259 140,799 Other Personnel Expenses 27,384 22,528 35,163 35,967
Operating Expenses
• Manage and oversee operating budget
• Support in managing the department’s business systems and technology
COMMUNITY SERVICES |
Personnel Services
Professional & Contract Services 122,679 63,921 385,000 35,000 Supplies & Materials 58,876 44,160 31,834 44,387 Repair & Maintenance 20 20
Other Operating Expenses 23,616 1,239 4,700 3,700 Capital Outlay
Full Time Positions 7.00 6.45 7.00 7.00 Hourly/FTE Positions 3.00 2.50 2.50 1.00
Community Development Administration provides leadership, financial assistance, and administrative support for the delivery of land development programs and services; plans for the efficient use of resources and facilities; and provides liaison services, resource assistance and technical guidance to the Planning Commission and City Council. Community Development Administration adds value to organizational processes and procedures to ensure best practices are instituted and support the broader goals of the organization.
SERVICES
Salaries & Wages 812,622$ 842,027$ 910,113$ 925,334$ Retirement Benefits 191,405 276,853 202,483 222,690
COMMUNITY DEVELOPMENT: ADMINISTRATION
• Continue to identify and implement process improvements that help simplify and streamline permit intake, routing, and customer service interactions
• Overhauled intranet site with updated content and improved organization/resources
RECENT ACCOMPLISHMENTS
• Assisted divisions in launching customer service programs such as Customer Self Service Portal and Qless
E 7
• Digitize building plan prints and project files to make them available to the public
• Developed a series of informational bulletins to help the public understand complex land use issues
• Engage staff in an electronic review pilot program
• Continue to modernize and streamline front counter operations
• Expand use of the Customer Self Service Portal
GOALS
SERVICES
ABOUT
• Maintain the engineering section of the public counter
2019-20Actual 2020-21Actual 2021-22Budget 2022-23Budget
Retirement Benefits 253,568 389,669 268,090 292,107
Operating Expenses
COMMUNITY DEVELOPMENT: LAND DEVELOPMENT ENGINEERING
• Changed process to allow digital submittals of right of way permit applications
Other Personnel Expenses 40,244 33,239 46,266 51,404 Personnel Services Subtotal 1,584,446 1,752,410 1,669,303 1,783,321
E 8
Professional & Contract Services 398,335 246,079 375,183 220,183 Supplies & Materials 7,657 3,812 6,644 4,400 Repair & InterdepartmentalMaintenanceCharges 173,578 147,116 227,280 228,275
Salaries & Wages 1,122,452$ 1,144,984$ 1,149,631$ 1,222,160$
Account: 00131200013110
• Perform plan checking and permitting for grading, public improvement and right of way projects
• Provide flood plain administration and residential assistance
• Provide customer service and effective public information
• Implemented policies for state required capture of trash for new developments
Health Insurance 168,182 184,518 205,316 217,650
TOTAL EXPENDITURES 2,168,553$ 2,152,616$ 2,287,110$ 2,240,879$
• Initiated the Customer Self Service portal to process temporary water meter permits
• Performed 2,059 reviews for ministerial and discretionary permits
Personnel Services
Fund: General
The Land Development Engineering Division ensures that all grading and public improvements required for new development projects and work in the public right of way comply with adopted codes and engineering standards.
COMMUNITY SERVICES
|
RECENT ACCOMPLISHMENTS
• Conduct transportation impact review and analysis for development projects
Full Time Positions 11.75 11.00 11.00 11.00 Hourly/FTE Positions 0.50 1.00 1.00 1.50
• Issued 1,131 engineering permits
Other Operating Expenses 4,537 3,199 8,700 4,700 Capital Outlay Operating Expenses Subtotal 584,107 400,206 617,807 457,558
• Review and process requests to subdivide land
E 9
Performance Measure
GOALS
• Expand implementation of the Customer Self Service portal to allow processing of additional permit types, such as right of way permits
FYActual2021 FY 2022 Estimated FY Projected2023
Discretionary permit plan check reviews completed within 21 days of submittal 70% 66% 68%
Building permit plan check reviews completed within 14 days of submittal 89% 84% 85%
• Implement measures to reduce the time it takes to conduct discretionary plan check review, with the goal of completing 80% of discretionary plan check reviews within 21 days
• Update the city’s grading ordinance to clarify inconsistencies and memorialize current practices
• Maintain current building permit plan check review completion rate of at least 80% within 14 days
• Continue to refine procedures and adopt new technology to enhance the customer experience
• Test and choose a system for digital large format plan review
Other Personnel Expenses 68,473 54,340 79,500 86,973
SERVICES
2019-20Actual 2020-21Actual 2021-22Budget 2022-23Budget
COMMUNITY SERVICES |
• Maintain and modify plans, ordinances, and policies for the long range development and sustainability of the city
• Ensure new development adheres to all applicable land use codes, policies, and regulations
Professional & Contract Services 511,134 552,889 216,000 201,000 Supplies & Materials 49,774 36,511 36,282 32,650 Repair & Maintenance 20 5
Personnel Services
Health Insurance 208,537 219,870 261,994 268,185
General Fund 3,354,114$ 3,614,495$ 3,341,163$ 3,495,512$ Special Revenue 2,058,401 16,961
TOTAL EXPENDITURES 5,412,515$ 3,631,456$ 3,341,163$ 3,495,512$
Retirement Benefits 430,218 650,335 457,191 493,486
Operating Expenses
Full Time Positions 20.00 20.00 20.00 20.00 Hourly/FTE Positions 0.50 1.00 1.00 1.50
• Continuously enhance permit review process for efficiencies and implement streamlined permitting processes
Other Operating Expenses 977,793 21,284 11,400 11,400
Capital Outlay 1,104,114
• Provide technical support to the Planning Commission and the City Council
E 10
• Complete environmental review of all private and public projects for compliance with the California Environmental Quality Act and the city’s Environmental Protection Procedures
• Respond to questions and inquiries related to permit processing and development standards
Interdepartmental Charges 299,619 260,976 313,059 360,431
The Planning Division is responsible for updating and maintaining the city’s land use regulations (i.e., General Plan, Local Coastal Program, and Zoning Ordinance) pursuant to City Council direction and state mandates as well as ensuring new growth and development complies with those established regulations.
Operating Expenses Subtotal 2,942,454 871,665 576,741 605,481
Account: 00132XX Fund: General ABOUT
Salaries & Wages 1,762,833$ 1,835,246$ 1,965,737$ 2,041,387$
Personnel Services Subtotal 2,470,061 2,759,791 2,764,422 2,890,031
TOTAL FUNDING 5,412,515$ 3,631,456$ 3,341,163$ 3,495,512$
COMMUNITY DEVELOPMENT: PLANNING
• Complete permit ready accessory dwelling unit plans
Performance Measure
• Work with the City Council appointed Growth Management Citizens Committee to develop recommendations to update the current Growth Management Plan
FYActual2021 FY Estimated2022 FY Projected2023
RECENT ACCOMPLISHMENTS
• Coordinate with California Coastal Commission staff in their review of the city’s application for a Comprehensive Local Coastal Program Amendment
• Entitled 696 residential housing units, of which 116 are dedicated affordable to lower income families
• Finalized new Wireless Communications Facilities Amendments policy, which was approved by City Council
• Implement measures to reduce the time it takes to conduct discretionary permit plan check reviews to meet target of 100% of reviews completed within 30 days
GOALS
• Implement measures to reduce the time it takes to conduct building permit plan check reviews to meet target of 80% of reviews completed within 14 days
Building permit plan check reviews completed within 14 days of submittal 79% 71% 75%
• Completed Comprehensive Local Coastal Program Amendment, which was approved by City Council
• Complete environmental review and present Housing Element maps for City Council consideration
• Present Objective Design Standards inside and outside Village & Barrio Master Plan for City Council consideration
E 11
• Conducted public engagement activities and gathered input on Housing Element Update Site Selection, from which the City Council endorsed two maps for further environmental review
• Draft master plan amendments to conditionally permit Farmers Markets and Cultural Arts in the Barrio and add a policy encouraging development of vital uses as part of the Village & Barrio Master Plan
• Updated inclusionary housing policy and adjusted in lieu fee
Discretionary permit plan check reviews completed within 30 days of submittal 90% 89% 90%
• Respond to questions and inquiries related to permit processing and construction standards
Capital Outlay
Account: 0013610
• Maintain records during construction and prepare files for electronic conversion following final approval
• Provide information related to ongoing construction projects and historical building records
2019-20Actual 2020-21Actual 2021-22Budget 2022-23Budget
Fund: General
COMMUNITY DEVELOPMENT: BUILDING
Operating Expenses Subtotal 737,767 605,495 755,776 726,401
SERVICES
• Perform plan check, fee assessment, permit issuance and inspection for compliance with adopted state and local codes including recycling, stormwater, energy generation and conservation
Operating Expenses
Personnel Services
Personnel Services Subtotal 1,055,697 1,201,644 1,275,388 1,333,797
Professional & Contract Services 479,657 386,470 483,727 449,000 Supplies & Materials 2,430 3,233 7,077 4,127 Repair & Maintenance 313 23 250 250 Interdepartmental Charges 245,993 214,733 260,022 270,324
TOTAL EXPENDITURES 1,793,464$ 1,807,139$ 2,031,164$ 2,060,198$
Health Insurance 138,278 150,355 189,642 164,413
COMMUNITY SERVICES |
Other Operating Expenses 9,374 1,036 4,700 2,700
Full Time Positions 8.00 10.00 10.00 10.00 Hourly/FTE Positions 0.00 1.00 1.00 1.50
The Building Division staff are the main point of contact for individuals wanting to build or modify a structure on their property. Building staff provide guidance and review projects for conformance with state and local building standards. Once a permit has been issued to authorize construction, a building inspector is assigned to help the property owner ensure that the contractor’s work is consistent with approved plans.
Salaries & Wages 719,434$ 760,441$ 853,484$ 925,249$ Retirement Benefits 167,323 267,350 195,472 203,191
ABOUT
E 12
Other Personnel Expenses 30,662 23,498 36,790 40,944
RECENT ACCOMPLISHMENTS
E 13
• Expand the video inspection program to include more types of permits
• Achieved 100% State of California Safety Assessment Program Certification for all building inspection staff
• Launched the Customer Self Service portal for online permit submission of basic permits
• Update the city’s building code and standards to comply with new state building code by January 2024
• Implement an automated solar permitting platform consistent with Senate Bill 379 that will allow applicants to apply for and receive an approved residential building permit for solar systems up to 38.4 kW in real time
• Reduce transition time between staff processing and consultant plan check review, with goals of completing 80% of building permit plan check reviews within 14 days of submittal and 80% of building inspections within 24 hours of request
• Launched an online scheduling tool that allows residents to schedule an appointment from home or work
Performance Measure
FYActual2021 FY 2022 Estimated FY Projected2023
• Joined the California Building Officials and the International Code Council as a government member
Building permit plan check reviews completed within 14 days of submittal 66% 61% 62%
GOALS
• Finalize implementation of the inspection self certification program that will allow qualified individuals to self certify installation of minor improvements
• Conducted over 18,000 building inspections
Building inspections completed within 24 hours of request 100% 90% 95%
• Issued over 4,700 building permits valued at over $132 million
• Created website content for the city’s Mobile Home Park Program
• Maintain a high level of service with a focus on creating more efficient processes related to permit and building inspection self service, online records research and online project plan submittal
Retirement Benefits 70,183 131,233 101,427 51,136
• Ensure that residents are aware and follow rules on short term vacation rentals
Health Insurance 41,740 62,771 86,158 82,587
Other Personnel Expenses 20,546 15,270 23,889 13,537
Personnel Services Subtotal 502,813 696,634 761,686 636,707
Operating Expenses
Other Operating Expenses 16,076 4,526 5,550 2,950 Capital Outlay
Operating Expenses Subtotal 49,068 52,645 217,217 202,417
Full Time Positions 2.00 5.00 5.00 4.00 Hourly/FTE Positions 1.00 3.50 3.50 3.50
COMMUNITY DEVELOPMENT: CODE ENFORCEMENT
Interdepartmental Charges 17,998 23,641 122,117 137,317
TOTAL EXPENDITURES 551,881$ 749,279$ 978,903$ 839,124$
The Code Enforcement Division, working with residents and its partner enforcement agencies, is tasked with enforcing the city’s laws that govern land use and quality of life issues, including public nuisances, safety, and welfare. The purpose of these laws, and their enforcement, is to help maintain safe and healthy living and working conditions for the members of the community. The Division’s approach is not to be punitive, but to first attempt to achieve compliance with established codes and regulations through education before more formal enforcement methods like citations are applied.
Professional & Contract Services 11,049 17,416 67,000 50,500 Supplies & Materials 3,910 7,048 22,450 11,550 Repair & Maintenance 35 14 100 100
Account: 0013620
• Collaborate with partner enforcement agencies on overlapping enforcement cases
COMMUNITY SERVICES
SERVICES
2019-20Actual 2020-21Actual 2021-22Budget 2022-23Budget
Personnel Services
Salaries & Wages 370,344$ 487,360$ 550,212$ 489,447$
• Conduct inspections of alleged violations received from resident and business complaints
|
Fund: General ABOUT
E 14
• Enforce zoning, building, general property maintenance, and other municipal codes
• Assist individuals on how to secure required permits and/or obtain compliance with applicable codes
• Completed an audit of the division operations that identified specific opportunities that will improve operational processes
E 15
Performance Measure
• Develop a training program with a dedicated trainer to ensure code enforcement staff are consistently up to date on current responsibilities and expectations in response to an internal audit recommendation
SIGNIFICANT CHANGES IN THIS YEAR’S BUDGET
Percent of Category 3 cases closed within 50 businesses days of complaint New* New* 80%
• Developed specific key performance indicators that will start July 1
• Close Category 2 nuisance & blight causing conditions cases within 30 businesses days of complaint at least 80% of the time
• Develop and implement an online tracking system that simplifies the tracking of case processing timelines, as reflected in the Code Enforcement Case Prioritization and Process Guide in response to an internal audit recommendation
• Closed at least 1,266 cases, based on data as of April 2022
• Close Category 1 unsafe & hazardous conditions cases within three businesses days of complaint at least 80% of the time
• Develop a procedural manual to serve as both a training and operations resource guide for staff in response to an internal audit recommendation
• Became a stand only division within the Community Development Department
Percent of Category 1 cases closed within three businesses days of complaint New* New* 80%
*Fiscal year 2021 22 Internal Audit Plan was recently completed for the division. These are the recommended indicators for future years.
RECENT ACCOMPLISHMENTS
• Established the Code Enforcement Division separate from the Building Division within the Community Development Department
• Close Category 3 miscellaneous violation conditions cases within 50 businesses days of complaint at least 80% of the time
Percent of Category 2 cases closed within 30 businesses days of complaint New* New* 80%
• Developed and implemented the Code Enforcement Case Prioritization and Process Guide
GOALS
FYActual2021 FY Estimated2022
FY Projected2023
2019-20Actual 2020-21Actual 2021-22Budget 2022-23Budget
Professional & Contract Services 5,349,009 1,747,672 Supplies & Materials 233,726 261,642 Repair & Maintenance 300 300 Interdepartmental Charges 394,779 566,690
Other Personnel Expenses 53,556 68,761 Personnel Services Subtotal 1,969,955 2,365,011
General Fund $ $ 5,901,431$ 3,134,115$ Special Revenue Fund 10,018,926$ 12,009,918$ Trust Fund 1,067,495$ 1,068,845$
HOUSING & HOMELESS SERVICES
TOTAL FUNDING $ $ 16,987,852$ 16,212,878$
Summary level figures presented above for 2019 20 and 2020 21 actuals exclude divisions formerly organized under the department Community Development, as Housing & Homeless Services was formed in 2021 22.
HOUSING & HOMELESS SERVICES: SUMMARY
Full Time Positions 0.00 0.00 14.00 16.00 Hourly/FTE Positions 0.00 0.00 3.00 1.81
• Housing Services • Homeless Services • Affordable Housing Programs • Federally Funded Community Assistance Programs • Successor Agency
Personnel Services
|
Other Operating Expenses 8,920,286 11,266,663
E 16
COMMUNITY SERVICES
Salaries & Wages $ $ 1,456,081$ 1,654,810$ Retirement Benefits 250,032 377,017 Health Insurance 210,286 264,423
Operating Expenses
Capital Outlay 119,797 4,900 Operating Expenses Subtotal 15,017,897 13,847,867
TOTAL EXPENDITURES $ $ 16,987,852$ 16,212,878$
SERVICES
Account: 171150281000125200012510
Operating Expenses Subtotal 482,614 408,306 530,920 574,610
Other Personnel Expenses 10,601 8,467 17,716 26,578
Operating Expenses
Retirement Benefits 45,369 145,286 79,104 149,968
HOUSING & HOMELESS SERVICES: HOUSING SERVICES
Health Insurance 40,415 28,982 49,242 81,024
Professional & Contract Services 310,572 267,595 358,217 339,217 Supplies & Materials 16,079 8,454 13,600 13,600 Repair & Maintenance 110 14
Other Operating Expenses 3,452 527 37,527 53,777
Interdepartmental Charges 152,401 131,716 121,576 168,016
• Provide community education programs, including the Carlsbad Student Leader Academy for high school students and CityStuff for third grade students
ABOUT
Personnel Services Subtotal 479,734 408,552 606,725 939,430
• Through the Agricultural Conversion Mitigation Fee program, fund projects that improve agricultural lands for continued agricultural production, protect and enhance the coastal and lagoon environment, improve lagoon nature centers, and restore beaches for public use
• Provide financial assistance to community organizations, teams and special events that benefit and enrich residents in compliance with City Council policies
TOTAL FUNDING 962,348$ 816,858$ 1,137,645$ 1,514,040$
TOTAL EXPENDITURES 962,348$ 816,858$ 1,137,645$ 1,514,040$
The Housing Division provides various programs, activities and services that assist in the effort to sustain an extraordinary Carlsbad community. These include disbursing community grants, delivering community education programs, funding the Carlsbad Service Center and supporting the Carlsbad Housing Commission.
Full Time Positions 8.78 3.78 4.50 5.17 Hourly/FTE Positions 5.50 2.00 2.00 0.83
E 17
Fund: SpecialGeneralGeneralRevenue
2019-20Actual 2020-21Actual 2021-22Budget 2022-23Budget
General Fund 962,348$ 816,858$ 1,107,645$ 1,484,040$ Special Revenue 30,000 30,000
Personnel Services
Community Grants
Capital Outlay
COMMUNITY SERVICES |
Salaries & Wages 383,349$ 225,817$ 460,663$ 681,860$
Special Revenue Agriculture Mitigation Fee
• Provide technical and administrative support to the Carlsbad Housing Commission
• Commenced the Carlsbad Student Leader Academy in spring 2021 with 20 high school student participants
• Implemented alternative options to all classrooms participating in the CityStuff program to offer the curriculum online and provide additional virtual assistance for third grade students in 54 classrooms in partnership with 14 local elementary schools in response to COVID 19
E 18
• Continue to support the Carlsbad Service Center
• Provide community education to 54 classrooms
• Facilitated affordable housing projects: 419 dwelling units affordable to moderate, low, very low, and extremely low households are either under construction, approved and pending construction, or are currently moving through the permit approval process
GOALS
• Increase the amount of community grants dispersed to $5,000
• Implement the Community Activity Grant, Special Events Grant, Community Spirit Grant, and Winning Teams Grant programs, and process applications for assistance that are consistent with City Council policies
• Continue to support the Agricultural Conversion Mitigation Fee program
• Provide low income and homeless services support, including funding to the Carlsbad Services Center, which offers temporary day labor employment services, employment training and readiness, access to benefits, basic needs, rental assistance and case management
FYActual2021
• Provide technical and administrative support to the Carlsbad Housing Commission
• Provide education focused on civic proficiency and leadership to Carlsbad youth
Performance Measure
FY Estimated2022 FY Projected2023
Classrooms educated 54 54 54
• Completed marketing of interest list for Affordable Resale Program for 11 city owned condos in Bressi Ranch
RECENT ACCOMPLISHMENTS
• Administer the Minor Home Repair Program, which provides forgivable home repair loans to low income households who own and occupy their home as their primary residence
Community Grants dispersed $6,000 $3,500 $5,000
Operating Expenses
TOTAL EXPENDITURES $ $ 4,793,786$ 1,650,075$
• Oversee the Homeless Outreach and Case Management contract with Interfaith Community Services
• Offer short term emergency boarding for animals of a person experiencing homelessness within the city via contract services
Fund: General
Personnel Services Salaries & Wages $ $ 499,799$ 463,317$ Retirement Benefits 60,528 116,301 Health Insurance 86,630 80,283 Other Personnel Expenses 14,034 18,757 Personnel Services Subtotal 660,991 678,658
• Coordinate with neighboring jurisdictions and county resources on regional issues related to homelessness
COMMUNITY SERVICES
• Provide housing navigation services for persons at risk of or experiencing homelessness in the city
Professional & Contract Services 4,098,295 889,500 Supplies & Materials 19,250 16,250 Repair & InterdepartmentalMaintenanceCharges 62,417
|
The Homeless Services Division is responsible for leading all strategies, programs and initiatives related to the city’s goal of reducing homelessness, including the city’s adopted Homeless Response Plan. This division uses best practices, community input and consumer feedback to implement solutions to prevent and reduce homelessness.
Full Time Positions 0.00 0.00 3.50 4.00 Hourly/FTE Positions 0.00 0.00 0.00 0.00
• Manage and implement the city’s Homeless Response Plan
HOUSING & HOMELESS SERVICES: HOMELESS SERVICES
SERVICES
• Manage a rapid rehousing contract with Community Resource Center that helps individuals and households at risk of or experiencing homelessness within the city
• Oversee the contract with Urban Corps for citywide abandoned items and litter removal services related to homeless encampments
2019-20Actual 2020-21Actual 2021-22Budget 2022-23Budget
ABOUT
Other Operating Expenses 15,250 3,250 Capital Outlay Operating Expenses Subtotal 4,132,795 971,417
E 19
Account: 0012540
• Engage with community residents and businesses through regular communication efforts
• Formed a new Housing and Homeless Services Department
E 20
• Worked with the Police Department to implement new municipal code tools to provide enforcement in a compassionate manner
• Served 605 individuals at risk or experiencing homelessness in the city via Interfaith Community Services and the Homeless Outreach Team, providing 3,025 outreach contacts and helping 99 people get bridged to shelter, substance use or mental health treatment
• Implemented a new contract with Community Resource Center to implement a rapid rehousing program for households currently experiencing homelessness in the city
• Contract for an employment and benefit specialist who will be able to help connect people to disability and social security benefits, general relief, CalWORKS, CalFresh, Veteran benefits, stimulus checks, employment programs, and other aid programs
FYActual2021 FY Estimated2022 FY Projected2023
*CDC guidance limited encampment cleanup for most of 2021 due to COVID 19
• Began work on the City Council approved work plan to reduce the homeless unsheltered population, among those who want help, by 50% within five years
• Update the city’s Homeless Response Plan
• Reduce the homeless unsheltered population, among those who want help, by 50% within five years, with quarterly reports until the city decreases the unsheltered homeless population or five years as directed by the City Council
• Enter into an agreement with Catholic Charities to hire two licensed clinicians to provide staff at the La Posada de Guadalupe Emergency Shelter with training, in order for the facility to operate as a low barrier shelter
RECENT ACCOMPLISHMENTS
Performance Measure
• Enrolled the city into the Homeless Management Information System as a participating agency through the Regional Task Force on the Homeless
Unduplicated homeless persons served 605 700 700 Shelter placements 49 110 120 Persons housed 13 40 40 Encampments cleared 10* 30 30
GOALS
Other Operating Expenses 223,304 148,765 145,509 181,001
E 21 COMMUNITY SERVICES |
Health Insurance 14,973 8,095 7,600 15,956
The city is a regional leader in the provision of affordable housing. The Affordable Housing Trust Fund Program is the city’s primary source of affordable housing funding for low income households. The Affordable Housing Trust Fund collects fees generated from the Inclusionary Housing In Lieu Fee and the sale of affordable housing credits that satisfy a developer’s inclusionary housing obligation as well as loan repayments from existing developments. With these funds, the city provides affordable housing programs and low income and homeless services support, and financial assistance for residential developments that provide housing opportunities to low income households. The city also owns Tyler Court Senior Apartments, a 75 unit senior apartment complex. This complex provides for 100% affordable housing to senior households with incomes at 30% and 50% of the San Diego County Area median incomes. The city has an agreement with a third party to manage the day to day operations of the apartment complex. The property is intended to remain a senior only development according to its approved conditional use permit and continues to have income and rent restrictions to be affordable to very low and extremely low income households
Capital Outlay 3,116 4,213,749 119,797 2,900 Operating Expenses Subtotal 1,126,602 4,999,420 1,310,750 850,542
Salaries & Wages 173,859$ 102,028$ 111,395$ 53,332$ Retirement Benefits 40,313 36,004 17,886 11,645
HOUSING & HOMELESS SERVICES: AFFORDABLE HOUSING PROGRAMS
ABOUT
Professional & Contract Services 599,068 350,465 794,497 377,955 Supplies & Materials 153,034 158,521 186,711 217,627 Repair & InterdepartmentalMaintenanceCharges 148,080 127,920 64,236 71,059
TOTAL EXPENDITURES 1,365,196$ 5,148,834$ 1,452,184$ 934,101$
Personnel Services
Personnel Services Subtotal 238,594 149,414 141,434 83,559
Fund: Special Revenue Affordable Housing Trust
Operating Expenses
2019-20Actual 2020-21Actual 2021-22Budget 2022-23Budget
Full Time Positions 1.30 0.60 0.60 0.80 Hourly/FTE Positions 1.00 1.00 1.00 0.06
Special Revenue Tyler Court Apartments
Account: 806134133
Other Personnel Expenses 9,449 3,287 4,553 2,626
• Continue to implement the Inclusionary Housing Ordinance by providing information to developers, the public, and city staff on the requirements of the ordinance
• Research and develop other programs and development opportunities to increase the supply of affordable housing for low income households
• Worked with Community Development Department to provide amendments to the Inclusionary Housing Program, including an updated fee and streamlined City Council policies
• Provided $5.25 million in funding commitments for three affordable housing projects
E 22
• Oversee the third party managed Tyler Court Senior Apartments
SERVICES
• Preserve and improve the quality of the city’s existing housing stock
GOALS
• Continue to support the low income senior community by offering affordable housing with income and rent restrictions
• Continue to work with residential developers with inclusionary housing requirements to produce additional homes affordable to lower income households
• Administer the Housing Trust Fund in accordance with Council Policy No. 90
RECENT ACCOMPLISHMENTS
• Assist with the development of low income affordable housing developments from concept to construction
• Negotiate and prepare affordable housing agreements and density bonus agreements
• Provide affordable housing funding for low income households via the Affordable Housing Trust Fund Program
Fund: Special Revenue Section 8 Housing Special Revenue Community Development Block Grant
Other Operating Expenses 7,516,158 9,294,069 7,686,800 9,997,460 Capital Outlay 2,000 Operating Expenses Subtotal 7,738,922 9,460,007 7,975,937 10,382,453
ABOUT
Salaries & Wages 284,497$ 362,144$ 384,224$ 456,301$ Retirement Benefits 82,533 89,509 92,514 99,103 Health Insurance 27,107 39,219 66,814 87,160 Other Personnel Expenses 23,347 10,790 17,253 20,800 Personnel Services Subtotal 417,484 501,662 560,805 663,364
• Ensure the Section 8 tenant based rental assistance program is being administered in compliance with federal regulations and guidelines, the Carlsbad Administrative Plan, and the Public Housing Agency Plan
HOUSING & HOMELESS SERVICES: FEDERALLY FUNDED COMMUNITY ASSISTANCE PROGRAMS
The city receives federal grants that benefit the community and low income households. The federally funded Section 8 rental assistance program provides monthly rental subsidies to very low income households and processes new participants into the program as additional funds are available. The Community Development Block Grant program represents federal funds provided to the city to develop viable urban communities through the provision of decent housing, a suitable living environment and expanded economic opportunities for lower income persons. This program is focused on providing specific benefits to low income residents, with serving the city’s homeless population and providing affordable housing as the two highest priorities.
Personnel Services
2019-20Actual 2020-21Actual 2021-22Budget 2022-23Budget
• Achieve and maintain a lease rate that fully utilizes Section 8 program funding allocation
E 23
• Assist low income households with access to safe and sanitary rental housing
COMMUNITY SERVICES |
SERVICES
Account: 391190
• Provide monthly rental subsidies to very low income households and process new participants as for the federally funded Section 8 rental assistance program
TOTAL EXPENDITURES 8,156,406$ 9,961,669$ 8,536,742$ 11,045,817$
Professional & Contract Services 93,164 37,214 73,000 111,000 Supplies & Materials 10,892 12,084 14,165 14,165 Repair & Maintenance 115 9 300 300 Interdepartmental Charges 118,593 116,631 201,672 257,528
Operating Expenses
Full Time Positions 4.00 4.00 5.40 6.03 Hourly/FTE Positions 0.00 0.00 0.00 0.93
• Prepare the Consolidated Annual Performance and Evaluation Report for public review and comment and final submission to HUD
• Ensure that documentation is maintained to meet compliance with HUD established guidelines for continued CDBG funding
• Complete processing of rental assistance vouchers for 25 non elderly, disabled participants
• Added one Housing Assistant position to support expansion of the federally funded Section 8 rental assistance program to provide more housing vouchers to lower income families Rental 568 590
• Completed land acquisition and loan for construction of Windsor Pointe, a 50 unit affordable apartment community with permanent supportive services to homeless and lower income veteran families and people experiencing homelessness with mental health service needs
• Provided funding assistance to five non profit organizations to provide services to low income households with a focus on affordable housing, supportive services to low income and special needs populations, and assistance in the prevention of homelessness and reduction of the homeless population
• Monitor activities of grant sub recipients to ensure proper use of funds
• Provided monthly rental assistance to 550 very low and extremely low income households
SIGNIFICANT CHANGES IN THIS YEAR’S BUDGET
Performance Measure FYActual2021 FY Estimated2022 FY Projected2023 Clients receiving
Dollar value of grants awarded to community organizations $565,819 $536,522 $527,154
• Administer the CDBG program representing federal funds provided to the city
• Create expenditure plan for CDBG funds to provide additional affordable housing opportunities for low income households, focusing on those experiencing homelessness
• Prepare and implement a five year consolidated plan and Annual Action Plan for submittal to U.S. Department of Housing and Urban Development
• Successful completion and submission of the fiscal year 2021 22 Consolidated Annual Plan Evaluation Report
• Received and allocated additional funding assistance of $1.2 million in CDBG funding to sub recipients to be used to prevent, prepare for and respond to COVID 19
• Provide staff support to the CDBG Funding Advisory Committee and the City Council in the selection process for activities to be included in the CDBG Program
RECENT ACCOMPLISHMENTS
• Enable unemployed, under employed, or under educated low income families to achieve economic independence from welfare
GOALS
Assistance 550
• Maintain high level of grant funding for community organizations
• Continue to operate the Section 8 program effectively, and seek additional funding to serve more clients as opportunities arise
E 24
• Partner with a non profit legal advisor to provide fair housing and tenant landlord dispute counseling and education program
TOTAL EXPENDITURES 1,213,597$ 239,902$ 1,067,495$ 1,068,845$
The successor agency is responsible for preparing a recognized obligation payments schedule as detailed by the State of California’s Department of Finance, listing the enforceable obligations of the former redevelopment agency and their source of payment. This payment schedule is subject to approval by the countywide oversight board.
• Received loan repayment from the successor agency and funding for payment on redevelopment bond
• Continue to take actions to dissolve the former redevelopment agency in a timely manner and ensure repayment of all approved debt obligations
• Ensure payment of all debt obligations as approved by the oversight board
• Administer the successor agency, which is responsible for preparing a recognized obligation payment schedule as detailed by the State of California’s Department of Finance, listing the enforceable obligations of the former redevelopment agency and their source of payment
Account: 801, 811 Fund: Trust Fund Successor Agency
Full Time Positions 0.35 0.35 0.00 0.00 Hourly/FTE Positions 0.00 0.00 0.00 0.00
RECENT ACCOMPLISHMENTS
Other Operating Expenses 1,115,400 160,918 1,035,200 1,031,175 Capital Outlay Operating Expenses Subtotal 1,174,128 216,535 1,067,495 1,068,845
• Processed Recognized Obligations Payment Schedule for fiscal year 2021 22 for approval by the countywide oversight board
SERVICES
Salaries & Wages 22,838$ 17,391$ $ $ Retirement Benefits 13,170 5,373 Health Insurance 146 21 Other Personnel Expenses 3,315 582 Personnel Services Subtotal 39,469 23,367
ABOUT
Professional & Contract Services 6,008 5,008 25,000 30,000 Supplies & Materials 7,060 4,613 Repair & InterdepartmentalMaintenanceCharges 45,660 45,996 7,295 7,670
E 25
SERVICES |
2019-20Actual 2020-21Actual 2021-22Budget 2022-23Budget
Personnel Services
• Participate in activities associated with the dissolution of the redevelopment agency
COMMUNITY
HOUSING & HOMELESS SERVICES: SUCCESSOR AGENCY
Operating Expenses
GOALS
• Outreach, Literacy & Bilingual Services
Professional & Contract Services 565,152 398,850 797,429 734,375 Supplies & Materials 1,149,355 1,060,417 1,371,112 1,302,947 Repair & Maintenance 43,662 40,419 10,273 6,800 Interdepartmental Charges 3,144,952 2,852,698 3,195,050 3,362,870
Operating Expenses
TOTAL EXPENDITURES 13,276,926$ 12,514,415$ 14,302,575$ 14,620,642$
Operating Expenses Subtotal 5,515,624 4,782,852 5,892,860 5,860,725
• Collections & Technical Services
General Fund 13,030,148$ 12,344,689$ 13,780,555$ 14,088,425$ Special Revenue Fund 246,778$ 169,726$ 522,020$ 532,217$
• Children’s Services
LIBRARY & CULTURAL ARTS: SUMMARY
• Adult & Teen Services, Genealogy & Carlsbad History Services
E 26 COMMUNITY SERVICES |
• Circulation Services
Capital Outlay 82,463 14,333
Full Time Positions 52.50 52.50 52.50 51.00 Hourly/FTE Positions 61.66 62.06 63.66 61.95
Salaries & Wages 5,853,737$ 5,471,768$ 6,385,017$ 6,665,560$ Retirement Benefits 1,065,603 1,509,419 1,066,402 1,140,395
• Administration, Digital Initiatives & Special Projects
LIBRARY & CULTURAL ARTS
Other Operating Expenses 530,040 416,135 518,996 453,733
Other Personnel Expenses 271,854 152,820 239,379 253,406 Personnel Services Subtotal 7,761,302 7,731,563 8,409,715 8,759,917
TOTAL FUNDING 13,276,926$ 12,514,415$ 14,302,575$ 14,620,642$
2019-20Actual 2020-21Actual 2021-22Budget 2022-23Budget
Personnel Services
Health Insurance 570,108 597,556 718,917 700,556
• Cultural Arts
Full Time Positions 12.00 12.00 12.00 10.00 Hourly/FTE Positions 3.82 3.82 3.82 3.37
• Conduct strategic planning, set programs and services, and monitor and respond to industry trends and best practices
• Plan, develop and implement technology solutions to effectively deliver services
Retirement Benefits 273,527 378,464 272,779 282,520 Health Insurance 121,529 129,096 166,532 146,018 Other Personnel Expenses 48,244 29,224 46,208 43,950 Personnel Services Subtotal 1,629,704 1,570,258 1,728,371 1,593,458
SERVICES
TOTAL EXPENDITURES 3,080,467$ 2,896,984$ 3,155,065$ 3,149,631$
Account: 0014010
Personnel Services
Fund: General
• Manage personnel and volunteer recruitment activities, develop and maintain policies and procedures, and provide centralized training services for all staff and volunteers
• Develop and monitor budgets, administer contracts and grants, and manage purchasing and accounting processes
2019-20Actual 2020-21Actual 2021-22Budget 2022-23Budget
Operating Expenses
E 27 COMMUNITY SERVICES |
Salaries & Wages 1,186,404$ 1,033,474$ 1,242,852$ 1,120,970$
LIBRARY & CULTURAL ARTS: ADMINISTRATION, DIGITAL INITIATIVES & SPECIAL PROJECTS
ABOUT
Library & Cultural Arts Administration provides management and leadership for the delivery of library and cultural arts programs and services; plans for the efficient use of resources and facilities; coordinates relations with local, state and federal government agencies; and provides liaison services, resource assistance and technical guidance to Library Board of Trustees, Arts Commission, Historic Preservation Commission, the Friends of the Carlsbad Library, the Carlsbad Library & Arts Foundation, the Carlsbad Friends of the Arts, and the Serra Cooperative Library System.
• Utilize data to develop meaningful performance metrics that show impact in the community and adjust services based on community needs
Professional & Contract Services 152,110 70,370 44,550 18,000 Supplies & Materials 108,870 105,168 99,756 83,895 Repair & Maintenance 41,821 38,967 7,053 4,155 Interdepartmental Charges 551,754 689,278 756,339 997,493 Other Operating Expenses 517,854 408,610 518,996 452,630 Capital Outlay 78,354 14,333 Operating Expenses Subtotal 1,450,763 1,326,726 1,426,694 1,556,173
RECENT ACCOMPLISHMENTS
• Upgraded the library’s patron and materials management system and automated materials handling system allowing for improved functionality and support
• Develop an internal communications plan
• Restructured the department to address changing priorities and expectations from the community
• Migrated from California Research and Education Network to the city’s Digital Information Network, increasing in house computer and wireless internet speed for patrons and staff
• Complete an upgrade of the audio visual technology in the Exploration HUB
• Partner with support organizations including the Carlsbad Library & Arts Foundation, the Friends of the Carlsbad Library and Friends of the Arts to ensure endowments, donations and fundraising on behalf of the organization are put to good use
• Work with the Library Board of Trustees, the Arts Commission and the Historic Preservation Commission to ensure the department is responsive to community needs as represented by trustees and commissioners
• Develop new strategies and goals addressing lessons learned and changing needs from the community following the two year COVID 19 pandemic
Patron computer sessions: Mobile 42,671 89,450 105,000
• Integrated the library’s computer management system with the Parks & Recreation public computer labs so Parks & Recreation can utilize analytics and session management tools
• Upgraded the library online catalog, allowing for responsive web design for an improved experience on mobile devices
• Evaluate the future of patron computer, printing and copying services
• Assess library hours of service and optimize them to meet changing needs of the community
• Utilized lessons learned to provide a combination of in person and virtual programs and services, returning to full services as the COVID 19 pandemic retreats
Performance Measure FYActual2021 FY Estimated2022 FY Projected2023 Volunteer hours 1,062 3,000 10,000
• Attract and retain quality staff by institutionalizing ongoing talent management and succession planning practices and by developing a formal training structure and plan for each position in the department
GOALS
• Revitalize opportunities for volunteering
Patron computer sessions: Library provided 4,280 19,755 25,000
• Align programs and services with current best practices
E 28
• Utilize metrics to determine usage of existing resources and to anticipate future needs
Salaries & Wages 934,856$ 885,675$ 948,762$ 1,006,963$ Retirement Benefits 109,433 133,425 93,502 99,025 Health Insurance 54,158 53,797 59,454 66,574 Other Personnel Expenses 50,810 24,572 38,161 41,484 Personnel Services Subtotal 1,149,257 1,097,469 1,139,879 1,214,046
Personnel Services
• Collect retired flags from deposit boxes and deliver to the city’s Fire Department for proper disposal
• Circulate print and audiovisual materials and answer collection related questions
2019-20Actual 2020-21Actual 2021-22Budget 2022-23Budget
• Collect fines and fees, reconcile daily transactions and oversee collection agency accounts
• Track reserved and overdue items and sort, organize and shelve all library materials
Fund: General
Full Time Positions 4.50 4.50 4.50 5.00 Hourly/FTE Positions 20.68 20.68 20.68 20.68
Account: 0014015
ABOUT
E 29
Circulation Services maintains library patrons’ accounts and manages the shelving and circulation of all print and audiovisual materials.
Professional & Contract Services
• Maintain accuracy of user records through reports
Operating Expenses
LIBRARY & CULTURAL ARTS: CIRCULATION SERVICES
COMMUNITY SERVICES|
• Coordinate the city’s participation in countywide delivery and return of Serra Cooperative member library materials
• Respond to in person, telephone and email account inquiries
Supplies & Materials 4,978 7,206 12,500 12,500 Repair & InterdepartmentalMaintenanceCharges 205,512 113,364 143,328 185,231 Other OperatingCapitalExpensesOutlay
• Issue new and replacement library cards to borrowers and internet users
• Conduct a regular inventory of the collection
RECENT ACCOMPLISHMENTS
Operating Expenses Subtotal 210,490 120,570 155,828 197,731
• Converted two part time Circulation Supervisor positions to full time
SERVICES
• Improved the quality of database records
• Created a library specific GIS dashboard in collaboration with Business Systems and City GIS
TOTAL EXPENDITURES 1,359,747$ 1,218,039$ 1,295,707$ 1,411,777$
• Supported Business Systems’ upgrade of the automated materials handling system
• Offered library service via a hybrid in person and curbside circulation model
• Improve communication and training around new standards and processes through regular division meetings and trainings
Circulation of physical items 313,560 810,759 997,233
E 30
• Increase the number of community members with library cards
GOALS
• Restored staffing levels in proportion to services and open hours
• Implement new shelving standards to improve the appearance, accessibility and circulation of the collection
Performance Measure
FYActual2021 FY Estimated2022 FY Projected2023
• Cross train other divisions in circulation processes to improve user experience and continuity of service
New library accounts 5,827 9,672 10,833
E 31 COMMUNITY SERVICES |
LIBRARY & CULTURAL ARTS: ADULT & TEEN SERVICES, GENEALOGY & CARLSBAD HISTORY SERVICES
2019-20Actual 2020-21Actual 2021-22Budget 2022-23Budget
Other Personnel Expenses 64,368 35,963 54,466 57,384 Personnel Services Subtotal 1,753,879 1,776,086 1,923,852 1,978,056
• Provide community outreach activities such as visits to schools, senior centers, farmers’ markets and other community groups
Interdepartmental Charges 1,014,348 932,376 1,003,207 1,011,766
Adult & Teen Services staff assists the public with information needs; locates library materials for patrons; provides instruction on resource use; performs research for the public, local business and government; and provides readers’ advisory assistance. The Genealogy & Carlsbad History staff provides reference and instructional assistance to patrons researching their ancestry and preserves Carlsbad history materials for public research. The division works closely with the North San Diego County Genealogical Society to provide educational genealogy programs for the community, and with the city’s Historic Preservation Commission to support their work.
Other Operating Expenses 912 Capital Outlay Operating Expenses Subtotal 1,027,493 941,072 1,020,174 1,022,191
ABOUT
• Manage the selection and organization of print and digital genealogy and Carlsbad history resources, preserve archival collections and provide instruction and assistance to patrons of all ages researching genealogy or local history
• Respond to in person, telephone, email and text reference questions; provide instruction, classes and tours; assist the public with access to digital resources; and administer services to homebound patrons; provide library programs for adults and teens
SERVICES
Personnel Services
Fund: General
Account: 00140250014016
Professional & Contract Services 135 5,249 3,700 Supplies & Materials 10,894 7,376 9,798 5,380 Repair & Maintenance 1,204 1,320 1,920 1,345
TOTAL EXPENDITURES 2,781,372$ 2,717,158$ 2,944,026$ 3,000,247$
Salaries & Wages 1,354,842$ 1,298,620$ 1,496,551$ 1,554,949$ Retirement Benefits 234,870 328,064 231,378 248,689 Health Insurance 99,799 113,439 141,457 117,034
Operating Expenses
Full Time Positions 11.00 11.00 11.00 11.00 Hourly/FTE Positions 15.35 15.35 15.35 14.87
• Delivered thousands of seeds packets and was awarded 500 seeds and 200 bee identification guides through Plant Wildflowers grant
• Completed collection management projects in the Genealogy Collection including a complete inventory and analysis, shelf shift and weed of materials
• Provide public access to digital records such as oral history audio and video recordings with a new digital asset management system
Carlsbad history research provided to city and community 324 hours 410 hours 510 hours
• Resumed in person genealogy programs, and offered new hybrid in partnership with the North San Diego County Genealogical Society, providing remote access to seven genealogy research databases
• Scanned 4,000 photographic prints in the Historic Photo Collection to archival standards
RECENT ACCOMPLISHMENTS
• Presented three successful in person author visits with purposeful consideration to diversity, equity and inclusion
*no outreach during COVID 19 pandemic
• Support the work of the city’s Historic Preservation Commission and city staff through research, digitization and programming
• Coordinate with the North San Diego County Genealogical Society to schedule and provide free educational genealogy programs
• Resumed in person services including study rooms, computer labs, the Exploration HUB, Books to Go, book clubs and outreach programming
• Expanded Grow Your Garden program to include a seed library in collaboration with Carlsbad Community Gardens
• Initiated personal reading recommendation program
GOALS
• Acquired and launched new genealogy database in partnership with the North San Diego County Genealogical Society
• Evaluate and adjust staffing to meet the changing needs of the community
• Created and launched online form for scheduling personalized genealogy assistance
• Explore and enhance outreach opportunities in collaboration with the new Partnerships & Community Outreach Principal Librarian
• Create promotional materials to showcase the value of Genealogy & Carlsbad History services to the
PerformancecommunityMeasure FYActual2021 FY Estimated2022 FY Projected2023
E 32
• Added nine new databases for a total of 48 adult and teen eResources
• Transcribed oral histories in Carlsbad History Collection making the content of the recordings keyword searchable in library’s catalog
Community members reached through outreach N/A* 1,191 3,200
Personnel Services
Health Insurance 93,565 92,324 99,489 129,381 Other Personnel Expenses 31,529 16,692 27,004 27,872 Personnel Services Subtotal 893,774 847,631 961,814 996,991
SERVICES
Account: 0014035 Fund: General
ABOUT
2019-20Actual 2020-21Actual 2021-22Budget 2022-23Budget
• Answer reference questions and assist in using the collection and internet computers for research and homework
• Develop and present educational programs for children year round, including weekly early literacy and educational programs, as well as special reading programs such as the annual Summer Reading Adventure
• Provide leadership opportunities and community service volunteer hours for teens
• Support digital literacy for children by providing computers with early literacy programs, internet access and educational games as well as remote access to digital databases for homework assistance
E 33 COMMUNITY SERVICES |
• Provide library instruction and tours for children and youth related groups
Operating Expenses
Professional & Contract Services Supplies & Materials 11,645 770 2,900 2,900 Repair & InterdepartmentalMaintenanceCharges 423,756 353,532 376,200 339,359
Salaries & Wages 643,316$ 565,302$ 707,990$ 710,926$ Retirement Benefits 125,364 173,313 127,331 128,812
Other OperatingCapitalExpensesOutlay
LIBRARY & CULTURAL ARTS: CHILDREN’S SERVICES
• Promote literacy and the enjoyment of reading by connecting children with books through personal interactions, programs and development of an age appropriate collection
TOTAL EXPENDITURES 1,329,175$ 1,201,933$ 1,340,914$ 1,339,250$
Full Time Positions 7.00 7.00 7.00 7.00 Hourly/FTE Positions 5.55 5.55 5.55 5.55
The Children’s Services Division supports the educational, literacy, informational, cultural and recreational needs of young patrons from babies through middle school aged children. Youth related reference and readers’ advisory services are also offered to parents, caregivers and teachers.
Operating Expenses Subtotal 435,401 354,302 379,100 342,259
• Build community connections through story times, book talks and instructional sessions at local schools and special events throughout the city
• Strengthened early literacy efforts by launching 1,000 Books Before Kindergarten program
• Design and implement improvements to the Cole Children’s picture book area to provide a more attractive and interactive experience for young children and their families
RECENT ACCOMPLISHMENTS
• Resumed in person programming
• Conducted the first Children’s Services Summit to evaluate how Children’s Services provides public service, programming, collection and outreach efforts
• Taught children and families how to participate in virtual programs and services
• Implement systemwide Children’s Services program standards
• Evaluate the Maker STEAM Kit pilot to determine next steps for the program
• Increase 1,000 Books Before Kindergarten participation by 30%
• Strengthen outreach efforts to increase summer reading participation
• Re establish in person volunteer opportunities for teens to gain leadership skills and community service hours
GOALS
FYActual2021 FY Estimated2022 FY Projected2023
• Adapted and streamlined the Summer Reading Adventure to be more inclusive for readers of all skill levels and backgrounds
• Design and implement STEAM exploration and experiences for children and their families in the Leichtag Family Foundation Discovery Room
Performance Measure
E 34
• Initiated personal reading recommendation program specifically for children
• Initiated a pilot program to circulate age appropriate Maker Science, Technology, Engineering, Arts and Mathematics Kits, which cover various STEAM concepts and include a book and activities for patrons to complete at home
• Increase usage of Early Literacy Stations by 15% (note: closed during fiscal year 2021 22 until March 2022 due to COVID 19)
1000 Books Before Kindergarten participants N/A 129 175 Summer Reading participants 822 1,063 1,500 Early Literacy Station users 1,827 8,500 9,775
Fund: SpecialGeneralRevenue Gifts/Benefits
TOTAL FUNDING 1,915,255$ 1,896,027$ 2,156,042$ 2,107,069$
• Source and purchase library materials, in physical and electronic format
Other Operating Expenses 456 117
Collections & Technical Services coordinates the selection of materials and manages collection development and maintenance for all library facilities. Staff oversee selection, ordering, invoicing and acquisition of library materials for the public, in both physical and electronic formats. Staff also catalog and prepare library materials for public use, evaluate new content formats, devise new cataloging and processing procedures as new formats are added and evaluate usage patterns for electronic formats.
Operating Expenses
Personnel Services
• Manage the selection of library materials in accordance with collection development policies and industry practices to continue to meet the educational, lifelong learning and entertainment needs of the community
Special Revenue Friends of the Library
ABOUT
Full Time Positions 7.00 7.00 7.00 7.00 Hourly/FTE Positions 2.88 2.88 2.88 2.88
Salaries & Wages 571,168$ 574,073$ 599,069$ 627,402$
TOTAL EXPENDITURES 1,915,255$ 1,896,027$ 2,156,042$ 2,107,069$
Account: 145401114540100014040
SERVICES
• Keep the catalog and collection organized, current, accurate and accessible
Retirement Benefits 126,315 203,691 124,605 134,592
2019-20Actual 2020-21Actual 2021-22Budget 2022-23Budget
• Track the ordering and invoicing of materials, working with department and city staff to ensure timely payment to vendors
Health Insurance 83,845 81,715 84,483 81,757
Other Personnel Expenses 25,755 15,183 23,228 24,645
Personnel Services Subtotal 807,083 874,662 831,385 868,396
Operating Expenses Subtotal 1,108,172 1,021,365 1,324,657 1,238,673
Capital Outlay 4,109
Professional & Contract Services 41,737 24,217 13,325 21,825 Supplies & Materials 895,706 816,803 1,109,389 1,031,564
E 35 COMMUNITY SERVICES |
General Fund 1,812,494$ 1,833,437$ 1,963,006$ 1,933,653$ Special Revenue Fund 102,761 62,590 193,036 173,416
Repair & InterdepartmentalMaintenanceCharges 166,164 180,228 201,943 185,284
LIBRARY & CULTURAL ARTS: COLLECTIONS & TECHNICAL SERVICES
eBooks and audiobooks selected and added to collection 3,796 3,800 4,000 Physical items selected, cataloged, processed and added to collection 23,366 30,000 30,500
• Optimize the location of library materials for the best user experience
• Evaluated, reprocessed, and relocated 40,000 items in the adult nonfiction collection to increase findability
• Shifted resources and collections planning to support an increase in community use of eBooks and eAudiobooks
• Perform a scheduled update of the Collection Development Policy to ensure both currency and continuity of high standards in collection management
• Broaden access to material outside the city’s collection via Interlibrary Loan
• Reassessed and enhanced patron access to materials by modifying labeling, shelving locations and database indexing to improve access and
GOALS
• Further enhance library collections and metadata in relation to diversity, equity and inclusion
• Revise the library materials selection process to streamline workflow and staff training
• Balance the addition of eBooks, audiobooks and physical items as patron preferences change
FYActual2021 FY Estimated2022 FY Projected2023
• Initiated review of the library collections and catalog metadata for diversity, equity, and inclusion to reflect best practices in maintaining a timely, relevant, and welcoming collection
Performance Measure
RECENT ACCOMPLISHMENTS
• Configure new software enhancements that will improve search results to help patrons find the most relevant materials
• Maintain, track and assess patron use of electronic and physical content to guide purchasing decisions
• Provided new eResources platforms including video streaming, eComics and eAudiobooks
• Implement newly acquired technologies for both the purchasing process and catalog maintenance
E 36
• Analyzed needs for a next generation library catalog to provide better user access to the library collections
Special Revenue Falkenstein Donation
• Provide access to English, Spanish, bilingual and literacy materials for all ages
LIBRARY & CULTURAL ARTS: OUTREACH, LITERACY & BILINGUALSERVICES
• Facilitate the Homework Zone program, which offers homework assistance to school age students by volunteers and offer intensive reading help to elementary school age children
Retirement Benefits 104,879 151,670 110,639 102,926
E 37 COMMUNITY SERVICES |
Account: 001405X, 0014060 145016145015145014145013 Fund: SpecialGeneralRevenue Gartner Donation
• Provide programs, concerts, events and activities for all ages in English, Spanish, and bilingual formats
Special Revenue Sutton Donation
SERVICES
2019-20Actual 2020-21Actual 2021-22Budget 2022-23Budget
The Library Learning Center offers general library programs and services in addition to providing special collections, outreach services and entertaining activities across all ages and stages of language and literacy learning. Bilingual Services, Literacy Services and Outreach & Strategic Partnership personnel collaborate to provide specialized library services and programs focused on language acquisition, learning and community building in English and Spanish.
Salaries & Wages 612,904$ 596,401$ 734,761$ 627,418$
Other Personnel Expenses 30,028 16,865 27,552 23,608 Personnel Services Subtotal 810,011 829,138 954,062 805,913
Operating Expenses
• Offer reading and writing help by trained volunteer tutors for English speaking adults to meet their life goals
Professional & Contract Services 55,668 35,085 72,575 60,960 Supplies & Materials 90,848 104,707 105,865 134,154 Repair & Maintenance 623 1,300 300 Interdepartmental Charges 679,428 511,188 576,223 514,681
Other Operating Expenses 8,979 5,824
ABOUT
Capital Outlay Operating Expenses Subtotal 835,546 656,804 755,963 710,095
• Manage an accredited Career Online High School diploma program and support students
Special Revenue Benson Donation
Health Insurance 62,200 64,202 81,110 51,961
TOTAL EXPENDITURES 1,645,557$ 1,485,942$ 1,710,025$ 1,516,008$
Personnel Services
Full Time Positions 6.00 6.00 6.00 5.00 Hourly/FTE Positions 9.00 9.40 9.00 6.65
• Resumed in person programs, services and events and continued to offer virtual programs, to be inclusive, equitable and reach the broadest audience possible
Career Online High School graduates 3 6 2 Bilingual program offerings 32 85 170
• Provide learning assistance in reading, writing and comprehension to students in partnership with Carlsbad High School
• Evaluate and adjust staffing levels commensurate with services and open hours to meet the changing needs of the community
• Develop a department wide outreach and marketing strategy and increase support and partnership with other city departments
• Increase the number of Career Online High School participants
• Develop partnerships with local stakeholders to promote community connections and improve services systemwide
GOALS
• Developed new digital literacy/technology capability to serve Literacy Services learners by purchasing and checking out Chromebooks and offering virtual programming
Active and current partners N/A 25 28
RECENT ACCOMPLISHMENTS
• Develop new bilingual early literacy and youth services programming
• Re establish English as a Second Language class offerings in partnership with MiraCosta College and include additional conversation skills classes
FYActual2021 FY Estimated2022 FY Projected2023
E 38
• Develop more robust digital resources, such as workshops, tools, and online programs for the adult literacy program
• Redesign the Learning Center’s public service areas for enhanced safety, ergonomics and customer service
Performance Measure
Operating Expenses
General Fund 1,135,843$ 1,072,885$ 1,563,046$ 1,958,910$ Special Revenue Fund 29,510 25,447 137,750 137,750
Special Revenue Schulman Endowment
2019-20Actual 2020-21Actual 2021-22Budget 2022-23Budget
• Create, document and maintain the city’s permanent and temporary public art experiences
Personnel Services
• Implement programs featuring guest artist residencies and STEAM with schools reaching 7,000 students annually
TOTAL EXPENDITURES 1,165,353$ 1,098,332$ 1,700,796$ 2,096,660$
Other Personnel Expenses 21,120 14,321 22,760 34,463 Personnel Services Subtotal 717,594 736,319 870,352 1,303,057
• Administer the Community Arts Grant program with the Carlsbad Arts Commission and community arts stakeholders
Retirement Benefits 91,215 140,792 106,168 143,831
• Present visual arts exhibitions, performing arts and film programming at the Ruby G. Schulman Auditorium, the William D. Cannon Art Gallery and other locations
Health Insurance 55,012 62,983 86,392 107,831
E 39 COMMUNITY SERVICES |
SERVICES
LIBRARY & CULTURAL ARTS: CULTURAL ARTS
Capital Outlay Operating Expenses Subtotal 447,759 362,013 830,444 793,603
Salaries & Wages 550,247$ 518,223$ 655,032$ 1,016,932$
TOTAL FUNDING 1,165,353$ 1,098,332$ 1,700,796$ 2,096,660$
Professional & Contract Services 315,502 269,178 661,730 629,890 Supplies & Materials 26,414 18,387 30,904 32,554 Repair & Maintenance 14 132 1,000 Interdepartmental Charges 103,990 72,732 137,810 129,056
Other Operating Expenses 1,839 1,584 1,103
The Cultural Arts Office plans, promotes and carries out visual and performing arts programs, arts education activities, temporary and permanent public art and other cultural offerings to make connections among artists, cultural organizations, community groups, businesses, visitors and residents that sustain and promote a thriving, diverse and creative city.
• Offer educational programs for youth and adults, including Three Part Art, Pop Up Art and summer workshops
Full Time Positions 5.00 5.00 5.00 6.00 Hourly/FTE Positions 4.38 4.38 6.38 7.95
Account: 175148001406X Fund: SpecialGeneralRevenue Special Events
ABOUT
• Offered Cannon Art Gallery and Sculpture Garden tours to all ages
• Launched new grants management software to improve efficiency and access
• Hosted four guest artist residencies with workshops and performances throughout the city
• Evaluate progress on Arts & Culture Master Plan Initiatives and determine which to pursue next
Performance Measure FYActual2021 FY Estimated2022 FY Projected2023
Arts & Culture Master Plan Initiatives activated 12 15 20
• Presented four exhibits in the Cannon Art Gallery, which focused on local artists and national touring exhibits and coordinated community art displays in all three libraries
• Work with Carlsbad Friends of the Arts on building their leadership and fundraising capacity
• Initiated partnership with Carlsbad Village Association which paired local artists with local businesses for temporary art installations, designed to spur greater economic development within the creative sector
• Progressively reopened the Schulman Auditorium to live performances, Wednesday Cinema Series, International Film Fridays and rentals to outside groups
• Provided Arts Education at home arts kits to homes and local schools
• Install two mural projects at the Library Learning Center and New Village Arts Theatre
• Collaborate with the business and creative sectors on new temporary art experiences
GOALS
• Refreshed and repaired the Sculpture Garden to ensure safety and security, fostering an updated look and improved visitor experience
• Develop STEAM initiative focused on building curriculum for a school year program
• Present performing arts series, including TGIF Concerts in the Parks
• Receive a final design for technology renovation upgrades for the Schulman Auditorium and Cannon Art Gallery, and request funding in the following fiscal year to complete the project
RECENT ACCOMPLISHMENTS
• Presented 36 hours of Virtually Artful performances including TGIF in Your Backyard, concerts in the Schulman and classical performances from Lincoln Center
• Restored aging permanent public art
• Completed three additional Carlsbad Beach Chairs with local artists
• Develop curriculum and arts outreach programming to further extend arts experiences
• Install public art at newly rebuilt Fire Station 2
• Finalize plans for public transportation art at the Village & Barrio Traffic Circle and Chestnut Underpass
E 40
• Hosted first virtual Public Art Advisory Subcommittee meetings for Fire Station 2 and selected artist and design concept
• Seek out artist collaborations throughout Carlsbad and the North County
• Maintain partnership with Carlsbad Friends of the Arts
Permanent and temporary public art projects completed 2 5 8
General Fund 17,584,182$ 16,786,632$ 19,159,380$ 21,167,014$ Enterprise Fund 7,033,434$ 6,718,515$ 7,231,000$ 9,195,000$ Special Revenue Fund 1,701,233$ 1,818,178$ 2,475,161$ 2,341,644$
TOTAL FUNDING 26,318,849$ 25,323,325$ 28,865,541$ 32,703,658$
PARKS & RECREATION: SUMMARY
PARKS & RECREATION
Full Time Positions 55.00 55.00 55.00 59.00 Hourly/FTE Positions 89.61 77.83 80.26 71.56
SERVICES |
Other Personnel Expenses 507,784 293,094 477,446 473,268 Personnel Services Subtotal 8,475,169 8,322,133 9,286,809 10,054,876
• Administration • Recreation • Parks & Trail Maintenance • Street Tree Maintenance & Median Maintenance • The Crossings Golf Course
2019-20Actual 2020-21Actual 2021-22Budget 2022-23Budget
Professional & Contract Services 6,241,274 6,202,333 7,326,523 8,329,905 Supplies & Materials 1,046,876 872,007 1,108,803 1,166,558
Salaries & Wages 6,366,613$ 5,897,102$ 6,942,615$ 7,447,323$ Retirement Benefits 1,091,356 1,572,592 1,141,979 1,273,007
Capital Outlay 555,031 157,054 108,000 687,500 Operating Expenses Subtotal 17,843,680 17,001,192 19,578,732 22,648,782
Health Insurance 509,416 559,345 724,769 861,278
Personnel Services
Other Operating Expenses 8,345,686 8,186,933 9,073,911 10,467,217
E 41
Repair & Maintenance 45,433 7,916 4,850 5,020
Interdepartmental Charges 1,609,380 1,574,949 1,956,645 1,992,582
Operating Expenses
COMMUNITY
TOTAL EXPENDITURES 26,318,849$ 25,323,325$ 28,865,541$ 32,703,658$
Account: 0014510, 0014511 149140 Fund: SpecialGeneralRevenue Scholarships Special Revenue Donations
Health Insurance 97,171 111,366 124,405 141,218
• Administer recreation program scholarships to low income residents
Salaries & Wages 1,230,946$ 1,211,204$ 1,296,655$ 1,243,160$ Retirement Benefits 273,297 418,881 283,306 301,822
Repair & Maintenance 43,436 6,430 300 300 Interdepartmental Charges 208,185 206,443 273,978 398,987
Professional & Contract Services 167,760 96,004 299,787 251,440 Supplies & Materials 55,207 74,509 84,556 83,877
• Enhance citywide open space and trails system through land acquisition, planning, construction monitoring and maintenance
Capital Outlay 72,031 6,314 2,500
• Process and issue city special event permits
• Monitor recreation programs with participant surveys and community outreach
General Fund 2,282,380$ 2,187,782$ 2,453,842$ 2,529,660$ Special Revenue Fund 28,289 26,165 82,591 81,009
Full Time Positions 12.45 11.45 11.30 10.30 Hourly/FTE Positions 1.13 1.36 1.34 0.49
COMMUNITY SERVICES |
2019-20Actual 2020-21Actual 2021-22Budget 2022-23Budget
• Develop and monitor operating budget and annual CIP budget
E 42
Other Personnel Expenses 71,887 44,584 64,422 57,782
• Evaluate and monitor business processes to improve operations and performance
Operating Expenses Subtotal 637,368 427,912 767,645 866,687
Personnel Services
TOTAL EXPENDITURES 2,310,669$ 2,213,947$ 2,536,433$ 2,610,669$
Operating Expenses
Other Operating Expenses 90,749 38,212 109,024 129,583
• Oversee management agreement for The Crossings at Carlsbad Municipal Golf Course
Total Funding 2,310,669$ 2,213,947$ 2,536,433$ 2,610,669$
ABOUT
PARKS & RECREATION: ADMINISTRATION
Parks & Recreation Administration provides department leadership, planning and administrative services to help develop and sustain high quality parks and recreation programs.
• Perform parks planning, design, administration and construction monitoring services
Personnel Services Subtotal 1,673,301 1,786,035 1,768,788 1,743,982
SERVICES
• Resumed community engagement workshops and stakeholder meetings, public survey distribution and collection, agency programs and services benchmarking, and fee comparison studies related to the Parks & Recreation Department Master Plan Update
• Support three commissions in accomplishing the goals and tasks within each work plan
RECENT ACCOMPLISHMENTS
• Checked plans and specifications of new development projects that include trail construction
• Liaise with Parks & Recreation, Senior and Beach Preservation Commissions
• Develop, monitor and support the department’s information technology
• Conducted two virtual Parks & Recreation Department master plan update public meetings
• Supported the Fleet & Facilities Department in proposing the Monroe Street Pool Renovation and Replacement Project to the Parks & Recreation Commission and City Council
• Moved Parks & Recreation software system to its own dedicated hosting server and to CivicPlus Platform for additional software security
• Receive City Council award of a design services agreement and commence the public engagement phase for master planning of the Robertson Ranch Community Park
• Updated the senior center, Monroe Street Pool and Alga Norte Aquatic Complex door kickers and turnstiles for added security
• Complete process to update the Parks & Recreation Department Master Plan
• Added one limited term Parks Planner position to support major upcoming capital improvement projects and ongoing demand for park planning resources
• Conducted Park inventories for the Parks & Recreation Department Master Plan Update
SIGNIFICANT CHANGES IN THIS YEAR’S BUDGET
E 43
• Proceed with environmental permitting and entitlements phase for master planning of Veterans Memorial Park
• Implemented a mobile application to enhance citywide trails use
• Attained additional staff certifications via Certified Parks & Recreation Professional Program
• Integrated CivicRec to city’s single sign on system
• Upgraded the Senior Center and Teen Center computer labs to the Pharos system to create consistency between computer labs and increase efficiencies
• Obtain City Council approval of the final Veterans Memorial Park Master Plan
• Pursue further strategies to respond to the lifeguard staffing challenges
• Update and implement master and strategic planning efforts
GOALS
• Enhance the city’s municipal waste reduction, recycling and waste diversion programs Environmental Sustainability
• Pursue reaccreditation from Commission for Accreditation of Park and Recreation Agencies
• Converted 6.63 part time lifeguard positions to three full time positions and added on full time position to better support operations at aquatics facilities
• Continue to provide support to the Monroe Street Pool Renovation project
• Received Planning Commission approval of environmental documents and entitlement permits for the Veterans Memorial Park Master Plan
PARKS & RECREATION: RECREATION
• Promote fair and efficient use of athletic facilities for resident nonprofit sports organizations
• Collect and account for revenue to ensure efficient and cost effective programming
Operating Expenses
Supplies & Materials 654,168 565,230 655,350 655,625 Repair & Maintenance 1,669 1,007 4,050 4,220
Account: 0014520 44, 0014546 73 143 Fund: SpecialGeneralRevenue Senior Program Donations
Salaries & Wages 3,408,780$ 2,967,030$ 3,714,640$ 4,174,164$ Retirement Benefits 417,981 550,229 429,754 499,474
Capital Outlay 67,074 927
Other Personnel Expenses 310,525 172,287 292,354 296,721 Personnel Services Subtotal 4,296,440 3,877,536 4,678,141 5,330,786
• Serve as a certification site for aquatics training programs through the American Red Cross
Personnel Services
ABOUT
Operating Expenses Subtotal 3,006,291 2,504,249 3,348,236 3,338,854
TOTAL EXPENDITURES 7,302,731$ 6,381,785$ 8,026,377$ 8,669,640$
COMMUNITY SERVICES |
SERVICES
• Provide information, enrollment, and registration services for programs and facilities
• Conduct cultural and historic park educational and interpretive programming
• Plan, conduct and supervise recreation operations and programs both virtually and in person at community centers, parks and other city facilities
Other Operating Expenses 424,284 437,488 476,827 506,528
Interdepartmental Charges 985,690 972,541 1,121,914 1,091,629
Full Time Positions 18.25 19.25 19.40 24.40 Hourly/FTE Positions 79.70 71.84 74.28 66.44
General Fund 7,282,139$ 6,376,418$ 7,946,777$ 8,619,140$ Special Revenue Fund 20,592 5,367 79,600 50,500 Total Funding 7,302,731$ 6,381,785$ 8,026,377$ 8,669,640$
Health Insurance 159,154 187,990 241,393 360,427
E 44
2019-20Actual 2020-21Actual 2021-22Budget 2022-23Budget
Professional & Contract Services 873,406 527,056 1,090,095 1,080,852
• Process applications and issue permits for use of recreational facilities and aquatic centers
The Parks & Recreation Department offers a wide range of virtual and in person programming, including youth and adult sports, instructional classes, camps, aquatics, preschool and teen services, and special events. The department operates 339 acres of developed community parks and special use areas, featuring multi use fields, tennis courts, dog parks, skate parks, playgrounds, two historic parks, a senior center, four multigenerational community centers and two aquatic centers.
o Executed a memorandum of understanding with the Carlsbad Unified School District to allow exclusive use of the pool for Carlsbad High School during the hours which the city is unable to provide lifeguard services and the district has reserved the pool
• Assisted the Human Resources Department with eight full time staff recruitments
• Execute 85% of advertised recreation programs 85%
• Arrange classes, seminars, transportation and professional services for seniors
o Expanded lifeguard academy courses
• Accommodate the demand for the Senior Nutrition Meal Program due to COVID 19 impacts
• Manage volunteers supporting the Senior Center, Leo Carrillo Ranch, trails and special events
• Implemented the following strategies in response to the lifeguard staffing shortage:
o Received emergency determination from the State of California to allow ocean lifeguards to serve as pool lifeguards
• Arrange intergenerational programs that increase cooperation and interaction
• Offer opportunities for hybrid recreation programs that have both virtual and in person participants and additional outdoor activities to adapt to the public’s health concerns
• Collaborate with the Friends of Carrillo Ranch to plan, design and implement a new interpretive exhibit at Leo Carrillo Ranch
GOALS
• Offer programs that promote health and wellness and essential childhood development
• Augment staff with volunteers to build community and enhance fiscal stewardship
• Provide programs that promote health and wellness and essential childhood development
• Offered over 100 different types of programs that promoted health and wellness and essential childhood development
• Provide congregate and home meals to seniors at little or no cost
• Hosted USA Swimming Speedo Sectional Championship at Alga Norte Community Park
• Expand adult 50+ opportunities and collaborations beyond the Senior Center
o Created new full time lifeguard positions and adjusted lifeguard pay rates to be competitive with other entities in the region
• Complete department’s master plan update and begin implementation of its findings related to services, programs and events
• Utilize 10,000 hours of volunteer service to support recreation programs
RECENT ACCOMPLISHMENTS
85%
Performance Measure FYActual2021 FY Estimated2022 FY Projected2023 Hours of Volunteer Services used 5,790 21,009 10,000 Advertised programs executed 76%
E 45
Other Personnel Expenses 100,107 59,681 93,915 98,784 Personnel Services Subtotal 1,918,574 2,086,958 2,223,918 2,480,828
Operating Expenses
Professional & Contract Services 4,111,422 4,413,623 4,367,891 5,386,863 Supplies & Materials 328,540 211,169 311,964 381,834 Repair & Maintenance 328 479 500 500 Interdepartmental Charges 501,436 417,762 580,718 508,083
• Inspect and maintain restroom facilities and picnic areas
Account: 00146XX Fund: General
The Parks & Recreation Department maintains approximately 339 acres of developed community parks and special use areas, 51 miles of trails, and 762 acres of habitat preserves, urban forests and undeveloped lands.
Personnel Services
• Coordinate coastal activities with the California Department of Parks & Recreation, California Coastal Commission and lagoon foundations
Other Operating Expenses 1,145,543 1,086,771 1,273,770 1,260,106
Full Time Positions 19.45 19.85 19.45 20.40 Hourly/FTE Positions 7.25 3.10 3.10 3.85
• Oversee maintenance and monitoring of preserves, urban forests, and undeveloped lands
Capital Outlay 13,820 5,670 Operating Expenses Subtotal 6,101,089 6,135,474 6,534,843 7,537,386
• Inspect and prune all city trees on a 4 to 4.5 year cycle and a 2 to 2.25 year supplemental cycle for high maintenance trees, in accordance with Community Forest Management Plan
• Manage the trail volunteers program
PARKS & RECREATION: PARKS & TRAIL MAINTENANCE
TOTAL EXPENDITURES 8,019,663$ 8,222,432$ 8,758,761$ 10,018,214$
|
Salaries & Wages 1,294,611$ 1,338,219$ 1,498,373$ 1,677,798$ Retirement Benefits 311,227 469,644 333,989 388,440 Health Insurance 212,629 219,414 297,641 315,806
E 46
ABOUT
2019-20Actual 2020-21Actual 2021-22Budget 2022-23Budget
• Inspect and maintain tot lots, tennis and basketball courts, soccer, softball, baseball and multi purpose fields
• Maintain existing citywide trails and coordinate development of new trails
SERVICES
• Repair park structures, athletic field lighting, play equipment and other park fixtures
• Manage turf, irrigation, drainage and landscaping at parks, civic facilities, beach accesses, and school athletic fields
COMMUNITY SERVICES
• Reopened remaining amenities within the parks inventory under COVID 19 protocols
• Assumed ongoing maintenance and operations of the Calavera Hills Community Park Gateway, including a new looped pathway with outdoor exercise stations and a picnic area
• Maintained parks, preserves, and beach accesses in accordance with COVID 19 protocols
• Repaired several segments of Lake Calavera trails with heavy equipment and erosion control
• Apply clear coat on playground surfacing at selective parks to aid in UV protection and wear
• Increase number of recycling receptacles at park and trail facilities by 10%
• Execute a North Beach clean up event with the Beach Preservation Commission
• Added over 500 total trees to the city’s inventory, including those within parks, facilities and trails, in accordance with City Council adopted Community Forest Management Plan
• Administered the construction contract for retrofits to LED fixtures on pathway and parking lot lights at Stagecoach, Calavera Hills and Poinsettia Community Parks
• Resurface blockhouse restroom floors at Aviara, Hidden Canyon, La Costa Canyon and Laguna Riviera Community Parks
• Assumed ongoing maintenance and operations of the Poinsettia Community Park Phase IV Improvements, including a new Dog Park, parking lot and restroom facility
• Perform sports lighting maintenance and enhancements at several community parks
• Commenced administration of new maintenance services agreement for Work Category B
FYActual2021 FY Estimated2022 FY Projected2023
Mulch generated in parks reused 95% 95% 95%
• Add 500 total trees to the city’s inventory, including those within parks, facilities and trails, in accordance with City Council adopted Community Forest Management Plan
GOALS
• Executed a North Beach clean up event with the Beach Preservation Commission
• Resurface outdoor basketball courts at Stagecoach, Calavera Hills and La Costa Canyon Community Parks
RECENT ACCOMPLISHMENTS
E 47
• Expanded the Parks & Recreation Department Memorial Program to include additional memorial items and locations at the City Council’s direction
• Plant parks and trails trees within vacancies created by prior removals and plant new parks and trails trees in accordance with the Community Forest Management Plan
• Initiate design of next phase of retrofits to LED fixtures on pathway and parking lot lights
Performance Measure
• Inspected and pruned city parks, facilities and trails trees on a 4 to 4.5 year cycle, and a 2 to 2.25 year supplemental cycle for high maintenance trees
Increase in number of recycling receptacles at parks and trails 9% 10% 10%
• Reuse 95% of mulch generated at city parks at city facilities
• Repair additional segments of Lake Calavera trails with heavy equipment and erosion control
• Inspect and prune city parks, facilities and trails trees on a 4 to 4.5 year cycle, and a 2 to 2.25 year supplemental cycle for high maintenance trees
• Administered the construction contract for replacing the resilient rubberized safety surfacing of the playgrounds at Aviara and Hidden Canyon Community Parks
• Retrofit light fixtures on pathway lights at Holiday Park to energy efficient LED fixtures
The Median Maintenance Assessment District provides landscape and irrigation maintenance for approximately 68 acres of median planters and nine acres of developed parkways and streetscapes, including the Downtown Carlsbad Village area.
• Respond to street tree service requests and provide storm and emergency assistance as necessary
Salaries & Wages 432,276$ 380,649$ 432,947$ 352,201$
Professional & Contract Services 868,654 870,627 1,299,750 1,299,750 Supplies & Materials 8,961 21,099 56,933 45,222 Repair & InterdepartmentalMaintenanceCharges (85,931) (21,797) (19,965) (6,117)
Other Operating Expenses 273,814 345,113 360,290 372,000
Personnel Services
PARKS & RECREATION: STREET TREE & MEDIAN MAINTENANCE
Fund: Special Revenue Special Revenue
ABOUT
SERVICES
Retirement Benefits 88,851 133,838 94,930 83,271
Operating Expenses Subtotal 1,065,498 1,215,042 1,697,008 1,710,855
TOTAL EXPENDITURES 1,652,352$ 1,786,646$ 2,312,970$ 2,210,135$
Capital Outlay
Account: 161160
Full Time Positions 4.85 4.45 4.85 3.90 Hourly/FTE Positions 1.53 1.53 1.53 0.78
Health Insurance 40,462 40,575 61,330 43,827
• Plant street trees and median trees within vacancies created by prior removals in accordance with the Community Forest Management Plan
The Street Tree Maintenance Assessment District provides maintenance to all city accepted street trees within the public right of way, including specialized maintenance for street trees in the Downtown Carlsbad Village area.
|
Other Personnel Expenses 25,265 16,542 26,755 19,981 Personnel Services Subtotal 586,854 571,604 615,962 499,280
• Inspect and prune all city trees on a 4 to 4.5 year cycle, and a 2 to 2.25 year supplemental cycle for high maintenance trees
• Refine, support, administer and inspect the tree maintenance block pruning program
Operating Expenses
COMMUNITY SERVICES
2019-20Actual 2020-21Actual 2021-22Budget 2022-23Budget
E 48
• Inspected and pruned city street trees and median trees on a 4 to 4.5 year cycle, and a 2 to 2.25 year supplemental cycle for high maintenance trees
• Added over 500 total trees to the city’s inventory, including those within street rights of way and medians, in accordance with City Council adopted Community Forest Management Plan
• Perform plan checks, conduct inspections, and assume maintenance responsibility for medians and parkways constructed from city capital improvement projects and private development, or ensure a median and parkway maintenance agreement is executed and recorded by the developer
• Perform plan checks, conduct inspections and assume maintenance responsibility for street trees of development projects or ensure a street tree maintenance agreement is executed and recorded by the developer
• Refined, supported, administered and inspected canopy maintenance block pruning program
• Administered and oversaw landscape and irrigation maintenance for all city median planters and developed parkways and streetscapes
GOALS
• Respond to tree service requests and provide storm and emergency assistance as necessary
• Responded to approximately 600 street tree service requests and provided storm and emergency assistance as necessary
• Inspect and prune streets and medians trees on a 4 to 4.5 year cycle and a 2 to 2.25 year supplemental cycle for high maintenance trees
• Add 500 total trees to the city’s inventory, including those within street rights of way and medians, in accordance with City Council adopted Community Forest Management Plan
• Administer and oversee landscape and irrigation maintenance for all city median planters and developed parkways
• Increase number of recycling receptacles within the Downtown Village and Northern Beach Streetscapes by 10% to support waste diversion objectives
RECENT ACCOMPLISHMENTS
Increase in number of recycling receptacles within Downtown Village and Northern Beach Streetscapes 10% 10% 10%
Performance Measure
Street trees inspected for pruning 5,060 5,587 5,000
FYActual2021 FY Estimated2022 FY Projected2023
• Refine, support, administer and inspect tree maintenance block pruning program
• Commenced administration of new maintenance services agreement for Work Category B
• Inspect 5,000 trees for pruning
• Administer and oversee landscape and irrigation maintenance for all city medians planters and developed parkways and streetscapes, including litter control, weed abatement, pruning, shrub and tree refurbishment and irrigation repairs
E 49
• Plan checked, inspected and assumed maintenance responsibility of street trees of development projects or ensured a street tree maintenance agreement was executed and recorded by developer
PARKS & RECREATION: THE CROSSINGS AT CARLSBAD MUNICIPAL GOLF COURSE
• Enhanced wedding offerings by completing the partial conversion of the existing women’s locker room into a bridal preparation suite
Professional & Contract Services 220,032$ 295,023$ 269,000$ 311,000$ Supplies & Materials Repair & InterdepartmentalMaintenanceChargesOtherOperatingExpenses
• Maintain and renovate turf, landscaping, drainage and irrigation systems
• Administer management and operations agreement with JC Management, Inc.
Capital Outlay 402,106 144,143 108,000 685,000
SERVICES
RECENT ACCOMPLISHMENTS
TOTAL EXPENDITURES 7,033,434$ 6,718,515$ 7,231,000$ 9,195,000$
• Implemented COVID 19 response through compliant, phased reopening plans in food and beverage operations to allow revenues to resume while maintaining protocols for patron safety
• Maintain and repair clubhouse, snack bar, restrooms and picnic areas available for patrons
COMMUNITY SERVICES |
Operating Expenses
6,411,296 6,279,349 6,854,000 8,199,000
The Crossings at Carlsbad Municipal Golf Course is an 18 hole municipal golf course and event facility. Amenities for public use include a 6,835 yard championship golf course, a clubhouse complete with a golf shop, players’ lounge, sunset patio, banquet facilities, fireplace lit dining room, full service kitchen, outdoor deck with ocean views, and three miles of hiking trails that connect to Veterans Memorial Park. JC Management, Inc. manages this facility via an agreement with the Carlsbad Public Financing Authority.
ABOUT
E 50
• Manage sales and marketing for golf and non golf activities, special events, banquets, weddings and other gatherings
Operating Expenses Subtotal 7,033,434 6,718,515 7,231,000 9,195,000
• Train and oversee marshals, greeters and assistants servicing the course and clubhouse
Account: 572 Fund: Enterprise
• Oversee food and beverage services at the players’ lounge, sunset patio, Canyons Restaurant and snack bar
2019-20Actual 2020-21Actual 2021-22Budget 2022-23Budget
Full Time Positions 0.00 0.00 0.00 0.00 Hourly/FTE Positions 0.00 0.00 0.00 0.00
Performance Measure
• Grow number of banquets and receptions by 2%
• Obtained Carlsbad Public Financing Authority approval on the scheduled replacement of the lithium battery operated golf cart fleet and ancillary cart fleet and ordered replacements
• Install wayfinding banners on street light poles at The Crossings Drive and Palomar Airport Road to improve visibility of the course and restaurant
• Till, replenish sand and improve drainage in selective bunkers near the greens
GOALS
Golf rounds that met pacing goal 91% 91% 90%
• Enhance wedding and banquet opportunities with the design and construction of upgrades to the westside patio and a new groomsman suite in an underutilized area at the back of the clubhouse
• Enhance wedding and banquet opportunities with the design and construction of an event patio outside the front entrance to the clubhouse and adjacent to the new bridal suite
• Replace carpeting within the clubhouse golf shop and offices
Increase in number of banquets and receptions hosted 29% 23% 2%
• Improved drainage on select fairways and greens
• Replace the lithium battery operated golf cart fleet and ancillary cart fleet upon arrival of new carts on order
• Completed monitoring of construction activities for the replacement of liners in the two lakes on the course
• Order and replace designated maintenance vehicles, carts and riding equipment
E 51
• Execute a Capital Improvement Plan with projects that have an anticipated return on investment or are needed for maintenance effectiveness or safety considerations
• Initiate design and permitting of entertainment bays at the driving range for an elevated experience of patrons
• Initiated permit and design tasks for wayfinding banners on street light poles at The Crossings Drive and Palomar Airport Road to improve visibility of the course and restaurant
• Ensure the pace of play is under five hours per round of golf, via staff educating and expediting patrons, and met pace of play goal on at least 90% of rounds played
FYActual2021 FY Estimated2022 FY Projected2023
• Tilled and replenished sand and improved drainage in selective bunkers near greens
• Initiated water conservation and turf replacement plan for areas out of play along Palomar Airport Road
E 52
Administrative Services is a transparent, innovative and efficient support services branch that is accountable for the assets entrusted to it. The branch, comprised of finance, human resources and risk management, innovation & economic development, information technology, and internal audit provides related services to city staff and the public as well as promotes a strong local economy.

Laura DeputyRochaCityManager, Administrative Services 442 339 laura.rocha@carlsbadca.gov2430
ADMINISTRATIVE SERVICES
F 1
Our employees work together to add value to organizational processes, provide timely and reliable service to our community and business partners, and find creative solutions to problems while protecting our assets. Key roles also include attracting and retaining a talented and engaged city workforce and ensuring the economic vitality of the city.

2019-20Actual 2020-21Actual 2021-22Budget 2022-23Budget
Salaries & Wages $ $ 344,395$ 475,970$ Retirement Benefits 80,653 114,312 Health Insurance 44,483 48,747
Full Time Positions 0.00 0.00 3.00 3.00 Hourly/FTE Positions 0.00 0.00 0.50 0.70
• Provide branch leadership and strategic support, long range financial management and budget oversight, internal audit, contract administration, and records management
RECENT ACCOMPLISHMENTS
• Awarded a five year contract to a regional public accounting firm to perform the city’s annual external financial audits and issue the city’s Annual Comprehensive Financial Report
• Developed Internal Audit Plan for fiscal year 2021 22 comprised of value add audit and risk assessment engagements including an audit of the city’s procurement processes and a city wide risk assessment
Other Operating Expenses 8,160 9,060 Capital Outlay
• Completed an internal audit of the city’s code enforcement program which evaluated the effectiveness of the city’s code enforcement policies and procedures and the degree to which code enforcement staff adhered to program guidelines
Other Personnel Expenses 10,251 14,411 Personnel Services Subtotal 479,782 653,440
• Recommended a strategically balanced budget, maintaining City Council approved reserve levels
Personnel Services
Professional & Contract Services 30,000 30,000 Supplies & Materials 5,290 9,790 Repair & Maintenance 200 100 Interdepartmental Charges 45,451 45,407
TOTAL EXPENDITURES $ $ 568,883$ 747,797$
ADMINISTRATIVE SERVICES ADMINISTRATION|
Operating Expenses
Operating Expenses Subtotal 89,101 94,357
Account: 0011110 Fund: General ABOUT Administrative Services Administration provides financial, analytical, budget, strategic and administrative support to the Administrative Services Branch and organization.
SERVICES
F 3
GOALS
FYActual2021 FY Estimated2022 FY Projected2023
• Perform quarterly internal control assessments that contribute to the strength of the city internal control
F 4
• Ensure the city’s short and long term financial status is healthy and sound
• Work with city leadership and City Council to develop plans for addressing any forecast shortfalls in funding for operations and infrastructure
• Enhance transparency, accountability, and integrity in operational areas using innovation and technology to streamline procedures and processes
PerformanceenvironmentMeasure
Delivery of value added internal audit engagements 1 4 5
• Evaluate opportunities for bond refinancing that will result in savings
Performance of internal control assessments 0 1 4
Personnel Services Subtotal 3,839,231 4,230,815 3,606,741 3,473,798
Interdepartmental Charges 477,881 421,112 480,063 706,753
ADMINISTRATIVE SERVICESFINANCE|
Fund: General
• Support treasury administration
ABOUT
• Monitor the economy closely and continuously update the city’s Ten Year Financial Forecast to ensure the General Fund remains in balance throughout the year Present quarterly financial updates to the City Council
Professional & Contract Services 809,639 757,573 923,350 910,940 Supplies & Materials 259,124 217,738 329,870 294,320 Repair & Maintenance 11,157 7,678 12,350 13,975
• Manage receiving, messenger and mail services
Account: 0011310
• Manage debt, cashiering, purchasing, utility billing and business licensing
Capital Outlay 3,000
As a steward of the city’s assets and liabilities, the Finance Department sets and implements a strategic financial management plan and provides information in an effective and timely manner, ensuring the city makes sound financial decisions.
Personnel Services Salaries & Wages 2,726,186$ 2,813,045$ 2,524,627$ 2,381,968$
SERVICES
Operating Expenses
TOTAL EXPENDITURES 5,617,702$ 5,810,863$ 5,632,387$ 5,472,176$
F 5
• Oversee the city budget and long range financial planning
• Provide general accounting and reporting
Retirement Benefits 630,077 952,788 583,702 595,494 Health Insurance 379,662 390,664 411,702 412,860
Other Personnel Expenses 103,306 74,318 86,710 83,476
2019-20Actual 2020-21Actual 2021-22Budget 2022-23Budget
Operating Expenses Subtotal 1,778,471 1,580,048 2,025,646 1,998,378
Full Time Positions 31.00 31.00 28.00 26.00 Hourly/FTE Positions 3.50 3.50 3.00 3.00
• Process payroll and payments
Other Operating Expenses 220,670 175,947 277,013 72,390
• Brought the results of a revenue study forward to the City Council
GOALS
• Continue to improve procedures to mitigate risk through additional controls in payables process
• Assisted with program specific external audits including Utilities, Public Works, and Police
• Continue supporting program specific audit requests for funding the city receives
• Completed the mid year budget review process, which identified budget savings and allowed the City Council to direct these funds to support its goals
• Implemented several internal audit recommendations, including additional guidance on the taxability of transient rent receipts on the city’s website, to maximize the city’s revenue
• Tracked and submitted required reporting for various COVID 19 related grants, including the American Rescue Plan Act State and Local Fiscal Recovery Funds
• Started implementation of new accounting guidance for lease accounting under GASB 87 with completion planned in July 2022
• Implemented the use of electronic submission and storage of all payables documentation and approvals to both streamline processing and reduce paper waste
• Maintained full service of payments to vendors and employees during pandemic shutdowns
F 6
• Began process to implement new accounting guidance for software contracts under GASB 96
• Assisted in the negotiation process for two of the city’s bargaining units, the Carlsbad Police Management Association and Carlsbad Police Officers Association
• Maintained a balanced operating budget and submitted a balanced budget to City Council for fiscal year 2022 23
• Complete implementation and maintenance of GASB 87 and GASB 96
• Implement several modules in the city’s financial information system to increase efficiency and enhance internal controls, including budgeting and contract management
Performance Measure FYActual2021 FY Estimated2022 FY Projected2023 General Fund Reserve Ratio 52% 63% 58% Credit rating AAA AAA AAA
RECENT ACCOMPLISHMENTS
• Upgraded the city’s current financial information system to the latest platform
• Completed the Master Fee Schedule update
• Continue to monitor the economy and its impact to the Ten Year Forecast to ensure the General Fund remains in balance
• Expand the use of electronic bidding to increase efficiencies in the procurement process
• Adopted a local debt policy in accordance with State Assembly Bill 1029
• Continue working with IT and Human Resources to develop a strategic plan for future technology system consolidations
• Integrated the Strategic Digital Transformation Investment Program into the budget
Full Time Positions 17.00 17.00 17.00 18.00 Hourly/FTE Positions 2.20 2.20 2.20 2.20
TOTAL EXPENDITURES 10,598,821$ 12,277,321$ 12,100,412$ 13,552,359$
F 7
Personnel Services Subtotal 2,551,183 2,660,401 2,624,930 3,039,251
Operating Expenses Subtotal 8,047,638 9,616,920 9,475,482 10,513,108
Operating Expenses
HUMAN RESOURCES
• Workers’ Compensation
ADMINISTRATIVE SERVICES
HUMAN RESOURCES: SUMMARY
Personnel Services Salaries & Wages 1,904,629$ 1,859,530$ 1,932,885$ 2,226,427$ Retirement Benefits 394,814 598,304 415,731 522,408 Health Insurance 175,446 174,905 215,008 218,572
|
2019-20Actual 2020-21Actual 2021-22Budget 2022-23Budget
Other Personnel Expenses 76,294 27,662 61,306 71,844
Capital Outlay 3,834
TOTAL FUNDING 10,598,821$ 12,277,321$ 12,100,412$ 13,552,359$
Other Operating Expenses 4,391,389 5,666,592 4,470,050 5,051,850
Professional & Contract Services 3,303,272 3,594,989 4,552,280 5,009,864 Supplies & Materials 94,905 105,691 93,877 100,174 Repair & InterdepartmentalMaintenanceCharges 258,072 249,648 355,441 351,220
• Risk Management
• Human Resources
General Fund 4,302,513$ 4,359,159$ 4,959,011$ 5,264,775$ Internal Service Fund 6,296,308$ 7,918,162$ 7,141,401$ 8,287,584$
• Manage recruitment, retention and onboarding, including the Internship and Department of Defense SkillBridge programs
• Oversee labor relations
Capital Outlay 3,834
Salaries & Wages 1,588,487$ 1,537,269$ 1,653,928$ 1,924,419$
Personnel Services
Account: 00115XX Fund: General
ABOUT
2019-20Actual 2020-21Actual 2021-22Budget 2022-23Budget
• Manage employee engagement, learning and development programs
Supplies & Materials 87,230 101,202 88,774 95,174
Full Time Positions 14.00 14.00 14.00 15.00 Hourly/FTE Positions 2.20 2.20 2.20 2.20
• Monitor and maintain employment compliance
Professional & Contract Services 1,379,795 1,385,821 1,749,780 1,707,864
The Human Resources Department provides services for the employees of the city so they can provide the highest level of service to the public. The responsibilities of the department serve to support the creation of a high performance work culture that can carry out the vision for the organization as defined by the City Council and the City Manager. The primary objectives are achieving compliance with federal and state mandates, making process improvements to increase efficiency and effectiveness and helping the city remain resilient while delivering exceptional service.
• Develop and maintain diversity, equity and inclusion program
Operating Expenses
HUMAN RESOURCES: HUMAN RESOURCES
• Provide for workforce planning
F 8
SERVICES
TOTAL EXPENDITURES 4,302,513$ 4,359,159$ 4,959,011$ 5,264,775$
• Manage employee benefits, leave of absence and personnel actions
Other Operating Expenses 498,379 433,512 570,350 551,150
• Manage employee relations and investigations
• Conduct classification studies
Retirement Benefits 319,916 492,744 349,629 446,332 Health Insurance 144,408 131,789 159,292 163,101
Other Personnel Expenses 51,042 38,766 51,900 61,483 Personnel Services Subtotal 2,103,853 2,200,568 2,214,749 2,595,335
• Maintain competitive and equitable compensation structures
Repair & InterdepartmentalMaintenanceCharges 233,256 238,056 331,524 315,252
Operating Expenses Subtotal 2,198,660 2,158,591 2,744,262 2,669,440
ADMINISTRATIVE SERVICES |
• Conducted multiple executive recruitments without the use of independent contractors, resulting in substantial cost savings
• Resolved Fair Labor Standards Act overtime issue with all bargaining units
FY Estimated2022 FY
RECENT ACCOMPLISHMENTS
• Offered a variety of trainings and worked with an employee committee to develop a City Council approved plan for Diversity, Equity & Inclusion program
• Updated benefit plan documents to remain compliant with all related laws
FY
• Continue to develop Diversity, Equity &I Inclusion program and Department of Defense SkillBridge program
• Maintain 100% compliance for legally mandated employee training
• Offered online classes to support the organization’s learning needs in addition to professional growth and leadership academies
Voluntary turnover rate 4% 9% 10%
• Maintain a voluntary turnover rate of 10% or less
GOALS
• Continue to develop new Let’s Connect program for performance management
• Processed 5,468 job applications in fiscal year 2020 21 and expect to process 6,300 in fiscal year 2021 22
• Provided all mandated training to employees to remain compliant with state and federal law
• Review compensation structure to maintain market competitiveness
• Implement new or updated employment and labor compliance policies
• Conducted negotiations for new labor contracts with the Carlsbad Police Management Association and Carlsbad Police Officers Association
• Continue to increase use of data analytics in all program areas to be used citywide
F 9
• Expand social media outreach for recruitments
Legally mandated employee training compliance rate 100% 100% 100%
• Review employee benefits to maintain compliance and industry standards
• Negotiate labor contracts with Carlsbad Firefighters’ Association and Carlsbad City Employees’ Association, effective Jan. 1, 2023
• Led COVID 19 Task Force in partnership with the Fire Department
• Met and conferred with bargaining units on the Substance Abuse, Discretionary Leave, Catastrophic Leave Donation and Equal Employment Opportunity policies
Performance Measure Actual2021 Projected2023
• Completed 24 full time promotions in fiscal year 2020 21 and expect to process 90 in fiscal year 2021 22
• Filled over 275 vacant full time and part time positions in fiscal year 2020 21 and expect to fill over 370 positions in fiscal year 2021 22
• Continue to collaborate with other North Zone fire agencies to conduct joint promotional assessments to save time and money and improve processes
• Implemented a new SkillBridge program in partnership with the Department of Defense to provide career transition opportunities for those transitioning out of military service
Salaries & Wages 205,024$ 208,192$ 199,626$ 211,880$ Retirement Benefits 49,807 72,127 48,212 53,373 Health Insurance 23,304 31,011 33,628 33,442
Personnel Services
ABOUT Risk Management administers funding of the self insured and insured portions of the city’s liability insurance program which helps protect the city’s financial interests. Risk Management works closely with the City Attorney’s Office and outside legal counsel to monitor, control, and resolve litigated claims. Risk Management also works to recover monetary losses to city property caused by the negligence of third parties. The risk manager serves as the city’s Americans with Disabilities Act Coordinator and assists with ongoing efforts of the city to comply with Title II of the ADA. Additionally, Risk Management oversees the city’s safety compliance program.
Operating Expenses
Capital Outlay
HUMAN RESOURCES: RISK MANAGEMENT
• Pursue loss recovery and manage loss prevention program for employee related losses
• Manage the citywide Safety Program
2019-20Actual 2020-21Actual 2021-22Budget 2022-23Budget
Fund: Internal Service
F 10
SERVICES
• Evaluate and provide advice regarding insurance purchases
ADMINISTRATIVE SERVICES |
• Monitor compliance related to insurance requirements for all citywide independent contractors
Professional & Contract Services 1,405,177 1,672,661 2,041,500 2,516,000 Supplies & Materials 7,675 4,489 5,103 5,000 Repair & InterdepartmentalMaintenanceCharges 24,324 10,632 23,207 23,967
Account: 6121930
Operating Expenses Subtotal 2,223,145 2,356,825 2,919,510 3,474,667
Full Time Positions 2.00 2.00 2.00 2.00 Hourly/FTE Positions 0.00 0.00 0.00 0.00
TOTAL EXPENDITURES 2,515,711$ 2,675,135$ 3,207,702$ 3,780,570$
• Manage subrogation of third party damage to city assets
• Manage all liability claims received by the city
Other Personnel Expenses 14,431 6,980 6,726 7,208 Personnel Services Subtotal 292,566 318,310 288,192 305,903
Other Operating Expenses 785,969 669,043 849,700 929,700
• Collaborate and resolve all risk management related litigation with the City Attorney’s Office
• Continue aggressive follow up on subrogation efforts to maintain city property loss recoveries at 75% or higher
FYActual2021 FY Estimated2022 FY Projected2023
SIGNIFICANT CHANGES IN THIS YEAR’S BUDGET
GOALS
New claims that are closed 88% 80% 80% Recovered damages to city property 78% 80% 80%
• Maintained 78% recovery rate of monetary losses to city property caused by the negligence of third parties in fiscal year 2020 21
• Increased budget for insurance premiums and legal expenses to cover anticipated higher liability and property insurance premiums and legal fees for the coming year
• Maintain at least 80% closure rate for open andor pending claims
• Created citywide COVID 19 Prevention Plan in compliance with California Division of Occupational Safety and Health requirements
• Adopted and implemented Administrative Order No. 6, the Injury & Illness Prevention Program
RECENT ACCOMPLISHMENTS
• Review the ADA strategic plan to increase the effectiveness of the city’s program in preventing discrimination against qualified individuals with disabilities
• Successfully passed a claims audit commissioned by the city’s liability insurance pool
• Continue enhancement of the city’s safety program to ensure better training of employees and fewer accidents
Performance Measure
F 11
Personnel Services Salaries & Wages 111,118$ 114,069$ 79,331$ 90,128$ Retirement Benefits 25,091 33,433 17,890 22,703 Health Insurance 7,734 12,105 22,088 22,029
F 12
GOALS
Fund: Internal Service
SERVICES
• Continue to improve systems to monitor lost days of work
Account: 6111520
2019-20Actual 2020-21Actual 2021-22Budget 2022-23Budget
Other Personnel Expenses 10,821 (18,084) 2,680 3,153
RECENT ACCOMPLISHMENTS
Operating Expenses
Professional & Contract Services 518,300 536,507 761,000 786,000 Supplies & Materials Repair & InterdepartmentalMaintenanceCharges 492 960 710 12,001
• Provide information and recommendations to department supervisors to prevent work related injuries
Other Operating Expenses 3,107,041 4,564,037 3,050,000 3,571,000 Capital Outlay
TOTAL EXPENDITURES 3,780,597$ 5,243,027$ 3,933,699$ 4,507,014$
• Implemented new policies and practices to comply with new legal mandates
• Coordinate employees’ return to work, including light duty assignments
• Resolved and closed 218 claims in fiscal year 2020 21 and expect to resolve and close 225 claims in fiscal year 2021 22
• Continue to share workers’ compensation data with management to effect change, especially in key departments
Operating Expenses Subtotal 3,625,833 5,101,504 3,811,710 4,369,001
Full Time Positions 1.00 1.00 1.00 1.00 Hourly/FTE Positions 0.00 0.00 0.00 0.00
HUMAN RESOURCES: WORKERS’ COMPENSATION
• Work with injured employees and physicians to ensure timely medical treatment
ABOUT This internal service fund is used to support the work related injury and illness program.
ADMINISTRATIVE SERVICES |
Personnel Services Subtotal 154,764 141,523 121,989 138,013
• Work directly with injured employees to settle outstanding claims without litigation
• Continue to make recommendations to reduce the number of days an employee is out of the workplace due to a work related cause
Average lost days of work per claim 56 40 40 Litigated claims as percent of open claims 1% 1% 1%
FYActual2021 FY Estimated2022 FY Projected2023
F 13
• Minimize the number of lost days of work due to work related injuries and illnesses
Performance Measure
• Ensure employees receive timely treatment to reach maximum medical improvement
• Develop workers’ compensation strategic plan and data analytics
• Work directly with injured employees to settle outstanding claims without litigation
TOTAL EXPENDITURES 9,462,572$ 14,283,834$ 14,369,778$ 15,477,967$
Other Personnel Expenses 256,758 (265,758) 136,928 161,902 Personnel Services Subtotal 5,416,754 5,765,064 5,922,847 7,097,087
• Support public safety through technology implementation and support specifically designed for the unique requirements of the Police and Fire departments
INFORMATION TECHNOLOGY
• Provide client services through a service desk, PC support and strategic initiatives
Interdepartmental Charges 21,948 25,608 32,769 35,668
ADMINISTRATIVE SERVICES |
Other Operating Expenses 1,185,872 2,031,060 1,824,512 1,793,150
Operating Expenses Subtotal 4,045,818 8,518,770 8,446,931 8,380,880
• Oversee information technology security policies and practices as well as threat investigation
Full Time Positions 35.00 37.00 37.00 43.00 Hourly/FTE Positions 3.00 1.00 1.00 0.99
Personnel Services Salaries & Wages 3,848,307$ 4,115,428$ 4,202,169$ 5,105,721$ Retirement Benefits 878,094 1,390,694 978,885 1,115,814 Health Insurance 433,595 524,700 604,865 713,650
• Implement and support enterprise software applications and systems
Account: 640, 641 Fund: Internal Service
• Provide project management services to ensure all technology implementations and system upgrades are performed in a standardized methodology
• Support operations through implementation and support of technology infrastructure
SERVICES
Professional & Contract Services 1,104,497 1,868,980 1,440,900 1,331,000 Supplies & Materials 213,292 184,712 121,700 134,497 Repair & Maintenance 1,219,973 2,948,269 3,924,685 4,295,130
F 14
Operating Expenses
2019-20Actual 2020-21Actual 2021-22Budget 2022-23Budget
Capital Outlay 300,236 1,460,141 1,102,365 791,435
• Administer and oversee the department’s use of resources and formation of priorities
ABOUT The Information Technology Department supports the technology needs of all city departments. There are seven service areas within IT, each with specific responsibilities to help the other city departments meet their goals.
• Support the opening of the new Fire Station 2 and temporary Fire Station 7 as well as the Police and Fire Headquarters remodel
• Implemented unified communication system, virtual queuing application, online permitting portal and numerous cyber security program enhancements
• Upgrade enterprise applications such as the Public Works and IT workorder systems, permitting, utility billing customer portal, and the citywide timekeeping system
• Upgraded enterprise applications including the financial, utility billing, utility mobile work order and remittance processing systems
• Expand software platform for records management system forms, business process automation and Police Department analytics
• Completed over 10,000 service desk tickets, deployed more than 300 mobile devices and 250 computers, supported numerous building construction and remodel projects, installed closed circuit video cameras at various city locations, and converted the Police Department’s backfile of thousands of paper records going back 12 years
• Converted one part time position to one full time client systems associate administrator position
• Implement project portfolio management, enterprise asset management, electronic reviews, virtual permit counter, Police computer aided dispatch and mobile system, enterprise digital asset management solution and staff report management system
• Restructured 9.49 business system specialist positions into IT to better support the needs of the city and to standardize the duties of these positions
F 15
• Restructured and reorganized the GIS Division to the Innovation & Economic Development to better support the needs and requirements of the city
• Achieved cost savings through strategic application of internal staff expertise as opposed to leveraging external consultants on large scale technical projects
GOALS
Tickets marked critical incidents 3.08% 2.42% 2.30%
• Develop assessment tools to identify strategies for future projects, including an action plan for IT service improvements
RECENT ACCOMPLISHMENTS
• Enhanced and modernized of the staff identity management solution, technology infrastructure, audiovisual capabilities and public safety data analytics
• Reduce critical incidents to under industry standards of 2.5%
• Added one Assistant IT Director position by restructuring the GIS Manager position, which will oversee the customer based services of IT
Performance Measure FYActual2021 FY Estimated2022 FY Projected2023
• Continue modernization of IT infrastructure for projects supporting improved security and data analytics, such as: extending the Carlsbad Digital Information Network, deploying applications in support of the city's data science efforts, developing a cyber security program, installing closed circuit video cameras at various city locations, and consolidating disparate endpoint management systems
SIGNIFICANT CHANGES IN THIS YEAR’S BUDGET
Other Personnel Expenses 7,676 15,622 19,443 39,591
ABOUT Innovation & Economic Development works to support a vibrant and diverse economy by cultivating a culture of innovation and collaboration among city departments and regular engagement with the business community. Through innovative programming and business support services, I&ED supports economic growth, attracts new businesses in targeted industries, partners with regional economic developers and solidifies the city’s position as a vibrant employment hub. I&ED also provides citywide data services including managing the Data Governance Committee, implementing the Citywide Data Governance and Management policy and providing training for citywide data initiatives to power data driven decision making with analytics and data visualization.
Capital Outlay 135
Operating Expenses
Operating Expenses Subtotal 826,671 518,576 394,993 859,244
SERVICES
Salaries & Wages 193,649$ 662,249$ 646,452$ 1,247,953$
Personnel Services
• Serve all industry sectors through innovative efforts in talent attraction, traded economies and fostering of business clusters that provide for an inclusive economy
• Provide governance and training for citywide data initiatives to power data driven decision making with advanced analytics and data visualization
• Develop and maintain innovative business support programs and act as the city’s liaison to the business community to remove barriers to economic growth and vitality
Interdepartmental Charges 41,148 53,820 104,284 227,128
Other Operating Expenses 10,917 6,498 12,830 43,057
F 16
• Conduct business expansion, attraction and retention activities
2019-20Actual 2020-21Actual 2021-22Budget 2022-23Budget
Personnel Services Subtotal 270,724 909,027 869,633 1,726,707
ADMINISTRATIVE SERVICES |
Retirement Benefits 49,387 175,812 142,175 285,472 Health Insurance 20,012 55,344 61,563 153,691
Professional & Contract Services 724,785 392,923 213,000 411,400 Supplies & Materials 49,821 65,200 64,879 72,259 Repair & Maintenance 105,400
INNOVATION & ECONOMIC DEVELOPMENT
Account: 00110350011033
Fund: General
TOTAL EXPENDITURES 1,097,395$ 1,427,603$ 1,264,626$ 2,585,951$
Full Time Positions 2.00 4.00 4.00 9.00 Hourly/FTE Positions 0.50 1.00 1.00 0.00
• Spurred the creation of innovative data visualization tools to support city goals
• Develop a coordinated approach to citywide data driven decisions
FYActual2021 FY Estimated2022 FY Projected2023
• Developed digital projects and process improvements to maximize savings
• Provided direct training to department analysts on using data visualization tools to allow for data insights self service
• Expand and optimize support services for city businesses and city departments engaging with businesses, including reaching more companies through BEAR activities
• Develop training for performance management, data and continuous improvement Measure
• Convene industry advisory groups to ensure the city is aware of current and anticipated challenges for our diverse business community
Performance
• Expanded the Economic Insights and Intelligence program to deliver various data products including quarterly economic scans
• Continued managing the city’s economic response to COVID 19, including joint communications to Carlsbad businesses with the Carlsbad Chamber, Carlsbad Village Association and Visit Carlsbad and provided direct support to over 800 businesses
Companies reached through BEAR activities 40 45 50
SIGNIFICANT CHANGES IN THIS YEAR’S BUDGET
• Ran innovation sprints to improve processes, save money and deliver more efficient service
• Launched Life in Action Recruiter pilot to directly connect interested talent with companies based on skills
• Implemented the Age Friendly Carlsbad initiative, a cross departmental project supported by AARP to support intergenerational activities and older adults
RECENT ACCOMPLISHMENTS
GOALS
• Transferred the GIS group from IT to I&ED to create the Citywide Data Services group, which is responsible for citywide data governance, GIS services, and data training
• Converted two part time positions to one full time Strategic Plan Analyst to support the city’s growing data needs in meeting City Council goals
F 17
• Implemented small business support programs through the Economic Revitalization and Recovery Initiative including a small business loan program and Gift Carlsbad
• Create and deploy new and innovative programs to support business resiliency
• Developed a data governance and management policy, which was approved by City Council
• Provide more hours of data training to city staff
• Provide citywide training in design thinking, strategic planning, innovation thinking, process improvement and re engineering, data management, data analytics and data visualization
• Drive strategic economic recovery, revitalization and growth
• Provide data systems consultation, evaluation, migration and data system upgrades to ensure business continuity while replacing legacy systems
• Identify opportunities and challenges that can be addressed using data
Hours of data training conducted 28 20 30
MISCELLANEOUSADMINISTRATIVESERVICES|NON-DEPARTMENTAL
F 18
Miscellaneous Non-Departmental Expenditures
Legal Services 697,114 755,312$ 1,200,000$ 1,000,000$
ABOUT
Transfer to General Capital Construction Fund 5,111,500 4,500,000 5,353,000 3,956,000 Transfer to Infrastructure Replacement Fund 5,111,500 4,500,000 5,353,000 3,956,000 Transfer from Infrastructure Replacement Fund (5,070,000)
Transfer to Strategic Digital Transformation Investment Program 3,956,000
Transfer to Storm Water Program 303,052 281,040 322,000 332,000
City Council Contingencies Contingencies 500,000 500,000
TOTAL EXPENDITURES 19,963,985$ 60,122,092$ 10,570,000$ 15,121,658$
General Fund Transfers
MISCELLANEOUS NON-DEPARTMENTAL
Vacancy Savings (2,000,000)
Personnel Related 152,582 184,337$ 850,000 1,050,000 Professional Services 39,195 34,194$ 42,000 41,658
Miscellaneous Non-Departmental Subtotal 6,397,819 3,109,546 2,922,000 1,021,658
Other Miscellaneous Expenditures 3,860,320 1,055,650$ 100,000
Transfer to LLD #1 (Medians & Trees) 950,000 700,000 1,190,000 1,400,000
Account: 00190XX Fund: General
Dues and Subscriptions 71,519 72,714$ 80,000 80,000
Community Contributions 7,983 2,595$
COVID 19 related expenditures in fiscal years 2019 20,2020 21, and 2021 22 are associated with the COVID 19 Economic Recovery and Revitalization Initiative and COVID 19 specific expenditures that the city believes are recoverable through various reimbursements.
2019-20Actual 2020-21Actual 2021-22Budget 2022-23Budget
Miscellaneous Transfers Out 2,090,114 47,031,506
The miscellaneous non departmental accounts for all General Fund transfers to other funds, City Council contingencies and other miscellaneous General Fund expenses, such as outside legal counsel, personnel vacancy savings, citywide final vacation pay, and citywide dues and subscriptions.
Vacancy savings, or anticipated personnel savings over the course of the fiscal year, are being added to the budget in fiscal year 2022 23. Accounting for $2 million in vacancy savings will allow for budgeted personnel costs to more closely align with actual personnel costs in the General Fund.
General Fund Transfers Subtotal 13,566,166 57,012,546 7,148,000 13,600,000
Property Tax and Other Administration 658,895 759,165$ 750,000 750,000
COVID-19 Related 910,211 245,579$
ADMINISTRATIVE SERVICES |
Scott Chadwick City Manager
442 339 manager@carlsbadca.gov2820
• Communication & Engagement
The City of Carlsbad follows a council manager form of government, where elected City Council members provide direction on the policies and regulations that govern the operations of the city. The Policy & Leadership branch includes the following areas:

• Office of the City Council
• Office of the City Manager
• Office of the City Attorney
POLICY & LEADERSHIP
G 1
• Office of the City Treasurer (elected)
• Office of the City Clerk (elected)
The City Council appoints the city manager, city attorney and members of the city’s boards, commissions and committees. The Office of the City Manager handles administration and oversight of the city organization, including hiring the city workforce, supervising city departments and ensuring the City Council’s policy priorities are met.
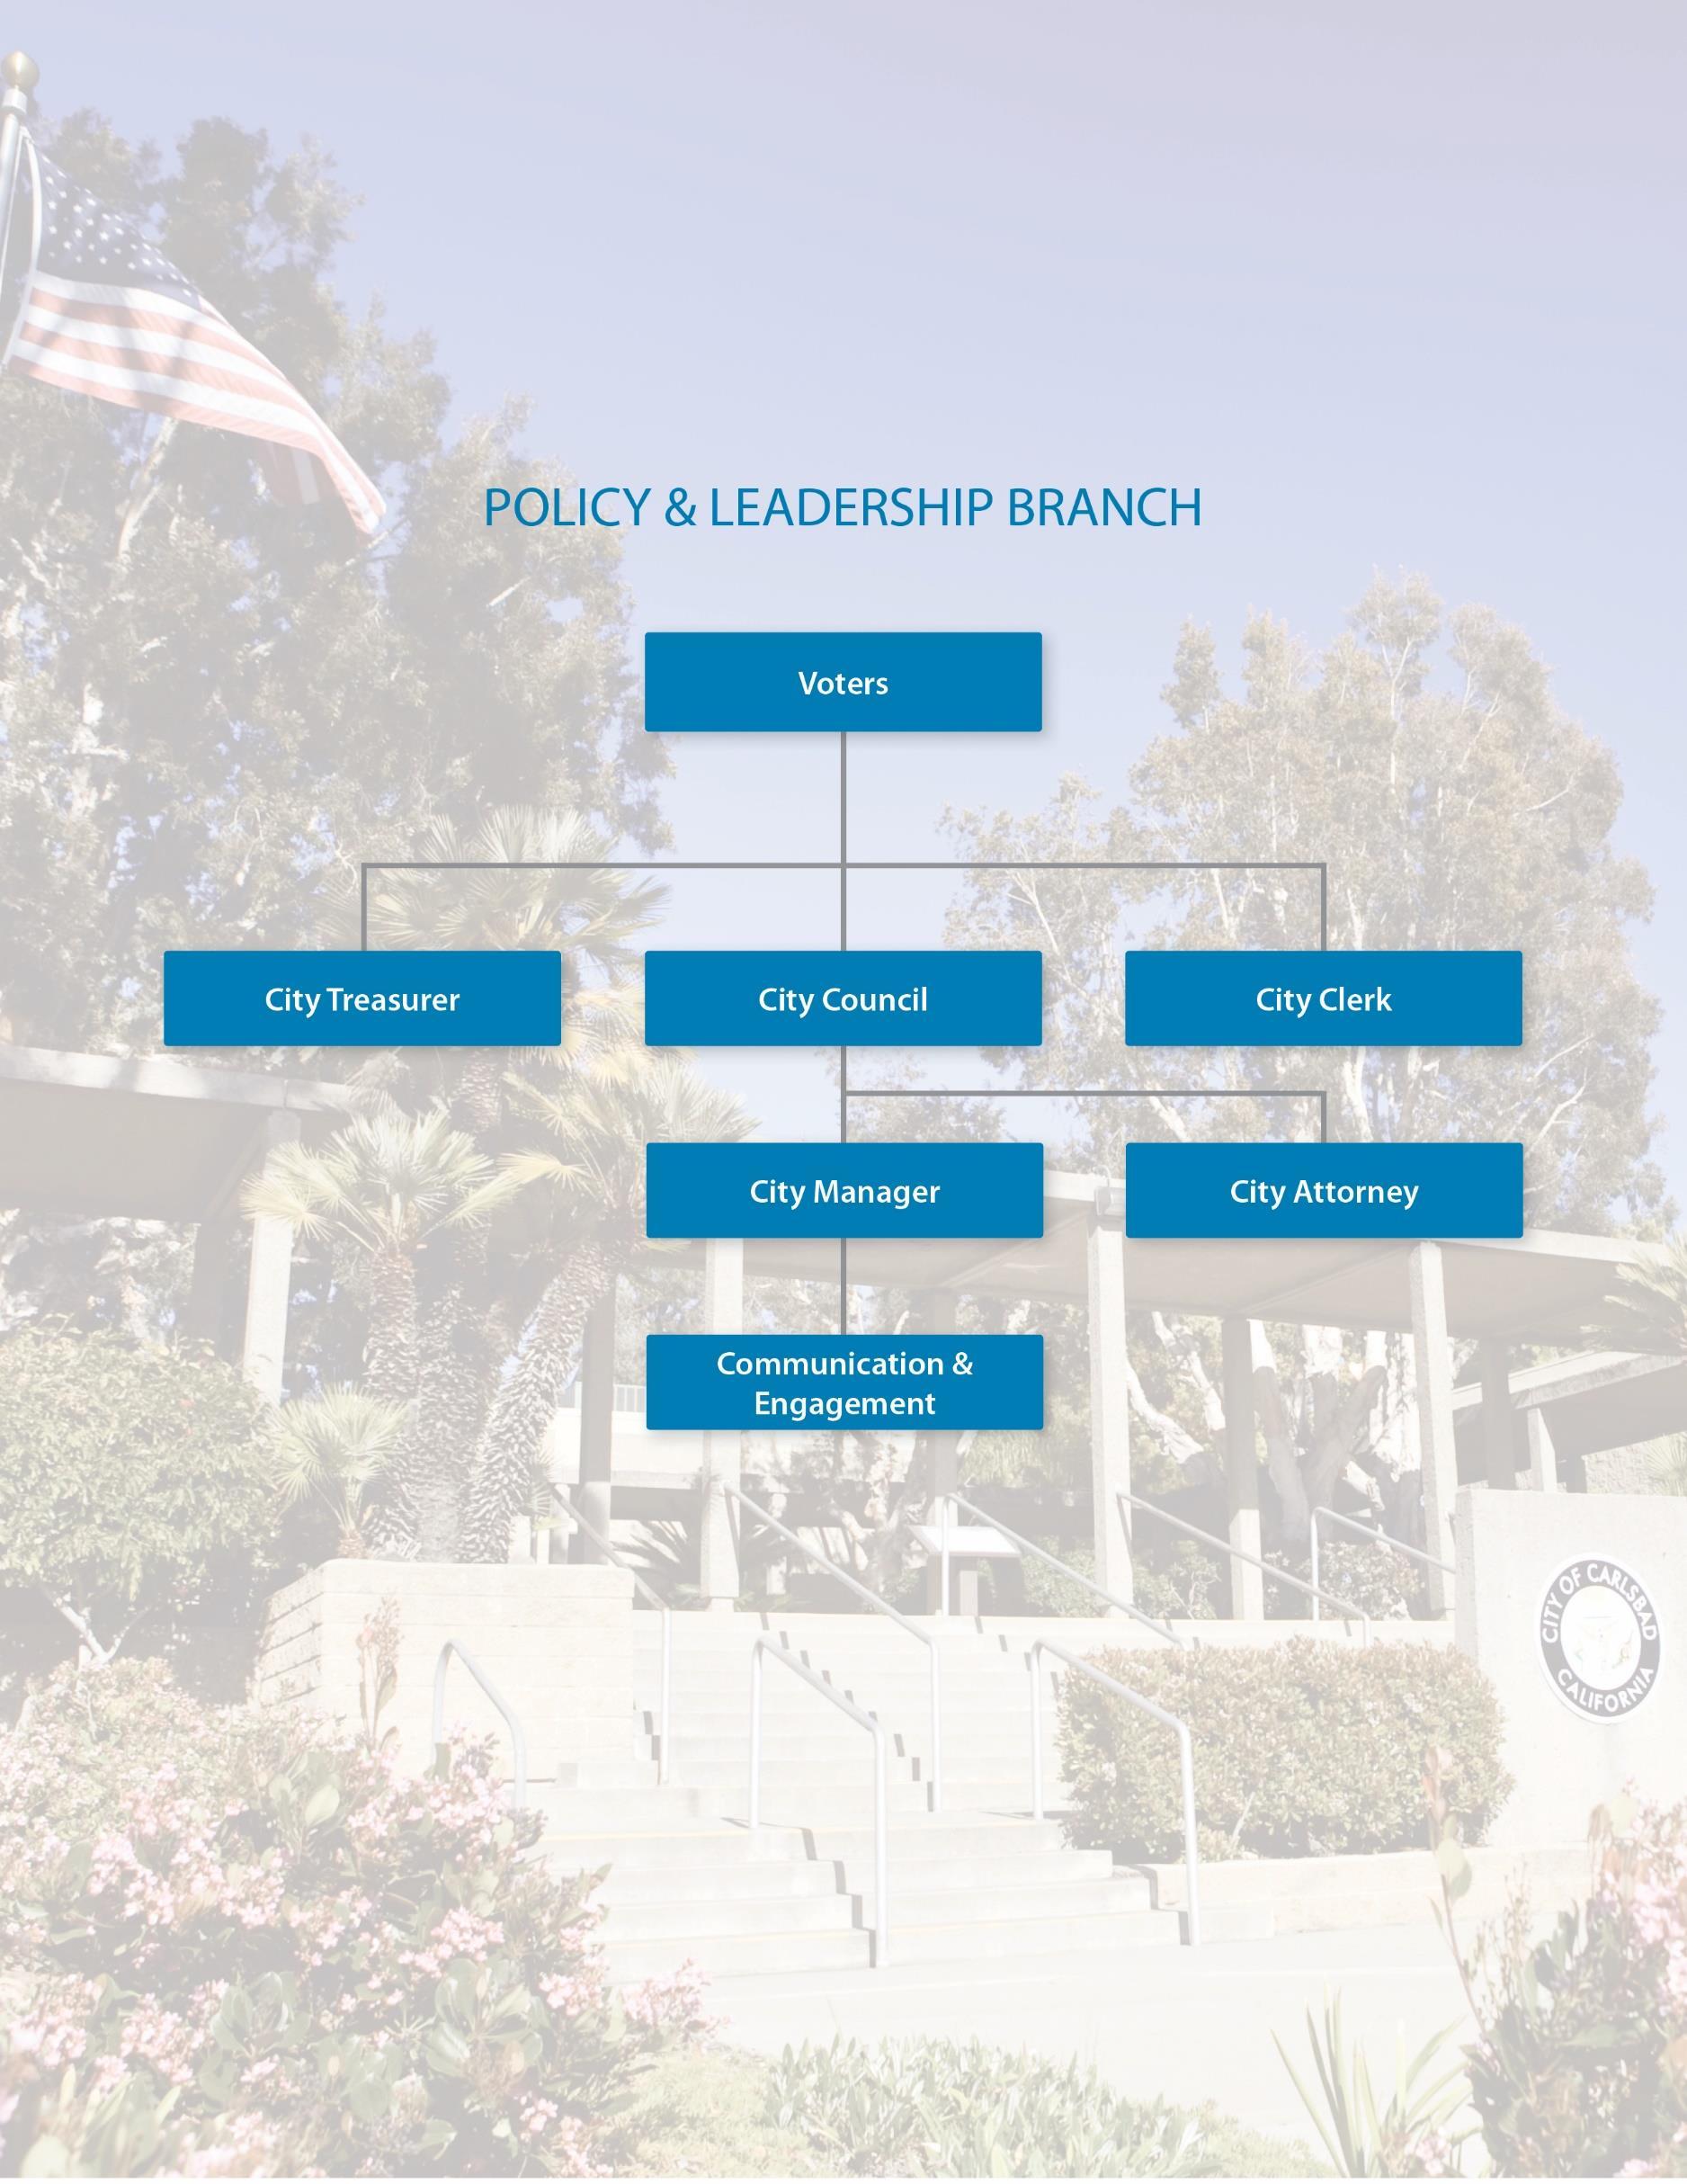
Health Insurance 71,041 85,962 102,479 85,148
The City Council is continuing work to advance their goals identified in fiscal year 2021 22 and to refine them through an ongoing Strategic Planning Process. In December 2021, the City Council initiated work on a five year Strategic Plan and identified five goal themes:
Salaries & Wages 260,589$ 274,624$ 286,814$ 295,280$
Capital Outlay Operating Expenses Subtotal 75,436 36,899 194,530 203,193
TOTAL EXPENDITURES 466,528$ 487,977$ 649,975$ 652,220$
• Organizational excellence and fiscal health
Professional & Contract Services 1,815 5,453 46,000 46,500 Supplies & Materials 10,756 6,211 24,929 25,310 Repair & InterdepartmentalMaintenanceCharges 34,992 25,020 79,815 88,478
SERVICES
Retirement Benefits 51,736 84,102 60,010 62,121
As the legislative body of the city, the Office of the City Council establishes the policies and regulations under which the city operates.
Full Time Positions 2.00 2.00 2.00 2.00 Hourly/FTE Positions 0.00 0.00 0.00 0.00
POLICY AND LEADERSHIP |
• Sustainability and the environment
2019-20Actual 2020-21Actual 2021-22Budget 2022-23Budget
The City Council, as a legislative body, approves direction, policies and regulations that govern the operations of the city. The City Council appoints residents to serve on various boards and commissions and may serve as city representatives on regional boards such as SANDAG, North County Transit District and the San Diego County Water Authority.
ABOUT
Other Personnel Expenses 7,726 6,390 6,142 6,478 Personnel Services Subtotal 391,092 451,078 455,445 449,027
OFFICE OF THE CITY COUNCIL
G 3
GOALS
• Quality of life and safety
Personnel Services
• Community character
Other Operating Expenses 27,873 215 43,786 42,905
Operating Expenses
• Economic vitality
Account: 0011010 Fund: General
Specifically, the current goals are targeted at:
G 4
• Bringing the city’s Fire Department into conformance with Standards of Cover evaluation, a comprehensive review of fire and emergency medical services that identified the need for additional staffing and facilities to address the city’s changing demographics and development patterns
• Fostering constructive City Council communication and teamwork and operating in accordance with the city’s new ethics ordinance to support the delivery of superior public service
• Initiating work through a citizens committee to create a new plan to manage growth in a way that maintains an excellent quality of life
• Reducing the city’s unsheltered homeless population among those who want help by 50% within five years
• Diversity, equity and inclusion
• Technology infrastructure
• Meaningful and early public engagement
The City Council also identified three key areas to be integrated into everything the city does:
Salaries & Wages 84,431$ 87,323$ 88,744$ 93,617$ Retirement Benefits 20,613 32,101 20,406 22,729 Health Insurance 21,316 25,958 28,773 26,346
TOTAL EXPENDITURES 215,784$ 235,400$ 250,752$ 249,945$
RECENT ACCOMPLISHMENTS
Manage reporting and oversight of the city’s cash and investments
Operating Expenses Subtotal 86,532 87,650 110,122 104,347
SERVICES
Account: 0010310 Fund: General ABOUT
Personnel Services
POLICY AND LEADERSHIP |
Other Operating Expenses 17 4,425 6,400 Capital Outlay
The Office of the City Treasurer provides cash and investment management services which adhere to the city’s Investment Policy and meet the changing investment needs of the city to optimize investment returns, consistent with maintaining safety of principal, ensuring sufficient liquidity and return on investment.
• Researched and expanded investment opportunities into municipal bonds
• Expanded the cash handling process
• Assisted with planning and implementation of the new payment portals for permitting
Professional & Contract Services 60,974 57,086 70,600 74,229 Supplies & Materials 2,081 1,488 2,414 1,810 Repair & InterdepartmentalMaintenanceCharges 23,460 29,076 32,683 21,908
2019-20Actual 2020-21Actual 2021-22Budget 2022-23Budget
• Worked with the Finance Department on the upgrade of the city’s financial information system
Operating Expenses
Other Personnel Expenses 2,892 2,368 2,707 2,906 Personnel Services Subtotal 129,252 147,750 140,630 145,598
• Worked with the Finance Department to upgrade the city’s safe and armor pickup system
Full Time Positions 1.00 1.00 1.00 1.00 Hourly/FTE Positions 0.00 0.00 0.00 0.00
G 5
OFFICE OF THE CITY TREASURER
GOALS
• Anticipate and meet the changing investment needs of the city to optimize investment returns, consistent with maintaining safety of principal while ensuring sufficient liquidity and return on investment
• Further develop the City Treasurer webpage on the city’s website, informing the community of the mission of the City Treasurer, the city’s Investment Policy and investment activities
• Use the City Treasurer webpage of the city’s website as a forum to receive and respond community comments and questions
• Continue to participate in the city’s Citizens Academy
• Use innovative solutions to fund modern and secure cash handling solutions even in uncertain times
G 6
Personnel Services
Capital Outlay (3,272) 541 Operating Expenses Subtotal 356,335 241,394 554,955 494,928
Full Time Positions 12.00 7.00 7.00 7.00 Hourly/FTE Positions 0.50 0.00 0.00 0.00
The City Manager’s Office provides City Council support, administrative leadership of city operations, policy development management, monitors and manages legislative affairs and provides general management of public communication and engagement.
The Office of the City Manager is dedicated to continuous improvement and organizational excellence that fosters the well being of a high performing organization that delivers impactful results to further the public good.
• Initiated a five year Strategic Planning effort to assist in prioritizing the goals and objectives of the City Council and community, focusing on long term fiscal sustainability and CIP prioritization
OFFICE OF THE CITY MANAGER
• Reduced and restructured the city budget in response to continuing COVID 19 related fiscal and operational impacts
G 7
Salaries & Wages 1,608,369$ 1,061,278$ 1,097,959$ 1,167,148$ Retirement Benefits 387,446 475,362 282,128 316,038 Health Insurance 175,974 133,336 144,821 143,953
POLICY AND LEADERSHIP |
Account: 0011010 Fund: General ABOUT
SERVICES
RECENT ACCOMPLISHMENTS
• Ensured timely follow up of all City Council and constituent services requests
Other Personnel Expenses 46,837 28,167 32,234 34,078 Personnel Services Subtotal 2,218,626 1,698,143 1,557,142 1,661,217
2019-20Actual 2020-21Actual 2021-22Budget 2022-23Budget
Operating Expenses
Other Operating Expenses 32,175 4,423 29,543 38,618
• Led the city’s response to the COVID 19 public health emergency, including a safe and measured return to in person services
Professional & Contract Services 154,796 115,652 377,365 305,240 Supplies & Materials 37,432 22,318 43,129 55,179 Repair & InterdepartmentalMaintenanceCharges 135,204 98,460 104,918 95,891
TOTAL EXPENDITURES 2,574,961$ 1,939,537$ 2,112,097$ 2,156,145$
• Managed robust state and federal legislative program including sponsorship of state legislation as well as coordination of City Council Legislative Committee
GOALS
• Supported Clean Energy Alliance expansion and operations
• Extensive collaboration with neighboring cities and regional organizations to better share best practices for improved cooperation and efficiencies in government
• Continue to effectively manage the response, reopening and recovery related to the COVID 19 public health emergency
• Ensure the most efficient and effective provision of city services while adapting to changing financial conditions
G 8
• Adapt community engagement and transparency efforts to foster authentic civic engagement with residents, organizations and businesses through alternative methods due to public health restrictions
• Increase intergovernmental collaboration and legislative advocacy with local, state and federal governments to further the City Council adopted legislative platform and support as needed special projects
Operating Expenses
Professional & Contract Services 2,576 3,063 3,445 2,700 Supplies & Materials 44,218 31,209 41,341 35,757 Repair & InterdepartmentalMaintenanceCharges 122,472 97,332 129,456 106,780
OFFICE OF THE CITY ATTORNEY
Personnel Services Subtotal 1,723,576 1,900,638 1,846,825 1,871,959
Health Insurance 114,307 129,650 148,875 145,714
Capital Outlay Operating Expenses Subtotal 186,484 135,828 190,311 161,549
• Represent the city in court proceedings and report to the City Council on litigation
• Appear on behalf of the city before regulatory and legislative agencies
Account: 0011210 Fund: General ABOUT
• Prepare and review ordinances and resolutions
Personnel Services
POLICY AND LEADERSHIP |
2019-20Actual 2020-21Actual 2021-22Budget 2022-23Budget
Full Time Positions 8.00 8.00 8.00 8.00 Hourly/FTE Positions 0.00 0.00 0.00 0.00
SERVICES
• Provide legal opinions on questions from the City Council, City Manager or other city officers
• Negotiate and prepare all contracts
Other Operating Expenses 17,218 4,224 16,069 16,312
TOTAL EXPENDITURES 1,910,060$ 2,036,466$ 2,037,136$ 2,033,508$
Salaries & Wages 1,260,706$ 1,266,674$ 1,320,642$ 1,332,053$ Retirement Benefits 311,635 472,390 338,520 354,851
• Enforce city laws and regulations
• Prepare contracts, forms and instruments for approval or execution
• Advise the City Council, committees, boards and commissions
• Attend City Council meetings as well as meetings of other boards and commissions as deemed necessary
G 9
The Office of the City Attorney consists of the city attorney, three assistant city attorneys, two deputy city attorneys and support staff. The city attorney is appointed by the Mayor and the City Council.
Other Personnel Expenses 36,928 31,924 38,788 39,341
• Support the City Manager in strategic operations related to ongoing and significant capital projects
• Prepared new Municipal Code provisions related to the theft of catalytic converters, e bike safety and the reduction of single use plastics
G 10
• Worked with Police Department to obtain Gun Violence Restraining Orders as appropriate for domestic violence and mental health incidents
• Advised the City Council, City Manager and city staff on legal issues related to the development and implementation of programs to address issues of homelessness
• Spearheaded the formation of a countywide attorney discussion group on homelessness through the City Attorneys’ Association of San Diego County
GOALS
RECENT ACCOMPLISHMENTS
• Advised the City Council, City Manager and city staff on legal issues related to state and county health orders
• To provide quality and timely legal advice to all elected and appointed city officials and all branches, assisting them in making sound legal decisions to carry out the goals of the City Council
• Assisted with establishing, staffing and advising the city’s first Independent Redistricting Commission and prepared Municipal Code revisions to implement new City Council District maps
• Reviewed and advised on numerous contracts, public records requests and City Council inquiries
• Complete comprehensive update of Municipal Code, City Council policies and administrative orders
Professional & Contract Services 24,427 30,415 100,500 70,500 Supplies & Materials 80,672 45,894 66,406 42,456 Repair & Maintenance 677 5,221 4,196
• Maintain, preserve and provide access to all legislative documents
• Prepare minutes
SERVICES
• Respond to Public Records Act Requests
Health Insurance 102,851 96,418 106,349 109,601
Full Time Positions 7.00 7.00 7.00 7.00 Hourly/FTE Positions 1.00 1.00 1.00 1.00
2019-20Actual 2020-21Actual 2021-22Budget 2022-23Budget
Operating Expenses
Personnel Services Subtotal 831,999 898,592 890,155 933,973
TOTAL EXPENDITURES 1,126,417$ 1,207,035$ 1,300,469$ 1,394,162$
POLICY AND LEADERSHIP| OFFICE OF THE CITY CLERK
Other Operating Expenses 44,318 111,486 81,800 199,800 Capital Outlay
Personnel Services
ABOUT
G 11
• Assist City Attorney’s Office with citywide ethics training
Other Personnel Expenses 23,359 15,723 20,069 21,990
• Prepare City Council agendas
• Maintain Fair Political Practices Commission filings
• Provide proofs of life certifications
• Complete legal noticing and publishing
Salaries & Wages 586,938$ 593,961$ 630,775$ 659,421$ Retirement Benefits 118,851 192,490 132,962 142,961
The Office of the City Clerk serves as a vital link between city government and those it serves, providing access to public records, publishing City Council agendas, preparing minutes and serving as the city’s election official.
Account: 0010210, 0011610 Fund: General
Interdepartmental Charges 144,324 120,648 156,387 143,237
• Maintain Carlsbad Municipal Code
• Notarize documents
• Administer elections
• Ensure public records are archived, preserved and accessible to the public
Operating Expenses Subtotal 294,418 308,443 410,314 460,189
• Conducted the process to fill the City Council District 1 vacancy
• Provide greater access to public records on the city website
• Explore automation and workflows in Laserfiche
• Obtain a digital posting board to push out all agendas electronically throughout the city for greater accessibility in conformance with the Brown Act
• Provide document research assistance to staff and the public
• Evaluate feasibility of offering passport application acceptance services
• Develop and implement records management and document management programs
• Assisted Fire Prevention in creating a digital records process and digitizing their legacy records
• Continue to systematically update the Carlsbad Municipal Code and City Council Policies
RECENT ACCOMPLISHMENTS
• Facilitated the live streaming of all board and commission meetings
• Process recorded documents and bond releases
• Began work on the agenda management workflow process through Laserfiche
• Process subpoenas, summons and claims
GOALS
• Provide Citywide Public Records Act and Ethics training
• Continue to collaborate with various departments on digitizing their documents
• Conduct the November 2022 General Municipal Election
• Completed the redistricting process for the city
• Manage and coordinate destruction of records past retention
• Updated the Carlsbad Municipal Code relating to the elected City Clerk
• Perform the 2022 Conflict of Interest Biannual Review
• Continue to conduct departmental records audits
• Provide training and support to various department personnel designated to scan documents into the city’s records repository
G 12
• Update the Records Retention Schedule and provide city staff with training
• Fully automate the staff report routing process through Laserfiche
• Completed drawing mylar consolidation project, which consolidated 40,000 pdf files into 4,000 multipage pdf files
• Placed Measure C Appointive City Clerk on the June 2022 Statewide Primary Election
• Develop community engagement programs that facilitate early and meaningful public input in city government decision making
Capital Outlay 4,242 162,484
SERVICES
G 13
ABOUT
Professional & Contract Services 468,064 323,325 575,250 516,201 Supplies & Materials 156,765 73,442 128,091 107,686 Repair & InterdepartmentalMaintenanceCharges 144,600 134,940 172,377 194,963
POLICY & LEADERSHIP |
Full Time Positions 7.00 7.00 7.00 9.00 Hourly/FTE Positions 3.50 3.50 3.50 1.50
Other Personnel Expenses 29,037 19,566 27,831 34,715
Account: 0011012, 0011016 1381010 Fund: SpecialGeneralRevenue Local Cable Infrastructure
Other Operating Expenses 26,296 17,401 30,505 33,467
• Manage the city’s digital communication channels, including the city website, social media, email and text alerts, and an employee intranet
Salaries & Wages 784,116$ 756,371$ 887,064$ 1,073,526$ Retirement Benefits 140,573 230,127 171,276 239,499 Health Insurance 105,126 112,283 123,779 174,135
Personnel Services
The city’s communication and engagement program has two main areas of focus: to foster open, two way communication with the community about city issues, programs and services, leading to a more responsive and transparent government; and to encourage and facilitate the community’s participation in city decisions that affect their lives. This department is also responsible for promoting communication and engagement within the city organization so employees are not only informed but can see how their day to day work supports the larger city mission.
2019-20Actual 2020-21Actual 2021-22Budget 2022-23Budget
Operating Expenses Subtotal 799,967 711,592 906,223 852,317
• Develop informational materials including fact sheets, fliers and newsletters that further understanding of city issues, news, services and events
Personnel Services Subtotal 1,058,852 1,118,347 1,209,950 1,521,875
General Fund 1,651,700$ 1,493,938$ 1,771,173$ 1,979,186$ Special Revenue Fund 207,119 336,001 345,000 395,006 Total Funding 1,858,819$ 1,829,939$ 2,116,173$ 2,374,192$
TOTAL EXPENDITURES 1,858,819$ 1,829,939$ 2,116,173$ 2,374,192$
COMMUNICATION & ENGAGEMENT
Operating Expenses
3 4 4
• Communicate directly with community members through a combination of social media and email an average of five times a week
• Produce an average of three news releases per week highlighting city news and programs
• Posted 1,140 tweets generating 823,000 impressions
3 4 3 Average
• Sent 550 targeted emails regarding city issues, programs and events, with an average open rate of 55%, more than double the industry standard
• Increased email database to 83,000, an increase of 16% over the previous year
• Enable the community to watch City Council meetings and find out about city issues, news, services and events on a dedicated 24/7 government cable channel
Number of community engagement programs annually number of news updates prepared per week
G 14
• Provide accurate, timely information to the media
• Gathered community input on the City Council strategic plan, the future of south Carlsbad’s coastline, sites for new housing, the CAP Update, City Council redistricting, Barrio lighting and Veterans Memorial Park memorial designs and objective design standards
• Produced 169 videos and generated a total of 1.4 million video impressions
GOALS
• Produced and distributed 246 news releases and articles about city services and programs
• Posted 1,700 updates on Facebook generating 768,000 impressions
• Maintain a trained team of city staff ready to perform public information duties 24/7 in case of an emergency
• Developed and distributed 52 editions of the city’s e newsletter
RECENT ACCOMPLISHMENTS
• Complete a minimum of three community engagement programs with at least 500 participants each for citywide programs and 150 participants each for neighborhood specific programs
• Develop informational videos and produce video recordings and livestream all City Council meetings and meetings of boards, commissions and committees
• Provide communication skills training to city staff
Average number of direct communications with memberscommunityperweek
5 5 5
Performance
• Increased Instagram followers to 17,000, an increase of 15% over the previous year
• Launched a new online public engagement portal, attracting more than 3,000 participants in its first three months
• Write and edit staff reports to ensure information presented at City Council meetings is clear, complete and accurate
• Increased YouTube subscribers to 2,456, an increase of 17% over the previous year
Measure FYActual2021 FY Estimated2022 FY Projected2023
• Provide employee communication that supports an informed and engaged workforce
• Provide communication skills training to city staff
STRATEGIC DIGITAL TRANSFORMATION INVESTMENT PROGRAM
Connected Carlsbad: An Inclusive City Innovation Roadmap
In January 2019, city staff presented Connected Carlsbad: An Inclusive City Innovation Roadmap, designed to provide a high level, organized guide outlining the principles that matter to the city in creating a more connected community. This roadmap and its associated action plan were based on a combination of items, including:
The Strategic Digital Transformation Investment Program expands on the Connected Carlsbad Roadmap to include a strategy for evaluating and prioritizing projects and a five year investment roadmap that includes estimated costs and timelines. This new investment program continues to be organized into the five primary goal areas approved by City Council in Connected Carlsbad, listed below.
• Enhance Accessibility and Transparency recognizes that open government and approaching problem solving from an accessibility perspective leads to better outcomes for all.
H 1
• City Council approved projects,
• Pursue Communitywide Digital Transformation focuses on the foundational elements, including connectivity, up to date hardware and software, and a robust security strategy while providing an aspirational vision for the future.
The Strategic Digital Transformation Investment Program, or SDTIP, is a comprehensive approach to planning for and funding digital transformation efforts throughout the city. Several documents inform this program, including the City Council approved Connected Carlsbad: An Inclusive City Innovation Roadmap, the Internal Digital Information Network Action Plan, and the Information Technology Strategy, which are complemented by a five year projected roadmap of digital transformation investments The SDTIP is the strategic plan for technology and digital transformation combined with project descriptions, costs, funding sources and timelines. The purpose of this new program is to provide for an annual investment strategy, not a commitment for spending, that outlines a five year expenditure plan for future digital transformation and technology projects and the corresponding revenues necessary to pay for them.
• existing city documents,
• Promote Safety and Sustainability through Connectivity leads to understanding the interconnected nature of our communities that can achieve environmental, mobility and sustainability goals when approached in a cross departmental and community informed manner.
• Foster a Vibrant Civic Engagement Culture builds upon the first two goals with a human centered perspective that an engaged city that uses data and technology in a way that respects people and their privacy will support a vibrant culture where residents, organizations and businesses are invested in their community and its future.
• a global scan of other cities and best practices that have emerged from leading smart city thinkers and Carlsbad specific community engagement.
• previous Information Technology assessments and interviews with departments, and
• Build Capacity for Data Driven Government focuses on the policies, procedures and staffing necessary for the city to fully capture the value of emerging models of data analytics.
INVESTING IN DIGITAL TRANSFORMATION
H 2
As the city continues to grow and develop, the use of technology has also grown exponentially over the last two decades. The SDTIP outlines the financial resources needed to ensure that the technology infrastructure is in place to enable the city to provide services to the community Prudent financial planning will ensure that ongoing funding for investment in technology is available.
Strategic TransformationDigitalInvestmentProgram Public Health and Safety City OrganizationalVisionMission,andValuesCommunityValuesCityCouncilGoals DocumentsGoverningandPolicy EnvironmentalAvailabilityFundingReviewTechnologyStandardsandStrategicPlans
A number of factors are considered when putting together projects for the five year program. All digital transformation and technology projects shall be consistent with:
PROJECT EVALUATION
Once City Council adopts the proposed Strategic Digital Transformation Investment Program, projects receive an appropriation that authorizes spending in the amount specified for the adopted fiscal year only. Estimated budget information is shown for a five year period to provide the most comprehensive information about known future projects. Spending authority in future years is not granted until adoption of the annual proposed SDTIP budget associated with each year.
Making decisions on technology implementations is a challenging and complex task. The challenging nature of these decisions is exacerbated by the expanding reach of technology and the increasingly interdisciplinary nature of emerging technologies. A major component of the SDTIP is the establishment of a cross departmental approach to technology leadership to evaluate, prioritize, budget for and adopt digital transformation efforts A new administrative order has been developed that provides a collaborative forum for key staff to validate and prioritize technology implementations. This approach also provides a structured venue to explore how particular configurations of a technology implementation may positively or negatively affect others within the organization. The process to evaluate digital transformation initiatives is ongoing and meetings may be held on a monthly, bimonthly or quarterly basis depending on the need
Proposed projects are evaluated and prioritized by a set of criteria that include:
• Coordination of IT investments across the enterprise to avoid duplication, maximizing the return on investment and increasing efficiency
• Consideration of potential project risks and identification of appropriate means to manage those risks
As the SDTIP is implemented throughout the year, staff continually re evaluate projects’ scopes, costs and schedules to responsibly and cost effectively manage city resources.
• Accuracy and reasonableness of cost and benefit estimates
Although digital transformation is a collaborative effort involving all city departments, Information Technology is the core department that is responsible for delivering projects approved in the Strategic Digital Transformation Investment Program The IT Department is also responsible for ensuring that technology implementations operate efficiently and effectively to support the delivery of services to the city’s residents, businesses and visitors.
o Understanding the business to get to the best yes
INFORMATION TECHNOLOGY STRATEGY
Mission and Guiding Principles
• Effective articulation of the business case including valid operational benefits of the project
Leveraging partnerships, people, and technology, we collaborate with the organization to deliver the best solutions for the City of Carlsbad.
We partner with the organization to deliver innovative solutions by:
• Adherence to standard project management practices
In late 2021, the IT leadership team conducted a multi day strategic planning workshop and developed a robust and detailed strategic plan update. This exercise involved development of numerous strategic initiatives that align with overall city business goals and the creation of Vision, Mission and Values statements to guide leadership on future endeavors.
Our guiding principles are as follows:
o Embracing and guiding change
• Alignment with City Council goals and IT strategic plans, architecture, security and technology standards, including legislative and regulatory mandates, and administrative goals
• Capacity of staffing resources to implement the project
In 2022, the IT Department underwent a re organization to better align the team for continued success. As part of this re alignment, Geographic Information Systems, or GIS, moved from the IT Department to the Innovation and Economic Development Department to create a new citywide Data Services Division Additionally, the IT Department created an Assistant IT Director position overseeing administration, client services, project management and security to better align coordinate the IT Department and city operations The IT Department was able to create the role of the Assistant IT Director without adding a new position due to the retirement of the GIS manager.
o Consistently asking is there a better way
H 3
The Mission for the IT department is:
o Having a bias towards action and taking calculated risks
• Measure to Improve
• Deliver Services and Solutions
We create a great work environment by:
H 4
Alignment between the five goals presented in the Connected Carlsbad Roadmap and the strategic goals of the IT Department are critical to delivering effective technology services. This exercise was key to the development of the strategic goals.
Strategic Goals
o Empowering staff
o Being accountable for our work and delivering on our promises
o Celebrating our success and learning from our mistakes
o Safeguarding the city’s digital assets
We build trust within the organization by:
• Develop the Workforce
The IT department has developed five strategic goals:

o Communicating early and often
• Connect with the Organization
o Supporting each other
o Prioritizing growth and education
o Being approachable
• Drive Operational Standardization
The IT Enterprise Applications Division is divided into two sections, database management and enterprise application management.
H 5
Division provides support to the other IT Department divisions by centralizing the management of staff reports, contracts and agreements, accounts payable, purchasing, budgeting, and coordination of asset replacement requirements. Having central staff to handle these functions allows for continuity of procedures and standards within the department.
Client Services
The IT Department is organized into multiple divisions, including Enterprise Applications, Infrastructure and Operations, Project Management, Client Services, Public Safety, Security and Administration. These divisions work together to provide services that are crucial to digital transformation efforts.
The software applications used in the city deliver major technical services to city staff, providing them with the technology tools and data necessary to do conduct their core business functions and make data driven decisions.
The database management team provides technical support and expertise related to the city’s database infrastructure. This includes ensuring the city’s database infrastructure is stable, secure and readily available to support the city’s enterprise applications. Additionally, the database management team works closely with the city’s Business Intelligence & Data Analytics Manager on initiatives related to data governance and operational analytics.
The city also has numerous technologists, known as Business Systems Specialists, embedded into various departments in the city. These include departments in the Public Works branch, Parks & Recreation, Library & Cultural Arts, Finance and Community Development departments. These technologists specialize in the business processes of their respective departments, assist in the administration of that department’s enterprise applications, and serve as technology liaisons between Information Technology and the department. The goal of the Business Systems Specialists team is to investigate business systems, identify options for improving business systems and bridge the needs of the business through technology solutions.
The Information Technology Department
TheCybersecurityCybersecurity
IT Department Divisions
Client Services provides the first level of support in the IT department. This group manages the service desk, where staff call to get help when a technical service is not functioning as expected. This group also manages the replacement of mobile devices such as smart phones and tablets.
Enterprise Applications
section is responsible for building and managing the city’s information technology security program. This includes the user security awareness program and training as well as incident response to malicious attacks. Recently, the city hired its first IT Security Manager to specifically oversee these efforts and formally define important strategies and policies. Given the nature of threats to many organizations, this is a role of critical importance.
TheAdministrationITAdministration
The Client Systems section provides endpoint support to all information systems users in the city. This includes deployment and support for desktops and laptops
The enterprise applications team provides technical support and expertise related to the city’s portfolio of enterprise applications. Enterprise applications are the major applications, such as the central finance system and public works enterprise asset management system, used by the city to accomplish its core business functions. The team is divided into three groups supporting dedicated departments within the city. One group supports the Public Works and Community Development departments, another group supports the Human Resources and Finance departments, and another group supports the remaining departments. The enterprise applications team also provides web administrative support for the city’s internet website as well as assisting with the branding and configuration of other city web based applications.
The IT Infrastructure and Operations Division manages these technologies and is divided into three sections: Client Systems, Datacenter Systems and Networking. Each section of the team supports multiple technologies that make up the technical services they are responsible for delivering
Infrastructure and Operations Infrastructure technologies are the foundation of all other digital services that IT provides. Without these systems, data cannot be transported, processed or stored.
Project Management
The Project Management team provides project management support for larger technology initiatives including new implementations and upgrades to existing systems This team also provides support, guidance and assistance to other city departments managing smaller technology projects and assists departments in submitting project proposals as part of the Strategic Digital Transformation Investment Program.
Public Safety IT is the technology team dedicated to public safety that provides application and hardware support to the city’s Police and Fire departments. Regional information sharing amongst Law Enforcement Agencies along with Joint Powers Authority membership for the city’s Fire Department requires IT to proactively engage with regional partners With so much information being warehoused throughout the county, it is important to have a mechanism to intelligently display and interpret all this data.
H 6
The Datacenter Systems section is responsible for the centralized computer processing and data storage systems at the city. These are the platforms many other departments rely upon for the delivery of critical applications. This section also holds the primary role in supporting collaboration and remote work tools.
The Networking section is responsible for the support of all digital communication networking technologies in the city. This section is also responsible for planning and implementing low voltage cabling and working with the Facilities Department to ensure all IT hardware systems have uninterruptible power and reliable cooling.
Public Safety
Fiscal Year 2021 22 Continuing Projects – No Changes
• Exploration Hub Audio Visual Upgrade
The following contains information about the projects in the SDTIP. Full project pages are provided for the new projects being requested for fiscal year 2022 23 and prior approved projects that have changes in funding needs or project requirements. Projects with no changes and projects that have been completed or cancelled are listed below. Full details for these projects can be found in the fiscal year 2021 22 budget document.
• Next Generation Online Catalog
H 7
• Outdoor Wireless Study
• Online Permitting/Electronic Reviews, also known as E Reviews
The following projects were completed or cancelled during fiscal year 2021 22. The completed projects are not part of the totals of the various graphs and charts, while the cancelled projects are included if the project was previously funded.
Completed
• Mobile Computer Program
Cancelled
• Intranet Upgrade
• ServiceNow SAM Implementation
• Digital Engagement & Analytics Consultant
• Global Positioning System, or GPS, Technology Hardware
• Council Chamber Technology Upgrade
• Unified Communications System
• ServiceNow Service Portal
STRATEGIC DIGITAL TRANSFORMATION INVESTMENT PROGRAM PROJECTS
The following projects were approved during the fiscal year 2021 22 SDTIP and have no changes to their funding needs or project requirements and are still in process. These projects are included in the totals of the various graphs and charts shown in the SDTIP
• Records Management System Expansion
• Project Portfolio Management Tool & Consulting
Fiscal Year 2021 22 Completed or Cancelled Projects
Build Capacity for Data DecisiondrivenMaking, 1,775,000 7%
AccessibilityEnhanceand 1,496,852Transparency,5%FosteraVibrantCivicEngagementCulture, 1,425,000 5%
H 8
Going into fiscal year 2022 23, there are 33 continuing and new projects planned over the next five years at an estimated total cost of $27 34 million Included in the $27 34 million is approximately $15 35 million in estimated new costs over the course of the same time frame to provide additional funding for the continuation of existing projects as well as funding for new projects. Within the $15.35 million is approximately $3.94 million of estimated new appropriations for fiscal year 2022 23 for these same projects.
Promote Security and Sustainability9,664,015Connectivitythrough,35%
Estimated Total Projects Costs by Goal
FY 2022 23 to FY 2026 27 $27.34 million
ESTIMATED TOTAL APPROPRIATIONS BY GOAL
Pursue DigitalCommunitywideTransformation,12,981,50048%
This goal’s projects include the policies, procedures and staffing necessary for the city to fully capture the value of emerging models of data analytics It builds a comprehensive approach to citywide data management to enable data rich key performance metrics and effective operation of city departments. A data policy and resources will be created to align departments with standards of data cataloging for compliance ease of data sharing
This goal recognizes that open government and approaching problem solving from an accessibility perspective leads to better outcomes for all. Projects in this category include Civic Engagement with Open Data, Online Permitting/Electronic Reviews, Patron Print/Copy Management and a Virtual Permitting Counter.
Build Capacity for Data Driven Decision Making $1.78 million
Enhance Accessibility and Transparency $1.49 million
The city’s civic engagement culture builds upon the first two goals with a human centered perspective to use data and technology in a way that respects people and their privacy Projects in this category will support a vibrant culture where residents, organizations and businesses are invested in their community and its future
Pursue Communitywide Digital Transformation $12.98 million
This goal includes updating connectivity, up to date hardware and software, and a robust security strategy
H 9
Foster a Vibrant Civic Engagement Culture $1.43 million
Promote Security and Sustainability through Connectivity $9.66 million
Projects in this goal include the annual replacement of hardware and technology infrastructure, a Facility Security Master Plan, the replacement of the Police Computer Aided Dispatch System, and an enhancement to the 9 1 1 emergency system
PURSUE COMMUNITYWIDE DIGITAL TRANSFORMATION
About This Project
The city is currently evaluating functional requirements and business processes Once this process is complete, the city’s consultant will provide a comprehensive report outlining the city’s requirements for a new consolidated system as well as outlining the options and costs associated with system consolidation and replacement based on an evaluation of the city’s needs. The next step will involve the development and issuance of a request for proposal for a new consolidated system. This process will take place during fiscal year 2022 23 and there has been a funding adjustment to reflect the budgetary requirements of this process. City staff are not currently requesting funding for implementation, operation or replacement costs. Staff will request an estimated $3.5 million in funding for the acquisition and implementation of a new system as part of the fiscal year 2023 24 and 2024 25 SDTIP It is not currently feasible to determine any operational or replacement costs because
Prior Year Req FY22-23 Est FY23-24 Est FY24-25
Consolidation & Replacement of Core Systems
This project provides for the consolidation and replacement of the city’s core systems. There are approximately 20 core systems include the city’s financial, human resources, payroll, budget, asset and work order management, licensing and permitting, utilities operations, computer aided dispatch, land management, and program event management. Rather than operate many systems with narrow applicability, the city is evaluating ways to consolidate its core systems as legacy applications are replaced. This may mean accelerated replacement for certain systems. The goal is to reduce redundancy and inefficiency with operating many different systems with different vendors.

Consolidating down to a few systems that seamlessly integrates data and provides a more uniform interface will improve the experience of city employees and the public. The scope of this multi year initiative includes the analysis, selection, purchase and implementation of the software and hardware necessary to consolidate, replace and integrate these systems with as few systems as possible while maintaining or enhancing existing capabilities.
Managing Department: Information Technology
Estimated Annual Costs Increase/(Decrease): Operational NA Replacement NA
H 10
EstBudgetFY25-26 $
Project Funding Source: Technology Investment 4,400,000$
SDTIP PROJECTS
Est FY26-27 Total Funding Source Budget Budget Budget Budget Budget Budget Tech. Investment 400,000$ 500,000$ 1,500,000$ 2,000,000$ $ $4,400,000
The city’s current application portfolio does not meet the city’s operational requirements, does not meet user needs, does not follow industry best practices, lacks integration, and is inhibiting the city’s ability to make data driven decisions. Having fewer systems that consolidate the city’s core business functions will enable streamlined business processes and provide more timely access to data and information. It will also enhance operations and reduce inefficiencies of employees having to learn and operate multiple systems.
they depend on the recommendations of the request for proposal process; staff will identify more definitive costs during the request for proposal process.
Connected Carlsbad Goal Pursue Communitywide Digital Transformation
Project Need
H 11
Estimated Annual Costs Increase/(Decrease): Operational NA Replacement NA
In 2017, Crown Castle reached a licensing agreement with the city allowing it to install wireless data transmitters on municipal facilities. The agreement with Crown Castle gives the city access to existing fiber optic cable assets owned by Crown Castle for city use. These cables are made up of multiple fibers which cannot be physically separated from the rest of Crown Castle’s cable infrastructure. The city must make special arrangements with Crown Castle to use this asset. This network will carry the information needed for data processing, email, internet access, public safety applications and a wide range of services that are crucial to city operations.
Connected Carlsbad Goal Pursue Communitywide Digital Transformation Project Need
The city has an opportunity to work with a private company called Crown Castle to build a more robust digital information network for its employees and facilities. Beginning in 2019, the city took full advantage of this opportunity and replaced a leased network from a third party vendor.
Managing Department: Information Technology
Prior Year Req FY22-23 Est FY23-24 Est FY24-25 Est FY26-27 Total Funding Source Budget Budget Budget Budget Budget Budget Tech. Investment 4,825,584$ 200,000$ $500,000 $500,000 $ $6,025,584
About This Project
Project Funding Source: Technology Investment 6,025,584$
H 12
Digital Information Network

As the initial phase of this project has been completed, staff are looking ahead to the second and third phases as originally approved by the City Council. These include leveraging the network to expand services to the Transportation and Utilities departments to replace the aging network infrastructure supporting their key systems. The additional funding request for fiscal year 2022 23 includes elements required for this expansion as well as some feature and functionality enhancements to the services already in place.
EstBudgetFY25-26 $
Funding Source Budget Budget Budget Budget Budget Budget Tech. Investment 1,100,000$ 500,000$ $ $ $ $1,600,000$
Project Need
EstBudgetFY25-26
Prior FY26-27
Operational NA Replacement NA
Estimated Annual Costs Increase/(Decrease):
Currently, departments manage and track assets and work orders in various ways. Many departments use disparate, stand alone Excel spreadsheets, custom or Microsoft based databases that lack integration, or paper files. The decentralized approach to asset management results is less accurate and reliable inventory numbers, decreased accountability for assets in general, less efficient use of staff time, and billing inaccuracies for those assets that are used as a basis to charge other departments and external customers.
Managing Department: Information Technology
This project implements a new web enabled enterprise asset and work order management system across all city departments to consolidate disparate asset databases, work order systems and inventory management tools. The city worked with a consultant to develop a comprehensive report outlining the city’s requirements for a new enterprise asset management system. The city used these requirements to develop and issue a request for proposal and is currently in the process of selecting a solution. Based on the costs identified in the request for proposal responses, an additional $500,000 is being requested. More definitive costs will be identified during the contract negotiation process and will be approved by City Council when the contract for the selected solution is placed on a future City Council agenda.
Project Funding Source: Technology Investment 1,600,000$
Year Req FY22-23 Est FY23-24 Est FY24-25 Est
Total
Enterprise Asset Management System

About This Project
Connected Carlsbad Goal Pursue Communitywide Digital Transformation
H 13
The project will be reevaluated at a later time.
Project Funding Source: Technology Investment $
Funding Source Budget Budget Budget Budget Budget Budget Tech. Investment 150,000$ (150,000)$ $ $ $ $
EstBudgetFY25-26 $
Estimated Annual Costs Increase/(Decrease): Operational NA Replacement NA
H 14
Managing Department: Information Technology
ServiceNow SAM Implementation Cancelled
Connected Carlsbad Goal Pursue Communitywide Digital Transformation Project Need
Est FY26-27 Total
ServiceNow is the application that IT staff use to service staff technology needs. The Software Asset Management project would have added new functionality to the ServiceNow tool to allow the IT department to easily keep track of the city’s software assets. The new functionality would have tracked how many software licenses have been purchased, who they are assigned to and the cost of each Afterlicense.further

About This Project
review, staff determined this solution is not needed at this time but will be revisited at a later time.
Est
Est
Prior Year Req FY22-23 FY23-24 FY24-25
Prior Year Req FY22-23 Est FY23-24 Est FY24-25
EstBudgetFY25-26 $
Managing Department: Information Technology
Estimated Annual Costs Increase/(Decrease): Operational NA Replacement NA
Project Funding Source: Technology Investment 95,000$
The city last updated its existing timekeeping system in 2019. In order to stay on a current, stable and vendor supported version of the application, an upgrade is necessary. The next version will also fix bugs and provide functionality that will improve processes and increase the productivity of Finance Department payroll staff

Est FY26-27 Total Funding Source Budget Budget Budget Budget Budget Budget Tech. Investment $ 95,000$ $ $ $ $95,000
Timekeeping System Upgrade
Connected Carlsbad Goal: Pursue Communitywide Digital Transformation Project Need
About This Project
H 15
This project provides for the upgrade of the city’s timekeeping system to the latest version.
Operational costs will not change as a result of this project. There is no replacement cost associated with this project.
Prior Year Req FY22-23 Est FY23-24 Est FY24-25
Est FY26-27 Total Funding Source Budget Budget Budget Budget Budget Budget
H 16
After this project is complete, staff expects operational costs for the utility billing automation platform to increase by an estimated $7,500 annually. There is no replacement cost associated with this project.
EstBudgetFY25-26 $
Utility Billing Automation
This project involves implementing the automation platform which adds additional functionality to the city’s existing utility billing system. The automation platform allows city staff to schedule routine tasks and administer best practice workflows for common business processes. This functionality provides a flexible and modular approach to automating complex business rules and integrations, while data validation enforcement helps maintain data integrity.

Managing Department: Information Technology
Based on current project demand and resource availability, city staff are tentatively scheduling this for fiscal year 2023 24 and will request funding as part of the fiscal year 2023 24 SDTIP.
Estimated Annual Costs Increase/(Decrease): Operational 7,500 Replacement NA
Utility Replacement $ $ $75,000 $ $ $75,000
Project Funding Source: Utility Replacement 75,000$
Connected Carlsbad Goal Pursue Communitywide Digital Transformation Project Need
About This Project
There are several manual processes that take a significant amount of staff time and increase the potential for errors within the current system.
Estimated Annual Costs Increase/(Decrease): Operational NA Replacement NA
Est FY26-27 Total Funding Source Budget Budget Budget Budget Budget Budget Utility Replacement $ 90,000$ $ $ $ $$90,000
Project Need
Utility Billing Portal

EstBudgetFY25-26
This project involves migrating from the existing CustomerConnect6 Utility Billing Portal to the vendor’s most current utility billing portal solution.
City staff do not expect operational costs to change as a result of this project. There is no replacement cost associated with this project.
About This Project
The vendor for the city’s utility billing system announced they have ceased development on the city’s existing utility billing customer portal and are migrating to a new solution. To ensure the city has a secure billing portal that protects the city and its customers, it is imperative that the city is using a billing portal supported by vendor provided upgrades and security patches.
Project Funding Source: Utility Replacement 90,000$
Managing Department: Information Technology
Prior Year Req FY22-23 Est FY23-24 Est FY24-25
Connected Carlsbad Goal: Pursue Communitywide Digital Transformation
H 17
About This Project
Project Need
This project facilitates the expansion of business process automation by adding licenses to the city’s existing Laserfiche system. This will allow for the implementation of additional automated and electronic document related workflows, additional DocuSign licensing to enable continued migration from paper signatures to electronic signatures, and consulting services to assist with the automation of existing manual HR processes.
H 18
Project Funding Source: Technology Investment 150,000$
Managing Department: Information Technology
Operational NA Replacement NA
Connected Carlsbad Goal
Prior Year Req FY22-23 Est FY23-24 Est FY24-25 Est FY26-27 Total Funding Source Budget Budget Budget Budget Budget Budget Tech. Investment $ 150,000$ $ $ $ $150,000 EstBudgetFY25-26 $
The COVID 19 pandemic surfaced several opportunities to improve upon manual and paper driven processes.
Estimated Annual Costs Increase/(Decrease):
Business Process Automation

Build Capacity for Data Driven Decision Making
BUILD CAPACITY FOR DATA DRIVEN DECISION MAKING
Connected Carlsbad Goal
This project serves as the foundation for delivering more efficient city services. By leveraging data, the city can achieve a better understanding of key performance metrics for all departments citywide. The project will implement a citywide data policy to govern how the organization collects, maintains and secures data in order to enable rich reporting and analytics for operations and leadership. The policy will enact a data governance team that can revise the policy as needs and priorities change. The data governance team will direct and oversee the data catalog and data inventory, participate in the evaluation of new systems that will collect data, regularly review data security, and audit processes of data collection and retention.
Project Funding Source: Technology Investment 505,000$
Data Governance and Operational Analytics

This project will fund the implementation of a data lake to house a centralized location to facilitate easier cross departmental reporting. Staff will be trained on data stewardship and how to unlock operational insights using new data tools. The project will fund the delivery of department performance dashboards to inform leadership and the City Council on the ongoing efforts of agency goals. Further, the project creates capacity to acquire external datasets that inform city operations and benefit multiple departments.
Estimated Annual Costs Increase/(Decrease):
Build Capacity for Data Driven Decision Making
About This Project
This project builds a comprehensive approach to citywide data management to enable data rich key performance metrics and effective operation of city departments. City Council recently approved a policy statement on citywide data governance and management, including the establishment of a data governance committee. City staff are requesting additional funding to purchase additional software licenses and data lake design and engineering services.
Managing Department: Innovation & Economic Development Information Technology
H 19
Project Need
Prior Year Req FY22-23 Est FY23-24 Est FY24-25
Operational 360,000 Replacement NA
EstBudgetFY25-26 $
After initial implementation, staff estimates operational costs to increase by $360,000 going forward. There is no replacement cost associated with this project.
Est FY26-27 Total Funding Source Budget Budget Budget Budget Budget Budget Tech. Investment 295,000$ 110,000$ 100,000$ $ $ $505,000
About This Project
Project Funding Source: Technology Investment 170,000$
Managing Department: Innovation & Economic Development Information Technology
Est FY26-27 Total Funding Source Budget Budget Budget Budget Budget Budget Tech. Investment 30,000$ $ $140,000 $ $ $$170,000
Operational NA Replacement NA
Project Need
The current process of identifying, gathering, sorting, reviewing and producing information and documents required for litigation discovery is cumbersome and time consuming. The implementation of a discovery management solution would enable the city to identify, gather, and sort information and records from the massive volumes of content that span the city, including emails, and then sort and eliminate exact copies to reduce the effort and cost of reviewing and producing the remaining content. City staff may also use the discovery management solution to respond to large California Public Records Act requests.

Discovery Management
Prior Year Req FY22-23 Est FY23-24 Est FY24-25
Connected Carlsbad Goal
EstBudgetFY25-26
Estimated Annual Costs Increase/(Decrease):
Build Capacity for Data Driven Decision Making
H 20
The first phase of this project involved the completion of an assessment to identify the functional and business requirements for a discovery management solution which will be used to draft a request for proposal Based on current project demand and resource availability, city staff will develop and issue of a request for proposal for the acquisition and implementation of a discovery management system during fiscal year 2023 24. This project is tentatively scheduled for fiscal year 2023 24; staff will identify and request funding as part of the fiscal year 2023 24 SDTIP
About This Project
Meter Data Management/Utility Analytics

Managing Department: Information Technology
Est FY26-27 Total Funding Source Budget Budget Budget Budget Budget Budget Utility Replacement $ $ $550,000 $ $ $$550,000
Project Funding Source: Utility Replacement 550,000$
Connected Carlsbad Goal
Project Need
Estimated Annual Costs Increase/(Decrease): Operational 175,000 Replacement NA
The city has an existing automated meter infrastructure and completed a major upgrade to the utility billing system last year. However, there are still many manual processes that exist between the two systems. For example, if for some reason a meter is not being automatically read, the automated meter infrastructure system will generate a report identifying the meter and staff must manually create a work order in the utility billing system to dispatch a meter reader to troubleshoot the meter. Implementing the Meter Data Management functionality of the utility billing system will automate this and several other integration processes.
EstBudgetFY25-26
H 21
Based on current project demand and resource availability, city staff are tentatively rescheduling this project for fiscal year 2023 24 from fiscal year 2022 23; staff will identify and request funding as part of the fiscal year 2023 24 SDTIP.
This project implements the Meter Data Management and analytics modules offered as additional functionality to the existing utility billing system.
Build Capacity for Data Driven Decision Making
Additionally, the Meter Data Management solution offers robust analytics capability including a key performance indicator dashboard, advanced leak detection and notification, water loss analysis, and water conservation management.
After initial implementation, staff estimate operational costs to increase by $175,000 going forward. There is no replacement cost associated with this project.
Prior Year Req FY22-23 Est FY23-24 Est FY24-25
EstBudgetFY25-26 $70,000
Professional Technical Services for Data Project Delivery
Connected Carlsbad Goal
About This Project
Build Capacity for Data Driven Decision Making
Project Funding Source: Technology Investment 350,000$
Managing Department: Innovation & Economic Development Information Technology
Annual consulting credit with ESRI to assist in GIS and data initiatives

The ESRI Advantage Program provides technical assistance to staff on projects that meet city and City Council goals. The program is currently being used to complete the first phase of the Fire Department Standards of Cover project. This funding will allow for staff to be agile in starting and executing new projects that use GIS and ESRI. The credits are also flexible so as city needs change, the city can adapt its use of the technical assistance. It is estimated that the city will use at least $70,000 worth of credits in fiscal year 2022 23.
Estimated Annual Costs Increase/(Decrease): Operational NA Replacement NA
H 22
Project Need
Prior Year Req FY22-23 Est FY23-24 Est FY24-25 Est FY26-27 Total
Funding Source Budget Budget Budget Budget Budget Budget Tech. Investment $ 70,000$ $70,000 $70,000 $70,000 $350,000
Operational 42,000 Replacement NA
Project Need
H 23
Year Req FY22-23 Est FY23-24 Est FY24-25 Est FY26-27 Total Funding Source Budget Budget Budget Budget Budget Budget
Connected Carlsbad Goal
Managing Department: Information Technology
Estimated Annual Costs Increase/(Decrease):
Prior
Utility Operating BudgetFY25-26
$ 50,000$ $ $ $ $$50,000 Est
The State of California has established water efficiency and allocation requirements as part of water conservation legislation, Senate Bill 606 and Assembly Bill 1668. These bills require urban water retail suppliers to develop annual urban water use objectives for their service areas that represent the total amount of efficiently used water that can be delivered to the service area. The District needs an application that analyzes data by the components of the water allocation and calculates water use efficiency to help meet the new water efficiency and allocation requirements and to provide the data needed for the annual reporting requirements which start November 2023.
Build Capacity for Data Driven Decision Making

After initial implementation, city staff estimate operational costs to increase by $42,000 going forward. There is no replacement cost associated with this project.
Regulator Water Usage Analytics
About This Project
Project Funding Source: Utility Operating 50,000$
Implement the Waterview Water Efficiency portal to assist the city in meeting legislatively established water conservation goals and reporting requirements.
About This Project
Audiovisual Upgrades

Foster a Vibrant Civic Engagement Culture
Managing Department: Information Technology
EstBudgetFY25-26 $100,000
FOSTER A VIBRANT CIVIC ENGAGEMENT CULTURE
There are no annual operational cost changes associated with this project. City staff cannot feasibly estimate replacement costs until after the new equipment is purchased
This project provides for upgrades and growth of the city's audiovisual equipment. The work landscape has changed audiovisual equipment that previously supported in person meetings in a room are now supporting meetings held virtually The IT Department will update and maintain audiovisual equipment to meet this new work environment and other necessary enhancements to legacy technology.
Project Need
Estimated Annual Costs Increase/(Decrease): Operational NA Replacement NA
Project Funding Source: Technology Investment 1,125,000$
H 24
Connected Carlsbad Goal
This project allows for the standardization of audiovisual equipment within the city’s work facilities so personnel can conduct business with internal and external resources virtually without the need to move between facilities for meetings.
$100,000 $1,125,000
Est FY26-27 Total Funding Source Budget Budget Budget Budget Budget Budget
Prior Year Req FY22-23 Est FY23-24 Est FY24-25
Tech. Investment 625,000$ 100,000$ $100,000 $100,000
ENHANCE ACCESSIBILITY AND TRANSPARENCY
Project Funding Source: Technology Investment 198,000$
Connected Carlsbad Goal Enhance Accessibility and Transparency Project Need
Estimated Annual Costs Increase/(Decrease): Operational 175,000 Replacement NA
Prior Year Req FY22-23 Est FY23-24 Est FY24-25
EstBudgetFY25-26 $
This project supports community engagement with city operations and makes government more open and accountable. An open data portal will provide a resource for citizen access to detailed financial, operational and historical datasets of city activity. City staff are requesting additional funding to cover design research services and increased licensing costs.
After initial implementation, staff estimate operational costs to increase by $175,000 going forward. There is no replacement cost associated with this project.
Managing Department: Innovation & Economic Development
Serving as the accessibility and transparency part of the Data Governance and Operational Analytics project, this project will leverage the city’s data resources and deliver an online portal rich of city data to enable increased community engagement and transparency. It is anticipated that this project will also save staff time for all departments by reducing common public records requests by making these datasets always available online. This key project will facilitate a deeper understanding within the community and better inform residents that wish to know more about how their city operates. The data governance team will direct and oversee the open data online catalog and track access to these resources. Phase I will deliver a smaller set of data commonly requested by the public to an online platform. Phase II will expand the publicly available datasets to cover information from all departments and live progress on citywide initiatives and City Council goals.
Est FY26-27 Total Funding Source Budget Budget Budget Budget Budget Budget Tech. Investment 180,000$ 18,000$ $ $ $ $198,000
Civic Engagement with Open Data

About This Project
H 25
H 26
Est
Total
Est
About This Project
Project Funding Source: Technology Investment 400,000$
Est
Est
At this time, depending on the identified solution, city staff cannot feasibly determine any operational or replacement costs.
Currently, the city has a wide range of digital assets maintained by numerous departments that are currently managed, stored, accessed and shared using a variety of methods. These digital assets range from unique archival documents, records, films, audio recordings, artwork and photos maintained by the Library & Cultural Arts Department, photos and videos related to the history of Leo Carrillo Ranch Historic Ranch maintained by Parks & Recreation Department, and photos of current events maintained by the Communications & Engagement Department. Storage of these assets varies from storage on an external hard drive, storage in SharePoint Digital Libraries or saved on network drives. As a result, no centralized environment exists to store and catalogue these assets, making it challenging to find, share and use these resources.
Project Need
Estimated Annual Costs Increase/(Decrease): Operational NA Replacement NA
Managing Department: Information Technology
Prior Year FY22-23 FY23-24 FY24-25 FY26-27 Funding Source Budget Budget Budget Budget Budget Budget Tech. Investment 50,000$ 350,000$ $ $ $ $400,000 BudgetFY25-26 $
Req
The city engaged with an outside consultant to complete an assessment that identified the functional and business requirements for an enterprise digital asset management solution that will provide for the storing, organizing, describing, accessing and preservation of digital assets City staff will use these requirements to develop and issue a request for proposal, which will take place during fiscal year 2022 23 Staff are currently requesting funding for the acquisition and implementation of an enterprise digital asset management system.
Connected Carlsbad Goal Enhance Accessibility and Transparency
Enterprise Digital Asset Management

Project Funding Source: Technology Investment 88,000$
At this time, city staff do not expect this project to result in an increase to operating or replacement costs.
About This Project
Est
H 27

Prior Year Req FY22-23 FY23-24 FY24-25 FY26-27 Total Funding Source Budget Budget Budget Budget Budget Budget
The existing agreement will expire in September 2022 and the Library & Cultural Arts Department is looking to enhance the current system.
Estimated Annual Costs Increase/(Decrease): Operational NA Replacement NA
Est
Connected Carlsbad Goal Enhance Accessibility and Transparency
Est
Patron Print/Copy Management
This project replaces the existing print/copy management system used at the various library locations within the city. City staff will need to complete a request for proposal to identify and implement a new system.
Project Need
Est
Managing Department: Information Technology
Tech. Investment $ 18,000$ 70,000$ $ $ $88,000 BudgetFY25-26 $
Afterproject.initial
Connected Carlsbad Goal Enhance Accessibility and Transparency
About This Project
EstBudgetFY25-26
Virtual Permitting Counter (OpenCounter)
Managing Department: Information Technology
implementation, staff estimate operational costs to increase by $34,500 going forward. There is no replacement cost associated with this project.
Prior Year Req FY22-23 Est FY23-24 Est FY24-25 Est FY26-27 Total Funding Source Budget Budget Budget Budget Budget Budget Tech. Investment 61,000$ $ $23,000 $ $ $$84,000
Prior to determining what is required to establish a business or begin development in the City of Carlsbad, potential applicants typically must meet with city staff. Staff then work to educate the applicant on what is allowable from a zoning perspective, what type of plan cases and permits will be required, and how much permitting will cost. OpenCounter establishes an online virtual permitting counter that walks an applicant through much of this process online in a self service portal.

Estimated Annual Costs Increase/(Decrease): Operational 34,500 Replacement NA
This project implements OpenCounter's Virtual Permitting Counter application. City staff adjusted the additional funding from fiscal year 2022 23 to fiscal year 2023 24 to better reflect the timing of this
Project Need
Project Funding Source: Technology Investment 84,000$
H 28
EstBudgetFY25-26 $1,110,000
Estimated Annual Costs Increase/(Decrease): Operational NA Replacement NA
About This Project
Annual Hardware and Infrastructure Replacement
Citywide hardware and infrastructure changes are necessary and ongoing. Replacement equipment is needed to support the city's technology infrastructure and department specific needs.
H 29
Project Funding Source: IT Replacement Fund 5,465,436$
This project provides for replacement equipment funding for scheduled replacement of laptops, desktops, internal servers, routers, switches, and other network and data center requirements.

There is no increase or decrease in operational costs associated with the annual replacement program. Due to the circular nature of the replacement program, replacement costs fluctuate annually depending on the hardware life cycles which can range from three years to 20 years.
Managing Department: Information Technology
Prior Year Req FY22-23 Est FY23-24 Est FY24-25
PROMOTE SECURITY AND SUSTAINABILITY THROUGH CONNECTIVITY
Est FY26-27 Total Funding Source Budget Budget Budget Budget Budget Budget IT Replacement Annual 790,436$ $1,030,000 $1,485,000 $1,050,000 $5,465,436
Connected Carlsbad Goal Promote Security and Sustainability through Connectivity Project Need
Est
Promote Security and Sustainability through Connectivity
Operational NA Replacement NA FY26-27 Source Budget Budget Budget Budget Budget Budget
staff do not expect this project to result in an increase to operating or replacement costs.
Atimprovement.thistime,city
Business Process Documentation
Estimated Annual Costs Increase/(Decrease):
Connected Carlsbad Goal
Project Funding Source: Technology Investment 150,000$
Prior Year Req FY22-23 Est FY23-24 Est FY24-25 Est
Tech. Investment $ 150,000$ $ $ $ $150,000 BudgetFY25-26 $
H 30
About This Project
Managing Department: Information Technology
Total Funding
This project will begin to upgrade EnerGov and provide for consulting services to update existing business process documentation to reflect user interface changes and assist with business process

The upgrade to EnerGov will significantly change the user interface. Additionally, the city can use this as a significant opportunity for business process improvement.
Project Need
The city purchased its current Public Safety Computer Aided Dispatch system, or CAD, in 2005. Over the years, the current vendor provided a series of upgrades to the system as both needs and technology have evolved. Through a series of mergers and acquisitions, the city’s current CAD system is now at the end of life, and the city must select a replacement CAD system to maintain the standards required by the State of California and expected by the citizens of Carlsbad The city completed a request for proposal process and selected the Motorola CAD and in car video system solution. The City Council approved the contract for this system on May 10, 2022

With the selection of the CAD and in car video system solution, city staff estimate the annual operating budget to increase by $170,000 starting in fiscal year 2023 24. Staff estimate replacement costs to be $90,000 annually for the in car video system.
Promote Security and Sustainability through Connectivity
Computer Aided Dispatch
Connected Carlsbad Goal
H 31
About This Project
Project Need
This project provides a new robust and reliable CAD system, designed to support law enforcement activities, that fully integrates with other system application components and meets the requirements established by the Department of Justice. The CAD solution shall include real time mapping, automated vehicle location and a mobile data client. This mobile data client must include real time integrated mobile mapping and AVL functionality that provides situational awareness and incident management tools to field personnel. The mobile application must be fully integrated with CAD software to ensure a seamless transfer of information between the CAD and Mobile applications, as well as the Police Department’s Report Writing and Records Management Systems. The CAD configuration must address system redundancy factors and incorporate backup, failover and recovery solutions. The in car video solution promotes officer safety by doubling as a forward facing LPR camera. The system also limits agency liability by automatically recording subjects placed in the backseat. Seamless integration with the proposed CAD system and real time access to the camera views allow command staff to make informed situational awareness decisions with units out in the field.
Funding Source Budget Budget Budget Budget Budget Budget Tech. Investment 350,000$ 100,000$ $100,000 $100,000 $100,000 $850,000
The cybersecurity program provides support and protection to the City of Carlsbad so it can successfully accomplish its mission. As the threat landscape is changing and getting more sophisticated in lockstep with advances in technology, we need to ensure the city’s cybersecurity program is robust enough to keep threat actors from causing harm to the city.
To ensure we address the different areas and aspects of cybersecurity, city staff have developed and adopted an approach based on the National Institute of Standards and Technology Cybersecurity Framework to cybersecurity defense program which covers five functions:

Prior Year Req FY22-23 Est FY23-24 Est FY24-25 Est
Project Funding Source: Technology Investment 850,000$
Total
Managing Department: Information Technology
• Detect Develop and implement the appropriate activities to identify the occurrence of a cybersecurity event. The Detect function enables timely discovery of cybersecurity events. Examples of outcome categories within this function include Anomalies and Events, Security Continuous Monitoring, and Detection Processes.
Operational NA Replacement NA FY26-27
Estimated Annual Costs Increase/(Decrease):
Cyber Security Program Development
About This Project
• Protect Develop and implement the appropriate safeguards to ensure delivery of critical infrastructure services. The Protect function supports the ability to limit or contain the impact of a potential cybersecurity event. Examples of outcome categories within this function include Access Control, Awareness and Training, Data Security, Information Protection Processes and Procedures, Maintenance, and Protective Technology.
• Identify Develop the organizational understanding to manage cybersecurity risk to systems, assets, data and capabilities. The activities in the Identify function are foundational for effective use of the Framework. Understanding the business context, the resources that support critical functions, and the related cybersecurity risks enables an organization to focus and prioritize its efforts, consistent with its risk management strategy and business needs. Examples of outcome categories within this function include Asset Management, Business Environment, Governance, Risk Assessment and Risk Management Strategy.
• Respond Develop and implement the appropriate activities to act regarding a detected cybersecurity event. The Respond function supports the ability to contain the impact of a potential cybersecurity event. Examples of outcome categories within this function include Response Planning, Communications, Analysis, Mitigation and Improvements.
H 32
EstBudgetFY25-26 $100,000
Disaster Recovery program assessment and development, Detection capability with security incident and event management technology, Cybersecurity governance program, Data classification tools, and Incident response procedure development and training
At this time, and depending on the types of programs implemented over the course of the project, city staff cannot feasibly determine any operational or replacement costs.
• Recover Develop and implement the appropriate activities to maintain plans for resilience and to restore any capabilities or services that were impaired due to a cybersecurity event. The Recover function supports timely recovery to normal operations to reduce the impact from a cybersecurity event. Examples of outcome categories within this function include Recovery Planning, Improvements and Communications.
H 33
Promote Safety and Sustainability through Connectivity Project Need
As a result of internal assessments and evaluations by external parties, city staff have identified certain initiatives within the five functions of the cybersecurity framework to translate into projects. Implementation of these projects will incur costs and require funding. The funding will cover assessment and evaluation, implementation, and staff training. Once the security infrastructure is in place, operational costs will move to the operation budget. City staff identified and planned the following projects for implementation:
Connected Carlsbad Goal
At this time, city staff do not expect this project to result in an increase to operating or replacement costs.
Project Funding Source: Technology Investment 50,000$
Estimated Annual Costs Increase/(Decrease): Operational NA Replacement NA FY26-27 Funding Source Budget Budget Budget Budget Budget Budget
Est
Total
About This Project
Promote Safety and Sustainability through Connectivity Project Need
Tech. Investment $ 50,000$ $ $ $ $50,000 BudgetFY25-26 $
Connected Carlsbad Goal
Electronic Patient Care Reporting

Prior Year Req FY22-23 Est FY23-24 Est FY24-25 Est
Managing Department: Information Technology
H 34
The County of San Diego has requested that any agency in the county that provides Emergency Medical Service migrate to the electronic patient care reporting system that is used by the county. This will streamline Emergency Medical Service reporting requirements.
This project implements the electronic patient care reporting system that is being used by the County of San Diego.
Funding Source Budget Budget Budget Budget Budget Budget
EstBudgetFY25-26
Estimated Annual Costs
Project Funding Source: Technology Investment 400,000$
Prior Year FY26-27
The city does not have a consistent overarching plan or policy for the security of city buildings, parks and critical infrastructure. The City of Carlsbad is committed to protecting the safety of the public and city staff at city facilities amid today’s security risks.
About This Project
H 35
Project Need
Managing Department: Information Technology
Connected Carlsbad Goal
Increase/(Decrease):
This project is for a facility security master plan that would create a citywide inventory, identify potential new locations, and develop a citywide plan to follow. The city will assess locations for closed circuit television, or CCTV, cameras, access control, alarm systems, physical door key audits and perimeter fencing at city facilities to help ensure both employee and citizen safety at these facilities. Staff will prioritize needs by risk and create a multi year implementation plan Staff will present the resulting Facility Security Master Plan to the City Council for consideration, which is expected to guide the city in creating requests for proposal for the implementation of the recommended security controls over multiple years.
Operational NA Replacement NA
At this time, and depending on the recommendations of the master plan, city staff cannot feasibly determine any operational or replacement costs.
Promote Security and Sustainability through Connectivity

Total
Req FY22-23 Est FY23-24 Est FY24-25 Est
Tech. Investment 100,000$ 100,000$ $100,000 $100,000 $ $$400,000
Facility Security Master Plan
Est
Est
Currently, responding officers are unable to hear the interaction between 9 1 1 callers and dispatchers.
Project Need
Theofficersinitial
Managing Department: Information Technology
Total
Connected Carlsbad Goal Promote Security and Sustainability through Connectivity
H 36 Live 9 1 1
About This Project
one time cost for this system is $66,380. Yearly ongoing costs are $60,000 for software licensing.
Estimated Annual Costs Increase/(Decrease): Operational 60,000 Replacement NA
Project Funding Source: Technology Investment 66,380$
Est
Est
Implement Live 9 1 1, which will allow officers and support personnel to monitor live emergency calls to 9 1 1 while enroute to a call. This will provide increased situational awareness for responding
Prior Year Req FY22-23 FY23-24 FY24-25 FY26-27 Funding Source Budget Budget Budget Budget Budget Budget Tech. Investment $ 66,380$ $ $ $ $66,380 BudgetFY25-26 $

Promote Security and SustainabilityConnectivitythrough, 7,111,380 46%
Estimated Fiscal Year 2022-23 through 2026-27 Appropriations by Goal
H 37
Build Capacity for Data driven Decision Making, 1,450,000 10%
FY 2022 23 to FY 2026 27 $15.35 million
FUTURE PROJECTS
Engagement Culture, 500,000 3%
Estimated Future Projects Costs by Goal
Enhance Accessibility and Foster479,000Transparency,3%aVibrantCivic
The City of Carlsbad’s SDTIP for fiscal year 2022 23 to fiscal year 2026 27 outlines 33 projects at an estimated total cost of $27.34 million. Of the $27.34 million, $15.35 million is for new or increased funding for projects over the next five years. The information provided for future years reflects the most comprehensive snapshot of known or anticipated future projects as well as associated estimated costs.
Pursue Communitywide Digital Transformation, 5,810,000 38%
The fiscal year 2022 23 SDTIP outlines $3 94 million in new appropriations for fiscal year 2022 23 to provide additional funding for the continuation of existing projects as well as funding for new projects.
Promote Security and SustainabilityConnectivitythrough, 1,836,380 47%
Civic Engagement Culture, 100,000 , 2%
Requested
Estimated Fiscal Year 2022 23 Appropriations by Goal
H 38
AccessibilityEnhanceand 386,000Transparency,10%FosteraVibrant
Build Capacity for Data DecisiondrivenMaking, 380,000 10%
Pursue Communitywide Digital1,235,000Transformation,31%
FY 2022-23 Appropriations by Goal $3.94 million
ReplacementInfrastructureandHardwareAnnualPSSCITRFNAMajor1,102,635790,0001,030,0001,485,0001,110,0001,050,0006,567,635 MajorDocumentationProcessBusinessPSSCTICFNA150,000150,000 (CAD)DispatchAidedComputerPSSCTICF7018Major1,000,000580,0001,580,000 DevelopmentProgramSecurityCyberPSSCTICF7012Major350,000100,000100,000100,000100,000100,000850,000 ReportingCarePatientElectronicPSSCTICFNAMajor50,00050,000 PlanMasterSecurityFacilityPSSCTICF7003Major100,000100,000100,000100,000400,000 Major911LivePSSCTICFNA66,38066,380 9,664,0151,150,0001,210,0001,685,0001,230,0001,836,3802,552,635
H 39 FIVE-YEAR SCHEDULE OF PROJECTS BY CONNECTED CARLSBAD GOAL EstimatedEstimatedEstimatedEstimatedEstimatedRequestedConnected TotalCarlsbadFundingFundingProjectPriorYear1Year2Year3Year4Year5 GoalNameProjectSourceIDTypeAppropriation2022-232023-242024-252025-262026-27Funding $$$$$$$SystemsCoreofReplacement&ConsolidationPCDTTICF7009Major400,000500,0001,500,0002,000,0004,400,000 NetworkInformationDigitalPCDTTICF7007Major4,825,584200,000500,000500,0006,025,584 MajorSystemManagementAssetEnterprisePCDTTICF70131,100,000500,0001,600,000 Consulting&ToolManagementPortfolioProjectPCDTTICF7004Major500,000500,000 (150,000)ImplementationSAMServiceNowPCDTTICF7015Major150,000 PortalServiceServiceNowPCDTTICF706Major150,000150,000 UpgradeSystemTimekeepingPCDTTICFNAMajor95,00095,000 AutomationBillingUtilityPCDTUEFNAMajor75,00075,000 PortalBillingUtilityPCDTUEFNAMajor90,00090,000 HardwareTechnology(GPS)SystemPositioningGlobalPCDTTICFNAMinor45,91645,916 12,981,5002,500,0002,075,0001,235,0007,171,500
$$$$$$$11,991,9873,937,3804,358,0004,355,0001,380,0001,320,00027,342,367 ITRF=FundReplacementTechnologyInformation TICF=FundCapitalInvestmentTechnology UEF=Capital)or(OperatingFundsEnterpriseUtilitiesTotalConnectivitythroughSustainabilityandSecurityPromoteTotalTransformationDigitalCommunitywidePursueGoalCarlsbadConnected TransformationDigitalCommunitywidePursue TotalCultureEngagementCivicVibrantaFoster TransparencyandAccessibilityEnhance TotalTransparencyandAccessibilityEnhance ConnectivitythroughSustainabilityandSecurityPromoteMakingDecisionData-drivenforCapacityBuild TotalMakingDecisionData-drivenforCapacityBuild CultureEngagementCivicVibrantaFoster ProjectsTotal AbbreviationsSourceFunding
MajorAutomationProcessBusinessBCDDMTICFNA150,000150,000 AnalyticsOperationalandGovernanceDataBCDDMTICF7019Major295,000110,000100,000505,000 MajorAssessmentManagementDiscoveryBCDDMTICF702030,000140,000170,000 AnalyticsManagement/UtilityDataMeterBCDDMUEFNAMajor550,000550,000 DeliveryProjectDataforServicesTechnicalProfessionalBCDDMTICFNAMajor70,00070,00070,00070,00070,000350,000 Funds)(OperatingAnalyticsUsageWaterRegulatoryBCDDMUEFNAMajor50,00050,000 1,775,00070,00070,00070,000860,000380,000325,000
UpgradesVisualAudioFVCECTICF7000Major625,000100,000100,000100,000100,000100,0001,125,000 ConsultantAnalytics&EngagementDigitalFVCECTICF7008Major200,000200,000 StudyWirelessOutdoorFVCECTICF7014Major100,000100,000 1,425,000100,000100,000100,000100,000100,000925,000
DataOpenwithEngagementCivicEATTICF7017Major180,00018,000198,000 UpgradeVisualAudioHubExplorationEATTICF7023Major41,85241,852 ManagementAssetDigitalEnterpriseEATTICF7022Major50,000350,000400,000 CatalogOnlineGenerationNextEATTICF7024Major40,00040,000 (E-Reviews)ReviewsPermitting/ElectronicOnlineEATTICF7025Major645,000645,000 ManagementPrint/CopyPatronEATTICFNAMajor18,00070,00088,000 (OpenCounter)CounterPermittingVirtualEATTICF7026Major61,00023,00084,000 1,496,85293,000386,0001,017,852
H 40 FIVE-YEAR SCHEDULE OF PROJECTS BY FUND EstimatedEstimatedEstimatedEstimatedEstimatedRequestedConnected TotalCarlsbadFundingFundingProjectPriorYear1Year2Year3Year4Year5 GoalNameProjectSourceIDTypeAppropriation2022-232023-242024-252025-262026-27Funding FundCapitalInvestmentTechnology $$$$$$$UpgradesVisualAudioTICFFVCEC7000Major625,000100,000100,000100,000100,000100,0001,125,000 MajorAutomationProcessBusinessTICFBCDDMNA150,000150,000 MajorDocumentationProcessBusinessTICFPSSCNA150,000150,000 DataOpenwithEngagementCivicTICFEAT7017Major180,00018,000198,000 (CAD)DispatchAidedComputerTICFPSSC7018Major1,000,000580,0001,580,000 SystemsCoreofReplacement&ConsolidationTICFPCDT7009Major400,000500,0001,500,0002,000,0004,400,000 DevelopmentProgramSecurityCyberTICFPSSC7012Major350,000100,000100,000100,000100,000100,000850,000 AnalyticsOperationalandGovernanceDataTICFBCDDM7019Major295,000110,000100,000505,000 ConsultantAnalytics&EngagementDigitalTICFFVCEC7008Major200,000200,000 NetworkInformationDigitalTICFPCDT7007Major4,825,584200,000500,000500,0006,025,584 MajorAssessmentManagementDiscoveryTICFBCDDM702030,000140,000170,000 ReportingCarePatientElectronicTICFPSSCNAMajor50,00050,000 MajorSystemManagementAssetEnterpriseTICFPCDT70131,100,000500,0001,600,000 ManagementAssetDigitalEnterpriseTICFEAT7022Major50,000350,000400,000 UpgradeVisualAudioHubExplorationTICFEAT7023Major41,85241,852 PlanMasterSecurityFacilityTICFPSSC7003Major100,000100,000100,000100,000400,000 Major911LiveTICFPSSCNA66,38066,380 CatalogOnlineGenerationNextTICFEAT7024Major40,00040,000 (E-Reviews)ReviewsPermitting/ElectronicOnlineTICFEAT7025Major645,000645,000 StudyWirelessOutdoorTICFFVCECNAMajor100,000100,000 ManagementPrint/CopyPatronTICFEATNAMajor18,00070,00088,000 DeliveryProjectDataforServicesTechnicalProfessionalTICFBCDDMNAMajor70,00070,00070,00070,00070,000350,000 Consulting&ToolManagementPortfolioProjectTICFPCDT7004Major500,000500,000 (150,000)ImplementationSAMServiceNowTICFPCDT7015Major150,000 PortalServiceServiceNowTICFPCDT7016Major150,000150,000 UpgradeSystemTimekeepingTICFPCDTNAMajor95,00095,000 (OpenCounter)CounterPermittingVirtualTICFEAT7026Major61,00023,00084,000 HardwareTechnology(GPS)SystemPositioningGlobalTICFPCDTNAMinor45,91645,916
FundReplacementTechnologyInformation ReplacementInfrastructureandHardwareAnnualITRFPSSCNAMajor1,102,635790,0001,030,0001,485,0001,110,0001,050,0006,567,635 Capital)or(OperatingFundsEnterpriseUtilities AnalyticsManagement/UtilityDataMeterUEFBCDDMNAMajor550,000550,000 Funds)(OperatingAnalyticsUsageWaterRegulatoryUEFBCDDMNAMajor50,00050,000 AutomationBillingUtilityUEFPCDTNAMajor75,00075,000 PortalBillingUtilityUEFPCDTNAMajor90,00090,000 Capital)or(OperatingFundsEnterpriseUtilitiesTotal 765,000625,000140,000 $$$$$$$11,991,9873,937,3804,358,0004,355,0001,380,0001,320,00027,342,367 AbbreviationsGoalCarlsbadConnected BCDDM=MakingDecisionData-drivenforCapacityBuild EAT=TransparencyandAccessibilityEnhance FVCEC=CultureEngagementCivicVibrantaFoster PSSC=ConnectivitythroughSustainabilityandSecurityPromote PCDT=TransformationDigitalCommunitywidePursueGoalCarlsbadConnected ProjectsTotal
TotalFundCapitalInvestmentTechnology 20,009,732270,000270,0002,870,0002,703,0003,007,38010,889,352
Balance Available for Future Projects
PROJECT FUNDING SOURCES
Estimated Requested Estimated Estimated Estimated Estimated Balance Year 1 Year 2 Year 3 Year 4 Year 5 2021-22 2022-23 2023-24 2024-25 2025-26 2026-27
Ending Available Balance
Ending Available Balance
Technology Investment Capital Fund Funds set aside on a yearly basis to fund ongoing SDTIP digital transformation and technology projects
Requested Estimated Estimated Estimated Estimated Balance Year 1 Year 2 Year 3 Year 4 Year 5 2021-22 2022-23 2023-24 2024-25 2025-26 2026-27
Interest Revenue 72,000 90,000 113,000 141,000 176,000
Estimated Available Funds
H 41
1,654,923$ 2,349,929$ 2,669,929$ 2,534,929$ 2,774,929$ Replacement Cost Revenue 1,485,006 1,350,000 1,350,000 1,350,000 1,350,000
Beginning Available Balance
3,039,160$ 4,059,780$ 5,542,780$ 6,972,780$ 11,114,780$
FUNDING SOURCES
Beginning Available Balance
Replacement Appropriations 790,000 1,030,000 1,485,000 1,110,000 1,050,000 2,349,929$ 2,669,929$ 2,534,929$ 2,774,929$ 3,074,929$ 1,654,923$
INFORMATION TECHNOLOGY DEPARTMENT REPLACEMENT FUND FUNDS AVAILABILITY PROJECTION
For information regarding the Utilities Enterprise Funds, please see the Public Works Section of the Fiscal Year 2022 23 Operating Budget and for the Capital Funds please see the CIP Section of the Fiscal Year 2022 23 Operating Budget.

Project Appropriations 3,007,380 2,703,000 2,870,000 270,000 270,000 4,059,780$ 5,542,780$ 6,972,780$ 11,114,780$ 15,401,780$ 3,039,160$
Transfers In 3,956,000 4,096,000 4,187,000 4,271,000 4,381,000
Information Technology Replacement Fund Funds are collected annually from the city’s operating departments as part of the IT Department internal service fund chargeback; charges are based on an asset’s lifecycle and original cost. These funds are used to replace assets at the end of their useful lives
TECHNOLOGY INVESTMENT CAPITAL FUND FUNDS AVAILABILITY PROJECTION
Utilities Enterprise Funds (Operating or Capital)
H 42 FISCAL YEAR 2022-23 ROADMAP Schedule2022-23FYProgramInvestmentTransformationDigitalStrategic Legend:ProjectOngoing INITIATIVESGOAL SystemsCoreofReplacement&Consolidation NetworkInformationDigital ManagementAssetEnterprise ManagementPortfolioProject PortalServiceServiceNow UpgradeSystemTimekeeping PortalBillingUtility HardwareTechnology(GPS)SystemPositioningGlobal INITIATIVESGOAL AutomationProcessBusiness AnalyticsOperationalandGovernanceData DeliveryProjectDataforServicesTechnicalProfessional AnalyticsUsageWaterRegulatory INITIATIVESGOAL UpgradesVisualAudio StudyWirelessOutdoor INITIATIVESGOAL DataOpenwithEngagementCivic UpgradeVisualAudioHubExploration ManagementAssetDigitalEnterprise CatalogOnlineGenerationNext (E-Review)ReviewsPermitting/ElectronicOnline ManagementPrint/CopyPatron (OpenCounter)CounterPermittingVirtual INITIATIVESGOAL ReplacementInfrastructureandHardwareAnnual DocumentationProcessBusiness (CAD)DispatchAidedComputer DevelopmentProgramSecurityCyber ReportingCarePatientElectronic EOCintoMirroredareTechnologiesNewRelevantofAdoptionEnsure PlanMasterSecurityFacility Live911 EnhancementFunctionalityManagementTraffic JUN JUN JUN JUN JUN MAY MAY MAY MAY MAY APR APR APR APR APR MAR MAR MAR MAR MAR FEB FEB FEB FEB FEB JAN JAN JAN JAN JAN andSafetyPromote throughSustainability Connectivity OCT AUGJULOCTSEP andAccessibilityEnhance Transparency AUGJULSEP CivicVibrantaFoster CultureEngagementData-forCapacityBuild MakingDecisiondriven SEP OCT OCT WideCommunityPursue TransformationDigital AUGJULAUGJULAUGJULOCT SEPSEP NOV DEC DEC DEC DEC DEC NOV NOV NOV NOV AssessmentDecision Ongoing Ongoing OngoingOngoing OngoingImplementation--------------------------------------------------------------------------------------------------------------------Implementation OutRollPilotOngoing---------------------------------------------------------------------------------------------------------------------------Implementation Implementation Implementation----------------------------------- Implementation Ongoing OngoingImplementationGovernane OutRollPilot TBD Implementation TBD-----------------------------------------------------------------------------------------------------------Implementation Implementation ImplementationSelectionRFP Implementation ImplementationHardwareAquireTBD Assessment Implementation Ongoing Implementation TBD Ongoing ImplementationAssessment
FY2025-26
FY2025-26 FY2025-26 FY2025-26
FY2025-26
YearsPriorFY2022-232022-23FYINITIATIVES INITIATIVES YearsPrior
FY2026-27
H 43 FIVE-YEAR ROADMAP Roadmap5-Year-ProgramInvestmentTransformationDigitalStrategic EvaluatingApprovedLegend:InprogressOngoing Q4Q3Q2Q1Q4Q3Q2Q1Q4Q3Q2Q1Q4Q3Q2Q1Q4Q3Q2Q1Q4Q3Q2Q1 SystemsCoreofReplacement&Consolidation NetworkInformationDigital SystemManagementAssetEnterprise Consulting&ToolManagementPortfolioProject PortalServiceServiceNow UpgradeSystemTimekeeping AutomationBillingUtility PortalBillingUtility HardwareTechnology(GPS)SystemPositioningGlobal ServicesCityofUsersforIdentitySingleatoTransition Q4Q3Q2Q1Q4Q3Q2Q1Q4Q3Q2Q1Q4Q3Q2Q1Q4Q3Q2Q1Q4Q3Q2Q1 AutomationProcessBusiness AnalyticsOperationalandGovernanceData AssessmentManagementDiscovery AnalyticsManagement/UtilityDataMeter DeliveryProjectDataforServicesTechnicalProfessional AnalyticsUsageWaterRegulatory Q4Q3Q2Q1Q4Q3Q2Q1Q4Q3Q2Q1Q4Q3Q2Q1Q4Q3Q2Q1Q4Q3Q2Q1 UpgradesVisualAudio ConsultantAnalytics&EngagementDigital StudyWirelessOutdoor Q4Q3Q2Q1Q4Q3Q2Q1Q4Q3Q2Q1Q4Q3Q2Q1Q4Q3Q2Q1Q4Q3Q2Q1 DataOpenwithEngagementCivic UpgradeVisualAudioHubExploration ManagementAssetDigitalEnterprise CatalogOnlineGenerationNext (E-Review)ReviewsPermitting/ElectronicOnline ManagementPrint/CopyPatron (OpenCounter)CounterPermittingVirtual Q4Q3Q2Q1Q4Q3Q2Q1Q4Q3Q2Q1Q4Q3Q2Q1Q4Q3Q2Q1Q4Q3Q2Q1 ReplacementInfrastructureandHardwareAnnual DocumentationProcessBusiness (CAD)DispatchAidedComputer DevelopmentProgramSecurityCyber ReportingCarePatientElectronic PlanMasterSecurityFacility 911Live EnhancementFunctionalityManagementTraffic EOCintoMirroredareTechnologiesNewRelevantofAdoptionEnsure andSafetyPromote throughSustainability ConnectivityINITIATIVESGOAL YearsPriorFY2022-23FY2023-24FY2024-25 YearsPriorFY2024-25FY2022-23FY2023-24 CivicVibrantaFoster CultureEngagement INITIATIVES GOAL GOAL Data-forCapacityBuild MakingDecisiondriven GOALWideCommunityPursue TransformationDigital INITIATIVESGOAL YearsPrior FY2024-252023-24FY 2023-24FY 2023-24FY FY2024-25 2022-23FYFY2024-25 andAccessibilityEnhance Transparency
FY2065-27 FY2065-27 FY2065-27 FY2065-27
H 44
Regulatory & Policy Driven: Legal compliancerequirements,withGrowthManagementPlan,ClimateActionPlan,definedprojectstoimplementpolicies,plansandgoalsadoptedbytheCityCouncil EnhancementsCommunity : new facilities, expansions, parks & trails, traffic signals, improvementscoastal AccountingProject CFD #1 Admin Open Repayment/transferacquisitionspaceLoans
Capital Projects
CAPITAL IMPROVEMENT PROGRAM
The City of Carlsbad Capital Improvement Program reflects the city’s ongoing commitment to maintaining the highest standards of quality facilities for our community today and in the future. It is a planning document, not a commitment for spending. The 15 year program outlines the expenditure plan for future capital projects and the corresponding revenues to pay for those expenditures.
Projects that are shown in the CIP are generally defined as any construction, rehabilitation or replacement of major infrastructure such as streets, libraries, parks, fire stations and administrative facilities, water, sewer and drainage facilities, and other facilities that are located on or in the ground.
I 1
In most cases, the total construction cost of each of these assets is recorded and tracked as part of the city’s inventory of capital infrastructure assets and other city owned property.
Once the City Council adopts the proposed annual CIP budget, projects receive an appropriation that authorizes spending in the amount specified for the adopted fiscal year only. Estimated budget information is shown for a 15 year period to provide the most comprehensive information about known future projects. Spending authority in future years is not granted until adoption of the annual proposed CIP budget associated with each year.
The CIP is organized by the following project classifications:
Planning AssessmentStudyPlan Maintenance & Operations Technical master plans MaintenanceRefurbishment/RepairrehabilitationModificationsImprovementsprogramMonitoringReplacementUpgrade
The detailed level of planning required by Growth Management has allowed the city’s CIP to anticipate the funding needed for capital improvements in the next 15 years. Facilities such as community centers, parks and fire stations have been constructed and opened to the public under this program.
The Growth Management Plan states that unless a standard level of facilities is available to meet new demands resulting from the city’s growth, development cannot proceed. Recently, certain actions, such as imposing a moratorium, have been determined to be impermissible by the California Housing and Community Development Department, per Senate Bill 330, Housing Crisis Act of 2019, which became effective on Jan. 1, 2020.
INVESTING IN OUR QUALITY OF LIFE
Development of the CIP is a team effort involving all operational departments, the City Manager’s Office, the City Council, and the community. Community feedback on infrastructure needs is considered and incorporated as appropriate. The CIP is fully vetted at multiple levels of the city organization by appropriate staff using an inclusive and transparent process and reviewed on a quarterly basis.

The CIP has been designed to specifically address areas where new or expanded facilities will be needed to maintain compliance with the adopted performance standards. With the adoption of the fiscal year 2022 23 CIP, compliance with the Growth Management Plan is continued.
PROJECT EVALUATION
As the city continues to grow and develop, there is a corresponding increase in the demand for development related services and new facilities. To ensure that the necessary infrastructure and facilities are built on a schedule that meets or exceeds this demand, the citizens of Carlsbad adopted a Growth Management Plan in 1986. The plan was established to manage development within the city by linking residential, commercial, and industrial development directly to standards for availability of public services and facilities.
The City of Carlsbad’s philosophy is to take a proactive, long range planning approach to building high quality facilities and infrastructure that support the needs and priorities of the community. Prudent financial planning has ensured ongoing funding to modernize, repair, and replace existing infrastructure projects through numerous asset management programs. Since the city applies a comprehensive asset management approach to infrastructure planning and budgeting it is able to avoid more costly unexpected repairs or operational needs and minimize the burden on emergency expenditures.
I 2
Capital49%Projects Maintenance & Operations35% AccountingProject16% FY 2022 23 Appropriationsby Category $42.6 million Capital ImprovementProgram Public health and safety City Environmentalorganizationalvisionmission,andvaluesCommunityvaluesreviewGoverning and documentspolicy availabilityFunding CouncilCitygoals
Projects were evaluated for the ability to deliver realistic outcomes considering anticipated revenue decreases in some capital funding sources. The city remains focused on matching existing resources with reasonable and achievable project schedules while continuing to work on projects that are already underway. Existing project balances were evaluated to determine whether additional funding was needed or if the existing balances were adequate.
recommendationsFundingwerematched against project timing and balanced against available funding sources.
As the CIP is implemented throughout the year, staff continually re evaluate projects’ scopes, costs and schedules to responsibly and cost effectively manage infrastructure assets at the required levels of service throughout their lifecycle. Recommendations for project funding consider current project status, project scheduling and sequencing requirements, project constraints, and current staff capacity. Project charters are updated to include project description, location, summary of need, justification including any legislative or policy citations, cost estimates, and project scores.
FISCAL YEAR 2022 23 APPROPRIATIONS BY CATEGORY
I 3
In the fiscal year 2022 23 CIP, there are approximately 226 continuing and new projects planned over the next 15 years. The fiscal year 2022 23 CIP outlines $42.6 million in new appropriations to provide additional funding for the continuation of existing projects as well as funding for 14 new projects Projected revenues during the same fiscal year are estimated at $59.5 million.
$Drainage3.3million
$Sewer13.9million


$2.8 million
This category includes a variety of facilities such as fire stations, libraries and the new City Hall. Costs include repair, maintenance and replacement of civic buildings.
FISCAL YEAR 2022 23 APPROPRIATIONS BY PROJECT TYPE
Projects include improvements and enhancements to existing parks, such as playground resurfacing, picnic areas and other needs identified by the community and in recently updated parks master plans.

$Transportation19million
The city’s drainage infrastructure plays an important role in handling storm water runoff flows, as well as maintaining the water quality of the city’s creeks, lagoons and ocean. As the city continues to age, it is increasingly necessary to balance repairing and replacing the existing lines with enhancing the current infrastructure to accommodate future needs.
Water and Recycled Water

Future water and recycled water projects include construction of new pipelines, replacement of existing waterlines and reservoir improvements. The Carlsbad Municipal Water District has been producing and delivering recycled water for over 30 years

$1.7 million
The city’s sewer, or wastewater, projects include numerous pipeline construction and rehabilitation projects, as well as improvements to the Encina Wastewater Treatment facility. Most new lines are built and paid for with impact fees collected with new development.
Civic Buildings and Facility Maintenance

People of all ages and abilities want to go places safely and conveniently in Carlsbad, whether they drive, walk, bike, or ride a bus or train. The city continues to invest in modernizing roads, leveraging technology to improve traffic systems, and making timely repairs and rehabilitation of the roadways, bridges, sidewalks and other assets in public rights of way throughout the city.
$Parks1.8million
I 4
Managing Department: Utilities Classification: Capital Project Funding Source: Sewer Replacement
About This Project
About This Project
Project Need
BudgetFY23 $ 300,000 FY25 $ 1,590,000
The project will replace the generator and electrical equipment and construct a building to reduce corrosion of the electrical gear.
Ensures access to the facility is preserved and provides future SCADA and communication capabilities.
C Tank Access Road Repair and Electrical Improvement

Chinquapin Lift Station Improvements
NEW CAPITAL IMPROVEMENT PROJECTS
The project will repair asphalt and unimproved portions of the access road to maintain vehicle access to the reservoir. The project will provide electrical service from the end of Bobcat Boulevard to the reservoir for future Supervisory Control and Data Acquisition, or SCADA, and communications purposes.

Project Need
TOTAL $ 1,220,000
I 5
TOTAL $ 1,890,000
Expansion of the enclosure is required to meet the electrical code. Salt laden air causes premature corrosion of electrical equipment, and a climate controlled building is necessary. Generator replacement will provide continued reliability. The project is consistent with California Electrical Code.
Managing Department: Utilities Classification: Capital Project Funding Source: Recycled Replacement, Recycled Connection
BudgetFY23 $ 300,000 FY24 $ 920,000
About This Project
The Phase 3B project is consistent with the City Council approved 1998 Leo Carrillo Ranch Park Master Plan and the City Council adopted 2015 Parks & Recreation Department Master Plan (Park, Facility and Program Rankings).
TOTAL $ 2,400,000
The individual projects that comprise the Leo Carrillo Ranch Park Phase 3B Project were included in the 1998 City Council approved (AB #14,521, Jan. 13, 1998) Leo Carrillo Ranch Master Plan. In 2014, the city held a public workshop on prioritization of the park’s individual projects for future planning and cost estimating purposes. The details of this project were prioritized by stakeholder and staff feedback received at that workshop. The project will include updates and improvements to the Carriage House, the Caretaker’s Residence, Botanical Garden, West Meadow, Botanical Trail, Arbor, and Feed Storage Building/Tack Shed. This prioritization of the park’s individual projects was affirmed via the 2015 Parks & Recreation Department Master Plan.
Orion Complex Energy Storage
Managing Department: Facilities Classification: Planning


Study feasibility of alternative energy generation and storage, such as a microgrid, to support city facilities located along Orion Way.
FY26 $ 500,000 FY27 $ 1,400,000
If feasible, the project could offset ongoing energy costs and contribute to the city’s use of renewable energy sources.
Leo Carrillo Ranch Park Phase
3B
Managing Department: Parks and Recreation
TOTAL $ 250,000
BudgetFY25 $ 500,000
I 6
Funding Source: Park in Lieu Southeast
Project Need
Project Need
Funding Source: General Capital Construction
Classification: Capital Project
About This Project
BudgetFY27 $ 250,000
Poinsettia Lift Station Rehabilitation
TOTAL $ 2,500,000
The maintenance yard has become available for a new use. Staff proposes converting maintenance yard at Stagecoach Park into a raised container community garden. Project will include 20 raised planting beds, kiosk, composting bins, tool storage and benches.
Project Need
Managing Department: Parks and Recreation Classification: Capital Project
Improvements will provide continued functionality of a critical wastewater facility and mitigate potential of Sanitary Sewer Overflows.

BudgetFY23 $ 225,000 FY24 $ 200,000
TOTAL $ 425,000
To address demand for community gardens in southeast quadrant. The project is consistent with the Parks and Recreation Master Plan.
Stagecoach Community Park Community Gardens
Managing Department: Utilities Classification: Capital Project
Replacement of the three pumps and related mechanical equipment and electrical and odor control improvements.
Funding Source: Park in Lieu Southeast

Funding Source: Sewer Replacement
BudgetFY24 $ 2,500,000
Project Need
I 7
About This Project
About This Project
The existing 42 inch sewer is plastic lined and was constructed in the 1960s. Due to age and deformations in plastic liner, a comprehensive rehabilitation is needed.
Right turn overlap phasing improves traffic flow through an intersection by allowing right turns to occur at the same time as the protected left turn movement on the intersecting road. This improves traffic flow efficiency while also reducing vehicle idling and emissions.
BudgetFY23 $ 150,000
BudgetFY23 $ 200,000 FY24 $ 600,000 FY25 $ 600,000
Funding Source: Gas Tax
Managing Department: Utilities Classification: Maintenance and Operations
Funding Source: Sewer Replacement
About This Project
Managing Department: Transportation Classification: Capital Project
Traffic signal modification to provide right turn overlap phase at Poinsettia/Paseo Del Norte southbound approach, El Camino Real/Tamarack Avenue northbound approach, and Palomar Airport Road/Melrose Drive eastbound approach.


Project Need
TOTAL $ 1,400,000
Traffic Signal Right Turn Overlaps
Rehabilitate approximately 8,600 lineal feet of existing 42 inch diameter interceptor sewer pipeline and manholes with cured in place pipe. Carlsbad shares the total cost of the project with the City of Vista as a percentage of capacity.
TOTAL $ 150,000
I 8
Project Need
Vista/Carlsbad Interceptor – Point Repair Reaches VC13 & VC14
About This Project
TOTAL $ 800,000
Install decorative lighting solutions along streets as prioritized in Phase 4 of the 2019 Village Decorative Lighting Study.
Project Need
Install decorative lighting solutions along streets as prioritized in Phase 3 of the 2019 Village Decorative Lighting Study.
Project Need
Recommended in the 2019 Village Decorative Lighting Study and requested to be accelerated by City Council on May 3, 2022.
Recommended in the 2019 Village Decorative Lighting Study and requested to be accelerated by City Council on May 3, 2022.
I 9
BudgetFY23 $ 400,000
BudgetFY24 $ 800,000
About This Project
TOTAL $ 400,000
Managing Department: Transportation Classification: Capital Project
Managing Department: Transportation Classification: Capital Project
Village Decorative Lighting – Carlsbad Village Drive from Harding Street to Ocean Street

Funding Source: General Capital Construction
About This Project
Village Decorative Lighting Train Station Area
Funding Source: General Capital Construction
Funding Source: General Capital Construction
TOTAL $ 800,000
I 10
Project Need
Project Need
Recommended in the 2019 Village Decorative Lighting Study and requested to be accelerated by City Council on May 3, 2022.
BudgetFY24 $ 800,000
Funding Source: General Capital Construction
Managing Department: Transportation Classification: Capital Project
TOTAL $ 900,000
About This Project
About This Project
Install decorative lighting solutions along streets as prioritized in Phase 6 of the 2019 Village Decorative Lighting Study.
Recommended in the 2019 Village Decorative Lighting Study and requested to be accelerated by City Council on May 3, 2022.
Install decorative lighting solutions along streets as prioritized in Phase 5 of the 2019 Village Decorative Lighting Study.
Managing Department: Transportation Classification: Capital Project
BudgetFY24 $ 900,000
Village Decorative Lighting Gateway Lighting
Village Decorative Lighting – Hospitality District
BudgetFY24 $ 450,000
Managing Department: Transportation Classification: Capital Project
Village Decorative Lighting – Pedestrian Lampposts Oak Avenue
Funding Source: General Capital Construction
Managing Department: Transportation Classification: Capital Project
About This Project
TOTAL $ 450,000
Recommended in the 2019 Village Decorative Lighting Study and requested to be accelerated by City Council on May 3, 2022.
Project Need
BudgetFY24 $ 850,000
I 11
TOTAL $ 850,000
Install decorative lighting solutions along streets as prioritized in Phase 7.2 of the 2019 Village Decorative Lighting Study.
Project Need
Funding Source: General Capital Construction
About This Project
Install decorative lighting solutions along streets as prioritized in Phase 7.1 of the 2019 Village Decorative Lighting Study.
Recommended in the 2019 Village Decorative Lighting Study and requested to be accelerated by City Council on May 3, 2022.
Village Decorative Lighting – Pedestrian Lighting at Village Outskirts
Developer fees 14.9%
Water and wastewater replacement revenues generated by user fees equal approximately 36.8% of total revenues and are used to pay for replacement of existing water and sewer facilities.
Infrastructure Replacement and General Capital Construction revenues, equal to 18.2%, are transfers from the city’s General Fund, which are being set aside to pay for replacement of major capital facilities other than wastewater and water facilities and the construction of various municipal projects. The remaining 26.1% consists of revenues from other agencies and include federal and state grants, the county sales tax program TransNet, gas taxes, and contributions or reimbursements from cities, developers, and other agencies.
CAPITAL IMPROVEMENT PROGRAM REVENUES
Approximately 18.9% of all capital revenue is received as a result of development, including Developer Fees and financing districts in the chart above, and is dependent upon assumptions made about the city's annual growth in dwelling units and commercial and industrial square feet. These revenues include Public Facilities Fees, Traffic Impact Fees, Park In Lieu Fees, Planned Local Drainage Fees, Water Connection Fees, Sewer Connection charges, and community facilities districts and bridge and thoroughfare benefit districts fees
Capital Improvement Program
Infrastructure Replacement Fund 9.1%
I 12
Financing4.0%Districts
Other agencies 26.1%
UtilitytransfersReplacement36.8%
Projected Revenues FY 2022 23 to FY 2035 37 $758.6 million
Over the next 15 years, revenues for capital projects are estimated at $758 6 million and are segregated into six major funding sources: (1) fees generated by development in the City of Carlsbad, (2) special district fees and taxes from the community facilities districts and bridge and thoroughfare benefit districts, (3) water and wastewater replacement funds, (4) infrastructure replacement funds other than wastewater and water, (5) general capital construction funds, and (6) other sources, including grants, sales taxes and contributions from other agencies.
GeneralConstructionCapital9.1%
As shown on the graph on the previous page, there are a variety of revenues that are used to fund the capital projects. In order to estimate revenues to be received from development, several assumptions about the rate and type of future development are made. These assumptions can change from year to year and tend to correlate with the current economic climate.
I 13
FUTURE GROWTH AND DEVELOPMENT
Projected Future Development
several multi family residential developments, commercial industrial, office and other mixed use projects. Development estimates provide data for estimating future fee revenues, which are calculated by multiplying each applicable development fee by the estimated number of dwelling units and/or square feet of construction expected during each year.
about 3,158 residential units are anticipated for future development, and it is currently estimated that the city is more than 90% built out. Residential development for fiscal year 2022 23 is projected at 396 units, and, over the next five years, should average 256 units per year. The amount of non residential development is projected at about 419,000 square feet over the next five Projectsyears.include
Every year, city staff evaluates all existing and future private development projects and compares this information to the capacity of the city using the most current adopted general plans. Information about existing development activity combined with estimates of how remaining net developable land might develop is then summarized to prepare future projections about when and where residential and non residential development may occur. The following table shows the number of residential units and non residential square feet of development that was used in calculating estimated revenues for fiscal year 2022 23 and subsequent years to build out.
Financial forecasting schedules are prepared to ensure that funding will be sufficient and available for construction of capital projects as planned in the CIP. In addition to evaluating whether or not capital funds are sufficient, significant operating cost impacts and availability of staff resources are also considered in evaluating the timing of projects. Where funding discrepancies occur, alternative financing methods and project timing are evaluated, and recommendations are made to resolve the Conservatively,discrepancies.

I 14
FUTURE PROJECTS
Wastewater11%Parks9%Drainage7% 28% Water/RecycledWater22%Transportation23%
FY 2022 23 to FY 2035 37 $695 million
The CIP for fiscal year 2022 23 to fiscal year 2035 37 outlines approximately 246 projects at a cost of $695 million. Long range planning and responsible asset management play key roles in the development of future capital projects. Using data from various infrastructure master plans, ongoing asset condition assessments, technical modelling, field inspections as well as community feedback, the information provided for future years reflects the most comprehensive snapshot of known or anticipated future projects as well as associated estimated costs.
Future Project Costs By Type
Civic facilities
CALCULATION OF FUTURE FEES
Carlsbad Blvd./ Palomar Airport Road (Partial Funding) 14,109,600
CFD No. 1 is a citywide district established to finance various civic facilities required under the city’s Growth Management Plan. Park in Lieu Fees are collected for the purchase and development of parkland within each quadrant of the city, and the fees are based on the acquisition cost of parkland. Projects in the CIP funded with Park in Lieu Fees include future park site acquisition, development and restoration. Bridge and thoroughfare fee districts or BTDs are formed by property owners to finance specific road construction projects located within the district boundaries. BTD No.2 Poinsettia Lane/Aviara Parkway was formed to finance the construction of Poinsettia Lane between Aviara Parkway and El Camino Real and Aviara Parkway between Palomar Airport Road and Poinsettia Lane.
I 15
Carlsbad Blvd. Realignment - Segments 3-5 26,100,000
College Boulevard Extension 30,000,000
TOTAL UNFUNDED PROJECTS 85,958,200$
UNFUNDED PROJECTS
Cannon Lake Park (6.7 Acres) 2,243,000
The revenue projections in the CIP reflect the growth assumptions identified in the previous section. The following information delineates how those assumptions were applied to estimate future development revenues. The mix of future multi family and single family residential units is assumed to be 80% and 20%, respectively, and reflects the anticipated mix of residential development for each Local Facilities Management Zone.
There are six projects identified in the CIP for which there is no identifiable funding source and, in some cases, where only partial funding has been identified. The city will investigate obtaining possible external funding, such as federal and state grants, loans, or other financing sources. Once funding is identified for these projects, the project costs will have to be reviewed and updated to reflect actual cost estimates. The unfunded projects do not receive annual inflationary increases. Two projects are partially funded by the Traffic Impact Fee program The program was planned to generate enough revenue to pay for 20% of the total costs of these projects, leaving the remaining 80% unfunded.
Business Park Recreational Facility (Partial Funding) 6,600,000$
To calculate estimated revenues for Traffic Impact Fees, the number of average daily trips was computed for each type of development use. An attached multi family residential dwelling unit is assigned either eight or six trips and a detached single family unit is assigned 10 trips per day. The trips per day value for commercial and industrial buildings are 40 and eight trips per 1,000 square feet of development, respectively, although the actual volume of trips generated by commercial and industrial buildings can vary widely depending on the ultimate land use.
Carlsbad Blvd. Mountain View To Northerly City Limits (Partial Funding) 6,905,600
BTD#2 - Poinsettia Lane/Aviara Pkwy 13,513,126$ 1,881,644$ $ $ 15,394,770$ BTD#3 - Cannon Road West 520,569 6,026 526,595
Planned Local Drainage Area B 1,478,924 84,142 110,661 1,452,405
Planned Local Drainage Area A 972,197 32,116 34,551 969,762
Water Replacement - Recycled 18,726,556 192,424 2,528,816 16,390,164
I 16
PROJECTED FUND BALANCES FOR FISCAL YEAR 2021 22
Traffic Impact Fee 23,287,504 1,256,032 4,783,390 19,760,146
Total 523,928,204$ 48,918,018$ 77,020,734$ 746,939$ 495,078,549$
Sewer Connection 6,610,339 256,504 2,762,488 4,104,355
CFD #1 - Citywide 94,519,267 2,569,143 1,548,784$ 136,939$ 95,402,688 Gas Tax 13,249,248 3,187,066 2,849,097 610,000 12,977,217 Gas Tax (Road Maint. & Rehab Acct.) 4,470,272 2,449,147 5,435,499 1,483,920 General Capital Const. 41,842,109 13,146,189 23,557,683 31,430,615
Water Replacement - Potable 57,252,332 4,723,694 3,150,724 58,825,301
Transnet/Local 28,612,186 5,243,493 5,883,694 27,971,985
Planned Local Drainage Area C 1,547,165 56,164 2,802 1,600,527
Public Facilities Fee 30,801,682 1,064,333 2,897,693 28,968,322
Grants - Federal (5,696) 1,138,005 145 1,132,164 Infrastructure Replacement 123,490,551 1,790,608 12,051,911 113,229,248 Other 1,914,046 22,138 962,234 973,950 Park Fee Zones 5,13,16, 17, 18 4,746,080 225,641 4,971,721 Park-In-Lieu NE 4,618,117 155,317 4,773,434 Park-In-Lieu NW 2,181,771 399,653 2,581,424 Park-In-Lieu SE 1,747,717 139,642 1,196 1,886,163 Park-In-Lieu SW 754,704 54,984 809,688
Sewer Replacement 21,282,557 5,519,725 6,405,387 20,396,895
Water - Potable 36,447,661 889,627 145,381 37,191,908
July 1, 2021 Projected June 30, 2022 Unreserved Projected Projected Debt Service Projected Fund Balance Revenues Expenditures Loans & Other Balance
Planned Local Drainage Area D 657,242 275,385 33,732 898,895
Water - Recycled (11,310,024) 2,159,175 1,874,866 (11,025,715)
July 1, 2022 June 30, 2022 July 01, 2022 2022-23 June 30, 2023 Projected Estimated Continuing New Total Projected Fund Balance Revenues Appropriations Appropriations Appropriations Balance BTD#2 - Poinsettia Lane/Aviara Pkwy 15,394,770$ $ 13,499,116$ $ 13,499,116$ 1,895,654$ BTD#3 - Cannon Road West 526,595 526,595
PROJECTED FUND BALANCES FOR FISCAL YEAR 2022 23
Traffic Impact Fee 19,760,146 1,535,630 15,976,033 3,419,516 19,395,549 1,900,228
Water - Recycled (11,025,715) 14,272,277 6,998,950 (4,017,388) 2,981,562 265,000
Water - Potable 37,191,908 1,724,252 11,179,664 523,601 11,703,265 27,212,895
I 17
Planned Local Drainage Area B 1,452,405 151,107 29,823 10,355 40,178 1,563,334
Planned Local Drainage Area A 969,762 28,788 39,391 25,000 64,391 934,159
Planned Local Drainage Area D 898,895 80,989 41,820 41,820 938,063
CFD #1 - Citywide 95,402,688 2,853,218 32,056,555 1,367,250 33,423,805 64,832,101 Gas Tax 12,977,217 3,377,749 12,645,638 3,527,852 16,173,490 181,476 Gas Tax (Road Maint. & Rehab Acct.) 1,483,920 2,632,806 814,841 2,920,000 3,734,841 381,885 General Capital Const. 31,430,615 4,051,000 18,328,229 1,949,588 20,277,817 15,203,798
Planned Local Drainage Area C 1,600,527 156,935 38,274 25,000 63,274 1,694,188
Public Facilities Fee 28,968,322 1,866,561 6,088,569 (820,408) 5,268,161 25,566,722 Sewer Connection 4,104,355 396,950 3,384,837 1,003,000 4,387,837 113,467 Sewer Replacement 20,396,895 5,560,398 26,168,950 9,022,521 35,191,471 (9,234,178)
Transnet/Local 27,971,985 5,347,000 21,040,978 6,946,268 27,987,246 5,331,739
Water Replacement - Potable 58,825,301 5,609,663 39,292,528 8,783,006 48,075,534 16,359,430 Water Replacement - Recycled 16,390,164 1,000,000 5,092,443 1,417,500 6,509,943 10,880,221
Total 495,078,549$ 59,515,879$ 251,531,638$ 42,572,837$ 294,104,475$ 260,489,953$
Grants - Federal 1,132,164 2,373,295 3,505,459 3,505,459 0 Infrastructure Replacement 113,229,248 3,977,000 34,360,424 3,475,878 37,836,302 79,369,946 Other 973,950 323,489 323,489 650,461 Park Fee Zones 5,13,16, 17, 18 4,971,721 48,255 5,019,975 Park-In-Lieu NE 4,773,434 400,000 214,000 614,000 4,159,434 Park-In-Lieu NW 2,581,424 1,792,968 792 2,561,764 2,562,556 1,811,837 Park-In-Lieu SE 1,886,163 679,039 2,916 220,889 223,805 2,341,398 Park-In-Lieu SW 809,688 221,919 (2,355) 219,564 590,124
BTD#3 - Cannon Road West 18,996 17,696 949 6,026
Transnet/Local 3,779,436 4,546,554 3,347,237 5,243,493 5,347,000 Water - Potable 2,064,521 2,188,356 713,234 889,627 1,724,252
Water - Recycled 2,144,721 2,815,693 59,190 2,159,175 14,272,277 Water Replacement - Potable 6,970,260 7,885,252 6,378,189 4,723,694 5,609,663 Water Replacement - Recycled 2,046,796 1,995,701 1,083,332 192,424 1,000,000 Total 65,061,930$ 58,741,652$ 37,901,545$ 48,918,018$ 59,515,879$
Public Facilities Fee 3,673,762 3,439,781 1,751,477 1,064,333 1,866,561 Sewer Connection 874,464 749,326 332,049 256,504 396,950 Sewer Replacement 7,662,061 5,682,839 4,390,568 5,519,725 5,560,398
1,441,530 347,407 451,497 155,317
Planned Local Drainage Area C 82,796 53,875 2,779 56,164 156,935
BTD#2 - Poinsettia Lane/Aviara Pkwy 751,810$ 217,466$ 22,020$ 1,881,644$ $
General Capital Const. 1,077,525 5,111,500 4,654,470 13,146,189 4,051,000
Traffic Impact Fee 2,586,291 1,924,738 1,084,181 1,256,032 1,535,630
CFD #1 - Citywide 6,095,889 5,736,415 2,286,479 2,569,143 2,853,218
Park-In-Lieu NE
Planned Local Drainage Area A 155,094 48,111 27,489 32,116 28,788
I 18
2018-19 2019-20 2020-21 2021-22 2022-23 Actual Actual Actual Projected Estimated Fund Revenue Revenue Revenue Revenue Revenue
REVENUE PROJECTIONS SCHEDULE
Park Fee Zones 5,13,16, 17, 18 244,229 255,028 78,182 225,641 48,255
Infrastructure Replacement 15,073,019 9,369,345 4,704,670 1,790,608 3,977,000 Other 19,704 65,369 3,384 22,138
Park-In-Lieu NW 1,086,531 260,256 429,037 399,653 1,792,968 Park-In-Lieu SE 372,419 326,671 3,205 139,642 679,039 Park-In-Lieu SW 190,127 271,373 319,862 54,984
Planned Local Drainage Area D 124,198 31,433 2,877 275,385 80,989
Gas Tax 3,299,173 3,118,353 2,733,074 3,187,066 3,377,749 Gas Tax (Road Maint. & Rehab Acct.) 2,132,844 2,067,614 2,149,734 2,449,147 2,632,806
Grants - Federal 956,847 41,175 256,529 1,138,005 2,373,295
Planned Local Drainage Area B 136,887 174,328 635,853 84,142 151,107
Planned Local Drainage Area C 99,472 4,174 2,802 38,274 25,000 63,274
BUDGET EXPENDITURE SCHEDULE
Grants - Federal 41,175 260,820 145 3,505,459 3,505,459
Infrastructure Replacement 5,848,629 3,333,331 12,051,911 34,360,424 3,475,878 37,836,302 Other 8,868 962,234 323,489 323,489 Park Fee Zones 5,13,16, 17, 18 Park-In-Lieu NE 400,000 214,000 614,000 Park-In-Lieu NW 925 792 2,561,764 2,562,556 Park-In-Lieu SE 4,850 1,196 2,916 220,889 223,805 Park-In-Lieu SW 383,869 1,118 221,919 (2,355) 219,564
Total 44,736,495$ 35,725,667$ 77,767,673$ 251,531,638$ 42,572,837$ 294,104,475$
Water Replacement - Potable 6,761,187 5,224,472 3,150,724 39,292,528 8,783,006 48,075,534 Water Replacement - Recycled 151,548 792,286 2,528,816 5,092,443 1,417,500 6,509,943
Planned Local Drainage Area D 107,285 49,311 33,732 41,820 41,820
I 19
Actual Actual Estimated Continuing New Total FUND Expense Expense Expense Appropriations Appropriations Appropriations
BTD#2 - Poinsettia Lane/Aviara Pkwy 270,034$ $ $ 13,499,116$ $ 13,499,116$ BTD#3 - Cannon Road West CFD #1 - Citywide 381,703 582,179 1,685,723 32,056,555 1,367,250 33,423,805 Gas Tax 2,803,727 2,911,799 3,459,097 12,645,638 3,527,852 16,173,490 Gas Tax (Road Maint. & Rehab Acct.) 889,601 170,381 5,435,499 814,841 2,920,000 3,734,841 General Capital Const. 5,503,817 5,086,290 23,557,683 18,328,229 1,949,588 20,277,817
Public Facilities Fee 1,184,567 164,847 2,897,693 6,088,569 (820,408) 5,268,161 Sewer Connection 190,119 810,372 2,762,488 3,384,837 1,003,000 4,387,837 Sewer Replacement 7,797,397 8,206,747 6,405,387 26,168,950 9,022,521 35,191,471
2019-20 2020-21 2021-22 2022-23 2022-23 2022-23
Traffic Impact Fee 629,024 1,196,826 4,783,390 15,976,033 3,419,516 19,395,549
Planned Local Drainage Area A 107,524 6,131 34,551 39,391 25,000 64,391
Planned Local Drainage Area B 305,319 1,510,279 110,661 29,823 10,355 40,178
Transnet/Local 4,294,221 2,152,292 5,883,694 21,040,978 6,946,268 27,987,246
Water - Potable 42,813 17,507 145,381 11,179,664 523,601 11,703,265 Water - Recycled 6,937,689 3,235,638 1,874,866 6,998,950 (4,017,388) 2,981,562
I 20
Project Name New Project DistrictScore Funding ID Funding Source Prior Appropria on Year 1 (2022-23) Year 2 (2023-24) Year 3 (2024-25) Year 4 (2025-26) Year 5 (2026-27) Year 6-10 (2028-32) Year 11-15 (2033-37) Total Funding Source Abandon Potable Services (New Recycled Services) NOCitywideMedium52051 WATER REPL ADA Beach AccessPine to TamarackNO1Medium60651 GCC ADA Improvement ProgramNO1High60491 TRANSNET -LOC Agua Hedionda Creek MaintenanceNO2High 33381 PLDB 66291IRF Agua Hedionda Li Sta on Biological Monitoring and Maintenance NO2Cri cal55451 SEWER REPL Alga Norte Park Modifica onsNO2Medium47331GCC Assessment District 97-1 MaintenanceNO3Medium60841 GCC Avenida Encinas and Palomar Airport Road Pedestrian Access Improvement NO2Low60911GAS TAX Avenida Encinas Coastal Rail Trail and Pedestrian Improvements NO2,3Cri cal 60041 TIF 60042FED GRNT Aviara Reimbursement AgreementNO2Low36491 PIL-SW Barrio Street Ligh ng NO1High 40131GCC 40133 GAS TAX 40134 TRANSNET -LOC Beach Access Repair and UpgradesPine Avenue to Tamarack NO1Cri cal 38961 IRF 38962GCC 1,925,825 500,000 500,000 50,000 875,825 2,875,000 2,500,000 375,000 9,385,000 2,225,000 2,225,000 715,000 175,000 715,000 175,000 715,000 2,440,000 3,545,249 -14,645 3,559,894 1,663,000 585,000 520,000 95,000 90,000 80,000 80,000 80,000 133,000 225,000 225,000 1,020,200 706,200 314,000 420,000 420,000 100,000 25,000 75,000 5,177,903 3,177,000 2,000,903 1,776,000 1,776,000 238,000 238,000 760,000 760,000 700,000 700,000 3,590,000 1,030,000 1,280,000 1,280,000 5,912,750 1,800,000 4,112,750 15year Capital Improvement Program
Project Name New Project DistrictScore Funding ID Funding Source Prior Appropria on Year 1 (2022-23) Year 2 (2023-24) Year 3 (2024-25) Year 4 (2025-26) Year 5 (2026-27) Year 6-10 (2028-32) Year 11-15 (2033-37) Total Funding Source Beach Access Repair and UpgradesPine Avenue to Tamarack NO1Cri cal 38961 IRF 38962GCC Bridge Preventa ve Maintenance Program NOCitywideHigh60661 IRF Buena Interceptor Sewer Access Road Improvements NO3High55371 SEWER REPL Buena Interceptor Sewer Improvements NO2,3High 55011 SEWER REPL 55012 SEWER CONN Buena Interceptor Sewer RealignmentEast Segment NO2High55441 SEWER REPL Buena Vista Creek Concrete Channel Maintenance at El Camino Real NO1Cri cal 66191GCC 66192 IRF Business Park Recrea onal Facility (Par al Funding) NO2Low19041ZONE 5 C-Tank Access Road Repair and Electrical Improvements YES2Medium 52151 RECY REPL 52152 RECYCON N Calavera Hills Community Center Refurbishment NO2Medium47461 IRF Calavera Hills Community Park Gateway Improvements NO2High46011GCC Camino De Los Coches and La Costa Avenue Intersec on Control NO4Cri cal63251 GAS TAX Camino Hills and Jackspar Drive Slope Stabiliza on NO2Medium60301GCC Cannon Park Restroom NO2Low47261 GCC Cannon Road Li Sta on Improvements NO2High55521SEWER REPL 6,199,000 6,199,000 4,177,511 700,000 500,000 500,000 250,000 2,227,511 1,150,000 1,150,000 5,348,686 920,000 2,070,000 1,150,000 250,000 958,686 550,000 550,000 2,675,000 2,168,000 507,000 2,260,000 425,000 375,000 30,000 150,000 30,000 1,250,000 4,020,000 1,200,000 2,820,000 5,065,200 4,665,200 400,000 1,575,000 1,325,000 250,000 315,000 265,000 50,000 1,985,000 1,300,000 685,000 1,407,850 1,407,850 850,000 500,000 350,000 859,400 859,400 45,765 45,765 15year Capital Improvement Program
Carlsbad WATER REPL Carlsbad TRANSNET -LOC
Boulevard RealignmentManzano Drive to Island Way NO2Low 19081
19091TIF
Village Drive and Grand Avenue Pedestrian and Crossing Improvements NO1Medium19121
Carlsbad Water Recycling (Encina Capital Projects) NO3High 52031 WATER REPL 52032RECL REPL
Total -LOC
Boulevard Waterline Replacement at Terramar NO2Cri cal50481
Facility
15year Capital Improvement Program
Carlsbad Water Recycling Facility Irriga on and Landscape NO3High52131 RECL REPL
Project Name New Project DistrictScore Funding ID Funding Source Prior Appropria on Year 1 (2022-23) Year 2 (2023-24) Year 3 (2024-25) Year 4 (2025-26) Year 5 (2026-27) Year 6-10 (2028-32) Year 11-15 (2033-37)
Carlsbad TIF
Funding Source Cannon Park Restroom NO2Low47261 GCC Cannon Road Li Sta on Improvements NO2High55521 SEWER REPL Carlsbad Boulevard and Tamarack Avenue Pedestrian Improvements NO1High 60581 GAS TAX 60583 TRANSNET -LOC Carlsbad Boulevard Emergency RepairNO3High60631 GAS TAX Carlsbad Boulevard Lane Reduc on and Edge Striping NO2,3High60961GAS TAX Carlsbad Boulevard MedianTamarack Avenue to Pine Avenue NO1Low19071 GAS TAX Carlsbad Boulevard Pedestrian Improvement Project NO1High 60971GAS TAX 60972 FED GRNT Carlsbad Boulevard Pedestrian Ligh ngNO1High60681 TRANSNET
Carlsbad Water Recycling Facility Roof Replacement NO3Low47491RECL REPL 715,000 565,000 150,000 2,276,000 700,000 1,576,000 1,054,000 1,054,000 841,000 841,000 300,000 300,000 2,763,000 2,763,000 222,100 222,100 591,600 591,600 1,325,000 1,325,000 932,000 932,000 3,681,000 3,681,000 4,730,000 1,300,000 3,430,000 1,320,000 1,320,000 599,944 599,944 9,032,710 1,252,000 252,000 223,000 1,879,000 895,000 474,000 366,000 3,691,710 175,000 175,000
Project Name New Project DistrictScore Funding ID Funding Source Prior Appropria on Year 1 (2022-23) Year 2 (2023-24) Year 3 (2024-25) Year 4 (2025-26) Year 5 (2026-27) Year 6-10 (2028-32) Year 11-15 (2033-37) Total Funding Source CarlsbadWaterRecyclingFacility Irriga on and Landscape NO3High52131 RECL REPL Carlsbad Water Recycling Facility Roof Replacement NO3Low47491RECL REPL Cathodic Protec on ProgramNOCitywideCri cal50071 WATER REPL CFD#1 Administra on NO2,3Low19151CFD#1 Chestnut Avenue Complete Street ImprovementsValley to Pio Pico NO1Medium19161 TRANSNET -LOC Chestnut Complete Street I-5 to Railroad Project Study NO1Medium60691 TRANSNET -LOC Chestnut Underpass Public Art ProjectNO1Medium60981 GCC Chinquapin Li Sta on ImprovementsYES1High55541 SEWER REPL Chris ansen Way ImprovementsNO1Medium19171 TRANSNET -LOC City Facility Accessibility UpgradesNOCitywideMedium47271GCC City Facility Safety and Parking Lot Ligh ng Assessment NOCitywideHigh 60741 IRF 60742PIL-NW City Fire Sta ons Wash Water BMPsNO2Medium66161 GCC City Hall Complex NOCitywideCri cal40081CFD#1 City Hall Complex RefurbishmentNO1Medium47181 IRF City Hall Exterior RefurbishmentNO1Cri cal47251GCC Citywide Drainage Improvement Program NO1High 66082 GAS TAX 66083IRF 225,000 225,000 3,096,700 280,000 260,000 190,000 190,000 190,000 190,000 190,000 1,606,700 550,000 110,000 110,000 110,000 110,000 110,000 1,080,000 1,080,000 85,000 85,000 250,000 150,000 100,000 1,220,000 920,000 300,000 310,000 310,000 500,000 500,000 1,910,000 1,910,000 200,000 200,000 280,000 280,000 51,028,105 50,000,000 1,028,105 1,144,000 1,144,000 2,250,000 2,250,000 6,090,594 6,090,594 15year Capital Improvement Program
Project Name New Project DistrictScore Funding ID Funding Source Prior Appropria on Year 1 (2022-23) Year 2 (2023-24) Year 3 (2024-25) Year 4 (2025-26) Year 5 (2026-27) Year 6-10 (2028-32) Year 11-15 (2033-37) Total Funding Source Citywide Drainage Improvement Program NO1High 66082 GAS TAX 66083IRF Citywide Street Ligh ng ProgramNOCitywideMedium60921 GAS TAX Citywide Thermoplas c Pavement Markings NOCitywideCri cal60931GAS TAX Cole Library Expansion NO1Low 19211 CFD#1 19212PFF 19213 GCC Cole Library Security FencingNO1Low47501IRF College BoulevardCannon Road To Badger Lane (375 Zone) NO2Medium50131 WATER CONN College BoulevardCannon Road To Badger Lane (490 Zone) NO2Medium50121 WATER CONN College Boulevard ExtensionNO2High 36362 OTHER 36363PLDB 36364 TRANSNET -LOC Concrete Repair/Replacement Program NO4Medium 60132GAS TAX 60133 RMRA Coordinated Traffic Signal ProgramNOCitywideHigh 63261 TRANSNET -LOC 63264 TRANSNET -LOC 63265IRF 9,781,500 1,500,000 1,500,000 300,000 300,000 300,000 300,000 900,000 4,681,500 150,000 150,000 50,000 50,000 5,988,000 5,988,000 11,936,000 11,936,000 1,000,000 1,000,000 170,000 130,000 40,000 1,278,383 1,000,000 28,200 250,183 1,562,600 1,250,000 12,600 300,000 1,713,002 1,713,002 1,205,000 1,205,000 2,933,000 2,933,000 6,327,000 1,250,000 1,250,000 620,000 620,000 620,000 620,000 620,000 727,000 2,583,979 2,583,979 1,000,000 1,000,000 15year Capital Improvement Program
NO2Low19261
DMP Facility AAA (Jefferson Street)NO1Low19231 PLDA
Desalinated Water Flow Control Facility No. 5 WATER CONN
NO1Medium66091
Total Funding Source -LOC 63265IRF
DMP Facility BCB (Magnolia Avenue)NO1Medium19281 PLDB
Crestview Drive Transmission MainNO1Medium50331 REPL
DMP Facility BB 1 and 2 (Washington Street) NO1Low19271PLDB
NO2Low19251PLDA
DMP Facility BFB-U (El Camino Real)NO1High 66221PLDB 66222 IRF
DMP Facility AAAA (Madison Street)NO1Medium19241PLDA
DMP Facility AFA (Hidden Valley Drainage Restora on and Enhancement Project)
DMP Facility BL-U (College Boulevard)NO2Low19311 PLDB
Project Name New Project DistrictScore Funding ID Funding Source Prior Appropria on Year 1 (2022-23) Year 2 (2023-24) Year 3 (2024-25) Year 4 (2025-26) Year 5 (2026-27) Year 6-10 (2028-32) Year 11-15 (2033-37)
DMP Facility AC (Highland Drive Drainage Project) PLDA
WATER
DMP Facility BFB-L and BFB-1 (Tamarack and El Camino Real Plda "B") NO1Low19291 PLDB
15year Capital Improvement Program
Coordinated Traffic Signal ProgramNOCitywideHigh 63264 TRANSNET
DMP Facility AFB (Calavera Hills Drainage Restora on and Enhancement Project) PLDA
DMP Facility BL-L (College Boulevard Bridge Reimbursement Plda "B") NO2Low19301PLDB
NO2High50381
DMP Facility BM (Cantarini/College BoulevardBoxCulvert) NO2Low19321PLDB 800,000 800,000 856,000 535,000 21,000 300,000 10,811,601 707,301 10,104,300 289,534 289,534 416,500 416,500 921,408 921,408 91,608 91,608 163,164 163,164 1,086,065 1,086,065 468,096 468,096 1,241,649 1,241,649 904,329 904,329 153,489 153,489 4,100,000 50,000 50,000 50,000 50,000 50,000 3,000,000 100,000 750,000 1,816,101 1,816,101 384,509 384,509
DMP Facility BFA (Country Store)NO2High66271PLDB
DMP Facility BL-U (College Boulevard)NO2Low19311 PLDB
Project New Project DistrictScore Funding ID Funding Source Prior Appropria on Year 1 (2022-23) Year 2 (2023-24) Year 3 (2024-25) Year 4 (2025-26) Year 5 (2026-27) Year 6-10 (2028-32) Year 11-15 (2033-37)
DMP Facility BM (Cantarini/College Boulevard Box Culvert) NO2Low19321PLDB
15year Capital Improvement Program
Total Funding Source
DMP Facility C2 (Paseo Del Norte)NO3Low19351 PLDC
DMP Facility DQB (La Costa Town Center) NO4Medium19411PLDD
Dove Library Ligh ng ImprovementsNO3Low40811GCC
CreekBridgeRailingandSidewalk
Name
DMP Facility DZ (Poinse a Lane)NO3High19421 PLDD
DMP Facility DFA (Ba quitos Lagoon Stormwater Treatment) NO4Low19391PLDD
DMP Facility BQ (Sunny Creek)NO2Low19331 PLDB
DMP Facility BR (Cantarini/College Boulevard Pipe Drainage) NO2Low19341PLDB
DMP Facility DBB (Avenida Encinas)NO4Low19381 PLDD
Drainage Master Plan Facility DBA (Poinse a Village) NO4Low19371 PLDD Drainage Master Plan UpdateNOCitywideHigh 66231PLDA 66232 PLDB 66233PLDC 66234 PLDD
El Camino Real and Agua Hedionda NO2Cri cal60561IRF 204,077 204,077 131,355 131,355 180,773 180,773 727,730 727,730 529,402 529,402 429,108 429,108 256,423 256,423 232,812 232,812 745,842 745,842 642,063 642,063 225,000 225,000 167,215 167,215 216,512 25,000 191,512 583,000 25,000 558,000 171,890 25,000 146,890 234,598 234,598
DMP Facility CA (Avenida Encinas)NO3Low19361PLDC
DMP Facility DH (Al ve Place Canyon Restora on) NO3Low19401 PLDD
Total Opera ons GCC Capital cal58011 SEWER REPL Faraday and El Camino Real Sewer AirportRoad NO2High55391SEWER CONN 210,000 210,000 3,536,000 3,536,000 837,000 837,000 1,020,000 1,020,000 131,000 131,000 695,780 695,780 904,530 904,530 438,000 438,000 9,260,000 6,010,000 3,250,000 3,155,000 50,000 3,105,000 1,440,000 1,440,000 5,010,000 1,010,000 4,000,000 830,000 650,000 180,000 1,658,000 1,658,000 700,000 500,000 200,000 168,176,401 39,174,600 42,644,000 7,757,200 8,002,500 8,450,000 6,957,000 6,367,800 48,823,301
Replacement-OriontoPalomar
Center Reconfigura on NO2Medium 47191
Funding Source Drainage Master Plan UpdateNOCitywideHigh66234 PLDD El Camino Real and Agua Hedionda Creek Bridge Railing and Sidewalk NO2Cri cal60561IRF El Camino Real and Cannon Road Intersec on Improvements NO2Cri cal 60421 TIF 60422GAS TAX El Camino Real and College Boulevard Intersec on Improvements NO2Cri cal 60711 GAS TAX 60712GCC El Camino Real Medians NOCitywideLow 36431 PFF 36432GAS TAX El Camino Real Right Turn Lane to East Bound Alga Road NO3Low19441 TIF El Camino Real WideningArenal Road to La Costa Avenue NO4High60511TIF El Camino Real WideningPoinse a Lane to Camino Vida Roble NO2Cri cal 60721 TRANSNET -LOC 60722FED GRNT El Camino Real WideningSunny Creek to Jackspar NO2Cri cal60941 TRANSNET -LOC El Fuerte Li Sta on Pump Addi onNO2Medium55531 SEWER CONN Emergency
Projects NOCitywideCri
15year Capital Improvement Program
Project Name New Project DistrictScore Funding ID Funding Source Prior Appropria on Year 1 (2022-23) Year 2 (2023-24) Year 3 (2024-25) Year 4 (2025-26) Year 5 (2026-27) Year 6-10 (2028-32) Year 11-15 (2033-37)
47192IRF Encina
Project Name New Project DistrictScore Funding ID Funding Source Prior Appropria on Year 1 (2022-23) Year 2 (2023-24) Year 3 (2024-25) Year 4 (2025-26) Year 5 (2026-27) Year 6-10 (2028-32) Year 11-15 (2033-37) Total Funding Source Encina Capital Projects NOCitywideCri cal58011 SEWER REPL Faraday and El Camino Real Sewer ReplacementOrion to Palomar Airport Road NO2High55391 SEWER CONN Faraday Avenue ImprovementsNO2High60991 GCC Faraday Center RefurbishmentNO2Medium47201IRF Fire Administra on OfficesNO2Medium40891 GCC Fire Flow Capacity System Improvements NO1High50431 WATER REPL Fire Sta on No. 2 ReplacementNO4High 40601 GCC 40602IRF Fire Sta on No. 6 Renova onNO4Low47511 IRF Fleet Fuel Island Upgrade NO2High47471IRF Fleet Maintenance RefurbishmentNO2High 47141 IRF 47142GCC Foxes Landing Li Sta on Wetwell and Pump Replacement NO1Cri cal55261 SEWER REPL Gas Tax Transfer to General Fund (Transporta on Opera ng Budget) NOCitywideNullPA011GAS TAX Grand Avenue Promenade Feasibility Study NO1Medium40612 GCC Guardrail Replacement and Improvement Program NOCitywideMedium60871GAS TAX Harding Center RefurbishmentNO1Low47081 IRF Headwall Replacement ProgramNO1High66241IRF 1,740,000 1,600,000 140,000 100,000 100,000 3,154,380 3,154,380 150,000 150,000 2,174,000 264,000 1,700,000 -1,500,000 1,710,000 13,000,000 13,000,000 1,433,882 1,433,882 35,000 35,000 3,363,800 100,000 400,000 400,000 200,000 500,000 1,763,800 2,574,000 500,000 2,074,000 896,100 896,100 6,392,000 700,000 5,692,000 9,000,000 3,000,000 3,000,000 600,000 600,000 600,000 600,000 600,000 800,000 600,000 200,000 300,000 300,000 305,000 140,000 165,000 15year Capital Improvement Program
Project Name New Project DistrictScore Funding ID Funding Source Prior Appropria on Year 1 (2022-23) Year 2 (2023-24) Year 3 (2024-25) Year 4 (2025-26) Year 5 (2026-27) Year 6-10 (2028-32) Year 11-15 (2033-37) Total Funding Source Harding Center RefurbishmentNO1Low47081 IRF Headwall Replacement ProgramNO1High66241IRF Hosp Grove Park ImprovementsNO1Low 47281 IRF 47282PIL-NW Hydroelectric Genera on at Water Facili es NO2Medium50591 WATER CONN Intelligent Traffic Control DevicesNOCitywideLow66341GAS TAX Kelly Drive and Park Drive Complete Street Improvements NO1High 60751 TRANSNET -LOC 60753GAS TAX 60754 PFF Kelly Drive Channel RepairNO1Medium66061IRF La Costa Avenue Traffic ImprovementsNO4Medium60761 GAS TAX Laguna Drive Storm Drain NO1Medium66281GAS TAX Lake Calavera Outlet ImprovementsNO2Cri cal50541 GCC Lake Calavera Reservoir MaintenanceNO2High50492GCC Las Palmas Roof ReplacementNO2Medium47521 IRF Las Palmas Trunk Sewer NO2High55401 SEWER CONN Le Turn Lane Extensions NO3,4High60771 GAS TAX Leo Carrillo Ranch Park Phase 3BYES3Medium23071PIL-SE 510,000 510,000 1,562,000 1,562,000 2,652,126 1,323,476 208,650 1,000,000 120,000 1,853,000 1,425,000 28,000 400,000 200,000 200,000 4,675,000 500,000 4,175,000 130,000 130,000 1,085,000 1,085,000 3,441,000 1,900,000 500,000 1,041,000 863,000 741,700 121,300 2,750,000 1,494,000 1,000,000 256,000 1,436,001 1,436,001 1,351,001 250,000 250,000 50,000 50,000 120,000 50,000 50,000 531,001 500,000 500,000 3,463,000 2,907,000 556,000 800,000 150,000 150,000 150,000 150,000 200,000 15year Capital Improvement Program
Project Name New Project DistrictScore Funding ID Funding Source Prior Appropria on Year 1 (2022-23) Year 2 (2023-24) Year 3 (2024-25) Year 4 (2025-26) Year 5 (2026-27) Year 6-10 (2028-32) Year 11-15 (2033-37) Total Funding Source Le Turn Lane Extensions NO3,4High60771 GAS TAX Leo Carrillo Ranch Park Phase 3BYES3Medium23071PIL-SE Leo Carrillo Ranch Roof RepairsNO3High47481 IRF Library Fire Alarm Panel UpgradesNO1,3Low47411IRF Limited Access Pipeline Reloca on Program NO1,3Cri cal50351 WATER REPL Loan RepayPark-in-Lieu NE to Public Facility Fee Fund NONullNullPA041PIL-NE Loan RepayPark-in-Lieu SW to Public Facility Fee Fund NONullNullPA021 PIL-SW Loan RepaySewer Conn to Sewer Repl NONullNullPA031 SEWER CONN Maerkle Facility ImprovementsNO2Cri cal50091 WATER REPL Maerkle Reservoir Floa ng Cover Replacement NO2Cri cal50361 WATER REPL Maerkle Reservoir Solar ProjectNO2Medium47222 WATER REPL Maerkle Reservoir Transmission MainNO2Medium50011 WATER REPL Marca Place Drainage ImprovementsNO4Medium66141 GAS TAX Melrose Drive Right Turn Lane to West Bound Palomar Airport Road NO2Cri cal60341TIF Miscellaneous City Building Improvements NOCitywideMedium47231 IRF Monroe Street Pool ReplacementNO1High 47241IRF 47242 GCC 47243PIL-NW 2,400,000 1,400,000 500,000 500,000 1,450,000 1,450,000 180,000 180,000 4,940,000 1,000,000 2,000,000 1,940,000 4,550,000 4,550,000 1,100,000 1,100,000 4,700,000 4,700,000 2,735,200 500,000 2,235,200 11,032,844 11,032,844 250,000 249,170 830 6,330,000 4,557,000 1,000,000 773,000 65,000 65,000 911,000 911,000 3,665,000 750,000 750,000 150,000 150,000 150,000 1,715,000 2,657,747 908,983 -4,438,236 6,187,000 236 -61,764 62,000 15year Capital Improvement Program
Project Name New Project DistrictScore Funding ID Funding Source Prior Appropria on Year 1 (2022-23) Year 2 (2023-24) Year 3 (2024-25) Year 4 (2025-26) Year 5 (2026-27) Year 6-10 (2028-32) Year 11-15 (2033-37) Total Funding Source Monroe Street Pool ReplacementNO1High 47242 GCC 47243PIL-NW New Village Arts Building Roof and Exterior Refurbishment NO1Low47391 IRF New Village Arts Tenant ImprovementsNO1Medium47551GCC Normally Closed Valve (Install Motorized Valve) NO3High50501 WATER REPL North Ba quitos Access Road Improvement NO4High55471 SEWER REPL North Ba quitos Li Sta on Forcemain Rehabilita on NO4High55361 SEWER REPL Ocean Street Reconfigura on Concepts Study NO1Medium60781GCC Ocean Street Restroom FacilityNO1Medium47291 GCC Odor and Corrosion Preven on Assessment NOCitywideMedium55201 SEWER REPL Open Space and Trail Acquisi on (Prop C) NOCitywideHigh40831 GCC Orion Center NO2High 35721CFD#1 35722 WATER REPL 35723 SEWER REPL 35724 CFD#1 35725RECL REPL Orion Complex Energy StorageYES2Medium23101 GCC Palomar Airport Road and Avenida EncinasGrowthManagementPlan Improvements NO2,3High61021GAS TAX 3,061,764 1,500,000 1,561,764 313,626 313,626 613,000 613,000 985,000 500,000 485,000 363,800 113,800 250,000 200,000 -750,000 950,000 200,000 200,000 834,355 59,355 775,000 320,000 320,000 4,015,000 4,015,000 35,257,727 35,257,727 6,789,409 6,789,409 4,078,500 4,078,500 429 429 2,715,600 2,715,600 250,000 250,000 15year Capital Improvement Program
Poinse
15year Capital Improvement Program
Project Name New Project DistrictScore Funding ID Funding Source Prior Appropria on Year 1 (2022-23) Year 2 (2023-24) Year 3 (2024-25) Year 4 (2025-26) Year 5 (2026-27) Year 6-10 (2028-32) Year 11-15 (2033-37)
Phase 4Dog Park NO3High 46081PFF 46082
60012 GAS TAX 60013 TRANSNET
Poinse a LaneCassia Road to CONN
60016 RMRA
Skimmer Court (Reimbursement Agreement) NO3Medium50451 WATER
Poinse a LaneReach E Cassia Road to Skimmer Court BTD#2 a LaneReaches A,B,C,F,G andAviaraParkwayReimbursement NO2High19591BTD#2 230,000 230,000 1,295,500 1,295,500 320,538 -110,000 430,538 917,482 -8,157 925,639 2,310,000 560,000 1,750,000 717,439 717,439 3,965,000 1,030,000 2,935,000 2,920,000 475,000 475,000 60,000 130,000 60,000 130,000 60,000 1,530,000 41,786,563 8,250,000 8,250,000 1,650,000 1,650,000 1,650,000 1,150,000 19,186,563 7,930,850 7,930,850 29,646,476 4,750,000 4,750,000 950,000 950,000 950,000 950,000 2,200,000 14,146,476 43,936,000 12,000,000 12,000,000 2,400,000 2,400,000 2,400,000 2,400,000 2,300,000 8,036,000 2,838,140 2,838,140 600,000 600,000 14,081,200 14,081,200
Poinse a Community ParkPFF
Funding Source Orion Complex Energy StorageYES2Medium23101 GCC Palomar Airport Road and Avenida Encinas Growth Management Plan Improvements NO2,3High61021GAS TAX Palomar Airport Road and College Boulevard Improvements NO2Cri cal60281 TIF Palomar Airport Road/Paseo Del Norte Right Turn Lane NOCitywideHigh 60441GAS TAX 60442 TRANSNET -LOC Palomar Airport Waterline Realignment NO2Cri cal50551 WATER REPL Park Drive Street and Drainage Improvement NO1Cri cal 66111 GCC 66112GAS TAX Parking Lot Maintenance ProgramNO1High60521 IRF Pavement Management ProgramNOCitywideHigh 60011 TRANSNET
Total -LOC -LOC
NO3High39221
1,000,000 1,000,000 200,000 200,000
15year Capital Improvement Program
Funding Source Poinse aLane-ReachECassiaRoad to Skimmer Court NO3High39221 BTD#2 Poinse a LaneReaches A,B,C,F,G and Aviara Parkway Reimbursement NO2High19591BTD#2 Poinse a Li Sta on Rehabilita onYES2High23041 SEWER REPL Police and Fire Headquarters Renova on NO2High 47151IRF 47152 GCC Pressure Reducing Sta on ProgramNOCitywideCri cal50201 WATER REPL Rancho Carlsbad Groundwater SupplyNO2Low 50611 WATER CONN 50612 WATER REPL Rancho Santa Fe Trail Slope Improvements NO4High60881 GCC Recycled Water Condi on Assessment Program NOCitywideHigh52111RECL REPL Recycled Water Phase 3ReservoirNO3High 52101 WATER REPL 52102 RECL WATER Recycled Water Pipeline ReplacementNO2Medium19541 RECL REPL Recycled Water Valve and Appurtenance Replacement Program NOCitywideHigh52121RECL REPL Reservoir Repair and Maintenance Program NOCitywideHigh50241 WATER REPL Retroreflec vity Sign Replacement Program NOCitywideMedium60371GAS TAX Roadway ImprovementsCoastal Area Analysis and Implementa on NOCitywideMedium60791 GCC Roadway Slope Stabiliza onNO2High60811GAS TAX
Total 1,168,833 1,168,833 2,500,000 2,500,000 9,993,050 9,993,050 10,973,500 10,973,500 13,062,000 3,000,000 3,000,000 600,000 600,000 600,000 600,000 600,000 4,062,000
Project Name New Project DistrictScore Funding ID Funding Source Prior Appropria on Year 1 (2022-23) Year 2 (2023-24) Year 3 (2024-25) Year 4 (2025-26) Year 5 (2026-27) Year 6-10 (2028-32) Year 11-15 (2033-37)
1,750,000 1,425,000 125,000 200,000 1,750,000 1,425,000 125,000 200,000 350,000 350,000 1,540,000 310,000 280,000 50,000 50,000 50,000 50,000 50,000 700,000 980,000 980,000 3,320,000 200,000 3,120,000 6,460,000 2,910,000 2,150,000 350,000 350,000 350,000 350,000 2,080,000 700,000 630,000 125,000 125,000 120,000 120,000 260,000 14,490,000 3,610,000 3,070,000 1,960,000 5,850,000
Project Name New Project DistrictScore Funding ID Funding Source Prior Appropria on Year 1 (2022-23) Year 2 (2023-24) Year 3 (2024-25) Year 4 (2025-26) Year 5 (2026-27) Year 6-10 (2028-32) Year 11-15 (2033-37) Total Funding Source RoadwayImprovements-CoastalArea Analysis and Implementa onNOCitywideMedium60791 GCC Roadway Slope Stabiliza onNO2High60811GAS TAX Robertson Ranch Park Development (Par al Funding) NO2Medium 38011 PIL-NE 38012PFF Romeria Drainage ImprovementsNO4High 66041 GCC 66042GAS TAX Safety Training Center Se lementNO2Low47431 GCC San Luis Rey Mission Basin Groundwater Supply NOCitywideLow 50441 WATER CONN 50442 WATER REPL Santa Fe II Inlet Pipeline NONullHigh50571 WATER REPL Santa Fe II Reservoir Site Electrical Improvements NO3Medium50461 WATER REPL SCADA Improvements NOCitywideCri cal 55421 SEWER REPL 55422 WATER REPL 55423RECL REPL Schulman Auditorium and Cannon Art Gallery NO3Medium47531 IRF Senior Center RefurbishmentNO1Medium47381IRF Senior Center Security FencingNO1Low47541 IRF Sewer Condi on AssessmentNOCitywideCri cal55131SEWER REPL 1,280,000 500,000 200,000 580,000 3,635,500 2,621,500 400,000 214,000 400,000 13,473,440 13,473,440 410,000 410,000 347,940 347,940 1,156,995 1,156,995 8,280,000 2,500,000 5,500,000 280,000 -277,500 277,500 6,080,000 6,000,000 80,000 -77,500 77,500 3,029,650 2,500,000 34,650 495,000 183,581 150,000 33,581 4,684,632 380,734 175,165 4,128,733 10,155,600 610,500 2,412,500 3,209,200 3,923,400 2,394,000 398,000 337,600 631,500 1,026,900 350,000 150,000 200,000 1,848,000 600,000 1,248,000 78,000 58,000 20,000 15year Capital Improvement Program
Project Name New Project DistrictScore Funding ID Funding Source Prior Appropria on Year 1 (2022-23) Year 2 (2023-24) Year 3 (2024-25) Year 4 (2025-26) Year 5 (2026-27) Year 6-10 (2028-32) Year 11-15 (2033-37) Total Funding Source Senior Center Security FencingNO1Low47541 IRF Sewer Condi on AssessmentNOCitywideCri cal55131 SEWER REPL Sewer Li Sta on Repairs and Upgrades NO2Cri cal38401 SEWER REPL Sewer Line Capacity ImprovementsNO1High55481 SEWER REPL Sewer Modeling NOCitywideMedium55461 SEWER CONN Sewer Monitoring Program (Capacity)NOCitywideHigh55041 SEWER CONN Sewer System Rehabilita on and Replacement NO1,2,3High55031 SEWER REPL Sidewalk/Street Construc on ProgramNO1,2High 60021TIF 60022 GAS TAX South Carlsbad Coastline NO2,3,4Medium60311 TRANSNET -LOC South Shore Agua Hedionda Lagoon Trail NO2High40851 GCC Stagecoach Community Park Community Gardens YES4Medium46111PIL-SE State Street and Grand Avenue Road Improvements NO1Medium60821 TRANSNET -LOC State Street Parking Lot Electric Vehicle Charging Sta ons NO1Medium40901PFF Storm Drain Condi on AssessmentNOCitywideHigh66201 IRF Storm Drain System Rehab and Repair Program NO1,2,3High66071IRF Street Ligh ng Replacement ProgramNOCitywideHigh 60621 GCC 60622TRANSNET -LOC 3,358,000 750,000 750,000 100,000 100,000 100,000 100,000 1,458,000 6,485,380 750,000 750,000 150,000 150,000 150,000 150,000 150,000 4,235,380 3,000,000 1,800,000 1,000,000 200,000 300,000 300,000 950,000 110,000 154,000 44,000 642,000 43,576,475 14,050,000 13,350,000 1,850,000 1,850,000 1,850,000 1,200,000 1,200,000 8,226,475 8,953,000 2,835,000 890,000 107,500 333,000 987,500 3,800,000 1,800,000 1,500,000 300,000 2,779,026 1,000,000 1,779,026 789,940 34,440 755,500 425,000 200,000 225,000 325,000 325,000 300,000 300,000 7,692,500 3,002,500 2,375,000 420,000 375,000 350,000 300,000 270,000 600,000 10,253,860 2,140,000 1,822,500 300,000 300,000 250,000 250,000 200,000 4,991,360 319,269 319,269 15year Capital Improvement Program
Project Name New Project DistrictScore Funding ID Funding Source Prior Appropria on Year 1 (2022-23) Year 2 (2023-24) Year 3 (2024-25) Year 4 (2025-26) Year 5 (2026-27) Year 6-10 (2028-32) Year 11-15 (2033-37) Total Funding Source Street Ligh ng Replacement ProgramNOCitywideHigh 60621 GCC 60622 TRANSNET -LOC Sustainable Mobility Plan Implementa on Program NOCitywideHigh61041 GAS TAX Temporary Fire Sta on No. 7NO2High 40911GCC 40912 PFF Terramar Area Coastal ImprovementsNO2High 60541TIF 60542 GCC 60543 TRANSNET -LOC 60544 SEWER REPL 60545PFF The Crossings Golf Course Lake Liner Replacement NO2High 40841 GCC 40842GCC Traffic Control ImprovementsPoinse a Lane and Cassia Road NOCitywideHigh63292 GAS TAX Traffic Control ImprovementsPoinse a Lane and Oriole Court NO3High63302GAS TAX Traffic Impact Fee Funds to CFD #1NONullNullPA051 TIF Traffic Impact Fee Update NOCitywideHigh60401TIF Traffic Improvement ProgramNO1,2,4Cri cal 60701 GAS TAX 60702GCC 3,325,000 3,325,000 1,020,566 510,000 510,566 900,000 900,000 922,000 922,000 9,450,001 2,800,000 6,650,001 999,999 999,999 2,000,000 1,000,000 1,000,000 2,450,000 2,450,000 835,500 835,500 200,000 200,000 411,000 411,000 411,000 411,000 1,854,000 1,404,000 90,000 90,000 90,000 90,000 90,000 270,000 30,000 240,000 2,388,000 2,388,000 15year Capital Improvement Program
Project Name New Project DistrictScore Funding ID Funding Source Prior Appropria on Year 1 (2022-23) Year 2 (2023-24) Year 3 (2024-25) Year 4 (2025-26) Year 5 (2026-27) Year 6-10 (2028-32) Year 11-15 (2033-37) Total Funding Source Traffic Improvement ProgramNO1,2,4Cri cal 60701 GAS TAX 60702GCC Traffic Monitoring Program NOCitywideHigh60031 TIF Traffic SignalMaverick Way and Camino De Los Coches NO4Cri cal63322GAS TAX Traffic SignalTamarack Avenue and Valley Street NO1Medium63351 GAS TAX Traffic Signal Opera ons Modifica onsNO2Medium63271GAS TAX Traffic Signal Right Turn OverlapsYES2,3,4Low66361 GAS TAX Trail Connec vity to Tamarack State Beach (Prop C) NO1Low40631GCC Trash Amendment Compliance Program NO1,2,3Medium66261 IRF Tri-Agency Water Transmission Pipeline Replacement NO2High50081 WATER REPL Tyler Street Traffic Circula on StudyNO1Medium61031 GCC U lity Undergrounding Program StudyNOCitywideMedium60831GCC Vallecitos Interceptor Sewer Cleaning and CCTV NO2,3Cri cal55491 SEWER REPL Valley and Magnolia Complete StreetsNO1High 60191TIF 60192 WATER REPL 60193 TRANSNET -LOC Valley Street Traffic CalmingNO1Medium19741 TRANSNET -LOC Veteran's Memorial Park (All Quadrants) NO2Cri cal46091CFD#1 1,200,000 400,000 400,000 400,000 1,745,416 122,516 1,622,900 380,000 240,000 140,000 502,370 502,370 315,800 135,800 180,000 150,000 150,000 3,494,669 3,342,513 152,156 9,705,000 3,000,000 2,000,000 175,000 2,700,000 1,200,000 100,000 530,000 6,455,000 1,836,030 1,000,000 3,618,970 70,000 70,000 100,000 100,000 350,000 100,000 250,000 4,536,206 1,000,000 3,536,206 71,000 71,000 1,200,000 1,200,000 1,645,000 1,645,000 15year Capital Improvement Program
Village Decora ve Ligh ngPedestrian Ligh ng at Village Outskirts GCC Village Decora ve Ligh ngState Street, Madison, Roosevelt, and Washington
NO1Low60891
CirclesNO1High 40151
YES1Medium61051 GCC Village
Valley
NO2Cri
NO1Medium40161GCC
NO2Cri
NO1High55351SEWER
YES1Medium23131 GCC Village
15year Capital Improvement Program
Total Funding Source Street Traffic -LOC Memorial Park (All Quadrants) cal46091CFD#1 and Barrio Traffic GCC -LOC 40153 SEWER REPL TAX Decora ve Ligh ngCarlsbad Drive from Harding Street to Ocean Street Decora ve Ligh ngGateway Ligh ng Decora ve Ligh ngHospitality District Decora ve Ligh ngPedestrian Lampposts Oak Avenue
Village Intelligent Parking Implementa on GCC Villas Sewer Li Sta on ReplacementNO2Cri cal55501 SEWER REPL Vista Carlsbad InterceptorAgua Hedionda LS and Forcemain (VC12-VC13) cal34921 SEWER CONN Vista Carlsbad InterceptorBuena VistaLi Sta onImprovements CONN 30,257,650 24,630,950 1,257,250 1,257,250 3,112,200 415,000 415,000 1,025,000 1,025,000 160,000 160,000 4,159,000 1,400,000 2,759,000 400,000 400,000 900,000 900,000 800,000 800,000 450,000 450,000 850,000 850,000 1,103,853 400,000 703,853 500,000 500,000 2,003,201 1,320,701 160,500 522,000 300,000 300,000 1,254,000 100,000 1,154,000 33,190,972 33,190,972
40154GAS
Veteran's
Project Name New Project DistrictScore Funding ID Funding Source Prior Appropria on Year 1 (2022-23) Year 2 (2023-24) Year 3 (2024-25) Year 4 (2025-26) Year 5 (2026-27) Year 6-10 (2028-32) Year 11-15 (2033-37)
40152 TRANSNET
CalmingNO1Medium19741 TRANSNET
YES1Medium23161
Village Decora ve Ligh ngTrain Sta on Area GCC
Village
Village
Village
Village H South Off Leash Dog Area and Trail Segment 5B
YES1Medium23141GCC Village
NO2Medium46101PFF
YES1Medium23151GCC
YES1Medium61061
NOCitywideCri cal50191 WATER REPL
1,890,000 550,000 550,000 110,000 110,000 110,000 110,000 350,000 425,000 25,000 25,000 25,000 350,000 65,028,366 21,080,000 19,890,000 3,000,000 3,000,000 3,000,000 2,800,000 2,690,000 9,568,366 22,500,000 5,650,000 5,110,000 1,000,000 960,000 960,000 960,000 940,000 6,920,000
Year 2 (2023-24) Year 3 (2024-25) Year 4 (2025-26) Year 5 (2026-27) Year 6-10 (2028-32)
Year 11-15 (2033-37)
Total Funding Source
Vista Carlsbad InterceptorReach VC3NO1Cri cal39501 SEWER CONN
Vista/Carlsbad InterceptorPoint Repair Reaches (VC13 & VC14) YES2,3High55551 SEWER REPL Water Infrastructure Condi on Assessment Program
Water Loss Monitoring ProgramNOCitywideHigh50521 WATER REPL Water Modeling
NOCitywideCri cal50581 WATER CONN
NOCitywideCri cal38861 SEWER CONN
Project Name New Project DistrictScore Funding ID Funding Source Prior Appropria on Year 1 (2022-23)
NOCitywideCri cal39041 WATER REPL
Water Valve Repair/Replacement Program
Water System Rehabilita on and Replacement
15year Capital Improvement Program
VistaCarlsbadInterceptor-Agua HediondaLSandForcemain (VC12-VC13)
NO2Cri cal34921 SEWER CONN
Vista Carlsbad InterceptorBuena Vista Li Sta on Improvements NO1High55351 SEWER CONN
1,335,000 939,000 100,000 -100,000 396,000 9,464,833 9,464,833 480,000 380,000 -497,000 597,000 21,362,390 21,362,390 2,141,000 1,500,000 500,000 141,000 1,400,000 600,000 600,000 200,000 8,620,000 2,480,000 2,250,000 450,000 420,000 420,000 410,000 410,000 1,780,000
Vista Carlsbad InterceptorReach VC14 To VC15 NOCitywideHigh39491 SEWER CONN
Vista Carlsbad InterceptorLagoon Bridge Replacement (VC11B)
Vista Carlsbad InterceptorRehabilita on (VC1 and VC2) NO2Cri cal55511 SEWER REPL
NOCitywideCri cal50511 WATER REPL
BEGINNING FUND BALANCE N/A 63,346,133$ 64,832,101$ 66,372,017$ 43,985,014$ 45,104,880$ 46,240,357$
N/A 1,895,654$ 2,411,774$ 2,924,766$ 2,924,766$ 2,924,766$ 3,899,342$
CFD#1 Administration $ 110,000 110,000 110,000 110,000 110,000
CAPITAL PROJECTS
REVENUES
Total Project Expenditures 19,977
REVENUES
Orion Center 35,258,155
CAPITAL PROJECTS
BTD NO. 3 CANNON ROAD WEST
REVENUES
BEGINNING FUND BALANCE N/A 526,595$ 526,595$ 526,595$ 526,595$ 526,595$ 526,595$
City Hall Complex 1,028,105 50,000,000
I 41
PRIOR YEAR 1 YEAR 2 YEAR 3 YEAR 4 YEAR 5 YEAR 6-15 YEARS 2022-23 2023-24 2024-25 2025-26 2026-27 2028-37
CAPITAL IMPROVEMENT PROGRAM SUMMARY BY FUND
Prior Year 1 Year 2 Year 3 Year 4 Year 5 Year 6-15 Years 2022-23 2023-24 2024-25 2025-26 2026-27 2028-37
BEGINNING FUND BALANCE N/A 1,895,654$ 1,895,654$ 2,411,774$ 2,924,766$ 2,924,766$ 2,924,766$
Cole Library Expansion 5,988,000
BTD NO. 2 AVIARA PARKWAY - POINSETTIA LANE
Veteran's Memorial Park (All Quadrants) 3,112,202 1,257,250 1,257,250 24,630,950
ENDING FUND BALANCE N/A 64,832,101$ 66,372,017$ 43,985,014$ 45,104,880$ 46,240,357$ 7,059,807$
CAPITAL PROJECTS
COMMUNITY FACILITIES DISTRICT NO. 1 (CFD 1)
Poinsettia Lane - Reach E Cassia Road To Skimmer Court 14,081,198$
Total Revenues N/A 516,120 512,992 2,143,409
Total Project Expenditures 14,081,198 1,168,833
Poinsettia Lane - Reaches A,B,C,F,G & Aviara Pkwy Reimb 1,168,833
ENDING FUND BALANCE
Developer Fees Total Revenues N/A
ENDING FUND BALANCE N/A 526,595$ 526,595$ 526,595$ 526,595$ 526,595$ 526,595$
PRIOR YEAR 1 YEAR 2 YEAR 3 YEAR 4 YEAR 5 YEAR 6-15 YEARS 2022-23 2023-24 2024-25 2025-26 2026-27 2028-37
BTD#3 Reconciliation and Closeout 19,977$
Total Revenues N/A 2,853,218 2,907,166 2,353,947 1,229,866 1,245,477 16,807,450
Developer Fees 516,120 512,992 2,143,409
Developer Special Taxes 2,853,218 2,907,166 2,353,947 1,229,866 1,245,477 16,807,450
Total Project Expenditures 39,398,462 1,367,250 1,367,250 24,740,950 110,000 110,000 55,988,000
Jefferson Street SMP Improvements 75,000 (70,657)
La Costa Slope Repair West of Romeria 255,751
El Camino Real Medians 904,530
Traffic Improvement Program 2,388,003
Total Project Expenditures 8,763,002 2,920,000 3,020,000 3,020,000 3,020,000 3,020,000 26,500,000
Barrio Street Lighting 700,000
Intersection Control - Camino De Los Coches And La Costa Avenue 350,000 500,000
PROJECTS
Carlsbad Blvd Median-Tamarack Avenue To Pine Avenue 2,763,000
La Costa Avenue Traffic Improvements 121,300 741,700
Traffic Control Improvements - Poinsettia Lane & Cassia Road 411,000
Total Revenues N/A 3,377,749 3,435,845 3,497,155 3,534,848 3,563,667 36,373,917
Traffic Signal - Tamarack Avenue And Valley Street 502,370
Total
CAPITAL PROJECTS
Avenida Encinas Pedestrian Access Improvements 75,000 25,000
Cannon Road and Paseo del Norte SMP and GMP Improvements 60,000 (55,657)
Palomar Airport Road/Paseo Del Norte Right Turn Lane 430,538 (110,000)
Traffic Signal Operations Modifications 180,000 135,800
$
Traffic Signal - Maverick Way & Camino De Los Coches 140,000 240,000
La Costa Avenue SMP Improvements 110,000 (99,252)
Gas Tax and Prop 42 Funds 3,377,749 3,435,845 3,497,155 3,534,848 3,563,667 36,373,917
PRIOR YEAR 1 YEAR 2 YEAR 3 YEAR 4 YEAR 5 YEAR 6-15 YEARS 2022-23 2023-24 2024-25 2025-26 2026-27 2028-37
Citywide Drainage Improvement Program 6,090,594
Concrete Repair/Replacement Program 2,932,999
Pavement
Traffic Signal - La Costa Avenue And Levante Street 250,000 (250,000)
$
Left Turn Lane Extensions 200,000 150,000 150,000 150,000 150,000
BEGINNING FUND BALANCE N/A 331,579$ 181,476$ 590,621$ 2,637,776$ 4,122,623$ 7,086,291$
Carlsbad Blvd Pedestrian Improvement Project 222,100
Wayfinding Sign Replacement Program 50,683
$
El Camino Real And College Blvd Intersection Improvements 1,020,000
Roadway Slope Stabilization 579,997 200,000 500,000 Romeria Drainage Improvements 347,938
REVENUES
Traffic Signal - El Fuerte Street And Rancho Pancho 210,000 (210,000)
I 42
El Camino Real And Cannon Road Intersection Improvements 837,001
Carlsbad Boulevard Lane Reduction and Edge Striping 300,000
Sidewalk/Street Construction Program 300,000 1,500,000 Sustainable Mobility Plan Implementation Program 510,566 510,000
Citywide Thermoplastic Pavement Markings 50,000
Carlsbad Boulevard Emergency Repair 841,001
Palomar Airport Road/Paseo Del Norte Left Turn Lane 194,547 (52,948)
Traffic Signal Right Turn Overlaps 150,000
REVENUES
Total Project Expenditures 38,813,202 3,527,852 3,026,700 1,450,000 2,050,000 600,000 11,757,000
Repair/Replacement Program
Marca Place Drainage Improvements 65,000
Citywide Street Lighting Program 150,000
Traffic Control Improvements - Poinsettia Lane & Oriole Court 410,999
Pavement Management Program 7,930,849
ENDING FUND BALANCE N/A 181,476$ 590,621$ 2,637,776$ 4,122,623$ 7,086,291$ 31,703,207$
Gas Tax Transfer To General Fund (Transportation Operating Budget) 600,000 600,000 600,000 600,000 600,000 6,000,000
PRIOR YEAR 1 YEAR 6-15 YEARS 2022-23 2023-24 2024-25 2025-26 2026-27 2028-37
Advance Street Name Signs 40,000$ (40,000)
ENDING FUND BALANCE N/A 381,885$ 126,331 17,293 82,913 370,698 19,826,031
2 YEAR 3 YEAR 4 YEAR 5 YEAR
Park Drive Drainage And Street Improvements 2,935,002 1,030,000
Guardrail Replacement And Improvement Program 300,000
Village And Barrio Traffic Circles 2,759,000 1,400,000
$ GAS TAX (ROAD MAINTENANCE AND REHABILITATION ACCOUNT) GAS TAX FUND
CAPITAL
Concrete 727,000$ 620,000 620,000 620,000 620,000 620,000 2,500,000 Management Program 8,036,002 2,300,000 2,400,000 2,400,000 2,400,000 2,400,000 24,000,000
Laguna Drive Storm Drain 256,000 1,000,000 1,494,000
Gas Tax (RMRA) Revenues 2,632,806 2,764,446 2,910,962 3,085,620 3,307,785 45,955,333 Revenues N/A 2,632,806 2,764,446 2,910,962 3,085,620 3,307,785 45,955,333
Palomar Airport Rd and Avenida Encinas GMP Improvements 230,000
Retroreflectivity Sign Replacement Program 999,999
Kelly Drive And Park Drive Road Diet And Multiuse Trail 130,000
BEGINNING FUND BALANCE N/A 669,079$ 381,885$ 126,331$ 17,293$ 82,913$ 370,698$
Intelligent Traffic Control Devices 200,000
Carlsbad Blvd And Tamarack Avenue Pedestrian Improvements 1,576,001 700,000
$
GENERAL CAPITAL CONSTRUCTION (GCC)
City Facility Accessibility Upgrades 500,001
City Fire Stations Wash Water BMPs 280,000
Dove Library Lighting Improvements 225,000
Fire Administration Offices 150,000
Tyler Street Traffic Circulation Study 70,000
Alga Norte Park Modifications 314,000 706,200
El Camino Real and College Boulevard Intersection Improvements 131,000
Chestnut UnderpassPublic Art Project 100,000 150,000
4,051,000 4,187,000 4,235,000 4,278,000 4,389,000 47,708,000
Village Decorative Lighting - Gateway Lighting 900,000
Lake Calavera Trails Master Plan/Construction (Prop C) 1,128,248
Police and Fire HeadquartersRenovation 10,973,501
Lake Calavera Storm Drain Improvements 5,569
Safety Training Center Water Recirculating System Study 50,000 (50,000)
Village Decorative Lighting - Pedestrian Lighting at Village Outskirts 850,000
BEGINNING FUND BALANCE
Village Decorative Lighting - Train Station Area 500,000
Lake Calavera Outlet Improvements 1,436,002
Park Drive Street and Drainage Improvement 717,440
30,000 150,000 30,000 800,000
City Hall Exterior Refurbishment 2,250,001
CAPITAL PROJECTS
Beach Access Repair and Upgrades - Pine Avenue to Tamarack 6,199,000
The CrossingsGolf Course Lake Liner Replacement 200,000
Village and Barrio Traffic Circles 415,000
Barrio Street Lighting 760,001
Village Decorative Lighting - Hospitality District 800,000
Rancho Santa Fe Trail Slope Improvements 350,000
Public Beach Access Improvements (Ocean Street) 3,610,340
N/A 13,102,386$ 15,203,798$ 14,334,598$ 15,519,598$ 15,895,730$ 19,954,730$
Total Revenues N/A 4,051,000 4,187,000 4,235,000 4,278,000 4,389,000 47,708,000
Calavera Hills Community Park Gateway Improvements 1,407,851
Cannon Park Restroom 55,645
Fleet Maintenance Refurbishment 896,100
Ocean Street Reconfiguration Concepts Study 200,000
South Shore Agua Hedionda Lagoon Trail 755,501 34,440
Village Decorative Lighting - State Street, Madison, Roosevelt, and Washington 703,853 400,000
Grand Avenue Promenade Feasibility Study 200,000 600,000
Village Decorative Lighting - Carlsbad Village Drive from Harding Street to Ocean Street 400,000
The CrossingsGolf Course Lake Liner Replacement 835,500
Assessment District 97-1 Maintenance 420,000
I 43
Fire Station No. 5 New Roof and Storage Building 345,001 (121,373)
Orion Complex Energy Storage 250,000
Ocean Street Restroom Facility 775,000 59,355
Buena Vista Creek Concrete Channel Maintenance at El Camino Real 1,250,000
Utility Undergrounding Program Study 100,000
Temporary Fire Station No. 7 900,000
Dove Library Parking Lot Renovation 474,999
Terramar Area Coastal Improvements 1,000,000
Trail Connectivity to Tamarack State Beach (Prop C) 152,156 3,342,513
New Village Arts Tenant Improvements 613,000
Village Railroad Tracks Trenching 560,103 (12,675)
Lake Calavera Reservoir Maintenance 531,004 50,000 50,000 120,000 50,000 50,000 500,000
Street Lighting Replacement Program 319,270
Traffic Improvement Program 400,000 400,000 400,000
Transfer from General Fund
Maerkle Reservoir Solar Project 830
Roadway Improvements - Coastal Area Analysisand Implementation 200,000
Safety Training Center Settlement 1,156,996
Village Decorative Lighting - Pedestrian Lampposts Oak Avenue 450,000
Emergency Operations Center Reconfiguration 1,658,001
REVENUES
Romeria Drainage Improvements 409,999
Village Intelligent Parking Implementation 300,000
Total Project Expenditures 63,777,314 1,949,588 5,056,200 3,050,000 3,901,868 330,000 2,300,000 N/A 15,203,798$ 14,334,598$ 15,519,598$ 15,895,730$ 19,954,730$ 65,362,730$
Monroe Street Pool Replacement 62,000 (61,764)
ADA Beach Access - Pine to Tamarack 375,002$ 2,500,000
Camino Hills and Jackspar Drive Slope Stabilization 859,399
Fire Station No. 2 Replacement 13,000,000
Traffic Signal Master Plan 150,001 (9,040)
Faraday Avenue Improvements 100,000
PRIOR YEAR 1 YEAR 2 YEAR 3 YEAR 4 YEAR 5 YEAR 6-15 YEARS 2022-23 2023-24 2024-25 2025-26 2026-27 2028-37
Open Space and Trail Acquisition (Prop C) 4,015,000
Cole Library Expansion 1,000,000
ColeLibrary Security Fencing 40,000 130,000
El Camino Real Widening -Poinsettia Lane to Camino Vida Roble 1,440,000
PRIOR YEAR 1 YEAR 2 YEAR 3 YEAR 4 YEAR 5 YEAR 6-15 YEARS 2022-23 2023-24 2024-25 2025-26 2026-27 2028-37
PRIOR YEAR 1 YEAR 2 YEAR 3 YEAR 4 YEAR 5 YEAR 6-15 YEARS 2022-23 2023-24 2024-25 2025-26 2026-27 2028-37
Holiday Park FacilitiesMaintenance 79,823
Public Beach AccessImprovements (Ocean Street) 726,683 (153,252)
Coordinated Traffic Signal Program 800,000
Storm Drain Condition Assessment 600,000 270,000 300,000 350,000 375,000 420,000 5,377,500
REVENUES
MAINTENANCE& REPLACEMENT
REVENUES
City Facility Safety and Parking Lot Lighting Assessment 1,910,000
MiscellaneousCity Building Improvements 1,715,000 150,000 150,000 150,000 1,500,000
Citywide Drainage Improvement Program 4,681,502 900,000 300,000 300,000 300,000 300,000 3,000,000
Carlsbad Boulevard Pedestrian Improvement Project 591,600
Farol Court Storm Drain Outfall at Agua Hedionda Creek 529,749
$
BEGINNING FUND BALANCE N/A 78,868,824$ 79,369,946$ 73,206,963$ 72,553,963$ 74,304,963$ 75,360,963$
BEGINNING FUND BALANCE N/A (2,373,295)$ 0$ 0$ 0$ 0$ 0$
Beach AccessRepair and Upgrades- Pine Avenue to Tamarack 4,112,752 1,800,000 Bridge Preventative MaintenanceProgram 2,227,512 250,000 500,000 500,000 700,000
Buena Vista Creek Concrete Channel Maintenanceat El Camino Real 2,820,000 1,200,000
FireStation No. 6 Renovation 35,000
FireStation No. 4 Expansion 267,410 (80,634)
Senior Center Refurbishment 1,248,002 600,000
Harding Center Refurbishment 165,000 140,000
Total Revenues N/A 3,977,000 4,096,000 4,187,000 4,271,000 4,381,000 48,220,000
Kelly Drive Channel Repair 1,041,003 500,000 1,900,000
Parking Lot MaintenanceProgram 1,529,999 60,000 130,000 60,000 130,000 60,000 950,000
Stagecoach Park Synthetic Turf Replacement 2,200,000
CAPITAL PROJECTS
Emergency OperationsCenter Reconfiguration 200,000 500,000
Trash Amendment ComplianceProgram 530,000 100,000 1,200,000 2,700,000 175,000 2,000,000 3,000,000 66,182,912 3,475,878 10,258,983 4,840,000 2,520,000 3,325,000 18,995,000
Fleet Fuel Island Upgrade 1,763,798 500,000 200,000 400,000 400,000 100,000
La Costa Avenue Drainage Improvements 868,367
Fleet MaintenanceRefurbishment 2,074,003 500,000
DMP Facility BFB-U (El Camino Real) 750,000 100,000 3,000,000 50,000 50,000 50,000 100,000
Leo Carrillo Ranch Roof Repairs 1,449,999
Agua Hedionda Creek Maintenance 133,002$ 80,000 80,000 80,000 90,000 95,000 1,105,000
CAPITAL PROJECTS
$
$
I 44
Faraday Center Refurbishment 3,154,382
Storm Drain SystemRehab and Repair Program 4,991,364 200,000 250,000 250,000 300,000 300,000 3,962,500
City Hall Complex Refurbishment 1,143,999
GRANTS
Calavera HillsCommunity Center Refurbishment 685,001 1,300,000
LasPalmasRoof Replacement 500,000
Monroe Street Pool Replacement 6,187,001 (4,438,236) 908,983
- FEDERAL
Senior Center Security Fencing 20,000 58,000
Aviara and Hidden Canyon Parks Playground Safety Resurfacing 600,000
Grant Revenue 2,373,295
Headwall Replacement Program 510,001
ENDING FUND BALANCE N/A 0$ 0$ 0$ 0$ 0$ 0$
ENDING N/A 79,369,946$ 73,206,963$ 72,553,963 74,304,963 75,360,963 104,585,963
$
New Village ArtsBuilding Roof and Exterior Refurbishment 313,627
Total Revenues N/A 2,373,295
Avenida EncinasCoastal Rail Trail and Pedestrian Improvements 1,776,000$
El Camino Real and Agua Hedionda Creek Bridge Railing and Sidewalk 210,000
Total Project Expenditures 3,807,600
Schulman Auditorium and Cannon Art Gallery 200,000 150,000
Transfer from General Fund 3,977,000 4,096,000 4,187,000 4,271,000 4,381,000 48,220,000
FireStation No. 2 Replacement 1,433,884
Hosp Grove Park Improvements 1,562,000
INFRASTRUCTURE
Police and Fire HeadquartersRenovation 9,993,049
FUND BALANCE
Library Fire Alarm Panel Upgrades 180,000
PRIOR YEAR 1 YEAR 2 YEAR 3 YEAR 4 YEAR 5 YEAR 6-15 YEARS 2022-23 2023-24 2024-25 2025-26 2026-27 2028-37
Total Project Expenditures 400,000 214,000 400,000 2,621,500 4,550,000
ENDING FUND BALANCE N/A 2,341,398$ 2,748,960$ 2,248,960$ 1,748,960$ 348,960$ 354,065$
PARK-IN-LIEU NW
BEGINNING FUND BALANCE N/A 2,580,632$ 1,811,837$ 1,777,963$ 2,431,525$ 3,099,627$ 3,760,912$
NE
Leo Carrillo Ranch Park Phase 3B 500,000 500,000 1,400,000
Total Project Expenditures 1,712,999
ENDING FUND BALANCE N/A 1,811,837$ 1,777,963$ 2,431,525$ 3,099,627$ 3,760,912$ 10,094,248$
Total Revenues N/A 679,039 607,562 5,106
Monroe Street Pool Replacement 1,561,764 1,500,000
PARK-IN-LIEU SE
College Blvd Reach A And Cannon Road Reach 4A 1,712,999$
PRIOR YEAR 1 YEAR 2 YEAR 3 YEAR 4 YEAR 5 YEAR 6-15 YEARS 2022-23 2023-24 2024-25 2025-26 2026-27 2028-37
Developer Fees 20,422 3,543,259
Total Revenues N/A 20,422 3,543,259
Total Project Expenditures 1,334,100 220,889 200,000 500,000 500,000 1,400,000
PRIOR YEAR 1 YEAR 2 YEAR 3 YEAR 4 YEAR 5 YEAR 6-15 YEARS 2022-23 2023-24 2024-25 2025-26 2026-27 2028-37
REVENUES
PRIOR YEAR 1 YEAR 2 YEAR 3 YEAR 4 YEAR YEAR 6-15 YEARS 2022-23 2023-24 2024-25 2025-26 2026-27 2028-37
CAPITAL PROJECTS
Total Revenues N/A
Other Financing Sources
ENDING FUND BALANCE N/A 4,159,434$ 3,759,434$ 1,158,356$ 1,158,356$ 1,158,356$ 151,615$
BEGINNING FUND BALANCE (1) N/A 4,373,434$ 4,159,434$ 3,759,434$ 1,158,356$ 1,158,356$ 1,158,356$
City Facility Safety and Parking Lot Lighting Assessment $ 200,000
CAPITAL PROJECTS
PARK-IN-LIEUOTHER
Developer Fees 1,792,968 1,874,777 1,977,037 668,102 661,285 6,333,337
Hosp Grove Park Improvements 120,000 1,000,000 208,650 1,323,476
I 45
Developer Fees 679,039 607,562 5,106
Pine Avenue Park - Phase II (Community Building) 2,197,002
5
Leo Carrillo Ranch Park Phase 3 - Stables Restoration and Restroom Construction 1,334,100$ (4,111)
Total Project Expenditures 2,317,002 2,561,764 1,908,650 1,323,476
ENDING FUND BALANCE N/A 650,461$ 650,461$ 650,461$ 650,461$ 650,461$ 650,461$
Total Revenues N/A 1,792,968 1,874,777 1,977,037 668,102 661,285 6,333,337
CAPITAL PROJECTS
CAPITAL PROJECTS
Loan - Park-in-Lieu NE to Public Facility Fee Fund for Park Site Acquisition $ 4,550,000 Robertson Ranch Park Development 400,000 214,000 400,000 2,621,500
BEGINNING FUND BALANCE N/A 650,461$ 650,461$ 650,461$ 650,461$ 650,461$ 650,461$
REVENUES
REVENUES
BEGINNING FUND BALANCE N/A 1,883,247$ 2,341,398$ 2,748,960$ 2,248,960$ 1,748,960$ 348,960$
REVENUES
Stagecoach Community Park Community Gardens 225,000 200,000
CAPITALPROJECTS
DMP
N/A 590,124$ 590,124$ 590,124$ 590,124$ 590,124$ (249,493)$
DMPFacilityAAA(JeffersonStreet) $ 289,534
DMPFacilityAFB(CalaveraHillsDrainageRestorationandEnhancementProject) 163,164
81,652 80,852 2,447,221
REVENUES
BEGINNINGFUNDBALANCE N/A 1,422,582$ 1,563,334$ 1,824,449$ 1,906,101$ 1,987,753$ 2,068,606$
DeveloperFees 151,107 261,116 81,652 81,652 80,852 2,447,221 TotalRevenues N/A 151,107 261,116 81,652
TotalProjectExpenditures 400,000 4,665,200
AviaraCommunityPark-Phase2(Art) 38,199 (2,355)
CAPITALPROJECTS
FacilityBFB-U(ElCaminoReal) 153,489 DMPFacilityBL-L(CollegeBoulevardBridgeReimbursementPlda"B") 1,816,101 DMPFacilityBL-U(CollegeBoulevard) 384,509 DMPFacilityBM(Cantarini/CollegeBoulevardBoxCulvert) 204,077 DMPFacilityBQ(SunnyCreek) 131,355 DMPFacilityBR(Cantarini/CollegeBoulevardPipeDrainage) 180,773 DrainageMasterPlanUpdate 558,001 25,000 TotalProjectExpenditures 5,612,274 10,355 5,175,305 ENDINGFUNDBALANCE N/A 1,563,334$ 1,824,449$ 1,906,101$ 1,987,753$ 2,068,606$ (659,478)$ PLANNEDLOCALDRAINAGEAREABFEES(PLDB) PARKFEEZONES5,13,16,17,18 PLANNEDLOCALDRAINAGEAREAAFEES(PLDA) PARK-IN-LIEUSW
FacilityBFA(CountryStore) 1,241,649
DeveloperFees 48,255 85,933 20,000 972,947
DeveloperFees 28,788 7,840 39,328 TotalRevenues N/A 28,788 7,840 39,328
PROJECTS AguaHediondaCreekMaintenance 3,559,890$ (14,645) CollegeBoulevardWetlandHabitatCreation 99,245
CAPITALPROJECTS
DMPFacilityAC(HighlandDriveDrainageProject) 921,408
N/A 4,971,721$ 5,019,975$ 5,105,909$ 4,725,909$ 60,709$ 60,709$
DMPFacilityAAAA(MadisonStreet) 416,500
BEGINNINGFUNDBALANCE
DMPFacilityAFA(HiddenValleyDrainageRestorationandEnhancementProject) 91,608
REVENUES
FacilityBB1and2(WashingtonStreet) 1,086,065
FacilityBFB-LandBFB-1
ENDINGFUNDBALANCE N/A 5,019,975$ 5,105,909$ 4,725,909$ 60,709$ 60,709$ 1,033,655$
BEGINNINGFUNDBALANCE
N/A 587,769$ 590,124$ 590,124$ 590,124$ 590,124$ 590,124$
PRIOR YEAR1 YEAR2 YEAR3 YEAR4 YEAR5 YEAR6-15 YEARS 2022-23 2023-24 2024-25 2025-26 2026-27 2028-37
BEGINNINGFUNDBALANCE N/A 930,371$ 934,159$ 934,159$ 941,999$ 941,999$ 941,999$
REVENUES
ENDINGFUNDBALANCE N/A 934,159$ 934,159$ 941,999$ 941,999$ 941,999$ (900,887)$
DMP (Magnolia 468,096
TotalRevenues N/A 48,255 85,933 20,000 972,947
DMP
FacilityBCB
Avenue)
LoanRepay-Park-in-LieuSWtoPublicFacilityFeeFund 1,100,000
AviaraReimbursementAgreement 238,001
DMP
YEARS 2022-23 2023-24 2024-25 2025-26 2026-27 2028-37
PRIOR YEAR1 YEAR2 YEAR3 YEAR4 YEAR5 YEAR6-15 YEARS 2022-23 2023-24 2024-25 2025-26 2026-27 2028-37
TotalProjectExpenditures 191,511 25,000 1,882,214
DrainageMasterPlanUpdate 191,511 25,000
DMP (Tamarack 904,329
PRIOR YEAR1 YEAR2 YEAR3 YEAR4 YEAR5 YEAR6-15
I 46
BusinessParkRecreationalFacility(PartialFunding) $ 400,000 4,665,200
andElCaminoRealPlda"B")
REVENUES
TotalProjectExpenditures 3,396,704 (2,355) 1,100,000
AviaraCommunityPark-Phase2 3,120,504$
DeveloperFees/Loans 260,384 TotalRevenues N/A 260,384
PRIOR YEAR1 YEAR2 YEAR3 YEAR4 YEAR5 YEAR6-15 YEARS 2022-23 2023-24 2024-25 2025-26 2026-27 2028-37
CAPITAL
REVENUES
DMP Facility DQB (La Costa Town Center) 745,842
PLANNEDLOCALDRAINAGE
LOCALDRAINAGEAREAC FEES(PLDC)
Drainage Master Plan Update 234,599
BEGINNING FUNDBALANCE N/A 1,562,253$ 1,694,188$ 1,799,312$ 1,924,085$ 1,924,085$ 1,924,085$
Total Project Expenditures 234,599 2,473,463
CAPITAL PROJECTS
Leo Carrillo Ranch Park Phase3 -StablesRestoration and RestroomConstruction 1,631,500
ENDING FUNDBALANCE N/A 938,063$ 1,057,740$ 1,104,953$ 1,104,953$ 1,104,953$ (136,661)$
ENDING FUNDBALANCE N/A 1,694,188$ 1,799,312$ 1,924,085$ 1,924,085$ 1,924,085$ 2,519,596$
PineAvenuePark -PhaseII (Community Building) 10,016,036 (687,622)
Total Revenues N/A 80,989 119,676 47,213 1,231,849
Total Revenues N/A 156,935 105,124 124,772 1,852,643
PRIOR YEAR 1 YEAR 2 YEAR 3 YEAR 4 YEAR 5 YEAR 6-15 YEARS 2022-23 2023-24 2024-25 2025-26 2026-27 2028-37
FEEFUND(PFF)
Temporary Fire Station No. 7 922,000
ColeLibrary Expansion 11,936,000
Terramar Area Coastal Improvements 2,450,000
BEGINNING FUNDBALANCE N/A 22,879,753$ 25,566,722$ 26,181,915$ 14,070,813$ 14,555,616$ 15,036,195$
REVENUES
El Camino Real Medians 695,781
BEGINNING FUNDBALANCE N/A 857,075$ 938,063$ 1,057,740$ 1,104,953$ 1,104,953$ 1,104,953$
Robertson Ranch Park Development (Partial Funding) 13,473,440
Total Project Expenditures 2,523,438 25,000 1,257,132
I 47
Drainage Master Plan Facility DBA (Poinsettia Village) 167,215
PineAvenuePark -PhaseII (Community Building) 123,300
DMP Facility C1 (Carlsbad Boulevard EncinasCreek Bridge Plda "C") 2,376,548$
CAPITAL PROJECTS
Total Revenues N/A 1,866,561 1,935,894 1,362,338 484,803 480,579 17,427,278
Leo Carrillo Ranch Park Phase3 -StablesRestoration and RestroomConstruction 29,654 (29,367)
Poinsettia Community Park -Phase4 -Dog Park 2,838,141
DMP Facility DBB (Avenida Encinas) $ 429,108
REVENUES
DMP Facility C2 (Paseo Del Norte) 727,730
Kelly Driveand Park DriveComplete Street Improvements 1,085,000
DMP Facility DH (AltivePlaceCanyon Restoration) 232,812
PRIOR YEAR 1 YEAR 2 YEAR 3 YEAR 4 YEAR 5 YEAR 6-15 YEARS 2022-23 2023-24 2024-25 2025-26 2026-27 2028-37
AREAD FEES(PLDD)
ENDING FUNDBALANCE N/A 25,566,722$ 26,181,915$ 14,070,813$ 14,555,616$ 15,036,195$ 20,527,473$
Total Project Expenditures 26,588,112 (820,408) 1,320,701 13,473,440 11,936,000
PLANNED
Aviara Community Park -Phase2 700,001$ (263,919)
CAPITAL PROJECTS
Developer Fees 156,935 105,124 124,772 1,852,643
DMP Facility CA (Avenida Encinas) 529,402
Developer Fees 1,866,561 1,935,894 1,362,338 484,803 480,579 17,427,278
Poinsettia Community Park -Phase3 5,236,067
Village H South OffLeash Dog Area and Trail Segment 5B 522,000 160,500 1,320,701
DMP Facility DZ (Poinsettia Lane) 642,063
DMP Facility DFA (BatiquitosLagoon Stormwater Treatment) 256,423
PUBLIC FACILITY
Drainage Master Plan Update 146,890 25,000
PRIOR YEAR 1 YEAR 2 YEAR 3 YEAR 4 YEAR 5 YEAR 6-15 YEARS 2022-23 2023-24 2024-25 2025-26 2026-27 2028-37
Poinsettia Community Park -Phase3 38,632
Developer Fees 80,989 119,676 47,213 1,231,849
State Street Parking Lot Electric VehicleCharging Stations 300,000
Vista Carlsbad Interceptor -Reach VC3 597,000 (497,000) 380,000
Total Revenues N/A 396,950 501,314 946,772 136,451 141,314 3,469,588
Encina Capital Projects 48,823,298 6,367,800 6,957,000 8,450,000 8,002,500 7,757,200 81,818,600
REVENUES
Buena Interceptor Sewer Improvements 550,000$
Poinsettia LaneLift Station Overflow 1,008,592
Orion Center 4,078,500
Total Revenues N/A 5,560,398 10,287,288 16,152,368 16,576,611 15,756,307 110,993,215
Developer Feesand Miscellaneous 396,950 436,314 336,422 136,451 141,314 3,469,588
Faraday and El Camino Real Sewer Replacement -Orion to Palomar Airport Road 140,000 1,600,000
VallecitosInterceptor Sewer Cleaning and CCTV 250,000 100,000
Vista Carlsbad Interceptor -Agua Hedionda LS and Forcemain (VC12-VC13) 32,363,824
North BatiquitosLift Station Forcemain Rehabilitation 950,000 (750,000)
PRIOR YEAR 1 YEAR 2 YEAR 3 YEAR 4 YEAR 5 YEAR 6-15 YEARS 2022-23 2023-24 2024-25 2025-26 2026-27 2028-37
BEGINNING FUNDBALANCE N/A 719,518$ 113,467$ (3,422,219)$ (3,458,447)$ (3,321,996)$ (3,180,682)$
Buena Interceptor Sewer AccessRoad Improvements 1,150,000
$ SEWER CONNECTION FEEFUND SEWER REPLACEMENT FUND
Sewer Condition Assessment 1,457,999 100,000 100,000 100,000 100,000 1,500,000
Total Project Expenditures 86,665,068 9,022,521 18,425,734 14,720,000 11,022,500 9,757,200 112,218,600
PRIOR YEAR 1 YEAR 2 YEAR 3 YEAR 4 YEAR 5 YEAR 6-15
CAPITAL PROJECTS
REVENUES
ENDING FUNDBALANCE N/A (9,234,178)$ (17,372,624)$ (15,940,256)$ (10,386,145)$ (4,387,038)$ (5,612,423)
Vista Carlsbad Interceptor -Buena Vista Lift Station Improvements 396,001 (100,000) 100,000 939,000
Vista Carlsbad Interceptor -Reach VC14 To VC15 21,362,393
Poinsettia Lift Station Rehabilitation 2,500,000
North BatiquitosAccessRoad Improvement 250,000 113,800
CAPITAL PROJECTS
Sewer Lift Station Repairsand Upgrades 4,235,384 150,000 150,000 150,000 150,000 150,000 1,500,000
Loan Repay - Sewer Conn to Sewer Repl 4,700,000
Village and Barrio Traffic Circles 160,001
Sewer Monitoring Program (Capacity) 642,000 44,000 264,000
YEARS 2022-23 2023-24 2024-25 2025-26 2026-27 2028-37
Vista Carlsbad Interceptor -Rehabilitation (VC1and VC2) 141,000 500,000 1,500,000
Simsbury Sewer Extension 638,402
Agua Hedionda Lift Station Biological Monitoring and Maintenance 225,000$
Buena Interceptor Sewer Improvements 958,691 250,000 1,150,000 2,070,000 920,000
Sewer SystemRehabilitation and Replacement 8,226,479 1,200,000 1,200,000 1,850,000 1,850,000 1,850,000 27,400,000
I 48
Sewer LineCapacity Improvements 200,000 1,000,000 1,800,000
Vista/Carlsbad Interceptor -Point Repair Reaches(VC13 & VC14) 200,000 600,000 600,000
Terramar Area Coastal Improvements
Sewer Modeling 299,999
Other Agency Contributions(City ofVista) 65,000 610,350
Vista Carlsbad Interceptor -Lagoon BridgeReplacement (VC11B) 9,464,834
Chinquapin Lift Station Improvements 300,000 920,000
LasPalmasTrunk Sewer 556,000 2,907,000
Buena Interceptor Sewer Realignment -East Segment 507,000 2,168,000
Water, Recycled and Sewer Master Plan 389,985
ENDING FUNDBALANCE N/A 113,467$ (3,422,219)$ (3,458,447)$ (3,321,996)$ (3,180,682)$ (4,675,094)$
El Fuerte Lift Station Pump Addition 180,000 650,000
Villas Sewer Lift Station Replacement 1,154,002 100,000
FoxesLanding Lift Station Wetwell and Pump Replacement 5,692,002 700,000
Transfer fromSewer Operating Fund 5,560,398 10,287,288 16,152,368 16,576,611 15,756,307 110,993,215
Terramar Sewer Replacement -El Arbol and LosRobles 1,250,000 (1,250,000)
Cannon Road Lift Station Improvements 150,000 565,000
BEGINNING FUNDBALANCE N/A (5,772,055)$ (9,234,178)$ (17,372,624)$ (15,940,256)$ (10,386,145)$ (4,387,038)$
SCADA Improvements 4,128,733 175,165 380,734
Odor and Corrosion Prevention Assessment 320,000
Total Project Expenditures 66,552,051 1,003,000 4,037,000 983,000 4,964,000
Chinquapin Lift Station ForceMain Outfall Realignment 320,000 (299,244)
Traffic Monitoring Program 1,622,899 122,516 Valley and Magnolia Complete Streets 3,536,206 1,000,000
Carlsbad Boulevard Realignment -Manzano Driveto Island Way 932,000 Carlsbad Boulevard Realignment -Manzano Driveto Island Way 3,681,000
IMPACT FEES(TIF)
Developer Fees 1,535,630 1,727,498 1,048,745 284,944 282,138 15,260,829
ADA Improvement Program 2,440,001$ 715,000 175,000 715,000 175,000 715,000 4,450,000 Barrio Street Lighting 1,280,000 1,280,000 1,030,000
Transportation Taxes 5,347,000 5,010,200 5,147,784 5,293,760 5,442,135 55,010,356
Total Project Expenditures 62,525,970 6,946,268 5,640,000 5,425,000 6,375,000 3,315,000 30,450,000
PRIOR YEAR 1 YEAR 2 YEAR 3 YEAR 4 YEAR 5 YEAR 6-15
CollegeBoulevard Extension 1,205,001
Total Revenues N/A 5,347,000 5,010,200 5,147,784 5,293,760 5,442,135 55,010,356
El Camino Real and Cannon Road Intersection Improvements 3,536,000
N/A 3,784,113$ 1,900,228$ (2,472,275)$ (5,301,030)$ (6,439,086)$ (6,264,448)$
Carlsbad Boulevard and Tamarack AvenuePedestrian Improvements 1,054,001
YEARS 2022-23 2023-24 2024-25 2025-26 2026-27 2028-37
El Camino Real Widening -Sunny Creek to Jackspar 3,999,999 1,010,000 Kelly Driveand Park DriveComplete Street Improvements 4,175,000 500,000
Carlsbad VillageDriveand Grand AvenuePedestrian and Crossing Improvements 1,320,000 Chestnut AvenueComplete Street Improvements- Valley to Pio Pico 1,080,000 Chestnut Complete Street I-5 to Railroad Project Study 85,000 Christiansen Way Improvements 310,000
BEGINNING FUNDBALANCE N/A 6,931,007$ 5,331,739$ 4,701,939$ 4,424,723$ 3,343,483$ 5,470,618$
ENDING 5,331,739 4,701,939 4,424,723 3,343,483
Coordinated Traffic Signal Program 2,583,979
CAPITAL PROJECTS
FUNDBALANCE N/A
PRIOR YEAR 1 YEAR 2 YEAR 3 YEAR 4 YEAR 5 YEAR 6-15 YEARS 2022-23 2023-24 2024-25 2025-26 2026-27 2028-37
MelroseDriveRight Turn Laneto West Bound Palomar Airport Road 911,002 Palomar Airport Road and CollegeBoulevard Improvements 1,295,499
Carlsbad Boulevard Pedestrian Lighting 1,325,000
Pavement Management Program 19,186,565 1,150,000 1,650,000 1,650,000 1,650,000 16,500,000
El Camino Real Widening -Arenal Road to La Costa Avenue 3,250,001 6,010,000
South Carlsbad Coastline 1,779,027 1,000,000
Pavement Management Program 14,146,476 2,200,000 950,000 950,000 950,000 950,000 9,500,000
State Street and Grand AvenueRoad Improvements 325,000 Street Lighting Replacement Program 3,325,001
$
$
$ 5,470,618$ 30,030,974$
TRAFFIC
TRANSNET - LOCAL
BEGINNING FUNDBALANCE
Terramar Area Coastal Improvements 1,000,000 1,000,000 Valley and Magnolia Complete Streets 1,200,000 Valley Street Traffic Calming 1,645,000 Village and Barrio Traffic Circles 1,024,999
REVENUES
El Camino Real Widening -Poinsettia Laneto Camino Vida Roble 3,105,001 50,000
Avenida EncinasCoastal Rail Trail and Pedestrian Improvements 2,170,653$ 3,177,000
CAPITAL PROJECTS
Sidewalk/Street Construction Program 3,800,000 987,500 333,000 107,500 3,725,000 Terramar Area Coastal Improvements 6,650,005 2,800,000
Traffic Impact FeeUpdate 240,000 30,000
$
Traffic Impact FeeFundsto CFD #1 90,000 90,000 90,000 90,000 1,494,000
REVENUES
El Camino Real Right Turn Laneto East Bound Alga Road 438,000
Total Project Expenditures 27,012,265 3,419,516 6,100,000 3,877,500 1,423,000 107,500 10,270,000
Total Revenues N/A 1,535,630 1,727,498 1,048,745 284,944 282,138 15,260,829
Coordinated Traffic Signal Program 1,000,001
I 49
Palomar Airport Road/Paseo Del Norte Left Turn LaneExtension 250,278 (575) Palomar Airport Road/Paseo Del Norte Right Turn Lane 925,641 (8,157)
ENDING FUNDBALANCE N/A 1,900,228$ (2,472,275)$ (5,301,030)$ (6,439,086)$ (6,264,448)$ (1,273,619)$
TotalRevenues N/A 5,609,663 5,323,461 5,115,661 5,174,491 5,233,998 55,767,363
MaerkleReservoirTransmissionMain 773,000 1,000,000 4,557,000
ValleyandMagnoliaCompleteStreets 71,000 WaterInfrastructureConditionAssessmentProgram 1,780,000 410,000 410,000
PRIOR YEAR1 YEAR2 YEAR3 YEAR4 YEAR5 YEAR6-15 YEARS 2022-23 2023-24 2024-25 2025-26 2026-27 2028-37
BEGINNINGFUNDBALANCE N/A 19,532,773$ 16,359,430$ 4,880,391$ (6,551,478)$ (6,781,987)$ (6,977,989)$
CollegeBoulevard-CannonRoadToBadgerLane(490Zone) 300,000 12,600 1,250,000
RanchoCarlsbadGroundwaterSupply 200,000 125,000 1,425,000
RecycledWaterPhase3-Pipelines 21,256,333 (4,253,888)
TotalRevenues N/A 1,724,252 2,016,073 1,635,544 1,089,556 1,180,328 15,159,895
TotalProjectExpenditures 12,481,983 523,601 1,450,000 2,275,000 125,000 280,000 9,425,000
WaterLossMonitoringProgram 349,999
ENDINGFUNDBALANCE
CAPITALPROJECTS
I 50
PRIOR YEAR1 YEAR2 YEAR3 YEAR4 YEAR5 YEAR6-15
AviaraParkwayandPlumTreeWaterline 200,000 (200,000)
PressureReducingStationProgram 4,061,999 600,000 600,000 600,000 600,000 600,000 6,000,000
FireFlowCapacitySystemImprovements 1,710,000 (1,500,000) 1,700,000 264,000
RecycledWaterLine-CarlsbadWaterRecyclingFacilitytoAguaHediondaLagoon 3,417,406 (13,500)
PalomarAirportWaterlineRealignment 1,750,000 560,000
RecycledWaterPhase3-CarlsbadWaterRecyclingFacilityExpansion 3,291,435
PRIOR YEAR1 YEAR2 YEAR3 YEAR4 YEAR5 YEAR6-15 YEARS 2022-23 2023-24 2024-25 2025-26 2026-27 2028-37
RecycledWaterLoansandGrants 14,272,277
ReservoirRepairandMaintenanceProgram 5,849,999 1,960,000 6,680,000
DesalinatedWaterFlowControlFacilityNo.5 10,104,300 707,301
BEGINNINGFUNDBALANCE N/A (18,024,665)$ 265,000$ 265,000$ 0$ 0$ 0$
MaerkleReservoirFloatingCoverReplacement 11,032,843
SanDieguitoWaterIntertieAndPipelineExtension 280,000 (280,000)
C-TankAccessRoadRepairandElectricalImprovements $ 50,000 265,000
MaerkleFacilityImprovements 2,235,201 500,000
RecycledWaterPhase3-Reservoir 980,000
5,609,663 5,323,461 5,115,661 5,174,491 5,233,998 55,767,363
CarlsbadBoulevardWaterlineReplacementatTerramar 3,430,001 1,300,000
N/A 27,212,895$ 27,778,968$ 27,139,512$ 28,104,068$ 29,004,396$ 34,739,292$
CollegeBoulevard-CannonRoadToBadgerLane(375Zone) 250,183$ 28,200 1,000,000
SanLuisReyMissionBasinGroundwaterSupply 277,500 (277,500) 280,000 8,000,000 WaterModeling 350,000 25,000 25,000 25,000
N/A 26,012,244$ 27,212,895$ 27,778,968$ 27,139,512$ 28,104,068$ 29,004,396$
REVENUES
CarlsbadWaterRecyclingFacility(EncinaCapitalProjects) 599,943
MaerkleReservoirSolarProject 249,170
RanchoCarlsbadGroundwaterSupply 200,000 125,000 1,425,000
SanLuisReyMissionBasinGroundwaterSupply 77,500 (77,500) 80,000 6,000,000
CAPITALPROJECTS
AbandonPotableServices(NewRecycledServices) 875,827$ 50,000 500,000 500,000
LimitedAccessPipelineRelocationProgram 1,939,999 2,000,000 1,000,000
HydroelectricGenerationatWaterFacilities 400,000 28,000 1,425,000 PoinsettiaLane-CassiaRoadtoSkimmerCourt(ReimbursementAgreement) 600,000
YEARS 2022-23 2023-24 2024-25 2025-26 2026-27 2028-37
BEGINNINGFUNDBALANCE
TransferfromWaterOperatingFund
SantaFeIIReservoirSiteElectricalImprovements 33,580 150,000 SCADAImprovements 3,923,400 3,209,200 2,412,500 610,500 Tri-AgencyWaterTransmissionPipelineReplacement 3,618,972 1,000,000
CrestviewDriveTransmissionMain 300,000 21,000 535,000
REVENUES
REVENUES
NormallyClosedValve(InstallMotorizedValve) 485,000 500,000 OrionCenter 6,789,410
TotalRevenues N/A 14,272,277
RecycledWaterPhase3-CarlsbadWaterRecyclingFacilityExpansion 6,753,630
ENDINGFUNDBALANCE N/A 265,000$ 265,000$ 0$ 0$ 0$ 0$
CAPITALPROJECTS
CathodicProtectionProgram 1,606,701 190,000 190,000 190,000 190,000 190,000 540,000
110,000 1,100,000 WaterSystemRehabilitationandReplacement 9,568,372 2,690,000 2,800,000 3,000,000 3,000,000 3,000,000 40,970,000 WaterValveRepair/ReplacementProgram 6,919,997 940,000 960,000 960,000 960,000 1,000,000 10,760,000 Water,RecycledandSewerMasterPlan 491,213 TechnologyInvestmentProjects MeterDataManagement/UtilityAnalytics 550,000 UtilityBillingAutomation 75,000 UtilityBillingPortal 90,000 TotalProjectExpenditures 79,850,514 8,783,006 16,802,500 16,547,530 5,405,000 5,430,000 78,205,000 ENDINGFUNDBALANCE N/A 16,359,430$ 4,880,391$ (6,551,478)$ (6,781,987)$ (6,977,989)$ (29,415,626)$ WATERCONNECTION-POTABLE WATERCONNECTION-RECYCLED WATERREPLACEMENT-POTABLE
DeveloperFees 1,724,252 2,016,073 1,635,544 1,089,556 1,180,328 15,159,895
RecycledWaterPhase3-Pipelines 2,497,528 (349,751)
TotalProjectExpenditures 34,547,369 (4,017,388) 265,000
495,000 34,650
RecycledWaterLine-CarlsbadWaterRecyclingFacilitytoAguaHediondaLagoon 1,632,595 (303,763)
RecycledWaterPhase3-Reservoir 3,120,000 200,000
SantaFeIIInletPipeline 2,500,000 1,836,030 420,000 420,000 450,000 4,730,000 110,000 110,000 110,000
Recycled Water Condition Assessment Program 700,001 50,000 50,000 50,000 50,000 50,000 590,000
CAPITAL PROJECTS
Carlsbad Water Recycling Facility (Encina Capital Projects) 3,691,710 366,000 474,000 895,000 1,879,000 223,000 1,504,000
WATER REPLACEMENT - RECYCLED
PRIOR YEAR 1 YEAR 2 YEAR 3 YEAR 4 YEAR 5 YEAR 6-15 YEARS 2022-23 2023-24 2024-25 2025-26 2026-27 2028-37
Recycled Water Pipeline Replacement 350,000 350,000 350,000 350,000 5,060,000
Recycled Water Valve and Appurtenance Replacement Program 260,000 120,000 120,000 125,000 125,000 1,330,000
Total Revenues N/A 1,000,000 1,433,235 1,449,860 1,466,534 1,483,399 14,833,990
Carlsbad Water Recycling Facility Roof Replacement 225,000 Orion Center 2,715,600
Transfer from Recycled Water Operating Fund 1,000,000 1,433,235 1,449,860 1,466,534 1,483,399 14,833,990
I 51
C-Tank Access Road Repair and Electrical Improvements $ 250,000 1,325,000
BEGINNING FUND BALANCE N/A 11,297,721$ 10,880,221$ 11,101,856$ 9,413,716$ 8,476,250$ 9,211,649$
SCADA Improvements 1,026,900 631,500 337,600 398,000
Water, Recycled and Sewer Master Plan 369,609
Total Project Expenditures 9,163,820 1,417,500 1,211,600 3,138,000 2,404,000 748,000 8,484,000
ENDING FUND BALANCE N/A 10,880,221$ 11,101,856$ 9,413,716$ 8,476,250$ 9,211,649$ 15,561,639$
REVENUES
Carlsbad Water Recycling Facility Irrigation and Landscape 175,000
I 52
BTD 2 Bridge and Thoroughfare District 2 developer fees are paid to partially fund the Poinsettia Lane and Aviara Parkway street construction project.
Planned Local Drainage (PLD) Drainage facilities necessitated by growth are paid from developer Planned Local Drainage Fees. PLD fees are segregated by drainage area.
Infrastructure Replacement Fund (IRF) Annual transfers from the General fund pay for major maintenance and replacement of the city’s infrastructure.
Parks Fee Zones 5, 13, 16, 17, 18 Fees paid by development in Local Facilities Management Zones 5, 13, 16, 17 and 18 to fund a Business Park Recreational Facility in the city's industrial corridor.
BTD 3 Bridge and Thoroughfare District 3 developer fees are paid to partially fund Cannon Road CDBGimprovements.Community
Grants Federal Federal Grants such as Highway Bridge Program funding.
Gas Tax Gas Tax revenues for street projects that are received under the Streets & Highways Code of the State of California.
Park in Lieu (PIL) Park in Lieu Fees are charged to developers for park acquisition and development. PIL fees are segregated by quadrant to fund park projects in those quadrants.
Other Sources include revenues related to pending financing districts, property owner contributions, and contributions from other agencies.

I 53
Development Block Grants are allocated by the federal government to help develop viable urban communities for low and moderate income CFDhouseholds.1TheCity of Carlsbad Community Facilities District 1 (Mello Roos) funds civic projects, I 5 interchange projects, and road segments.
GLOSSARY OF CAPITAL PROJECT FUNDING SOURCES
Gas Tax (Road Maintenance and Rehabilitation Account) Gas Tax revenues for street projects specifically for road maintenance and rehabilitation that are received under the Streets & Highways Code of the State of California.
General Capital Construction (GCC) General Capital Construction funds, created through fund transfers from the city's General Fund, are used to fund various municipal and other capital projects.
Sewer Replacement (SEWER REPL) Sewer Replacement is part of sewer user fees and pays for repair and replacement of the city's existing sewer system.
Water Connection Recycled (RECL WATER) Revenues used to fund new Recycled Water projects; revenues for Phase III expansion includes grant and loan funds.
Public Facilities Fees (PFF) Public Facilities Fees are charged to developers to fund civic facilities, park development, streets, traffic signals, and other facilities.
TransNet (TRNSNT BIKE, HWY, LOCAL, STP) Receipts of County Sales Taxes allocated by the San Diego Regional Transportation Commission finance various bicycle, freeway interchange and local road improvement projects.
Traffic Impact Fees (TIF) Developer Traffic Impact Fees are used for various street construction and improvement projects.
Sewer Connection (SEWER CONN) Development fees include Sewer Connection charges for expansion of sewer lines and facilities.
Transportation Development Act (TDA) City street and bicycle projects can receive funding from Transportation Development Act sales tax receipts.
Water Replacement Potable (WATER REPL) Water Replacement funds are included in water utility rates and pay for the repair and replacement of existing potable water lines and facilities.
Water Replacement Recycled (RECL REPL) Recycled Water Replacement funds are included in utility rates and pay for the repair and replacement of existing recycled water lines and facilities.
I 54
Water Connection Potable (WATER CONN) Development fees include Major Facility Fees used to fund expansion of water lines and ancillary water facilities.
Parks & Recreation: Stump Cutter 1 12,000
Fire Very High Frequency Radio Replacements 11 250,000 Plymovent Systems 60,000 Fire Engine 1 924,000 Fire Engine Equipment Outfitting 222,500 Fire Subtotal $1,456,500
J 1
Public Works: Pickup Truck 6 305,281 Public Works: Backhoe Loader 1 125,000 Fleet Replacement Subtotal 32 $4,598,281
PLANNED MAJOR CAPITAL OUTLAY ITEMS FISCAL YEAR 2022 23
Utilities Light bars and equipment outfitting for new utility truck 10,000 Utilities Subtotal $10,000
Fire: Urban Search and Rescue Truck 1 1,400,000
Police: Sedan 2 80,000
Parks & Recreation: Tractor 1 30,000
Golf Course Driving Range Netting 40,540 Monument Sign 25,000 Waterfall Planting 55,000 AirWall System Replacement for Fireside Room 25,000 Mega Top Salad Unit - Refrigeration 5,500 M3 Refrigerator - 3 Door Storage 5,700 Groom Suite 25,000 Events Patio Outside of Front Entrance 52,000 Canyon's Westside Patio Upgrade 59,000 Duplex Sewer Pump Station Replace 28,000 Parking Lot Slurry & Stripe 32,000 Bunker Renovation Phase 4 of 5 56,000 Cart Path Repairs (6-8 panels) 50,000 Toro Triplex Greens Mower 50,000 Workman HDxD Utility Vehicle 32,000 GTX Electric Utility Cart 18,000 Topdresser 17,000 Drinking Fountains 16,000 Entertainment Range Bays 55,000 Carpeting for Golf Shop and Offices 26,000 Starter Area Upgrade 12,000 Golf Course Subtotal $684,740
Information Technology Subtotal $16,718
Library: Dodge Sprinter 1 50,000
Fire: Pickup Truck 2 171,000
Fire: Truck 1 918,000
Fire: SUV 2 150,000
Quantity One-Time Cost Environmental Sustainability New vehicles 3 135,000 Environmental Management Subtotal $135,000
Servers 1 16,718
(Greater than $10,000)
Fleet Replacement
Finance: SUV 1 36,000
Parks & Recreation: Pickup Truck 1 44,000
Grand Total Major Capital Outlay $6,901,239
Fire: Ambulance 2 660,000
Parks & Recreation: Sedan 1 35,000
Police: Utility Hybrid 5 312,000 Police: SUV with K9 Outfitting 3 225,000 Police: Pickup Truck 1 45,000
Information Technology Replacement
*Major Capital Outlay only includes items of $10,000 or greater.
Department Item Description
Innovation and Economic Development
1 New Orleans, LA 3,000$ International Institute for Municipal Clerks
Legislative Meetings 2 Washington, D.C. 3,000 City Manager Total 9,500$
ICMA National Conference 2 Columbus, OH 3,500$
Association for Intelligent Information Management
Administrative Services - Admin
Neogov Conference 4 Las Vegas, NV 12,000$ LMS Conference 1 TBD 3,000 World at Work Conference 1 TBD 3,000 Human Resources Total 18,000$
ICMA Annual Conference 2 Columbus, OH 4,000
4 TBD 10,000$
Legislative Meetings
J 2
2 Henderson, NV 2,400$
Government Investment Officers Association 2 Las Vegas, NV 1,400 City Treasurer Total 3,800$
Police
Association of Public Treasurers of US & Canada
Human Resources
Various background investigations 1 TBD 20,000
Harvard TECH Civic Innovation Summit 2 Cambridge, MA 4,000 City Possible City Executive summit 1 Block Island, RI 2,000
National League of Cities - City Summit 1 Kansas City, KS 2,000
Smart Cities Connect/Smart Cities Week 2 Washington, DC 3,000
CPTED, SMILE conference 1 TBD 1,700
2 Washington, D.C. 3,000$ National League of Cities 2 TBD 3,000 City Council Total 6,000$
IACP, LEIT, Benchmarkcities
SXSW Tech Industry Conference 1 Austin, TX 3,000
Police Total 42,800$
Communication & Engagement
Tyler Connect (Energov - Business License) Conference 2 TBD 6,600 Central Square (IFAS) conference 2 Orlando, FL 6,000 Finance Total 27,400$
1 Little Rock, AR 3,000 Managing Electronic Records
IEDC Conference
General Fund City Council
Smart City Expo 1 Miami, FL 2,000
1 Oklahoma City, OK 2,000$ Administrative Services - Admin Total 2,000$
3CMA National Communication Conference 1 TBD 4,500
OUT OF STATE TRAVEL BUDGET FISCAL YEAR 2022 23
Travel Description Employees Destination 2022-23 Budget
PRSA National Conference 1 TBD 6,000 Communication & Engagement Total 15,000$
City Treasurer
CHIA conference 4 TBD 2,400
City Manager
GFOA Annual Conference 5 Portland, OR 9,000$ Harris Conference 2 Las Vegas, NV 5,800
Innovation and Economic Development Total 25,000$
ICMA Regional Conference 2 TBD 3,000
City Clerk Services
IAP2 Training Conference 1 TBD 4,500$
IEDC Annual Conference 2 Oklahoma City, OK 5,000$
ICAC conference (reimbursed by grant) 1 TBD 2,000 International Association for ID 2 TBD 2,100
1 Chicago, IL or Indianapolis, IN 3,000 City Clerk Services Total 9,000$
Finance
CATO Conference 4 TBD 4,600
American Public Works Association Conference 4 Charlotte, NC 9,350$
Harvard Kennedy School 1 Cambridge, MA 3,000 Fire Service Executive Development Institute 1 Washington 3,000
National Fire Sprinkler Association Conference 1 Las Vegas, NV 2,000 Arson Investigators Training Conference 1 TBD 3,000
CivicRec Summit 2 TBD 6,000$
Public Works - General Fund
Public Works - General Fund 31,360$
Fire Chiefs Summit 2 Albuquerque, NM 4,000
General Fund Subtotal 305,260$
National Fire Academy - Executive Fire Officer 1 Emittsburg, MD 3,000
Computers in Libraries 1 Arlington, VA 1,500 Creando Enlaces 2 San Diego/Tijuana 750 Library & Cultural Arts Total 15,200$
National Fire Academy 1 Emittsburg, MD 3,000
National Facilities Management and Technology Conference 2 Las Vegas, NV 4,560 Transportation Research Board 102nd Annual Meeting 1 Washington, DC 1,600 Tableau Conference 1 TBD 2,210 Energov Conference 1 TBD 2,210 EAM Vendor Conference 1 TBD 2,280
ICMA Conference 1 TBD 2,350 Waste Expo 2 TBD 3,000
Parks & Recreation
Housing & Homeless Services
IAFC Fire Rescue International 5 San Antonio, TX 12,500$
Travel Description Employees Destination 2022-23 Budget
EduCode Training Conference 1 Las Vegas, NV 3,000
ALA Annual 2 Chicago, IL 3,500$ Society of American Archivists 1 Boston, MA 1,700 Americans for the Arts Annual Convention 2 TBD 3,500
Community Development
National Fire Academy - Executive Chief Officer 1 Emittsburg, MD 3,000 International Code Council Conference & Code Hearings 1 Louisville, KY 2,500
F.I.E.R.O PPE Symposium 2 TBD 2,000
Fire
Wildland Urban Interface Conference 1 TBD 2,000 Vision 20/20 Community Risk Reduction Conference 1 TBD 2,000
Redmond Health & Safety Symposium 2 TBD 4,000 Firehouse World 5 Columbus, OH 10,000
Tri-State Seminar 2 Las Vegas, NV 2,300
ICMA National Conference 1 Columbus, OH 2,100$ Institute of Transporation Engineers 1 New Orleans, LA 2,100 Community Development Total 4,200$
National Adaptation Forum 1 Baltimore, MD 1,500
ALSC National Institute 1 Kansas City, MO 1,750
National Fire Protection Association Conference 1 TBD 2,500
Library & Cultural Arts
ALA LibLearnX 1 New Orleans, LA 2,500
NRPA Conference 6 Phoenix, AZ 15,000 Parks & Recreation Total 21,000$
LOIN Personal Protection Council 2 TBD 2,000
J 3
National Association of Housing and Redevelopment Officials Conference 2 Washington, DC 4,000 Housing & Homeless Services Total 4,000$
CPSE Excellence Conference 1 TBD 2,500 Fire Total 71,000$
LOIN Fiber to Fabrics 2 TBD 2,000
Grand Total Out Of State Travel 425,180$
J 4
IACP 1 Dallas, TX 3,500
Microsoft Ignite 1 TBD 3,500 Gartner Infrastructure 1 Las Vegas, NV 3,500 Service Now Knowledge 2023 1 TBD 3,500
Replacement Apparatus Inspection - USAR Chassis 2 Clintonville, WI 3,000 Replacement Apparatus Inspection - USAR Body 4 Fort Collins, CO 6,000 AssetWorks Conference 2 TBD 5,560 Public Works - Fleet & Facilities Total 29,560$
GFOA 1 Portland, OR 1,600$ Tri-State Seminar 2 Las Vegas, NV 1,220 APWA PWX 2022 3 Charlotte, NC 2,150 Water Environment Federation conference 1 TBD 2,200 UESI Pipelines 2022 Conference 1 Indianapolis, IN 2,150 Itron Conference 2022 1 Marco Island, FL 1,680 Harris/Northstar Conference 2022 1 Las Vegas, NV 1,010 WaterSmart Innovations 2022 2 Las Vegas, NV 2,020 AWWA Water Infrastructure conf 1 Portland, OR 2,450 Water Environemnt Foundation TEC 1 New Orleans, LA 3,480 Public Works - Utilities Total 19,960$
Replacement Apparatus Inspections - F995 & F830 4 Clintonville, WI 6,000$ Replacement Apparatus Inspections - F976 3 Boise, ID 4,500 Replacement Apparatus Inspections - F498 3 Sumner, IA 4,500
Information Technology
Non General Fund Subtotal 119,920$
Northstar 1 TBD 1,800 SQL Server & Azure SQL Conference 1 Las Vegas, NV 2,000 Tyler 2 TBD 4,200
FIRE CONFERENCE 1 Denver, CO 3,500 Defcon 1 Las Vegas, NV 2,000 Information Technology Total 55,600$
TECH MENTOR 1 Redmond, WA 3,500
Non-General Fund Housing & Homeless Services
Public Works - Utilities
Travel Description Employees Destination 2022-23 Budget
Public Works - Fleet & Facilities
ITFMA 1 TBD 3,500$ Cisco Live 2 TBD 6,700
CentralSquare 2 TBD 4,200
National Association of Housing and Redevelopment Officials Conference 1 Washington, DC 2,800$ YARDI Software Forum 2 TBD 5,000 Housing & Homeless Services Total 7,800$
Public Works - Environmental Management Resource Recycling Conference 2 Austin, TX 3,000$ SOAR- Sustainability Operations Actions and Resources 1 TBD 2,000 US Composting Council Conference 1 TBD 2,000 Public Works - Solid Waste Total 7,000$
MOTOROLA 2 TBD, FL 6,700 IGNITE 1 TBD, FL 3,500
The financial operations of the city are organized into funds for which budgets are prepared. These funds are grouped into three major categories: Governmental, Proprietary, and Fiduciary.
Flower Fields Grant Program (170) A grant program to support the preservation and enhancement of the Carlsbad Flower Fields.
Citizens’ Option for Public Safety (COPS) (123) Supplemental Law Enforcement Services Funds to be spent providing “front line police services” such as anti gang efforts, crime prevention and juvenile justice
Governmental Funds
FUND CLASSIFICATIONS AND DESCRIPTIONS
Activity Grants (150) Provides city funded grants to community service groups.
Special Revenue Funds are used to account for specific revenues that are legally restricted to expenditures for specifiedAffordablepurposes.Housing
Cultural Arts Donations (148) Funds used to promote and support the programs and activities of the city’s Cultural Arts Office.
The General Fund (001) is used to account for all financial resources necessary to carry out basic governmental activities of the city that are not accounted for in another fund. The General Fund supports essential city services such as police and fire protection, street maintenance, libraries, parks and open space management.
(133) Collects fees generated from the Inclusionary Housing In Lieu Fee and the sale of affordable housing credits that satisfy a developer’s inclusionary housing obligation as well as loan repayments from existing developments. With these funds, the city provides affordable housing programs and low income and homeless services support and financial assistance for residential developments that provide housing opportunities to low income households.
Habitat Mitigation Fee (172) Funding for conservation of certain parcels totaling approximately 300 acres which lie in the unincorporated area to the southeast of Carlsbad and which are essential to the biological viability of the Habitat Management Plan.
Governmental funds are made up of the General Fund, Special Revenue Funds and Capital Project Funds.
Buena Vista Channel Maintenance District (163) Ensures adequate funds are collected from property owners within the district to administer and maintain the Buena Vista Creek Channel from Jefferson Street east to the South Vista Way bridge.
J 5
Library and Arts Endowments (175) Donations are used to support Library programming and activities.
Communityprograms
Agricultural Mitigation Fee (171) The Agricultural Conversion Mitigation Fee program funds projects that improve agricultural lands for continued agricultural production, protect and enhance the coastal and lagoon environment, improve lagoon nature centers and restore beaches for public use.
Community Development Block Grant (391) Federal funds provided to the city to develop viable urban communities through the provision of decent housing, a suitable living environment and by expanding economic opportunities for lower income persons.
Capital Project Funds are used to account for specific revenues that are restricted to expenditures for capital project
Street Tree Maintenance District (160) The street tree maintenance assessment district provides partial funding for the operation and maintenance of all city accepted street trees within the public right of way, including specialized maintenance for street trees in the Downtown Carlsbad Village area.
Grants (124) Used to purchase equipment, supplement staffing costs and assist with Recreationtraining.
Library Gifts & Bequests (145) Includes Friends of the Library annual donations and Library Gifts and Bequests. Donations are used to support Library programming and activities.
Rental Assistance/Section 8 Program (190) Federal funding to provide vouchers to help low income residents pay rent.
Asset Forfeiture (122) Funds received from the police department’s drug enforcement activities which are restricted for use in supporting police activities to include the acquisition of equipment, supplies or Publicservices.Safety
Median Maintenance District (161) Provides landscape and irrigation maintenance for approximately 68 acres of median planters and nine acres of developed parkways, including the Downtown Carlsbad Village
Policearea.
District 2 (BTD 2) (362) Developer fees are paid to partially fund the Poinsettia Lane and Aviara Parkway street construction project.
Tyler Court Apartments (806) Provides affordable housing to senior households with incomes at 30% and 50% of the San Diego County Area median incomes.
Bridge and Thoroughfare District 3 (BTD 3) (363) Developer fees are paid to partially fund Cannon Road improvements.
Senior Program Donations (143) These donations provide funding for nutrition, transportation, activities, events and other programs benefiting Carlsbad's senior population.
Street Lighting Maintenance District (162) The street lighting maintenance assessment district provides funding for the operation and maintenance of all city accepted streetlights within the public right of way.
Bridgepurposes.andThoroughfare
J 6
Donations (149) These donations provide supplemental funding for Parks & Recreation events, programs and facilities.
Cable Infrastructure (138) Funds used for the associated capital costs of the city’s own cable channel and other city outreach and communications programs Franchise fees from cable and internet providers make up the revenue for this fund.
Lighting and Landscaping District 2 (164) This maintenance and assessment district funds the costs of streetlights, street trees and medians within the district boundaries covering newer developments in the Localcity.
Public Facilities Fees (PFF) (320) Public Facilities Fees are charged to developers to fund civic facilities, park development, streets, traffic signals, and other facilities.
Industrial Corridor Park Fees (334) Fees paid by development in Local Facilities Management Zones 5, 13, 16, 17 and 18 to fund a Business Park Recreational Facility in the city's industrial corridor.
Proprietary funds are Internal Service Funds and Enterprise Funds.
Internal Service Funds are used to account for operations internal to the city where the intent is that the cost of providing services to the city department is financed primarily through department user charges.
Community Facilities District 1 (CFD 1) (430) Mello Roos funds specific civic projects, I 5 interchange projects and road segments.
Parking in Lieu Fees (315) Funding collected from new developments in Carlsbad Village that do not provide adequate parking facilities for use in construction of future parking facilities and improvements.
Technology Investment Capital (375) Technology Investment Capital funds, created through annual fund transfers from the city's General Fund, are used to fund various technology projects.
Transportation Development Act (TDA) (380) City street and bicycle projects can receive funding from Transportation Development Act sales tax receipts.
Planned Local Drainage Area Fees (PLD) (350 353) Drainage facilities necessitated by growth are paid from developer Planned Local Drainage Fees. PLD fees are segregated by drainage area.
Construction (GCC) (300) General Capital Construction funds, created through annual fund transfers from the city's General Fund, are used to fund various municipal and other capital projects.
Gas Tax Road Maintenance and Rehabilitation (153) Gas Tax revenues for street projects, which can only be used for road maintenance and rehabilitation, received under the Streets & Highways Code of the State of GeneralCalifornia.Capital
Grants Federal (392) Federal Grants such as Highway Bridge Program funding.
Infrastructure Replacement (IRF) (370) Annual transfers from the General Fund to pay for major maintenance and replacement of the city’s infrastructure.
Gas Tax (152) Gas Tax revenues for street projects received under the Streets & Highways Code of the State of California.
Proprietary Funds
Traffic Impact Fees (TIF) (310) Developer Traffic Impact Fees are used for various street construction and improvement projects.
J 7
Park in Lieu Fees (PIL) (330 333) Park in Lieu fees are charged to developers for park acquisition and development. PIL fees are segregated by quadrant to fund park projects in those quadrants.
TransNet (342) Receipts of county sales taxes allocated by the San Diego Regional Transportation Commission to finance various bicycle, freeway interchange and local road improvement projects.
Risk Management (612) Management of vehicle and city liability insurance.
Wastewater Replacement (515) Sewer replacement charges are part of sewer user fees and pay for repair and replacement of the city's existing sewer system.
Potable Water Replacement (505) Water replacement charges are included in water utility rates and pay for the repair and replacement of existing potable water lines and facilities.
(621) Funding for the replacement of vehicles currently in operation, based on the expected replacement cost at the end of vehicles useful life.
Enterprise Funds are used to account for operations that are financed and operated similar to a private business where the intent is that the cost of providing services to the public is financed primarily through user
Potable Water Connection (506) Development fees include Major Facility Fees used to fund expansion of potable water lines and ancillary water facilities.
Information Technology Replacement (641) Funding for the replacement of current technology assets based on the expected replacement cost at the end of the anticipated useful life.
Recycled Water Connection (507) Revenues used to fund new Recycled Water projects; revenues for Phase III expansion includes grant and loan funds.
Recycled Water Operations (502) Funds used to operate and maintain critical infrastructure systems and to provide the safe delivery of conservation outreach and treated irrigation water.
Wastewater Connection (512) Development fees include Sewer Connection charges for expansion of sewer lines and facilities.
Vehicle Maintenance (620) Vehicle maintenance and operations of citywide fleet, including gas and oil Vehiclecharges.Replacement
J 8
Workers’ Compensation (611) Management of workers’ compensation insurance and claims.
Water Operations (501) Carlsbad Municipal Water District (CMWD), a subsidiary of the city, provides potable water service to approximately 85% of the city.
Solid Waste Management (520) Administers and monitors the solid waste contract and the Palomar Transfer Station agreement and is responsible for ensuring the waste reduction and recycling components of the Source Reduction and Recycling Element and Household Hazardous Waste Element comply with state mandated diversion and disposal requirements.
Recycled Water Replacement (508) Recycled Water Replacement funds are included in utility rates and pay for the repair and replacement of existing recycled water lines and facilities.
Information Technology Operations (640) Maintenance and operations of citywide technology assets.
Wastewater Operations (511) The city operates and maintains a sanitary wastewater collection system, which covers approximately 65% of the geographic area of the city.
charges.Potable
Fiduciary Fund
J 9
The Crossings Golf Course (572) Funds used to cover the operations of the city’s municipal golf course.
Fiduciary funds are private purpose trust funds used to account for situations where the city’s role is purely custodial, such as the receipt, temporary investment, and remittance of fiduciary resources to individuals, private organizations, or other governments.
Watershed Protection (521) Fund dedicated to providing programs which enable stewardship of the city’s resources protecting our beaches, creeks, and lagoons.
Successor Agency to the Redevelopment Agency (801) Responsible for administering enforceable obligations of the former Carlsbad Redevelopment Agency (RDA) including administration of housing loans and other debt obligations, completing existing projects and ultimately to wind down RDA operations over time.
J 10
ProgramBudget
Recycled Water Replacement X
Special Revenue
Citizens Option for Public Safety X
Library & Arts Endowments X Library Gifts & Bequests X
J 11
Recycled Water Connection X
Habitat Mitigation Fee X
Community Facilities District No. 1 X
Wastewater Replacement X
General Capital Construction X Infrastructure Replacement X Park-in-Lieu Fees/Park Development Fund X Enterprise
Affordable Housing X
Local Cable Infrastructure X
Wastewater Operations X Wastewater Connection X
Special Revenue
Community Development Block Grant X Cultural Arts Donations X
Police Department Fire Department Public Works Community Services Administrative Services &Policy Leadership Capital Projects
Recycled Water Operations X
Buena Vista Channel Maintenance District X
Potable Water Operations X
Potable Water Replacement X
Fund
Major
Lighting & Landscaping District No. 2 X X
Median Maintenance District X Police Asset Forfeiture X
Agricultural Mitigation Fees X
Community Activity Grants X Capital Project
DEPARTMENT/FUND RELATIONSHIP
General X X X X X X
Flower Fields Grant Program X
Potable Water Connection X
Non-MajorFundsFunds
The Crossings Golf Course X
Vehicle Replacement X
Gas Tax X
Public Safety Grants X X
Bridge & Thoroughfare District No. 2 X
Workers' Compensation X Risk Management X
Special Revenue (continued)
Fiduciary Successor Agency to the Redevelopment Agency X X
TransNet X
Parking-in-Lieu Fees X
Senior Program Donations X
Grants-Federal X
Technology Investment Capital X Transportation Development Act (TDA) X
Capital Project
Vehicle Maintenance X
J 12
Information Technology Replacement X
Enterprise
Street Tree Maintenance District X Tyler Court Apartments X
Police Department Fire Department Public Works Community Services Administrative Services &Policy Leadership Capital Projects
Public Facilities Fees X
Fund
Gas Tax Road Maintenance and Rehabilitation X
Rental Assistance/Section 8 Program X
Street Lighting Maintenance District X
Industrial Corridor Park Fees X
ProgramBudget
Planned Local Drainage Area Fees (PLD) X
Recreation Donations X
Information Technology Operations X
Bridge & Thoroughfare District No. 3 X
Internal Service
Traffic Impact Fees (TIF) X
Solid Waste Management X Watershed Protection X
Balanced Budget A budget in which planned expenditures do not exceed planned funds available.
GLOSSARY
Fund A set of interrelated accounts to record revenues and expenditures associated with a specific purpose.
Debt Service The payment of principal and interest on borrowed funds such as bonds.
Enterprise Fund A fund type established to account for the total costs of selected governmental facilities and services that are operated similar to private enterprises.
Branch An organizational unit comprised of departments. Examples include the Administrative Services Branch and Community Services Branch.
Capital Outlay Equipment (fixed assets) with a value $1,000 or more and an estimated useful life of more than one year, such as automobiles and office furniture, which appear in the operating budget.
Assessed Valuation A dollar value placed on real estate or other property by the County of San Diego as a basis for levying property taxes.
Beginning/Ending Fund Balance Unencumbered resources available in a fund from the prior/current year after payment of the prior/current year expenses.
Carlsbad Community Vision A set of nine core values and vision statements developed through consultation with the community in 2010 that serve as a guide for city leaders as they serve the city.
Department An organizational unit comprised of programs or divisions. Examples include the Finance and Human Resources departments.
Bond A certificate of debt issued by an entity, guaranteeing payment of the original investment, plus interest, by a specified future date.
Fiscalactivity.Year 12 month period designated as the budget year. Carlsbad's fiscal year is July 1 to June 30.
Cost Allocation A method used to charge General Fund overhead costs to other funds, such as Enterprise Funds and Internal Service Funds.
Appropriation A specific amount of money authorized by the City Council for an approved work program or individual project.
Budget An annual financial plan that identifies revenues, types and levels of services to be provided and the amount of funds that can be spent.
J 13
Expenditure The actual spending of funds set aside by appropriation for identified goods and services.
Fee A general term used for any charge levied by government for providing a service or permitting an
Full time Equivalent (FTE) The hours worked by one employee on a full time basis, used to convert the hours worked by several part time employees into the hours worked by full time employees. Two employees each working 1,000 hours equals 1.0 full time equivalent employee.
Encumbrance A legal obligation to pay funds, an expenditure of which has not yet occurred.
Capital Improvement Program A multi year financial plan containing proposed construction of physical assets such as park, street, sewage and recreation facilities. The 15 year program outlines the expenditure plan for future capital projects and the corresponding revenues to pay for those expenditures.
Grant Contributions of cash or other assets from another governmental agency to be used or expended for a specified purpose, activity, or facility.
J 14
Maintenance and Operations A general category used for classifying expenditures for materials, supplies and services that are normally used within the fiscal year.
Revenues Amount of funds received from the collection of taxes, fees, permits, licenses, interest and grants during the fiscal year.
Operatingyear.Costs
Personnel Costs Expenditures associated with providing the staff necessary to provide the desired levels of services, including both salary and benefit costs.
Internal Service Fund A fund that provides services to all city departments and bills the various other funds for services rendered. Examples are Fleet Maintenance, Information Systems and Workers’ Compensation.
Strategic Digital Transformation Investment Program A strategic plan for technology and digital transformation combined with project descriptions, costs, funding sources and timelines. It outlines a five year expenditure plan for future digital transformation and technology projects and the corresponding revenues necessary to pay for them.
General Fund The primary fund used by the city for which revenues and expenditures are not legally restricted for use. Examples of departments operating within the General Fund include Fire, Library, and the City Manager's Office.
Payments from one fund to another fund, primarily for work or services provided.
Growth Management Standards Acceptable service levels that have been established for 11 public facility Interfundcategories.Transfers
Fund Balance The amount of financial resources available for use.
Special Revenue Funds A fund that collects revenues that are restricted by the city, state or federal government as the manner in which they may be spent.
Estimated expenses that can be expected to occur following the construction of a Capital Improvement Project.
Operating Budget The annual appropriation of funds for ongoing program costs, which include salaries, benefits, maintenance and operations and capital outlay items. Carlsbad's Operating Budget encompasses one fiscal
Growth Management Plan A comprehensive approach to land use planning ensuring controlled and managed growth within the city, while providing designated public facilities.
AARP American Association of Retired Persons
CAP Climate Action Plan
BTD Bridge and Thoroughfare Benefit District
FVCEC Foster a Vibrant Civic Engagement Culture
GCC General Capital Construction
COPS Citizens' Option for Public Safety Grant
CEQA California Environmental Quality Act
EKG Electrocardiogram
CWRF Carlsbad Water Reclamation Facility
FPPC Fair Political Practices Commission
ESL English as a Second Language
FEMA FederalEmergency Management Agency
CPMA Carlsbad Police Management Association
J 15
CWEA California Water Environment Association
EIR Environmental Impact Report
ADC ActuarialDeterminedContributions
CDBG Community Development Block Grant
ERP Enterprise Resource Planning
ADA Americans with Disabilities Act
CST Crime Suppression Team
COSUGI Customers of SirsiDynix Users Group, Inc.
CAD Computer Aided Dispatch
CCTV Closed circuit Television
FTE Full‐Time Equivalent
ACRONYMS
AED Automated External Defibrillator
AB Assembly Bill
CM&I Construction Management & Inspection
EMS Emergency Medical Services
EWA Encina Wastewater Authority
DOJ Department of Justice
DEI Diversity, Equity and Inclusion
CPOA Carlsbad Police Officers' Association
BCDDM Build Capacity for Data driven Decision Making
CTBID Carlsbad Tourism Business Improvement District
EAT Enhance Accessibility and Transparency
ALA American Library Association
GAAP Generally Accepted Accounting Principles
CPR Cardiopulmonary Resuscitation
EMT Emergency Medical Technician
FY Fiscal Year
CalPERS California Public Employees Retirement System
CIP Capital Improvement Program
EOC Emergency Operations Center
CFD CommunityFacilitiesDistrict
GDP Gross Domestic Product
CalTrans California Department of Transportation
CCEA Carlsbad City Employees' Association
CMWD Carlsbad Municipal Water District
FBI Federal Bureau of Investigation
CSS Customer Self Service Portal
EPA Environmental Protection Agency
GFOA Government Finance Officers Association
GASB Governmental Accounting Standards Board
CFA Carlsbad Firefighters' Association
CalWORKs California Work Opportunities and Responsibility to Kids
GHG Greenhouse Gas Emissions
CSMFO California Society of Municipal Finance Officers
CAD Computer aided Dispatch
GIS Geographic Information System
J 16
POST Police Officer Standards and Training
PCDC Pursue Communitywide Digital Transformation
LED Light emitting diode
PSSC Promote Security and Sustainability through Connectivity
HUD Department of Housing and Urban Development
PC personal computer
TIF Traffic Impact Fee
HPRM HP Records Manager
ISF Internal Service Fund
PW Public Works
TDA TransportationDevelopment Act
SWAT Special Weapons Attack Team
UDC Unified Disaster Council (of San Diego)
PFF Public Facilities Fees
TDM TransportationDemandManagement
ICC International Code Council
RFP Request for Proposal
SWPPP Storm Water Pollution Prevention Plan
PERS Public Employees Retirement System
TCBMP Treatment Control Best Management Practices
IT Information Technology
IFAS Integrated Financial Accounting System
LMS Learning Management System
TCMP Traffic Control Management Plan
STEAM Science, Technology, Engineering, the Arts, and Mathematics Program
PLD Planned Local Drainage
SCADA Supervisory Control and Data Acquisition System
SANDAG San Diego Association of Governments
TMDL Total Maximum Daily Load
M&O Maintenance and Operations
HELP Homeless Engagement Leading to Progress
SDCWA San Diego County Water Authority
TOT Transient Occupancy Tax, or hotel tax
I&ED Innovation & Economic Development
PHA Public Housing Agency
MFF Major Facility Fee
HA Hydrologic Area
PLA Public Library Association
ROW Right of Way
LCP Local Coastal Program
SDTIP Strategic Digital Transformation Investment Program
JPA Joint PowersAuthority
PIL Park‐In‐Lieu Fees
IRF Infrastructure Replacement Fund
ICMA International City/County Management Association
ROPS Recognized Obligation Payment Schedule
SB Senate Bill
HMP Habitat Management Plan
HOT Homeless Outreach Team
PCI Payment card industry
UASI Urban Areas Security Initiatives Program
HR Human Resources
SDG&E San Diego Gas & Electric
GPS Global Positioning System
NFPA National Fire Protection Association
USLA Unified States Lifesaving Association
WQIP Water Quality Improvement Plan
LEAP Local Early Action Planning
SWQMP Storm Water Quality Management Program
NIST National Institute of Standards and Technology
MS4 Municipal Separate Storm Sewer System
City Council meeting agenda on May 20, https://www.facebook.com/photo/?fbid=377155171112495&set=a.221114840049863Cityhttps://www.facebook.com/photo/?fbid=374446531383359&set=a.2211148400498632022CouncilmeetingagendaonMay24,2022
City Council Workshops
CIP Project Prioritization Workshop #3 on May 3, 2022 https://carlsbadca.new.swagit.com/videos/171072
BUDGET COMMUNICATIONS
Strategic Plan Workshop #2 on March 16, 2022 https://carlsbadca.new.swagit.com/videos/156898
CIP Project Prioritization Workshop #1 on April 20, 2022 https://carlsbadca.new.swagit.com/videos/170480
CIP Project Prioritization Workshop #2 on April 26, 2022 https://carlsbadca.new.swagit.com/videos/170665
Fiscal Year 2022 23 Operating Budget, Strategic Digital Transformation Investment Program and Capital Improvement Program, the Fiscal Year 2022 23 Appropriation Limit and Revisions of Fees and Charges of Services on June 14, 2022 https://carlsbadca.new.swagit.com/videos/175538
City Manager’s update on May 26, 2022
City Council Budget Meetings
Facebook Posts
Investment Program and Capital Improvement Program on June 7, 2022 https://carlsbadca.new.swagit.com/videos/175144
Fiscal Year 2022 23 Preliminary Operating Budget on May 24, 2022
J 17
Strategic Plan Workshop #1 on Dec. 13, 2021 https://carlsbadca.new.swagit.com/videos/149987
Social Media Communications
Fiscalhttps://carlsbadca.new.swagit.com/videos/174409Year202223PreliminaryStrategicDigitalTransformation
https://twithttps://twitter.com/carlsbadcagov/status/1529148744536662017https://twitter.com/carlsbadcagov/status/1529518679981019136https://twitter.com/carlsbadcagov/status/1532787712029245440https://twitter.com/carlsbadcagov/status/1534238068667990017https://twitter.com/carlsbadcagov/status/1535331133507964931https://twitter.com/carlsbadcagov/status/1536748558560395268Twitterhttps://www.facebook.com/pCityhttps://www.facebook.com/photo/?fbid=388628283298517&set=a.221114840049863Cityhttps://www.faCityhttps://www.facebook.com/photo/?fbid=383936220434390&set=a.221114840049863Cityhttps://www.facebook.com/photo/?fbid=378683360959676&set=a.221114840049863CouncilmeetingagendaonJune3,2022CouncilmeetingagendaonJune7,2022cebook.com/photo/?fbid=386549176839761&set=a.221114840049863CouncilmeetingagendaonJune10,2022CouncilmeetingagendaonJune14,2022hoto/?fbid=391236353037710&set=a.221114840049863Postster.com/carlsbadcagov/status/1527703666525888513
City Manager’s Update for May 19, 2022 https://myemail.constantcontact.com/City Manager s Update May 19 2022.html?soid=1102527936699&aid=ohrAsJi1KyM
City Manager’s Update for June 2, 2022 https://myemail.constantcontact.com/City Manager s Update June 2 2022.html?soid=1102527936699&aid=Mv9WGHzvKGQ
City Manager’s Update for June 9, 2022 https://myemail.constantcontact.com/City Manager s Update June 9 2022.html?soid=1102527936699&aid=8t1fZiVTBzQ
J 18
City Manager’s Update E Newsletters
City Manager’s Update for May 5, 2022 https://myemail.constantcontact.com/City Manager s Update May 5 2022.html?soid=1102527936699&aid=J_uiR6YYFyM
City Manager’s Update for May 26, 2022 https://myemail.constantcontact.com/City Manager s Update May 26 2022.html?soid=1102527936699&aid=08usr9VuZo0
City staff develops medium term (5 year) and long term (10 year) forecasts as part of the budget process. While long term projections are inherently less reliable than short term projections, they can help detect structural budget issues early. As shown in the following chart, revenues will start to fall short of expenditures in fiscal year 2025 26 because revenues are growing at a slower rate than expenditures. Assumptions for both revenues and expenditures are detailed further in this forecast section.
While economic conditions are the primary drivers for economically sensitive revenues such as property tax, sales tax and transient occupancy tax, other factors drive non economically sensitive categories such as franchise, ambulance, and departmental fee revenues. These revenue categories are more heavily impacted by rate changes, energy prices, and consumption levels. Collections from local, state, and federal agencies are primarily driven by grant and reimbursement funding available from these agencies. As a result, these revenues experience no significant net gain or loss during economic expansions or slowdowns. All revenue projections are based upon a careful examination of
Overview
$200,000$150,000$100,000$50,000$$250,000 $300,000
FY23 FY24 FY25 FY26 FY27 FY28 FY29 FY30 FY31 FY32
thousands)(in$
Forecast Methodology
J 19
Revenues Expenditures
The forecast is not a budget nor a plan but rather a model based on cost and revenue assumptions updated regularly as new information becomes available. Of these components, cost projections which are based on known costs are relatively reliable. However, revenue forecasts are based on assumptions related to future economic conditions, which are inherently more uncertain. Economic forecasts change frequently and demonstrate the difficulties of committing to a particular prediction of the future. For this reason, the city’s forecast is updated regularly.
GENERAL FUND FORECAST
General Fund 10-Year Forecast
A financial forecast is a planning tool that helps identify trends and anticipate the long term consequences of budget decisions. The forecast is instrumental in modeling the effects of retirement costs, employee compensation, on going maintenance and operations, as well as revenues for the city’s budget.
J 20
Unemployment has continued to steadily improve since an initial spike to 13.8% at the onset of the COVID 19 pandemic. The March 2022 unemployment rate of 3.1% in Carlsbad only lags pre pandemic unemployment levels by 0.2 percentage points. The unemployment rate for the County of San Diego was 3.4% in March 2022 and the State of California was 4.2%. Currently, many employers are citing difficulty in finding and retaining workers. In March 2022, nationally, there were 1.9 open jobs for every unemployed worker. This is one underlying cause to increased wage pressures and difficulty retaining employees.
the collection history and patterns related to seasonality and the economic environment the city is most likely to encounter in the future. Staff also considered potential COVID 19 impacts in determining the most reasonable estimated figures.
A discussion of both the national and local economic outlooks used to develop the revenue estimates for the fiscal year 2022 23 forecast is included below. To create the revenue forecasts, the city reviewed national, state, and regional economic forecasts from multiple sources, including the Congressional Budget Office, California’s Legislative Analyst’s Office (LAO), and the Center for Continuing Study of the California Economic (CCSCE). The city also relies on third party consultants to provide revenue estimates in their respective field of expertise. For sales tax, the city contracts with Avenu.
Real gross domestic product (GDP) increased at an annual rate of 6.9% in the fourth quarter of 2021, following an increase of 2.3% in the third quarter. The increase was revised down 0.1 percentage points from the “second” estimate released in February. The acceleration in the fourth quarter was led by an acceleration in inventory investment, upturns in exports and residential fixed investment, as well as an acceleration in consumer spending. In the fourth quarter, COVID 19 cases resulted in continued restrictions and disruptions in the operations of establishments in some parts of the country. Government assistance payments in the form of forgivable loans to businesses, grants to state and local governments, and social benefits to households all decreased as provisions of several federal programs expired or tapered off.
Geopolitical conflict has fueled volatility in financial markets. The conflict has exacerbated inflationary pressures, particularly in energy and commodities, and has caused tightening in financial markets. While consumer spending and economic growth remain strong, an extended conflict along with elevated energy prices increases the risk of an economic slowdown later this year. While the Federal Reserve is expected to tighten monetary policy, the Federal Open Market Committee (FOMC) has very little margin for error as it attempts to combat inflation without pushing the economy into a recession.
Carlsbad Economic Outlook
National Economic Outlook
As of 2021, Carlsbad had the second largest gross regional product (GRP) in San Diego County at nearly $14.6 billion, only trailing the City of San Diego. In 2019, Carlsbad’s economy grew by $800 million to nearly $13.6 billion. In 2020, as a result of the pandemic, the city’s GRP remained flat. In 2021, its economy grew by approximately $1 billion, to nearly $14.6 billion. This growth was seen across all industry categories, and was led by manufacturing, wholesale trade, and professional, scientific, and technical services.
The city’s Consumer Price Index (CPI) forecasts are derived from the UCLA Anderson Forecast for the Nation and California.
J 21
Hospitality and tourism businesses have been hard hit over the past two years with fluctuating health order restrictions and consumer confidence impacting travel. Hotel occupancy in January was significantly lower than January 2019 levels. However, occupancy rose sharply over the quarter, with March occupancy (75.5%) nearly matching March 2019 occupancy levels (76.5%). With the Omicron surge behind us, tourism leaders are optimistic that individual and family travel could continue to rise. Baseline comparison is 2019, as it represents normal conditions. Carlsbad’s average daily room rate (ADR) remains higher than pre pandemic levels. Despite beginning the quarter with lower occupancy numbers, ADR quickly rose as occupancy rates recovered. ADR was $209.40 in March, compared to $174.54 in March 2019. Baseline comparison is 2019, as it represents normal conditions.
There were 15,628 unique job postings in Carlsbad between January and March, a slight increase from the previous quarter. This continues a trend of increased postings quarter over quarter for the past eight quarters. The median advertised salary for these postings was $44,200, which is on average $2,600 more than jobs posted in the previous quarter. Of jobs posted, 45% did not indicate any experience was required and 68% indicated an education requirement of High School/GED or less. Continued feedback from hospitality and restaurant businesses indicate hiring in those industries remains a challenge.
Median household income in Carlsbad continues to exceed county income levels. The median income for a household in Carlsbad in 2019 was $123,409, which was $44,085 higher than the county median income. The delta between Carlsbad median income and the County median income grew by $11,768 between 2018 and 2019, meaning Carlsbad is outpacing the region in terms of household income growth. Home values in Carlsbad, along with San Diego County, continue to rise significantly, with median home prices in the city at $1.44 million in March, a gain of 3.7% over the previous quarter. This value is seasonally adjusted and only includes the middle price tier of homes. Carlsbad home values have risen 28.5% over the past year. The continued rise in home values can be partially attributed to constrained supply and strong demand in the region.
Carlsbad has established itself as having the right workforce to fuel innovation in tech and life sciences fields. Carlsbad businesses can access talent from San Diego County, Orange County, and even southwest Riverside County. Nearly 60% of working age residents hold a bachelor’s degree, with more than 25% attaining an advanced degree. Outside of some communities in central San Diego, Carlsbad has the heaviest concentration of households with degrees in science, technology, engineering, and mathematics (STEM degrees). This local talent mix is among the leading reasons that firms choose Carlsbad.
There were a total of 2,810 business licenses issued in the third quarter of fiscal year 2021 22, including 1,156 non residential, 757 residential, and 897 outside the city licenses. This represents the strongest quarter for business licenses issued since the pandemic. The number of licenses issued does not reflect the number of businesses in Carlsbad as a business may carry multiple licenses, short term vacation rentals are required to get a license, and businesses outside of Carlsbad that do business in
Commercial vacancy rates improved in all segments this quarter. The industrial vacancy rate is now at 2.9%, compared to 10.8% pre pandemic. The office vacancy rate is currently 13%, compared to 15.25% pre pandemic. Retail, which was disproportionately impacted by the pandemic continues to see elevated vacancy rates, although they have improved slightly since last quarter. Retail vacancy is now at 8.3%, compared to 5.27% pre pandemic. Average market rents per square foot, per year have also risen across all categories this quarter. Retail rates are now $43.55. Office rates are now $36.95. Industrial rates are now at $19.24.
J 22
Between January and March, permit activity remained the same for commercial building permits and increased for residential building permits. The number of residential permits issued (1,139) was an increase of 148 over the last quarter. Commercial permits issued (117), was consistent with last quarter. The number of residential building permits issued has been generally increasing over the past two years. While permit activity is improving year over year, residential builders continue to cite labor shortages and increased building costs as challenges to new housing starts.
the city or with the city are required to get a license. It is estimated that there are approximately 6,327 businesses in Carlsbad. Upon evaluation of the number of business licenses that were discontinued those that were once active but not renewed Carlsbad actually lost fewer businesses during the pandemic than the 24 months prior to the pandemic.
General Fund Revenues
Bureau of Economic Research (NBER), an American private nonprofit research organization, defines the beginning and ending dates of recessions. The NBER defines a recession as “a significant decline in economic activity spread across the economy, lasting more than two quarters which is 6 months, normally visible in real gross domestic product (GDP), real income, employment, industrial production, and wholesale retail sales.” Since World War II, recessions have lasted an average of 11.1 months and have occurred, on average, about every 58.4 months (4.8 years).
$184,812 $204,786 $219,042 $235,127 $254,384 $$300,000$250,000$200,000$150,000$100,000$50,000thousandsin$ Fiscal Year
10 Year General Fund Revenues
As shown in the chart below, General Fund revenues are expected to be $198.8 million in fiscal year 2022 23 and increase through the forecast. Sales tax is conservatively projected to decrease from the record highs in fiscal year 2021 22. Property tax and transient occupancy tax are expected to increase moderately. Other revenue sources consider assumptions ranging from no growth to conservative
The city’s top three revenue sources continue to be property tax, sales tax, and transient occupancy tax (TOT). While this will continue to be true, the city expects revenues to be below the historic highs estimated in fiscal year 2021 22.
Thegrowth.National
Franchise Tax 6,213$ 6,958$ 6,914$ 6,872$ 6,830$ 6,784$
Estimated Projected Projected Projected Projected
Sales tax is one of the city’s largest revenues sources. Sales taxes are collected at the point of sale and remitted to the California Department of Tax and Fee Administration (CDTFA), formerly the Board of Equalization. The CDTFA allocates tax revenue owed to the city in monthly payments.
Income from Investments and Property 5,095$ 5,480$ 5,802$ 6,054$ 6,303$ 6,563$
Ambulance Fee
1,697$ 1,570$ 1,601$ 1,633$ 1,666$ 1,699$
Projected Revenue Category 2021-22 2022-23 2023-24 2024-25 2025-26 2026-27
J 23
The city’s sales tax base is heavily weighted in the transportation (comprised heavily of new auto sales) and general retail sectors, both of which account for over half of taxable sales in Carlsbad. New auto sales are highly elastic in comparison to economic trends, and tax revenues from new auto sales
Intergovernmental 7,745$ 1,415$ 1,415$ 1,415$ 1,415$ 1,415$ Other Revenues 6,564$ 5,447$ 5,924$ 5,722$ 5,483$ 5,566$
Sales tax revenues were adversely impacted in fiscal year 2019 20 with the onset of the pandemic. The restrictions resulting from the COVID 19 pandemic have led to increases in segments like auto sales, construction, drug store sales, chemical product, food markets and recreational products, while others like restaurants and general retail took a major hit. The city has also been benefitting from sales tax revenues on internet sales generated as a result of the Wayfair or AB147 law that went into effect in October 2019.
2,650$ 3,850$ 3,996$ 4,090$ 4,180$ 4,284$
Transient Occupancy Tax 28,091$ 28,803$ 29,524$ 30,262$ 31,060$ 31,901$
Until fiscal year 2019 20, sales tax revenues had improved markedly, peaking in fiscal year 2018 19 at $40.8 million. The onset of the pandemic in March of 2020 resulted in swift reductions in sales tax revenues and the city ended the year with $38 million in sales tax revenues. During fiscal year 2020 21, impacts of COVID 19 on sales tax generally correlated with shelter in place mandates and as restrictions were lifted, recovery was realized as fiscal year 2020 21 ended with $44 million in sales tax revenues. Fiscal year 2021 22 experienced the most accelerated recovery however and it is estimated to end the year at $50 million in sales tax revenues, a historic high for the city. Much of this recovery resulted from the easing of restrictions and pent up demand. As we move forward into fiscal year 2022 23, much uncertainty remains surrounding market and economic conditions like inflation and impacts to disposable income. As a result, a conservative estimate of $49.1 million is budgeted for fiscal year 2022 23 which represents a decrease of $0.9 million, or 2%, over fiscal year 2021 22 estimations. With rising inflation and pent up demand likely to decrease, conservative estimates have been applied for sales tax in the out years of the forecasted period.

50,323$ 49,123$ 49,876$ 51,769$ 53,449$ 54,945$
Property Tax 79,666$ 81,511$ 84,299$ 87,138$ 89,799$ 92,123$
Interdepartmental Charges
Sales Tax
Business License Tax 6,968$ 6,377$ 6,472$ 6,702$ 6,915$ 7,099$ Development Related 3,970$ 2,860$ 3,301$ 1,887$ 543$ 591$
Transfer Tax
5-Year GeneralFund Revenue Forecast(in thousands)
Sales Tax
5,221$ 5,456$ 5,664$ 5,797$ 5,924$ 6,072$
Total 204,203$ 198,848$ 204,786$ 209,340$ 213,567$ 219,042$
fell precipitously during the recession, from $6.7 million in 2007 to $4.4 million in 2009. Since that dip, auto sales tax revenues hit a high of $12.2 million for the four quarters ended Dec 31, 2021.
Property Tax
Revenues received under Proposition 72, a 0.5 cent increase in California sales tax for the funding of local public safety services, is included in sales tax revenues.
Sales taxes are expected to increase over the next 5 years by annual average rate of 1.8%.
With general retail sales tax suffering for the year ended Dec. 31, 2020, the most recent four quarters have shown full recovery increasing nearly 75% and reaching historic levels.
J 24
tax revenues lag behind changes in the housing market, as the tax revenue for the upcoming fiscal year is based on assessed values from January 2022. Thus, the taxes to be received for fiscal year 2022 23 are based on assessed values as of Jan 1, 2022.
Assessed values on the residential real estate are expected to grow modestly, capped by California’s Proposition 13. Proposition 13, adopted in 1978, limits the annual increase in assessed values for property. Under this proposition, assessed values (and the related property tax) can grow by no more than 2% per year. The value upon which the tax is based is only increased to the full market value upon the sale of a property. The maximum increase of assessed values, when not sold, is by the change in California’s Consumer Price Index, which was 1.036% for 2021 22 below the 2% cap for the first time since 2016 17. Residential activity has been driven by low interest rates on mortgages, pent up demand that built during the shutdown and an increase in the ability to work remotely. The median price of a single family residence in Carlsbad, based on resale data from Zillow, is $1.4 million, up by 28.5% year over year in March 2022. Estimates for the upcoming 2022 23 assessment year provided by the County of San Diego’s Assessor’s Office project moderate growth; however, the city’s forecast assumes a more conservative outlook after taking into account current economic conditions and the related risks posed upon the housing market. Rising inflation and the Federal Reserve’s continued interest rates hikes are likely to impact property values as well as the volume of Changestransactions.inproperty
Property tax is the largest source of General Fund revenues, is expected to grow by 6% over last year’s adopted budget and 2.3% over the fiscal year 2021 22 estimated amount. While the residential real estate market in Carlsbad has seen significant increases in values, commercial property assessed values are still expected to remain more flat. Due to the uncertainty and slowdown of economic activity created from the COVID 19 crisis commercial property transactions have been limited during the prior year. Proposition 8 allows owners to have their property temporarily revalued if market value is lower than the factored base year value, posing a risk that commercial property values could temporarily decrease. Until the economic uncertainty wanes and small businesses begin to recover, commercial property prices are not anticipated to increase significantly on an annual basis.
J 25
Transient Occupancy Tax
Property taxes tend to grow slowly unless there is a significant amount of development related activity. In past decades, the city has seen robust growth in property tax revenue due to new development, high turnover of existing homes, and double digit growth in housing prices. However, as the city approaches buildout, development has slowed. In addition to recent interest rate increases, slower development combined with minimal commercial property transactions and tax reform has caused a slowing in property tax growth in the city.

Transient Occupancy Tax is the third highest revenue source for the General Fund also known as TOT or hotel tax. TOT was the revenue category most adversely impacted by COVID 19. From historic highs of $26 million in fiscal year 2018 19, year over year decreases of 27% and 16% were experienced. As of last year, TOT was expected to increase approximately 47%, marking the beginning of an anticipated 3 year recovery. However, this recovery was accelerated with the easing of restrictions and pent up demand which resulted in TOT revenues reaching new historic highs, estimated to end fiscal year 2021 22 at approximately $28 million. While group business travel has yet to fully return to pre pandemic levels, uncertainty around rising inflation and diminishing pent up demand result in conservative estimates applied to the forecast
Property taxes are expected to increase over the next 10 years by annual average rate of 3.1%.
According to a report from Tourism Economics, San Diego County tourism will see significant growth in visitation demand of around 36% in calendar year 2022 and another 9% in calendar year 2023. The projected rebound is driven by lifted travel restrictions and the regions attractiveness for leisure travel, offset by weak group and business travel. The following few years are expected to increase steadily as group and business travel become more prevalent and increases in available rooms continue. The City of Carlsbad currently has approximately 4,812 hotel rooms, 668 timeshares, and over 315 registered vacation rentals.
Transient occupancy taxes are expected to increase over the next 10 years by annual average rate of 2.6%.

The city also receives franchise fee revenues for solid waste recycling and organics services. In April 2021, a new agreement was approved with Republic Services of San Diego. The city receives 7.5% of revenues collected as well as an annual payment of $0.8 million in support of AB 939 and $1.3 million storm water fee. The increase in fiscal year 2022 23 is driven by this $0.8 million payment to assist with AB 939. Increases in the forecast are driven by estimated population growth which drives
Franchise taxes are paid by certain industries that use the city’s right of way to conduct their business. The city currently has franchise agreements for cable TV service, solid waste services, cell sites, fiber optic antenna systems and gas and electric services. The solid waste franchise experienced minor revenue increases that mirror growth in population and changes in rate structures. Cable TV franchise revenue is expected to decrease by 5% from $1.44 million to $1.36 million over the next fiscal year due to decreases in the number of paid subscription services. This trend will most likely continue in future years as more subscribers cut cable services and move to online streaming services.
J 26
Sanconsumption.DiegoGas
Franchise Tax
& Electric pays franchise taxes for the use of the public land over which they transport gas and electricity. The city also receives an “in lieu” franchise tax based on the value of gas and electricity transported on SDG&E lines but purchased from another source. The “in lieu” tax captures the franchise taxes on gas and electricity that is transported using public lands, which would not otherwise be included in the calculations for franchise taxes, due to deregulation of the power industry. This revenue source is expected to remain flat out over the next several years.
Business License Tax
Business licenses taxes are closely tied to the health of the local economy and are projected to increase to $6.2 million in fiscal year 2022 23, a growth of $0.4 million, or 7%, when compared to last year’s adopted budget. This is somewhat in line with projected sales tax revenue increase as businesses either pay taxes based on the amount of their gross receipts or based on set fees. There are currently about 9,591 licensed businesses in the City of Carlsbad, 77 more than in the prior year with 6,327 of them located in the city. Over the next 10 years, business license tax revenues are forecasted to increase annually, on average, by approximately 2.4%.
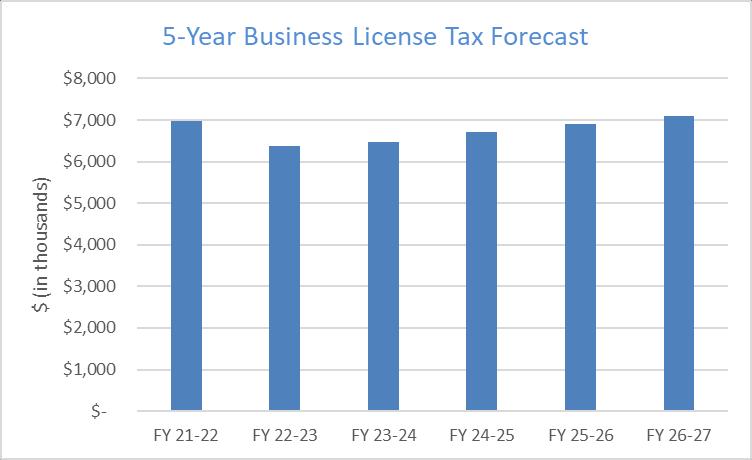
Franchise taxes are expected to increase over the next 10 years by an annual average rate of 0.7%.

Development Related
Interdepartmental Charges
Interdepartmental charges are generated through engineering services charged to capital projects, reimbursed work from other funds and interdepartmentalmiscellaneousexpensescharged to funds outside the General Fund for services performed by departments within the General Fund. interdepartmentalMiscellaneouschargescorrelate with consumer price index (CPI) and are expected to increase annually and on average by 2.5%.

It is difficult to forecast development related revenues as they fluctuate significantly from one year to the next. The city works with consultants to identify and estimate future development based on capacity. While development related revenues are trending downward, based on capacity, the forecast assumes increases in the second half of the forecasted period.

J 27
During fiscal year 2009 10, development related revenues began to turn around from historic lows experienced in fiscal year 2008 09. Since then, development related revenues have fluctuated in line with increases and decreases in residential, commercial and industrial development. In fiscal year 2022 23, the city expects a 28% decrease in development related revenues, to approximately $2.9 million, following higher than anticipated development activity occurring in fiscal year 2021 22. The projected decrease in development related revenues is tied to the volume and type of development projected to be permitted, multi family versus single family, and a drop in the revenues derived from building fees which occur in the early stages of development.
Development related revenues are derived from fees for planning, engineering and building permits, and fees paid by developers to cover the cost of reviewing and monitoring development activities, such as plan checks and inspections. These revenues are difficult to predict, as many of the planning and engineering activities occur months or years before any actual development.
J 28
Ambulance Fees
This category includes interest earnings as well as rental income from city owned land and facilities. The city is expected to earn about $2.8 million in interest on its General Fund investments for fiscal year 2022 23, and another $2.7 million in rental and lease income. The yield on the city’s portfolio is forecasted to average 1.5% and cash balances are expected to remain flat as increases in receipts are projected to be offset by increases in expenditures as the City Council’s goals are operationalized.
Transfer taxes are those taxes paid to the county upon the transfer of interests in real estate. The tax is $1.10 per $1,000 of property value, split equally between the county and the city. Carlsbad expects to receive approximately $1.6 million in transfer taxes for fiscal year 2022 23, which is a 22% increase from fiscal year 2021 22 adopted budget and relatively consistent with current year estimates. The residential real estate market continues remains strong; however, this will likely be influenced by rising interest rates. Housing prices are continuing to increase in Carlsbad and inventories remain low. Over the forecasted period, transfer taxes are expected to annually increase on average by 2.0% in alignment with housing industry projections.

Income from Investments and Property

The city receives ambulance fee revenues based on gross revenue generated by the ambulance transport service provider. Ambulance fees are anticipated to increase over the forecast period by 2.5% on average.
Transfer Taxes

• The process for requesting new staff was also enhanced whereby new requests must meet one of the following criteria:
• Automatic consumer price index (CPI) increases were no longer added to base budgets. Instead, budget requests are required to substantiate the specific increase each year
J 29
Other Revenues
o Address a critical public safety need
Each year, the city updates the budget by considering historical, present, and future costs and trends. In recent years, the city has added new rigor to the budget process which includes the following measures and strategies:
All other revenues include recreation fees, other licenses and fees, fines and forfeitures, transfers in, and other charges and fees. Over the forecasted period, these revenues are anticipated to increase conservatively by 0.5% annually, on average.
o Needed to comply with legal and regulatory requirements
These revenues represent funds received from other governmental entities. In recent years, this revenue category has experienced a great deal of activity with the American Rescue Plan Act of 2021 in which the city received $12.6 million over a two year span. Over the forecasted period, intergovernmental revenues are anticipated to remain flat.

o Meet City Council priorities or goals
General Fund Expenditures
• The process for carrying forward appropriations and encumbrances was formalized whereby requests exceeding $100,000 require City Council approval.
• In fiscal year 2022 23, departments were directed to identify budgetary savings which resulted in a decrease in General Fund maintenance and operation expenditures of approximately 1.8% over the previous year’s adopted budget
As shown in the chart below, General Fund expenditures are expected to increase from $198.3 million in fiscal year 2022 23 to $269 million over the 10 year forecast period, representing an increase of $70 million or 35%
Intergovernmental Revenues

$268,676$300,000$250,000$200,000$150,000$100,000$50,000$-thousands)(in$
Capital Outlay 889$ $ $ $ $ $
$216,441 $201,466 $224,290 $240,671
Fiscal Year
Full time salaries are projected to grow at a rate of 4.3% per year, based on the presumed rate of growth by CalPERS. Part time salaries are forecasted to grow at a rate of 1.9% as they generally grow slower than full time salaries. In fiscal year 2022 23 the city’s budget began accounting for vacancy savings. Vacancy savings represents the amounts of savings achieved through attrition. The forecast assumes $2 million in vacancy savings on an annual basis.
Health Benefits
10 Year General Fund Expenditures
5-Year General Fund Expenditure Forecast(in thousands)
Salaries
Retirement
Personnel Expenditures
Transfers 26,778$ 13,663$ 14,054$ 14,363$ 14,652$ 15,017$
J 30
Expenditure Category 2021-22 2022-23 2023-24 2024-25 2025-26 2026-27
Salaries 75,815$ 81,969$ 83,919$ 86,608$ 89,406$ 92,295$
Maintenance and Operations 59,790$ 60,393$ 58,351$ 59,635$ 61,126$ 62,654$
Rising retirement costs are driving the increase in employee benefits. Carlsbad provided retirement benefits for its employees through the California Public Employee’s Retirement System (CalPERS). Poor investment returns during the Great Recession significantly decreased the plan’s assets. In addition, enhanced benefits and actuarial assumption changes due to increased life expectancies increased the plan’s liabilities. As a result, the city’s pension costs have increased significantly and are one of the city’s largest financial obligations.
Estimated Projected Projected Projected Projected Projected
Benefits 42,963$ 41,792$ 44,641$ 47,577$ 50,828$ 53,825$
Council Contingency 500$ 500$ 500$ 500$ 500$ 500$
In fiscal year 2022 23 health benefits account for about 10% of all personnel costs in the General Fund, primarily due to health insurance costs. The city pays employees a fixed amount for health and dental insurance costs instead of covering a percentage of premiums. Health benefit costs are forecasted to increase annually on average by approximately 6%.
Total 206,735$ 198,318$ 201,466$ 208,682$ 216,512$ 224,290$
J 31
Misc. Classic 231 22.8% 19,374,576$
Service credit: the number of years of CalPERS service. Benefit Factor: percentage of pay based on age. Compensation Basis: the highest monthly average salary for a defined period.
Total Contribution 11,231,619$ 11,914,307$ 12,558,176$ 13,491,001$ 13,973,767$ 14,216,494$
Tier Number Employeesof Total Normal CostFY2022-23 Payroll 6/30/2020on
Total Contribution (%) 41.5% 42.9% 44.0% 46.0% 46.4% 45.9%
Inbelow.December
Misc. Tier2 53 19.4% 5,442,376$
Fire PEPRA 27 24.5% 2,363,122$
A retiree’s highest monthly pension benefits are calculated by multiplying:
Normal Cost($) 5,349,739$ 5,416,307$ 5,508,176$ 5,601,001$ 5,694,767$ 5,758,494$
CalPERSPlanBreakdownbyTier(Miscellaneous)
ProjectedCalPERSContributions(Miscellaneous)
ProjectedCalPERSContributions(Safety)
Total Contribution 12,680,481$ 13,265,747$ 13,964,257$ 14,463,253$ 14,945,963$ 15,207,561$
The city’s CalPERS costs are projected to increase over the next few years, as shown in the table
Total Contribution (%) 27.3% 27.7% 28.4% 28.7% 28.8% 28.5%
Projected Payroll 27,032,538$ 27,775,932$ 28,539,770$ 29,324,615$ 30,131,042$ 30,959,645$
Misc. PEPRA 265 15.9% 18,071,874$
The city’s retirement rates are based on a blend of all three miscellaneous tiers (2.7% @ 55, 2% @ 60, and 2% @ 62). Although employees pay a different rate depending on their respective tier, the city’s costs are the same for all three tiers. The table below shows the current breakdown of city employees amongst the three retirement tiers the majority of employees in the city are currently covered under Tier 3. Savings from the lower cost Tier 2 and Tier 3 plans are not expected to be substantial for several years.
2016, the CalPERS Board of Administration lowered the discount rate from 7.5% to 7.0% with a three year phase in beginning in fiscal year 2018 19 to improve the financial stability of the pension system. This resulted in significant increases in retirement costs. In fiscal year 2021 22, the CalPERS Board lowered the discount rate from 7.0% to 6.8% because the fiscal year 2020 21 investment gain of 21.3% triggered the Funding Risk Mitigation Policy.
Normal Cost(%) 19.8% 19.5% 19.3% 19.1% 18.9% 18.6%
Number EmployeesofTier Total Normal CostFY2022-23 Payroll 6/30/2020on
FY2022-23 FY2023-24 FY2024-25 FY2025-26 FY2026-27 FY2027-28
Police Classic 48 34.3% 6,725,419$ Police Tier2 16 32.3% 1,823,360$ Police PEPRA 65 28.9% 6,677,721$
Projected Payroll 46,525,350$ 47,804,798$ 49,119,429$ 50,470,213$ 51,858,144$ 53,284,243$
UALPayment 5,881,880$ 6,498,000$ 7,050,000$ 7,890,000$ 8,279,000$ 8,458,000$
FY2022-23 FY2023-24
CalPERSPlanBreakdownbyTier(Safety)
Normal Cost($) 5,452,771$ 5,449,747$ 5,452,257$ 5,501,253$ 5,496,963$ 5,541,561$ UALPayment 7,227,710$ 7,816,000$ 8,512,000$ 8,962,000$ 9,449,000$ 9,666,000$
FY2024-25 FY2025-26 FY2026-27 FY2027-28
Normal Cost(%) 11.7% 11.4% 11.1% 10.9% 10.6% 10.4%
Fire Classic 45 30.5% 5,472,471$
Fire Tier2 18 28.5% 1,857,522$
• Employee contributions (11%)
General Fund Departments budget for costs to support the ongoing maintenance and operations of the city. These costs comprise materials and supplies, professional services, and one time special projects. One time costs are budgeted for in year one of the forecasted period so naturally the increase over the forecasted period remains relatively low. On average, maintenance and operations costs are expected to increase approximately 1% annually.
• Employer contributions (29%)
• Expected investment returns (discount rates)
The city maintains a Council Contingency budget at a level of $500,000.
The General Fund is responsible for transferring funds for the following purposes:
Each year, CalPERS determines an employer’s contributions based on actual investment returns and actuarial assumptions including:
• Life expectancies
• Investment earnings (60%)
CalPERS
Transfers
• Lighting and Landscaping District #1 (LLD #1) the city established LLD #1 in 1986 and during its formation, no annual inflator was applied. As a result, the assessment paid by property owners in the District have become insufficient to cover the costs of lighting and landscaping. As a result, the General Fund is responsible for making up the difference. The transfer amount is expected to increase 7% over the next five years at an annual average rate of 1.4%.
The city provides a defined benefit pension to its employees through the California Public Employees’ Retirement System (CalPERS). Retirement benefits are calculated using a formula based on an employee’s age, earnings, and years of service. The retirement benefits are funded by:
J 32
Other Benefits
• Future Capital Funding the General Fund is responsible for a significant portion of the city’s capital project funding. On an annual basis, the General Fund transfers an equivalent of 6% of estimated General Fund revenues to the Strategic Digital Transformation Investment Program, the Infrastructure Replacement Fund, and the General Capital Construction Fund. This transfer amount increases throughout the forecast based on increases in forecasted General Fund revenues.
• Retirement ages
• Inflation rates
• Salaries
Council Contingency
Capital outlay costs are typically not budgeted for in the city’s General Fund; however, from time to time, departments may experience the need to purchase an item that is classified as a capital asset. Because the annual capital outlay amounts are relatively minimal, they have not been included in the city’s General Fund forecast.
The forecast assumes health insurance, dental insurance, and vision insurance increase by CPI.
Maintenance and Operations
Capital Outlay
CalPERS Discount Rate
Contributions to fund the pension plan are comprised of two components:
From the city’s perspective, the discount rate is important as it is used to determine the city’s annual contributions to the plan, the plan’s unfunded liability, and the plan’s funded status. In other words, the discount rate is used to determine whether a plan has enough assets to meet its future obligations. The discount rate must be realistic to allow the city to foresee funding issues that may impact future operating budgets and future generations of retirees and plan members. If the discount rate assumption is too high and investments earn less than expected, a funding shortfall may result, requiring the city or CalPERS members to make greater contributions than expected.
• The amortization of the unfunded accrued liability (UAL).
CalPERS Investment Earnings
Since investment earnings fund nearly 60% of retirement benefits, the city’s pension plan is sensitive to the investment returns of CalPERS. Investment returns affect how much of the retirement benefits can be funded by investment earnings rather than contributions. If investment returns are lower than the discount rate, contributions must increase to make up the difference. As a result, pension plans need accurate return assumptions to ensure fiscal sustainability.
6.1%3.7%16.6%12.3%11.8%19.1%5.1%24.0%13.3%21.7%0.1%13.2%18.4%2.4%0.6%11.2%8.6%6.7%4.7%21.3%-30.0% -20.0% -10.0%0.0%10.0%20.0%30.0% FY02 FY06 FY10 FY14 FY18 ReturnsInvestmentAnnual
CalPERS Historical Investment Returns
Annual Investment Return Discount Rate
Currently CalPERS assumes it will earn investment returns of 6.8% each year. As illustrated in the following chart, over the last 20 years, CalPERS has earned investment returns below the discount rate assumption approximately half of the time. Individual fiscal year investment returns have ranged between 24.0% and +21.7%. In particular, CalPERS earned negative investment returns in 2001 and 2002 due to the dot com crash and 2008 and 2009 due to the Great Recession.
Defined benefit plans are highly sensitive to the discount rate assumption. The discount rate is the expected rate of return of the plan’s assets over the long term. The discount rate will depend on the plan’s size, asset allocation, time horizon, and other considerations.
J 33
• The normal cost (the cost of the benefits earned in a respective year).
Under the Funding Risk Mitigation Policy, the 21.3% return in fiscal year 2020 21 triggered a reduction in the discount rate from 7% to 6.8%. the Funding Risk Mitigation Policy, approved by the CalPERS Board in 2005, lowers the discount rate in years of good investment returns to reduce risk in the portfolio. The Risk Mitigation Policy will affect contributions starting in fiscal year 2023 24.
As of the most recent actuarial valuation on June 30, 2020, the city’s miscellaneous pension plan had assets of $330.9 million, liabilities of $430.5 million and a funded ratio of 76.9%. The city’s safety pension plan has assets of $251.4 million, liabilities of $343.2 million and a funded ratio of 73.2%. The unfunded liability is the difference between assets and liabilities, while the funded ratio is the ratio of assets to liabilities.
In November 2021, CalPERS completed its quadrennial Asset Liability Management (ALM) process, which reviewed investment strategies and actuarial assumptions. At the November 15 17, 2021, meetings, the CalPERS Board approved a 6.8% discount rate, selected a new asset allocation for the fund’s investment portfolio, and adopted new actuarial assumptions.
Asset Class
CalPERS Plan Status
*Includes a 5% allocation to leverage.
Funding Risk Mitigation Policy
J 34
Global Equity 50% 42% Fixed Income 28% 30% Real Assets 13% 15% Private Equity 8% 13% Private Debt 0% 5% Liquidity 1% 0% Total 100% 105%
For fiscal year 2020 21, CalPERS reported an investment return of 21.3%, 14.3 percentage points higher than the 7% discount rate. The average investment return is 10.3% for a 5 year period, 8.5% for a 10 year period, 6.9% for a 20 year period, and 8.4% for a 30 year period. As returns in a given year are volatile, it can be more instructive to look at returns over longer time horizons.
1 Year 21.3% 5 Year 10.3% 10 Year 8.5% 20 Year 6.9% 30 Year 8.4%
Asset Liability Management Process
Time Period Total Investment Return
AllocationNewAllocationCurrent
CalPERS Update
In fiscal year 2019 20, CalPERS earned 4.7%, 2.3 percentage points below the 7% discount rate. As a result, the city’s required pension contributions will increase to make up the difference. The fiscal year 2019 20 investment loss will affect the city’s pension costs starting in fiscal year 2022 23. The contribution increase will be amortized over 20 years and phased in over five years.
In 2022, financial market volatility has increased due to heightened geopolitical risk, supply chain bottlenecks and persistent inflation, and the Federal Reserve’s pivot to a less accommodative monetary policy. Any investment losses will impact the city’s future pension costs.
J 35
The discount rate has a significant effect on the city’s CalPERS contributions. If the discount rate is less than the discount rate assumption, the city’s CalPERS contributions will increase.
For fiscal year 2020 21, CalPERS reported an investment return of 21.1%, 14.3 percentage points above the 7% discount rate. The Investment return triggered the Funding Risk Mitigation Policy, lowering the discount rate to 6.8%. The investment gain and discount rate reduction will impact the city’s pension costs starting in fiscal year 2023 24. The discount rate reduction partially offsets the effect of the investment gain.
During its Asset Management Liability Process, CalPERS considered discount rates between 6.25% and 7%. Ultimately, CalPERS approved a discount rate of 6.8%, a decrease from the previous discount rate of 7%.
City Strategies
Present Value of Projected Benefits 467,508,549$ 493,021,289$
In recent years, unfunded liabilities, or pension debt, have caused cities in California to cut back on public services. Three cities have declared bankruptcy. Pension debt is the difference between how much money is available to pay for the pensions city employees receive when they retire, and the
Entry Age Normal Accrued Liability 410,200,348$ 430,502,885$ Market Value of Assets 322,146,603$ 330,903,112$ Unfunded Accrued Liability 88,053,745$ 99,599,773$ Funded Ratio 78.5% 76.9%
June 30, 2019 June 30, 2020
Impact of CalPERS Discount Rate Changes
CalPERS assumes it will earn investment returns of 7% each year. If investment returns are higher than 7%, the city’s contributions decrease. Conversely, if investment returns are lower than 7%, the city’s contributions increase.
June 30, 2019 June 30, 2020
Present Value of Projected Benefits 391,995,147$ 420,888,640$ Entry Age Normal Accrued Liability 324,351,564$ 343,243,950$ Market Value of Assets 243,980,037$ 251,416,320$ Unfunded Accrued Liability 80,371,527$ 91,827,630$ Funded Ratio 75.2% 73.2%
Due to lower than historical interest rates and economic growth, market experts project lower returns for the next several decades. The Pew Research Center forecasts a long term investment return of 6.5% for typical pension fund portfolios.
Impact of CalPERS Investments Returns
CalPERS Miscellaneous Plan Status
CalPERS Safety Plan Status
Even though CalPERS is continuing to take prudent measures to manage the pension liability for its participants, the annual costs paid by participating members will continue to increase. And, while CalPERS has outperformed its assumed rate of return on investments over the last 10 years, future economic uncertainty is likely to have a profound impact on its investment performance, which will impact the city’s annual required contributions.
Since fiscal year 2016 17, the city has contributed $56.4 million to CalPERS to reduce the city’s unfunded liability and thereby achieve interest savings. These contributions were in addition to the annual required contributions set by CalPERS.
money needed to pay for the actual benefits. Pension debt is an estimate because it’s not possible to know exactly how well the pension fund investments will perform nor how many employees will retire, at what age they will retire and how long they will live.
J 36
The City of Carlsbad has long recognized the financial uncertainty caused by the state’s pension system. That’s why Carlsbad was one of the first cities in the region to enact pension reform, pre dating state reforms in 2013. This and other strategies have reduced the city’s pension debt considerably compared to most other cities in the state.
In 2019, the City Council adopted a Pension Funding Policy (City Council Policy Statement No. 86). This policy states that the city will strive to maintain an 80% funded status. Said another way, the goal of this policy is to keep Carlsbad’s pension debt at no more than 20%.
That the above recitations are true and correct.
3. That the amounts reflected as estimated revenues for FY 2022 23 as shown in Attachments A A3, B B2 and D are adopted as the budgeted revenues for FY 2022 23.
4. That the amounts as designated as the FY 2022 23 Budget request in Attachments A A3, B B2 and D are appropriated to the department or fund for which they are designated, and such appropriation shall not be increased except as provided in this resolution.
2. That certain documents now on file in the Office of the City Clerk of the City of Carlsbad, entitled “Fiscal Year 2022 23 Preliminary Operating Budget,” presented at the Joint Special Meeting on May 24, 2022 as Exhibit 1 to Item No. 8, as amended, if necessary, and “Strategic Digital Transformation Investment Program and Capital Improvement Program,” presented at the Joint Special Meeting on June 7, 2022 as Exhibits 3 and 4 to Item No. 13, as amended, if necessary, in accordance with Attachments A A3, B B2, C and D to this Exhibit 4, attached and incorporated by reference, are adopted as the final Operating Budget, Strategic Digital Transformation Investment Program and Capital Improvement Program for the City of Carlsbad for FY 2022 23 along with the program options and adjustments, if any, determined by the City Council as set forth in the minutes of this Joint Special Meeting on June 14, 2022
J 37
A RESOLUTION OF THE CITY COUNCIL OF THE CITY OF CARLSBAD, CALIFORNIA, ADOPTING THE FINAL OPERATING BUDGET, STRATEGIC DIGITAL TRANSFORMATION INVESTMENT PROGRAM AND CAPITAL IMPROVEMENT PROGRAM FOR FISCAL YEAR 2022 23 FOR THE CITY OF CARLSBAD AND ESTABLISHING CONTROLS ON CHANGES IN APPROPRIATIONS FOR BUDGET FUNDS
RESOLUTION NO. 2022-135.
NOW, THEREFORE, BE IT RESOLVED by the City Council of the City of Carlsbad, California, as follows:1.
WHEREAS, the City Council of the City of Carlsbad, California, has reviewed the proposed final Operating Budget, Strategic Digital Transformation Investment Program and Capital Improvement Program for fiscal year (FY) 2022 23 and has held such public hearings as are necessary prior to adoption of the final budgets.
5. That total appropriations for each fund may only be increased or decreased by the City Council by passage of a resolution amending the budget except as provided in this resolution.
vi. The City Manager may authorize budget adjustments to increase the appropriation for unforeseen legal expenses and liabilities
6. That the following controls are placed on the use and transfer of budget funds:
A. No expenditure of funds shall be authorized unless sufficient funds have been appropriated by the City Council or City Manager as described below.
ii. The City Manager may authorize transfers of funds between Information Technology and departments citywide as it relates to the reorganization of staff within the business systems specialist series.
v. The City Manager may authorize budget adjustments to increase the appropriation for the Workers’ Compensation and Risk Management Funds’ operating budgets in an amount equal to the increases in costs of claims expenses or estimated losses and liabilities.
iv. The City Manager may authorize budget adjustments involving offsetting revenues and expenditures; the City Manager may authorize increases in an appropriation for a specific purpose where the appropriation is offset by unbudgeted revenue, which is designated for said specific purpose.
viii. The City Council must authorize all transfers of funds from the City Council’s Contingency Account.
i. The City Manager may authorize all transfers of funds from account to account within any department.
ix. The City Manager may delegate any of the authority given to the City Manager under this resolution.
iii. The City Manager may authorize transfers of funds between departments within the same fund in an amount up to $100,000 per transfer.
vii. The City Manager may authorize budget adjustments to increase the appropriation for Mutual Aid expenses in an amount equal to the increases in amounts to be reimbursed by other agencies.
J 38
11. That all appropriations in the Operating Budget remaining unexpended at June 30, 2022 related to developer deposits received for developer funded studies not yet completed or grant awards received or expected for projects that are continuing into the next fiscal year are appropriated to FY 2022 23.
9. That all appropriations in the Capital Improvement Program remaining unexpended at June 30, 2022, are appropriated to FY 2022 23 in their respective project budgets.
B. The City Council must authorize any increase in the number of authorized permanent personnel positions above the level identified in Attachment C.
7. That the legal level of budgetary control is the fund level. Budgets may not legally be exceeded at the fund level without appropriate authorization by the City Council.
10. That all appropriations in the Strategic Digital Transformation Investment Program remaining unexpended at June 30, 2022, are appropriated to FY 2022 23 in their respective project budgets.
12. That all appropriations for outstanding encumbrances as of June 30, 2022, are continued into FY 2022 23 for such contracts or obligations.
C. The City Manager may authorize the hiring of temporary or part time staff as necessary within the limits imposed by the controls listed above.
8. That interest earned on grants may be appropriated during the year for the purpose for which the grant was received.
J 39
None.Hall.

J 40

�FAVIOLA MEDINA, City Clerk Services Manager (SEAL)

ABSENT:NAYES:AYS:
PASSED, APPROVED AND ADOPTED at a Joint Special Meeting of the City Council of the City of Carlsbad, theBoardofDirectorsofthe Carlsbad MunicipalWaterDistrict, theBoardofDirectorsof the Carlsbad Public Financing Authority, the City of Carlsbad Community Development Commission, and the City Council of the City of Carlsbad as Successor Agency to the Carlsbad Redevelopment Agency held on the 14th day of June, 2022, by the following vote, to wit: Blackburn, Bhat-Patel, Acosta, Norby.
NOW, THEREFORE, BE IT RESOLVED by the Board of Directors of the Carlsbad Municipal Water District, as follows:
2. That certain documents now on file in the Office of the City Clerk of the City of Carlsbad, entitled “Fiscal Year 2022 23 Preliminary Operating Budget,” presented at the Joint Special Meeting on May 24, 2022 as Exhibit 1 to Item No. 8, as amended, if necessary, and “Strategic Digital Transformation Investment Program and Capital Improvement Program,” presented at the Joint Special Meeting on June 7, 2022 as Exhibits 3 and 4 to Item No. 13, as amended, if necessary, in accordance with Attachments A A3, B B2, C and D of Exhibit 4 of Item No. 7 presented at this Joint Special Meeting on June 14, 2022, are adopted as the final Operating Budget, Strategic Digital Transformation Investment Program and Capital Improvement Program for the Carlsbad Municipal Water District for FY 2022 23 along with any program options and/or adjustments determined by the Board of Directors as set forth in the minutes of this Joint Special Meeting on June 14, 2022.
1. That the above recitations are true and correct.
3. That the amounts reflected as estimated revenues for FY 2022 23 are adopted as the budgeted revenues for FY 2022 23
A RESOLUTION OF THE BOARD OF DIRECTORS OF THE CARLSBAD MUNICIPAL WATER DISTRICT, ADOPTING THE WATER DISTRICT’S FINAL OPERATING BUDGET, STRATEGIC DIGITAL TRANSFORMATION INVESTMENT PROGRAM AND CAPITAL IMPROVEMENT PROGRAM FOR FISCAL YEAR 2022 23 AND ESTABLISHING CONTROLS ON CHANGES IN APPROPRIATIONS FOR BUDGET FUNDS
WHEREAS, the Board of Directors of the Carlsbad Municipal Water District has reviewed the proposed final Operating Budget, Strategic Digital Transformation Investment Program and Capital Improvement Program for Fiscal Year (FY) 2022 23 and has held such public hearings as are necessary prior to the adoption of the final budgets.
J 41
4. That the amounts designated as FY 2022 23 Budgets in Attachments A and B to this Exhibit 5 are appropriated to the fund for which they are designated, and such appropriation shall not be increased except as provided in this resolution.
RESOLUTION NO. 1673.
v. The Executive Manager may authorize budget adjustments to increase the appropriation for unforeseen legal expenses and liabilities.
B. The Board of Directors must authorize any increase in the number of authorized permanent personnel positions above the level identified in the final Budget. The Executive Manager may authorize the hiring of temporary or part time staff as necessary within the limits imposed by the controls listed above.
8. That interest earned on grants may be appropriated during the year for the purpose for which the grant was received.
5. That total appropriations may only be increased or decreased by the Board of Directors by passage of a resolution amending the budget except as provided in this resolution.
J 42
A. No expenditure of funds shall be authorized unless sufficient funds have been appropriated by the Board of Directors or Executive Manager as described below.
9. That all appropriations for Capital Improvement Projects remaining unexpended at June 30, 2022, are appropriated for such capital projects for FY 2022 23
vi. The Executive Manager may delegate the authority to make budget transfers.
i. The Executive Manager may authorize all transfers of funds from account to account within the same fund.
6. That the following controls are placed on the use and transfer of budget funds:
iv. The Executive Manager may authorize budget adjustments to increase the appropriation for the Workers’ Compensation and Risk Management Funds’ operating budgets in an amount equal to the increases in costs of estimated claims expenses.
iii. The Executive Manager may authorize increases in purchased water appropriations in an amount equal to the same percent that water sales exceed the amount of the original revenue estimate.
ii. The Executive Manager may authorize budget adjustments involving offsetting revenues and expenditures; the Executive Manager may authorize increases in an appropriation for a specific purpose where the appropriation is offset by unbudgeted revenue which is designated for said specific purpose.
7. That all appropriations for outstanding encumbrances as of June 30, 2022 are continued into FY 2022 23 for such contracts and obligations.
J 43
�FAVIOLA MEDINA, City Clerk Services Manager
10. That all appropriations in the Strategic Digital Transformation Investment Program remaining unexpended at June 30, 2022, are appropriated to FY 2022 23 in their respective project budgets.
PASSED, APPROVED AND ADOPTED at a Joint Special Meeting of the City Council of the City of Carlsbad, the BoardofDirectorsof the CarlsbadMunicipalWaterDistrict, the BoardofDirectorsof the Carlsbad Public Financing Authority, the City of Carlsbad Community Development Commission, and the City Council of the City of Carlsbad as Successor Agency to the Carlsbad Redevelopment Agency held onthe 14th day of June, 2022, by the following vote, to wit:

(SEAL)
ABSENT:AYES:NAYS: Blackburn, Bhat-Patel, Acosta, Norby. None.Hall.

J 44
1. That the above recitations are true and correct.
5. That the following controls are placed on the use and transfer of budget funds:
2. That certain documents now on file in the Office of the City Clerk of the City of Carlsbad, entitled “Fiscal Year 2022 23 Preliminary Operating Budget,” presented at the Joint Special Meeting on May 24, 2022 as Exhibit 1 to Item No. 8, as amended, if necessary, in accordance with Attachments A A3 and C of Exhibit 4 to Item No. 7 presented at this Joint Special Meeting on June 14, 2022, are adopted as the final Operating Budget for the Carlsbad Housing Authority for FY 2022 23, along with any program options and/or adjustments, if any, determined by the Commission as set forth in the minutes of this Joint Special Meeting on June 14, 2022, and that all funding for planning and administrative expenses have been determined to be necessary and appropriate for implementation of the Carlsbad Housing Authority’s activities in FY 2022 23.
A RESOLUTION OF THE COMMUNITY DEVELOPMENT COMMISSION OF THE CITY OF CARLSBAD, CALIFORNIA, ADOPTING THE FINAL OPERATING BUDGET OF THE CARLSBAD HOUSING AUTHORITY FOR FISCAL YEAR 2022 23 AND ESTABLISHING CONTROLS ON CHANGES IN APPROPRIATIONS FOR BUDGET
WHEREAS,FUNDSthe Community Development Commission of the City of Carlsbad, California (Commission) has reviewed the Operating Budget for the Carlsbad Housing Authority for fiscal year (FY) 2022 23;WHEREAS,and public hearings have been held as necessary prior to the adoption of the final operatingNOW,budgets.THEREFORE,
BE IT RESOLVED by the Community Development Commission of the City of Carlsbad, California, as follows:
3. That the amounts reflected as estimated revenues for FY 2022 23 are adopted as the budgeted revenues for FY 2022 23
4. That the amount designated as FY 2022 23 Budget request in Attachment A to this Exhibit 6 is appropriated to the fund for which it is designated, and such appropriation shall not be increased except as provided in this resolution.
RESOLUTION NO. 553.
6. That all appropriations for any state or federal grant funds in the Operating Budget remaining unexpended at June 30, 2022, are appropriated to FY 2022 23.
i. The Executive Director may authorize all transfers of funds from account to account within the same fund.
ii. The Executive Director may delegate the Carlsbad Housing Authority to make budget transfers and adjustments.
B. The Commission must authorize any increase in the number of authorized permanent personnel positions above the level identified in the final budget. The Executive Director may authorize the hiring of temporary or part time staff as necessary within the limits imposed by the controls listed above.
iii. The Executive Director may authorize budget adjustments involving offsetting revenues and expenditures; the Executive Director is authorized to increase an appropriation for a specific purpose where said appropriation is offset by unbudgeted revenue which is designated for said specific purpose.
J 45
A. No expenditure of funds shall be authorized unless sufficient funds have been appropriated by the Commission or Executive Director as described below.
7. That all outstanding encumbrances as of June 30, 2022, are continued into FY 2022 23 for such contracts and obligations.
J 46
(SEAL)
AYES: NAYS: ABSENT: Blackburn, Bhat-Patel, Acosta, Norby. Hall. None.

PASSED, APPROVED AND ADOPTED at a Joint Special Meeting of the City Council of the City of Carlsbad, the Board of Directors of the Carlsbad Municipal Water District, the Board of Directors of the Carlsbad Public Financing Authority, the City of Carlsbad Community Development Commission, and the City Council of the City of Carlsbad as Successor Agency to the Carlsbad Redevelopment Agency held on the 14th day of June, 2022, by the following vote, to wit:

2. That certain documents now on file in the Office of the City Clerk of the City of Carlsbad, entitled “Fiscal Year 2022 23 Preliminary Operating Budget,” presented at the Joint Special Meeting on May 24, 2022 as Exhibit 1 to Item No. 8, as amended, if necessary, and “Strategic Digital Transformation Investment Program and Capital Improvement Program,” presented at the Joint Special Meeting on June 7, 2022 as Exhibits 3 and 4 to Item No. 13, as amended, if necessary, in accordance with Attachments A A3, B B2, C and D of Exhibit 4 to Item No. 7 presented at this Joint Special Meeting on June 14, 2022 are adopted as the final Operating and Capital Improvement Program Budgets for The Crossings at Carlsbad Municipal Golf Course for FY 2022 23, along with any program options and/or adjustments, if any, determined by the Board of Directors as set forth in the minutes of this Joint Special Meeting on June 14, 2022
3. That the amounts reflected as estimated revenues for FY 2022 23 are adopted as the budgeted revenues for FY 2022 23.
5. That the following controls are placed on the use and transfer of budget funds:
J 47
RESOLUTION NO. 89.
A RESOLUTION OF THE BOARD OF DIRECTORS OF THE CARLSBAD PUBLIC FINANCING AUTHORITY ADOPTING THE FINAL OPERATING BUDGET AND CAPITAL IMPROVEMENT PROGRAM OF THE CROSSINGS AT CARLSBAD MUNICIPAL GOLF COURSE FOR FISCAL YEAR 2022 23 AND ESTABLISHING CONTROLS ON CHANGES IN APPROPRIATIONS FOR BUDGET FUNDS
1. That the above recitations are true and correct.
WHEREAS, the Board of Directors of the Carlsbad Public Financing Authority has reviewed the proposed final Operating Budget and Capital Improvement Program for The Crossings at Carlsbad Municipal Golf Course for fiscal year (FY) 2022 23; and WHEREAS, public hearings have been held as necessary prior to the adoption of the final budgets.NOW, THEREFORE, BE IT RESOLVED by the Board of Directors of the Carlsbad Public Financing Authority as follow:
4. That the amount designated as FY 2022 23 Budget request in Attachment A to this Exhibit 7 is appropriated to the fund for which it is designated, and such appropriation shall not be increased except as provided in this resolution.
iii. The City Manager, as Executive Director of the Carlsbad Public Financing Authority, may authorize budget adjustments involving offsetting revenues and expenditures; the City Manager, as Executive Director of the Carlsbad Public Financing Authority, is authorized to increase an appropriation for a specific purpose where said appropriation is offset by unbudgeted revenue which is designated for said specific purpose.
iv. The City Manager, as Executive Director of the Carlsbad Public Financing Authority, may delegate any of the authority given to him or her under this resolution.
A. No expenditure of funds shall be authorized unless sufficient funds have been appropriated by the Board of Directors or designee, as described below.
6. That all outstanding encumbrances as of June 30, 2022, are continued into FY 2022 23 for such contracts and obligations.
ii. The City Manager, as Executive Director of the Carlsbad Public Financing Authority, may delegate the authority to make budget transfers and adjustments.
7. That all Capital Improvement Budgets remaining unexpended at June 30, 2022, are appropriated to FY 2022 23 for their respective projects.
i. The City Manager, as Executive Director of the Carlsbad Public Financing Authority, may authorize all transfers of funds from account to account within the same fund.
J 48
PASSED, APPROVED ANDADOPTED ataJoint Special Meetingofthe City Council ofthe City of Carlsbad, theBoardofDirectorsoftheCarlsbadMunicipalWaterDistrict, theBoardofDirectorsofthe Carlsbad Public Financing Authority, the City of Carlsbad Community Development Commission, and the City Council of the City of Carlsbad as Successor Agency to the Carlsbad Redevelopment Agency heldonthe 14thday ofJune,2022,bythe followingvote, to (SEAL)wit:

�FAVIOLA MEDINA, City ClerkServices Manager
J 49

AYES: NAYS: ABSENT: Blackburn, Bhat-Patel, Acosta, Norby. None.Hall.

RESOLUTION NO. 2022-136.
the Successor Agency finds that the proposed Operating Budget for the Agency and the Oversight Board approved enforceable debt obligations of the Redevelopment Obligation Retirement Fund are consistent with the Recognized Obligation Payment Schedule prepared by the Successor Agency and approved by the Oversight Board; and
J 50
A RESOLUTION OF THE CITY COUNCIL OF THE CITY OF CARLSBAD, CALIFORNIA, ACTING AS SUCCESSOR AGENCY FOR THE CARLSBAD REDEVELOPMENT AGENCY, ADOPTING THE FINAL OPERATING BUDGET OF THE SUCCESSOR AGENCY AND THE ENFORCEABLE DEBT OBLIGATIONS OF THE CITY OF CARLSBAD’S REDEVELOPMENT OBLIGATION RETIREMENT FUND FOR FISCAL YEAR 2022 23 AND ESTABLISHING CONTROLS ON CHANGES IN APPROPRIATIONS FOR BUDGET FUNDS
BE IT RESOLVED by the City Council of the City of Carlsbad, acting as Successor Agency for the Carlsbad Redevelopment Agency, as follows:
2. That certain documents now on file in the Office of the City Clerk of the City of Carlsbad, entitled “Fiscal Year 2022 23 Preliminary Operating Budget,” presented at the Joint Special Meeting on May 24, 2022 as Exhibit 1 to Item No. 8, as amended, if necessary, in accordance with Attachments A A3, B B2, C and D of Exhibit 4 to Item 7 presented at this Joint Special Meeting on June 14, 2022 are adopted as the final Operating Budget for the Successor Agency and the enforceable debt obligations of the City of Carlsbad’s Redevelopment Obligation Retirement Fund for FY 2022 23, along with any program
WHEREAS, public hearings have been held as necessary prior to the adoption of the final operatingNOW,budget.THEREFORE,
WHEREAS, the City Council of the City of Carlsbad, California has been designated as the Successor Agency for the Carlsbad Redevelopment Agency (Successor Agency) and, as such, is responsible for the administrative responsibilities required to complete the work of the former Carlsbad Redevelopment Agency and repay all enforceable debt obligations; and WHEREAS, the Successor Agency and the appointed Oversight Board have reviewed the proposed Operating Budget for the Successor Agency and previously approved the enforceable debt obligations to be repaid from the Redevelopment Obligation Retirement Fund for fiscal year (FY) 2022 23; andWHEREAS,
1. That the above recitations are true and correct.
A. No expenditure of funds shall be authorized unless sufficient funds have been appropriated by the Successor Agency or designee, as described below.
iii. The City Manager may authorize budget adjustments involving offsetting revenues and expenditures; the City Manager is authorized to increase an appropriation for a specific purpose where said appropriation is offset by unbudgeted revenue which is designated for said specific purpose and is approved in advance by the Oversight Board.
B. The Successor Agency must authorize any increase in the number of authorized permanent personnel positions above the level identified in the final budget. The City Manager may authorize the hiring of temporary or part time staff as necessary, within the limits imposed by the controls listed above and subject to the Operating Budget for the Successor Agency.
J 51
options and/or adjustments, if any, determined by the Successor Agency as set forth in the minutes of this Joint Special Meeting of June 14, 2022.
4. That the amount designated as FY 2022 23 Budget request in Attachment A to this Exhibit 8 is appropriated to the fund for which it is designated, and such appropriation shall not be increased except as provided in this resolution.
6. That all outstanding encumbrances as of June 30, 2022, are continued into FY 2022 23 for such contracts and obligations, as approved by the Oversight Board.
3. That the amounts reflected as estimated revenues for FY 2022 23 are adopted as the budgeted revenues for FY 2022 23.
ii. The City Manager may delegate the authority to make budget transfers and adjustments.
5. That the following controls are placed on the use and transfer of budget funds:
i. The City Manager may authorize all transfers of funds from account to account within the same fund.
PASSED, APPROVED AND ADOPTED at aJoint Special Meeting of the City Council of the City of Carlsbad,theBoardofDirectorsofthe Carlsbad MunicipalWaterDistrict,theBoardofDirectorsofthe Carlsbad Public Financing Authority, the City of Carlsbad Community Development Commission, and the City Council of the City of Carlsbad as Successor Agency to the Carlsbad Redevelopment Agency heldonthe 14th day of June,2022, by the followingvote, to wit:
J 52
AYES: NAYS: ABSENT: Blackburn, Bhat-Patel, Acosta, Norby. None.Hall.

�FAVIOLA MEDINA, City Clerk Services Manager (SEAL)

NOW,A.THEREFORE,
2. That the City Council of the City of Carlsbad, California, establishes and adopts the FY 2022 23 appropriation limit of $582,535,354 as computed in the attached and incorporated Attachment A.
RESOLUTION NO. 2022-137.
WHEREAS, Article XIIIB of the California State Constitution requires that governments annually establish a limit on the appropriation of proceeds of taxes commonly known as the “Gann Limit”; and WHEREAS, state law requires that this limit be presented to the governing body of each entity each fiscal year; WHEREAS,andthe
A RESOLUTION OF THE CITY COUNCIL OF THE CITY OF CARLSBAD, CALIFORNIA, ESTABLISHING THE FISCAL YEAR 2022 23 APPROPRIATION LIMIT AS REQUIRED BY ARTICLE XIIIB OF THE CALIFORNIA STATE CONSTITUTION AND STATE LAW
That the above recitations are true and correct.
BE IT RESOLVED by the City Council of the City of Carlsbad, California, as follows:1.
J 53
Gann Limit is based on a combination of a population factor and an inflation factor as outlined in Attachment A, attached and incorporated by reference; and WHEREAS, the City Council desires at this time and deems it to be in the best public interest to adopt the annual Gann Limit for fiscal year (FY) 2022 23 as listed in the attached and incorporated Attachment
J 54
PASSED, APPROVED ANDADOPTEDat aJoint Special Meetingof the City Council of the City of Carlsbad, theBoardofDirectorsoftheCarlsbadMunicipalWaterDistrict,theBoardofDirectorsofthe Carlsbad Public Financing Authority, the City of Carlsbad Community Development Commission, and the City Council of the City of Carlsbad as Successor Agency to the Carlsbad Redevelopment Agency heldon the 14thday ofJune,2022, bythefollowingvote, towit: ABSENT:AYES:NAYS: Blackburn, Bhat-Patel, Acosta, Norby. None.Hall.
,r!FAVIOLA MEDINA, City Clerk Services Manager (SEAL)


WHEREAS, the City Council of the City of Carlsbad, California has the authority to establish fees for city services;
WHEREAS, the City Council finds it necessary to recover the costs for city services; and WHEREAS, the City Council has held the necessary public hearing and allowed for public comment on the establishment said fees.
City Council believes it is necessary for the City Manager to have the authority to adjust the parks and recreation and library and arts program and classes fees from time to time to remain competitive and within the market pricing for like programs and classes; and
3. The City Council authorizes the City Manager or a designee to set parks and recreation and library and cultural arts program, rental, and class fees that are included in the Community Services Guide. The fees shall not exceed the fully burdened, including direct and indirect, costs of providing the program, rental, and class but shall be no less (except in the case of introductory, discount or promotional pricing) than the lowest fee charged for like kind programs or classes in similarly benchmarked Southern California cities.
J 55
That the above recitations are true and correct.
A RESOLUTION OF THE CITY COUNCIL OF THE CITY OF CARLSBAD, CALIFORNIA, ADOPTING CHANGES TO THE MASTER FEE SCHEDULE
2. That the changes to the Master Fee Schedule as shown in Attachment A are adopted.
NOW, THEREFORE, BE IT RESOLVED by the City Council of the City of Carlsbad, California, as
WHEREAS,andfrom time to time said fees are reviewed and evaluated to maintain an adequate fee structure recovering costs for city services; and
RESOLUTION NO. 2022-138.
4. The City Council authorizes the City Manager or a designee to change vehicle and traffic violation fees at the time, and by the same amount, as the state changes its portion of the fine Any changes to these fees will be made to the current Master Fee Schedule.
WHEREAS, the City Council has determined the cost of providing general and development related services;
follows:1.
WHEREAS,andthe
(SEAL) Blackburn, Bhat-Patel,Acosta, Norby. None.Hall.
,r!FAVIOLA MEDINA, City Clerk Services Manager

6. Per the contract with Republic Services, changes to the recycling and trash fees as shown in Attachment A shall become effective on July 1, 2022.
J 56
5. This resolution shall become effective on Sept. 1, 2022; not sooner than 60 days after adoption in accordance with California Government Code Section 66017 for development related service fees and development impact fees.

ABSENT:AYES:NAYS:
PASSED, APPROVED AND ADOPTED at a Joint Special Meeting of the City Council of the City of Carlsbad, the Board ofDirectors of the Carlsbad Municipal WaterDistrict, the Board ofDirectors of the Carlsbad Public Financing Authority, the City of Carlsbad Community Development Commission, and the City Council of the City of Carlsbad as SuccessorAgency to the Carlsbad Redevelopment Agency held on the 14th day of June, 2022, by the following vote, to wit:
J 57
RESOLUTION NO. 1674
WHEREAS, from time to time said fees are reviewed and evaluated to maintain an adequate fee structure recovering costs for district services; and WHEREAS, the Board of Directors has determined the cost of providing water services; and WHEREAS, the Board of Directors finds it necessary to recover the costs for water services; and WHEREAS, the Board of Directors has held the necessary public hearing and allowed for public comment on the establishment said fees.
2. That the changes to the Master Fee Schedule as shown in Attachment A are adopted.
3. This resolution shall become effective on Sept. 1, 2022; not sooner than 60 days after adoption in accordance with California Government Code Section 66017 for water fees.
�FAVIOLA MEDINA, City Clerk Services Manager
NAYS:AYES:ABSENT: Blackburn, Bhat-Patel, Acosta, Norby. Hall.None.
PASSED, APPROVED ANDADOPTED at aJointSpecial Meeting of the City Council of the City of Carlsbad, theBoard of Directorsof the Carlsbad Municipal WaterDistrict, the Board of Directors of the Carlsbad Public Financing Authority, the City of Carlsbad CommunityDevelopment Commission, and the City Council ofthe City ofCarlsbadas Successor Agency to theCarlsbadRedevelopment Agency held on the 14th day ofJune,2022, by the followingvote, to wit:
A RESOLUTION OF THE BOARD OF DIRECTORS OF THE CARLSBAD MUNICIPAL WATER DISTRICT, ADOPTING CHANGES TO THE MASTER FEE

1. That the above recitations are true and correct.
WHEREAS,SCHEDULEtheBoard of Directors of the Carlsbad Municipal Water District has the authority to establish fees for district services; and
NOW, THEREFORE, BE IT RESOLVED by the Board of Directors of the Carlsbad Municipal Water District, as follows:
NOW, THEREFORE, BE IT RESOLVED by the Community Development Commission of the City of Carlsbad, California, as follows:
Community Development Commission of the City of Carlsbad, California (Commission) has the authority to establish fees for housing services; and
RESOLUTION NO. 554.
J 58
1. That the above recitations are true and correct.
2. That the changes to the Master Fee Schedule as shown in Attachment A are adopted.
WHEREAS,SCHEDULEthe
A RESOLUTION OF THE COMMUNITY DEVELOPMENT COMMISSION OF THE CITY OF CARLSBAD, CALIFORNIA, ADOPTING CHANGES TO THE MASTER FEE
WHEREAS,andthe Community Development Commission has held the necessary public hearing and allowed for public comment on the establishment said fees.
WHEREAS, the Community Development Commission has determined the cost of providing housing services;
WHEREAS, from time to time said fees are reviewed and evaluated to maintain an adequate fee structure recovering costs for housing services; and
3. This resolution shall become effective on Sept. 1, 2022; not sooner than 60 days after adoption in accordance with California Government Code Section 66017 for housing fees.
WHEREAS,andthe Community Development Commission finds it necessary to recover the costs for housing services;
PASSED, APPROVED AND ADOPTED at a Joint Special Meeting of the City Council of the City of Carlsbad, the Board of Directors of the Carlsbad Municipal Water District, the Board of Directors of the Carlsbad Public Financing Authority, the City of Carlsbad Community Development Commission, and the City Council of the City of Carlsbad as Successor Agency to the Carlsbad Redevelopment Agency held on the 14th day of June, 2022, by the following vote, to wit:

J 59
AYES: NAYS: ABSENT: Blackburn, Bhat-Patel, Acosta, Norby. Hall. None.
SCOTT CHADWICK, Secretary {SEAL)

WHEREAS, the Encina Agreement requires approval for the budget of the Encina Wastewater Authority, or EWA, by the Member Agencies following the recommendation of the Joint Advisory Committee, or JAC; and
WHEREAS,and the Wastewater Fund is projected to have sufficient funds for the payments as they becomeNOW,due.
4. That the City Manager, or a designee, is authorized to approve appropriations to the EWA estimated budgets listed above based on the City of Carlsbad’s actual share of the EWA budget.
THEREFORE, BE IT RESOLVED by the City Council of the City of Carlsbad, California, as follows:1.
That the above recitations are true and correct.
WHEREAS, the City of Carlsbad is a Member Agency to the Encina Joint Powers Agreement (the Encina Agreement) entered into on July 13, 1961, for the acquisition, construction, ownership, operation and maintenance of the Encina Joint Sewer System; and
J 60
RESOLUTION NO. 2022-139.
WHEREAS, the City Council of the City of Carlsbad desires to approve said budget and provide for the payment of its share of such expenses in accordance with the allocation provided in the Encina Agreement;
2. That the City of Carlsbad’s estimated share of the FY 2022 23 Operating Budget of the EWA as approved by the JAC on April 27, 2022, in the amount of $4,558,061 for Wastewater Plant Operations, $1,461,581 for the Carlsbad Water Recycling Facility Operations, as described in Attachment A
A RESOLUTION OF THE CITY COUNCIL OF THE CITY OF CARLSBAD, CALIFORNIA, APPROVING THE CITY OF CARLSBAD’S SHARE OF THE FISCAL YEAR 2022 23 OPERATING AND CAPITAL BUDGETS OF THE ENCINA WASTEWATER AUTHORITY
3. That the City of Carlsbad’s estimated share of the FY 2022 23 Capital Budget of the EWA as approved by the JAC on April 27, 2022 in the amount of $6,367,800 for Wastewater Plant Capital and $366,000 for Carlsbad Water Recycling Facility Capital is approved, as described in Attachment A.
7. That the City Manager, or a designee, is authorized to make payment on behalf of the City of Carlsbad to EWA in accordance with the budget as approved by the JAC pursuant to the Encina Agreement.


J 61
AYES: NAYS: ABSENT: Blackburn, Bhat-Patel, Acosta, Norby.
5. That all outstanding operating encumbrances as of June 30, 2022 are continued into FY 2022 23 for such contracts and obligations.
6. That all Capital Improvement Program budget appropriations and outstanding encumbrances as of June 30, 2022 are continued into FY 2022 23 for such contracts and obligations.
PASSED, APPROVED AND ADOPTED at aJoint Special Meeting of the City Council of the City of Carlsbad, the Board of Directors of the Carlsbad Municipal Water District, the Board of Directors of the Carlsbad Public Financing Authority, the City of Carlsbad Community Development Commission, and the City Council of the City of Carlsbad as Successor Agency to the Carlsbad Redevelopment Agency held on the 14th day of June, 2022, by the following vote, to wit:
Hall. None.
� FAVIOLA MEDINA, City Clerk Services Manager (SEAL)
A RESOLUTION OF THE CITY COUNCIL OF THE CITY OF CARLSBAD, CALIFORNIA, DETERMINING THAT THE FY 2022 23 CAPITAL IMPROVEMENT PROGRAM BUDGET IS CONSISTENT WITH THE GENERAL PLAN AND APPLICABLE CLIMATE ACTION PLAN MEASURES AND ACTIONS
WHEREAS, the City Council also reviewed the FY 2022-23 Capital projects for consistency with applicable Climate Action Plan measures and actions; and
RESOLUTION NO. 2022-140.
b) The projects are consistent with applicable goals and policies of the Land Use and Community Design; Mobility; Open Space, Conservation, and Recreation; Sustainability Elements of the General Plan, as described in Attachment A.
J 62
a)findings:The projects are consistent with the goals and policies of the city's General Plan in that the projects are required to ensure the provision of adequate public facilities and services concurrent with or prior to need.
c) Specific projects are consistent with, and support Climate Action Plan greenhouse gas reduction measures and actions, as described in Attachment A.
BE IT RESOLVED by the City Council of the City of Carlsbad, California, as follows:
WHEREAS, the City Council of the City of Carlsbad, California has reviewed the Capital Improvement Program for FY 2022-23 and has held such public hearings as are necessary prior to adoption of the Capital Improvement Program Budget; and
WHEREAS, at said hearing, upon hearing and considering all testimony and arguments, if any, of all persons desiring to be heard, said City Council considered all factors relating to the City Council determination.NOW,THEREFORE,
1. That the above recitations are true and correct.
2. That based on the evidence presented at the hearing, the City Council determines that the Capital Improvement Program for FY 2022-23 is consistent with the General Plan based on the following
WHEREAS, on June 14, 2022, the City Council reviewed for consistency with the General Plan goals and policies for all Capital projects receiving an allocation of funds for FY 2022-23 pursuant to Carlsbad Municipal Code Section 2.24.065 (b); and
"NOTICE"
The time within which judicial review of this decision must be sought is governed by Code of Civil Procedure, Section 1094.6, which has been made applicable in the City of Carlsbad by Carlsbad Municipal Code Chapter 1.16. Any petition or other action seeking review must be filed in the appropriate court not later than the ninetieth day following the date on which this decision becomes final; however, if within ten days after the decision becomes final a request for the record is filed with a deposit in an amount sufficient to cover the estimated cost or preparation of such record, the time within which such petition maybe filed in court is extended to not later than the thirtieth day following the date on which the record is either personally delivered or mailed to the party, or his attorney of record, if he has one. A written request for the preparation of the record of the proceedings shall be filed with the City Clerk, City of Carlsbad, 1200 Carlsbad Village Drive, Carlsbad, CA 92008.


PASSED, APPROVED AND ADOPTED at a Joint Special Meeting of the Carlsbad City Council, Carlsbad Municipal Water District Board of Directors, Carlsbad Public Financing Authority Board of Directors, Community Development Commission, and City of Carlsbad as Successor Agency to the Redevelopment Agency, held on the 14th day of June, 2022, by the following vote to wit:
d) As required by the General Plan, the proposed improvements are consistent with the city's Growth Management Plan in that the projects ensure that the necessary improvements are provided for facilities maintenance, park development, sewer projects, and circulation systems, in accordance with the performance standards contained in the city's Growth Management regulations.3.This action is final as of the date this resolution is adopted by the City Council. The Provisions of Chapter 1.16 of the Carlsbad Municipal Code, "Time Limits for Judicial Review" shall apply:
ABSENT:AYES:NAYS: Blackburn, Bhat-Patel, Acosta, Norby. None.Hall.
J 63
.ftr-v FAVIOLA MEDINA, City Clerk Services Manager (SEAL)

J 64