
304600207 Prepared for Canterbury-Bankstown Council 22 March 2024
DraftFinalFlood Risk ManagementStudyandPlan Prospect Creek Sub-Catchments

Contact Information
Registered Name
Stantec Australia
ABN 95 001 145 035
Level 16 207 Kent Street Sydney NSW 2000
+61 2 9496 7868
+61 7 3369 9722
Author(s):

Document History
Draft Final Flood Risk Management Study and Plan Prospect Creek Sub-Catchments
Document Information
Project Name Prospect Creek SubCatchments
File Reference 304600207_R007_Prospect_ Ck_Sub_Draft_Final FRMS&P.docx
Job Reference 304600207
Date 22 March 2024
Version Number V1
© Stantec. Copyright in the whole and every part of this document belongs to Stantec and may not be used, sold, transferred, copied or reproduced in whole or in part in any manner or form or in or on any media to any person other than by agreement with Stantec
This document is produced by Stantec solely for the benefit and use by the client in accordance with the terms of the engagement. Stantec does not and shall not assume any responsibility or liability whatsoever to any third party arising out of any use or reliance by any third party on the content of this document
Our report is based on information made available by the client. The validity and comprehensiveness of supplied information has not been independently verified and, for the purposes of this report, it is assumed that the information provided to Stantec is both complete and accurate. Whilst, to the best of our knowledge, the information contained in this report is accurate at the date of issue, changes may occur to the site conditions, the site context or the applicable planning framework. This report should not be used after any such changes without consulting the provider of the report or a suitably qualified person.
304600207 | 22 March 2024 ii
Phone
Fax
Prepared for Canterbury-Bankstown
Australia www.stantec.com
Council
Martin Griffin Group Leader, Water Resources NSW & ACT Effective Date 22/03/2024
Version Effective Date Description of Revision Prepared by Reviewed by 1 28/03/2022 Interim Report 1 Martin Griffin CBC & NSW DCCEEW 2 19/09/2022 Draft Interim Report 2 Martin Griffin CBC & NSW DCCEEW 3 19/02/2023 Draft Interim Report 3 Martin Griffin CBC & NSW DCCEEW 4 06/07/2023 Draft FRMS&P Martin Griffin CBC & NSW DCCEEW 5 16/08/2023 Draft Final FRMS&P Martin Griffin CBC, NSW SES, NSW DCCEEW & CBC FRMC 6 23/09/2023 Draft Final FRMS&P for Martin Griffin CBC, NSW SES, NSW DCCEEW & CBC FRMC 7 05/03/2024 Draft Final FRMS&P Martin Griffin CBC, LEMO, NSW SES, NSW DCCEEW & CBC FRMC 8 22/03/2024 Draft Final FRMS&P for Public Exhibition Martin Griffin CBC, LEMO, NSW SES, NSW DCCEEW & CBC FRMC

Foreword
The primary objective of the NSW Flood Prone Land Policy 2021 is to reduce the impact of flooding and flood liability on communities and individual owners and occupiers of flood prone property, and to reduce private and public losses resulting from floods, utilising ecologically positive methods wherever possible.
The previous policy formed part of the New South Wales (NSW) Floodplain Development Manual (FDM) in 2005 Recently, two changes have occurred in flood risk management in NSW:
> The 2021 Flood Prone Land Package Update was released in July 2021. The Flood Prone Land package included a new planning direction, planning circular, guideline, standard flood-related Local Environment Plan (LEP) instruments, and several planning legislation changes.
> The finalised and gazetted Flood Risk Management (FRM) Manual was adopted on 30 June 2023 The Manual replaces the FDM 2005 and a number of previous technical guides. The manual provides advice to local councils on the management of flood risk in their local government areas through the flood risk management framework and flood risk management process. This update builds on the 2005 manual and guides. It considers lessons learnt from floods and the application of the flood risk management process and manual since 2005. It considers a range of work on managing natural hazards across government, including relevant national and international frameworks, strategies and best practice guidance. Accompanying the manual is eight FRM Guidelines that comprise a new toolkit to provide guidance for local councils and their consultants.
Under the 2021 policy, councils are primarily responsible for managing flood risk to reduce the risk to life, property damage and other impacts in their local government areas. The State Government subsidises flood management measures to alleviate existing flooding problems and provides specialist technical advice to assist Councils in the discharge of their flood risk management responsibilities. The Commonwealth Government also assists with the subsidy of floodplain modification measures. The new policy identifies the following flood risk management ‘process’ for the identification and management of flood risks:
1. Data Collection - Aims to gather the information needed to support the study being undertaken
2. Flood Study - Aims to define flood behaviour in sufficient detail to support the understanding and management of flood risk
3. Flood Risk Management Study (FRMS) - Provides the basis for examining and recommending FRM measures to manage risks to the existing and growing community, people and built environment. The measures aim to limit the residual flood risk to the community and how this may change over time.
4. Flood Risk Management Plan (FRMP) - Builds on the recommendations of the FRM study by clearly outlining council’s decision on how it intends to effectively manage flood risk in the study area
This Prospect Creek Sub-Catchments Flood Risk Management Study and Plan (FRMS&P) falls within steps 3 and 4 in the FRM process and has been developed from the previous four sub-catchment Flood Studies completed between 2012 and 2014 An illustration of the FRM process from the FRM Manual is shown below. Beyond the FRM process, councils must also implement and review and update the studies.

Draft Final Flood Risk Management Study and Plan Prospect Creek Sub-Catchments 304600207 | 22 March 2024 iii

Executive Summary
Stantec Australia Pty Ltd (formerly Cardno) was commissioned by Canterbury-Bankstown Council (‘Council’, or CBC) to undertake a Flood Risk Management Study and Plan (FRMS&P) for the Prospect Creek SubCatchments Study Area. The study area consists of the catchment of Prospect Creek that lies within the Canterbury-Bankstown Council Local Government Area (LGA) divided into four sub-catchments; Georges Hall, Lansdowne, Miller Road and Villawood.
Community Consultation
Consultation with the community and stakeholders is an important component in the development of a Flood Risk Management Study and Plan. Consultation provides an opportunity to collect feedback and observations from the community on problem areas and potential flood risk management measures. It also provides a mechanism to inform the community about the current study and flood risk within the Study Area and seeks to improve their awareness and readiness for dealing with flooding.
The consultation strategy has been divided into two key sections:
> Consultation in FRMS&P development: This will occur during Phases A to E of the project (refer to Section 1.4 for phase descriptions) and will involve both informing the community and stakeholders of the project and gathering information on existing flooding issues and suggestions for flood risk management options.
> Public exhibition of draft FRMS&P: This will occur in Phase G of the project, with comments sought from the community and stakeholders on the draft FRMS&P report with this input to be reviewed and incorporated into the final FRMS&P.
Across the initial consultation period there were approximately 37 recorded responses through online survey (27 respondents), Have Your Say photo and video uploads (5 different participants), email responses submitted to Council (5 respondents), and two in-person information sessions (30 attendees). Across these 67 total engagements, there were often several engagements for some households, most commonly residents attending in-person sessions often completed another form of response such as an online survey The majority of engagements were in relation to Villawood (17 properties) and Georges Hall sub-catchments (10 properties). With respect to Have Your Say outcomes from the initial consultation, there were 476 views of the project page, initiated by 246 unique visitors. The total viewing time of project information was over 11 hours.
An online survey was conducted from the Have Your Say page. From the survey response outcomes, the key outcomes are:
> Based on average score, the most preferred option is flood forecasting and warning systems, followed by flood education programs both non-structural options.
> Based on average score, the highest ranked structural option was increasing stormwater channel sizes, followed by increasing pipe / culvert / bridge sizes, and then road raising, levees and detention basins.
> Increasing stormwater channel size and increasing pipe / culvert / bridge sizes both were noted to be potentially polarising in the community, with seemingly strong support and opposition for both, though on balance there is more support than opposition resulting in them being the 3rd and 4th most preferred based on average scores.
> Conversely, flood forecasting / warning and flood education programs had less top priority scores but there is less opposition to these options explaining why on average they are the highest ranked two options.
In terms of least preferred options, on average score voluntary purchase in both its listed forms are in the bottom three options, along with rainwater tanks and rainwater harvesting
Impact of Flooding
The number of flood affected private / developed properties for the existing conditions for all design flood events are summarised in the below table. In the PMF event, there are a total of 2,667 flood affected properties, or 35.5% of the total 7,502 properties in the study area. In the 1% AEP the total number of affected properties is 1,567, or 21% of all private and developed properties. The majority (over 60%) of flood affected properties across the four sub-catchments are located within the Villawood sub-catchment.
Draft Final Flood Risk Management Study and Plan Prospect Creek Sub-Catchments 304600207 | 22 March 2024 iv

With respect to economic impacts of flooding in the study area, the Average Annual Damages (AAD) and damage totals for five design flood events in summarised in the following table. The AAD for Prospect Creek sub-catchments is over $93.7 million. Nearly half (49%) of this AAD is a result of the most frequent 20% AEP event, with the next most frequent event, the 5% AEP contributing 32% of the AAD. The less frequent events, the 2% and 1% AEP and PMF provide between 3 – 8% of AAD contribution. Though these events result in far higher flood damage totals, particularly the PMF event, their relatively low likelihood means they contribute less to the AAD.
For 20% AEP damages, the vast majority of damages are within the Villawood sub-catchment (91%) particularly within the low-lying industrial precinct, and within Georges Hall in the overland flowpaths through the sub-catchment.
Flood Emergency Response Review
Based on the detailed review of flood emergency response provisions for the Prospect Creek SubCatchments, it is unlikely that SES doorknocked evacuation will be able to effectively evacuate residents prior to flooding. From this review, a number of potential measures have been identified that could improve flood emergency response potential for the study area:
> Use of alternative flood warning systems: There are noted difficulties of flood warning systems in flash flooding environments. A number of alternatives may be considered for flood warning systems may be developed for the Study Area, particularly the emergency response hotspot areas.
> Self-managed evacuation - An alternative to emergency service assisted evacuation is self-managed evacuation. This describes where people make their own decision to evacuate earlier and move to alternate accommodation, using their own transport. The advantage of this approach would be that people can evacuate more quickly than emergency service assisted evacuation, and as a result reduces the strain on emergency services. However, self-managed evacuation can also pose a risk if not conducted in an appropriate way. Residents could place themselves at higher risk for example if they evacuate to a location which is even more flood affected, drive through flood waters, or could increase traffic congestion if the wrong route is selected.
> Improved flood awareness - For the evacuation timeline model, significant delays are expected as a result of a lack of community awareness in both acceptance and lag time. A comprehensive flood awareness program for the Study Area, educating residents of the seriousness of the flood risk and the flash flooding nature of the catchment could drastically improve the evacuation timeline.
> For the Georges River floodplain portions of Georges Hall and Lansdowne, particularly those that are also affected by flash flooding from the local catchment, specific evacuation plans may be considered.
Draft Final Flood Risk Management Study and Plan Prospect Creek Sub-Catchments 304600207 | 22 March 2024 v Subcatchment Total Properties Base Case Flood Affected Property 20% AEP 5% AEP 2% AEP 1% AEP PMF Georges Hall 977 115 160 205 228 337 Lansdowne 1,234 144 183 213 228 336 Miller Road 569 106 122 136 140 179 Villawood 4,893 733 868 924 978 1,829 Total 7,502 1,092 1,326 1,471 1,567 2,667
AEP Probability Total Damages AAD Contribution AAD Contribution % 50% 0.50 $135,587,258 20% 0.20 $171,001,280 $45,988,281 49% 5% 0.05 $232,049,763 $30,228,828 32% 2% 0.02 $265,376,037 $7,461,387 8% 1% 0.01 $301,399,554 $2,833,878 3% PMF 0.0000001 $1,142,215,120 $7,218,001 8% Total AAD $93,730,375

Flood Planning Review
The outcomes of the flood planning review were as follows:
> Compared to the requirements for planning proposals outlined within the 2021 Flood Prone Land Policy Update, the current development controls are generally in agreement.
> Compared to the Flood Planning Constraints Categories (FPCC) approach from the 2023 Flood Risk Management (FRM) Manual Guide FB01, current Flood Risk Precincts of the Development Control Plan (DCP) are generally aligned however potentially adopting FPCC offers some potential benefits. These benefits include splitting the current High risk precinct into FPCC1 and FPCC2 where development can be precluded in FPCC1 and more tailored controls can be applied to FPCC2 areas.
> Compared to the requirements for Flood Impact Risk Assessment (FIRA) from the 2023 FRM Manual Guide LU01. Generally, the current development controls are in agreement with the proposed requirements in the guide with some exceptions:
- The current controls do not require consideration of climate change in assessments.
- The current controls do not specify flood impacts be considered not just for flood levels but also duration, velocity, evacuation, flood function or hazard categorisation.
- The current controls do not specifically require a consideration of residual risk of proposed developments to confirm if flood risk is lower than existing based on proposed risk management measures for developments.
> This flood control matrix is commonly adopted by Council’s throughout the Sydney region. The matrix approach offers a suitable platform to be able to apply development controls specific to development types and flood affectation. In doing so it allows for a suitable merit-based approach to development consideration.
> The decision-making flowchart shown in Section 7.1 of the DCP is a useful resource to guide applicants through the process.
> The current format of the DCP allows for some confusion regarding which parts of former Bankstown LGA apply for Georges River, or catchments with stormwater flooding. A map in the DCP more clearly delineating the areas of applicability for the two matrices could be beneficial.
> For properties in the lower Georges Hall and Lansdowne that are affected by both Georges River and overland flooding from the sub-catchment, the current expectation would be that they need to address controls from both matrices. Given the likely overlap in controls between the two matrices a review is recommended to confirm if only one of the matrices can be applicable to suitably address flood risk from both forms of flooding.
Ultimately the current development controls are considered suitable, and generally in accordance with recent guidance both within the 2021 Flood Prone Land Policy Update and the 2023 FRM Manual Guide LU01. However, there are some minor alterations listed in the bullet points above that may improve applicant’s understanding of the controls and provide a more comprehensive assessment of flood risk in future development submissions.
Flood Risk Management Options Background
Three main types of Flood Risk Management (FRM) options were considered for Prospect Creek SubCatchments:
> Flood modification measures – Flood modification measures are options aimed at preventing / avoiding or reducing the likelihood of flood risks. These options reduce the risk through modification of the flood behaviour in the catchment.
> Property modification measures – Property modification measures are focused on preventing / avoiding and reducing consequences of flood risks. Rather than necessarily modify the flood behaviour, these options aim to modify properties (both existing and future) so that there is a reduction in flood risk.
> Emergency response modification measures – Emergency response modification measures aim to reduce the consequences of flood risks. These measures generally aim to modify the behaviour of people during a flood event.
Draft Final Flood Risk Management Study and Plan Prospect Creek Sub-Catchments 304600207 | 22 March 2024 vi

Creek Sub-Catchments
The assessment of FRM options should consider people in the community, the economy, social and cultural aspects, services to the community and the natural environment. Relating to the development of FRM options, the following stages were applied in this project:
> Option identification and preliminary option assessment and optimisation – The identification of an inclusive range of FRM options to address local or broad FRM issues for the existing community and new development. Having identified the FRM issues to address and an inclusive range of FRM options worthy of consideration, the viability of these options needed to be tested to determine if they warranted more detailed assessment.
> Detailed option assessment – Detailed assessment and subsequent optimisation of FRM options and packages of options needs to consider their costs, benefits and disbenefits in managing risk. The detailed assessment includes flood modelling of options, damages assessment of option benefits, preliminary costing and a Multi-Criteria Assessment (MCA) that considers a broad range of factors quantitatively or qualitatively.
> Recommendation in FRM studies and decision-making in FRM plans which is summarised in the implementation program in Section 11
Detailed Assessment of Options
Following the preliminary option assessment, eighteen (18) options were selected for detailed assessment, with the final options listed in the table below.
Georges Hall FG4 – Rex Road Bunds
Georges Hall FG5 – Harden Reserve Basin Retrofit
Georges Hall FG7 – Amaroo Ave Drainage Upgrade
Lansdowne FL2 – Wilton Reserve Detention Basin
Lansdowne FL3 – Jacaranda Drive Drainage Upgrade
Flood Modification (FM)
Property Modification (PM)
Emergency Response Modification (EM)
Miller Road FM1 - Miller Road Bunds
Villawood FV1 – Alcoomie Reserve Detention Basin
Villawood FV3 – Tucker Reserve Detention Basin
Villawood FV5 – Orchard Road Drainage Upgrade
Villawood FV6 – Sir Thomas Mitchell Drive Channel Upgrade
Villawood FV8 – Christina Road Channel Upgrade
All subcatchments
All subcatchments
PM1 – Voluntary House Raising
PM3 – Voluntary Purchase
EM1 – Flood Prediction and Warning
EM2 – Review of Local Flood Planning and Info Transfer to NSW SES
EM3 – Community Flood Awareness
EM5 – Flood Markers and Signage
EM6 – Flood Data and Debrief
The detailed assessment of these 18 FRM options was conducted including:
> Hydraulic modelling of five design events – 20%, 5%, 2%, 1% AEP and PMF (for FM options),
> Flood damages benefits assessment (for FM options) involving adopting water level impact results compared to the existing flood damages to determine the potential benefits of the option in the 5 modelled events. The AAD of damage benefits were calculated and the Net Present Worth (NPW) of benefits for all options were calculated assuming a 7% discount rate and 50 year life cycle for the option.
Draft Final Flood Risk Management Study and Plan Prospect
304600207 | 22 March 2024 vii
Option Type Sub-Catchment Option ID

> Cost estimation was conducted for all options for both capital and ongoing / maintenance costs. The process for capital cost estimation was based on quantities for construction estimated from preliminary design for the 11 FM options as they were modelled in the TUFLOW model. Unit rates were initially estimated by Stantec and reviewed and updated by Council staff in some instances to match current cost rates for the local area. A 50% contingency has been applied to all estimates given uncertainty on eventual design refinement and quantities. For other measures (EM and PM), costs were estimated only on the basis of cost to implement, and were done for the purpose of comparison in the multi-criteria assessment. The total cost of the options was calculated for Net Present Worth using a 7% discount rate and an implementation period of 50 years
> Benefit Cost Ratio - The economic evaluation of each option was performed by considering the reduction in the amount of flood damages incurred for the design events and then comparing this value with the cost of implementing the option. The benefit-cost ratio provides an insight into how the damage savings from a measure relate to its cost of construction and maintenance. Where the benefit-cost ratio is greater than one (BCR >1) the economic benefits are greater than the cost of implementing the measure. For all FM options it is possible to quantify, at least at a high-level both damage benefits and costs of implementation for each option, therefore a BCR is able to be calculated. For PM and EM options, the damage benefits are not easily quantifiable, though there would be some economic benefits of these options in the form of reduced risk to life and resultant reduction in flood damage for loss of life. Therefore in lieu of any damage benefit information, the economic analysis of these options has assumed that BCR is 1.0. The Benefit Cost Ration outcomes for all detailed options have been summarised in the table below.
*In lieu of benefit values for PM and EM options, due to flood risk reduction BCR value assumed to be 1.0
Multi-Criteria Assessment
To assist Council in identifying the FRM options that provide the most benefits for the community, all options need to be compared against each other based on factors relevant to the study area. Evaluating what constitutes an appropriate strategy for floodplain management is a significant analytical and policy challenge. Such challenges have led to the exploration of alternative policy analysis tools, one being Multi Criteria
Draft Final Flood Risk Management Study and Plan Prospect Creek Sub-Catchments 304600207 | 22 March 2024 viii
Option NPW of AAD Reduction Benefits NPW of Cost of Implementation of Option Benefit Cost Ratio FG4 – Rex Road Drainage Upgrade $134,374 $220,857 0.61 FG5 – Harden Reserve Basin Retrofit $2,645,650 $1,149,066 2.30 FG6 – Amaroo Ave Drainage Upgrade $2,925,492 $2,670,405 1.10 FL2 – Wilton Reserve Detention Basin $2,167,619 $2,167,962 1.00 FL3 – Jacaranda Drive Drainage Upgrade $3,157,970 $1,679,956 1.88 FM1 - Miller Road Drainage Upgrade $858,745 $1,396,298 0.62 FV1 – Alcoomie Reserve Detention Basin $475,296 $3,385,648 0.14 FV3 – Tucker Reserve Detention Basin $4,681,612 $2,837,287 1.65 FV5 – Orchard Road Drainage Upgrade $5,534,432 $7,644,704 0.72 FV6 – Sir Thomas Mitchell Drive Channel Upgrade $834,180 $1,347,827 0.62 FV8 – Christina Road Channel Upgrade $3,098,476 $3,591,953 0.86 PM1 – Voluntary House Raising Scheme N/A* $155,751 1.0* PM3 – Voluntary Purchase Scheme N/A* $155,751 1.0* EM1 – Flood Prediction and Warning N/A* $889,506 1.0* EM2 – Review of Local Flood Planning and Info Transfer to NSW SES N/A* $125,751 1.0* EM3 – Community Flood Awareness N/A* $709,506 1.0* EM5 – Flood Markers and Signage N/A* $172,151 1.0* EM6 – Flood Data and Debrief N/A* $251,502 1.0*

Assessments (MCA). The goal of MCA is to attempt to directly incorporate multiple values held by community and stakeholders into the analysis of management alternatives while avoiding the reduction of those values into a standard monetary unit. In doing so, one can consider different FRM options in the context of economic criteria as well as other criteria such as social, or environmental aspects. Community and stakeholders can also assign explicit weights to those values to reflect their preferences and priorities. Therefore, MCA provides opportunities for the direct participation of community and stakeholders in the analysis.
An MCA approach has been used for the comparative assessment of all options identified. Each option is given a score according to how well the option meets specific considerations. In order to keep the scoring system simple a framework has been developed for each criterion.
The selection of criteria and weighting has been completed by involving the FRM committee and its technical working group (TWG). This process was conducted with a group of project stakeholders in a session led by NSW Department of Climate Change, Energy, the Environment and Water (DCCEEW) representatives on 6 December 2022. In total, 24 preliminary criteria were provided to the stakeholders to score in terms of importance from 1 (least) to 5 (most important). Stakeholders included Council staff, NSW SES, and local resident representatives from the FRM Committee. In total, criteria scoring was received from 10 project stakeholders. The TWG reviewed the 24 preliminary criteria and were able to condense these into ten (10) final criteria (four economic, four social and two environmental).
A scoring system was established for each criteria with scores ranging from +2 for options that represented a significant improvement on existing conditions for any given criteria, to -2 for options that represented a significant worsening of existing conditions. The scoring system for all 10 criteria are summarised in the table below. It is noted that for two criteria (Benefit-Cost Ratio and Reduction in Risk to Property) scoring systems was based on quantifiable assessment outcomes, for all other criteria scoring was more subjective.
The highest scoring options typically fall into one of two categories:
> Relatively cost-effective flood modification (FM) options that provide significant flood risk reduction benefits. Examples are FG5 Harden Reserve Basin retrofit, FV3 Tucker Reserve detention basin and FL3 Jacaranda Drive drainage upgrade.
> Emergency response modification options (EM) which offer significant flood risk reduction with relatively minor cost. Five of the top 8 MCA scoring options are EM options.
The lowest scoring options typically fall into one of two categories as well:
> High-cost flood modification (FM) options in the lower Villawood industrial precinct that provide relatively minor flood risk benefits. Examples are FV8 Christina Road channel upgrade and FV6 Sir Thomas Mitchell Drive Channel Upgrade
> Property Modification (PM) options that have low community support and represent significant cost for only localised flood risk benefit. These are PM1 Voluntary House Raising and PM3 Voluntary Purchase Implementation Plan
The list of recommended management options has been transformed into an implementation plan provided in the table below. It lists the following information relevant to the implementation of each adopted FRM option:
> Type and sub-catchment location of option and Multi-Criteria Assessment score;
> The priority for implementation (high, medium, or low) and rank as an outcome of the FRMS&P;
> An estimate of implementation costs including capital and ongoing costs per annum;
> Potential funding mechanism or organisation; and
> Required economic assessment level during Investigation and Design (I&D) stage.
The flood risk management options identified in the table represent a capital outlay of approximately $27.5M, with the flood modification options making up $27.0M of this cost. High priority options have combined capital costs of $5.5M. The capital costs of VP and VHR options are for program establishment tasks only.
It is noted that a specific timeframe for the implementation plan has not been explicitly identified. Experience with these types of plans has identified that the works are undertaken when and as funding becomes available, as well as when various opportunities might arise specifically for an option
Draft Final Flood Risk Management Study and Plan Prospect Creek Sub-Catchments 304600207 | 22 March 2024 ix

Draft Final Flood Risk Management Study and Plan Prospect Creek Sub-Catchments 304600207 | 22 March 2024 x Option ID Option Type SubCatchment MCA Score Option Rank Implementation Priority Capital Costs (excl. GST) Ongoing Costs (p.a excl. GST) Economic Assessment Level for I&D FG5 – Harden Reserve Basin Retrofit Flood Modification (FM) Georges Hall 1.11 1 High $1,038,315 $7,500 Level 2 (Detailed damages) EM5 – Flood Markers and Signage Emergency Response (EM) All subcatchments 0.99 2 High $150,000 $1,500 Level 1 (FRMS&P) FV3 – Tucker Reserve Detention Basin Flood Modification (FM) Villawood 0.96 3 High $2,704,386 $9,000 Level 2 (Detailed damages) FL3 – Jacaranda Drive Drainage Upgrade Flood Modification (FM) Lansdowne 0.94 4 High $1,569,205 $7,500 Level 2 (Detailed damages) EM3 – Community Flood Awareness Emergency Response (EM) All subcatchments 0.90 5 High $45,000 $45,000 Level 1 (FRMS&P) EM2 – Review of Local Flood Planning and Info Transfer to NSW SES Emergency response (EM) All subcatchments 0.87 6 High $15,000 $7,500 Level 1 (FRMS&P) EM1 – Flood Prediction and Warning Emergency response (EM) All subcatchments 0.49 7 Medium $225,000 $45,000 Level 1 (FRMS&P) EM6 – Flood Data and Debrief Emergency response (EM) All subcatchments 0.49 8 Medium $30,000 $15,000 Level 1 (FRMS&P) FG7 – Amaroo Ave Drainage Upgrade Flood Modification (FM) Georges Hall 0.48 9 Medium $2,559,653 $7,500 Level 2 (Detailed damages) FM1 - Miller Road Drainage Upgrade Flood Modification (FM) Miller Road 0.43 10 Medium $1,285,546 $7,500 Level 2 (Detailed damages) FG4 – Rex Road Drainage Upgrade Flood Modification (FM) Georges Hall 0.32 11 Medium $209,781 $750 Level 1 (FRMS&P) FV1 – Alcoomie Reserve Detention Basin Flood Modification (FM) Villawood 0.22 12 Medium $3,252,747 $9,000 Level 2 (Detailed damages) FL2 – Wilton Reserve Detention Basin Flood Modification (FM) Lansdowne 0.21 13 Medium $2,035,061 $9,000 Level 2 (Detailed damages) FV5 – Orchard Road Drainage Upgrade Flood Modification (FM) Villawood 0.18 14 Medium $7,533,953 $7,500 Level 3 (Detailed damages and costs) PM1 – Voluntary House Raising Property Modification (PM) All subcatchments -0.02 15 Low $45,000 $7,500 Level 1 (FRMS&P) PM3 – Voluntary Purchase Property Modification (PM) All subcatchments -0.31 16 Low $45,000 $7,500 Level 1 (FRMS&P) FV8 – Christina Road Channel Upgrade Flood Modification (FM) Villawood -0.39 17 Low $3,481,201 $7,500 Level 2 (Detailed damages) FV6 – Sir Thomas Mitchell Drive Channel Upgrade Flood Modification (FM) Villawood -0.41 18 Low $1,303,526 $3,000 Level 2 (Detailed damages) Total $27,528,374 $204,750

Draft Final Flood Risk Management Study and Plan Prospect Creek Sub-Catchments 304600207 | 22 March 2024 xi Table of Contents Forewordiii Executive Summary iv 1 Introduction 1 1.1 Study Context 1 1.2 Study Objectives 2 1.3 Flood Risk Management Principles 3 1.4 Project Summary 3 2 Study Area Description 6 2.1 Catchment Background 6 2.2 Flood Affectation 7 2.3 Topography 9 2.4 Soils 9 2.5 Threatened Flora and Fauna 13 2.6 Heritage 16 2.7 Demographic Profile 18 2.8 Water Drainage Assets 18 3 Review of Available Data 21 3.1 Sub-Catchment Flood Studies 21 3.2 Other Flood Studies 23 3.3 Site Visits 24 3.4 Floor Level Survey 25 3.5 GIS Data 28 4 Consultation 29 4.1 Consultation Process 29 4.2 Consultation Plan and Engagement Techniques 29 4.3 Council Engagement 30 4.4 Flood Risk Management Committee 30 4.5 Stakeholder Engagement 31 4.6 Initial Consultation 31 4.7 Public Exhibition Period 35 5 Flood Study Model Review and Update 36 5.1 Updated Base Case Model Set-up 36 5.2 Updated Base Case Model Results 39 5.3 Climate Change Assessment 42 6 Flood Planning Review 45 6.1 Flood Affected Properties 45 6.2 Relative Flood Risk for Development Types 46 6.3 Current Land Use Zoning 47

Draft Final Flood Risk Management Study and Plan Prospect Creek Sub-Catchments 304600207 | 22 March 2024 xii 6.4 Future Development Potential in Flood Affected Land 47 6.5 Flood Related Development Controls 52 7 Economic Impact of Flooding 60 7.2 Input Data 60 7.3 Flood Damages Methodology 62 7.4 Flood Damages Outcomes 65 8 Flood Emergency Response Review 68 8.1 Flood Emergency Management Documentation 69 8.2 Guidance on Emergency Response in Flash Flooding 70 8.3 Emergency Management Locations 71 8.4 Flood Warning Systems 75 8.5 Evacuation Timeline 77 8.6 Shelter-in-Place Potential 83 8.7 Flood Information to Support NSW SES 84 8.8 Potential Improvements to Flood Emergency Response 89 9 Flood Risk Management Options 90 9.1 Background 90 9.2 Flood Risk Management Measures 91 9.3 Comprehensive List of Flood Modification Options 91 9.4 Preliminary Flood Modification Options 92 9.5 Other Preliminary Options 93 9.6 Selection of Preliminary Options for Detailed Assessment 94 10 Detailed Assessment of Options 95 10.1 Options for Detailed Assessment 95 10.2 Flood Modification Options 95 10.3 Property Modification Options 99 10.4 Emergency Response Modification Options 103 10.5 Cost Estimation 107 10.6 Benefit-Cost Ratio 109 10.7 Multi-Criteria Assessment 110 11 Implementation of Options 114 11.1 Steps to Implementation 114 11.2 Economic Assessment Framework for Options 114 11.3 Funding Mechanisms for FRM Options 115 11.4 Ranking and Prioritisation of Options 116 11.5 Implementation Plan 116 12 Conclusions & Next Steps in Study 118 13 References 119

Appendices
Appendix
Appendix B
Appendix C
Appendix
Appendix
Appendix
Appendix
Appendix
Table
Table 4-2
Table 5-1 Proposed Downstream Flood Event Coincidence Georges River Flood Levels (in m AHD) for Georges Hall and Lansdowne Sub-Catchment Base Case Models Compared to Previous Flood Study
Table 5-2 Comparison of 1% and 20% AEP Peak Flow Results for Base Case and Flood Study Models for
Draft Final Flood Risk Management Study and Plan Prospect Creek Sub-Catchments 304600207 | 22 March 2024 xiii
Consultation
A
Materials
Base
Case Model Updates
Base
Case Flood Maps
D Climate Change Impact Maps
E Emergency Response Maps
F Site Visit Outcomes and Preliminary Options Summary
G Preliminary Options Assessment
H MCA Option Scoring Outcomes Tables
2-1 Details of the Prospect Creek Sub-catchments 6
Acid Sulfate Soil Land Classes (Source: Bankstown
2015) 11
Species with Over 20 Sightings in the Vicinity of the Study Area and Conservation Status 14 Table
Number
for
Owner
Drainage Type 19
Summary
24
Engagement Techniques 29
Table 2-2
LEP
Table 2-3
2-4
of Drainage Sections
Each
and
Table 3-1
of Flood Related Studies for Prospect Creek and Georges River Mainstream Floodplains
Table 4-1 Consultation Plan and Proposed
35
Online Survey Responses for Preferred Flood Risk Management Options Ranked from Most to Least Preferred
38
Models
Four Sub-Catchments (in m3/s) 40 Table 5-3 Comparison of 1% AEP Peak Flow Results for Base Case and Climate Change Models for SubCatchments (in m3/s) 43 Table 6-1 Flood Affected Property Numbers for Private and Developed Properties (Excluding Parkland Sites) for All Design Flood Events for Base Case Flood Extents 45 Table 6-2 Flood Affected Property Numbers for Private and Developed Properties for Base Case Flood Extents Compared to Previous Flood Study Extents 45
6-3 Relative Flood Risk & Vulnerability of Land Uses for the Same Flood Exposure (Source: NSW DCCEEW, FRM Guide FB01) 46 Table 6-4 Planning Proposal Requirements and Relevance to Prospect Creek Sub-Catchments 48 Table 6-5 Typical considerations when assessing impacts due to development (Source: NSW DCCEEW, LU01 Guide) 57 Table 6-6 Typical measures to minimise impacts due to development (Source: NSW DCCEEW, LU01 Guide) 58 Table 7-1 Types of Flood Damages 60 Table 7-2 Existing Total Damages Summary for Design Flood Events 66
7-3 Average Annual Damage Summary for Design Flood Event Contributions 67
Table
Table

Draft Final Flood Risk Management Study and Plan Prospect Creek Sub-Catchments 304600207 | 22 March 2024 xiv Table 8-1 Hazard and Risk Summary for Flooding Types (Source: NSW SES, Local EMPLAN) 70 Table 8-2 Flood Affected Properties and Buildings for the Emergency Response Hotspots 87 Table 9-1 Flood Risk Management Alternatives (Source: SCARM, 2000) 90
9-2 Comprehensive List of Flood Modification Options by Type and Sub-Catchment 91 Table 9-3 Summary of Preliminary Priority for Flood Modification Options by Sub-Catchment (Medium / High) Carried into Preliminary Assessment and Modelling 92 Table 10-1 Description of Options for Detailed Assessment 95 Table 10-2 Description of Options for Detailed Assessment 96 Table 10-3 Reduction in Flood Damages and AAD Associated with each FM Option 99 Table 10-4 Summary of Key Outcomes for VHR Eligibility Review for Study Area 100
10-5 Summary of Key Outcomes for VP Eligibility Review for Study Area 102 Table 10-6 Cost Estimates for High-Level Quantitatively Assessed FM Options 107 Table 10-7 Cost Estimates for High-Level Quantitatively Assessed FM Options 108 Table 10-8 Summary of Net Present Worth of Benefits and Costs and Resultant Benefit Cost Ratio 109 Table 10-9 Summary of Criteria Weighting Outcomes 111 Table 10-10 Multi-Criteria Assessment - Scoring System Summary 112 Table 10-11 MCA Outcomes for Weighted and Unweighted Scores for Detailed Options 113 Table 11-1 Implementation Plan for Prospect Creek Sub-Catchments FRMS&P 117 Figures Figure 1-1 Location of Prospect Creek Study Area (Pink Outline) within Canterbury-Bankstown LGA (Black Outline) and Surrounding Waterways (Blue Outlines) 4 Figure 1-2 Layout of Four Sub-Catchments within Prospect Creek Study Area 5 Figure 2-1 Areas of Flood Affectation of the Study Area with 1% AEP and PMF Extents for Local Catchments and Georges River 8 Figure 2-2 Topography of Prospect Creek Sub-Catchments Study Area 10 Figure 2-3 Acid Sulfate Soils Mapping and Contaminated Land Sites within Study Area 12 Figure 2-4 Mapping of Plant Community Types and Threatened Species Sightings and Coastal Wetland Proximity 15 Figure 2-5 Mapping of Cultural Heritage Constraints 17 Figure 2-6 Stormwater Drainage Assets and Sydney Water Sewer Assets in the Study Area 20 Figure 3-1 Site Visit Locations 26 Figure 3-2 Floor Level Survey and Building Footprints (Geoscape, 2020) 27 Figure 4-1 In-Person Information Session Set-ups for Bass Hill Plaza (Left) and Georges Hall Village (Right) 32 Figure 4-2 Consultation Responses Summary 33 Figure 4-3 Proportion of Online Survey Responses for the Perceived Main Cause of Flooding for the Community 34 Figure 5-1 Comparison of 1% and 20% AEP Hydrographs for Base Case and Flood Study Models for Villawood at Wood_01 40
Table
Table

Draft Final Flood Risk Management Study and Plan Prospect Creek Sub-Catchments 304600207 | 22 March 2024 xv Figure 5-2 H1-H6 Hazard Categories Source: Section 7.2.7, Book 6, ARR, 2019 41
5-3 Comparison of 1% AEP Hydrographs for Base Case and Climate Change Models for Villawood at Wood_01 44
6-1 Current Land Use Zoning with 1% AEP and PMF Extents 49 Figure 6-2 1% AEP Flood Function with Floodway on Current Land Use Zoning 50 Figure 6-3 1% AEP Provisional Hazard with High Hazard on Current Land Use Zoning 51 Figure 6-4 Indicative Flood Risk Precinct Extents Based on Base Case Model 54 Figure 6-5 Current Development Control Matrix for Catchments Affected by Stormwater Flooding 55
7-2 Adopted Damage Curves for Residential Single Storey 63
7-3 Adopted Damage Curves for Residential Double Storey 63
7-4 Adopted Damage Curves for Commercial Properties 64 Figure 7-5 Flood Risk to Life Damages Calculations (Source: NSW DCCEEW, 2022) 65 Figure 7-6 Total Damages for the 20%, 5%, 2% an 1% AEP events with Estimate Curve 66
8-1 Location of Emergency Services in the Region with CBC LGA 1% AEP and PMF Extents 72 Figure 8-2 Location of Vulnerable Developments and Emergency Services within the Study Area with 1% AEP and PMF Extents 74
8-3 Flood Timing Inspection Points (Shown as Yellow Points) with 1% AEP Peak Depth Results 78 Figure 8-4 Flood Level Time Series Results for Base Case Models for Three Villawood Sub-Catchment Locations 79
8-5 Flood Level Time Series Results for Base Case Models for Three Non-Villawood SubCatchment Locations 80
8-6 Georges River Flood Level Time Series Results in the Vicinity of Georges Hall and Lansdowne Sub-Catchments 81 Figure 8-7 Emergency response Hotspots with PMF H1-H6 Hazard and PMF Overfloor Flooding Depths 85 Figure 8-8 Flood Affected Road Locations within Study Area 88 Figure 10-1 Location of 11 Detailed Flood Modification Options for Prospect Creek Sub-Catchments 97
11-1 Detailed FRM Measure Economic Assessment Framework (Source: FRM Guide MM01) 115
Figure
Figure
Figure
Figure
Figure
Figure
Figure
Figure
Figure
Figure

Abbreviations
1D One-dimensional
2D Two-dimensional
ABS Australian Bureau of Statistics
AEP Annual Exceedance Probability
AHD Australian Height Datum
AHIP Aboriginal Heritage Impact Permit
ARI Average Recurrence Interval
ARR Australian Rainfall and Runoff
ASS Acid Sulfate Soils
BoM Australian Bureau of Meteorology
CBC Canterbury-Bankstown Council
DAWE Australian Department of Agriculture, Water and Environment.
DCP Development Control Plan
DCCEEW NSW Department of Climate Change, Energy, the Environment and Water
EIS Environmental Impact Statement
ELVIS Elevation Information System
EM Emergency Response Modification (Option)
EPA NSW Environmental Protection Authority
EPBC Act Environment Protection and Biodiversity Conservation Act 1999
FDM Floodplain Development Manual
FIRA Flood Impact and Risk Assessment
FM Flood Modification (Option)
FMC Floodplain Management Committee
FPCC Flood Planning Constraint Categories
FRM Flood Risk Management
FRMS&P Flood Risk Management Study and Plan
FRP Flood Risk Precincts
FPL Flood Planning Level
FPA Flood Planning Area
GIS Geographical Information Systems
IFD Intensity-Frequency-Duration
LEMP Local Emergency Management Plan
LEP Local Environment Plan
LGA Local Government Area
LIDAR Light Detection and Ranging
MCA Multi-Criteria Assessment
NPWS National Parks and Wildlife Service
NSW New South Wales
PCT Plant Community Types
Draft Final Flood Risk Management Study and Plan Prospect Creek Sub-Catchments 304600207 | 22 March 2024 xvi

PM Property Modification (Option)
PMF Probable Maximum Flood
PMST Protected Matters Search Tool
SEPP State Environmental Planning Policy
SES NSW State Emergency Service
TEC Threatened Ecological Community
TfNSW Transport for New South Wales
TWG Technical Working Group
TWSF Total Warning Sydney Flood
WSUD Water Sensitive Urban Design
Glossary
Acid Sulfate Soils (ASS)
Acid sulfate soils (ASS) are naturally occurring sediments and soils containing iron sulfides (mostly pyrite). When these sediments are exposed to the air by excavation or drainage of overlying water, the iron sulfides oxidise and form sulphuric acid. ASSs are widespread among low lying coastal areas of NSW, in estuarine floodplains and coastal lowlands.
The probability of an event occurring or being exceeded within a year. For example, a 5% AEP flood would have a 5% chance of occurring in any year. An approximate conversion between ARI and AEP is provided. AEP ARI
Annual Exceedance
Probability (AEP)
Australian Height Datum (AHD)
Average Recurrence Interval (ARI)
Cadastre, cadastral base
Catchment
Design flood
A standard national surface level datum approximately corresponding to mean sea level.
The long-term average period between occurrences equalling or exceeding a given value. For example, a 20-year ARI flood would occur on average once every 20 years.
Information in map or digital form showing the extent and usage of land, including streets, lot boundaries, water courses etc.
The area draining to a site. It always relates to a particular location and may include the catchments of tributary streams as well as the main stream.
A significant event to be considered in the design process, various works within the floodplain may have different design events. E.g. some roads may be designed to be overtopped in the 1% AEP flood event.
Draft Final Flood Risk Management Study and Plan Prospect Creek Sub-Catchments 304600207 | 22 March 2024 xvii
63.2 % 1 year 39.3 % 2 year 18.1 % 5 year 10 % 10 year 5 % 20 year 2 % 50 year 1 % 100 year 0.5 % 200
0.2 % 500
year
year

Development
Discharge
Elevation Information System (ELVIS)
Flash flooding
Flood
Flood fringe
Flood hazard
Flood prone land
Floodplain
Flood risk management measures
Flood risk management options
Flood Planning Area (FPA)
The erection of a building or the carrying out of work, or the use of land or of a building or work, or the subdivision of land.
The rate of flow of water measured in terms of volume over time. It is to be distinguished from the speed or velocity of flow, which is a measure of how fast the water is moving rather than how much is moving.
ELVIS was launched by Geoscience Australia in 2016 to replace the existing National Elevation Data Framework (NEDF) and to open access to elevation datasets to a wider user base. With the online ELVIS portal, users can now easily download continent-wide elevation data.
Flooding which is sudden and often unexpected because it is caused by sudden local heavy rainfall or rainfall in another area. Often defined as flooding which occurs within 6 hours of the rain which causes it.
Relatively high stream flow which overtops the natural or artificial banks in any part of a stream, river, estuary, lake or dam, and/or overland runoff before entering a watercourse and/or coastal inundation resulting from super elevated sea levels and/or waves overtopping coastline defences.
The remaining area of flood prone land after floodway and flood storage areas have been defined.
Potential risk to life and limb caused by flooding.
Land susceptible to inundation by the probable maximum flood (PMF) event, i.e. the maximum extent of flood liable land. Floodplain Risk Management Plans encompass all flood prone land, rather than being restricted to land subject to designated flood events.
Area of land which is subject to inundation by floods up to the probable maximum flood event, i.e. flood prone land.
The full range of techniques available to floodplain managers.
The measures which might be feasible for the management of a particular area.
The area of land below the flood planning level and thus subject to flood related development controls.
Flood Planning Levels (FPLs)
Flood storages
Floodway areas
Geographical Information Systems (GIS)
Flood levels selected for planning purposes, as determined in floodplain management studies and incorporated in floodplain management plans. Selection should be based on an understanding of the full range of flood behaviour and the associated flood risk. It should also consider the social, economic and ecological consequences associated with floods of different severities. Different FPLs may be appropriate for different categories of land use and for different flood plains. The concept of FPLs supersedes the “Standard flood event” of the first edition of the Manual. As FPLs do not necessarily extend to the limits of flood prone land (as defined by the probable maximum flood), floodplain management plans may apply to flood prone land beyond the defined FPLs.
Those parts of the floodplain that are important for the temporary storage of floodwaters during the passage of a flood.
Those areas of the floodplain where a significant discharge of water occurs during floods. They are often, but not always, aligned with naturally defined channels. Floodways are areas which, even if only partially blocked, would cause a significant redistribution of flood flow, or significant increase in flood levels. Floodways are often, but not necessarily, areas of deeper flow or areas where higher velocities occur. As for flood storage areas, the extent and behaviour of floodways may change with flood severity. Areas that are benign for small floods may cater for much greater and more hazardous flows during larger floods. Hence, it is necessary to investigate a range of flood sizes before adopting a design flood event to define floodway areas.
A system of software and procedures designed to support the management, manipulation, analysis and display of spatially referenced data.
Draft Final Flood Risk Management Study and Plan Prospect Creek Sub-Catchments 304600207 | 22 March 2024 xviii

High hazard
Hydraulics
Hydrograph
Hydrology
Low hazard
Mainstream flooding
Flood conditions that pose a possible danger to personal safety, evacuation by trucks difficult, able-bodied adults would have difficulty wading to safety, potential for significant structural damage to buildings.
The term given to the study of water flow in a river, channel or pipe, in particular, the evaluation of flow parameters such as stage and velocity.
A graph that shows how the discharge changes with time at any particular location.
The term given to the study of the rainfall and runoff process as it relates to the derivation of hydrographs for given floods.
Flood conditions such that should it be necessary, people and their possessions could be evacuated by trucks, able-bodied adults would have little difficulty wading to safety.
Inundation of normally dry land occurring when water overflows the natural or artificial banks of the principal watercourses in a catchment. Mainstream flooding generally excludes watercourses constructed with pipes or artificial channels considered as stormwater channels.
Management plan
Mathematical/computer models
Overland Flow
Peak discharge
Probable maximum flood (PMF)
Probability
Risk
Runoff
Stage
Stage hydrograph
Stormwater flooding
Topography
A document including, as appropriate, both written and diagrammatic information describing how a particular area of land is to be used and managed to achieve defined objectives. It may also include description and discussion of various issues, special features and values of the area, the specific management measures which are to apply and the means and timing by which the plan will be implemented.
The mathematical representation of the physical processes involved in runoff and stream flow. These models are often run on computers due to the complexity of the mathematical relationships. In this report, the models referred to are mainly involved with rainfall, runoff, pipe and overland stream flow.
The local runoff, travelling through properties and /or roads, before it discharges into a stream, river, estuary, lake or dam.
The maximum discharge occurring during a flood event.
The flood calculated to be the maximum that is likely to occur.
A statistical measure of the expected frequency or occurrence of flooding. For a more detailed explanation see AEP and Average Recurrence Interval.
Chance of something happening that will have an impact. It is measured in terms of consequences and likelihood. For this study, it is the likelihood of consequences arising from the interaction of floods, communities and the environment.
The amount of rainfall that actually ends up as stream or pipe flow, also known as rainfall excess.
Equivalent to 'water level'. Both are measured with reference to a specified datum.
A graph that shows how the water level changes with time. It must be referenced to a particular location and datum.
Inundation by local runoff. Stormwater flooding can be caused by local runoff exceeding the capacity of an urban stormwater drainage system or by the backwater effects of mainstream flooding causing the urban stormwater drainage system to overflow.
A surface which defines the ground level of a chosen area.
Draft Final Flood Risk Management Study and Plan Prospect Creek Sub-Catchments 304600207 | 22 March 2024 xix

1 Introduction
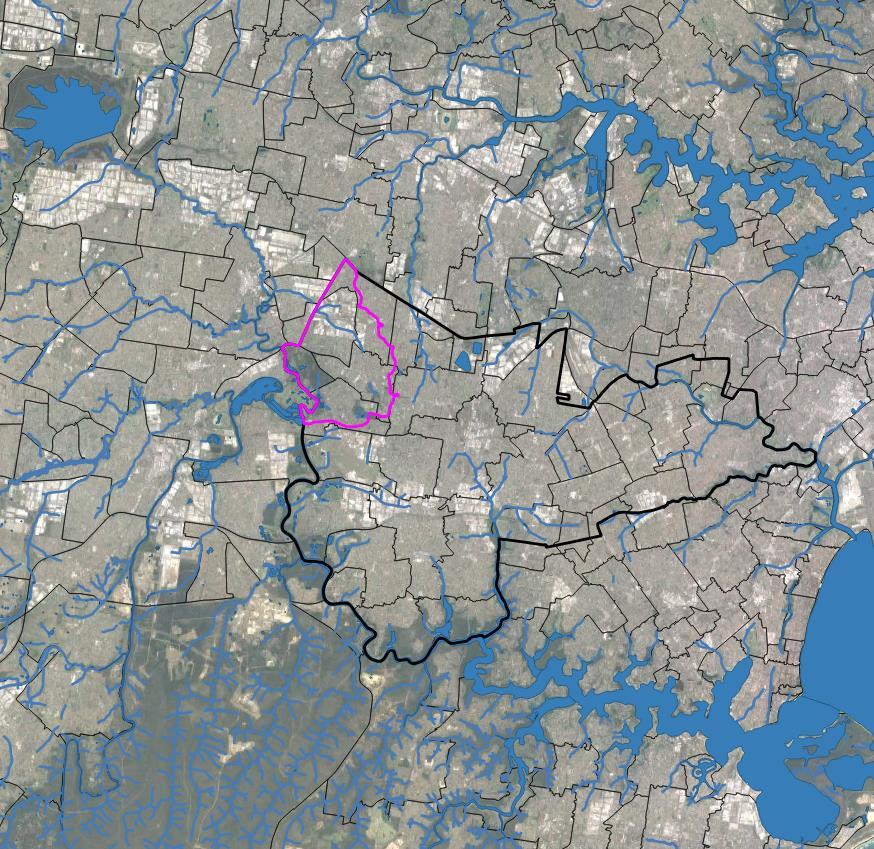
Stantec Australia Pty Ltd (formerly Cardno) was commissioned by Canterbury-Bankstown Council (‘Council’, or CBC) to undertake a Flood Risk Management Study and Plan (FRMS&P) for the Prospect Creek SubCatchments Study Area. The study area consists of the catchment of Prospect Creek that lies within the Canterbury-Bankstown Council Local Government Area (LGA), the location of the study area is shown in Figure 1-1. The study area is divided into four sub-catchments as follows:
> Georges Hall: A 145 ha (1.45 km2) sub-catchment in the suburb of Georges Hall. The flood behaviour of the sub-catchment was assessed within the Georges Hall Catchment Flood Study (BMT WBM, March 2013) commissioned by the former Bankstown City Council.
> Lansdowne: A 243 ha (2.43 km2) sub-catchment in the suburb of Lansdowne. The flood behaviour of the sub-catchment was assessed within the Lansdowne Catchment Flood Study (BMT WBM, December 2012) commissioned by the former Bankstown City Council.
> Miller Road: A 50 ha (0.50 km2) sub-catchment covering part of the suburb of Chester Hill. The flood behaviour of the sub-catchment was assessed within the Miller Road Catchment Flood Study (BMT WBM, December 2012) commissioned by the former Bankstown City Council.
> Villawood: The largest of the four sub-catchments with an area of approximately 740 ha (7.40 km2) including the suburbs of Villawood and Bass Hill, and parts of Chester Hill, Georges Hall and Lansdowne. The flood behaviour was initially defined in the Villawood Drain Work-as-Executed Study prepared by Civic Design on behalf of former Bankstown City Council (July 2008). The TUFLOW model established within this study was subsequently updated in the Bennett Street Drain Upgrade, Chester Hill Flood Assessment (BMT WBM, August 2014).
The layout of the four sub-catchments is shown in Figure 1-2 The four sub-catchment study areas listed above, combined create the study area for this study and plan. Throughout this report, discussion of the ‘study area’ will relate to the combined four sub-catchments, unless a specific sub-catchment study area is specifically identified by name.
This report is the Draft FRMS&P report for the Prospect Creek Sub-Catchments
1.1 Study Context
As outlined within the Floodplain Risk Management (FRM) Manual 2023, like all Council’s in NSW, Canterbury-Bankstown Council is responsible for local land use planning including management of both mainstream and overland flooding within the LGA. In response to the objectives of the New South Wales (NSW) Government’s Flood Prone Land Policy 2021, Council has an ongoing commitment to reduce the impact of flooding and flood liability on individual owners and occupiers of flood prone property, and to reduce public losses resulting from floods, utilising ecologically positive methods wherever possible. Through the NSW Department of Climate Change, Energy, the Environment and Water (DCCEEW) and the State Emergency Service (SES), the NSW Government provides specialist technical assistance to local government on all flooding and land use planning matters. The FRM Manual 2023 guides councils in the strategic management of flood risk across their LGAs through the FRM framework. This supports councils in meeting their responsibilities for a range of FRM activities and their strategic consideration of flooding.
The FRM process is a key element of the FRM framework. Studies and plans under the process support the understanding of flooding, the examination of measures to manage flood risk and informed decisions on how to manage flood risk into the future. They also support the consideration of flooding in broader activities under the FRM framework. The FRM process progresses through four (4) steps in an iterative process:
1. Data Collection
2. Flood Study
3. Flood Risk Management Study
4. Flood Risk Management Plan
The study currently being undertaken addresses points three and four of the process. The previous Flood Studies for the four sub-catchments provide the second step listed above to define the flood behaviour in the Study Area. These various Flood Studies form the basis of the flood data used for this FRMS&P.
Draft Final Flood Risk Management Study and Plan Prospect Creek Sub-Catchments 304600207 | 22 March 2024 1

1.2 Study Objectives
The overall objective of the study is to develop a FRMS&P for the study area that addresses the existing, future and continuing flood problems, in accordance with the NSW Government’s Flood Prone Land Policy 2021, and the FRM Manual 2023. From the project brief, the specific project objectives are as follows:
Flood Risk Management Study
> Review of flood modelling and other data,
> Development of Flood Risk Management options,
> Development of Flood Planning Levels, Controls and Guidelines, and,
> Provide recommendations to inform Canterbury-Bankstown Local Emergency Management Plan and Bankstown City Flood Emergency Sub Plan, Canterbury-Bankstown Local Environment Plan (LEP), and Canterbury-Bankstown Development Control Plan (DCP)
Flood Risk Management Plan
> Reducing the flood hazard and risk to people and property in the existing community and to ensure future development is controlled in a manner consistent with the flood hazard and risk.
> Reducing private and public losses due to flooding.
> Protecting and where possible enhance the creek and floodplain environment.
> Being consistent with the objectives of relevant State policies, in particular, the Government’s Flood Prone Land and State Rivers and Estuaries Policies and satisfy the objectives and requirements of the Environmental Planning and Assessment Act 1979.
> Ensuring actions arising out of the management plan are sustainable in social, environmental, ecological and economic terms.
> Ensuring that the flood risk management plan is fully integrated with the Canterbury-Bankstown Local Emergency Management Plan (LEMP) and Bankstown City Flood Emergency Sub Plan and other relevant catchment management plans.
> Ensuring the Management Plan consists of a coordinated mix of measures that address existing, future and continuing risks that utilise the findings of the management study.
> Establishing a program for management plan implementation and a mechanism for funding (including priorities, staging, funding sources, responsibilities, constraints and monitoring).
> Ensuring the plan is fully integrated with the local flood and catchment plans, Council’s Community Strategic Plan and Four-year Delivery Plan, existing and proposed planning instruments (e.g. Draft LEP and DCP) and meets Council’s obligations under the Local Government Act 1993.
> Ensuring that the plan has the support of the Floodplain Management Committee (FMC) and local community.
> Ensuring that the plan enables management of future land use, in particular by considering Council’s Residential Development Strategy, by addressing the limits, types, scales and conditions of proposed development.
> Making recommendations to Council on its existing DCP Part 12 policies referred to in the DCP and the draft DCP.
Draft Final Flood Risk Management Study and Plan Prospect Creek Sub-Catchments 304600207 | 22 March 2024 2

1.3 Flood Risk Management Principles
Beyond the specific objectives of this study listed above, the FRM Manual 2023 outlines ten (10) principles for flood risk management in NSW:
1. Establish sustainable governance arrangements,
2. Think and plan strategically,
3. Be consultative,
4. Make flood information available,
5. Understand flood behaviour and constraints,
6. Understand flood risk and how it may change,
7. Consider variability and uncertainty,
8. Maintain natural flood functions,
9. Manage flood risk effectively, and,
10. Continually improve the management of flood risk.
The objectives of this study align with these principles, and through the proposed study methodology attempts to account for all of these principles, either directly or indirectly.
1.4 Project Summary
The Prospect Creek FRMS&P project progressed through the following phases:
> Phase A – Data Collection, Review and Analysis of Data,
> Phase B – Flood Model Review and Update,
> Phase C – Site Visit,
> Phase D – Risk Assessment and Emergency Response,
> Phase E – Assessment of Preferred Options,
> Phase F – Draft Flood Risk Management Study and Plan, and,
> Phase G - Final Flood Risk Management Study and Plan
Included within these seven phases of the project are additional ongoing components of the project beyond technical delivery including: community consultation input, project management, project meetings and ongoing correspondence with Council. These components will be addressed throughout the seven phases.
1.4.1 Report Summary
This FRMS&P report summarises the outcomes of Phases A to F It is noted that as requested by Canterbury-Bankstown Council, the scope of Phase B was expanded to include establishment of a new base case flood model condition for all four sub-catchments to reflect the changes in the study area over the 8-10 years since the Flood Studies were completed. Phase E was also expanded to assess additional preliminary options. The structure of the report is as follows:
> Study Area description including catchment, topography, flora and fauna, heritage, demographics (Section 2) and initial data collection and review process (Section 3),
> Summary of the community consultation process (Section 4),
> Review and update of the flood study models and preparation of updated base case models (Section 5),
> Existing flood risk review including economic impacts of flooding (Section 7), flood emergency response review (Section 8), and a flood planning review (Section 6).
> Summary of flood modification options development and selection of detailed options (Section 9).
> Description of detailed assessment of options including modelling, cost estimation, damages benefits and Multi-Criteria Assessment (MCA) (Section 10), and implementation program for these detailed options to provide Council guidance on the future implementation of these options (Section 11).
Draft Final Flood Risk Management Study and Plan Prospect Creek Sub-Catchments 304600207 | 22 March 2024 3

Prospect Reservoir


Study Area


Draft Final Flood Risk Management Study and Plan Prospect Creek Sub-Catchments 304600207 | 22 March 2024 4
Figure 1-1 Location of Prospect Creek Study Area (Pink Outline) within Canterbury-Bankstown LGA (Black Outline) and Surrounding Waterways (Blue Outlines)
Canterbury Bankstown LGA
Botany Bay


Draft Final Flood Risk Management Study and Plan
304600207 | 22 March 2024 5
Prospect Creek Sub-Catchments
Figure 1-2 Layout of Four Sub-Catchments within Prospect Creek Study Area
Miller Road
Villawood
Lansdowne
Georges Hall

2 Study Area Description
2.1 Catchment Background
Prospect Creek originates downstream of the Prospect Reservoir and flows into the Georges River, which discharges into Botany Bay. It stretches from the Wetherill Park suburb at the upstream end to Georges Hall in the downstream end. The length of Prospect Creek from top of the catchment to the Georges River is approximately 16km.
The creek catchment covers part of City of Canterbury Bankstown, Fairfield City, Cumberland City, Blacktown City, and Liverpool City Councils. The study area for this project covers the CanterburyBankstown Council portion of the Prospect Creek catchment, totalling 1,178.2 ha. The study area forms the eastern portion of the Prospect Creek catchment and drains to Prospect Creek either directly, or through a major tributary of Prospect Creek – Burns Creek. In relation to the Canterbury Bankstown LGA, the study area covers the north-west portion of the LGA
The study area has been divided into four sub-catchments, with a brief summary of the catchment (as previously summarised in the Flood Studies for each sub-catchment) as follows:
> Georges Hall study area covers the suburb of Georges Hall, and is predominantly residential land, with the exception of the Crest Reserve to the east and Amaroo and Garrison Point Reserves to the west The catchment drains in a westerly direction.
> Lansdowne study area consists of the suburb of Lansdowne and parts of Georges Hall and Bass Hill. The southern and eastern extents of the catchment are predominantly urban residential with much of the western part of the catchment consisting of bushland and forming part of the Lansdowne Park and Mirambeena Regional Park. The sub-catchment drains in a westerly direction towards Prospect Creek with a low-lying floodplain and ponds located between Prospect Creek and Henry Lawson Drive.
> Miller Road study area includes part of the Chester Hill suburb and is predominantly residential land. The study area is bounded north by the Sydney Water Main, to the east and south by the natural topographic divide which runs partway along Gurney Rd and to the west by Woodville Rd. There are no defined channels within the Miller Road study area, the water is conveyed west via overland flow and the piped drainage network which follow the natural topography. Downstream of Woodville Rd the flowpath diverts south and discharges to Burns Creek.
> Villawood study area forms the upstream portion of the Burns Creek catchment and includes the suburbs of Villawood, Bass Hill, and part of Chester Hill. The upper parts of the catchment have mainly residential land-use, with drainage systems consisting generally of kerb inlet pits and pipes. Lower in the catchment the land-use is mainly industrial, with a network of concrete-lined open channels draining this industrial area. An important hydraulic feature of the catchment is the T3 railway line that crosses in an east-west direction, with Leightonfield and Chester Hill stations in the study area
The layout of the four sub-catchment study areas are shown in Figure 1-2. The details of the four subcatchments are summarised in Table 2-1
Draft Final Flood Risk Management Study and Plan Prospect Creek Sub-Catchments 304600207 | 22 March 2024 6
Name Sub-catchment ID Study Area (ha) Model Area (ha) Discharge Waterway Georges Hall C21 144.7 137.5 Prospect Creek directly Lansdowne C22 243.1 236.8 Prospect Creek directly Miller Road C08 50.3 108.1 Burns Creek Villawood C12 740.1 767.8 Burns Creek
Table 2-1 Details of the Prospect Creek Sub-catchments

2.2 Flood Affectation
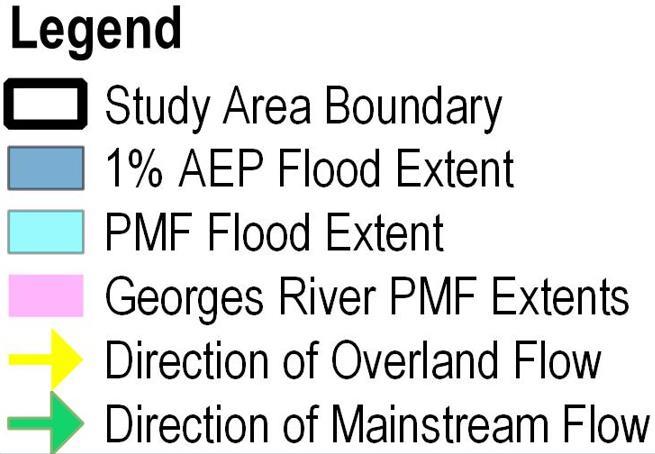
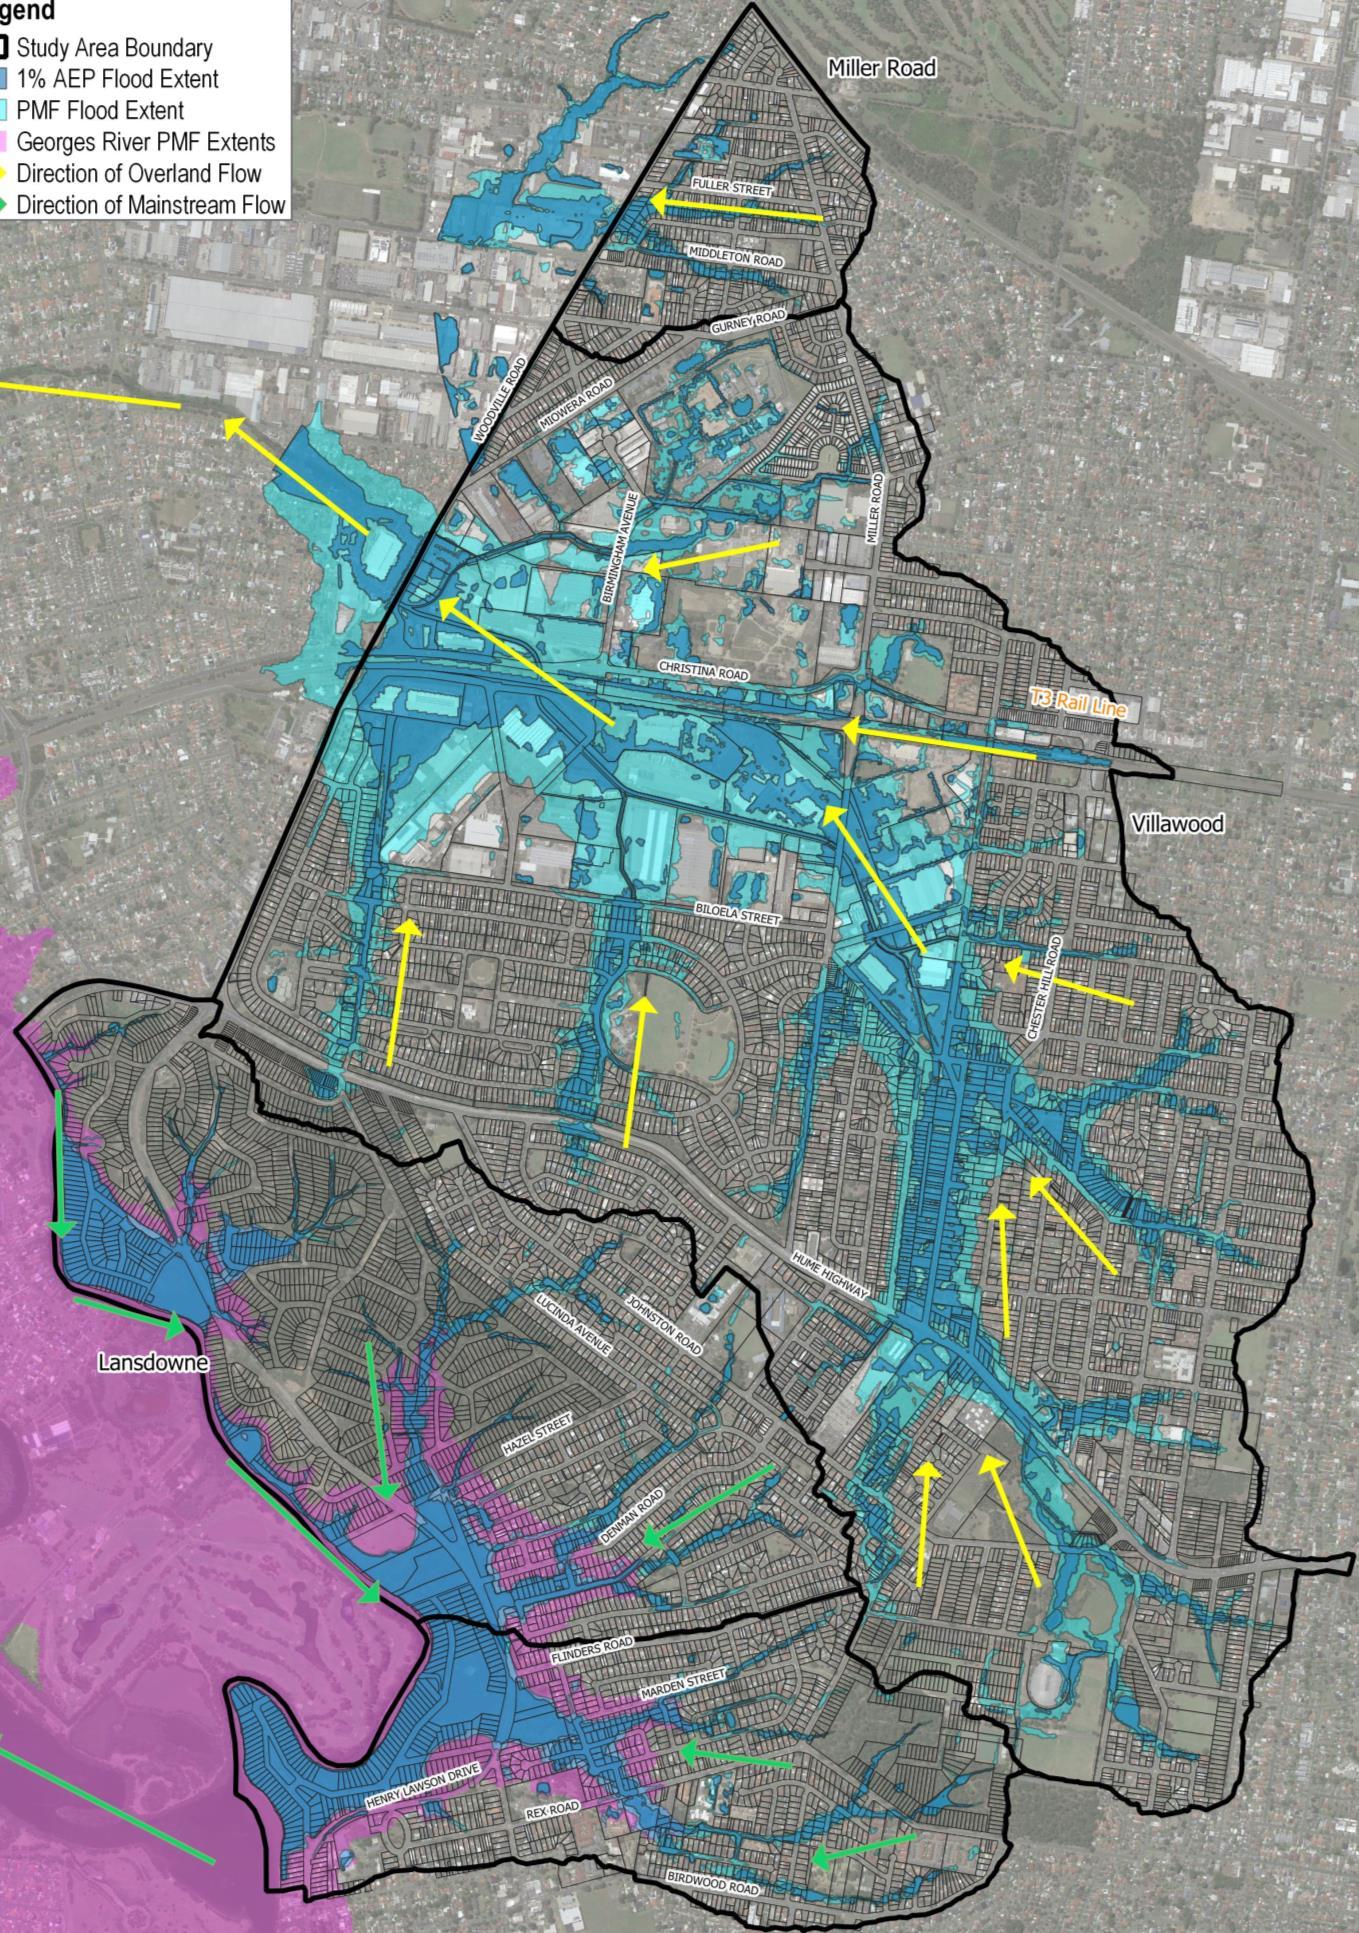
The 1% AEP and Probable Maximum Flood (PMF) flood extents are shown in Figure 2-1. This figure also includes the PMF extents for Georges River flooding for Georges Hall and Lansdowne sub-catchments. This figure provides an indication of the flood affected portions of the study area.
The flood affectation of the four sub-catchments is as follows:
> Georges Hall – Flooding occurs along three main overland flowpaths, one originates from the north of the sub-catchment near Rex Road and Flinders Road, a central flowpath that originates from two ponds in the Crest Reserve, and a southern flowpath near Birdwood Road. All three flowpaths converge near Amaroo Ave near Amaroo Reserve discharging to Lake Gillawarna and on to Prospect Creek. The lowlying western portions of the sub-catchment near Henry Lawson Drive are also affected by Georges River / Prospect Creek mainstream flooding as well as the overland flooding of the local catchment.
> Lansdowne – Two minor overland flowpaths converge to the west of Whitemore Reserve continuing to flow east with overland flooding of properties along Jacaranda Drive. There is another overland flowpath through the centre of the catchment close to Caroline Crescent crossing Denman Street and converging with the other flowpaths at Jacaranda Drive. A northern flowpath originates from near Laundy Reserve and continues to the south-west to Amber Reserve and on to Kirrily Reserve before passing into Lansdowne Reserve. The low-lying western portions of the sub-catchment are also affected by Georges River / Prospect Creek mainstream flooding as well as the overland flooding of the local catchment.
> Miller Road – A southern flowpath originates from near Bulleen Reserve, a flowpath continues through properties between Clack Road and Fuller Street, with a northern flowpath originating from Alpha Street. All flowpaths converge near Clack Road and cross Woodville Road as overland flows.
> Villawood – The main flowpath for the catchment originates from the south-east near the velodrome and other public reserves. The flowpath continues parallel to Hume Highway in Carysfield Park, crossing the highway and flowing through a trunk drainage line and overland flow near Orchard Road. Near Sir Thomas Mitchell Road the flowpath discharges to a concrete-lined channel flowing west through the industrial precinct. The concrete lined channel crosses the T3 train line and continues west towards Woodville Road. Two overland flowpaths flow from the south of the study area near Lowana Street and Deribong Street. The western flowpath continues across Llewellyn Ave and into a culvert under the rail line, crossing Christina Road and into a concrete channel through an industrial site. A north flowpath conveys flows through the Villawood detention centre site and crosses Birmingham Ave into a concrete lined channel that continues through the industrial precinct. All of the trunk drainage channels converge and discharge from the study area through a box culvert system under Woodville Road, with overland flows overtopping the road when culvert capacity is exceeded. Due to significant flow obstructions from Woodville Road and the rail line the Villawood industrial precinct is exposed to significant and widespread ponding and flooding.
In most instances the hydrology / hydraulic model boundaries established in the respective flood studies mirrors the study area boundaries. There are two notable exceptions for Miller Road and Villawood subcatchments, where the models have been extended downstream of the Canterbury-Bankstown LGA boundary marked by Woodville Road. The flood study model boundaries, relative to the study area are shown in Figure 1-2 Flow directions for flowpaths have been shown in the figure, with mainstream (Prospect Creek and Georges River flow directions shown as well).
The extension of the model boundaries at these two locations to include parts of Fairfield LGA west of Woodville Road was to increase the confidence in flood modelling for the Woodville Road area. Whilst this additional area is represented in the model, this FRMS&P, including consideration of flood risk management options, focuses on the study area which is limited to that area within the Canterbury-Bankstown Council LGA boundary.
Draft Final Flood Risk Management Study and Plan Prospect Creek Sub-Catchments 304600207 | 22 March 2024 7




Draft Final Flood Risk Management Study and Plan Prospect Creek Sub-Catchments 304600207 | 22 March 2024 8
Figure 2 Areas of Flood Affectation of the Study Area with 1% AEP and PMF Extents for Local Catchments and Georges River
Villawood
Lansdowne
Georges Hall

2.3 Topography
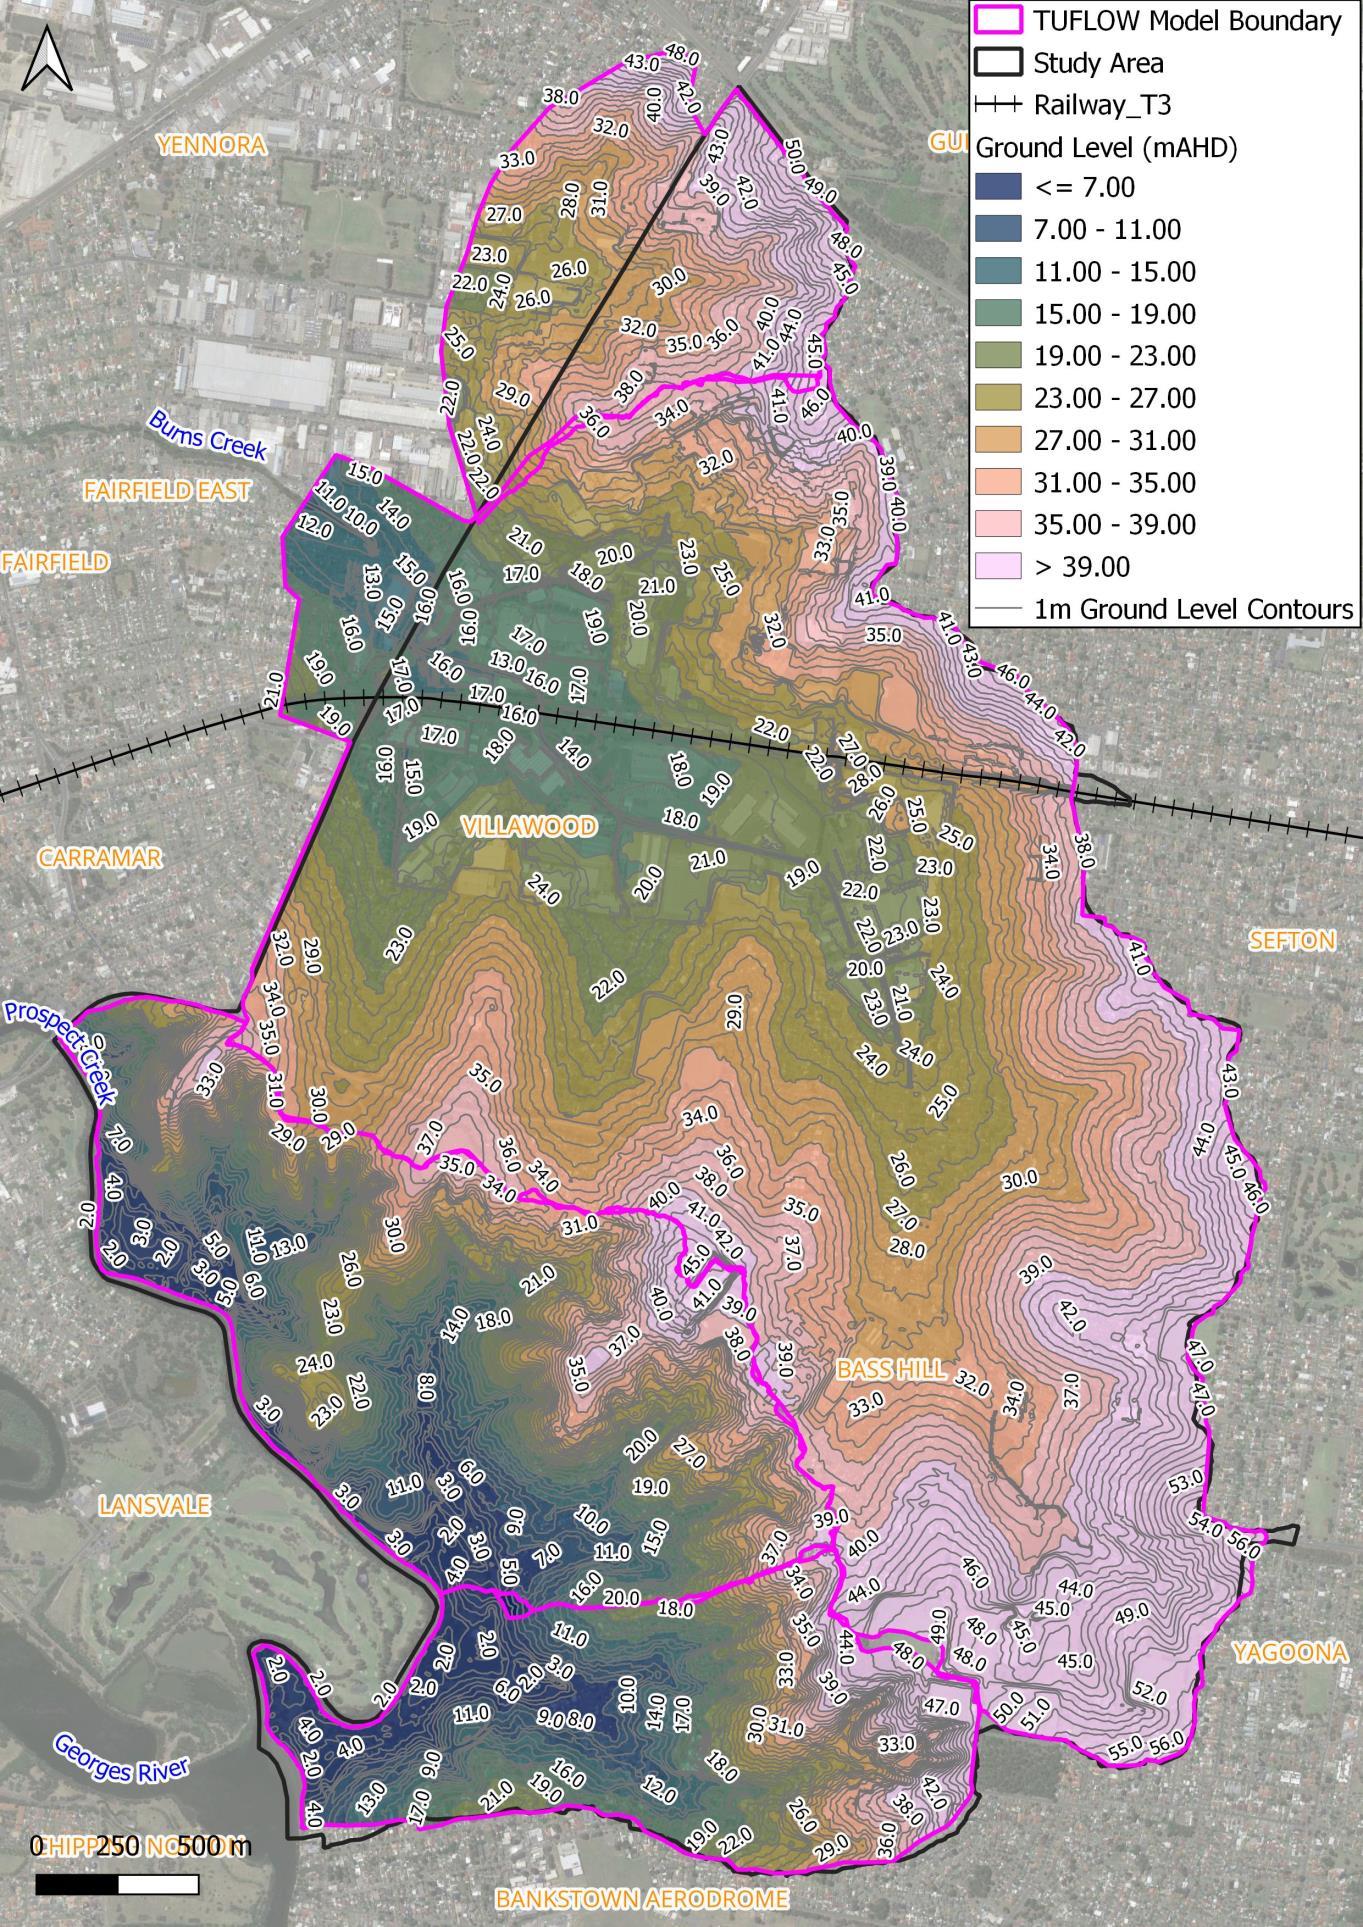
The topography of the Prospect Creek Sub-Catchments Study Area is shown in Figure 2-2
The eastern boundary of the study area is a north-south ridgeline that forms the catchment boundary between the Prospect Creek and Duck River catchment to the east in the suburb of Sefton. The highest elevations in the study area, around 40m Australian Height Datum (m AHD), are along this eastern ridgeline. From this ridgeline the study area generally grades in a westerly direction.
The study area is bisected by a second ridgeline in a more east-west direction, just south of Hume Highway. This ridgeline delineates the areas of the study area that flow to Burns Creek (Villawood sub-catchment), and those that flow to the Prospect Creek floodplain (Georges Hall and Lansdowne sub-catchments). The lowest lying areas of the study area, less than 7m AHD, are along the Prospect Creek floodplain in the Georges Hall and Lansdowne sub-catchments. These sub-catchments are also not as wide as Villawood sub-catchment and with lower lying sections the slopes on these two sub-catchments are typically steeper than Villawood.
A third, minor ridgeline also runs in an east-west direction near Gurney Road that signifies the boundary between the Villawood sub-catchment, and the smaller Miller Road sub-catchment. Miller Road is a side overland flowpath sub-catchment of the wider Burns Creek catchment and discharges to the creek downstream of the model boundary.
The minimum channel inverts on the western side of the Villawood study area are around 13m AHD, a significant fall from the elevations of the eastern ridgeline. However, with a wider catchment in Villawood the gradient of the sub-catchment is more modest than the other sub-catchments. This is particularly the case for the industrial area in Villawood which is the lowest lying and flattest section of the catchment, with all other parts of the catchment (north, east and south) all directing towards this central low-lying section.
2.4 Soils
2.4.1 Soil Erosion Potential
A review of soil landscapes mapping from eSpade v2.1 (DCCEEW, 2022) indicates that the sub-catchments are located within the Blacktown (north, central, east and south-east) and Richmond (south, south west and west) soil landscapes.
The Blacktown soil landscape is characterised by gently undulating rises on Wianamatta Group shales and Hawkesbury shale, with broad rounded crest and ridges with gently inclined slopes. The shallow to moderately deep (<100cm) soils are characterised by red and brown Podzolic Soils on crests, upper slopes and well-drained areas, with the deep soils characterised by yellow Podzolic Soils and Soloths on lower slopes and in areas of poor drainage.
The limitation of the Blacktown soils landscape is the moderately reactive highly plastic subsoil, low soil fertility and poor soil drainage.
The Richmond soil landscape is characterised by quaternary terraces of the Nepean and Georges Rivers and is mainly flat, with splays and levees which provide local relief. The soils are characterised by poorly structured orange to red clay loams, clays and sands, with texture increasing with depth and ironstone nodules present. Plastic clays are located in drainage lines, deep acid non-Calcic brown soils, red Earths and red Podzolic soils located on terrace surfaces and Earthy sands are located on terrace edges.
The limitation of the Richmond soils landscape is the localised flood hazard, localised seasonal waterlogging, and localised water erosion hazard on terrace edges.
Draft Final Flood Risk Management Study and Plan Prospect Creek Sub-Catchments 304600207 | 22 March 2024 9

Prospect Creek Sub-Catchments
Draft Final Flood Risk Management Study and Plan
304600207 | 22 March 2024 10
Figure 2-2 Topography of Prospect Creek Sub-Catchments Study Area

2.4.2 Acid Sulfate Soils
Acid Sulfate Soils (ASS) is the common name for soils that contain metal sulfides. The presence of these soils is more likely in low-lying areas of the floodplain. In an undisturbed and waterlogged state, ASS generally pose no or low risk to the environment. However, when disturbed, an oxidation reaction occurs to produce sulfuric acid which can negatively impact the surrounding environment in a number of ways such as a decline in water quality, fish kills and plant death. Sulfuric acid produced by the soils can also corrode and weaken certain structures and building foundations. Part 6.1 of the Bankstown Local Environmental Plan 2015 (Bankstown LEP) outlines general provisions for development near ASS.
Potential ASS within the Canterbury-Bankstown Local Government Area (LGA) are classified into five land classes with each land class indicating the depth where potential ASS may occur. Development consent is required for work in those five classes as described in Table 2-2
Table 2-2 Acid Sulfate Soil Land Classes (Source: Bankstown LEP 2015)
ASS Class Works
1 Any works.
2 Works below the natural ground surface. Works by which the watertable is likely to be lowered.
3 Works more than 1 metre below the natural ground surface. Works by which the watertable is likely to be lowered more than 1 metre below the natural ground surface.
4 Works more than 2 metres below the natural ground surface. Works by which the watertable is likely to be lowered more than 2 metres below the natural ground surface.
5 Works within 500 metres of adjacent Class 1, 2, 3 or 4 land that is below 5 metres Australian Height Datum and by which the watertable is likely to be lowered below 1m AHD on adjacent Class 1, 2, 3 or 4 land.
The Bankstown LEP 2015 ASS mapping of the study area in shown in Figure 2-3. Prospect Creek floodplain there are Classes 1, 3 and 4 within the Georges Hall and Lansdowne sub-catchments Adjacent areas in Georges Hall and Lansdowne sub-catchments are Class 5, covering a significant portion of the study area for these two sub-catchments. Negligible areas of Villawood and no part of Miller Road study areas are mapped within an ASS land class.
2.4.3 Contaminated Land
Contaminated land refers to any land which contains a substance at concentrations sufficient to present a human or environmental health risk, as defined in the Contaminated Land Management Act 1997
The NSW DCCEEW regulates contaminated land sites and maintains a record of written notices issued by the NSW Environmental Protection Authority (EPA) in relation to the investigation or remediation of site contamination. Searches were undertaken of the online Contaminated Land Record and the List of NSW Contaminated Sites notified to the EPA on 15 March 2022. A total of 11 premises were listed:
> Woolworths Caltex Bass Hill, 862 Hume Highway, Bass Hill.
> Former Orica, Chester Hill, 127 Orchard Road, Chester Hill.
> Ettason Villawood Site, 2A Birmingham Avenue, Villawood.
> Former Electrical Component Manufacture, 66 Christina Road, Villawood.
> Former Orica Crop Care, 2 Christina Road, Villawood.
> Former Siemens/Westinghouse, 49 Miowera Road, Villawood.
> Nepotian (Former Toll) Site, 110A Christina Road, Villawood.
> Former Defence Site, 29 Biloela Street, Villawood.
> PPG Industries, 9 Birmingham Avenue, Villawood.
> Various industrial premises, 191 Miller Road, Chester Hill.
> Integrated Packaging, 149 Orchard Road, Chester Hill.
The location of these 11 sites is shown in Figure 2-3 Each of these sites have been formerly regulated under the Contamination Land Management Act 1997. It is important to note that there are limitations to the registers and there may be contaminated sites not listed.
Draft Final Flood Risk Management Study and Plan Prospect Creek Sub-Catchments 304600207 | 22 March 2024 11


Draft Final Flood Risk Management Study and Plan Prospect
304600207 | 22 March 2024 12
Creek Sub-Catchments
Figure 2-3 Acid Sulfate Soils Mapping and Contaminated Land Sites within Study Area

2.5 Threatened Flora and Fauna
2.5.1 Flora
A search of the Australian Department of Agriculture, Water and Environment Protected Matters Search Tool (PMST) (DAWE, 2022a) for Matters of National Environmental Significance listed under the Commonwealth Environment Protection and Biodiversity Conservation Act 1999 (EPBC Act) was undertaken on 15 March 2022 adopting a 5 km buffer from the sub-catchment areas.
The PMST indicated that 11 threatened ecological communities (TECs) listed under the EPBC Act are likely to or may occur in the area, namely:
> Castlereagh Scribbly Gum and Agnes Banks Woodlands of the Sydney Basin Bioregion.
> Coastal Swamp Oak (Casuarina glauca) Forest of NSW and South-East Queensland
> Coastal Swamp Sclerophyll Forest of New South Wales and South-East Queensland.
> Cooks River/Castlereagh Ironbark Forest of the Sydney Basin Bioregion.
> Cumberland Plain Shale Woodlands and Shale-Gravel Transition Forest.
> River-flat eucalypt forest on coastal floodplains of southern New South Wales and eastern Victoria.
> Shale Sandstone Transition Forest of the Sydney Basin Bioregion.
> Subtropical and Temperate Coastal Saltmarsh.
> Turpentine-Ironbark Forest of the Sydney Basin Bioregion.
> Upland Basalt Eucalypt Forests of the Sydney Basin Bioregion.
> Western Sydney Dry Rainforest and Moist Woodland on Shale.
A review of DCCEEW’s vegetation mapping for the Sydney Metropolitan Area (NSW OEH, 2016) identifies Plant Community Types (PCTs) as occurring within the sub-catchments. The layout of the PCT’s for the study area are shown in Figure 2-4 The list of PCTs for the study are as follows:
> PCT 724 Castlereagh shale - gravel transition forest: Broad-leaved Ironbark – Grey Box.
> PCT 725 Castlereagh Ironbark forest: Broad-leaved Ironbark.
> PCT 781 Coastal freshwater wetland.
> PCT 835 Cumberland river flat forest: Forest Red Gum
> PCT 849 Cumberland shale Plains woodland: Grey Box.
> PCT 883 Castlereagh Scribbly Gum woodland: Hard-leaved Scribbly Gum.
> PCT 920 Estuarine mangrove forest.
> PCT 1234 Estuarine Swamp Oak Forest
> PCT 1281 Sydney Turpentine - Ironbark forest.
> PCT1800 Cumberland Swamp Oak riparian forest.
> PCT 1808 Estuarine reed land
Of the PCTs present in the sub-catchments, six have potential to comprise vegetation communities commensurate with Threatened and Endangered Communities (TECs) listed under the EPBC Act, including those identified as being likely to occur within the sub-catchments. These community types are noted in italics in the above list, and are likely to be the most sensitive communities. In order to confirm if TECs are present they would need to be ground-truthed by a suitably qualified ecologist.
2.5.2
Fauna
The PMST results indicated a total of 83 threatened species and 44 migratory species listed under the EPBC Act are known, likely or have potential to occur in the wider region around the sub-catchment study areas
A search of the DCCEEW BioNet database was undertaken to obtain flora and fauna sighting records for the vicinity of the sub-catchments A total of 6,061 records of 55 species, including threatened (listed on the BC Act), Commonwealth listed in the vicinity of the study area (area bounded by North: -33.84, West: 150.94, East: 151.05, South -33.94) The locations of the sightings are shown in Figure 2-4
Draft Final Flood Risk Management Study and Plan Prospect Creek Sub-Catchments 304600207 | 22 March 2024 13

As can be seen in the sighting mapping, there are large numbers of sightings vulnerable and endangered species in the bushland on the north-west side of the Lansdowne sub-catchment that extends into the southern side of the Villawood sub-catchment.
Generally, the majority of sightings, particularly of vulnerable and endangered species are within the Georges Hall, Lansdowne and southern portions of the Villawood sub-catchments. There are two sightings of critically endangered species, both within the Georges Hall sub-catchment, each on the east and west sides of the sub-catchment.
With regards to commonly sighted threatened and endangered species, a list of flora and fauna with over 20 sightings in the vicinity of the study area is included in Table 2-3. The commonly sighted species include the vulnerable grey-headed flying fox and the large bent-winged bat for mammalia. There are also six forms of commonly sighted flora in the area, with one critically endangered, one endangered and one vulnerable flora species.
Table 2-3 Species with Over 20 Sightings in the Vicinity of the Study Area and Conservation
Mammalia Grey-headed Flying-fox Pteropus poliocephalus
Large Bent-winged Bat Miniopterus orianae oceanensis
Flora Marsdenia viridiflora R. Br. subsp. Viridiflora population in the Bankstown, Blacktown, Camden, Campbelltown, Fairfield, Holroyd, Liverpool and Penrith local government areas
Marsdenia viridiflora subsp. viridiflora E2 - 461 - Hibbertia puberula E1 - 201 - Hibbertia sp. Bankstown E4A CE 217
Downy Wattle
Netted Bottle Brush
Acacia pubescens
linearifolius
Note: CE – Critically Endangered, E – Endangered, EP – Endangered Population, V – Vulnerable, NL – Not Listed.
The presence of TECs and threatened species that occur (or have the potential to occur) within the subcatchments should be considered in the development and implementation of any proposed flood modifications options or flood protection works. The potential for any impacts to threatened communities or species can have implications for the approvals pathway for any structural flood mitigation proposals, and further investigations or offsetting of impacts may be required.
2.5.3 Coastal Wetlands
The State Environmental Planning Policy (Resilience and Hazards) 2021 came into effect on 1 March 2022 and overrules ISEPP in regards to development on Coastal Wetlands (Clause 2.7) and Proximity to Coastal Wetlands (Clause 2.8). It aims to promote an integrated and coordinated approach to land use planning in the coastal zone. Typically, development consent requires an Environmental Impact Statement (EIS) and associated environmental reviews.
Clause 2.7of the SEPP notes that development consent is required for most developments within a coastal wetland or littoral rainforest. Developments requiring consent include (i) earthworks (including the depositing of material on land), (ii) constructing a levee, (iii) draining the land, and (iv) environmental protection works Clause 2.8 of the SEPP notes that development consent is also required for all developments within the proximity of a coastal wetland or littoral rainforest The proximity area for the Prospect Creek sub-catchments study area is shown in Figure 2-4
The proximity areas for coastal wetlands are confined to the floodplain and wetland areas near Prospect Creek floodplain within the Georges Hall and Lansdowne sub-catchments. Any options within these proximity areas will likely need to consider onerous environmental approval requirements involved in the EIS process.
Draft Final Flood Risk Management Study and Plan Prospect Creek Sub-Catchments 304600207 | 22 March 2024 14
Class Common Name Scientific Name BC Act EPBC Act Number of Recorded Sightings
Status
V,P V 337
E1 -
27
V V 4218
Callistemon
V,3 - 20 Spiked Rice-flower Pimelea spicata E1 E 320

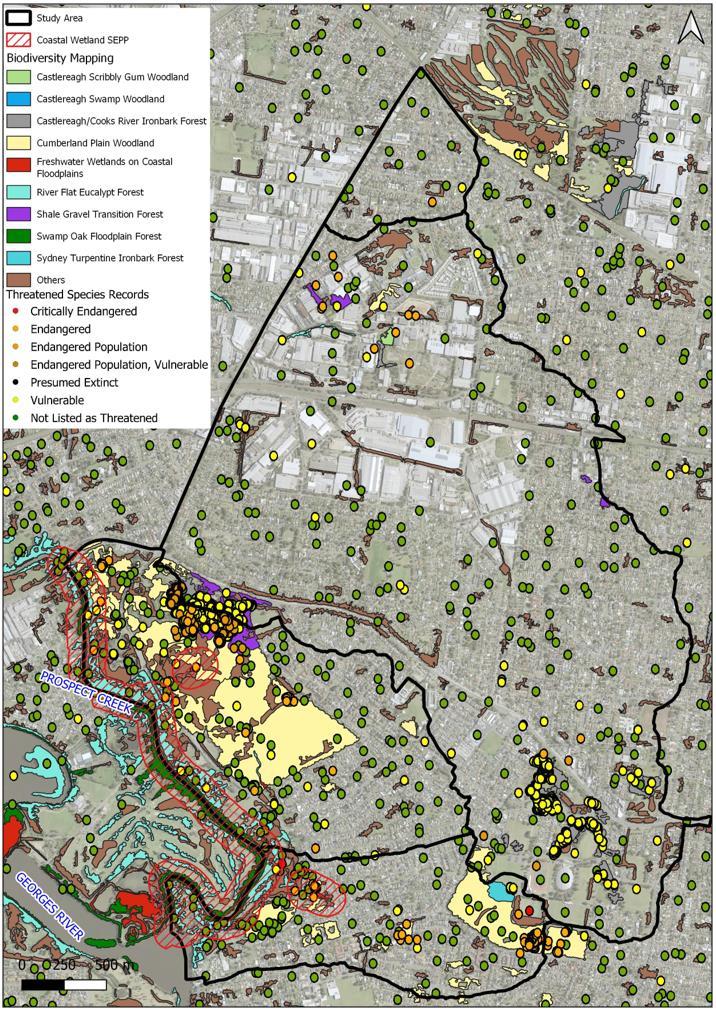
Draft Final
Risk
Study
304600207 | 22 March 2024 15
Flood
Management
and Plan Prospect Creek Sub-Catchments
Figure 2-4 Mapping of Plant Community Types and Threatened Species Sightings and Coastal Wetland Proximity

2.6 Heritage
2.6.1 Aboriginal Heritage
Australia contains many different and distinct Aboriginal and Torres Strait Islander groups, each with their own culture, language, beliefs and practices. The study area is within the Gandangara Local Aboriginal Land Council area, with the Canterbury-Bankstown West LGA situated on the traditional land of the Darug and Eora peoples.
A search of the Aboriginal Heritage Information Management System (AHIMS) showed there are at least 13 sites of Aboriginal archaeological and cultural heritage significance within the vicinity of the sub-catchments. There is also the potential for Aboriginal sites and archaeology to exist across the sub-catchments even though they have not been formally recorded. These 13 sites were generally adjacent to the Prospect Creek waterway in the Lansdowne and Georges Hall sub-catchments.
All Aboriginal sites are protected under the National Parks and Wildlife Act 1974 (NPW Act) and therefore any floodplain management options that have potential to impact on protected sites should be assessed via the Aboriginal cultural heritage due diligence assessment process detailed in the Due Diligence Code of Practice for the Protection of Aboriginal Objects in New South Wales (Department of Environment, Climate Change and Water NSW, 2010). Impacts to sites should be avoided in the first instance. In the event a management option would impact an item or site listed under the NPW Act, an Aboriginal Heritage Impact Permit (AHIP) must be sought from DCCEEW
2.6.2
Non-Aboriginal Heritage
Non-Aboriginal heritage can be classified into three statutory listing classifications based on significance, namely Commonwealth, State and local. The significance of an item is a status determined by assessing its historical, scientific, cultural, social, archaeological, architectural, natural or aesthetic value.
A desktop review of non-Aboriginal heritage was undertaken for Bankstown. Searches were undertaken of the following databases:
> Australian Heritage Database which incorporates World Heritage List, National Heritage List, Commonwealth Heritage List (DAWE, 2022b),
> State Heritage Register (DPIE, 2022b), and
> Local Council Heritage as listed on the Bankstown LEP.
There were no Commonwealth heritage items identified within the sub-catchments.
The search of the State Heritage Register (DPIE, 2022b) identified one item in the sub-catchment as being listed under the NSW Heritage Act 1977 (refer Figure 2-5), the Homestead, The – 1a Lionel Street, Georges Hall (SHR no. 00448). This site is located in the Georges Hall sub-catchment.
The search of the local heritage items listed on the Bankstown LEP identified four items in the study area:
> Villawood Immigration Detention Centre – 15 Birmingham, Villawood (Item no. I40).
> Pressure Tunnel, Shaft No 1 and associated infrastructure - 1 Campbell Hill Road, 61A–61C Priam Street and 1A Woodville Road, Chester Hill, 227 Rookwood Road, Chullora, 1A Auburn Road, Potts Hill, 2A Auburn Road and 1 Chisholm Road, Regents Park, 2A Chisholm Road and 7 Hector Street, Sefton (Item no. 01630).
> House, “Lansdowne” – 7 Henry Lawson Drive, Lansdowne (Item no. I27).
> The Homestead building and site – 1a Lionel Street, Georges Hall (Item no. 00448).
Where it is proposed to undertake works that either directly or indirectly impact on a locally listed heritage item or site, Council must refer to the Bankstown LEP for heritage provisions and development guidelines relating to locally listed heritage items.
Depending on the nature of any structural floodplain risk management works proposed, a more detailed Statement of Heritage Impact prepared by a suitably qualified specialist may be required to assess potential impacts on these features. Where impacts to listed heritage items are identified, a permit may be required under the NSW Heritage Act 1977
Draft Final Flood Risk Management Study and Plan Prospect Creek Sub-Catchments 304600207 | 22 March 2024 16

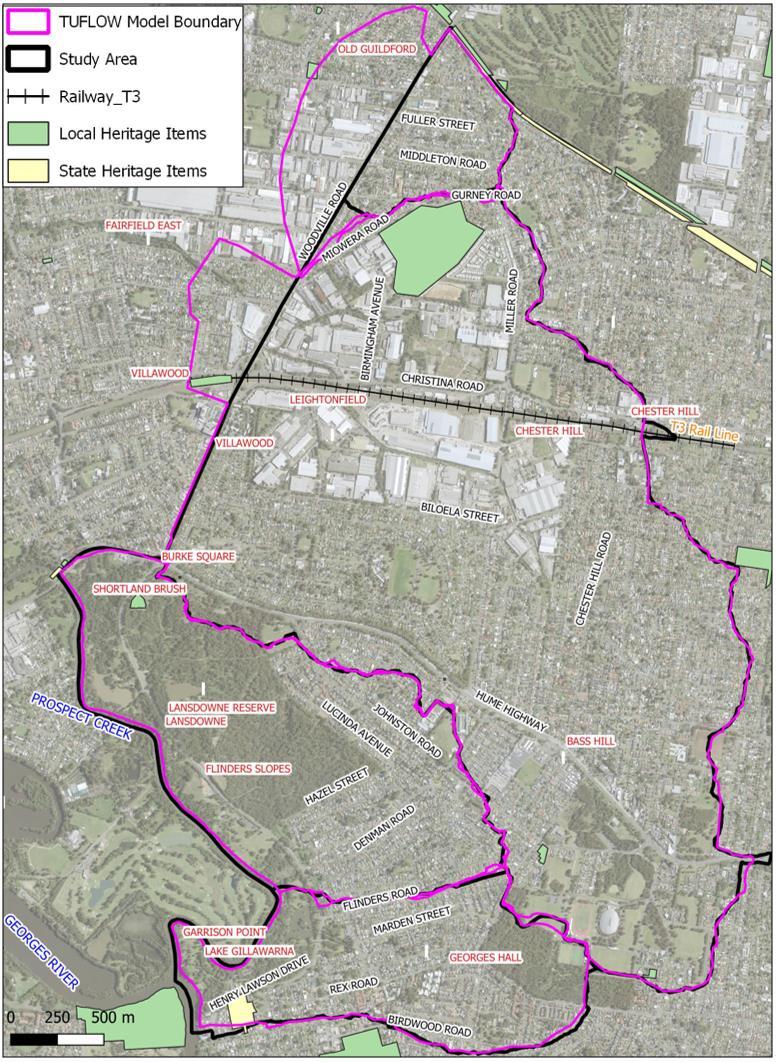
Draft Final Flood Risk Management Study and Plan Prospect
Sub-Catchments 304600207 | 22 March 2024 17
Creek
Figure 2-5 Mapping of Cultural Heritage Constraints

2.7 Demographic Profile
Knowledge of the demographic character of an area enables preparation and evaluation of flood risk management options that are appropriate for the local community. For example, in the consideration of emergency response or evacuation procedures, information may need to be presented in languages other than English and/or additional arrangements may need to be made for less mobile members of the community who may not be able to evacuate efficiently.
Demographic data from Canterbury-Bankstown LGA was used to identify the social characteristics of the sub-catchments. All, or part, of the following suburbs are located within the study area:
> Georges Hall.
> Bass Hill and Lansdowne.
> Chester Hill.
> Villawood.
The Canterbury-Bankstown community profile identified that the population of the above suburbs was 37,956 in 2020 (Canterbury-Bankstown Council, 2022). A review of the Canterbury-Bankstown Council social atlas revealed the following:
> The median age of the sub-catchments is 36 years.
> Approximately 25% of the population within the sub-catchment is under 18 years old and approximately 15% of the population within the sub-catchment is over 65 years old.
> Approximately 8.33% of the population require assistance due to disability.
> Approximately 56.25% of the population spoke a language other than English, with 11.10% not fluent in English. Other languages spoken at home include Chinese languages (approximately 4.24%), Greek (approximately 2.26%), Vietnamese (approximately 10.19%) and Arabic (approximately 25.56%).
> The median mortgage repayments per week is $476.
Based on the above information, there are various factors which should be considered for flood risk management planning including:
> Potential assistance for disabled persons and implications of different land use types and the vulnerable populations they may expose to the floodplain,
> Assistance with language barriers, and,
> House prices - in the above suburbs may assist in the calculation of economic damages incurred during a flood event. According to data from realestate.com.au (realestate.com.au, 2022) the average median property prices across the sub-catchments are approximately $991,562 for dwellings.
2.8 Water Drainage Assets
2.8.1 Stormwater Drainage
Council provided Stantec with a stormwater drainage layer as part of project inception. The layer includes recorded stormwater pipe and culverts, as well as open drains within the study area, owned and operated by the following agencies:
> Canterbury-Bankstown Council (CBC),
> National Parks and Wildlife Service (NPWS),
> RailCorp,
> Transport for NSW (TfNSW) formerly (RMS),
> Private ownership, and,
> Unknown ownership.
The layout of the stormwater drainage systems in the study area are shown in Figure 2-6. A summary of the number of drainage sections (lengths of pipe / culvert or open drain) for each owner are included in Table 2-4
Draft Final Flood Risk Management Study and Plan Prospect Creek Sub-Catchments 304600207 | 22 March 2024 18

The majority of stormwater drainage infrastructure in the study area is pipes / culverts owned by CanterburyBankstown Council, with TfNSW also owning a large number of pipes / culverts, particularly along the Hume Highway and Woodville Road. The National Parks and Wildlife Service own 42 pipes all within the bushland on the western side of Lansdowne. RailCorp owns 5 culverts crossing the T3 train line in the Villawood subcatchment, private ownership makes up 58 section of pipe / culverts and unknown ownership a further 11 sections.
With regards to stormwater open drains, Council owns nearly half of the sections within the study area, with 8 drains owned by RailCorp on the T3 train line that bisects the Villawood sub-catchment and one private owner of an open drain. The remaining 86 sections of stormwater open drain have an unknown owner. The major stormwater open drains through the Villawood industrial precinct are all owned by Council.
As confirmed in discussions with Council, it is understood that there have not been any major upgrades or changes to the stormwater drainage network over the past decade since the flood studies were prepared.
2.8.2 Sydney Water Assets
In response to initial stakeholder engagement, Sydney Water provided on 7 March 2022 a summary of flood affected sewage pump stations that they own and operate within the study area. Two pump locations were identified within the study area, one within Georges Hall (SP0323) and one within Lansdowne (SP0309). Both sites are located within the Prospect Creek floodplain. The station datum for the two is 5.7m AHD and 5.25m AHD for Georges Hall and Lansdowne stations respectively. The locations of the two pump stations are shown in Figure 2-6
Draft Final Flood Risk Management Study and Plan Prospect Creek Sub-Catchments 304600207 | 22 March 2024 19
Number of Drainage Sections for Each Owner and Drainage Type Drainage Owner Number of Pipe / Culvert Sections Number of Open Drain Sections Total Drainage Sections Canterbury-Bankstown Council 2,797 92 2,889 National Parks and Wildlife Service 42 0 42 RailCorp 5 8 13 Transport for NSW 239 0 239 Private Ownership 58 1 59 Unknown Ownership 11 86 97 Total 3,152 187 3,339
Table 2-4

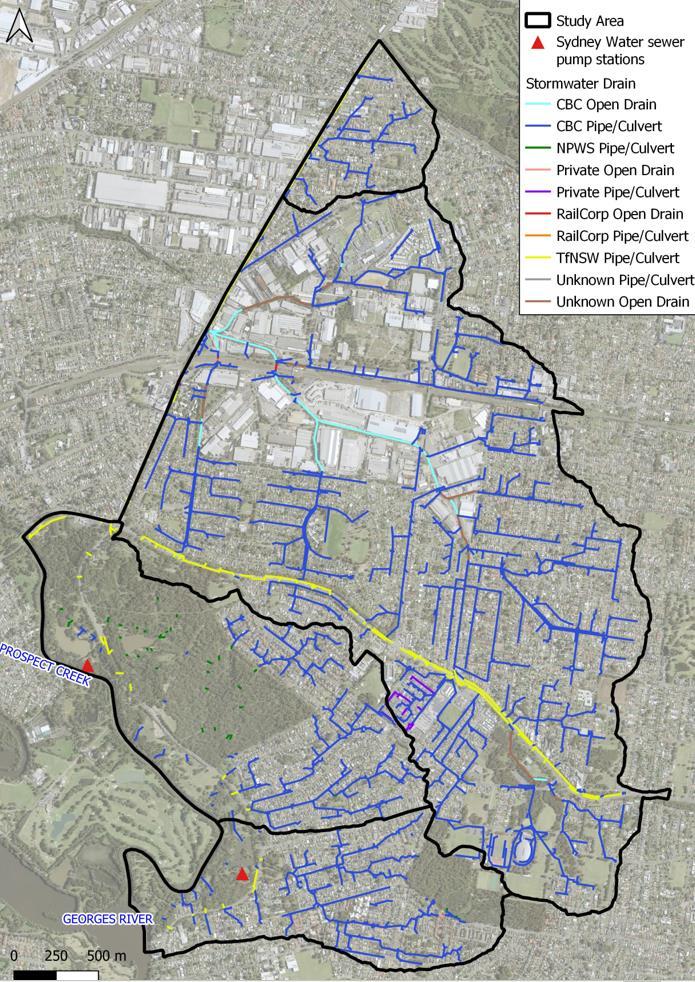
Draft Final Flood Risk Management Study and Plan Prospect Creek Sub-Catchments 304600207 | 22 March 2024 20
Figure 2-6 Stormwater Drainage Assets and Sydney Water Sewer Assets in the Study Area
Sydney Water Sewage Pumps

3 Review of Available Data
3.1 Sub-Catchment Flood Studies
3.1.1 Background to Flood Modelling and TUFLOW
The following overview of flood modelling and TUFLOW has been sourced from the previous Flood Studies for the study area, providing a background to the development of numerical modelling processes for flood assessment that have been adopted in these previous studies.
Due to the complex nature of floodplain flow patterns in urban catchments, a computerised modelling approach for the prediction of flood levels has been adopted in this study area. For computerised flood analysis, two types of numerical models are required:
> A hydrologic model, covering all the sub-catchments of the project area. The hydrologic model simulates the catchment rainfall-runoff processes, generating the runoff inflows that the hydraulic model uses to predict design flood behaviours.
> A combined one dimensional / to dimensional (1D/2D) hydraulic model representing the catchment. The hydraulic model simulates the flow behaviour of the pipe flows, overland flowpaths, waterways and associated floodplains, producing flood levels, discharges and velocities.
For the simulation of the catchment rainfall-runoff processes, the direct rainfall-on-grid approach is preferred, whereby rainfall is applied to every location within the catchment. Through this approach rainfall is applied to the two-dimensional grid representing the catchment and flows are routed through the grid. In this way, a direct rainfall-on-grid approach (which has been adopted for all sub-catchments of this study area) combines the hydrologic and hydraulic components of simulation into a single model.
TUFLOW is a 1D/2D hydrodynamic modelling package that was developed (and is still being expanded upon) in Australia. It is one of the worlds leading hydraulic modelling packages. TUFLOW has been subjected to extensive testing and validation, with results compared favourably to first-principle theory as well as other leading software packages.
TUFLOW is an acronym for Two-dimensional Unsteady FLOW modelling software. The two-dimensional aspect comes from the finite element grid method used for the aboveground hydraulic calculations; the unsteady aspect comes from its ability to calculate results that vary with time.
TUFLOW incorporates the ESTRY 1D network modelling system for modelling culverts and pipe networks. It is capable of modelling large urban catchments because of its ability to incorporate a pit and pipe network, and its strength of being able to nest 1D channels into a 2D domain. It can model the hydrology, the aboveground and the belowground hydraulics of a catchment at the same time.
3.1.2 Flood Study Data Provided
Five previous flood studies were provided by Canterbury-Bankstown Council to act as the primary basis for defining flood behaviour for the four Prospect Creek sub-catchments:
> Georges Hall Catchment Flood Study (BMT WBM, March 2013) commissioned by the former Bankstown City Council,
> Lansdowne Catchment Flood Study (BMT WBM, December 2012) commissioned by the former Bankstown City Council,
> Miller Road Catchment Flood Study (BMT WBM, December 2012) commissioned by the former Bankstown City Council,
> For the Villawood sub-catchment two previous flood studies were provided:
- Villawood Drain Work-as-Executed Study prepared by Civic Design on behalf of former Bankstown City Council (July 2008), and,
- Bennett Street Drain Upgrade, Chester Hill Flood Assessment (BMT WBM, August 2014). This study updates the modelling from the 2008 study and therefore supersedes this study as the adopted study for the sub-catchment.
As part of project inception, Canterbury-Bankstown Council provided Stantec with PDF copies of the flood study reports, as well as copies of the TUFLOW hydrology / hydraulic models and associated input files for all design storm runs. Included within this is GIS such as 2D materials layers, building polygons, modelled pit
Draft Final Flood Risk Management Study and Plan Prospect Creek Sub-Catchments 304600207 | 22 March 2024 21

and pipe data, model topography, and other relevant model inputs. In most instances, Council also provided processed GIS versions of model results from each of the studies for design storms runs including depth, velocity, water level, provisional hazard, and flood risk category mapping
3.1.3
Hydrology Model Set-up
All five of the studies adopt 1D/2D TUFLOW models as the basis for flood modelling, with all models also adopting a rainfall-on-grid or direct rainfall approach for hydrology within the TUFLOW model. Similarly, all of the models adopt design rainfall patterns and rainfall depths specified in Australian Rainfall and Runoff (ARR87) to the 2D domain. The rainfall depths for the Villawood model vary slightly from those adopted within the other three models due to the small spatial differences in ARR87 Intensity-Frequency-Duration (IFD) data. For example, the 1% AEP 2-hour rainfall depth for Villawood is 104.8mm, while for the other three models the rainfall depth for this same event is 102mm, a less than 3% difference.
The design events modelled within the 2014 Villawood model included the 1-year ARI, 2-year ARI, 20%, 10%, 5%, 2%, and 1% AEP storms. In addition, the 2008 Villawood model also included the Probable Maximum Flood (PMF) event, however this event was not updated for inclusion in the 2014 Villawood study. The Flood Studies for the other three sub-catchments included all of the above listed design storms as well as the 0.5%, 0.2% and 0.1% AEP storms.
For all four sub-catchments the critical duration for all design storms is the 2-hour event, with the exception of the PMF event for Villawood which is a 6-hour duration storm as outlined within Appendix E of the 2008 report. No areal reductions factors were applied to the design rainfalls, however for the Villawood PMF as the catchment was of sufficient size ellipses A and B were applied as in Appendix E of the 2008 report.
2D materials layers in the TUFLOW model have been used to apply initial and continuing rainfall losses in rainfall-on-grid hydrology. For all studies, pervious surfaces have been modelled with an initial and continuing loss of 10mm and 2.5mm/hr respectively. Impervious surfaces in all models have been modelled with initial and continuing losses of 0mm and 0mm/hr respectively.
3.1.4 2D Hydraulic Model Set-up
In the Villawood model, a 5-metre grid cell size was adopted in the 2008 study and retained in the 2014 study, while for the other three sub-catchment models a 2-metre grid cell size was adopted. The 5-metre grid cell size is considered generally suitable for this catchment as TUFLOW calculates at all corners of the centrepoints of the grid, therefore for the Villawood model simulates at 2.5 metre spacing, though the grid size is 5 metres. This resolution is considered to provide sufficient detail to reasonably model the hydraulic behaviour of flows through the urban areas including through building footprints.
The TUFLOW engine of the Villawood 2008 study was the 2007 version of the software, while this was updated in the 2014 Villawood study to the 2012-05-AE TUFLOW release. This 2012 TUFLOW engine is the same as that adopted in the other three sub-catchment models. As reported in the 2014 study report, the alterations made to the 2008 model helped to provide further model stability to the 2014 update of the Villawood model.
In the 2D domain buildings were not blocked in the sub-catchment models with the building footprints digitised and high roughness applied to these footprints. The Villawood model applied a very high roughness of 20.0 for buildings in floodway, while the other models adopted a more commonly used high roughness value of 1.0. The exception was the downstream industrial precinct of the Villawood model where the large building footprints were modelled as follows:
> Building perimeters were modelled as walls or z-shapes in the TUFLOW model. Through this approach the walls of the building are elevated several metres above the surrounding floodplain to represent their likely blockage stopping flows in the model from freely passing through the building footprint, or,
> Buildings that represent full blockage, the entire building footprint was elevated. This approach assumes that the buildings are essentially elevated above the surrounding ground or represent such a comprehensive blockage of flows to warrant elevation in the model above the floodplain.
Apart from the building footprints, 2D materials were modelled similarly across the models with depth varying roughness co-efficient (<30mm and >100mm flow depths thresholds) being the same for different land use types across all of the models. Roughness values for the Georges Hall, Lansdowne and Miller Road models are consistent across the three models. The roughness values are found in Table 3-1 of the Miller Road Catchment Flood Study report (BMT-WBM, 2012). Adopted roughness values for the Villawood model are summarised in Section 5.3.1 of the Villawood Drain Work-as-Executed Study (Civic Design, 2008).
Draft Final Flood Risk Management Study and Plan Prospect Creek Sub-Catchments 304600207 | 22 March 2024 22

3.1.5 1D Hydraulic Model Set-up
All of the models accounted for existing stormwater pit and pipe network in the 1D component of the model. In accordance with Council’s policy, under a ‘blocked’ condition a blockage rate of 20% for lintel pits and 50% for grate pits was applied to all models. For bridges and culverts with a diagonal opening of less than 6 metres, a 50% blockage factor was applied. The following blockage scenarios were applied to the models:
> Georges Hall, Lansdowne and Miller Road models: Both blocked (B) and unblocked (U) scenarios were applied to the design storm events to create a peak envelope,
> Villawood: In the 2008 study five separate blockage combinations were assessed with S2 (Woodville culverts only blocked) and S5 (blockage of Woodville Rd, Llewellyn Ave West, Llewellyn Ave East and Miller Road culverts) were combined to make an envelope approach for peak flood levels in design storms. However, in the 2014 update, just the S5 blockage scenario was retained as the only adopted blockage condition.
The only model with significant lengths of open channel is in the Villawood model in the downstream industrial precinct. These channel sections were modelled using 1D channel links. The majority of the channels were modelled within the 2008 study, however the Bennett Street channel upgrades were also included in the 2014 study model.
3.1.6 Downstream Boundary
Downstream conditions have been applied differently in each sub-catchment:
> Georges Hall, and Lansdowne: Constant water level boundaries for these sub-catchment models have been applied based on Georges River flood levels. The adopted levels vary based on the design event.
> Miller Road models: A constant level of 22.5m AHD has been applied for all design flood events. As the boundary has been extended sufficiently far downstream of Woodville Road the model is not sensitive to downstream boundary assumptions.
> Villawood: The downstream boundary of the Villawood model was established in the 2008 study as a stage-time series, as shown in Section 4.1.3 of the Flood Study report (Civic Design, 2008) As the boundary has been extended sufficiently far downstream of Woodville Road the model is not sensitive to downstream boundary assumptions.
3.1.7 Other Analysis
In addition to modelling of the design flood events, the Villawood 2008 study included a drainage capacity assessment, however this analysis was not updated as part of the 2014 study. The other three subcatchment models also include a pipe drainage capacity assessment.
All four models (the 2008 model for Villawood only) include provisional hazard mapping for the various design events, while the three non-Villawood models also include a climate change assessment for 10% rainfall increase for the 1% AEP event.
Finally, for the three non-Villawood flood studies, a building floor level survey was conducted by Bankstown City Council in 2011. This data was used to assess the overfloor flooding within the three study areas.
For the Georges Hall and Lansdowne flood studies, a combined flooding envelope was applied for peak Georges River flooding results to be overlayed over peak sub-catchment model results.
3.2 Other Flood Studies
Beyond the sub-catchment Flood Studies described above that form the basis for this FRMS&P, a range of additional flood-related studies have been sourced to inform this project as well. These flood studies mostly relate to mainstream flooding of the downstream floodplains of Georges River and Prospect Creek. While there are many additional versions of flood studies and floodplain risk management studies and plans for these mainstream floodplains, the focus in this instance has been on the latest available and currently adopted studies. A summary of these most relevant flood related studies is included in Table 3-1
Draft Final Flood Risk Management Study and Plan Prospect Creek Sub-Catchments 304600207 | 22 March 2024 23

Table 3-1
Creek Sub-Catchments
Summary of Flood Related Studies for Prospect Creek and Georges River Mainstream Floodplains Study Description Relevance to this Study
Prospect Creek Flood Study Review (Bewsher, 2006)
Prospect Creek Floodplain Management Plan Review (Bewsher, 2010)
A previous review of Prospect Creek Flood Levels was completed in 2004 by Stantec (Cardno Willing). The study was based on a RAFTS hydrologic catchment model and a 2D TUFLOW hydraulic model. A further review and update of these models was undertaken as part of the floodplain management plan by Bewsher. The design flooding was based on embedding the 2 and 9-hour ARR87 design rainfall within the 2001 historical rainfall pattern which was conducted for the 5%, 2%, and 1% AEP and PMF events.
A floodplain management study was previously prepared for Lower Prospect Creek (Willing & Partners, 1990) and Upper Prospect Creek (Willing & Partners, 1993). These studies provided a plan of flood mitigation works to alleviate flooding in Prospect Creek. Following the 2001 Prospect Creek flooding an update of the floodplain risk management study and plan was commissioned. Measures previously recommended for Prospect Creek were reviewed, and other new measures were considered for inclusion in the revised Plan.
This study defines the flood behaviour for Prospect Creek currently adopted by Fairfield Council. Stantec is currently preparing an updated Prospect Creek and Georges River Flood Study on behalf of Fairfield Council, however this study is ongoing and has not at this time been adopted by Fairfield Council. The study formed the basis for review of downstream boundary conditions for Villawood and Miller Road sub-catchments. However as discussed in Section 5.1.5 the extent of this study does not extend far enough upstream on Burns Creek to influence model boundaries.
The extent of this FRMS&P is for the Prospect Creek floodplain within Fairfield LGA, therefore there is no overlap with the sub-catchments study area. However, the flood risk management options and discussion in this report provides a useful insight into potential options and compatibility with flood risk management downstream of the study area within the neighbouring LGA. Examples include measures within the creek floodplain in Lansvale on the opposite bank of the creek from the Georges Hall and Lansdowne study areas, and in Fairfield East in Burns Creek downstream of Villawood and Miller Road study areas.
Sea Level Rise Impact Assessment for the Georges River (FloodMit, 2012)
Georges River Flood Study (BMT-WBM, 2019)
FloodMit Pty Ltd was commissioned by Bankstown City Council in July 2011 to assess the impact of potential sea level rise on tidal behaviour and flood behaviour in the Georges River. It followed an earlier study that was undertaken for Fairfield City Council. The study considered existing tidal conditions and the effect of climate change impacts on flooding along Georges River from Liverpool Weir down to Botany Bay. The study considered the impacts on 1% AEP flooding for the 0.4m and 0.9m Sea Level Rise (SLR), as well as combined 0.9m SLR and 10% rainfall increase.
Prepared for Liverpool City and CanterburyBankstown Councils to review the flood behaviour across the floodplain of Georges River. A 2D TUFLOW HPC hydraulic model was established from Cambridge Ave to downstream of the Salt Pan Creek confluence. The design flooding has been based on ARR87 design rainfall, with a sensitivity assessment of ARR2019. The model was simulated for the 20%, 10%, 5%, 2%, 1%, and 0.2% AEP and Extreme events.
The baseline existing climate 1% AEP conditions from this 2012 study have been superseded by the 2019 flood study discussed below. However, the 2019 flood study does not provide peak levels or impacts for climate change scenarios considering sea level rise, only 10% rainfall increase. Therefore in lieu of more up to date data, this study was used to determine the level impacts of a combined 0.9m SLR and 10% rainfall increase on peak flooding at the downstream boundary of the Georges Hall and Lansdowne sub-catchments models (refer to Section 5.2 for further discussion).
This project is the currently adopted Flood Study that defines flooding for the Georges River floodplain. As the Georges Hall and Lansdowne study areas are near the confluence of Prospect Creek and Georges River it is assumed that Georges River flooding is dominant at this location. Therefore, review of downstream boundary conditions for the two sub-catchment base case models was based on this studies outputs.
Canterbury-Bankstown Council provided TUFLOW model and results for the Georges River Flood Study (BMT-WBM, 2019) to Stantec on 28 January 2022 to inform the downstream conditions of the Georges Hall and Lansdowne sub-catchment model downstream boundary conditions as discussed in Section 5.1.5.
3.3 Site Visits
Following the initial desktop data review and model setup, Stantec and Council flood engineers conducted a site visit of the areas of interests / critical locations within the study area. This was beneficial for the project team to further familiarise with the study area. Particular attention was paid to the hotspots identified in the previous Flood Studies, and locations that may be candidates for flood mitigation measures to relieve flood affectation at these locations. Key observations recorded during the site visit included:
Draft Final Flood Risk Management Study and Plan Prospect
304600207 | 22 March 2024 24

> Local drainage systems, mainly the key hydraulic structures and stormwater outlets,
> Hydraulic controls such as roads, bridges, culverts, and topographic controls,
> Debris causing temporary obstructions and permanent obstructions from development to the flowpaths,
> Low lying and possibly flood affected areas based on review of flood model results, and,
> Flood affected open space areas and parks for potential flood detention opportunities.
The site visit was conducted over two days, with sites in the Georges Hall and Lansdowne sub-catchments inspected on the 20 April 2022, and Miller Road and Villawood sub-catchment sites inspected on the 21 April 2022. In total, 80 sites were inspected over the two days with the visited locations shown in Figure 3-1. The number of locations for each of the sub-catchments was as follows:
> Georges Hall – 16 sites,
> Lansdowne – 17 sites,
> Miller Road – 12 sites, and,
> Villawood – 35 sites.
Photos and notes were recorded by our engineers providing information about potential flooding concerns at the visited locations, and potential opportunities and constraints on any possible flood risk management options at all 80 locations. The observations made at these various sites were important in considering the feasibility of any potential options.
A detailed summary of the site visit observations and preliminary options discussions from the site visits are provided in Appendix F
3.4 Floor Level Survey
Floor level survey was prepared for the Georges Hall, Lansdowne and Miller Road sub-catchments as part of the Flood Studies summarised in Section 3.1. Council provided copies of the floor level survey for these three study areas on 28 April 2022. The provided survey data was in GIS format as points with survey points for the following:
> Floor level points including surveyed floor level in m AHD,
> Floor level estimate points for sites with no access,
> Ground level points, and,
> Natural surface points.
Of most relevance to this study is the floor level points from the first bullet point above. These surveyed floor levels have been used to define floor levels for most of the flood affected properties in these three subcatchments. In total, there were 587 surveyed floor levels with:
> Georges Hall – 166 surveyed floor levels,
> Lansdowne – 304 surveyed floor levels, and,
> Miller Road – 117 surveyed floor levels.
The location of the surveyed floor level points are shown in Figure 3-2 For flood affected buildings that did not have surveyed levels from this database, floor levels were estimated as discussed further in Section 7.2.3
Draft Final Flood Risk Management Study and Plan Prospect Creek Sub-Catchments 304600207 | 22 March 2024 25

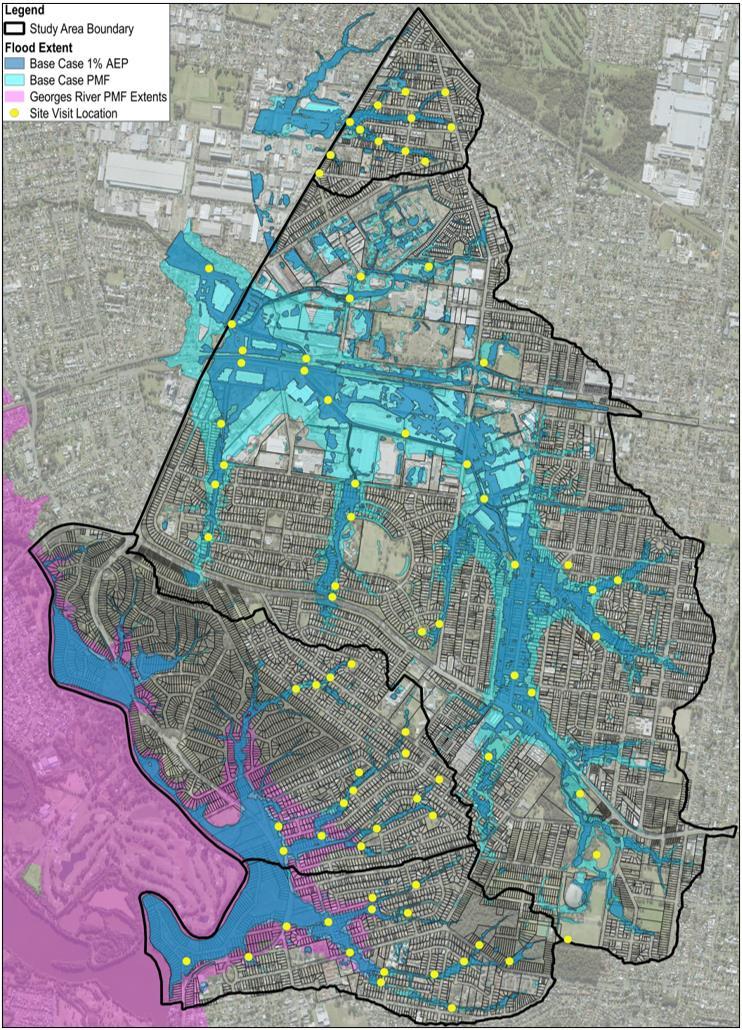
Draft Final Flood Risk Management Study and Plan Prospect Creek Sub-Catchments 304600207 | 22 March 2024 26
Figure 3-1 Site Visit Locations

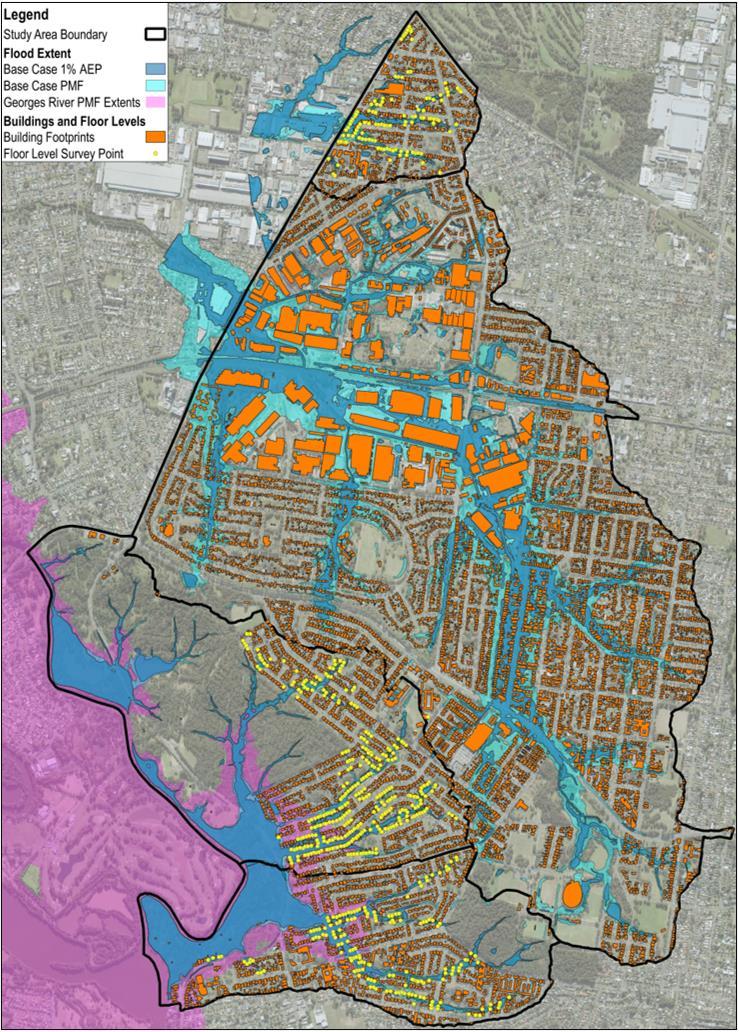
Draft Final Flood Risk Management Study and Plan Prospect Creek Sub-Catchments 304600207 | 22 March 2024 27
Figure 3-2 Floor Level Survey and Building Footprints (Geoscape, 2020)

3.5 GIS Data
3.5.1
Council Data
As part of project inception, on 7 October 2021 Canterbury-Bankstown Council provided Stantec with the following GIS data for the study:
> Local Government Area (LGA) boundary,
> Cadastral boundary layer,
> Road centrelines,
> Catchment and sub-catchment boundary layer,
> Stormwater pit and pipe network,
> Local Environment Plan (LEP) Acid Sulfate Soil (ASS) layer,
> State Environmental Planning Policy (SEPP) 2016 Coastal Management layer,
> Council local heritage layers,
> Sydney Water assets layer,
> Vulnerable facilities layer, and
> Aerial imagery from June 2020
Aside from these GIS layers provided by Council during the early stages of the project, various other publicly available GIS layers were sourced by Stantec for this study including high quality aerial imagery from MetroMap (2021) recorded at various periods for the Study Area and its surrounds. This aided in not only providing details about the current site, but also the historical site at the time of the Flood Study. Another example is the various flora and fauna and heritage GIS databases described in Section 2.5
3.5.2
ELVIS LiDAR
The ELVIS - Elevation and Depth - Foundation Spatial Data website was accessed with two datasets available from the website. The files appear to have been recorded on the following dates:
> April 2013,
> June 2019, and
> May 2020.
All three files appear to be 1m x 1m ASC grid data set in 2km x 2km with an accuracy of 0.3m (95% Confidence Interval) vertical and 0.8m (95% Confidence Interval) horizontal in GDA94 and MGAz56
Review of the three LiDAR datasets showed that the June 2019 LiDAR data provided the most comprehensive coverage, accuracy and latest available dataset that covered the entire study area of the four sub-catchments.
3.5.3
Building Footprints
NSW DCCEEW provided Stantec access to a building footprint layer recorded by Geoscape in September 2020. This layer covered all four sub-catchments. When compared to the previous building footprint layer accounted for within the various Flood Study models, the level of detail in the Geoscape layer was assessed to be better, relating to more up to date and enhanced sampling techniques.
A review of this September 2020 building footprint layer against the previous Flood Study footprints showed significant differences. This is expected to be attributable to improved recording techniques in the more recent GIS database, and in some locations as a result of recent development altering the building footprints since the Flood Study layers were prepared. The layout of the building footprint layer is shown in Figure 3-2
Draft Final Flood Risk Management Study and Plan Prospect Creek Sub-Catchments 304600207 | 22 March 2024 28
.

4 Consultation
4.1 Consultation Process
Consultation with the community and stakeholders is an important component in the development of a Flood Risk Management Study and Plan. Consultation provides an opportunity to collect feedback and observations from the community on problem areas and potential flood risk management measures. It also provides a mechanism to inform the community about the current study and flood risk within the Study Area and seeks to improve their awareness and readiness for dealing with flooding.
The consultation strategy has been divided into two key sections:
> Consultation in FRMS&P development: This will occur during Phases A to E of the project (refer to Section 1.4 for phase descriptions) and will involve both informing the community and stakeholders of the project and gathering information on existing flooding issues and suggestions for flood risk management options.
> Public exhibition of draft FRMS&P: This will occur in Phase G of the project, with comments sought from the community and stakeholders on the draft FRMS&P report with this input to be reviewed and incorporated into the final FRMS&P.
The strategy has been developed in accordance with the IAP2 Quality Assurance Standard and the Canterbury-Bankstown Council Community Participation Plan.
4.2 Consultation Plan and Engagement Techniques
A consultation plan has been developed in the preliminary phases of this project involving the development of several engagement techniques to achieve the objectives of the two stages of the consultation process. Details of the plan are provided below in Table 4-1 The completed or drafted components of the plan to date have been shown in italics in the table.
Table 4-1 Consultation Plan and Proposed Engagement Techniques
Stakeholder Consultation –Council
Stakeholder Consultation –Agencies
Press Release
Consultation in FRSM&P development
Occupant and Owner Letter
Have Your Say Page and Online Survey / Questionnaire
Relevant Council staff attended the inception meeting to discuss various input to the study and the proposed study approach. Regular project update meetings will be scheduled throughout the project.
Stantec contact relevant agency stakeholders via letter and follow up email and/or phone.
Stantec draft a press release for Council’s consideration and publication on the Have Your Say page for the project and through Council’s social media platforms
Stantec draft a letter of introduction for the study for Council to print and distribute to flood affected property owners and occupants within the catchment. The letters include a link and QR code to the Have Your Say page.
Council will host a dedicated “Have Your Say” website for the project. The website will be utilised for media release, continued project updates, online survey / questionnaire providing residents with an opportunity to locate the area of flooding on a GIS based system and upload an associated photos/videos they may wish to share.
Council objectives are achieved by the study
Council is informed and provides feedback throughout the study.
Inform the agencies of the study.
Obtain relevant information.
Provide an opportunity for input from the relevant agencies.
Public awareness of the study
Assist in engagement with the community
Assist in the public acceptance of the study outcomes and implications for development and flood risk management in the future
Inform the community about the study and provide background information
Provide the community a link to further information and online survey
Collaborative community engagement process
Provide information to the community and opportunity to provide input/feedback
Identify community concerns and awareness
Develop and maintain community confidence in the study results
Draft Final Flood Risk Management Study and Plan Prospect Creek Sub-Catchments 304600207 | 22 March 2024 29
Consultation Stage Engagement Technique Description Expected Outcome

Public exhibition of draft FRMS&P
In-Person Community Information Sessions
Consultation –Council and Flood Advisory Committee
Have Your Say update
Stantec will prepare materials for and attend two community information sessions to be hosted by Council representatives.
Stantec will attend and present at four stakeholder meetings (which may include Flood Advisory Committee as deemed suitable) throughout the study.
Council to update the Have Your Say page for the project to provide the community access to the Draft FRMS&P report.
Public Exhibition Council will arrange for the public exhibition of the Draft FRMS&P with submissions to be sought through various means.
Community Information Sessions
Stantec will prepare materials for and present at two community information sessions during public exhibition
4.3 Council Engagement
Provide the community with an opportunity to comment on flood experience and preferences on mitigation options prior to option development
Opportunity for the community to ask questions and discuss flood risk
Update stakeholders on the FRMS&P process
Provide an opportunity for input from the stakeholders on the mitigation options
Inform the community of the draft FRMS&P and invite submissions
Inform the community of the two information sessions
Provide an opportunity for the community to review and provide comment on the Draft FRMS&P.
Provide the community with an opportunity to comment on flood mitigation options and an understanding of the outcomes of the Draft FRMS&P.
Given Canterbury-Bankstown Council’s role in commissioning this FRMS&P, it is important that Stantec maintain constant engagement with Council’s project manager throughout the project. Furthermore, NSW Department of Climate Change, Energy, the Environment and Water (DCCEEW) have maintained an active role in project supervision throughout the project. Both Council and DCCEEW representatives have been part of the project technical working group (TWG) which has met with Stantec as the consultants to agree on technical decisions and pathway throughout the project. To date, TWG engagement has been maintained through the following:
> An online project inception meeting was held on 1 October 2021 with Council, DCCEEW and Stantec representatives in attendance. The inception meeting signified the commencement of the project and provided an opportunity for Council to outline the objectives and expectations for the study, and to provide initial guidance and direction.
> Fortnightly online project update meetings have been conducted since project inception with Council, DCCEEW and Stantec project managers in attendance as well as other Stantec staff as needed. The update meetings have provided an opportunity for Stantec to update Council on the ongoing status of the project, and to ask Council for any clarifications or queries that arise during the project.
> Workshops with Council technical staff from various teams, and NSW DCCEEW have been conducted to present preliminary options and determine suitable priority for options into detailed options. Similarly workshops were held with Council and DCCEEW to present detailed option assessment outcomes.
4.4 Flood Risk Management Committee
One of the primary mechanisms by which the study team engaged in consultation with key stakeholders and the community is via the Canterbury-Bankstown City Flood Risk Management Committee (FRM Committee) convened by Council. The Committee includes membership by the following individuals:
> Four local community representatives and two local business representatives,
> A number of staff from Canterbury Bankstown Council who have involvement in the study including team leaders, managers, planners, and co-ordinators.
> Five SES representatives,
Draft Final Flood Risk Management Study and Plan Prospect Creek Sub-Catchments 304600207 | 22 March 2024 30
Stage Engagement Technique
Expected
Consultation
Description
Outcome

> Floodplain Engineer from NSW DCCEEW,
> One flood planning representative from each of the surrounding Councils, Inner West, Fairfield City, Georges River, Burwood, and Bayside.
This project was presented to the FRM Committee at the following meetings throughout the project:
> The first FRM Committee meeting was held on 21 September 2022 to discuss the progress of the project including the outcomes discussed within the Interim Report 2.
> The second FRM Committee meeting was held on 3 May 2023 to discuss the flood modification options development, the process for selection of preferred options from the preliminary list for detailed assessment, and to summarise the Multi-Criteria Assessment scoring development process.
> The third FRM Committee meeting was held on 26 July 2023 to present the Draft Final FRMS&P report to the Committee , with some comments raised by the Committee to be addressed prior to adoption.
> The fourth FRM Committee meeting was held on 20 March 2024 to present the revised Draft Final report to the Committee During the meeting the committee endorsed this report to go on public exhibition
> The fifth FRM Committee meeting will present outcomes of the public exhibition, the comments received from the community and how these were applied to the Final FRMS&P report. This meeting will occur prior to potential Council endorsement and adoption of the final study
4.5 Stakeholder Engagement
As part of this FRMS&P, it is important that relevant stakeholder agencies be consulted and engaged throughout the project to inform the agencies of the study, obtain relevant information, and provide an opportunity for input from the relevant agencies.
Canterbury-Bankstown Council provided Stantec with contact information for representatives of four stakeholder agencies:
> NSW State Emergency Service (SES)
> Transport for New South Wales (TfNSW),
> Sydney Trains, and,
> Sydney Water.
Stantec issued stakeholder letters to these four agencies in February 2022 (July 2022 for Sydney Trains) notifying them of the study and seeking any information or concerns the agencies had relating to flooding in the study area. The key outcomes of the agency consultation were:
> Stantec received a response from Sydney Water representatives noting that Sydney water has no stormwater assets within the study area, however does have two wastewater pumping stations within the study area (refer to Section 2.8.1 for locations). Sydney Water representatives provided details relating to these pump stations and their respective elevations in relation to Sydney Water recorded design flood elevations at each. Sydney Water noted there is no record of previous flood affectation or flood damages for these assets.
> A meeting with NSW SES representatives was held on 11 August 2022 with input from SES on the current information and projects underway and providing comment on current agency positions on flood risk and relevant information presented in FRMS&P documents. The outcomes from this discussion were utilised in developing the flood emergency response review discussed in
> Sydney Trains responded in relation to the waterway rail crossings in the Villawood sub-catchments noting that no topographic survey of the waterway crossings was available.
4.6 Initial Consultation
The initial consultation period was held from 27 July 2022 to 26 August 2022. During this period the following materials were made available to the community:
> A dedicated Have Your Say page was posted for the project, which has been maintained following the initial consultation period to continue to provide updates to the community as the project progresses. The text for the Have Your Say page has been included in Appendix A
> Press release information for the study was posted to Council’s social media and to Council’s newsletter.
Draft Final Flood Risk Management Study and Plan Prospect Creek Sub-Catchments 304600207 | 22 March 2024 31

> Introductory letters were mailed to all owners and occupants of flood affected properties in the study area, which involved mail out to approximately 2,000 properties. The resident letter template provided an introduction to the study, and a link and QR code to the Have Your Say page for further information and to complete the online survey. The letter text is included in Appendix A.
> A resident online survey / questionnaire was hosted by Stantec through an online portal, with links to the online survey provided on the projects Have Your Say page. The survey also included the opportunity for residents to provide notes on an interactive online map. The survey text is included in Appendix A.
> Two in-person information sessions were hosted by Council and attended by Stantec flood engineers and Council representatives. Notification of the in-person sessions was posted on the Have Your Say page and in the introductory letter (for the first session). The details for the two sessions were (set-ups for both sessions shown in Figure 4-1):
- Bass Hill Plaza, Hume Highway on 4 August 2022 from 5.00 – 7.00pm
- Georges Hall Village, Haig Avenue and Georges Crescent on 18 August 2022 from 10am to 12pm


4.6.2
Consultation Response Outcomes
Across the initial consultation period there were approximately 37 recorded responses through one of three response methods:
> Online survey had 27 respondents.
> Have Your Say photo and video uploads by 5 different participants, and,
> Email responses submitted to Council by 5 respondents
In addition, there were approximately 30 community attendees to the two in-person information sessions, 25 at the first session and a further 5 at the second session.
Across these 67 total engagements, there were often several engagements for some households, most commonly residents attending in-person sessions often completed another form of response such as an online survey. There were responses related to approximately 33 individual properties with the location and types of engagements shown in Figure 4-2. The majority of engagements were in relation to Villawood (17 properties) and Georges Hall sub-catchments (10 properties).
With respect to Have Your Say outcomes from the initial consultation, there were 476 views of the project page, initiated by 246 unique visitors. The total viewing time of project information was over 11 hours.
Draft Final Flood Risk Management Study and Plan Prospect Creek Sub-Catchments 304600207 | 22 March 2024 32
Figure 4-1 In-Person Information Session Set-ups for Bass Hill Plaza (Left) and Georges Hall Village (Right)

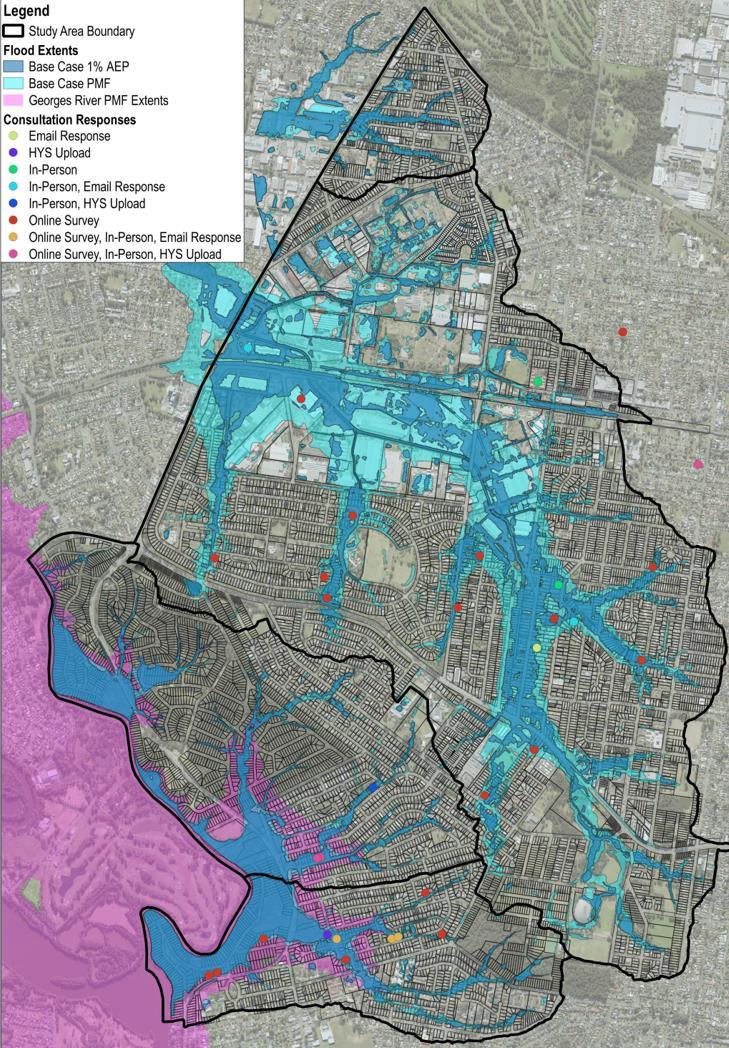
Draft Final Flood Risk Management Study and Plan Prospect Creek Sub-Catchments 304600207 | 22 March 2024 33
Figure 4-2 Consultation Responses Summary

4.6.3 Online Survey Outcomes
Of the 27 respondents to the online survey, some of the key responses to the survey included:
> 74% of respondents (20 of 27) were owner occupiers, 15% rented (4 of 27), 4% (1 of 27) a business and 2 other (public housing and lease of Council owned building),
> 33% of respondents (9 of 27) had been residents more than 65 years,
> 81% (22 of 27) English is the main language at home with Arabic (2), Italian and Vietnamese (1 each),
> Most respondents (70%, 19 of 27) think email is the best contact method, followed by mailouts (67%, 18 of 27). Council website, local paper and information days were the next most popular methods
> 41% (11 of 27) have experienced flooding of their home or business, 63% (17 of 27) experienced flooding of their yard, and only 15% (4 of 27) had experienced no flooding at all,
> 67% (18 of 27) had observed flooding in 2022 alone, mostly in March or July,
> 63% (17 of 27) are concerned about flooding and future climates, with 33% (9 of 27) not concerned (2 respondents were N/A)
> 74% (20 of 27) believe Council should address the impacts of an uncertain future climate on flooding
Relating to the perceived main cause of flooding for the community, a summary of the percentage of responses for the online survey question is shown in Figure 4-3. Insufficient capacity in stormwater drainage was noted as the most common main cause of flooding from the survey responses, followed by stormwater or overland flows to drainage.

There was a question within the online survey in regard to preferred flood risk management options, with ranking of 14 nominated options with a score of 1 being most preferred and 5 being least preferred. From the survey response outcomes, the 14 options are ranked from most to least preferred in Table 4-2, with N/A scores disregarded in the average score The key outcomes are:
> Based on average score, the most preferred option is flood forecasting and warning systems, followed by flood education programs both non-structural options.
> Based on average score, the highest ranked structural option was increasing stormwater channel sizes, followed by increasing pipe / culvert / bridge sizes, and then road raising, levees and detention basins.
> In terms of the most number of 1st rankings (most preferred), increasing stormwater channel size had the most at 9, followed by increasing pipe / culvert / bridge sizes, however both of these options also had 6 5th rankings (least preferred). This suggests that these two stormwater upgrade options may be polarising in the community, with seemingly strong support and opposition for both, though on balance there is more support than opposition resulting in them being the 3rd and 4th most preferred based on average scores.
> Conversely, flood forecasting / warning and flood education programs have only six 1st ranking scores each, but only three 5th ranking scores suggesting there is less opposition to these options explaining why on average they are the highest ranked two options.
> In terms of least preferred options, on average score voluntary purchase in both its listed forms are in the bottom three options, along with rainwater tanks and rainwater harvesting.
Draft Final Flood Risk Management Study and Plan Prospect Creek Sub-Catchments 304600207 | 22 March 2024 34
Figure 4-3
Proportion of Online Survey Responses for the Perceived Main Cause of Flooding for the Community

4.7
Public Exhibition Period
The public exhibition period is an important phase of any regional Flood Study or FRMS&P as it provides the community and stakeholders the opportunity to provide comment and feedback on the draft outcomes of the study prior to finalisation.
The public exhibition period for this Draft report is proposed to be conducted in the first half of 2024, for a period of at least four weeks. Comments received from the community will be considered in a Final FRMS&P report to be issued post-exhibition. Outcomes of the public exhibition shall be summarised in this section within the Final FRMS&P.
Draft Final Flood Risk Management Study and Plan Prospect Creek Sub-Catchments 304600207 | 22 March 2024 35 Table 4-2 Online Survey Responses for Preferred Flood Risk Management Options Ranked from Most to Least Preferred Flood Risk Management Option 1st Rank 2nd Rank 3rd Rank 4th Rank 5th Rank N/A Average Score
evacuation planning
early
resources
improved radio
phone
6 3 1 0 3 6 2.31 12 - Education of community, providing greater awareness of potential flood hazards 6 2 1 1 3 6 2.46 6 - Increasing stormwater channel size 9 2 1 0 6 4 2.56 4 - Culvert / bridge / pipe enlarging 8 3 0 0 6 3 2.59 11 - Changes in road surface to keep stormwater in the road and away from private properties 6 3 0 0 5 6 2.64
13 - Flood forecasting, flood warning,
and emergency response such as
warning systems, improved local SES capabilities/
or
and
communications
create an elevated ground embankment protecting from flooding 7 1 2 0 5 5 2.67
- Detention basins, these temporarily hold water in open space areas and reduce flooding downstream 6 2 3 1 4 5 2.69 8 - Planning and flood related development controls to ensure future development is at lower risk of flooding 7 3 1 0 6 5 2.71 7 - Replacement of concrete channels with natural waterways 3 4 3 2 3 3 2.87 3 - Stormwater treatment devices to improve water quality in local waterways 5 2 2 1 7 5 3.18 14 - Other 1 0 1 0 2 8 3.50 9 - Voluntary raising of houses to reduce flood damages by raising floor levels above a design flood 2 2 1 1 6 7 3.58 1
other stormwater harvesting uses 3 0 6 0 8 5 3.59
highly flood affected properties
any buildings on the property 2 1 1 2 6 7 3.75
5 - Levee banks which
2
- Rainwater tanks and
10 - Voluntary purchase of
by Council and demolition of

5 Flood Study Model Review and Update
In the preliminary stages of the project, Stantec reviewed all available data including the previous models from the four sub-catchment Flood Studies (2014 Study for Villawood) that will form the basis of the FRMS&P modelling. A brief overview of these models is included in Section 3.1
Within this initial review phase, it was agreed with Council and DCCEEW that an updated base case (existing) model of the four sub-catchments be established for the purposes of the FRMS&P. Generally, it was found that the flood study models are suitable for adoption, however some minor improvements or adjustments to the models were required. The changes to the models include updating to the latest version of TUFLOW, updating building footprints and downstream boundaries to reflect latest available information, and to account for developments and changes in the sub-catchments since the flood studies were completed. These model updates will set a new existing condition model to act as the basis for analysis for proposed flood risk management options within the FRMS&P. The set-up and outcomes of these base case models is discussed in Section 5.1.
The base case models were simulated for the 20%, 5%, 2% and 1% AEP and PMF design flood events. These five events form the basis for flood risk management options assessment in this study and plan, and therefore have been updated within the base case models.
Discussions with Council and DCCEEW discussed the merits of updating the design rainfall approach of the Flood Studies that used ARR87 methodology with ARR2019 design rainfall methodology that has been released after the completion of the flood studies. While ARR2019 is the latest available guidance for design rainfall development, it was decided to retain ARR87 methodology to remain consistent with the flood studies and as it is likely to be a more conservative assessment of flood affectation.
In addition to the updated base case models for all four sub-catchment models, climate change impacts have been assessed as summarised in Section 5.2
5.1 Updated Base Case Model Set-up
5.1.1 Updated TUFLOW Engine
The base case models adopt the latest version of the TUFLOW engine that is stable and well established, which at this time is 2020-10-AA. This will be updated from the previous Flood Study TUFLOW engines which were all modelled in 2012 iterations of TUFLOW. The update in TUFLOW version brings the models in line with the latest industry adopted standard model version, and to possibly incorporate any marginal improvements in model processes that may have been developed in TUFLOW updates subsequent to 2012
The model engine was retained as TUFLOW Classic (CPU) and was not converted to TUFLOW HPC (GPU) as this change would possibly result in more significant model differences to the previous flood studies. In any case, the model runtimes of the flood study models are fast given the relatively small catchment areas, therefore TUFLOW Classic was considered suitable for retention.
Review of preliminary model results showed that updating to the more recent TUFLOW engine did not cause significant result differences compared to the previous flood study models (typically less than 1cm throughout study areas) The exception was for the PMF event in all four sub-catchments, where the extreme volumes of water in this simulation further pronounced any differences in the two TUFLOW versions. The updating of the TUFLOW engine resulting in minor peak water level reductions in the PMF event models for all four sub-catchments, however in the context of the scale of PMF event the differences are considered minor (see Section 5.2.1 for further discussion).
5.1.2 Review of Model Terrain
A review of the available LiDAR recorded in 2019 (see Section 3.5.2) and sourced from the ELVIS portal showed some differences in elevations with the flood study model terrains. These previous model terrains were mostly based on LiDAR data recorded in 2003. However, across most of the study area these terrain differences with the latest LiDAR were relatively minor. Furthermore, an extensive review and ground truthing process was conducted as part of the Villawood 2008 study confirming the suitability of the previous LiDAR based on ground survey. Therefore, due to the minor differences, and previous extensive review and ground truthing, it was decided to retain the flood study model terrain in the base case models for all four sub-catchments.
The exception was for recent development sites where 2019 LiDAR was applied to these sites to account for development that had occurred since the flood studies, as discussed further in the following sub-section.
Draft Final Flood Risk Management Study and Plan Prospect Creek Sub-Catchments 304600207 | 22 March 2024 36

5.1.3 Recent Development Sites
One of the key objectives of the base case model updates was to account for the changes in the study area that had occurred since the flood studies were completed between 2012 and 2014. An extensive review was conducted of the four sub-catchments to identify all significant development sites over the past decade. In this instance single dwelling residential and other minor developments were not considered, as it is assumed these minor developments would have negligible impact on flood behaviour.
The review and identification of recent development sites was based on the following information (the sourcing of all of this information is discussed in Section 3):
> Council provided a series of WAE plans and associated documents for 12 sites in the study area. This documentation provided proof of development for these sites, as well as details about the site changes,
> Comparison of the flood study building footprints layer to the more recent 2020 footprints helped to identify sites with significant changes in building footprint,
> Review of historical and current aerial images to identify large changes in site conditions, and,
> Terrain differences from the 2019 LiDAR and the flood study terrain was used to identify sites where significant cut and fill had likely occurred.
Based on this review, 23 recent development sites were identified within the four sub-catchment study areas. This included two sites in Georges Hall, and four sites in Miller Road. In Lansdowne, two sites were identified in the upper portion of the study area, across the ridgeline with the Villawood model near the Hume Highway. In addition to the two sites that are across the boundary with the Lansdowne sub-catchment, a further 15 development sites have been identified in the Villawood sub-catchment. The location of these 23 recent development sites are included in the mapping provided in Appendix B
The potential impacts of these recent developments on flood behaviour have been accounted for within the base case models as follows:
> Similar to the rest of the study area (see next sub-section for discussion), building footprints were updated for these sites to the 2020 footprint layer provided by DCCEEW. This accounts for any changes in building footprint as a result of the development (typically this is construction of new buildings).
> Model terrain for the development sites was updated to reflect 2019 LiDAR data to represent the cut and fill changes in landform from the development. The terrain differences for the base case models compared to flood study models has been included in Figure 3, 10, 17, and 24 of Appendix B.
In addition to these recent development sites, the intent was to also include stormwater drainage upgrades greater than 600mm diameter in the base case models. However following review of their records, Council’s stormwater drainage team confirmed that no such large drainage upgrades had occurred since 2012-2014, therefore no changes were made to the 1D drainage layers of the previous flood study models.
5.1.4 Building Footprint Updates
A detailed review was conducted of the 2020 building footprint layer provided by DCCEEW compared to the flood study building footprints. This review showed that there were widespread changes in building footprints throughout the study area, not just for recent development sites where buildings had been constructed or altered. These changes are a result in enhanced sampling techniques that have been improved over the past decade. Generally, the more recent buildings layer has larger footprints than the flood study model layer throughout all four sub-catchment study areas. Review of aerial imagery confirmed that the 2020 footprint layer appears to more closely reflect observed building layouts than the previous flood study models.
In discussions with Council and DCCEEW it was agreed that as a result of the availability of this more recent data, the base case models were updated with the materials layer adopting the 2020 building footprints. This represents a significant change in the four models as it alters both the hydrology in the form of rainfall losses, and hydraulic component through altered roughness mapping. As the building footprints are generally larger in the 2020 layer, typically this results in marginally increased runoff throughout much of the study area due to the areas of reduced rainfall losses, and marginally greater depth of flooding in residential areas due to the areas of higher roughness.
The revised materials layers for the base case models have been included in Figures 1, 8, 15 and 22 of Appendix B. A comparison of previous flood study and base case building footprints has been included in Figures 2, 9, 16, and 23 of Appendix B.
As it relates to other flow obstructions common in urban environments, such as fences, these have not been discretely modelled in any of the base case models. However the blockage effects of fences are accounted
Draft Final Flood Risk Management Study and Plan Prospect Creek Sub-Catchments 304600207 | 22 March 2024 37

for within a composite residential roughness value that is higher than open space areas. This increased roughness value is a suitable approximation of blockages posed by fences and other obstructions in residential properties.
5.1.5 Updates to Downstream Boundary Conditions
The downstream boundary conditions adopted within the four sub-catchment models were reviewed in light of the latest available flood information from studies discussed in Section 3.2. For Miller Road and Villawood sub-catchment models, the flood study downstream boundary conditions were retained as there was no alterations to flood information in this upper Burns Creek area. Furthermore, as the model boundary of these sub-catchments was extended sufficiently far downstream, flood modelling in the study area upstream of Woodville Road is not sensitive to downstream boundary conditions. Therefore, the downstream boundary for these two models was not altered in the base case models.
For the Georges Hall and Lansdowne sub-catchments, downstream boundaries are within the lower portions of the Prospect Creek floodplain where Georges River flooding is considered dominant. Therefore, the previously adopted constant water levels were reviewed compared to peak flood level results at this location from the recent Georges River Flood Study (BMT-WBM, 2019). It was found that the recent update in Georges River flood information from this study required updates in downstream boundary levels in the two base case models. The suitable coincidence of Georges River flood event with local sub-catchment flood event was based on guidance from the Floodplain Risk Management Guide – Modelling the Interaction of Catchment Flooding and Oceanic Inundation in Coastal Waterways (NSW Government, 2015). For frequent local flood events, the downstream coincident event is not based on flooding, but rather the Higher High Water Spring Solstice (HHWS) tide level. A summary of downstream coincident events for Georges River floods is included in Table 5-1
Peak flood levels for the base case models for these downstream flood events were mostly sourced through interrogation of peak water level results from the Georges River Flood Study (BMT-WBM, 2019). Review of model results along the downstream boundary of the sub-catchments was conducted to determine a suitable level. As there is a relatively low flood level gradient in Georges River flooding at these locations, a single level representative of the section of floodplain signifying the downstream boundary of the model was possible.
The HHWS tide level for the frequent flood events was determined using Figure 3-1 of the Sea Level Rise Impact Assessment for the Georges River (FloodMit, 2012). This figure provided a long section of tidal conditions, including the HHWS along the Georges River, with the HHWS level of 1.92m AHD at the nearest reporting location of Milperra Bridge adopted.
A summary of the adopted constant downstream boundary levels in the Georges Hall and Lansdowne base case models is included in Table 5-1. Also included in the table is a comparison to previously adopted levels from the two sub-catchment flood studies. The adopted downstream levels for the two models are between 0.07 – 0.13 metres higher in the base case models for the 2% AEP, 1% AEP and PMF events as a result of adoption of the 2019 Georges River study results. However, the downstream levels for the 20% AEP and 5% AEP events are 0.28 metres lower than the flood study adopted levels due to HHWS review.
Draft Final Flood Risk Management Study and Plan Prospect Creek Sub-Catchments 304600207 | 22 March 2024 38
Event
(in m
Sub-Catchment Base Case Models Compared to Previous Flood Study Models Local Subcatchment Flood Georges River Event Georges Hall Sub-Catchment Lansdowne Sub-Catchment Flood Study Base Case Flood Study Base Case 20% AEP HHWS Tide 2.2 1.92 2.2 1.92 5% AEP HHWS Tide 2.2 1.92 2.2 1.92 2% AEP 5% AEP 5.5 5.62 5.5 5.63 1% AEP 5% AEP 5.5 5.62 5.5 5.63 PMF 1% AEP 6.4 6.47 6.4 6.49 1% AEP plus 10% increase plus 0.9m Sea Level Rise 5% AEP plus 10% increase plus 0.9m Sea Level Rise N/A 5.93 N/A 5.95
Table 5-1 Proposed Downstream Flood
Coincidence Georges River Flood Levels
AHD) for Georges Hall and Lansdowne

5.1.6 Villawood PMF Model Update
As discussed in Section 3.1, Council provided Stantec with the necessary flood study model files to review and simulate the TUFLOW models. This allowed for the above base case set-up procedure to be established based on the latest available flood study models. The exception was the Villawood PMF model, which was not simulated in the 2014 study model, and therefore was not updated from the 2008 study model.
As discussed in the 2014 study report, there were some instabilities in the 2008 study model that were addressed within the 2014 study updates. In addition, as is often the case in modelling the additional volumes simulated in the PMF adds further instabilities into models. Therefore, in updating the Villawood PMF model for the base case model changes Stantec faced difficulties in creating a stable model that could run for the previous 5.5 hour run time of the 2008 study model. Stantec matched the model simplifications of the 2008 study PMF model and reduced the timestep for the PMF run. As such Stantec was able to create a more stable base case PMF model for Villawood that was able to simulate for most scenarios. The only exception was for the FV8 option where the PMF model was not able to simulated due to instabilities.
5.2
5.2.1
Updated Base Case Model Results
Comparison to Flood Study Results
In order to assess the impacts of the base case model updates compared to the previous flood study, peak water level and velocity differences have been mapped for the 1% AEP and PMF events in Appendix B. The impacts of the base case changes to the four sub-catchment models are as follows:
> Across all four sub-catchment models, the recent development sites particularly the terrain differences the impacts on flood behaviour appear to be relatively localised to the site and their immediate surrounds.
> The impacts of the downstream water level changes in the Georges Hall and Lansdowne models can be clearly seen in the water level increases in the Prospect Creek floodplain sections of the two study areas. The water level increases in these downstream areas directly reflect the change in boundary conditions in both the 1% AEP and PMF events.
> In the PMF event across all four sub-catchment models, the update in TUFLOW engine typically results in water level decreases throughout the study area. The water level decreases are typically less than 0.1 metres, which in the context of the PMF event is considered a negligible change. Testing confirmed that these PMF decreases are a result of the TUFLOW engine change. Review of 1% AEP results shows that these TUFLOW engine changes are not reflected in this event, with impacts of less than 0.5cm in areas not affected by the building footprint change discussed in the next point.
> The most significant change to flood behaviour across all four sub-catchment models is a result of the expanded building footprints adopted throughout the study areas. The impacts of this change vary on a local scale, however generally similar trends can be observed:
- For overland flowpaths that flow through residential areas, the larger building footprints in the base case models increase both runoff (reduced losses) and roughness to increase peak flood levels. Typically, these water level increases are in the order of 0.02 – 0.1 metres, and they are typically localised to short sections of flowpath.
- The change in roughness in these residential areas is also reflected in velocity differences where peak velocities are reduced in the same locations as peak level increases. This is a result of the increased building roughness areas slowing overland flows.
- Conversely, immediately downstream of these residential areas there are often water level decreases of between 0.02 -0.1 metres. This is also likely a result of the increased roughness in the immediately upstream building areas effectively slowing overland flows and in turn resulting in water level reductions. A good example of this is the Miller Road sub-catchment, where additional building areas upstream of Woodville Road increases peak 1% AEP levels by 0.05 – 0.1 metres, and downstream of Woodville Rd the reduced peak flows result in water level decreases of 0.02 – 0.05 metres.
Overall, the model changes for the base case models typically do not result in water level increases or decreases in excess of 0.1 metres for the four sub-catchments, particularly in the 1% AEP event. Localised sections of increases are often adjacent to equivalent localised water level reductions. This suggests that the base case models produce relatively modest changes to the previous flood study models, and do not represent a significant alteration in flood behaviour.
A comparison of 1% and 20% AEP hydrographs at the downstream boundary of the Villawood model at flow measuring location Wood 01 is included in Figure 5-1. It shows that the impacts of the base case model at
Draft Final Flood Risk Management Study and Plan Prospect Creek Sub-Catchments 304600207 | 22 March 2024 39

the downstream boundary of the Villawood is relatively minor, with a slight reduction in peak 1% AEP flow, however not a significant change in hydrograph timing.
A summary of peak flow results at the downstream boundary of the four sub-catchment models is included in Table 5-2. The downstream flow recording locations are shown in the figures included in Appendix B Consistently at the downstream locations of the four models, the base case peak flows are lower than the flood study models. This is likely a result of the more extensive building roughness slowing flows throughout the models. However, the reductions in peak flows is between 2.9% - 9.4% which are considered relatively minor differences.

5.2.2
Base Case Flood Behaviour and Mapping
The updated base case models were simulated for the 20%, 5%, 2% and 1% AEP and PMF events for the critical 2-hour duration (except for Villawood PMF with 5.5-hour duration).
Revised base case flood mapping was prepared for all of these design events for the four sub-catchments, included in Appendix C. The following flood maps were prepared for the base case model results: > Flood extents maps for all design events,
Draft Final Flood Risk Management Study and Plan Prospect
304600207 | 22 March 2024 40
Creek Sub-Catchments
Figure 5-1 Comparison of 1% and 20% AEP Hydrographs for Base Case and Flood Study Models for Villawood at Wood_01
(in m3/s) SubCatchment Flow Location 20% AEP 1% AEP Flood Study Base Case Difference % Flood Study Base Case Difference % Georges Hall PO_023 7.8 7.1 -9.3% 13.0 11.8 -9.4% Lansdowne WBM_PO_41 22.5 21.7 -3.5% 48.0 45.0 -6.3% Miller Road WBM_PO_01 12.5 11.8 -5.5% 26.3 24.3 -7.4% Villawood Wood_01 58.4 55.6 -4.8% 94.4 91.7 -2.9%
Table 5-2 Comparison of 1% and 20% AEP Peak Flow Results for Base Case and Flood Study Models for Four Sub-Catchments

> Peak depth result mapping, and,
> Peak velocity result mapping
These base case model results will be utilised in understanding the existing flood behaviour and in developing and assessing flood risk management options in later phases of the project.
5.2.3
Base Case Flood Extents
In determining final flood extents from the base case model results, a trimming process has been applied to remove all insignificant flooding areas through the following filters:
> 0.1 metre minimum depth filter was applied to flood extents to remove sheet flow areas that often are shown in rainfall-on-grid model results. The 0.1 metre depth filter was seen as a suitable threshold to define significant flooding beyond sheet flow.
> 250 m2 minimum area filter was applied to remove all minor disconnected ponding areas.
For context, the three non-Villawood Flood Study model applied a 0.05 metre depth filter, 250 m2 area filter, and 0.3 mere max depth filter for extents, while the Villawood Flood Study model results appear to have applied no filters to model results.
The base case flood extents for the 20%, 5%, 2% and 1% AEP and PMF events following this trimming process are shown in the flood maps included in Appendix C. All flood results were also trimmed to these extents.
5.2.4 H1-H6 Hazard Category Mapping
Following on from the provisional hazard (low, transitional, and high) hazard mapping adopted within the 2005 NSW FDM, a new method of hazard categorisation has been developed and is included in the 2019 edition of Australian Rainfall & Runoff (Book 6: Flood Hydraulics, Section 7.2.7). The sub-catchment flood studies prepared provisional hazard mapping for the four sub-catchments.
The new classification has been adopted within the 2023 FRM Guide FB03 for Flood Hazard and is still based on depth and velocity, but utilises six categories based on the stability of children, adults, the elderly and vehicles in floodwaters. The ARR hazard category curves are shown in Figure 5-2.
The mapping of H1-H6 hazard categories for the base case models of the four sub-catchments has been included in Appendix C
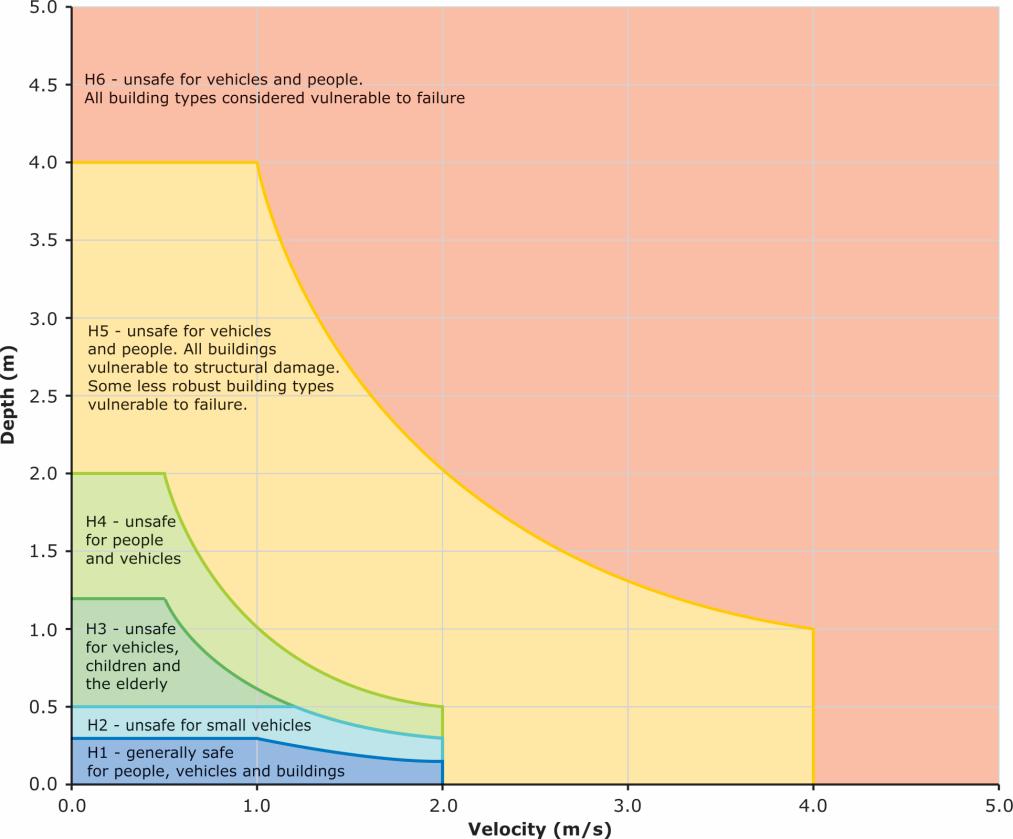
Draft Final Flood Risk Management Study and Plan Prospect Creek Sub-Catchments 304600207 | 22 March 2024 41
Figure 5-2 H1-H6 Hazard Categories Source: Section 7.2.7, Book 6, ARR, 2019

5.2.5 Flood Function Mapping
The 2023 FRM Manual defines flood prone land to be one of the following three flood functions:
> Floodway - Areas that convey a significant portion of the flow. These are areas that, even if partially blocked, would cause a significant increase in flood levels or a significant redistribution of flood flows, which may adversely affect other areas.
> Flood Storage - Areas that are important in the temporary storage of the floodwater during the passage of the flood. If the area is substantially removed by levees or fill it will result in elevated water levels and/or elevated discharges. Flood Storage areas, if completely blocked would cause peak flood levels to increase by 0.1m and/or would cause the peak discharge to increase by more than 10
> Flood Fringe - Remaining area of flood prone land, after Floodway and Flood Storage areas have been defined. Blockage or filling of this area will not have any significant effect on the flood pattern or levels.
Review of the 2023 FRM Manual guideline for Flood Function (Flood Risk Management Guide FB02) several methods of mapping are presented. With regards to overland flooding (a reasonable description of flooding type for most of the sub-catchment areas), the following advice is provided:
The indicator technique is likely to be the most appropriate technique for identifying floodways and flood storage in overland flooding areas. Large flood storage areas are not common in overland flooding and may not be present.
The indicator technique most commonly uses VxD, depth and velocity thresholds as key indicators of floodway and flood storage. After testing some different threshold criteria, the following criteria were adopted for flood function mapping:
> Floodway: VxD > 0.25 m2/s and V > 0.25 m/s
> Flood Storage: D > 0.3 metres
Note reviewing against past flood function mapping for other projects in Canterbury-Bankstown Council LGA, these are similar criteria. As a final check, a comparison of floodway portion flows to total flowpath flows was conducted in WaterRIDE. It showed flowpath flows across test sites throughout the four sub-catchments were on average 82% of total flow, which is right within the recommended 80-90% flow range for floodway recommended in the 2022 FRM Manual guideline.
Generally, the flood storage areas using the 0.3m criteria appear a reasonable representation of observed likely flood storage areas. Flood fringe was applied to all flood extents outside of these floodway and flood storage areas, with flood extents applying a 0.1m depth filter as discussed further in Section 5.2.3
5.3
Climate Change Assessment
5.3.1 Climate Change Scenario
In the previous flood studies, climate change was assessed for the Georges Hall, Lansdowne and Miller Road through a 10% rainfall increase scenario applied to the 1% AEP event. All three models adopted the downstream boundary conditions of the current climate 1% AEP event. For the Villawood sub-catchment model, no climate change scenarios were assessed in either the 2008 study or the 2014 study.
Council and DCCEEW requested that the climate change assessments be updated to account for the following potential combined climate change impacts on 1% AEP flood behaviour:
> 10% rainfall increase as was previously assessed in three of the flood studies, and,
> 0.9 metre Sea Level Rise (SLR).
Reviewing the flood study climate change assessments, the following additional climate change modelling was required:
> Georges Hall and Lansdowne sub-catchments: The 10% rainfall increase was previously included in a model scenario, however the impacts of Sea Level Rise on Georges River tailwater conditions in the models were not previously accounted for.
> Miller Road: The flood study 10% rainfall increase assessment was considered appropriate, and as the model is not sensitive to downstream boundary conditions, and as the boundary is elevated well above sea level rise influence, no additional climate change assessment was required, and,
> Villawood: No previous climate change assessment has been conducted, therefore was required. A 10% rainfall increase was applied to design rainfall for the 1% AEP. However, as the model is not sensitive to
Draft Final Flood Risk Management Study and Plan Prospect Creek Sub-Catchments 304600207 | 22 March 2024 42

downstream boundary conditions, and as the boundary is elevated well above sea level rise influence, no alteration of the downstream boundary condition was required.
For the Georges Hill and Lansdowne models, a climate change downstream boundary water level needed to be established. The Georges River Flood Study (BMT-WBM, 2019) model provided by Council contained a 10% rainfall increase simulation for the 1% AEP, however not the 5% AEP which is the downstream condition equivalent to the 1% AEP sub-catchment floods.
Therefore, a new 5% AEP plus 10% rainfall increase condition for the Georges River model was prepared and simulated by Stantec. The peak water levels for this modelled event were processed and levels at the two sub-catchment downstream boundaries were assessed.
Furthermore, the Georges River model did not account for any Sea Level Rise conditions within the model scenarios. Sea level rise impacts near the sub-catchment boundaries were inferred from impact results summarised in Table 4.3 of the Sea Level Rise Impact Assessment for the Georges River (FloodMit, 2012)
The impact of 0.9m sea level rise on peak flood levels in these upstream portions of Georges River were estimated to be 0.05 metres. While these sea level rise impacts are based on a Georges River model prior to the 2019 version, in lieu of additional data, this 0.05 metre level increase was applied to the 2019 Georges River results. The resulting peak water levels for the 5% AEP 10% rainfall increase and 0.9m SLR conditions in Georges River are 5.93m AHD and 5.95m AHD for the Georges Hall and Lansdowne models respectively.
5.3.2
Climate Change Impact Assessment Outcomes
A comparison of the adopted climate change conditions (10% rainfall increase and 0.9m SLR) to current climate base case model conditions for the 1% AEP event are included in Appendix D. The appendix includes mapping of the peak water level and velocity difference plots for climate change impacts for the Georges Hall, Lansdowne, and Villawood sub-catchments.
The climate change scenario results show the following:
> The 10% increase in rainfall results in water level increases in the flowpaths of the three models typically between 0.02 – 0.10 metres. The Villawood model does have section of the mainstream flooding area with localised increases in excess of 0.1 metres.
> The increased rainfall also results in increased peak flood velocities in all three models, with increases typically between 0.05 – 0.50 m/s.
> The increases in downstream water level for rainfall increase and sea level rise in the Georges Hall and Lansdowne models can be clearly seen in the water level increases in the Prospect Creek floodplain sections of the two study areas. The water level increases in these downstream areas directly reflect the 0.3 metre increase in Georges River flood levels compared to the 1% AEP current climate base case results.
A comparison of climate change and base case hydrographs at the downstream boundary of the Villawood model at flow measuring location Wood 01 is included in Figure 5-3. It shows that the impacts of the 10% rainfall increase result in a consistent increase in flows at the downstream end of the sub-catchment, slightly delaying the timing of the peak of the hydrograph.
A summary of peak flow results at the downstream boundary of the three sub-catchment climate change models is included in Table 5-3. The downstream flow recording locations are shown in the figures included in Appendix D At the downstream locations of the three models, the peak of the climate change flows is between 6.4% - 10.4% higher than the peak flows of the base case models. The results suggest that the Georges Hall sub-catchment is more sensitive to potential future rainfall increases as the peak flow increases are proportionally higher than the Lansdowne and Villawood sub-catchments.
Table 5-3 Comparison of 1% AEP Peak Flow Results for Base Case and Climate Change Models for Sub-Catchments (in m3/s)
Draft Final Flood Risk Management Study and Plan Prospect Creek Sub-Catchments 304600207 | 22 March 2024 43
Sub-Catchment Flow Location 1% AEP Base Case Climate Change Difference Georges Hall PO_023 11.8 13.0 10.4% Lansdowne WBM_PO_41 45.0 47.9 6.5% Villawood Wood_01 91.7 97.5 6.4%

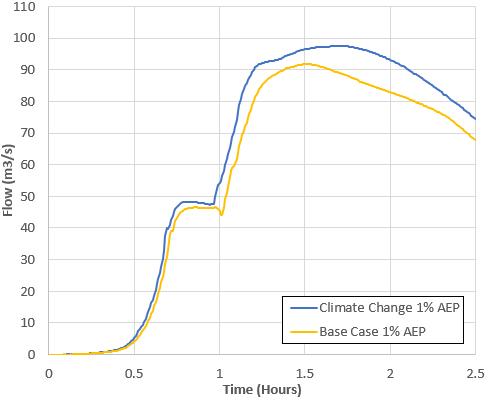
Draft Final Flood Risk Management Study and Plan Prospect Creek Sub-Catchments 304600207 | 22 March 2024 44
Figure 5-3 Comparison of 1% AEP Hydrographs for Base Case and Climate Change Models for Villawood at Wood_01

6 Flood Planning Review
6.1 Flood Affected Properties
A review of flood affected properties has been considered for the study area with a review of changes considered compared to the previous Flood Study property tagging
The updated property list adopted the updated base case flood extents discussed in Section 5.2.3. These flood extents not only consider the base case model changes but also apply the flood extent trimming of 0.1 metres depth and 250 m2 minimum area. This more effectively removes disconnected overland flooding from the flood extents than was conducted in the Flood Studies, particularly for Villawood sub-catchment which did not apply any flood extent filters.
It is noted that from the property database, all properties classed as ‘parklands’ have been removed from the affected property list. This includes all properties in the Lansdowne Reserve which has many subdivided lots however is one publicly owned and maintained property. Similarly, Council owned parks and open space have been excluded from the property database, leaving only private and developed properties in the database.
The number of flood affected private / developed properties for the base case updated results for all design events are summarised in Table 6-1 In the PMF event, there are a total of 2,667 flood affected properties, or 35.5% of the total 7,502 properties in the study area. In the 1% AEP the total number of affected properties is 1,567, or 21% of all private and developed properties. The majority (over 60%) of flood affected properties across the four sub-catchments are located within the Villawood sub-catchment.
A comparison of these base case affected property numbers to the previous Flood Study property numbers for the 1% AEP and PMF event are included in Table 6-2. The results show that for the three non-Villawood sub-catchments there are only minor differences in property numbers as the extent filter process was similar to that adopted in the Flood Studies. However, for the Villawood sub-catchment the base case represents a significant reduction in flood affected properties as no extent filters were applied to the previous Villawood Flood Study results. The flood extent filter and trimming process described in Section 5.2.3 is an effective way to remove tagging from properties that are marginally affected by flooding, therefore these reduced numbers in Villawood are considered appropriate.
Table 6-2 Flood Affected Property Numbers for Private and Developed Properties for Base Case Flood Extents Compared to Previous Flood Study Extents
Draft Final Flood Risk Management Study and Plan Prospect Creek Sub-Catchments 304600207 | 22 March 2024 45
Subcatchment Total Properties Base Case Flood Affected Property 20% AEP 5% AEP 2% AEP 1% AEP PMF Georges Hall 977 115 160 205 228 337 Lansdowne 1,234 144 183 213 228 336 Miller Road 569 106 122 136 140 179 Villawood 4,893 733 868 924 978 1,829 Total 7,502 1,092 1,326 1,471 1,567 2,667
Table 6-1 Flood Affected Property Numbers for Private and Developed Properties (Excluding Parkland Sites) for All Design Flood Events for Base Case Flood Extents
Subcatchment Total Properties 1% AEP PMF Flood Study Base Case Diff Flood Study Base Case Diff Georges Hall 977 245 228 -17 372 337 -35 Lansdowne 1,234 249 228 -21 371 336 -35 Miller Road 569 141 140 -1 206 179 -27 Villawood 4,893 1368 978 -390 2643 1,829 -814 Total 7,502 1991 1,567 -424 3571 2,667 -904

6.2 Relative Flood Risk for Development Types
The relative flood risk of development types and their users to flooding should be considered in decisionmaking as it can influence risk to the community. Flood risk is site and development specific but can generally be categorised between development types and their typical users.
The 2023 FRM Manual guideline for Flood Impact and Risk Assessment (Flood Risk Management Guide LU01) in Table 6 provides a useful resource in providing a high-level summary of flood risk for different development types of users, buildings and their contents for the same flood exposure. The summaries from this guideline for development types relevant to this Study Area have been included in Table 6-3
Table 6-3 Relative Flood Risk & Vulnerability of Land Uses for the Same Flood Exposure (Source: NSW DCCEEW, FRM Guide FB01)
Type
Low
Medium/high density
Emergency response management facility
Aged care facility
School
Correctional facility
Commercial Higher Lower Varies
This is used as a baseline for considering relative impacts in other land uses
Due to the higher density more people are involved but the buildings may be more structurally resistant to flooding. Contents may be less exposed to flooding as they may be over multiple levels
density of development and people
Users on average more vulnerable in evacuation. Building may be structurally stronger. Potential for high value medical equipment
Users on average more vulnerable in evacuation. However, evacuation arrangements likely to be in place. Buildings and contents generally lower value
May have challenges in the relocation of users therefore continued operation preferable. This relies on accessibility for staff and utility services. Buildings and contents expected to be generally of lower vulnerability
Employees may be able to be trained to assist in response to flooding. Higher density of customers, who are likely to be unfamiliar with location or flood issue and therefore more vulnerable. Buildings expected to be generally of lower vulnerability. Contents varies substantially depending on the specific business
Industrial Lower Lower Varies
Hazardous/ offensive industry Lower Lower Higher
Employees may be able to be trained to assist in response to flooding, customer density low, but they are likely to be unfamiliar with location or flood issue. Buildings expected to be generally of lower vulnerability. Contents varies substantially depending on the specific business
Employees may be able to be trained to assist in response to flooding, customer density low, but they are likely to be unfamiliar with location or flood issue. Buildings expected to be generally of lower vulnerability. However, the impacts of hazardous or offensive materials could be significant and need to be considered. This may require management measures such as avoidance of flood-affected areas or effective containment of hazardous or offensive materials to limit impacts on the community or environment
Recreation Lower Lower Lower Occupied less and may be weather influenced but could be higher density of people when in use. Users often unfamiliar with flooding in the location. Buildings and contents expected to be generally of lower vulnerability or value
It is noted this guidance is a generalisation for development types, and the flood risk of any development will depend on site specifics and details of the development. However, this provides a useful resource in understanding the relevant flood risk of different land uses. It should be consulted in the review of current land uses and future development potential in the following sections.
Draft Final Flood Risk Management Study and Plan Prospect Creek Sub-Catchments 304600207 | 22 March 2024 46
Use Relative Risk Compared to Low Density Residential Comment Users Buildings Contents
of
Density Residential Base Base Base
Higher Lower Lower
Lower Lower Lower
Lower
Higher Lower Higher
Higher Lower Lower
Higher Lower Lower

6.3
Current Land Use Zoning
The current land use zoning for the four sub-catchments is shown in Figure 6-1 Included within the figure, the 1% AEP and PMF base case flood extents have been overlaid on the land use zoning to provide context on the flood affected portions of the study area.
The current zoning for the flood affected portions of the four sub-catchments are as follows:
> Georges Hall, Lansdowne and Miller Road: The majority of the study areas are classed as R2 Low Density Residential There are also large areas of RE1 Public Recreation in the upper catchment at The Crest Reserve and in the lower catchment at Garrison Point reserve and in Lansdowne Reserve. There are also several smaller Council owned parks throughout the three sub-catchments that are often flood affected which are all zoned RE1 Public Recreation. The schools in the three sub-catchments are mostly zoned as SP2 Infrastructure, as is Henry Lawson Drive corridor.
> Villawood: There is a more diverse range of current zoning for the Villawood sub-catchment:
- The southern portion of the sub-catchment is mostly classed as R2 Low Density Residential, as well as in the north of the sub-catchment in mostly flood free areas.
- The most flood affected portion of the sub-catchment in its centre, is mostly zoned as IN1 General Industrial. The exceptions are to the north where there are SP1 Special Activity, B5 Business Development and IN2 Light Industrial zoned lots.
- There are two locations of B2 Local Centre zoning at the Bass Hill Shopping Plaza and Chester Hill town centre.
- There are areas of both R3 medium and R4 high density residential to the south-west near Woodville Road, to the south around Villawood East Public School, to the south-east near Bass Hill Shopping Plaza and to the east near Chester Hill town centre.
- There are also large areas of RE1 Public Recreation in the upper catchment to the south near The Crest Reserve and Velodrome site with parks throughout this upper catchment. There are also several smaller Council owned parks throughout the sub-catchment that are often flood affected which are all zoned RE1 Public Recreation.
- The schools in the sub-catchment are mostly zoned as SP2 Infrastructure, as is Hume Highway corridor and the rail line corridor.
6.4 Future Development Potential in Flood Affected Land
6.4.1
Proposed Future Development Sites
In the preliminary stages of the project, Council reviewed submitted planning proposals within the study area and only one was currently active at 1 Leicester Street, Chester Hill. This Chester Square site location has been shown in Figure 6-1. As this planning proposal is located outside of the 1% AEP or PMF extents the flood risk of the site is negligible, and its consideration is not relevant to this study.
6.4.2
Future Planning Proposal Requirements
In mid-2021, NSW Department of Climate Change, Energy, the Environment and Water (DCCEEW) released a new Flood Prone Land Policy Update. Included within this policy is a draft set of standard flood-related clauses for Local Environment Plans (LEPs) to assist local Councils. In addition, the update package included a local planning directive outlining flooding requirements in consideration of planning proposals.
A summary of the key requirements of the local planning direction for planning proposals and their relevance to the future development potential of Prospect Creek sub-catchments is included in Table 6-4
To assist in the discussion of planning proposal requirements related to floodway and high hazard areas, these two maps for the 1% AEP have been overlaid on current land use zoning as shown in Figure 6-2 and Figure 6-3 respectively.
The outcomes from Table 6-4 suggest that development and particularly potential intensification should be prioritised in the flood free portions of the study area where possible. However, the high-level review suggests there is still redevelopment potential within parts of the floodplain
The guide on flood risk of development types summarised in Section 6.2, should be reviewed as a general guide when assessing potential future changes in land use in the floodplain.
Draft Final Flood Risk Management Study and Plan Prospect Creek Sub-Catchments 304600207 | 22 March 2024 47

Table 6-4
Planning Proposal Requirements and Relevance to Prospect Creek Sub-Catchments
Planning Proposal Requirement
A planning proposal must not rezone land within the flood planning area from Recreation, Rural, Special Purpose or Environmental Protection Zones to a Residential, Business, Industrial or Special Purpose Zones.
A planning proposal must not contain provisions that apply to the flood planning area which:
▪ permit development in floodway areas,
▪ permit development that will result in significant flood impacts to other properties,
▪ permit development for the purposes of residential accommodation in high hazard areas,
▪ permit a significant increase in the development and/or dwelling density of that land,
Relevance to Prospect Creek Sub-Catchments
Based on this requirement there is limited development potential for the flood affected portions of sites that are currently zoned as recreation or special purpose including parts of The Crest, Garrison Point and Lansdowne Reserves as well as any zoned Council park sites.
Assumed to be the 1% AEP floodway. As shown in Figure 62 the floodway extents in the study area are relatively well confined within existing road corridors, parkland areas, or channels in Villawood therefore this requirement should not significantly impact many potential redevelopment sites in the study area.
Floodway areas do extend into some industrial sites within Villawood, therefore development potential for these portions of the sites may be limited by this requirement.
This requirement would need to be assessed through flood impact assessments on a site-by-site basis with detailed assessment of proposed development plans
Assumed to be the 1% AEP high hazard. As shown in Figure 6-3 the high hazard extents in the study area are relatively well confined within existing road corridors, parkland areas, or channels in Villawood therefore this requirement should not significantly impact many potential redevelopment sites in the study area.
High hazard areas do extend into some industrial sites within Villawood, therefore development potential for these portions of the sites may be limited by this requirement.
This requirement will need to be considered in potential intensification of development in the floodplain. It is possible that intensification in flood affected areas may be feasible if flood risk is suitably addressed. However potential intensification should be prioritised in flood free portions of the study area.
▪ permit development for the purpose of centre-based childcare facilities, hostels, boarding houses, group homes, hospitals, residential care facilities, respite day care centres and seniors housing in areas where the occupants of the development cannot effectively evacuate,
▪ are likely to result in a significantly increased requirement for government spending on emergency management services, flood mitigation and emergency response measures, which can include but are not limited to the provision of road infrastructure, flood mitigation infrastructure and utilities, or
▪ permit hazardous industries or hazardous storage establishments where hazardous materials cannot be effectively contained during the occurrence of a flood event.
A planning proposal must not contain provisions that apply to areas between the flood planning area and probable maximum flood to which Special Flood Considerations apply which include items listed above.
For the purposes of preparing a planning proposal, the flood planning area must be consistent with the principles of the Floodplain Development Manual 2005 or as otherwise determined by a Floodplain Risk Management Study or Plan adopted by the relevant council.
These vulnerable development types should not be proposed within the 1% AEP floodplain where possible. As discussed further in Section 8.3.2, there are a number of these existing vulnerable developments within the floodplain, the alteration of these sites to improve flood risk should be considered.
Further review of flood emergency management concerns for the study area is included in Section 8.7. Development potential in identified flood emergency hotspots should be avoided based on this requirement. That is unless a potential redevelopment could justifiably be shown to reduce the emergency response burden for an existing site.
This is a particular concern for Villawood sub-catchment where the current industrial zoning in the flood affected centre results in a high risk of hazardous materials.
Similar to the above response, vulnerable developments should not be prioritised within PMF affected lands where possible. This also relates to critical infrastructure types for flood emergencies (refer to Section 8.3).
The flood planning level should be maintained at the 1% AEP plus 0.5 metre freeboard as in the Canterbury-Bankstown LEP and is recommended in the current Flood Prone Land Policy Update. There is no clear evidence that flood behaviour in the study area would justify an alternative FPL.
Draft Final Flood Risk Management Study and Plan Prospect Creek Sub-Catchments 304600207 | 22 March 2024 48

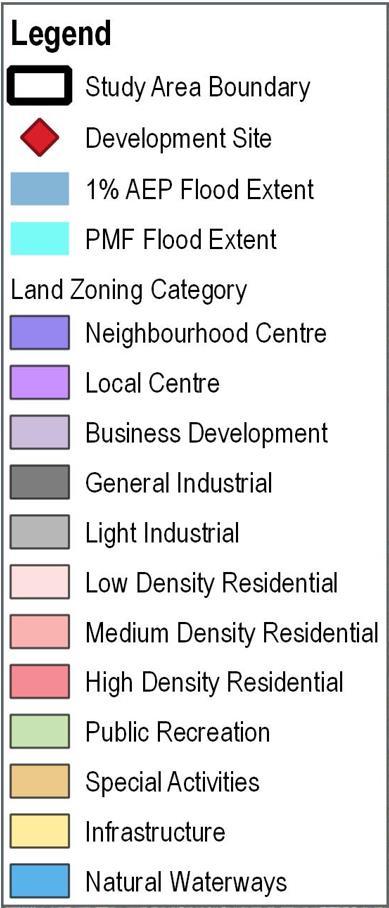
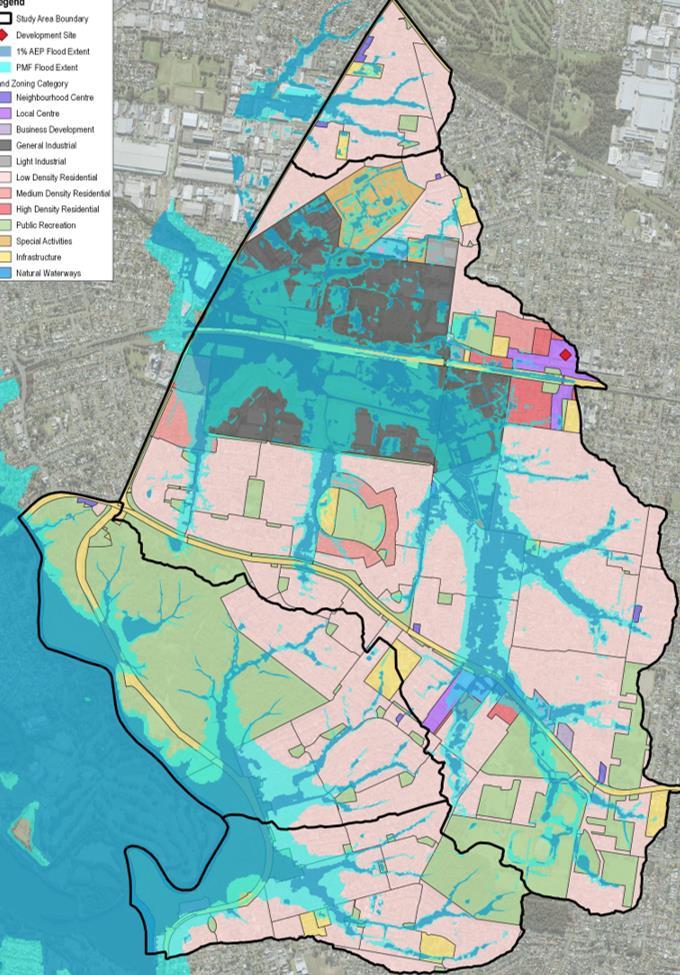
Draft Final Flood Risk Management Study and Plan Prospect Creek Sub-Catchments 304600207 | 22 March 2024 49
Figure 6-1 Current Land Use Zoning with 1% AEP and PMF Extents


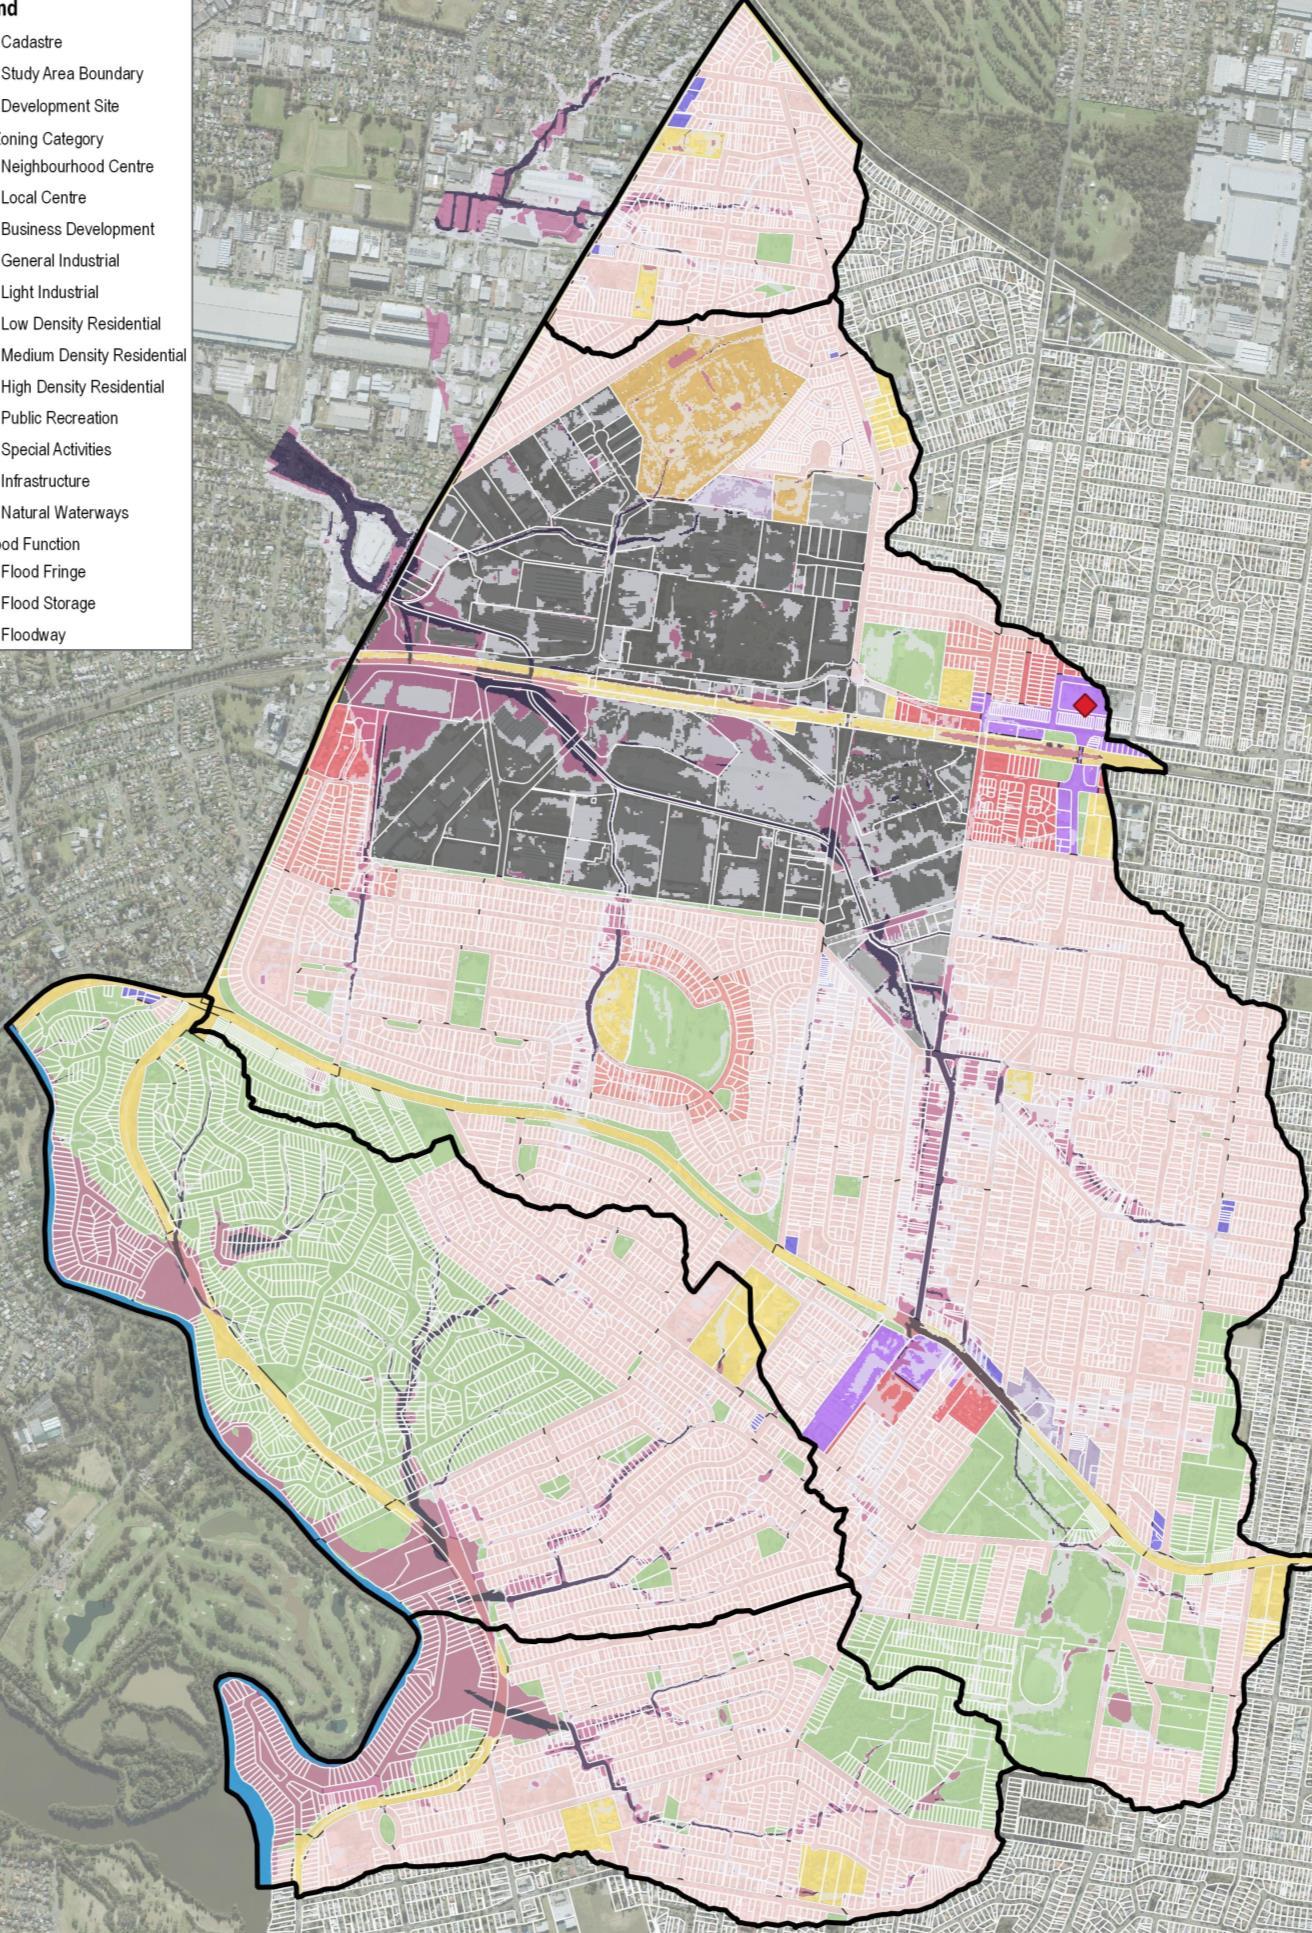
Draft Final Flood Risk Management Study and Plan Prospect Creek Sub-Catchments 304600207 | 22 March 2024 50
Figure 6-2 1% AEP Flood Function with Floodway on Current Land Use Zoning

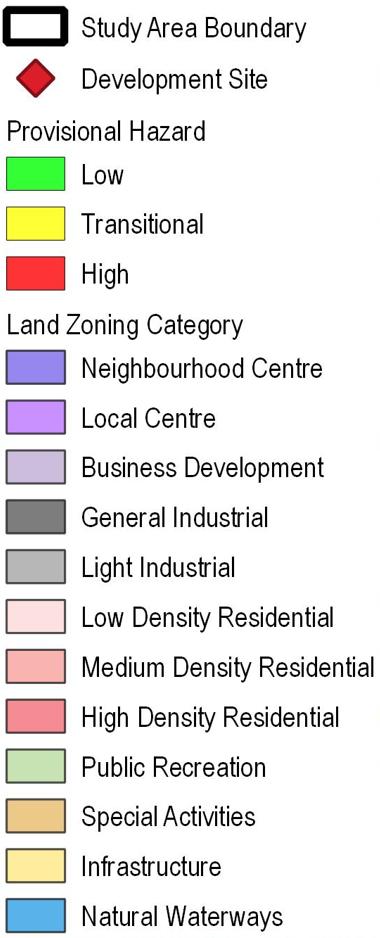

Draft Final Flood Risk Management Study and Plan Prospect Creek Sub-Catchments 304600207 | 22 March 2024 51
Figure 6-3 1% AEP Provisional Hazard with High Hazard on Current Land Use Zoning

6.5 Flood Related Development Controls
The Prospect Creek sub-catchments are located in the Canterbury-Bankstown LGA where development is controlled through the Local Environment Plans (LEP) and Development Control Plan (DCP). The following sub-sections summarise the flood-related development controls for these documents and provide recommendations.
6.5.1
Local Environment Plan
The Prospect Creek sub-catchments lie within the Canterbury-Bankstown LGA, therefore the relevant LEP is the Canterbury-Bankstown LEP 2023. As noted in previous sections, in mid-2021, NSW Department of Climate Change, Energy, the Environment and Water (DCCEEW) released a new Flood Prone Land Policy Update. Included within this policy is a draft set of standard flood-related clauses for Local Environment Plans (LEPs) to assist local Councils. The 2021 package establishes two different categories, and two associated standard Local Environment Plan (LEP) clauses where flood-related development controls may be applied / considered. These are:
> Flood Planning Areas (FPAs): The ‘flood planning’ LEP clause is mandatory and the LEPs of all Councils in NSW were amended on 14 July 2021,
> Special Flood Considerations (SFCs): The ‘special flood consideration’ LEP clause is optional, and Councils decide whether to adopt this clause or not. If Councils choose to adopt the optional standard instrument SFC provision, it must be adopted without variation but subject to any relevant direction in the standard instrument (cl 4(2), SI order).
6.5.1.1 Mandatory LEP Clause - Flood Planning Area
Clause 5.21 outlines the requirements for developments in the FPA which is all land under Flood Planning Level (FPL), which in accordance with the 2023 FRM Manual is typically defined by the 1% AEP (1 in 100 AEP) event with a 0.5 metre freeboard. Councils are permitted to propose alternate FPLs, however they are required to demonstrate and document the merits of any decision based on a risk management approach. The land this clause applies to is essentially unchanged from the previous standard LEP clause.
The main updates to the mandatory standard flood related clause include:
> Several new objectives have been added to the updated text including a reference to cumulative impacts, enabling safe and appropriate uses of land, and enabling safe evacuation from the land,
> The requirements for development consent have been updated with reference to:
- Compatibility to flood function (floodway, flood storage and flood fringe),
- No offsite flood impacts and the impact of the development on projected changes to flood behaviour (accounting for climate change),
- There is a reference to safe occupation and efficient evacuation of people and not to exceed the capacity of existing evacuation routes for the surrounding area. Similarly, also stated in the clause is whether the development incorporates measures to minimise the risk to life and ensure the safe evacuation of people in the event of a flood,
- The intended design and scale of buildings resulting from the development, and the potential to modify, relocate or remove buildings resulting from development if the surrounding area is impacted by flooding.
Review of the Canterbury-Bankstown LEP 2023 shows that the wording of the flood planning section 5.21 reflects this updated wording as is mandatory. It is noted that this chapter of the LEP does reference the 2005 FDM rather than the 2023 FRM Manual which should be considered for update.
6.5.1.2
Optional LEP Clause – Special Flood Considerations
A new optional flood clause 5.22 has been added to the update called the ‘Special Flood Considerations’ (SFC) clause. The clause applies to all land between FPA and the PMF, an area that was not covered within the previous standard LEP clause. The types of development this optional clause would apply to includes vulnerable developments and critical infrastructure. In relation to the Special Flood Considerations (SFC) Clause 5.22, as stated within the guideline document:
this is an optional provision of the Standard Instrument and Councils have the discretion whether to adopt the clause in a LEP in their LGA, provided they have appropriate information and justification to support the flood related development controls. Studies under the FRM process, as
Draft Final Flood Risk Management Study and Plan Prospect Creek Sub-Catchments 304600207 | 22 March 2024 52

well as emergency management planning processes and relevant strategies and plans developed by NSW Government may provide information and support justification for the adoption of the clause.
Upon review of the Canterbury-Bankstown LEP 2023and in discussions with Canterbury-Bankstown Council’s catchment management planning team and stormwater asset planning team the optional LEP clause 5.22 for land between the FPA and the PMF has not been adopted. Therefore only the mandatory LEP clause 5.21 for the FPA will be applicable. However as discussed in the next section, the Development Control Plan (DCP) does implement development controls that relate to Special Flood Considerations.
6.5.2 Current Development Control Plan
The Prospect Creek sub-catchments lie within the Canterbury-Bankstown Council LGA, therefore the relevant DCP is the Canterbury-Bankstown DCP 2023. The DCP controls for this part of the LGA are based on the previous Bankstown DCP 2015 with some updates where appropriate.
The development controls for the former Bankstown LGA are derived from a development matrix approach. The procedure to determine what controls apply to proposed development involves:
> Schedule 2 of the DCP identifies the land use category of the development which are grouped into the following:
- Critical uses and facilities
- Sensitive uses and facilities
- Subdivision
- Residential
- Commercial or industrial
- Tourist related development
- Recreation or non–urban uses
- Concessional development.
> Determine which floodplain applies, for the Prospect Creek sub-catchments it is assumed that the controls of the “catchments affected by stormwater flooding” apply. For the low-lying portions of Georges Hall and Lansdowne catchments within the Georges River floodplain, the “Georges River” controls are also assumed to apply.
> Determine which flood risk precinct the land is located within:
- High Flood Risk Precinct is the area of land below the 100–year flood that is either subject to a high hydraulic hazard (equivalent to H5 hazard or greater) or where there are significant evacuation difficulties.
- Medium Flood Risk Precinct is land below the 100–year flood that is not subject to a high hydraulic hazard (equivalent to H1 – H4 hazard) and where there are no significant evacuation difficulties.
- Low Flood Risk Precinct is defined as all other land within the floodplain (within the extent of the probable maximum flood)
> Section 5 provides controls for fencing in the floodplain including high risk precincts requiring approval for fences, and no flow impediment as a result of the fence.
The indicative flood risk precinct map for the study area has been shown in Figure 6-4. These are indicative extents as they are based on updated base case model results, rather than the Council adopted Flood Study results. In addition, the extents do not match the peak Georges River flood conditions, therefore extents in the lower Georges Hall and Lansdowne are likely underestimates.
Finally, the combination of development type and flood risk precinct can be used to determine relevant development controls as shown in control matrix in Figure 6-5 There is a generic outcome with recommendations for development controls, being ‘potentially unsuitable land use’ which applies for most development types in a high flood risk precinct, or for critical and vulnerable developments in low, medium or high flood risk precincts as shown in brown in Figure 6-5 This designation suggests the development is not normally considered permissible.
The other generic category is “Not relevant” where development is considered permissible with no consideration of development controls. This applied to all non-vulnerable or critical developments for the low risk precinct.
Draft Final Flood Risk Management Study and Plan Prospect Creek Sub-Catchments 304600207 | 22 March 2024 53

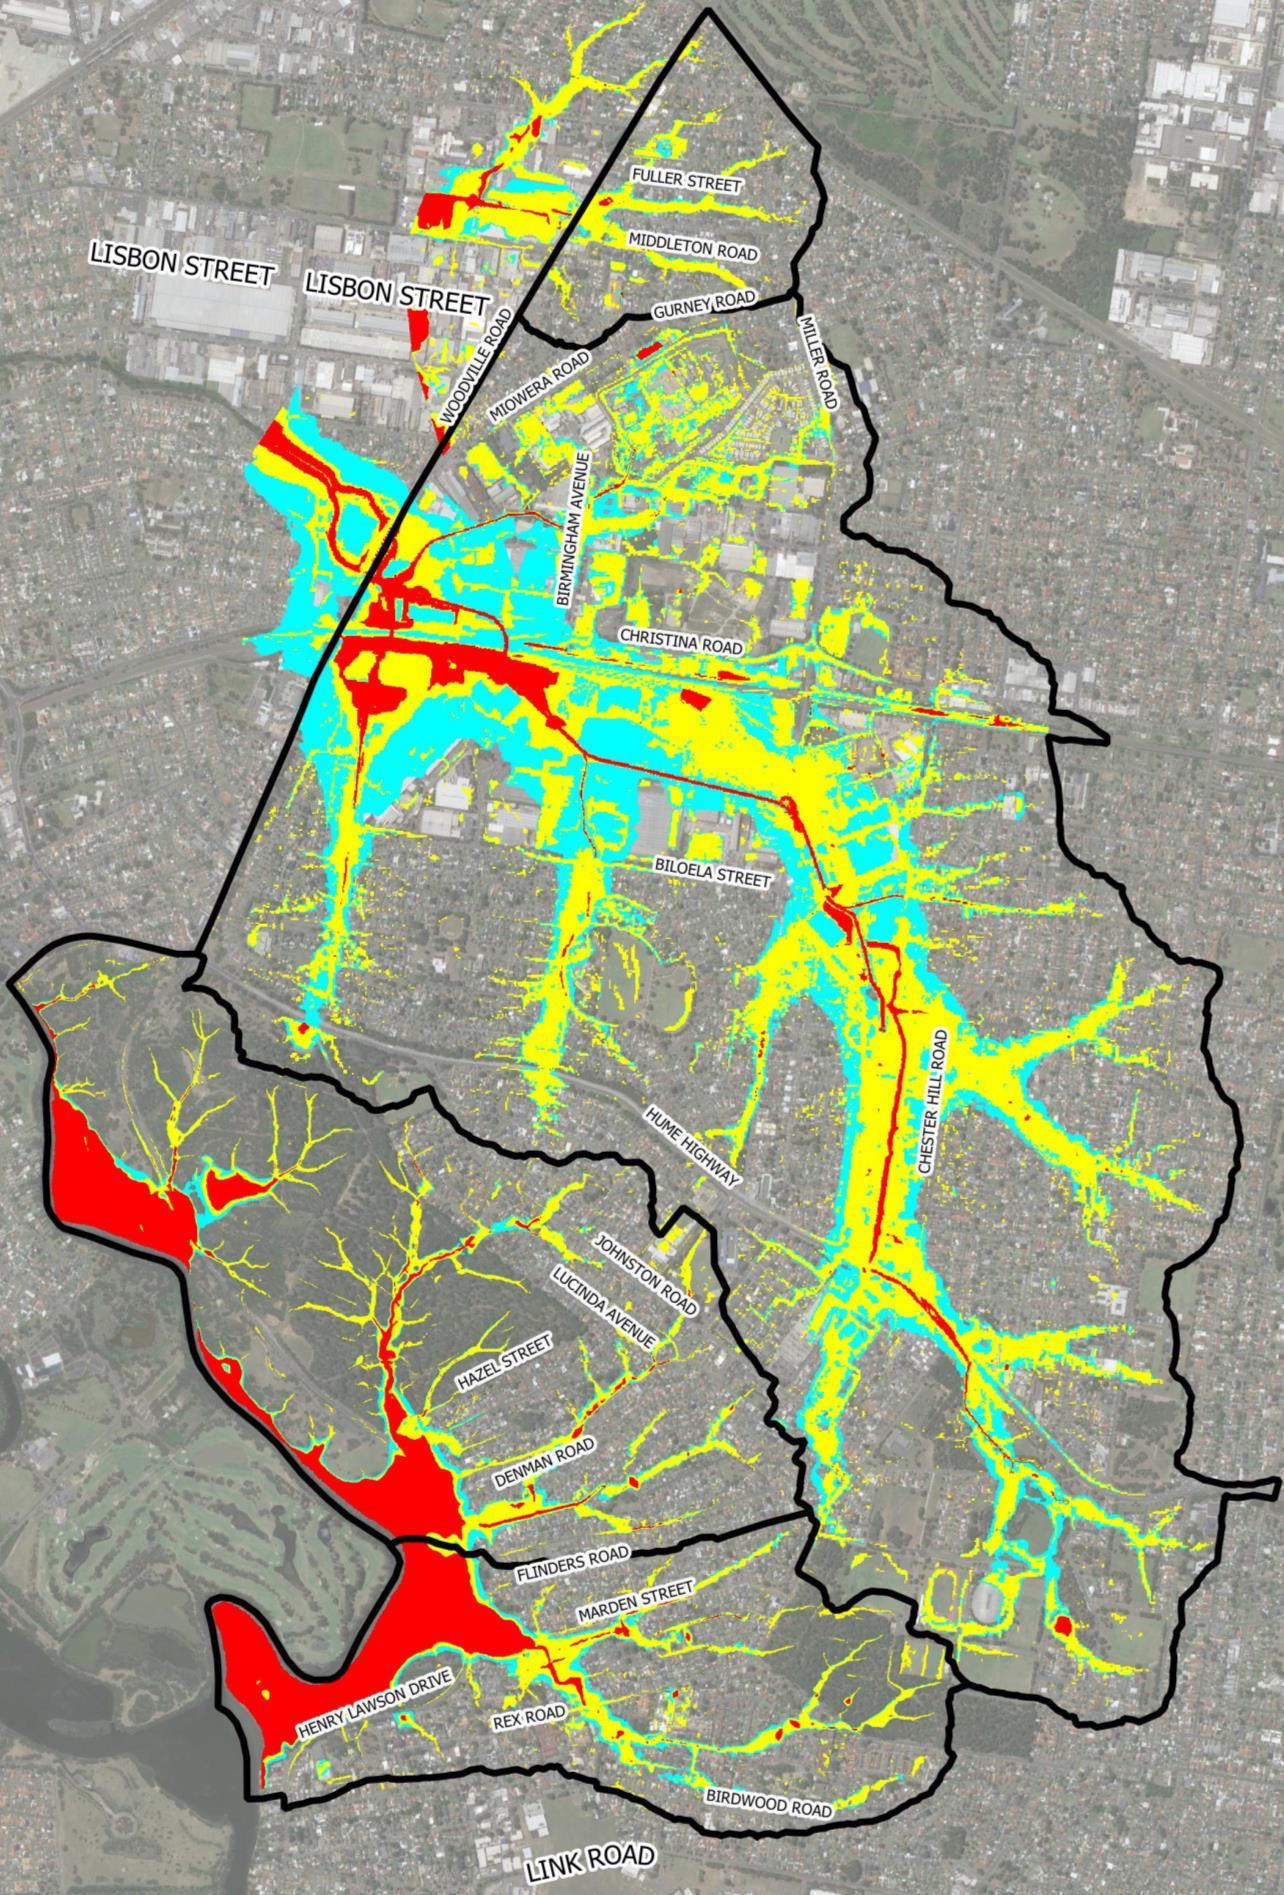
Draft Final Flood Risk Management Study and Plan
Sub-Catchments 304600207 | 22 March 2024 54
Prospect Creek
Figure 6-4 Indicative Flood Risk Precinct Extents Based on Base Case Model


There are seven categories of development controls:
> Flood level – outlining minimum floor level requirements in relation to design flood levels and freeboards,
> Building components – outlining all structures to have flood compatible building components below the 1% AEP flood level plus freeboard.
> Structural soundness – includes requirements for engineer reports certifying the structural stability of proposed structures to a design flood event with freeboard
> Flood effects – Requirements for applicant to demonstrate to Council's satisfaction (by way of an engineer’s report if requested) that the development will not increase flooding effects elsewhere, having regard to: loss of flood storage, changes in flood levels, flows and velocities, the cumulative impacts of multiple developments in the vicinity.
> Parking and driveway access - outlines requirements for various garage, parking, and access driveway requirements related to design flood levels and freeboards.
> Evacuation – includes a range of requirements for flood emergency response which include:
1. Applicant to show that evacuation for development resulting from the subdivision can be provided in accordance with this DCP.
2. Reliable access for pedestrians or vehicles is required from the building, commencing at a minimum level equal to the lowest habitable floor level to an area of refuge above the PMF. Such a refuge may comprise a minimum of 20% of the gross floor area of the dwelling being above the PMF level. An engineer’s report may be required.
3. Reliable access for pedestrians or vehicles is required. An engineer’s report may be needed to address this matter and should consider access for pedestrians or vehicles to a publicly accessible location above the 100–year flood level. Where feasible, an area of refuge within the building or development site that is above the PMF level, and which is equal to 20% of the gross floor area of the development, or such other area capable of accommodating the number of people likely to require evacuation.
4. The evacuation requirements of the development are to be considered. An engineer’s report will be required if circumstances are possible that the evacuation of persons may not be achieved within the effective warning time.
Draft Final Flood Risk Management Study and Plan Prospect Creek Sub-Catchments 304600207 | 22 March 2024 55
Figure 6-5 Current Development Control Matrix for Catchments Affected by Stormwater Flooding

5. An evacuation strategy to be considered and proposals made for improving the evacuation arrangements to the site in relation to the present situation where possible. Adequate flood warning should be available to allow safe and orderly evacuation without undue reliance on the SES or other authorised emergency personnel. Options could include the provision of access for pedestrians or vehicles to a publicly accessible location, or an area of refuge equal to at least 20% of the gross floor area, or such other area capable of accommodating the number of people likely to require evacuation that is above the probable maximum flood level.
6. The development should be consistent with any flood evacuation strategy, flood plan or similar strategy that has been adopted by Council.
> Management and Design – there are four controls each with a targeted flood control:
1. Applicant to demonstrate that development resulting from the subdivision can be undertaken in accordance with this DCP.
2. A Site Emergency Response Flood Plan is required where floor levels are below the prescribed floor level (which is the floor level that applies to that particular type of development).
3. Applicant to demonstrate that there is an available area above the 100-year flood level plus freeboard to store goods.
4. No storage of materials below the prescribed floor level which may cause pollution or be potentially hazardous during floods
6.5.3 Flood Planning Constraint Categories and Flood Risk Precincts
Appendix A of the 2023 FRM Manual guideline for Understanding and Managing Flood Risk (Flood Risk Management Guide FB01) provides a summary of commonly Flood Risk Precincts (FRP). The common FRPs for NSW stated in the guideline shows that the Risk Precincts adopted in Council’s DCP match the commonly adopted precincts of other Councils in the state.
Appendix A of the guideline also establishes guidance on Flood Planning Constraint Categories (FPCC). There are four categories outlined and these essentially perform an equivalent role to the Flood Risk Precincts but add some more specific flood risk considerations The four FPCC classes are:
> FPCC1 – Land that is highly constrained and, in some cases, may be unsuitable for intensification of development. Consideration should be given to limiting growth of existing development in FPCC1 areas that is not compatible with flood function or hazard in the area. Examples provided in Table 10 of the guideline of areas that may class as FPCC1 include (for the purposes of this summary the Defined Flood Event, or DFE is assumed to be the 1% AEP):
- 1% AEP floodway and key flood storage areas
- H6 hazard in the 1% AEP event
> FPCC2 – It is the next least suitable area for more intense development. Some FPCC2 areas are likely to be unsuitable for increased density of development and some types of development, whilst other areas have development potential but need to address the significant flood related constraints on the land. Consideration should be given to limiting growth in exposure of existing development where the associated risks cannot be effectively managed. Examples provided in Table 10 of the guideline of areas that may class as FPCC2 include:
- Floodways in events greater than the 1% AEP
- H5 hazard in the 1% AEP
- H6 hazard in events greater than the 1% AEP
- Low flood islands and high flood islands
> FPCC3 - More suitable for increased density of development and expansion of existing development when flood related development controls are met. Consideration may be given to restricting emergency response facilities and vulnerable land uses in some of these areas. Examples provided in Table 10 of the guideline of areas that may class as FPCC3 include:
- Areas outside FPCC2 but below the Flood Planning Level (1% AEP plus 0.5 metre freeboard).
> FPCC4 - identifies areas outside of FPCC1 to 3 but below the extent of the PMF. Special flood considerations to certain types of development may apply to some areas in FPCC4.
Draft Final Flood Risk Management Study and Plan Prospect Creek Sub-Catchments 304600207 | 22 March 2024 56

Compared to the currently implemented Flood Risk Precincts in the DCP, establishing a control matrix based on FPCC may offer several benefits including being able to more appropriately assign risk groupings and development controls. The FPCC approach would likely result in the following changes to the FRP approach:
> High Risk Precinct would be split into FPCC1 and FPCC2, which would allow for most developments to be precluded in FPCC1 and specific and tailored controls to be applied to FPCC2 areas.
> Medium Risk Precinct would generally align with FPCC3 category, with controls applied to the Flood Planning Area rather than the 1% AEP extents as in the current Medium precinct.
> Low Rick Precinct would align with FPCC4 category.
6.5.4 Flood Impact and Risk Assessment Requirements
More recent guidance for applicant flood impact assessments is included within the 2023 FRM Manual guideline for Flood Impact and Risk Assessment (Flood Risk Management Guide LU01) The guideline provides details on the preparation of both simple and detailed Flood Impact and Risk Assessment (FIRA) for developments. The recommended preparation of a FIRA for developments should consider (as outlined in Section 3 of the LU01 guide):
> Proposed development: The proposed development needs to be shown with the necessary detail
> Existing and developed model scenarios: The consent authority will need to ensure that flood modelling and/or analysis is sufficient to identify and assess the existing flood conditions and to determine post developed flood impacts and risks. Assessment needs to consider the key details of the final proposal, including development type and density (changing runoff characteristics), infrastructure, proposed modification to waterways or floodplain landform or vegetation.
> Impacts to be addressed: The consideration of development impacts is recommended to extend beyond flood level impacts only, with the table of impacts recommended to consider provided in Table 6-5 below.
Table 6-5
Typical considerations when assessing impacts due to development (Source: NSW DCCEEW, LU01 Guide)
Key considerations
Flood level change
Change in duration of flooding
Velocity change
Change in warning and evacuation time
Change in frequency of inundation
Flood function categories change
Hazard categorisation change
Reasons for considering
May increase inundation and damage to existing development
May inundate additional existing development
May create new or larger floodways and floodpaths
May isolate new areas
May increase damage
May increase duration of isolation
May increase score potential and/or damage to buildings
May decrease available warning time and time available for evacuation
Properties may become flood affected in more frequent events
Access may be cut frequently
Areas may be isolated more frequently
May change categorisation (e.g. flood storage to floodway) and change impacts on flooding on existing development
May reduce safety to vehicles, people or buildings
Draft Final Flood Risk Management Study and Plan Prospect Creek Sub-Catchments 304600207 | 22 March 2024 57

> Managing residual flood risk: In many situations there will be opportunities to limit the increase in risk due to development, however, available options will vary depending on the stage and scale of the development being considered. Typical risk considerations include the risks to people, property and infrastructure, including the ability of the occupants to respond in an emergency. Residual risks will remain after management measures and development controls have been applied. A list of measures available to minimise the increase in flood risk to large and small-scale development are in Table 6-6
Multi-lot, large-scale development
Includes strategic management consideration and measures:
• avoid floodways and flowpaths
• avoid other highly flood constrained areas
• provide management measures to manage risks to existing development
• consider compatibility of land uses/ development type with the flood constrains on the land
• determine and apply controls required to manage risk to the development and it’s users
• consider emergency response issues and options and provide management measures consistent with advice from emergency services
Individual, small-scale development
• Generally:
• avoid floodways and flowpaths
• avoid other highly flood constrained areas
• apply controls required to manage risk to the development and it’s users
• manage and design measures
• structural considerations
• floor level controls
The guide notes that documentation should ensure the intent of the approval is clear and maintained for the life of the approved development. This may include the need for conditions that consider:
> Limiting impacts and risks posed to the development and future occupants to ensure these have been appropriately managed. Consent conditions are to incorporate the key requirements to ensure these aspects are addressed. This may include the need to apply flood related controls such as those that nominate minimum fill or floor levels, structural considerations, management measures, address site egress, ensure the safety of occupants during flooding, and restrict unapproved modification to key elements of the development as approved in the consent.
> Management measures required to be considered in a staged manner as necessary to manage risks to the existing community
> Inclusion of all design reports and drawings in the consent to ensure these are consistent with key parameters used in post development modelling and analysis that formed the basis of the FIRA
> Modification of key design features of the development that may alter flood behaviour. This may require an additional approval with supporting modelling and/or reporting to ensure impacts of post developed flood risks are either in accordance with the original approval or are within the tolerable levels as defined by the consent authority
> How risks and impacts of the development change with future climatic conditions
> Any other specific requirements for consideration by the proponent to manage flood risk
Draft Final Flood Risk Management Study and Plan Prospect Creek Sub-Catchments 304600207 | 22 March 2024 58
Table 6-6 Typical measures to minimise impacts due to development (Source: NSW DCCEEW, LU01 Guide)

6.5.5 Conclusion of Review of Development Controls
Upon review of the flood-related development controls within the Canterbury-Bankstown DCP 2021, the following general comments are noted:
> Compared to the requirements for planning proposals outlined within the 2021 Flood Prone Land Policy Update (refer to Section 6.4.2), the current development controls are generally in agreement:
- The controls do not permit most developments within high-risk precincts, equivalent to the 1% AEP high hazard area. This is similar to the policy requirement for no residential accommodation in high hazard areas, though this also prohibits development in floodway areas as well.
- The controls require developments not increase flood effects, similar to requirements within the policy.
- The controls do not permit vulnerable and critical developments below the PMF level (low risk precinct), similar to the requirements of the policy relating to these types of developments.
- Requirements for storage of goods and hazardous materials is consistent.
- Emergency response requirements are similar, though the controls are more prescriptive outlining refuge and evacuation requirements more specifically which is beneficial to aid applicants.
> Compared to the FPCC approach from the 2023 FRM Manual Guide FB01, current Flood Risk Precincts are generally aligned however potentially adopting FPCC offers some potential benefits. These benefits include splitting the current High risk precinct into FPCC1 and FPCC2 where development can be precluded in FPCC1 and more tailored controls can be applied to FPCC2 areas.
> Compared to the requirements for FIRA from the 2023 FRM Manual Guide LU01 Generally, the current development controls are in agreement with the proposed requirements in the guide with some exceptions:
- The current controls do not require consideration of climate change in assessments.
- The current controls do not specify flood impacts be considered not just for flood levels but also duration, velocity, evacuation, flood function or hazard categorisation.
- The current controls do not specifically require a consideration of residual risk of proposed developments to confirm if flood risk is lower than existing based on proposed risk management measures for developments.
> This flood control matrix is commonly adopted by Council’s throughout the Sydney region. The matrix approach offers a suitable platform to be able to apply development controls specific to development types and flood affectation. In doing so it allows for a suitable merit-based approach to development consideration.
> The decision-making flowchart shown in Section 7.1 of the DCP is a useful resource to guide applicants through the process.
> The current format of the DCP allows for some confusion regarding which parts of former Bankstown LGA apply for Georges River, or catchments with stormwater flooding. A map in the DCP more clearly delineating the areas of applicability for the two matrices could be beneficial.
> For properties in the lower Georges Hall and Lansdowne that are affected by both Georges River and overland flooding from the sub-catchment, the current expectation would be that they need to address controls from both matrices. Given the likely overlap in controls between the two matrices a review is recommended to confirm if only one of the matrices can be applicable to suitably address flood risk from both forms of flooding.
Ultimately the current development controls are considered suitable, and generally in accordance with recent guidance both within the 2021 Flood Prone Land Policy Update and the 2023 FRM Manual Guide LU01. However, there are some minor alterations listed in the bullet points above that may improve applicant’s understanding of the controls and provide a more comprehensive assessment of flood risk in future development submissions.
Draft Final Flood Risk Management Study and Plan Prospect Creek Sub-Catchments 304600207 | 22 March 2024 59

7 Economic Impact of Flooding
The economic impact of flooding can be defined by what is commonly referred to as flood damages. Flood damages are generally categorised as either tangible (direct and indirect) or intangible damage types, these types are summarised in Table 7-1
Table 7-1 Types of Flood Damages
Type
Direct
Indirect
Intangible
Description
Building contents (internal)
Structural damage (building repair)
External items (vehicles, contents of sheds, etc.)
Building contents (internal)
Structural damage (building repair)
External items (vehicles, contents of sheds, etc.)
Social (increased levels of insecurity, depression, stress)
Inconvenience (general difficulties in post-flood stage)
The direct damage costs, as indicated in Table 7-1, are just one component of the entire cost of a flood event. There are also indirect costs. Together, direct and indirect costs are referred to as tangible costs. In addition to tangible costs, there are intangible costs such as social distress. The flood damage values discussed in this report are the tangible damages and do not include an assessment of the intangible costs which are difficult to calculate in economic terms.
The purpose of a flood damage assessment is to support decision-making on FRM options. It provides the basis for understanding the scale of benefits or disbenefits FRM measures may have on flood damages to the community. The damage assessment is not intended to be a precise estimate of damage at a given location. Rather, it is intended to provide a reasonable understanding of the relative scale of damage across the study area (focusing on aspects that will be materially changed by FRM measures) and how this may be altered with the implementation of FRM measures.
7.2 Input Data
7.2.1
Building Footprints
The primary flood damage calculation relates to building damages, being structural, contents, relocation, and clean-up costs. Therefore building damages have been calculated for each individual building footprint, based on the building footprint layer provided by NSW DCCEEW (refer to Section 3.5.3).
Commonly in the past flood damages were calculated on a per property basis rather than a per building basis. The adopted damage per building calculation provides a more accurate determinant of flood affectation due to the following reasons:
> Properties may have multiple buildings in the one property therefore damages can be calculated per building and added together,
> Flood model results can be considered only within the building footprints to provide a more accurate localised picture of flood affectation. On a property basis, flooding far removed from building footprints may misrepresent flood affectation near the building where the majority of flood damages are caused.
Therefore the bulk of flood damages calculation has been conducted based on NSW DCCEEW building footprints data as summarised in Section 3.5.3. The exception is for external (garden) damage which has been considered on a per property basis and then added to the cumulative building damages for each property to create a combined total damage.
Draft Final Flood Risk Management Study and Plan Prospect Creek Sub-Catchments 304600207 | 22 March 2024 60

7.2.2 Building Types
The adopted damages approach allows for unique classification of flood damages based on the type of building that were able to be determined for each building across the four sub-catchments. Building types were derived for each building footprint based on building type provided in the NSW DCCEEW footprint layer and confirmed through site visit observations, and Google Streetview observations. For example, all residential classed flood affected properties were inspected from site visit photos or Google Streetview to confirm if they were single or double storey. The building types were classified as follows:
> Residential building types:
- Single storey:
- Double storey,
- Multi-unit,
- Townhouse.
> Non-residential building types:
- Public buildings,
- Low to medium being restaurants, cafes, offices, surgeries, retail outlets, service stations, hardware stores,
- Default average,
- Medium to high being chemists, electrical goods, bottle shops, electronics.
Note that all secondary buildings such as garden sheds and garages in residential properties were excluded from damages calculations. In total, when removing secondary buildings there were a total of 7,613 buildings assessed in the flood damages calculation across the four sub-catchments.
The number of dwellings per building footprint were also estimated based on aerial images, site visit observations and Google Streetview. In addition, residential properties were grouped by size with small being less than 135 m2, medium being between 135 – 200 m2, default being between 200 – 230 m2 and large being 230 m2 or greater.
7.2.3
Floor Levels
Floor levels for all building footprints have been adopted in the damages calculation through one of two methods:
> Based on floor levels survey for the building for surveyed buildings in the three non-Villawood study areas. The floor level survey data is summarised in Section 3.4
> For non-surveyed buildings, including the entire Villawood sub-catchment, the following floor level estimation process was applied:
- The average ground level for the building footprint was calculated using the TUFLOW model terrain.
- Using site visit observations and Google Streetview, an approximate floor height above ground levels was estimated. This floor height was typically 0.15 metres for slab-on-ground type construction, 0.3 metres for normal construction and 0.6 metres for higher suspended floor type buildings.
- The estimated floor level was calculated from average ground floor of the building footprint plus the approximate floor height above ground.
7.2.4
Hydraulic Model Results
To inform the flood damages calculation, a range of base case model results were assessed for all five design flood events, 20%, 5%, 2% and 1% AEP and PMF events. The results were applied as max values across the building footprints:
> Maximum water levels for footprints were determined for each design event,
> Maximum depth results for footprints were determined for each design event, and,
> Maximum H1-H6 hazard category within the footprint were determined for each design event.
In addition, to inform external (garden) damage calculation, the maximum flood depth for properties were calculated for each design event.
Draft Final Flood Risk Management Study and Plan Prospect Creek Sub-Catchments 304600207 | 22 March 2024 61

7.3 Flood Damages Methodology
Flood damages can be assessed by a number of methods including the use of computer programs such as FLDamage or ANUFLOOD, or via more generic methods using spreadsheets. For the purposes of this project, the recently released Draft Flood Damages Tool (DT01) prepared by NSW DCCEEW as part of the FRM Manual 2022 has been adopted for calculation of building damages, with external damages calculated using in-house spreadsheet analysis as summarised in the following sub-sections.
7.3.1 New Draft Flood Damages Tool
This flood damages analysis has been based on the Draft Flood Damages Tool (DT01) prepared by NSW DCCEEW as part of the FRM Manual 2022. The damages tool is supported by Section 3 of the Flood Risk Management Measures - Flood Risk Management Guide MM01 which provides background and guidance on the use of the tool.
It was discussed with Council and NSW DCCEEW staff the merits of adopting the draft flood damages tool although at the time it had not yet been finalised and formally adopted. In those discussions it was agreed that the methodology outlined within the draft damages tool was an improved and more detailed calculations than previous damages tools. The draft damages tool DT01 provides the following advantages over past damages tools provided by the NSW Government:
> It provides not only residential damages for single and double storey houses similar to past tools, but it also provides damages curves for commercial and public infrastructure buildings,
> The methodology also allows for calculation of risk to life projected costs based on the H1-H6 hazard categorisation of the building,
> It allows for damages estimation based on building footprint areas providing additional detail in analysis. Therefore the draft tool was ultimately considered suitable for adoption in this study. Since then, the updated Flood Damages Tool DT01 has been released as part of the FRM Manual 2023 release. Stantec and NSW DCCEEW have reviewed the changes of the updated tool and found through testing that they would have relatively minor impacts on damages assessment outcomes for Prospect Creek sub-catchments. Therefore the outcomes of the damages assessment using the Draft 2022 tool have been retained in this analysis.
7.3.2
Calculation Parameters
The draft damages tool DT01 curves are derived for late 2019, and as part of this Study were updated to represent late 2021 dollars (no 2022 inflation data available at the time of this report).
General recommendations in the draft damages tool and guideline are to adjust values in residential damage curves by Average Weekly Earnings (AWE) rather than Consumer Price Index (CPI). NSW DCCEEW proposes that AWE is a better representation of societal wealth, and hence an indirect measure of the building and contents value of a home. The most recent data for AWE from the Australian Bureau of Statistics at the time of the assessment was for December 2021. Therefore all ordinates in the residential flood damage curves were updated to December 2021 dollars (AWE 1,748.4) from December 2019 dollars (AWE 1,711.6).
Consequently, all ordinates on the damage curves were increased by 5.43% compared to the curves presented in the draft flood damages tool DT01
7.3.3 Damage Curves for Overfloor Flooding Depths
Residential and non-residential flood damages are generally assessed based on assessments of structural damage, damage to contents, external damage, relocation costs and clean-up costs. In limited cases, the additional damage costs related to structural integrity due to building failure may also warrant consideration. The adopted flood damages curves for residential single and double storey buildings for the various building sizes are shown in Figure 7-2 and Figure 7-2 respectively.
Further details about the formulation of the residential damage curves adopted in the draft flood damages tool DT01 are included in Section 3.1 of Flood Risk Management Guide MM01.
Non-residential flood damage curves including commercial / industrial and public buildings are shown in Figure 7-3. Further details about the formulation of the non-residential damage curves adopted in the draft flood damages tool DT01 are included in Section 3.2 of Flood Risk Management Guide MM01.
Draft Final Flood Risk Management Study and Plan Prospect Creek Sub-Catchments 304600207 | 22 March 2024 62


Draft Final Flood Risk Management Study and Plan Prospect Creek Sub-Catchments 304600207 | 22 March 2024 63
Figure 7-1 Adopted Damage Curves for Residential Single Storey
Figure 7-2 Adopted Damage Curves for Residential Double Storey


7.3.4 Property Based Damages Calculation
A fixed external damage of $15,814.04 in 2021 dollars ($15,000 in 2019 dollars) is to be used for each dwelling site and for each site that contains multi-unit dwellings. This is used when flood depths above the ground level adjacent to the building are at least 0.3 metres or are above the habitable floor level of the house.
The trigger for these external damages has been based on maximum depth results on a per property basis, if the depth results exceed the threshold of the 0.3 metres, then the fixed damage rate has been applied to each property. The exception is parks, open spaces and national parks where no external damage has been applied.
7.3.5 Adopted Input Parameters
The draft flood damages tool DT01 provides numerous input parameters to tailor the flood damages analysis. The tool and associated guide provide advice with respect to default values. The input parameters for this flood damages assessment are as follows:
> Actual to potential ratio = 0.9 (default)
> Regional uplift factor = 1.00 (default for Sydney region)
> Infrastructure damages uplift = 10% of residential damages (default)
> Damages downscale for townhouses and units = 30% (default)
> Internal / contents rate = $490 / m2 (default)
> Residential clean-up costs = $4,000 / property (default)
> Non-residential indirect costs = 30% of direct actual damages, clean-up costs and loss of trading (default),
> Relocation costs are based on a damages curve with a flat maximum rate of $12,400
Draft Final Flood Risk Management Study and Plan Prospect Creek Sub-Catchments 304600207 | 22 March 2024 64
Figure 7-3 Adopted Damage Curves for Commercial Properties

With respect to risk to life damages calculations, the equations adopted within the draft flood damages tool DT01 are summarised in Figure 7-4
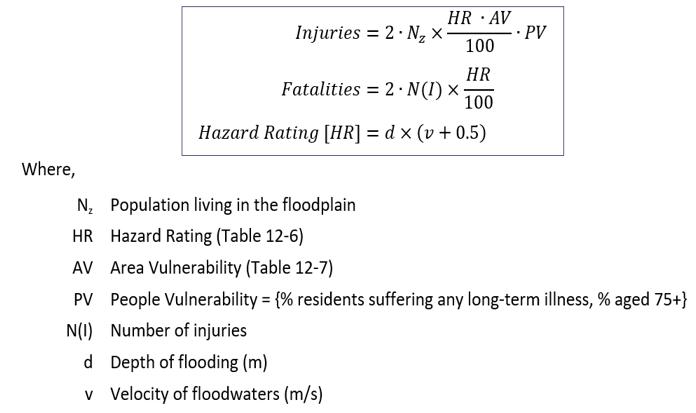
Figure 7-4 Flood Risk to Life Damages Calculations (Source: NSW DCCEEW, 2022)
The adopted flood risk to life parameters are as follows:
> Estimated cost per fatality = $7,752,786 (default from TfNSW)
> Estimated cost per injury = $77,472 (default from TfNSW)
> N(z) average people per household = 2.6 (default from ABS)
> Speed of onset = 2 (rate of rise around an hour or so)
> Primary nature of area = 2 (detached residential dwellings)
> Effective warning time P1, P2 and P3 = 0 (no effective warning time and no education program)
> Flood Warning Factor = 3 (calculated from P1, P2 and P3)
> Area Vulnerability (AV) = 7
> People Vulnerability = 24% (default)
7.4 Flood Damages Outcomes
7.4.1 Total Damages
The total damages have been calculated for all design events, 20%, 5%, 2%, and 1% AEP and the PMF event. The results are tabulated in Table 7-2 show that the damages totals for each of the four subcatchments. The tabulated results also show the building and external damage sub-totals.
In all design events it can be seen that the vast majority (88% – 93%) of total damages are within the Villawood sub-catchment for all design events. The sub-catchment with the next highest total damages is Georges Hall with 7% of total damages for all events excluding the PMF. Finally, Lansdowne and Miller Road have the smallest contribution to total damages with between 2 – 4% of damages in these two subcatchments.
As it relates to contributions from building and external damages, the external component makes up only a fraction (2.3 – 4.7%) of the total damages, with the vast majority being building related damages including structural, risk to life, contents, relocation etc.
The total damage values for the 20%, 5%, 2%, and 1% AEP events are shown graphically in Figure 7-5
Draft Final Flood Risk Management Study and Plan Prospect Creek Sub-Catchments 304600207 | 22 March 2024 65


7-5 Total Damages for the 20%, 5%, 2% an 1% AEP events with Estimate Curve
Draft Final Flood Risk Management Study and Plan Prospect Creek Sub-Catchments 304600207 | 22 March 2024 66
Existing Total Damages Summary for Design Flood Events Event Damage Type Georges Hall Lansdowne Miller Road Villawood Total 20% AEP Building $10,472,242 $1,658,735 $2,805,293 $149,771,022 $164,707,292 External $1,091,169 $1,138,611 $664,190 $3,431,647 $6,293,988 Total $11,563,411 $2,797,346 $3,469,482 $153,202,669 $171,001,280 5% AEP Building $13,701,735 $6,686,613 $3,188,562 $201,086,636 $222,007,848 External $1,628,846 $1,549,776 $1,012,099 $5,898,637 $10,041,915 Total $15,330,581 $8,236,389 $4,200,661 $206,985,273 $232,049,763 2% AEP Building $16,260,415 $9,074,943 $3,720,140 $227,495,126 $253,009,458 External $2,134,895 $1,992,569 $1,170,239 $7,132,132 $12,366,579 Total $18,395,310 $11,067,512 $4,890,379 $234,627,258 $265,376,037 1% AEP Building $18,206,272 $11,020,487 $4,149,729 $258,722,411 $287,672,967 External $2,356,292 $2,245,594 $1,201,867 $7,986,090 $13,726,587 Total $20,562,564 $13,266,080 $5,351,596 $266,708,501 $301,399,554 PMF Building $46,073,995 $25,753,421 $7,118,449 $1,045,604,730 $1,115,568,463 External $3,874,440 $3,747,927 $1,723,730 $17,411,258 $26,646,657 Total $49,948,435 $29,501,349 $8,842,179 $1,063,015,988
Table 7-2
$1,142,215,120
Figure

7.4.2 Average Annual Damage
Average Annual Damage (AAD) is calculated using a probability approach based on the flood damages calculated for each design event. These damage curves attempt to define the damage experienced on a property for varying depths of flooding. The total damage for a design event is determined by adding all the individual property damages for that event. AAD attempts to quantify the flood damage that a floodplain would receive on average during a single year. It does this using a probability approach.
A probability curve is drawn, based on the flood damages calculated for each design event. For example, the 1% AEP (or 100 year ARI) design event has a 1% probability of occurring in any given year, and as such the 1% AEP flood damage is plotted at this point on the AAD curve. AAD is then calculated by determining the area under this curve. The AAD curve for the study area is shown in Figure 7-5
While the PMF event has a theoretical probability of 0% of occurring, to inform the calculation of AAD a representative probability of 0.0000001 (or 0.00001%) has been adopted for the PMF event (equivalent to a 10,000,000 year ARI event). This is based on guidance from AR&R Book 8 – Estimation of Very Rare to Extreme Events which notes this as the equivalent recurrence event for catchment less than 100 km2 such as these sub-catchments. Through this method, the PMF accounts for extremely rare flood events in the AAD calculation.
For the most frequent event, the 20% AEP event, a lower bound flood damages estimate is required for the next most frequent event, the 50% AEP. This estimate of flood damages for the next most frequent event is important in providing a realistic lower bound on damages. In the end, based on the four modelled damages totals, a logarithmic equation was established with a strong correlation R2 value of 0.9973. The coefficients for the equation were 3.98 x 10⁷ ln(x) + 1.08 x 10⁸. This estimate resulted in a 50% AEP damages total estimate of $135,587,258.
Using this estimated lower bound combined with the five modelled AEP damage values, the AAD calculation for the Prospect Creek sub-catchments is summarised in Table 7-3.
Table 7-3 Average Annual Damage Summary for Design Flood Event Contributions
The total AAD for the Prospect Creek sub-catchments is over $93.7 million. Nearly half (49%) of this AAD is a result of the most frequent 20% AEP event, with the next most frequent event, the 5% AEP contributing 32% of the AAD. The less frequent events, the 2% and 1% AEP and PMF provide between 3 – 8% of AAD contribution. Though these events result in far higher flood damage totals, particularly the PMF event, their relatively low likelihood means they contribute less to the AAD.
Therefore, as it relates to damages and AAD, structural flood risk management options that reduce flood damages for the most frequent 20% AEP event are expected to provide the biggest benefits to AAD reductions.
For 20% AEP damages, the vast majority of damages are within the Villawood sub-catchment (91%) particularly within the low-lying industrial precinct, and within Georges Hall in the overland flowpaths through the sub-catchment.
Draft Final Flood Risk Management Study and Plan Prospect Creek Sub-Catchments 304600207 | 22 March 2024 67
AEP Probability Total Damages AAD Contribution AAD Contribution % 50% 0.50 $135,587,258 20% 0.20 $171,001,280 $45,988,281 49% 5% 0.05 $232,049,763 $30,228,828 32% 2% 0.02 $265,376,037 $7,461,387 8% 1% 0.01 $301,399,554 $2,833,878 3% PMF 0.0000001 $1,142,215,120 $7,218,001 8% Total AAD $93,730,375

8 Flood Emergency Response Review
When determining the flood risk to life, the flood hazard for an area does not directly imply the danger posed to people in the floodplain. This is due to the capacity for people to respond and react to flooding, ensuring they do not enter floodwaters. This concept is referred to as flood emergency response. To help minimise the flood risk to occupants, it is important that there are provisions for flood emergency response.
There are two main forms of flood emergency response that may be adopted:
Evacuation: The movement of occupants out of the floodplain before the property becomes flooded, Shelter-in-place: The movement of occupants to a building that provides vertical refuge on the site or near the site before their property becomes flood affected.
The emergency response provisions for a local area are outlined in documentation provided by the relevant emergency authority for NSW, the State Emergency Service (SES). The NSW SES typically prepare two documents relevant to flood emergency response, an Emergency Management Plan (EMPLAN) (previously referred to as DISPLAN), and a Flood Sub Plan. These documents are intended to provide information to residents and other authorities relating to identified evacuation centres, evacuation procedures and actions in the event of flooding. A review of these available documents is included in Section 0 There is also a review of available flood emergency response advice in flash flooding situations in Section 8.2.
In addition, a review of the flood emergency response potential for the Prospect Creek sub-catchments summarised below including key emergency response locations (Section 8.3), current and possible flood warning systems (Section 8.4), evacuation timeline review (Section 8.5), potential for shelter-in-place refuge (Section 8.6), and a summary of flood emergency response hotspots (Section 8.7).
Draft Final Flood Risk Management Study and Plan Prospect Creek Sub-Catchments 304600207 | 22 March 2024 68

8.1 Flood Emergency Management Documentation
Emergency Management in NSW is managed by the NSW SES at three levels of scale, at a state-wide level, at a zone level, and a local level. Each subsequent level provides additional detail in emergency management.
The Prospect Creek Sub-catchments are located within the Sydney Metropolitan SES Zone. The relevant local area with respect to SES emergency planning is the Canterbury-Bankstown Local Government Area (LGA).
8.1.1 Local Flood Plan
In September 2021 the SES released Volume I of the Canterbury-Bankstown Flood Emergency Sub Plan covering operations for flooding within the Canterbury-Bankstown Council LGA. Volume I of the plan outlines emergency management arrangements for prevention, preparation, response and initial recovery for flooding in the Canterbury-Bankstown LGA.
With respect to future Volume II and III of the Local Flood Plan, in discussions with NSW SES it was noted that these volumes are currently being considered by the SES and may or may not be released in the future If elected to proceed, Volume II of the Plan would focus on Hazard and Risk information for the local area, and NSW SES Response Arrangements would be found in Volume III if released. It was noted that SES was reviewing flood risk for the area at the same time as this study, however this information was not able to be shared to inform this study.
The local strategies for flood emergency response outlined within Volume I were divided into the four stages of emergency management, prevention / mitigation, preparation, response, and recovery operations.
In response to strategies a range of recommended actions are nominated for SES to achieve these strategies. The total number of strategies is 33 and 127 actions, spread across the four stages of emergency management as follows (these strategies and plans can be viewed in the publicly available Flood Plan document):
> Prevention / mitigation – 2 strategies and 4 actions covering land use planning and floodplain risk management.
> Preparation – 6 strategies and 24 actions covering flood emergency planning, flood intelligence systems, development of warning systems, briefing training and exercising, and community resilience to flooding
> Response – 24 strategies and 94 actions covering incident management measures, use of information and collection of intelligence, provision of information and warnings to the community, protection of property, road traffic and control, protection of essential services, evacuation, evacuee management and welfare, flood rescue, resupply, all clear and return, end of response operations, and post-impact actions
> Recovery – 1 strategy and 5 actions covering NSW SES recovery role
8.1.2 Local EMPLAN
The Canterbury-Bankstown Local Emergency Management Plan or EMPLAN was released by the Bankstown local emergency management committee in September 2020. The EMPLAN describes the arrangements at Local level to prevent, prepare for, respond to and recover from emergencies and also provides policy direction for the preparation of Sub Plans such as the Local Flood Plan summarised in the previous section.
The Local EMPLAN provides the following information relevant to flooding in the study area:
> The LGA is divided into five wards for emergency management. The Prospect Creek Sub-Catchment lies within the Bass Hill (Bura) Ward.
> The low-lying portions of the Georges Hall and Lansdowne are within the Georges River riverine waterway, however the remainder of the study area are considered local overland flow waterways.
> The Hume Highway which runs through the study area is considered a major arterial road
A hazard and risk summary for the local area is provided within Annexure B of the EMPLAN. A summary of the assessment for the flooding, both flash and riverine are provided in Table 8-1. Both forms of flooding are given a high risk priority.
Draft Final Flood Risk Management Study and Plan Prospect Creek Sub-Catchments 304600207 | 22 March 2024 69

Table 8-1
Hazard and Risk Summary for Flooding Types (Source: NSW SES, Local EMPLAN) Hazard Risk Description
Flooding (Flash)
Flooding (Riverine)
8.1.3
Heavy rainfall causes excessive localised flooding with minimal warning time.
River flows exceed the capacity of normal river systems resulting in flood waters escaping and inundating river plans
Regional and State Documents
The relevant regional and state emergency management documents are as follows:
> South-West Metropolitan Regional Emergency Management Plan – July 2017
> Georges River and Woronora River Valley Flood Emergency Sub Plan – May 2018
> NSW State Flood Plan – December 2021
> NSW State Emergency Management Plan – December 2018.
The various documents provide more useful information in relation to the roles and responsibilities of various stakeholders in both general emergencies (EMPLANs) and specifically for flood emergencies (Flood Plans).
8.1.4
Georges River Flooding
The flood emergency planning for Georges River floodplain, which would include low-lying properties within this study area, is far more extensive than for the local study area. Further details can be found on the Georges Riverkeeper website or the NSW SES website.
Similar to the overall study, this flood emergency response review focusses on the local overland flooding of the study area. However, it is important that Georges River be acknowledged as a different but no less significant form of flooding that affects part of the study area. Therefore though it is not the focus, references are made at times to Georges River flooding within this study (including the flood timing review in Section 8.5.5 which emphasises how distinctly different the two flooding mechanisms are). A flood emergency review for the Georges River should be included within a future Georges River FRMS&P project. The local flood emergency response outcomes from this study should be considered in light of the regional outcomes for the Georges River in this future study.
8.2 Guidance on Emergency Response in Flash Flooding
8.2.1
AFAC Guideline for Emergency Response in Flash Flood Events
In April 2018, the Australasian Fire and Emergency Service Authorities Council (AFAC) released the Guideline on Emergency Planning and Response to Protect Life in Flash Flood Events. This guideline for flash flood events provides a useful insight into the position of the national emergency services authorities’ council, of which NSW SES is a member. The guideline reflects a consensus on best practice for managing flash flooding, focussing on risk to life. The AFAC define flash flooding as:
Flash flooding can be defined as flooding that occurs within six hours or less of the flood-producing rainfall within the affected catchment. This may result in isolation of individuals and communities as time to warn and respond to flash flooding is limited.
Flash flood environments are characterised by the rapid onset of flooding from when rainfall begins (often within tens of minutes to a few hours) and by rapid rates of rise and by high flow velocity. The duration of flash flooding is often relatively short by comparison to riverine floods.
The discussion of flood timing for the Prospect Creek Sub-Catchments (Section 8.5.2) shows the entire floodplain is flash flooding based on the above definition, making this guideline relevant to the catchment. The exception is the lower portions of Georges Hall and Lansdowne which in addition flash flooding from the local catchment, may also be subjected to riverine flooding from the Georges River.
Draft Final Flood Risk Management Study and Plan Prospect Creek Sub-Catchments 304600207 | 22 March 2024 70
Likelihood Rating Consequence Rating Risk Priority Responsible Agency
Possible Moderate High NSW SES
Possible Moderate High NSW SES

8.2.2
Guidance on Flood Emergency Response Potential in Flash Flood Environments
Effective evacuation typically requires lead times of longer than just a couple of hours and this creates a dilemma for flash flood emergency managers. The following excerpt from the AFAC guideline outlines the dilemma as it relates to the suitability of evacuation and shelter-in-place potential in flash flood environments:
Because of the rapid onset of flash flooding and associated high velocity floodwaters, up to 75% of flash flood deaths occur while people are outside buildings attempting to leave or return, and directly exposed to floodwater.
This suggests that if evacuation has not occurred prior to the arrival of floodwater, taking refuge inside a building may generally be safer than trying to escape by entering the floodwater. However, some deaths – 25% of the total – occur among people trapped inside buildings. Details are not well documented, and these deaths could be the result of the building filling with flood water to a depth occupants cannot survive or because those trapped inside are swept away when the building fails. Other causes of death could be serious injury or an emergency medical condition while access to emergency assistance is compromised. Fires might also break out in buildings surrounded by floodwater, in which case occupants might not be able to evacuate as they would usually do.
For these reasons, remaining in buildings likely to be affected by flash flooding is not low risk and should never be a default strategy for pre-incident planning or incident action planning, even if the buildings are considered likely to withstand the impact of flash flooding. Where the available warning time and resources permit, evacuation should be the primary response strategy.
8.3
8.3.1
Emergency Management Locations
Emergency Services Locations
Emergency services locations are considered critical during flooding if the infrastructure is relied upon for emergency management on a regional scale or pose a significant hazard to surrounding areas. Therefore these types of emergency services have been mapped at a regional scale around the Prospect Creek SubCatchments as shown in Figure 8-1. This map has also been included in Appendix E
The following emergency services have been mapped in the region around the Sub-Catchments:
> Hospitals,
> Ambulance stations,
> Fire stations,
> Police stations,
> NSW SES facilities, and
> Helicopter emergency base at Bankstown Airport.
Within the study areas there is the NSW SES Bankstown Unit, Bass Hill Police Station and Chester Hill Fire Station all located in the Villawood Sub-Catchment. The SES unit is flood free in all events up to and including the PMF with flood free access only to the surrounding area in an overland flood event due to nearby flood extents affecting all surrounding roads. The Bass Hill Police Station is partially flood affected in the 1% AEP and PMF events, while the Chester Hill Fire Station site is flood free in all events however Waldron Street is flooded so there is no flood free access from the station.
Also shown in Figure 8-1 with the emergency service locations is the 1% AEP and PMF flood extents, not only for the sub-catchments, but for the entire Canterbury-Bankstown Council LGA. The LGA wide flood extents show the regional isolation of the study area from emergency services.
Most roads are isolated from overland flooding from within the Study Areas, then other catchments cause road flooding that would further block access to emergency services during a regional overland flood event. Though it was not possible to show the flood extents outside the LGA, it is assumed that access to emergency services would be similarly restricted for areas outside the LGA. The nearest hospitals would be Holroyd Private Hospital to the north, Liverpool Hospital to the south-west and Bankstown Hospital and Canterbury Hospital to the east. It is assumed that there would be no flood free access to these hospitals in the event of a regional flash flooding event from any part of the study area.
Draft Final Flood Risk Management Study and Plan Prospect Creek Sub-Catchments 304600207 | 22 March 2024 71

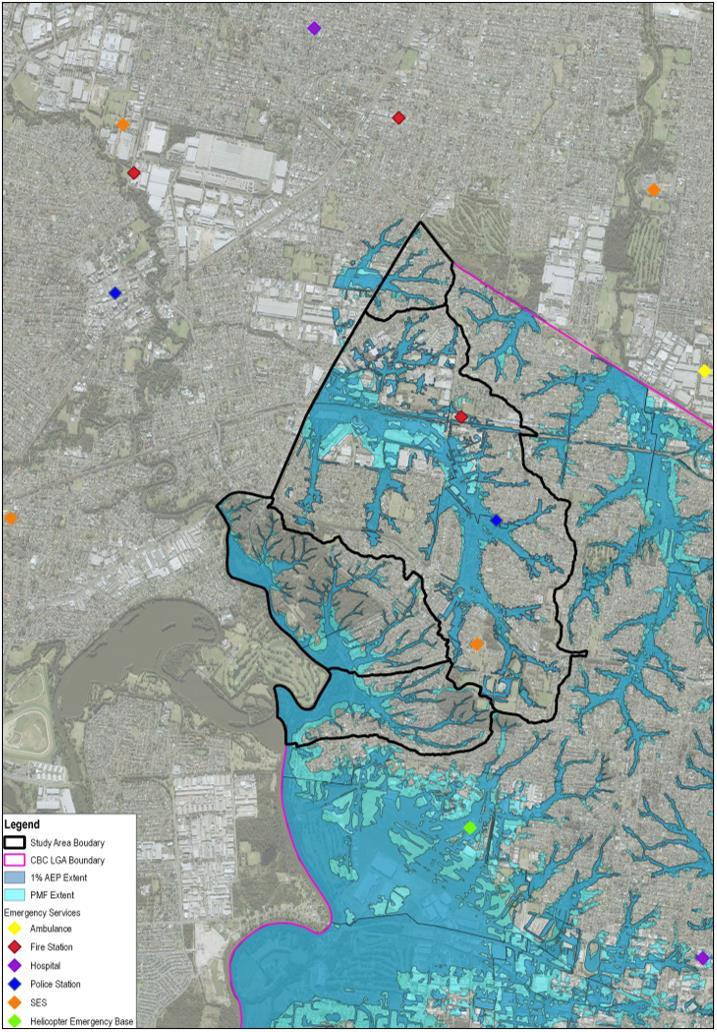
Draft Final Flood Risk Management Study and Plan Prospect Creek Sub-Catchments 304600207 | 22 March 2024 72
Figure 8-1 Location of Emergency Services in the Region with CBC LGA 1% AEP and PMF Extents

8.3.2 Vulnerable Developments
Vulnerable development relates to the increased risk of loss of life to vulnerable people including children, the elderly and disabled in most of these land use types. These demographics have a significantly greater risk to life when exposed to flood hazard. In addition, there is increased risk to life resulting from periods of isolation from medical emergency services due to pre-existing health conditions. Mobility of the related demographics is also compromised which will impede the effectiveness of both emergency response types. Included in these development types are:
> Schools, Preschools, and Childcare centres,
> Aged care facilities and retirement villages,
> Detention Centres – due to the limited mobility of the detained, these sites make flood evacuation much more difficult, and
> Hotels – the lack of local knowledge of hotel guests, coupled with the number of guests needing to be managed by hotel staff mean these are higher risk sites.
These categories of vulnerable developments match those presented in the 2021 Flood Prone Land Policy Update. Further discussion of the relative vulnerability of development types is in Section 6.2
These sites have been mapped for the Study Area in Figure 8-2, which is also included in Appendix E.
The mapping shows that most vulnerable developments are suitably located in flood free land, with some of these developments partially affected by flooding, with only some locations significantly flood affected. Due to the permissibility of childcare centres, preschools and retirement communities in various land use zonings, the location of vulnerable developments will change over time. This mapping should be reviewed and updated by Council in the future to have a continued understanding of flood risk vulnerable developments.
8.3.3 Current Emergency Management Procedures for Vulnerable Developments
The NSW SES within the Canterbury-Bankstown LGA Local Flood Plan provide the following specific actions within Section 5.8.4 and 5.8.5 as it relates to evacuation of vulnerable developments:
> Health Services Functional Area will coordinate the evacuation of hospitals, health centres and aged care facilities (including nursing homes) in consultation with the NSW SES and Welfare Services.
> School administration offices (Government and Private) will coordinate the evacuation of schools in consultation with the NSW SES and Welfare Services, if not already closed.
> Schools Administration (Government and Private) will manage the safety of students directly affected by flooding and will work with the NSW SES in the temporary closure of schools and will coordinate with NSW SES Transport and Welfare Services in the management of school evacuees.
> Welfare Services Functional Area will manage evacuation centres for affected residents and travellers in accordance with the Welfare Services Functional Area Supporting Plan.
As discussed further in Section 8.5.7, the flash flooding nature of the Study Area will make it difficult for SES to coordinate the evacuation of these vulnerable sites within the time available from the onset of rainfall. It is therefore recommended that individual flood response plans are developed for both existing and future vulnerable developments that are flood affected within the study area.
Draft Final Flood Risk Management Study and Plan Prospect Creek Sub-Catchments 304600207 | 22 March 2024 73

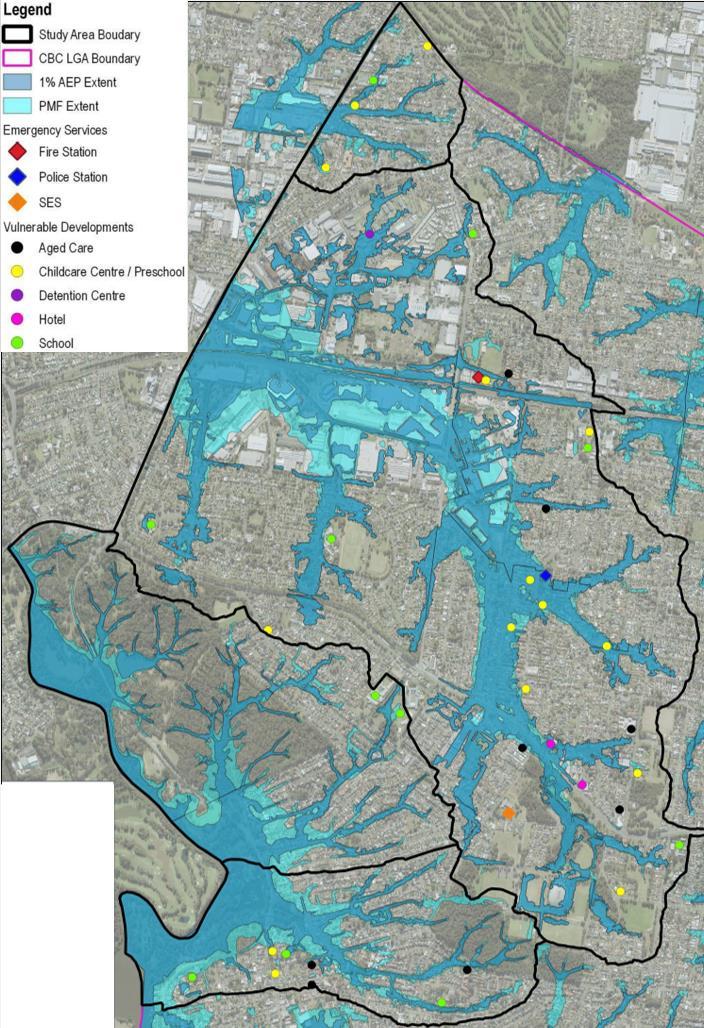
Risk
Study
304600207 | 22 March 2024 74
Draft Final Flood
Management
and Plan Prospect Creek Sub-Catchments
Figure 8-2 Location of Vulnerable Developments and Emergency Services within the Study Area with 1% AEP and PMF Extents

8.4 Flood Warning Systems
There are two components to a flood warning system:
> Monitoring of weather and flood conditions to decide when emergency response is required,
> Disseminating this information to residents so that evacuation may commence.
These two components of both current and potential flood warning systems are discussed in the following sub-sections.
8.4.1
Current Flood Warning System
The Canterbury-Bankstown LGA Flood Emergency Sub Plan (SES, 2021) under Section 5.4 discusses the range of monitoring and alerts currently adopted by the NSW SES in the local area:
> The BoM issues public weather and flood warning products before and during a flood. These may include:
- Severe Thunderstorm Warnings with reference to heavy rainfall
- Regional Severe Thunderstorm Warnings with reference to heavy rainfall
- Detailed Severe Thunderstorm Warnings (for Sydney/Newcastle/ Wollongong) with reference to heavy rainfall,
- Severe Weather Warnings with reference to heavy rainfall and/or storm surge,
- Flood Watches, and
- Flood Warnings.
> Councils will use the established flash flood warning system developed and maintained by Manly Hydraulics for Canterbury-Bankstown to provide warnings and information to NSW SES, key stakeholders and the community.
In addition to these resources that are monitored by the NSW SES, the Flood Plan also notes how these warnings are then disseminated to the community, with the SES providing alerts and flood information through:
> Hazards near me app
> Mobile and fixed public address systems and sirens.
> Emergency Alert (SMS and voice message alerting system). Telecommunications (including Auto dial systems).
> Standard Emergency Warning Signal.
> Doorknocking.
> Variable message signs.
> Community notices in identified hubs.
> Distribution through established community liaison networks, partnerships and relationships, and
> NSW SES social media and website
> NSW SES may seek support from agencies and local Council to share the SES social media messages.
> Road closure information will be provided to the community through Transport for NSW ‘Live Traffic’ website: www.livetraffic.com or ‘Transport InfoLine’: 131 500. Also, VMS messaging on roadways may also be used to advise motorists.
Several of these options will provide a useful means of almost instantaneously distributing flood warnings to the community. However, some of these means such as doorknocking and social media posts and community notices are unlikely to have the near instantaneous response needed for the community in overland or flash flooding situations.
Draft Final Flood Risk Management Study and Plan Prospect Creek Sub-Catchments 304600207 | 22 March 2024 75

8.4.2 Discussion of Flood Warning Systems in Flash Flooding Environments
The difficulty with effective flooding warning systems in flash flooding environments is the small amount of time available. A good summary of the considerations for flood warning systems in flash flooding is contained in the below excerpt from the AFAC guideline for flash flooding:
Successful evacuation strategies require a warning system that delivers enough lead time to accommodate the operational decisions, the mobilisation of the necessary resources, the warning and the movement of people at risk.
Where pre-incident planning identifies existing warning lead times as being non-existent, too short or based on too much uncertainty, improvements to warning systems within existing hydrometeorological capability should be a priority.
Weather forecasting and flash flood prediction is undergoing continual improvement. This is the result of many factors, including better science and the influence of technology. The advent of faster and more ‘accurate’ weather and hydrological modelling and enhanced real-time observation systems such as Doppler radar are examples of such advances.
However, although forecast ’accuracy’ is improving for 24 to 72-hour periods, the near-to-real-time period of one to six hours, the period most relevant to flash flood environments, remains a significant forecasting challenge.
Effective evacuation typically requires lead times of longer than just a couple of hours and this creates a dilemma for flash flood emergency managers. Due to the nature of flash flood catchments, flash flood warning systems based on detection of rainfall or water level generally yield short lead times (often as short as 30 minutes) and as a result provide limited prospects for using such systems to trigger planned and effective evacuation.
Warning systems based on weather forecast can yield longer lead times but provide only a qualitative assessment of the potential for flash flooding over a broad geographical area. A forecastbased warning also inherently provides less certainty in either the location or rainfall volume from which to derive the expected depth and timing of flash flooding. This makes it difficult to provide timely and accurate advice to at-risk communities about flash flooding, regarding advice about who needs to evacuate and when to evacuate.
Initiating evacuation of large numbers of people from areas prone to flash flooding based on these uncertain triggers may be theoretically defensible in a purely risk avoidance context but it is likely to be viewed as socially and economically unsustainable. Frequent evacuations in which no flooding occurs, which statistically will be the outcome of forecast-based warning and evacuation, could also lead to a situation where warnings are eventually ignored by the community.
These considerations call for flash flood emergency managers to engage with flash flood prone communities, both to discuss and agree on appropriate triggers for agency-led evacuation, and to educate the community on appropriate behaviour in the event of flash flooding occurring with no or very little warning (including messages about the dangers of late evacuation, and strategies such as moving from unsuitable to suitable buildings).
Therefore, it is recommended that further investigation of suitable flood warning systems be considered particularly for the emergency response hotspots discussed in Section 8.7
Draft Final Flood Risk Management Study and Plan Prospect Creek Sub-Catchments 304600207 | 22 March 2024 76

8.5 Evacuation Timeline
8.5.1 Background
The NSW SES Timeline Evacuation Model has been the de facto standard for evacuation calculations in NSW since it was first developed for evacuation planning in the Hawkesbury Nepean Valley. Though the guideline has not yet been released, the paper Technical Guideline for SES Timeline Evacuation Model was prepared by Molino S. et al in 2013 briefing the industry on the application of the guideline.
The timeline assessment of evacuation potential relates to the regional evacuation of floodplains through doorknocking by SES volunteers through to the evacuation of all occupants for the region.
At the centre of the timeline methodology is the following concept:
Surplus Time = Time Available – Time Required
If surplus time is positive then evacuation of all occupants is feasible, while a negative value implies evacuation of all occupants is not likely to be able to be achieved. The determination of the two times, ‘Time Available’, and ‘Time Required’ is summarised in the following sections.
8.5.2
Sub-Catchment Flood Water Levels and Timing
A review of flood timing for the Prospect Creek Sub-Catchments has been conducted based on base case model results for the 20%, 5%, 2%, and 1% AEP and PMF events at six locations. All have a rainfall duration of 2 hours. The flood timing inspection points, shown in Figure 8-3, include one point in the lower portions of Georges Hall, Lansdowne and Miller Road. There are also three points within Villawood Sub-Catchment in the middle catchment near Orchard Road and two in the lower industrial area, one upstream of the rail line and one downstream. These selected locations generally match the identified emergency hotspots discussed in Section 8.7
The water level time series results for all six locations from the base case models are shown in Figure 8-4 for the three Villawood sites and Figure 8-5 for the three non-Villawood sites.
8.5.3
Rate of Rise
With regards to rate of rise for the PMF event, the three Villawood site begin flooding 30 minutes after the onset of rainfall, with between 1 – 3 metres of flooding depth within an hour of the onset of rainfall. For the three non-Villawood inspection points, the time to flooding is even faster with flooding commencing in 15 minutes, and peaks of flooding occurring at three locations between 30 minutes and 1 hour after the onset of rainfall.
For the 1% AEP and smaller design events the rate of rise is slightly slower with flooding not commencing until 45 minutes after the onset of rainfall for all six locations.
8.5.4
Duration of Flooding
With regards to flooding duration for the PMF event, the model simulation period was set at only 2.5 hours for the Villawood model, and 1.5 hours for the three non-Villawood models. These short simulation times allow for the peak of flooding to occur, however do not allow for analysis of the duration of the falling limb of the flood. Using approximations for the falling limb being roughly equivalent to the rising limb, the three Villawood appear to have a duration of flooding in the order of 6 hours as the peak of flooding occurs at around 2.5 hours.
For the three non-Villawood sites the duration of flooding is expected to be even shorter as the peaks occur within 0.5 – 1 hour, the period of flooding may reasonably be expected to be between 3 – 6 hours.
For the 1% AEP and smaller events, the duration of flooding is expected to be less for the three Villawood locations, estimated to be in the order of three hours for locations 1 and 2, and only 1 hour for Location 3 at Orchard Street. For the three non-Villawood locations the duration of flooding is estimated to be within the order of 2 – 3 hours at all three locations.
Draft Final Flood Risk Management Study and Plan Prospect Creek Sub-Catchments 304600207 | 22 March 2024 77


304600207 | 22 March 2024 78
Draft Final Flood Risk Management Study and Plan Prospect Creek Sub-Catchments
Figure 8-3 Flood Timing Inspection Points (Shown as Yellow Points) with 1% AEP Peak Depth Results

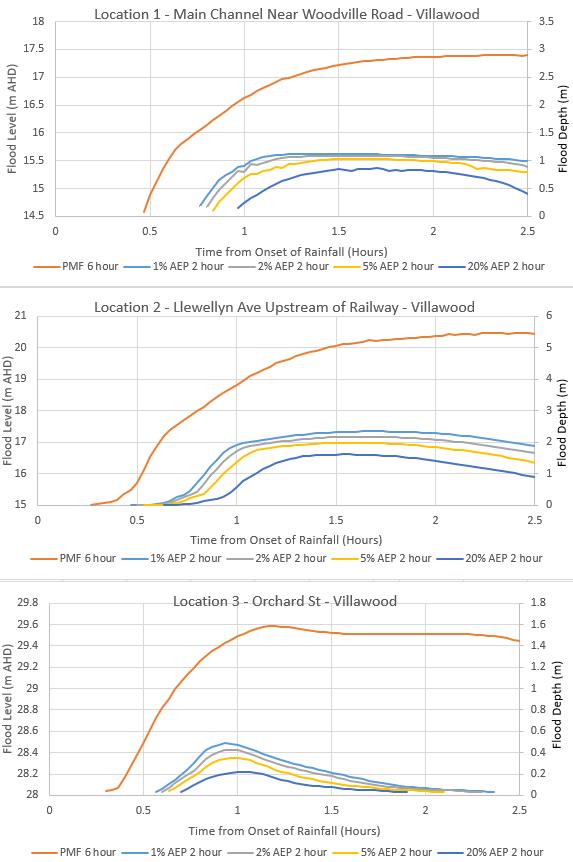
Draft
304600207 | 22 March 2024 79
Final Flood Risk Management Study and Plan Prospect Creek Sub-Catchments
Figure 8-4 Flood Level Time Series Results for Base Case Models for Three Villawood Sub-Catchment Locations

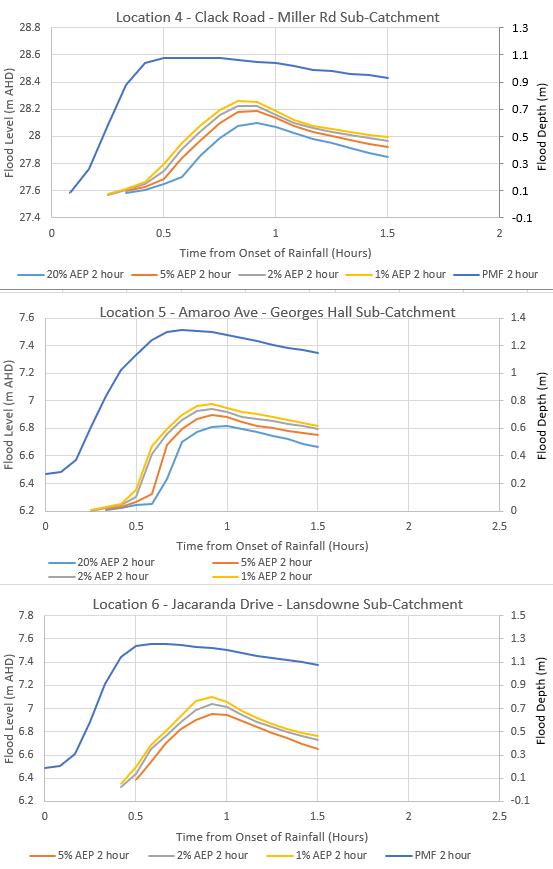
304600207 | 22 March 2024 80
Draft Final Flood Risk Management Study and Plan Prospect Creek Sub-Catchments
Figure 8-5 Flood Level Time Series Results for Base Case Models for Three Non-Villawood Sub-Catchment Locations

8.5.5 Georges River Flood Timing
For the lower portions of the Georges Hall and Lansdowne sub-catchments, the area is affected not only by local flash flooding in areas, but also by Georges River flooding. Due to the large upstream catchment of the Georges River, the timing of flooding is much longer duration and slower rate of rise as is expected for large riverine floodplains.
The water level time series results from the Georges River Flood Study, provided by Canterbury-Bankstown Council are included in Figure 8-6 for the 20%, 5% and 1% AEP as well as the PMF. For context, the local flood water level time series for Location 5 at Amaroo Avenue in the Georges Hall sub-catchment for the 1% AEP and PMF are also shown in Figure 8-6
It shows that the peak of the local floods have passed in less than an hour, while Georges River flooding does not exceed the approximate level of Amaroo Avenue of 6m AHD until 8 hours for the PMF and 22 hours for the 1% AEP event.
Relating to the duration of flooding, the majority of flooding for the local flood would be anticipated to have passed within 3 hours in the PMF event, depending on local ponding and the ability of the areas to drain effectively. Conversely the Georges River PMF event would have a duration of flooding above 6m AHD of approximately 50 hours based on these results.

Draft Final Flood Risk Management Study and Plan Prospect Creek Sub-Catchments 304600207 | 22 March 2024 81
Figure 8-6 Georges River Flood Level Time Series Results in the Vicinity of Georges Hall and Lansdowne Sub-Catchments

8.5.6
Time Available
The ‘Time Available’ is dependent on rate of rise of waters, meaning it varies for each evacuation scenario. From the flood timing assessment included above, the rate of rise is extreme for the Prospect Creek SubCatchments with significant flooding occurring:
> Between 15 – 30 minutes (0.25-0.50 hours) from the onset of rainfall for the PMF event,
> Between 45 - 60 minutes (0.5 – 1.0 hours) from the onset of rainfall for the 1% AEP and smaller events
Therefore there is very little time available from the onset of storm burst rainfall for evacuation to occur. In addition, the volume of rainfall occurring is extreme in both a 1% AEP and PMF storm. It is unlikely that evacuating during the early stages of a design storm burst rainfall event will be safe as both vehicle safety and pedestrian safety is compromised under such heavy rainfall.
As a result, the only form of flood evacuation trigger for the Study Area that will provide sufficient available time to facilitate evacuation is flood forecasting methods as observed rainfall or flooding means that the opportunity to evacuate low-lying areas has already passed.
8.5.7
Time Required
The evacuation timeline model uses the following equation to calculate ‘Time Required’ to evacuate residents by doorknocking by SES volunteers:
Time Required = Warning Acceptance Factor (WAF) + Warning Lag Time (WLT) + Travel Time (TT) + Travel Safety Factor (TSF)
Where the following values are recommended:
> Warning Acceptance Factor = 1 hour – accounts for the delay between occupants receiving the evacuation warning and acting upon it.
> Warning Lag Time = 1 hour – an allowance for the time taken by occupants to prepare for evacuation such as packing their belongings etc.
> Travel Time = Variable – the number of hours taken for the evacuation of all vehicles based on road capacity. NSW SES recommend a road lane capacity of 600 vehicles per hour.
> Travel Safety Factor = Variable – added to travel time to account for any delays along the evacuation route for example resulting from accidents.
Note that time required is calculated from the time that SES are on site and ready to begin doorknocking. Before this time there is an additional phase of mobilisation of SES staff which is the time taken to coordinate and travel to residences to commence doorknocking. There is no data available on mobilisation time for local SES services. For the purposes of this analysis, it is assumed that it will take half an hour to coordinate SES staff and mobilise them to the flood affected areas.
Based on the above contributors, the overall time required for evacuation of the Prospect Creek SubCatchments is a minimum of 2.5 hours (2 hours for WAF and WLT and 0.5 hours for mobilisation). It should be noted that this is a low bound estimate, as various factors such as Travel Time, and Travel Safety Factor have been disregarded. This means that in relation to SES doorknocked evacuation for the Study Area, evacuation needs to be triggered at least 2.5 hours prior to a storm burst rainfall event occurring.
The Evacuation Timeline model has undergone refinements in calculation for time required, with timeline analyses currently being developed being able to more accurately account for traffic conditions on evacuation routes and other improvements in time estimation.
While the Bureau of Meteorology (BoM) provide various flood forecasting tools, it is assumed there are no forecasting tools currently available that can provide the requisite confidence to trigger an evacuation based on flood forecasting 2.5 hours in the future.
Therefore it is concluded that SES doorknocked evacuation is not a reliable emergency response in the Prospect Creek Sub-Catchments. While SES assisted evacuation may be suitable for more long duration rainfall events, for the critical storm burst rainfall events which result in flash flooding this approach is not appropriate. The exception is the Georges River floodplain of the Georges Hall and Lansdowne subcatchments. The low-lying portions of these two study areas are within the Georges River floodplain. Within this riverine floodplain SES guided evacuation is more likely to be feasible and has been used in the past in these areas to initiate evacuation in the event of flooding. The more extended warning time for riverine compared to flash flooding environments allows for SES coordination of response, something that is unlikely to be possible in a flash flood. This is the same conclusion as stated within 2023 FRM Guide EM01.
Draft Final Flood Risk Management Study and Plan Prospect Creek Sub-Catchments 304600207 | 22 March 2024 82

8.6 Shelter-in-Place Potential
NSW DCCEEW following consultation with NSW SES have released the Draft Shelter-in-Place Guidelines in December 2022. The principles outlined in the guideline for shelter-in-place reflect those included in Section 8.2. Essentially that evacuation is the primary response strategy, however in flash flooding areas where evacuation is not possible, shelter-in-place is an alternative, and a last resort for brownfield and greenfield developments.
The guideline provides a list of requirements for potential shelter-in-place. Some requirements relate to development specific considerations such as access to utilities and power during shelter, a minimum floor space area for shelter, and the storage of food, first aid and other resources. However, there are some requirements that relate to the flood affectation of the area, specifically relating to:
> Stability of shelter-in-place structure,
> The duration of flooding of the refuge area, and,
> The feasibility of flood free refuge area.
The potential for shelter-in-place to be implemented for the study area based on these three factors is investigated in the following sections.
The advantage of shelter-in-place is that residents do not require as long to respond for this type of emergency response to be appropriate. As opposed to evacuation where people possibly need to travel a significant distance to reach flood free land, for shelter-in-place people are likely only going to need to access a mezzanine level or first floor within the same building. Thus, the response is more readily available for flash flooding environments and can offer residents a refuge even at night when people are likely to be asleep and not able to respond to evacuation warnings.
As noted within Emergency Management Principle 4 of the 2023 FRM Guide EM01, shelter-in-place should consider the following additional risks for this emergency response type:
> Isolation – There is no known safe period of isolation in a flood, the longer the period of isolation the greater the risk to occupants who are isolated.
> Secondary risks – This includes fire and medical emergencies that can impact on the safety of people isolated by floodwater. The potential risk to occupants needs to be considered and managed.
> Consideration of human behaviour – The behaviour of individuals such as choosing not to remain isolated from their family or social network in a building on a floor above the PMF for an extended flood duration, or attempting to return to a building during a flood, needs to be considered when adopting EM strategy.
8.6.1 Structural Stability
The collapse of a shelter-in-place refuge would result in almost certain loss of life and is not acceptable under any flood event. To determine the likelihood of this occurring the structural stability of shelter-in-place refuges in the event of flooding needs to be assessed.
Hazard categories H5 and H6 both involve structural instability with lower hazard groups H1-H4 being generally considered in a stable range for structures. Discussion of the H1-H6 hazard categories is included in Section 5.2.4. Mapping of H1-H6 hazard for the 20% and 1% AEP and PMF events for the emergency hotspots is included in Appendix E
The results show that H6 areas where building stability is compromised are generally confined to road reserve, backyards and dedicated waterways and channels. The exception is for the industrial area in Villawood Sub-catchment where H6 areas exceed the channel in some sections for the PMF event.
The extent of H5 areas are where standard buildings may be unstable but buildings designed for flood affectation may be stable. The H5 extents are more widespread than H6 but in most locations are not within existing building footprints. At these locations any prospective shelter-in-place refuges would need to be specially engineered to withstand flood forces in the PMF event.
8.6.2
Duration of Flooding
The duration of inundation (the time for which the location is submerged) is guided by the water level time series for the Study Area discussed in Section 8.5.2. The analysis shows that the duration of flooding for the Study Area is relatively short with most locations flood free less than 6 hours after the onset of rainfall for the PMF event. For more frequent flood events the duration of flooding is even shorter.
Draft Final Flood Risk Management Study and Plan Prospect Creek Sub-Catchments 304600207 | 22 March 2024 83

The only exception is the low-lying portions of the Georges Hall and Lansdowne sub-catchments. At these locations, Georges River flooding in the PMF event has significantly longer duration of flooding and slower rate of rise than the flash flooding portions of the floodplain. Shelter-in-place is not considered suitable in these areas and it is recommended that evacuation be adopted for the Georges River floodplain shown as the pink areas in Figure 8-7, and in Appendix E figures.
Aside from the Georges River floodplain, the duration of flooding is less than 24 hours for the majority of the Study Area Sub-daily durations of isolation are relatively short when compared to large riverine catchments within NSW such as the Hawkesbury-Nepean River.
As noted above further discussion of duration of isolation is provided within Principle 4 of the 2023 FRM Guide EM01, which notes secondary risks including fire and medical emergencies can impact on the safety of people isolated by floodwater, and consideration of human behaviour in flooding isolation conditions.
8.6.3 Flood Free Refuge
Flood hazard exposure is the main risk to life related to flooding. Therefore if shelter-in-place is implemented where occupants will remain on site for the duration of the flooding event, it is essential that refuge not expose them to any direct flood hazard, i.e. that the refuge is flood free. As a result, flood refuge should have floor levels located above the PMF water levels.
PMF peak depths vary throughout the Prospect Creek Sub-Catchments. In the upper catchment where overland flow typically occurs and fringe areas of the floodplain PMF depths can be less than 0.5 metres, and even lower than the Flood Planning Level (1% AEP plus 500mm freeboard). In these locations it is not onerous to require for shelter-in-place refuge above the PMF level.
In the lower portions of the floodplain, PMF peak depths become more significant, in particular within the Villawood industrial area and Georges River floodplain where PMF depths are in excess of 2 metres. For these locations, shelter-in-place refuges become more onerous to construct as they will likely require a mezzanine level or a first floor to be constructed. However, such elevated levels are possibly advantageous to future industrial developments in the area assuming that they can be allowed for within height restrictions for the area.
8.7 Flood Information to Support NSW SES
8.7.1
Emergency Response Hotspots
As part of initial consultation for this project, NSW SES representatives requested emergency response mapping for hotspot areas in the Study Area. It was noted that the mapping will assist SES in preparation of Volume II and III of the Canterbury-Bankstown Local Flood Plan. These emergency response maps have been provided in Appendix E
The maps include flood information for the 20% and 1% AEP and PMF events to provide the requested information for the full range of design events. The maps provide the following information to assist SES:
> H1-H6 hazard mapping for the three selected design flood events to show areas of vehicular, pedestrian and building instability,
> Estimated overfloor flooding depth in metres for the three selected design flood events to provide an indication of flood risk sites,
> Indicative evacuation routes to flood free land. A distinction has been made between evacuation routes suitable for vehicles which are preferred and pedestrian only evacuation routes, and,
> From the Flood Emergency Classification of Communities (FERCC) (outlined in Part C of Flood Risk Management Guide EM01), the low flood island areas in the hotspots have been identified. These are the higher risk areas with limited evacuation potential due to flooded roads and flooded properties. A distinction has been made between flash flooding low flood islands and Georges River low flood islands. Another distinction is for low flood islands in industrial land uses where the risk to life may be different than residential land uses.
In total, six emergency response hotspot areas have been identified as shown in Figure 8-7 This figure is also replicated in Appendix E. There are three hotspots in Villawood, and one hotspot each within Georges Hall, Lansdowne and Miller Road. Any potential flood risk management options, particularly emergency response focussed options should focus on these five hotspot areas.
Draft Final Flood Risk Management Study and Plan Prospect Creek Sub-Catchments 304600207 | 22 March 2024 84

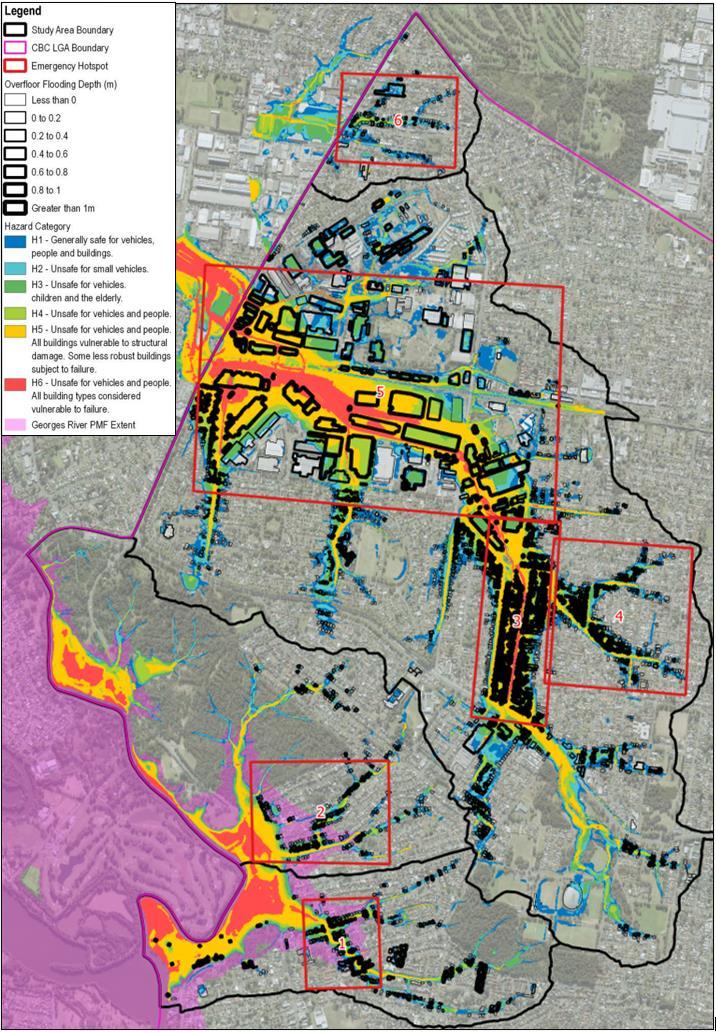
304600207 | 22 March 2024 85
Draft Final Flood Risk Management Study and Plan Prospect Creek Sub-Catchments
Figure 8-7 Emergency response Hotspots with PMF H1-H6 Hazard and PMF Overfloor Flooding Depths

8.7.2
Flood Affected Property Summary
As outlined in Part B of the of the 2023 FRM Guide, part of the FRM process is to provide NSW SES key information to support emergency management planning. One of the recommended details for the FRMS&P to develop is a tabulation of flood information for the study area.
Most of the example tables provided in Section B6 of Guide EM01 are not relevant to this study area as there are no gauges available, and no trigger water levels. However a summary of the number of flooded properties has been tabulated for the five modelled design flood events in Figure 8-2. This information has been provided for the six emergency response hotspots in the study area.
8.7.3 Flood Information for Road Crossings
Any flood response suggested for the study area must consider the availability of flood free access, and the ease with which movement may be accomplished. Movement may be evacuation from flood affected areas, medical personnel attempting to provide aid, or SES personnel installing flood defences.
There are 31 locations of road overtopping shown in Figure 8-8
Draft Final Flood Risk Management Study and Plan Prospect Creek Sub-Catchments 304600207 | 22 March 2024 86

Table 8-2
Affected Properties and Buildings for the Emergency Response Hotspots
1 – Amaroo Avenue in Georges Hall
2 – Jacaranda Dr, Denman Rd and Caroline Cres in Lansdowne Sub-catchment
3 – Orchard Rd in
4 – Cann St, Compton ST and Marks St in Villawood
5 – Villawood Industrial Precinct in Villawood Subcatchment
6 – Miller Road Sub-Catchment
Draft Final Flood Risk Management Study and Plan Prospect Creek Sub-Catchments 304600207 | 22 March 2024 87
Flood
Hotspot
Flood Number of Flooded Properties Number of Over Floor Flooded Buildings Average Over Floor Flooding Depth (m) Number of H5 or H6 Affected Buildings Number of Residential Low Flood Island Properties Number of Commercial Low Flood Island Properties Number of Georges River Low Flood Island Properties
Design
Sub-Catchment 20% AEP (1 in 5 year) 55 19 0.10 0 25 0 27 5% AEP (1 in 20 year) 63 29 0.16 0 2% AEP (1 in 50 year) 71 31 0.20 0 1% AEP (1 in 100 year) 74 36 0.21 0 PMF 98 84 0.47 6
20% AEP (1 in 5 year) 52 12 0.18 0 14 0 22 5% AEP (1 in 20 year) 71 30 0.18 0 2% AEP (1 in 50 year) 90 38 0.21 0 1% AEP (1 in 100 year) 95 43 0.23 0 PMF 141 79 0.41 5
Sub-catchment 20% AEP (1 in 5 year) 60 62 0.11 0 115 2 0 5% AEP (1 in 20 year) 133 129 0.13 1 2% AEP (1 in 50 year) 180 156 0.16 1 1% AEP (1 in 100 year) 206 386 0.30 2 PMF 430 468 0.85 182
Villawood
20% AEP (1 in 5 year) 39 54 0.17 0 22 0 0 5% AEP (1 in 20 year) 65 83 0.18 0 2% AEP (1 in 50 year) 71 91 0.19 0 1% AEP (1 in 100 year) 82 181 0.30 0 PMF 164 192 0.46 32
Subcatchment
20% AEP (1 in 5 year) 87 53 0.31 4 2 31 0 5% AEP (1 in 20 year) 123 86 0.27 6 2% AEP (1 in 50 year) 138 98 0.29 6 1% AEP (1 in 100 year) 151 226 0.39 9 PMF 250 295 0.97 130
20% AEP (1 in 5 year) 41 13 0.20 0 8 0 0 5% AEP (1 in 20 year) 62 23 0.18 0 2% AEP (1 in 50 year) 72 27 0.19 0 1% AEP (1 in 100 year) 73 30 0.20 0 PMF 103 47 0.29 0

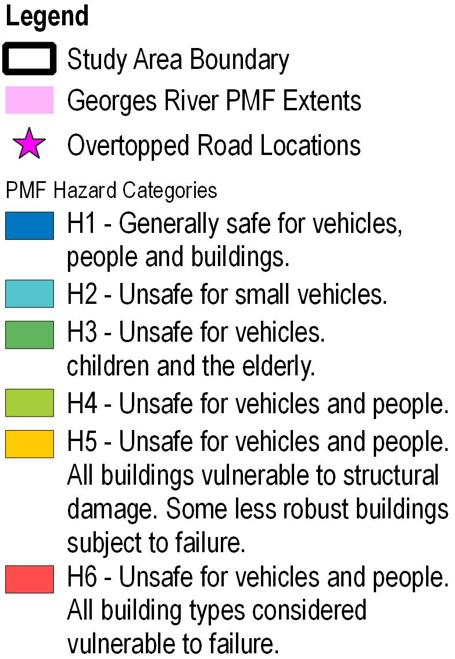
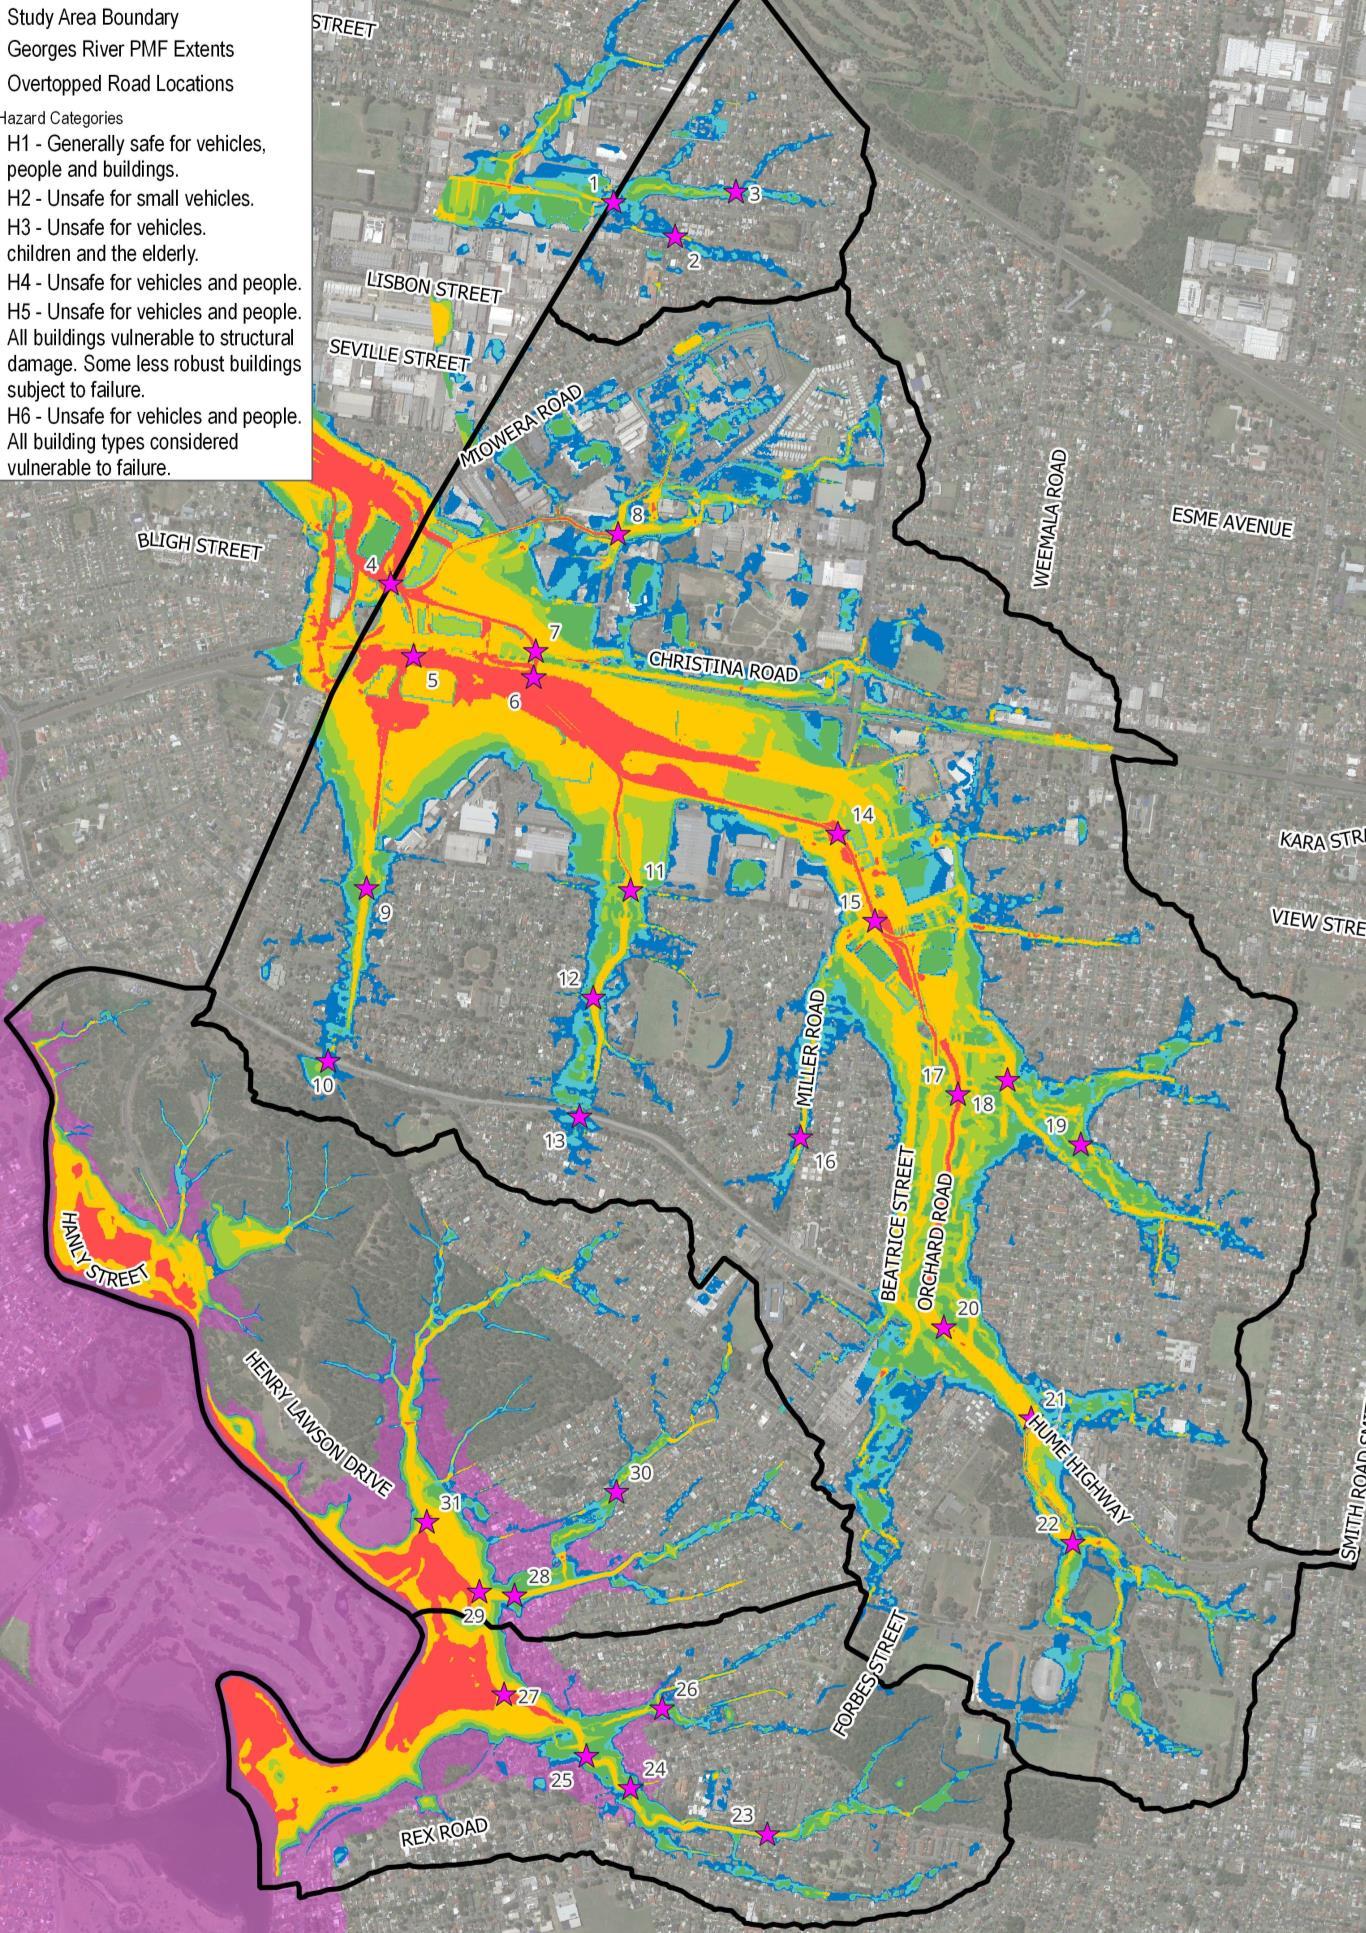
Draft Final Flood Risk Management Study and Plan Prospect
Sub-Catchments 304600207 | 22 March 2024 88
Creek
Figure 8-8 Flood Affected Road Locations within Study Area

8.8 Potential Improvements to Flood Emergency Response
Based on the detailed review of flood emergency response provisions for the Prospect Creek SubCatchments, it is unlikely that SES doorknocked evacuation will be able to effectively evacuate residents prior to overland or flash flooding. From this review, a number of potential measures have been identified that could improve flood emergency response potential for the study area:
> Use of alternative flood warning systems: Section 8.4 discusses the difficulties of flood warning systems in flash flooding environments. A number of alternatives may be considered for flood warning systems may be developed for the Study Area, particularly the emergency response hotspot areas.
> Self-managed evacuation,
> Improved flood awareness,
> For the Georges River floodplain of Georges Hall and Lansdowne, particularly those that are also affected by flash flooding from the local catchment, site-specific, personal evacuation plans should be considered.
The second and third points listed above are discussed further in the following sections. The other alternative to improve the emergency timeline is to utilise shelter-in-place in support of evacuation, with the suitability of this approach discussed further in Section 8.6.
8.8.1 Self-Managed Evacuation
An alternative to emergency service assisted evacuation is self-managed evacuation. This describes where people make their own decision to evacuate earlier and move to alternate accommodation, using their own transport. Self-managed evacuation has a number of advantages:
> People can be evacuated far quicker than emergency service assisted evacuation as various factors in the evacuation timeline are reduced or removed completely such as accounting for time for emergency services to mobilise, and doorknocking time.
> Self-managed evacuation reduces the strain on emergency service resources as part of the floodplain will be evacuated without needing to be doorknocked or otherwise prompted. Also less coordination is required on the part of emergency services as the scale of the evacuation exercise is lessened by some people being self-reliant
However, self-managed evacuation can also pose a risk if not conducted in an appropriate way. Residents could place themselves at higher risk for example if they evacuate to a location which is even more flood affected, drive through flood waters, or could increase traffic congestion if the wrong route is selected.
A way for Council to encourage and confirm the adequacy of any self-managed evacuation is through flood emergency response development controls. This could be through implementing requirements for new developments to develop flood emergency response plans particularly large-scale development such as medium and high density residential. Another alternative to improve self-managed evacuation could be requiring site-specific flood warning systems, however these systems typically rely on observed flooding.
NSW SES in their advice for this project noted “self-evacuation of the community should be achievable”.
8.8.2
Improved Flood Awareness
For the evacuation timeline model, two factors are typically expected to take one hour each in order for residents to evacuate, Warning Acceptance Factor and Warning Lag Time. These two factors both contribute to the poor outcome for the Prospect Creek Sub-Catchments evacuation timeline, however both can feasibly be significantly reduced through improved flood awareness:
> Warning Acceptance Factor, accounts for the delay between occupants receiving the evacuation warning and acting upon it. If people are aware of the flood risk of the area that they live in, then it is reasonable to expect that they will acknowledge the seriousness of any flood warning, and perhaps begin evacuating immediately instead of one hour after receiving the warning.
> Warning Lag Time, an allowance for the time taken by occupants to prepare for evacuation such as packing their belongings etc. If residents are aware of the flash flooding nature of the catchment they are in, then they will know that they have very limited time to respond before flooding commences, leaving the majority of their belongings behind to ensure they evacuate as soon as possible for their own safety.
Based on the above considerations a flood awareness program for the Study Area, educating residents of the seriousness of the flood risk and flash flooding behaviour could drastically improve the evacuation timeline. Currently the processes of residents in evacuation are expected to take on average 2 hours, however this could be reduced significantly if residents are suitably aware of local flood risk.
Draft Final Flood Risk Management Study and Plan Prospect Creek Sub-Catchments 304600207 | 22 March 2024 89

9 Flood Risk Management Options
9.1 Background
9.1.1
Managing Flood Risk
Risk is a combination of the consequences of flooding and the likelihood of these consequences occurring. Flood risk to the community is not static. It can be influenced by Flood Risk Management (FRM) measures, climate change, and future development. It is important to understand these risks and how they may change over time so that this can be considered in management.
Considering flood behaviour with existing measures in place provides a basis for understanding the residual risk to the community with existing conditions, how risks may change into the future, and making informed management decisions. Flood risk can be categorised as existing, future or residual risk as follows:
> Existing Flood Risk – existing buildings and development on flood prone land. Such buildings and developments by virtue of their presence and location are exposed to an ‘existing’ risk of flooding,
> Future Flood Risk – buildings and developments that may be built on flood prone land in the future. Such buildings and developments would be exposed to a flood risk when they are built, and
> Residual Flood Risk – buildings and development that would be at risk following the implementation of FRM measures. Unless a FRM measure is designed to the PMF, it may be exceeded by a sufficiently large event at some time in the future, meaning in most instances there is still a residual flood risk.
The alternate approaches to managing risk are outlined in Table 9-1. The hierarchy of preferred risk approaches is from top to bottom in the approaches listed in the table. This hierarchy is also referenced within Section 3 of the Flood Risk Management Guide FB01.
Table 9-1 Flood Risk Management Alternatives (Source: SCARM, 2000)
Alternative Examples
Preventing / Avoiding Risk
Appropriate development within the flood extent, setting suitable planning levels.
Reducing likelihood of risk Measures to reduce flood risk such as drainage augmentation, levees, and detention.
Reducing consequences of risk Development controls to ensure structures are built to withstand flooding.
Transferring risk Via insurance – may be applicable in some areas depending on insurer.
Financing risk Natural disaster funding.
Accepting Risk Accepting the risk of flooding as a consequence of having the structure where it is.
9.1.2 Options Development Process
As stated within the FRM Guide MM01 the assessment of FRM options should consider:
> Their practicality and feasibility, including the timeframe within which they may be implemented.
> The social, economic, and environmental costs, benefits and disbenefits of FRM measures.
> The upfront, ongoing and complementary work and lifecycle costs involved in implementation.
> Input from the community and the acceptability of measures to the community.
> Consistency with industry guidance and government direction, policy and guidance.
The assessment of FRM options should consider people in the community, the economy, social and cultural aspects, services to the community and the natural environment. Relating to the development of FRM options, the FRM Guide MM01 recommends the following stages within a FRMS&P:
> Option identification and preliminary option assessment and optimisation – The identification of an inclusive range of FRM options to address local or broad FRM issues for the existing community and new development. Having identified the FRM issues to address and an inclusive range of FRM options worthy of consideration, the viability of these options needs to be tested to determine if they warrant more detailed assessment. This process is summarised within the following sections.
Draft Final Flood Risk Management Study and Plan Prospect Creek Sub-Catchments 304600207 | 22 March 2024 90

> Detailed option assessment – Detailed assessment and subsequent optimisation of FRM options and packages of options needs to consider their costs, benefits and disbenefits in managing risk. The detailed assessment includes flood modelling of options, damages assessment of option benefits, preliminary costing and a Multi-Criteria Assessment (MCA) that considers a broad range of factors quantitatively or qualitatively. This detailed assessment is summarised in Section 10
> Recommendation in FRM studies and decision-making in FRM plans which is summarised in the implementation program in Section 11
9.2 Flood Risk Management Measures
FRM measures (interchangeably referred to as FRM options in this report) which are available for the management of flood risk can be categorised according to the way in which the risk is managed. There are five broad categories outlined within Table 29 of the FRM Guide MM01:
> Flood information - Flood information is essential to understanding flooding. Therefore the continued sourcing of flood information for the study area is considered a stand-alone FRM measure that indirectly influences future flood risk through informing decision-making.
> Flood modification measures – Flood modification measures are options aimed at preventing / avoiding or reducing the likelihood of flood risks. These options reduce the risk through modification of the flood behaviour in the catchment.
> Property modification measures – Property modification measures are focused on preventing / avoiding and reducing consequences of flood risks. Rather than necessarily modify the flood behaviour, these options aim to modify properties (both existing and future) so that there is a reduction in flood risk.
> Emergency response modification measures – Emergency response modification measures aim to reduce the consequences of flood risks. These measures generally aim to modify the behaviour of people during a flood event.
> Environment enhancement – Measures that look to prevent / avoid and reduce consequences of flood risk while also enhance environmental outcomes. Examples include catchment management measures, waterway modification measures, and Water Sensitive Urban Design (WSUD).
9.3 Comprehensive List of Flood Modification Options
During the site visits (discussed in Section 3.3), extensive notes were recorded for likely existing flooding behaviour and observed site constraints for the 80 sites visited across the four sub-catchments. From these observations a preliminary and exhaustive list of potential flood modification options were developed, with 62 flood modification (structural) options identified. Mapping of the site visit and comprehensive list of options are included within Appendix F The list of flood modification options have been grouped into the following:
> Drainage Upgrade,
> Channel Upgrade,
> Bridge Upgrade,
> Detention Basin, both with and without Water Quality (WQ) treatment,
> Road Raising,
> Flood Levee.
The comprehensive list of possible flood modification options and option types that were considered for each sub-catchment are summarised in Table 9-2
Table 9-2 Comprehensive List of Flood Modification Options by Type and Sub-Catchment
Draft Final Flood Risk Management Study and Plan Prospect Creek Sub-Catchments 304600207 | 22 March 2024 91
SubCatchment Drainage Upgrade Channel Upgrade Bridge Upgrade Detention Basin Detention Basin w WQ Treatment Road Raising Flood Levee Total Georges Hall 5 4 4 2 15 Lansdowne 2 5 3 2 2 14 Miller Road 2 1 2 1 6 Villawood 5 7 1 3 8 3 27 Total 14 7 1 13 17 8 2 62

9.4 Preliminary Flood Modification Options
9.4.1 Selection of Preliminary Flood Modification Options
Following Council review of the Interim Report 2, discussions with Council and NSW DCCEEW were held to determine which options would be adopted as preliminary flood modification options. Each of the 62 initial flood modification options were assessed a priority based on preliminary review of feasibility and effectiveness. The options were assigned a preliminary priority by the project technical working group (TWG) grouped into four levels: Very Low, Low, Medium and High. All options with a priority of medium or high were determined to be suitable, with potential significant benefit and feasibility to warrant further consideration as preliminary flood modification options.
The preliminary priority for flood modification options was confirmed as shown in Table 9-3. In total, twenty (20) preliminary flood modification options were assigned a priority of medium or high. The highest number of medium / high priority options are within Villawood (8), with Georges Hall (7) being second followed by Lansdowne (4) and Miller Road (1).
Table 9-3 Summary of Preliminary Priority for Flood Modification Options by Sub-Catchment (Medium / High) Carried into Preliminary Assessment and Modelling
9.4.2 Modelling of Preliminary Flood Modification Options
The twenty (20) flood modification options that were selected for preliminary assessment were developed and modelled in the four sub-catchment TUFLOW models with the following methodology:
> Each option had a unique model scenario established to account for the proposed option details. Each option model was based off the base case, existing scenario TUFLOW model summarised in Section 5
> Each option was modelled for three design events: the 20%, 5% and 1% AEP events
> The methodology for each option accounted for the proposed works in the TUFLOW model as follows:
- Drainage upgrades were modelled with updates to the 1D network with duplication of pits and pipes, and creation of new pits and pipes. The details of the proposed network were based on review of existing conditions to develop feasible pipe / culvert dimensions, locations, inverts and pit sizes.
- Channel upgrades were modelled (all in the Villawood sub-catchment) as 1D channel elements as per the base case model. Changes to the channel shapes, inverts, and 1D roughness values were applied to represent proposed changes in channel shape and lining.
- Detention basins were modelled within the 2D domain of the TUFLOW model with 2D_zshapes applied to create basin shapes typically with roughly 1 in 4 side slopes. The inverts of the basins were determined based on review of existing conditions, and minimum connection levels to existing stormwater networks. There were two methods for drainage basin drainage to be represented:
• For basins with proposed water quality treatment (requiring low flow discharge into the basin), existing trunk drainage lines were modelled to discharge into the basin, with an inlet node applied to the basin, often with a 0.3 – 0.5m extended detention depth to allow for potential treatment.
• For basins without proposed water quality treatment, often any existing trunk drainage was not designed to discharge into the basin, with the basin to be filled by overland flows from the 2D domain representing surface runoff in the model. These basins were also modelled to discharge via an inlet node connecting into the nearest existing stormwater network.
- Road corridor changes: A common option modelled was minor (0.2 – 0.5 metre) raises in road verge areas to divert flows away from private property and retention in the road reserve. These minor berms were modelled in the 2D domain of the model as 2D_zshapes in TUFLOW.
Draft Final Flood Risk Management Study and Plan Prospect Creek Sub-Catchments 304600207 | 22 March 2024 92
Sub-Catchment Very Low Low Medium / High Total Georges Hall 3 6 7 16 Lansdowne 4 6 4 14 Miller Road 1 5 1 7 Villawood 0 17 8 25 Total 8 34 20 62

9.4.3 Development and Optimisation of Preliminary Flood Modification Options
As per Section 2.2.4 of the FRM Guide MM01, optimisation of options may be used to refine options to improve benefits and reduce costs or disbenefits. This process was conducted for the 20 preliminary flood modification measures developed for this study.
The option as proposed in discussions with Council and NSW DCCEEW was initially modelled, and then depending on the outcomes of the initial modelling was often refined and altered to enhance option benefits. In some instances, this led to significant changes in option design through this optimisation process.
Optimisation not only occurred based on maximising flood benefits, but also in response to other factors that were accounted for in the preliminary option development including:
> Maximising the feasibility of the option. This included:
- Consideration of subsurface utility locations, with proposed earthworks avoiding the vicinity of these utilities where possible
- Creating a suitable scale of works justifiable based on the anticipated flood benefits
- Considering land ownership and avoiding works on private lands where possible
> Considering the relative cost of the option based on the scale of works, this provides an indication of the economic feasibility of the option.
> Reducing flood affectation and flood risk on private properties, particularly residential properties wherever possible. Often this resulted in additional flood risk within publicly owned lands such as road reserves and public open spaces.
> Minimising disturbance of ecological communities and minimising tree removal particularly for native species. The types of vegetation on subject sites was guided by site visit observations and Google Streetview.
> Minimising adverse impacts on private properties or non-publicly owned lands. While some options would result in significant benefits for some properties, it was important they not adversely affect other properties.
> Potential co-location opportunities for water quality treatment. This was considered particularly relevant in light of the Catchment Action Plan (CAP) currently under development for the same study area.
For the 20 preliminary flood modification options, a summary of the option outcomes considering all of the above was provided to Council and NSW DCCEEW for their review. As discussed in the sections below, these factors were assessed in determining the options to carry into detailed assessment.
9.5 Other Preliminary Options
Beyond the 20 flood modification options that were modelled and assessed, a further twelve non-structural preliminary options were considered:
> Six preliminary Property Modification (PM) measures including Voluntary House Raising (VHR), flood proofing, Voluntary Purchase (VP) and two derivatives (land swap and Council redevelopment) and stormwater system maintenance.
> Six preliminary Emergency Response Modification (EM) measures including flood prediction and warning, flood planning review, community awareness and school education programs, flood markers and signage and flood data and debrief.
These options were developed based on guidance provided within the FRM Guide MM01, the 2023 FRM Manual and based on past experience with option development in other study areas.
It is noted that all emergency response modification options focus on improvements that can be administered by Canterbury-Bankstown Council. The intent is for Council to be able to assist in flood response for the study area, not for these options to be implemented by NSW SES. The only option that may have had implications for NSW SES, school education programs, has not been progressed as a detailed option as it is beyond the purview of Council.
Draft Final Flood Risk Management Study and Plan Prospect Creek Sub-Catchments 304600207 | 22 March 2024 93

9.6 Selection of Preliminary Options for Detailed Assessment
As noted in the previous sections, in total 32 preliminary options were considered as part of this study. This included 20 FM options, 6 PM options and 6 EM options. These preliminary flood modification options have been discussed in detail with Council and NSW DCCEEW during a TWG workshop meeting on 2 February 2023. This included detailed review of flood benefits and feasibility based on summaries provided to the TWG.
The development and assessment of the preliminary options involved consideration of the following:
> Consultation outcomes for the community and stakeholders summarised in Section 4.6 and 4.5 respectively, including the community survey preferences for FRM option preferences summarised in Table 4-2
> Flood emergency response assessment outcomes summarised in Section 8. In particular, the ranking of these preliminary options focussed on the emergency response hotspots discussed in Section 8.7 and shown in mapping in Appendix E
> Flood damages outcomes for the existing scenario summarised in Section 7.4. The prioritisation of these preliminary flood modification options considered the areas of highest flood damages and prioritised options that improve flood risk in these areas.
> The recommendations of Council and NSW DCCEEW representatives
A summary of all 32 preliminary options, including descriptions of the options, high-level discussion of benefits, technical feasibility and costs for FM options, and descriptions of PM and EM options is included in Appendix G
Following this review and discussion, a total of 18 options were selected for detailed assessment including 11 FM options, 2 PM options and 5 EM options. Further details relating to the options selected for detailed assessment is included in Section 10.1
Draft Final Flood Risk Management Study and Plan Prospect Creek Sub-Catchments 304600207 | 22 March 2024 94

10 Detailed Assessment of Options
10.1
Options for Detailed Assessment
Eighteen (18) options were selected for detailed assessment including hydraulic modelling of five design events (for FM options), damages assessment, cost estimation and Multi-Criteria Assessment (MCA). A summary of the 18 options is included in Table 10-1 It is noted that detailed options retained their preliminary option ID, therefore the ID numbering of the detailed option list is non-sequential.
Table 10-1 Description of Options for Detailed Assessment
Georges Hall FG4 – Rex Road Bunds
Georges Hall FG5 – Harden Reserve Basin Retrofit
Georges Hall FG7 – Amaroo Ave Drainage Upgrade
Lansdowne FL2 – Wilton Reserve Detention Basin
Lansdowne FL3 – Jacaranda Drive Drainage Upgrade
Flood Modification (FM)
Property Modification (PM)
Emergency Response Modification (EM)
Miller Road FM1 - Miller Road Bunds
Villawood FV1 – Alcoomie Reserve Detention Basin
Villawood FV3 – Tucker Reserve Detention Basin
Villawood FV5 – Orchard Road Drainage Upgrade
Villawood FV6 – Sir Thomas Mitchell Drive Channel Upgrade
Villawood FV8 – Christina Road Channel Upgrade
All subcatchments
All subcatchments
PM1 – Voluntary House Raising
PM3 – Voluntary Purchase
EM1 – Flood Prediction and Warning
EM2 – Review of Local Flood Planning and Info Transfer to NSW SES
EM3 – Community Flood Awareness
EM5 – Flood Markers and Signage
EM6 – Flood Data and Debrief
10.2 Flood Modification Options
10.2.1 Overview
A brief description of the proposed works for all eleven (11) flood modification (FM) options proposed for adoption are summarised in Table 10-2
Of the 11 flood modification options selected for detailed assessment, three are located in Georges Hall, two in Lansdowne, one in Miller Road and five in Villawood sub-catchment. The location of the 11 flood modification options is shown in Figure 10-1
There are four detention basins proposed (one being a retrofit of an existing basin), three pit and pipe drainage network updates, two stormwater channel upgrades, and two road corridor bund projects. Several options have multiple components of the above option types, for example a detention basin option may also incorporate a pit and pipe drainage alteration for the draining of the basin as well as a road corridor bund to divert additional runoff into the basin.
Draft Final Flood Risk Management Study and Plan
304600207 | 22 March 2024 95
Prospect Creek Sub-Catchments
Option Type Sub-Catchment Option ID

Description of Options for Detailed Assessment
FG4 – Rex Road Bunds Georges Hall
FG5 – Harden Reserve Basin Retrofit Georges Hall
FG7 – Amaroo Ave Drainage Upgrade Georges Hall
FL2 – Wilton Reserve Detention Basin Lansdowne
FL3 –Jacaranda Drive Drainage Upgrade Lansdowne
FM1 - Miller Road Bunds Miller Road
FV1 – Alcoomie Reserve Detention Basin Villawood
FV3 – Tucker Reserve Detention Basin Villawood
FV5 – Orchard Road Drainage Upgrade Villawood
FV6 – Sir Thomas Mitchell Drive Channel Upgrade Villawood
Two bunds to be added to edge of Rex Road reserve to retain overland flows within road reserve and The Crest Reserve upstream to keep out of downstream properties. New grated inlet pit added in existing easement of ponding area in residential property.
Detention basin berm increased by 0.8 metres to add additional detention storage to basin. No change to base of the existing basin or to pit and pipe network. Two diversion berms in the form of elevated pedestrian crossings have been added to Amaroo Ave and Harden Cres on either side to divert runoff into the basin. A small bund along the property frontages downstream on Harden Crescent to retain flows in the road reserve. If the basin were to be converted into a WQ treatment basin, the inlet could be elevated to provide extended detention depth in the base of the basin, however this has not been modelled.
For south Bambil Street, add several diversion bunds on edges of the road corridor to retain flows in the road reserve Add a new trunk drainage line from Bambil St to the south to the existing culvert outlet location in Amaroo Reserve. The new trunk drainage line will divert flows from part of the existing stormwater network for Amaroo Ave. All 13 inlet pits are assumed to be 4.2m lintels with 0.45mx0.9m pits.
For Wendy Ave, alteration of the road topography to divert flow north into Wilton Reserve and away from properties Diversion channel and bund along reserve to maintain flows away from residential properties Detention basin in Wilton Reserve with 1 to 1.5 metre cut proposed. The basin will be drained by a new inlet pit and a 0.45m diameter pipe into existing 1.2m dia trunk drainage
For Athel Street, add a diversion bund on the west edge of the roadway. Add a new trunk drainage line from Athel St to the east to the existing culvert outlet location in Jacaranda Reserve near Henry Lawson Drive. The new trunk drainage line will duplicate the existing 1.2m diameter pipe along Jacaranda Drive. All 5 duplicate pits in the model are assumed to match existing mostly 3.6m lintels with 0.45mx0.9m pits
Bullock Reserve is proposed to have a 1m high bund added on the northern side of the reserve to divert flows from private property. Bunds are proposed mostly in road corridors throughout the sub-catchment at Bullock Avenue, Middleton Rd, Clack Rd, Middleton Rd near Woodville Rd, and at two locations on Fuller St.
New basin in Alcoomie Reserve proposed with 2 metres lowered levels. The existing 1.2m diameter pipe to the east is to be diverted into the basin, with a 1.2m pipe outlet to the existing location. The existing 0.525m diameter pipe to the north is to be diverted into the basin, with a 0.525m pipe outlet to the existing drainage line, , with water quality treatment feasible in the base of the basin.
Basin in Tucker Reserve with 2.2 metre lowering of land The existing 0.9m diameter pipe to the east is to be diverted into the basin, with a 0.9m pipe outlet to the existing location, with water quality treatment feasible in the base of the basin.
No changes to terrain are proposed. Add a new trunk drainage line from south end of Orchard Road to the existing culvert outlet location to the open channel to the north. The new trunk drainage line will divert flows from part of the existing stormwater network for Orchard Road.
The channel section under Sir Thomas Mitchell Road is proposed to be lowered by 0.9 metres as there is an existing vertical weir downstream of the bridge. The channel section immediately upstream for the side channel to the east would be lowered all the way to Orchard Road culvert. For the main channel section, the base has been widened to 7.5m. For the side channel the base has been widened to 4m (in existing varied typically between 2.5-3.0 metres) Concrete lining is proposed for this lengths of channel which are currently vegetated.
FV8 – Christina Road Channel Upgrade Villawood
For Christina Road side channel upgrades, the culvert under the railway line is proposed to be lowered by 0.6 metres, the twin 1.5 metre pipes under Christina Road are also proposed to be lowered by 0.6 metres and increased to twin 2.1m diameter pipes, and the channel section from Christina Road to the confluence of channels is to also be lowered by 0.6 metres with the base of the channel widened through vertical side walls.
For the main channel section the base has been widened to 7.5m.
For the side channel the base has been widened to 4m.
Near Woodville Road, a basin in vegetated area with up to 3.0 metres cut to be 0.5 metres above existing main channel invert, but roughly in line with north side channel invert to provide additional flood storage in the channel junction area near Woodville Road.
Draft Final Flood Risk Management Study and Plan Prospect Creek Sub-Catchments 304600207 | 22 March 2024 96
Table 10-2
ID SubCatchment
Option
Description

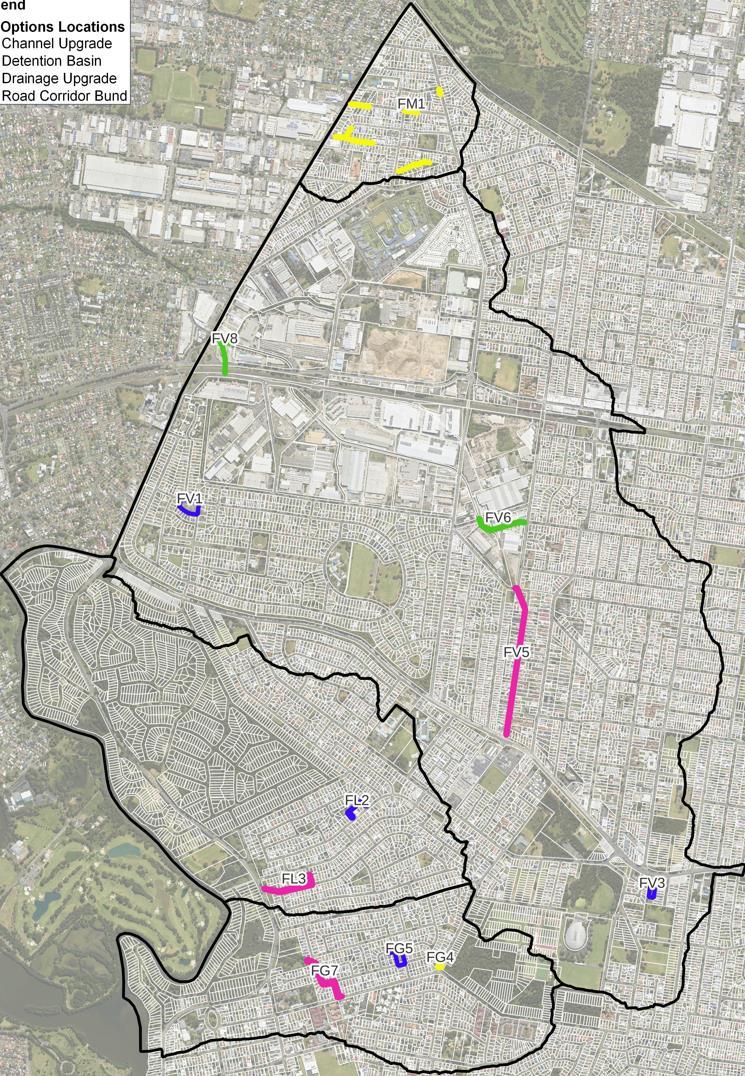
304600207 | 22 March 2024 97
Draft Final Flood Risk Management Study and Plan Prospect Creek Sub-Catchments
Figure 10-1 Location of 11 Detailed Flood Modification Options for Prospect Creek Sub-Catchments

10.2.2 Road Corridor Bunds
Most of the proposed FM options are relatively conventional flood mitigation designs that would commonly be proposed in both urban and rural FRMS&P. The road corridor bund is a more unique solution tested for this study area.
The majority of this study area is almost fully developed with very few vacant lots, and importantly few instances of Council-owned drainage corridors or open space parks that align with overland flowpaths throughout the study area. Typically, it is Council-owned flood affected lands that make ideal locations for flood mitigation works as there is no land acquisition costs or associated social implications.
The ultimate design principle of most flood mitigation works is to retain flood risk within Council-owned undeveloped areas to reduce flood affectation of surrounding private residential properties. This is commonly done through one of the following:
> When there is a drainage corridor or open space area that aligns with an overland flowpath, solutions such as detention basins or channel upgrades may be considered.
> When a Council-owned road corridor aligns with an overland flowpath then pit and pipe drainage upgrades along the corridor may be considered.
> When an overland flowpath is conveyed through private properties, a drainage easement can be established mostly within undeveloped portions of properties (typically backyards) that allows for drainage pipes to be installed to convey flows.
For large parts of the study area none of these typical opportunities were available as the historical development of the area did not align road corridors with flowpaths (often roads run perpendicular to flowpaths), there are very few dedicated drainage corridors assigned to allow for conveyance of overland flowpaths, and drainage easements previously established have undersized drainage. Opportunities for new or altered drainage easements through private property were considered however the extensive development of the study area means that a drainage easement alignment which had minimal disturbance of existing private structures was not readily identifiable.
Therefore, for locations within the study area with such limited opportunities road corridor bunds were identified as a potential alternative. This involves establishing roadside bunds, typically in the grassed verge areas of local road corridors that are between 0.2 – 0.5 metres higher than existing ground levels. The alignment of the bunds were designed and modelled such that they retain overland flows within road corridors, in turn reducing runoff entering private residential properties downstream. These are low-cost options that through modelling were found to have significant benefit for residential properties, particularly in the more frequent 20% and 5% AEP flood events.
These road corridor bund options have been implemented where there were no other feasible options, at Rex Road in Georges Hall sub-catchment (FG4), and at multiple locations throughout the Miller Road subcatchment (FM1).
10.2.3
Hydraulic Modelling
The hydraulic modelling of detailed flood modification options reflected the model approach adopted for the preliminary options summarised in Section 9.4.2. The 11 detailed flood modification options were modelled for five design flood events - the 20%, 5% and 1% AEP events as part of the preliminary option assessment, and in addition were also modelled for the 2% AEP and PMF events.
The review of hydraulic model results for detailed options included water level difference plots for each option compared to existing conditions for all 5 design events. The extent and scale of water level reductions and complete removal of flooding informed flood risk improvement conclusions for each option.
10.2.4
Damages Assessment of Flood Modification Options
An assessment of flood damages of the study area for the existing condition was presented in Section 7 The existing condition assessment was used as the base case to compare the performance of modelled options, and through calculation of post-option damages based on hydraulic model results the potential flood damage benefits of each option The details of all methodology and input data for the option condition damages assessment are unchanged from the existing damages assessment summarised in Section 7. The only change was to re-assess damages using the option condition TUFLOW model results for all 11 FM options. The damage assessment for options focussed only on the extent of impacts of the options, not the entire study area, with the total damage benefits calculated from the difference between option and existing condition damage totals in these areas of impact.
Draft Final Flood Risk Management Study and Plan Prospect Creek Sub-Catchments 304600207 | 22 March 2024 98

A summary of damage benefit outcomes for the five modelled design flood events (20%, 5%, 2%, and 1% AEP and PMF) for each of the 11 FM options is included in Table 10-3
The Average Annual Damage (AAD) reduction for each of the 11 FM options has also been calculated in Table 10-3. The total combined AAD benefit of all 11 FM option is estimated to be nearly $1.8M per year. The options with the highest AAD benefits are unsurprisingly some of the largest proposed options, FV5 –Orchard Road Drainage Upgrade, FV3 – Tucker Reserve Detention Basin, FL3 – Jacaranda Drive Drainage Upgrade, and FV8 – Christina Road Channel Upgrade. Conversely the option with the lowest AAD benefit is the smallest proposed options FG4 – Rex Road Bunds.
Table 10-3 Reduction in Flood Damages and AAD Associated with each FM Option
10.3 Property Modification Options
10.3.1 PM1 – Voluntary House Raising
House raising is a measure designed to reduce the incidence of over-floor flooding of existing buildings through works where Council and NSW DCCEEW make contributions to the funding the cost of the work. There are a range of factors that contribute to the feasibility of Voluntary House Raising. Based on review of house raising schemes in nearby Fairfield Council and northern NSW, and guided by advice from NSW DCCEEW, the average capital cost of house raising is $150,000 with a nominal ongoing maintenance cost of $500 / year assumed. Therefore the Net Present Worth (NPW) cost of VHR for a single residential house (assuming a 7% discount rate and an implementation period of 50 years) is estimated to be $158,000.
The scheme should involve raising residential properties above a minimum design level, assumed to be Council’s flood planning level (FPL) meaning 1% AEP plus 0.5 metre freeboard. While house raising can reduce the occurrence of overfloor flooding, there are issues related to the practice, including:
> The potential for damage to items on a property other than the raised dwelling are not reduced – such as gardens, sheds, garages, granny flats, decks etc.;
> Unless a dwelling is raised above the level of the PMF, and proven to be stable in such a flood event, the potential for above floor flooding still exists – i.e. there will still be a residual risk;
> Evacuation may be required during a flood event for a medical emergency or similar, even if no overfloor flooding occurs, and this evacuation is likely to be hampered by floodwaters surrounding a property;
> Ensure new footings or piers can withstand flood-related forces; and
> Potential conflict with height restrictions imposed for a specific zone or locality within the LGA.
Draft Final Flood Risk Management Study and Plan Prospect Creek Sub-Catchments 304600207 | 22 March 2024 99
Option ID Total Damages Reduction Average Annual Damage Reduction PMF 1% AEP 2% AEP 5% AEP 20% AEP FG4 $0 $158,364 $23,589 $23,054 $14,446 $9,100 FG5 $191,245 $142,377 $214,699 $267,299 $431,486 $179,162 FG7 $183,800 $369,720 $346,016 $488,208 $414,644 $198,113 FL2 $48,628 $74,383 $203,958 $413,450 $303,818 $146,790 FL3 $49,368 $110,017 $208,766 $343,164 $515,840 $213,856 FM1 $233,179 $204,825 $288,778 $195,750 $91,705 $58,154 FV1 $0 $28,833 $145,886 $188,123 $35,028 $32,187 FV3 $9,927 $351,768 $1,337,878 $609,222 $674,074 $317,036 FV5 $984,279 $1,063,184 $2,211,777 $1,106,114 $626,308 $374,789 FV6 $59,097 $860,374 $1,637,965 $104,352 $15,814 $56,490 FV8 $0 $2,759,846 $1,780,103 $473,916 $302,251 $209,827 Total $1,759,523 $6,123,691 $8,399,415 $4,212,652 $3,425,414 $1,795,504

> Additional financial burden on homeowners if they are required to relocate for an extended period of time while work is undertaken.
The Guidelines for voluntary house raising schemes: Floodplain Management Program (NSW DCCEEW, 2020) sets out ineligibility criteria for house raising under the Voluntary House Raising (VHR) scheme. In addition, follow up discussions with NSW DCCEEW representatives have provided further information as the potential eligibility of properties for a VHR scheme. The adopted eligibility criteria for this FRMS&P based on these resources is as follows:
> Must be residential dwellings to be eligible for funding. Commercial and industrial, public buildings or secondary dwellings are not considered eligible;
> Properties that would not achieve a positive benefit through damage reduction relative to cost (i.e. benefit-cost ratio less than 1). Based on the above cost estimation for residential house raising, the flood damage benefit NPW must therefore be greater than $158,000 It is possible to determine which residential buildings exceed this flood damage NPW based on existing affectation, with these buildings being eligible.
> The post-raised building must be stable and therefore not be in a high hazard area. As outlined in the guideline this is defined as areas with PMF hazard of H4 or less being eligible.
> Building located in 1% AEP floodway areas are not considered eligible as they represent a significant flow obstruction.
> Based on NSW DCCEEW guidance, house construction of brick or masonry type are not feasible for raising due to the difficulty of raising floors for such structures. Therefore only fibro or timber type constructed houses are considered eligible.
> Funding is only available for properties where the buildings were approved and constructed prior to 1986, when the original Floodplain Development Manual was gazetted by the State Government. Properties built after this date should have been constructed in accordance with the principles in the manual.
> Properties which are already benefiting substantially from other floodplain mitigation measures, such as houses already protected by a levee. There are negligible existing flood mitigation measures in the study area therefore no properties have been excluded on this basis. It is assumed that this requirement does not relate to properties that may benefit from one of the 11 FM options proposed within the FRMS&P as these are not currently implemented mitigation works.
> Buildings with estimated overfloor flooding depth of less than 0.3 metres in the 1% AEP are considered relatively low hazard and therefore not considered eligible for VHR. This minimum depth threshold corresponds to H1 hazard category where all occupants would still be safe.
Applying all of the above eligibility criteria, the draft number of properties eligible for VHR in the study area has been determined to be 38 buildings. Table 10-4 provides a summary of the key outcomes for the VHR assessment for the study area
Draft Final Flood Risk Management Study and Plan Prospect Creek Sub-Catchments 304600207 | 22 March 2024 100
VHR Assessment Outcome Value Number of Buildings 38 Benefit Average Annual Damage (AAD) $1,624,543 Net Present Benefit of VHR Scheme $23,989,311 Net Present Cost of VHR Scheme $6,004,000 Overall Benefit-Cost-Ratio 3.996 Council contribution to scheme $2,001,333 Ratio VHR Properties / 1% AEP Total Properties 5% Number of Single Storey / Double Storey Buildings 34 Single / 4 Double Number of Buildings with Floor Level Survey / Estimated Floor Levels 7 Surveyed / 31 Estimated Average Floor Level Raise to FPL Level (metres) 0.94 Number of Buildings with PMF Overfloor Flooding PostRaising 14
Table 10-4 Summary of Key Outcomes for VHR Eligibility Review for Study Area

Consideration of a VHR scheme should consider the potential implications of creating a precedent for potential roll-out across the LGA. The eligibility of 5% of all 1% AEP affected buildings in the study area is considered a relatively high proportion of buildings eligible for future raising. If applied similarly across the LGA it could result in a significant cumulative investment from Council.
As noted within the NSW DCCEEW guideline the VHR funding scheme allows for a 2 to 1 funding contribution from the state government and Council respectively. With a $6.0M estimated NPW cost for the scheme, this would represent a $2.0M contribution from Council and $4.0M from the state government.
The property owners for the identified VHR buildings will need to bear the relocation cost during the execution stage of VHR works (which would be around 6-8 months). This may be a major cost for a property owner, who may not be convinced in the VHR option unless there is a sound evidence of flooding risks (such as historical flooding events). The rate of VHR uptake was very high in the Prospect Creek Catchment (Fairfield LGA) during 1990s following the major flooding events of 1980s, which inundated many properties. For any VHR scheme Canterbury-Bankstown Council should prepare a detailed communication plan.
10.3.2 PM3 – Voluntary Purchase
Voluntary purchase is the optional purchase of pre-selected properties funded jointly by Council and the State Government. It would free both residents and emergency services personnel from the hazard of future floods by removing the risk, and is achieved by the purchase of properties and the removal and demolition of buildings.
Properties could be purchased by Council at an equitable price and only when voluntarily offered. Such areas would then need to be re-zoned under the LEP to a flood compatible use, such as recreation or parkland, or possibly redeveloped in a manner that is consistent with the flood hazard.
In calculating the potential cost of a Voluntary Purchase on a per property basis, the following analysis was applied:
> The median house price for the suburbs of Georges Hall, Bass Hill, Chester Hill and Villawood were researched (between $880,000 - $1,200,000). Purchase price was assumed to be the median house price for each property based on suburb the property is in.
> An average demolition cost of $75,000 was assumed (accounting for a 50% contingency)
> Purchase costs and fees were assumed to be equivalent to 8% of purchase price
> A nominal ongoing maintenance cost for the property of $5,000 was assumed.
> In calculating Net Present Worth (NPW), a 7% discount rate and an implementation period of 50 years was assumed.
Through this process the NPW cost of Voluntary Purchase on a per property basis was estimated to be between $1.1M and $1.44M.
The Guidelines for voluntary purchase schemes: Floodplain Management Program (NSW DCCEEW, 2020) to assist in determining when and where voluntary purchase schemes may be suitable. The guideline recommends that voluntary purchase be considered where:
> There are highly hazardous flood conditions from riverine or overland flooding and the principal objective is to remove people living in these properties and reduce the risk to life of residents and potential rescuers;
> A property is located within a floodway and the removal of a building may be part of a floodway clearance program that aims to reduce significant impacts on flood behaviour elsewhere in the floodplain by enabling the floodway to more effectively perform its flow conveyance function; and/or
> Purchase of a property enables other flood mitigation works (such as channel improvements or levee construction) to be implemented because the property will impede construction or may be adversely affected by the works with impacts not able to be offset.
> Must be residential dwellings to be eligible for funding. Commercial and industrial, public buildings or secondary dwellings are not considered eligible;
> Properties that would achieve a positive benefit through damage reduction relative to cost (i.e. benefitcost ratio less than 1).
Based on these eligibility criteria, an assessment of flood damages for each eligible residential property in the study area was compared to the NPW cost of VP noted above. From this analysis it was determined that
Draft Final Flood Risk Management Study and Plan Prospect Creek Sub-Catchments 304600207 | 22 March 2024 101

only 1 property had a BCR greater than 1.0 and therefore met the economic requirements of VP. A further two properties had a BCR between 0.9 and 1.0, meaning that with more detailed cost and benefit estimation may exceed the threshold of 1.0. A summary of the outcome of the proposed VP for these three properties is summarised in Table 10-5.
Table 10-5 Summary of Key Outcomes for VP Eligibility Review for Study Area
As noted within the NSW DCCEEW guideline the VP funding scheme allows for a 2 to 1 funding contribution from the state government and Council respectively. With a $4.1M estimated NPW cost for the scheme, this would represent a $1.4M contribution from Council and $2.7M from the state government.
10.3.3
Other Considerations of PM Options
Following discussions with NSW DCCEEW staff, some of the other considerations that Council should weight prior to proceeding with a VP or VHR scheme include:
> The social acceptance of these schemes is generally lower than other FRM options. There are a number of social considerations such as the perception of public funds being provided to developers, or limited appreciation for the flood risk particularly for a predominantly overland flooded study area such as this.
> In this case as this is an overland flooded study area there is not a single row of mainstream flooded properties identified as eligible. Properties are dispersed across the study area potentially creating a public perception of unfairness when neighbours will be eligible and ineligible.
> Given the site specific nature of flood risk reduction, and the relative cost of such a scheme, Council should consider other options in the first instance and consider these options only when other options are not feasible.
> Other alternative approaches for property modification recommended by NSW DCCEEW prior to VP and VHR include re-development and application of development controls for new development to gradually reduce the flood risk of the study area.
10.3.4 Next Steps for PM Options
Based on discussions with NSW DCCEEW staff, the next steps for a VP or VHR scheme for the study area following this FRMS&P would be:
> Apply for grant funding for a scoping or feasibility study for a potential scheme.
> The feasibility study would potentially involve:
- Floor level survey of all potential properties, currently the majority of nominated properties have only floor level estimates
- Re-calculation of both damages and cost estimation to provide more detail than provided in this study
- The eligibility criteria for schemes may have changed since the time of this study, meaning that properties need to be re-assessed
- Contact may be made with prospective property owners to gauge interest in such a scheme.
- Funding models should be considered.
> The scheme application would then be submitted as a State Assessment and assessed on its merits.
> If approved the scheme could be established, funding developed and offers made to landowners in an extensive consultation process.
Draft Final Flood Risk Management Study and Plan Prospect Creek Sub-Catchments 304600207 | 22 March 2024 102
VP Assessment Outcome Value Number of Properties 3 Benefit Average Annual Damage (AAD) $272,744 Net Present Benefit of VP Scheme $4,027,560 Net Present Cost of VP Scheme $4,118,502 Overall Benefit-Cost-Ratio 0.978 Council contribution to scheme
NSW Government contribution to scheme
$1,372,834
$2,745,668

10.4 Emergency Response Modification Options
The following emergency response modification (EM) options have been assessed for the Prospect Creek study area:
> EM1 - Flood prediction and flash flood warning system;
> EM2 – Review of local planning and information transfer to the NSW SES;
> EM3 - Community awareness and education;
> EM5 - Flood markers and signage; and
> EM6 – Flood data and debrief
These options are discussed in the sub-sections below.
As noted in Section 9.2, as it relates to the risk hierarchy, emergency response modification options aim to reduce the consequences of flood risks. This is a lower form of risk management than flood and property modification measures which aim to prevent or avoid flood risks. In this context, EM options have a residual flood risk associated, if people do not respond as intended then the flood risk is essentially unchanged. However if effective emergency response modification is developed and adhered to by the residents then the flood risk to life can be significantly reduced. Therefore it is clear that any EM options will not completely remove flood risk, but at a minimum EM options should produce a residual flood risk that is better than existing flood risk.
EM options, unlike FM and PM options do not benefit risk to property or flood damages, they only provide potential benefits to risk to life. However, there are a number of reasons that EM options are typically considered more favourably:
> Flood risk to life is typically considered more significant than risk to property, therefore the fact EM options do not improve risk to property does not often negatively affect perceptions of these options.
> The potential cost, timing and feasibility of implementation of EM options is often better than both FM and PM options. The cost and time needed to construct a flood mitigation, or to establish a VP or VHR scheme is typically significantly more than most EM options.
> Significant portions of the study area fall outside of the potential areas of benefits for FM options, and are not proposed for PM options. Therefore EM options may provide potential flood risk benefits to a wider portion of the study area than the other option types.
> Typically there is stronger community support for EM options than PM and FM options. Community survey outcomes for this study area (refer to Table 4-2) confirm this, with the top two ranked options being flood forecasting and warning and education and awareness of the community,
The EM options discussed below are proposed for Council implementation. Given the key role that NSW SES have in emergency management in the study area, it is important that development of any of these options be conducted in collaboration with SES. The intent of these Council lead schemes would be to supplement and support any schemes that SES implements or plans for the local area.
10.4.1 EM1 – Flood and Flash Flood Warning System
As discussed in Section 8.4, the flash flooding nature of the study area floodplain means that implementation of a flood warning system is not currently possible. The short duration flooding experienced in local catchments is not well suited to flood warning systems.
As a minimum, Council should co-ordinate and contribute with the regional flood warning system currently being developed for Georges River by NSW SES. This regional flood warning system currently being developed will likely be targeted to riverine flooding of the Georges River meaning it will be more relevant to low lying portions of Georges Hall and Lansdowne sub-catchments.
Though not currently possible, in the future consideration should also be given to development of a local flood warning system that is tailored to the overland flooding / flash flooding nature of the study area. A flash flood warning system would rely on self-managed evacuation by residents as discussed in Section 8.4.2, there is insufficient warning time in this study area for emergency services to coordinate evacuation. While flood response times of less than an hour that have been modelled in this study area make any form of warning system seem impossible, there are several factors that may make a scheme worth further investigation:
Draft Final Flood Risk Management Study and Plan Prospect Creek Sub-Catchments 304600207 | 22 March 2024 103

> Flood free land throughout the study area is typically not a long distance. Unlike riverine catchments where the evacuation routes can be kilometres long, as shown in the evacuation route mapping in Appendix E, the distance to flood free land does not typically exceed several hundred metres. This means that land above the PMF level could be reached by pedestrians or vehicles in a matter of minutes based on travel time.
> Due to the local nature of the flooding there should be less traffic for evacuation routes as there is not a regional evacuation route that needs to service an entire community.
> The relatively elongated length of the main Villawood overland flowpath offers a potential opportunity for some improved warning time for areas in the lower study area. If a gauge trigger was implemented in the upper catchment it may provide some additional time for warnings to be issued for Orchard Road residential areas and Villawood industrial precinct.
Of the six emergency response hotspots identified for the study area in Section 8.7.1, the following hotspots are noted as higher risk and therefore for potential consideration for a flood warning system
> 1 - Amaroo Ave area of Georges Hall sub-catchment
> 3 – Orchard Road area of Villawood sub-catchment
> 5 – Villawood industrial precinct of Villawood sub-catchment
Development of a potential flood warning system is in accordance with Emergency Management Principle 6 of the 2023 FRM Guide EM01:
An effective flood warning strategy with clear and concise messaging understood by the community is key to providing the community an opportunity to respond to a flood threat in an appropriate and timely manner.
In addition, the Local Flood Plan notes that it is Council’s requirement under the Local Flood Plan to be responsible for flash flood warning systems and that there are other examples of such systems being implemented in the area. Under Section 4.4.1 item d. and e. it is noted:
The State Government, in partnership with Local Government, is responsible for developing and maintaining flash flood warning systems for local catchments where required.
Canterbury-Bankstown Council has engaged Manly Hydraulics Laboratory for the development and maintenance of a flash flood warning system at Ashford Avenue, Milperra and Kelso Levee (Kelso Creek) Panania
The 2023 FRM Guide EM01 provides advice around the development of a Total Warning System for Flooding (TWSF). The components of a TWSF must be integrated for a system of operate effectively. The components of a TWSF as noted in EM01 are listed below with the implications for this study area included:
> Monitoring of rainfall and river flows that may lead to flooding - In this instance river flows are not relevant to a flash flooding environment such as the study area, therefore the focus would be on rainfall and potentially in the future rainfall prediction.
> Prediction of flood severity and the time of onset of particular levels of flooding - This is complicated by no stream gauges being available within the study area, therefore confident predictions of flood severity are difficult in flash flooding environments. However the recorded rainfall intensity can provide an strong indicator of short term flooding severity, while predicted rainfall can provide a lower confidence estimate of severity but likely with more available time to respond that recorded rainfall
> Interpretation of the prediction to determine the likely flood impacts on the community – This study begins this process through the emergency response mapping for different design flood events summarised in Section 8.7 and Appendix E. This could be further refined through the development of a local flood warning system.
> Construction of warning messages describing what is happening and will happen, the expected impact and what actions should be taken
> Dissemination of warning messages – For local areas such as this, alerts could be sent by sirens located in the community, email, SMS, or recorded message to a landline. Sirens would offer the benefit of notifying not only residents but also people in the area.
> Response to the warnings by the agencies involved and community members – A flash flood warning system would require strong flood awareness in the community and knowledge of the self-managed evacuation procedures required in the event of flooding.
Draft Final Flood Risk Management Study and Plan Prospect Creek Sub-Catchments 304600207 | 22 March 2024 104

> Review of the warning system after flood events.
10.4.2
EM2 – Review of Local Planning and Information Transfer to NSW SES
Having a robust EM plan that can provide the basis for responding to various scales of flood threat and be altered to fit the circumstances of an event can assist with flood preparation, response and recovery. The review of local flood plans should also include:
> A review of the current flood warning classifications (minor, moderate and major) for the location relative to the impacts on the community and any associated recommendations
> Clarification of the scale of impacts and the scale of the emergency response required in relation to key events and the associated flood timings so this can inform decisions and logistics. For example, for a levee protected community, having a plan in place on how to respond to floods that do not threaten the levee, threaten to result in minor overtopping of the levee, and for extreme floods that overwhelm the levee and town, can provide flexibility
> A review of other key information in the plan in light of the information in this study. The findings of this FRMS&P are an important source of catchment specific information for the NSW SES and Council. Details of flood risks at specific locations are important for planning of operational tasks and for the future review of the Flood Emergency Sub-Plan
As discussed in Section 8.1.1, the Local Flood Plan is currently being developed by NSW SES with ongoing review by Council. Providing outcomes from this FRMS&P to NSW SES is essential. This option recommends the ongoing information sharing between Council and SES for flood information for the study area. This would include any future flood studies and FRMS&P, post-flood records and observations and any other relevant flood information.
The NSW SES have developed a Flood Risk Management Checklist to clearly establish the current expectations for data developed in the FRM process for the purposes of generating reliable flood intelligence to support flood emergency planning. This is a standard across the board and the checklist is normally adopted upon receiving a formal request via the agency referral process. The checklist relates to three categories; Flood Studies, FRMS&P, and Key Flood Risk Management Issues. Those requirements considered essential for all flood studies / floodplain risk management studies are highlighted in green. While others are dependent on the project brief, the NSW SES requests they be included where possible.
For context for this study area, and the overland flooding nature of the study area, some of the references within the SES requirements checklist are not considered relevant. For the FRMS&P requirements, there are references to tying in outputs to key warning gauges, however at this time there are no gauges within the study area that relate to the overland flooding of the study area. If any gauges are installed as part of a flood warning system as outlined in option EM1, the outputs should be reviewed to align with gauge levels for that future gauge.
10.4.3 EM3 – Community Awareness and Education
Flood awareness is an essential component of flood risk management for people residing in the floodplain, it is important to maintain an adequate level of flood awareness during the extended periods when flooding does not occur. A continuous awareness program is required to ensure new residents are informed, the level of awareness of long-term residents is maintained, and to cater for changing circumstances of flood behaviour and new developments. This enables the community to make safe decisions during flood events.
It is in the interest of Council to support community awareness and education. An example of such programs is the Council annual community safety expo which continue to provide information to the community with safety information, including riverine flooding information. This is managed by Council in collaboration with emergency services.
As noted within 2023 FRM Guide EM01, Council works closely with the NSW SES in flood awareness programs. Development of a flood awareness program is in accordance with Emergency Management Principle 7 of the 2023 FRM Guide EM01:
Councils and government play an important role in ensuring communities have and retain an awareness of flooding and the strategies that will help them respond appropriately to a flood threat.
The implementation of a flood awareness program may be important in supporting other EM options. For example the development of a flood warning system (option EM1) would require strong flood awareness, and flood signage and markers (option EM5) would provide best benefits if accompanied with a flood awareness program.
Draft Final Flood Risk Management Study and Plan Prospect Creek Sub-Catchments 304600207 | 22 March 2024 105

An additional consideration for any flood awareness program in the study area is the wide range of languages in the study area. As noted in the demographic profile in Section 2.7, approximately 56.25% of the population spoke a language other than English, with 11.10% not fluent in English. Other languages spoken at home include Chinese languages (approximately 4.24%), Greek (approximately 2.26%), Vietnamese (approximately 10.19%) and Arabic (approximately 25.56%). Methods of information sharing for an awareness program would need to consider this diversity of language in the study area.
10.4.4 EM5 – Flood Markers and Signage
While the above public programs can be effective in improving the long-term awareness of flood risk, in the event of flooding these education programs can easily be forgotten. Therefore flood warning signage can be an effective tool to remind or inform residents of the risks associated with entering floodwaters, and to also provide practical information in the event of flooding such as recommended evacuation routes.
Appropriate flood warning signs should be posted at all locations of significant flooding. These would be implemented in both overland flooding and riverine flooding. These signs may contain information on flooding issues, or be depth gauges to inform residents of the flooding depth over roads and paths. Also evacuation route mapping could be provided on these signs to assist residents.
Council would likely post this signage within existing local road reserves and flood prone public open space areas. Some of the local roads that would be suitable for flood signage include:
> Amaroo Ave in Georges Hall sub-catchment (Hotspot 1).
> Jacaranda Drive, Denman Road and Caroline Crescent in Lansdowne sub-catchment (Hotspot 2)
> Orchard Road in Villawood sub-catchment (Hotspot 3)
> Compton Street and Chester Hill Road in Villawood sub-catchment (Hotspot 4).
> Sir Thomas Mitchell Road, Miller Road, Monier Square, Llewellyn Ave, Christina Road in Villawood subcatchment (Hotspot 5).
> Brown Street and Clack Road in Miller Road sub-catchment (Hotspot 6).
In addition, consultation could be conducted with Transport for NSW (TfNSW) to discuss potential flood signage for flood affected regional roads through the study area including Henry Lawson Drive, Woodville Road, and Hume Highway.
10.4.5 EM6 – Flood
Data and Debrief
A flood event provides an opportunity to capture information on the flood and learn from it. It helps understand the event, the consequences for the community, successes and limitations in current management practices and how the community recovered. Information can be captured in coordinated community surveys.
This information should be collated by Council and a report produced to catalogue what has been captured and its availability and format. The data should be securely stored and made publicly available. The information can be used in both explaining this event to the community and in considering future flood risk, EM and land-use planning decisions within and potentially beyond this community
These tasks are currently part of Council’s requirements for flooding response. It is also noted that post-flood funding for data collection is also available from NSW DCCEEWDCCEEW
Draft Final Flood Risk Management Study and Plan Prospect Creek Sub-Catchments 304600207 | 22 March 2024 106

10.5 Cost Estimation
10.5.1
FM Options
Preliminary cost estimates have been prepared for all FM options, which allow for an economic assessment via consideration of the cost of implementation and the associated reduction in flood damages. The process for capital cost estimation was as follows:
> Quantities for construction have been estimated from preliminary design for the 11 FM options as they were modelled in the TUFLOW model. This included cut and fill volumes, disturbance footprint areas, and pipe lengths and diameters.
> Unit rates were initially estimated by Stantec based on past project experience. These unit cost rates were reviewed by Council staff and revised in some instances to match current cost rates for the local area.
> Due to the high-level nature of the estimates, a 50% contingency has been applied to all estimates given uncertainty on eventual design refinement and quantities.
Ongoing maintenance costs of FM Options have been estimated based on expected site conditions postconstruction. Typically maintenance works assumed include pit and pipe cleaning, CCTV and mowing and maintenance of open space areas, with only minor expected costs associated. Due to uncertainty on future maintenance requirements and annual costs for Council, a 50% contingency has been applied to ongoing cost estimates as well.
A summary of cost estimation outcomes for the 11 FM Options is included in Table 10-6 All capital and ongoing costs are excluding GST, and account for the 50% contingency.
Table 10-6 Cost Estimates for High-Level Quantitatively Assessed FM Options
Draft Final Flood Risk Management Study and Plan Prospect Creek Sub-Catchments 304600207 | 22 March 2024 107
Option Capital Cost (excl. GST) Ongoing Annual Cost (excl. GST)* FG4 – Rex Road Drainage Upgrade $209,781 $750 FG5 – Harden Reserve Basin Retrofit $1,038,315 $7,500 FG6 – Amaroo Ave Drainage Upgrade $2,559,653 $7,500 FL2 – Wilton Reserve Detention Basin $2,035,061 $9,000 FL3 – Jacaranda Drive Drainage Upgrade $1,569,205 $7,500 FM1 - Miller Road Drainage Upgrade $1,285,546 $7,500 FV1 – Alcoomie Reserve Detention Basin $3,252,747 $9,000 FV3 – Tucker Reserve Detention Basin $2,704,386 $9,000 FV5
Orchard Road Drainage Upgrade $7,533,953 $7,500
–
Sir Thomas Mitchell Drive Channel Upgrade $1,303,526 $3,000
FV6 –
Christina Road Channel Upgrade $3,481,201 $7,500
FV8 –

10.5.2 EM and PM Options
For other measures (EM and PM), costs were estimated only on the basis of cost to implement, and were done for the purpose of comparison in the multi-criteria assessment. For the two PM options – VHR and VP, as the final list of properties for the schemes is unsure, the capital costs are for program establishment tasks only. The funding for the actual VHR and VP implementation will need to be arranged as part of the scheme establishment process. Ongoing costs for PM and EM options were estimated based on expected work needed for each scheme. Due to uncertainty of potential capital and ongoing costs for all PM and EM options, a 50% contingency has been applied to all, remaining consistent with the assessment of the FM options as well.
Prior to a measure proceeding it is recommended that, in addition to detailed analysis and design of the measure, these costs be revised to achieve a more accurate assessment for overall budget allocation. The level of detail for economic assessment in the next stage is discussed further in Section 11.2 Detailed rates and quantities will also be required at the detailed design phase.
A summary of cost estimation outcomes for the 2 PM Options and 5 EM Options is included in Table 10-7. All capital and ongoing costs are excluding GST, and account for the 50% contingency. Included within the table is a brief note on the assumed capital and ongoing costs anticipated in the estimate.
EM2 – Review of Local Flood Planning and Info Transfer to NSW SES
EM3 – Community Flood Awareness
EM5 – Flood Markers and Signage
$15,000 $7,500
Cost for Council to prepare a VHR scheme for submission and approval by NSW DCCEEW Ongoing cost is a nominal allowance to manage the scheme
Cost for Council to prepare a VP scheme for submission and approval by NSW DCCEEW. Ongoing cost is a nominal allowance to manage the scheme
Cost for preparation of the flood prediction analysis and warning system. If part of a regional warning system, then addresses the portion of the scope that accounts for the Prospect Creek sub-catchment study area only. Ongoing cost is an annual cost for Council to maintain the system, issue warnings etc
Cost for the initial review of flood planning and transfer of any existing studies to NSW SES. Ongoing cost is for transfer of future studies as they are completed, assume on average 1 study per year
EM6 – Flood Data and Debrief
$45,000 $45,000
Cost for Council to workshop and prepare a community flood awareness program and to initially implement it including marketing materials, attendance at information sessions, mailing lists, school programs etc. Ongoing cost is for Council to continue the awareness program each year including marketing materials, attendance at information sessions, mailing lists, school programs etc
$150,000 $1,500
$30,000 $15,000
Cost for Council to develop approvals for flood signage installation, prepare and install signs, assume 10 locations Ongoing cost is nominal allowance to maintain and update the signs as new flood information becomes available
Cost for Council to establish a flood database to store information initially. Also cost to send out staff to record flood markers and photograph during flooding, review and analyse BoM rainfall data for event and consult with NSW SES. Ongoing cost is for Council to send out staff to record flood markers and photograph during flooding, review and analyse BoM rainfall data for event and consult with NSW SES. Assume one flood event per year
Draft Final Flood Risk Management Study and Plan Prospect Creek Sub-Catchments 304600207 | 22 March 2024 108
Option Capital Cost (excl. GST) Ongoing Annual Cost (excl. GST)* Assumed
$45,000 $7,500
Table 10-7 Cost Estimates for High-Level Quantitatively Assessed FM Options
Works Covered PM1 – Voluntary House Raising Scheme
PM3 – Voluntary Purchase Scheme $45,000 $7,500
EM1
Flood Prediction
Warning $225,000 $45,000
–
and

10.6 Benefit-Cost Ratio
The economic evaluation of each option was performed by considering the reduction in the amount of flood damages incurred for the design events and then comparing this value with the cost of implementing the option.
Table 10-8 summarises the results of the economic assessment of each of the options. The indicator adopted to assess these measures on economic merit is the benefit-cost ratio (BCR), which is based on the net present worth (NPW) of the benefits (reduction in AAD, refer to Section 10.2.4) and the costs (of implementation, refer to Section 10.5). In the calculation of NPW, a 7% discount rate and an implementation period of 50 years have been adopted
The benefit-cost ratio provides an insight into how the damage savings from a measure relate to its cost of construction and maintenance.
> Where the benefit-cost ratio is greater than one (BCR >1) the economic benefits are greater than the cost of implementing the measure.
> Where the benefit-cost is less than one but greater than zero (0 < BCR < 1) there is still an economic benefit from implementing the measure, but the cost of implementing the measure is greater than the economic benefit.
> Where the benefit-cost is equal to zero (BCR = 0), there is no economic benefit from implementing the measure.
For all FM options it is possible to quantify, at least at a high-level both damage benefits and costs of implementation for each option, therefore a BCR is able to be calculated. For PM and EM options, the damage benefits are not easily quantifiable, though there would be some economic benefits of these options in the form of reduced risk to life and resultant reduction in flood damage for loss of life. Therefore in lieu of any damage benefit information, the economic analysis of these options has assumed that BCR is 1.0.
Draft Final Flood Risk Management Study and Plan Prospect Creek Sub-Catchments 304600207 | 22 March 2024 109
Summary
Net Present Worth of Benefits
Resultant Benefit Cost Ratio Option NPW of AAD Reduction Benefits NPW of Cost of Implementation of Option Benefit Cost Ratio FG4 – Rex Road Drainage Upgrade $134,374 $220,857 0.61 FG5 – Harden Reserve Basin Retrofit $2,645,650 $1,149,066 2.30 FG6 – Amaroo Ave Drainage Upgrade $2,925,492 $2,670,405 1.10 FL2 – Wilton Reserve Detention Basin $2,167,619 $2,167,962 1.00 FL3 – Jacaranda Drive Drainage Upgrade $3,157,970 $1,679,956 1.88 FM1 - Miller Road Drainage Upgrade $858,745 $1,396,298 0.62 FV1 – Alcoomie Reserve Detention Basin $475,296 $3,385,648 0.14 FV3 – Tucker Reserve Detention Basin $4,681,612 $2,837,287 1.65 FV5 – Orchard Road Drainage Upgrade $5,534,432 $7,644,704 0.72 FV6 – Sir Thomas Mitchell Drive Channel Upgrade $834,180 $1,347,827 0.62 FV8 – Christina Road Channel Upgrade $3,098,476 $3,591,953 0.86 PM1 – Voluntary House Raising Scheme N/A* $155,751 1.0* PM3 – Voluntary Purchase Scheme N/A* $155,751 1.0* EM1 – Flood Prediction and Warning N/A* $889,506 1.0* EM2 – Review of Local Flood Planning and Info Transfer to NSW SES N/A* $125,751 1.0* EM3 – Community Flood Awareness N/A* $709,506 1.0* EM5 – Flood Markers and Signage N/A* $172,151 1.0* EM6 – Flood Data and Debrief N/A* $251,502 1.0* *In
values
options, due to flood risk reduction BCR value assumed to be 1.0
Table 10-8
of
and Costs and
lieu of benefit
for PM and EM

10.7 Multi-Criteria Assessment
To assist Council in identifying the FRM options that provide the most benefits for the community, all options need to be compared against each other based on factors relevant to the study area.
Evaluating what constitutes an appropriate strategy for floodplain management is a significant analytical and policy challenge. Such challenges have led to the exploration of alternative policy analysis tools, one being Multi Criteria Assessments (MCA). The goal of MCA is to attempt to directly incorporate multiple values held by community and stakeholders into the analysis of management alternatives while avoiding the reduction of those values into a standard monetary unit. In doing so, one can consider different FRM options in the context of economic criteria as well as other criteria such as social, or environmental aspects. Community and stakeholders can also assign explicit weights to those values to reflect their preferences and priorities. Therefore, MCA provides opportunities for the direct participation of community and stakeholders in the analysis.
An MCA approach has been used for the comparative assessment of all options identified using a similar approach to that recommended in 2023 FRM Guide MM01. This approach uses a subjective scoring system to assess the merits of each option. The principal value of such a system is that it allows comparisons to be made between alternatives using a common index. In addition, the MCA makes the assessment of alternatives “transparent” (i.e. all important factors are included in the analysis).
However, this approach does not provide an absolute “right” answer as to what should be included in the plan and what should be omitted. Rather, it provides a method by which Council, community and stakeholders can re-examine options and, if necessary, debate the relative scoring assigned.
Each option is given a score according to how well the option meets specific considerations. In order to keep the scoring system simple a framework has been developed for each criterion.
10.7.1 Development of Criteria
A balanced FRMS&P addresses existing, future and continuing risk to reduce residual risk to a level more acceptable to the community and in doing so generally involves assessing, deciding on and prioritising a range of FRM measures.
One way of considering the outcomes of an MCA of different options or packages of options is the establishment of an options assessment matrix that considers a range of criteria that can influence decisionmaking. The criteria used can vary with the flood situation and community. Some may not be relevant to the circumstances or the options being considered. In addition, different communities, decision-makers and groups may consider different criteria and specific elements to be more or less important. One way of addressing this variation is to weight the relative importance of these criteria so this can be factored into the assessment.
As per the recommendations of Section 2.2.5 of the FRM Guide MM01, the selection of criteria and weighting should be completed independent of scoring and actively involve the FRM committee and its technical working group (TWG). This process was conducted with a group of project stakeholders in a session led by NSW DCCEEW representatives on 6 December 2022. In total, 24 preliminary criteria were provided to the stakeholders to score in terms of importance from 1 (least) to 5 (most important). Stakeholders included Council staff, NSW SES, and local resident representatives from the FRM Committee.
In total, criteria scoring was received from 10 project stakeholders. The TWG reviewed the 24 preliminary criteria and were able to condense these into ten (10) final criteria:
> Four economic criteria – economic merits, technical feasibility, adaptability and long-term performance and risk to property
> Four social criteria – Risk to life, emergency access and evacuation, social disruption and public open spaces, and community and stakeholder support
> Two environment criteria – Flora and fauna impact and water quality benefits and WSUD co-location.
The 24 preliminary criteria that were scored by stakeholders were classified into being most relevant to one of these ten final criteria. The average ranking of each criteria was scaled into a stakeholder weighting out of five, with 1 being the least important and 5 being the most important.
The TWG then reviewed and finalised criteria weighting guided by average stakeholder scores with minor adjustment to relative importance for the project
The average stakeholder score and final criteria weighting are summarised in Table 10-9 Detailed options have been scored within the MCA using the final weighting only.
Draft Final Flood Risk Management Study and Plan Prospect Creek Sub-Catchments 304600207 | 22 March 2024 110

Long term performance (10)
Technical feasibility (2)
Staging of works (24)
Heritage conservation areas/items (17)
Acid Sulphate Soils and contaminated land (21)
Financial feasibility and funding availability (9)
Compatibility with existing Council plans, policies or projects (18)
(6)
10.7.2 Criteria Scoring System
A scoring system was established for each criteria with scores ranging from +2 for options that represented a significant improvement on existing conditions for any given criteria, to -2 for options that represented a significant worsening of existing conditions. The scoring system for all 10 criteria are summarised in Table 10-10. It is noted that for two criteria (Benefit-Cost Ratio and Reduction in Risk to Property) scoring systems was based on quantifiable assessment outcomes, for all other criteria scoring was more subjective.
Draft Final Flood Risk Management Study and Plan Prospect Creek Sub-Catchments 304600207 | 22 March 2024 111
Category Criteria Related Prelim Criteria (and Stakeholder Ranking out of 24) Stakeholder Average Score Final Weight Economic Benefit-Cost Ratio Economic merits (5) 3.96 15% Adaptability
long-term performance
Table 10-9 Summary of Criteria Weighting Outcomes
and
Ongoing maintenance requirements (12) Climate change adaptability (14) 4.17 10% Risk to Property Impact on commercial
industrial properties
Impacts on property values and insurance costs (19) 3.23 5% Technical Feasibility
/
(15)
4.47 20% Social Emergency Access
access
evacuation
Safe roads
4.49 9% Risk to Life Impact on critical and/or vulnerable facilities
Impact on residential properties (7) Impact on flood hazard (4) 4.61 12% Social Disruption and Public Open Spaces Social disruption (23) Impact on public open spaces (22) 2.66 4.5% Community and stakeholder support Community flood awareness (11) Community and stakeholder support (20) 3.39 4.5% Environment Flora and Fauna Impact Environmental and ecological impacts (8) 3.33 8% WQ Benefits and WSUD Co-location Improvement in water quality / water balance (16) 1.67 12%
and Evacuation Impact on emergency services
Road
and
routes (3)
(13)
(1)

Adaptability and long-term performance 10%
Reduction in Risk to Property 5%
Technical Feasibility 20%
Safer Egress Routes 9%
Reduction in Risk to Life 12%
Social Disruption and Public Open Spaces 4.50%
The cost effectiveness of the scheme, i.e. the tangible return on investment
The impact the option will have both in terms of feasibility, benefits and cost over the life of the option, and adaptability to climate change conditions
Based on reduction in AAD, it establishes the tangible benefit of an option
Establishes the feasibility of options based on constructability, and bureaucratic difficulties such as land acquisition and agreements with external agencies
The impact on the occupant to evacuate from the area
The impact on risk to life from the 20% AEP up to the PMF event
The impact of the risk management option on social disruption and the use of public spaces
Significantly diminished performance long-term or under climate change
Major increase in AAD (>$200,000)
There are a number of factors that pose a significant impact on the feasibility of the project
Widespread or significant localised impact on evacuation
Widespread or significant localised increase in risk to life
Significant increase in the frequency of flooding or limitation of the use of a public space or causes significant social disruption
Slightly diminished performance long-term or under climate change
Slight increase in AAD ($200k to $100k)
There is a factor that poses a potential impact on the feasibility of the project
Localised or slight localised impact on evacuation
Localised or slight increase in risk to life
Increase in the frequency of flooding or limitation of the use of a public space or causes social disruption
Unchanged performance long-term or under climate change
Negligible Improvement (less than $100k AAD impact)
May or may not be feasible
Negligible impact on evacuation
Negligible change in risk to life
Negligible impact on public space or social disruption
Unchanged or improved performance long-term or under climate change with minor ongoing costs
Slight decrease in AAD ($200k to $100k)
Unchanged or improved performance long-term or under climate change with negligible ongoing costs
Major decrease in AAD ($>200,000)
Likely to be feasible
Localised or slight improvement for evacuation
Localised or slight reduction of risk to life
Reduces the frequency of flooding or provides enhanced use of a public space or causes social benefit
Very likely to be feasible
Widespread or significant localised improvement for evacuation
Widespread or significant localised reduction of risk to life
Significantly reduces the frequency of flooding or enhanced use of a public space or causes significant social benefit Community and Stakeholder Support 4.50%
Support for the option based on FRM Committee meeting, stakeholder engagement and community consultation outcomes
Significant opposition to the option
Slight opposition to the option
No clear support or opposition
Slight support to the option
Significant support to the option
and WSUD
Feasibility for co-location of water quality treatments and devices, creating commonality with Catchment Action Plan outcomes
Significant increase in risk of negatively impacting water quality
Slight increase in risk of negatively impacting water quality
Negligible co-location or water quality treatment benefits
Potential water quality benefit, or treatment colocation likely to be feasible
Significant potential water quality benefit, or treatment co-location very likely to be feasible
Draft Final Flood Risk Management Study and Plan Prospect Creek Sub-Catchments 304600207 22 March 2024 112 Table 10-10 Multi-Criteria Assessment - Scoring System Summary Category Criterion Weighting Description of Criterion Assessment Score -2 -1 0 1 2 Economic Benefit-Cost
Ratio 15%
0 to 0.4 0.4 to 0.8 0.8 to 1.2 1.2 to 1.6 >1.6
Social
Environment Impact on Fauna/Flora 8% Likely impacts on Threatened Ecological Communities
Species High negative impact Slight negative impact Negligible impact Some benefit Considerable benefit
Benefits
Co-location
and Threatened
Water Quality
Opportunities 12%

10.7.3 Multi-Criteria Scoring Outcomes
The assignment of a score and brief discussion reasoning for the score for each criterion for all flood modification (FM), property modification (PM), and emergency response (EM) modification options is shown in its entirety in the matrices presented in Appendix H.
The unweighted scores of the MCA has a range from 20 to -20 based on 10 criteria each with a score of +2 to -2. The weighted final MCA scores using the criteria weighting (see Table 10-10) have a possible range of +2.0 to -2.0. The total weighted and unweighted MCA scores for each detailed option are summarised in Table 10-11. The options have been tabulated in order from highest to lowest weighted score.
Due to the relative weighting of the 10 criteria the weighted and unweighted scores for options are not ordered the same. This provides an insight into the significance of appropriate criteria weighting which has been developed based on a rigorous process summarised in the previous section.
The highest scoring options typically fall into one of two categories:
> Relatively cost-effective flood modification (FM) options that provide significant flood risk reduction benefits. Examples are FG5 Harden Reserve Basin retrofit, FV3 Tucker Reserve detention basin and FL3 Jacaranda Drive drainage upgrade.
> Emergency response modification options (EM) which offer significant flood risk reduction with relatively minor cost. Five of the top 8 MCA scoring options are EM options.
The lowest scoring options typically fall into one of two categories as well:
> High-cost flood modification (FM) options in the lower Villawood industrial precinct that provide relatively minor flood risk benefits. Examples are FV8 Christina Road channel upgrade and FV6 Sir Thomas Mitchell Drive Channel Upgrade
> Property Modification (PM) options that have low community support and represent significant cost for only localised flood risk benefit. These are PM1 Voluntary House Raising and PM3 Voluntary Purchase.
Draft Final Flood Risk Management Study and Plan Prospect Creek Sub-Catchments 304600207 | 22 March 2024 113
Option ID Option Type SubCatchment Total Unweighted Score (from -20 to 20) MCA Weighted Score FG5 – Harden Reserve Basin Retrofit Flood Modification (FM) Georges Hall 8 1.11 EM5 – Flood Markers and Signage Emergency Response (EM) All subcatchments 9 0.99 FV3 – Tucker Reserve Detention Basin Flood Modification (FM) Villawood 8 0.96 FL3 – Jacaranda Drive Drainage Upgrade Flood Modification (FM) Lansdowne 10 0.94 EM3 – Community Flood Awareness Emergency Response (EM) All subcatchments 10 0.90 EM2 – Review of Local Flood Planning and Info Transfer to NSW SES Emergency Response (EM) All subcatchments 8 0.87 EM1 – Flood Prediction and Warning Emergency Response (EM) All subcatchments 6 0.49 EM6 – Flood Data and Debrief Emergency Response (EM) All subcatchments 5 0.49 FG7 – Amaroo Ave Drainage Upgrade Flood Modification (FM) Georges Hall 7 0.48 FM1 - Miller Road Drainage Upgrade Flood Modification (FM) Miller Road 3 0.43 FG4 – Rex Road Drainage Upgrade Flood Modification (FM) Georges Hall 2 0.32 FV1 – Alcoomie Reserve Detention Basin Flood Modification (FM) Villawood 1 0.22 FL2 – Wilton Reserve Detention Basin Flood Modification (FM) Lansdowne 3 0.21 FV5 – Orchard Road Drainage Upgrade Flood Modification (FM) Villawood 6 0.18 PM1 – Voluntary House Raising Property Modification (PM) All subcatchments 0 -0.02 PM3 – Voluntary Purchase Property Modification (PM) All subcatchments -3 -0.31 FV8 – Christina Road Channel Upgrade Flood Modification (FM) Villawood 0 -0.39 FV6 – Sir Thomas Mitchell Drive Channel Upgrade Flood Modification (FM) Villawood -2 -0.41
Table 10-11 MCA Outcomes for Weighted and Unweighted Scores for Detailed Options

11 Implementation of Options
The Flood Risk Management options outlined in Section 10 are recommended for implementation as an outcome of the Floodplain Risk Management Study. In order to achieve the implementation of relevant management actions, a plan of implementation has been developed as outlined in the following sections.
11.1 Steps to Implementation
The steps in progressing the flood risk management process from this point onwards are:
> Formal adoption of FRMS&P: Following public exhibition and FRM Committee approval, Council will formally adopt the final Flood Risk Management Study and Plan;
> Investigation and Design (I&D) stage – Most options will next require an Investigation and Design (I&D) phase to further refine the design and further confirm the feasibility of the option. An equivalent assessment is a ‘Feasibility Study’ or ‘Scoping Study’ for programs such as the Voluntary House Raising Scheme. These investigation and design assessments for individual projects should build on the assessment undertaken in the FRM plan. The potential steps of the I&D stage may include:
- Prior to the I&D stage, grant funding applications for the I&D assessment may need to be submitted by Council when required.
- Additional investigations may be required to inform feasibility assessment. For example, for Flood Modification options these may include geotechnical investigations, subsurface utility survey, or environmental impact reviews.
- Concept design of the option
- Detailed design of the option
- Environmental approvals submissions such as a Review of Environmental Factors (REF) or Environmental Impact Statement (EIS).
- Economic assessment of options (Level 1, Level 2 or Level 3 guided by the framework discussed in the next sub-section) potentially including further detailed damages benefit assessment, or cost estimation compared to the analyses conducted in this FRMS&P.
> Following I&D stage, if required, a grant funding application will need to be submitted to support the implementation / construction of the option.
> Implementation / construction of the flood risk management option.
11.2 Economic Assessment Framework for Options
Where external funding is required, the FRM economic assessment framework, as shown in Figure 11-1, provides the basis for further assessment of the FRM measures as part of the investigation and design phases of implementation.
The framework for the economic assessment of FRM measures from the FRM Guide MM01 is shown in Figure 11-1. It provides a summary of the economic assessment of FRM options following on from a FRMS&P into Investigation and Design (I&D) stage and into Implementation stage. This provides useful context into the different levels of detailed assessment required for FRM options once they proceed beyond the FRMS&P stage. There are four levels of economic assessment based on this framework:
> Level 1 assessments are the least detailed form of economic assessment. Level 1 assessments include preliminary costing, damages benefit estimation and an MCA including preliminary cost-benefit summary. These Level 1 assessments are applied at the FRMS&P phase for all FRM options, regardless of expected option cost. For FRM options with expected cost less than $1 million, a level 1 assessment is also appropriate at I&D and implementation stage as no grant approval is required. The Level 1 assessment in this FRMS&P for detailed options is summarised in Section 10
> Level 2 assessments update the Level 1 economic analysis to include cost estimates from I&D stage. Consider whether additional damage assessment factors (not included but likely to influence the outcome) should be included to improve the Level 1 damage assessment, also consider sensitivity assessment to discount rate, and increases, and decreases in benefits and costs. Level 2 assessments relate to FRM options with expected value between $1-$5 million. Level 2 assessments require additional reporting incorporated in I&D reporting to support grant application for implementation.
Draft Final Flood Risk Management Study and Plan Prospect Creek Sub-Catchments 304600207 | 22 March 2024 114

> Level 3 assessments are similar to Level 2 with updating of Level 1 economic analysis to include cost estimates from I&D stage, but with potential to include more detailed techniques for monetary valuation. Use of more detailed assessment techniques for benefits assessment, for example, evacuation modelling may be appropriate to identify risk to life more readily. More detailed sensitivity analyses than Level 2 with a more detailed stand-alone report or appendix to the I&D report to support grant application. Level 3 assessments relate to FRM options with expected value between $5-$10 million
> For FRM Options with expected value in excess of $10 million, the option must go through a NSW Treasury gateway review process with more detailed economic assessment and reporting required.
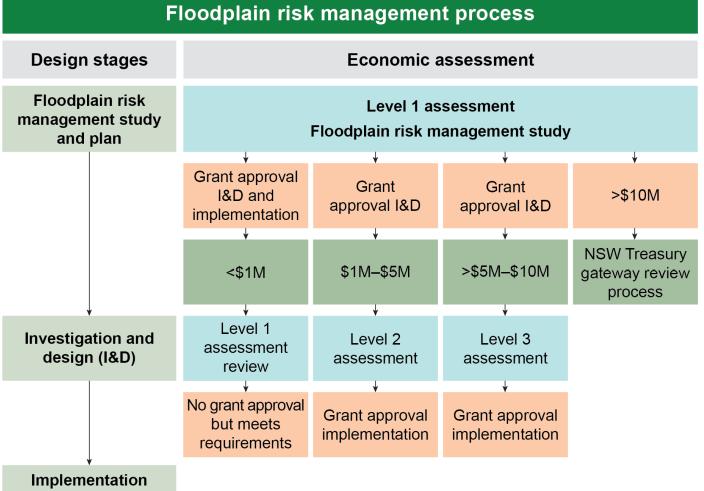
The expected necessary economic assessment level of each option in this FRMS&P is summarised in the implementation program in Table 11-1 The economic assessments will need to be completed during Investigation and Design (I&D) stage for each option.
11.3 Funding Mechanisms for FRM Options
As stated in FRM Guide MM01, FRM plans may recommend a range of implementation measures that are funded through one of the following means:
a. Council funded: Can be implemented within council’s own resources, such as updating land-use planning arrangements. Council should progress these measures within their own resources considering the priorities in the plan
b. Funded by Other Agencies: Are the agreed responsibility of, or require agreed input from external parties to implement. Examples include updating EM planning arrangements, or options located within the lands of other stakeholder agencies. Council should work with external parties to support implementation, considering the priorities in the plan
c. Grant Funded: Will generally require external funding support, such as new or upgraded FRM works, including levees, basins, and flood warning systems. Council will need to apply for these grant funds.
The anticipated funding mechanism for each option adopted within this FRMS&P is summarised in the implementation program in Table 11-1 This is an assumed funding source, it is possible that funding sources other than those listed in Table 11-1 may be considered for any given option at Council’s discretion and with the agreement and support from any relevant funding agencies.
Draft Final Flood Risk Management Study and Plan Prospect Creek Sub-Catchments 304600207 | 22 March 2024 115
Figure 11-1 Detailed FRM Measure Economic Assessment Framework (Source: FRM Guide MM01)

11.3.1 Grant Funding
The NSW Government's floodplain management grants support local Councils to manage flood risk. The funding for FRM option implementation from these grants has traditionally comes from two programs:
> NSW Floodplain Management Program, and
> Floodplain Risk Management Grants Scheme (jointly funded by the NSW DCCEEW and the Commonwealth Government).
Applications for funding can be made by Council for the implementation of actions identified in a FRMS&P. The information provided in the applications for each management action is used to rank the priority for funding of all actions across NSW. The information presented in this FRMS&P can be used as a starting point to complete the relevant applications for funding
Sufficient information should be provided in reports to facilitate funding applications for eligible projects under relevant funding programs. Information currently needed to support these applications relates to Council’s commitment to FRM, how FRM measures were identified and assessed, community involvement in FRM plan development, and the FRM benefits of the project for the community.
11.4 Ranking and Prioritisation of Options
Based on review of the Multi-Criteria Assessment outcomes summarised in Section 10.7.2, the options have been ranked in order of preference. The MCA scores have been combined to produce an options implementation preferences list as shown in Table 11-1. As shown in the rank column, this table has been ordered based on ranking, from highest ranking to lowest ranking option.
In addition, a priority has been assigned to each of the options to inform the implementation strategy. The priority reflects the recommended urgency of the option from a reduction in flood risk perspective, it is possible that the order of implementation that Council adopts may differ from these priority assignments.
The grouping of options into the three priority categories has been based on the distribution of MCA scoring, with categories set at points of clear delineation of scoring outcomes. There is a MCA score difference of 0.38 from the worst scoring high priority option and the best medium priority option, with a 0.2 score difference from medium to low. The three priority categories are:
> High – Six (6) options have been identified as high priority. Of the high priority options, three are Flood Modification (FM), or structural options and three are Emergency response modification (EM) options The range of MCA scores for high priority options is 1.11 to 0.87 (ranks 1-6)
> Medium – Eight (8) options have been identified as medium priority. Of the medium priority options, six are Flood Modification (FM), or structural options and two are Emergency response modificiation (EM) options. The range of MCA scores for medium priority options is 0.49 to 0.18 (ranks 7-14); and
> Low – Four (4) options have been identified as low priority. Of the low priority options, two are Flood Modification (FM), or structural options and two are Property Modification (PM) options. The range of MCA scores for low priority options is -0.02 to -0.41 (ranks 15-18).
11.5 Implementation Plan
The list of recommended management options has been transformed into an implementation plan provided in Table 11-1. It lists the following information relevant to the implementation of each adopted FRM option:
> Type and sub-catchment location of option and Multi-Criteria Assessment score;
> The priority for implementation (high, medium, or low) and rank as an outcome of the FRMS&P;
> An estimate of implementation costs including capital and ongoing costs per annum;
> Potential funding mechanism or organisation; and
> Required economic assessment level during I&D stage from framework in Section 11.2
The flood risk management options identified in Table 11-1 represent a capital outlay of approximately $27.5M, with the flood modification options making up $27 0M of this cost. High priority options have combined capital costs of $5.5M. The capital costs of VP and VHR options are for program establishment tasks only.
It is noted that a specific timeframe for the implementation plan has not been explicitly identified. Experience with these types of plans has identified that the works are undertaken when and as funding becomes available, as well as when various opportunities might arise specifically for an option.
Draft Final Flood Risk Management Study and Plan Prospect Creek Sub-Catchments 304600207 | 22 March 2024 116

Draft Final Flood Risk Management Study and Plan Prospect Creek Sub-Catchments 304600207 | 22 March 2024 117
Option ID Option Type SubCatchment MCA Score Option Rank Implementation Priority Capital Costs (excl. GST) Ongoing Costs (p.a excl. GST) Economic Assessment Level for I&D FG5 – Harden Reserve Basin Retrofit Flood Modification (FM) Georges Hall 1.11 1 High $1,038,315 $7,500 Level 2 (Detailed damages) EM5 – Flood Markers and Signage Emergency response (EM) All subcatchments 0.99 2 High $150,000 $1,500 Level 1 (FRMS&P) FV3 – Tucker Reserve Detention Basin Flood Modification (FM) Villawood 0.96 3 High $2,704,386 $9,000 Level 2 (Detailed damages)
– Jacaranda Drive Drainage Upgrade Flood Modification (FM) Lansdowne 0.94 4 High $1,569,205 $7,500 Level 2 (Detailed damages) EM3 – Community Flood Awareness Emergency response (EM) All subcatchments 0.90 5 High $45,000 $45,000 Level 1 (FRMS&P) EM2 – Review of Local Flood Planning and Info Transfer to NSW SES Emergency response (EM) All subcatchments 0.87 6 High $15,000 $7,500 Level 1 (FRMS&P) EM1 – Flood Prediction and Warning Emergency response (EM) All subcatchments 0.49 7 Medium $225,000 $45,000 Level 1 (FRMS&P) EM6 – Flood Data and Debrief Emergency response (EM) All subcatchments 0.49 8 Medium $30,000 $15,000 Level 1 (FRMS&P) FG7 – Amaroo Ave Drainage Upgrade Flood Modification (FM) Georges Hall 0.48 9 Medium $2,559,653 $7,500 Level 2 (Detailed damages) FM1 - Miller Road Drainage Upgrade Flood Modification (FM) Miller Road 0.43 10 Medium $1,285,546 $7,500 Level 2 (Detailed damages) FG4 – Rex Road Drainage Upgrade Flood Modification (FM) Georges Hall 0.32 11 Medium $209,781 $750 Level 1 (FRMS&P) FV1 – Alcoomie Reserve Detention Basin Flood Modification (FM) Villawood 0.22 12 Medium $3,252,747 $9,000 Level 2 (Detailed damages) FL2 – Wilton Reserve Detention Basin Flood Modification (FM) Lansdowne 0.21 13 Medium $2,035,061 $9,000 Level 2 (Detailed damages) FV5 – Orchard Road Drainage Upgrade Flood Modification (FM) Villawood 0.18 14 Medium $7,533,953 $7,500 Level 3 (Detailed damages and costs) PM1 – Voluntary House Raising Property Modification (PM) All subcatchments -0.02 15 Low $45,000 $7,500 Level 1 (FRMS&P) PM3 – Voluntary Purchase Property Modification (PM) All subcatchments -0.31 16 Low $45,000 $7,500 Level 1 (FRMS&P) FV8 – Christina Road Channel Upgrade Flood Modification (FM) Villawood -0.39 17 Low $3,481,201 $7,500 Level 2 (Detailed damages) FV6 – Sir Thomas Mitchell Drive Channel Upgrade Flood Modification (FM) Villawood -0.41 18 Low $1,303,526 $3,000 Level 2 (Detailed damages) Total $27,528,374 $204,750 *All capital costs for non-structural (PM and EM) options are for program establishment tasks only, not actual implementation costs.
Table 11-1 Implementation Plan for Prospect Creek Sub-Catchments FRMS&P
FL3

12 Conclusions & Next Steps in Study
This Draft Flood Risk Management Study and Plan (FRMS&P) report summarises the outcomes of the study undertaken for Canterbury-Bankstown Council for Prospect Creek Sub-Catchments. This includes initial data collection and review process, community consultation, review and update of the flood study models, existing risk assessments including economic impacts of flooding, flood emergency response review, and flood planning review It includes a summary of the flood risk management option development process and preliminary option assessment to refine options for adoption. The report also documents the detailed option assessment including modelling, cost estimation, damage benefits assessment, and Multi-Criteria Assessment (MCA) and provides a prioritised list of final options. Finally, the report outlines an implementation program to assist Council in the future implementation of these final options.
The flood study model review process involved the updating of the base case model for the FRMS&P to represent current study area conditions to reflect changes in the sub-catchments over the past decade since the flood studies were completed. Other updates to the base case models include use of a more recent TUFLOW processing engine, use of more accurate building footprints, and updating of downstream boundary conditions to reflect the latest flood available information for the Georges River.
A climate change sensitivity analysis has been conducted on the Georges Hall, Lansdowne, and Villawood models to assess the potential impacts of climate change on flooding including a 10% rainfall increase, and 0.9m sea level rise.
The flood damages assessment, flood emergency response review and flood planning review all contribute to the understanding of existing flooding as it relates to economic impacts, risk to life, and future development respectively.
A preliminary assessment of flood modification options has also been conducted including flood modelling of Flood Modification (FM) options and consideration of Property Modification (PM) options and Emergency Response Modification (EM) options. In total 32 preliminary options were developed including 20 FM, 6 PM and 6 EM options. From these preliminary options, 18 options have been selected for detailed assessment including 11 FM options, 2 PM options, and 5 EM options.
The detailed option assessment to review the selected final 18 options through flood modelling to assess the impacts of the option, flood damages (both for FM options only), cost estimation and Multi-Criteria Assessment (MCA). The outcomes of the MCA have been applied to the implementation plan including a list of priority options with six (6) high priority options, eight (8) medium priority options, and four (4) low priority options. Of the high priority options, three are Flood Modification (FM), or structural options and three are Emergency response modification (EM) options.
The next phase of the project is for this Draft Final FRMS&P report to be placed on public exhibition, to receive comments and feedback from the community on the draft outcomes of the study prior to finalisation. The public exhibition period is planned for a four-week period (at a minimum) in the first half of 2024 Comments from the community shall be collated and reviewed and incorporated into the Final FRMS&P report.
Draft Final Flood Risk Management Study and Plan Prospect Creek Sub-Catchments 304600207 | 22 March 2024 118

13 References
Australasian Fire and Emergency Service Authorities Council (AFAC) (2018) Guideline on Emergency Planning and Response to Protect Life in Flash Flood Events, April
Australian Emergency Management (AEM) Institute (2014) AEM Handbook 7: Managing the floodplain: best practice in flood risk management in Australia
Ball J, Babister M, Nathan R, Weeks W, Weinmann E, Retallick M, Testoni I, (Editors), 2019, Australian Rainfall and Runoff: A Guide to Flood Estimation, Commonwealth of Australia
Bankstown Council (2015) Bankstown Local Environmental Plan 2015
Bewsher (2006) Prospect Creek Flood Study Review, February
Bewsher (2010) Prospect Creek Floodplain Management Plan Review, Final Report, March
BMT WBM (2012) Lansdowne Catchment Flood Study, December
BMT WBM (2012) Miller Road Catchment Flood Study, December
BMT WBM (2013) Georges Hall Catchment Flood Study, March
BMT WBM (2014) Bennett Street Drain Upgrade, Chester Hill Flood Assessment, August
BMT WBM (2019) Georges River Flood Study – Final Draft Report, September
Canterbury-Bankstown Council (2023) Canterbury-Bankstown Development Control Plan (DCP) 2023
Canterbury-Bankstown Council (2023) Canterbury-Bankstown Local Environment Plan (LEP) 2023
Canterbury-Bankstown Council (2022a) City of Canterbury-Bankstown Community Profile, 15 March 2022, from: https://profile.id.com.au/canterbury-bankstown
Canterbury-Bankstown Council (2022b) City of Canterbury-Bankstown Social Atlas, 15 March 2022, from: https://atlas.id.com.au/canterbury-bankstown
Civic Design (2008) Villawood Drain Work-as-Executed Study, July
DAWE (2022a) Environmental Protection and Biodiversity Conservation Act 1999 (EBPC Act) Protected Matters Search Tool, 15 March 2022. Australian Department of Agriculture, Water and Environment.
DAWE (2022b) Australian Heritage Database, 15 March 2022. Australian Department of Agriculture, Water and Environment.
FloodMit (2012) Sea Level Rise Impact Assessment for the Georges River, Final Report, October
NSW DCCEEW (2020) Guidelines for voluntary house raising schemes: Floodplain Management Program, February
NSW DCCEEW (2020) Guidelines for voluntary purchase schemes: Floodplain Management Program, February
NSW DCCEEW (2022a) Bionet Atlas of NSW Wildlife, NSW Government. Retrieved 15 March 2022, from: http://www.bionet.nsw.gov.au/
NSW DCCEEW (2022b) State Heritage Database. Retrieved 15 March 2022, from http://www.environment.nsw.gov.au/heritageapp/heritagesearch.aspx
NSW Government (2005) Floodplain Development Manual
NSW Government (2015) Floodplain Risk Management Guide – Modelling the Interaction of Catchment Flooding and Oceanic Inundation in Coastal Waterways, November
NSW Government (2021) Considering flooding in land use planning: Guideline, July
NSW Government (2021) Environmental Planning and Assessment Amendment (Flood Planning) Regulation 2021
NSW Government (2021) Local Planning Direction - Section 9.1(2) of the Environmental Planning and Assessment Act 1979 - Flooding
Draft Final Flood Risk Management Study and Plan Prospect
304600207 | 22 March 2024 119
Creek Sub-Catchments

NSW Government (2021) Planning Circular - Considering flooding in land use planning: guidance and statutory requirements
NSW Government (2021) Standard Instrument (Local Environmental Plans) Amendment (Flood Planning) Order 2021
NSW Government (2021) State Environmental Planning Policy Amendment (Flood Planning) 2021
NSW Government (2023) Flood Risk Management Manual: The management of flood liable land, February
NSW Government (2023) FRM Guide - Draft Flood Damages Tool (DT01)
NSW Government (2023) FRM Guide – FRM Measures (MM01)
NSW Government (2023) FRM Guide - Understanding and Managing Flood Risk (FB01)
NSW Government (2023) FRM Guide - Flood Impact and Risk Assessment (LU01)
NSW Government (2023) FRM Guide - Support for Emergency Management Planning (EM01)
NSW Government (2023) FRM Guide – Flood Function (FB02)
NSW Government (2023) FRM Guide – Flood Hazard (FB03)
NSW Government (2023) FRM Guide – Delivery under the Flood Risk Management Framework (FG01)
NSW Government (2022) State Environmental Planning Policy (Resilience and Hazards) 2022
NSW SES (2021) Canterbury-Bankstown LGA Flood Emergency Sub Plan
NSW SES (2017) South-West Metropolitan Regional Emergency Management Plan, July
NSW SES (2018) Georges River and Woronora River Valley Flood Emergency Sub Plan, May
NSW SES (2021) NSW State Flood Plan, December
NSW SES (2018) NSW State Emergency Management Plan, December Realestate.com.au (2022) Explore Australian Suburbs, 15 March 2022, from: https://www.realestate.com.au/neighbourhoods/
Smith, G and Cox, R. (2019) Book 6: Flood Hydraulics in AR&R - A Guide to Flood Estimation
Draft Final Flood Risk Management Study and Plan Prospect Creek Sub-Catchments 304600207 | 22 March 2024 120
Prospect
Creek Sub-Catchments

APPENDIX

CONSULTATION MATERIALS
‘Have Your Say’ Text
1.1 Background
The City of Canterbury Bankstown (Council) is preparing a flood risk management study and plan for the City’s four sub-catchments of Prospect Creek. The purpose of the Flood Risk Management Study is to identify ways to manage the flood risk in a way that benefits the community and the environment.
Council is required to develop Flood Risk Management in accordance with the process outlined by the NSW Government’s Flood Risk Management Manual as illustrated in the following flowchart.

1.2 This Proposal
Council’s available information identifies that stormwater and riverine flooding has occurred in this area. The objective of this flood risk management Study and Plan (Step 3 and 4 of the Flood risk management process) is to help the community to protect their lives and properties by better planning, improving emergency management and identifying flood mitigation infrastructures.
Council has previously completed data collection and prepared Flood Studies (Steps 1 and 2) for these catchments, which provided a description of flood behaviour in the catchment and defines the flood extents for a range of storm events.
The Flood Studies for the four sub-catchments are available here
The Study Area includes the suburbs of Georges Hall, Lansdowne, Bass Hill, Villawood, and Chester Hill as detailed in the project map by boundary and including a 100-year flooding levels overlay.
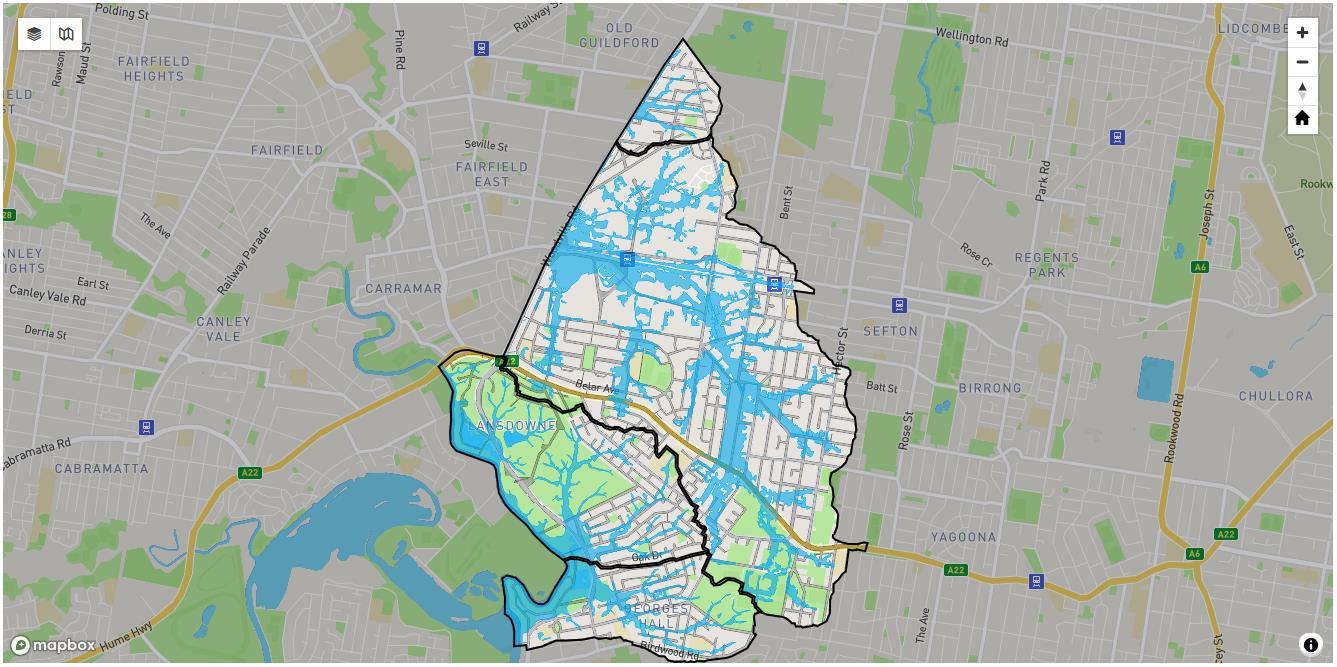
This Study and Plan (Steps 3 and 4) will build upon previous flood studies for the four catchments. The feedback received from the community will be considered for options that seek to:
• Modify flood behaviour (e.g. levees, upgrade of stormwater systems);
• Mitigate the impact of flooding on existing properties (e.g. via floor raising);
• Control future development in the floodplain; and
• Guide emergency management when a flood occurs.
At this time residents, property owners and business operators within the study area are invited to share their recent and historical experiences with storm events in their respective area and, provide their ideas for improved flood risks management.
1.3 How to have your say
Community consultation will be a key component of the study process and we will be seeking input from residents, land owners and business operators at key stages throughout this study.
For this initial phase, we encourage you to provide feedback and comments by completing the online survey which has been set-up to gather views and suggestions for flood risk management options. This survey was be facilitated by our project partners Stantec.
The online survey (for this initial phase) will be open until 5pm on Friday 26 August 2022.
1.3.1 Community Information Sessions
If you would like the opportunity to speak with a project officer about this study / plan, we will be hosting a community information session.
1.3.2 Who's listening
If you have questions or want to learn more about the project, please contact the Council officers listed below.
Introductory Letter Text
Council is preparing a flood risk management study and plan for four sub-catchments of Prospect Creek. The Study Area is shown in Figure 1 and includes the suburbs of Georges Hall, Lansdowne, Bass Hill, Villawood, and Chester Hill This study and plan will help protect people and property through better planning, emergency management and infrastructure works.
Flooding within the Study Area typically originates from the following sources:
> Local overland flows from within the catchment through existing drainage paths
> Overtopping of the open channel in low lying areas of the catchment
> For Lansdowne and Georges Hall areas also flooding from Prospect Creek / Georges Hall
But what is a flood model? Expert consultants create a computer-generated model of the area. The model shows the impact of storm events ranging from heavy rainfall to the most extreme flood. This includes:
> Where the water will run
> How the existing drainage system will cope
> Whether property damage is likely to occur
What is a flood risk management study and plan? There are three main ways to manage flood risk:
> controls on development
> helping people at risk (e.g. flood warning systems)
> changing the behaviour of the flood itself (e.g. upgrade of stormwater systems).
The study and plan will assess each option to determine:
> reductions in flood risk and potential losses
> costs to implement
> benefits or impacts society and the environment.
A list of prioritised options will be developed for the study area which will look to provide solutions to current flooding issues. Options may need external funding to implement, such as through state government grants. Your input into preferred options is another goal of this online survey.
For further information regarding the study, please visit Council’s Have Your Say page using the following link or scan the QR code:
[link and QR code to Have You Say page]
An online survey has been set-up to gather views and suggestions for flood risk management options. You can access this survey from the Have Your Say page in the above link and QR code. Residents, land owners and business operators in the Study Area are invited to share your experiences of past storm events and ideas for managing flood risks. This survey will provide useful information about past flooding experience and to gather any photo and video evidence as well as stories from residents. The online survey will be available from this link until 26 August 2022.
In addition, the first in-person information session will be at Bass Hill Plaza from 5.00pm to 7.00pm on 4 August 2022. An information stall will be attended by Council staff, as well as flood consultants from Cardno to answer any questions you may have. We will also have on hand tablet devices for residents to complete online surveys in-person.
For further information about the study, please contact [Council contact details].
Online Survey Questions
Prospect Creek Sub-Catchments Flood Risk Management Study and Plan
Resident/ Landowner Survey 2022
Section 1: About You
Q1. Could you please provide us with the following details, as this allows us to locate specifically where your comments and responses relate to? This information will not be shared without your consent. If you do not provide these details, please feel free to complete the survey anyway.
Name:
Address:
Daytime Ph:
Email:
Q2. Do you give permission for someone from Council or their consultants Cardno to contact you to discuss some of the information you have provided us?
Yes
No
Q 3. Is your property (please tick)
Owner occupied
Rented - by yourself
Rented – by others
A business
Other
Q 4. How long have you lived, worked and/or owned your property?
Months
Years
Q 5. Number of permanent residents at this address aged:
0 - 4 years
5 - 24 years
25 - 64 years
65+ years
Q 6. What is the main language spoken at home?
English
Other (Specify)
Q 7. What do you think are the best ways to get input and feedback from the local community about this project? (Please tick relevant boxes)
Council’s website
Emails from Council
Council’s Flood Risk Management Committee
Information days in the local area
Community meetings
Mail outs to all residents / business owners in the study area
Formal Council Meetings
Council’s information page in the local paper
Other articles in the local paper
Section 2: Your Experience of Flooding
Q 8. Have you ever experienced flooding since living/working in the local area? (Please tick relevant boxes)
If you have multiple experiences of flooding, please add notes for all flooding experiences
Yes, floodwaters entered my house/business
Yes floodwaters entered my yard
Yes, the road was flooded and I couldn’t drive my car
Yes, the drainage channel overtopped
Yes, other parts of my neighbourhood were flooded
Yes, I saw water flowing out of street drains or manholes
No, I haven’t experienced flooding
Q 9. Do you remember when the flooding occurred? Years, months, or even specific dates?
Q 10. How did the flooding affect you and your family / business? (Please tick relevant boxes)
Parts of my house/business building were damaged
If yes, when did the flooding occur?
The contents of my house/business were damaged
My garden, yard, and/or surrounding property were damaged
My car(s) were damaged
Other property was damaged (specify)
I couldn’t leave the house/business
Family members/work mates couldn’t leave/return to the house/business
The flood disrupted my daily routine
The flood affected me in other ways (specify)
The flood didn’t affect me
Q 11. Can you mark on this map where you have observed flooding before? [ArcMap interactive map]
Q 12. Do you have any materials or photos you can provide to evidence the flooding you experienced?
If yes, when did the flooding occur?
Yes. The photographed / recorded flooding occurred on.
No
Q 13. What do you believe to be the main cause of flooding in your area?
Drainage channels overtopping
Not enough capacity in the stormwater drainage causing systems to overflow
Stormwater flowing to a channel or drain
Flooding from Prospect Creek / Georges River
Other (please describe)
Section 3: Reducing Flood Risk
Q 14. As a local resident who may have witnessed flooding/drainage problems, you may have your own ideas on how to address flooding concerns. Which of the following management options would you prefer (where 1 = most preferred, 5 = least preferred)? (Please note the Glossary at the bottom of this questionnaire)
> Rainwater tanks and other stormwater harvesting uses
> Detention basins; these temporarily hold water in open space areas and reduce flooding downstream
> Stormwater treatment devices to improve water quality in local waterways
> Culvert / bridge / pipe enlarging
> Levee banks which create an elevated ground embankment protecting from flooding
> Increasing stormwater channel size
> Replacement of concrete channels with natural waterways
> Planning and flood related development controls to ensure future development is at lower risk of flooding
> Voluntary raising of houses to reduce flood damages by raising floor levels above a design flood
> Voluntary purchase of highly flood affected properties by Council and demolition of any buildings on the property
> Changes in road surface to keep stormwater in the road and away from private properties
> Education of community, providing greater awareness of potential flood hazards
> Flood forecasting, flood warning, evacuation planning and emergency response such as early warning systems, improved local SES capabilities/ resources or improved radio and phone communications
> Other (please specify any options you believe are suitable). Please attach extra pages for other suggestions
Q 15. If you have a flood management option specific location, can you please add a note to this interactive map for the option location and provide a note about option details? [ArcMap interactive map]
Section 4: Flooding and Climate Change
Q 16. Are you concerned about the uncertainty of future climates and the possible impacts on flooding in your area?
If yes, can you provide some examples of your concerns?
Yes
No
Q 17 Under an uncertain future there is potential for impacts on flooding due to projected increases in sea levels and rainfall intensities. The Flood Risk Management Study will be looking at measures to reduce the flood impacts as a result of existing and future climate conditions.
a. Do you believe the climate is changing?
Not at all
Yes, but the effects won’t be significant Yes, it will have significant effects
b. Are you concerned about the impact of an uncertain climate on future flooding in the study areas?
Yes
Somewhat
No
c. Should Council be addressing the impacts of an uncertain future climate on flooding?
Yes
No
If yes, how much would you like to see Council address these impacts (e.g. development controls on potentially affected properties, structural protection works)?
Prospect
Creek Sub-Catchments

APPENDIX

BASE CASE MODEL UPDATES


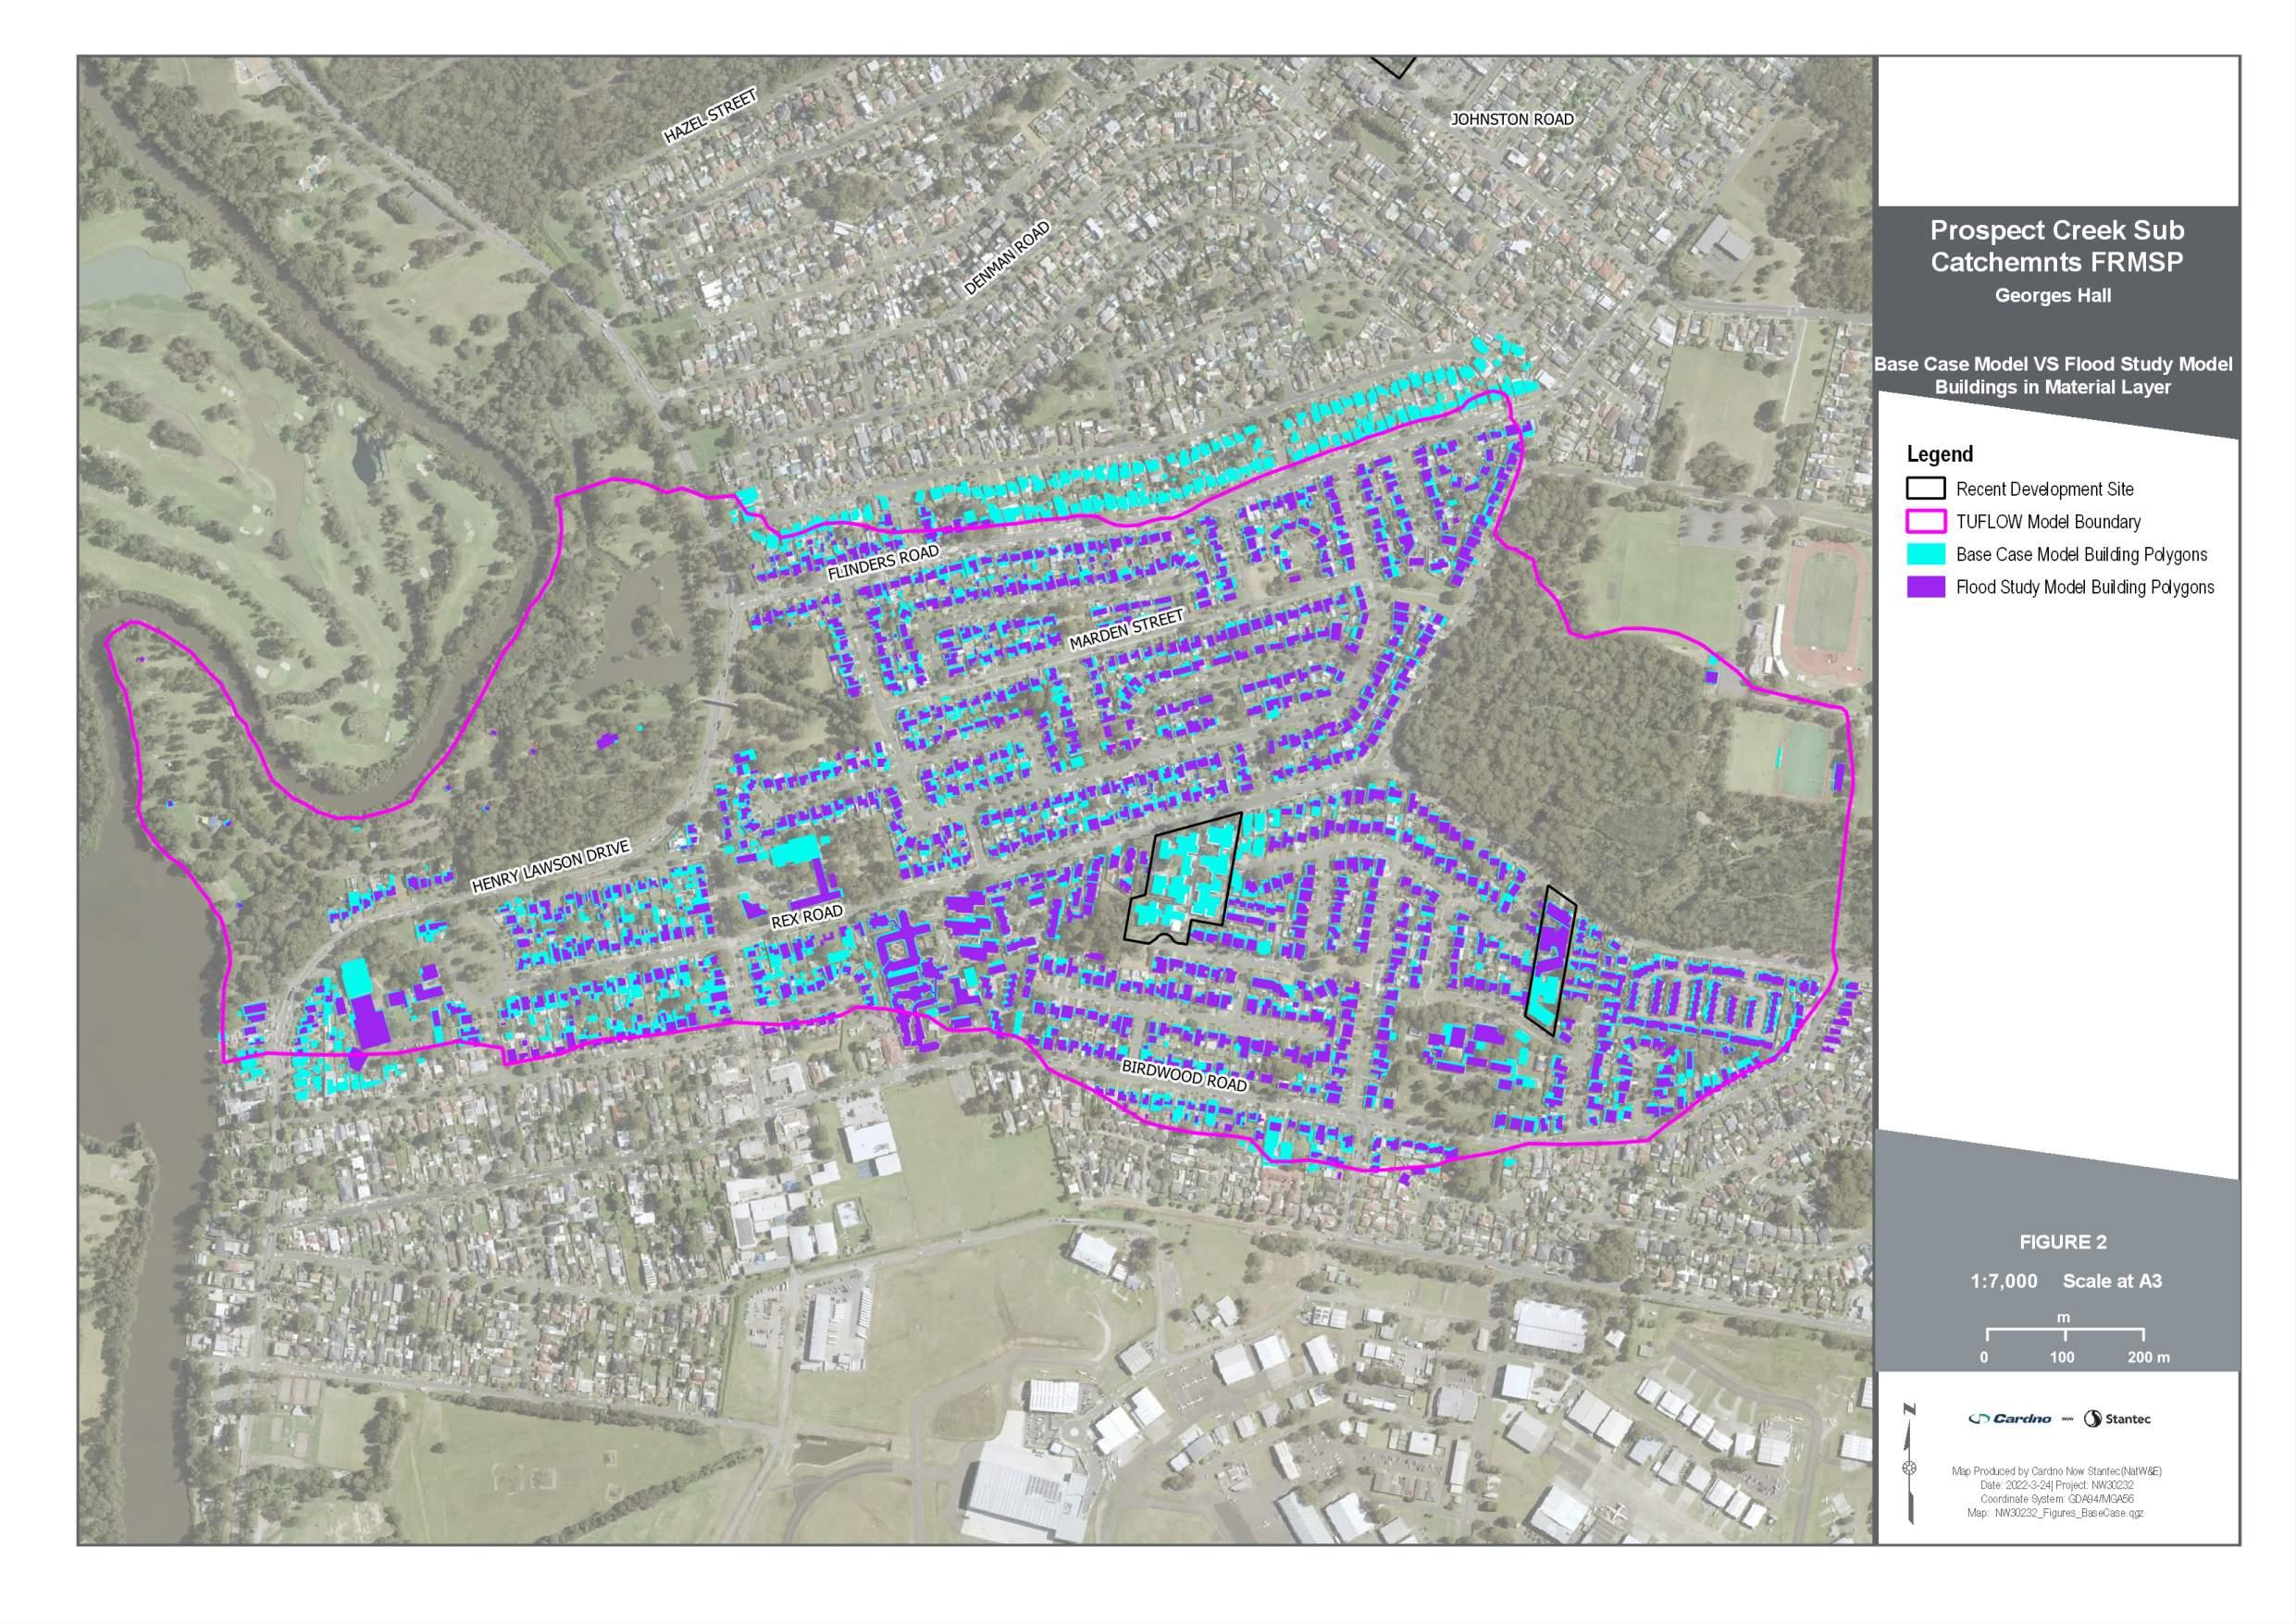

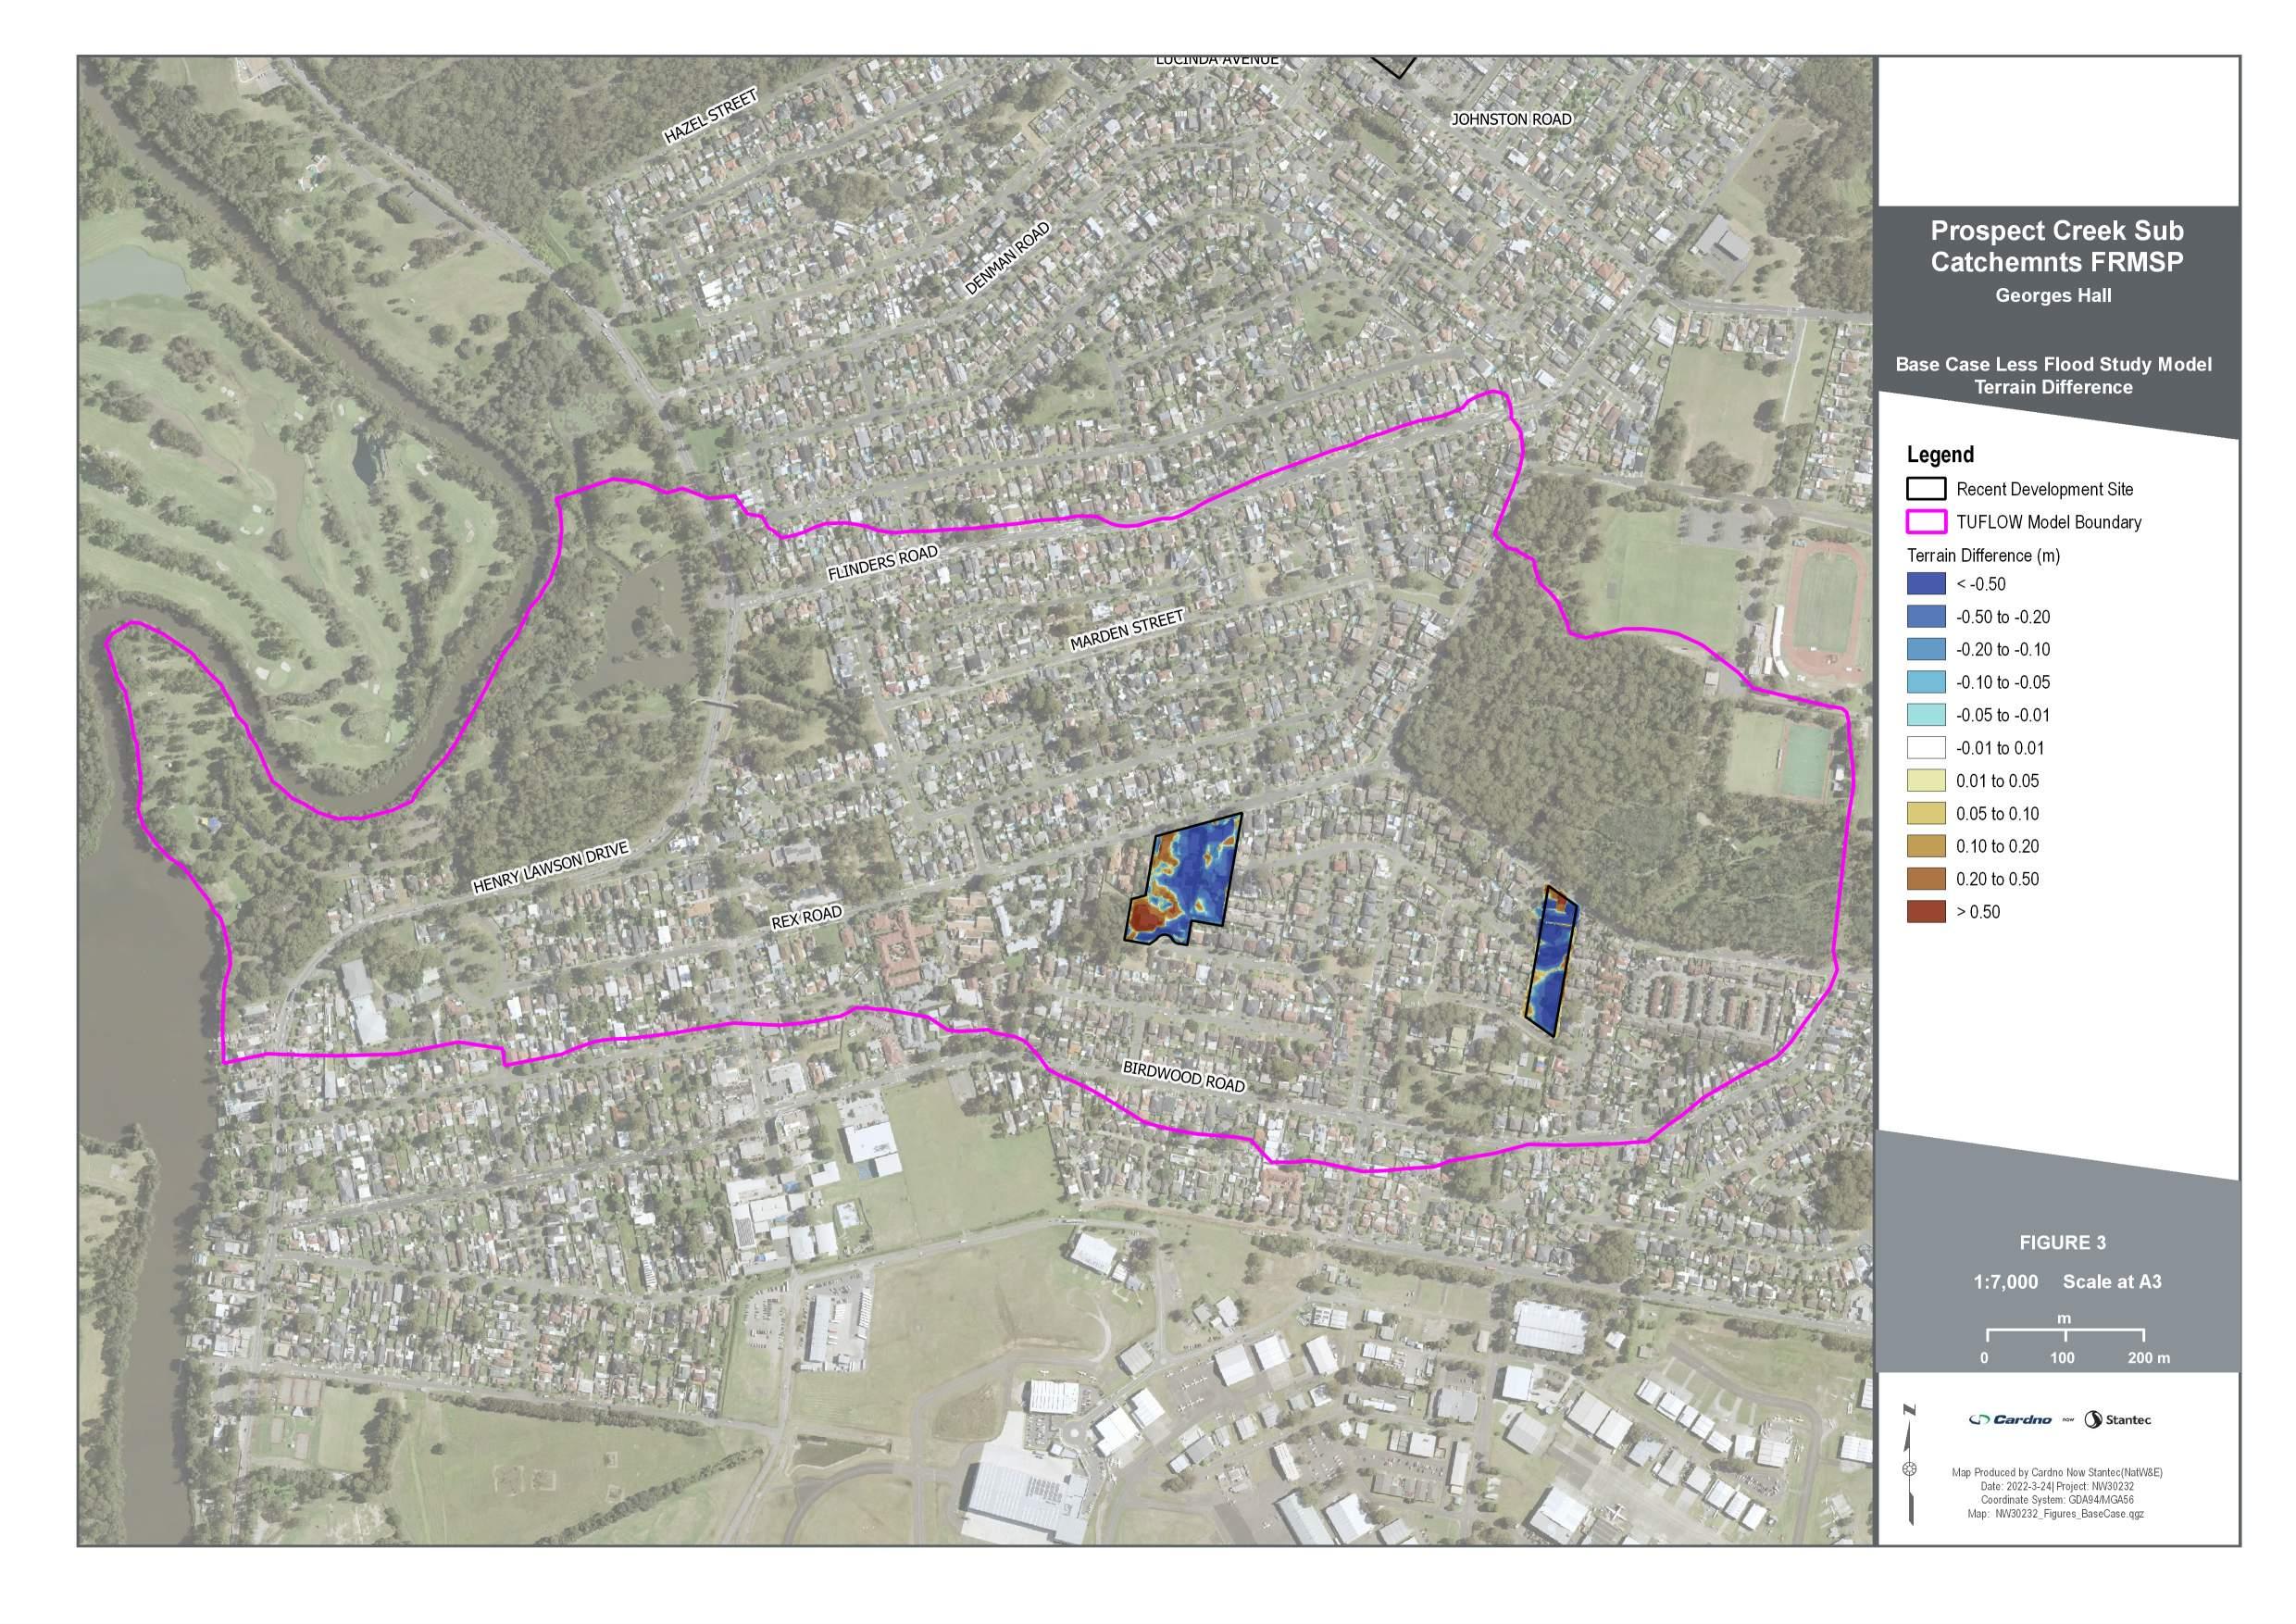

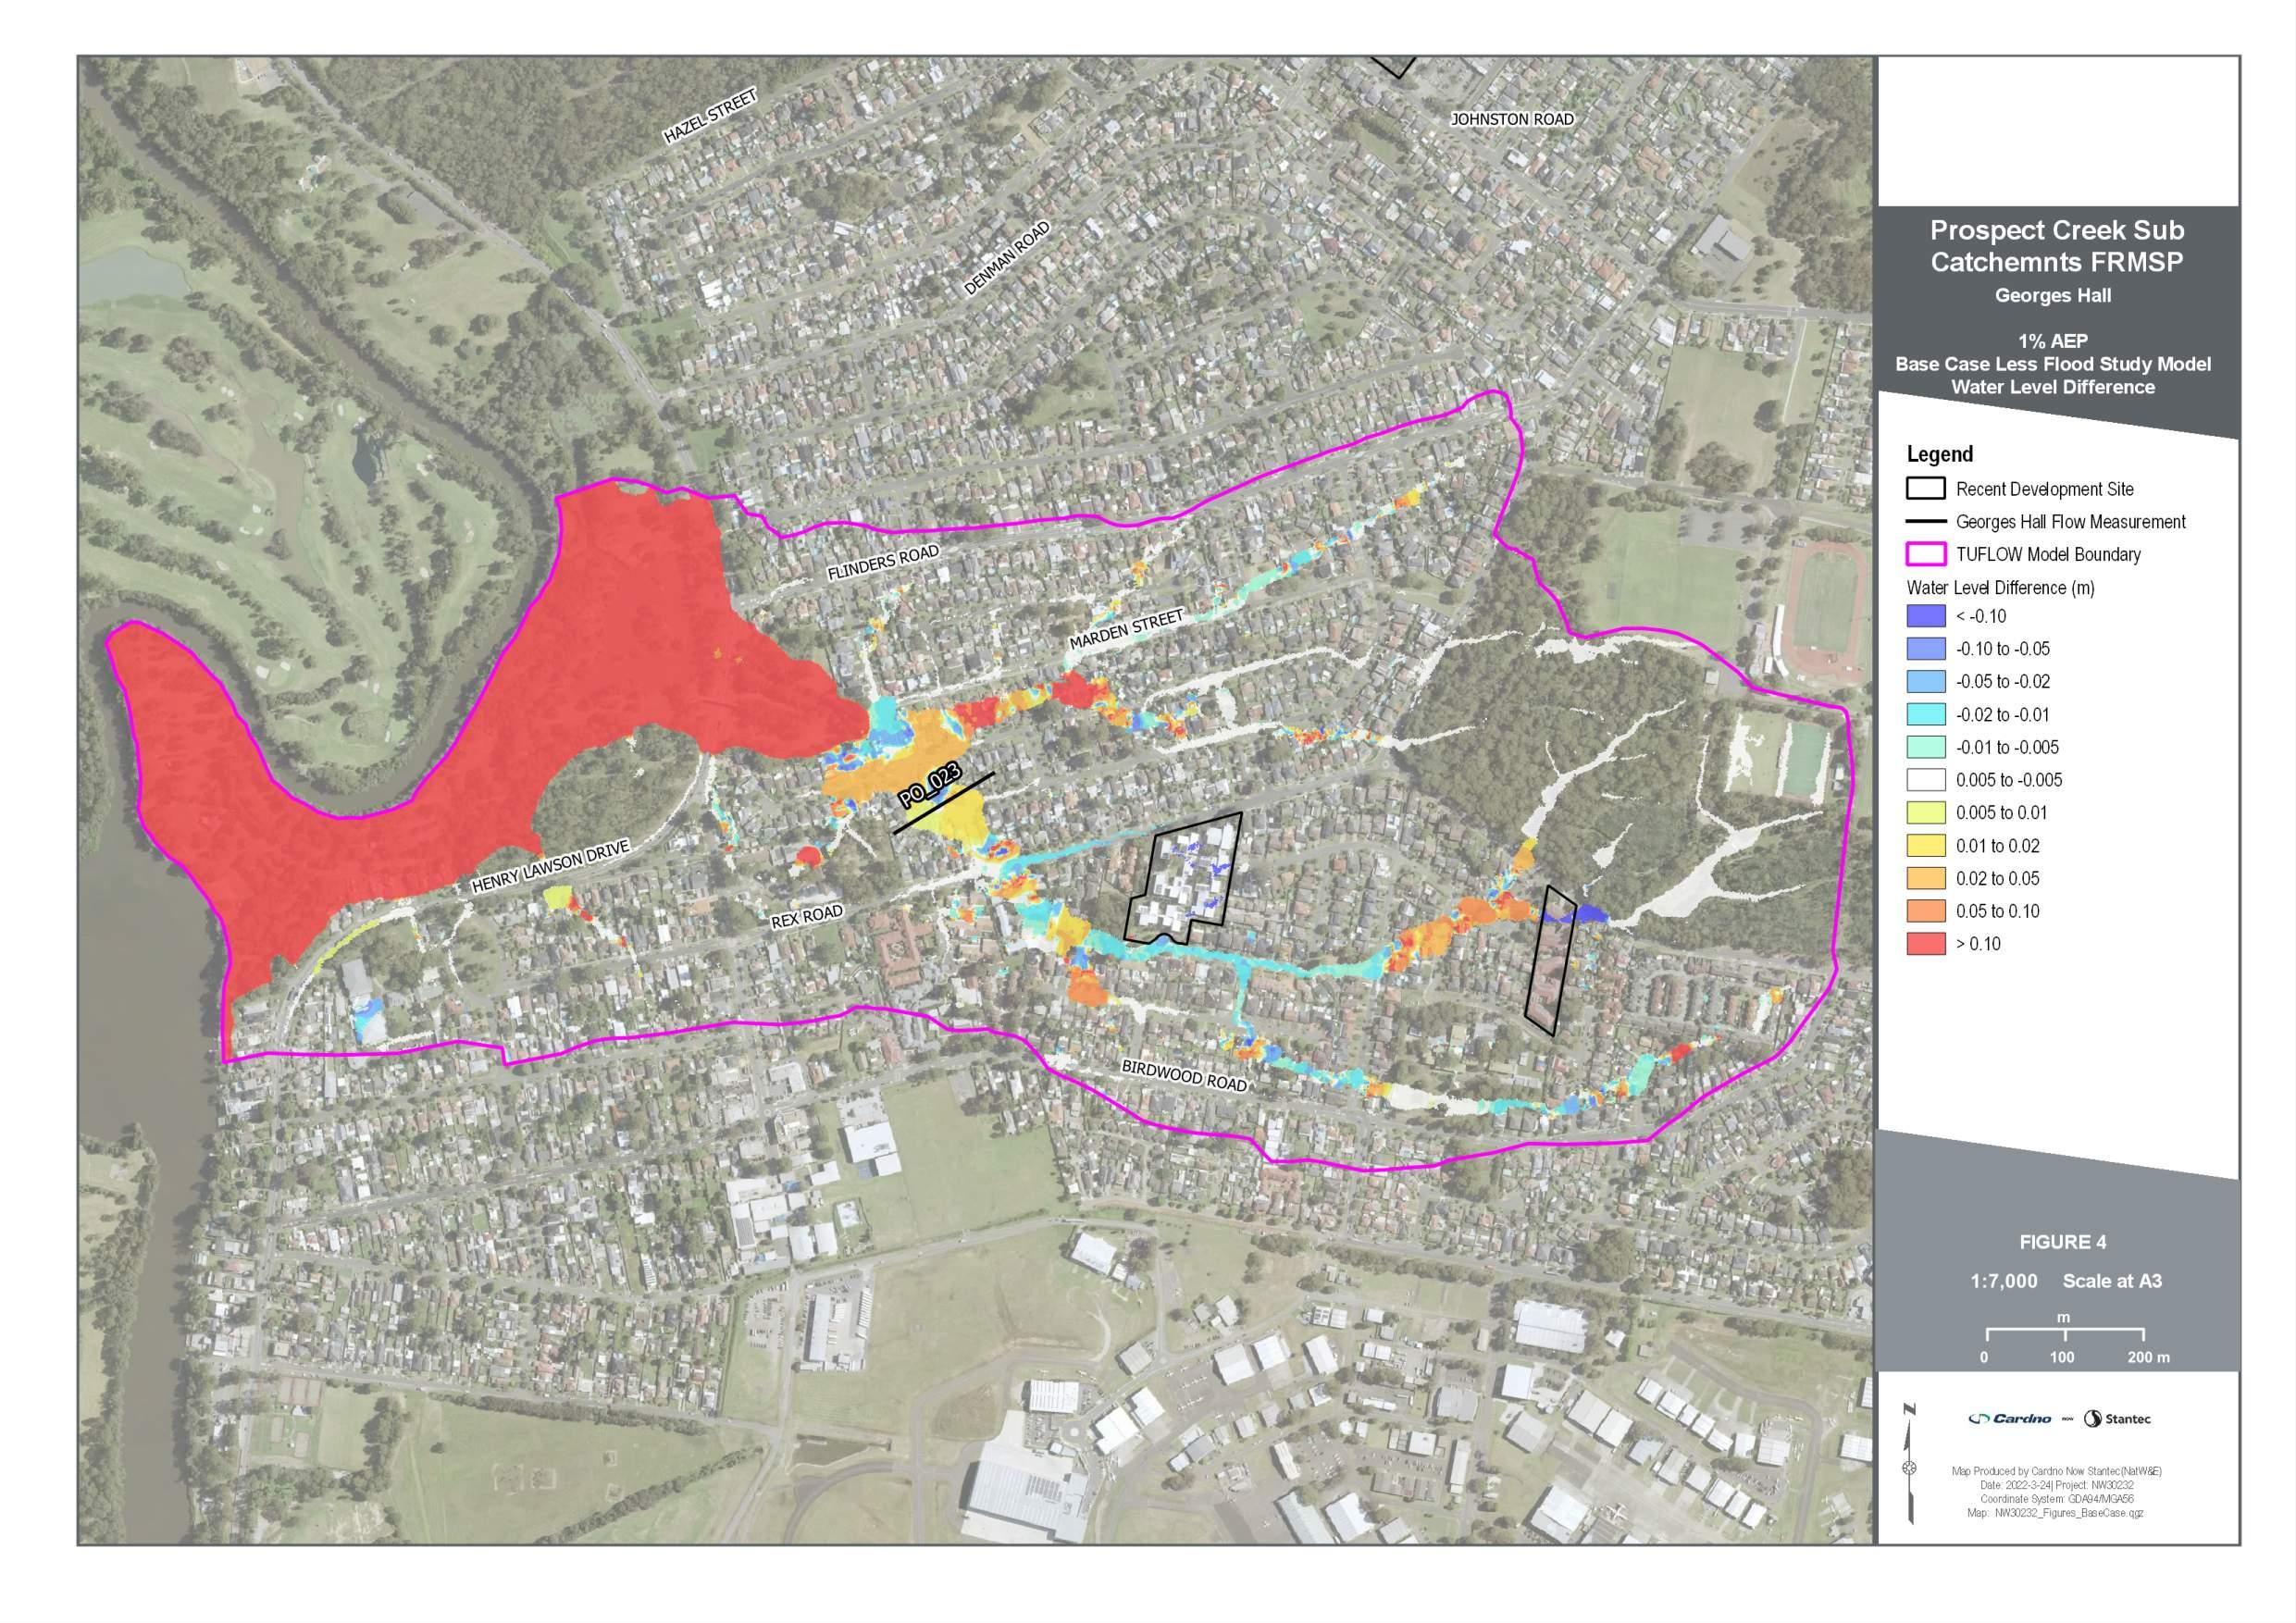

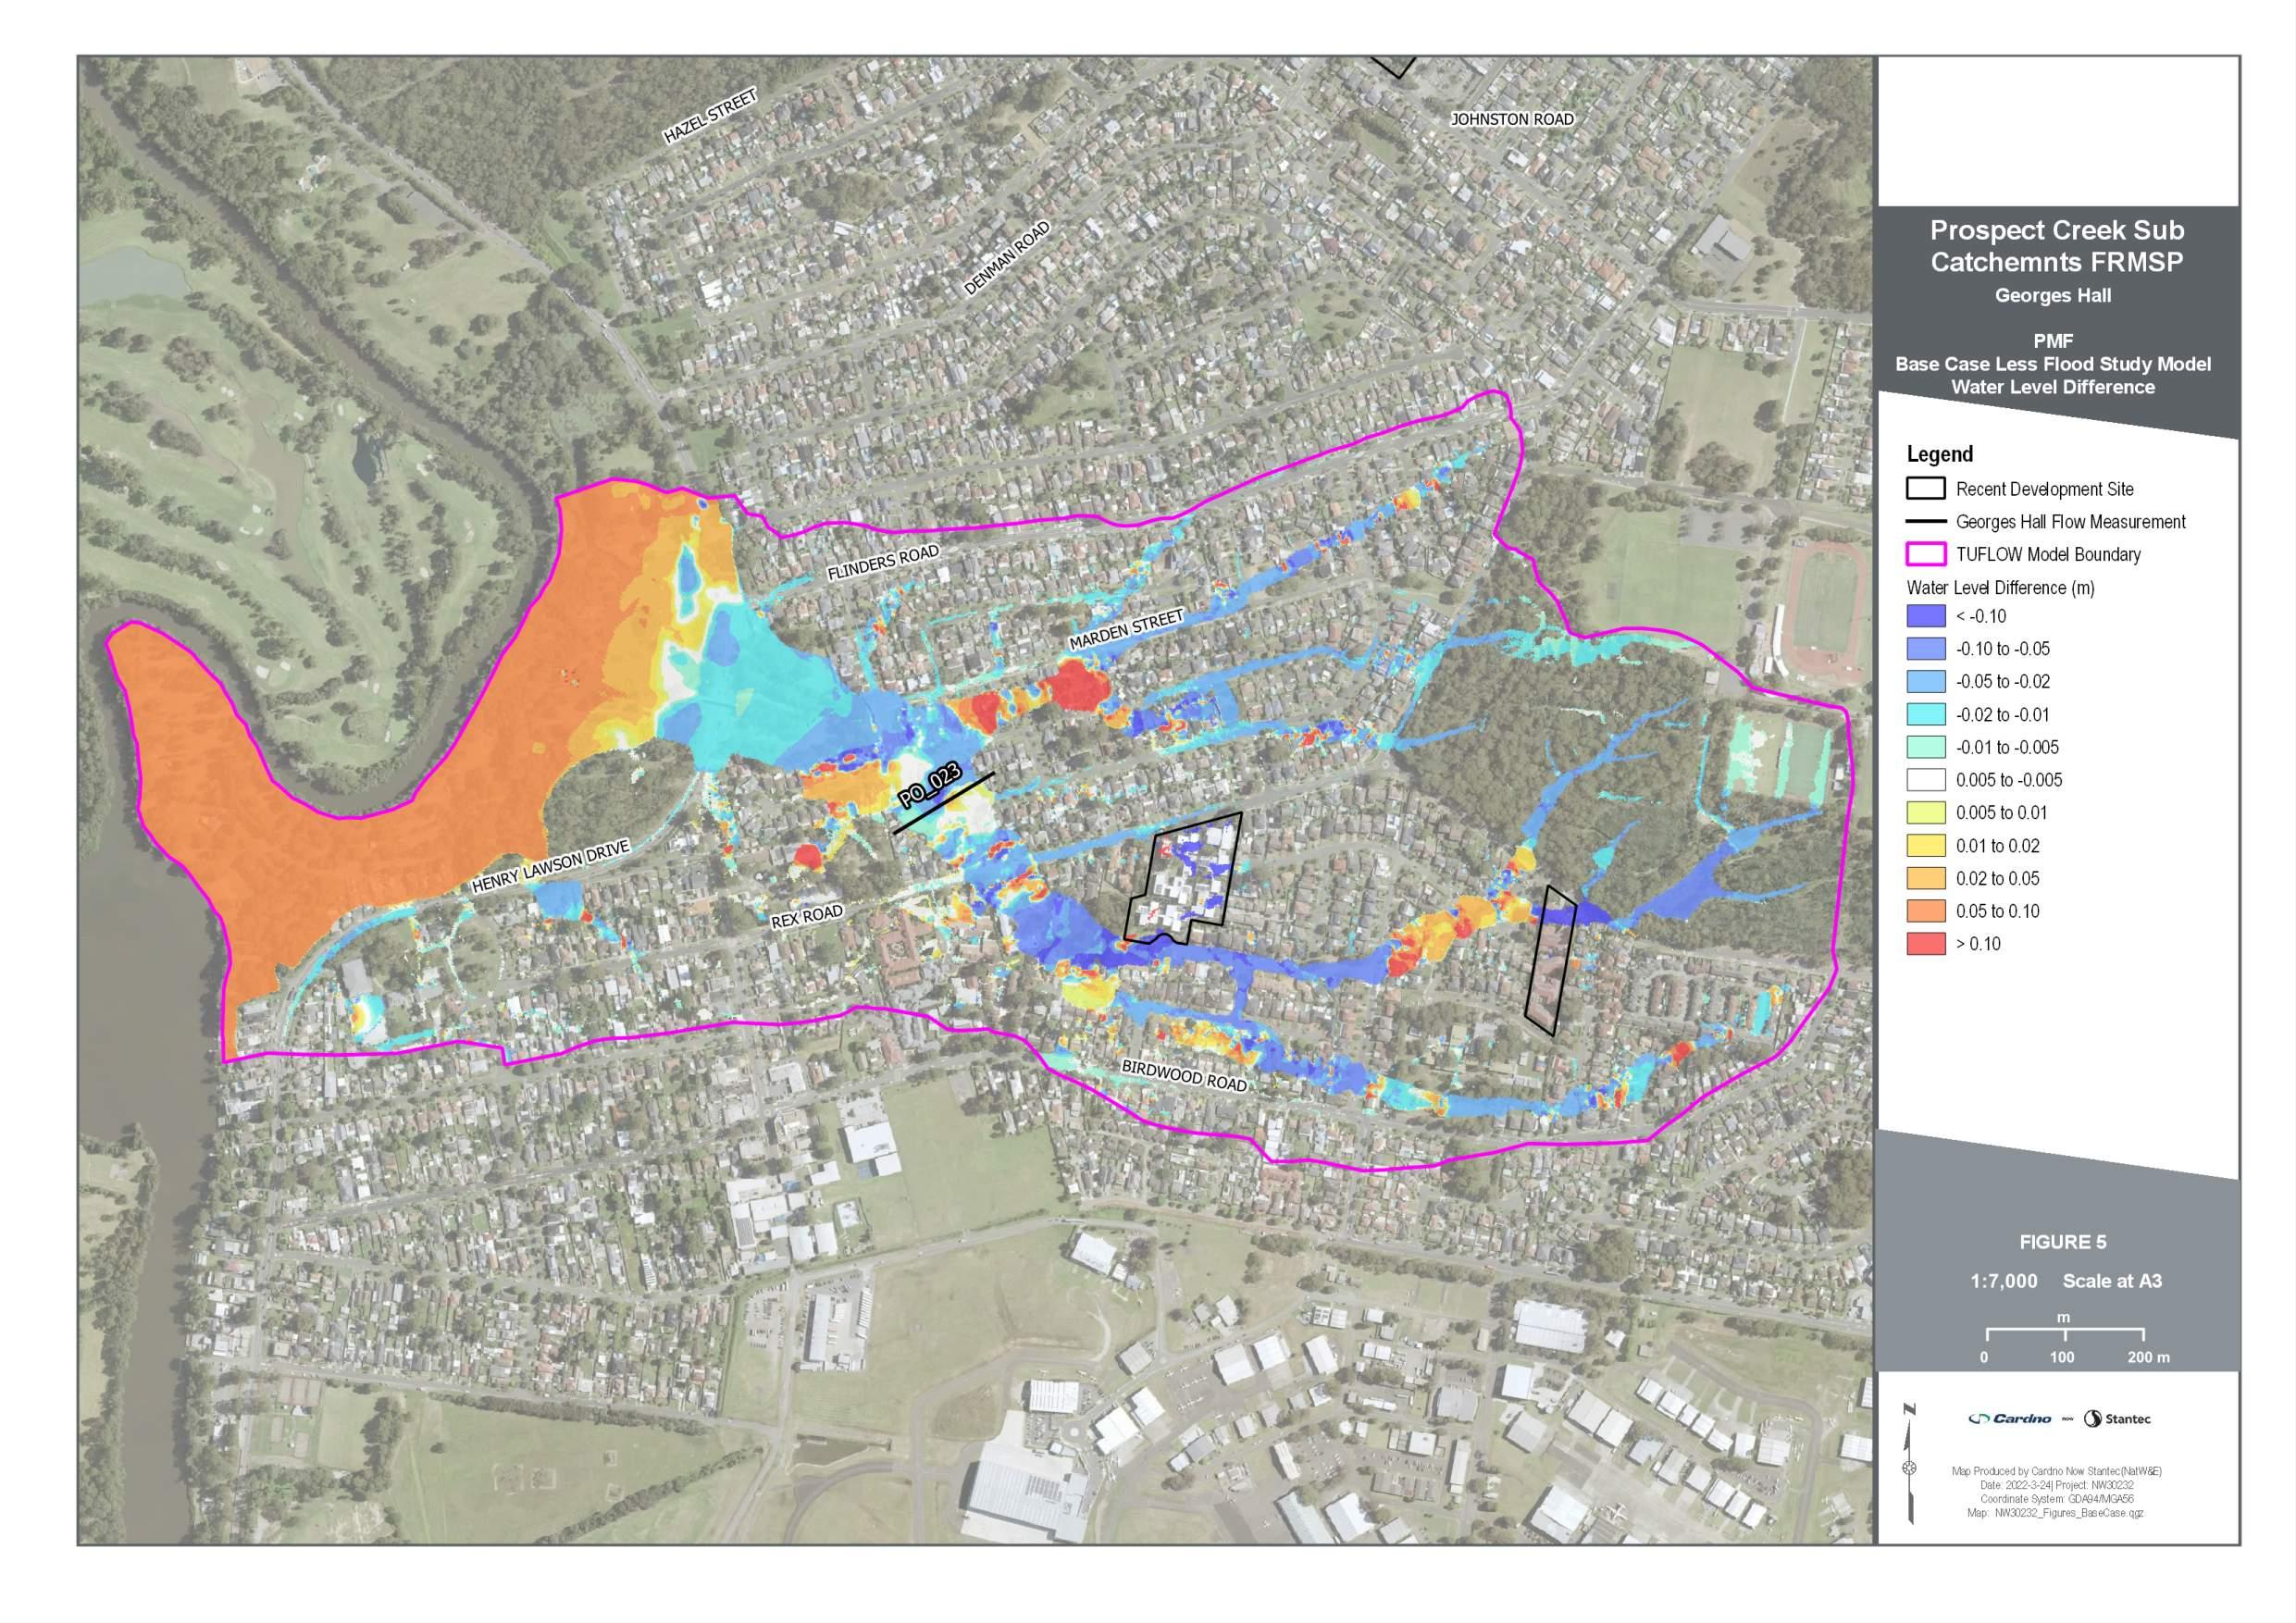

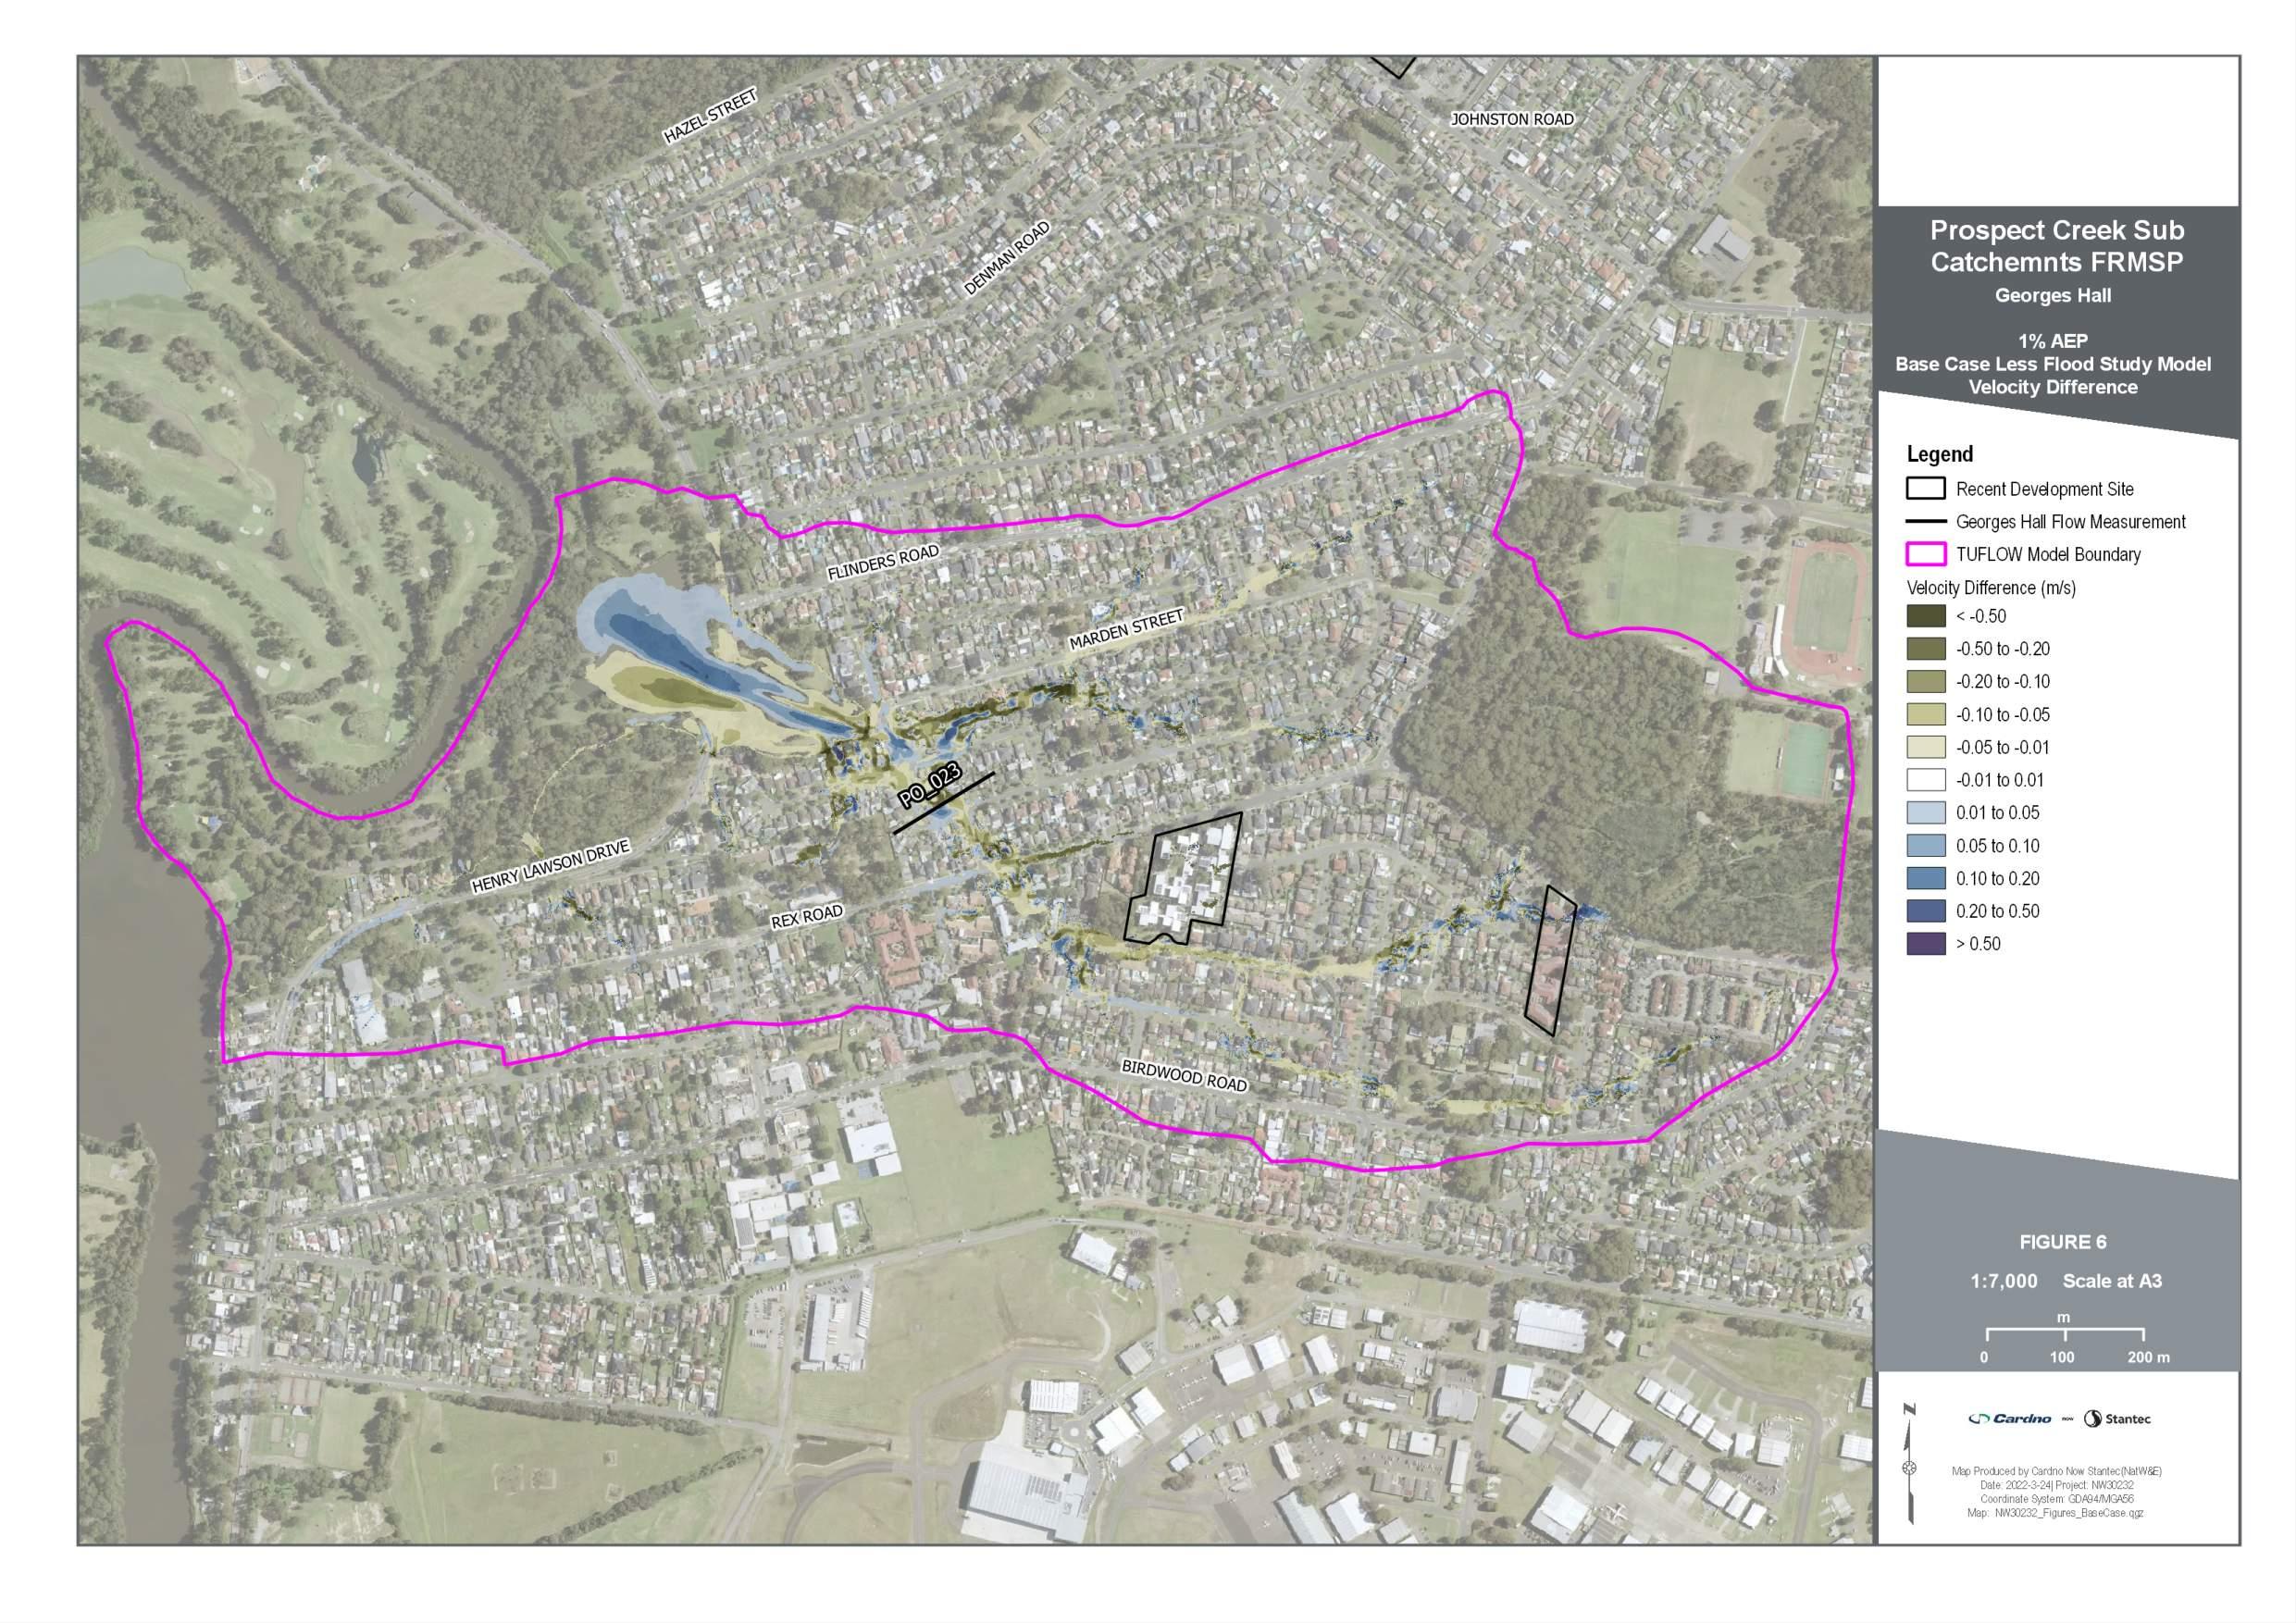

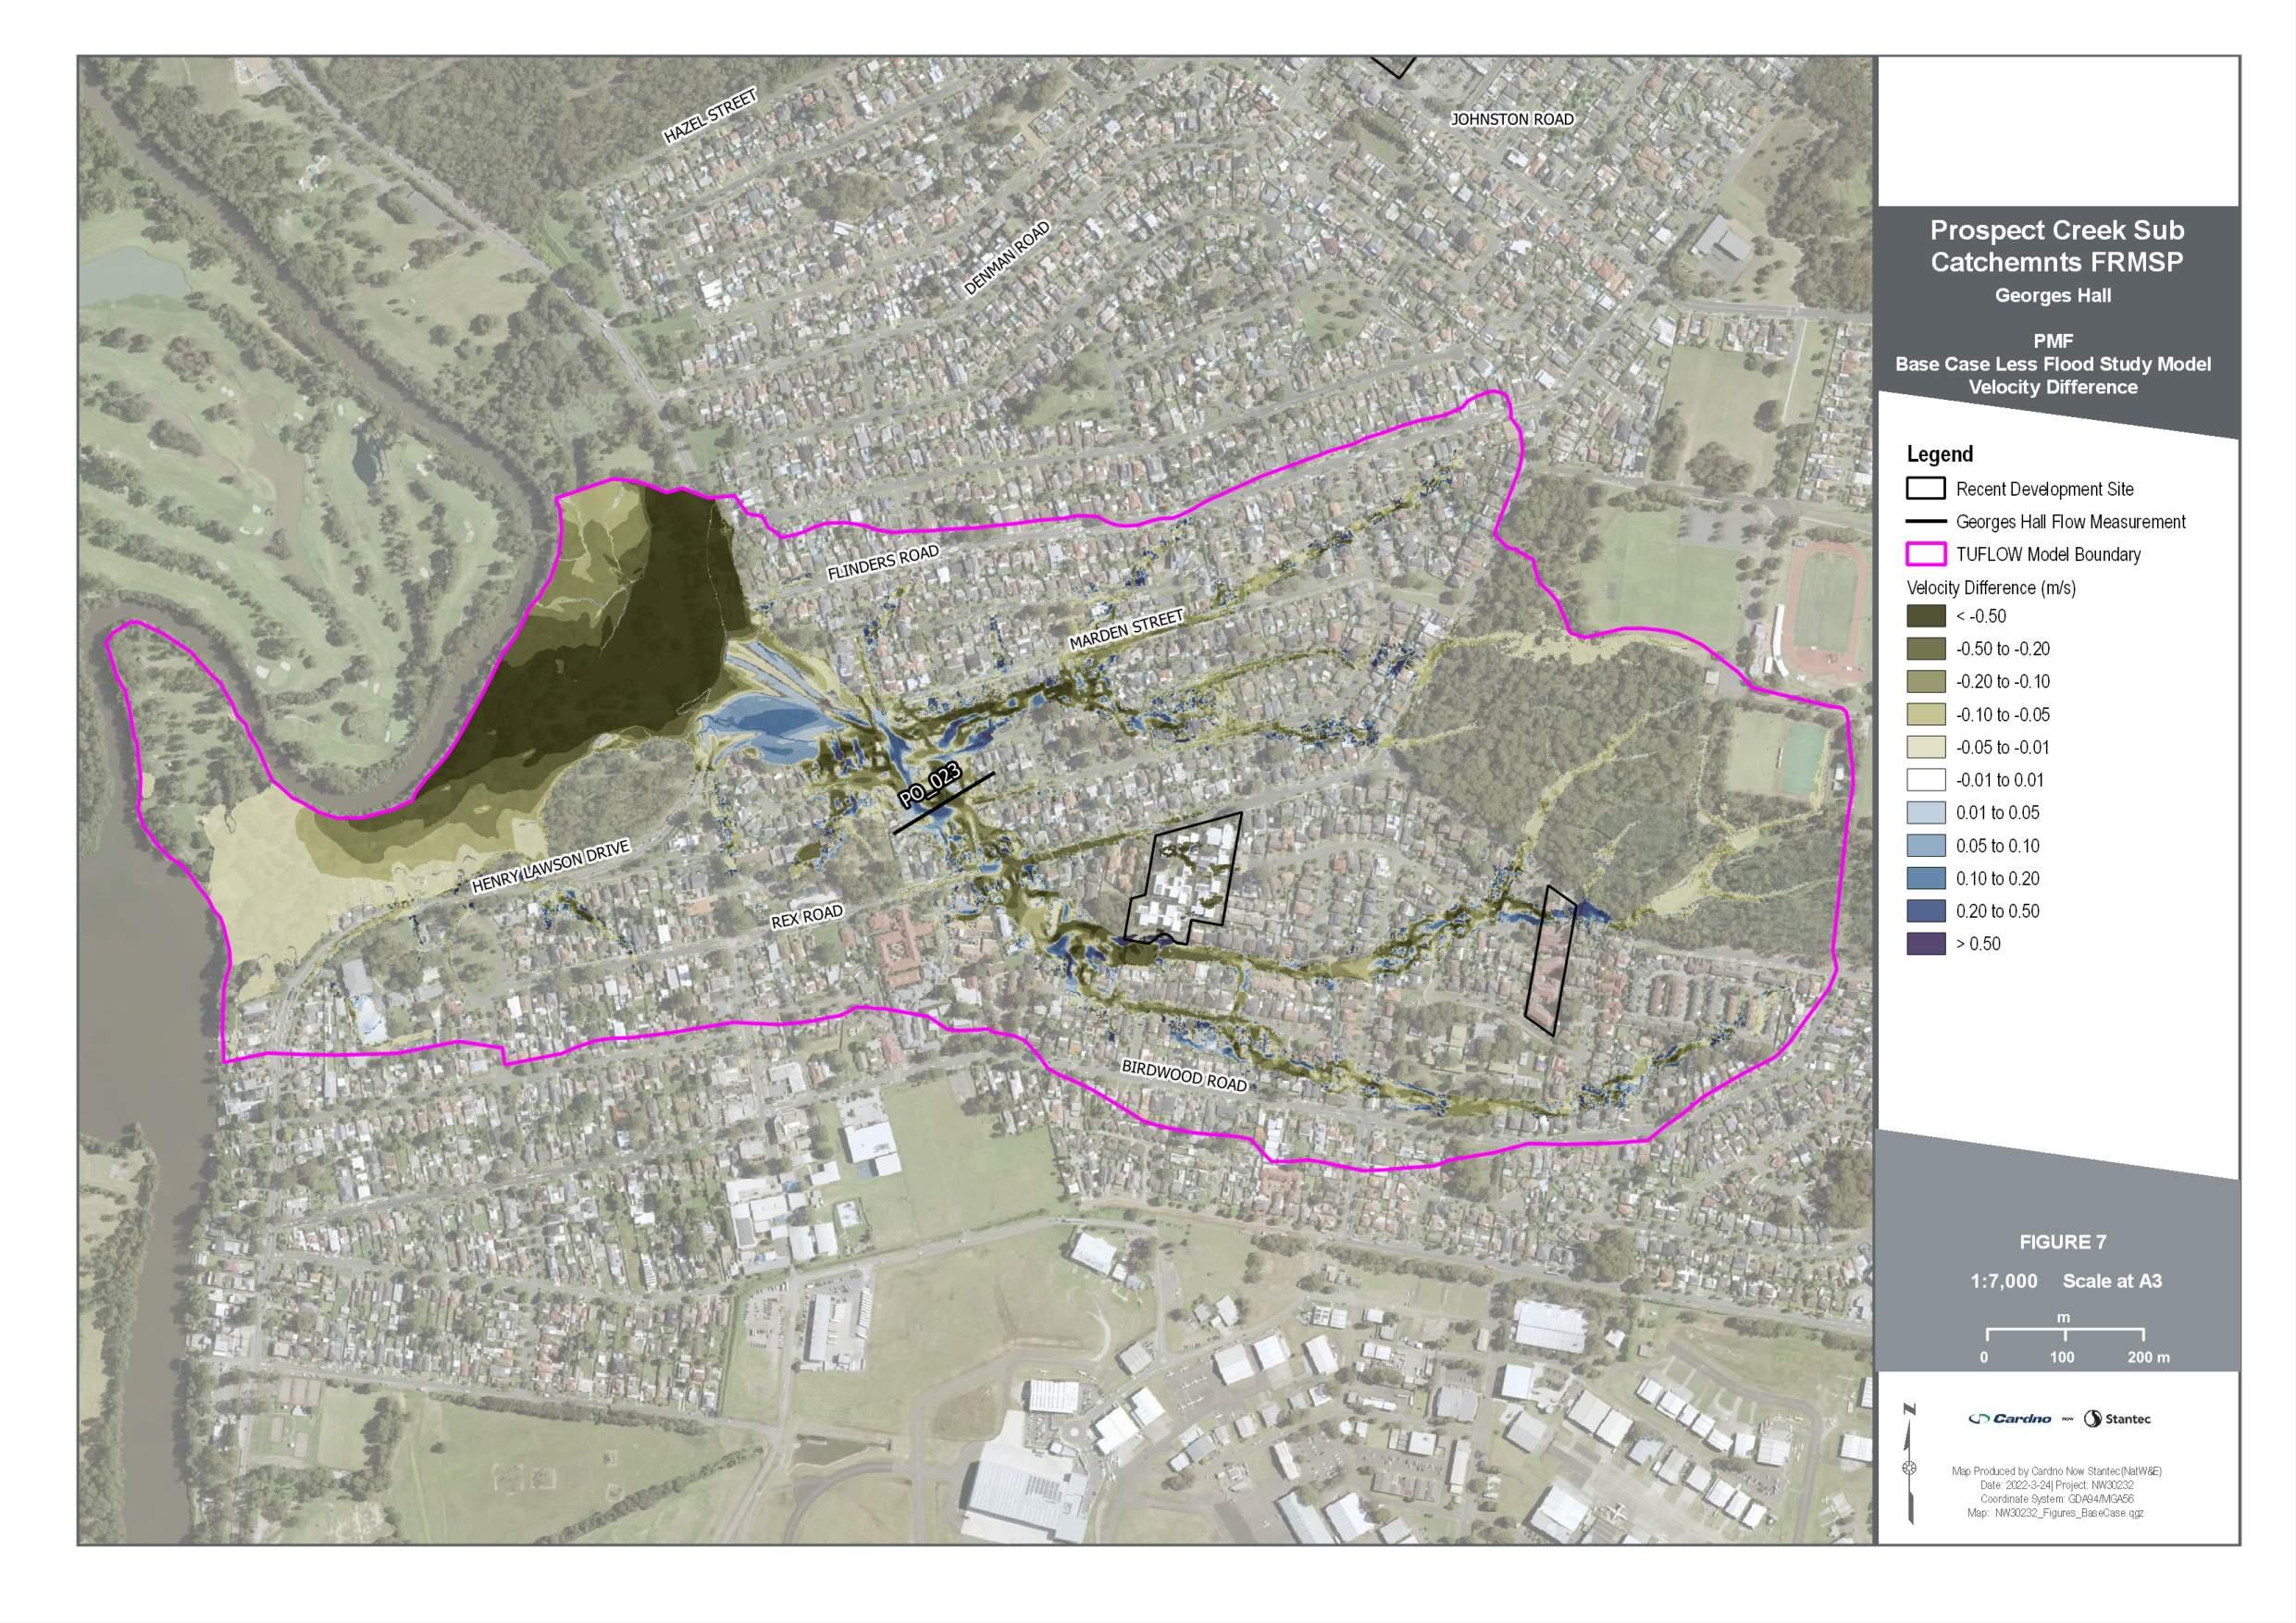

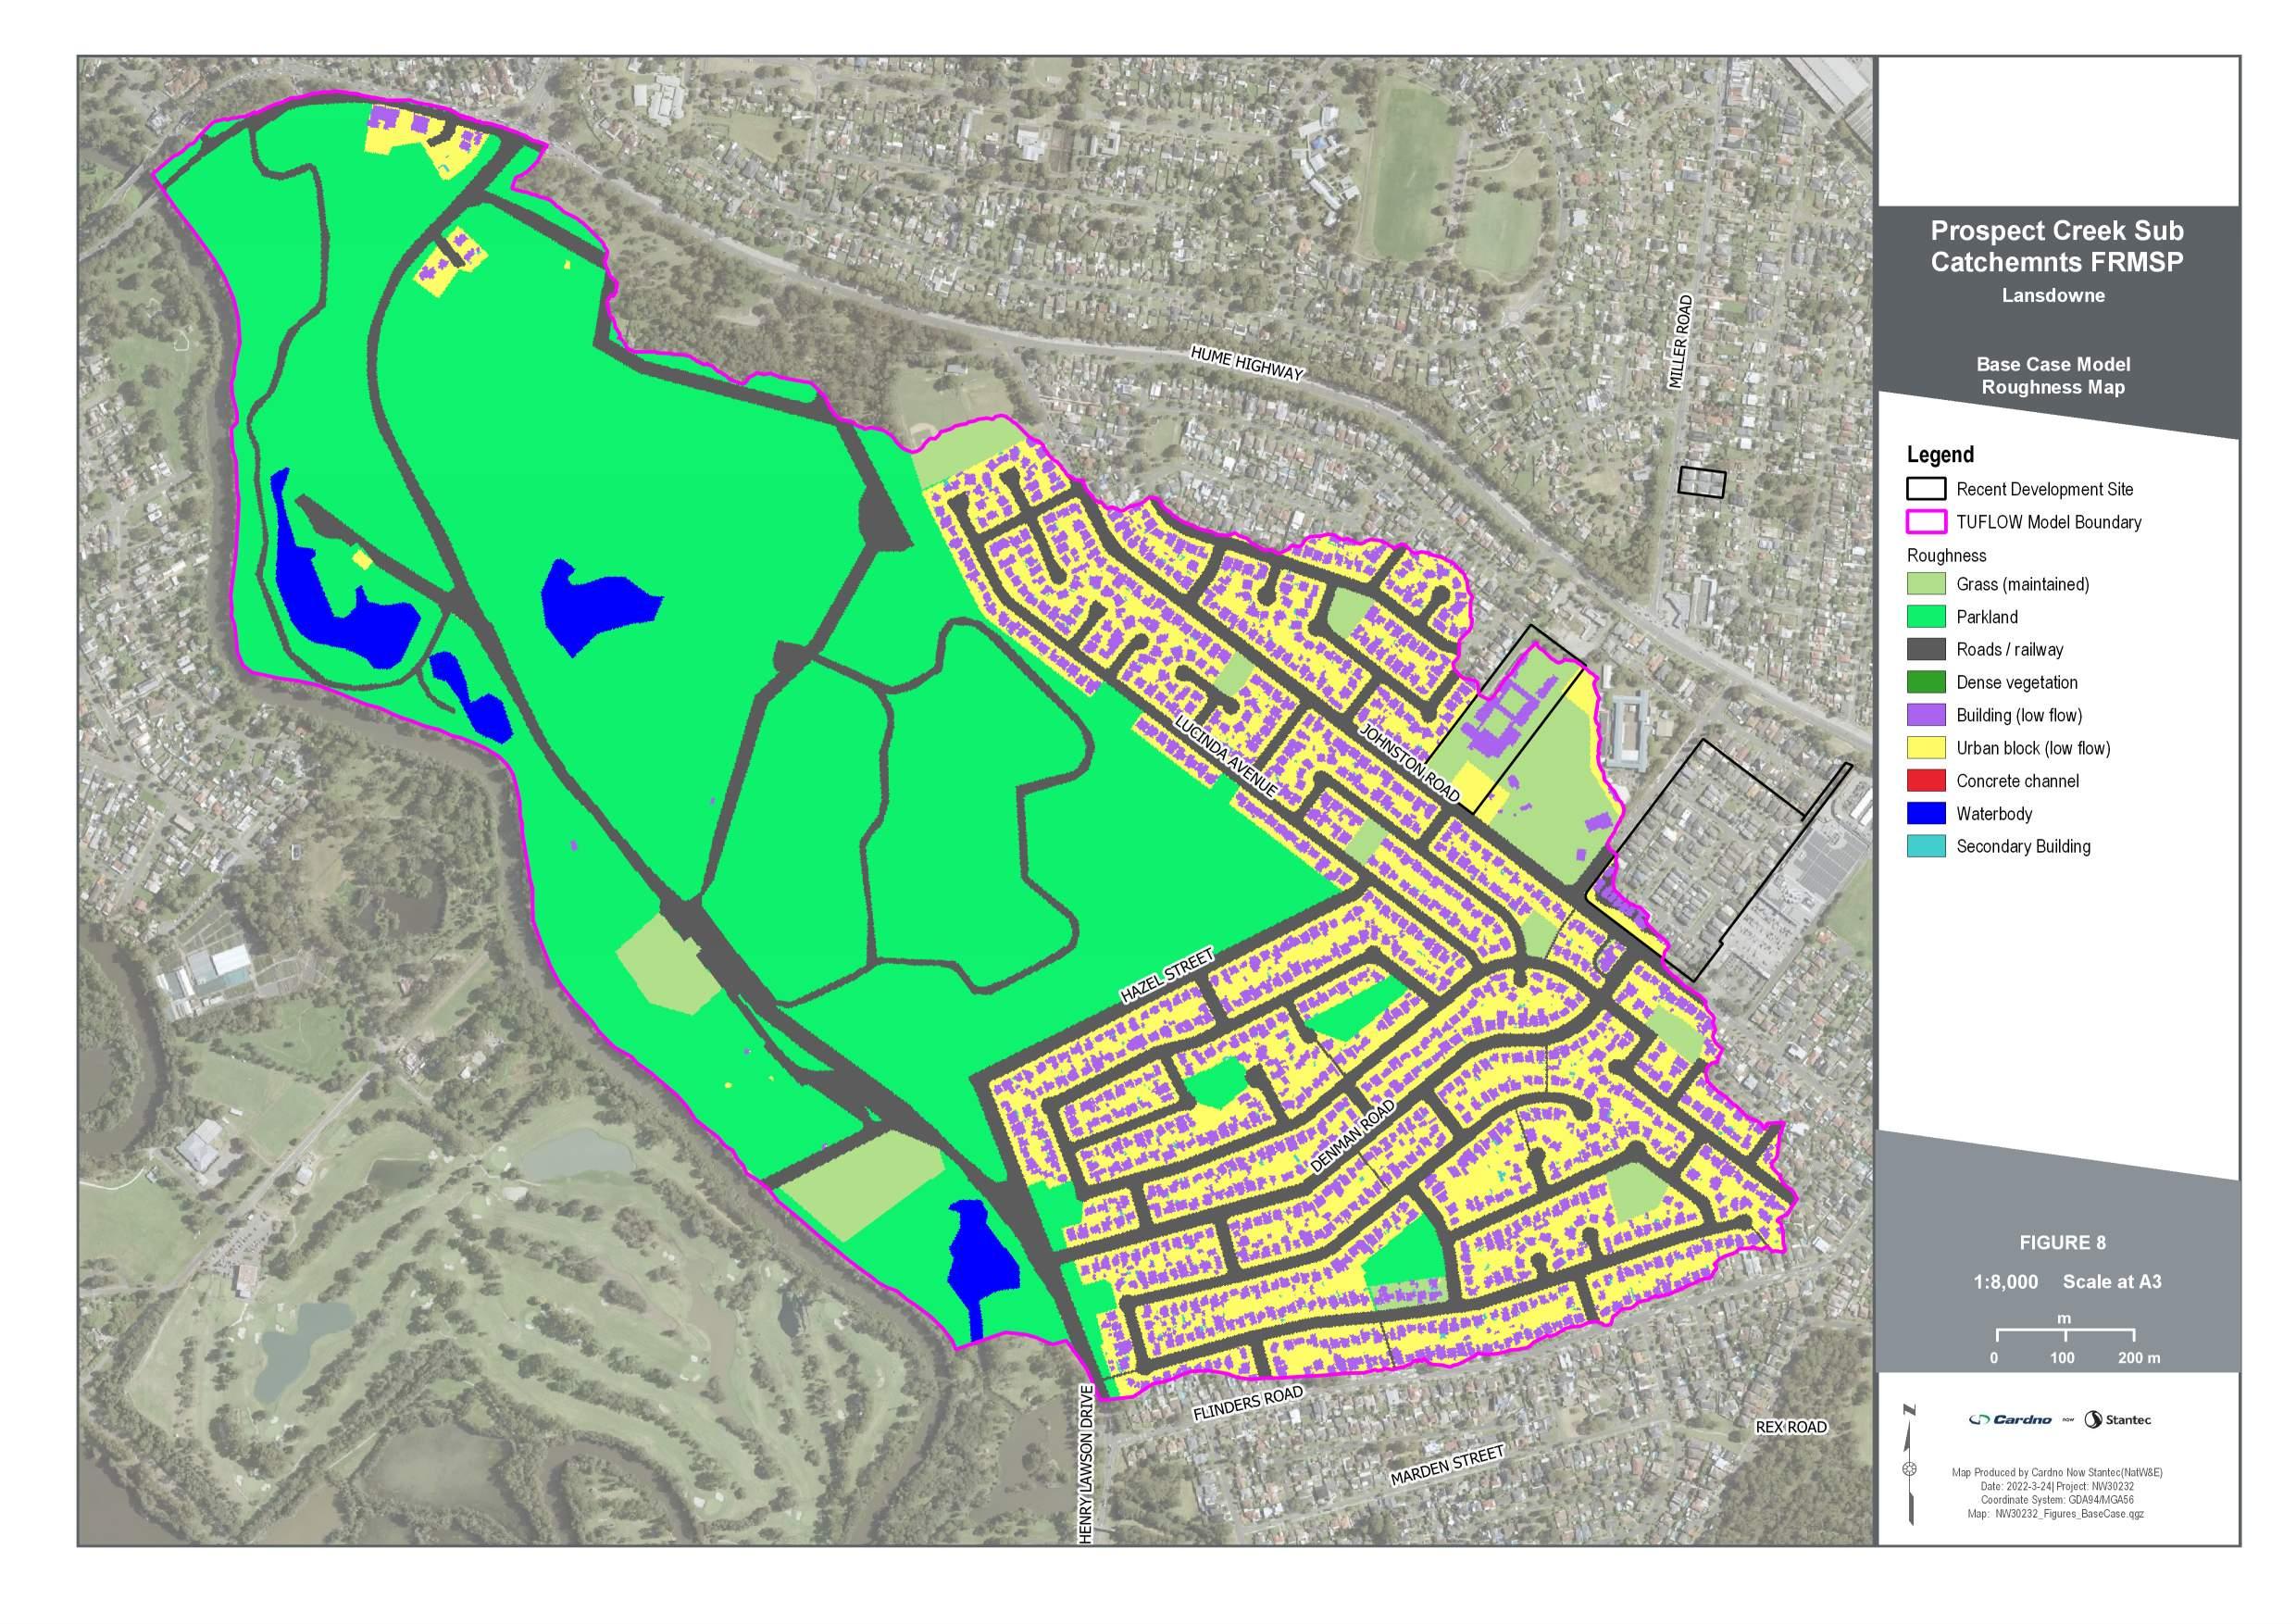

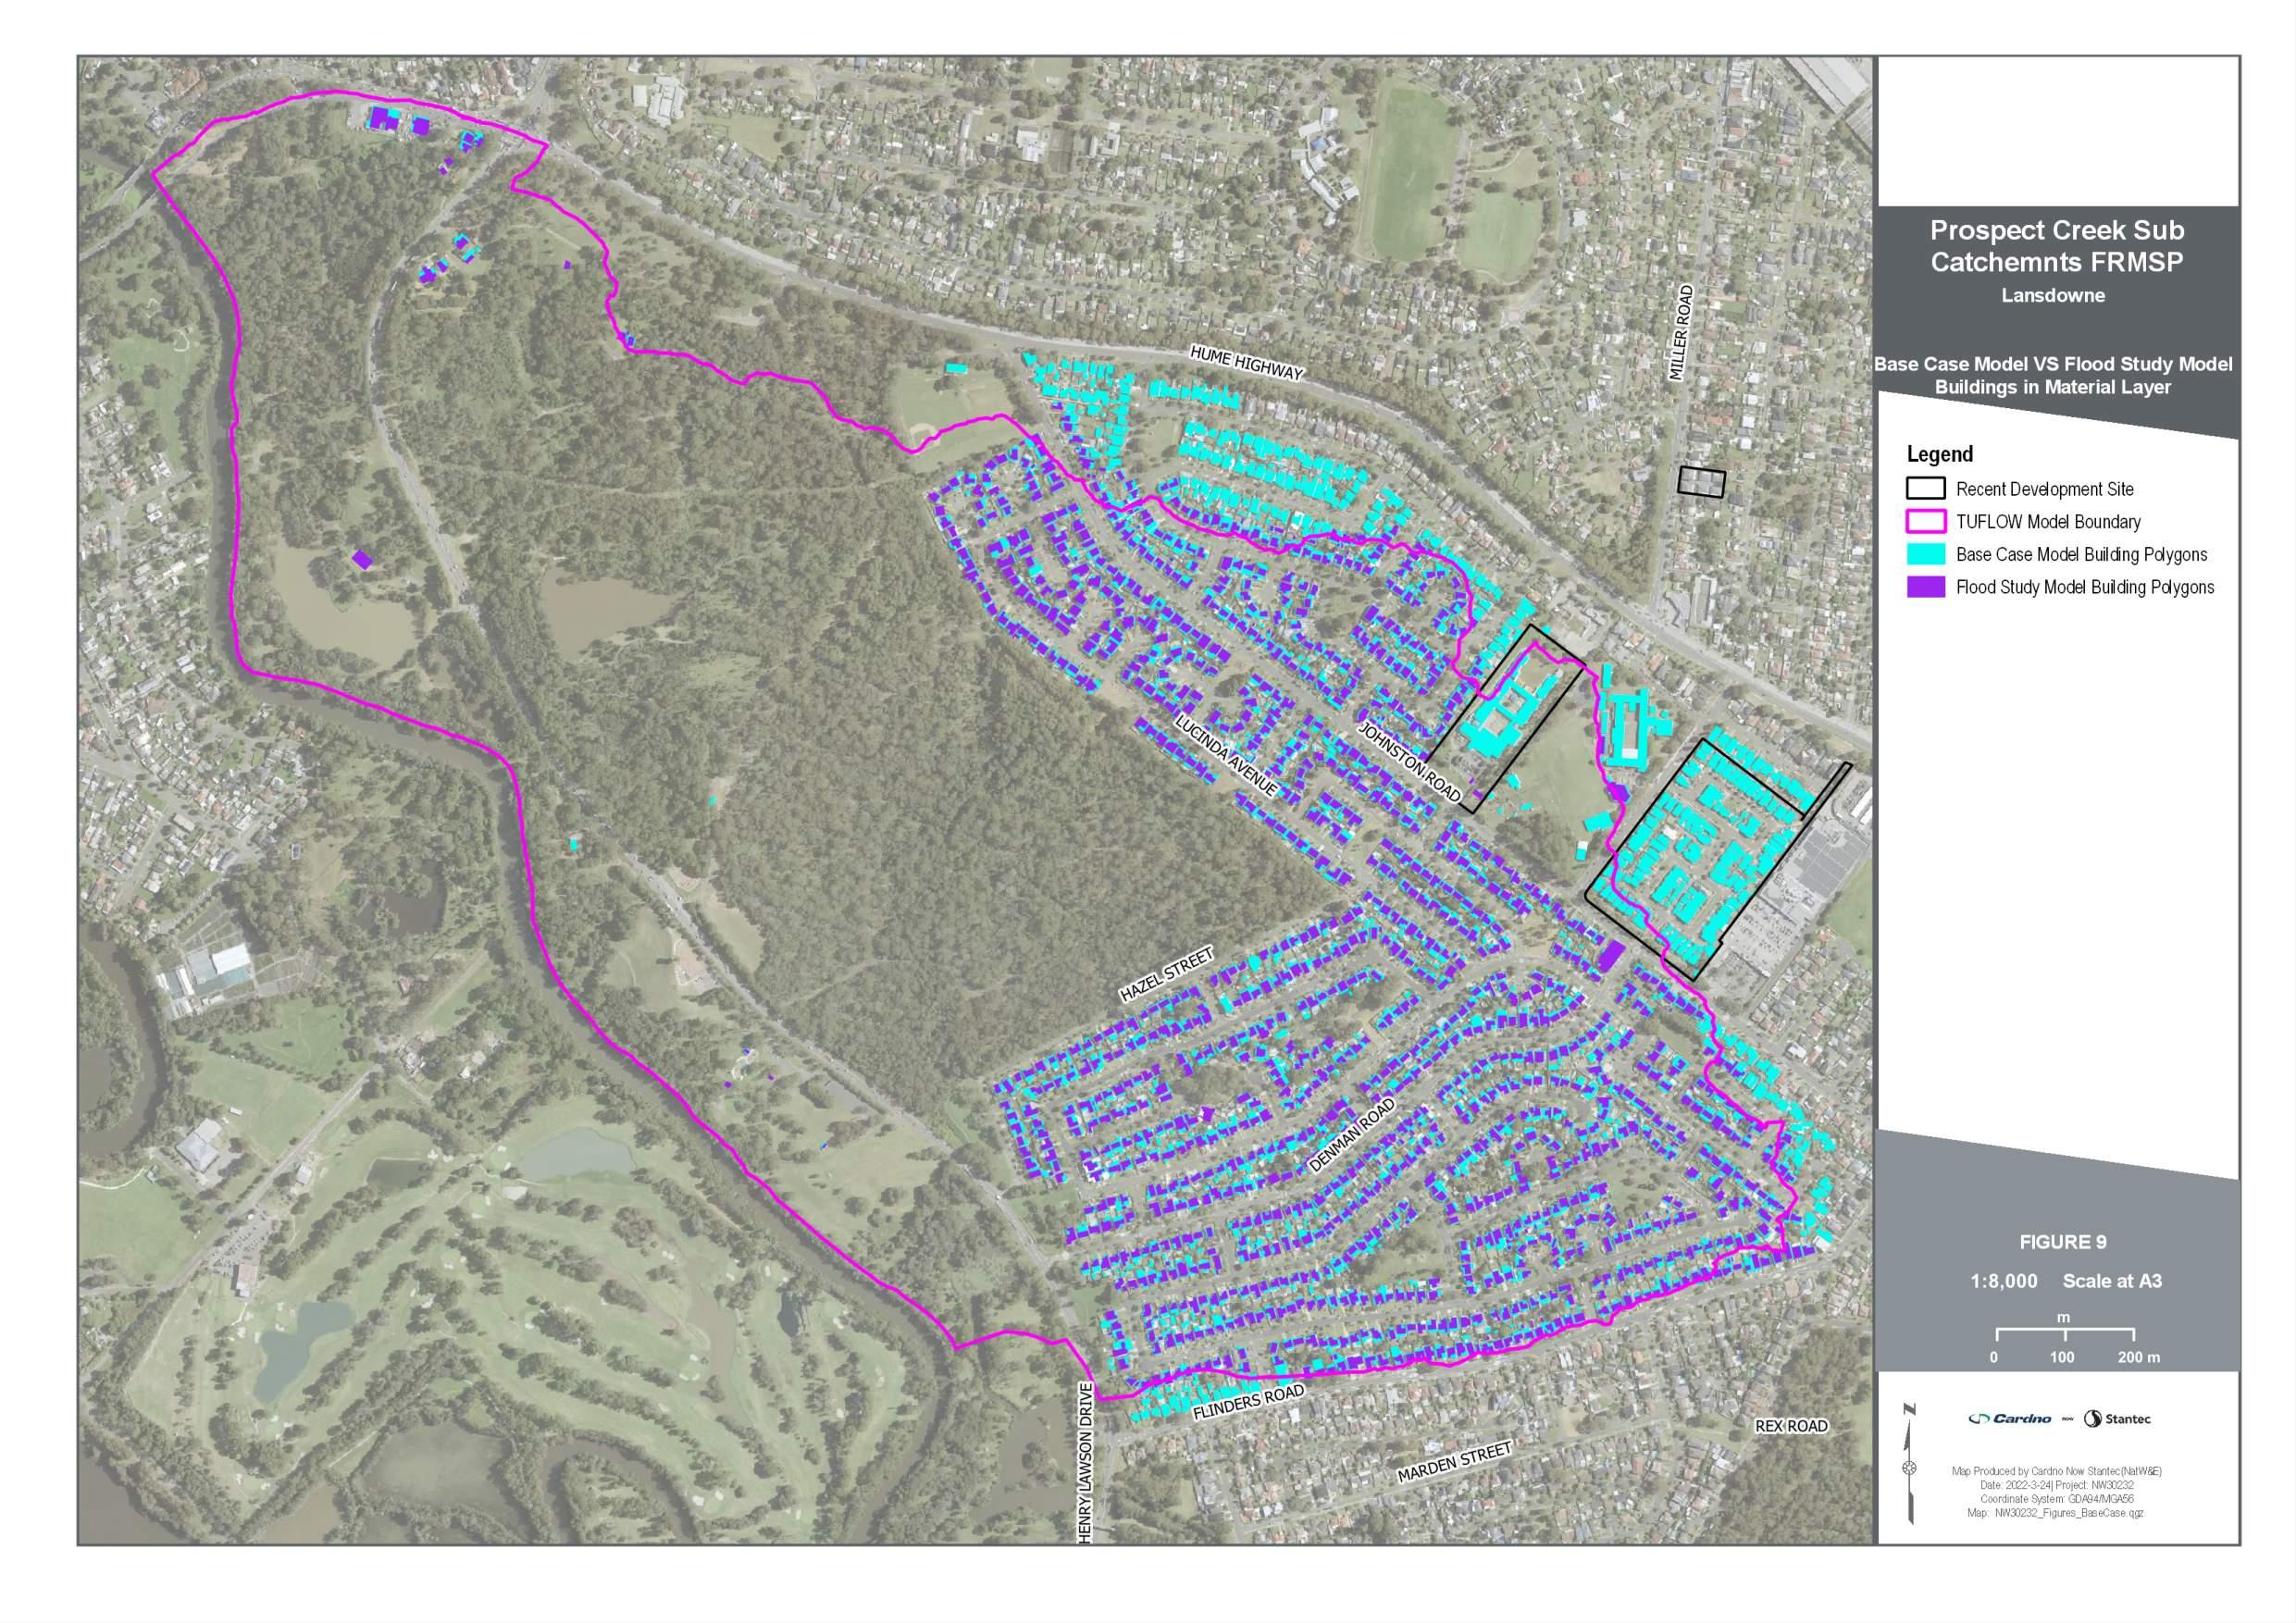

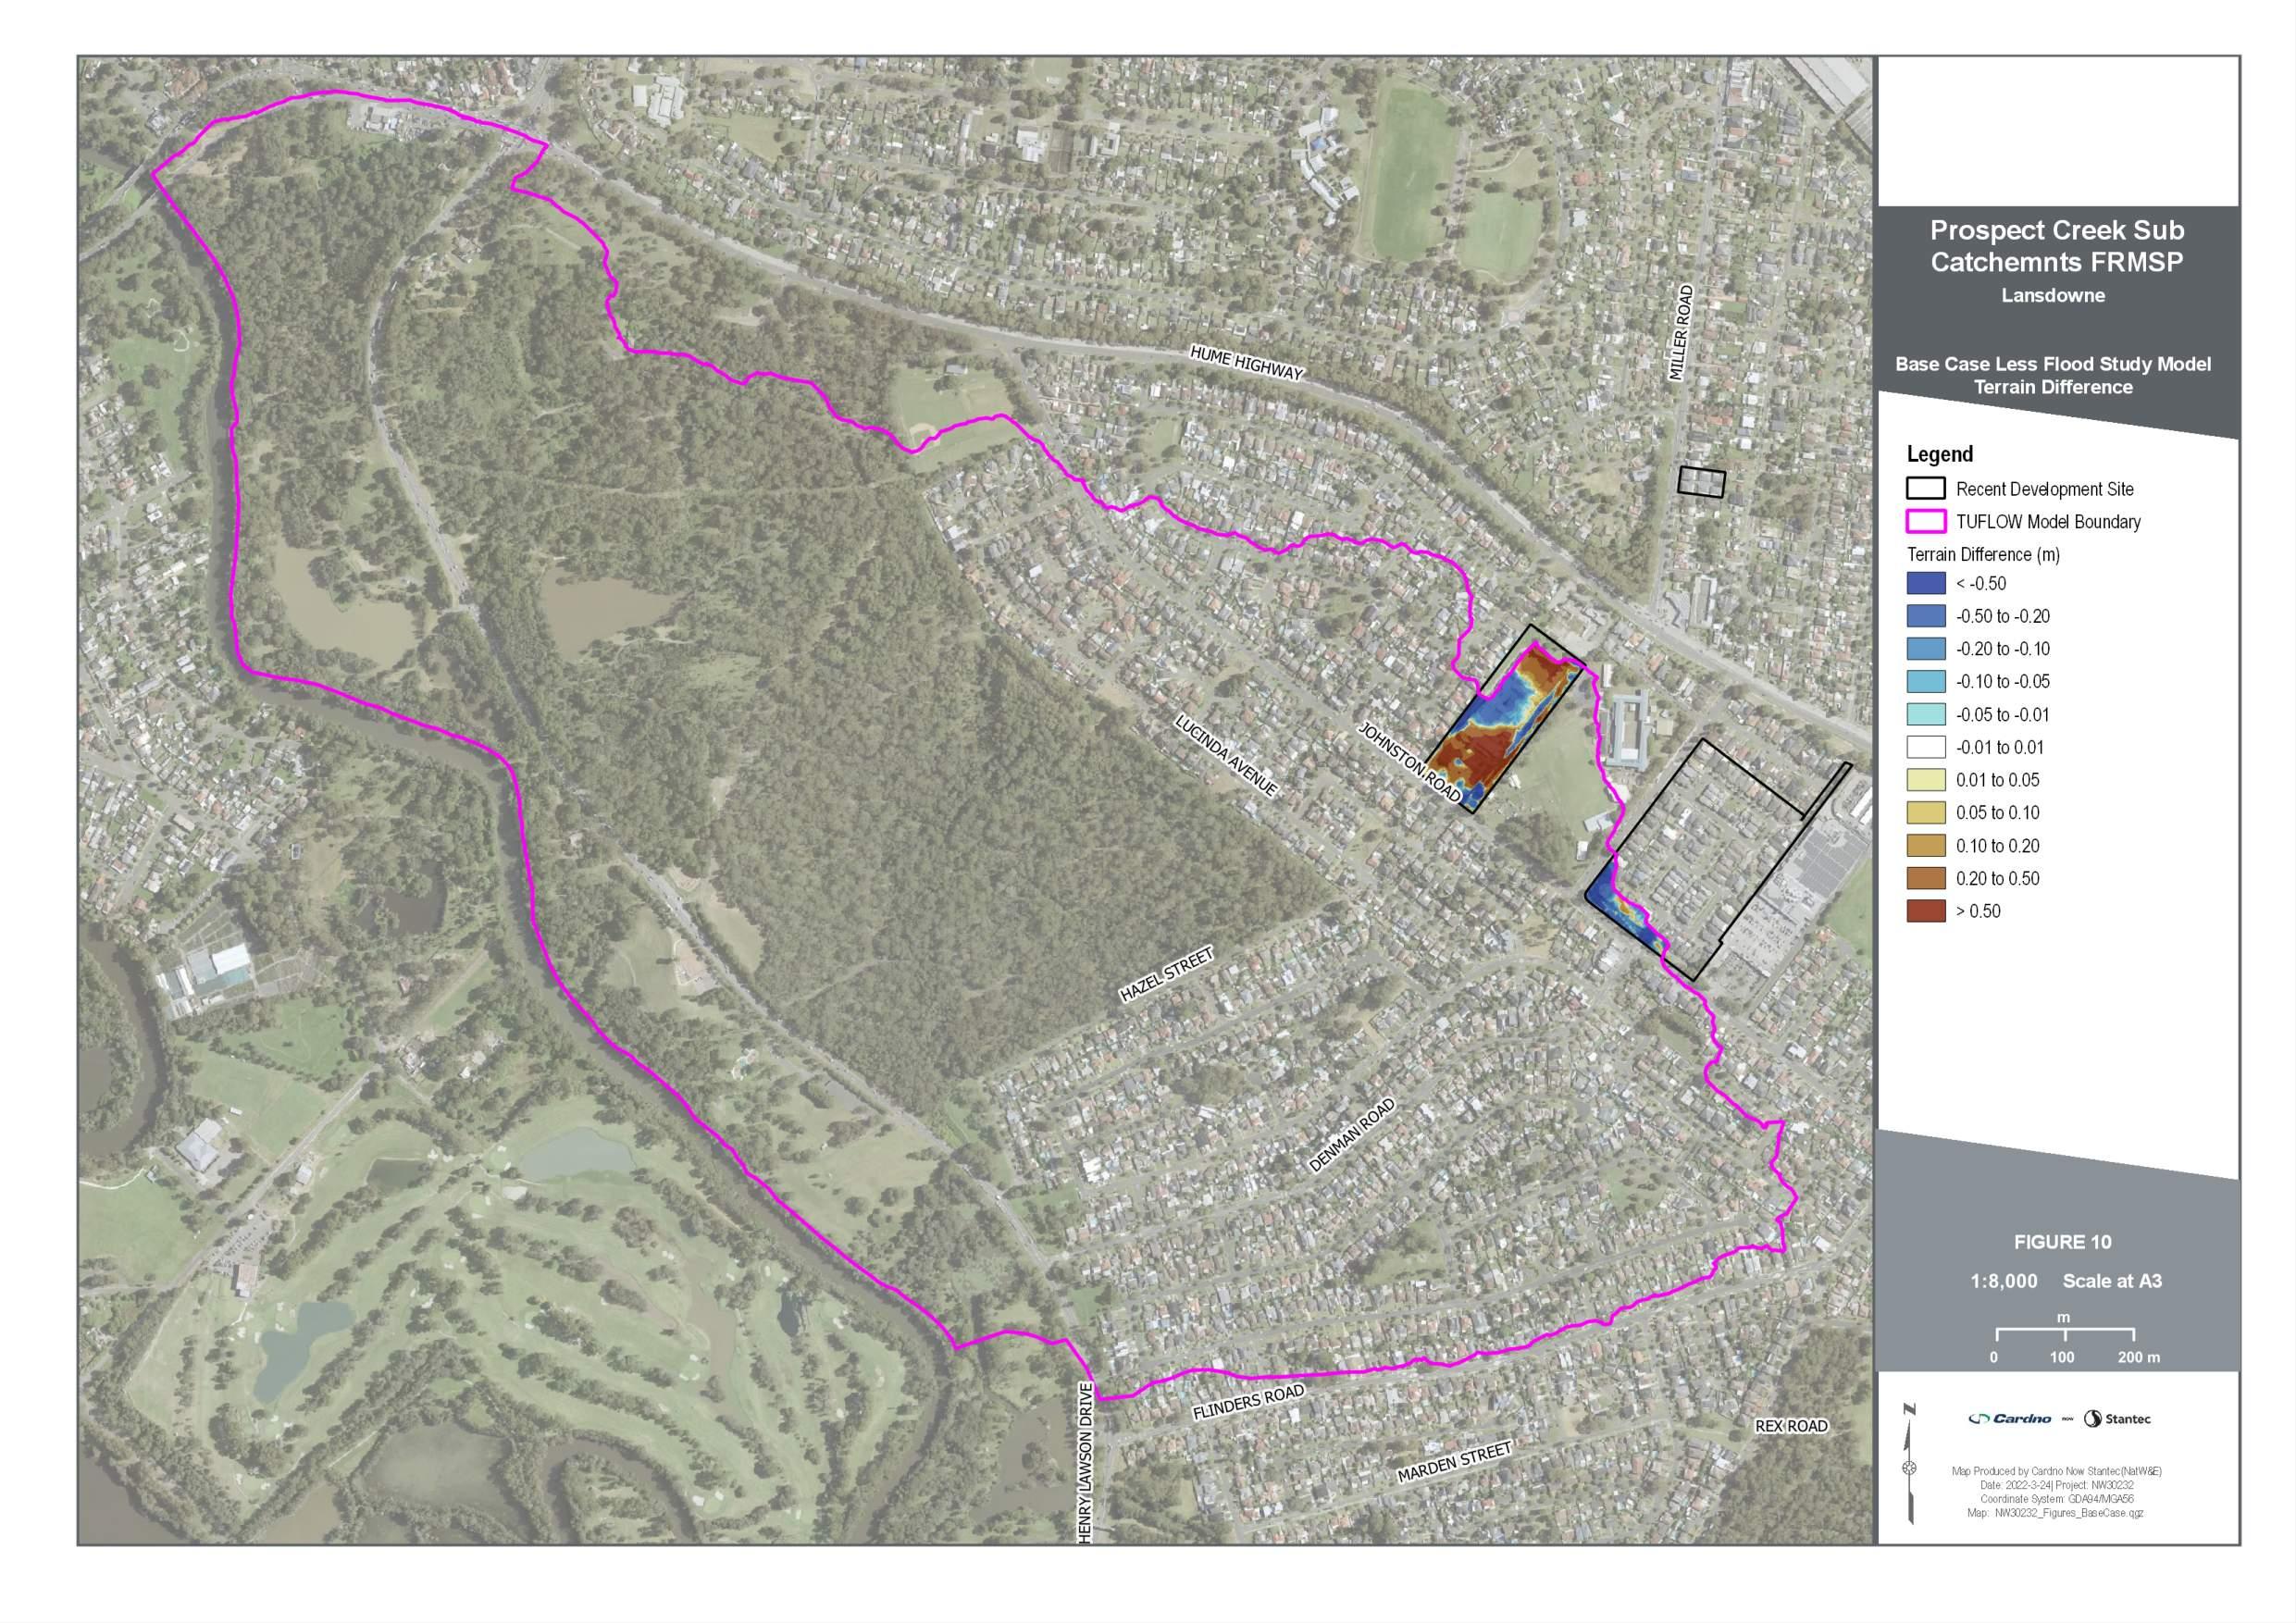

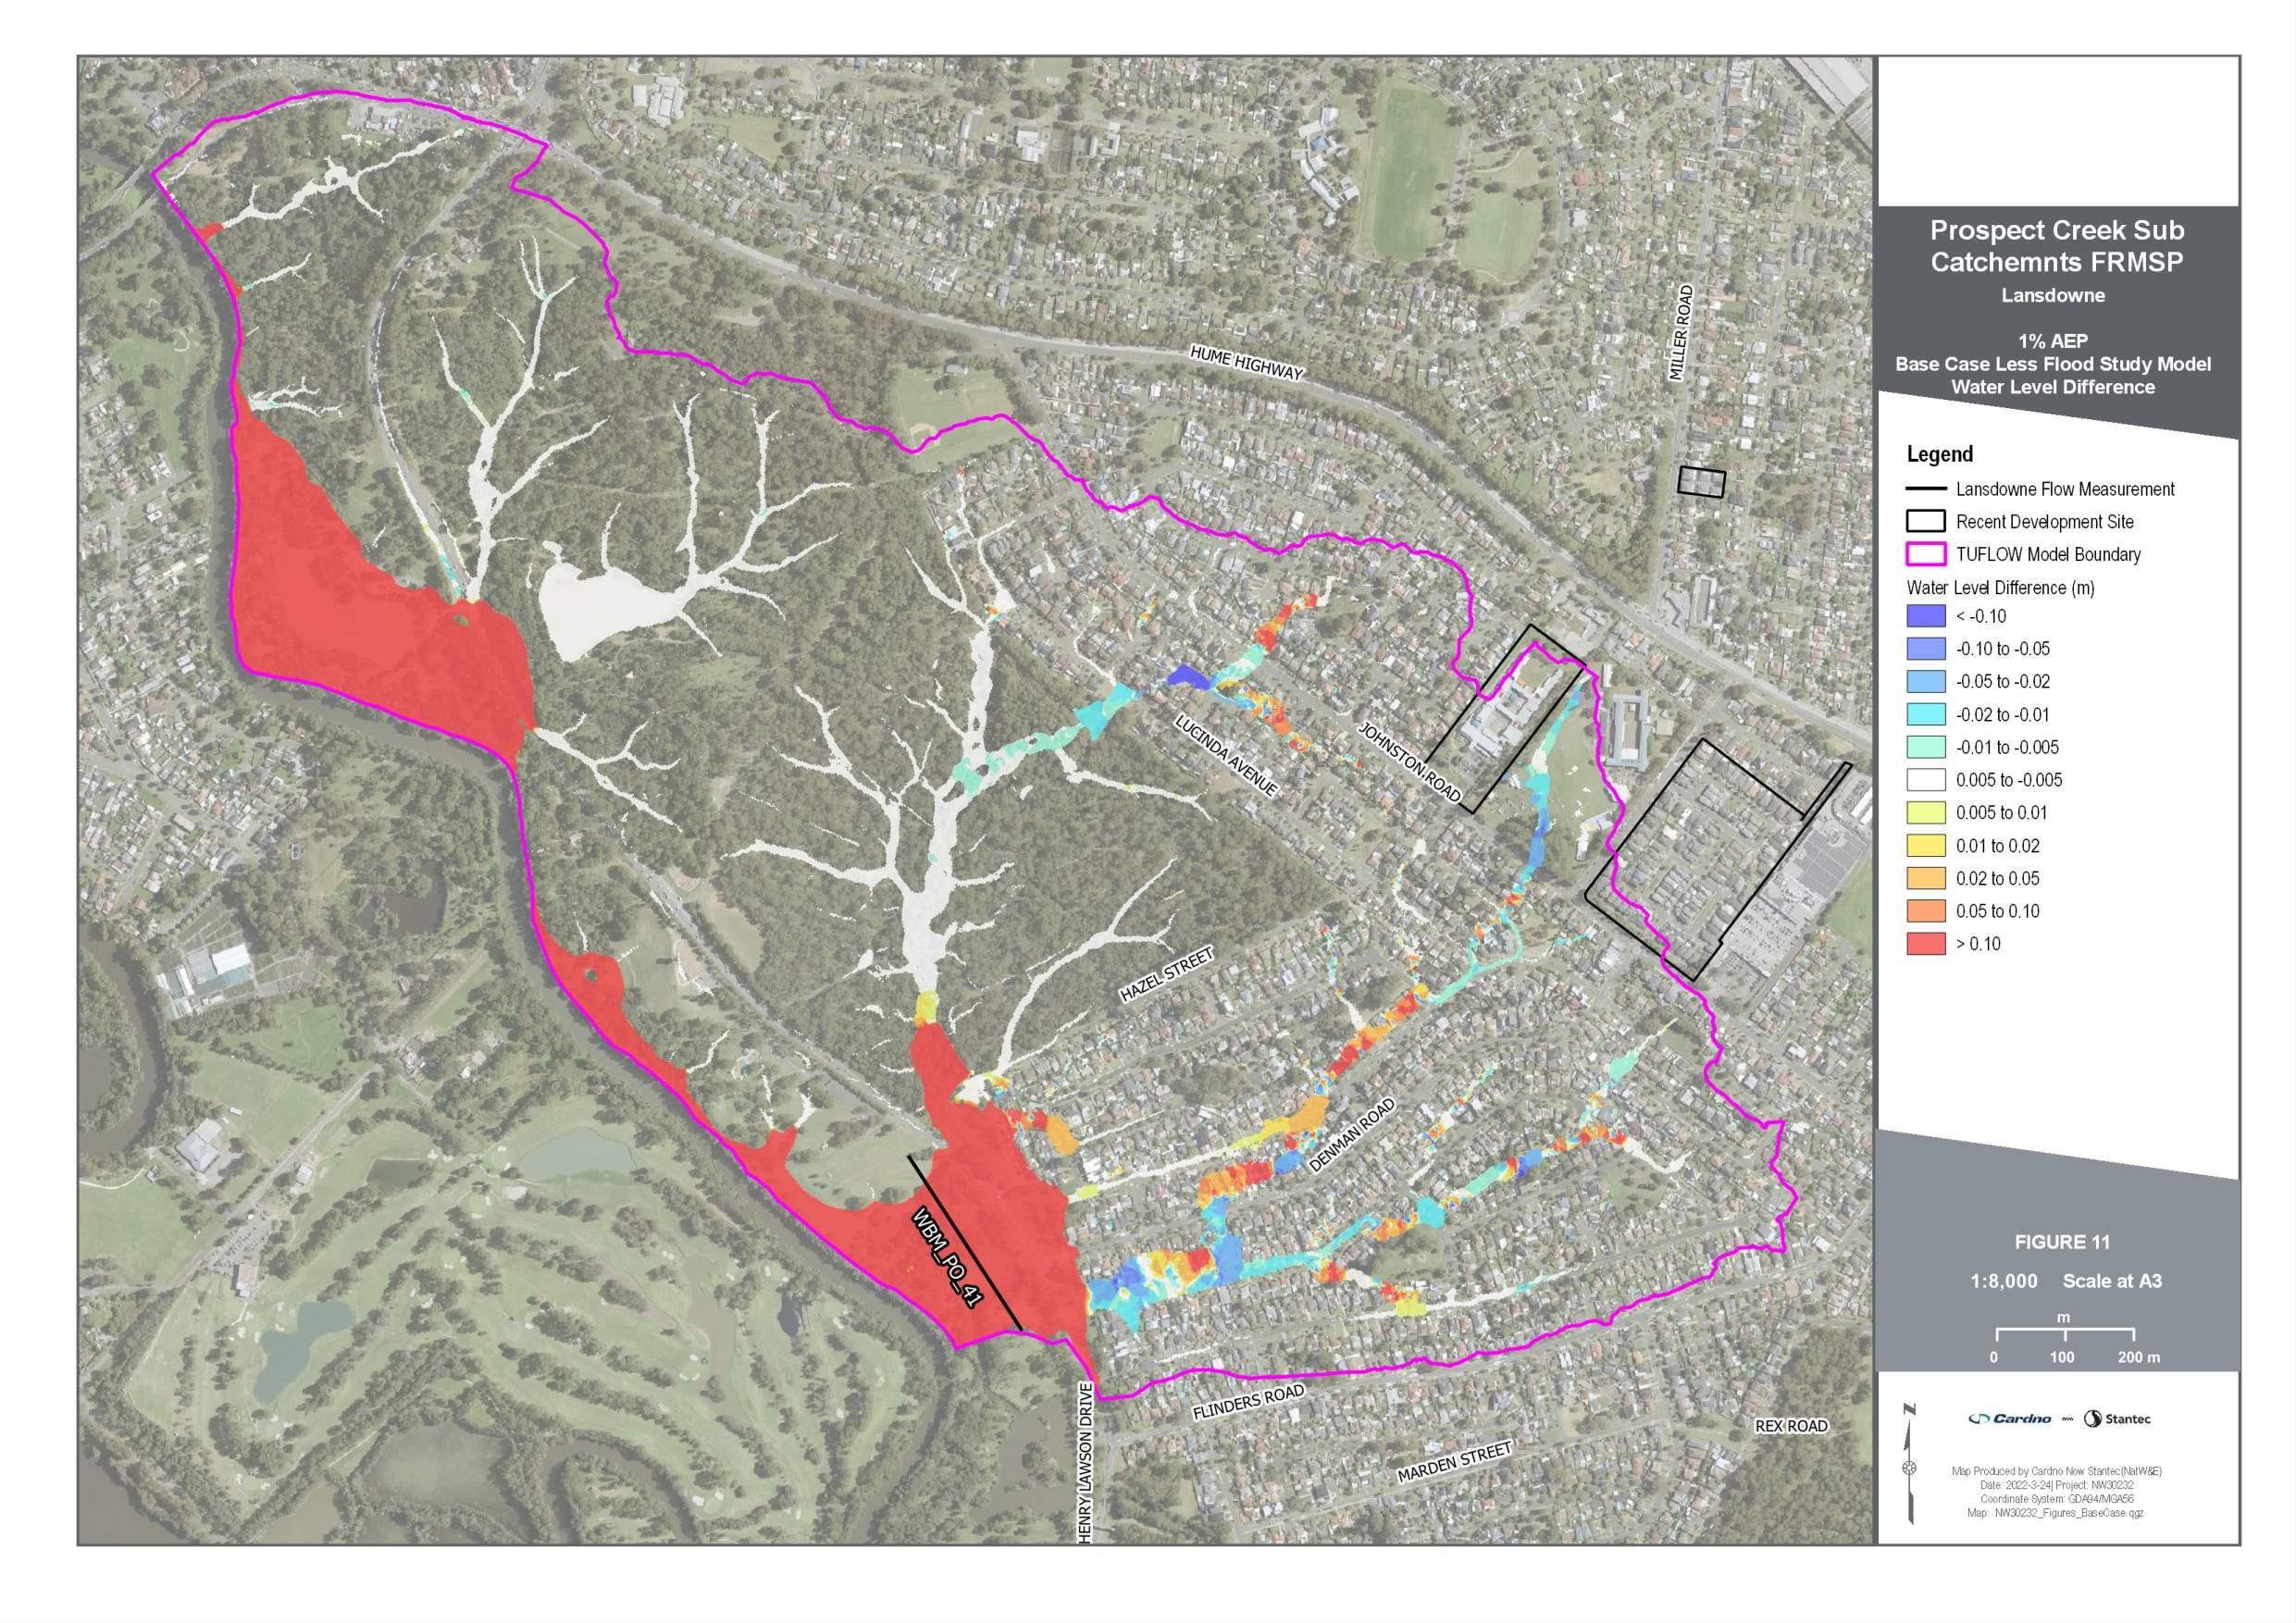

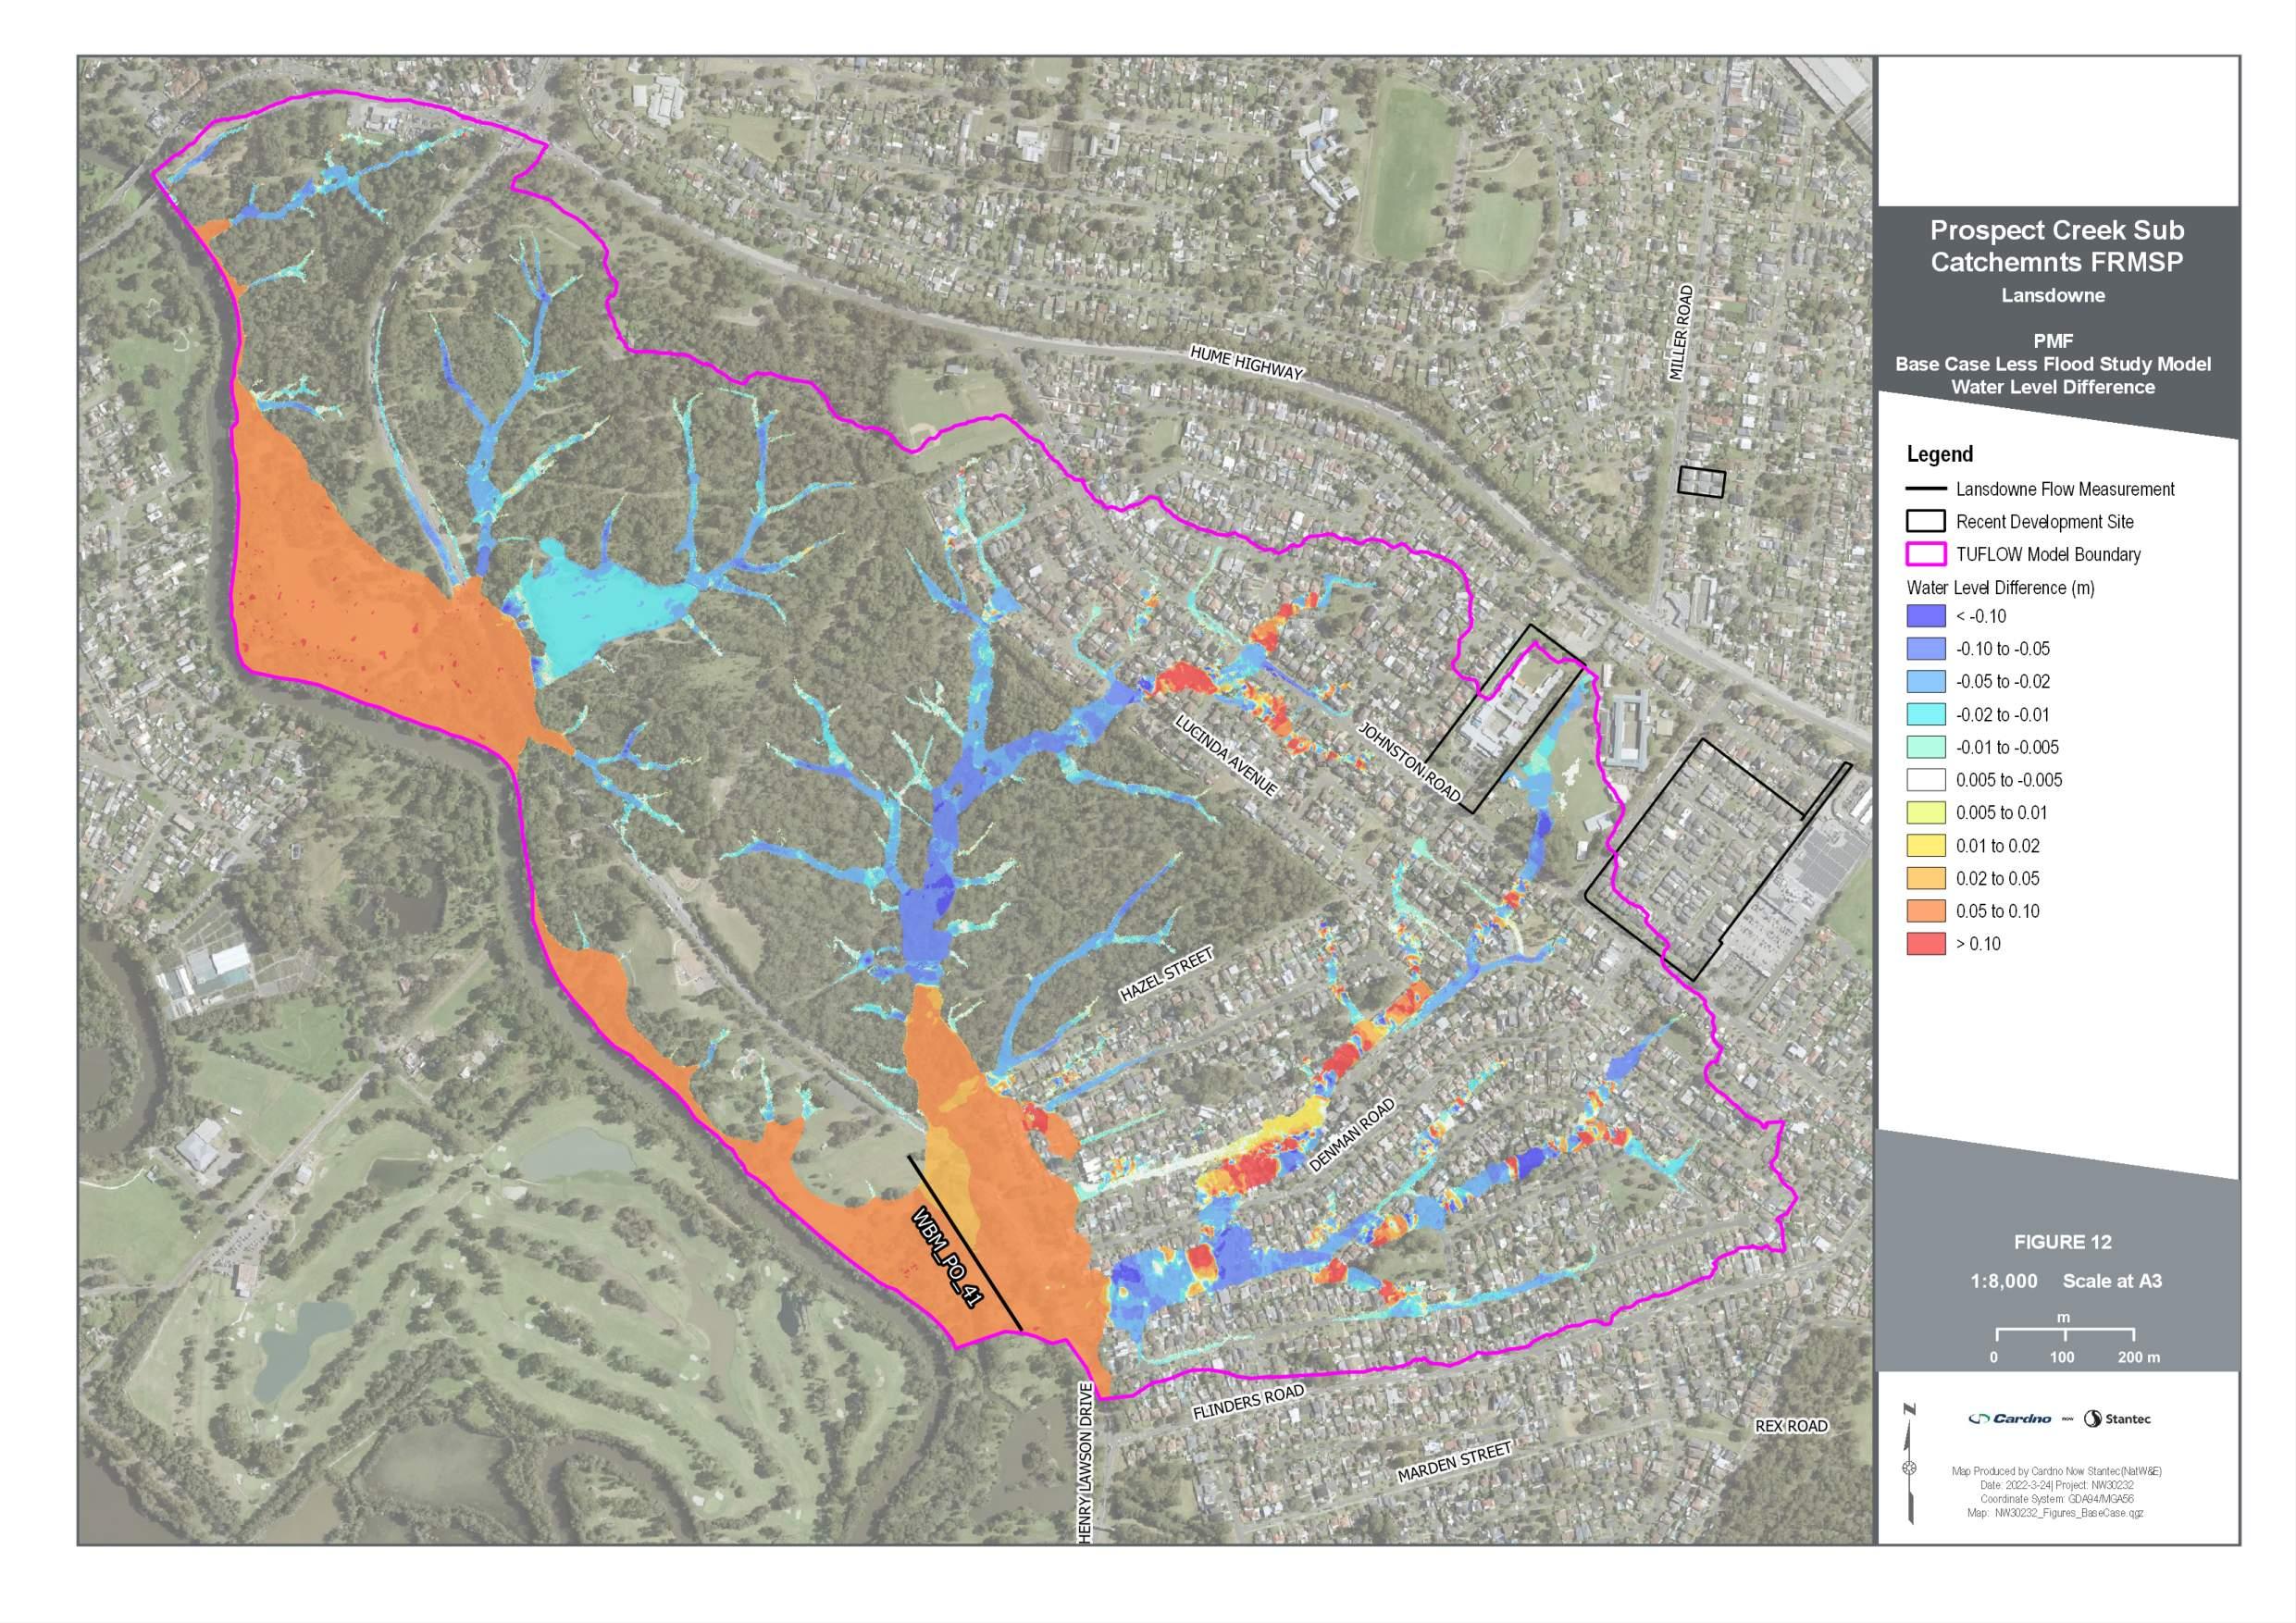


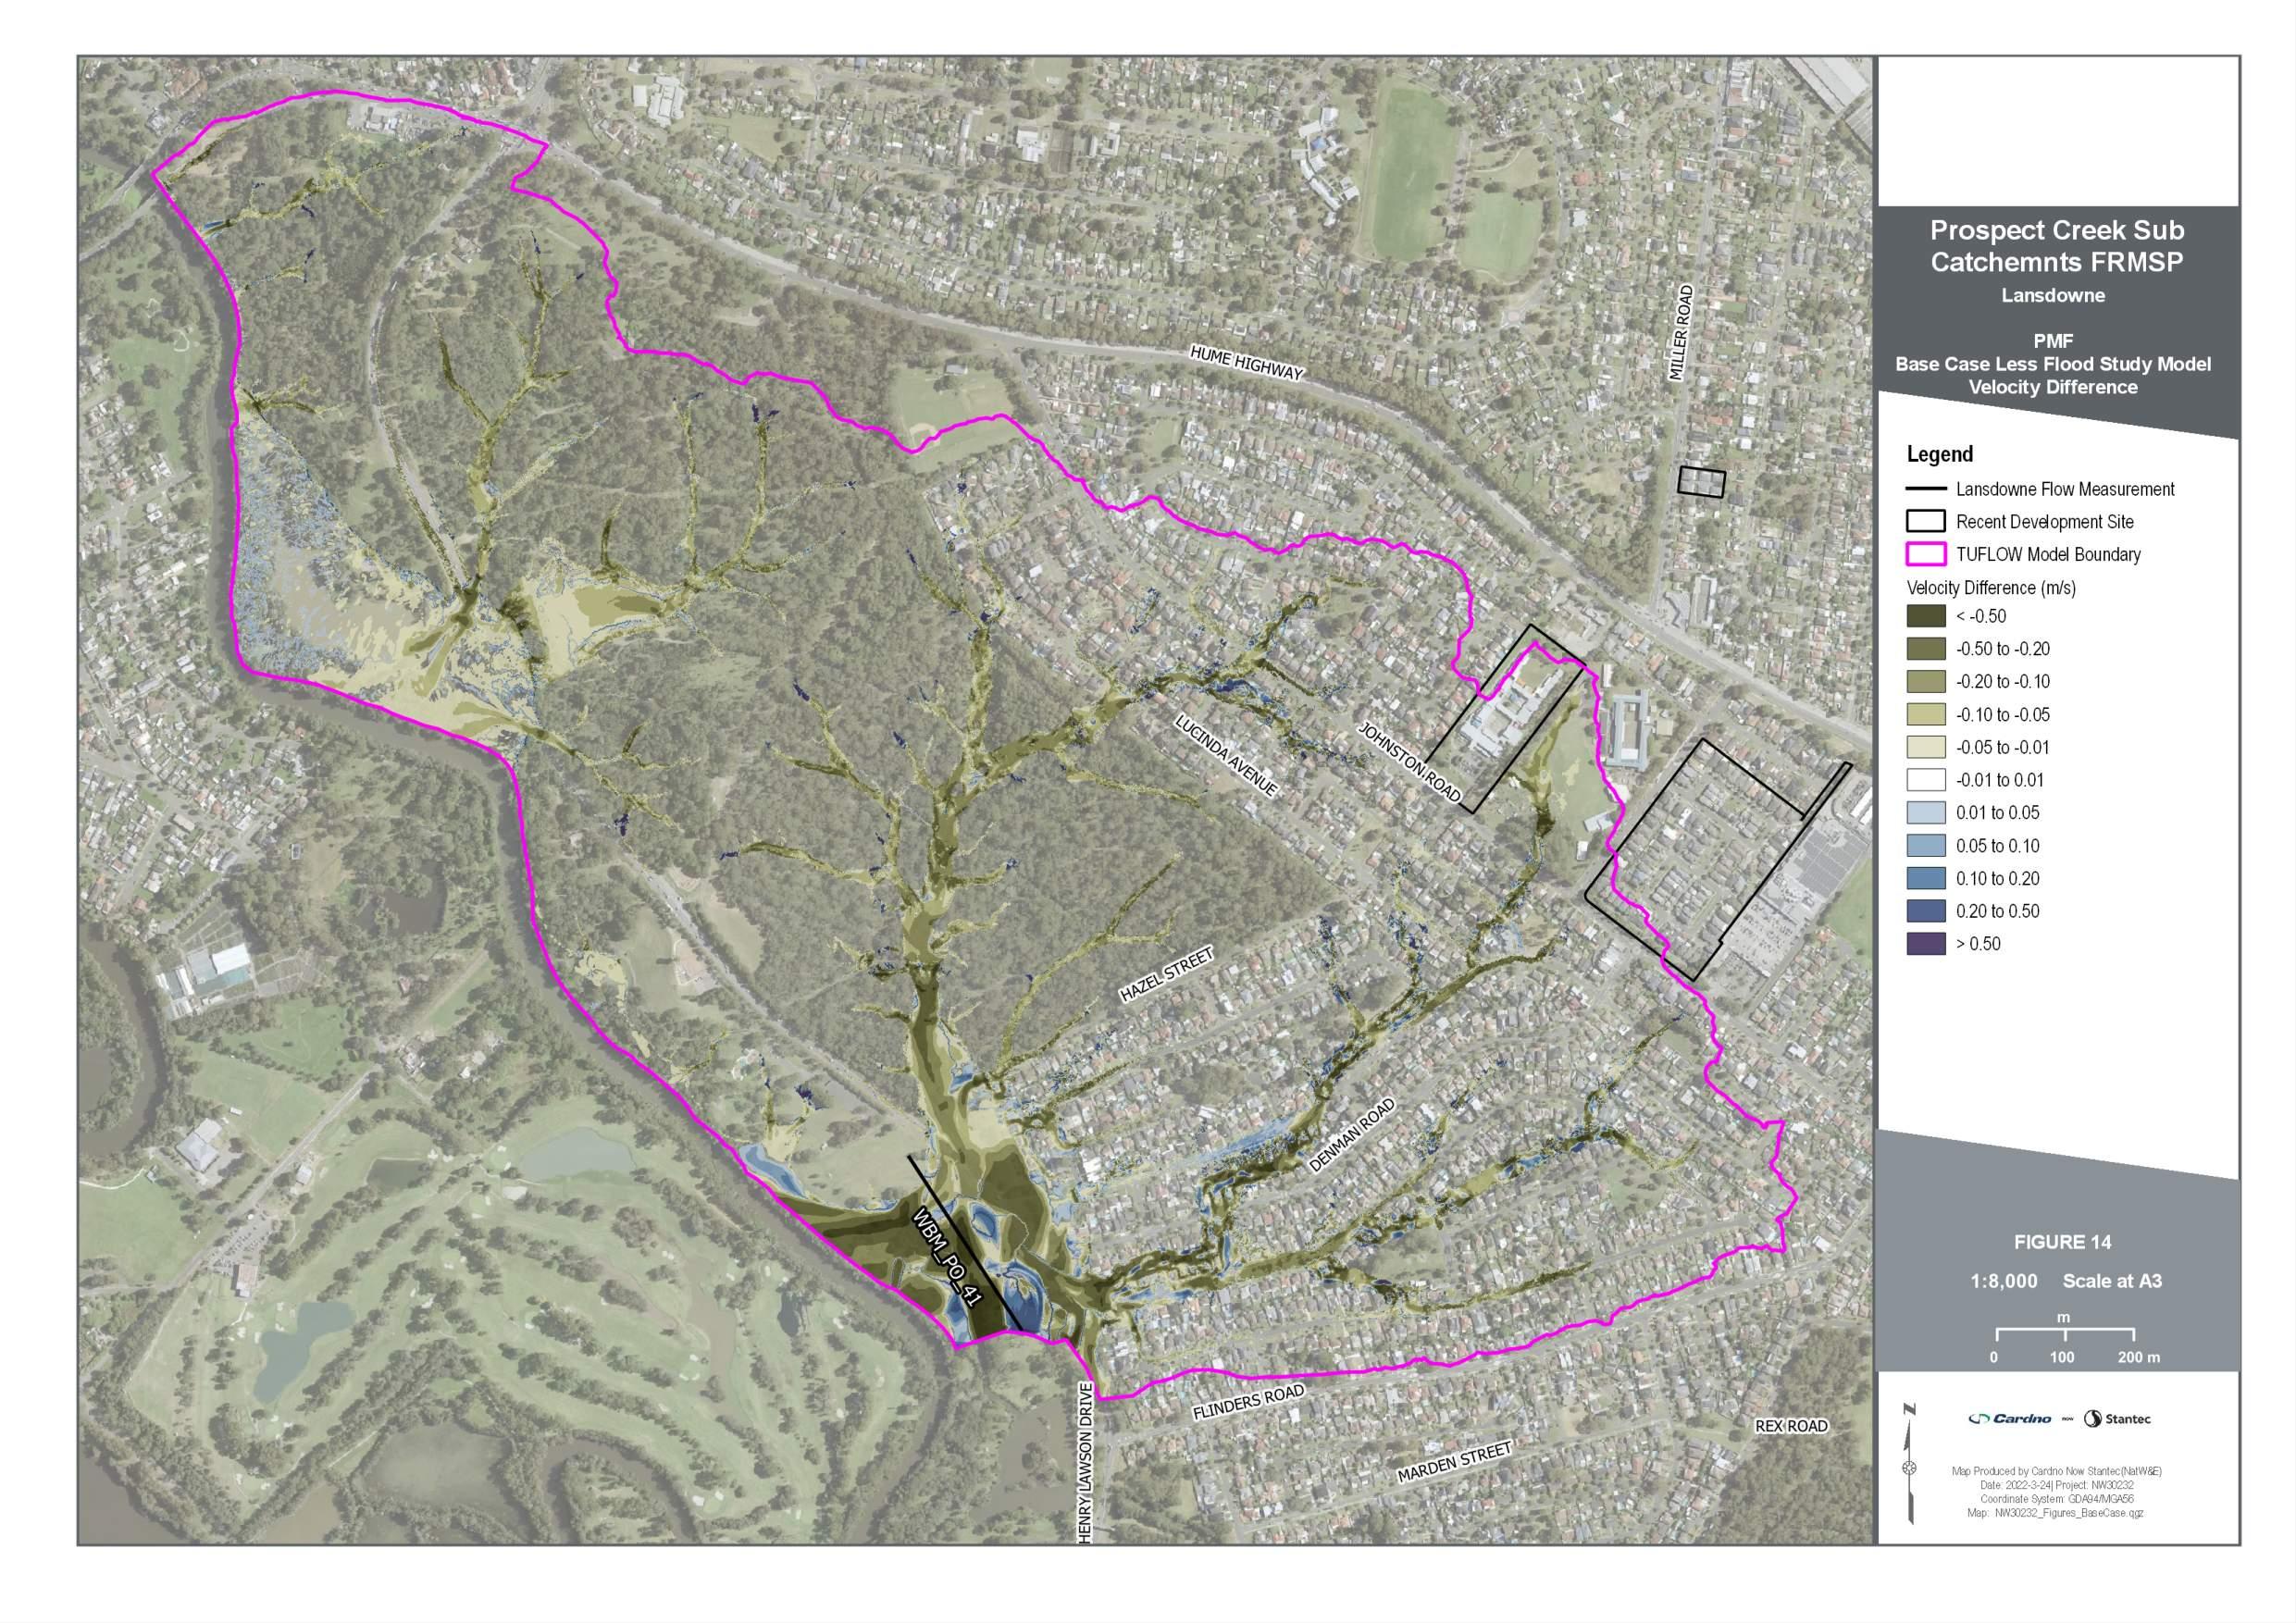


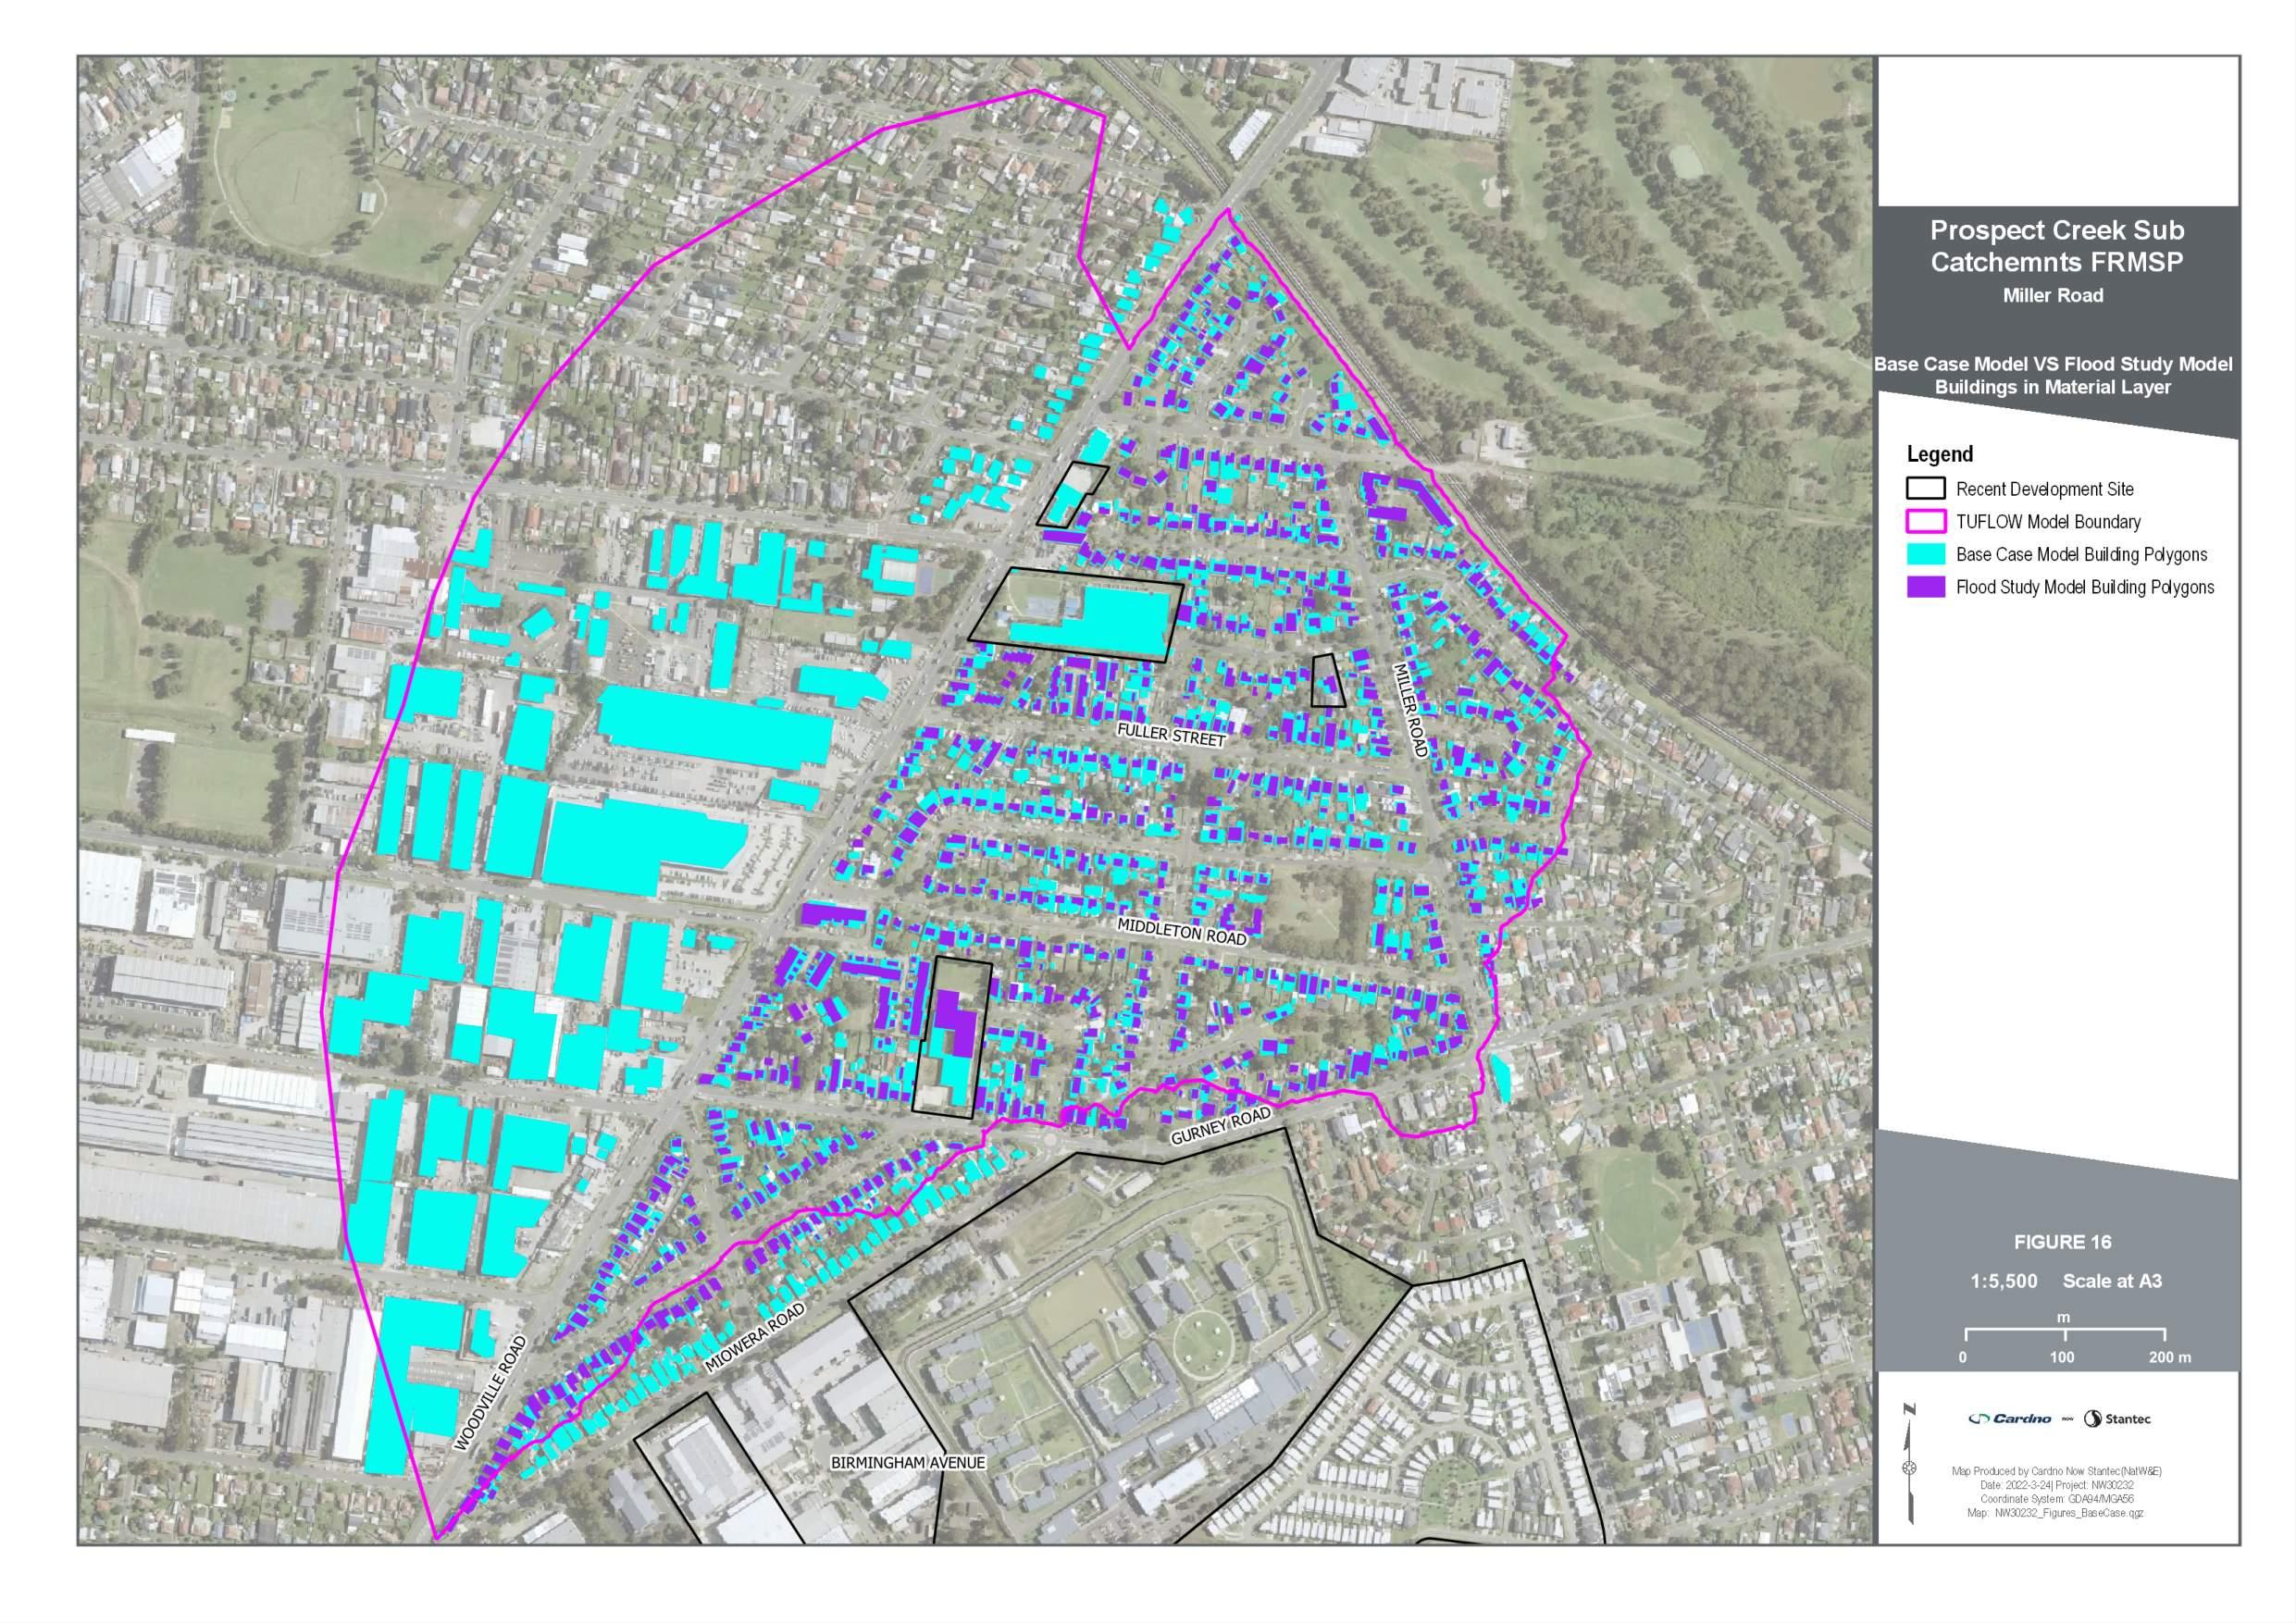

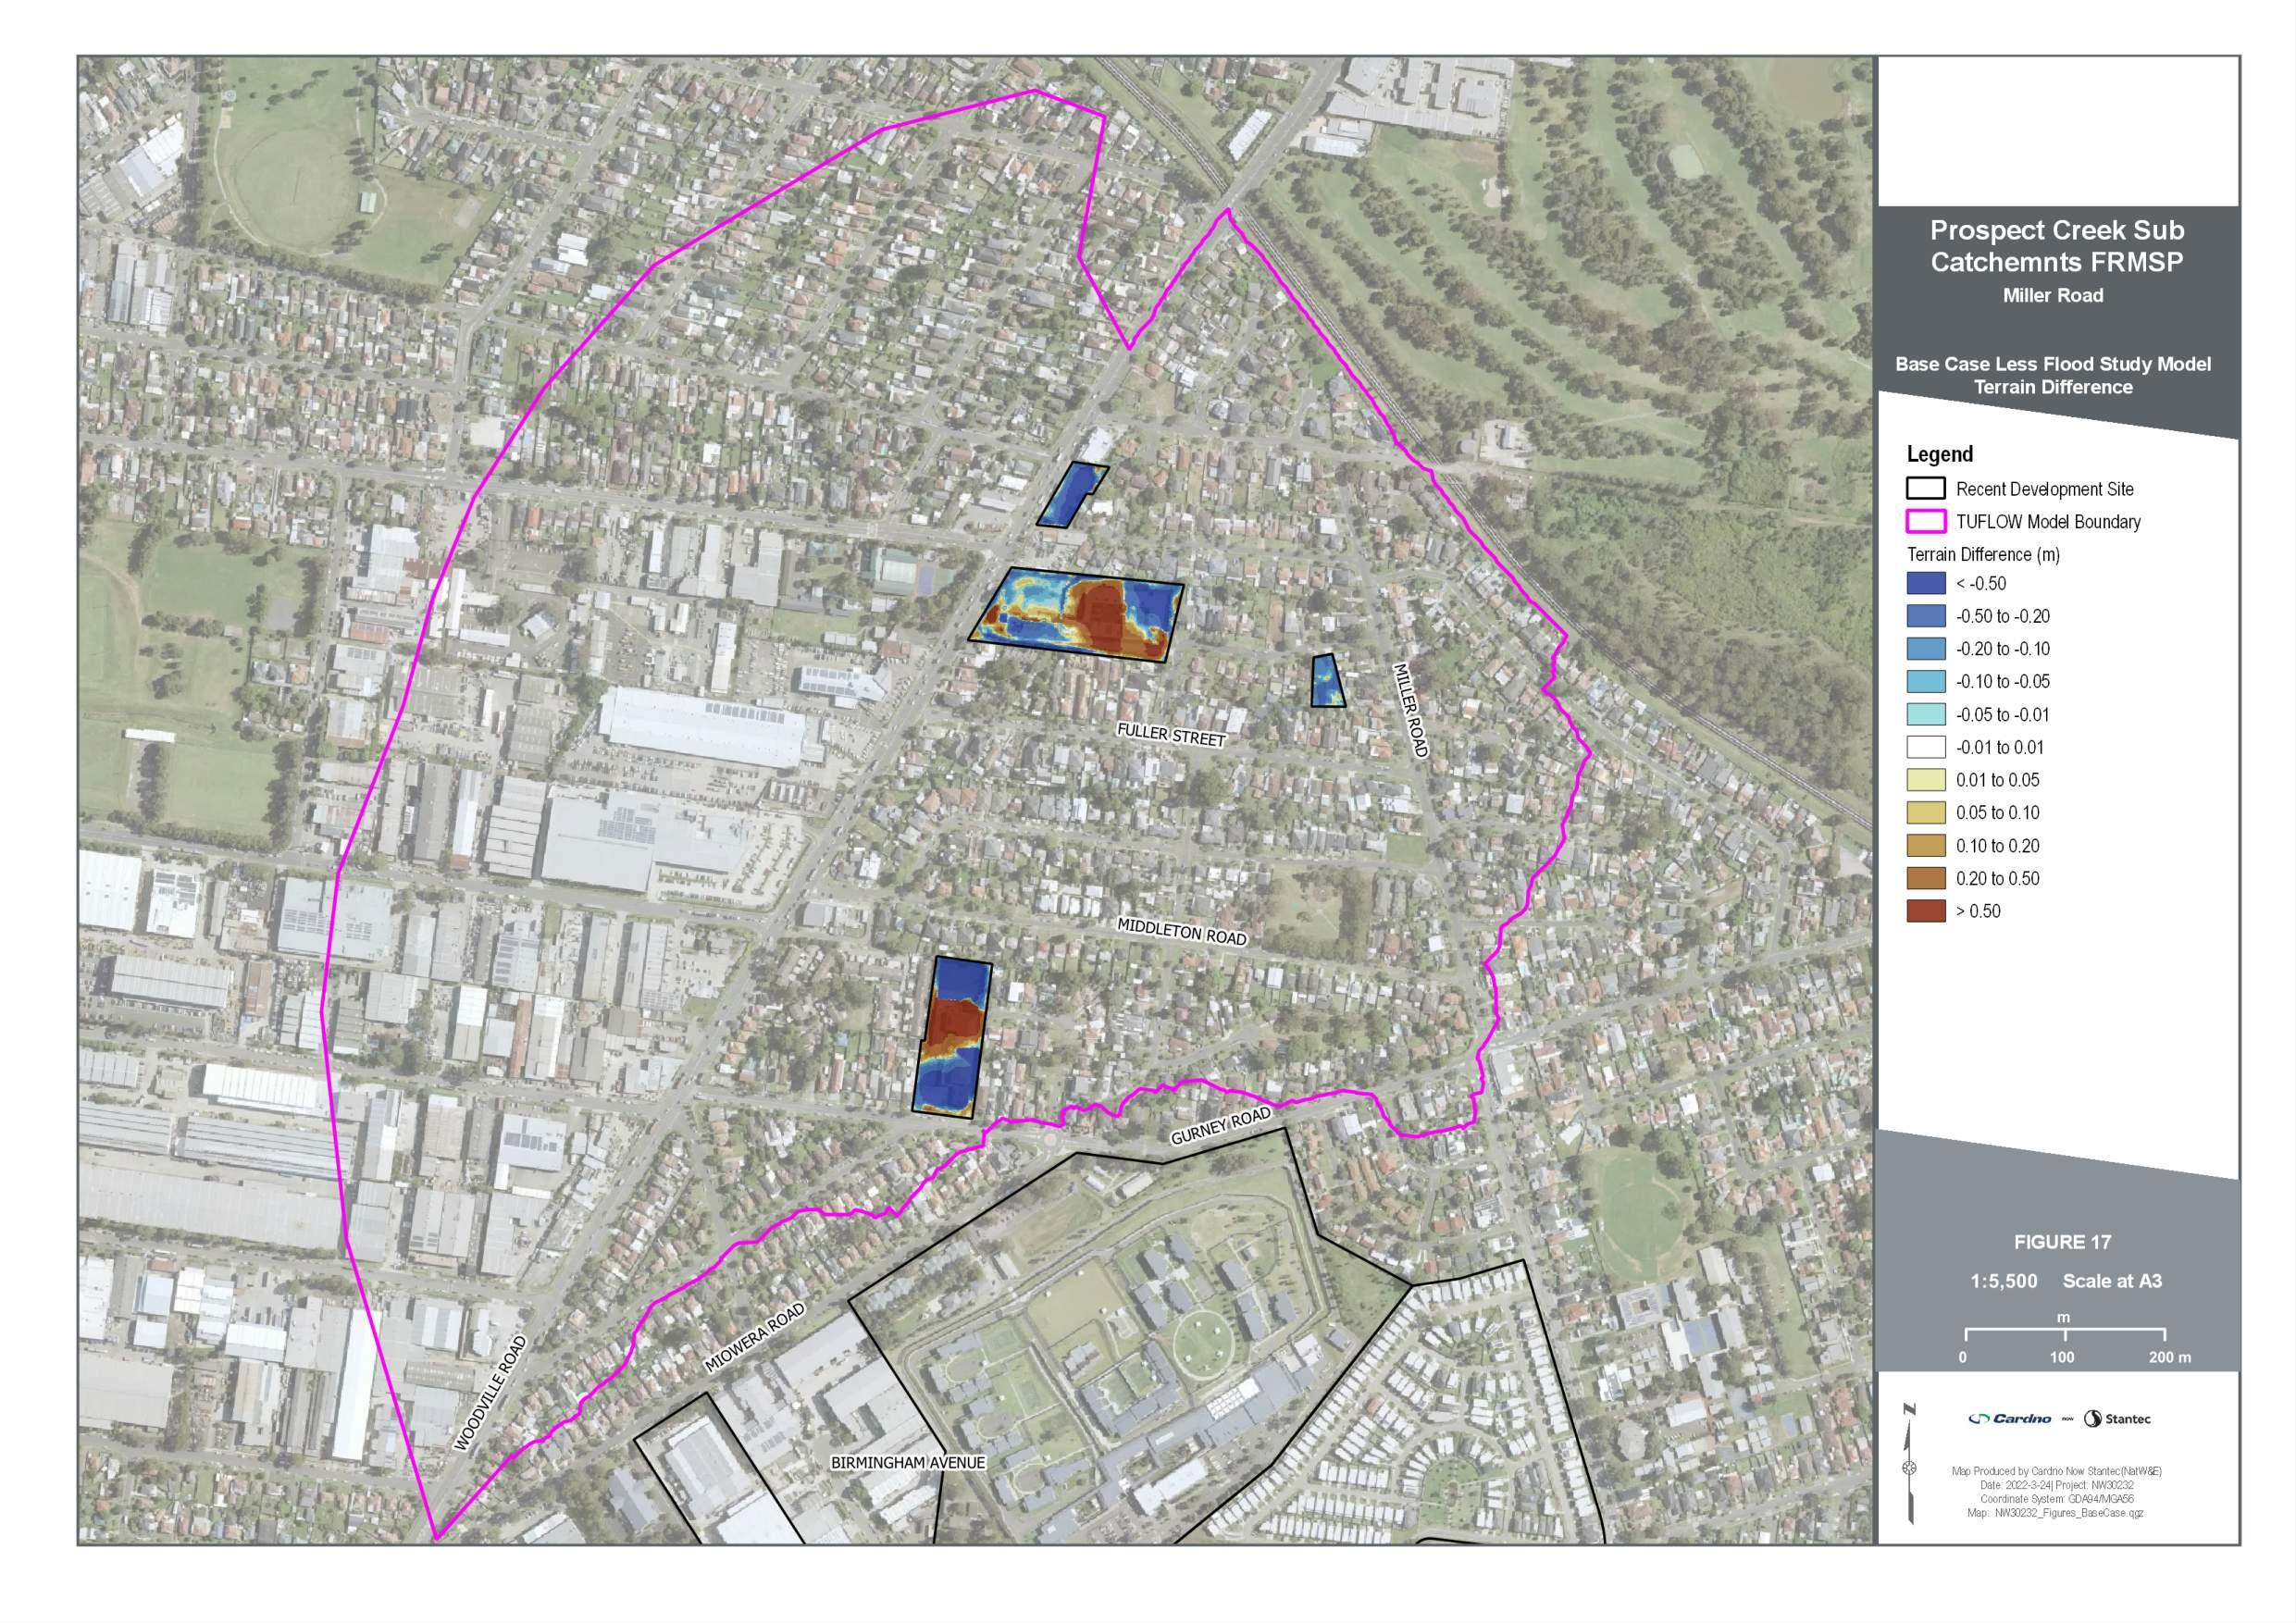

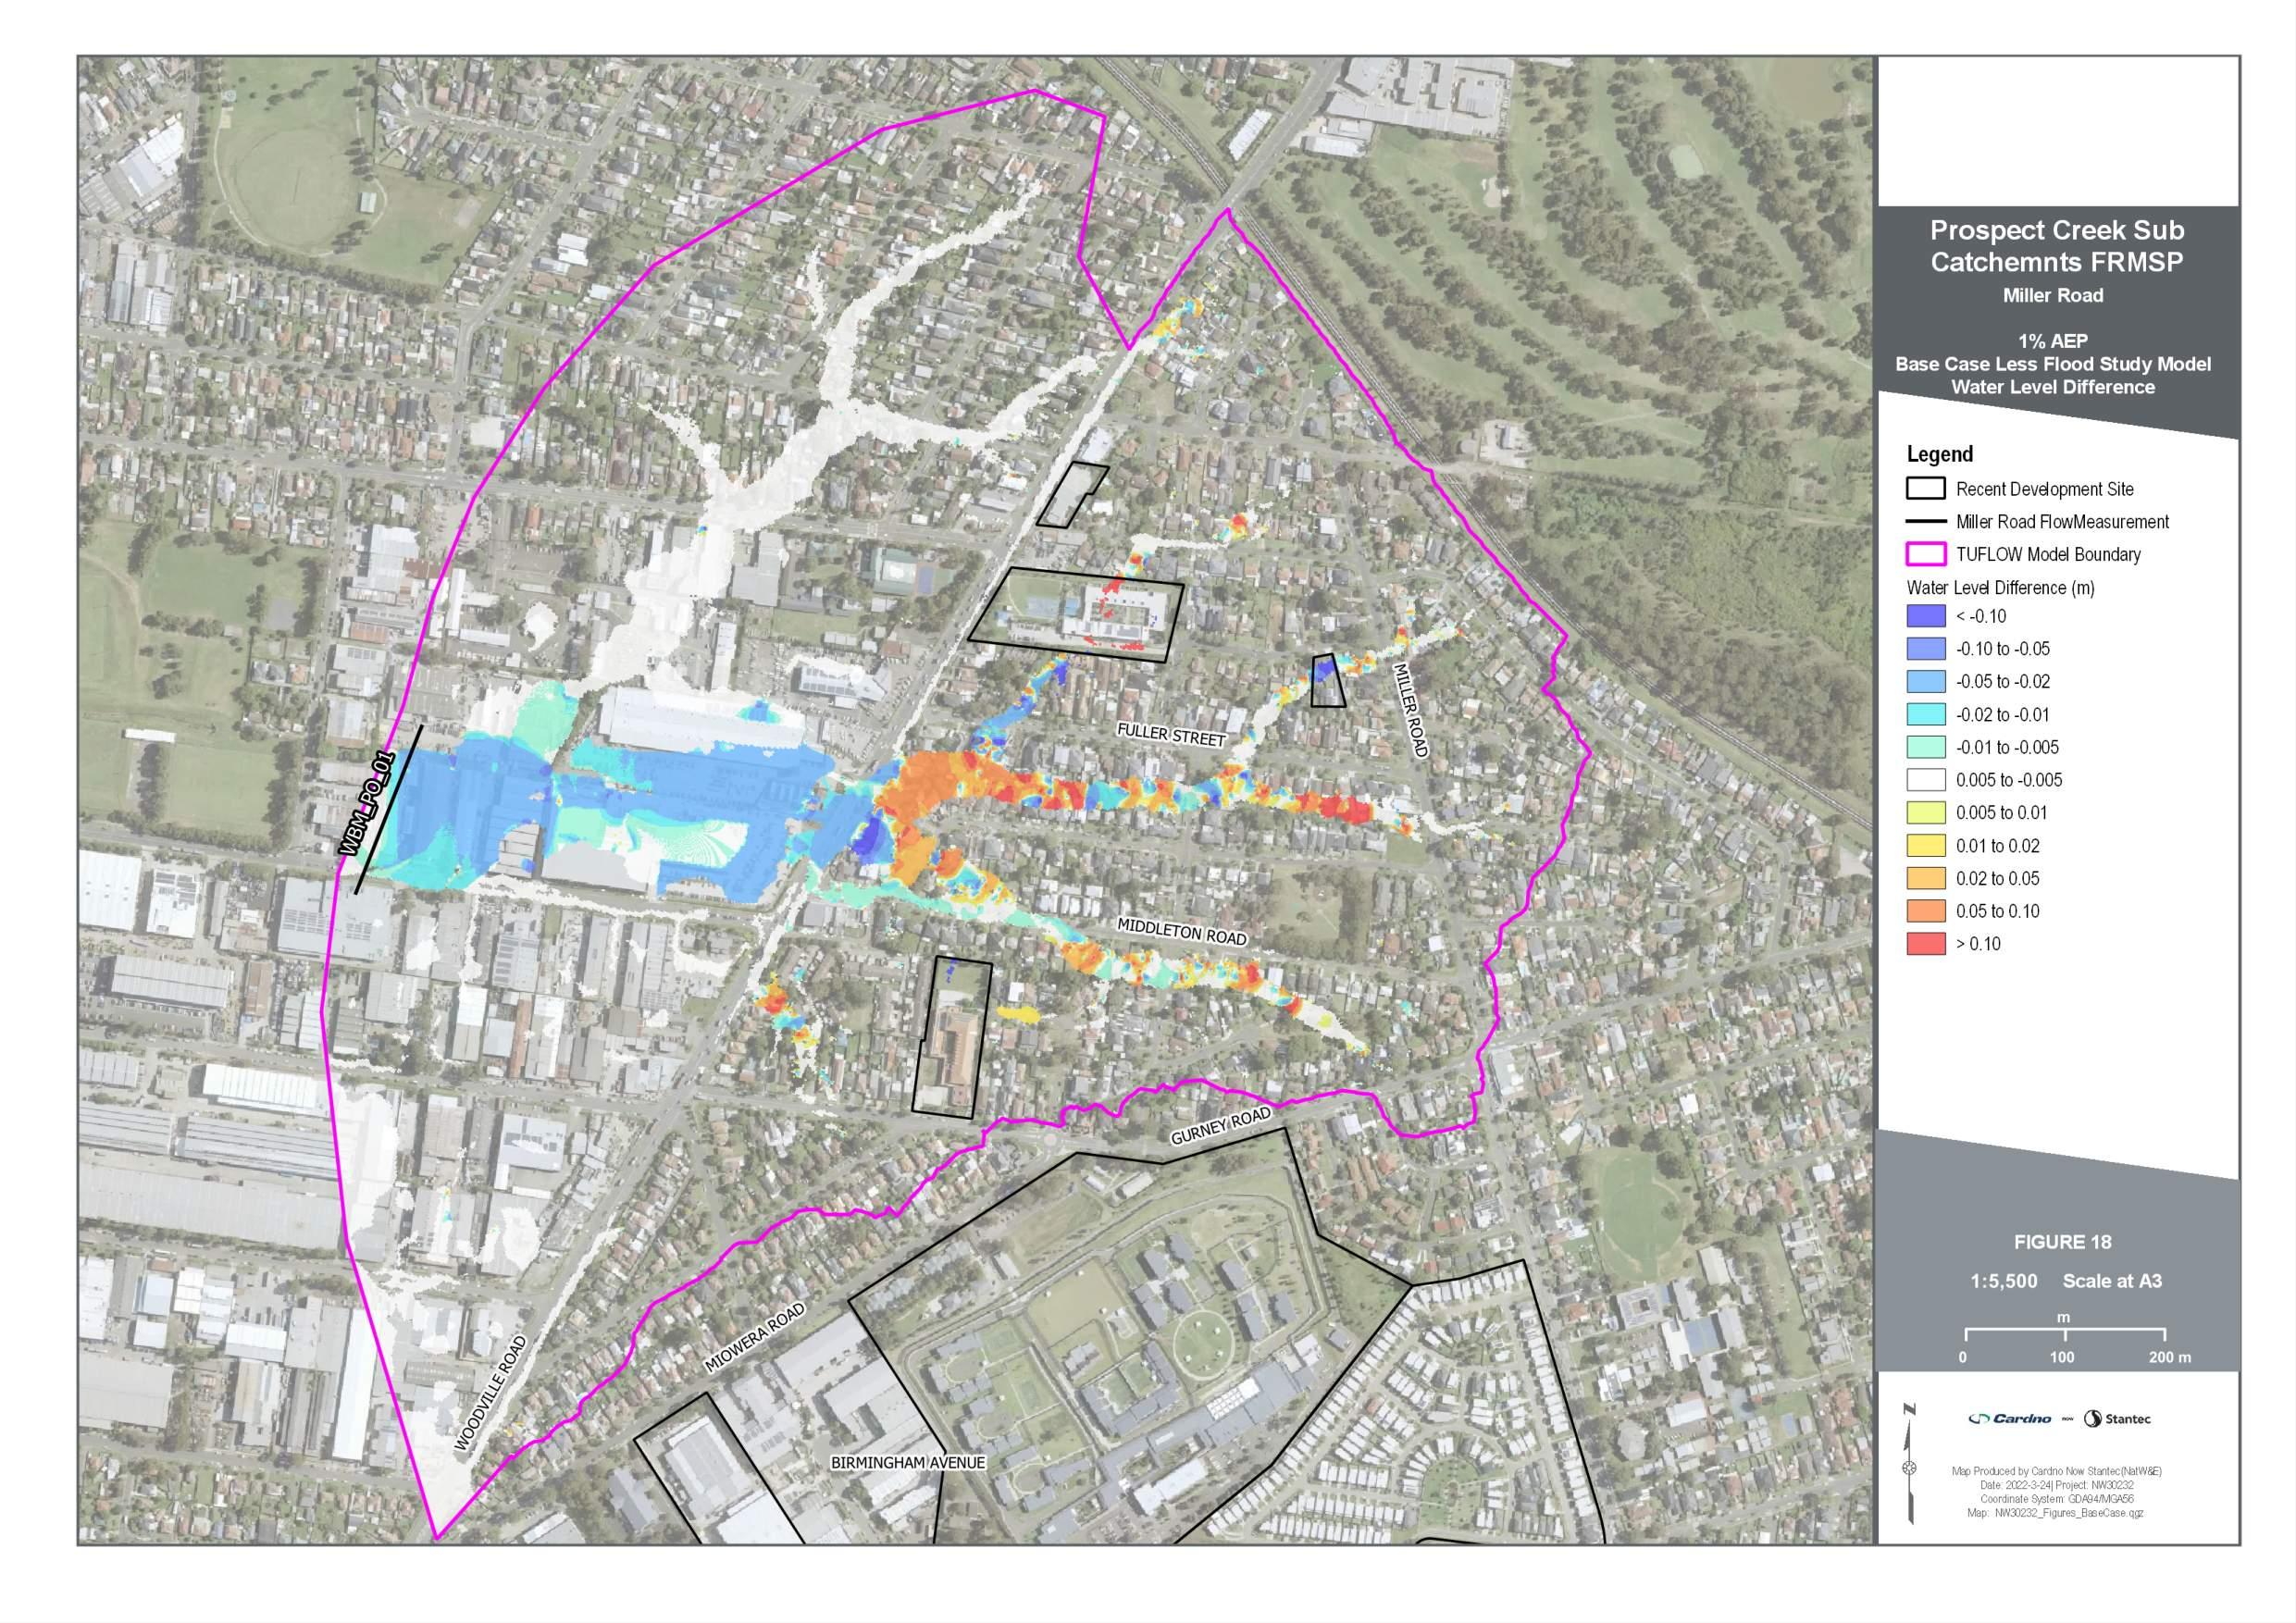


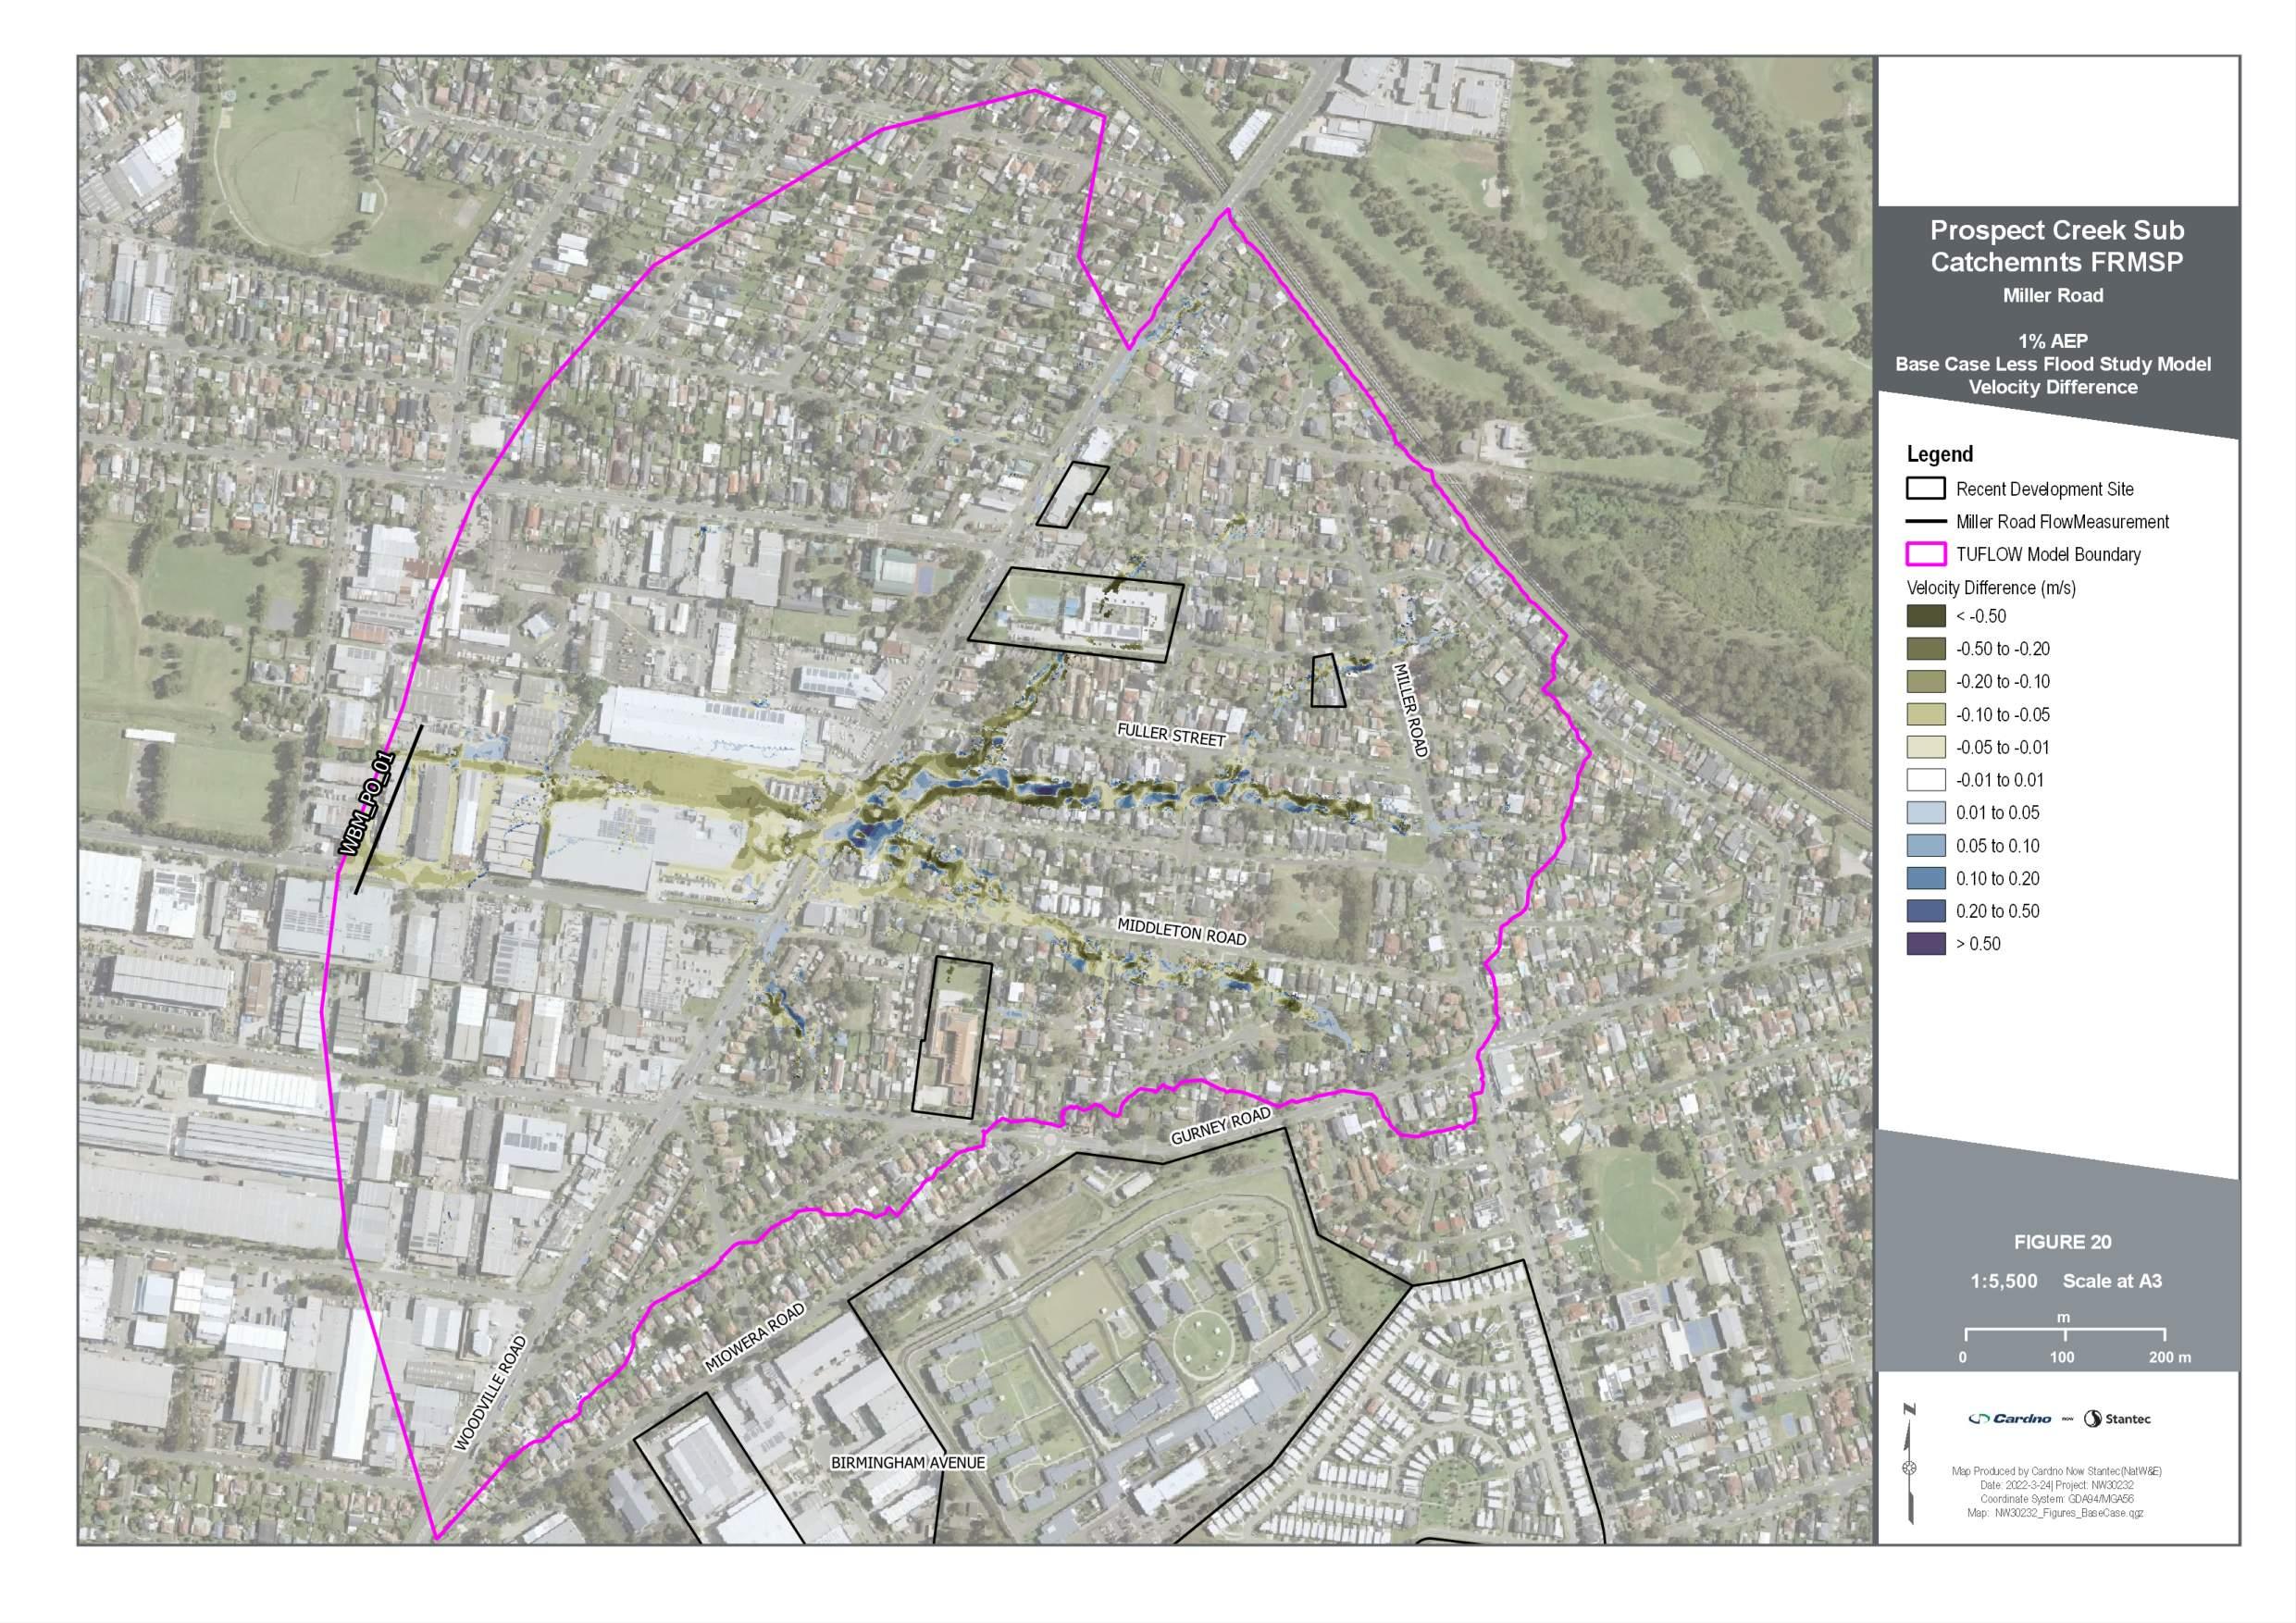


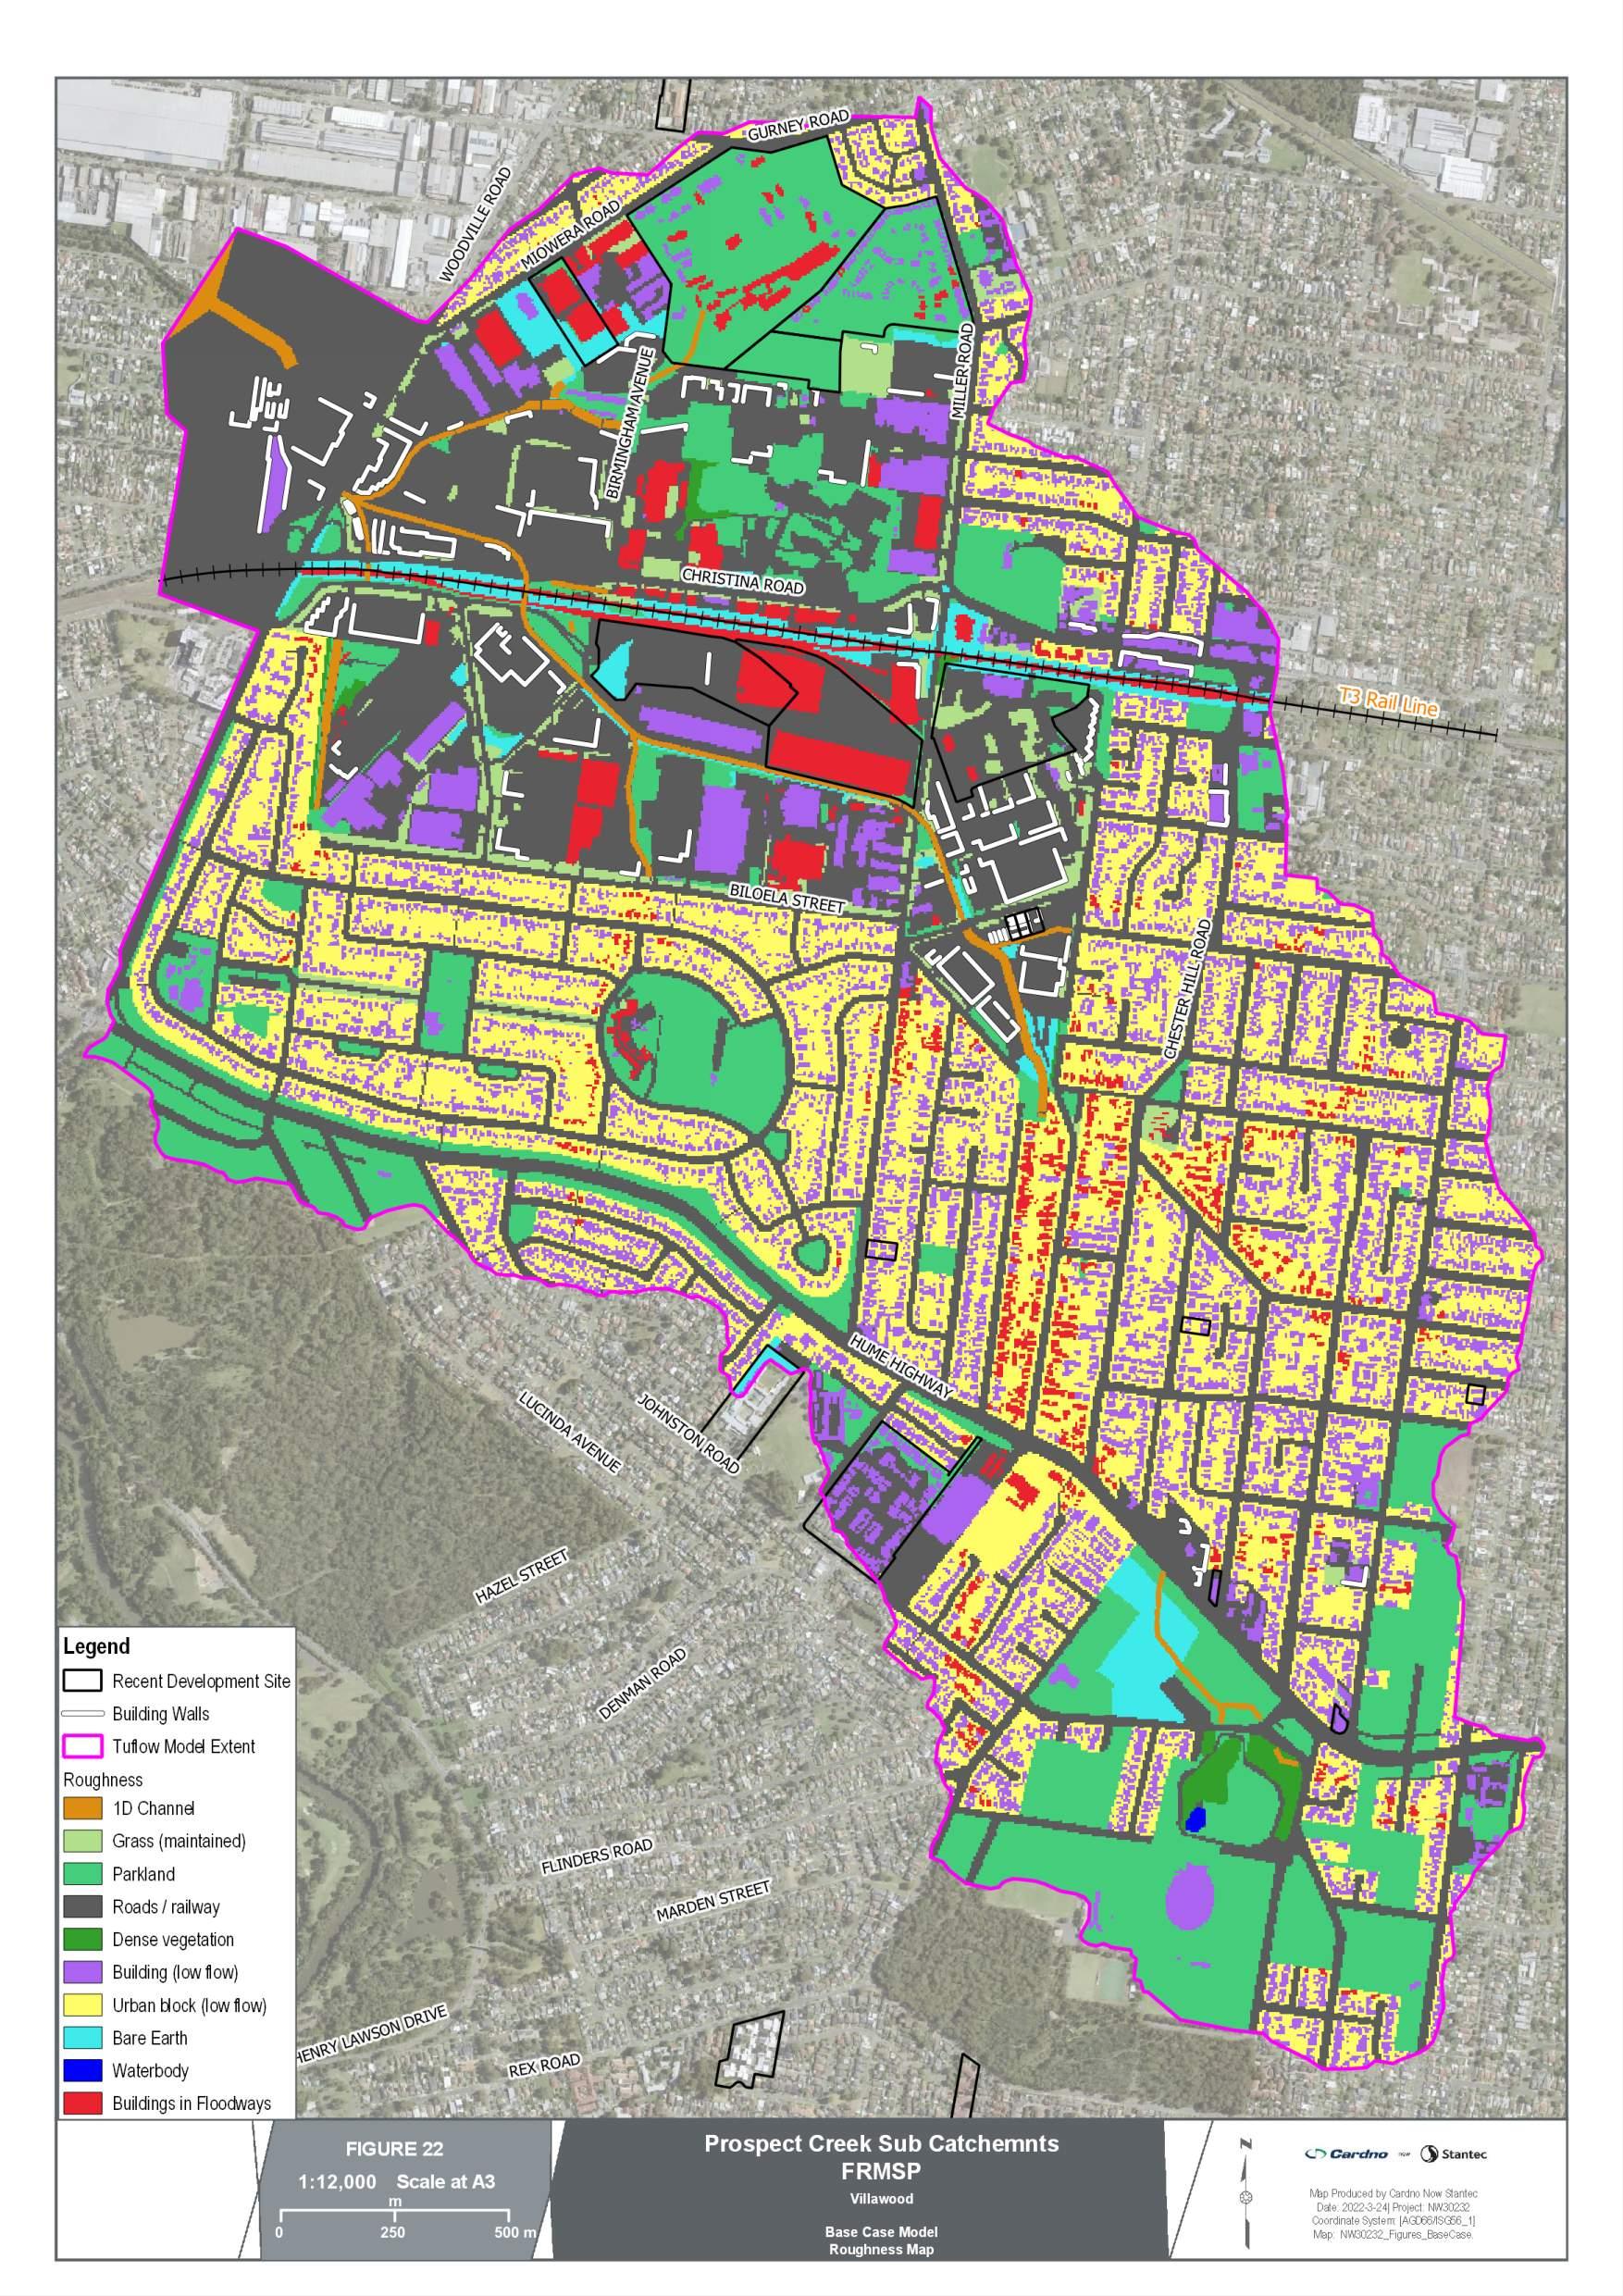

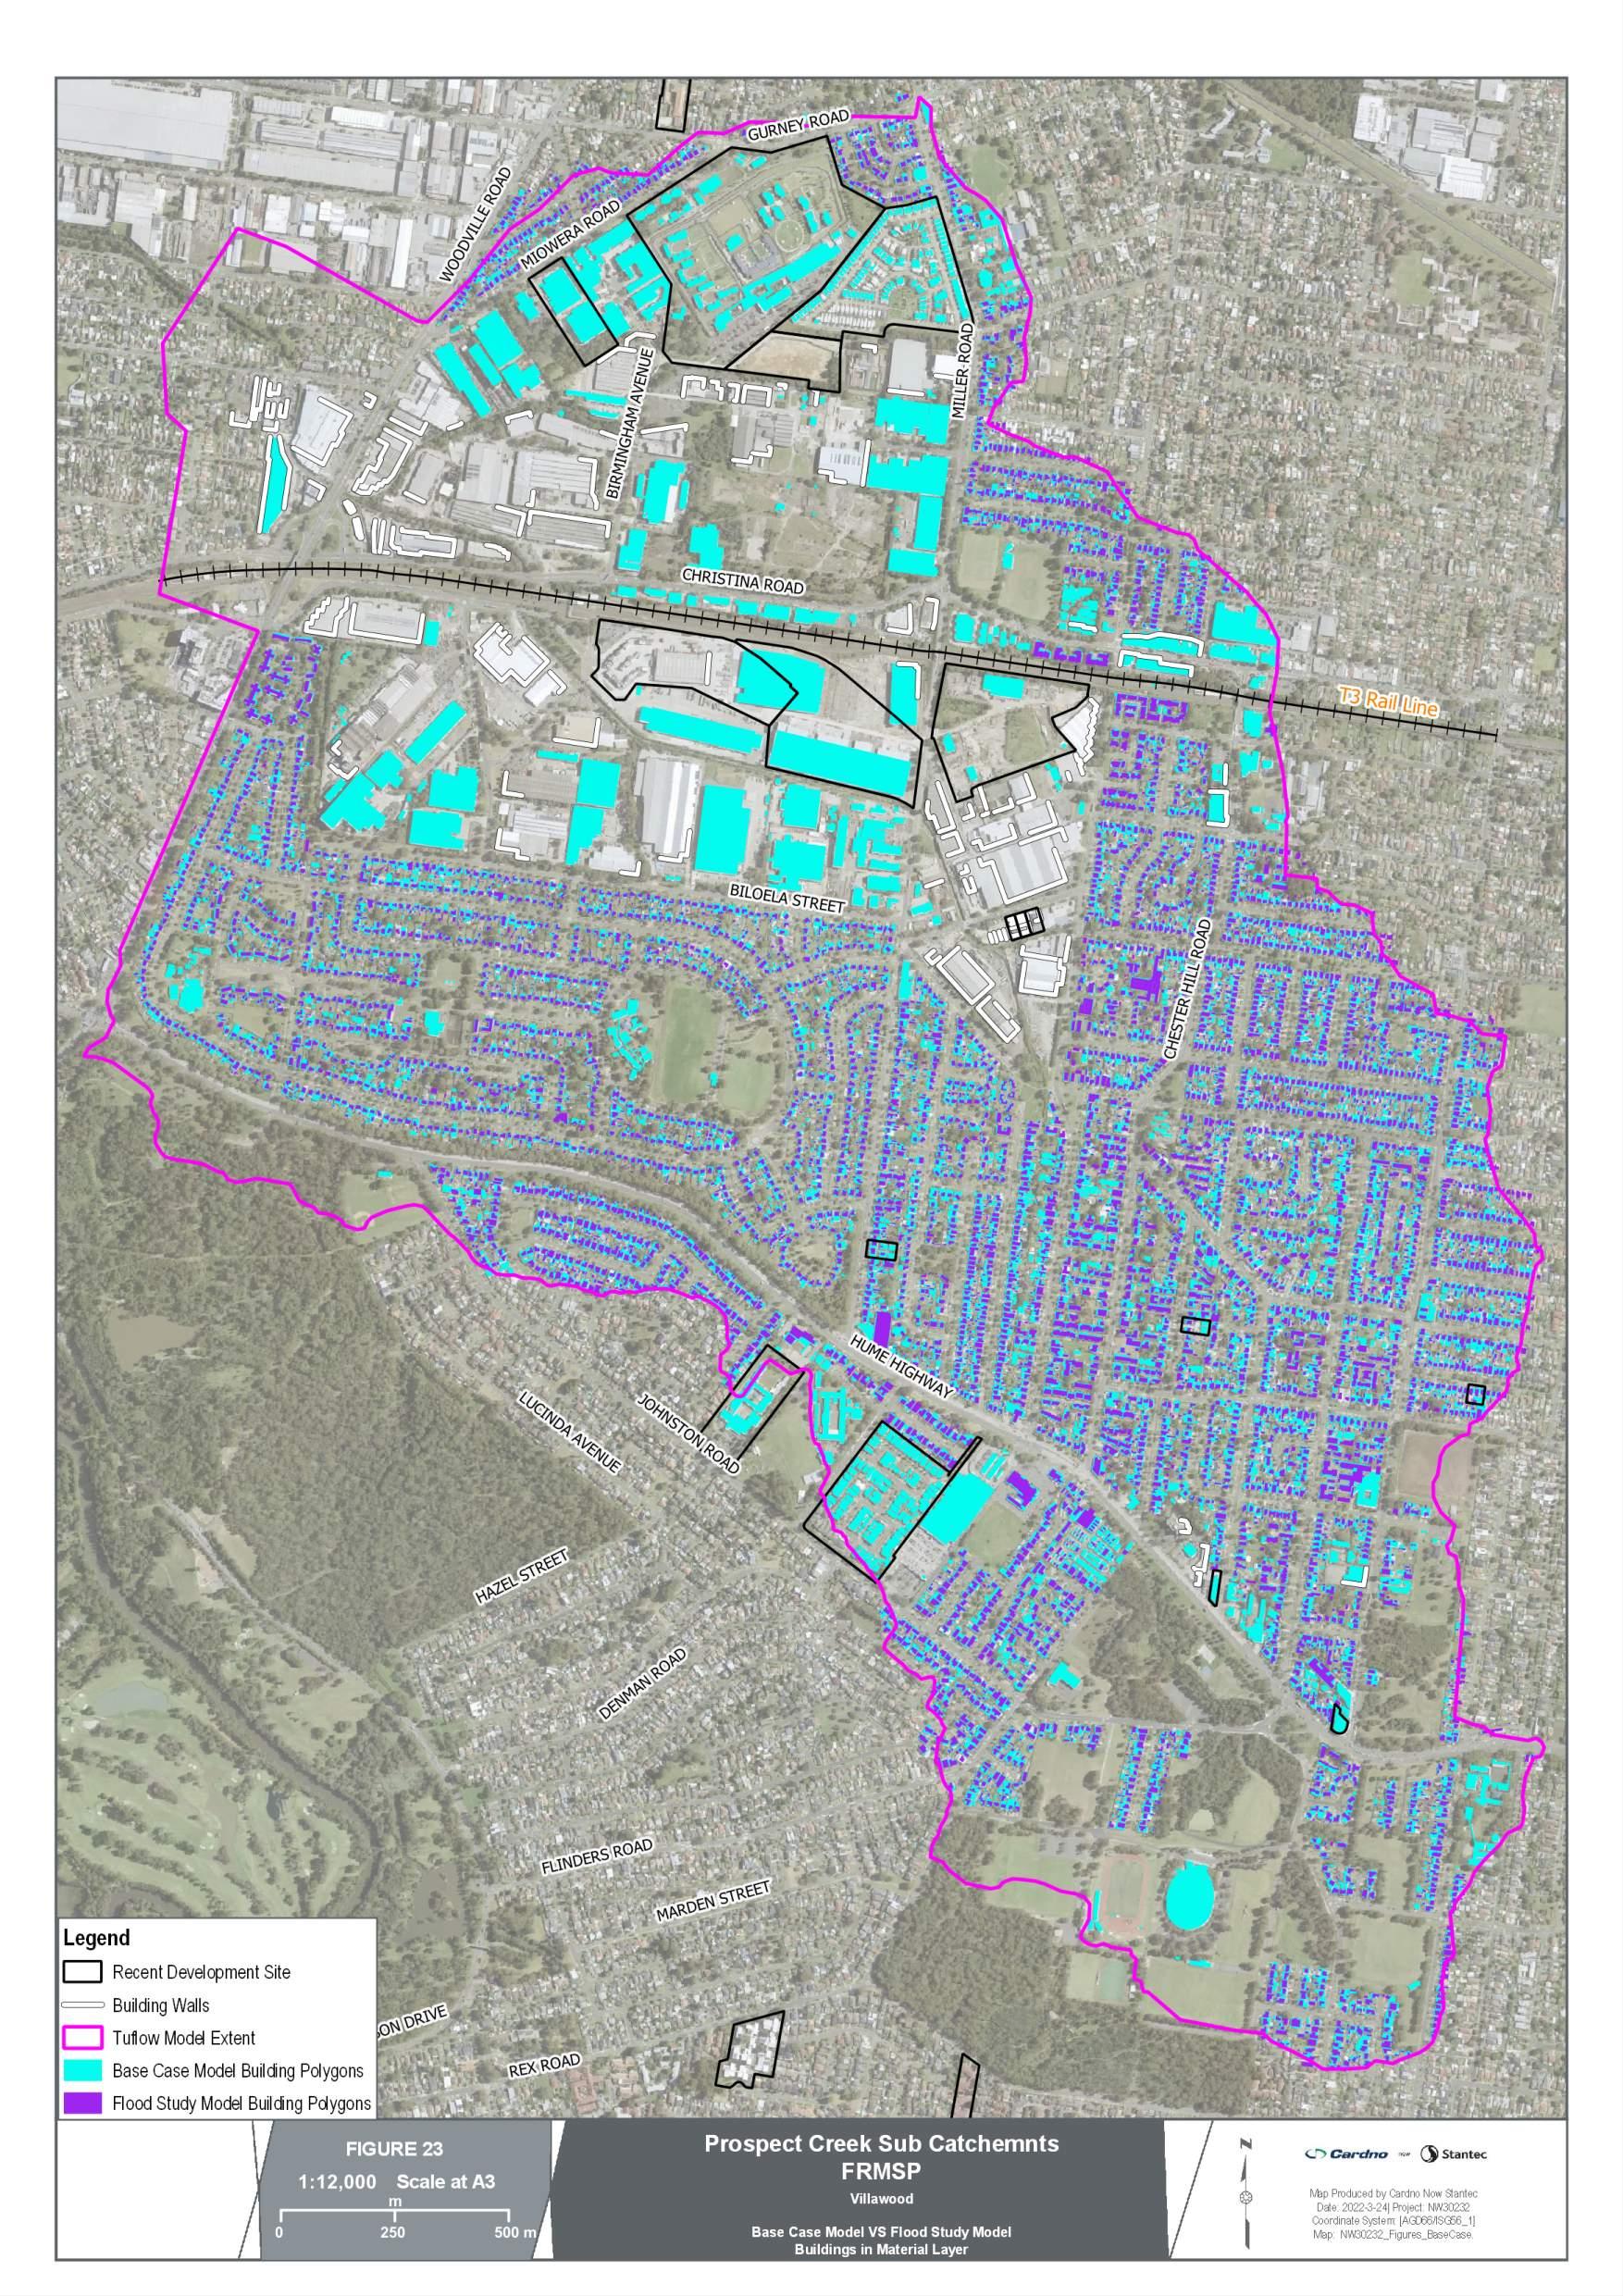

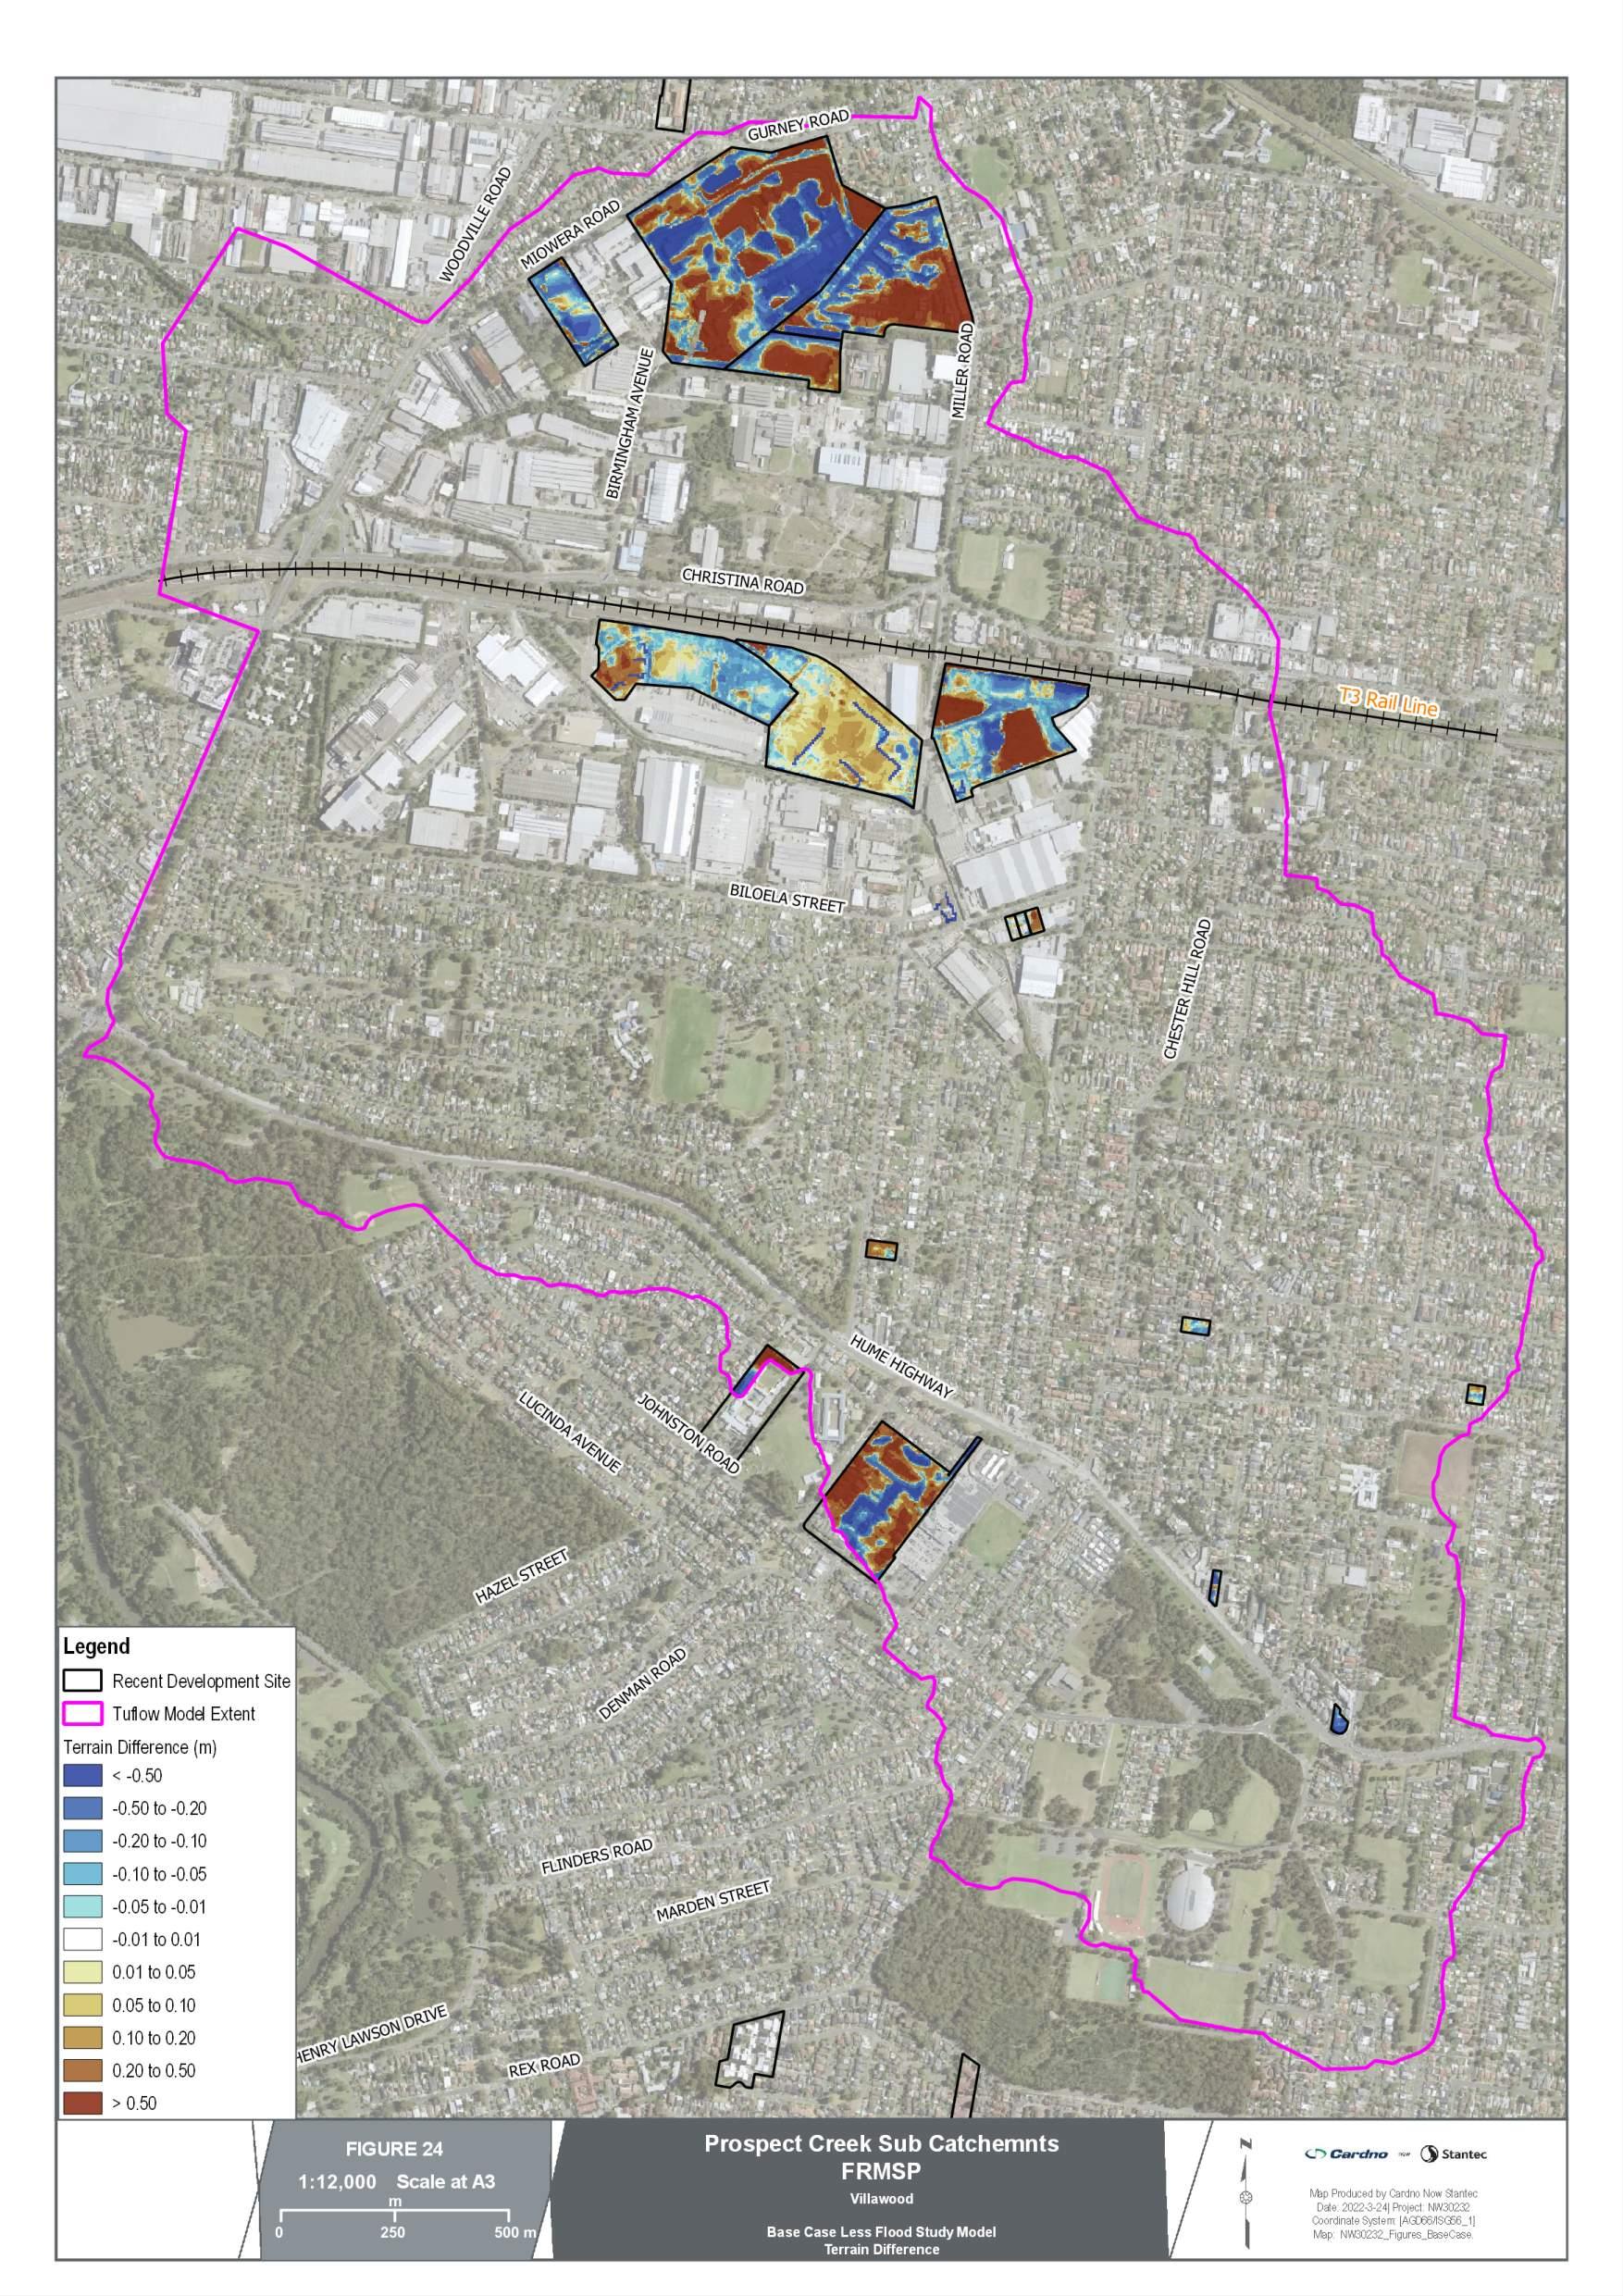


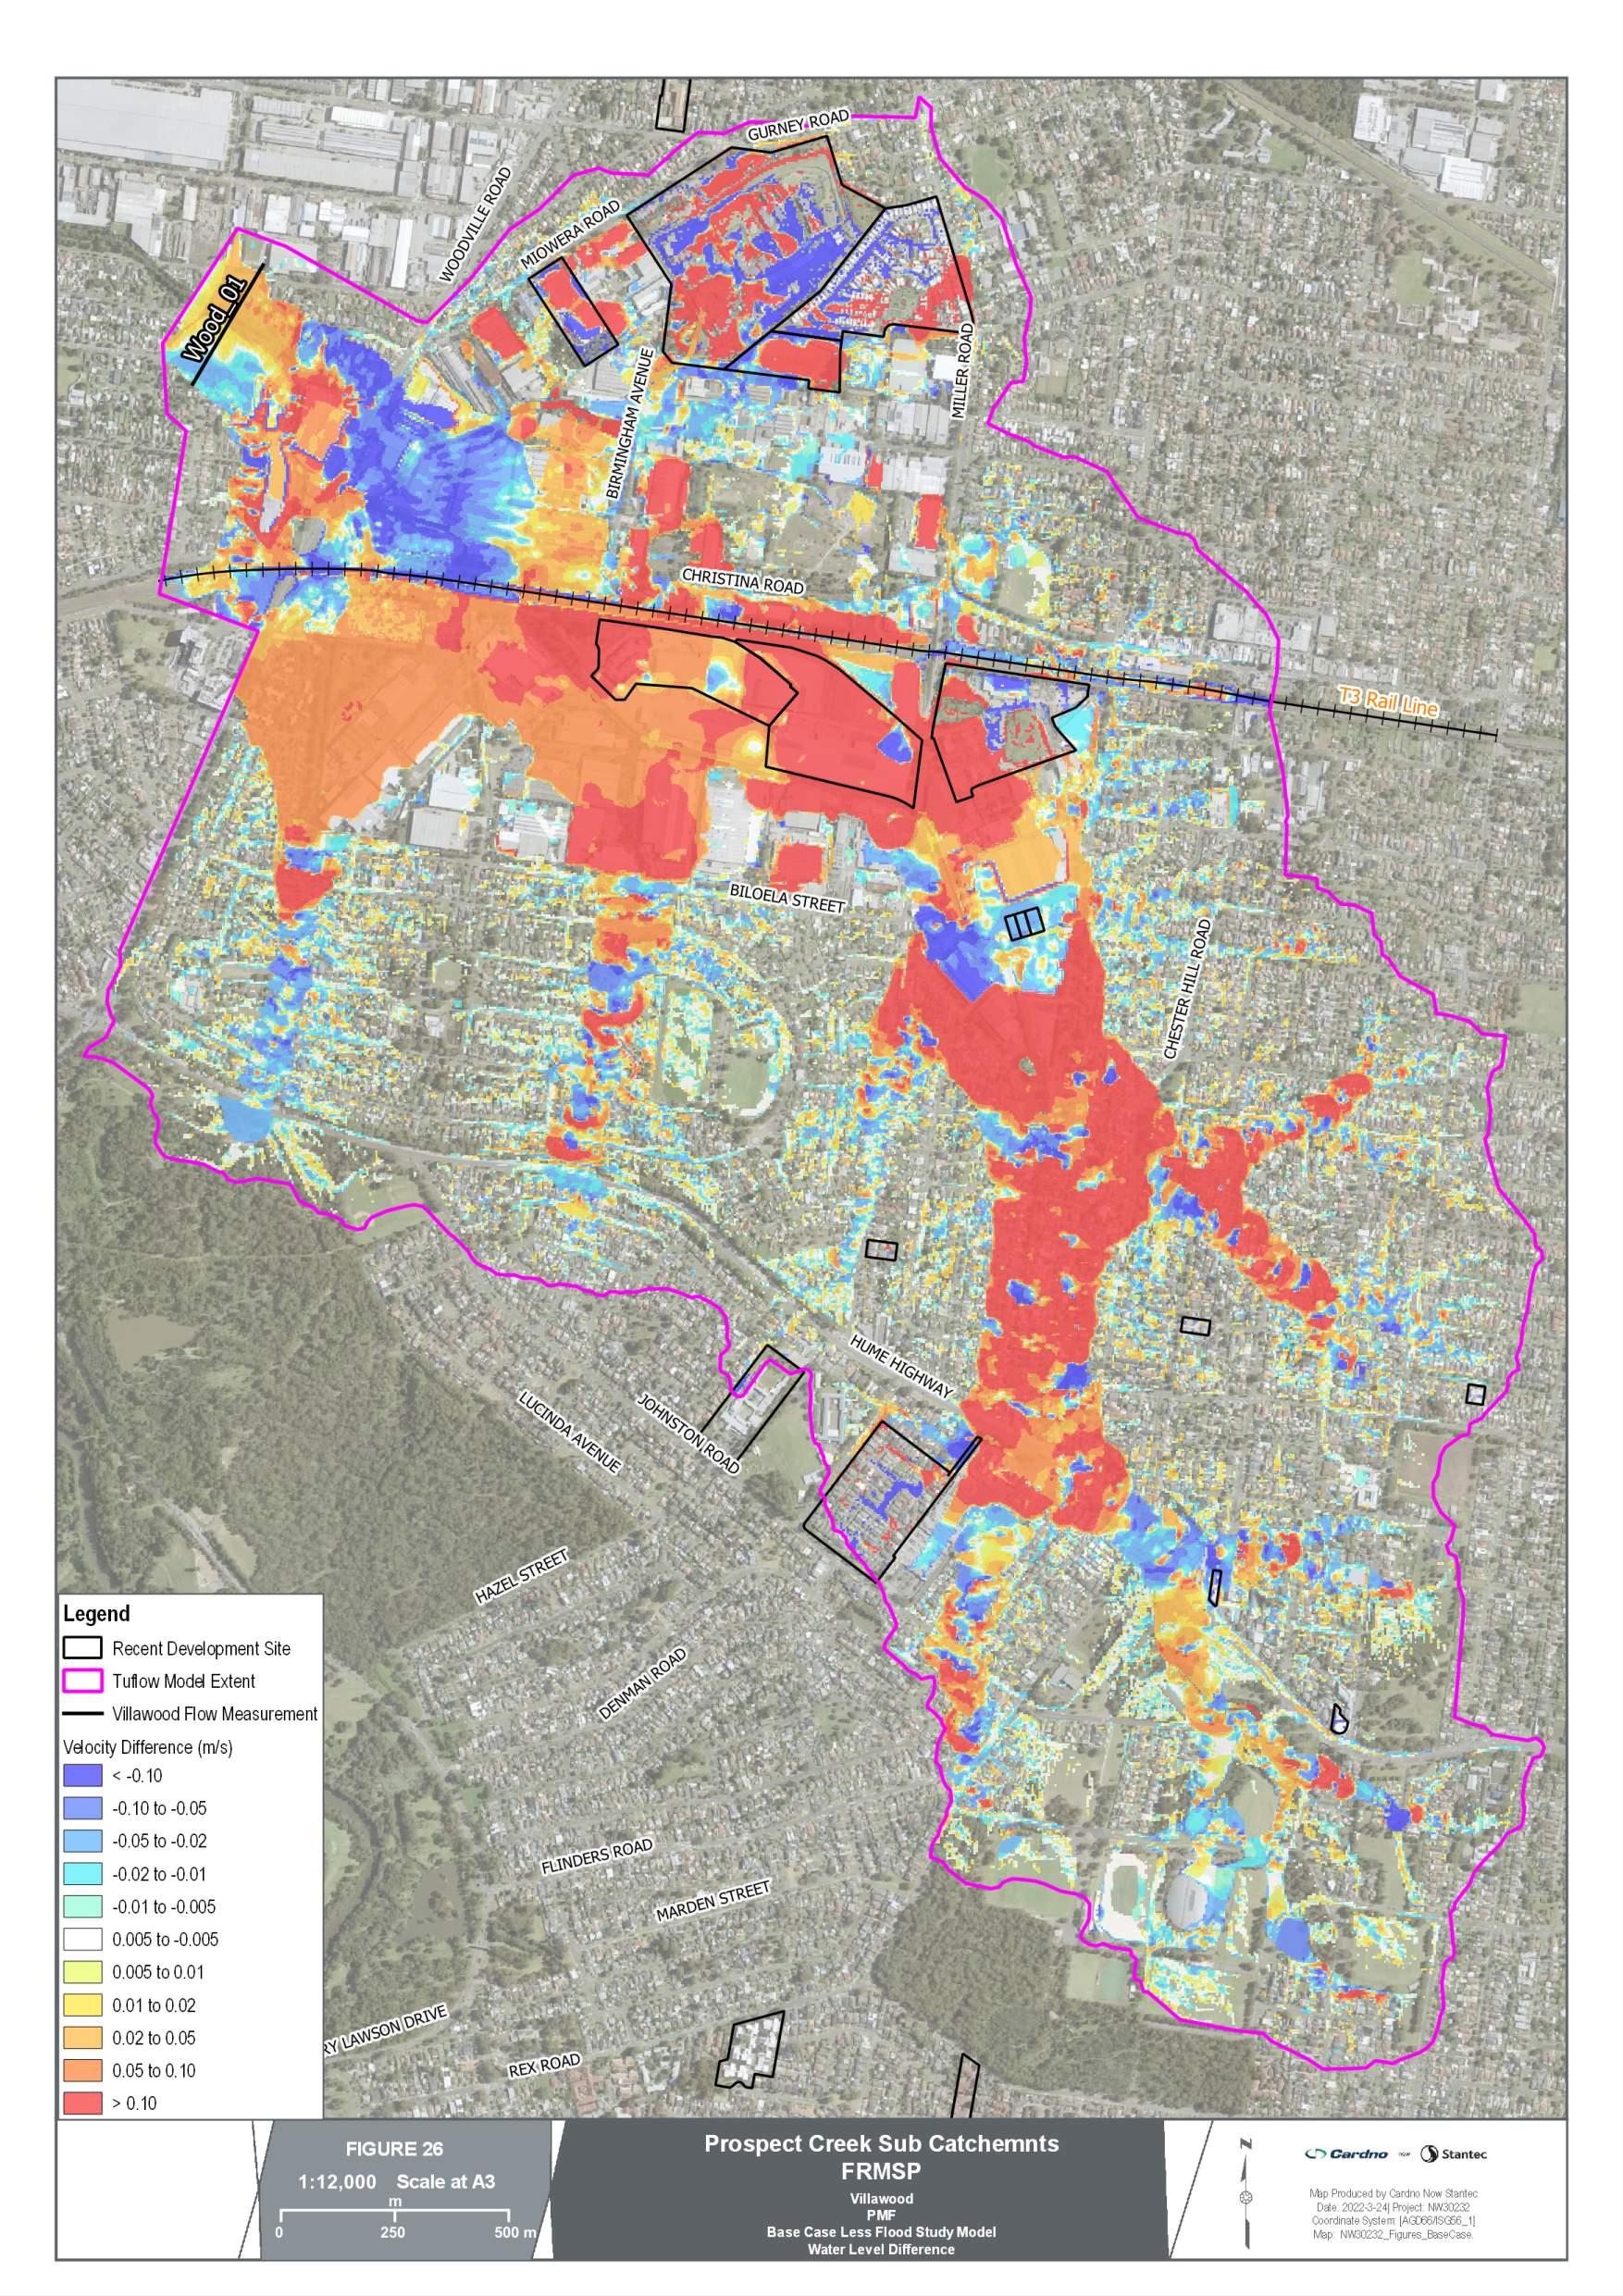

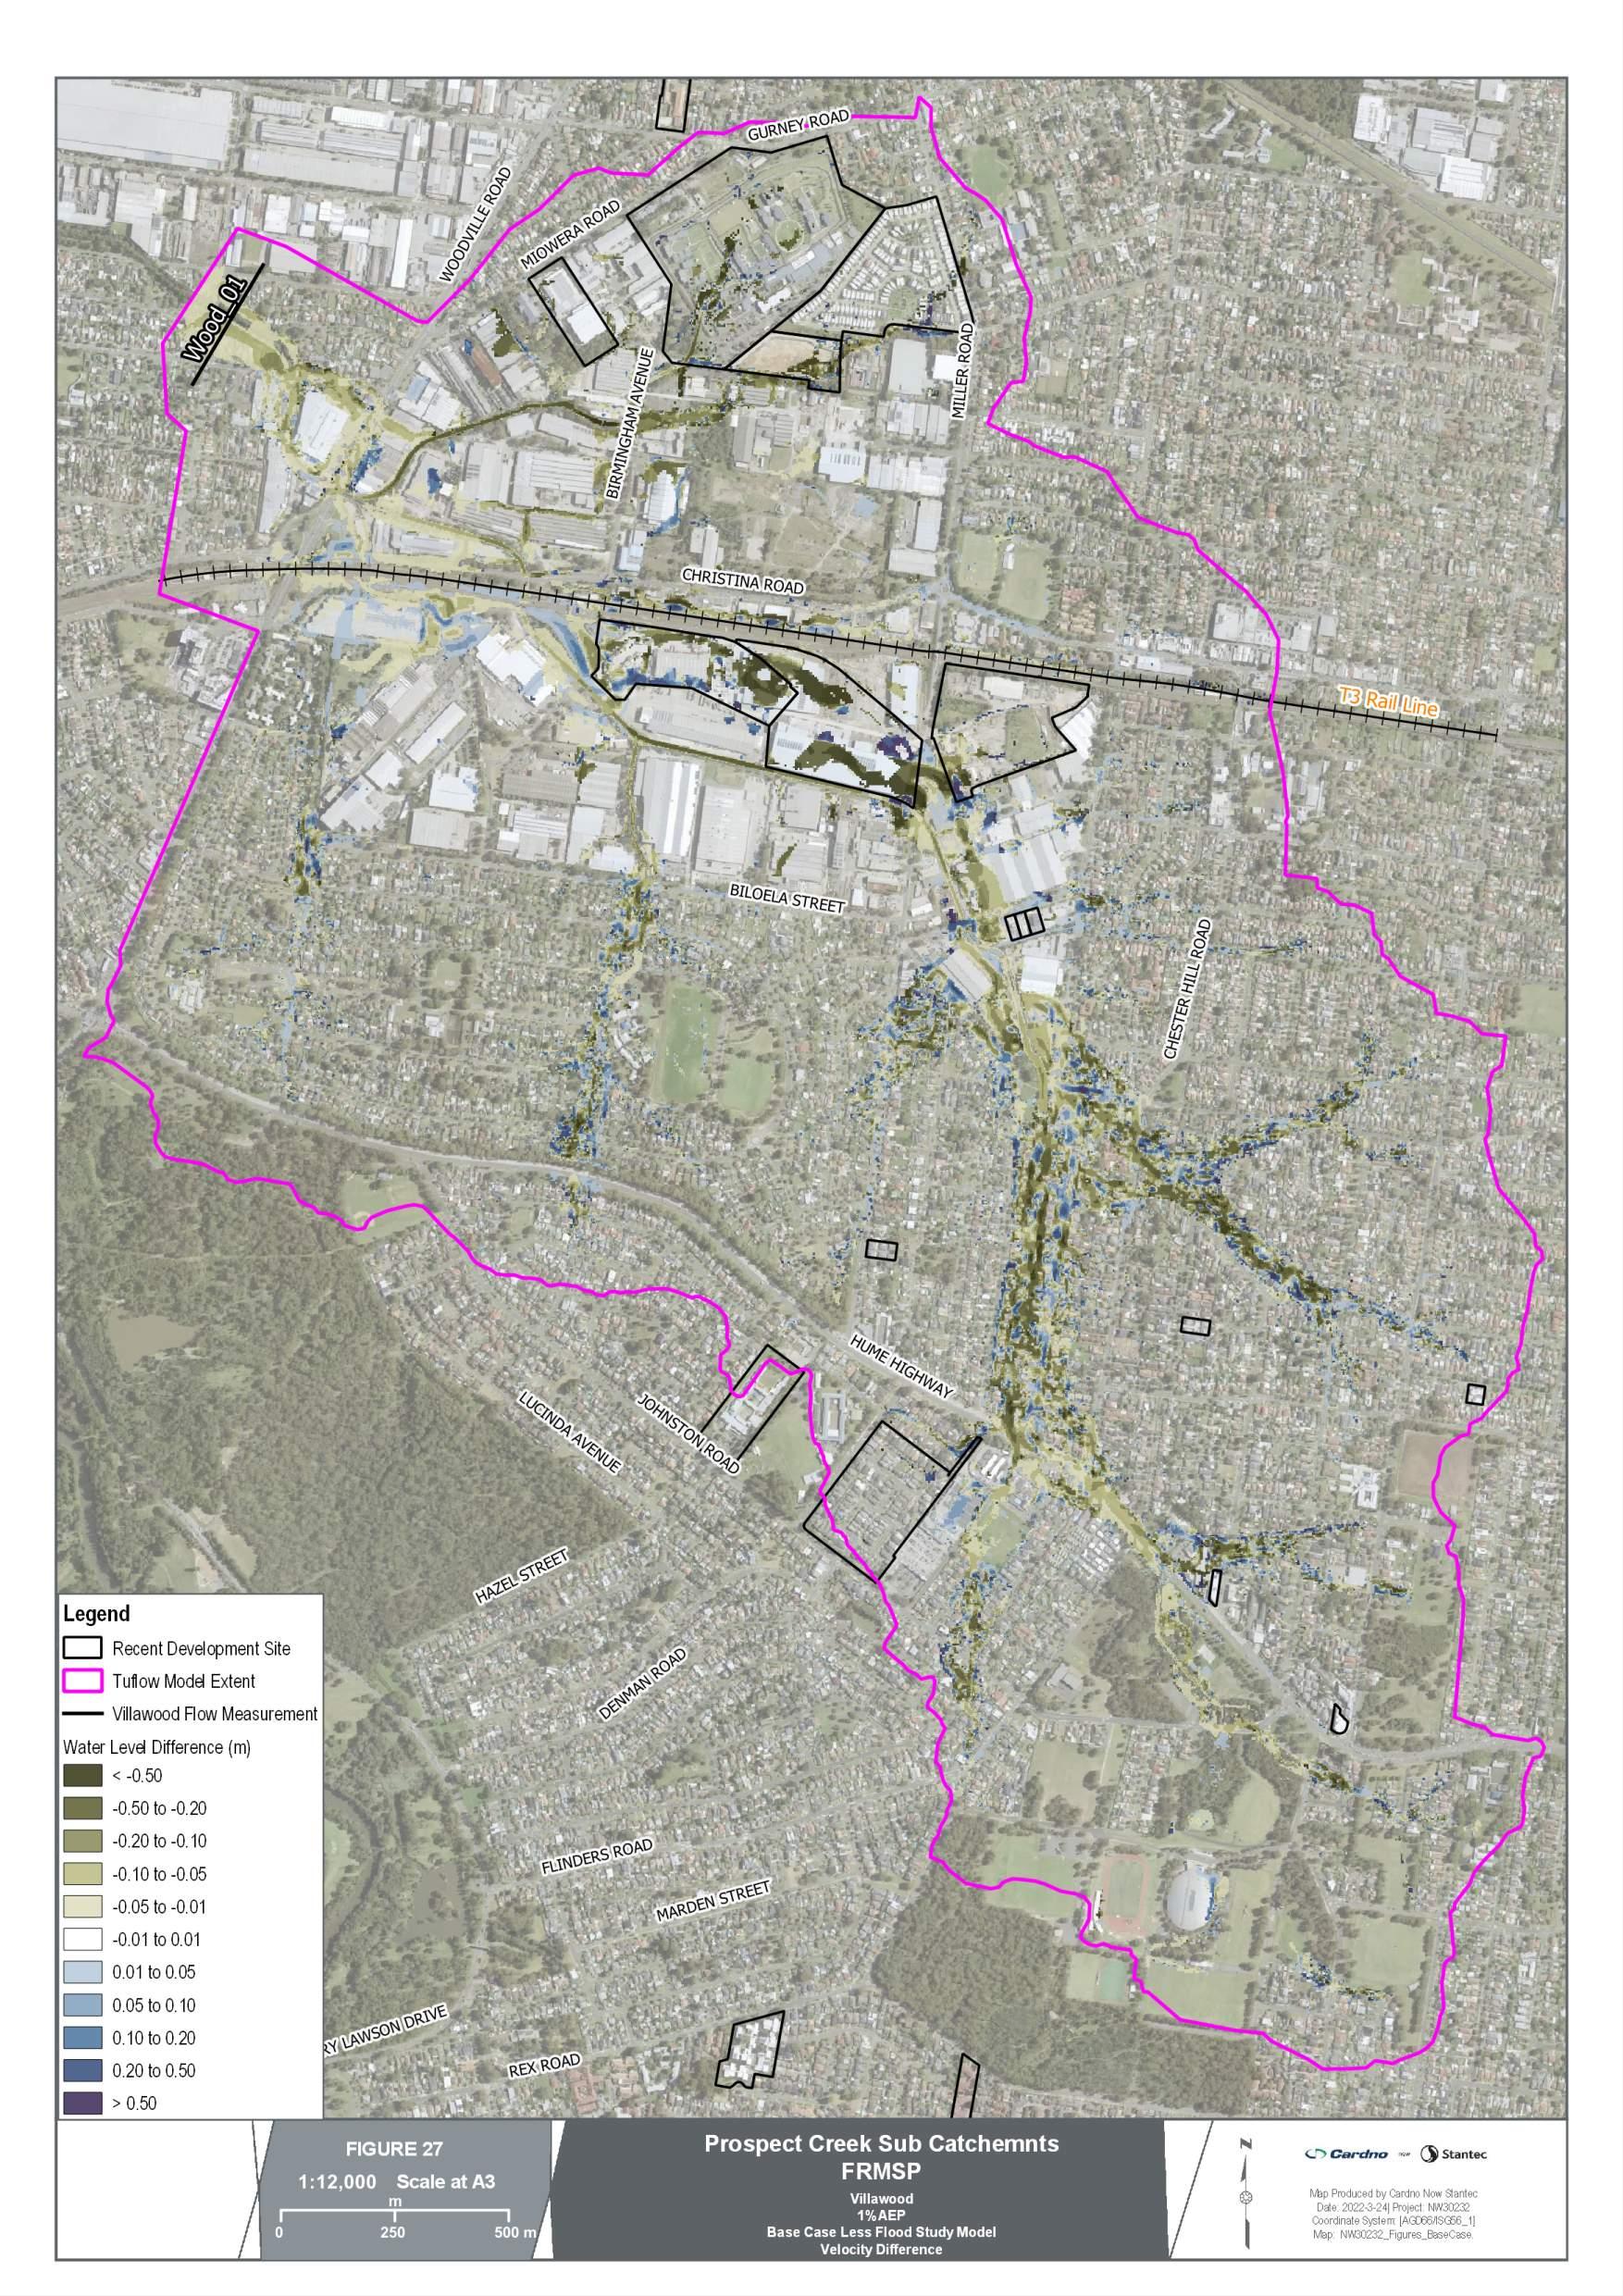


Prospect Creek Sub-Catchments

APPENDIX

BASE CASE FLOOD MAPS
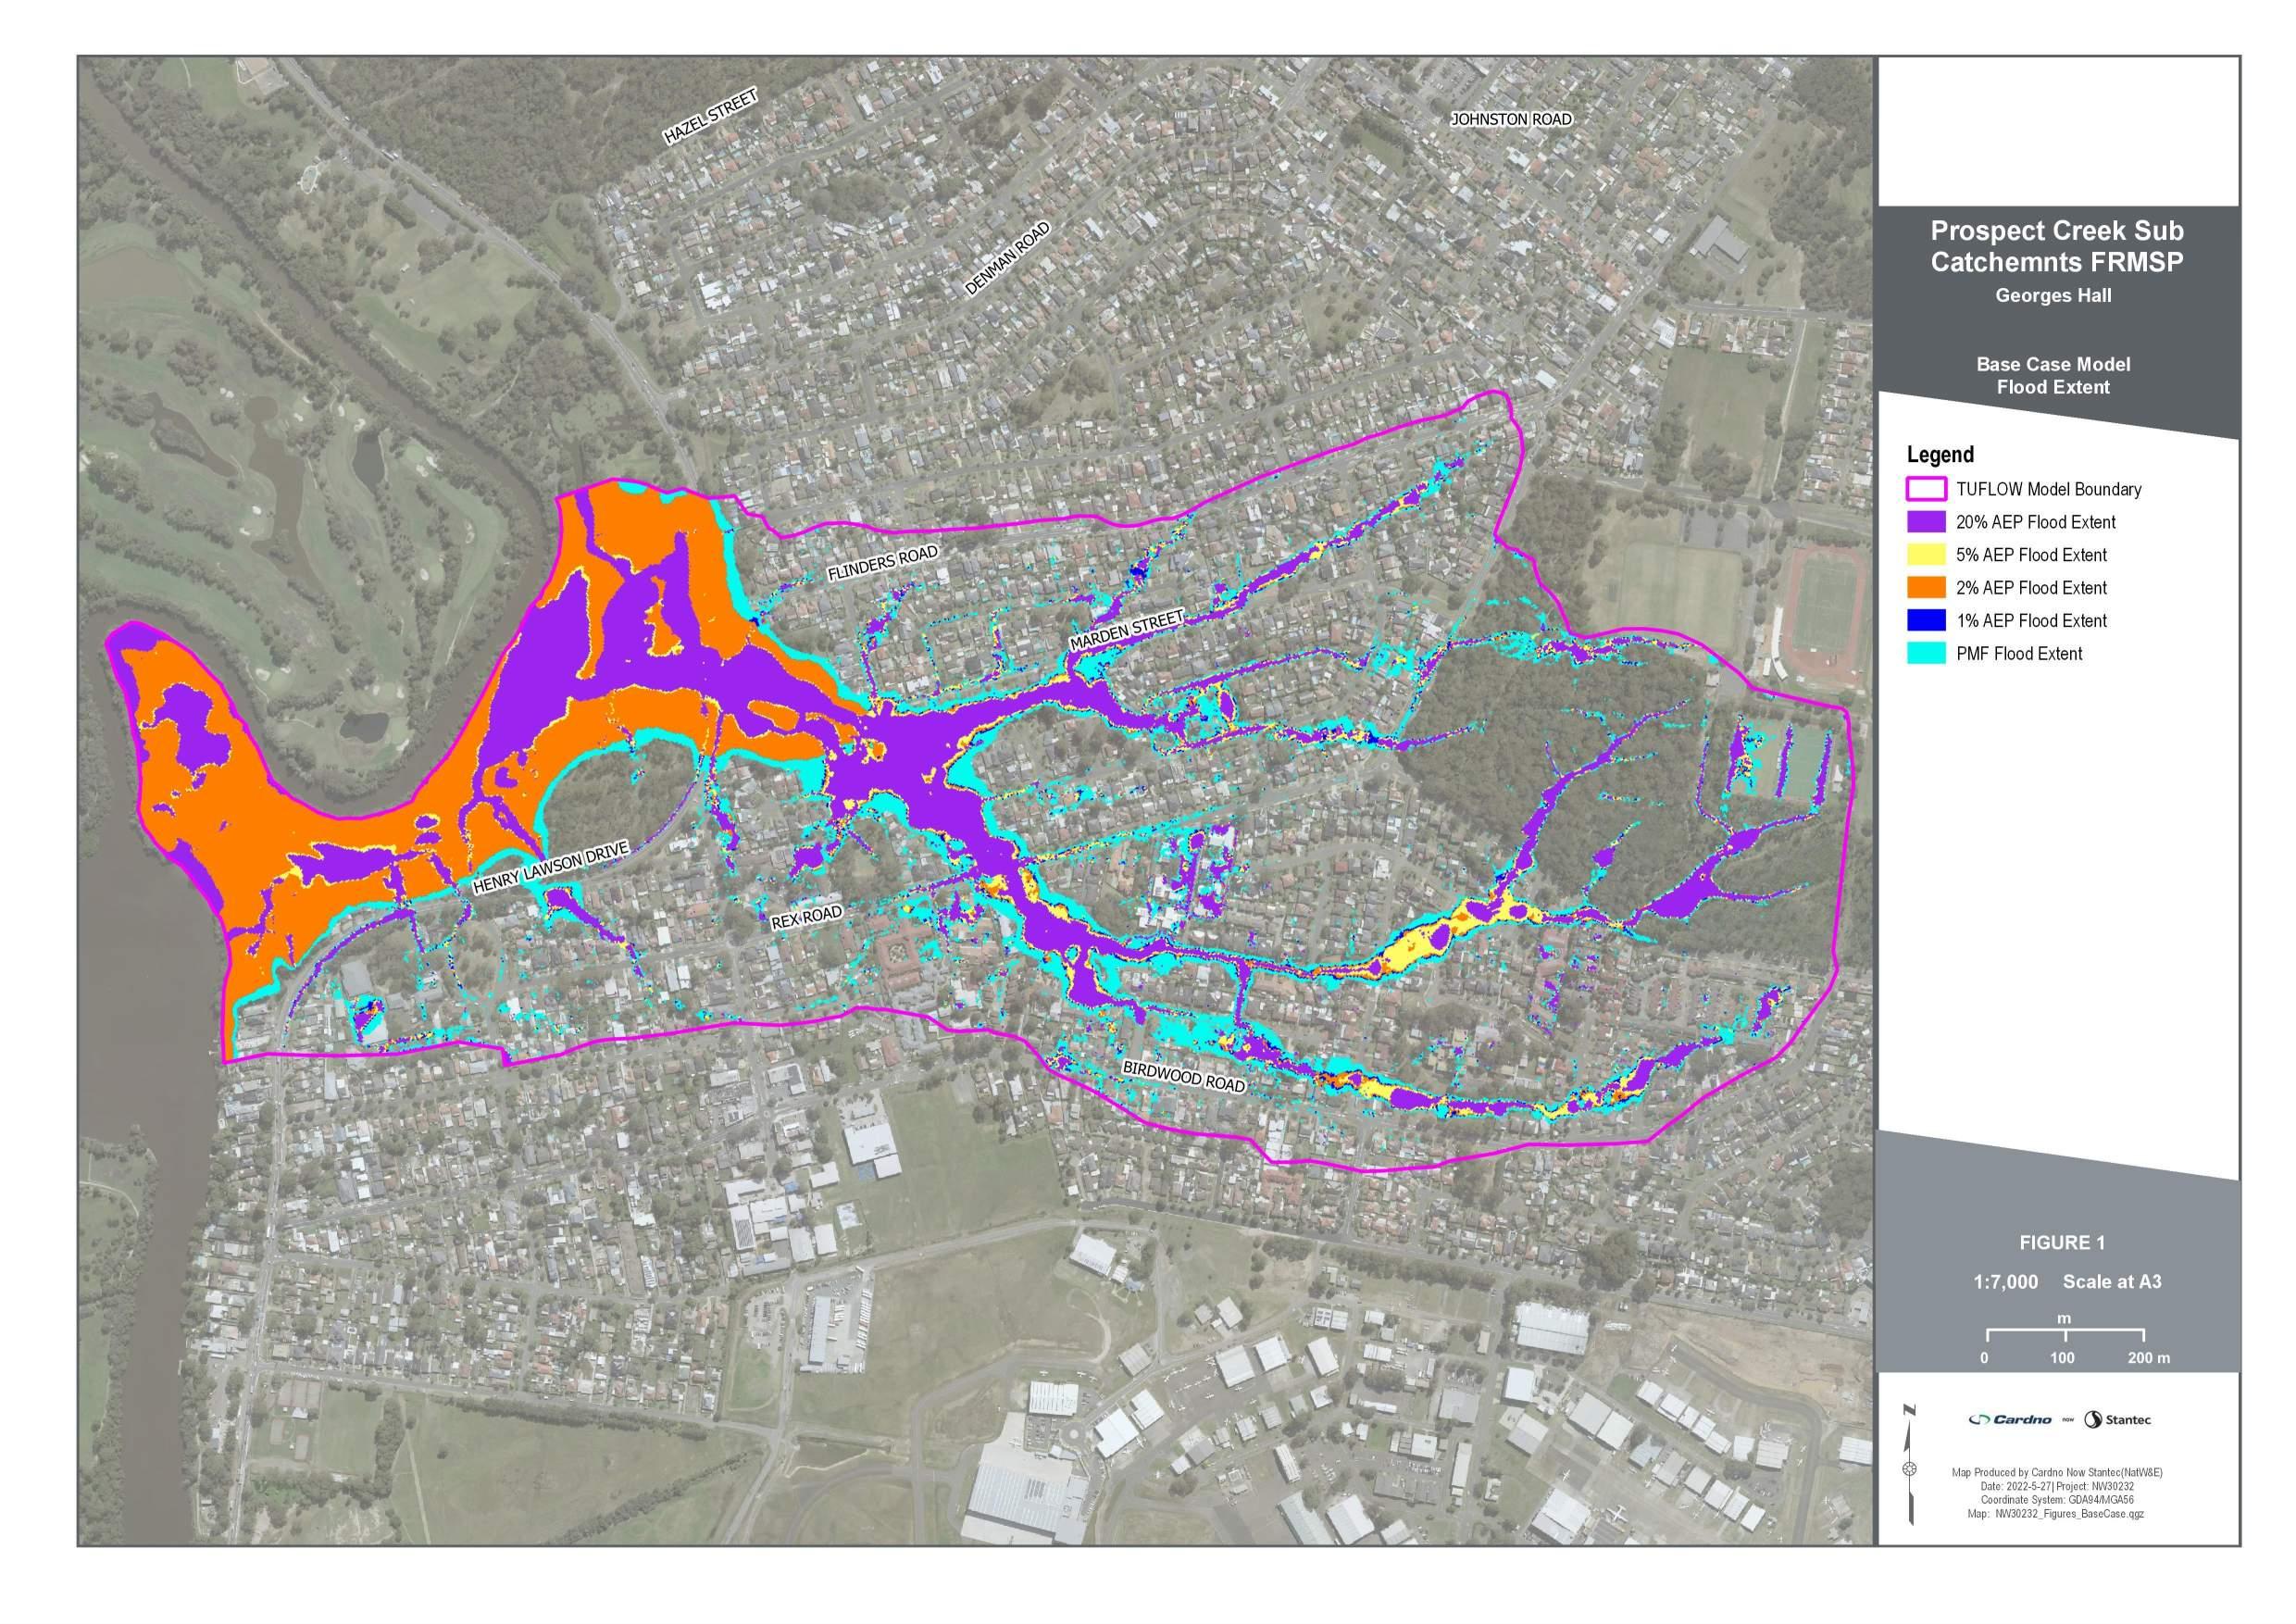


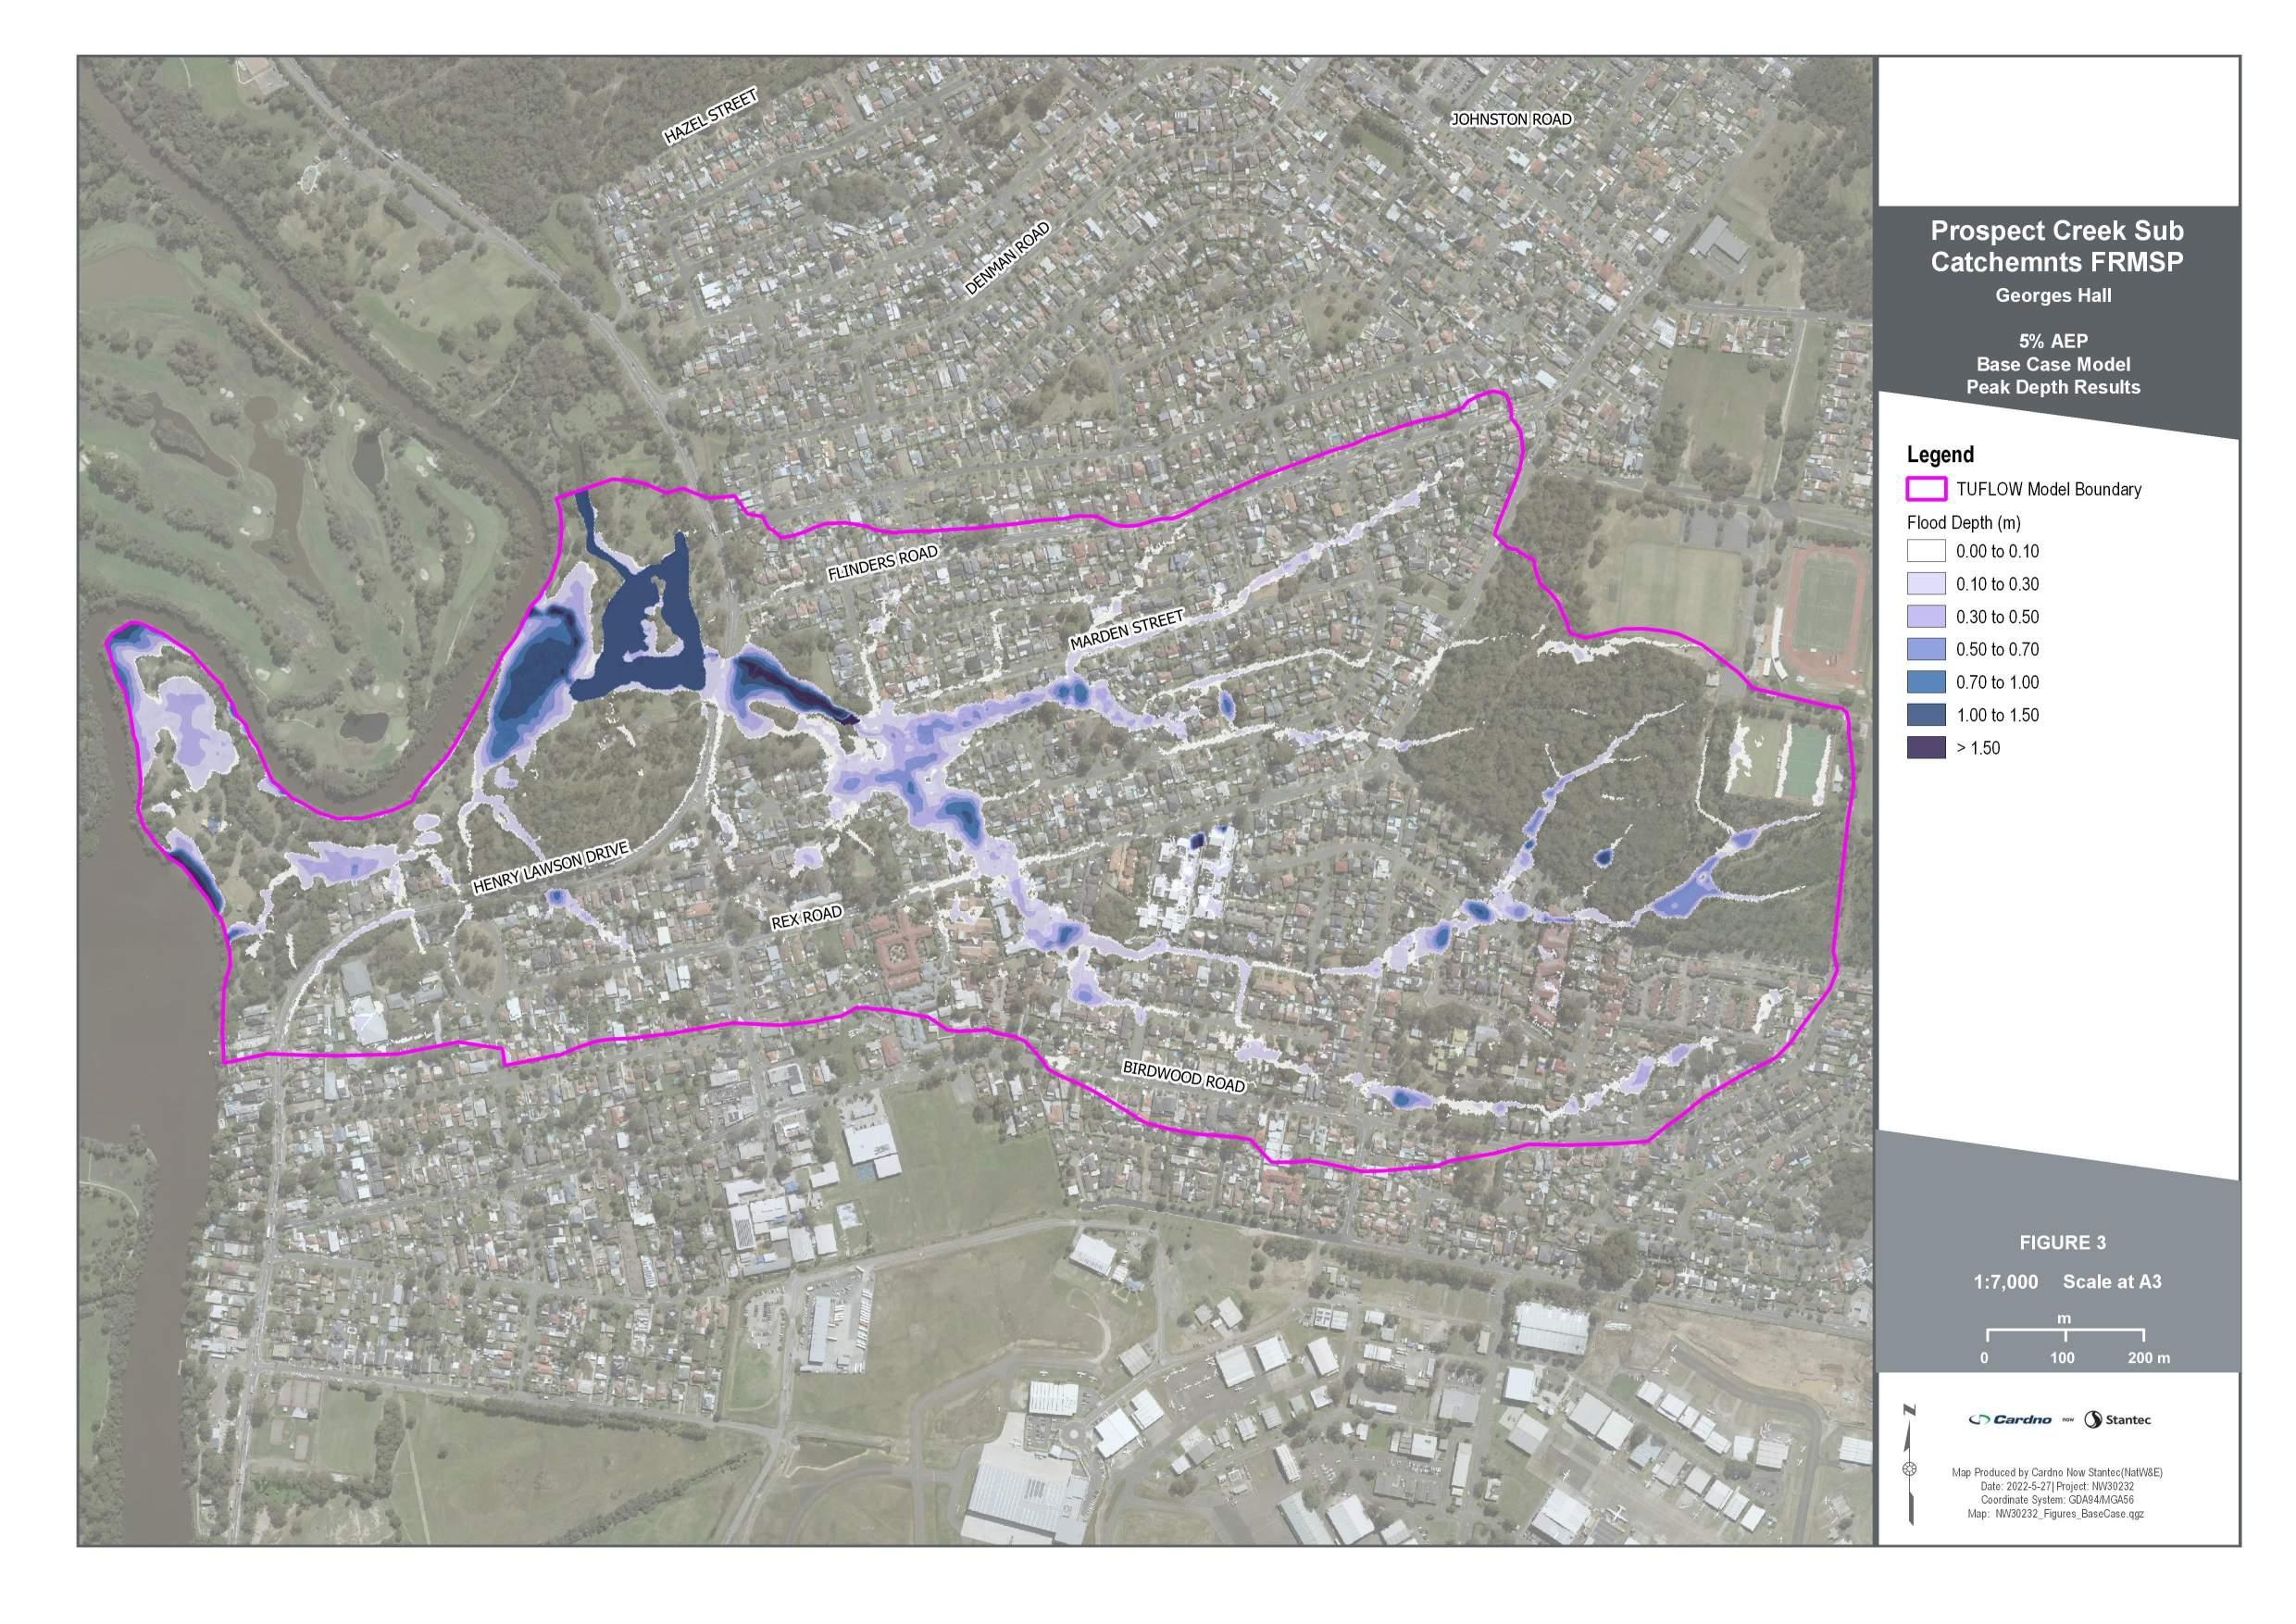

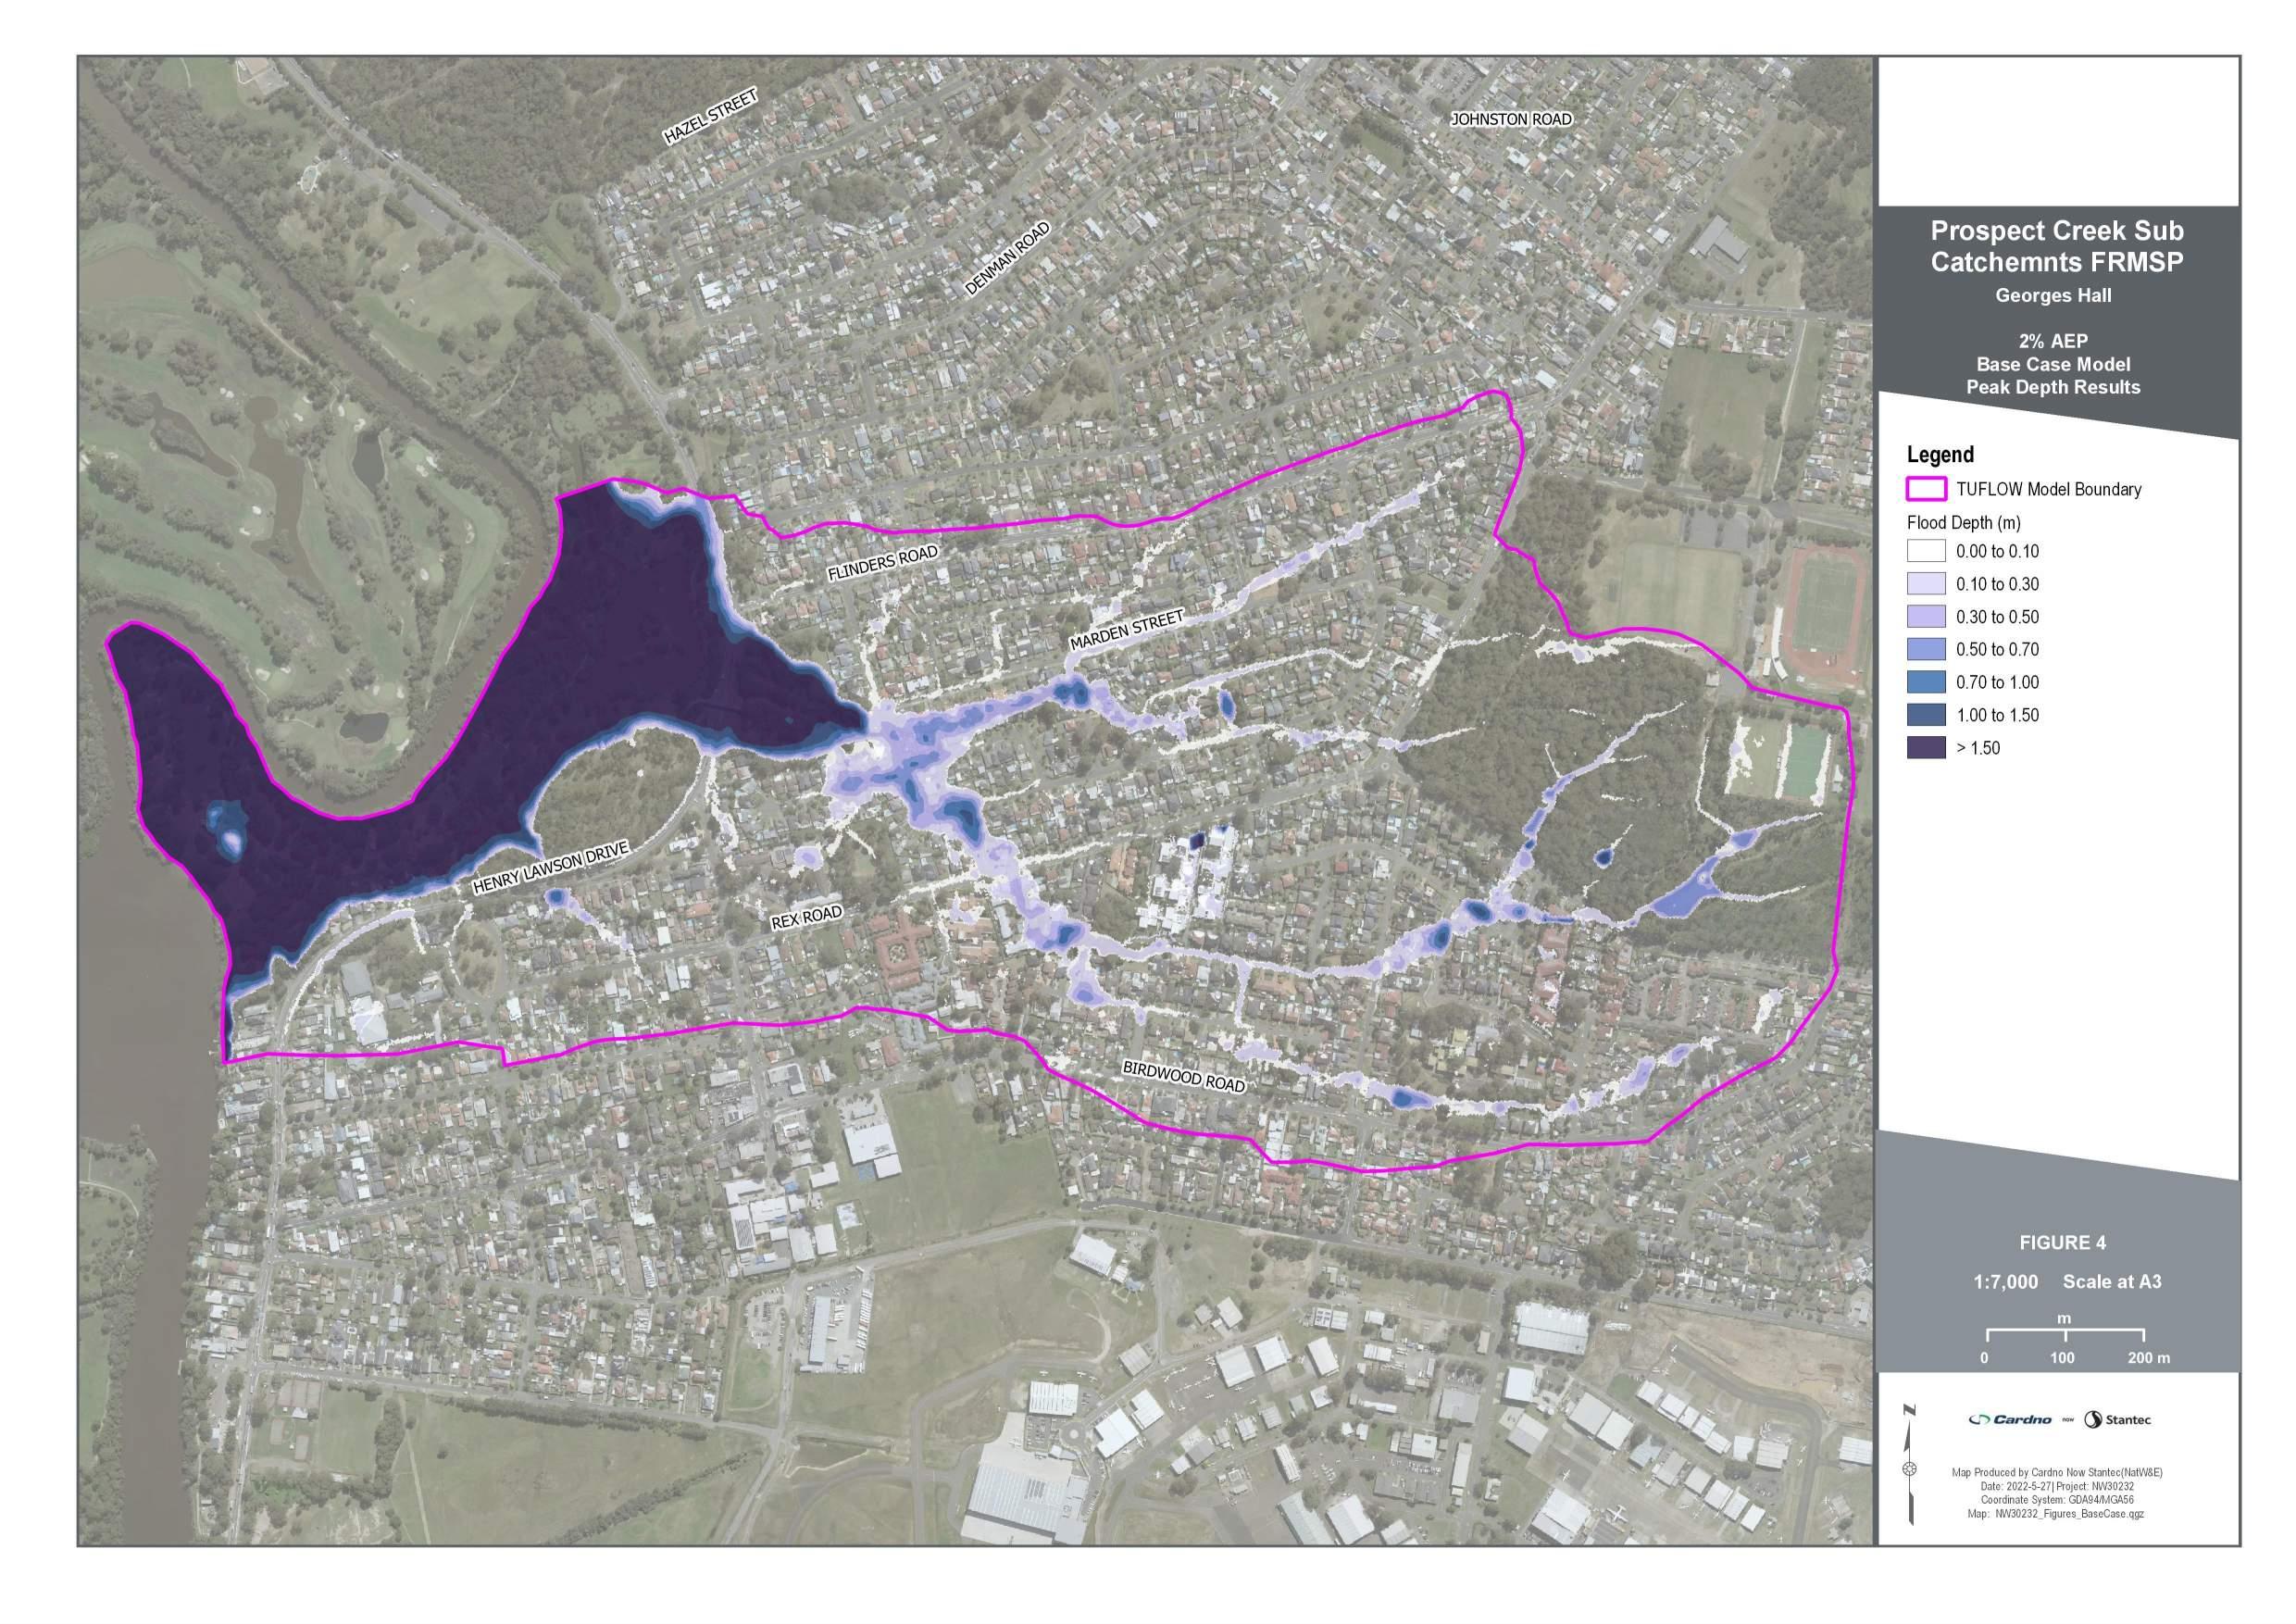

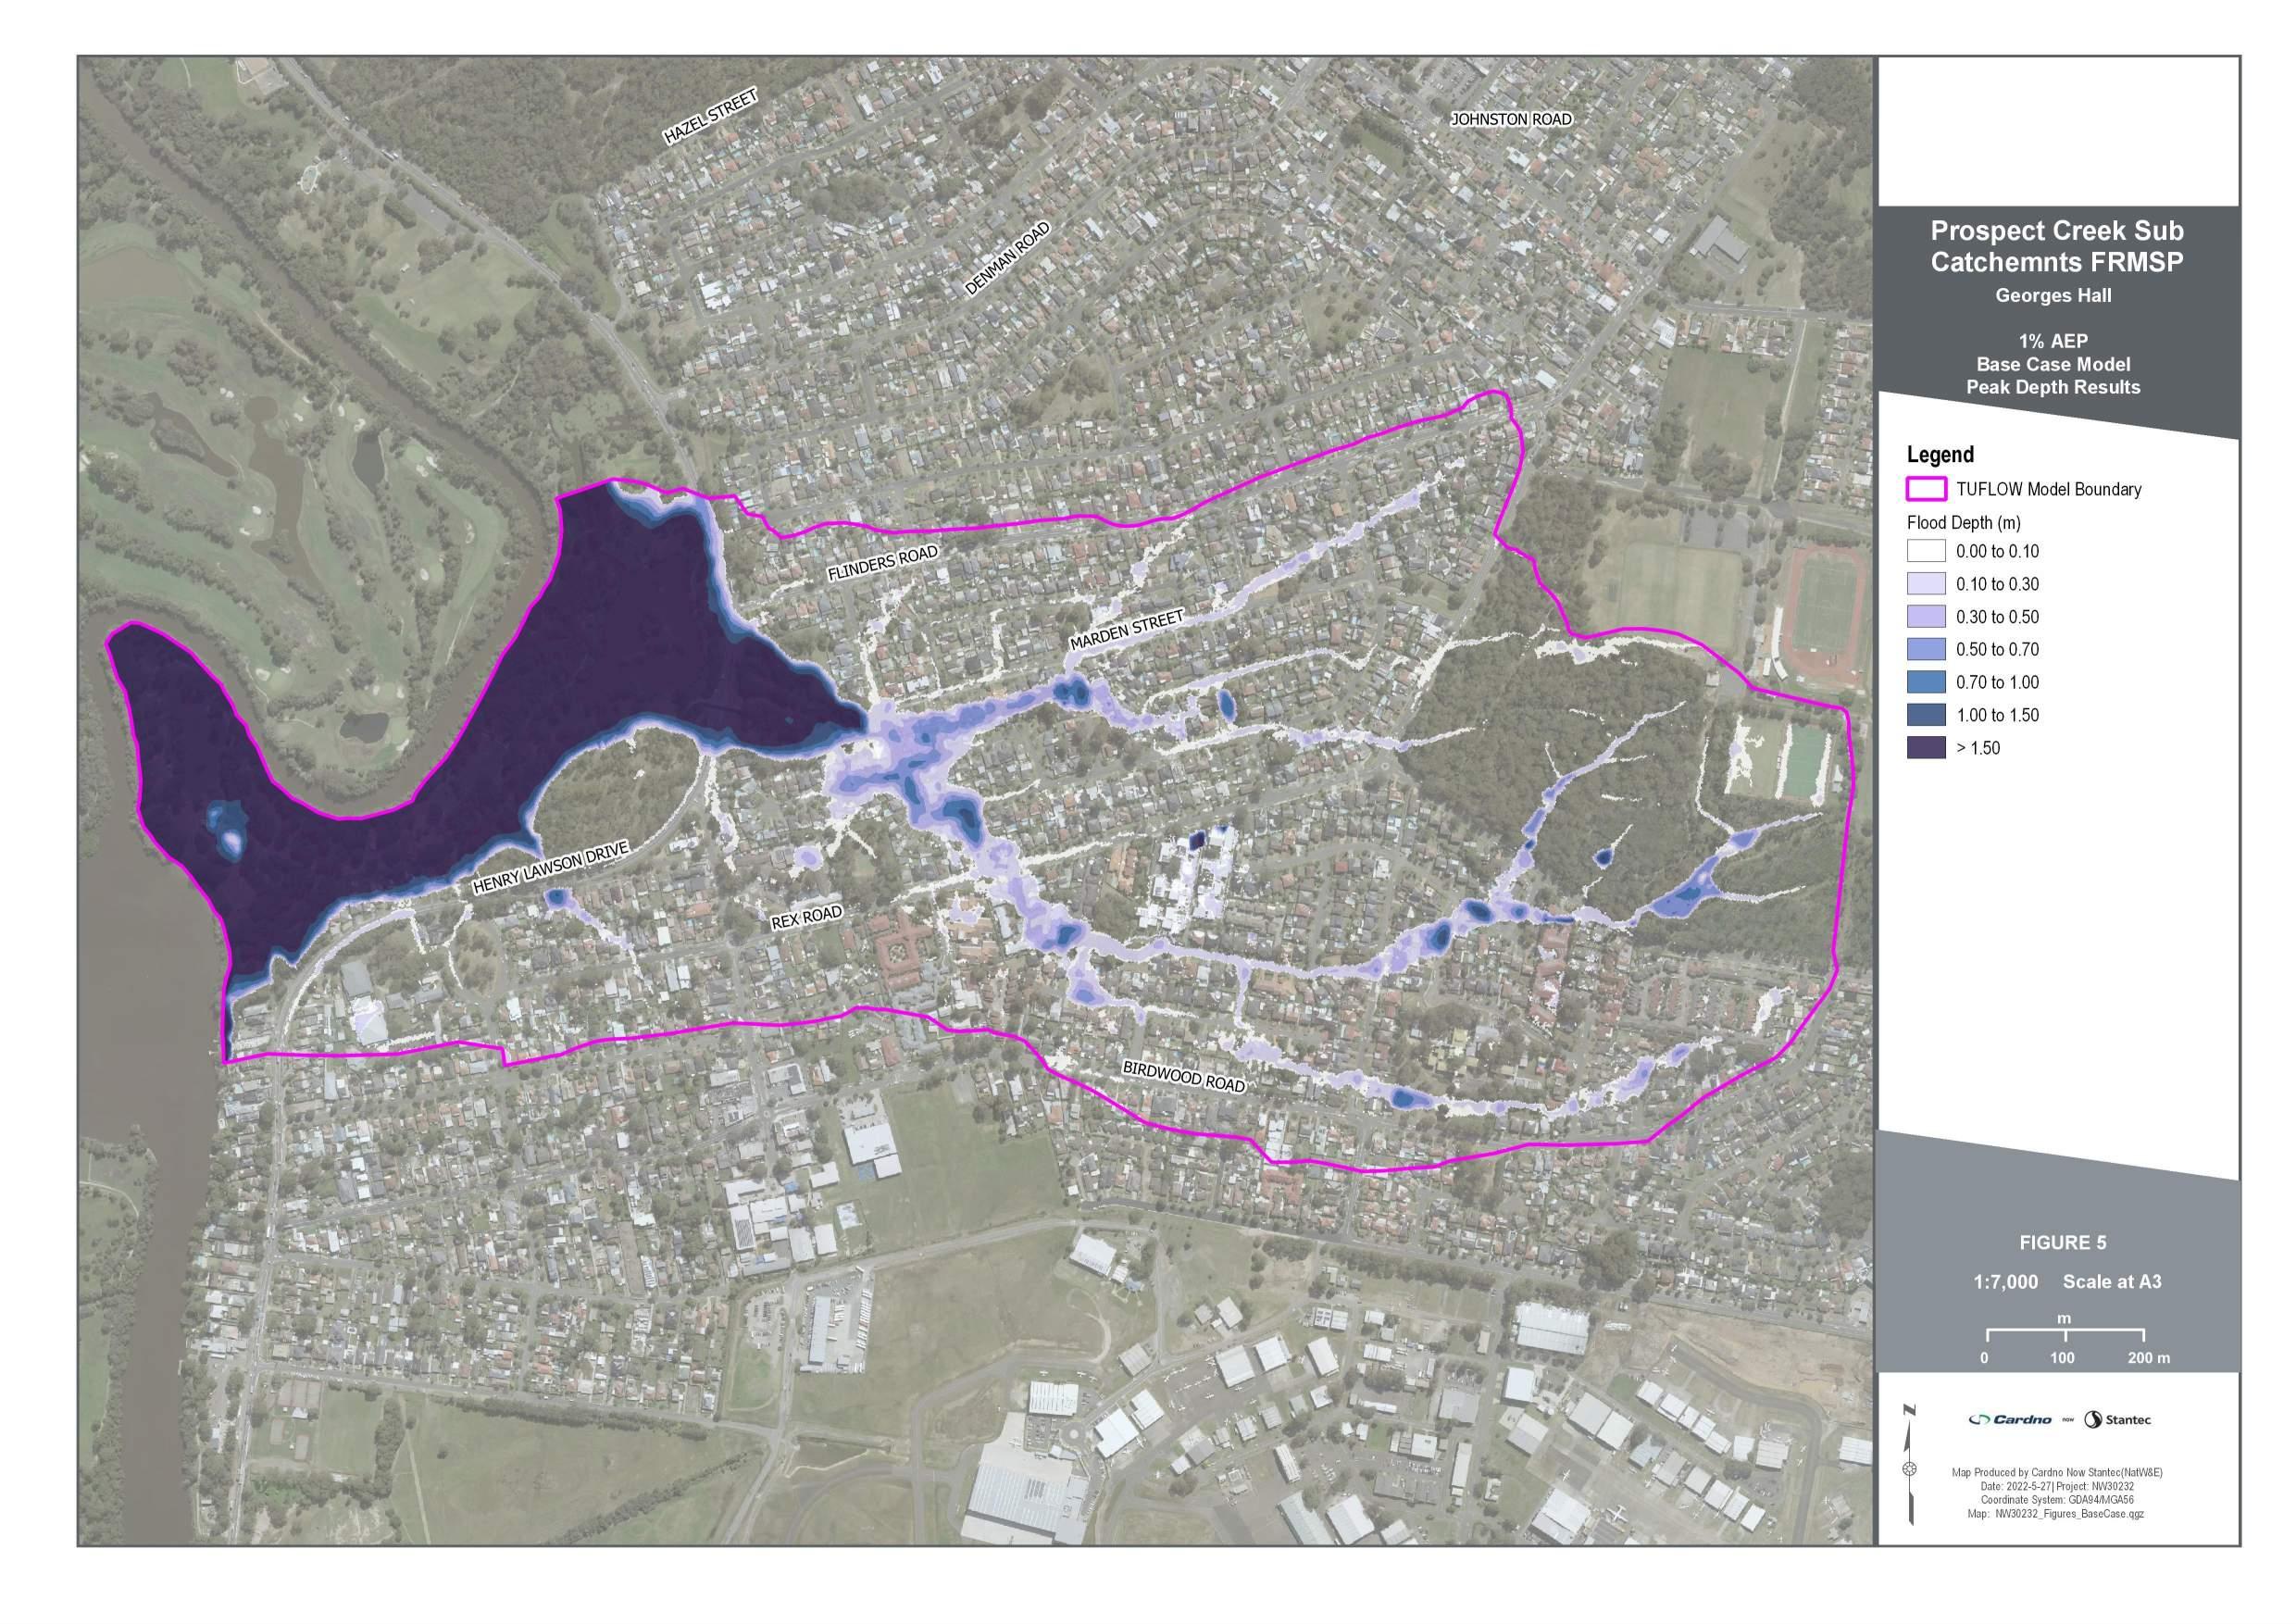

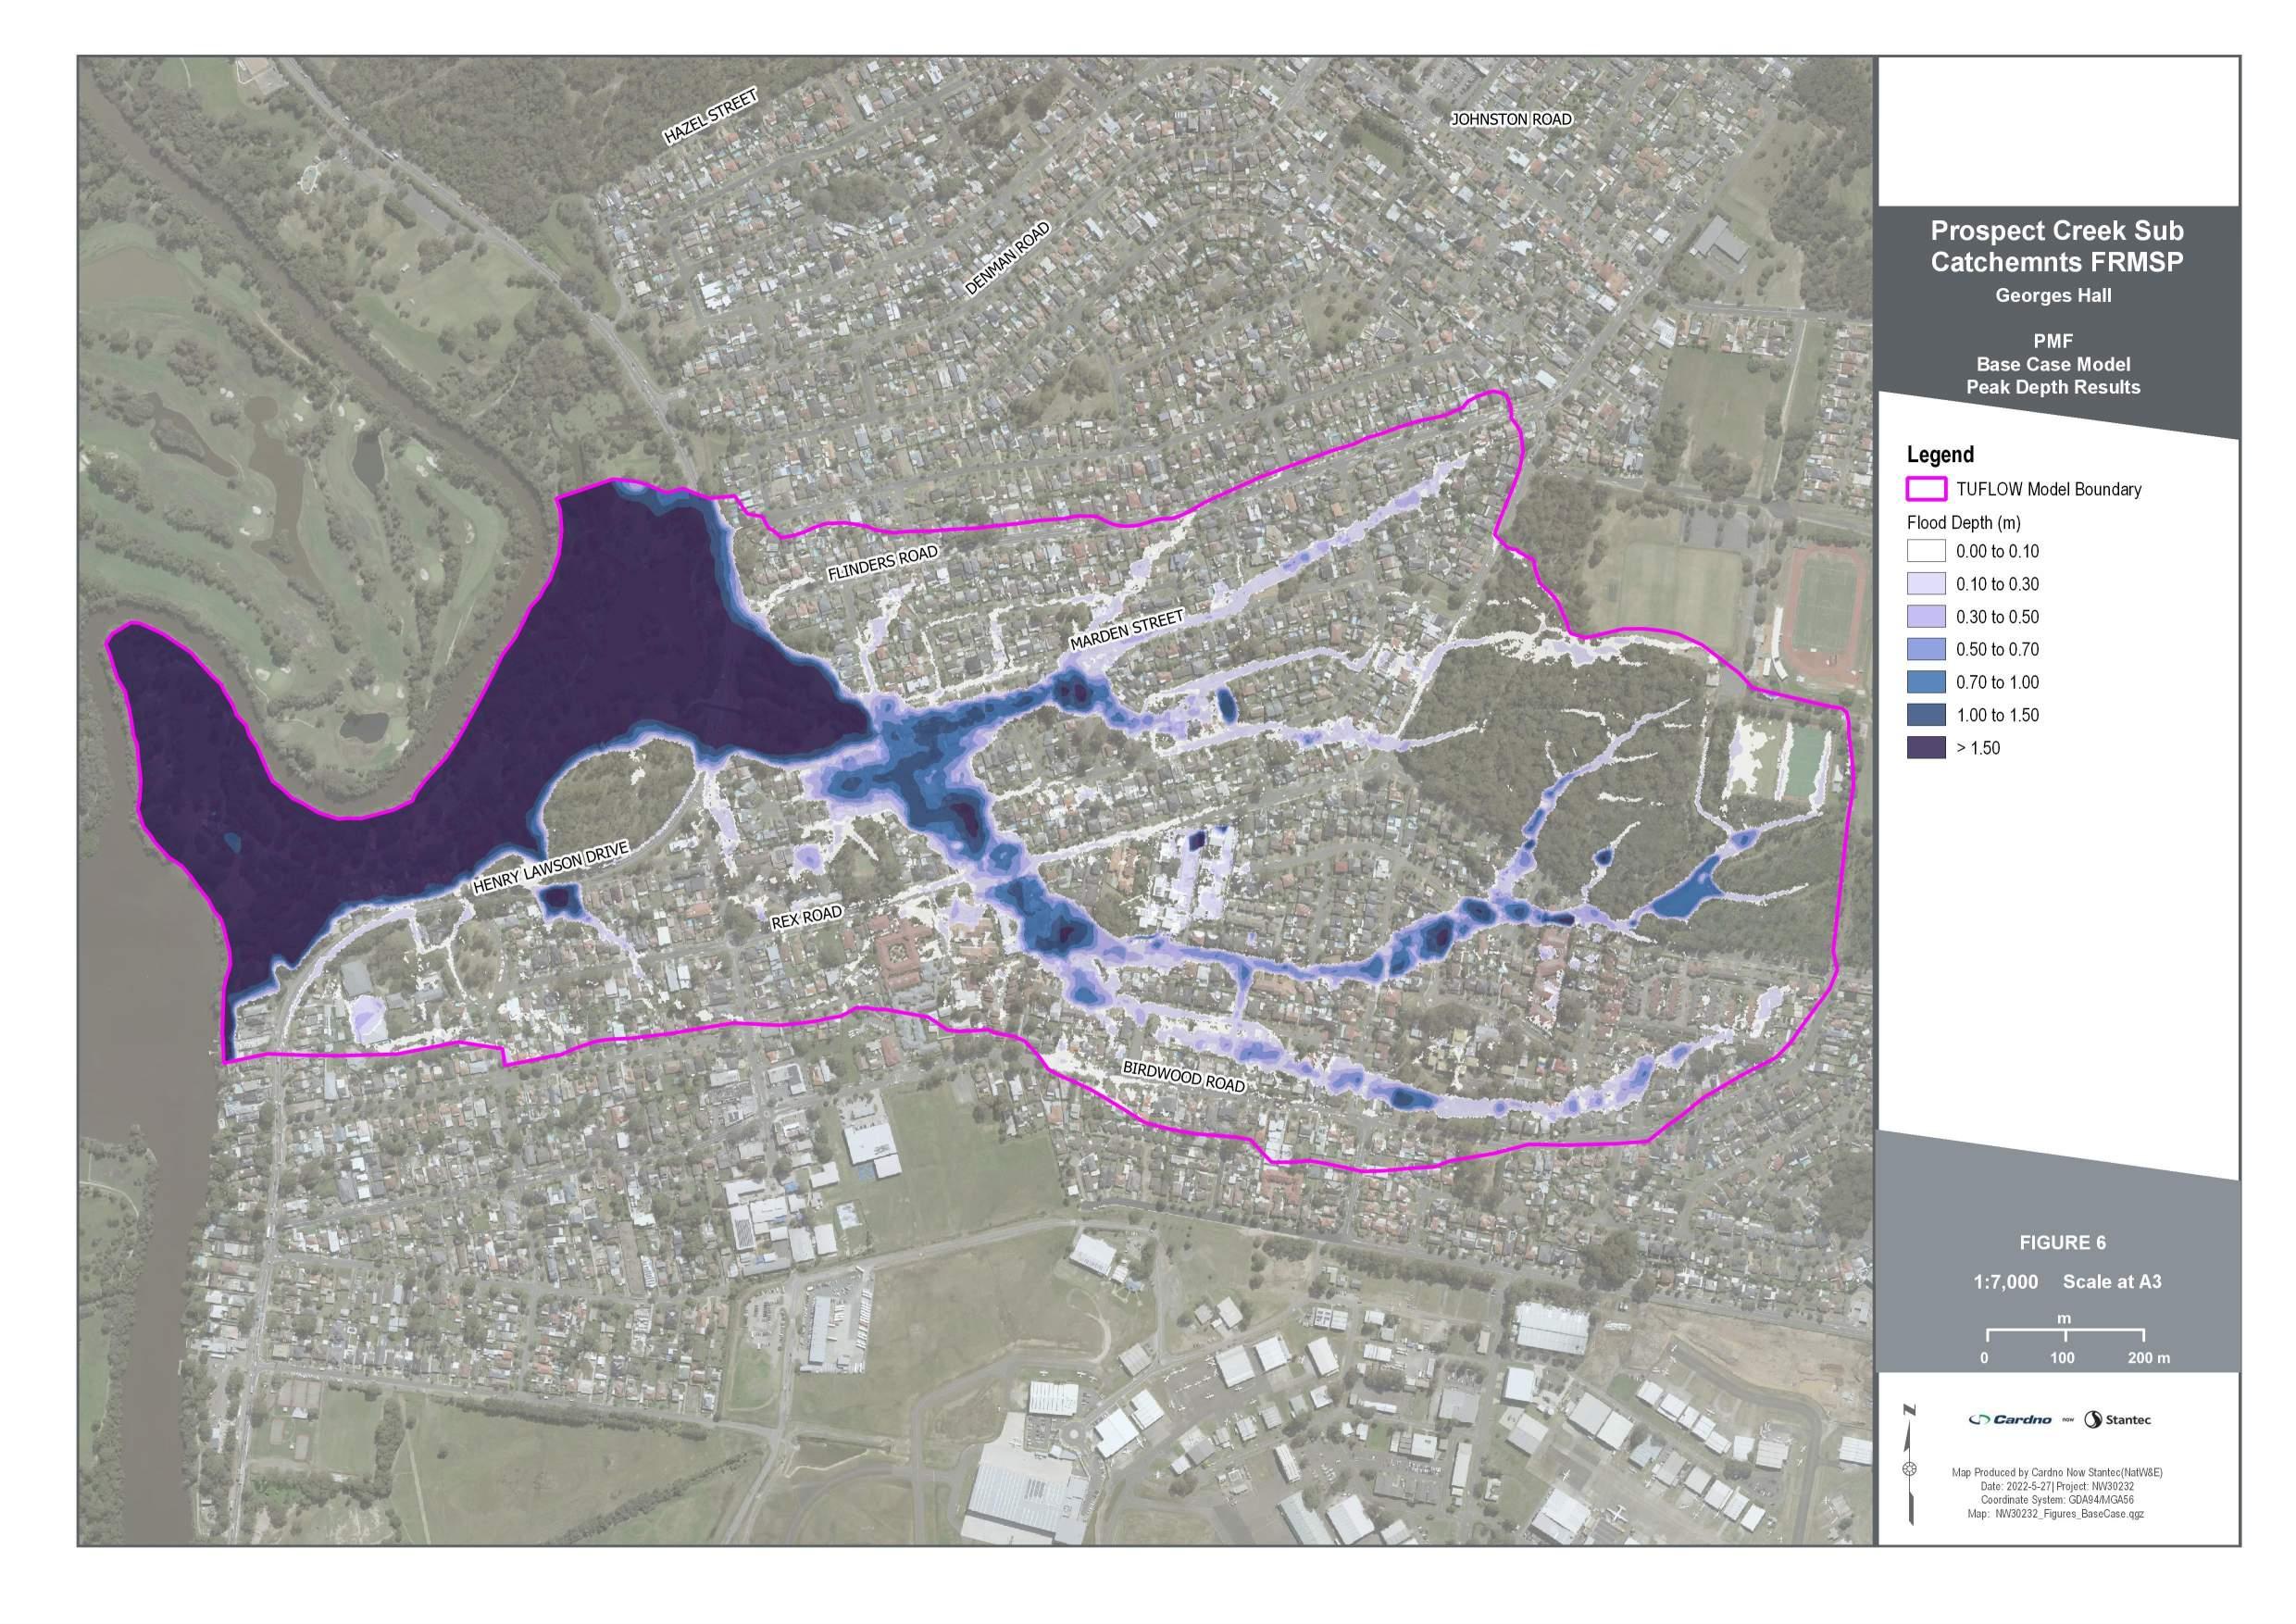


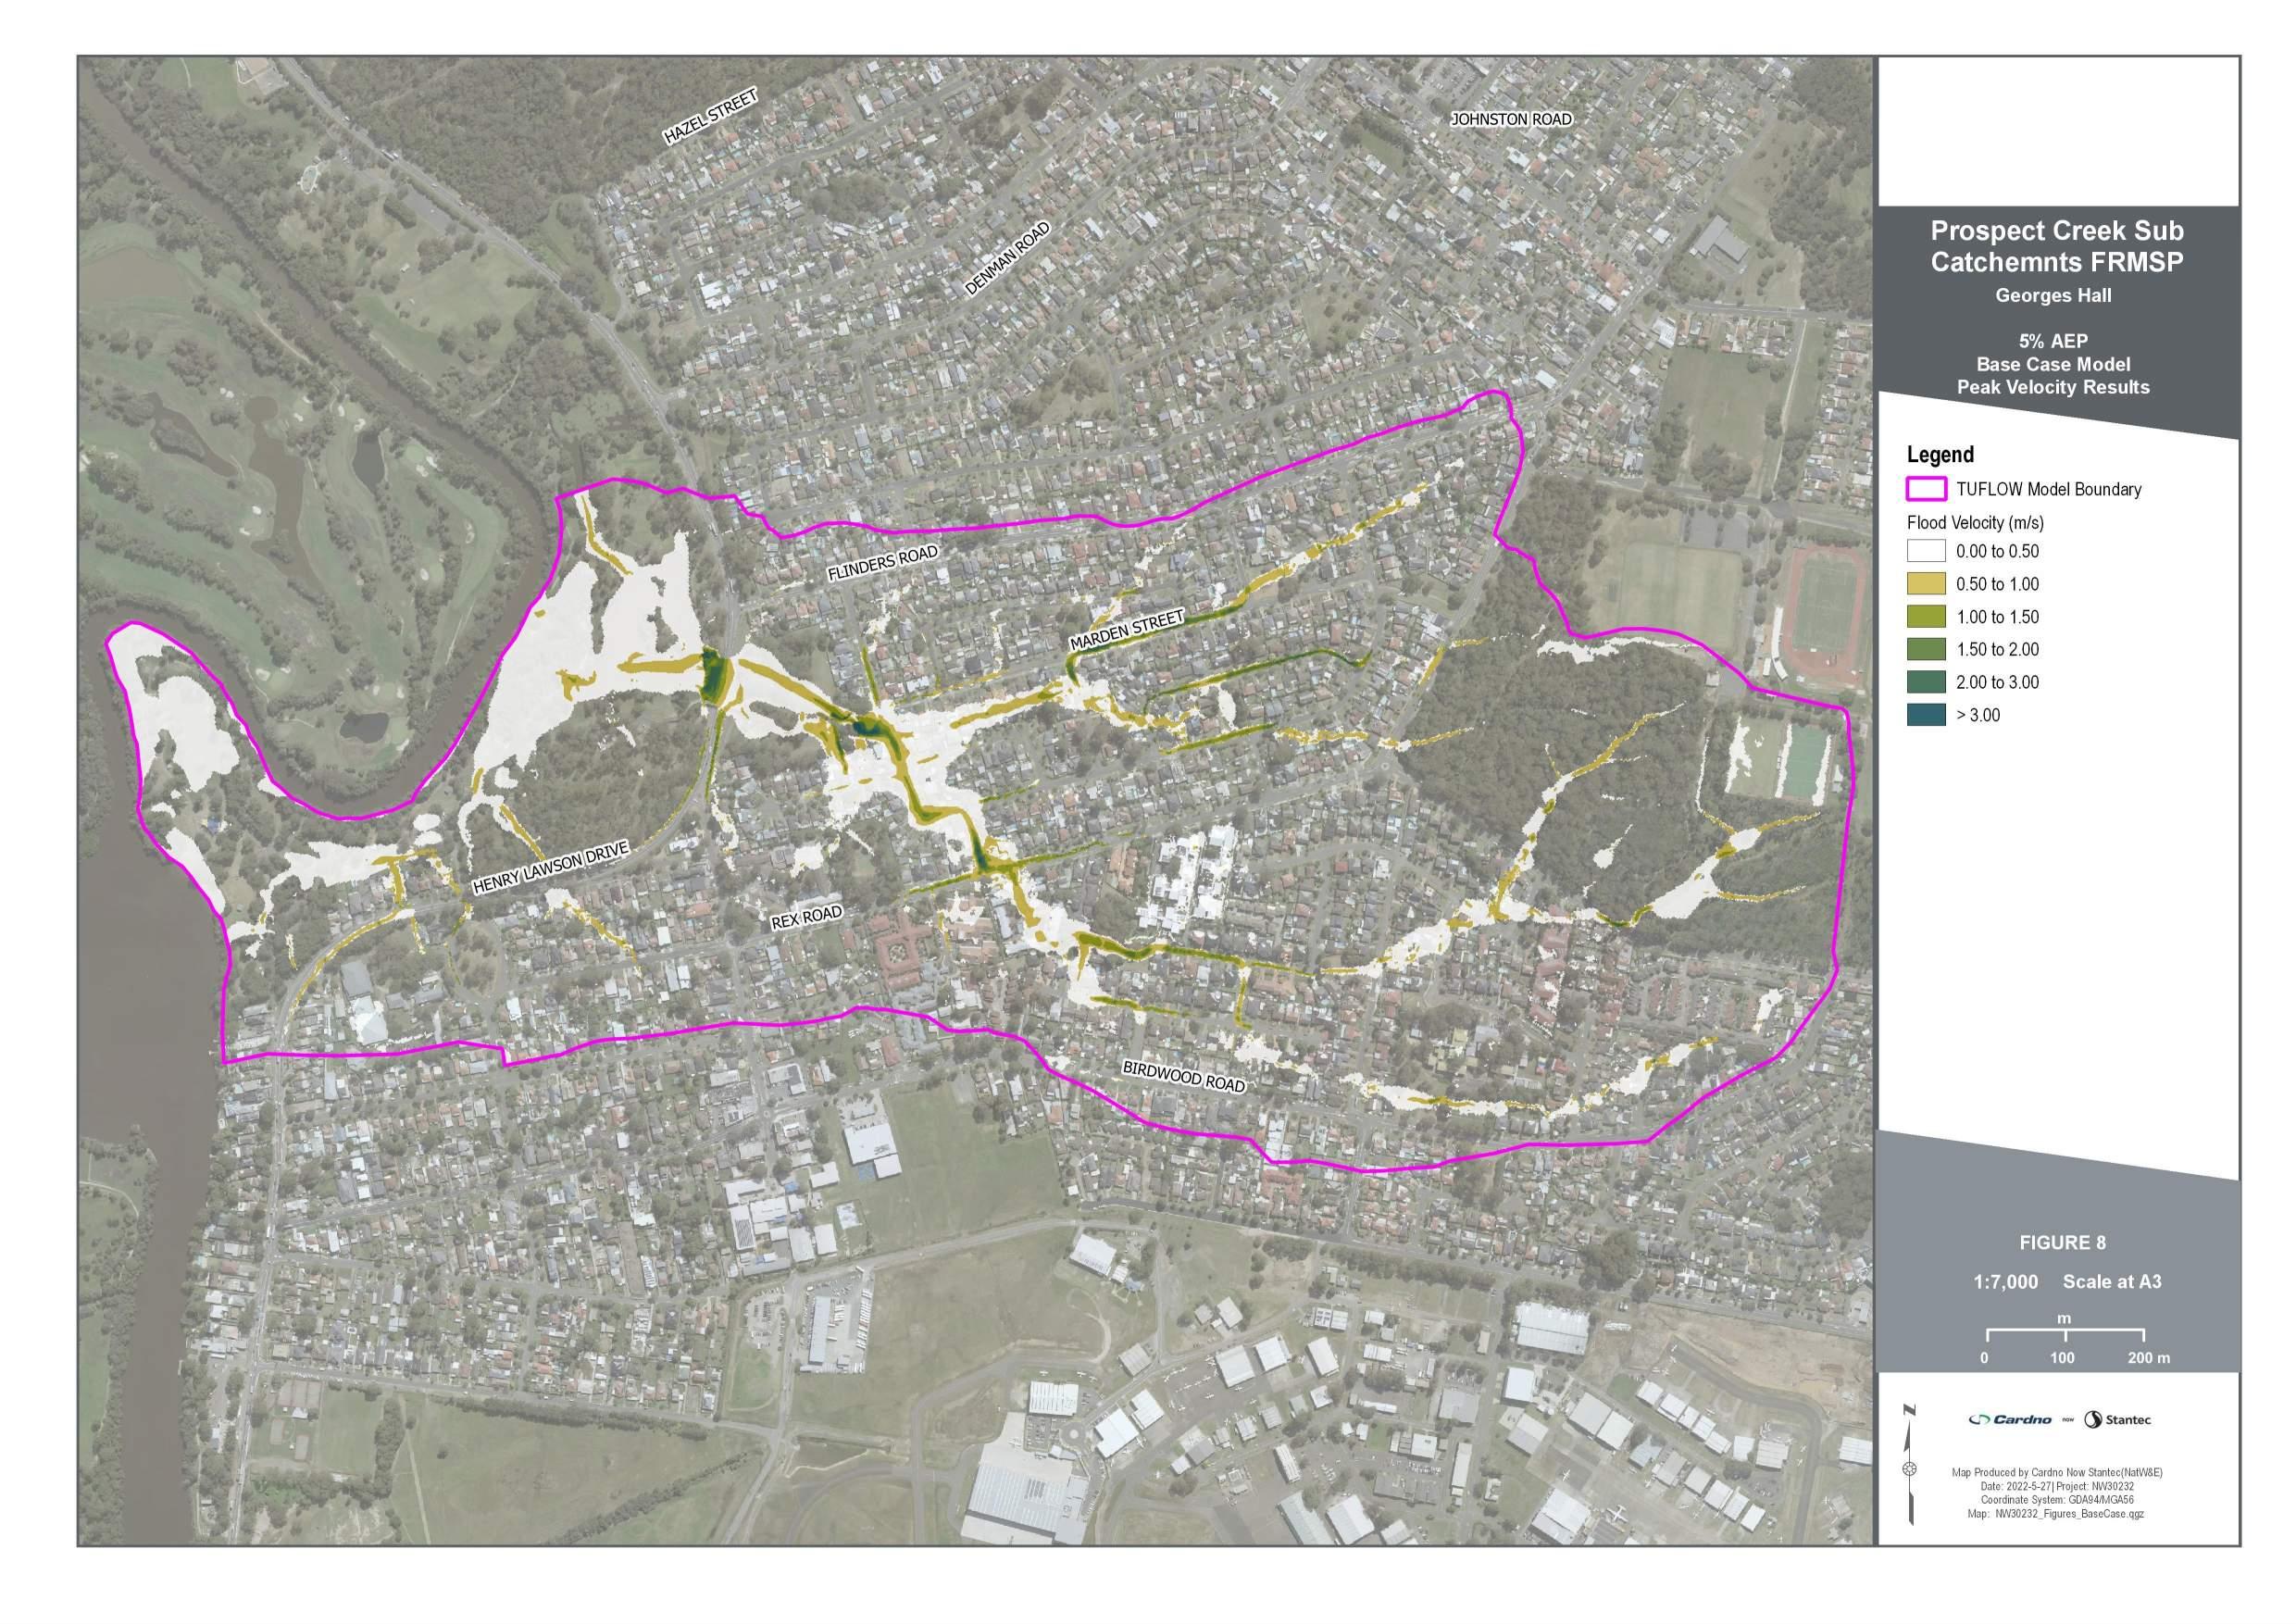


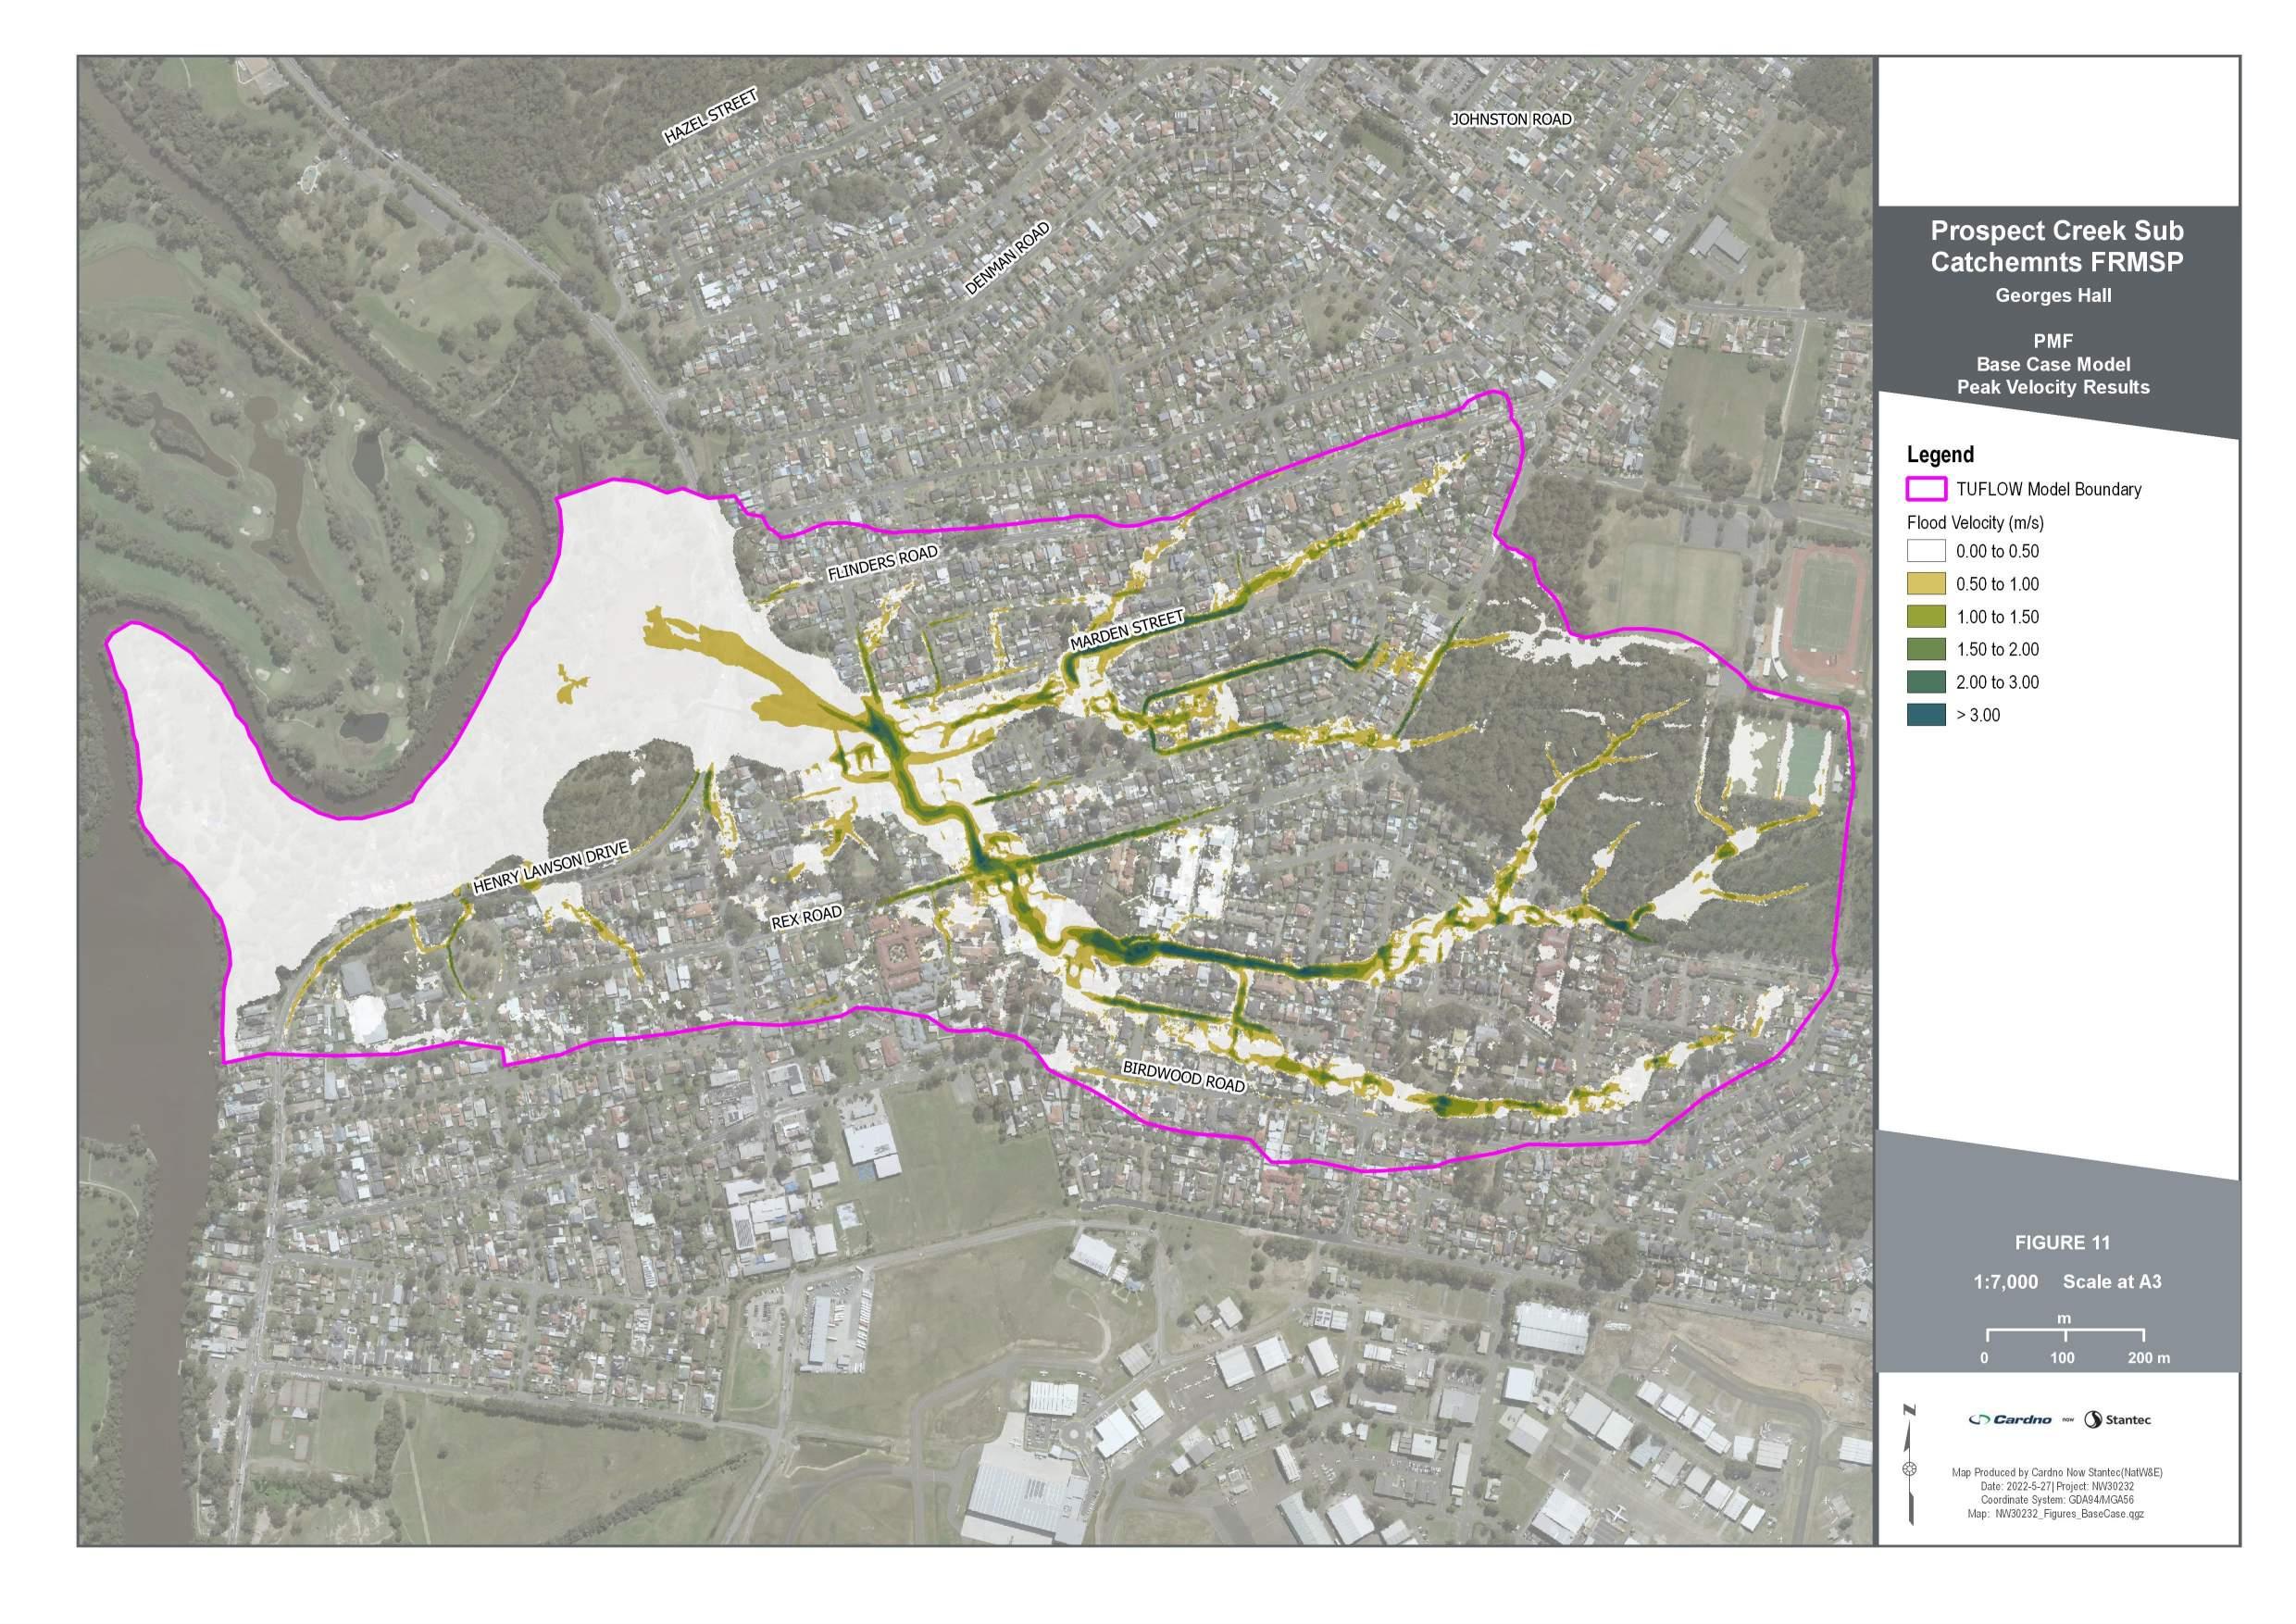


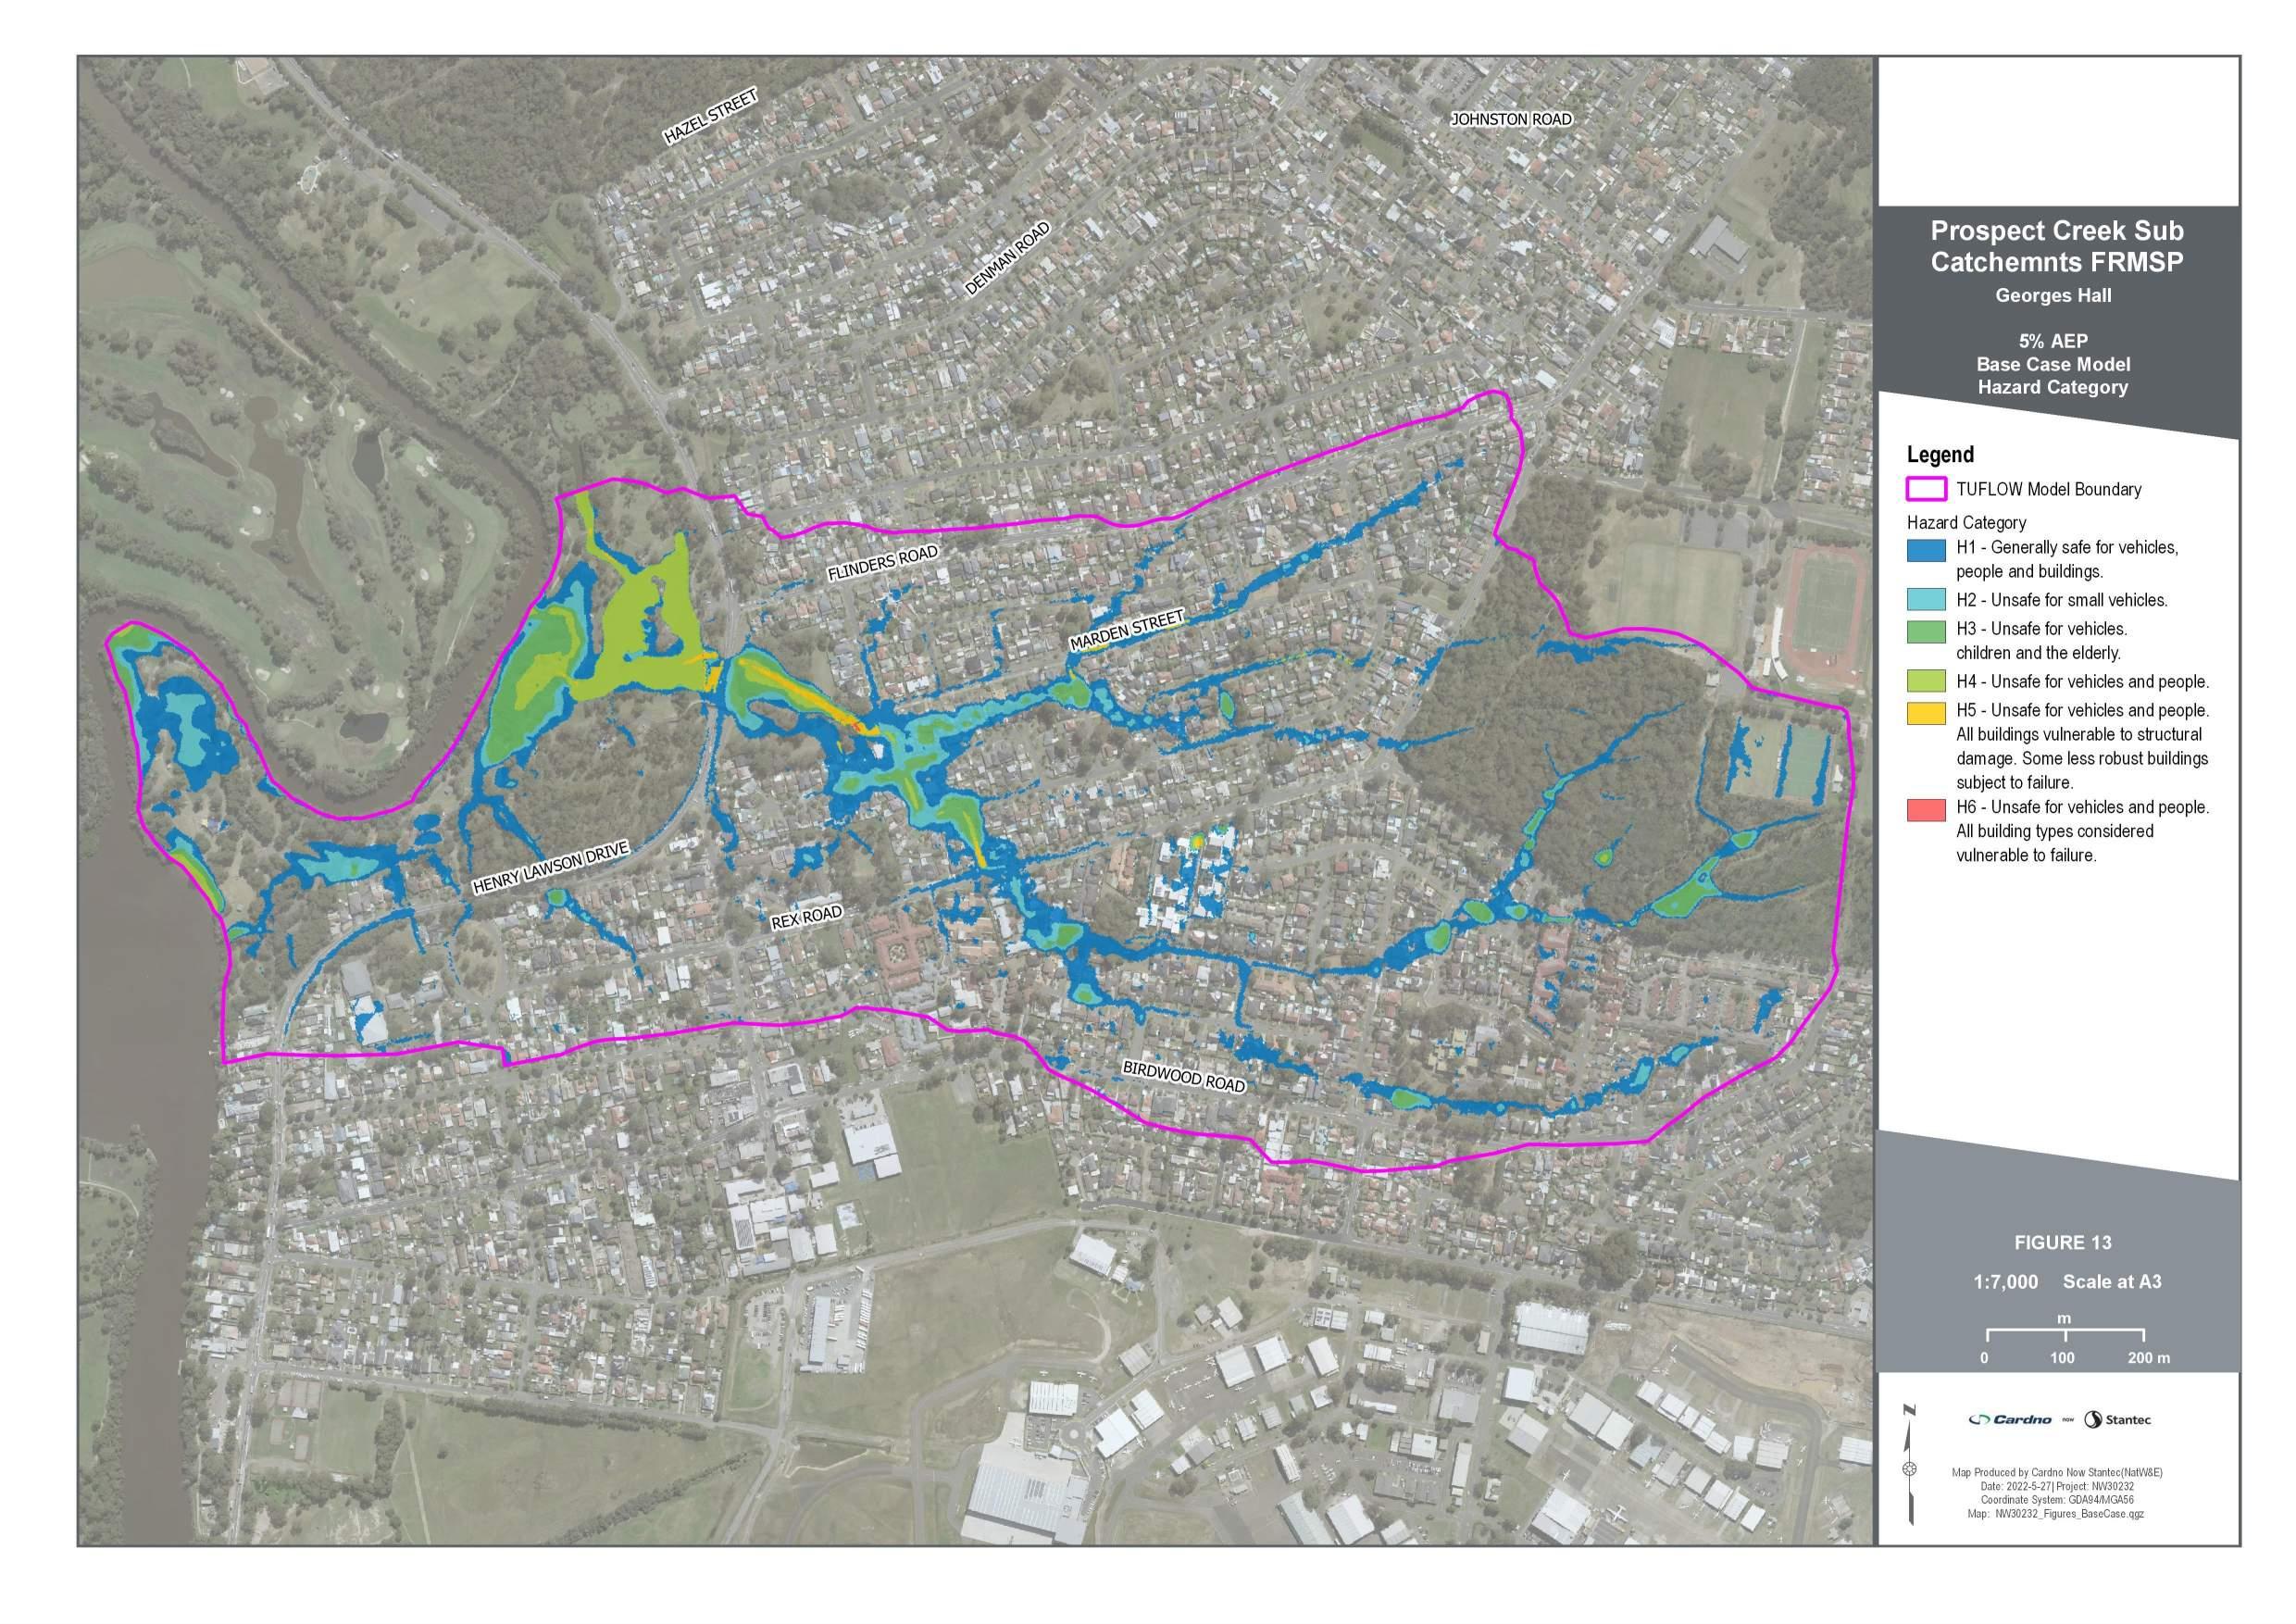

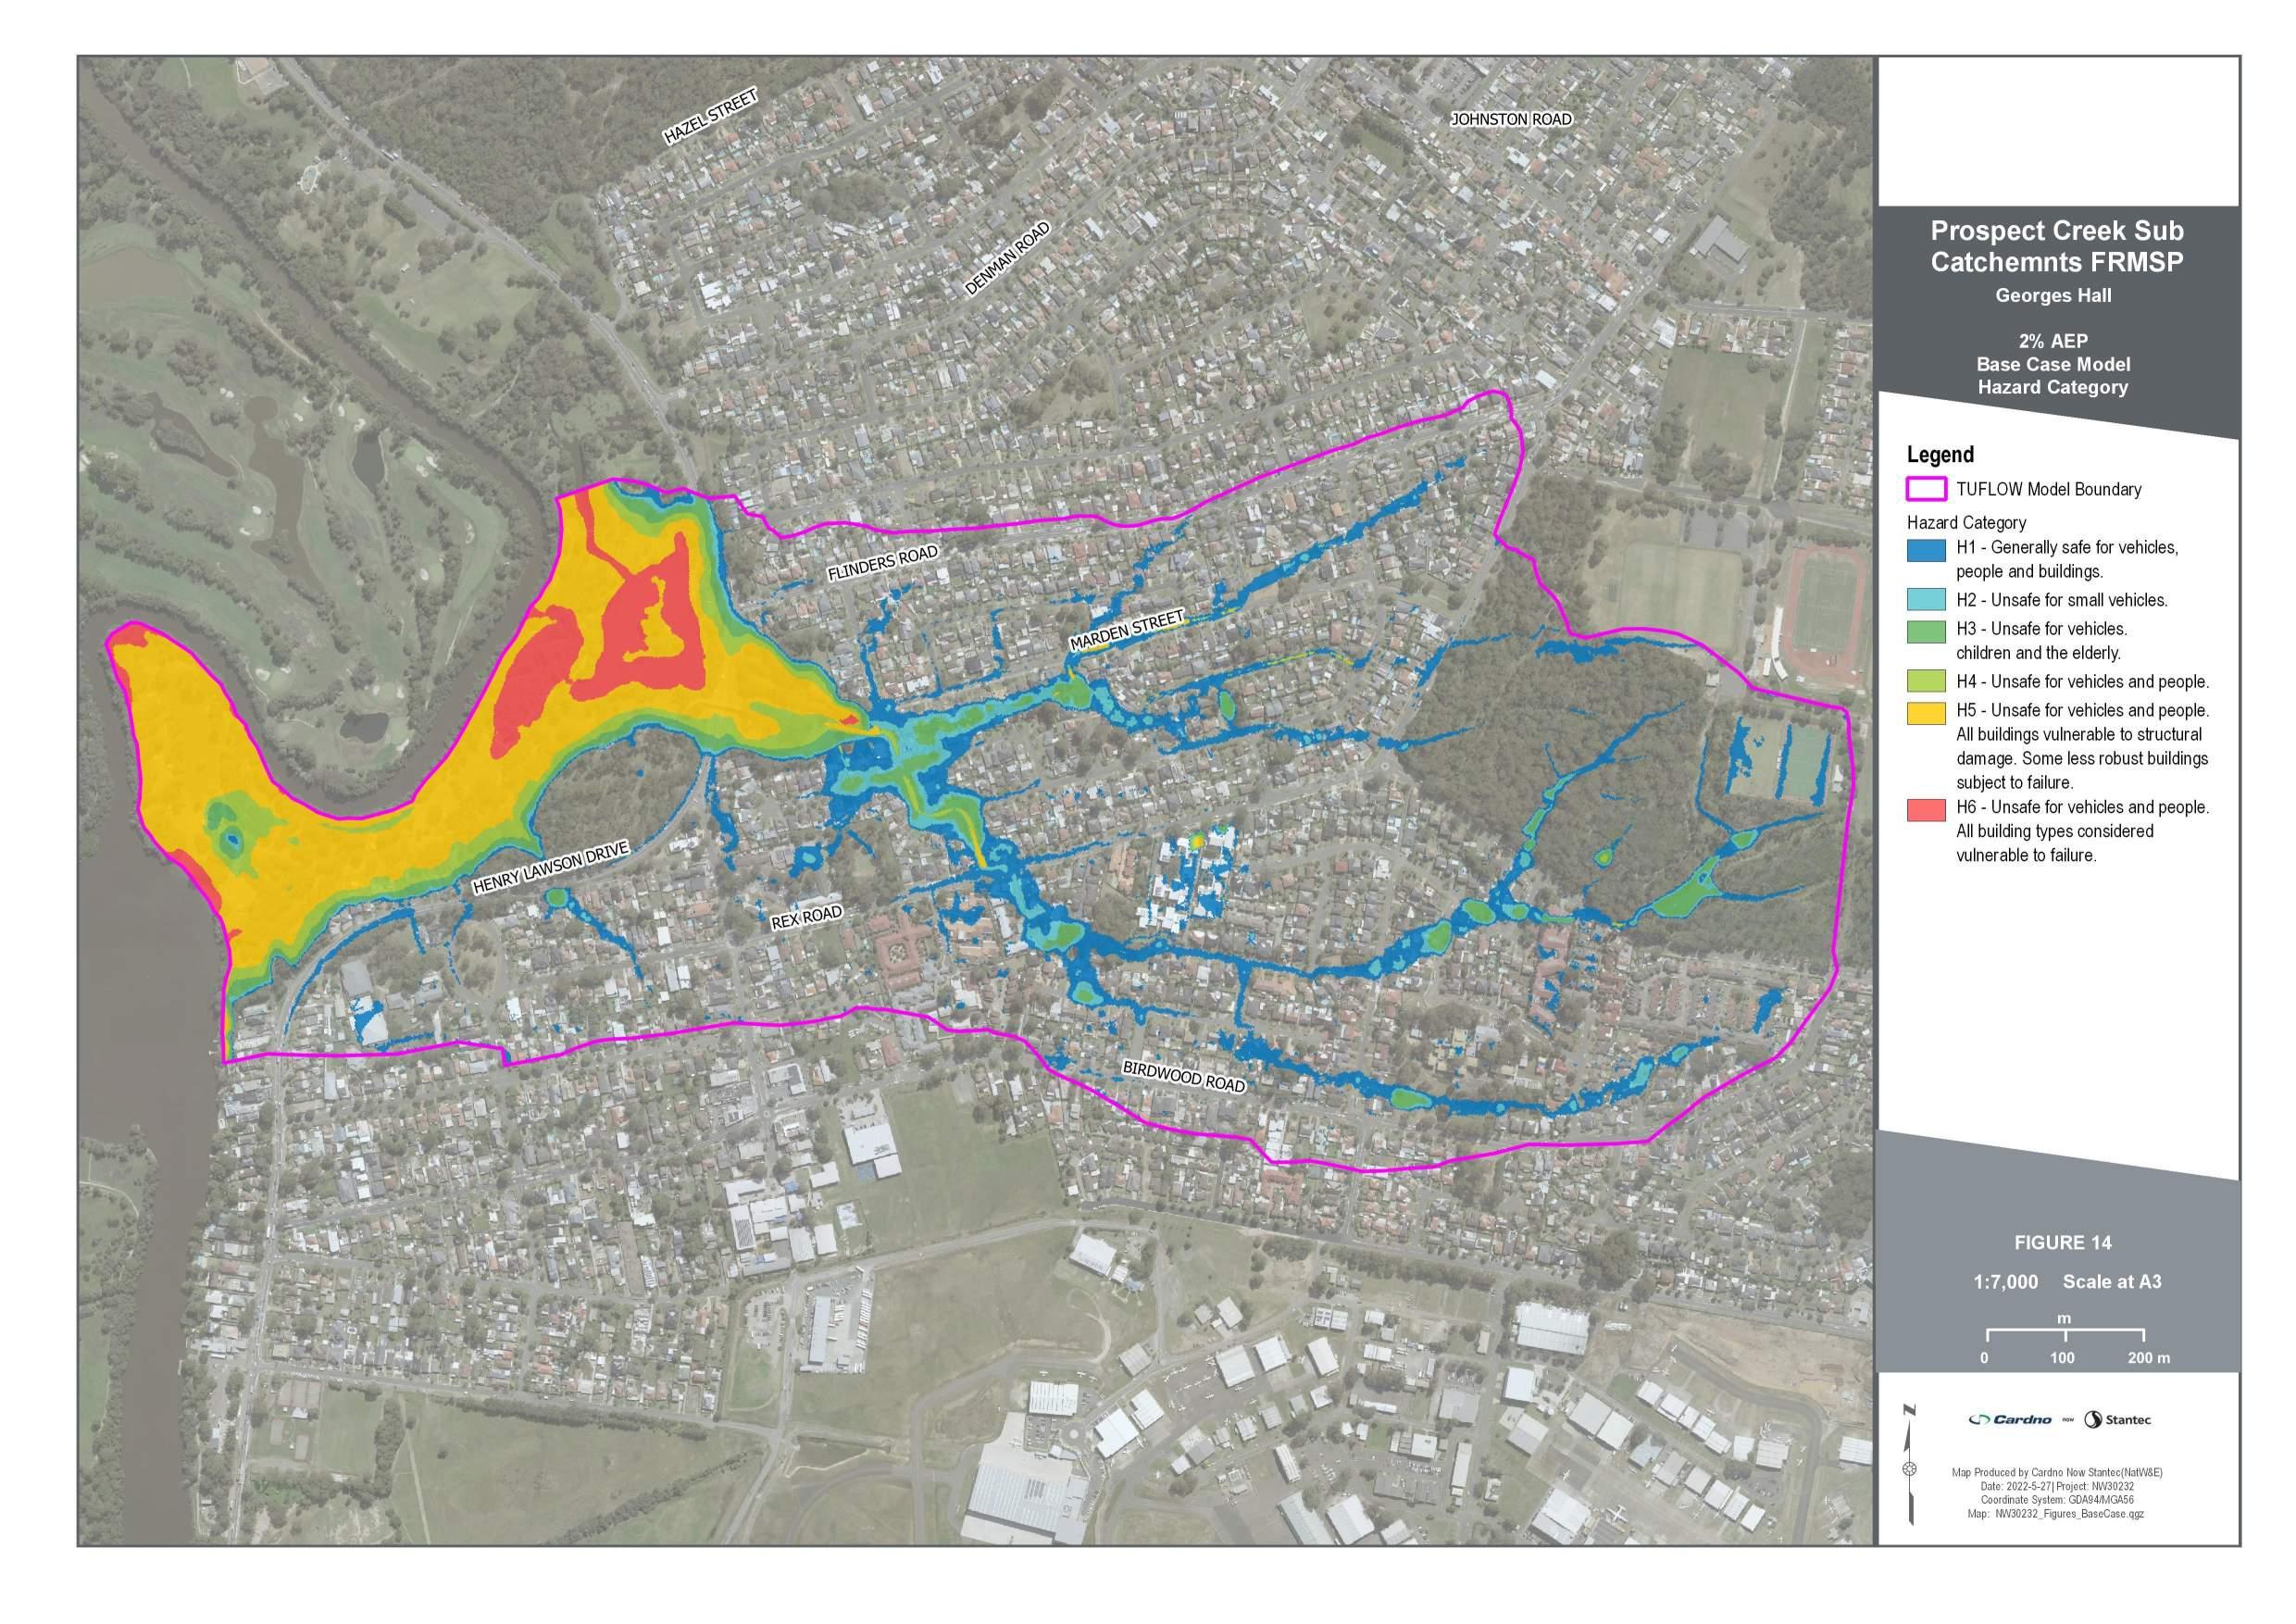


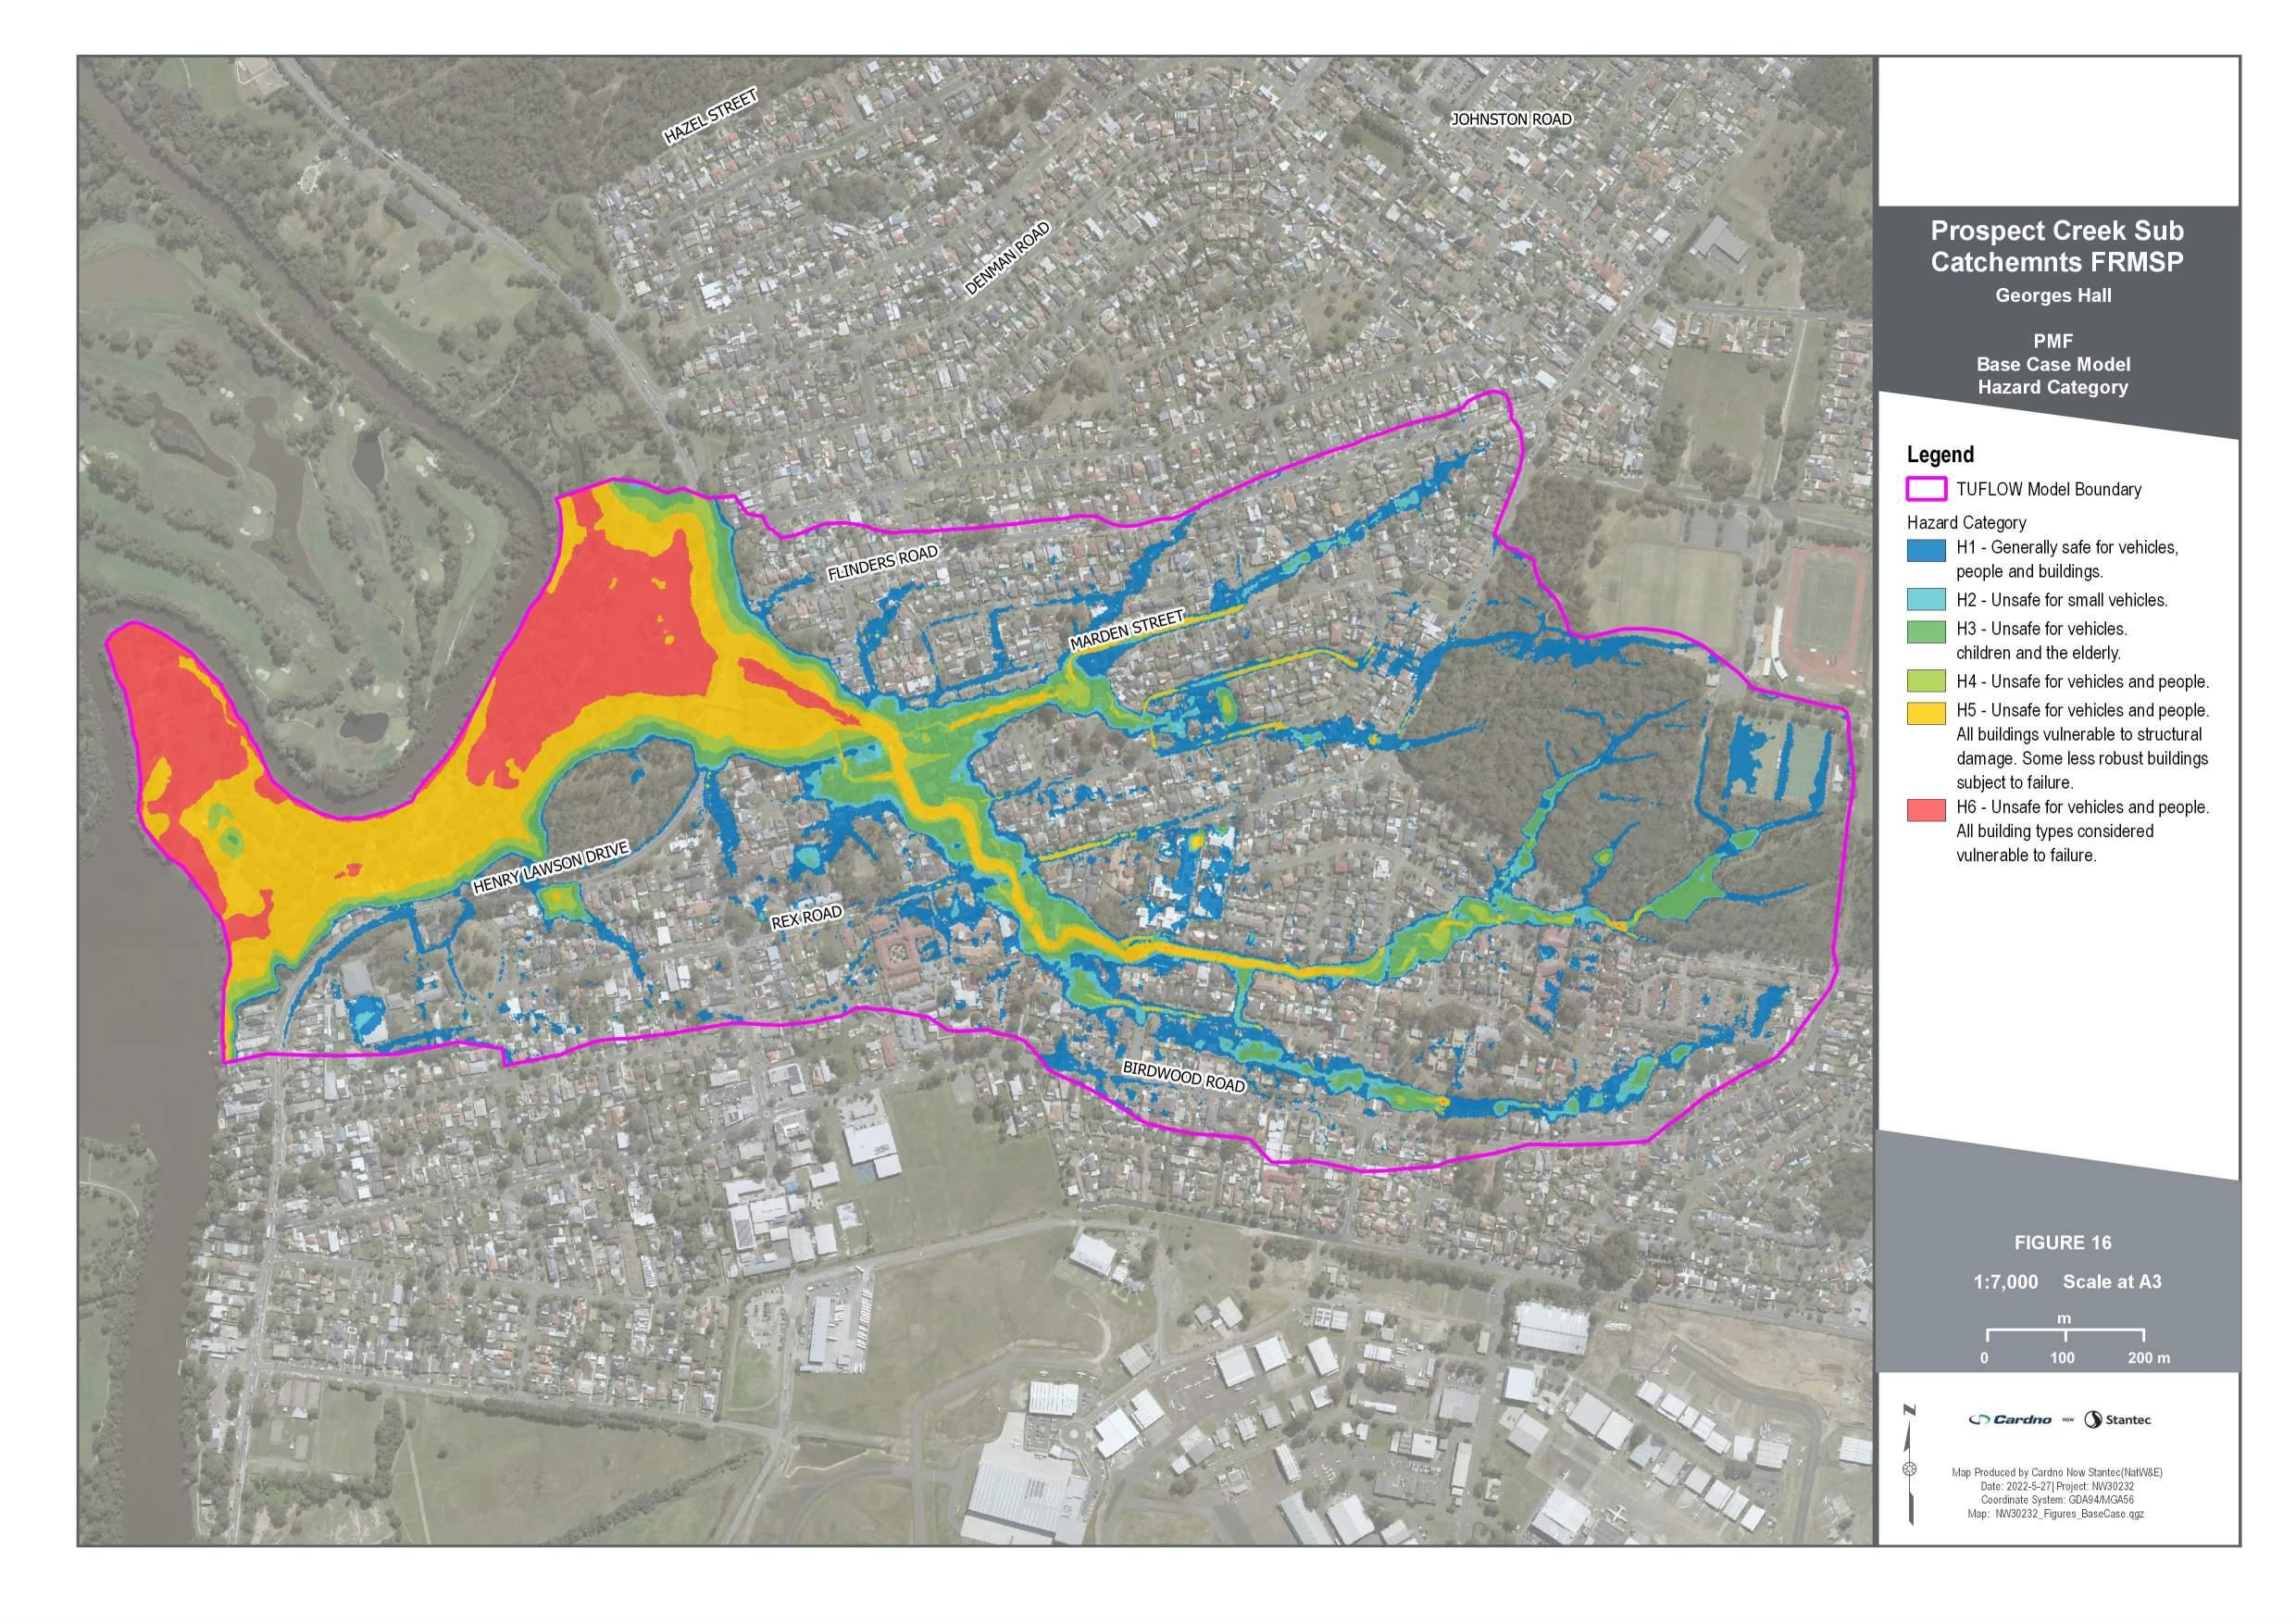

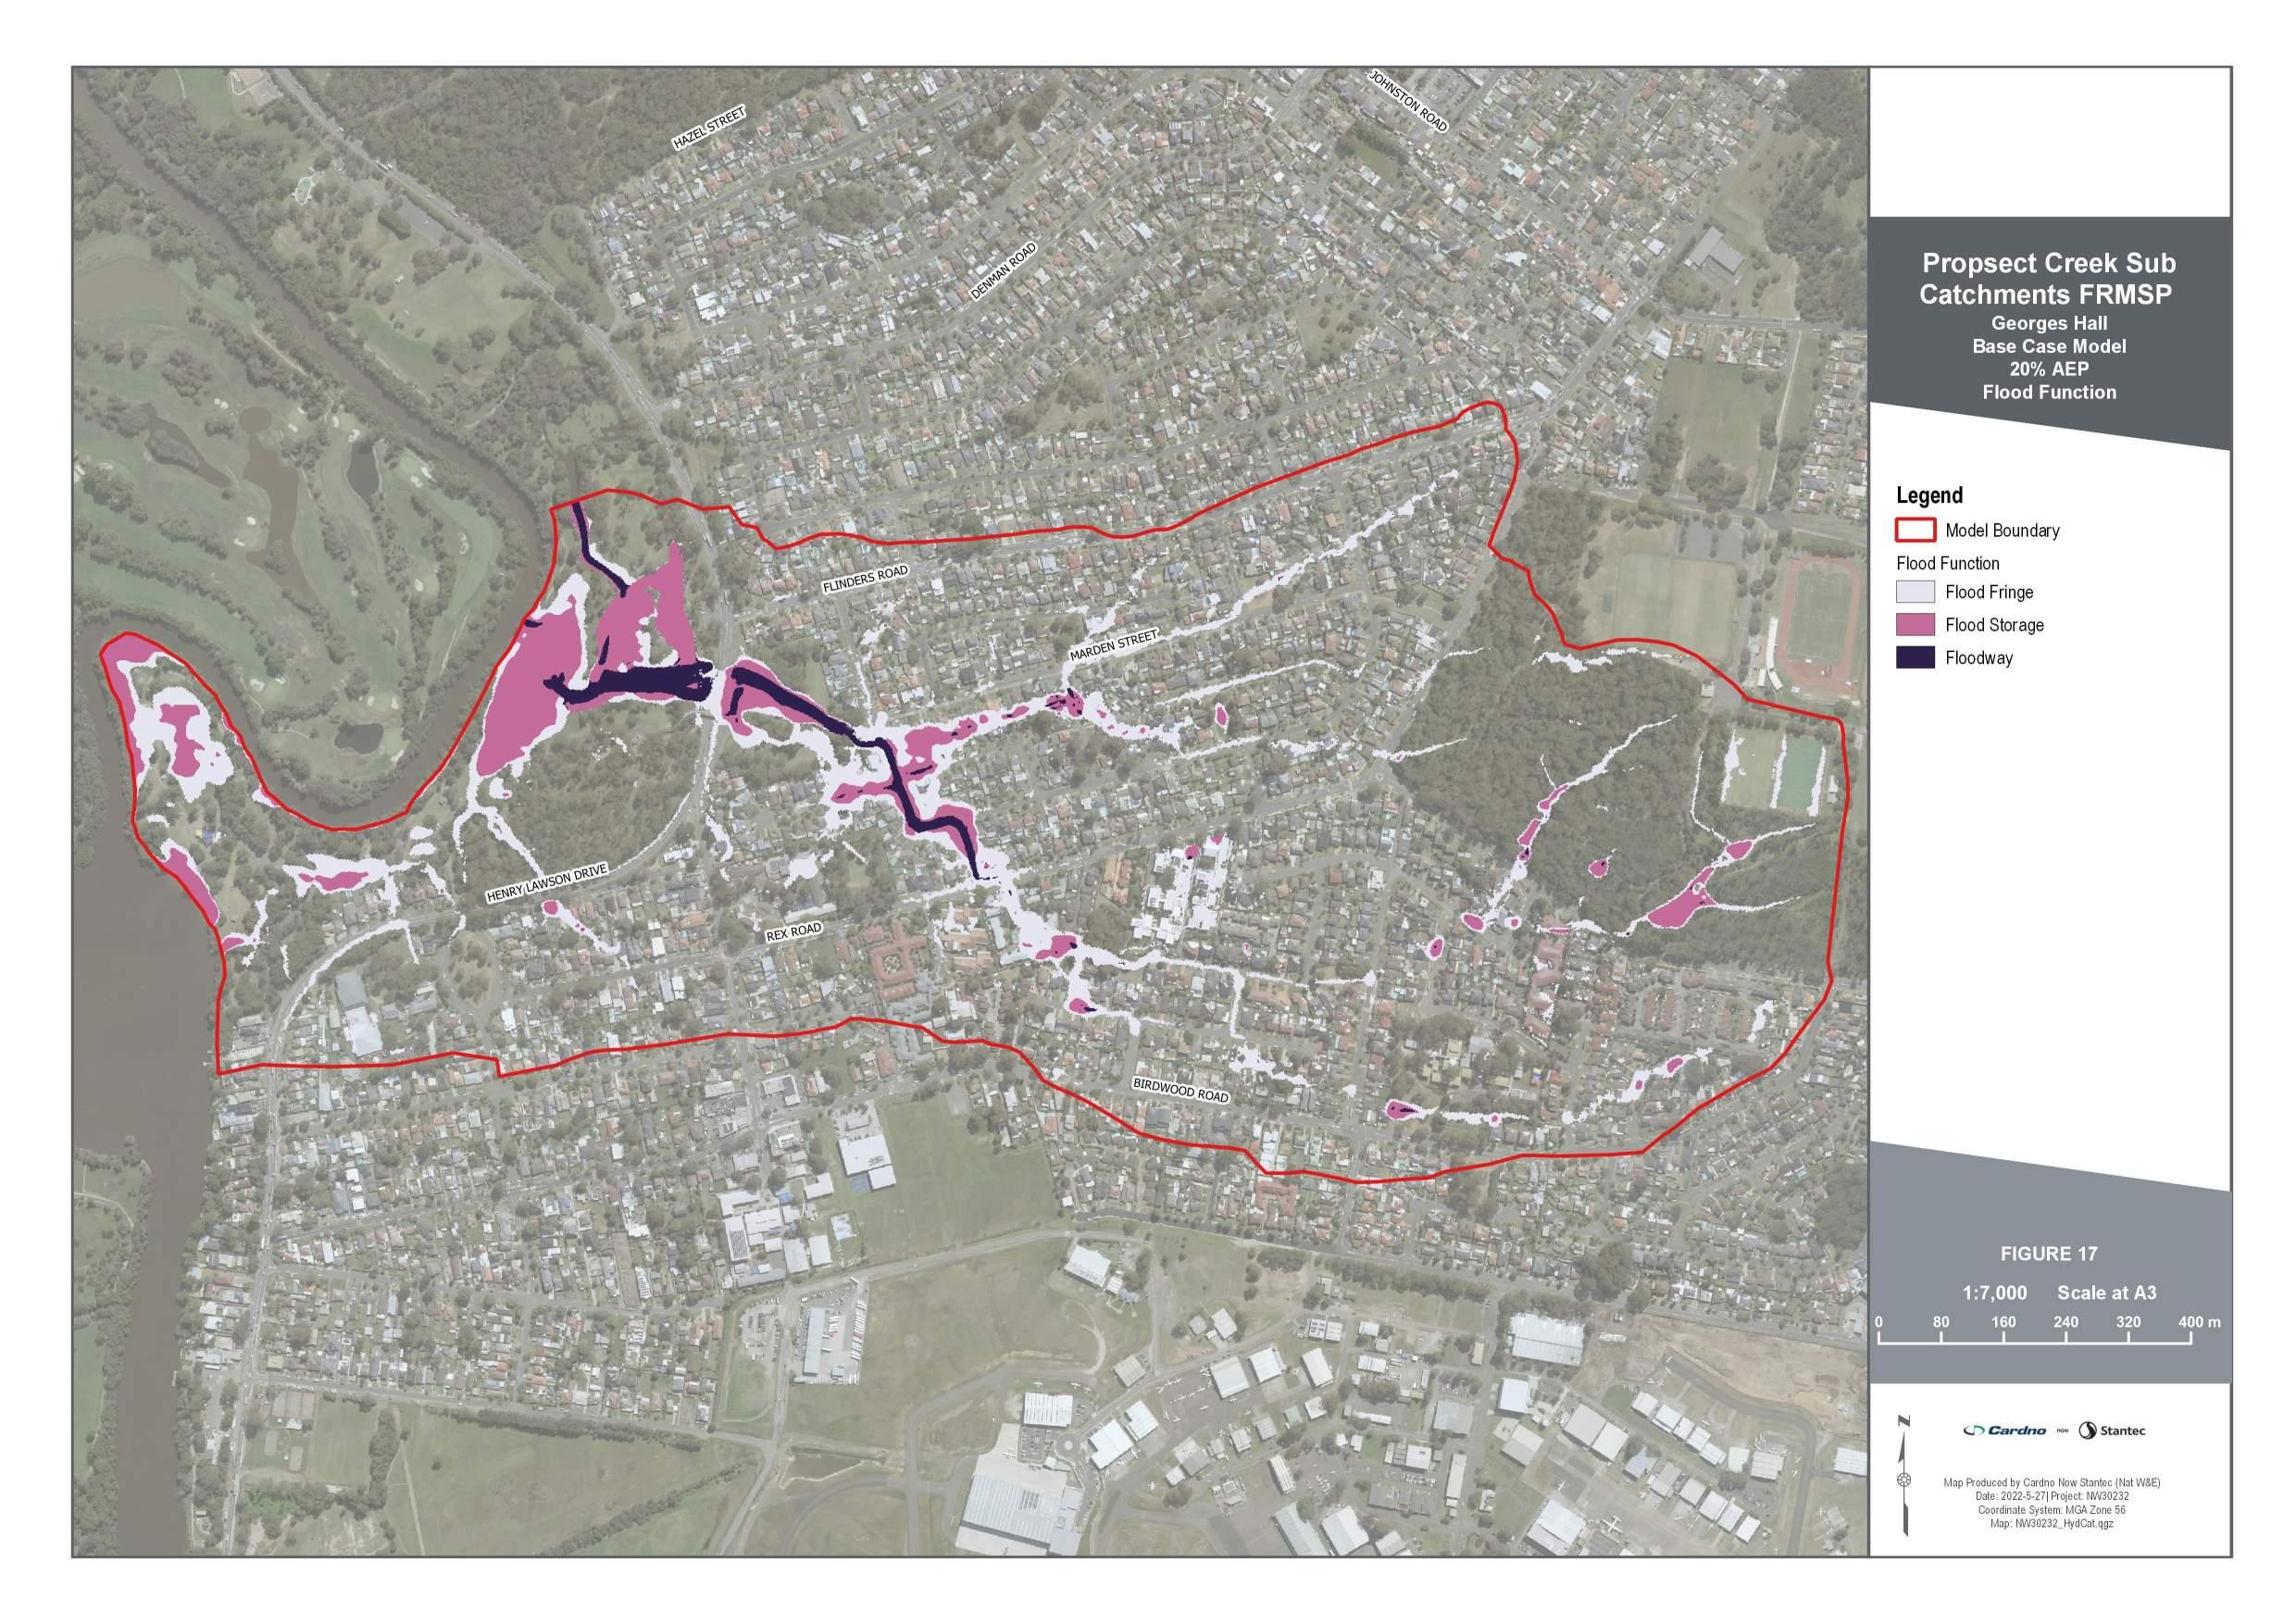

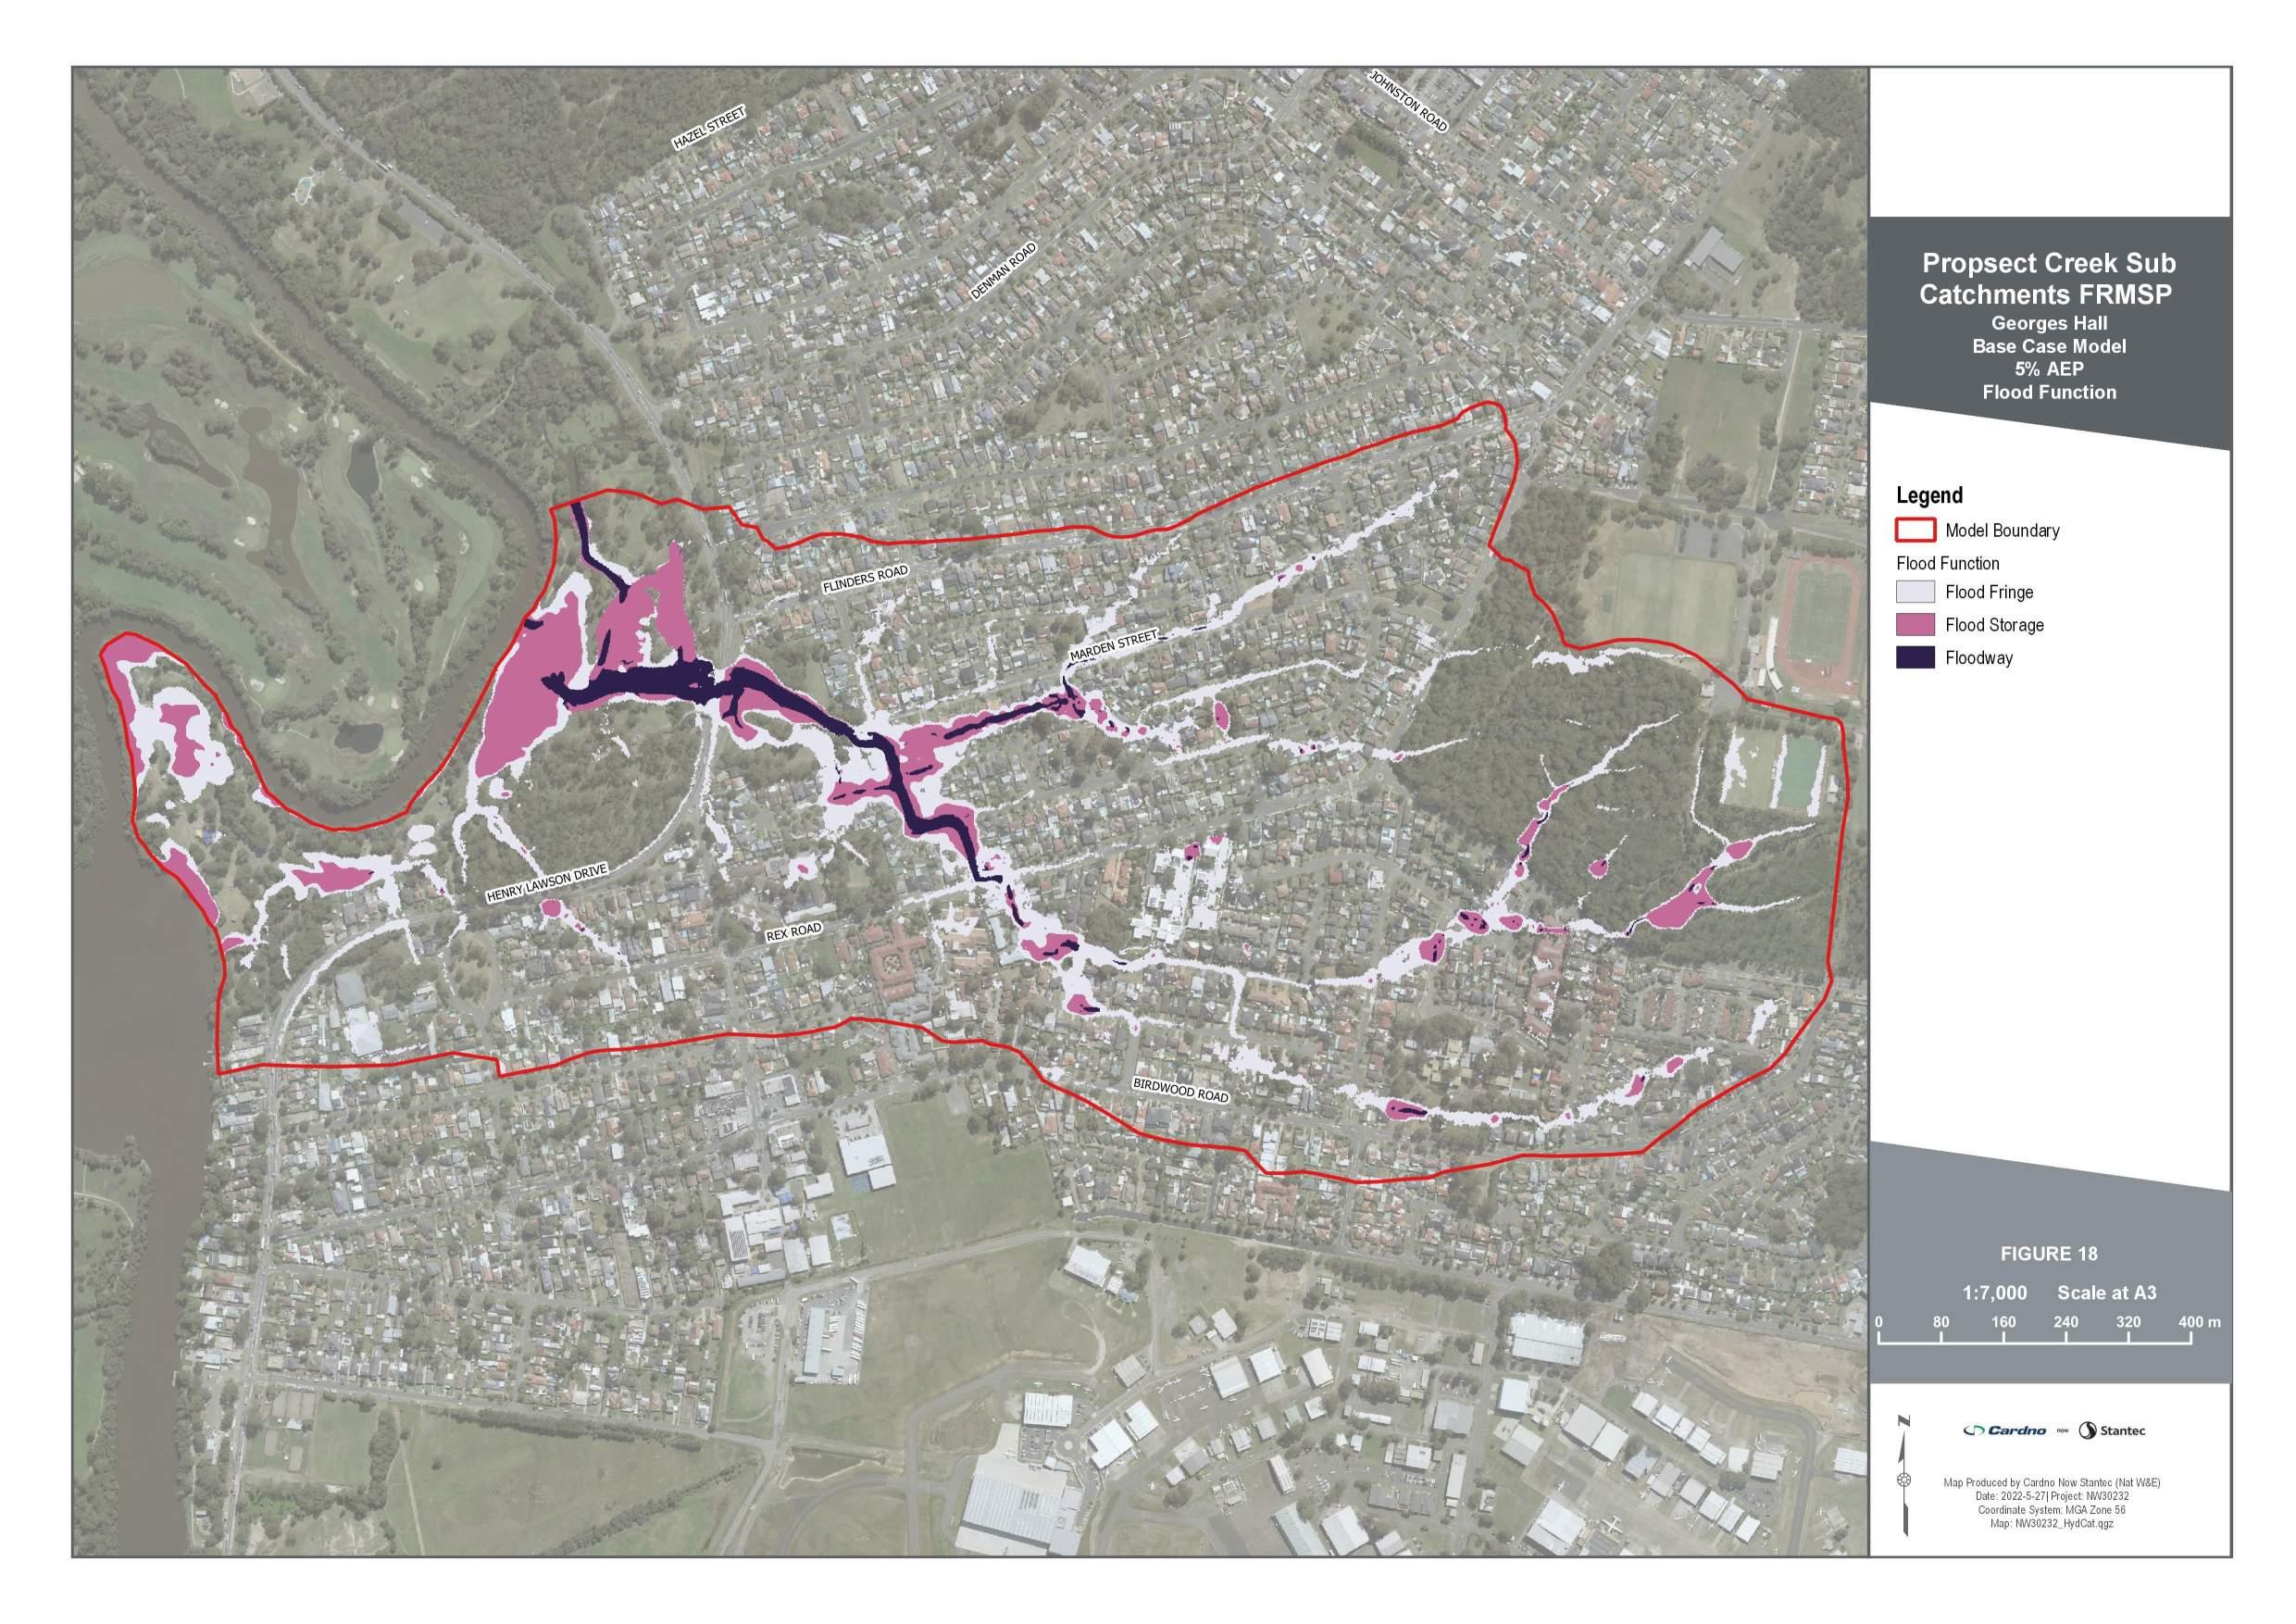


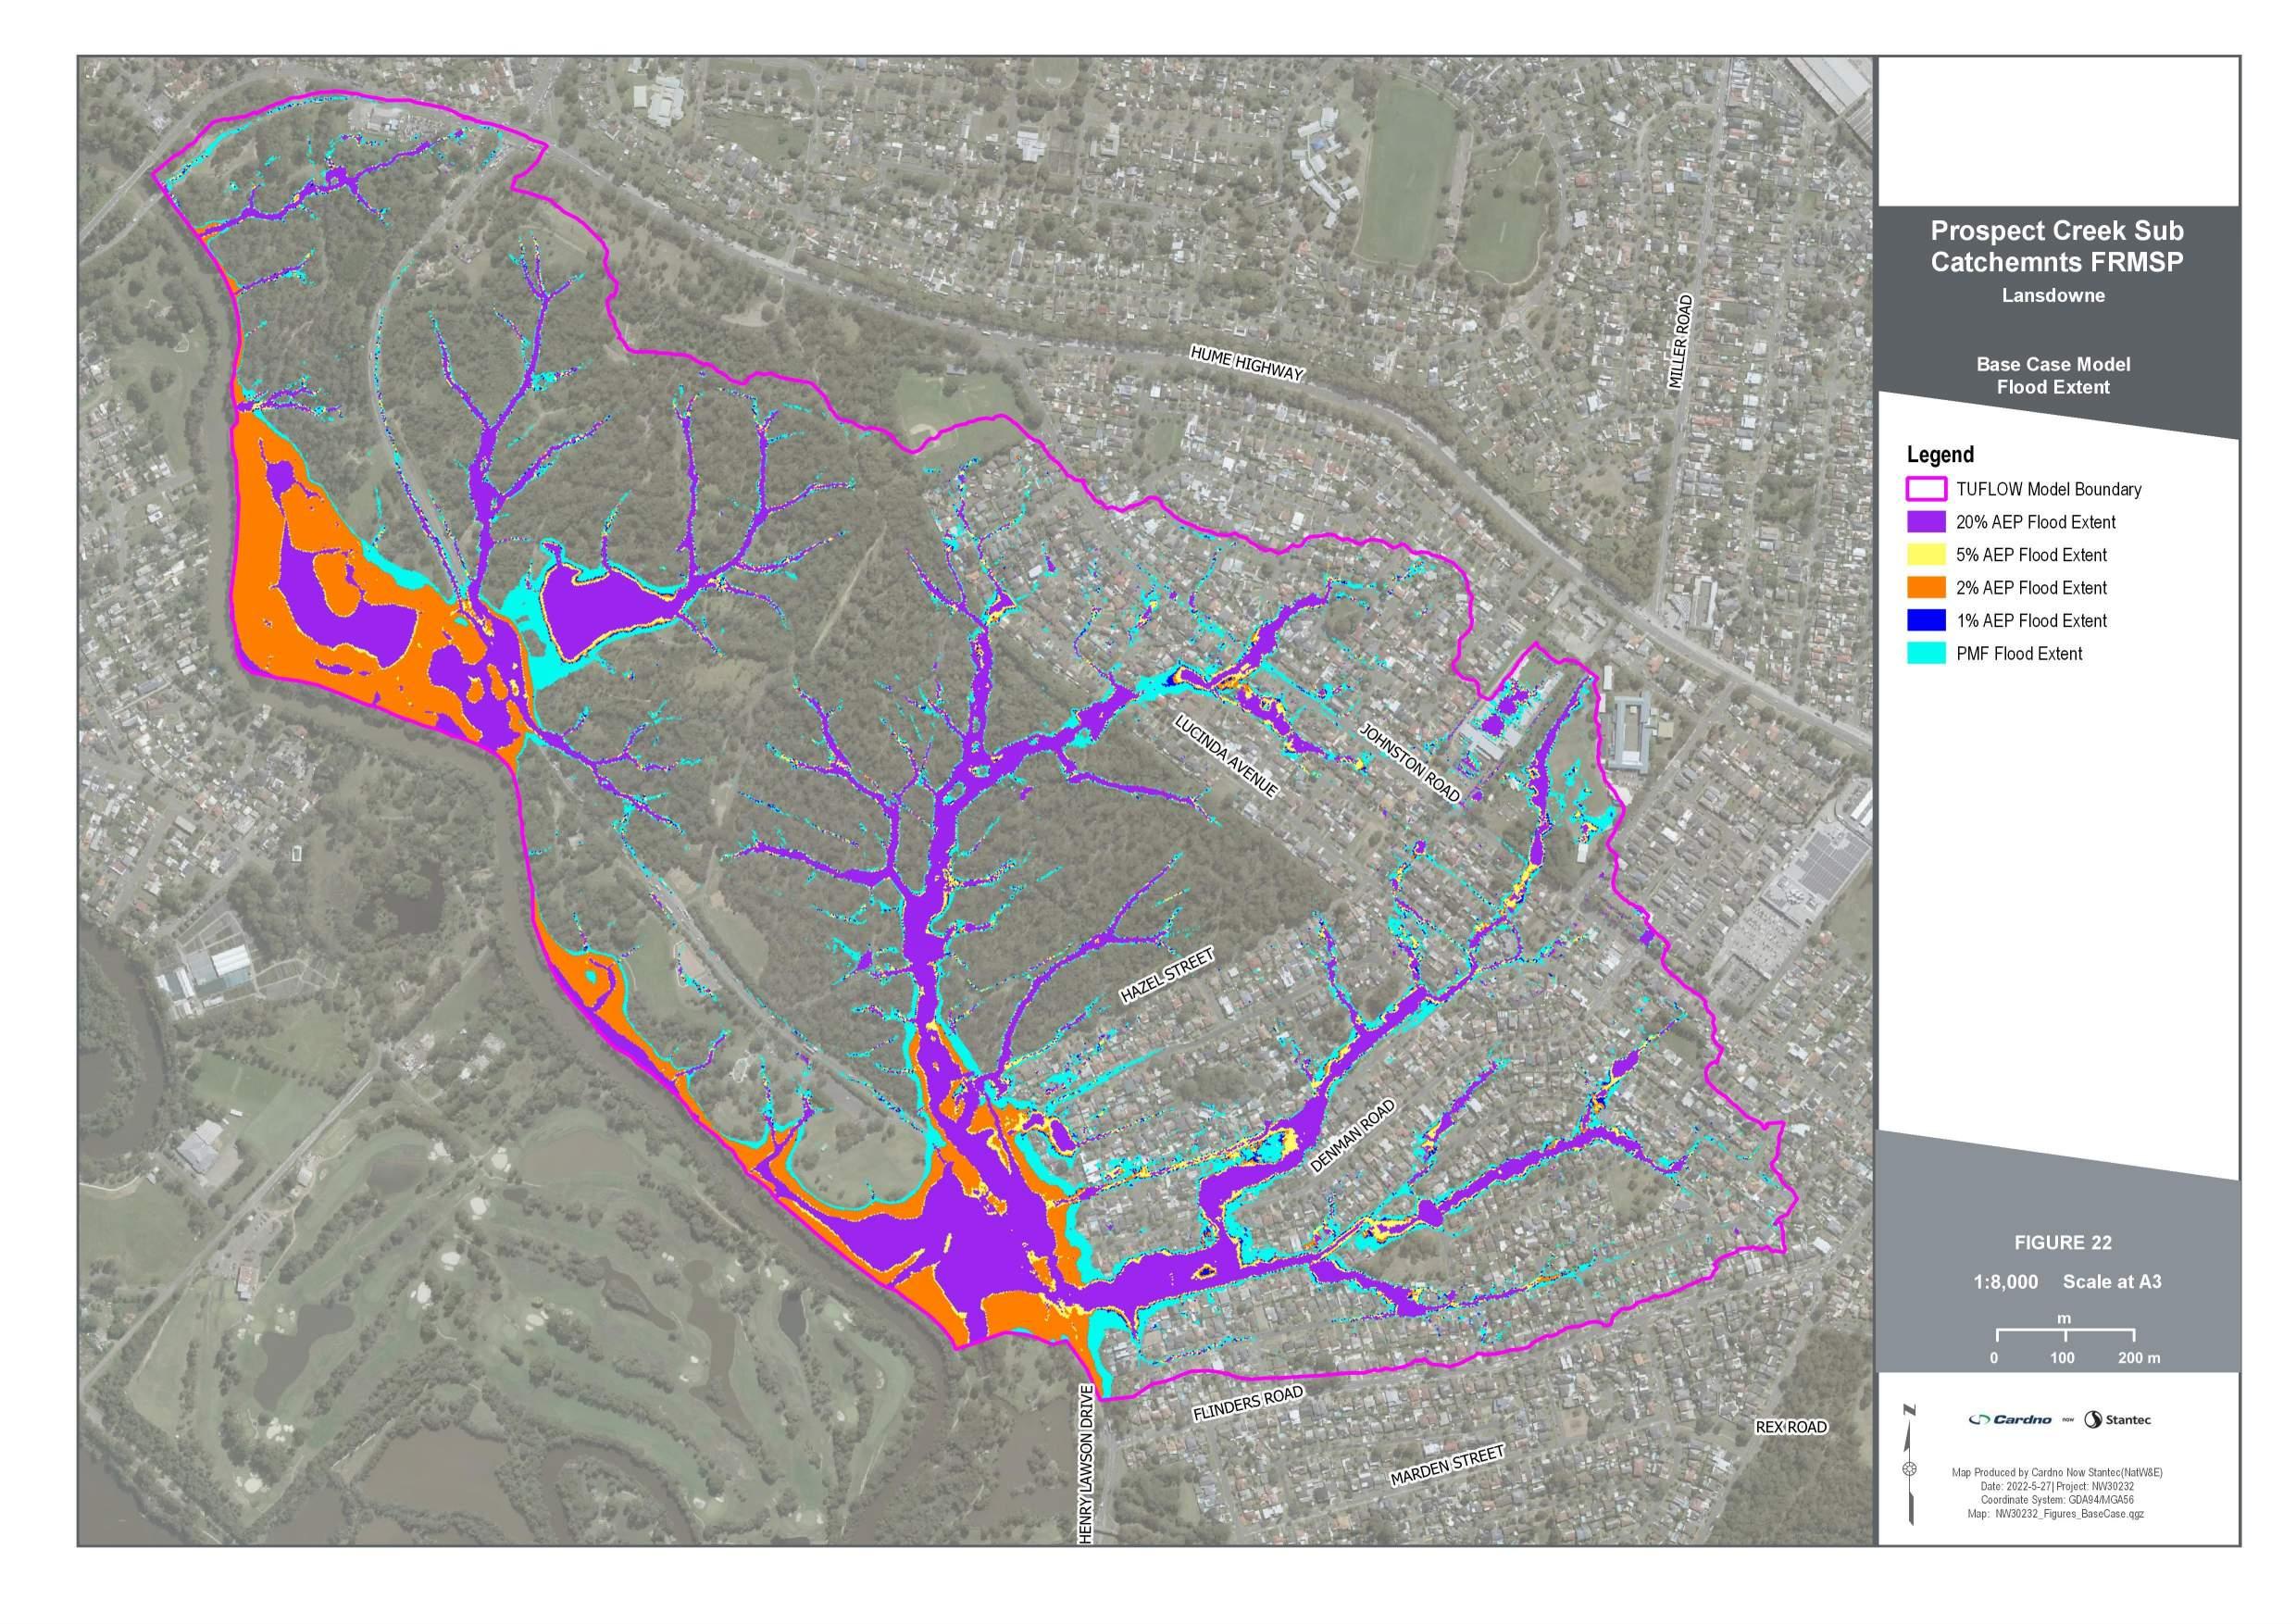

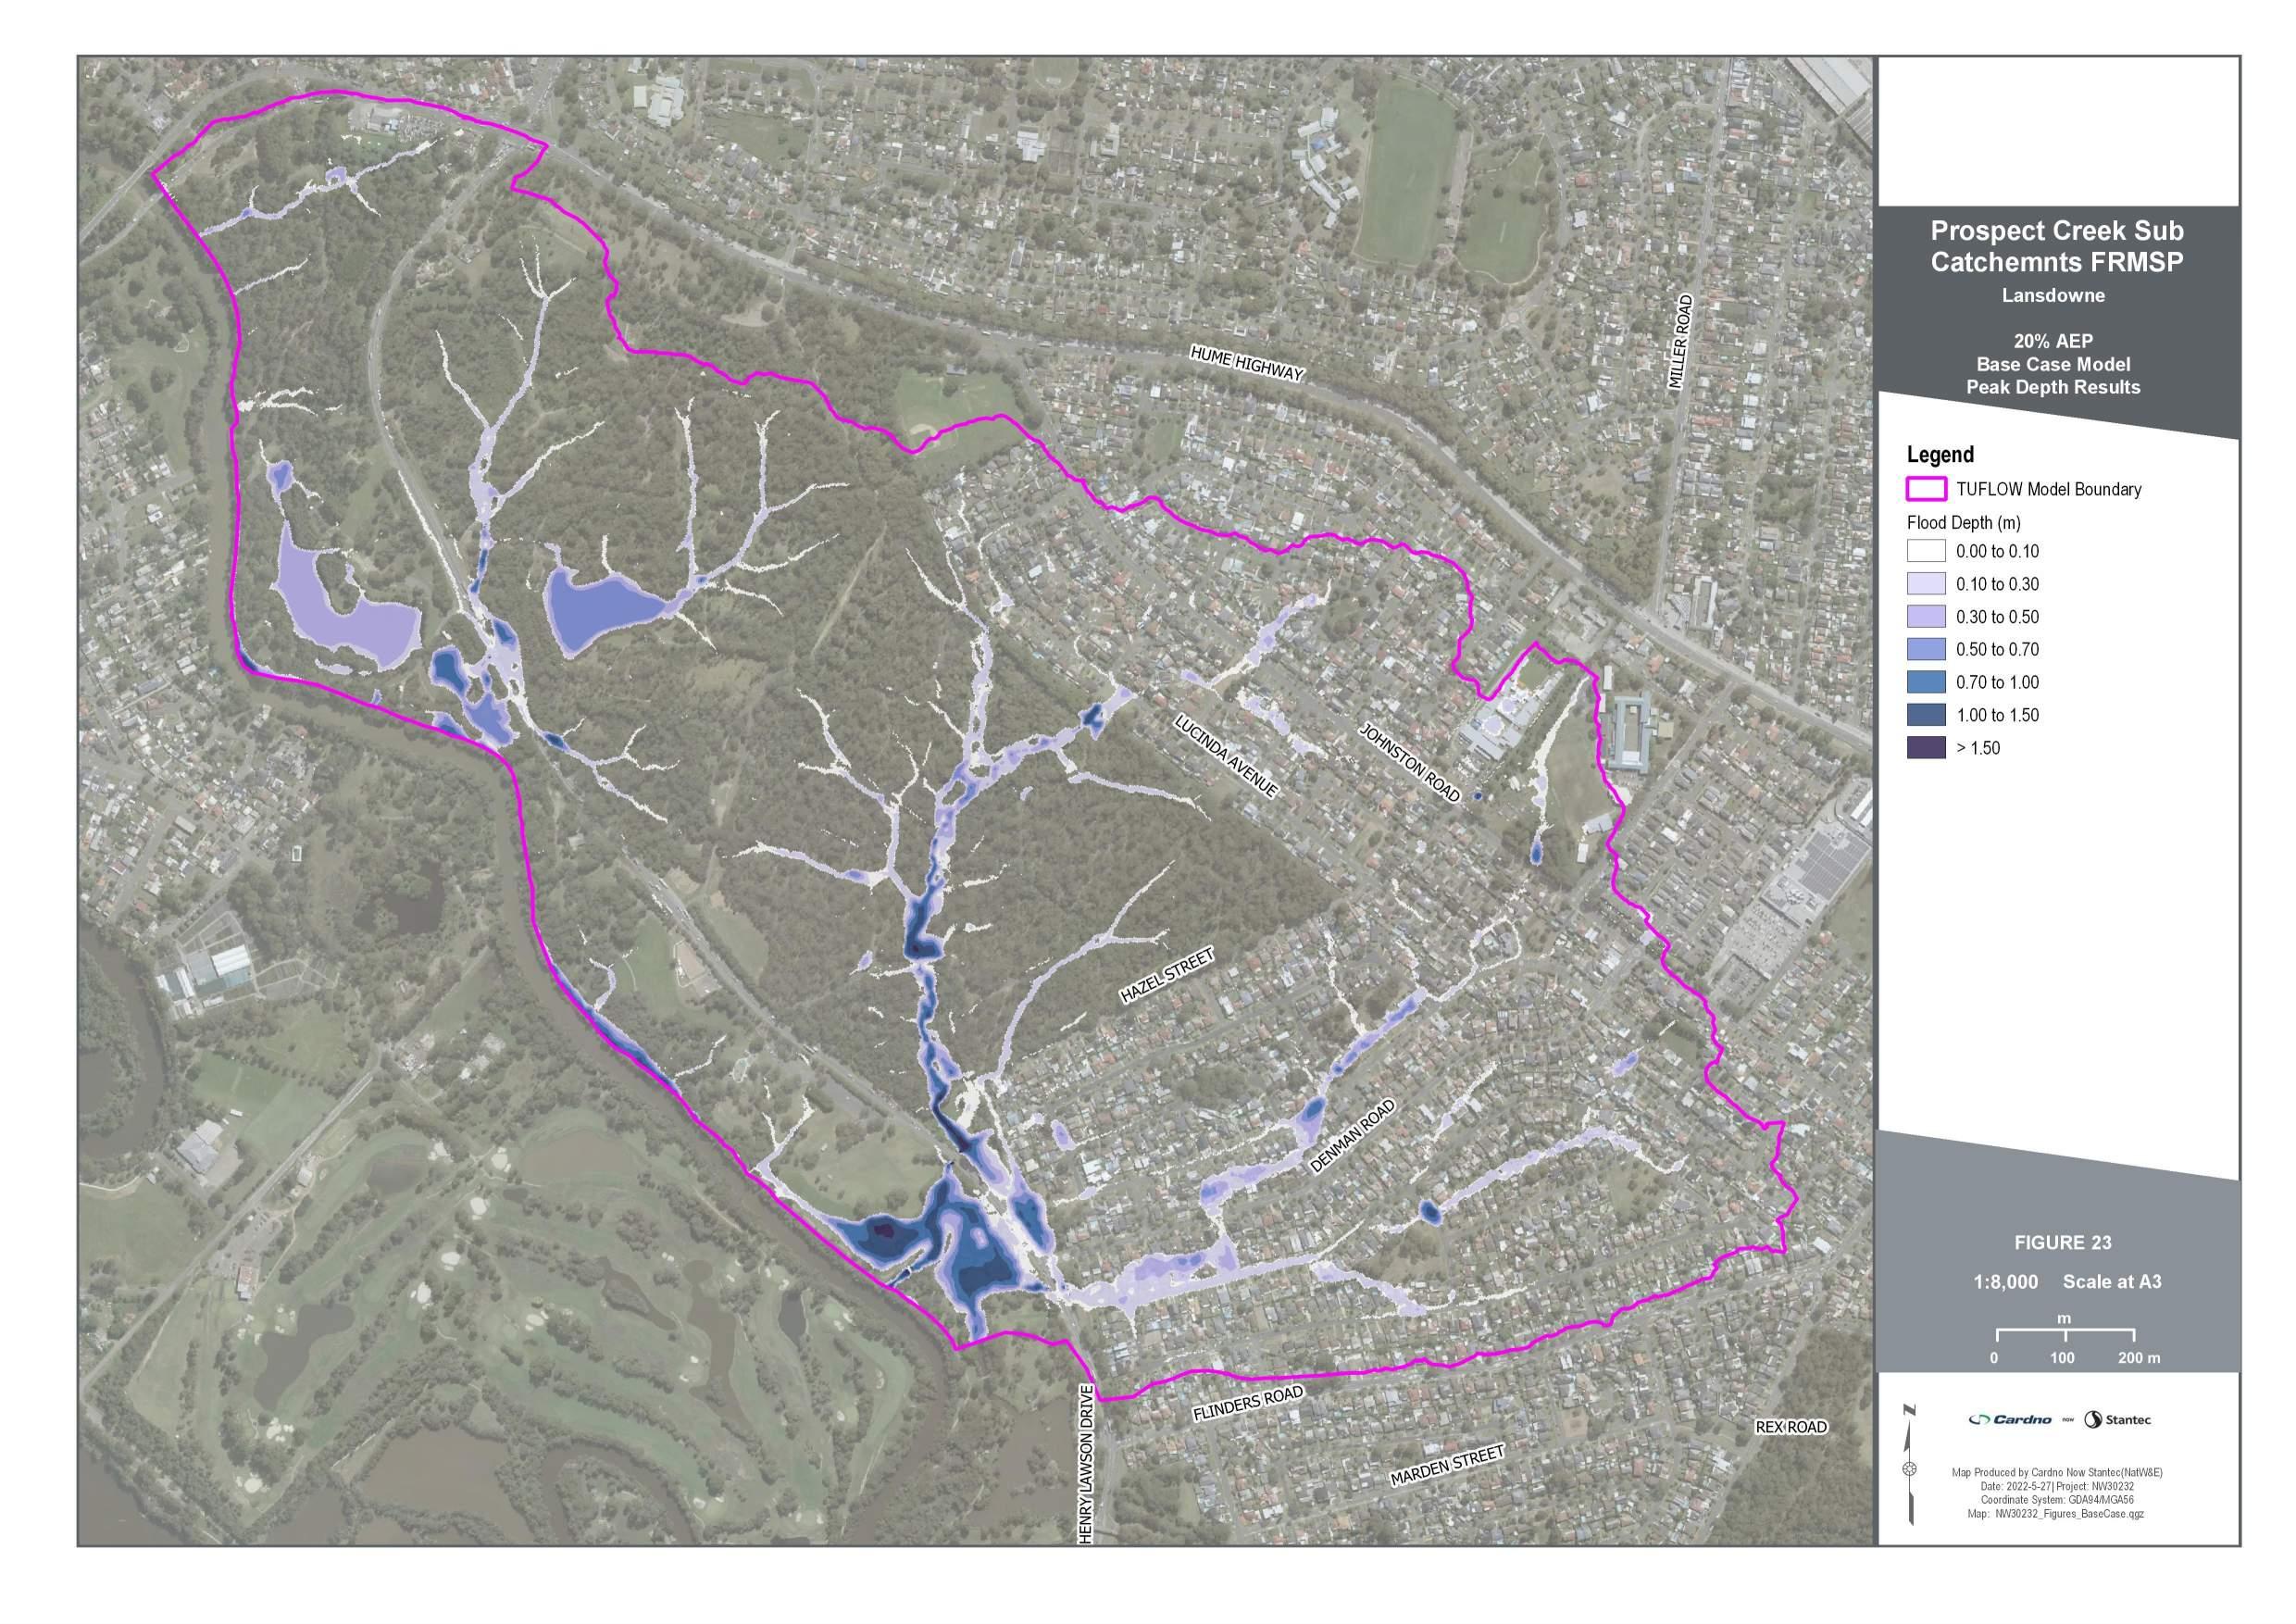


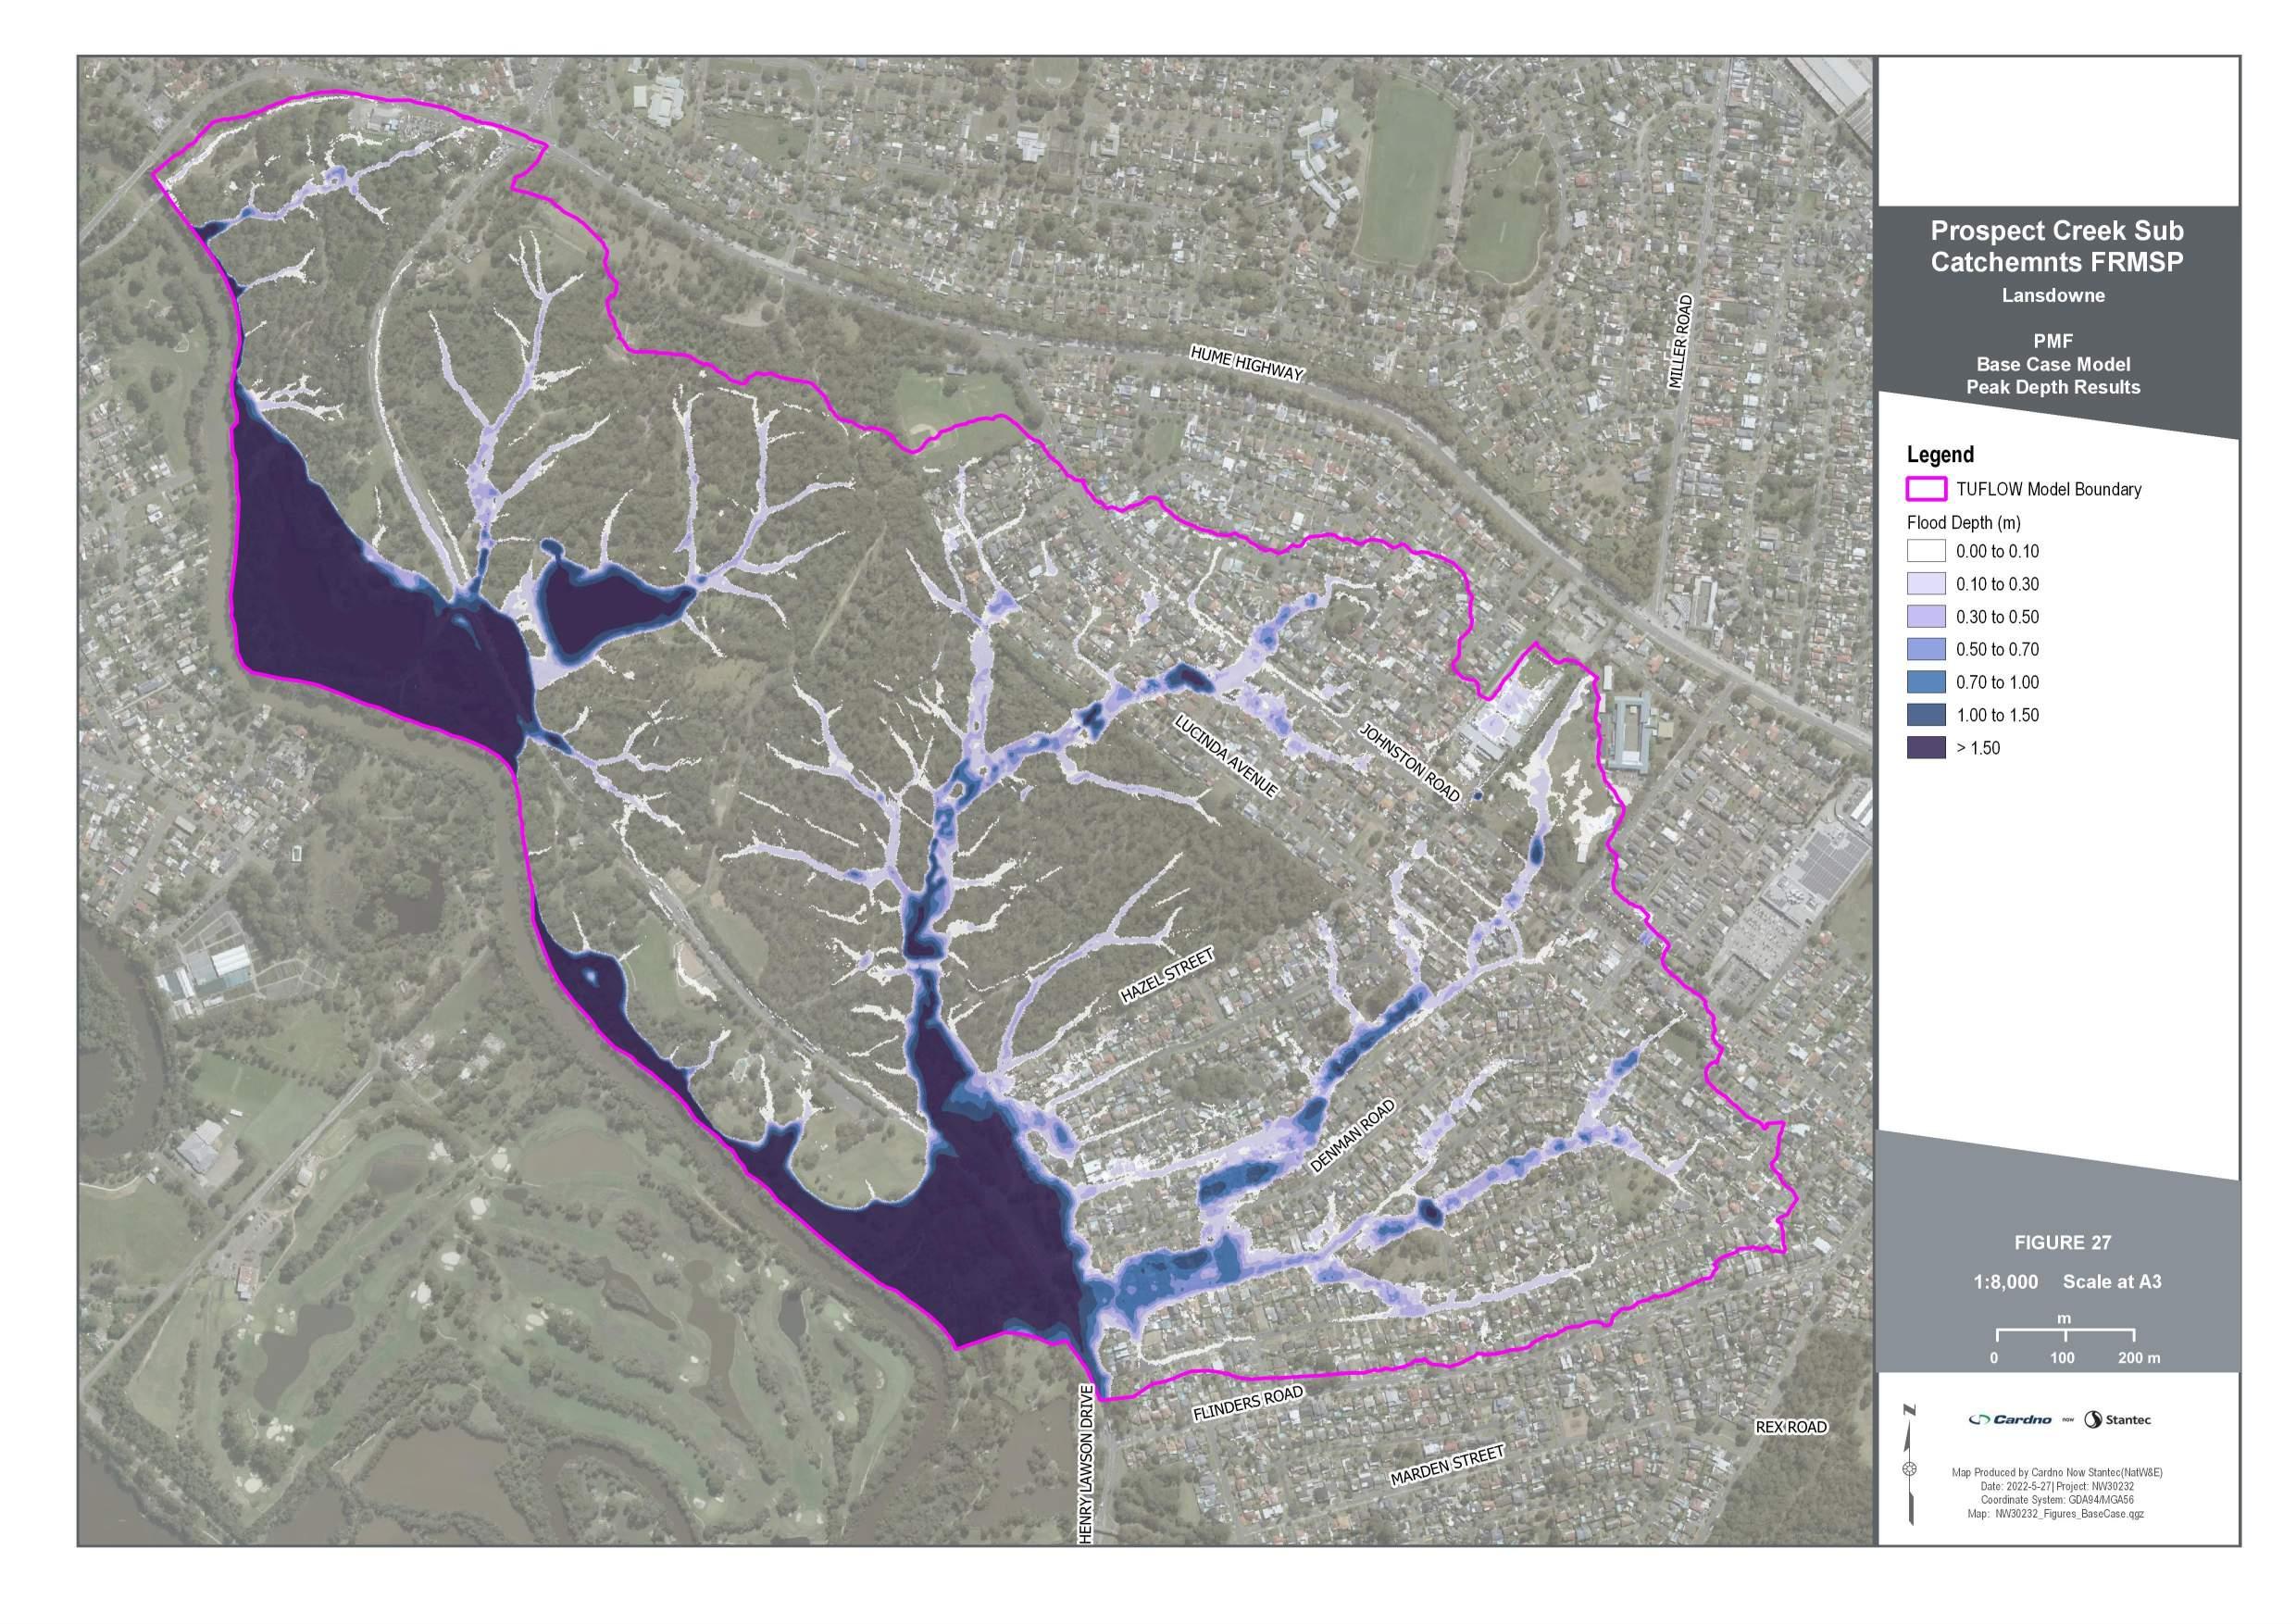

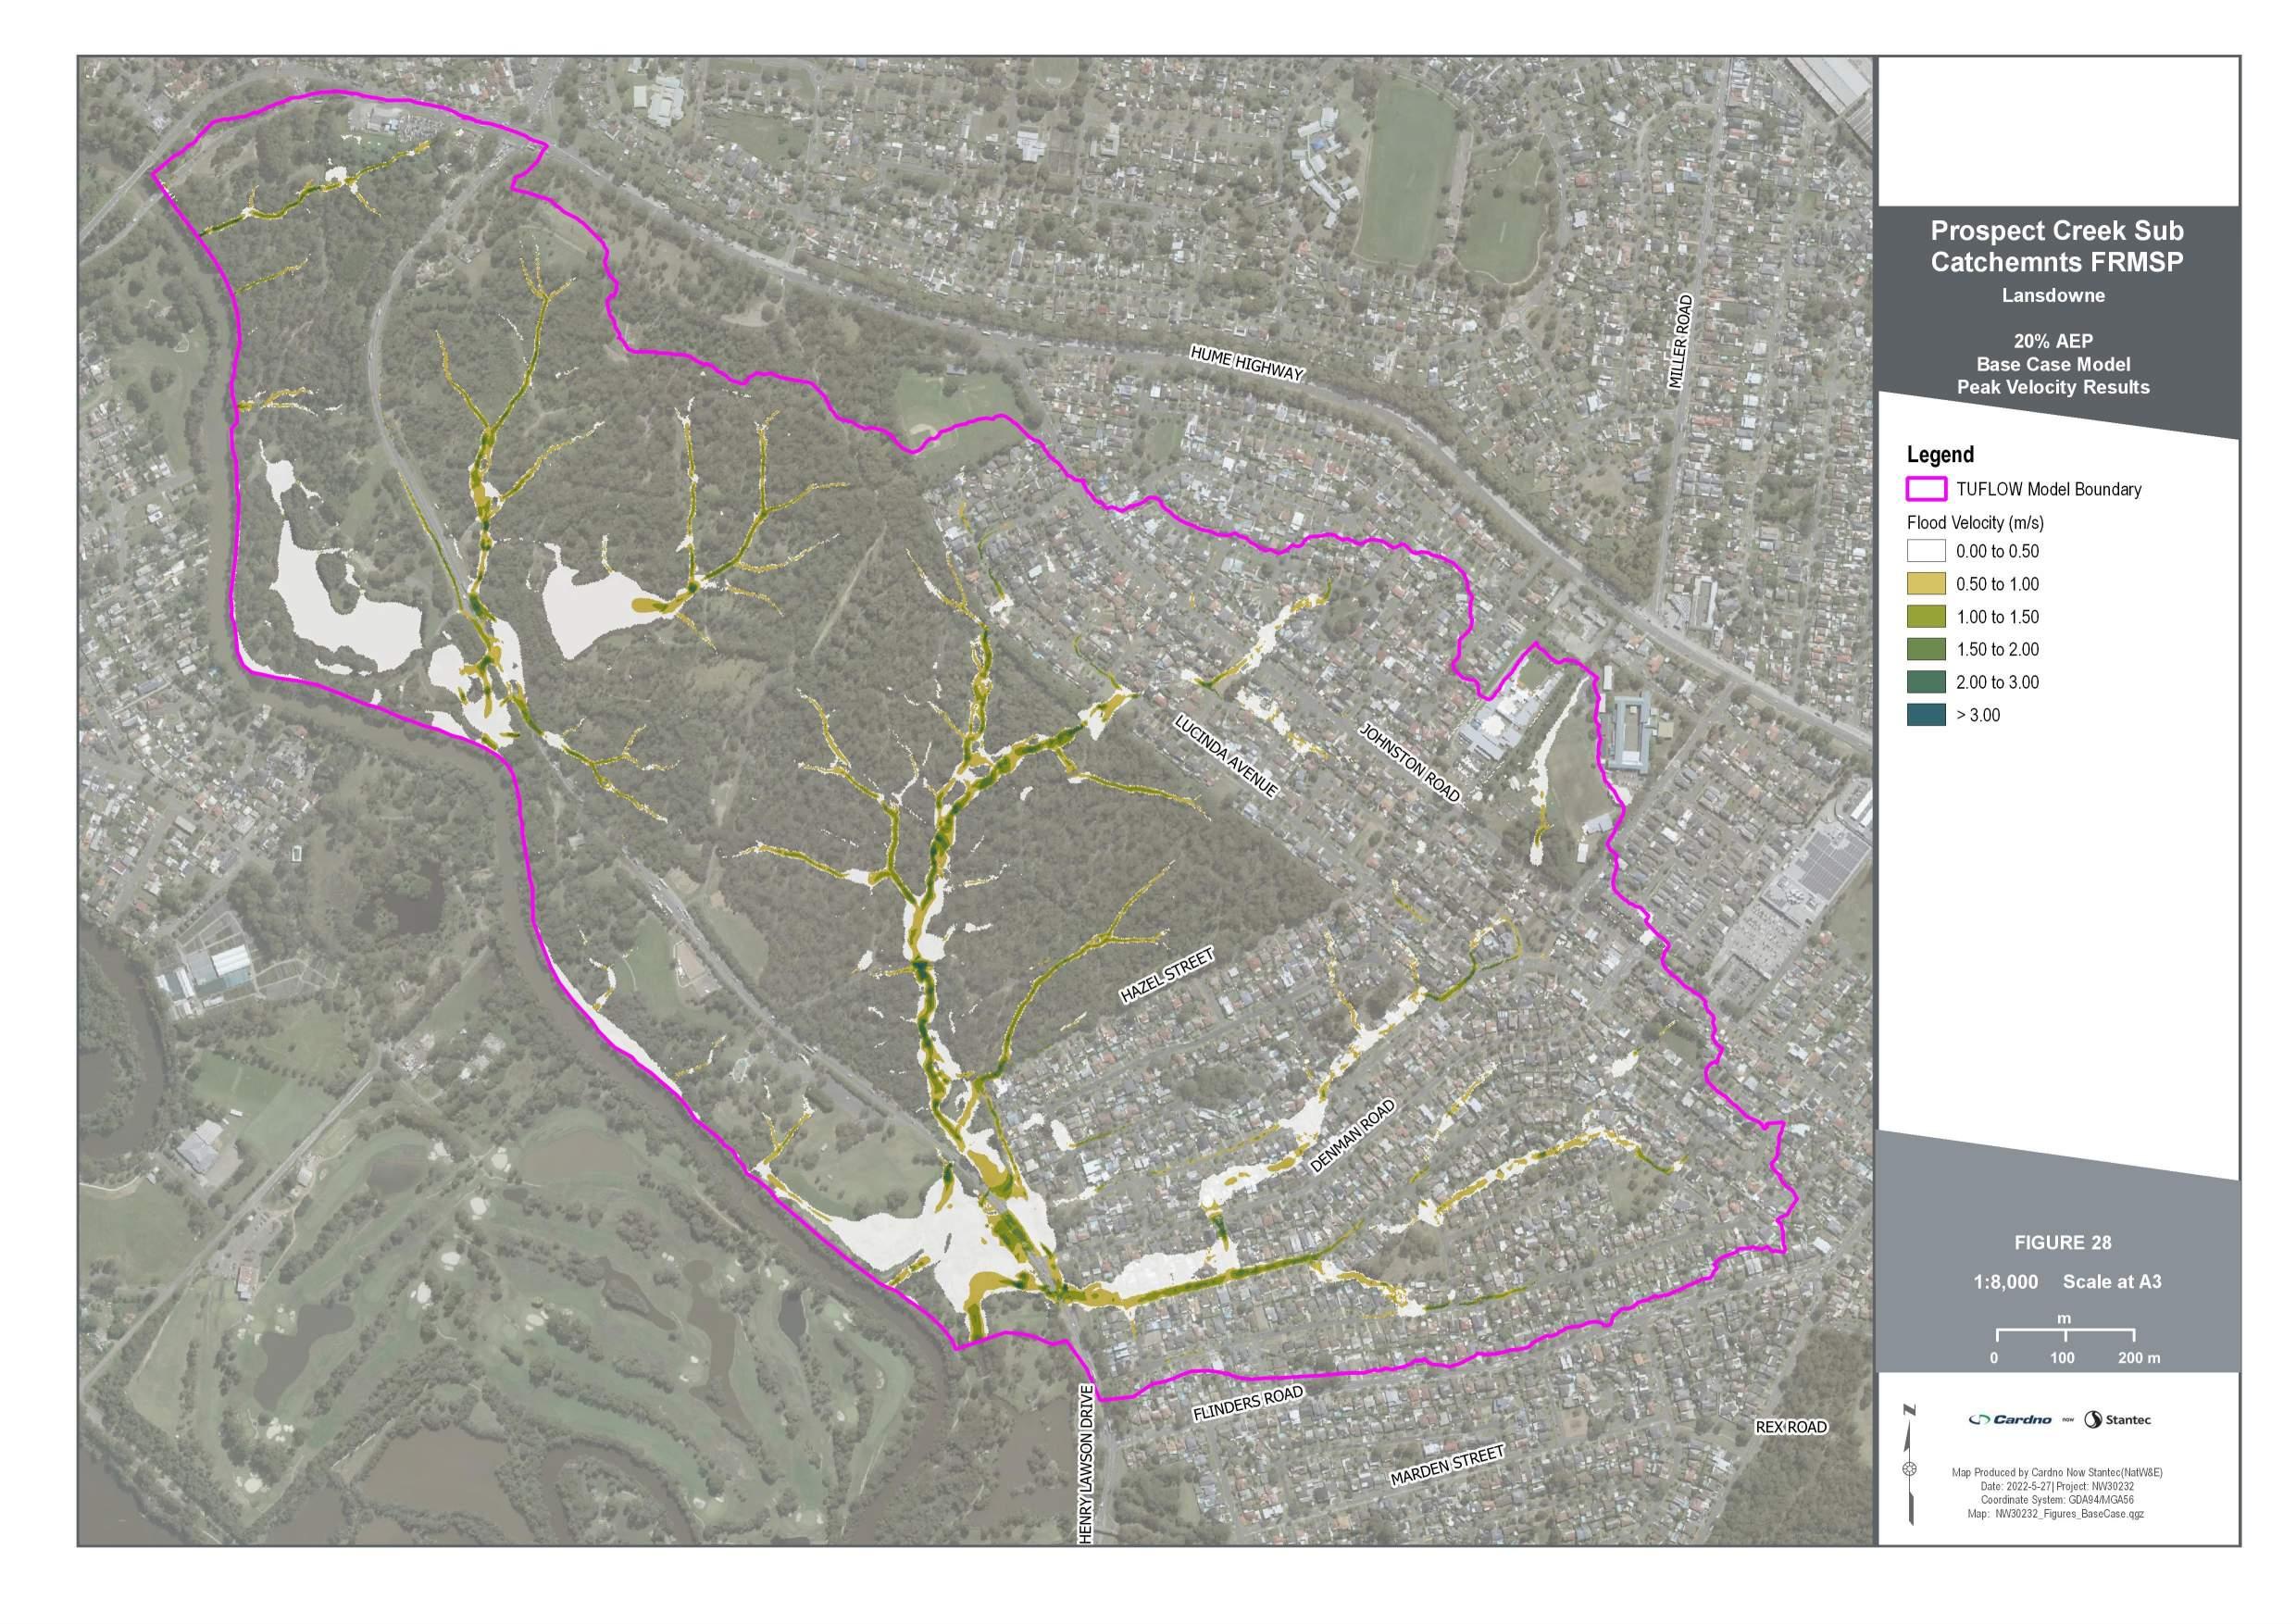


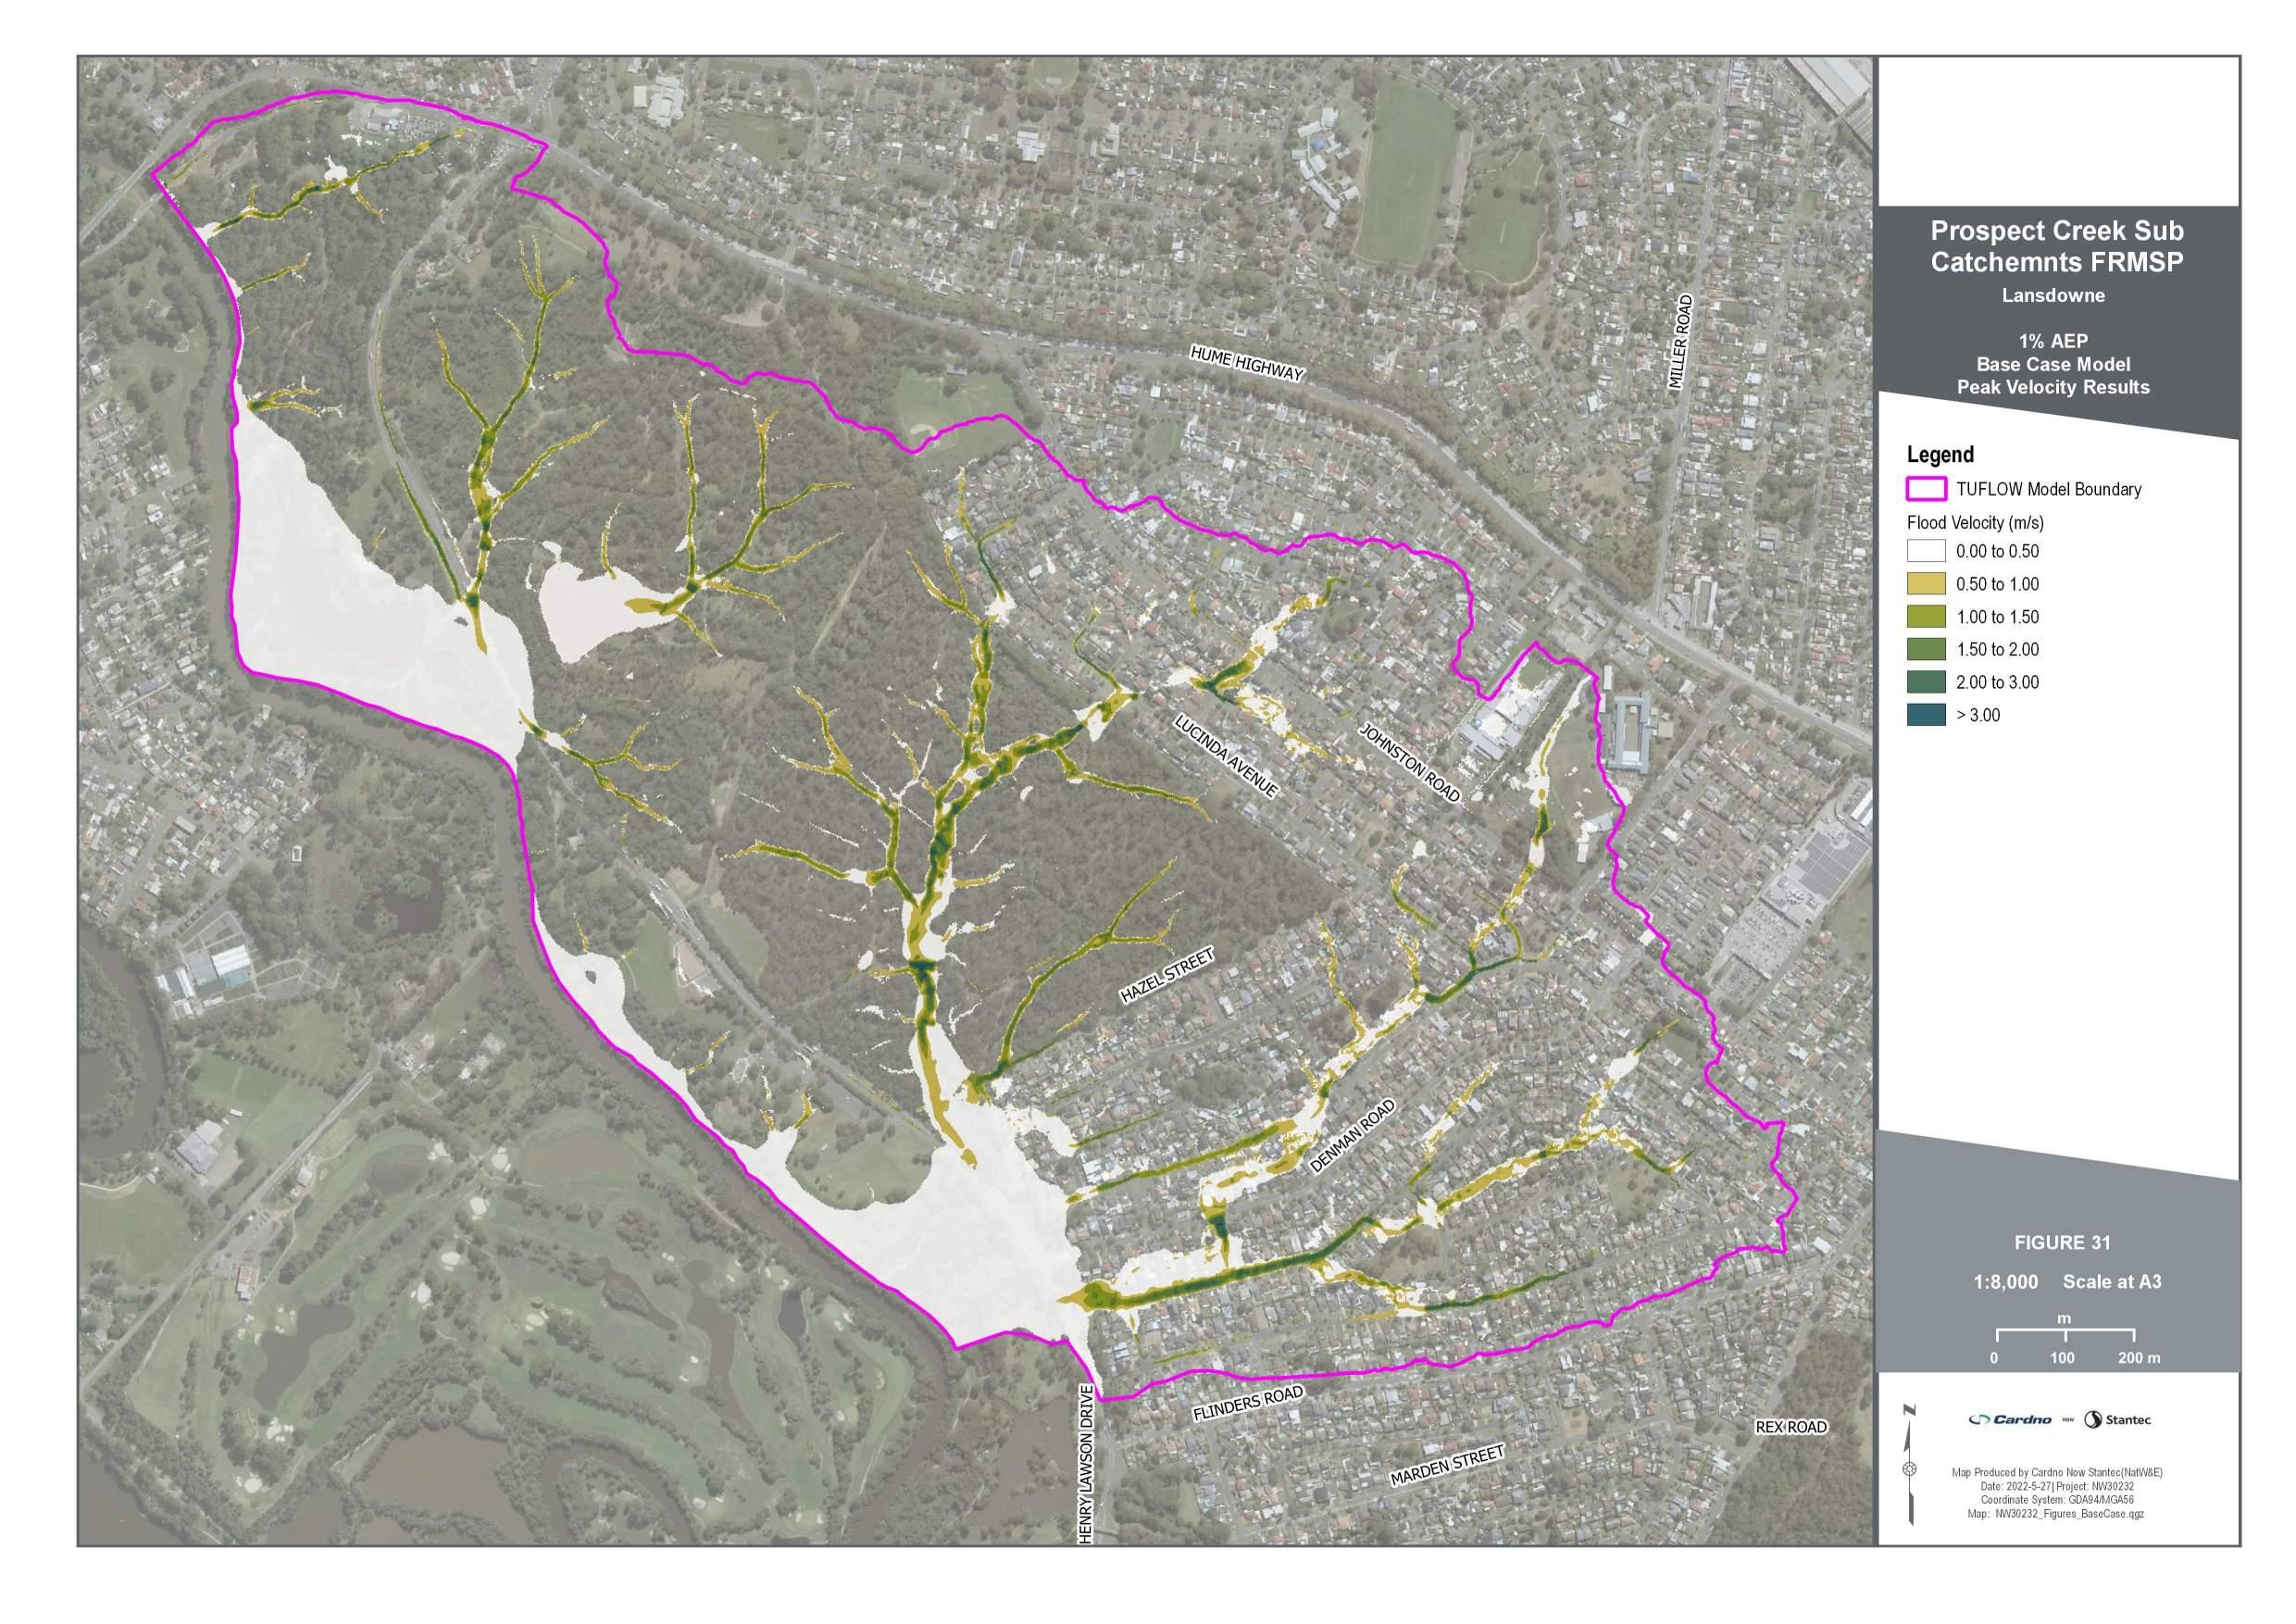

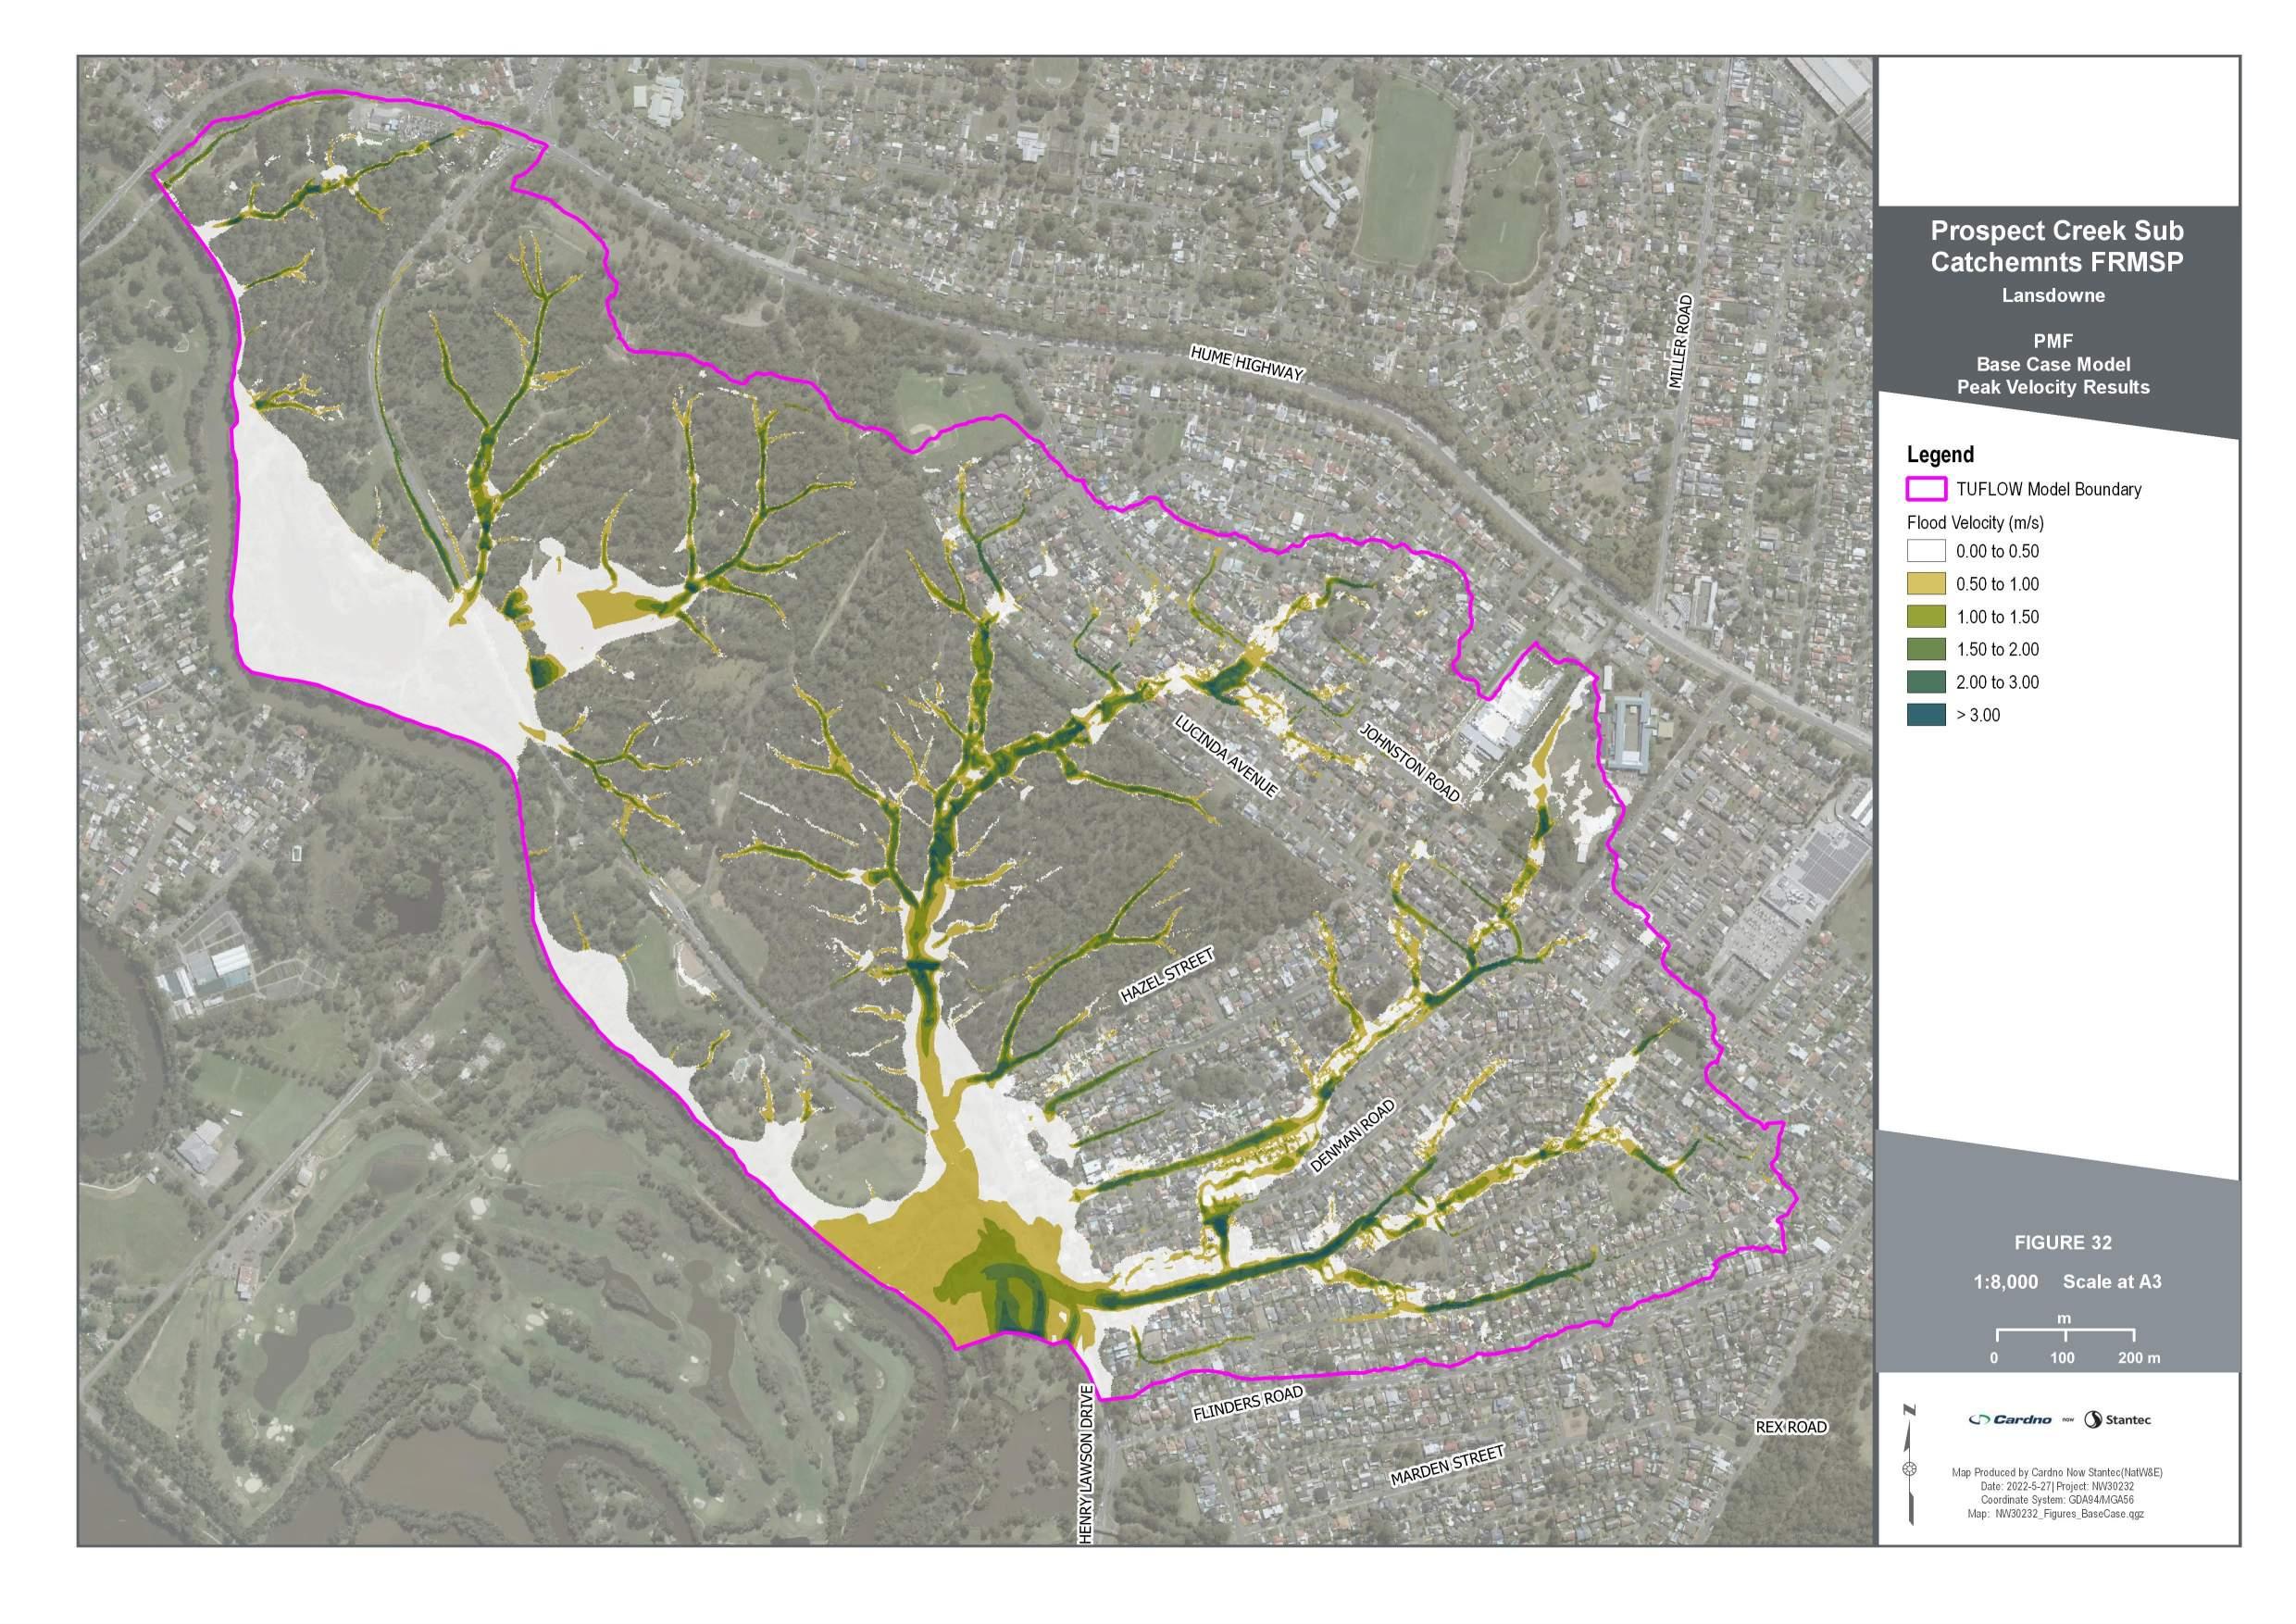


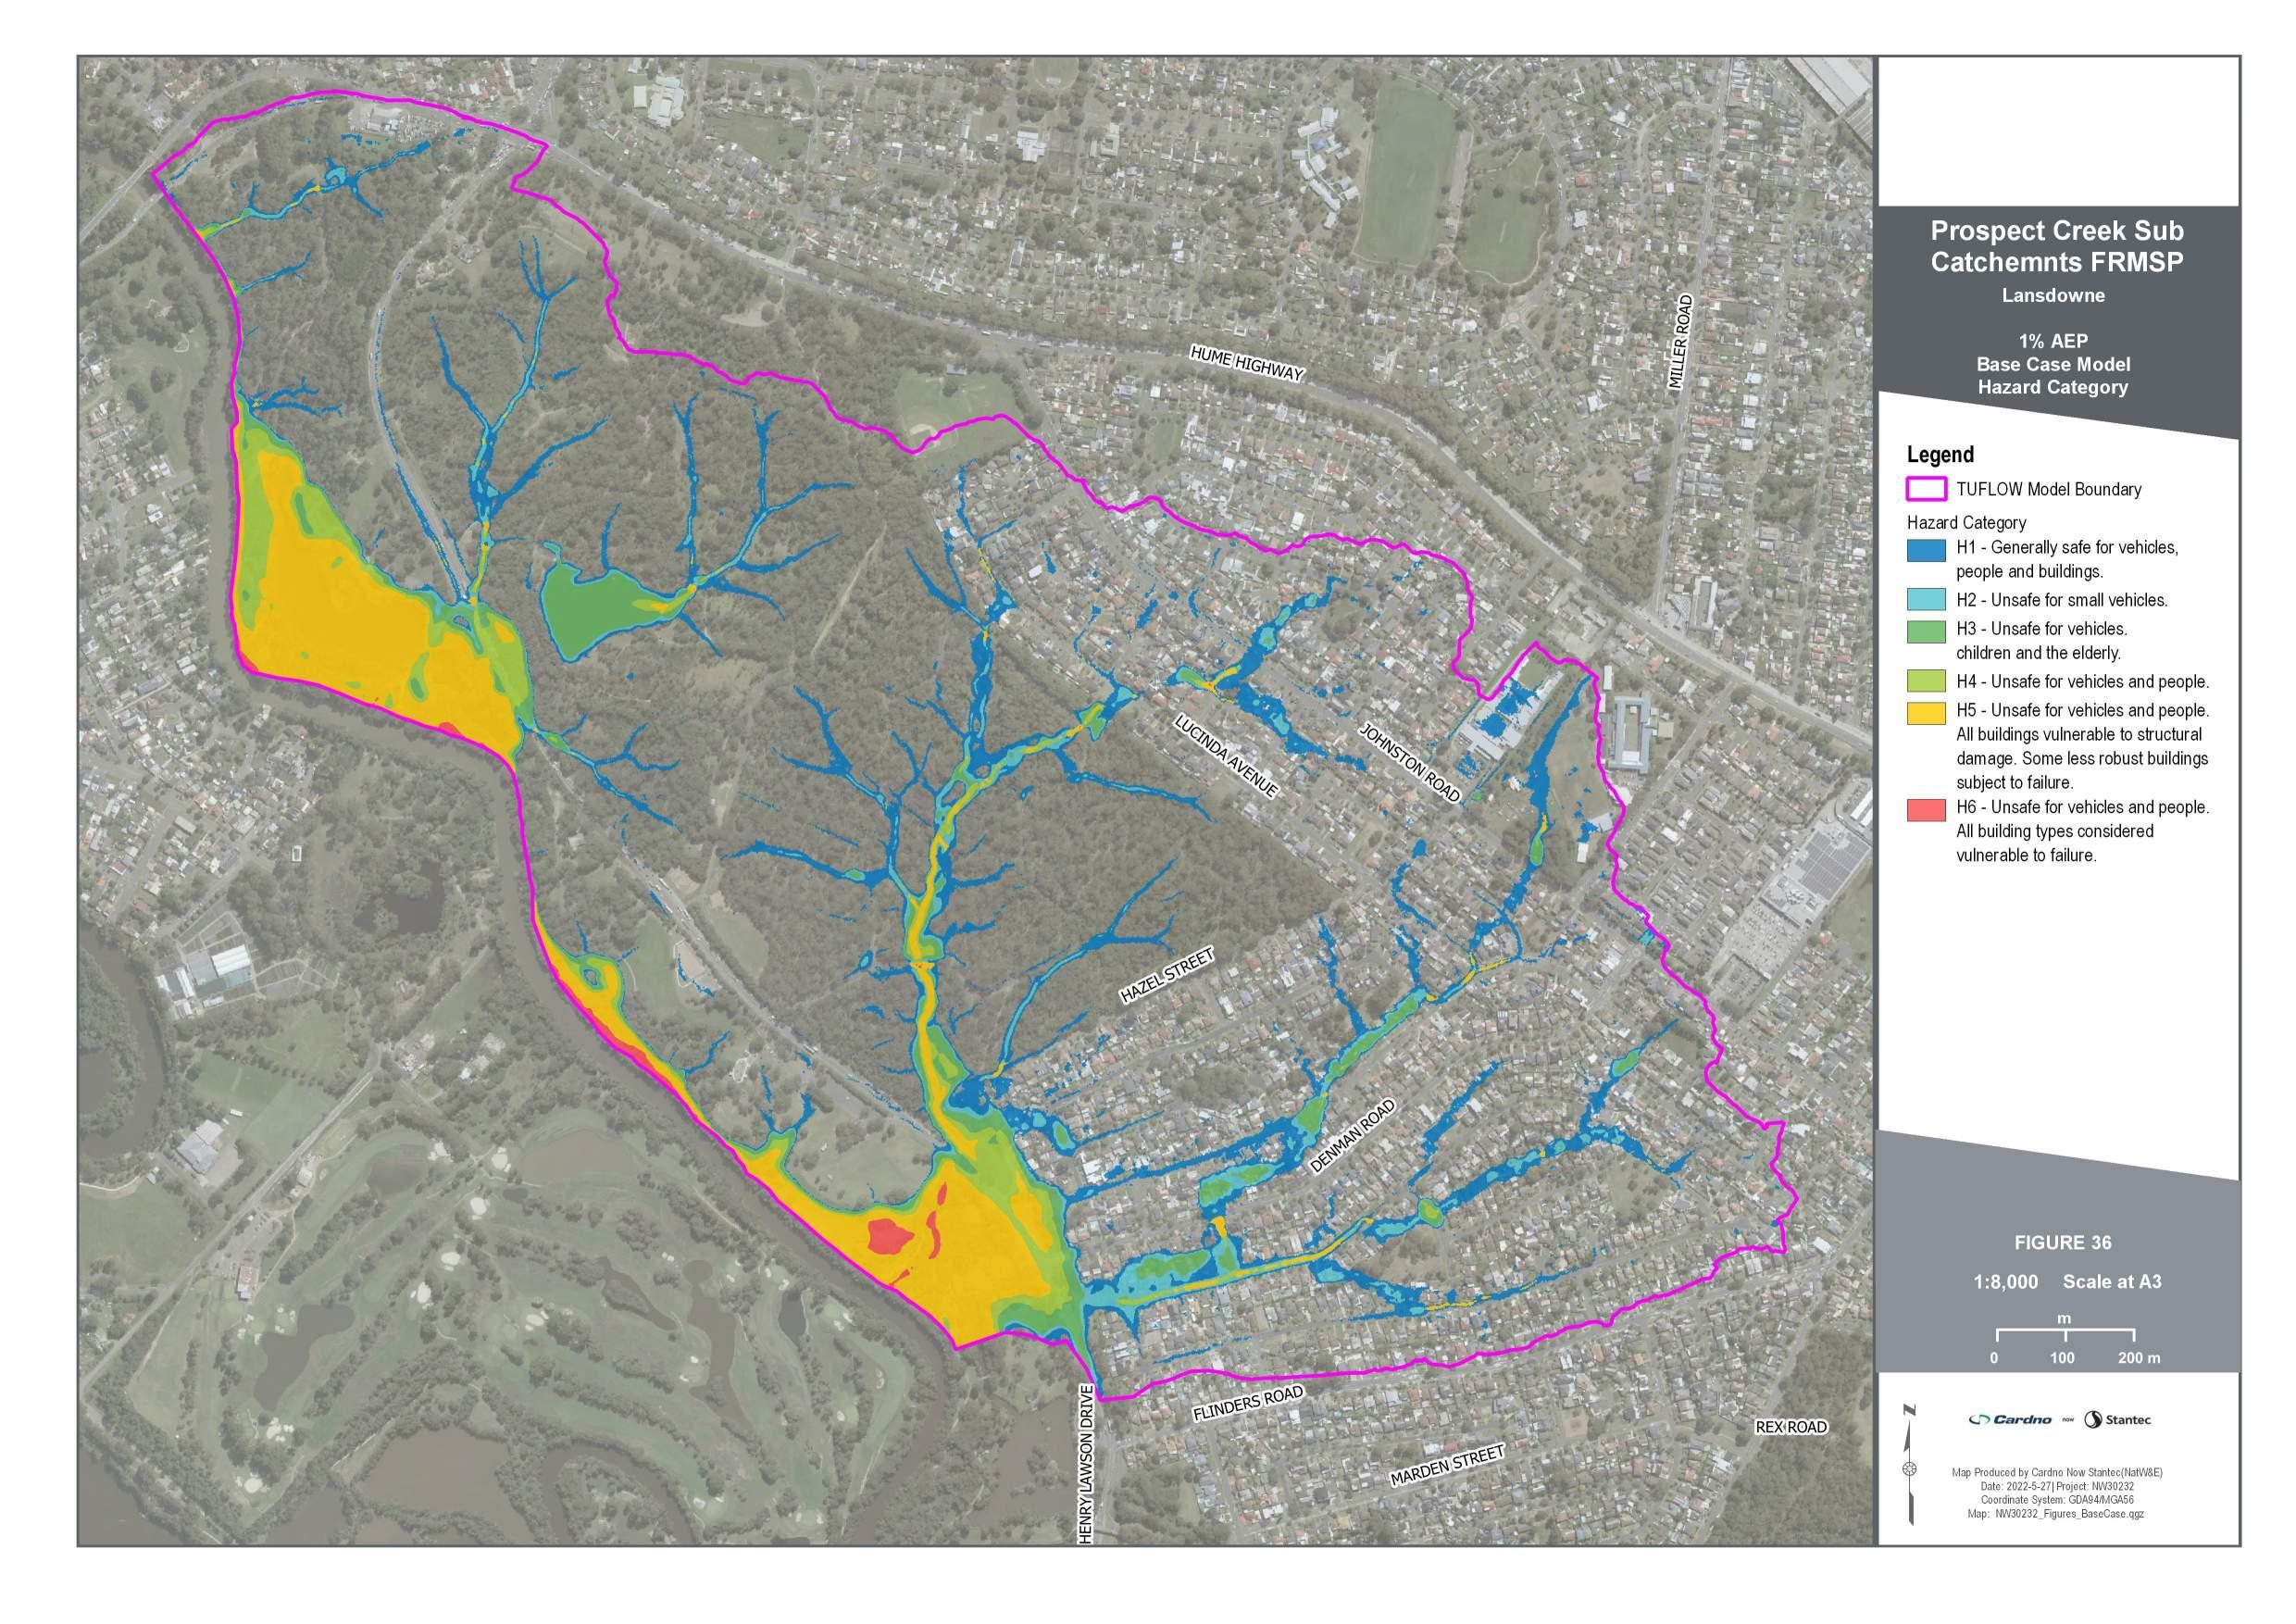


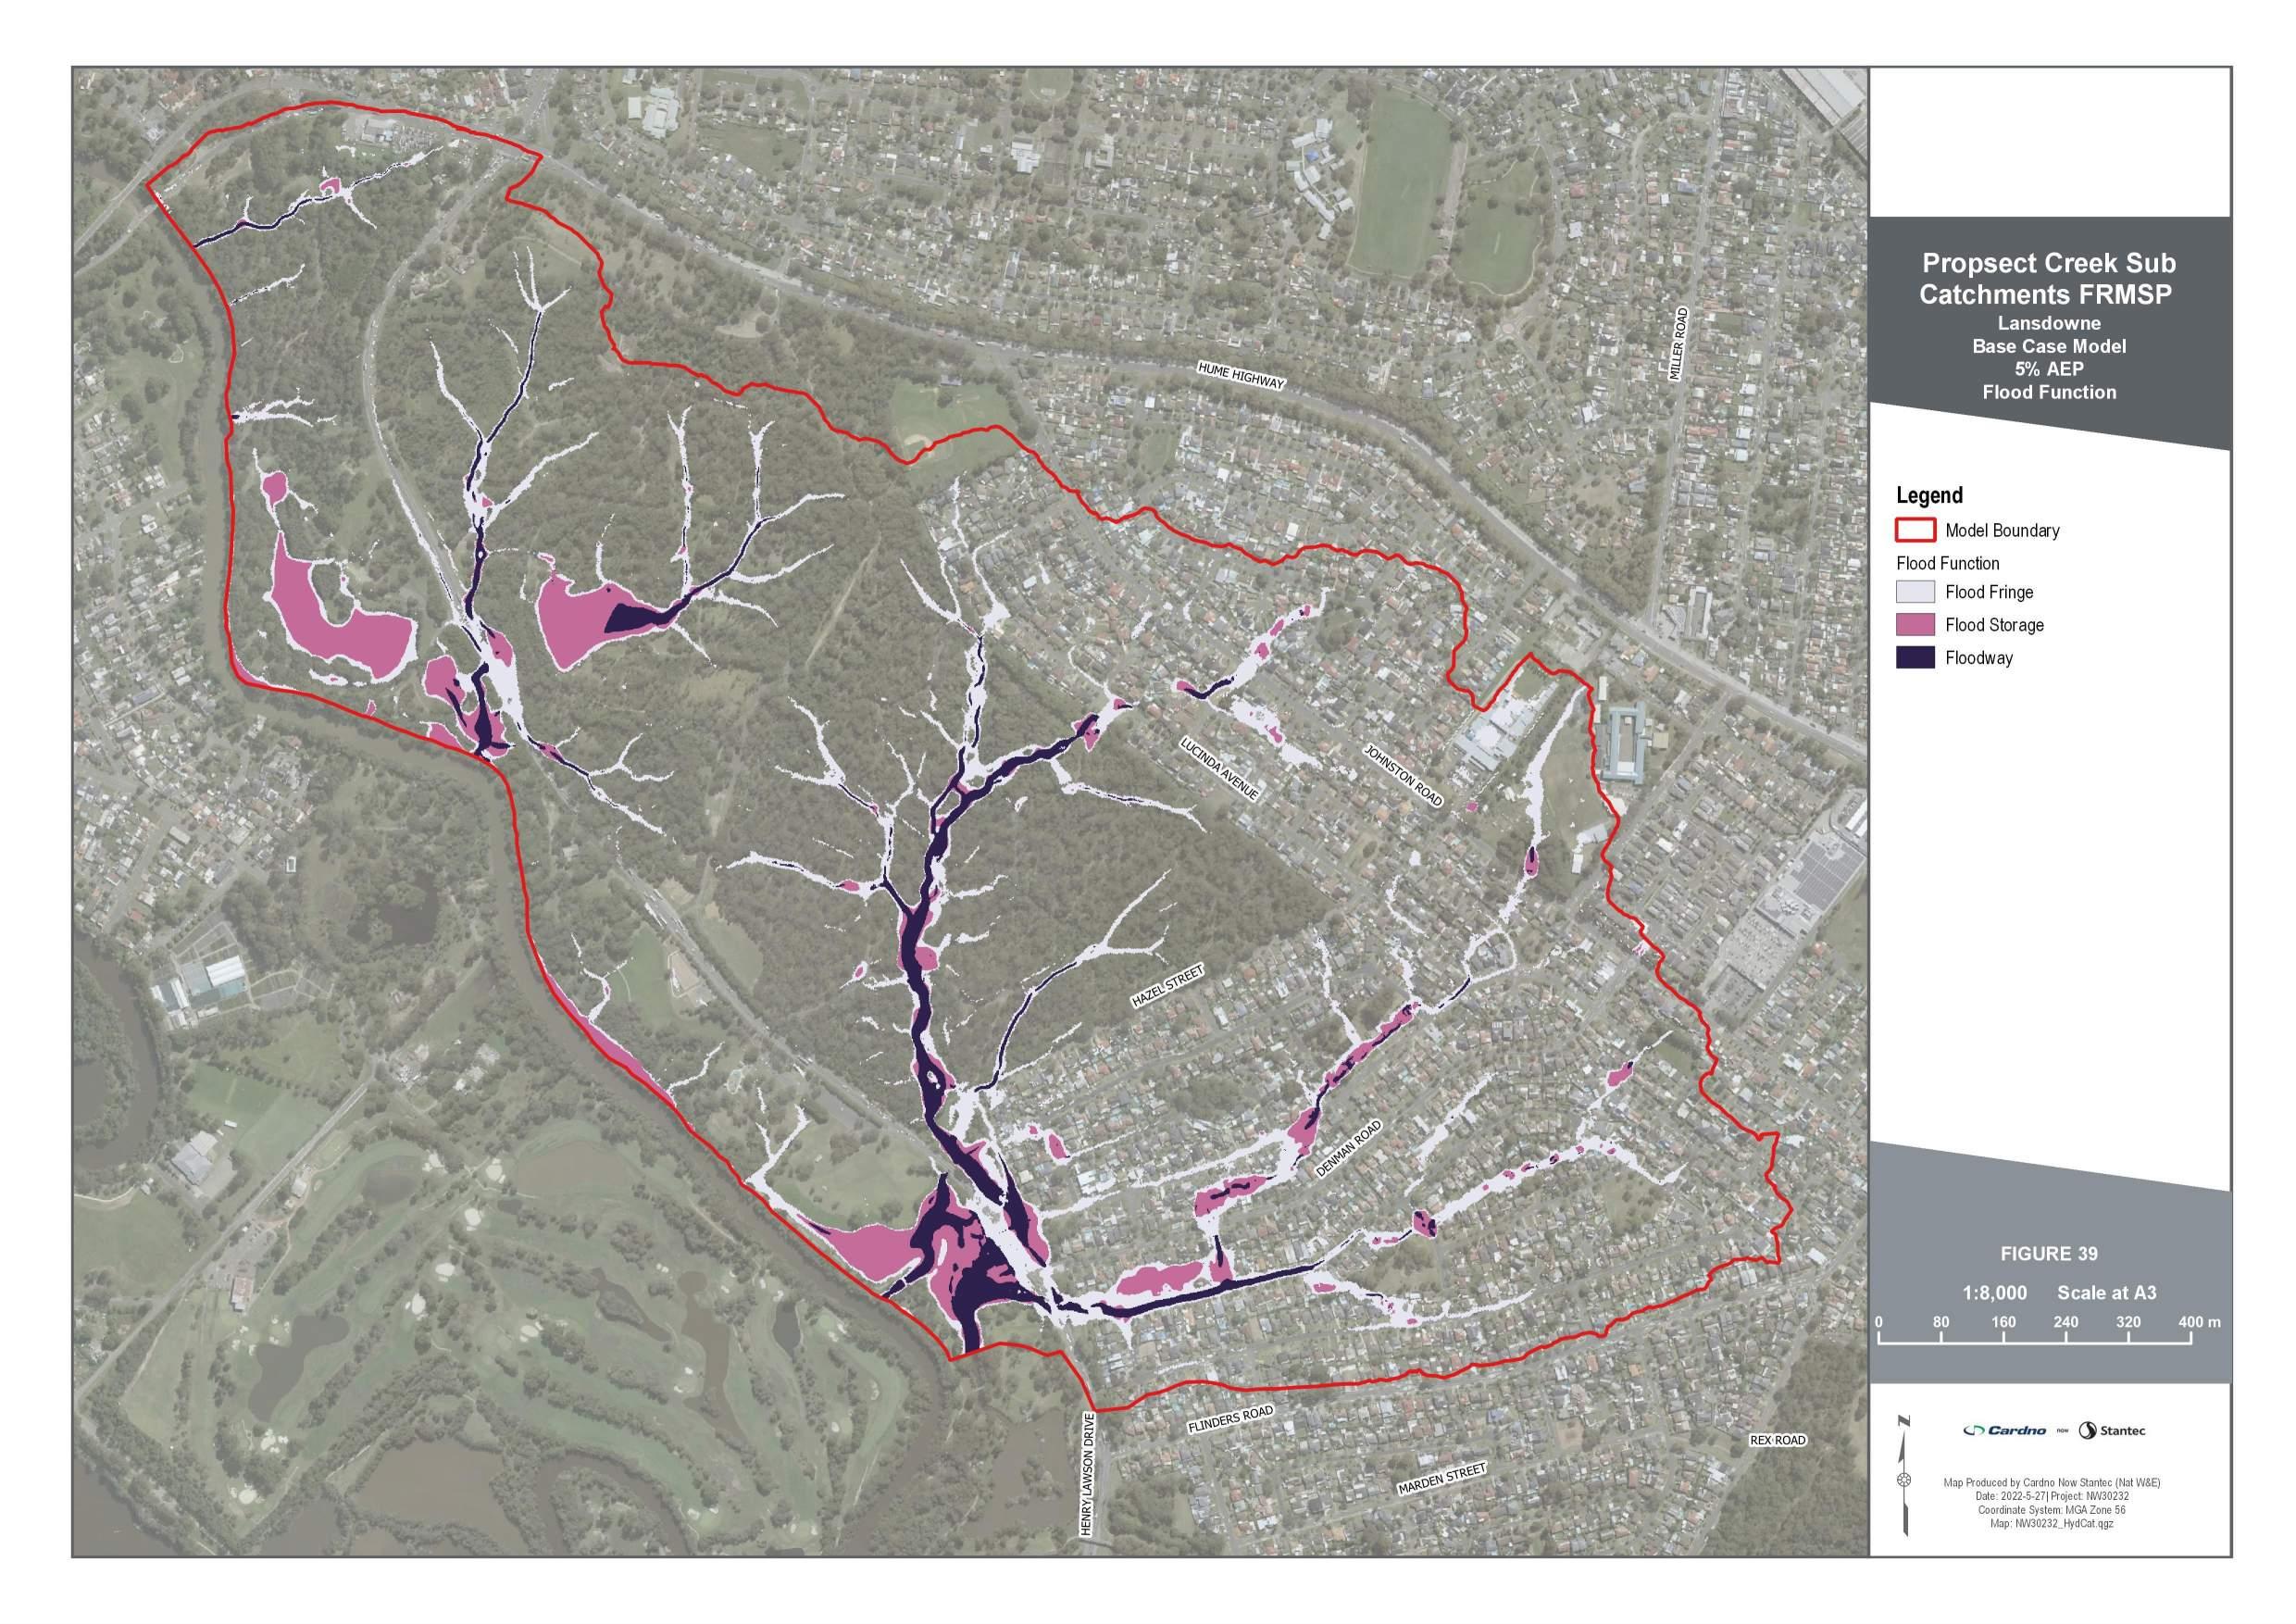


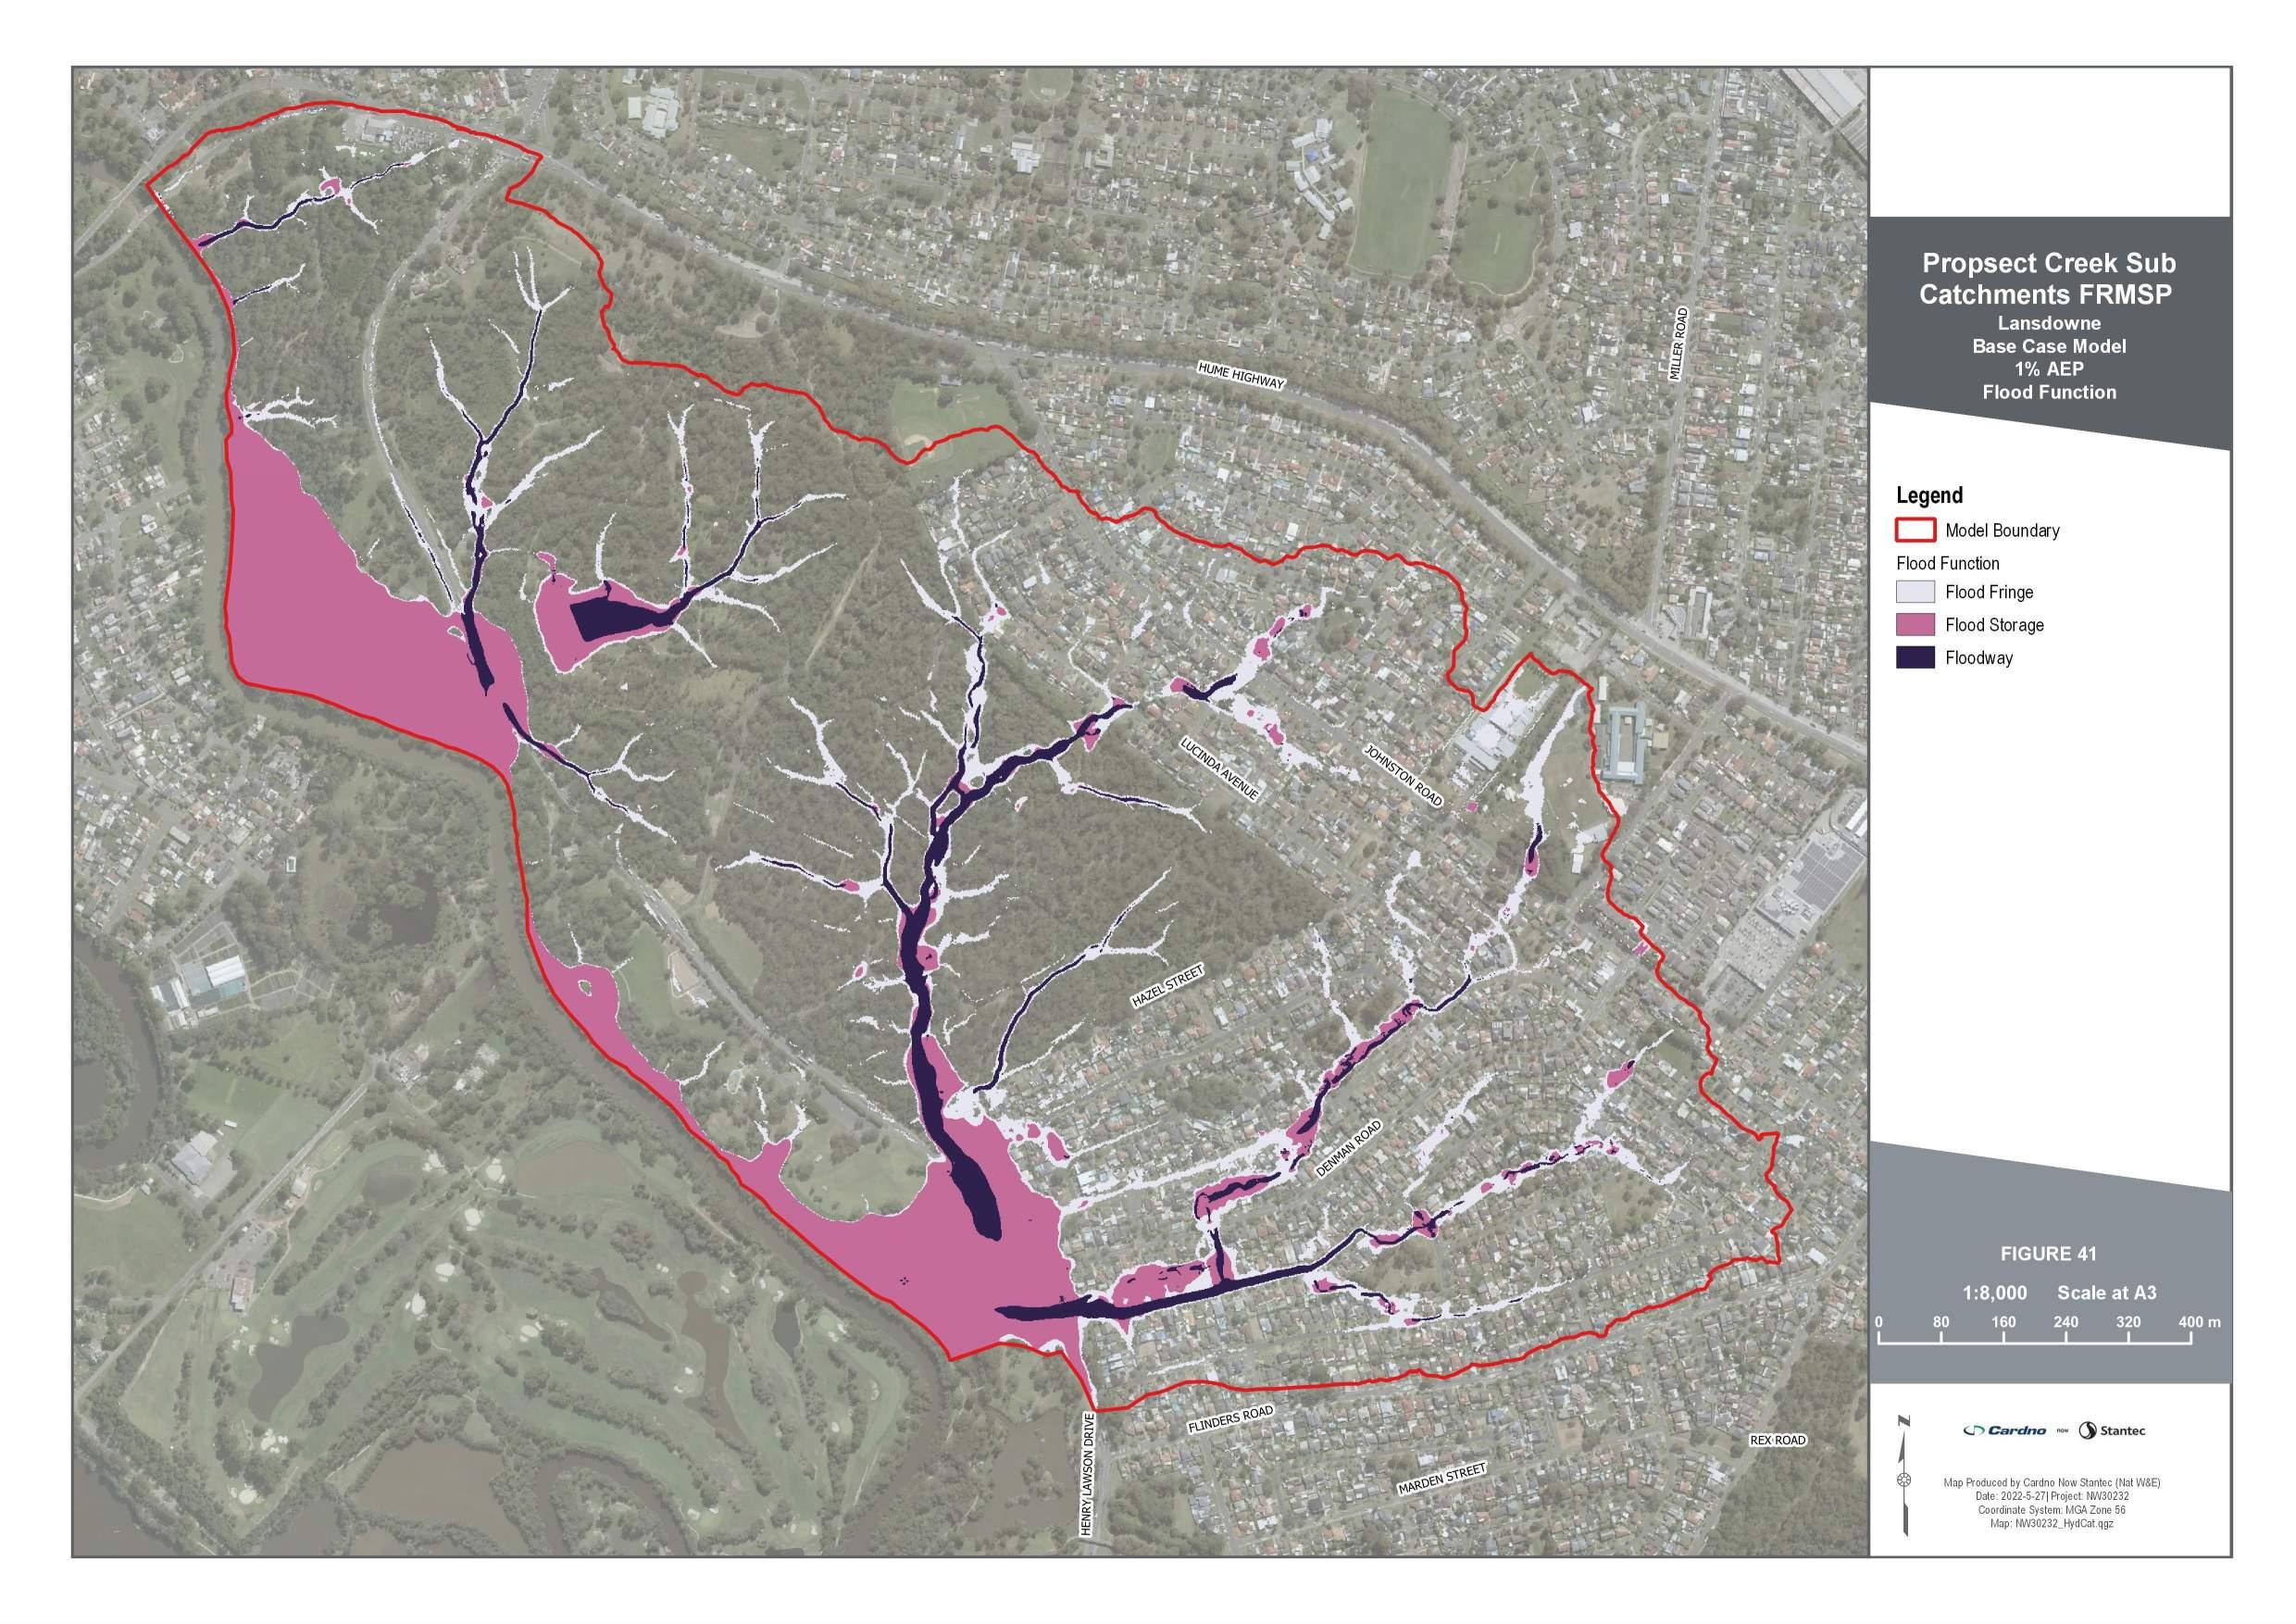


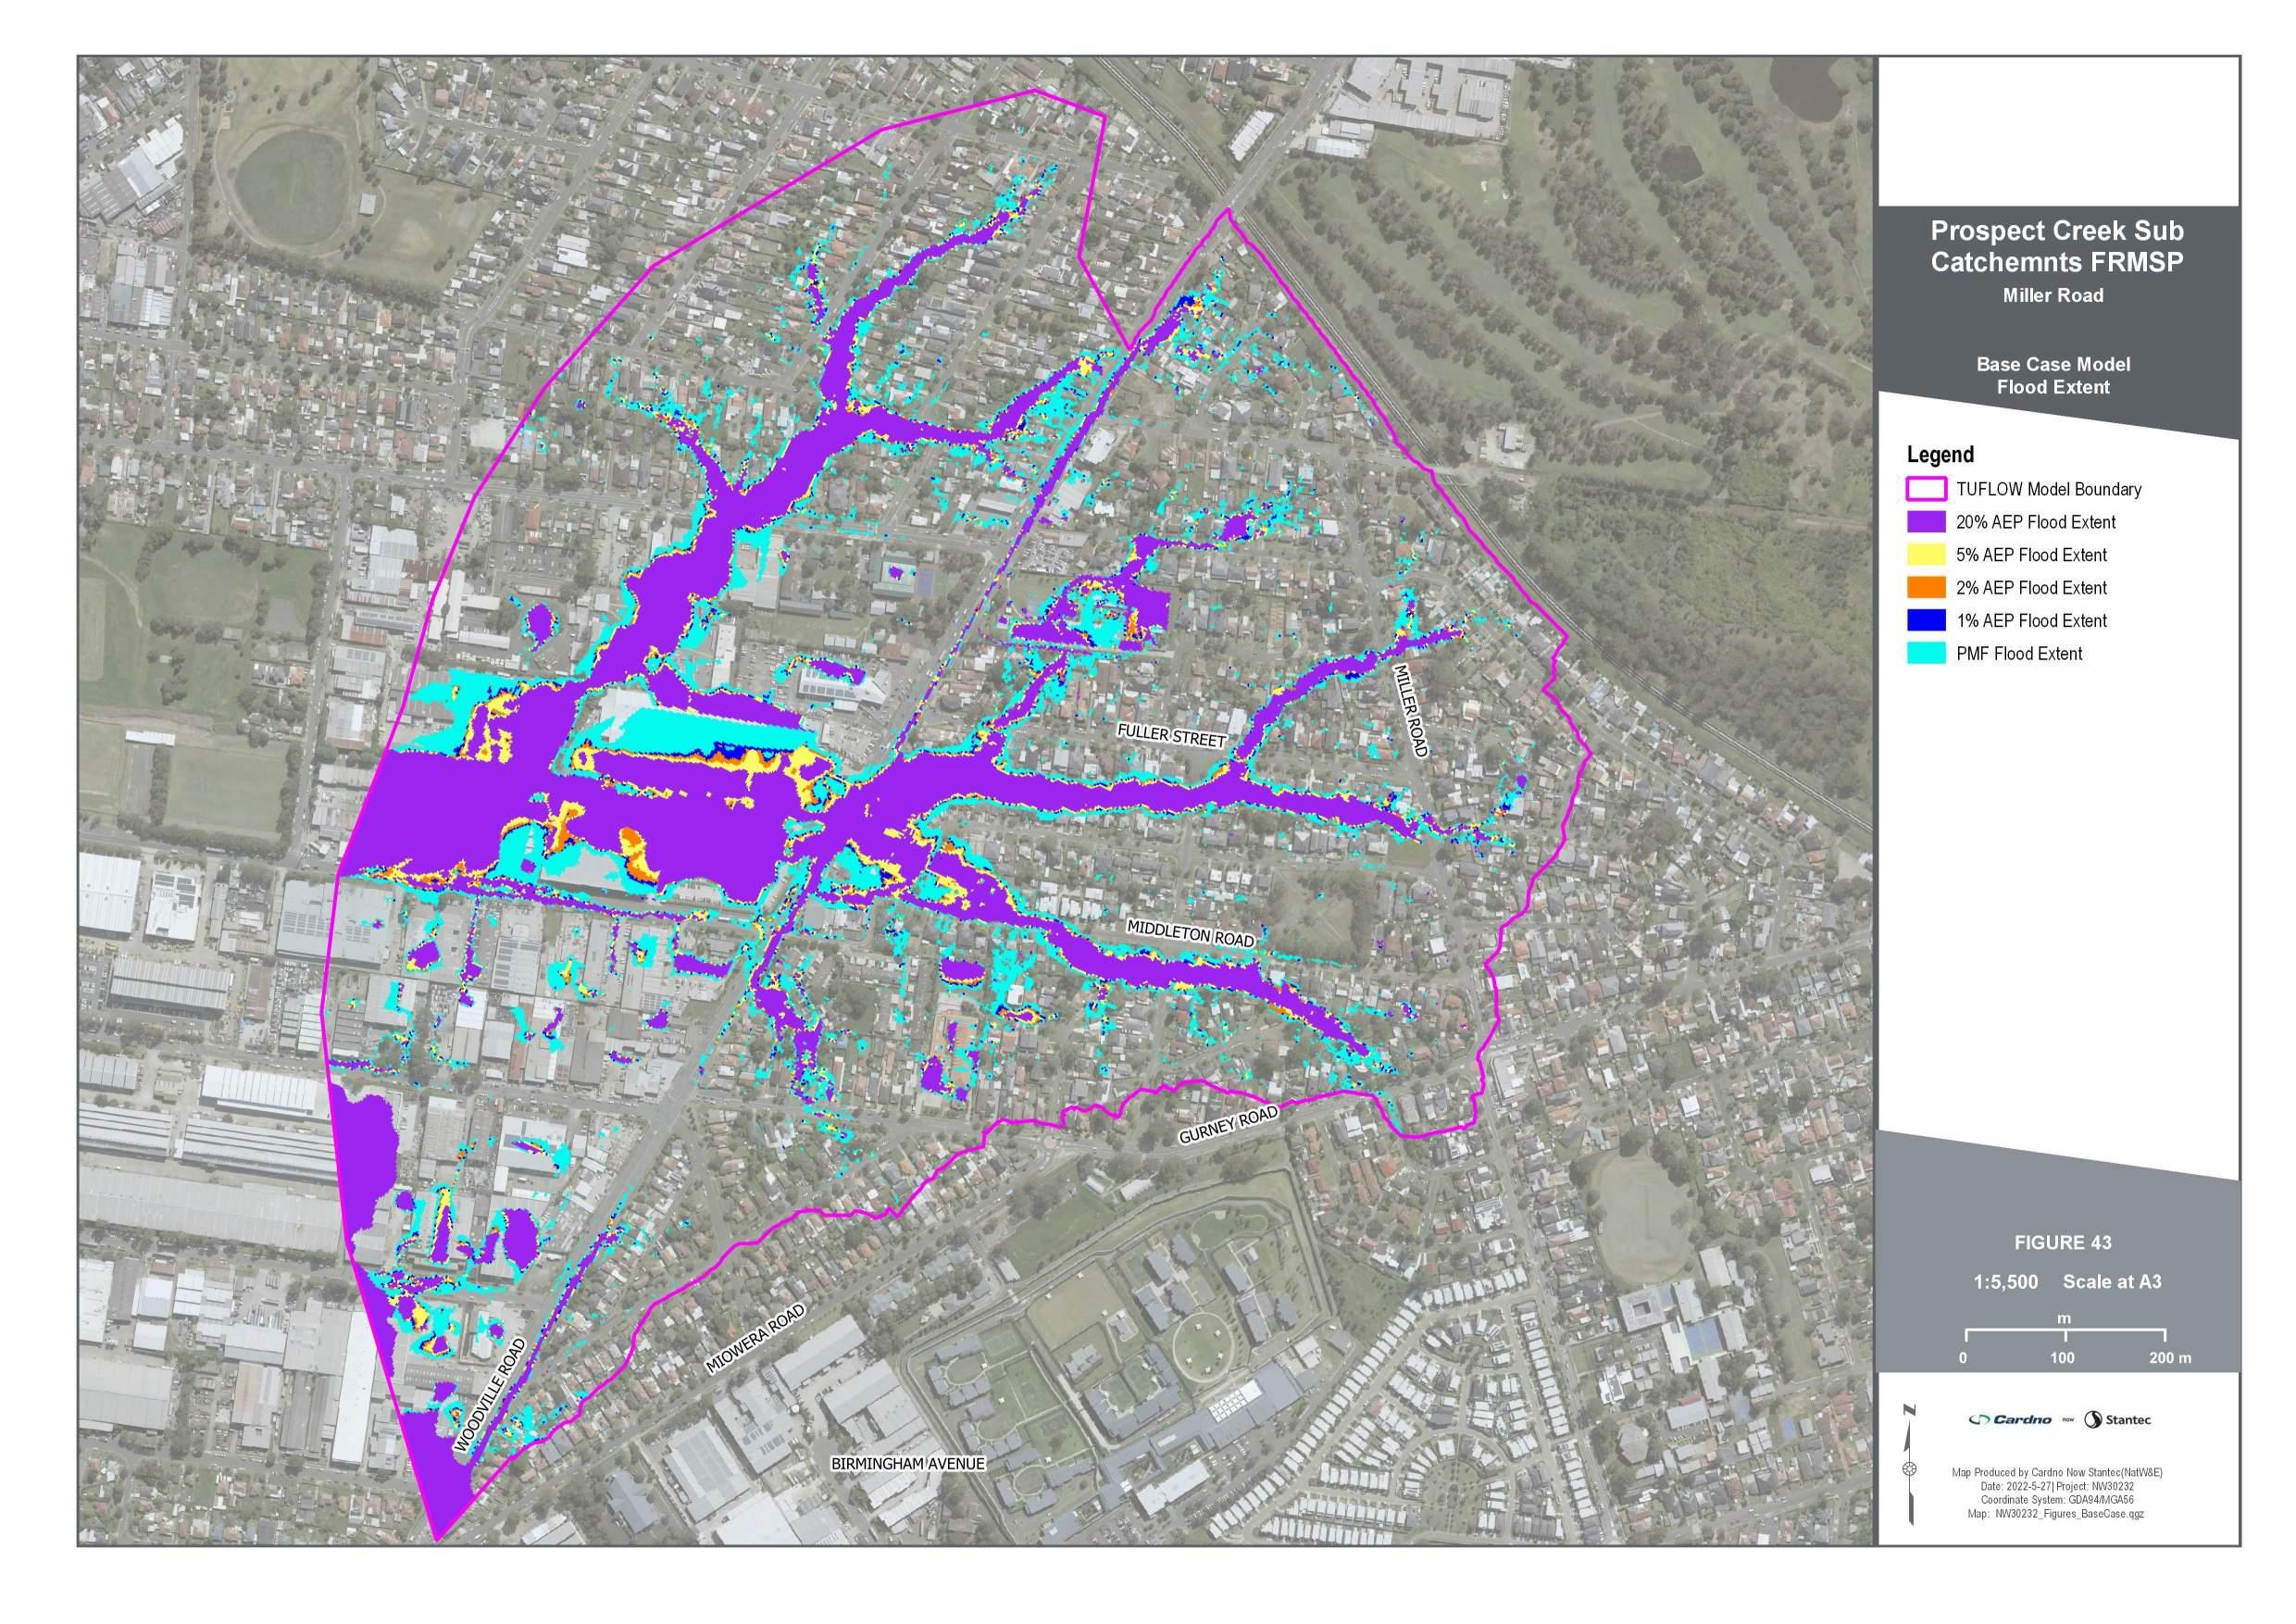

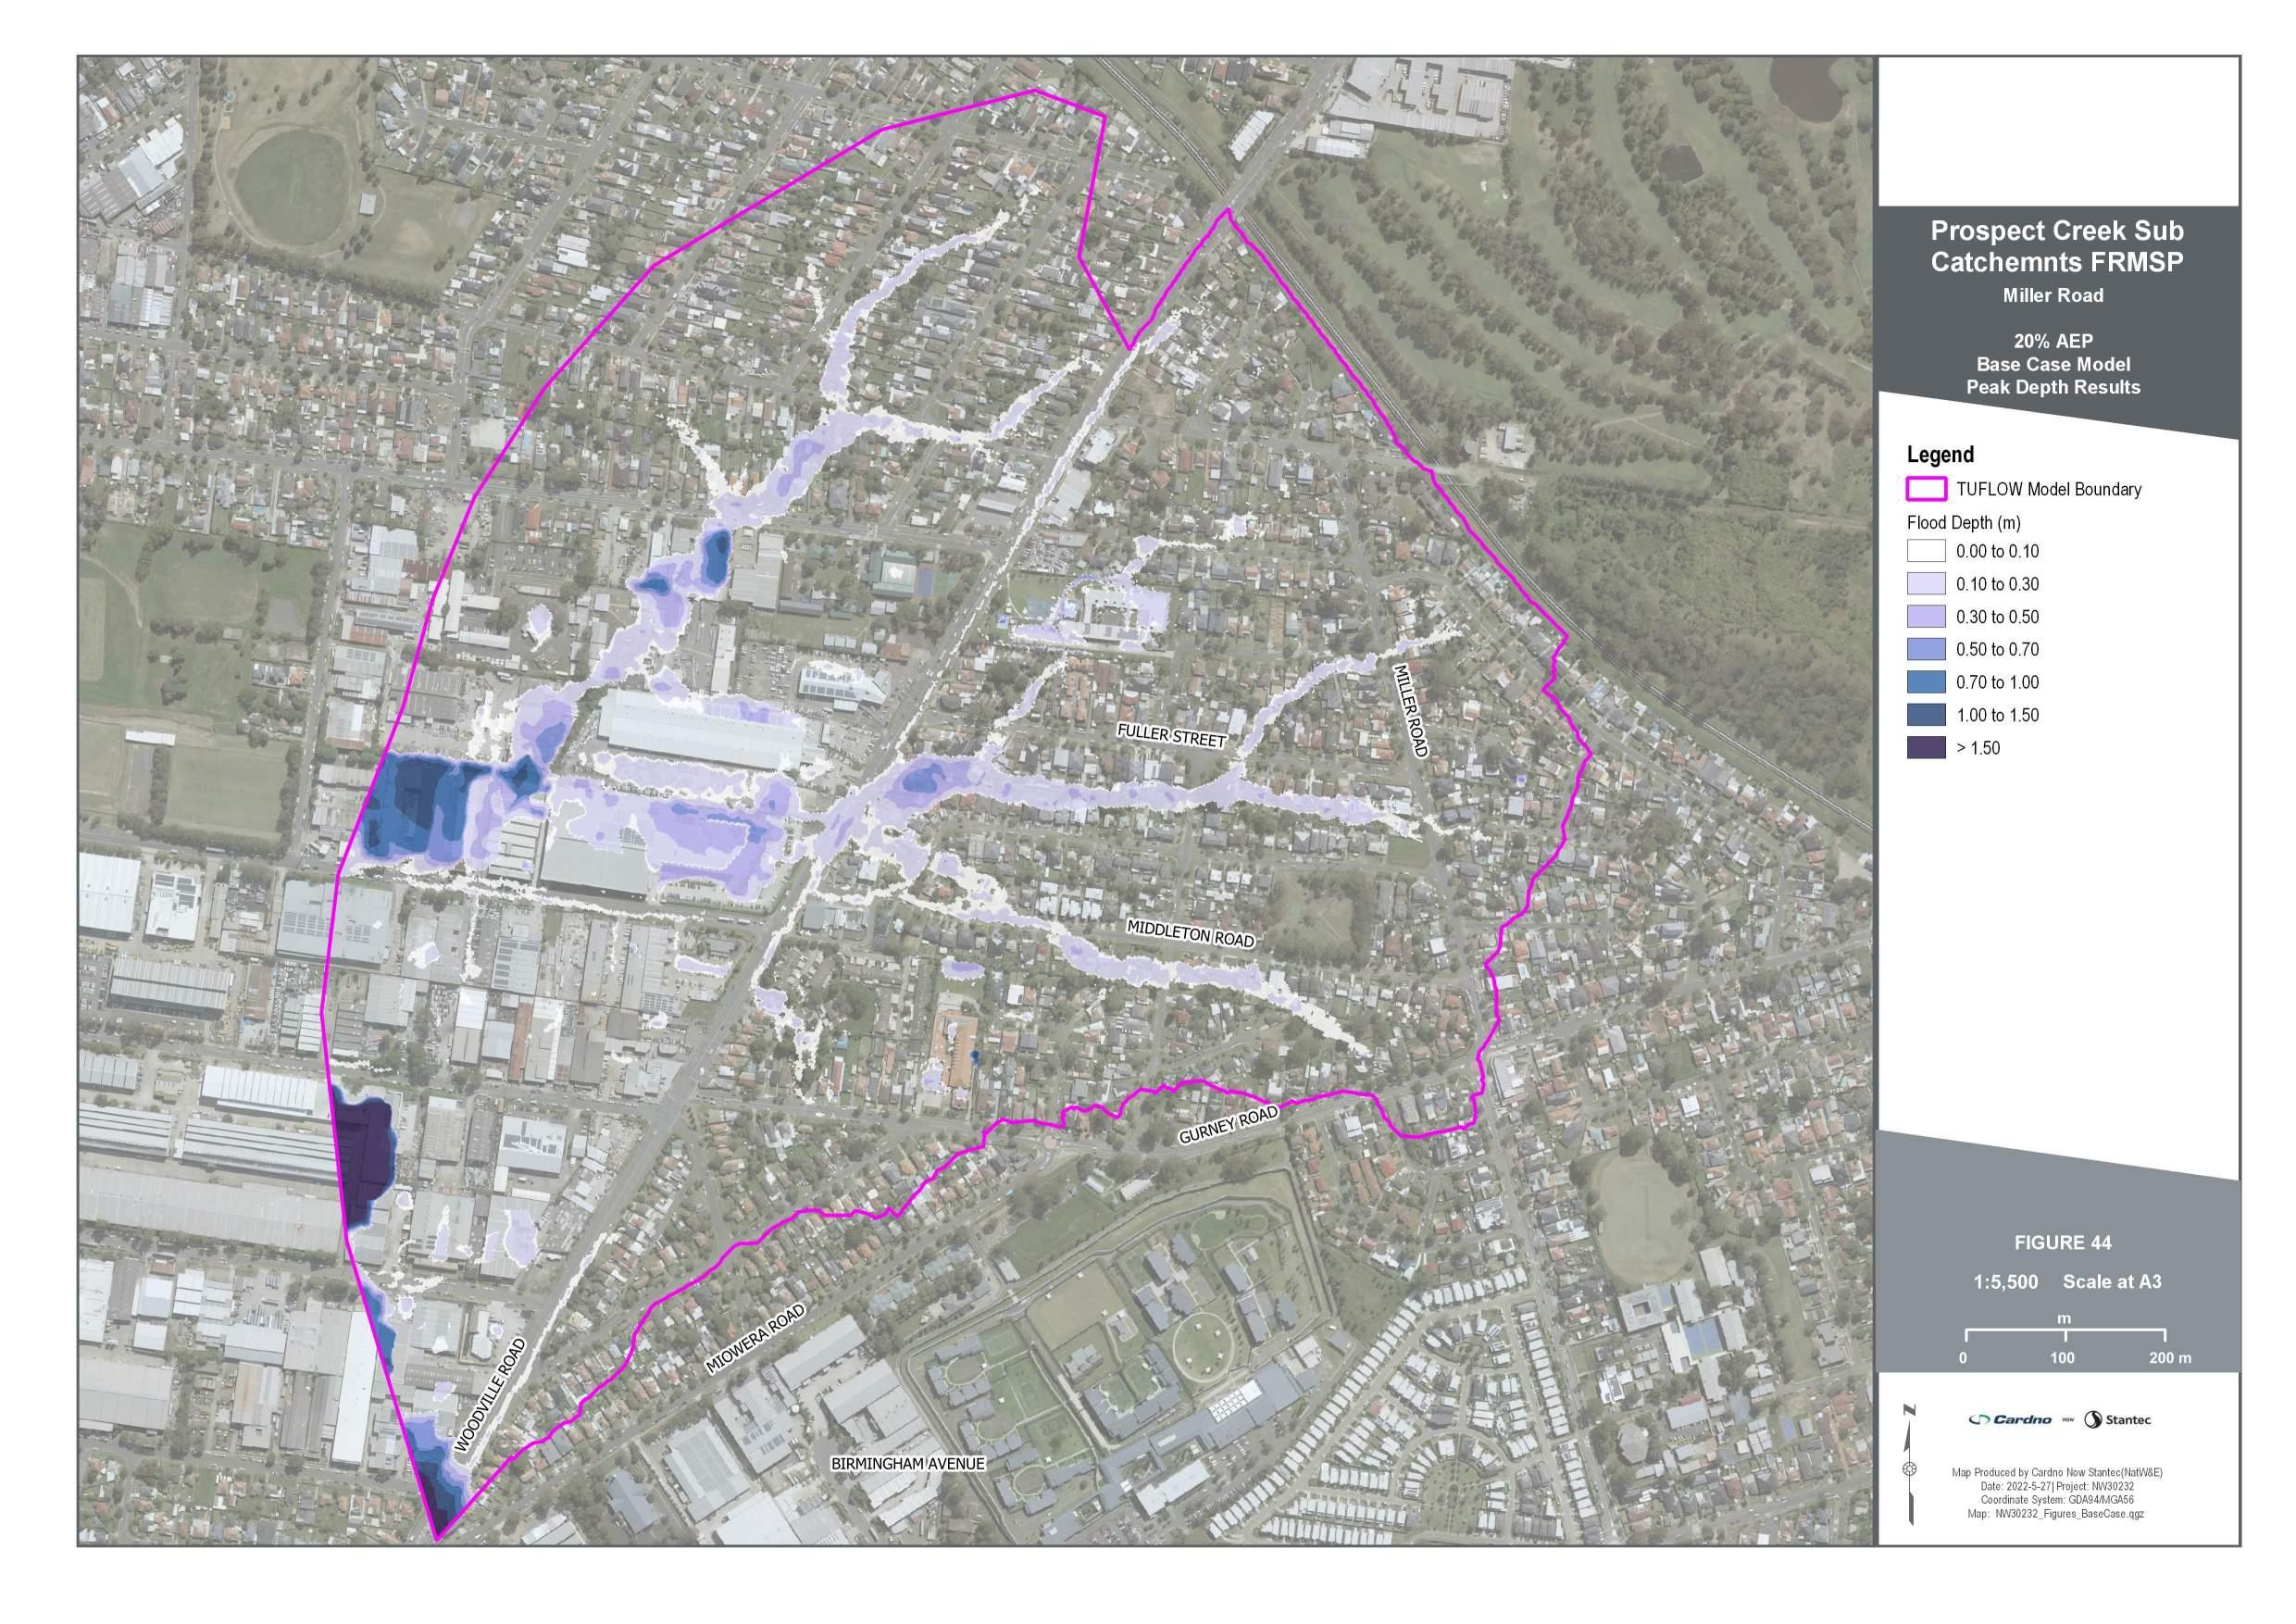

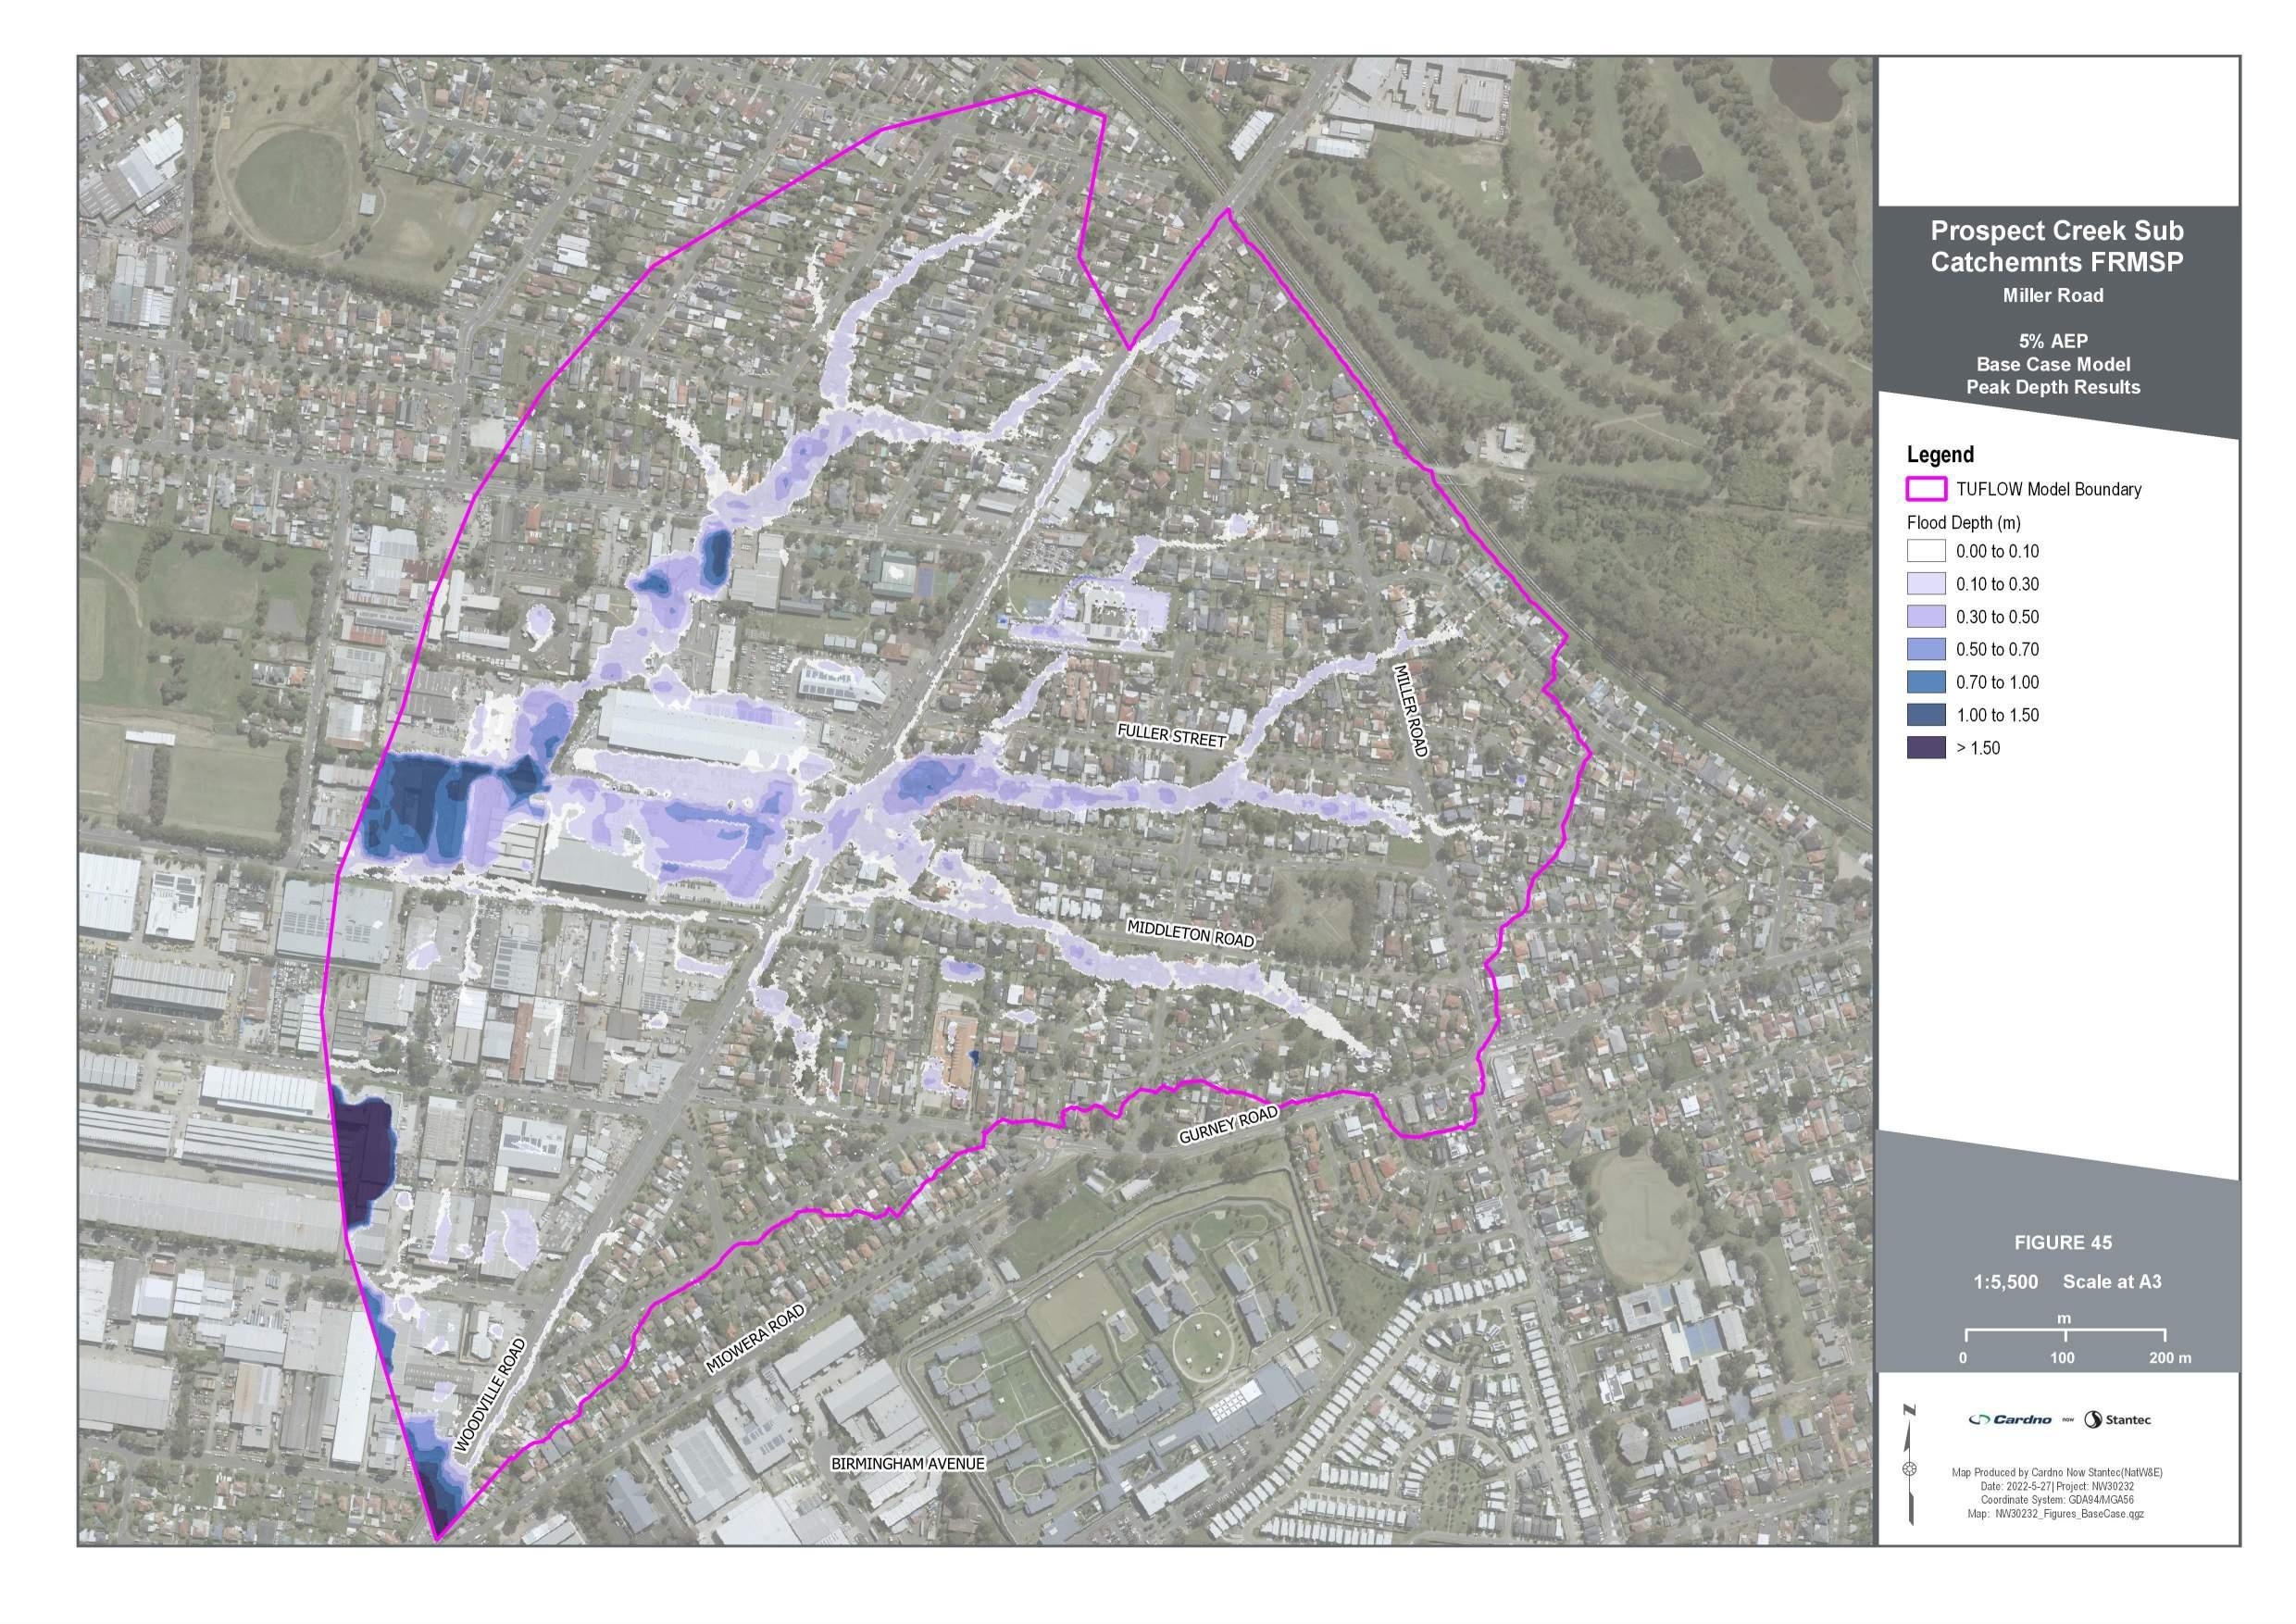

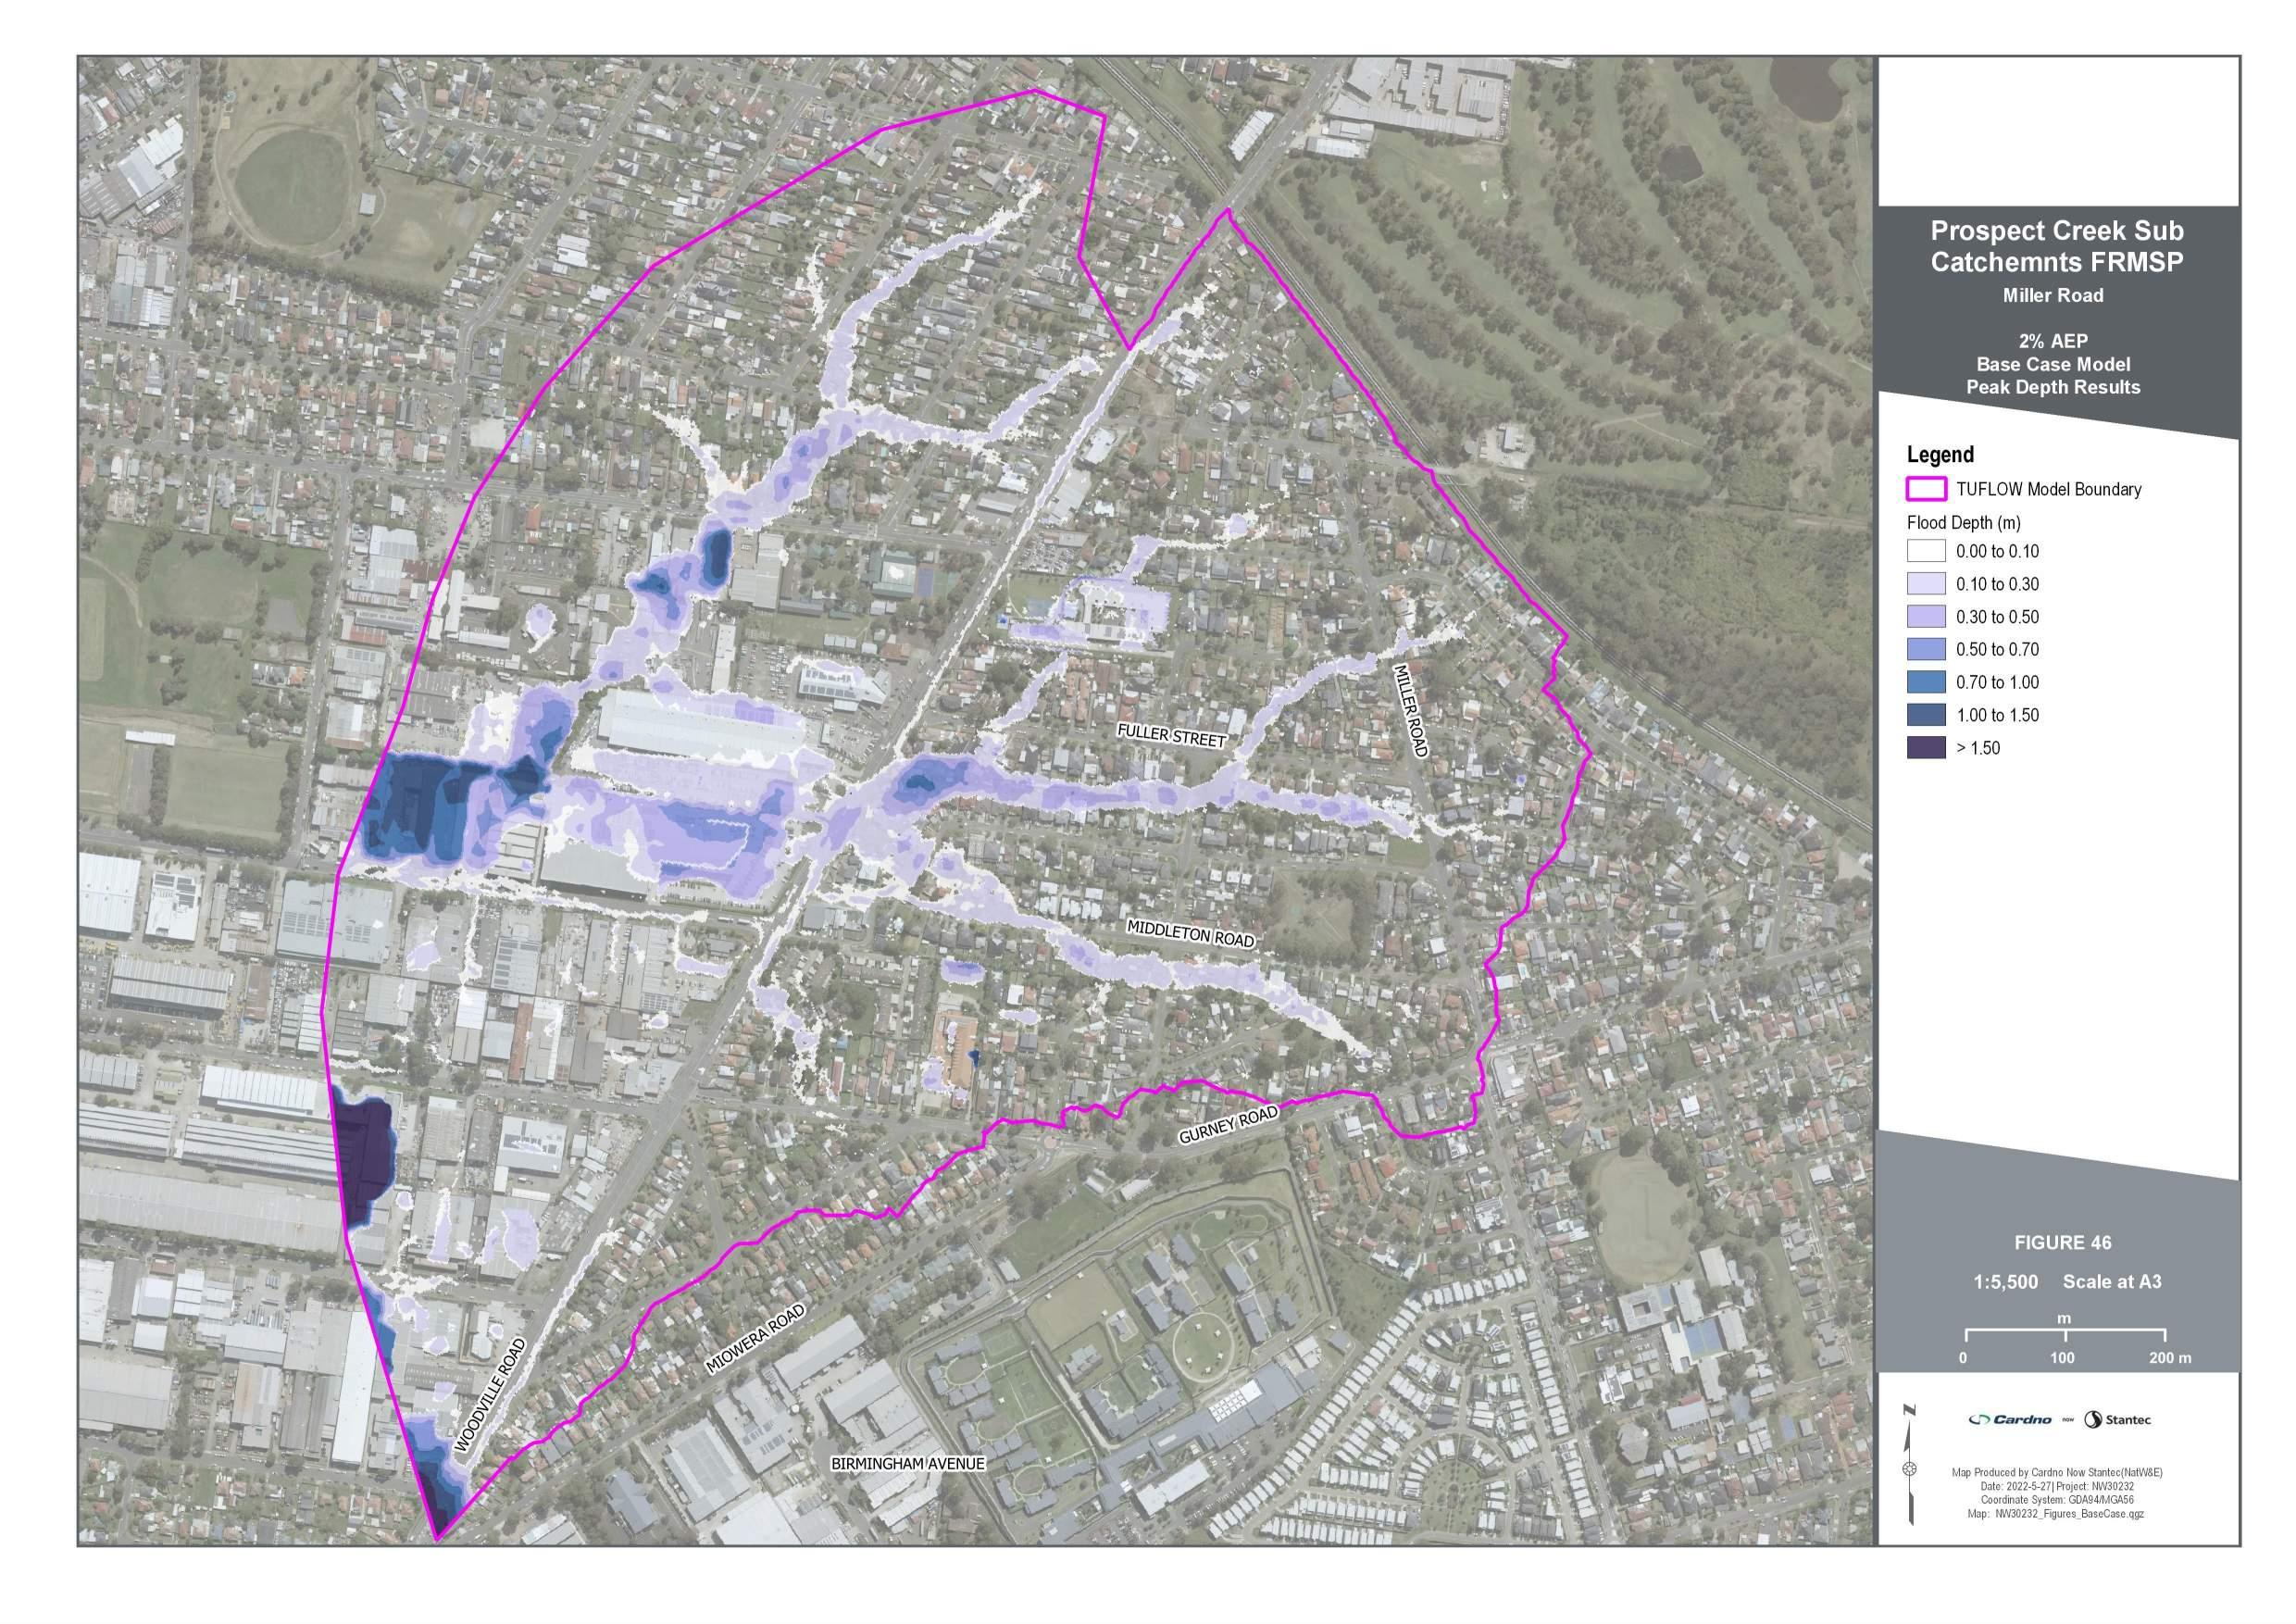


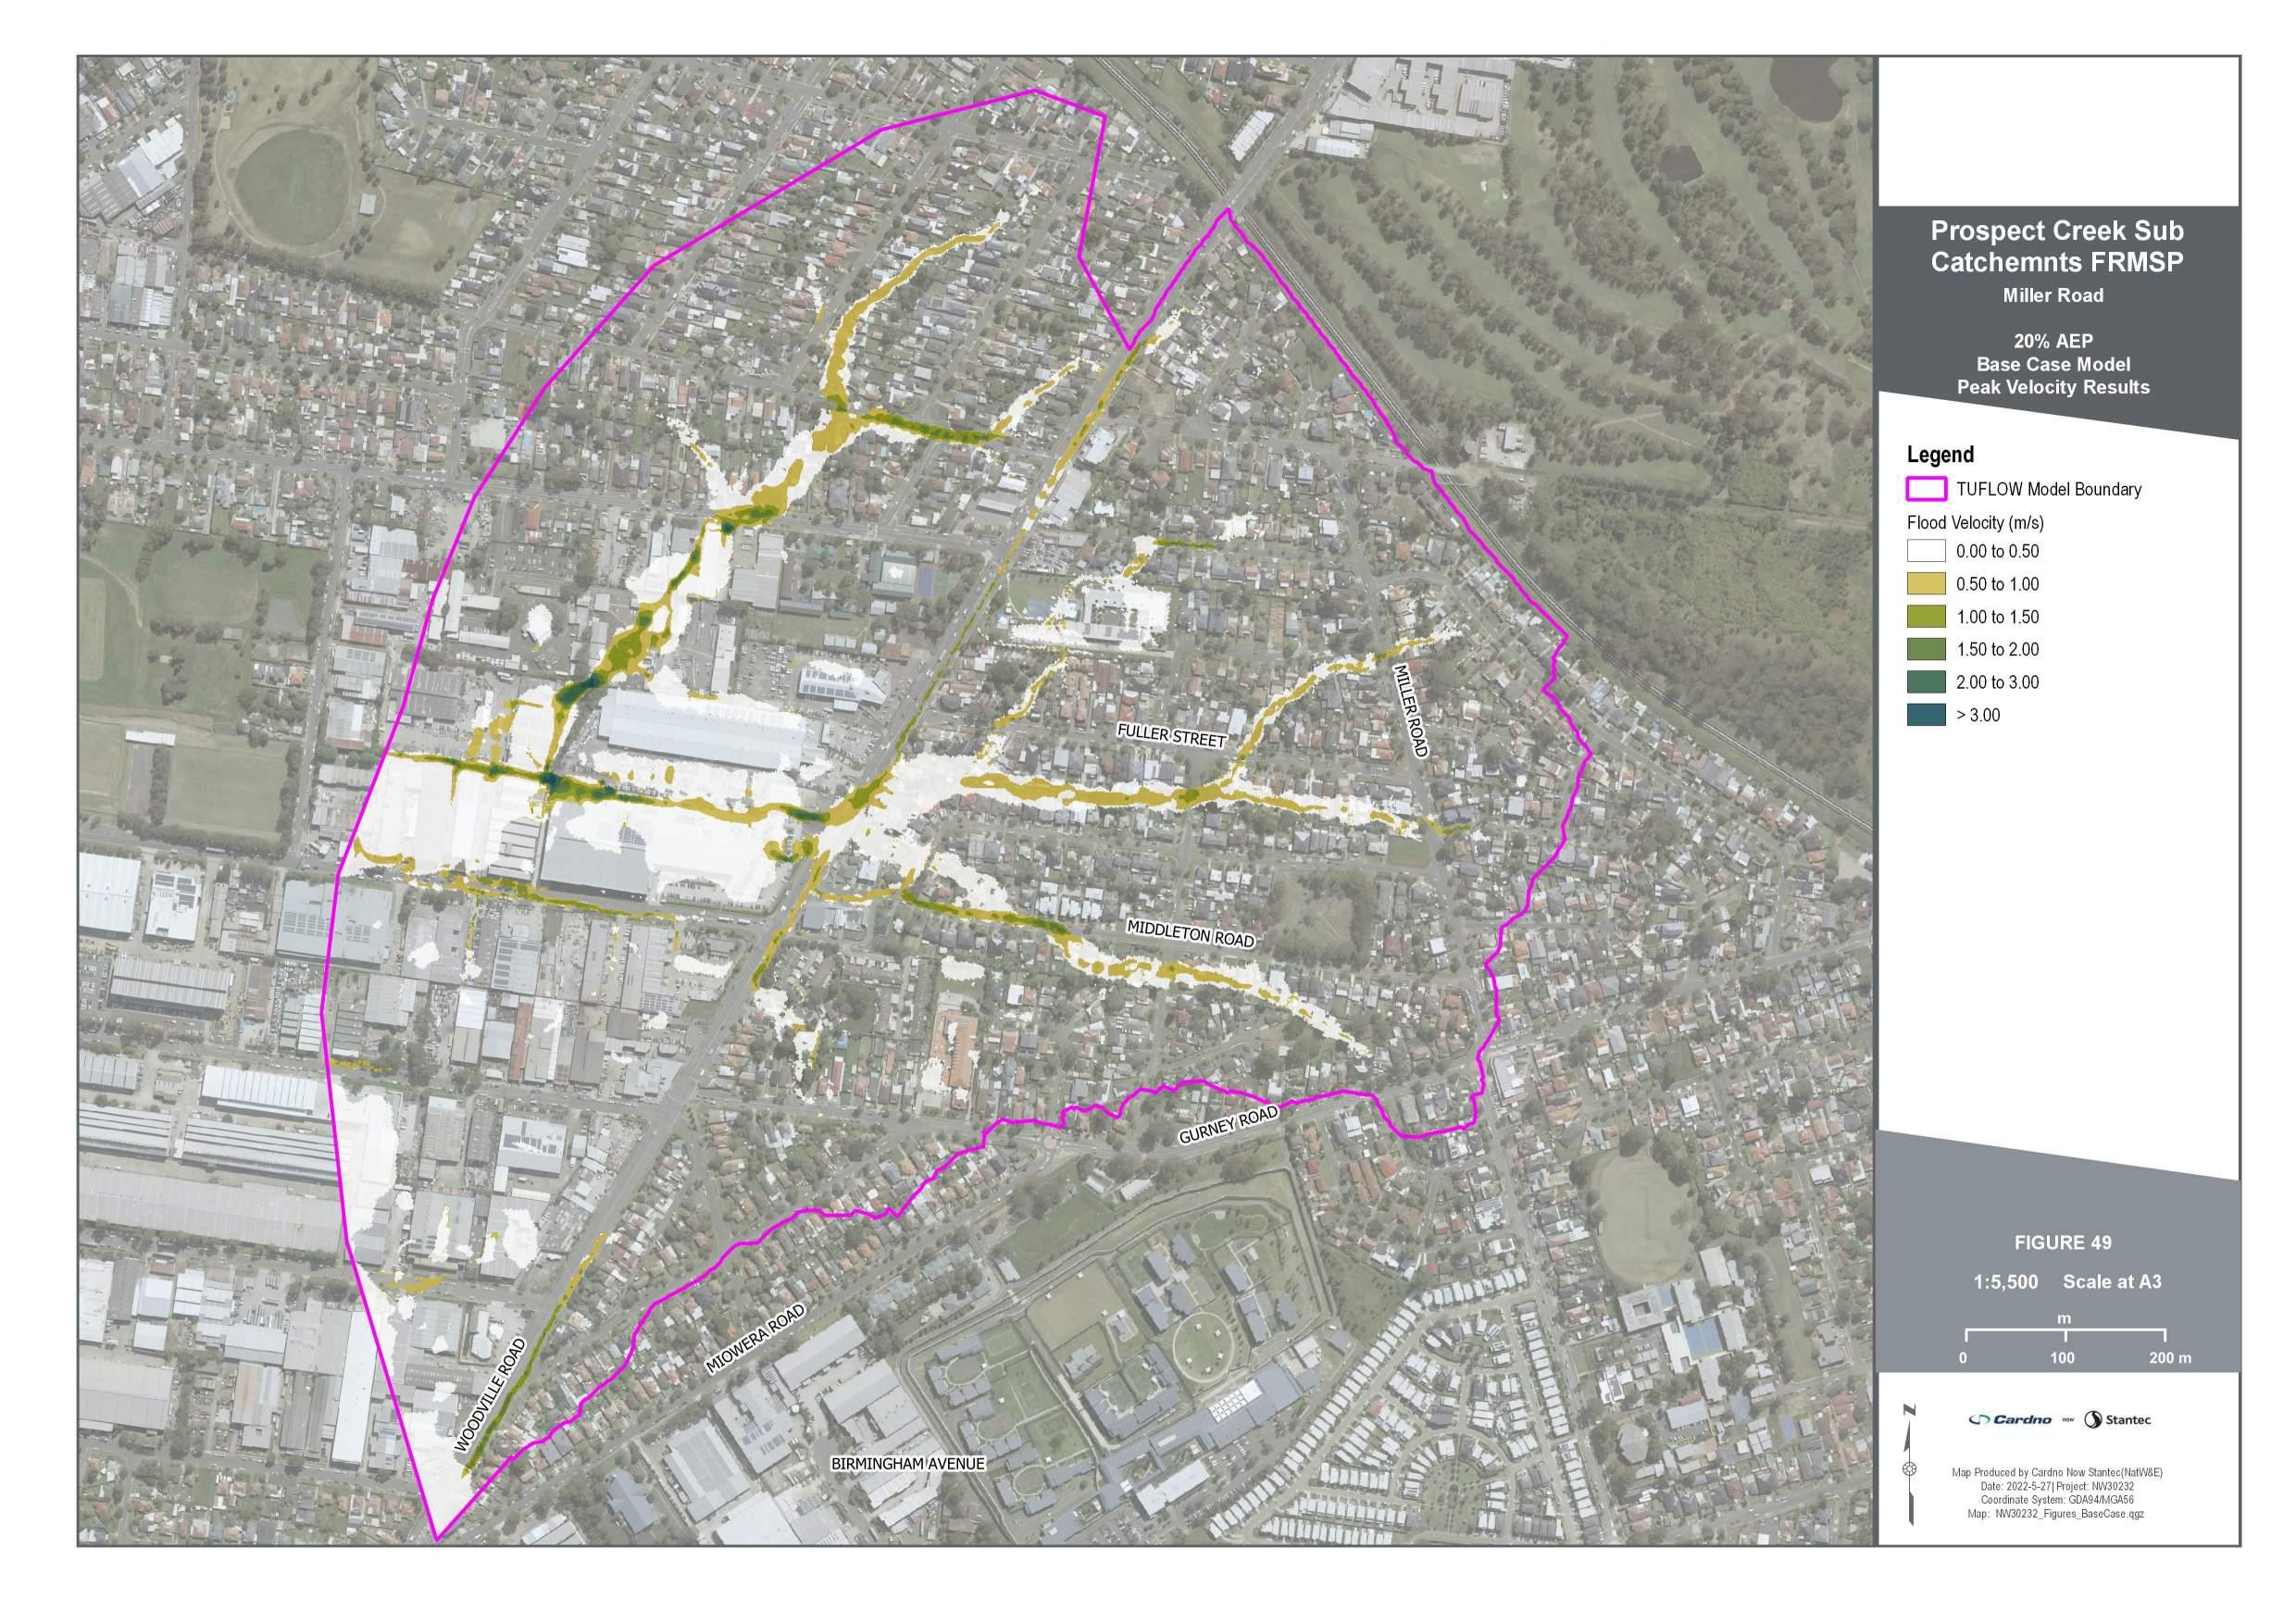


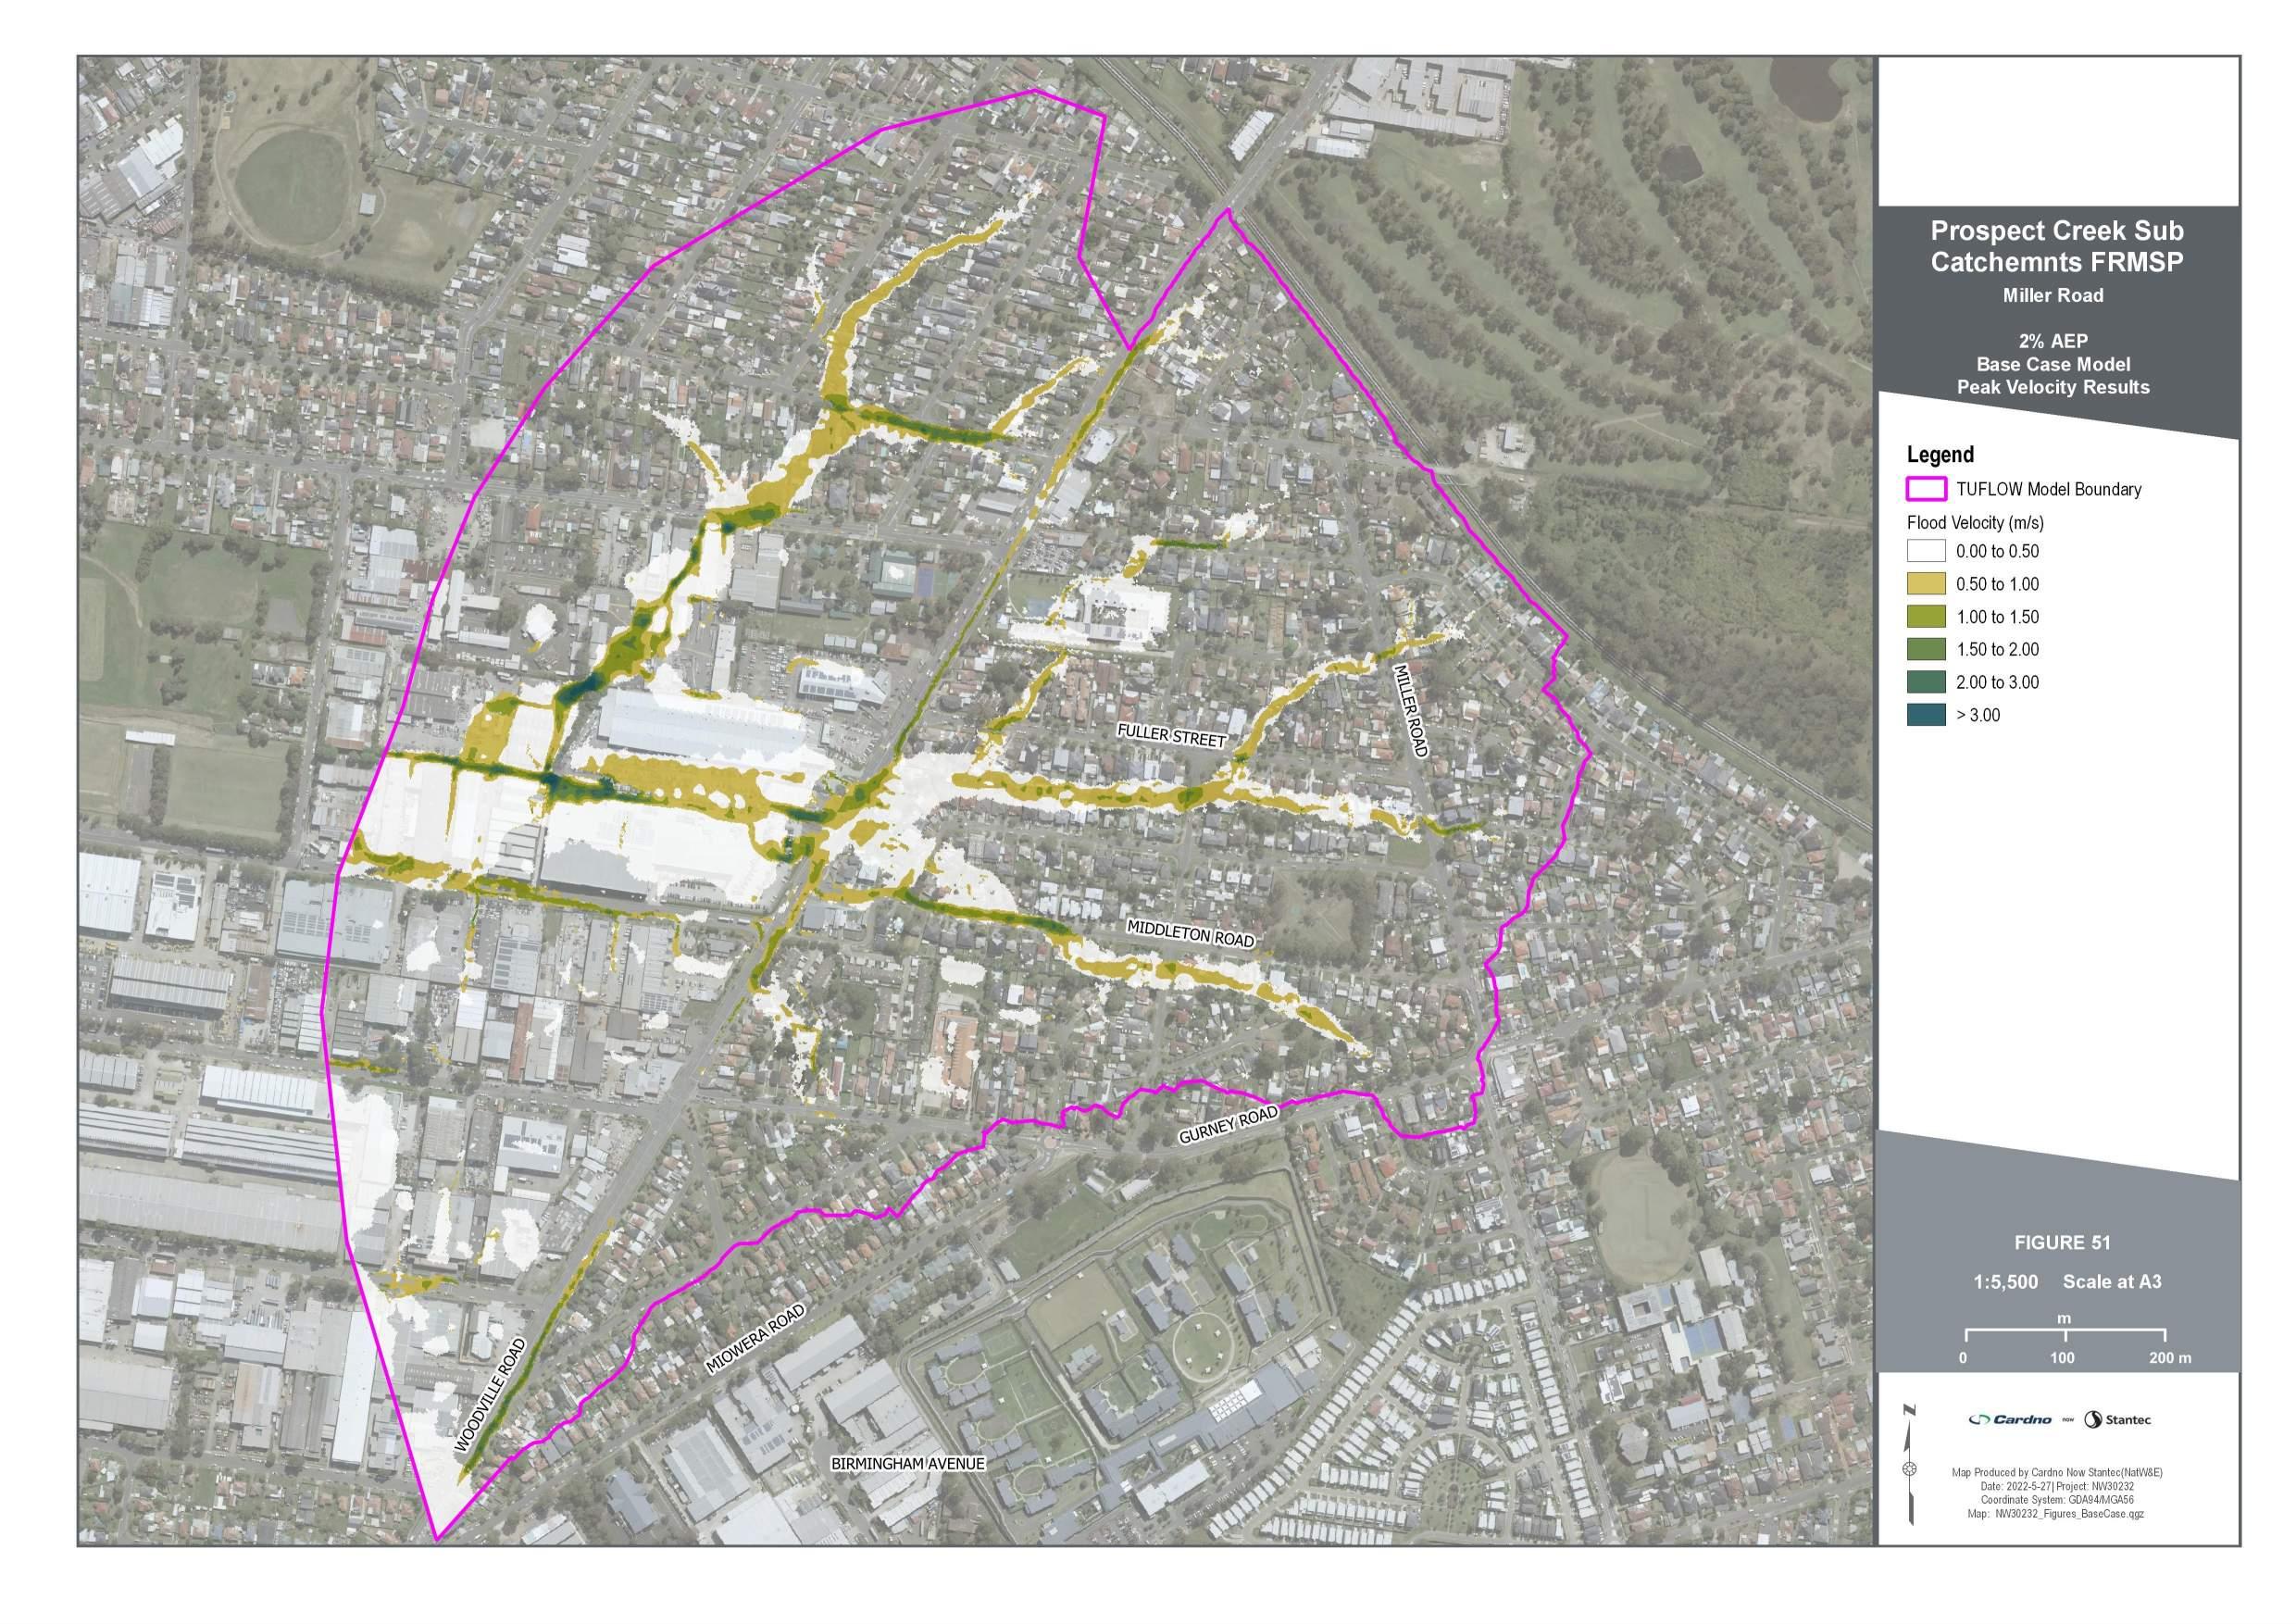


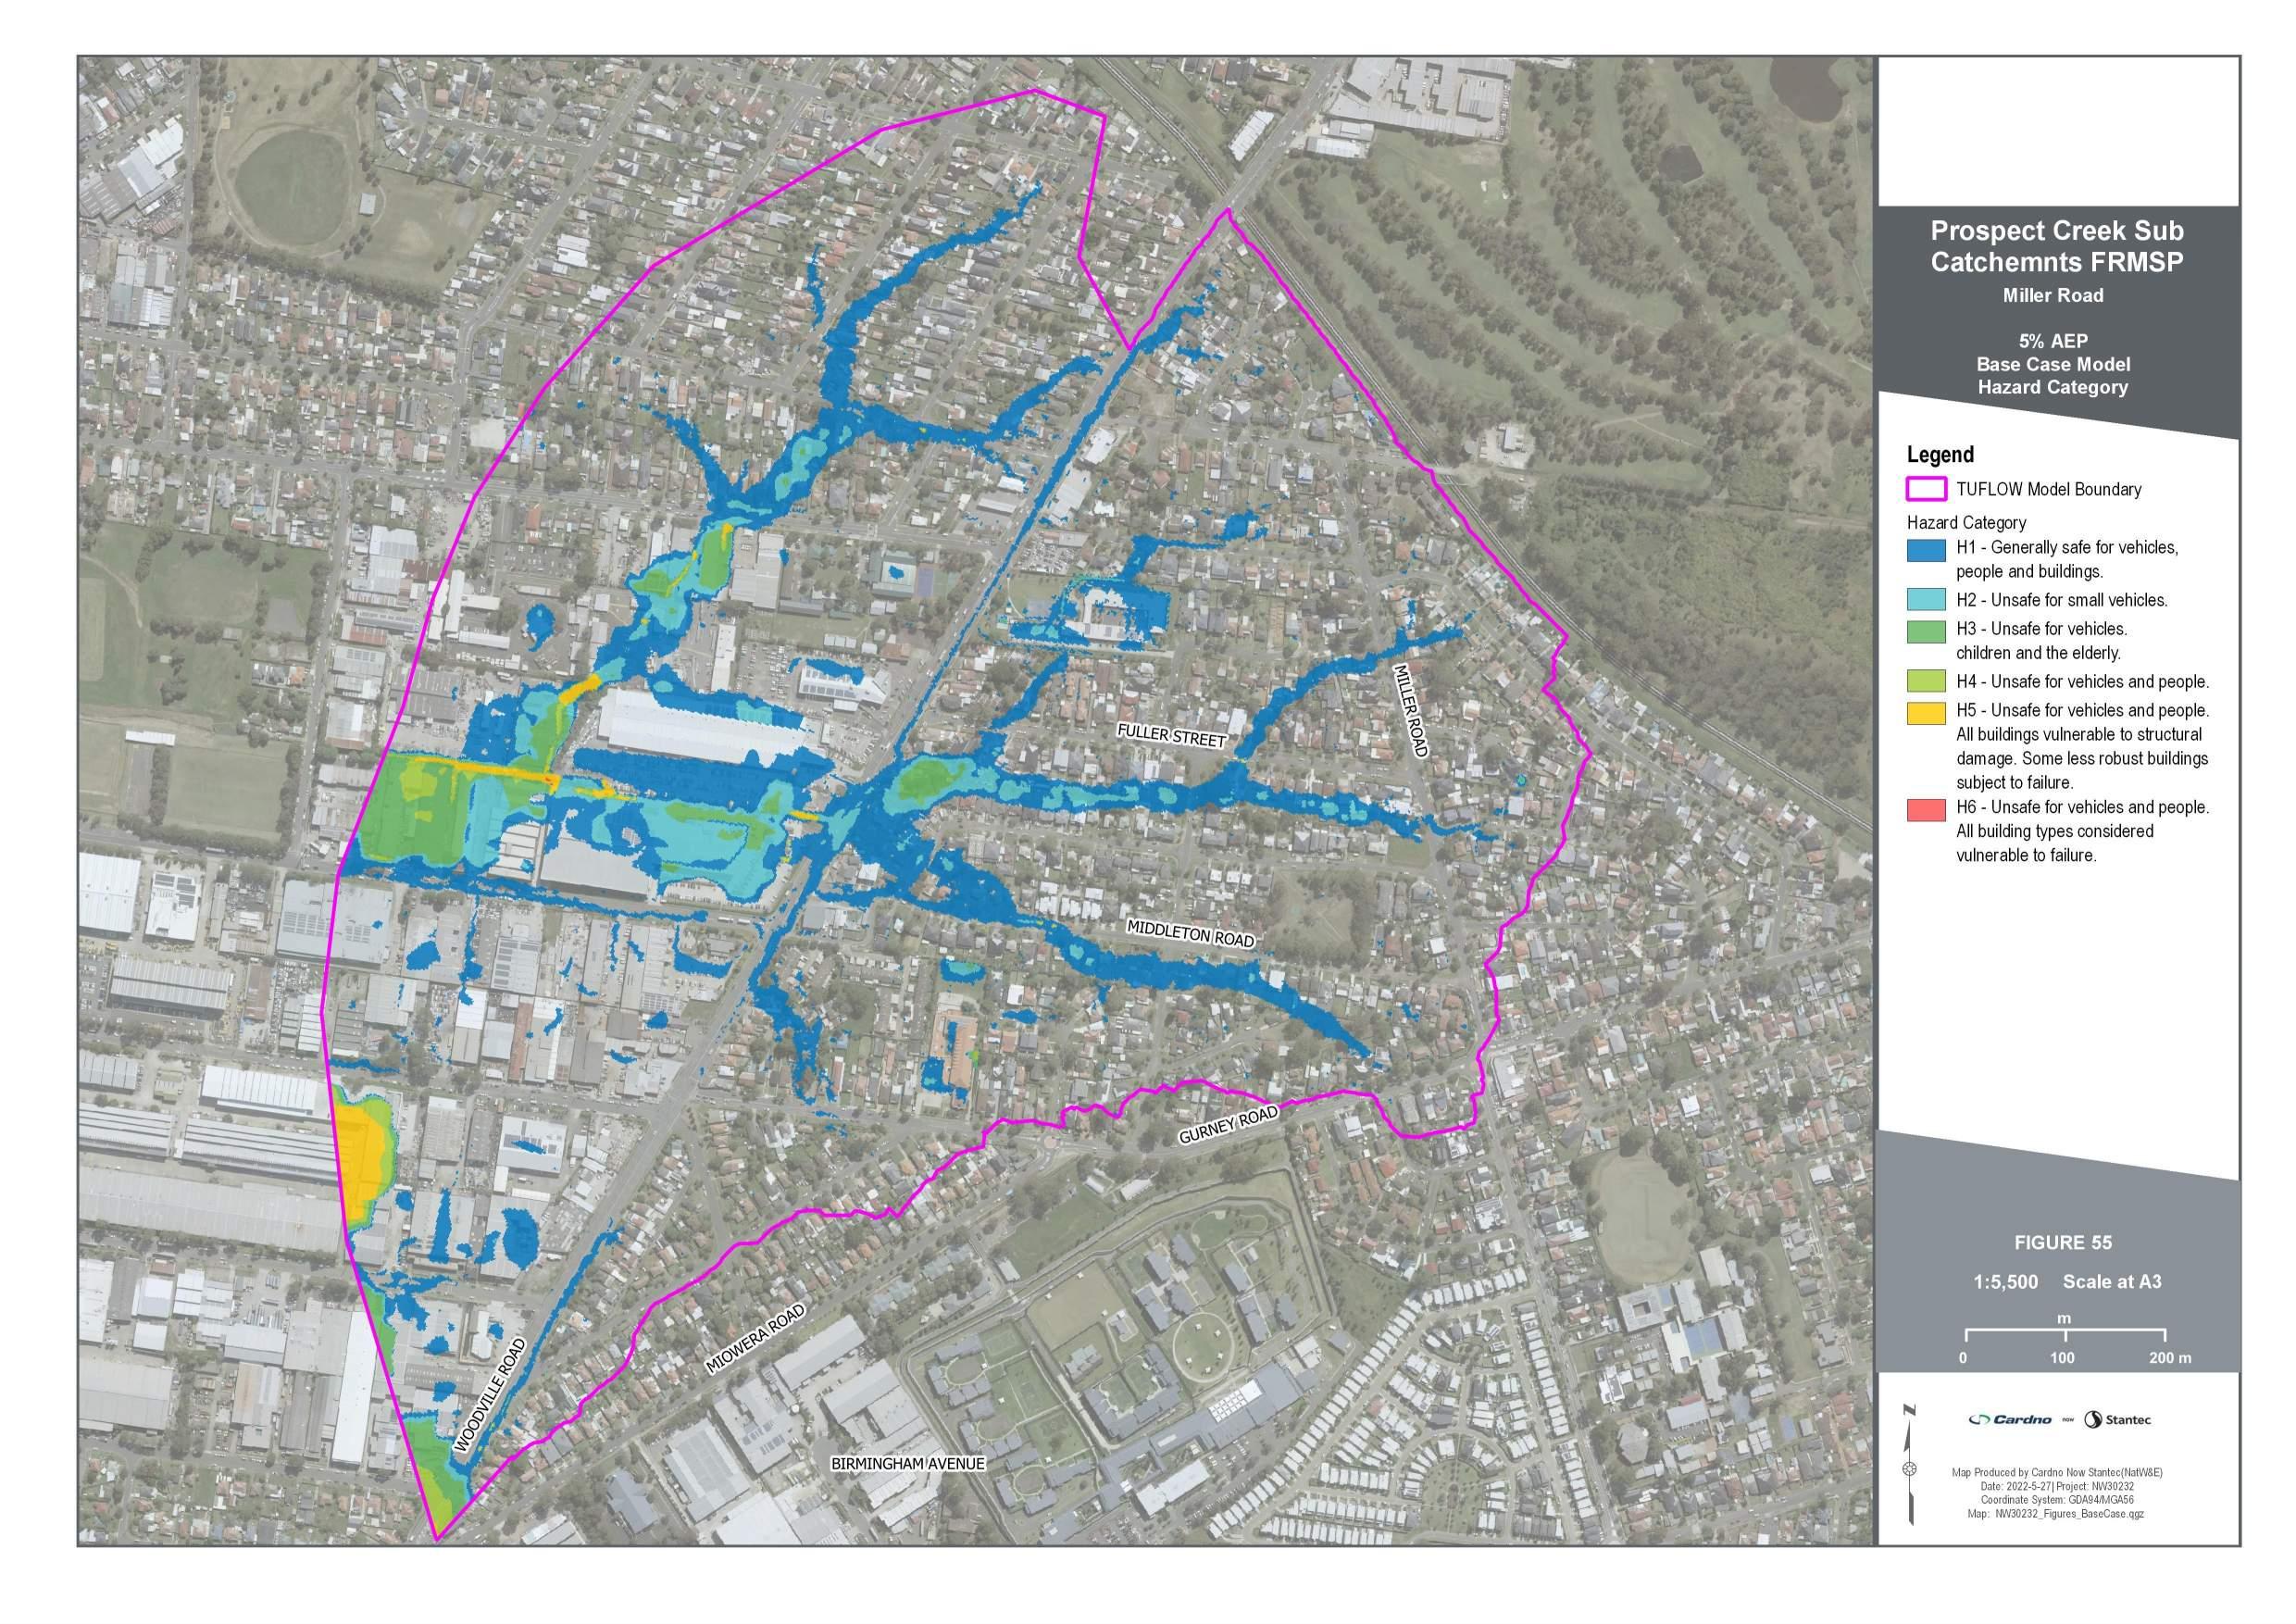

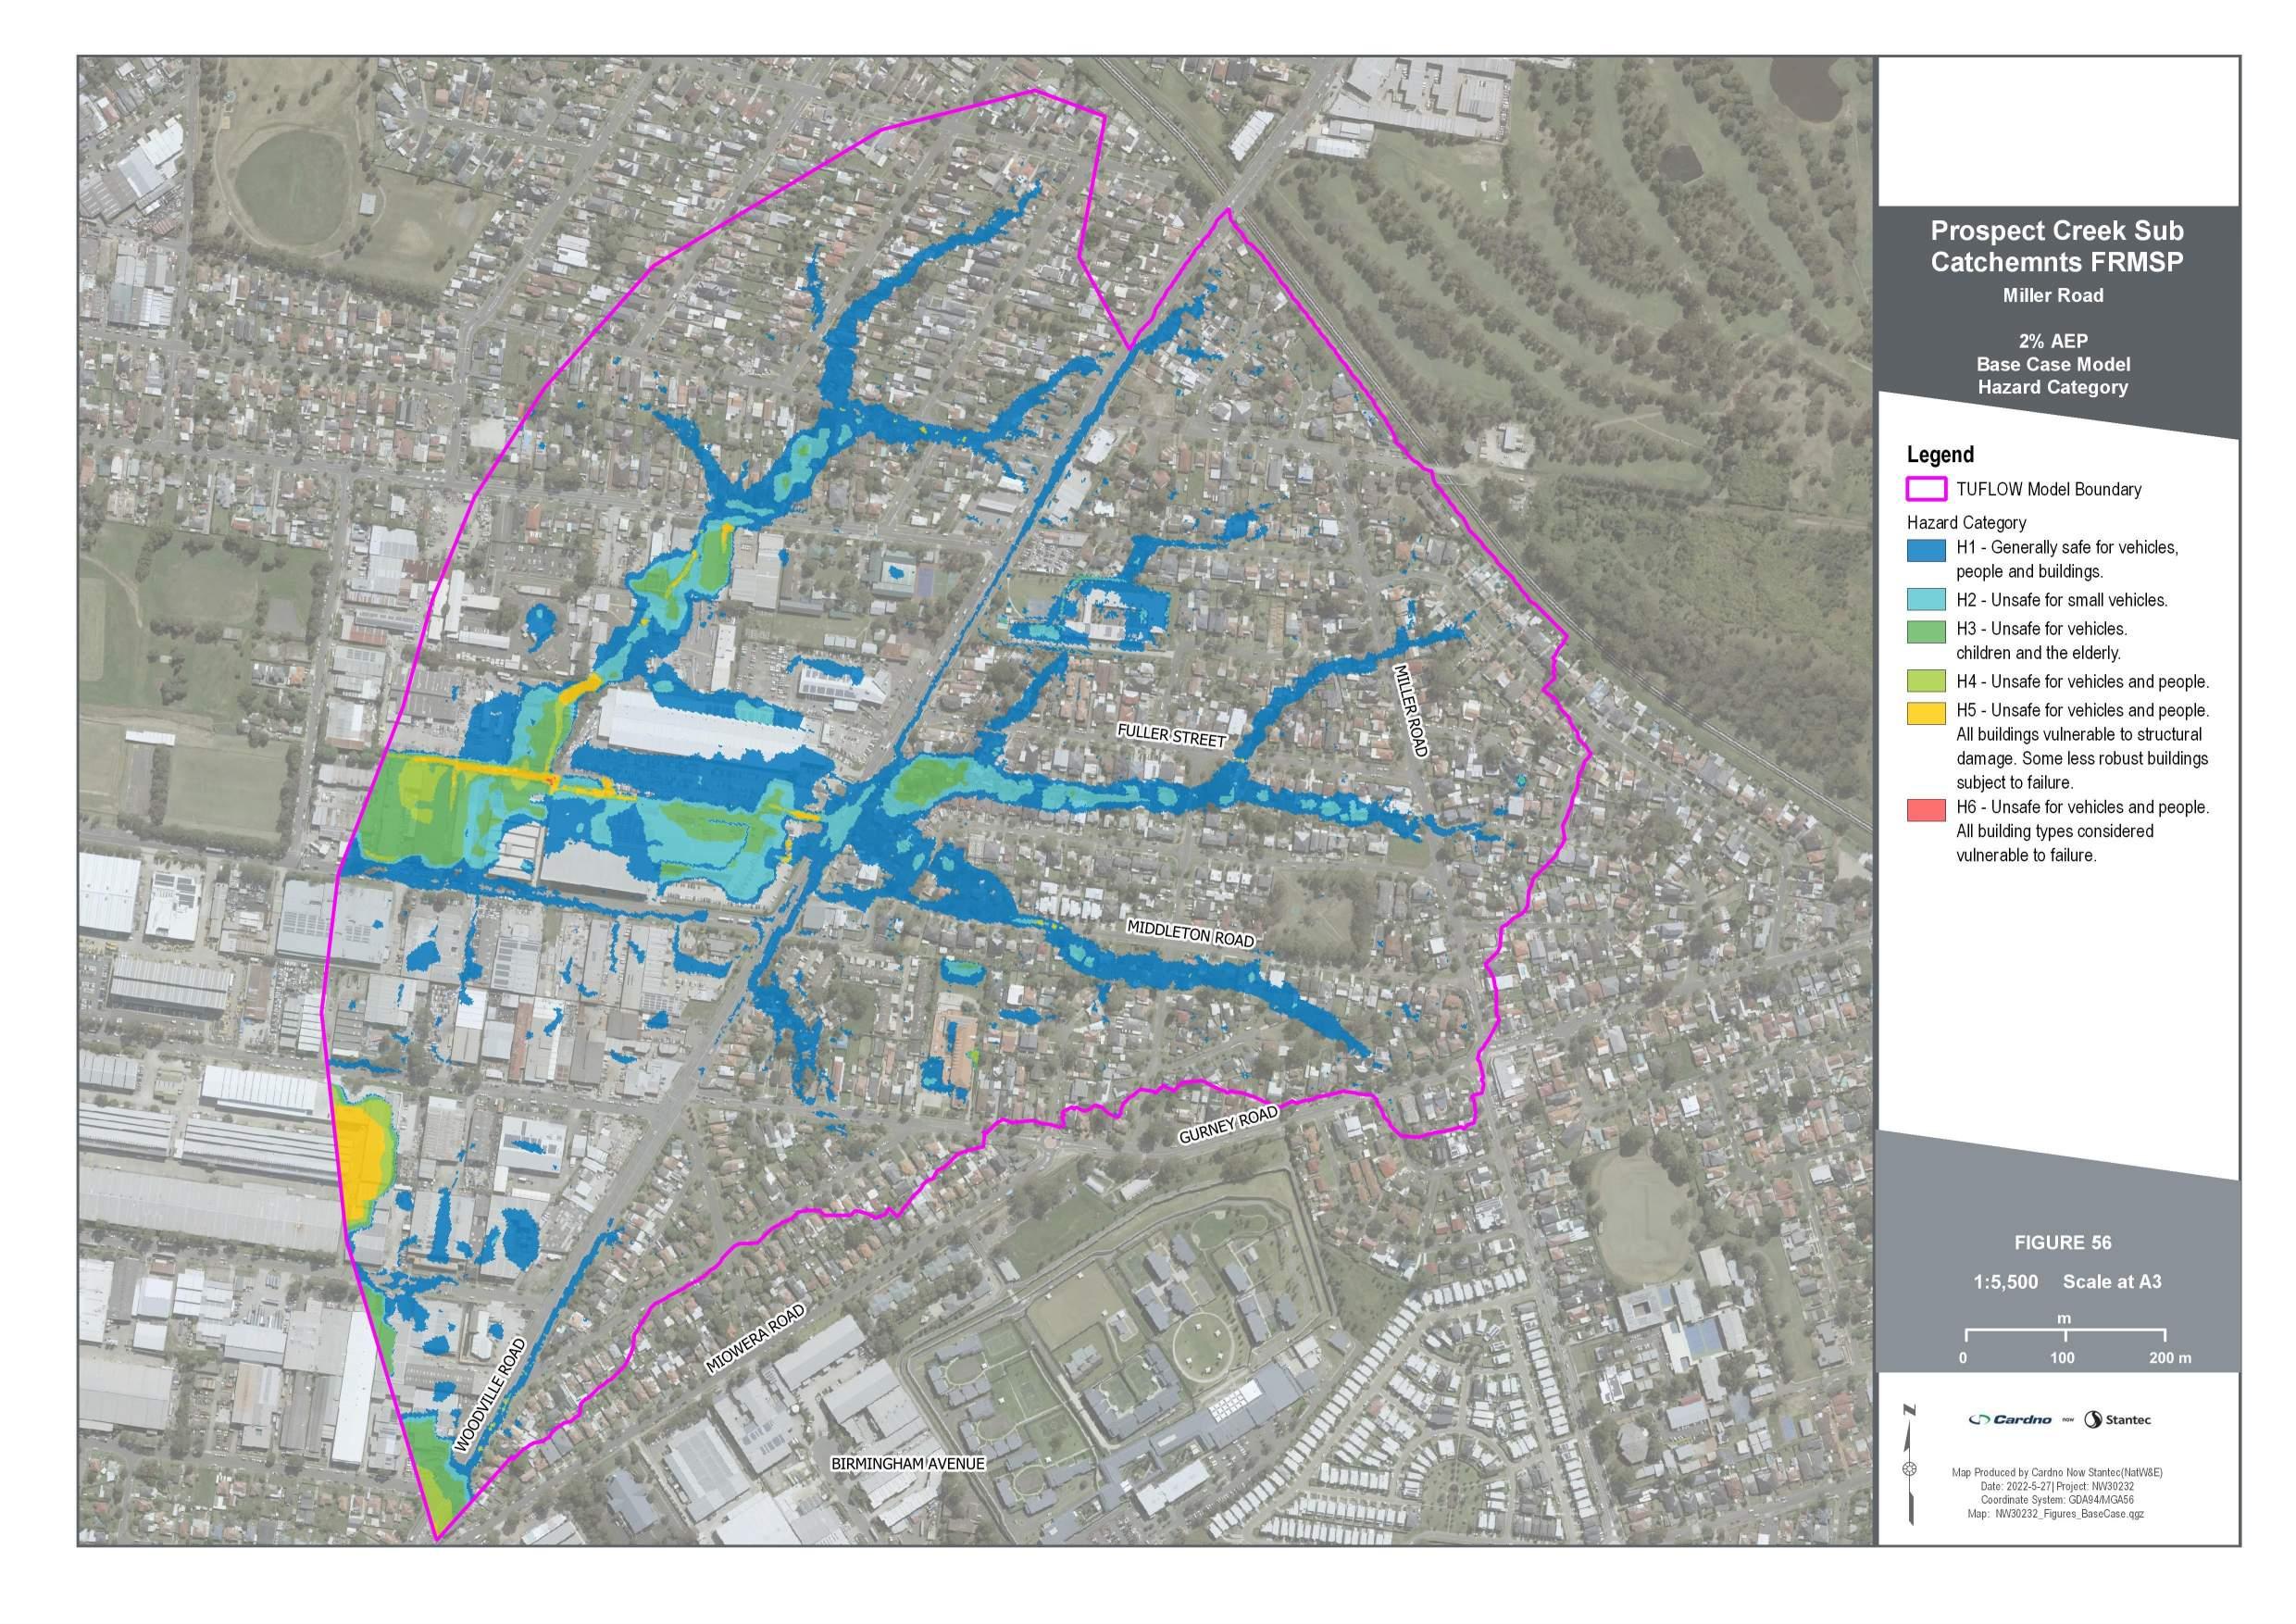

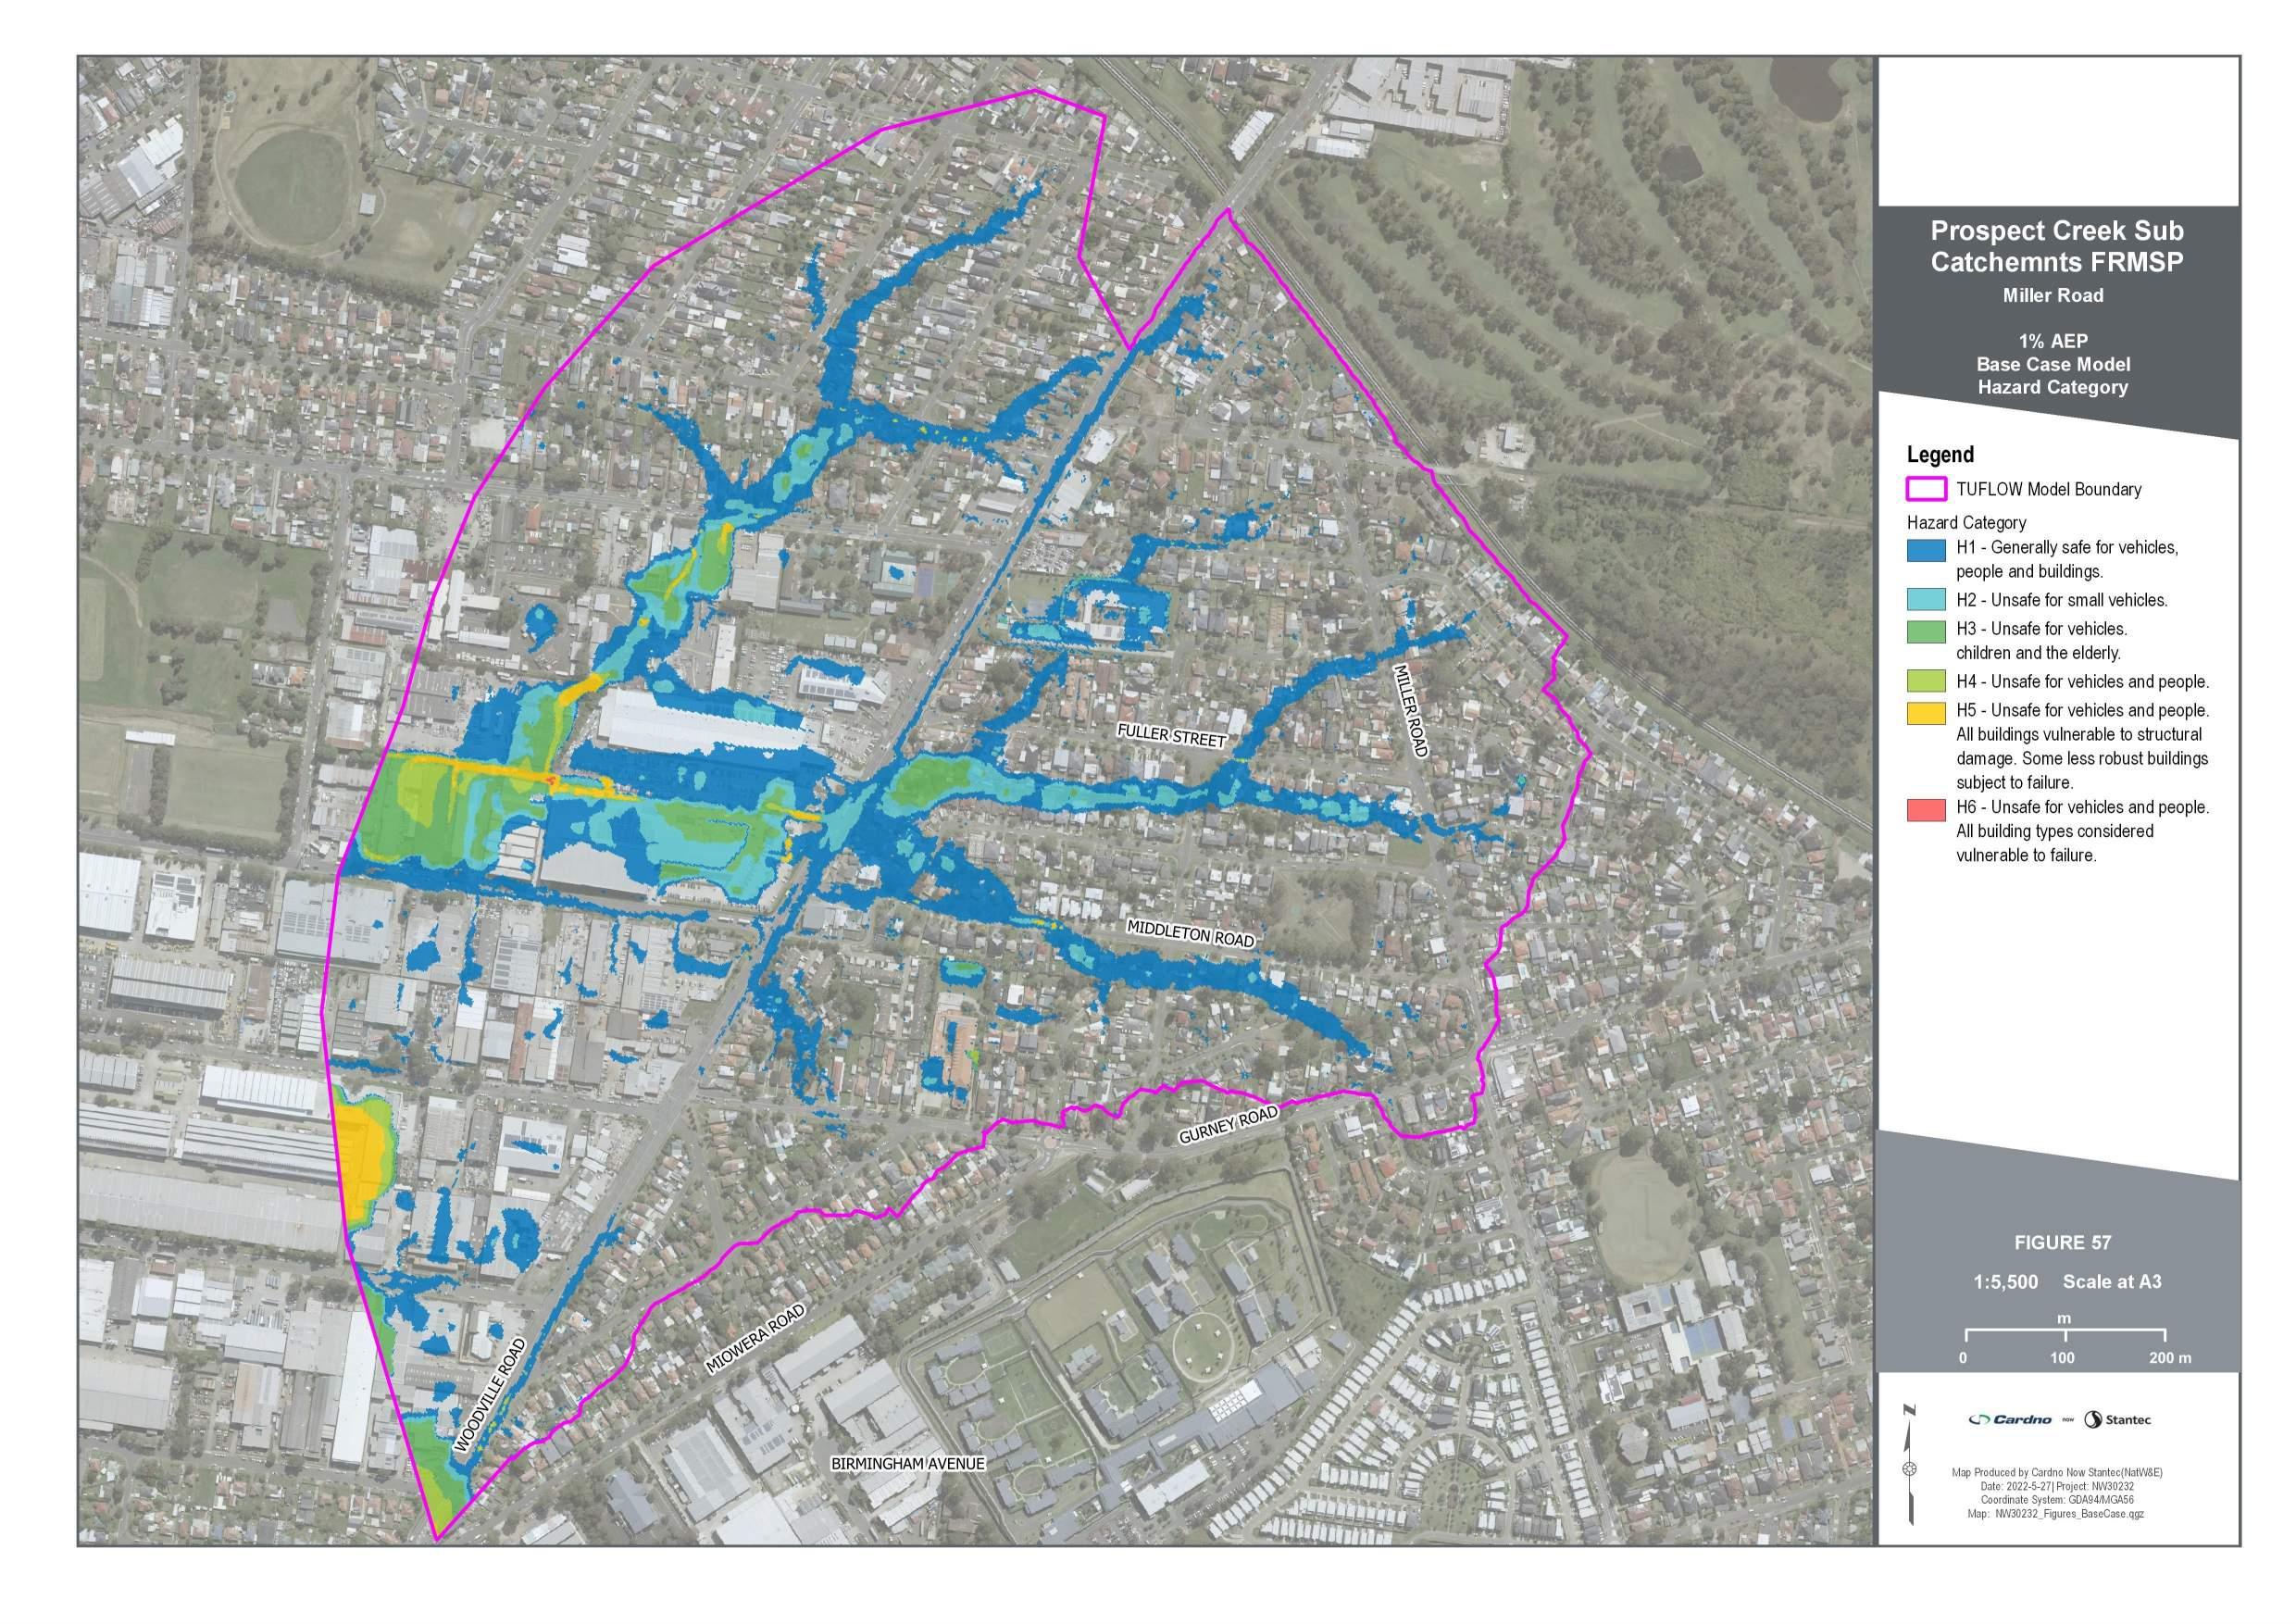


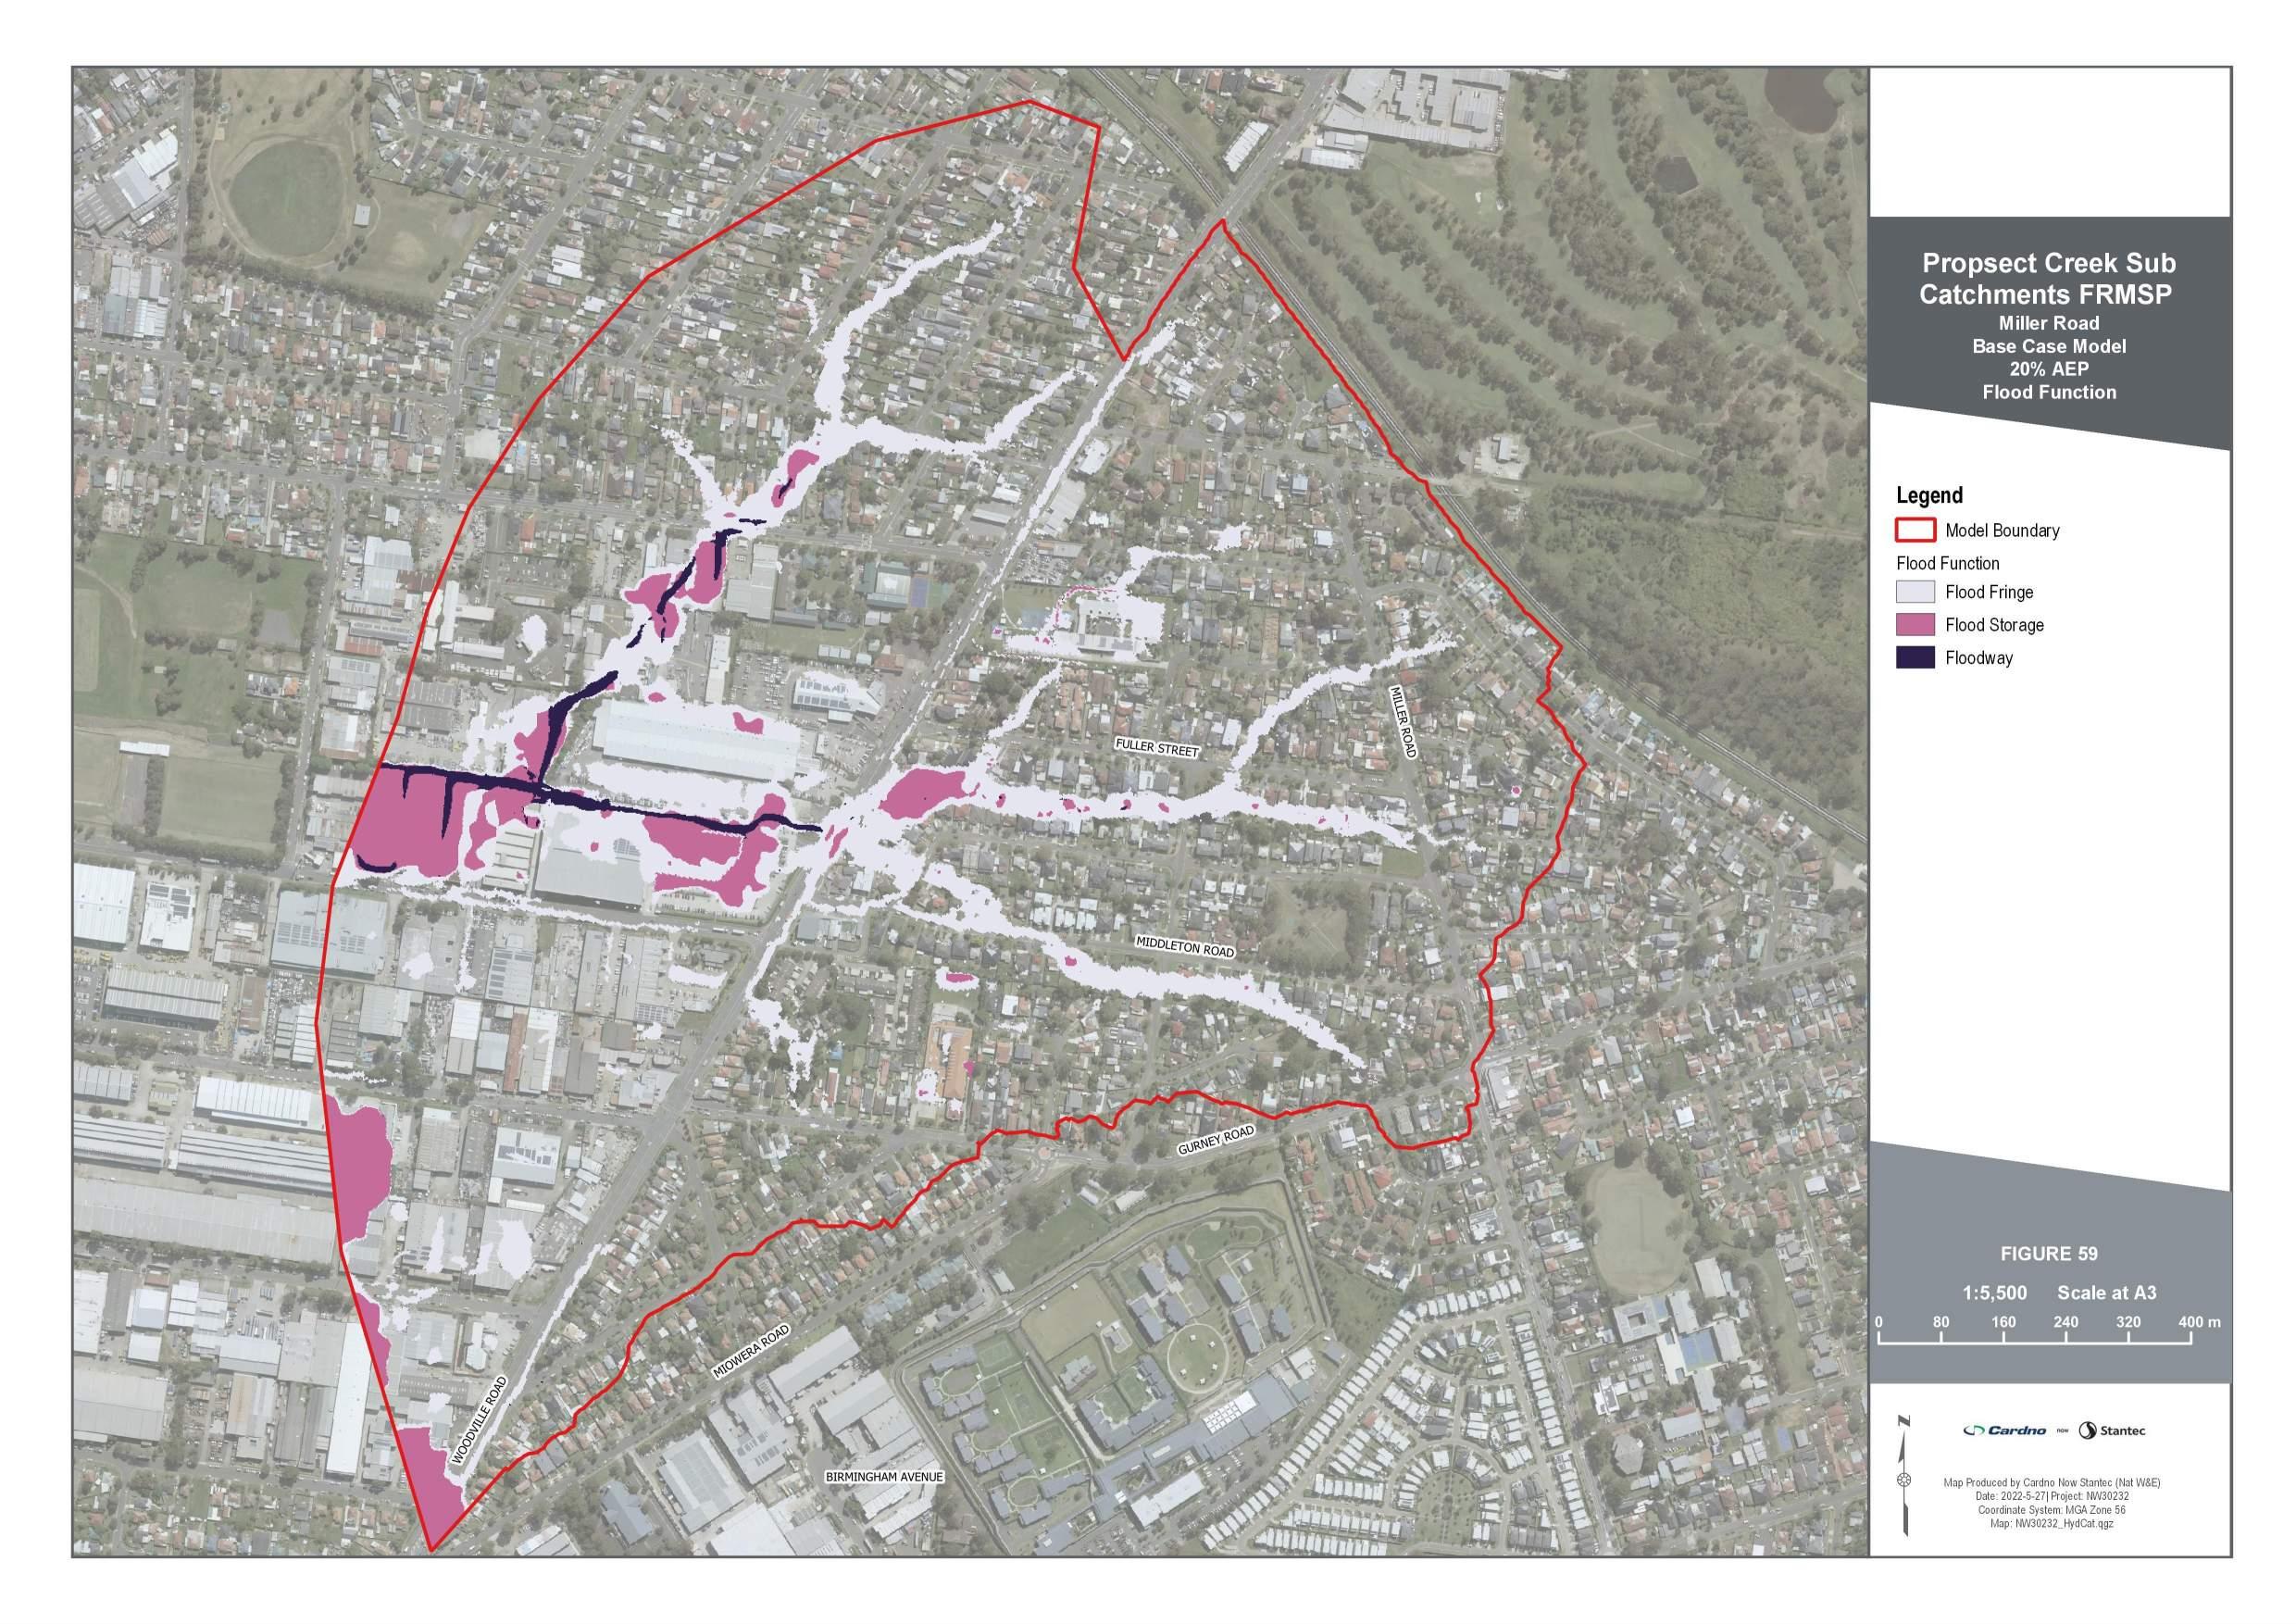

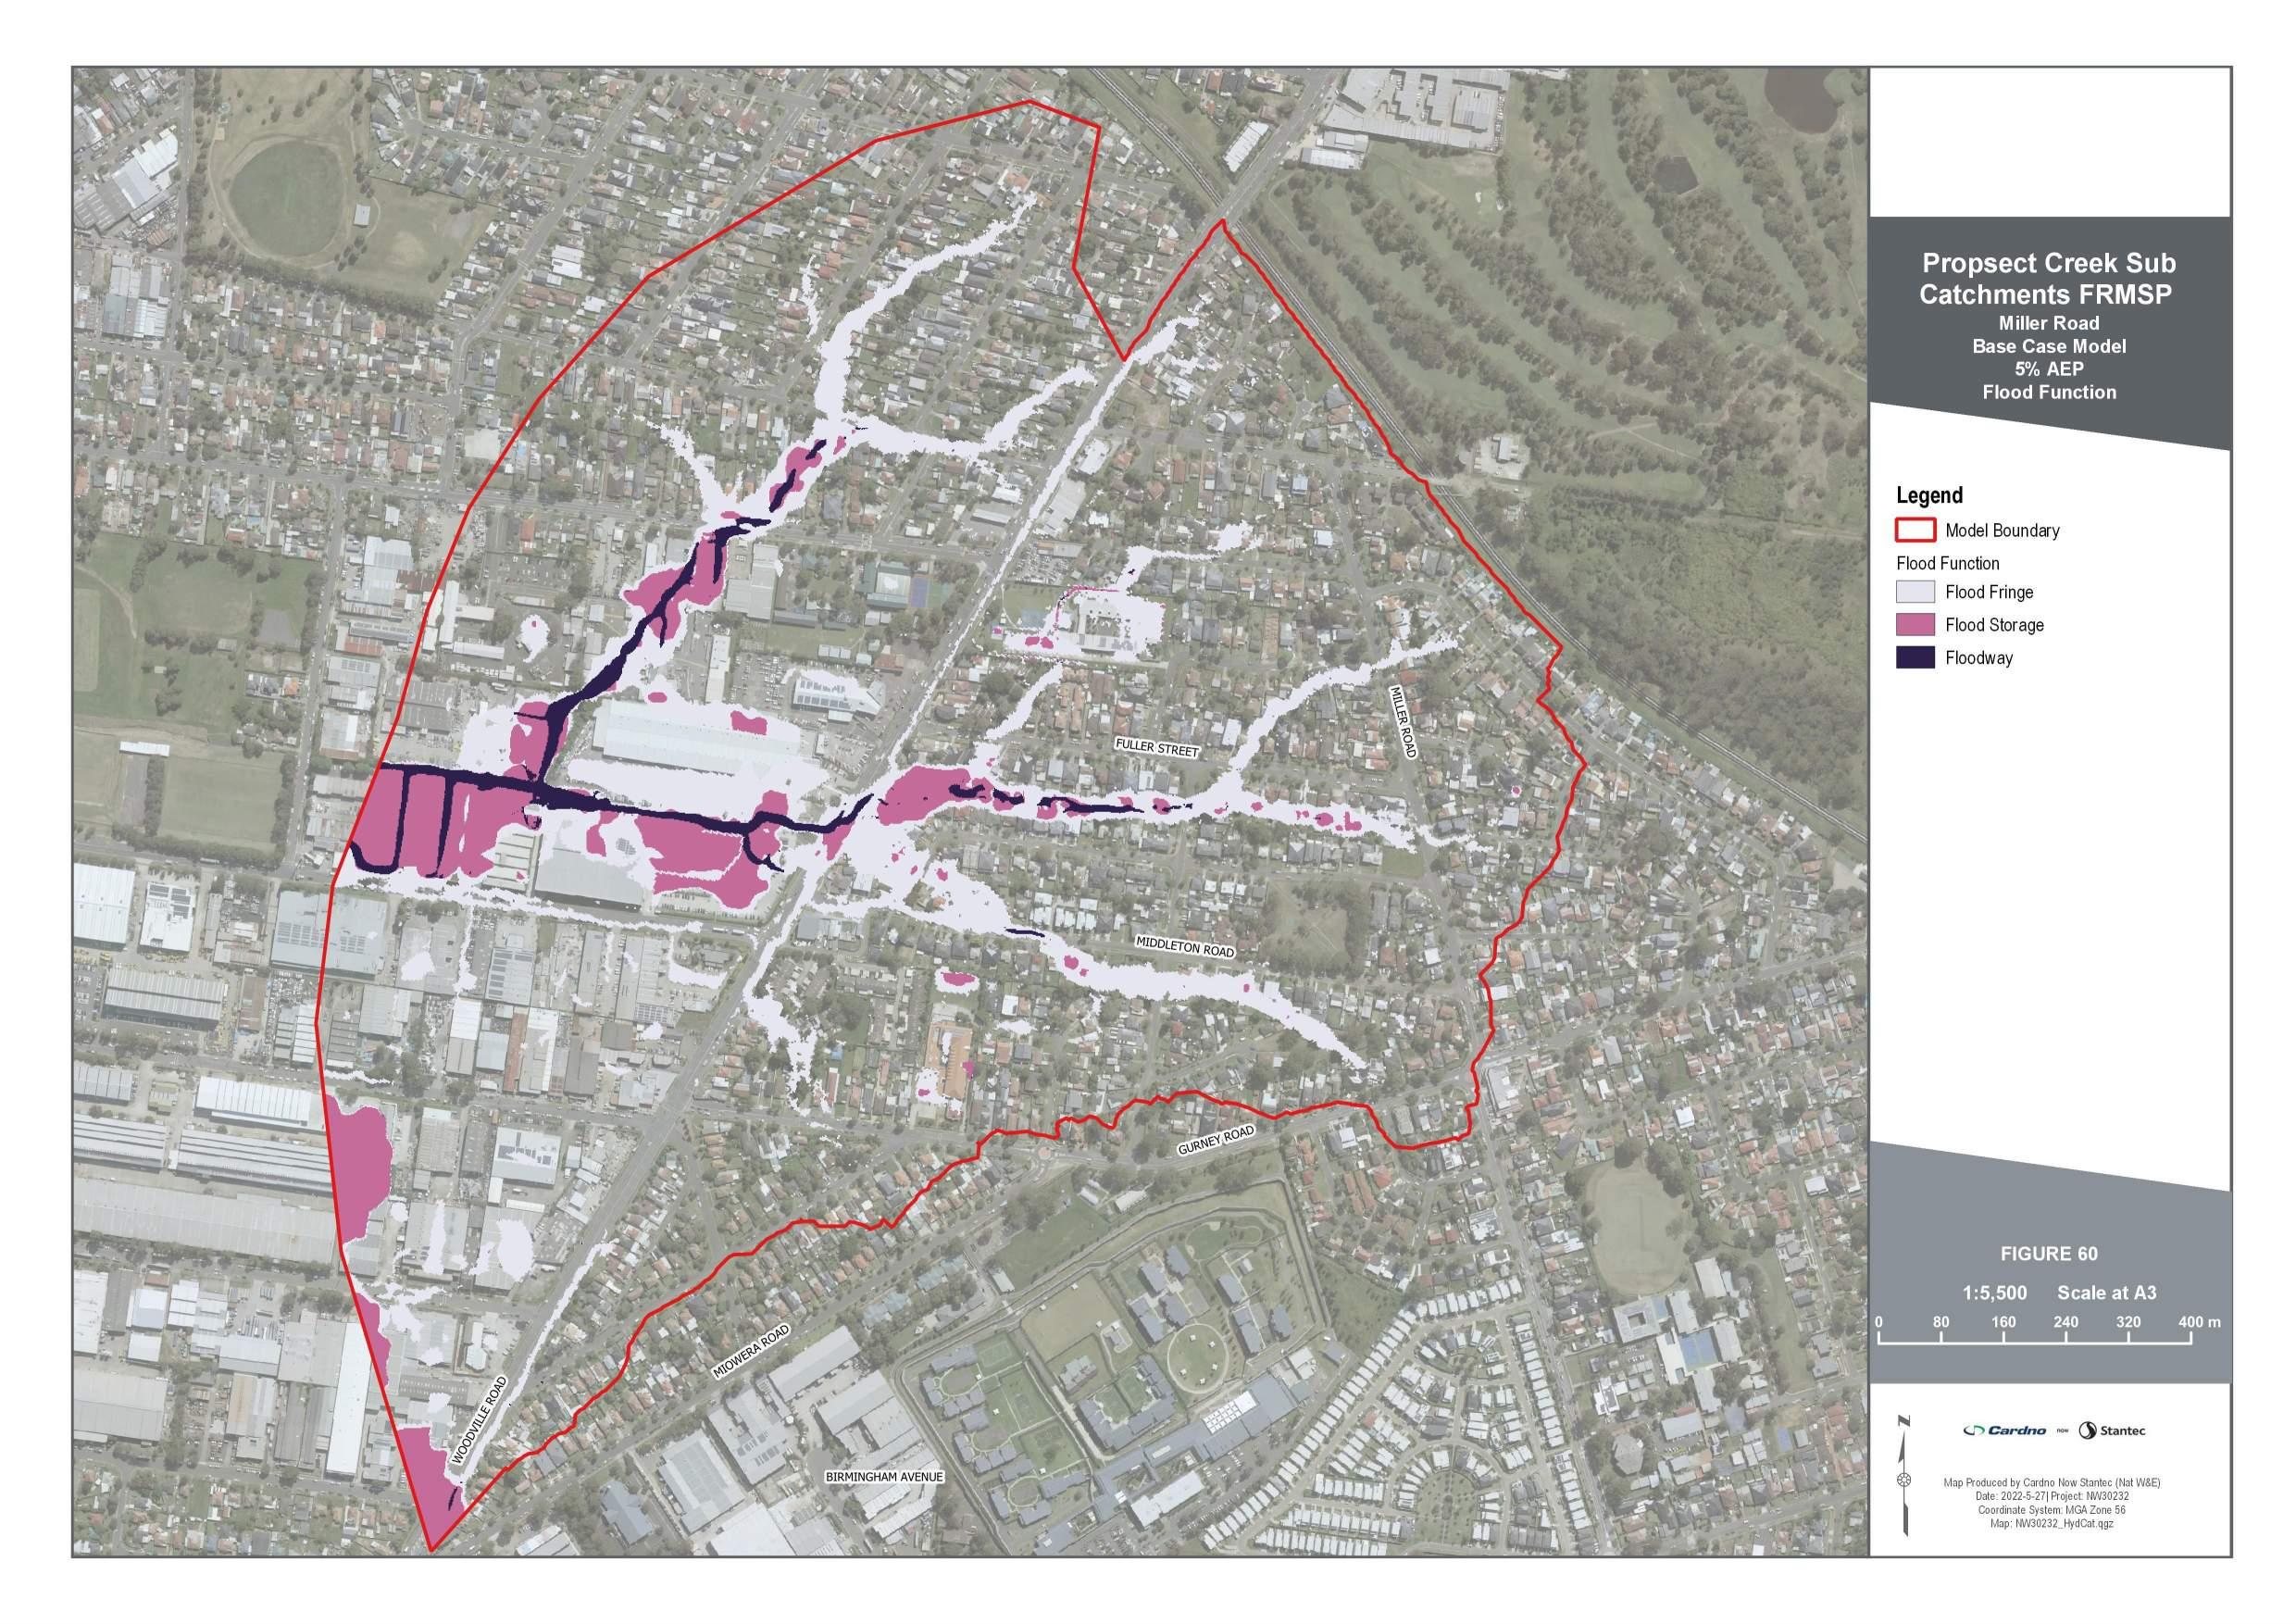


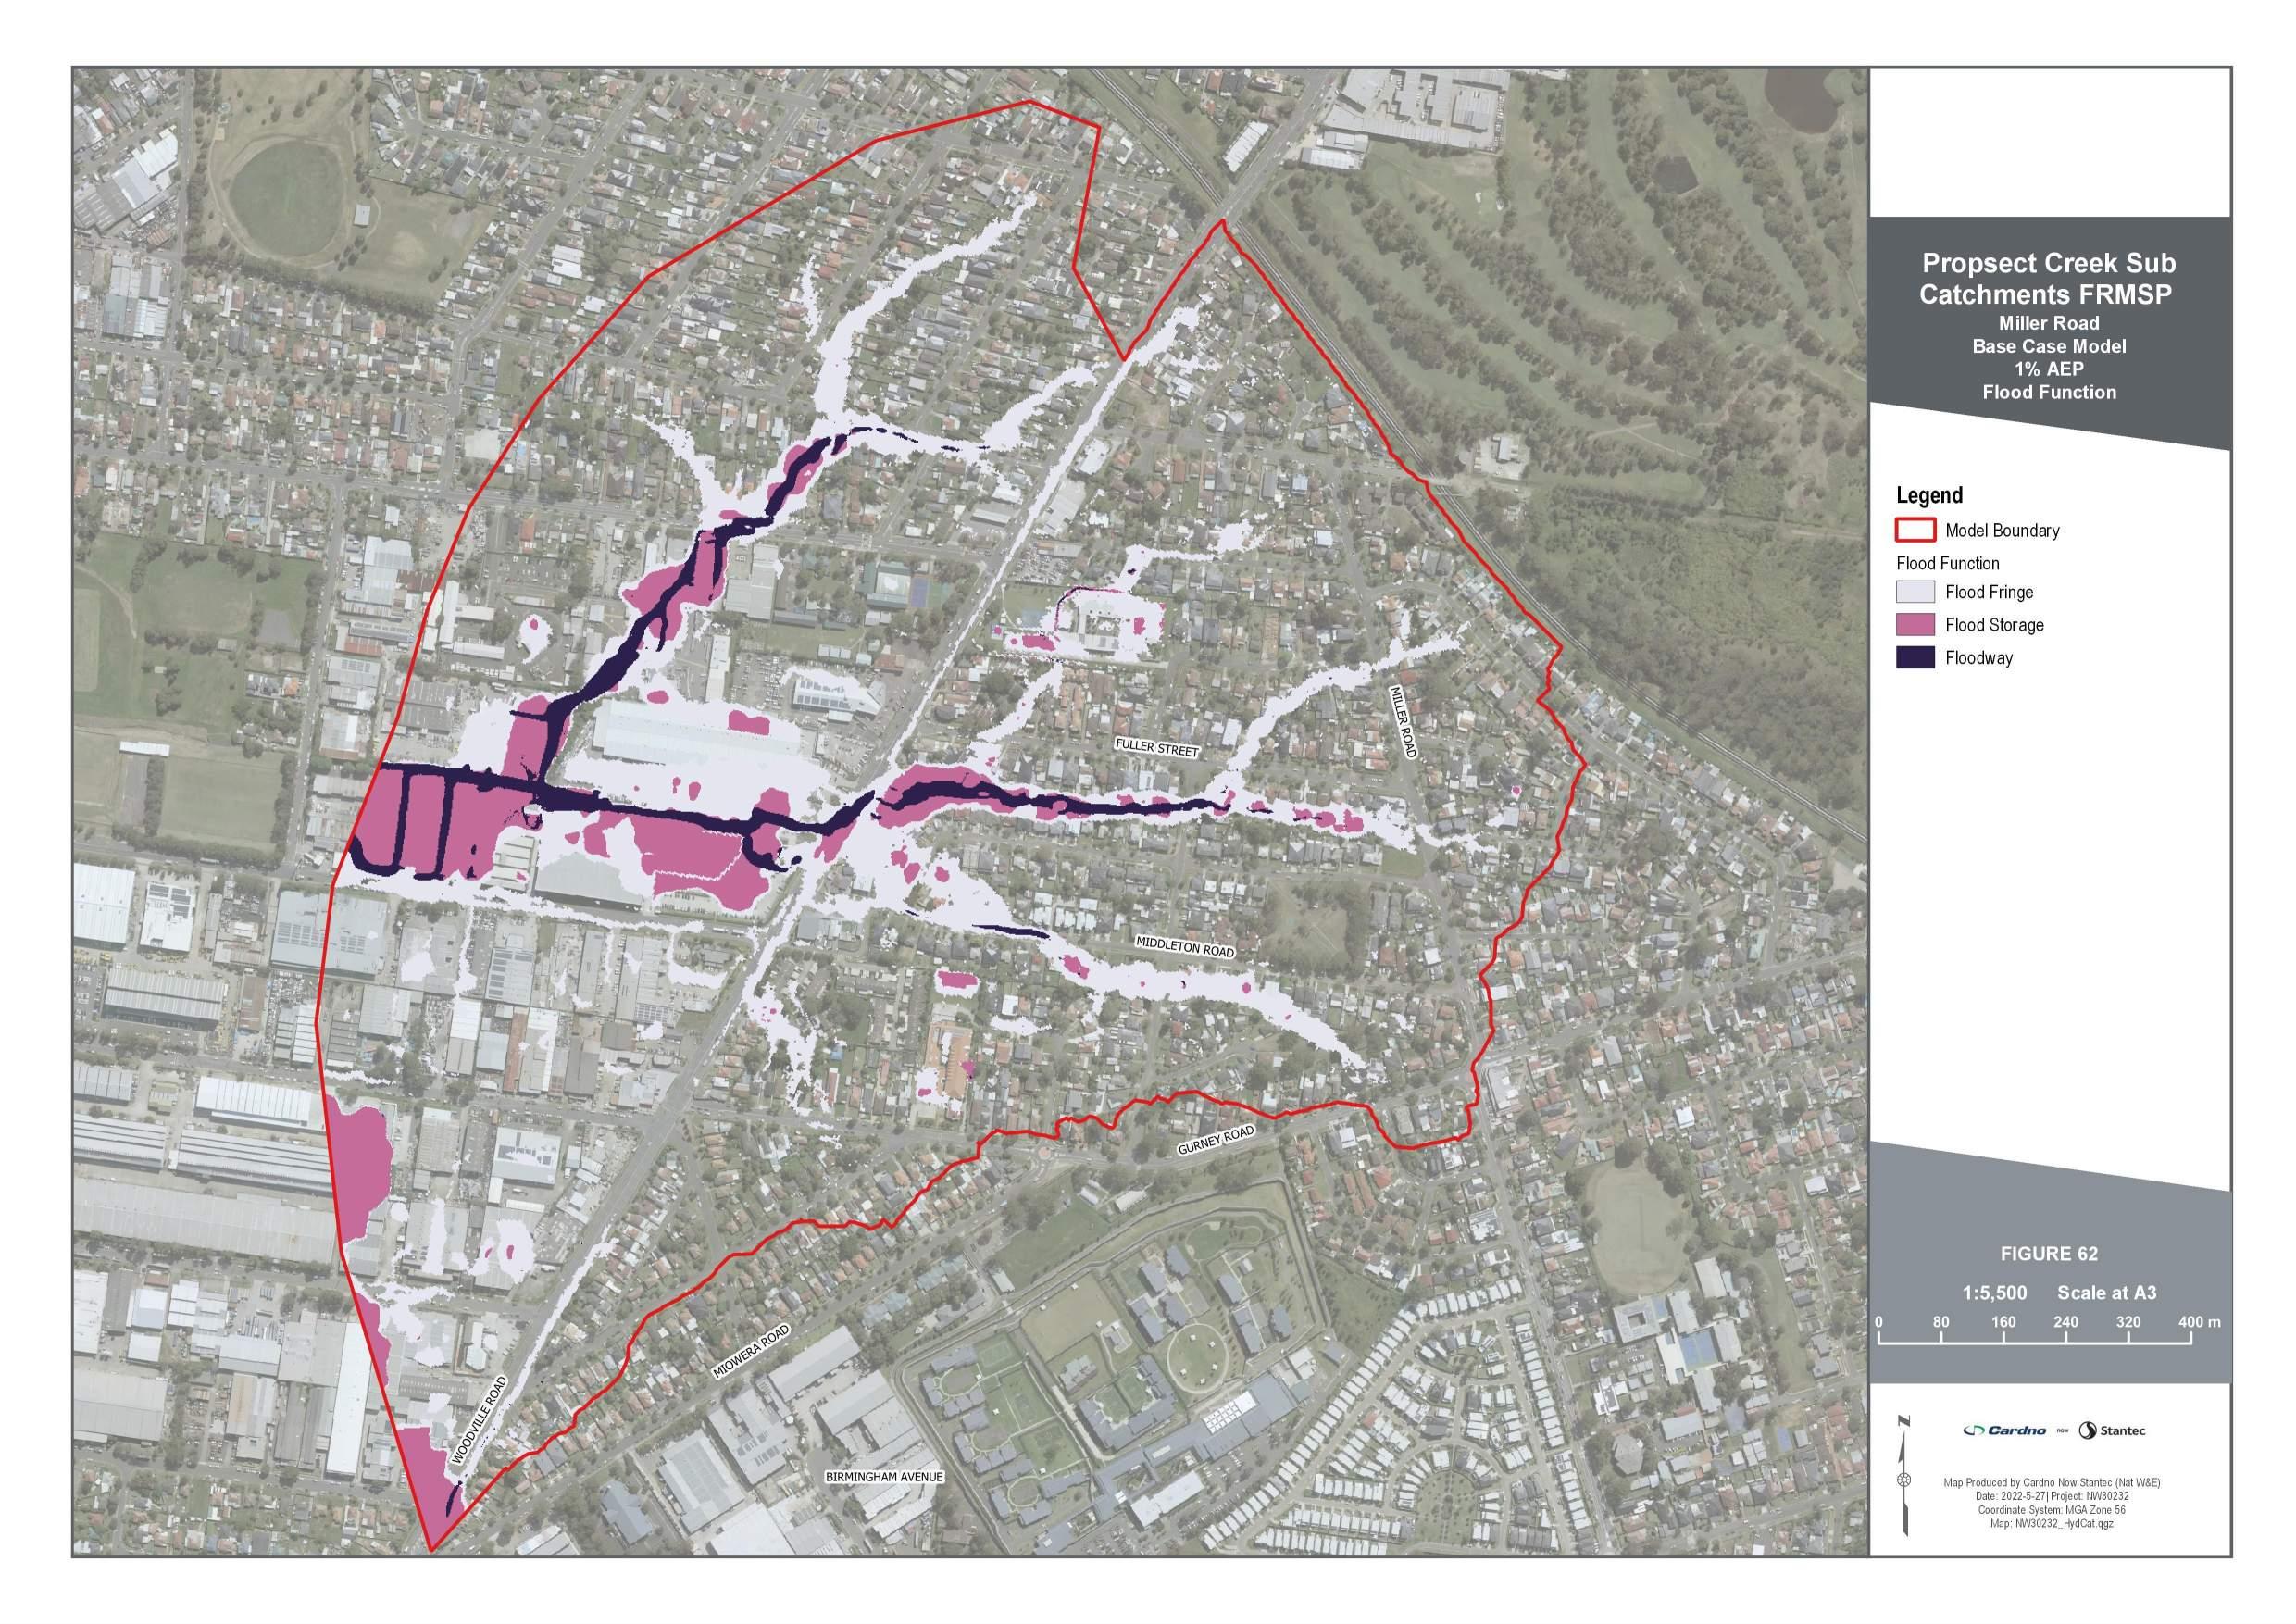


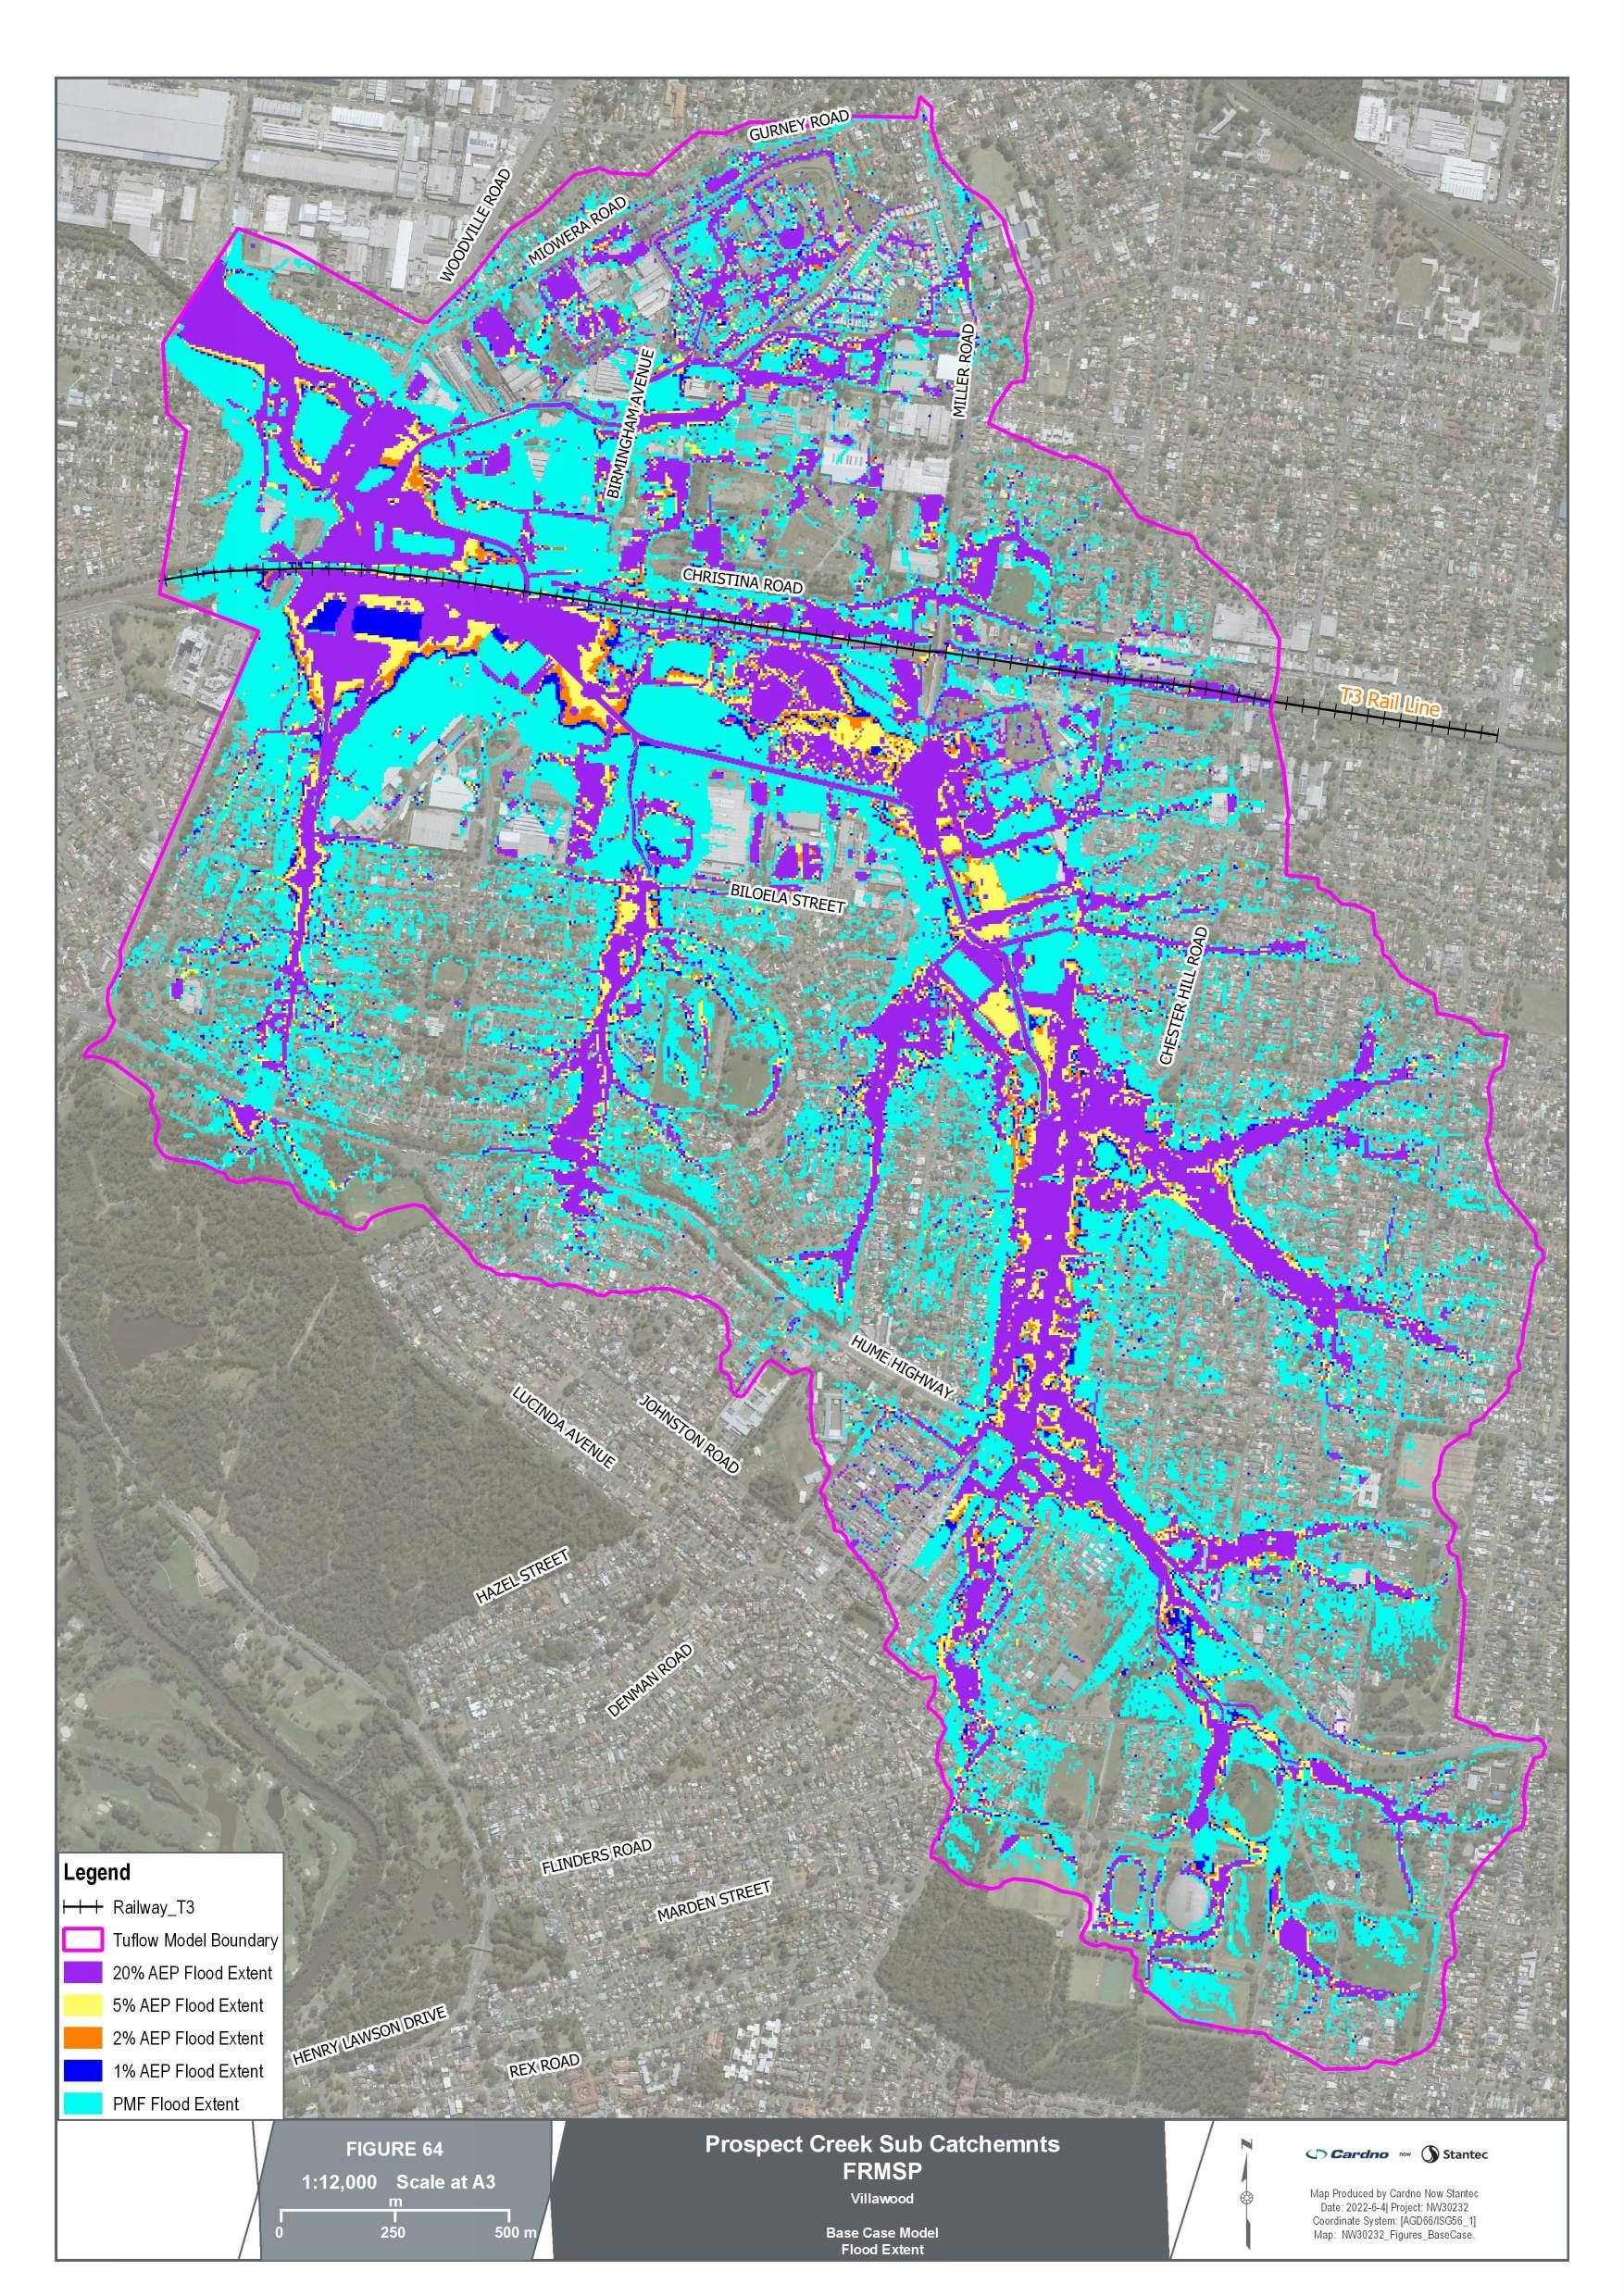

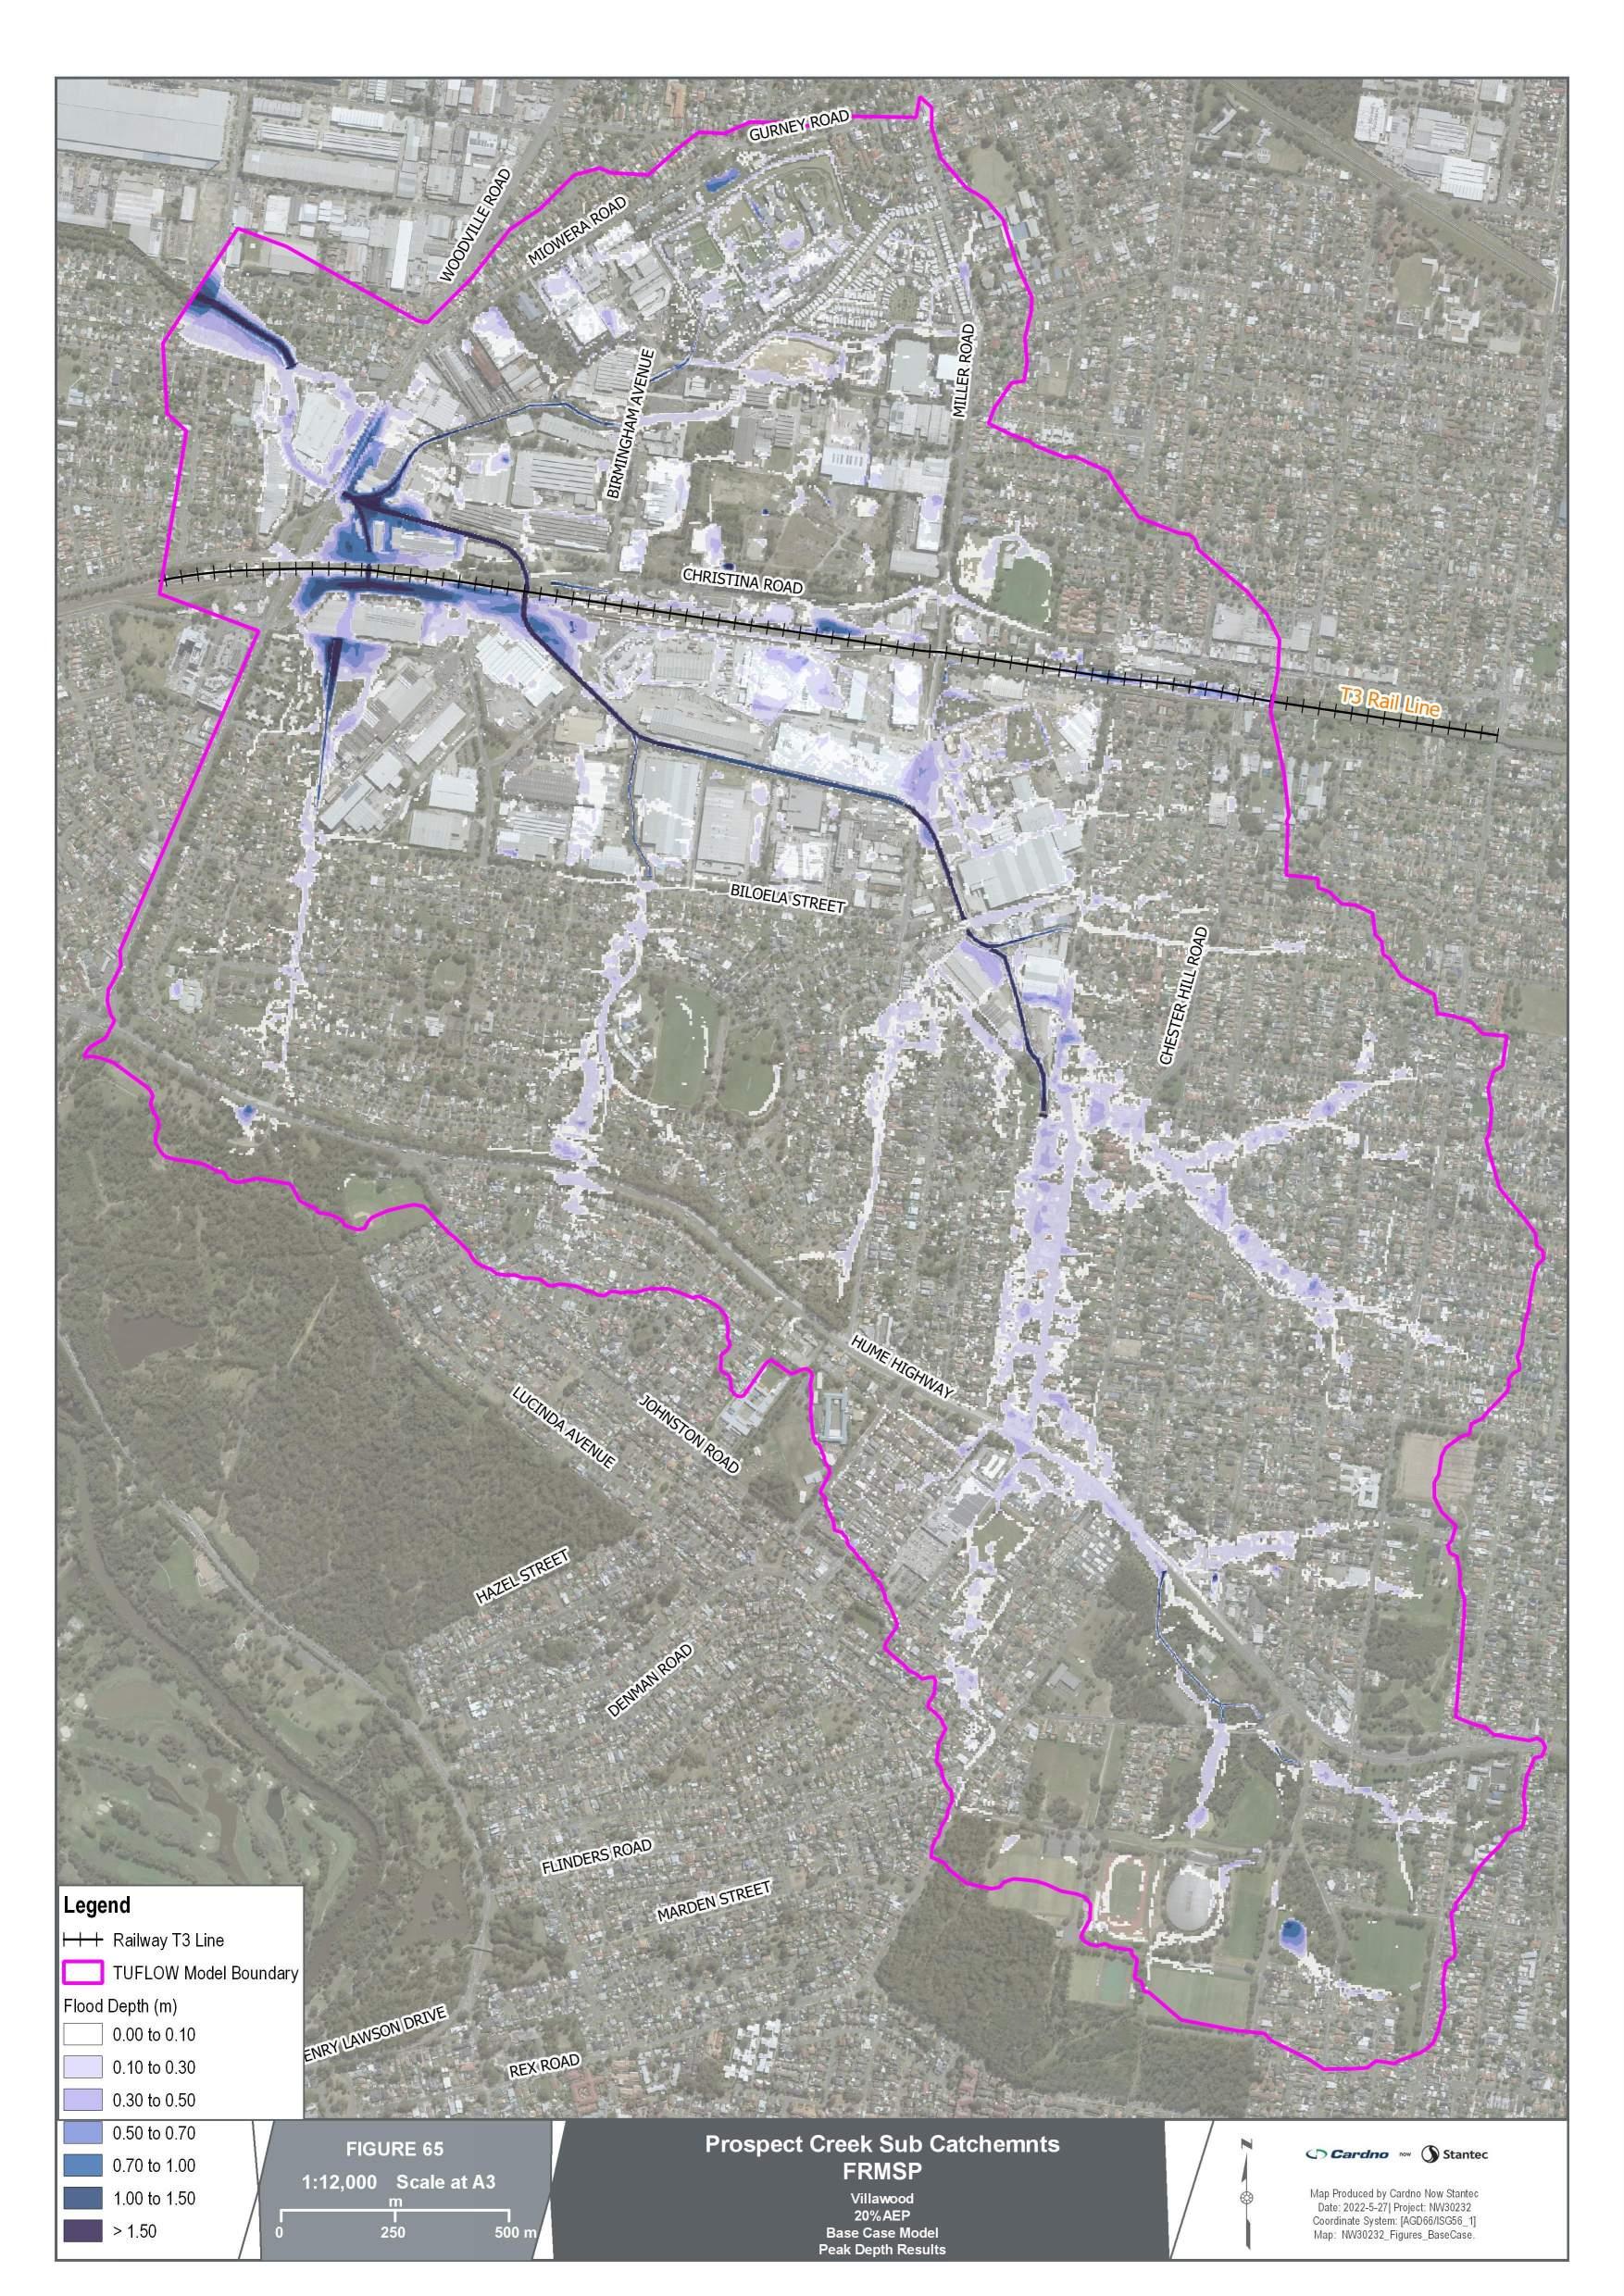


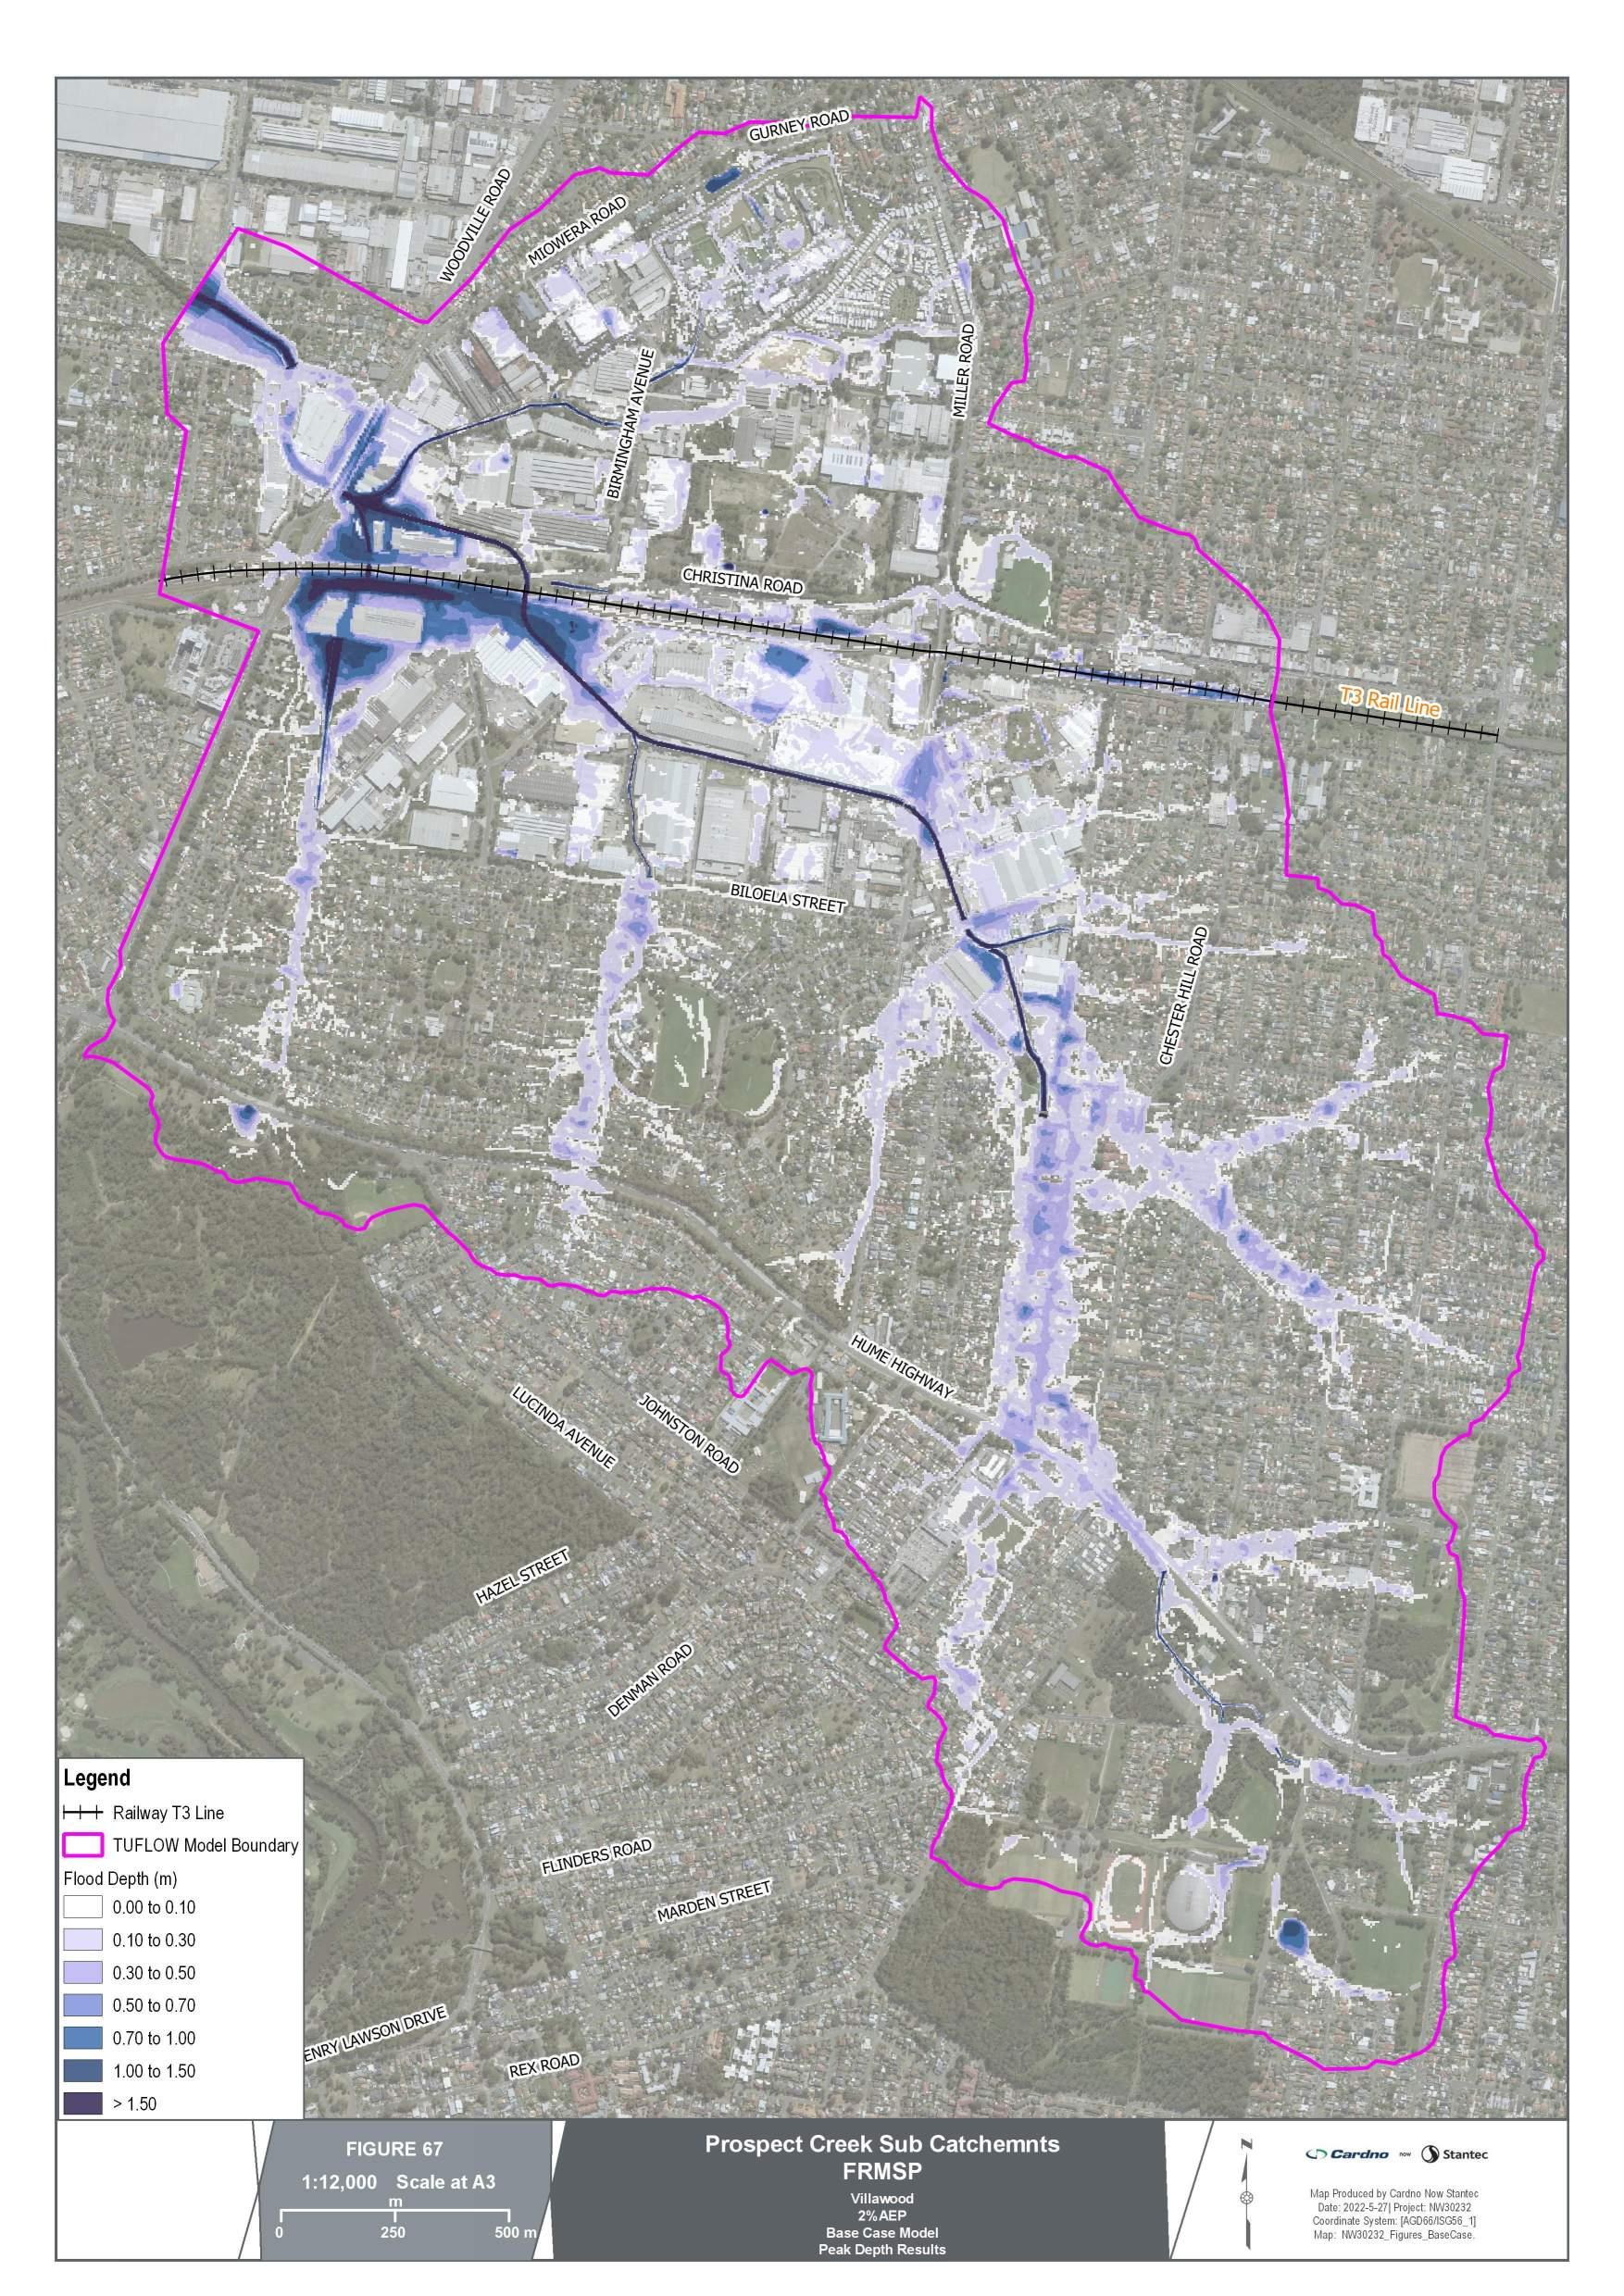

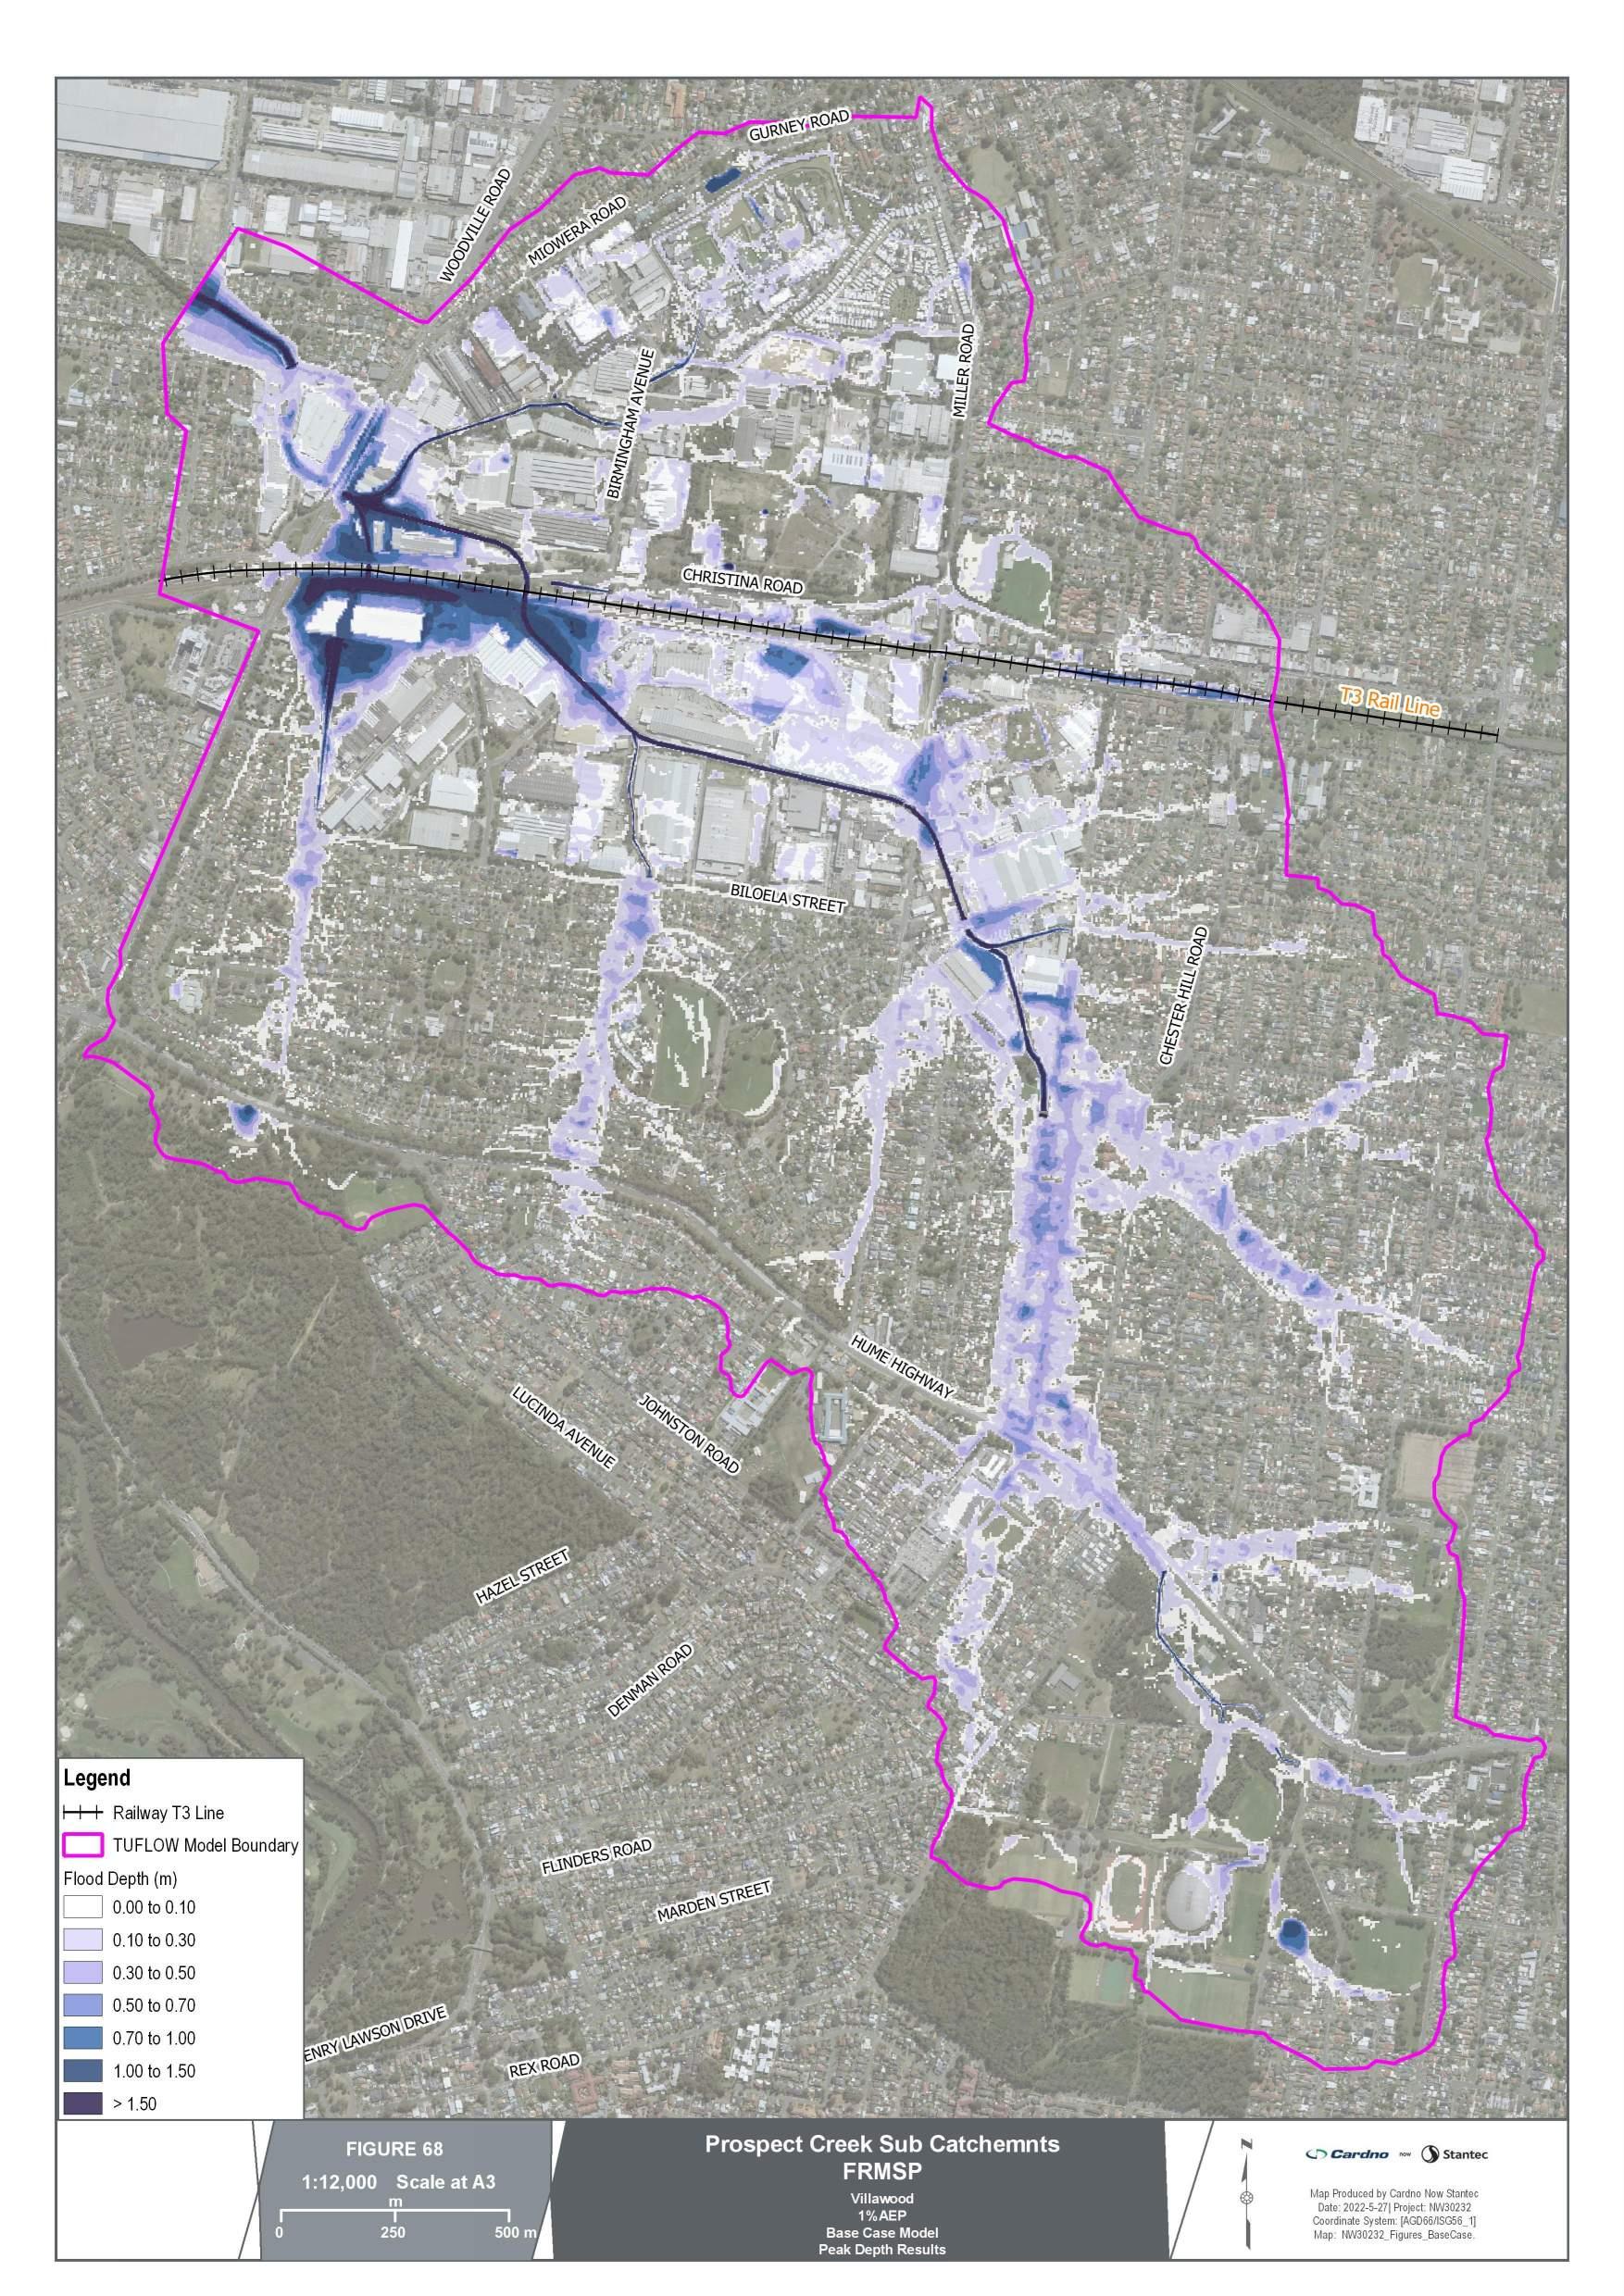

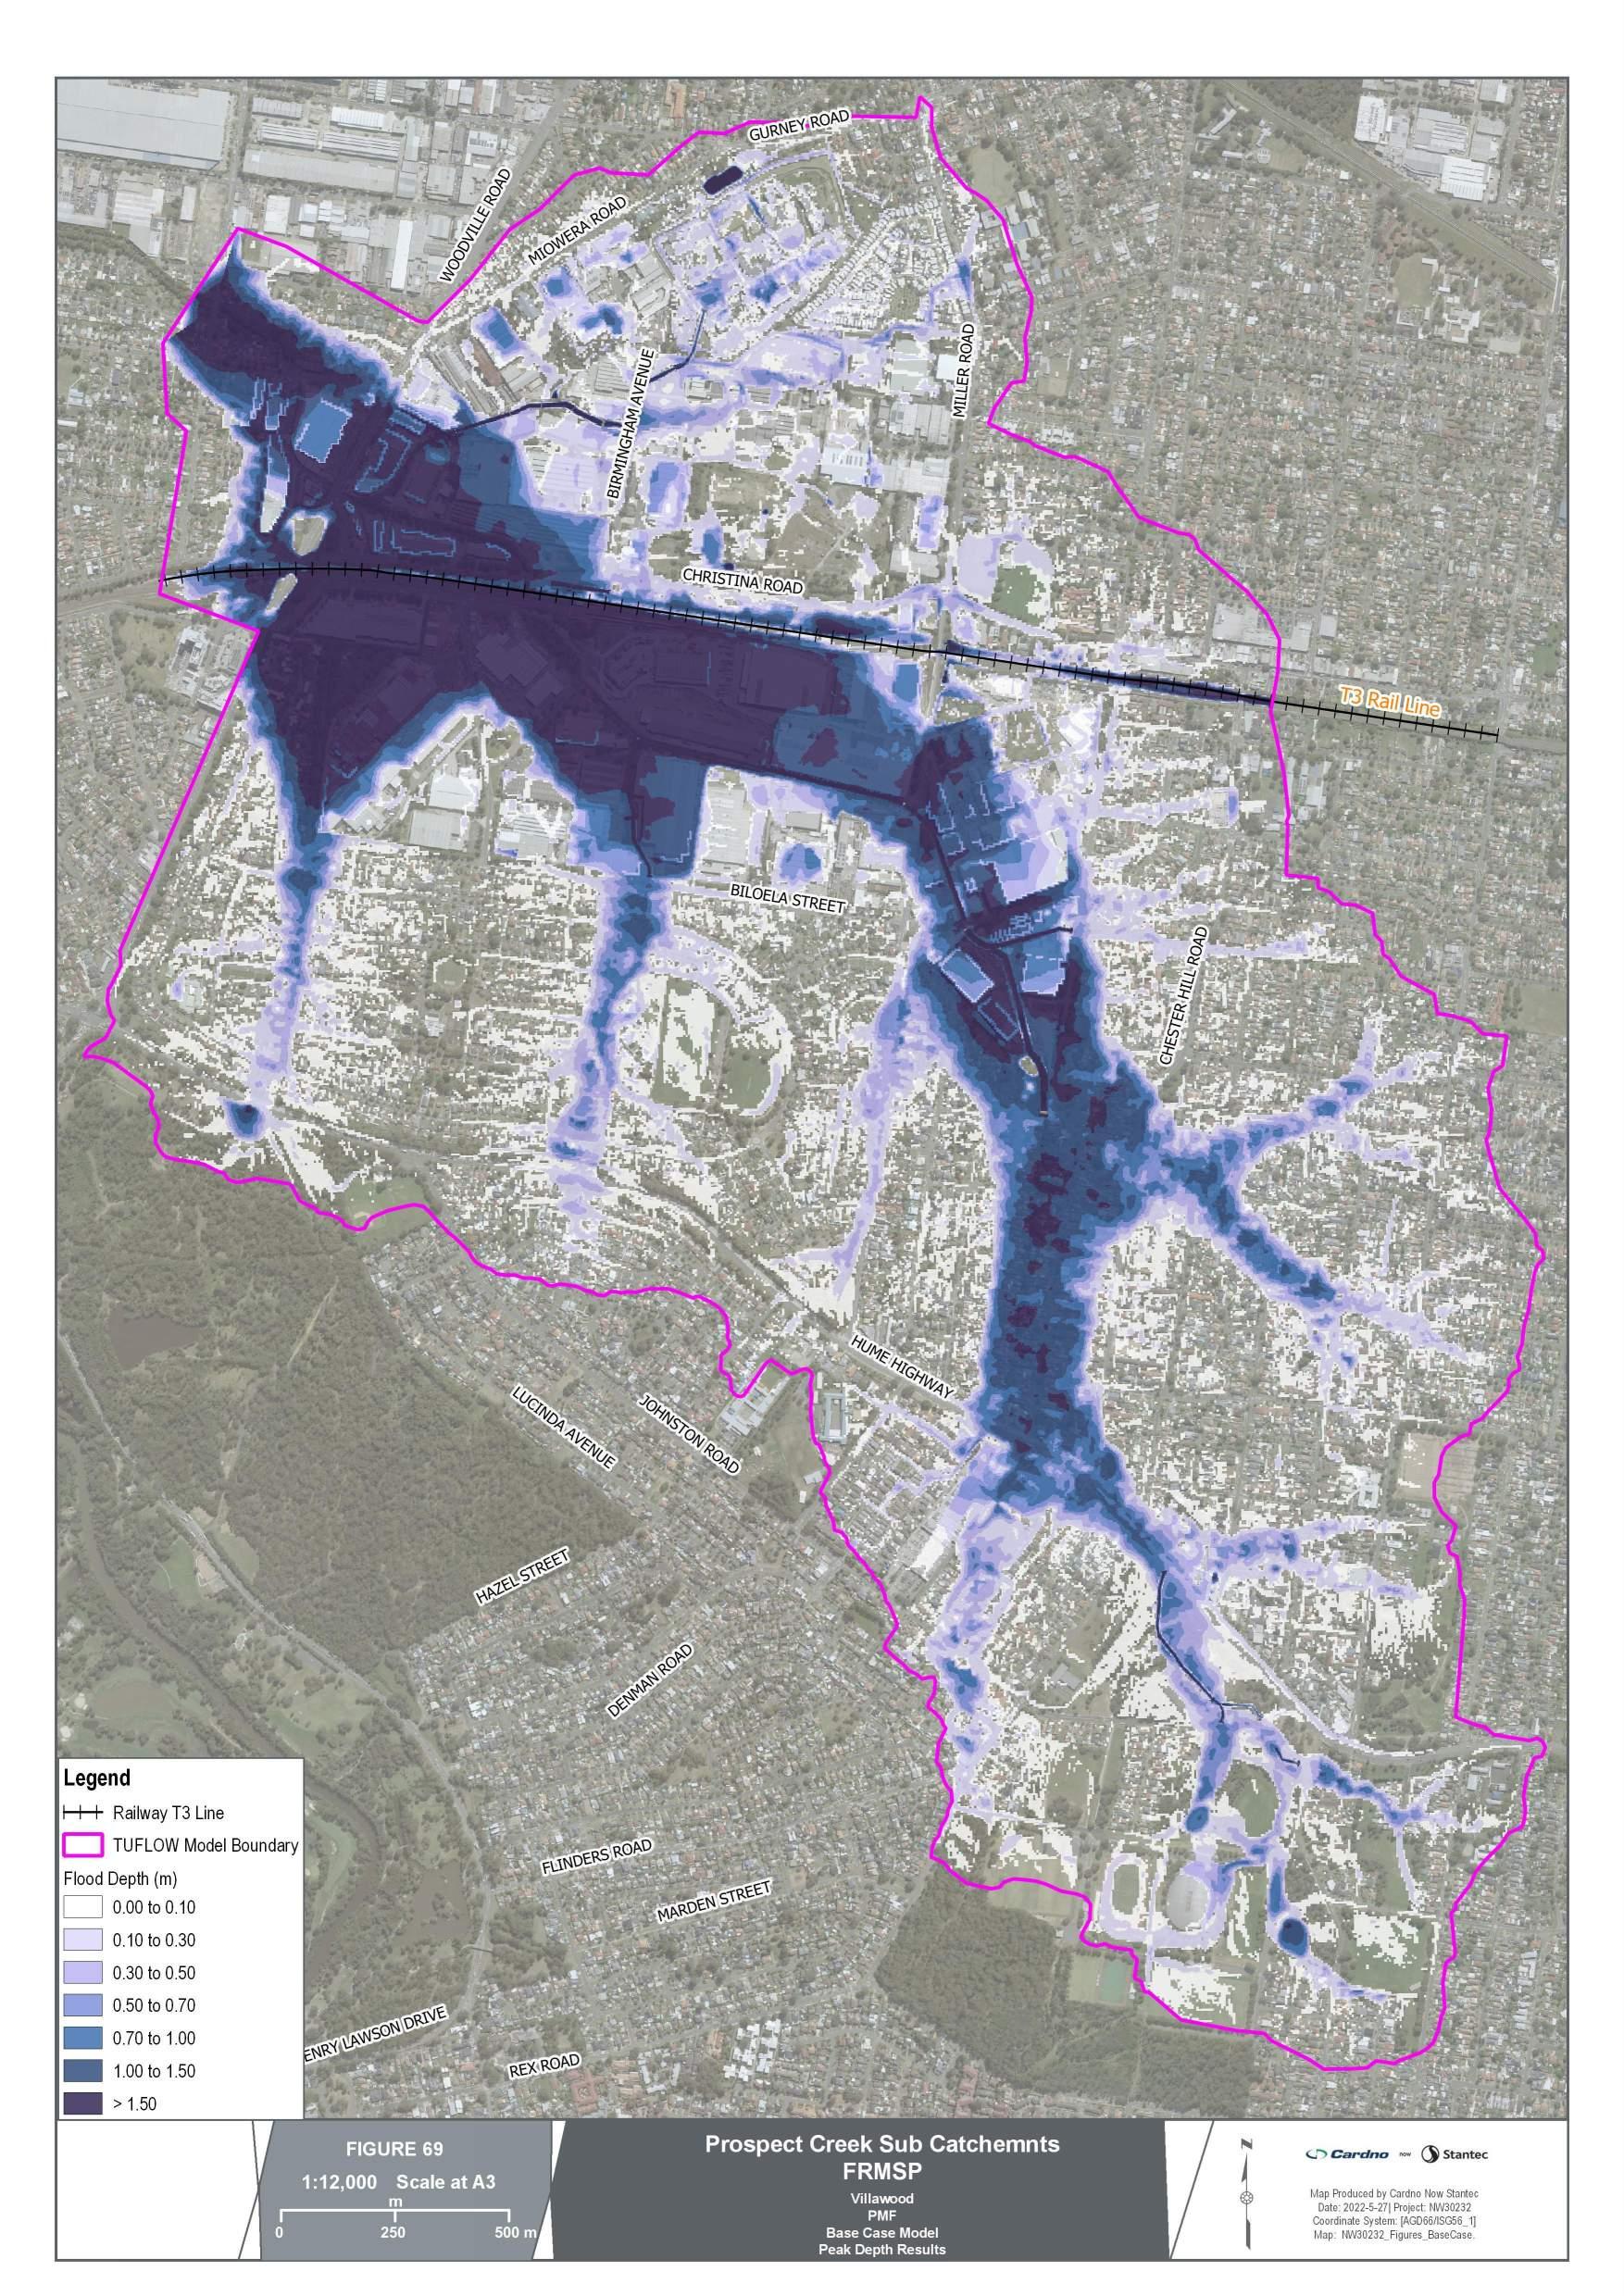

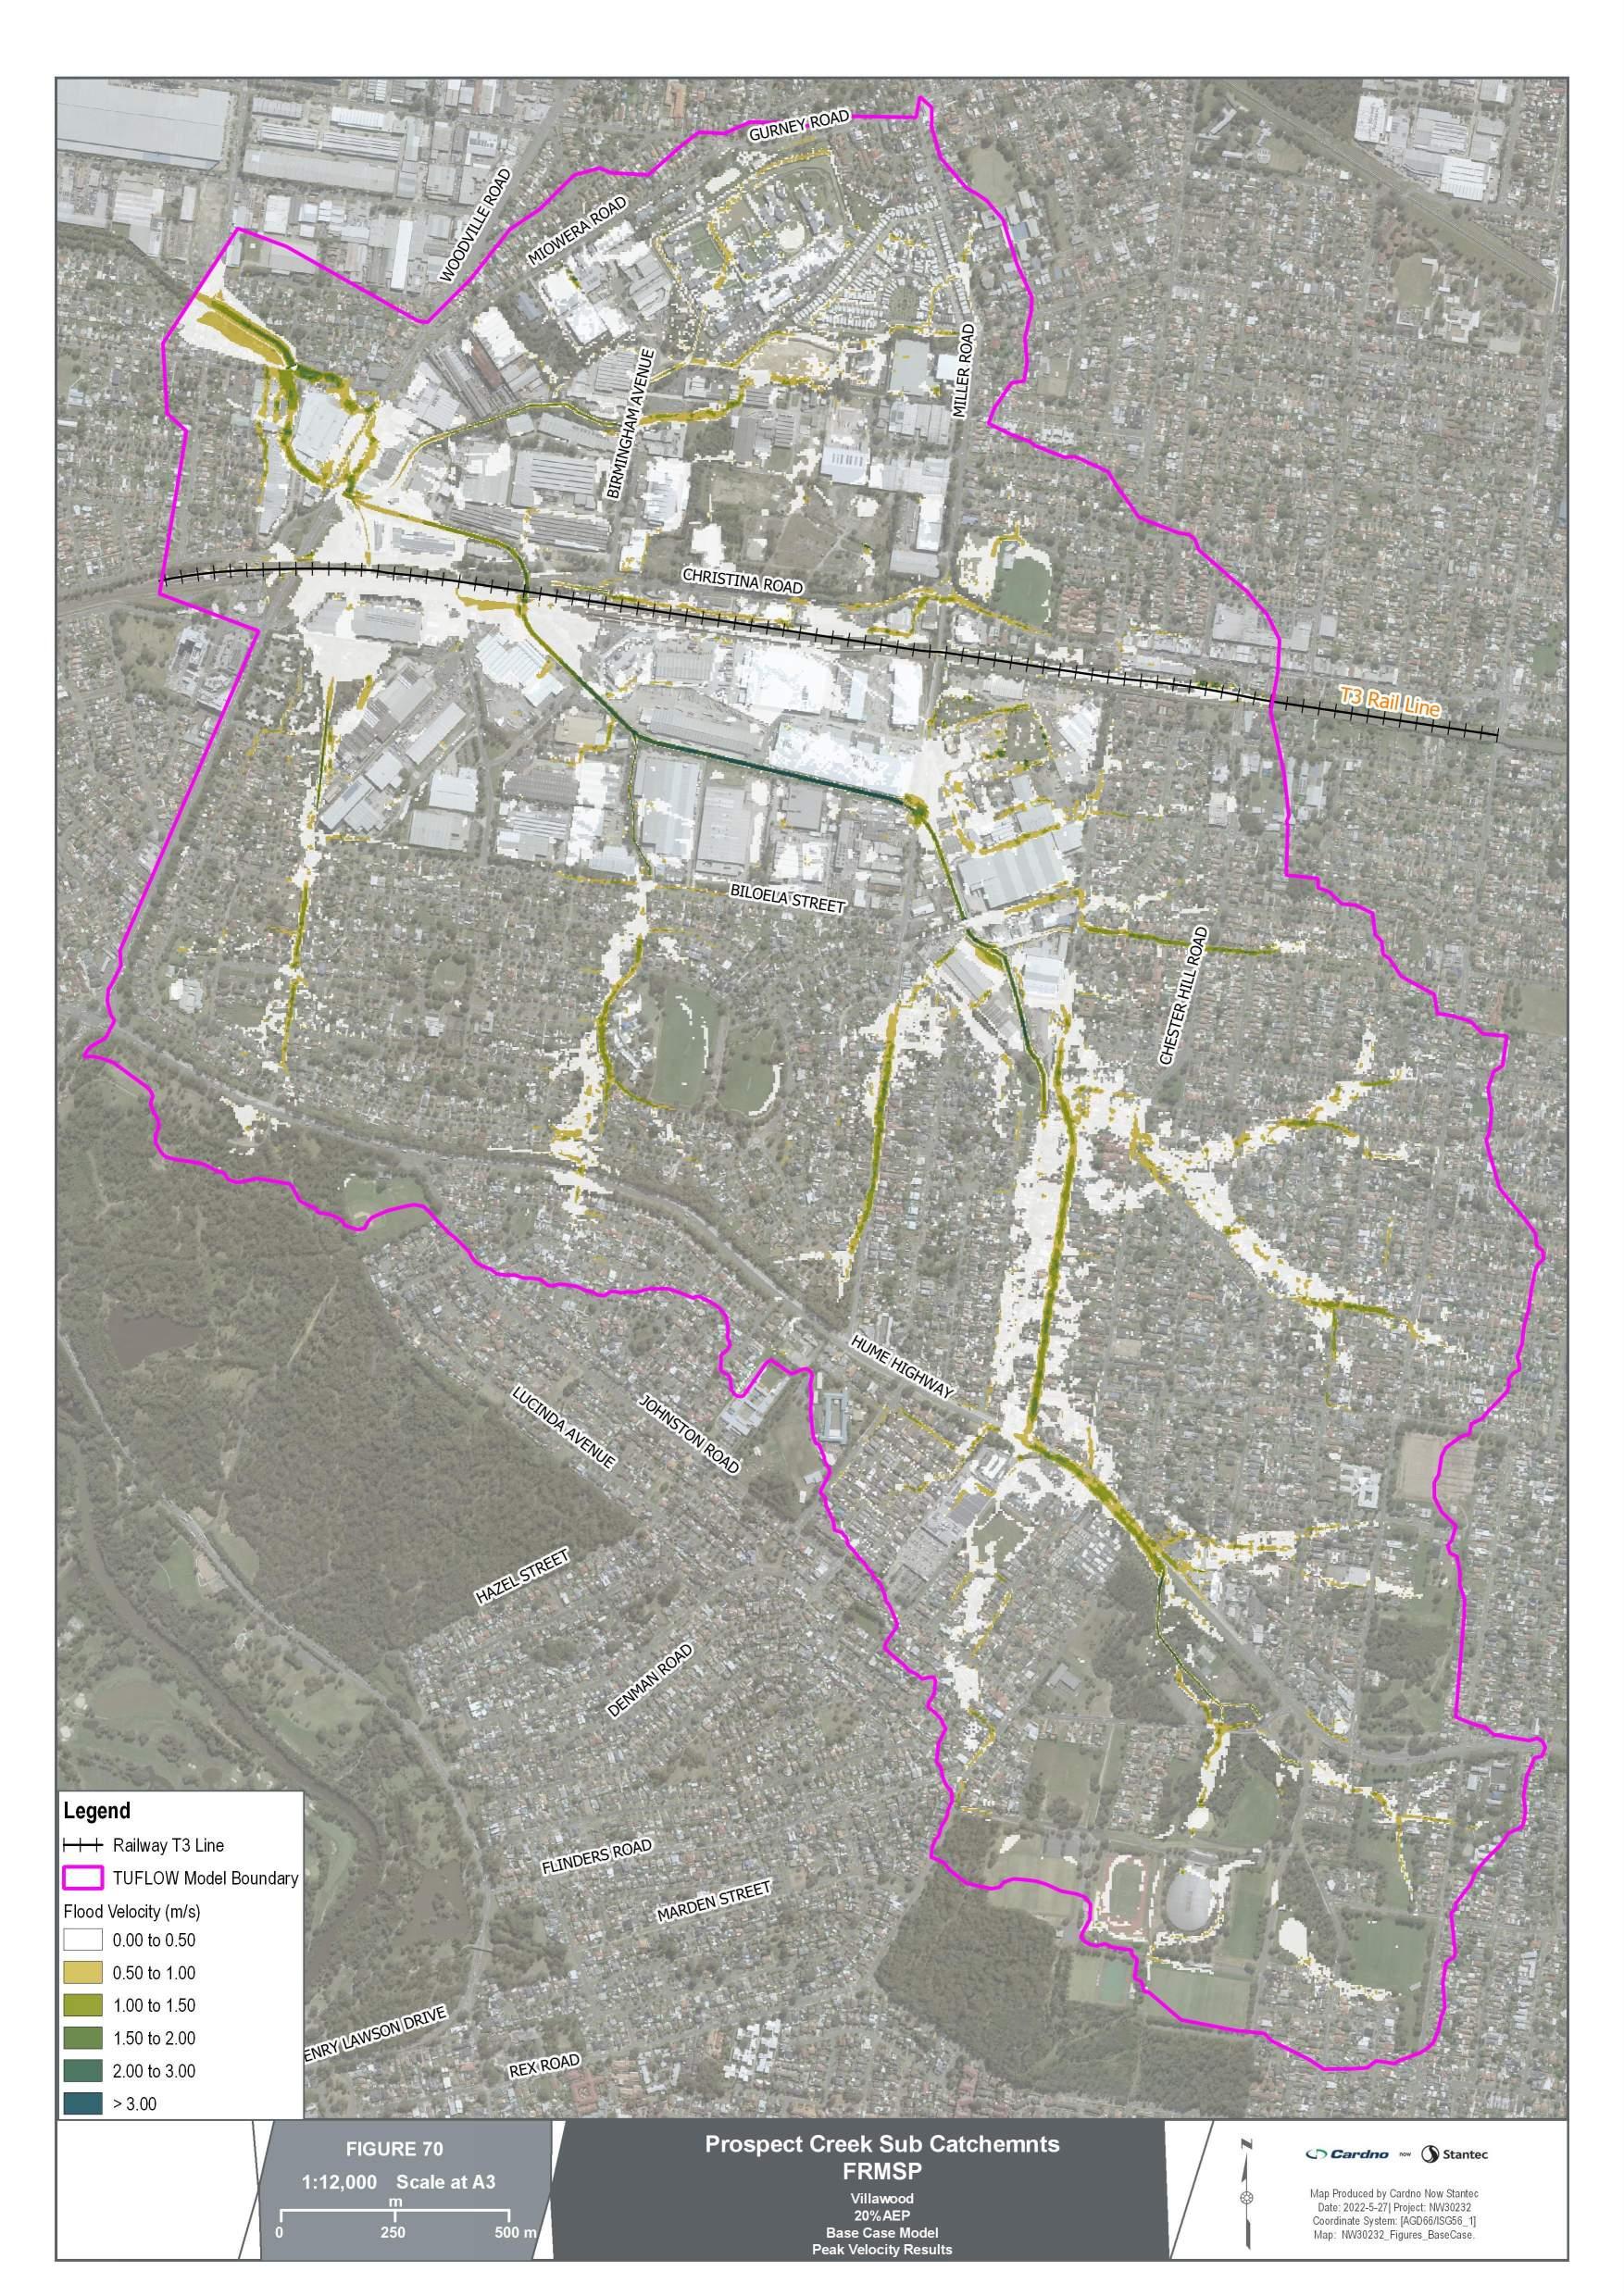

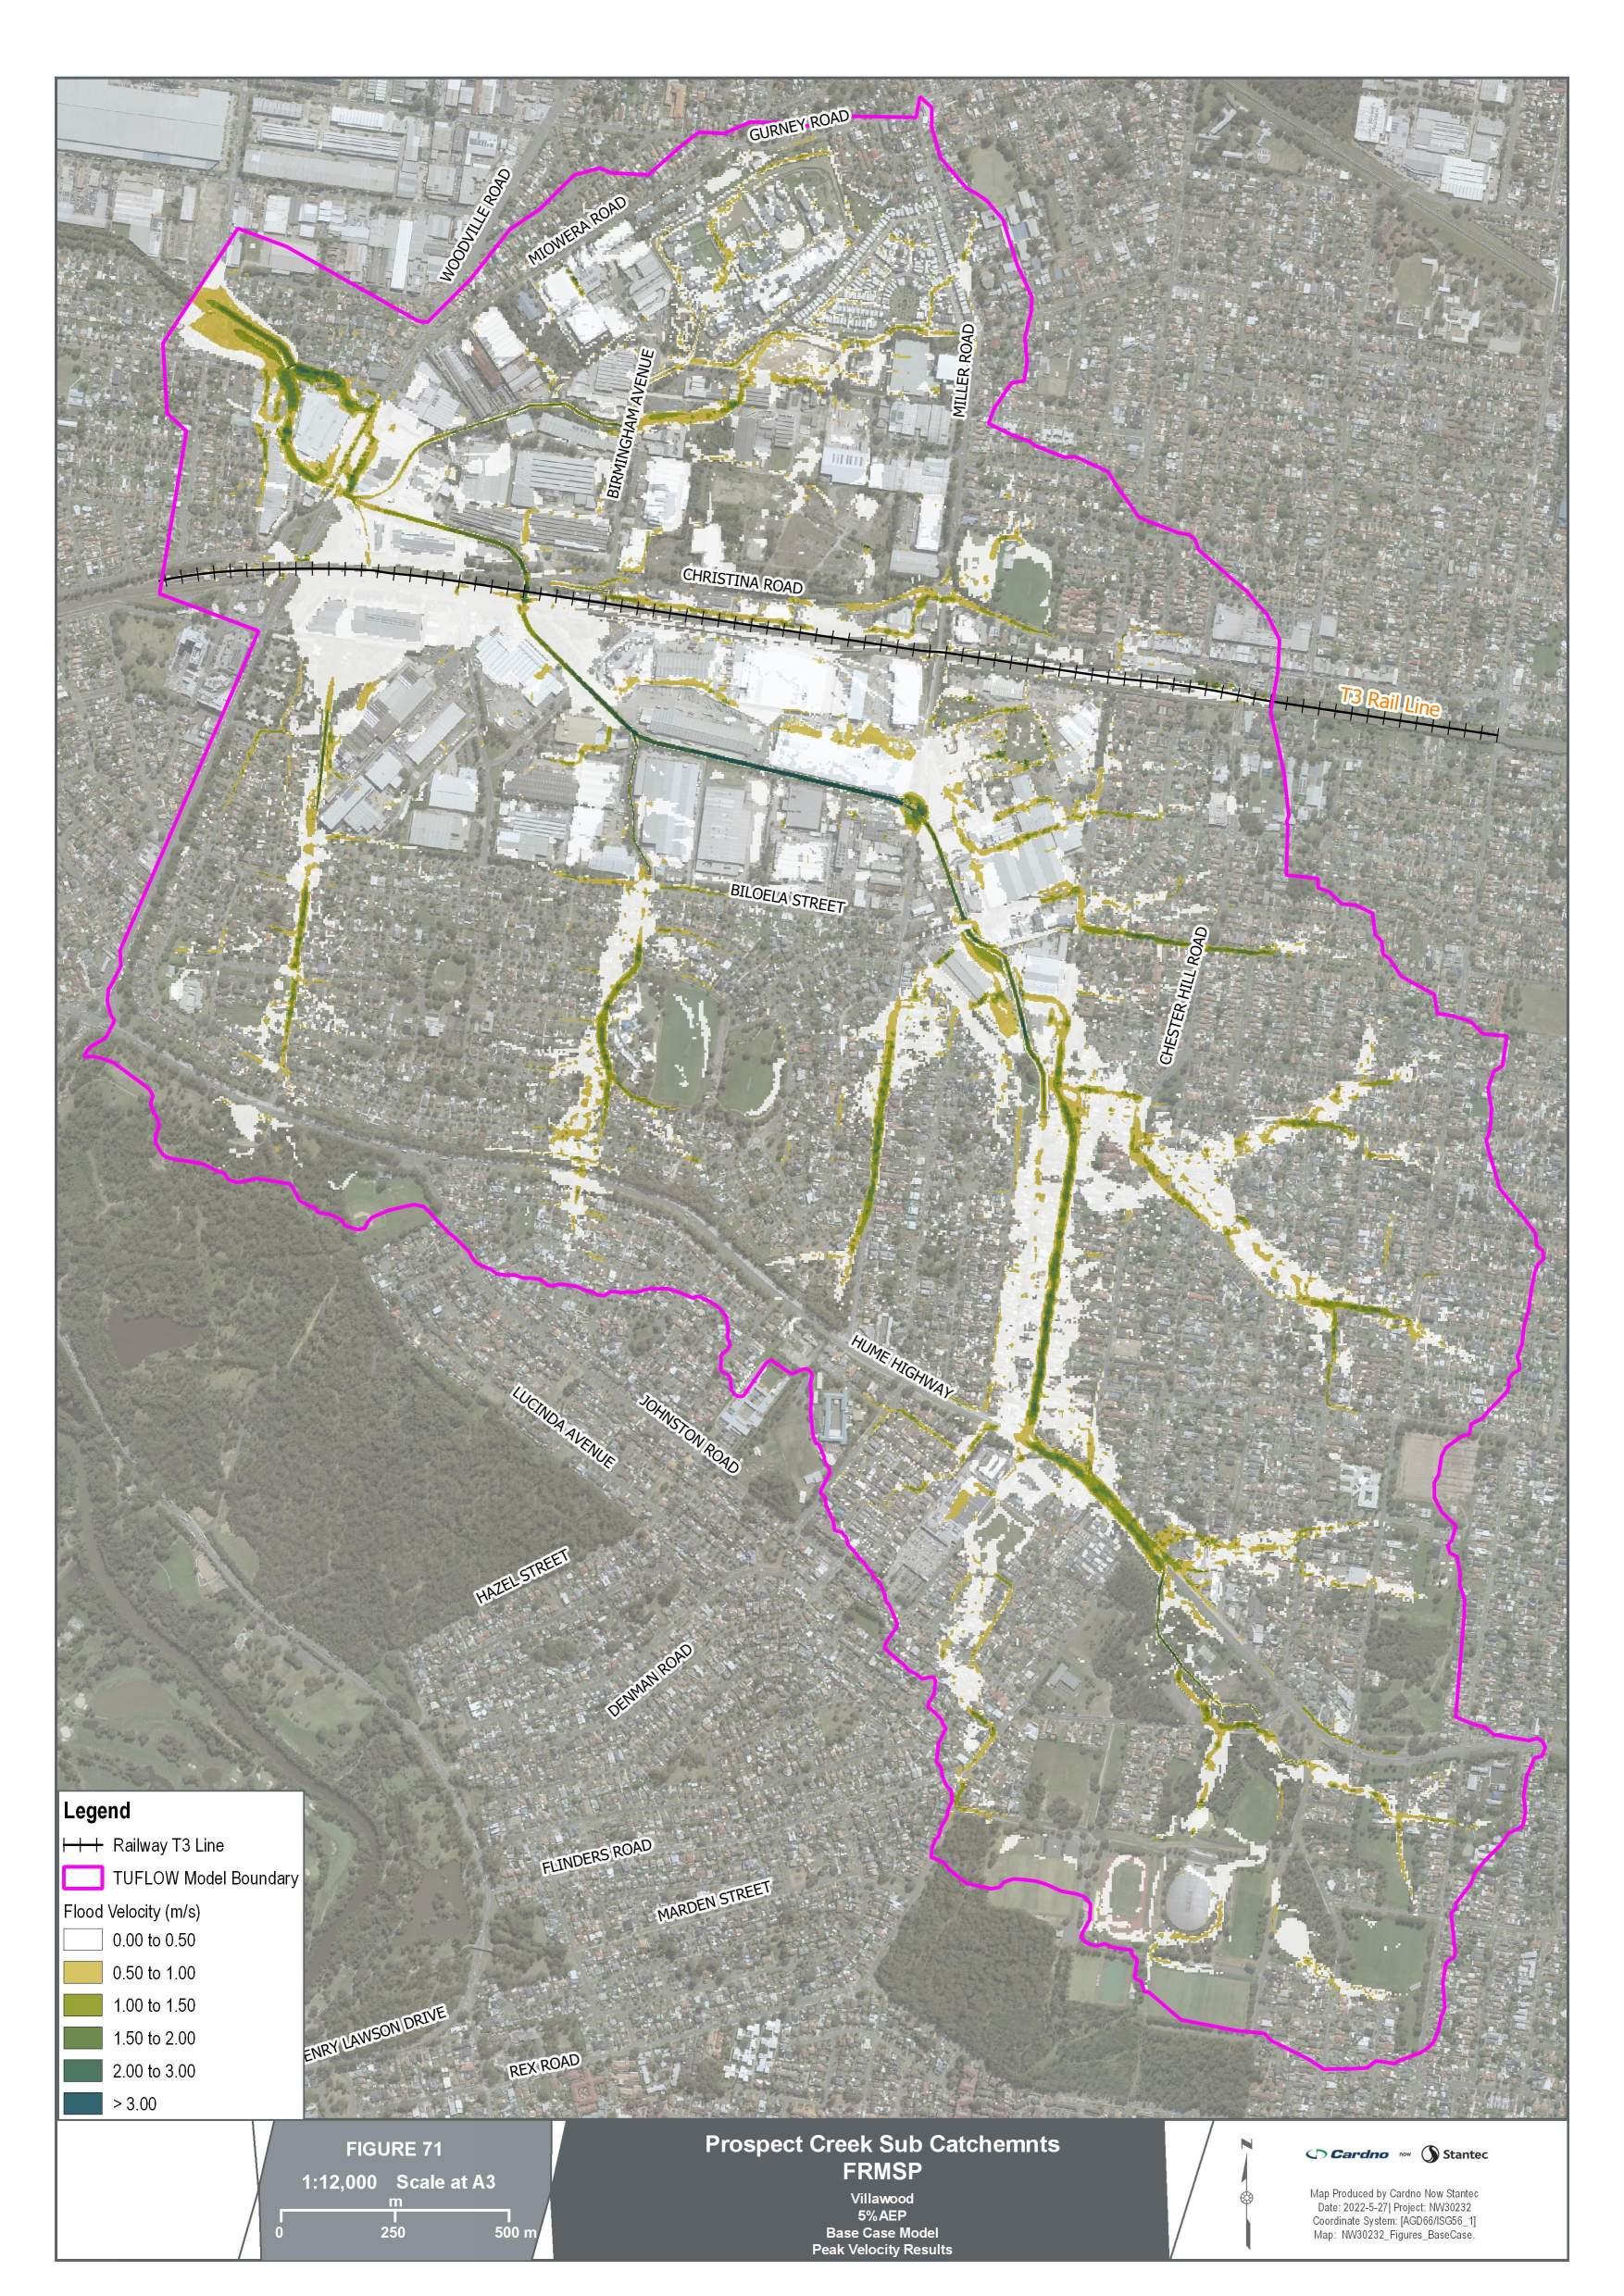

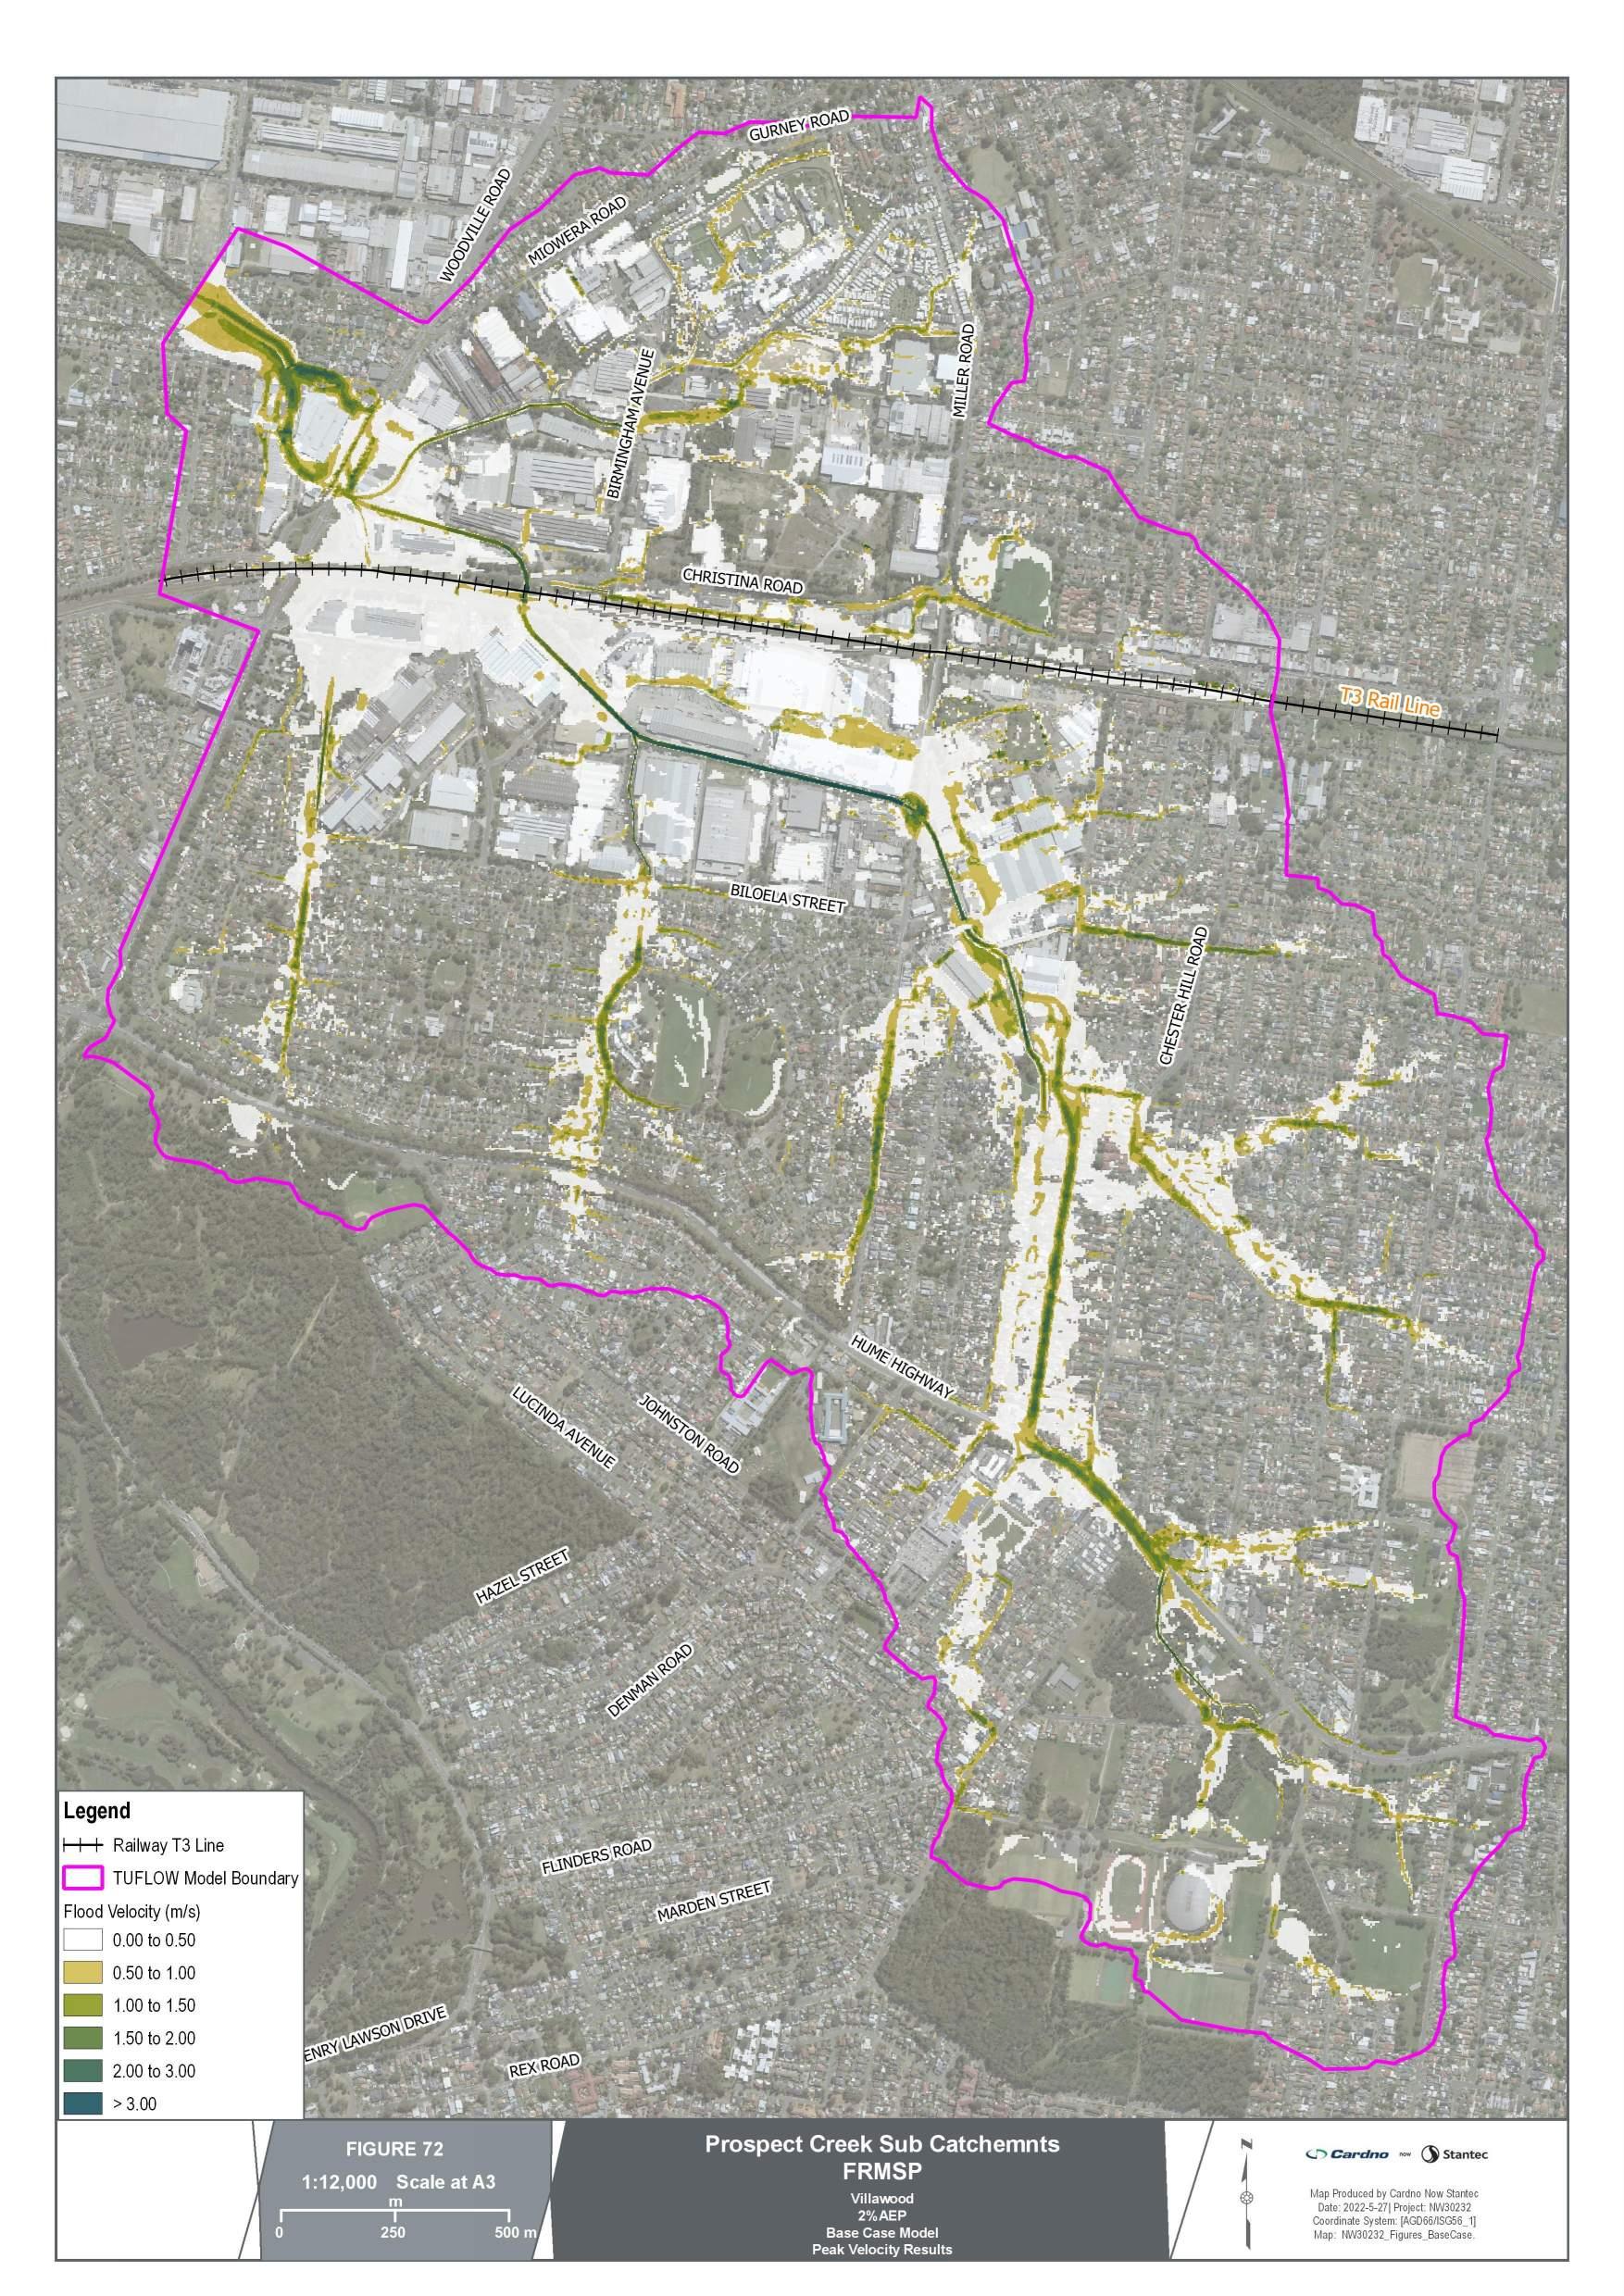


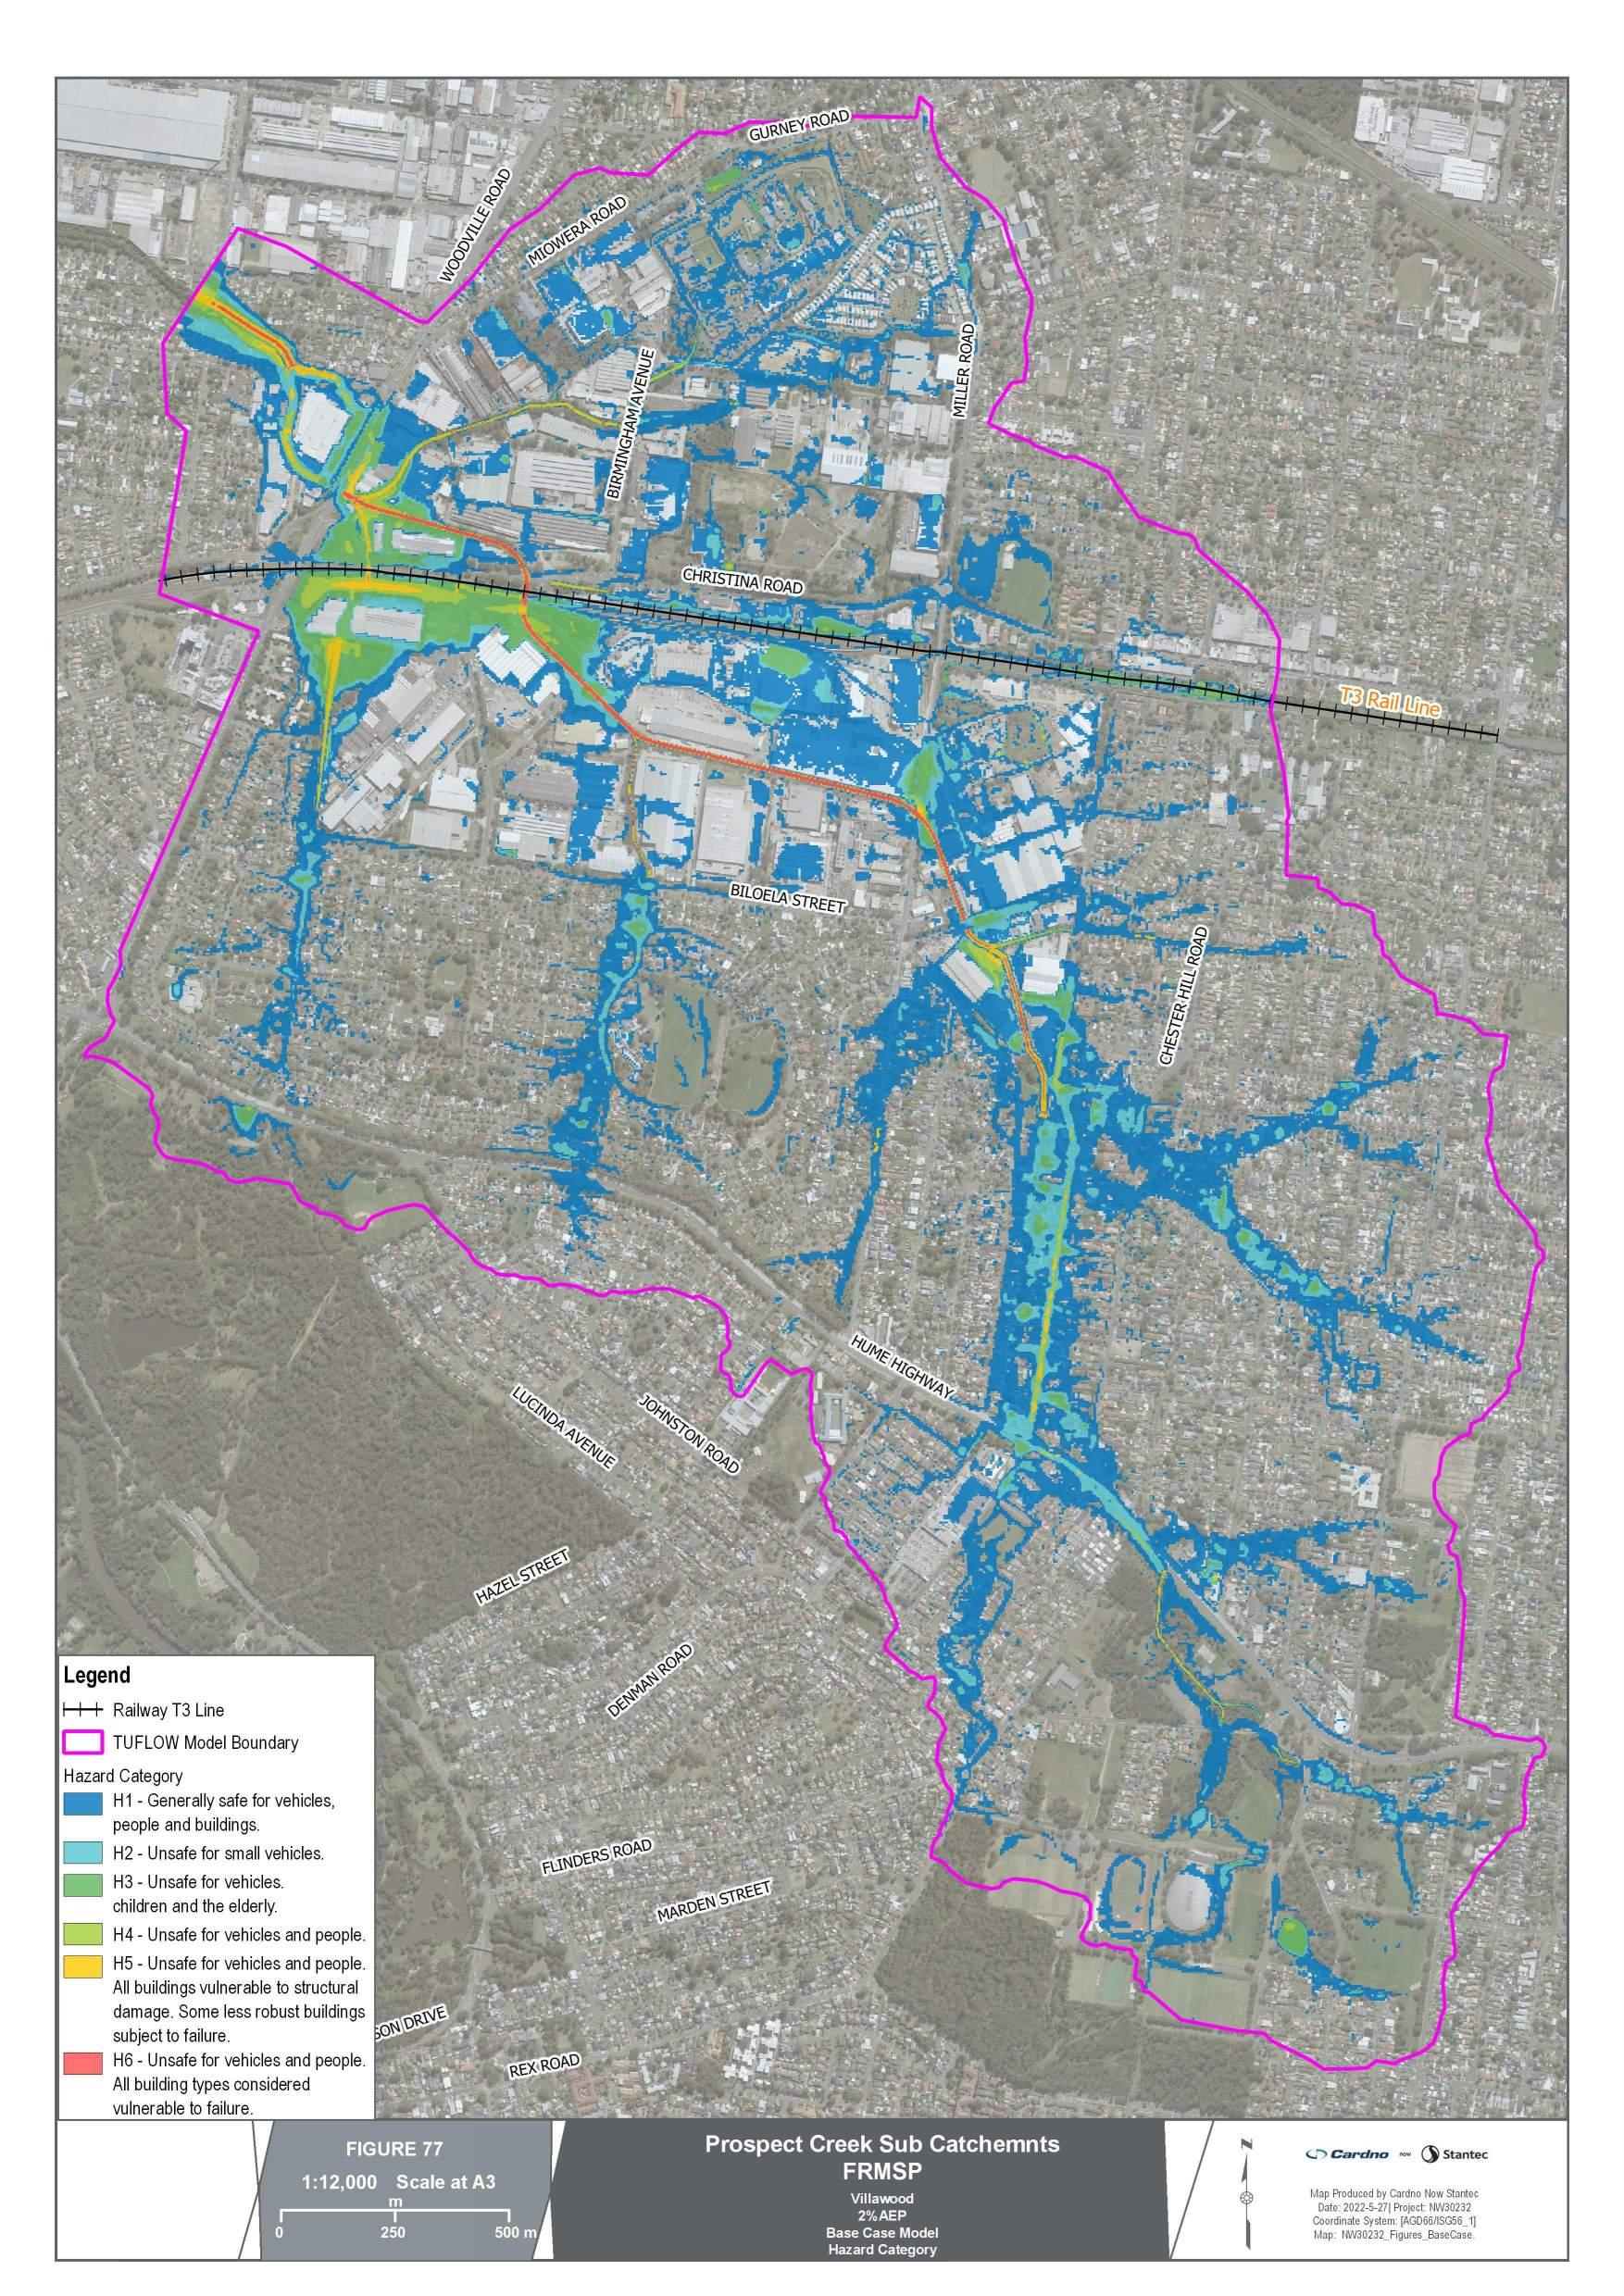

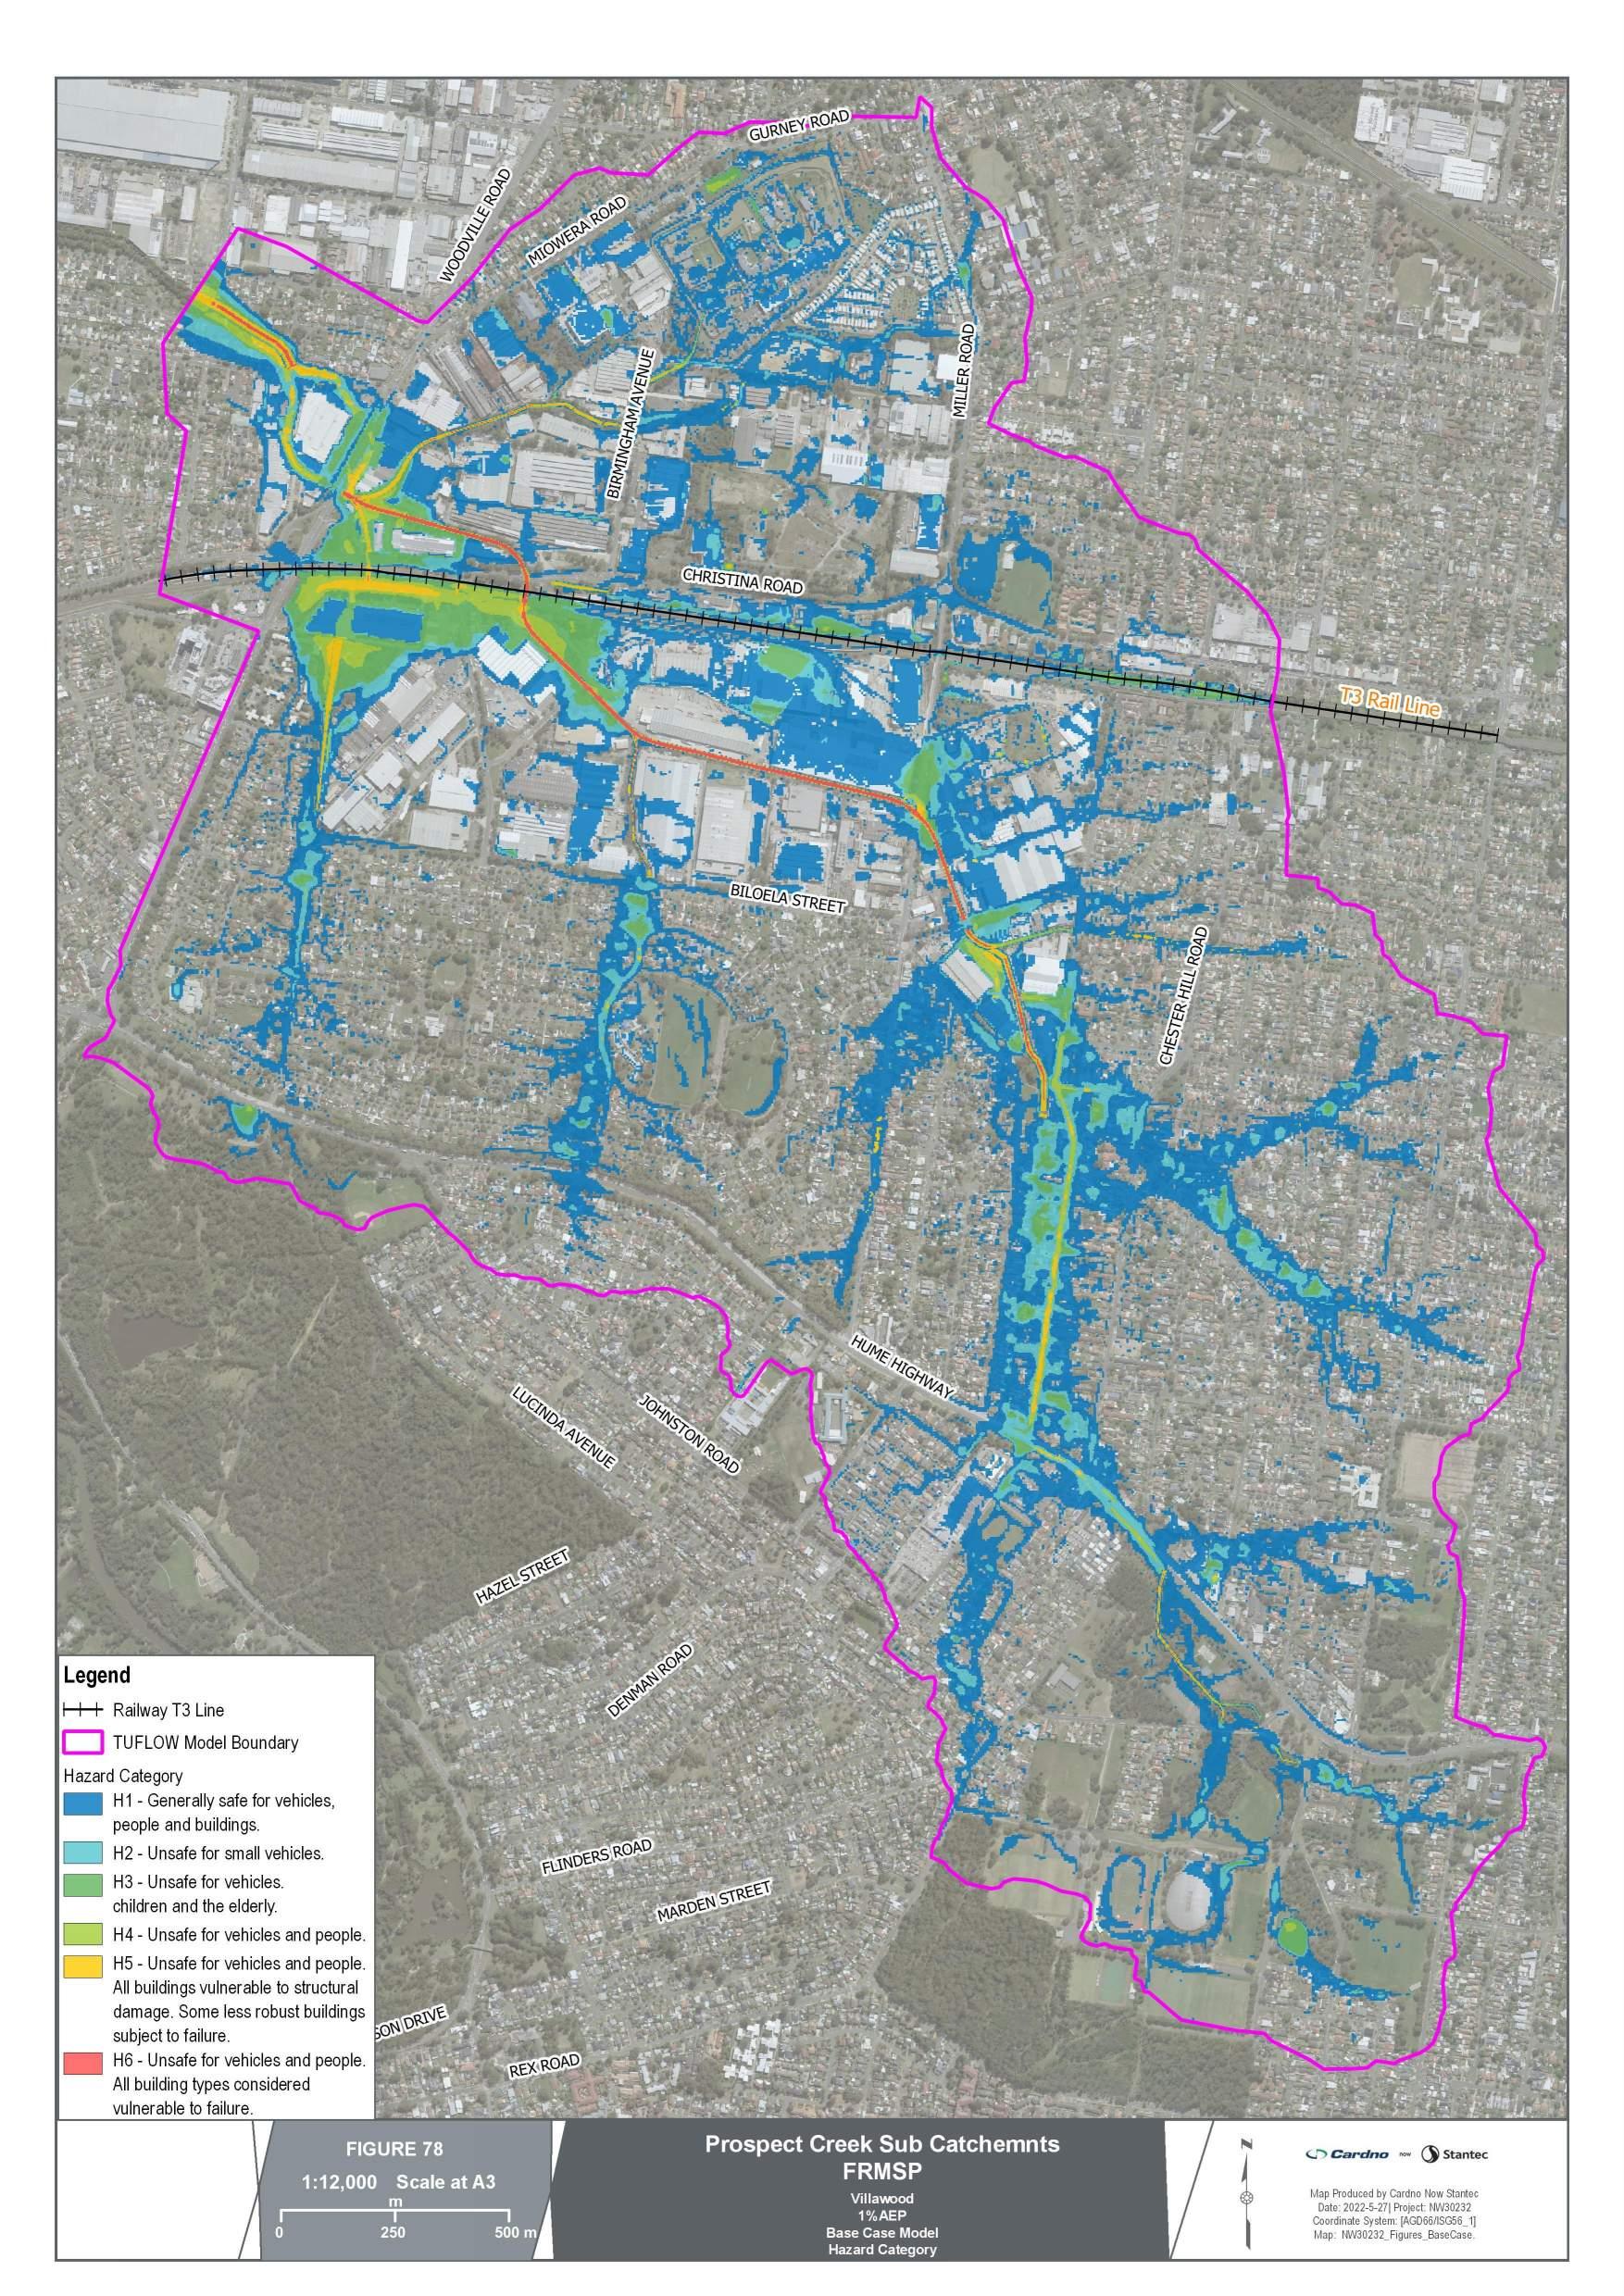

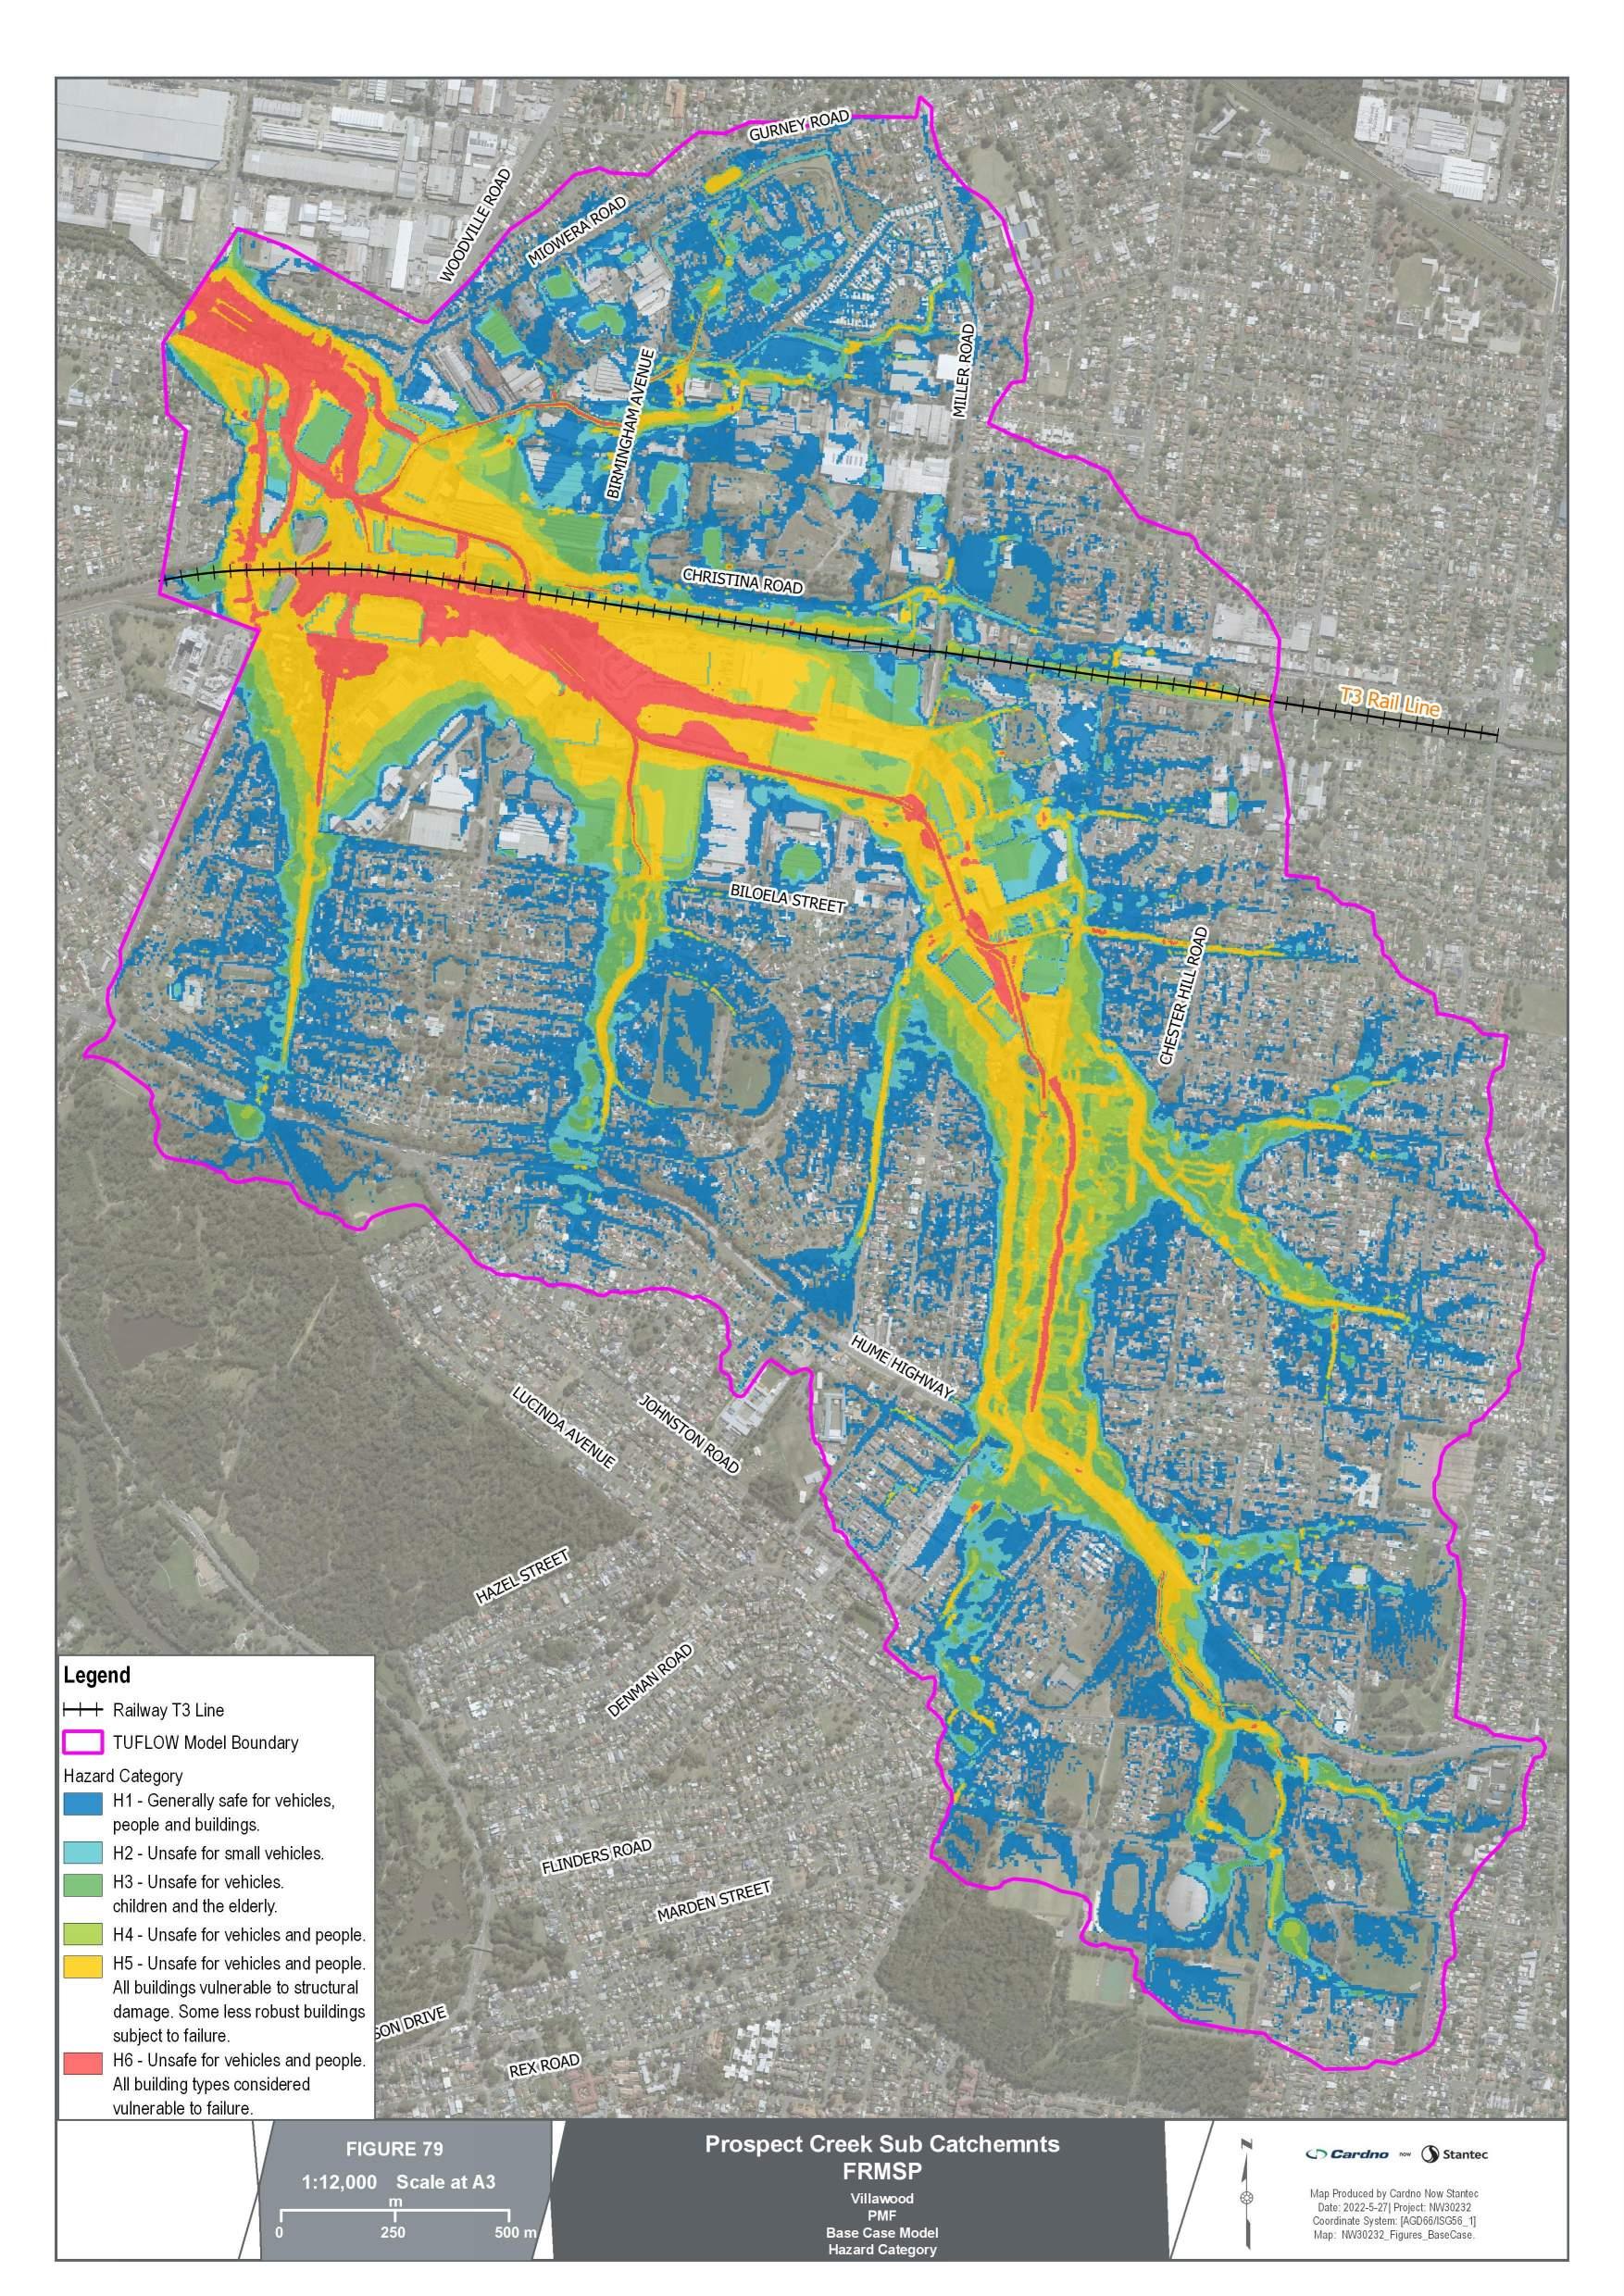

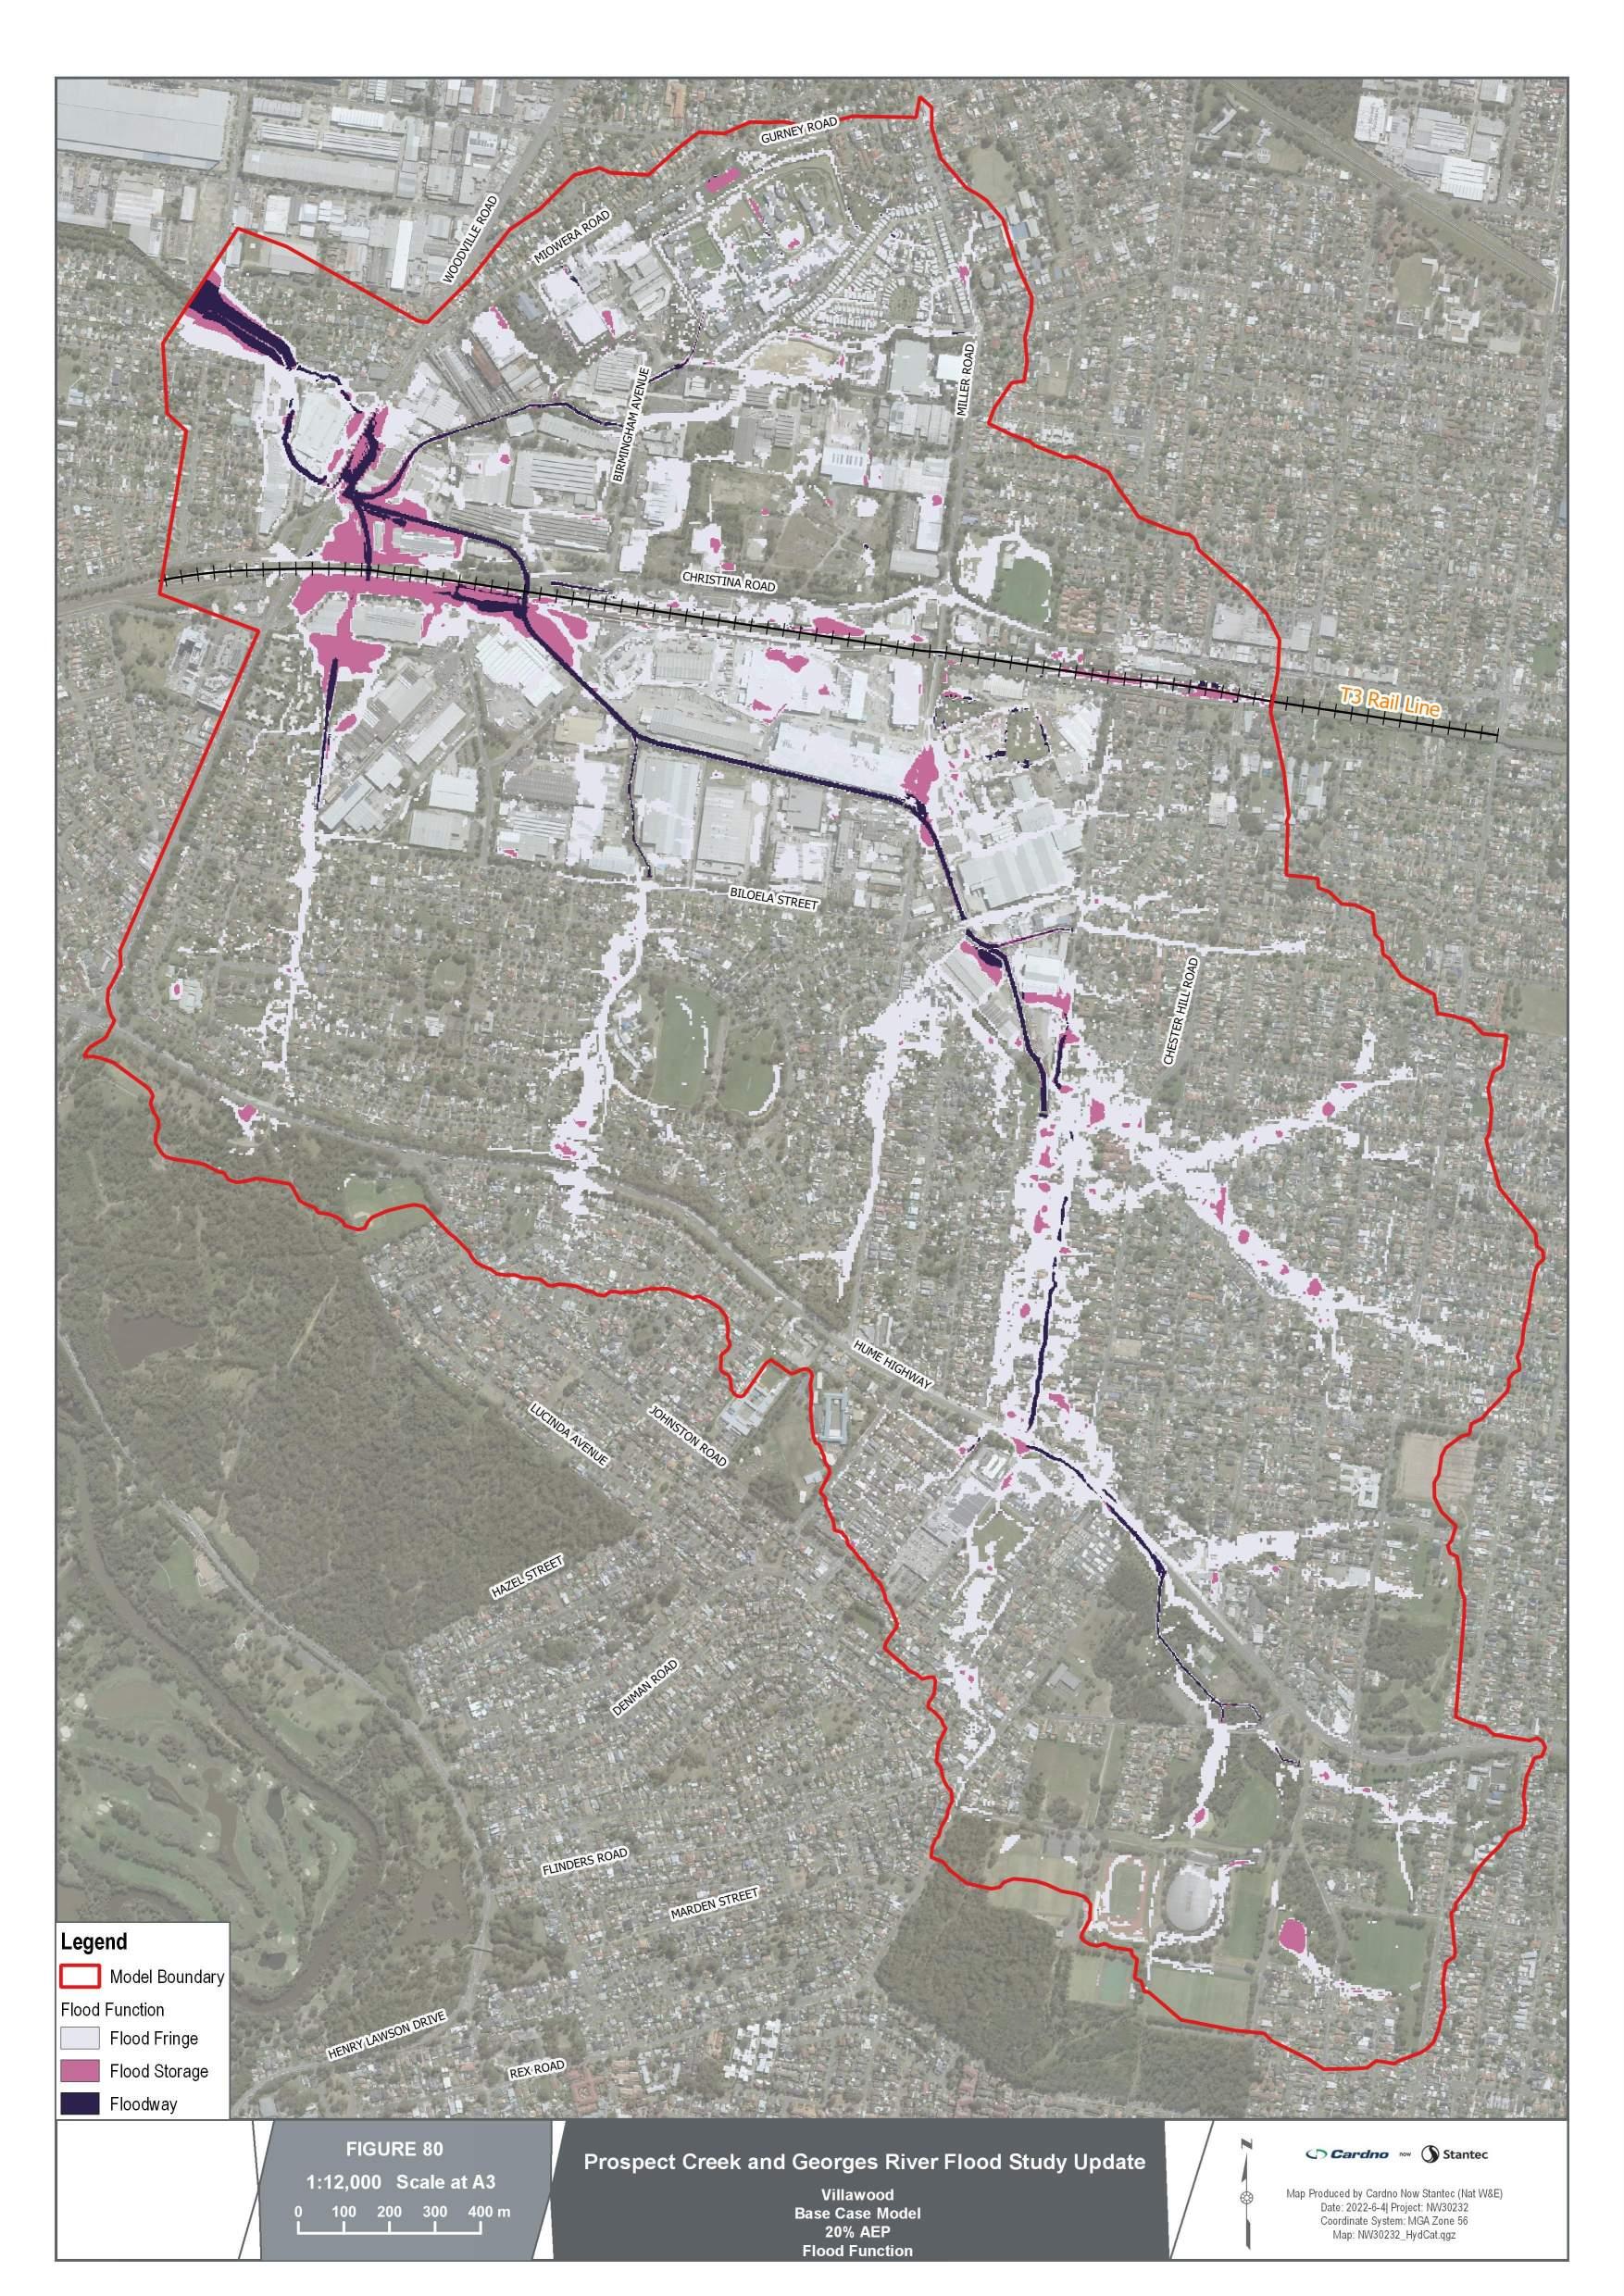
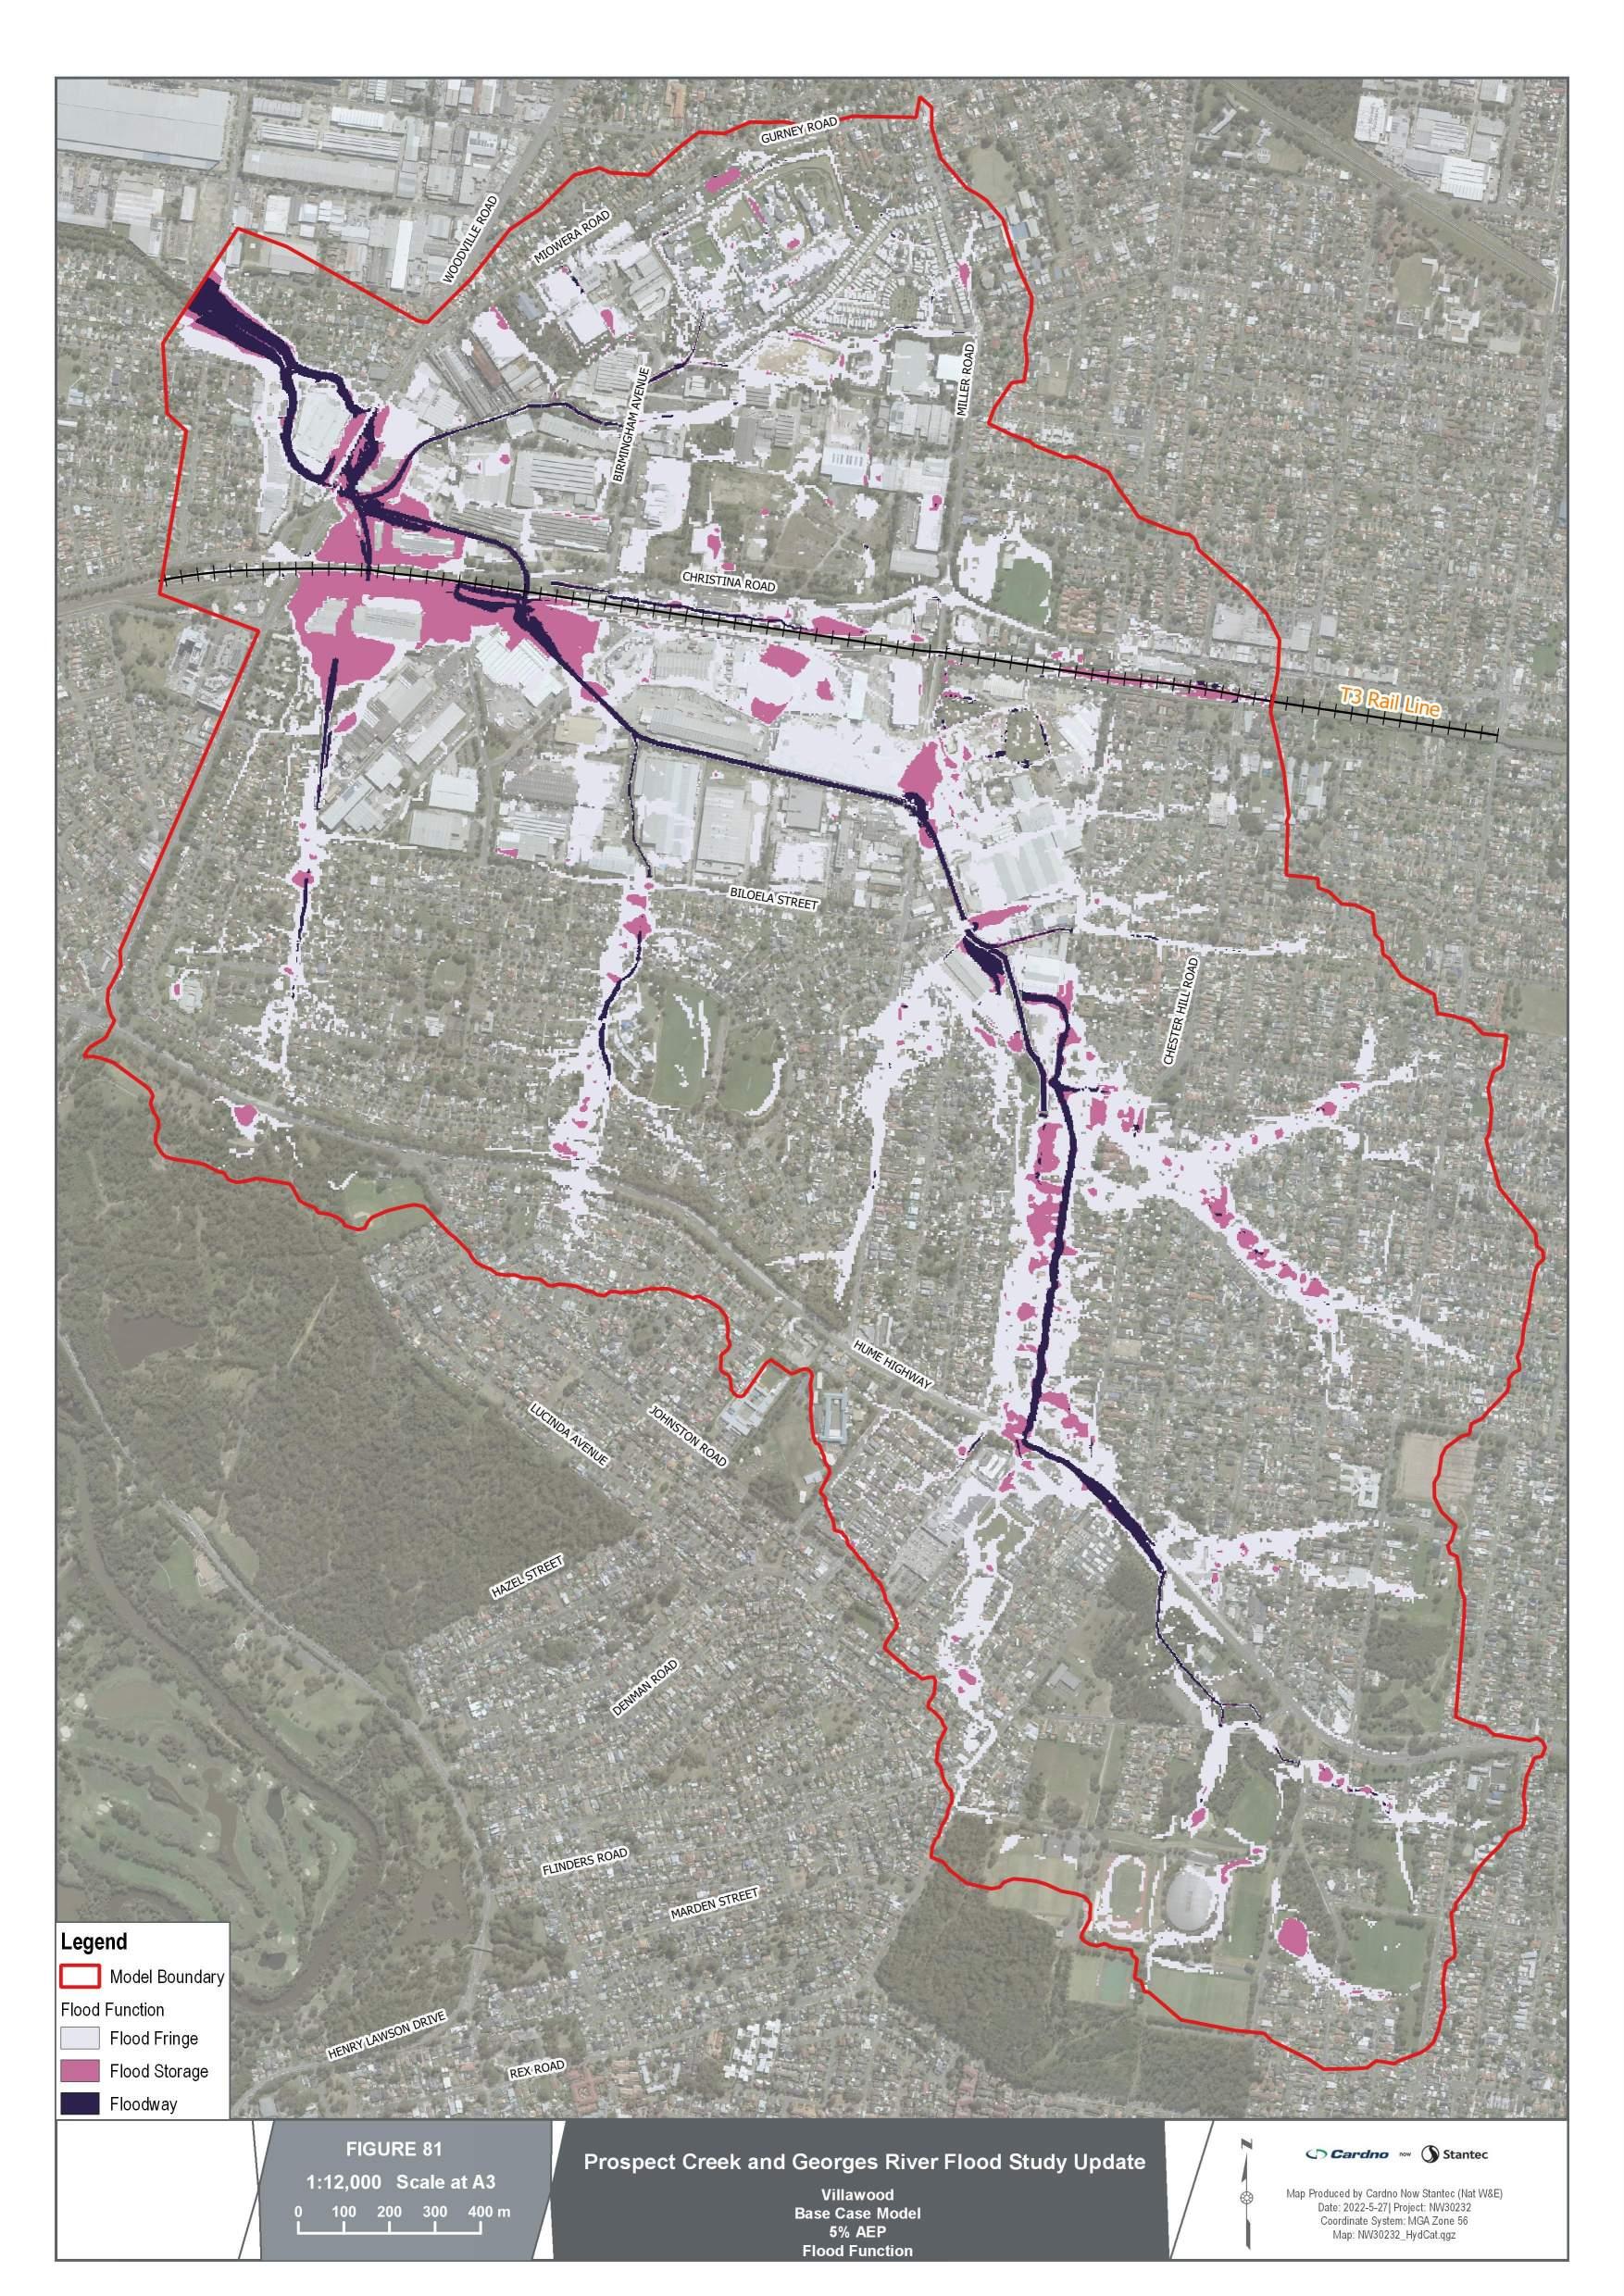
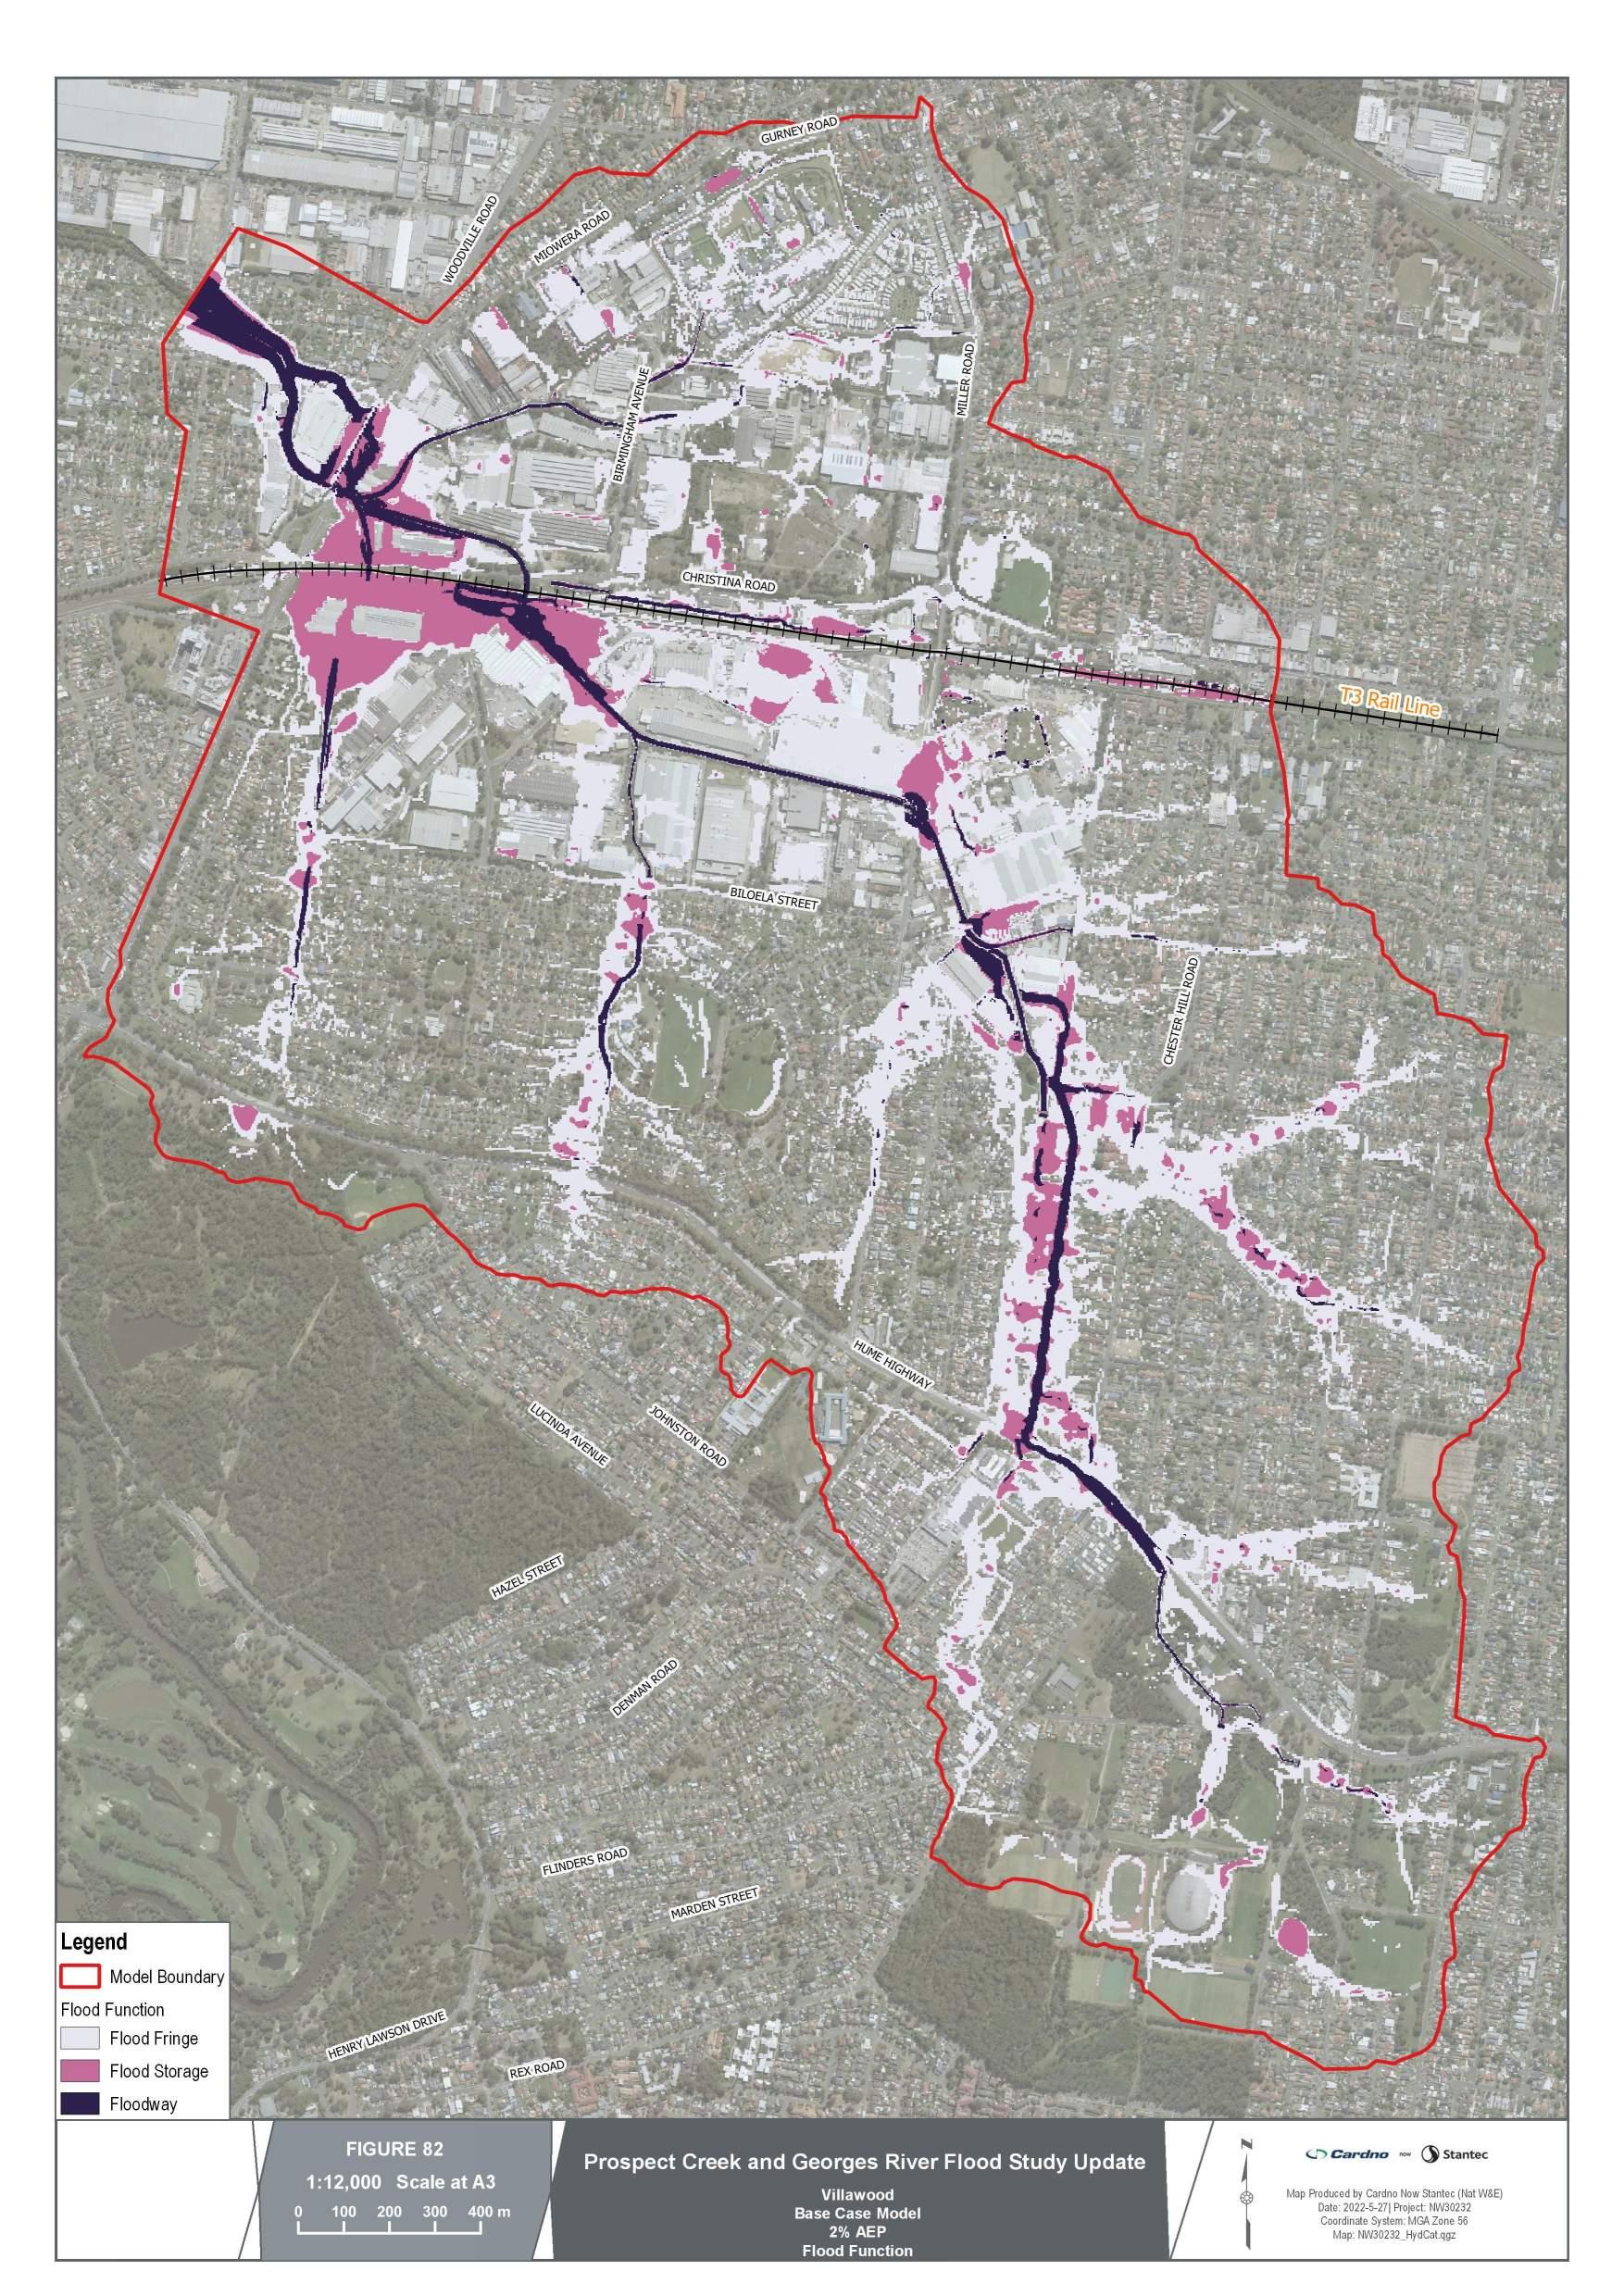

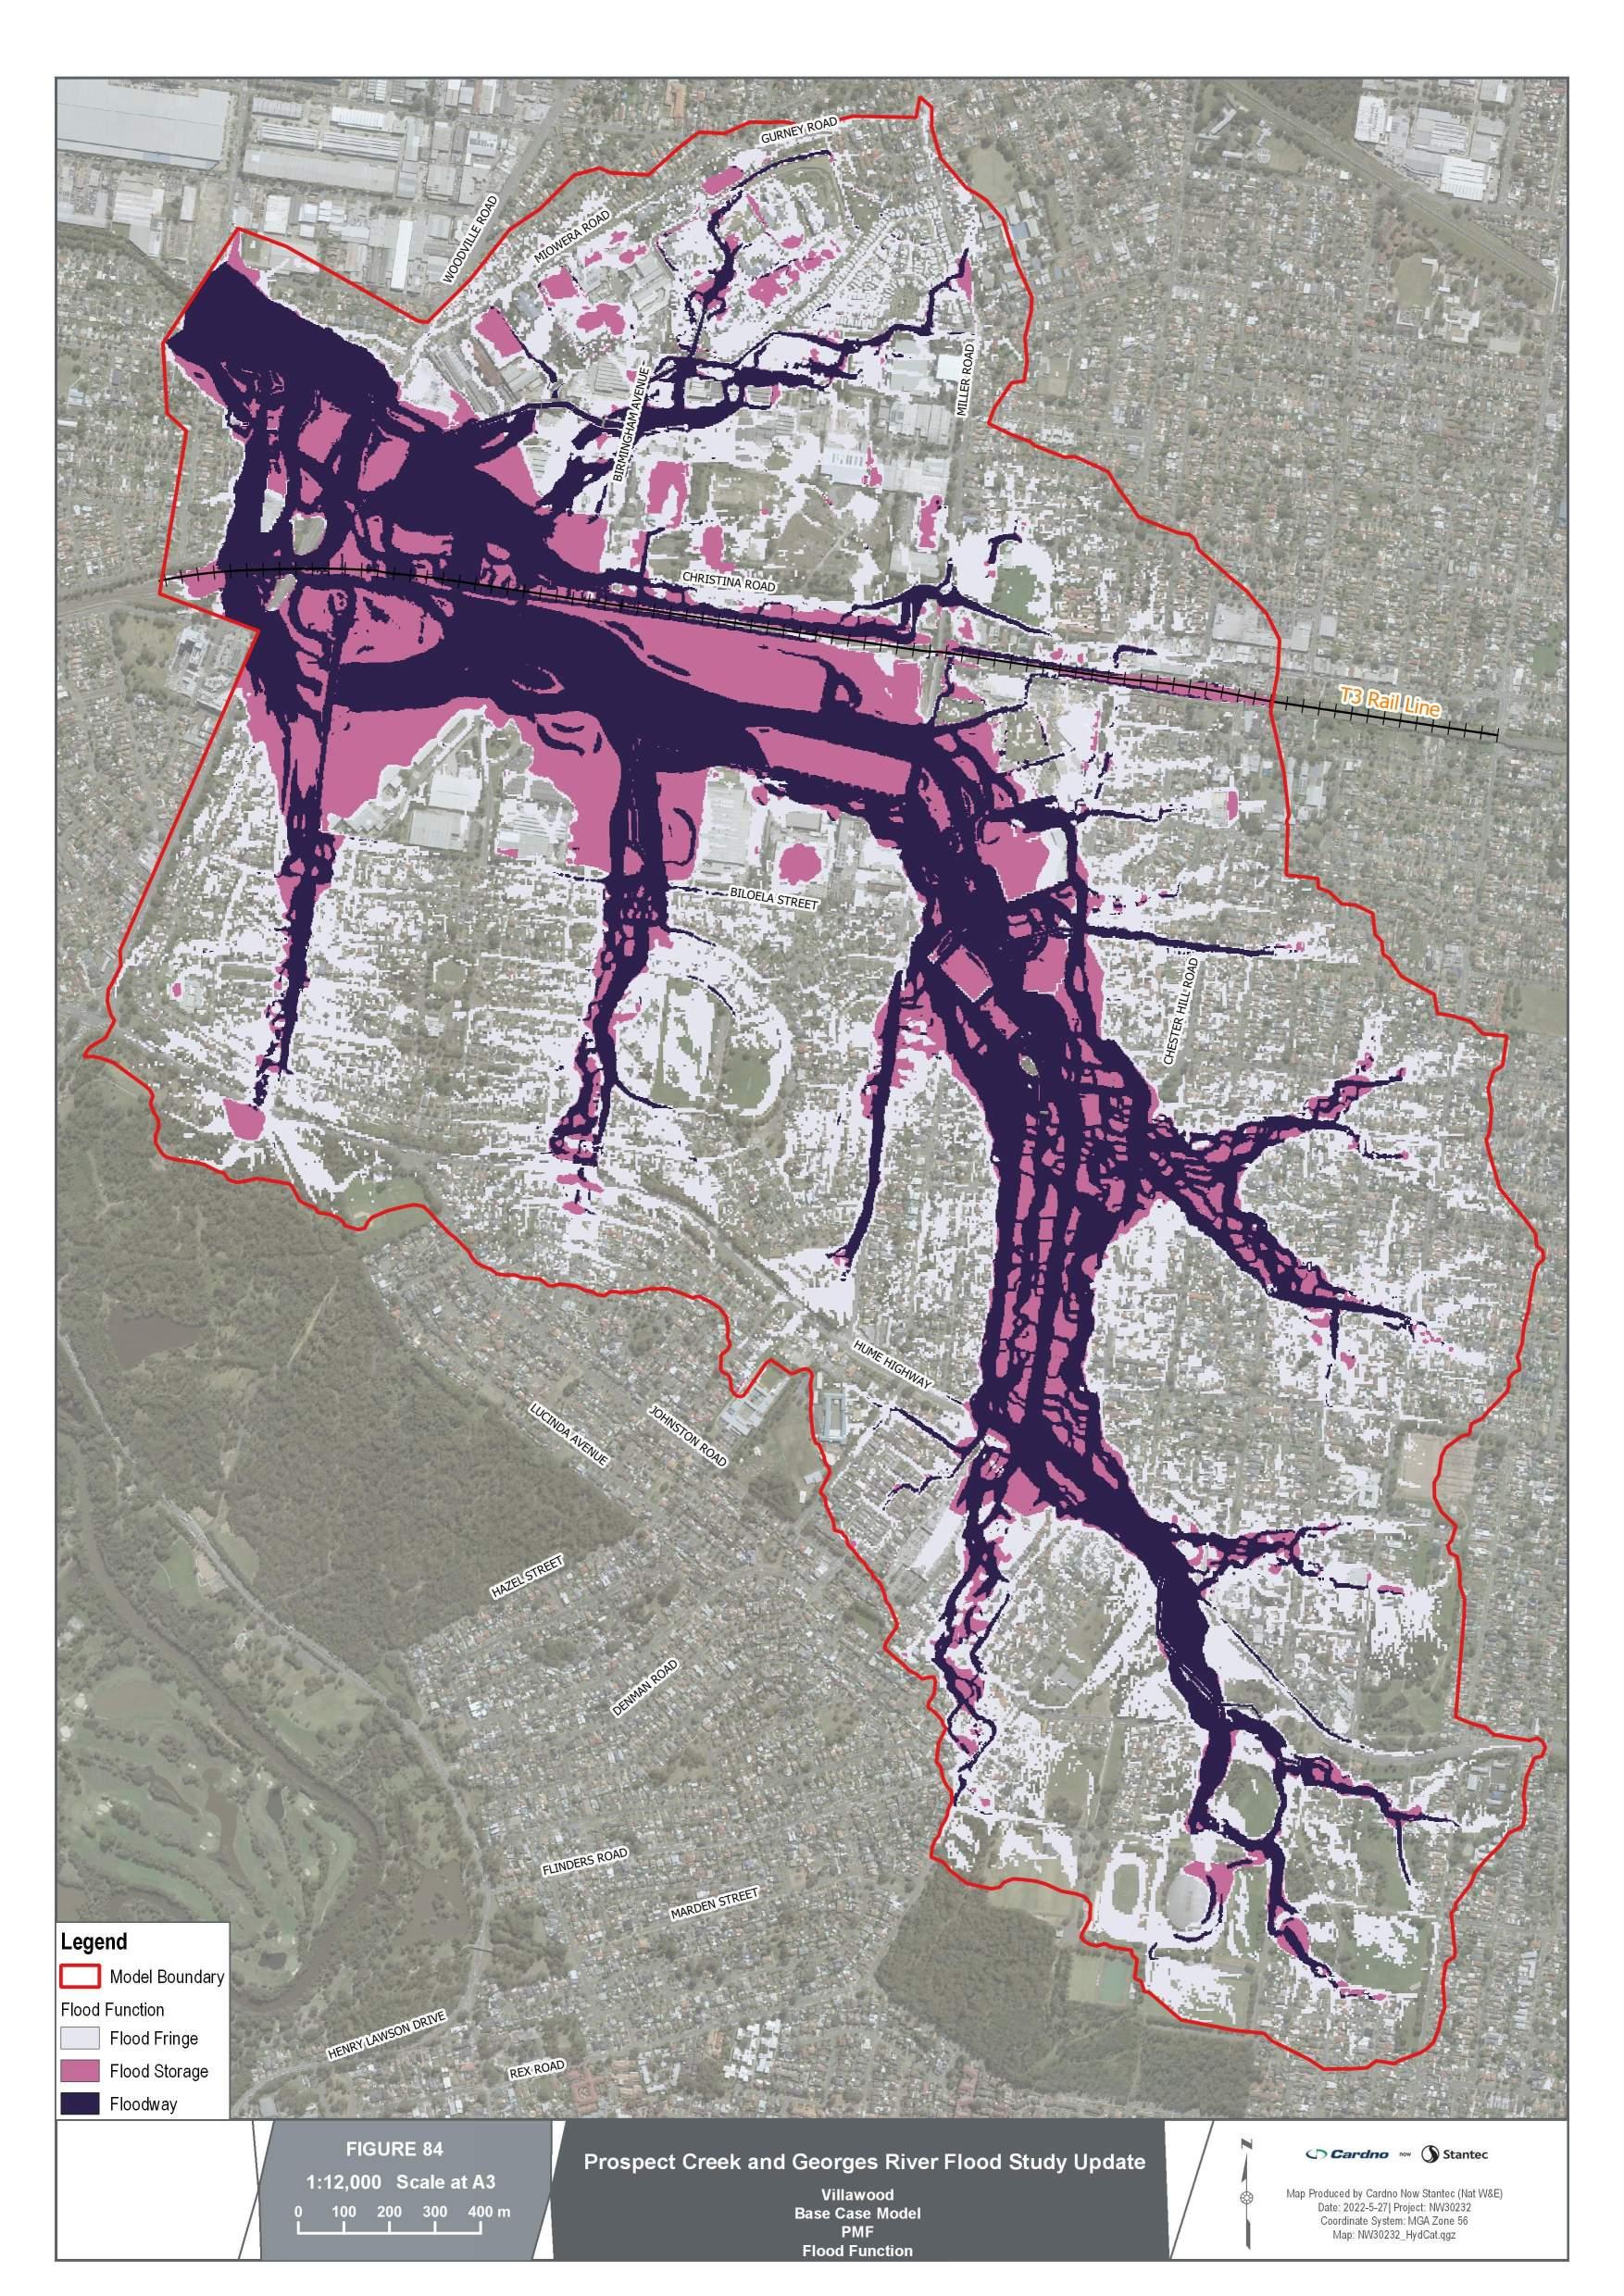
Prospect
Creek Sub-Catchments

APPENDIX

CLIMATE CHANGE IMPACT MAPS
v
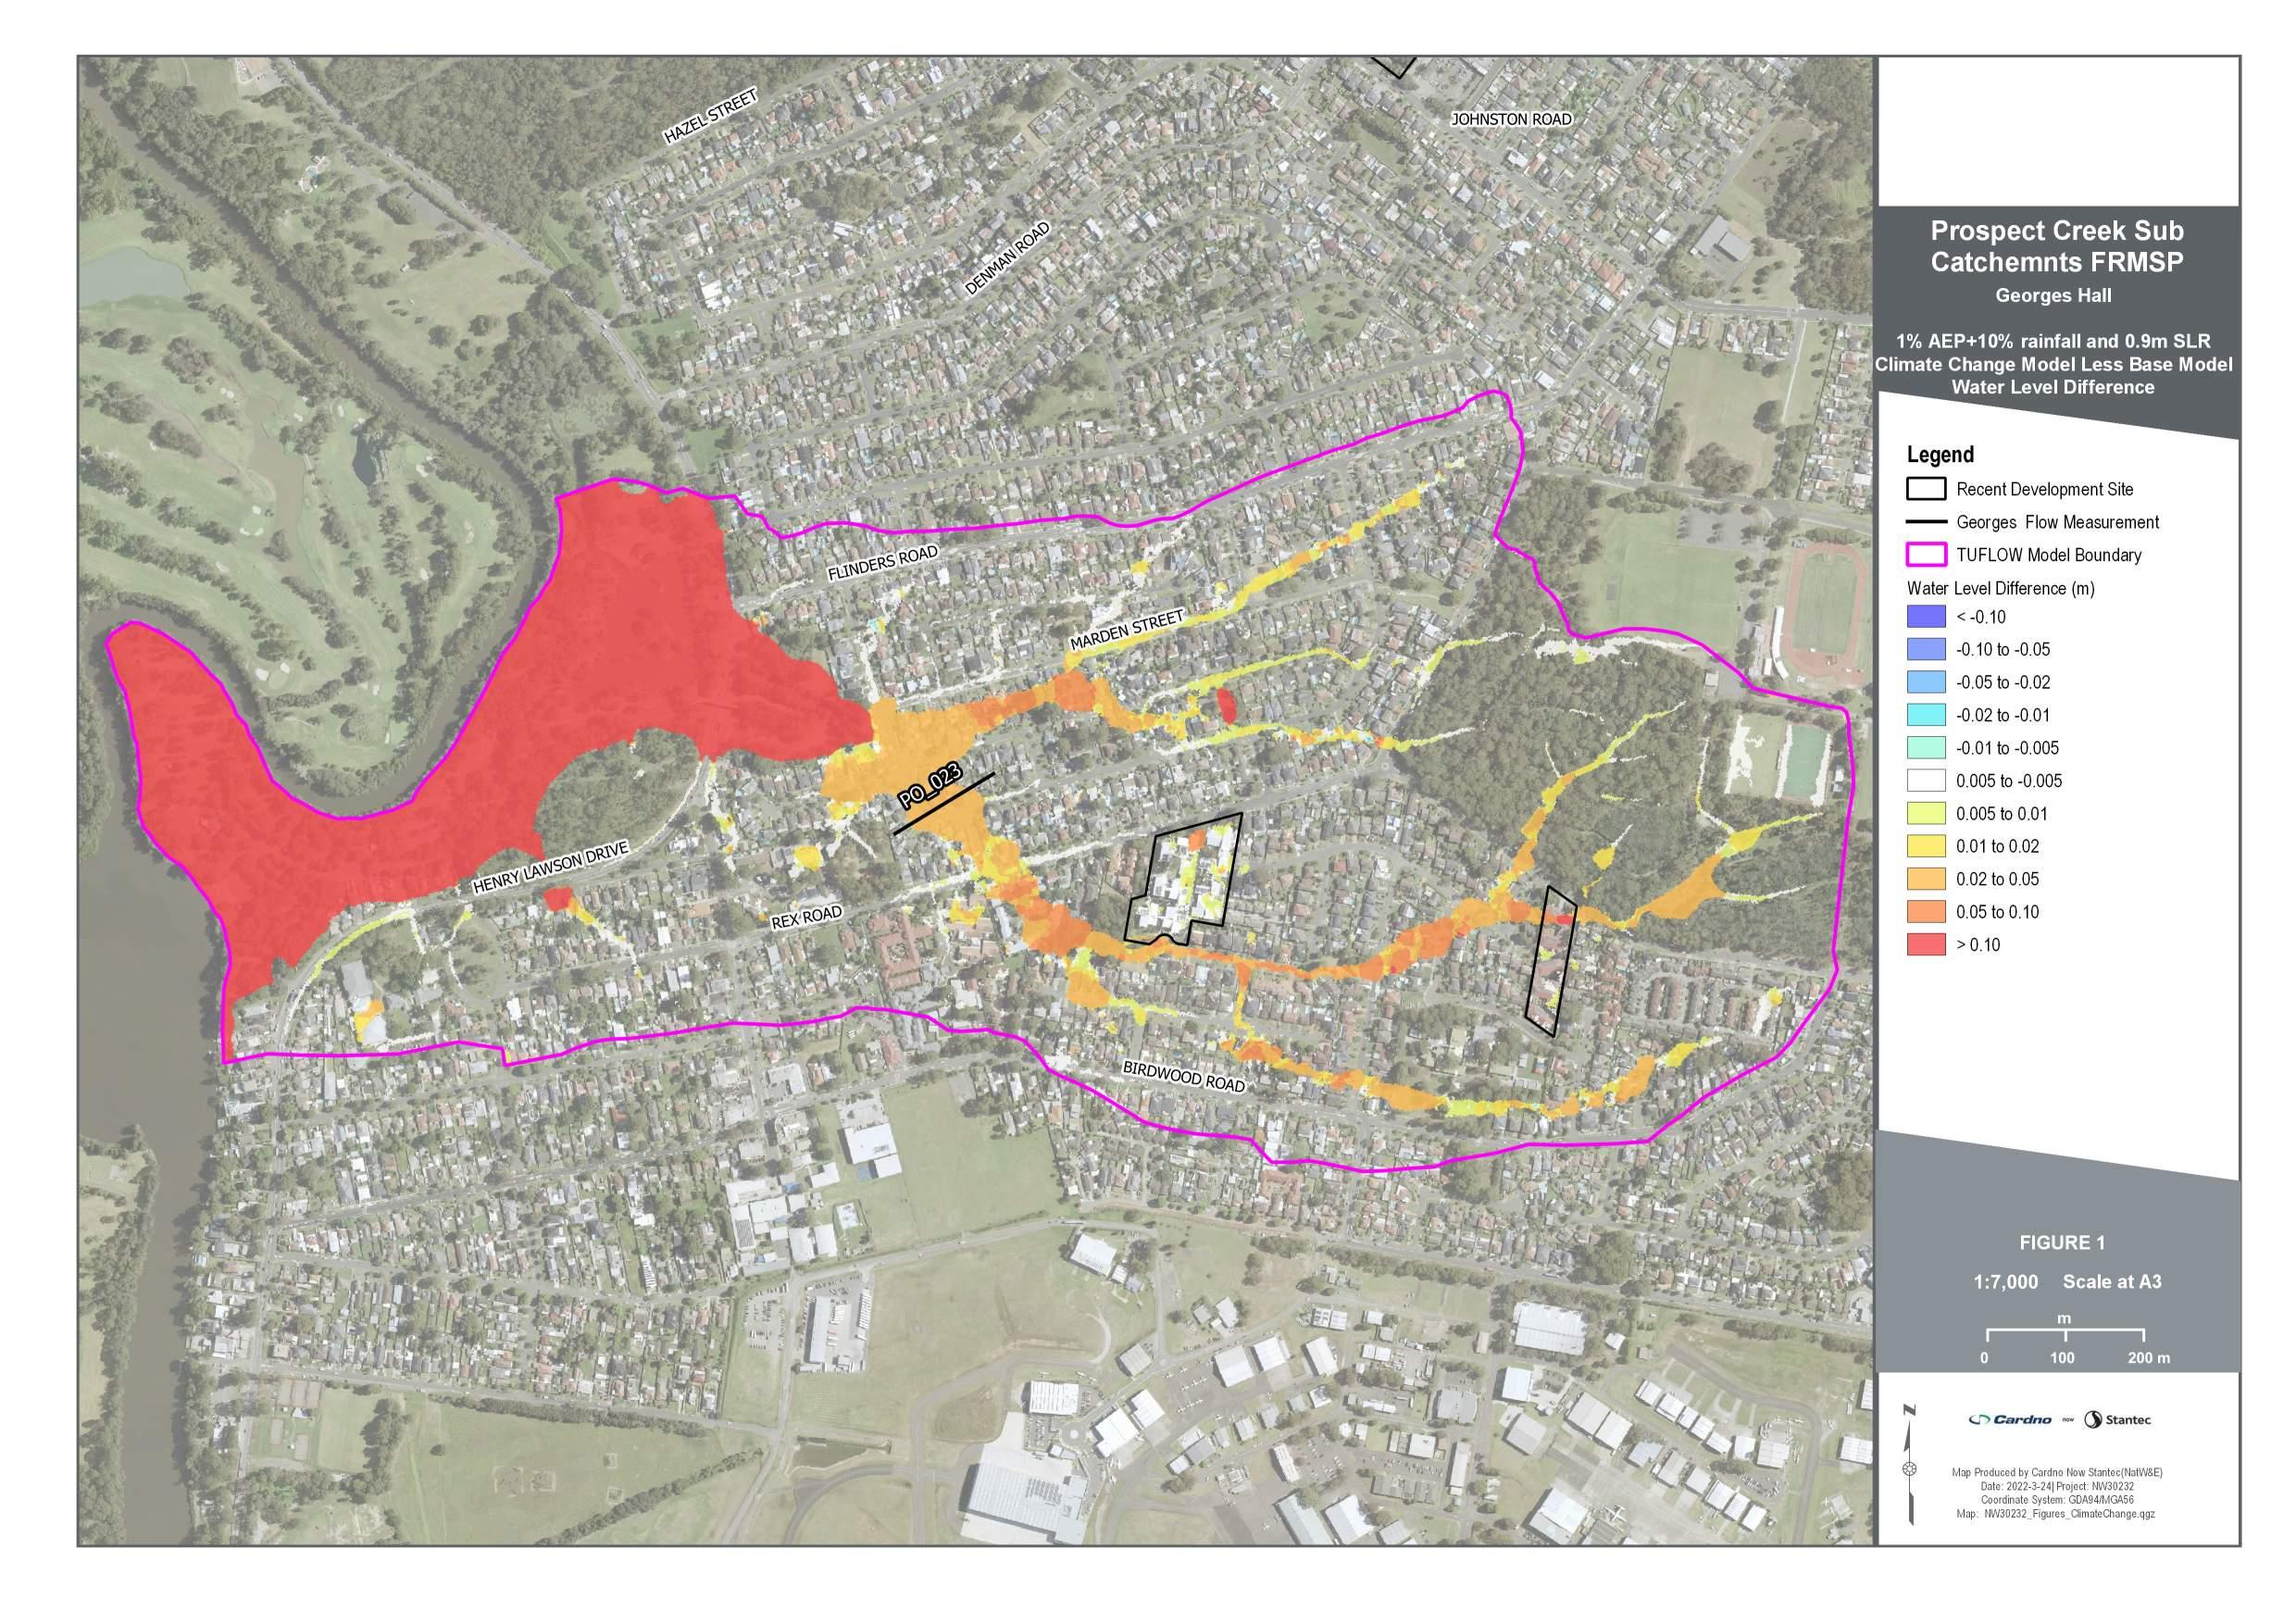

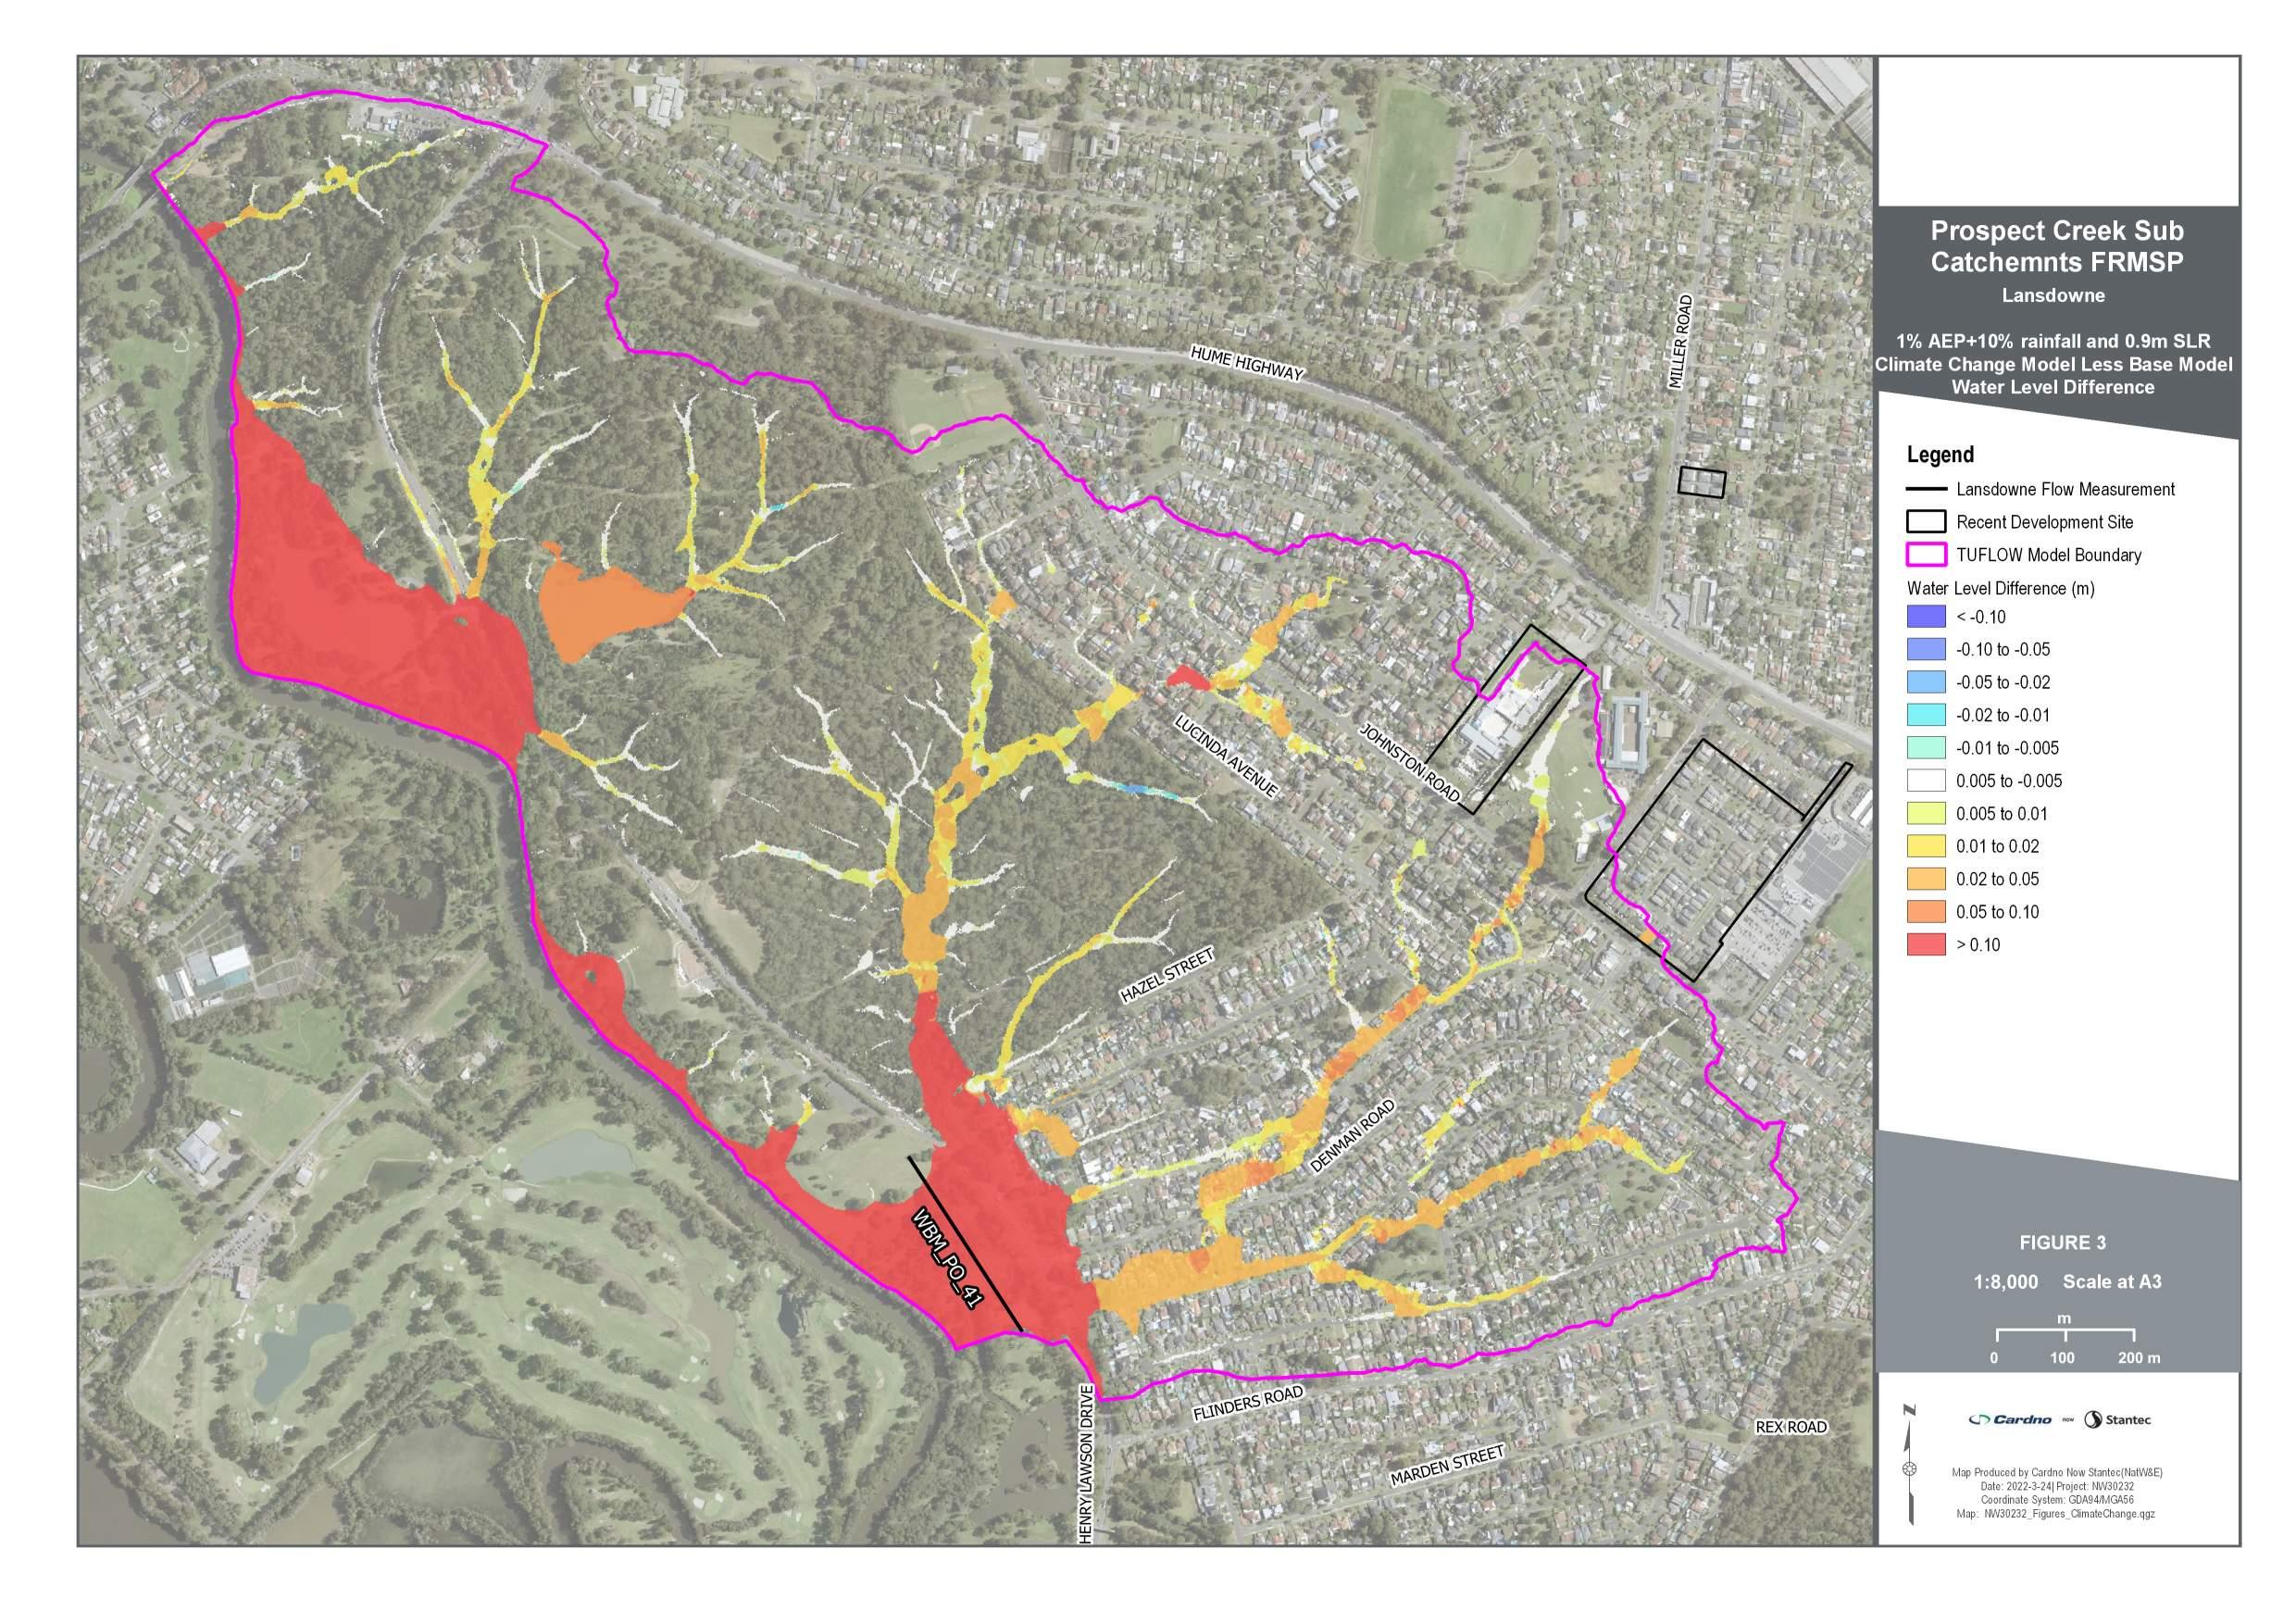
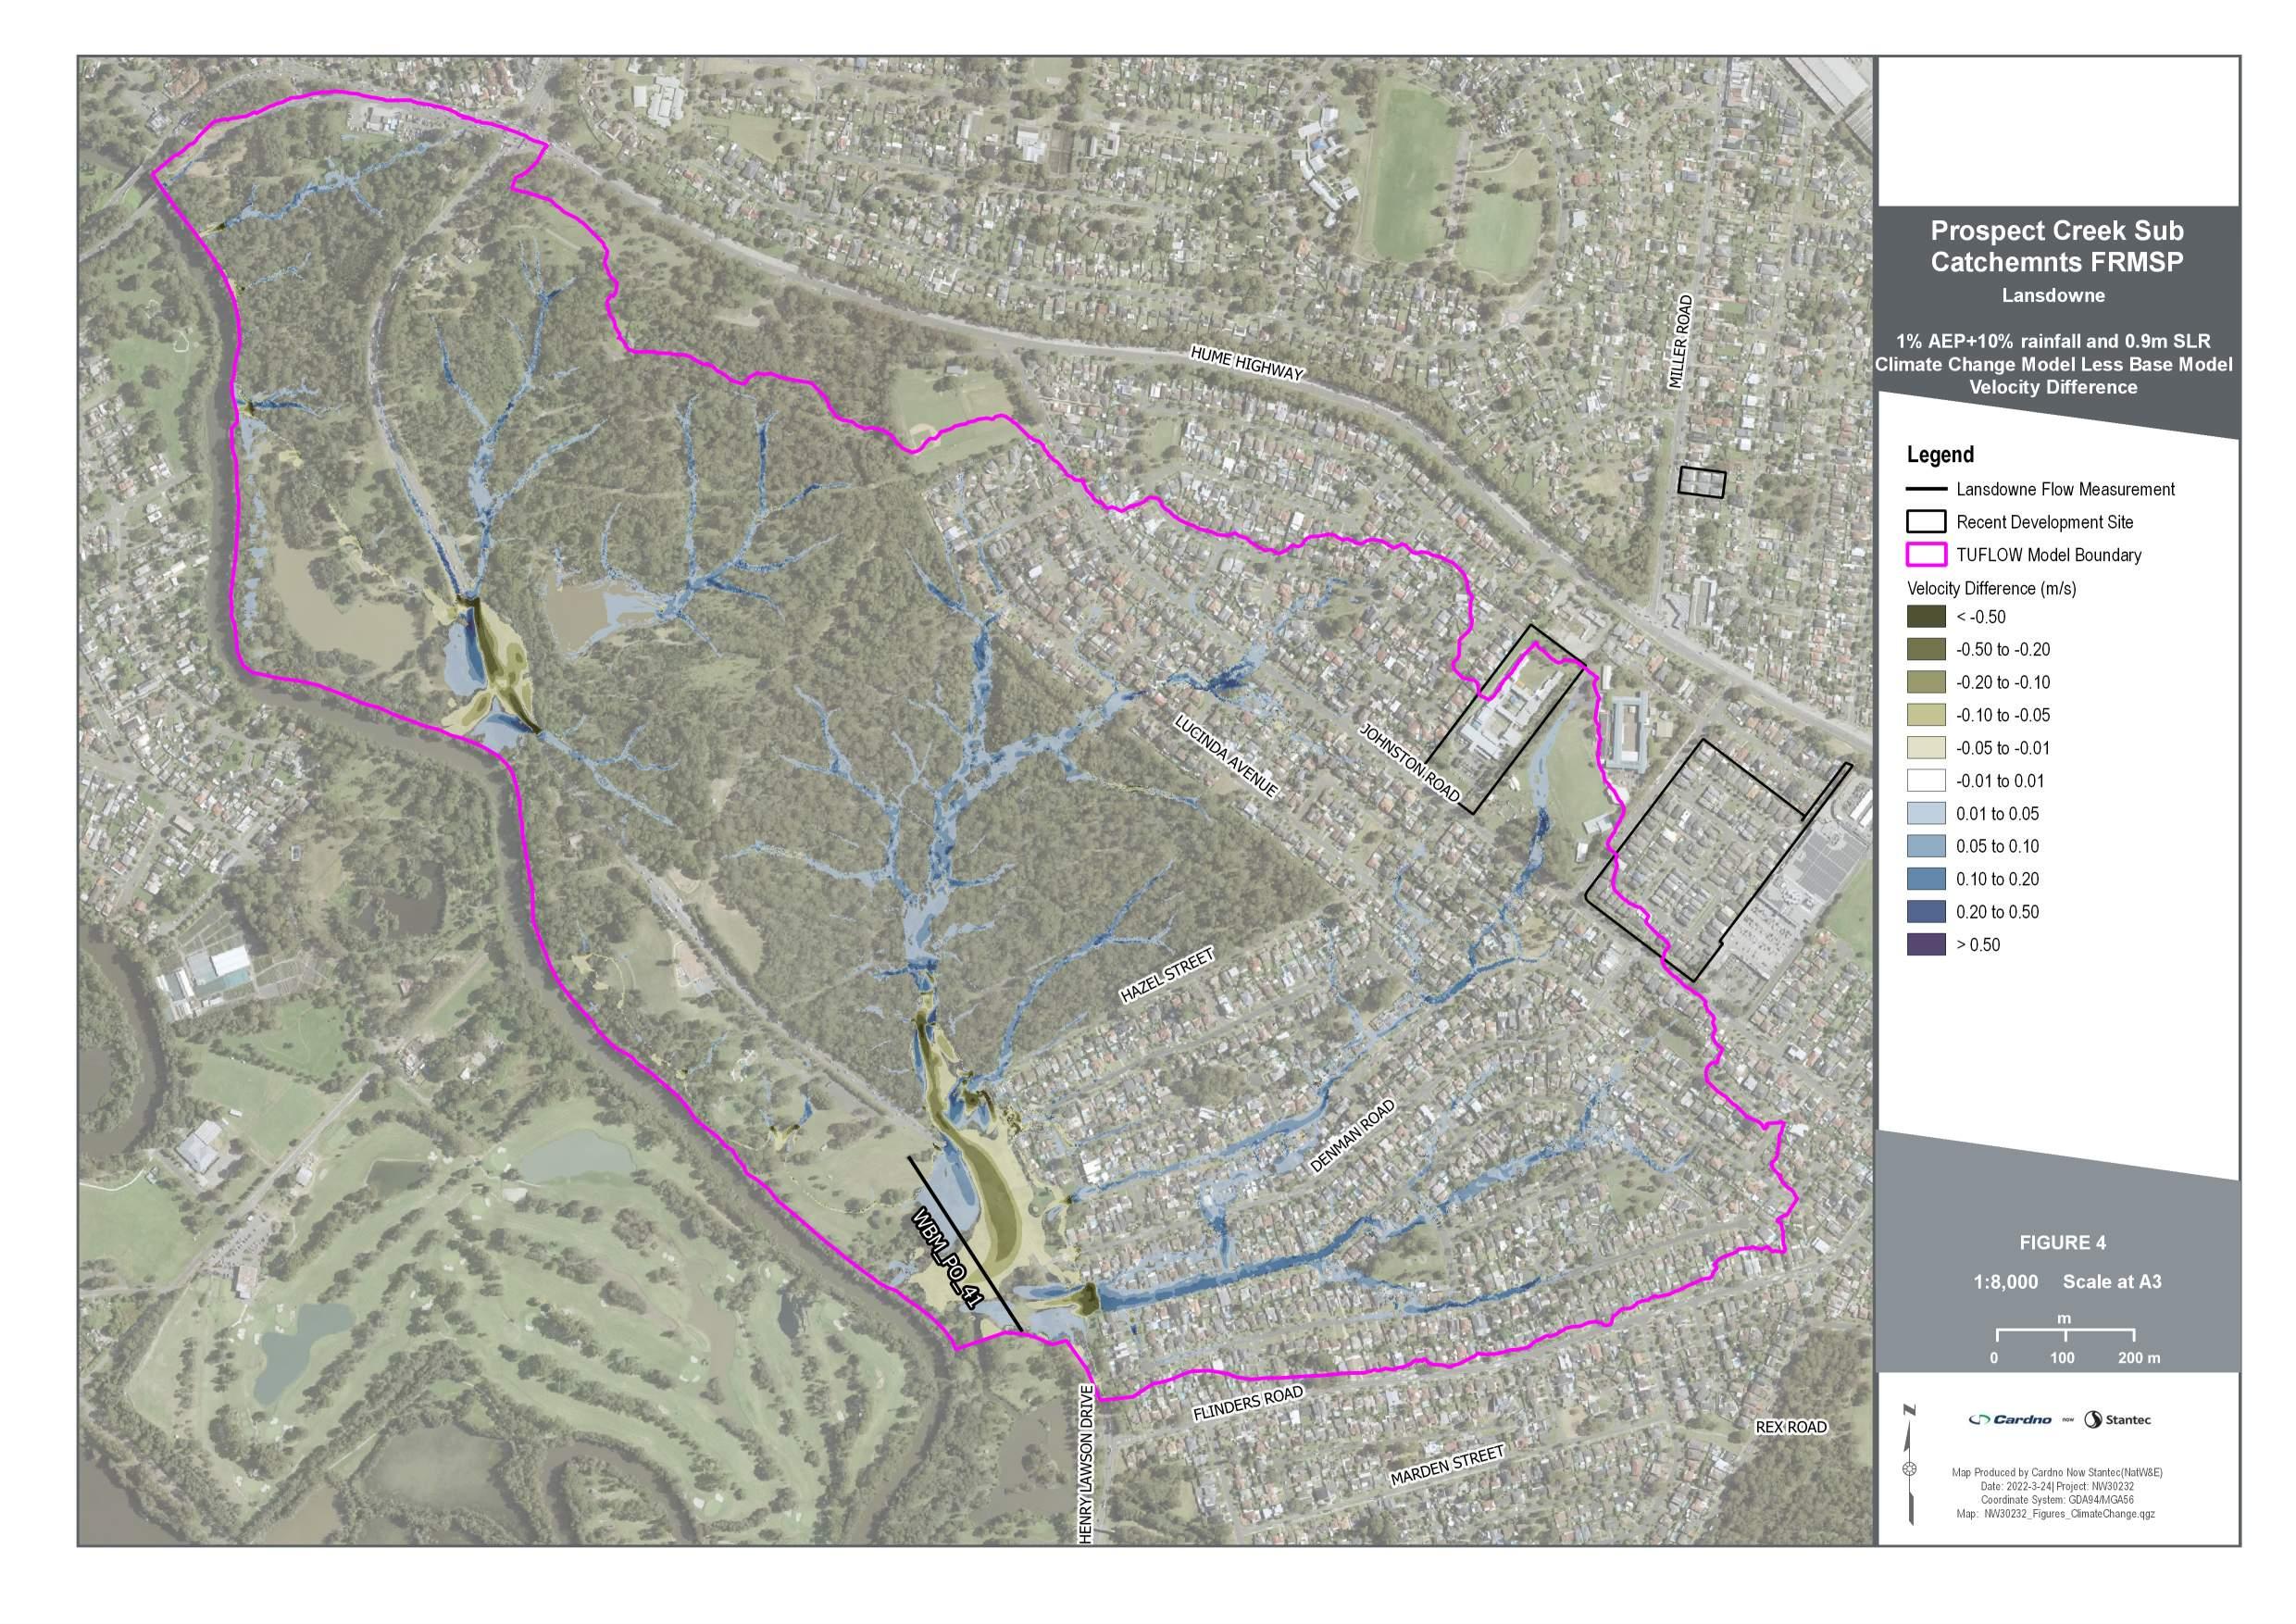
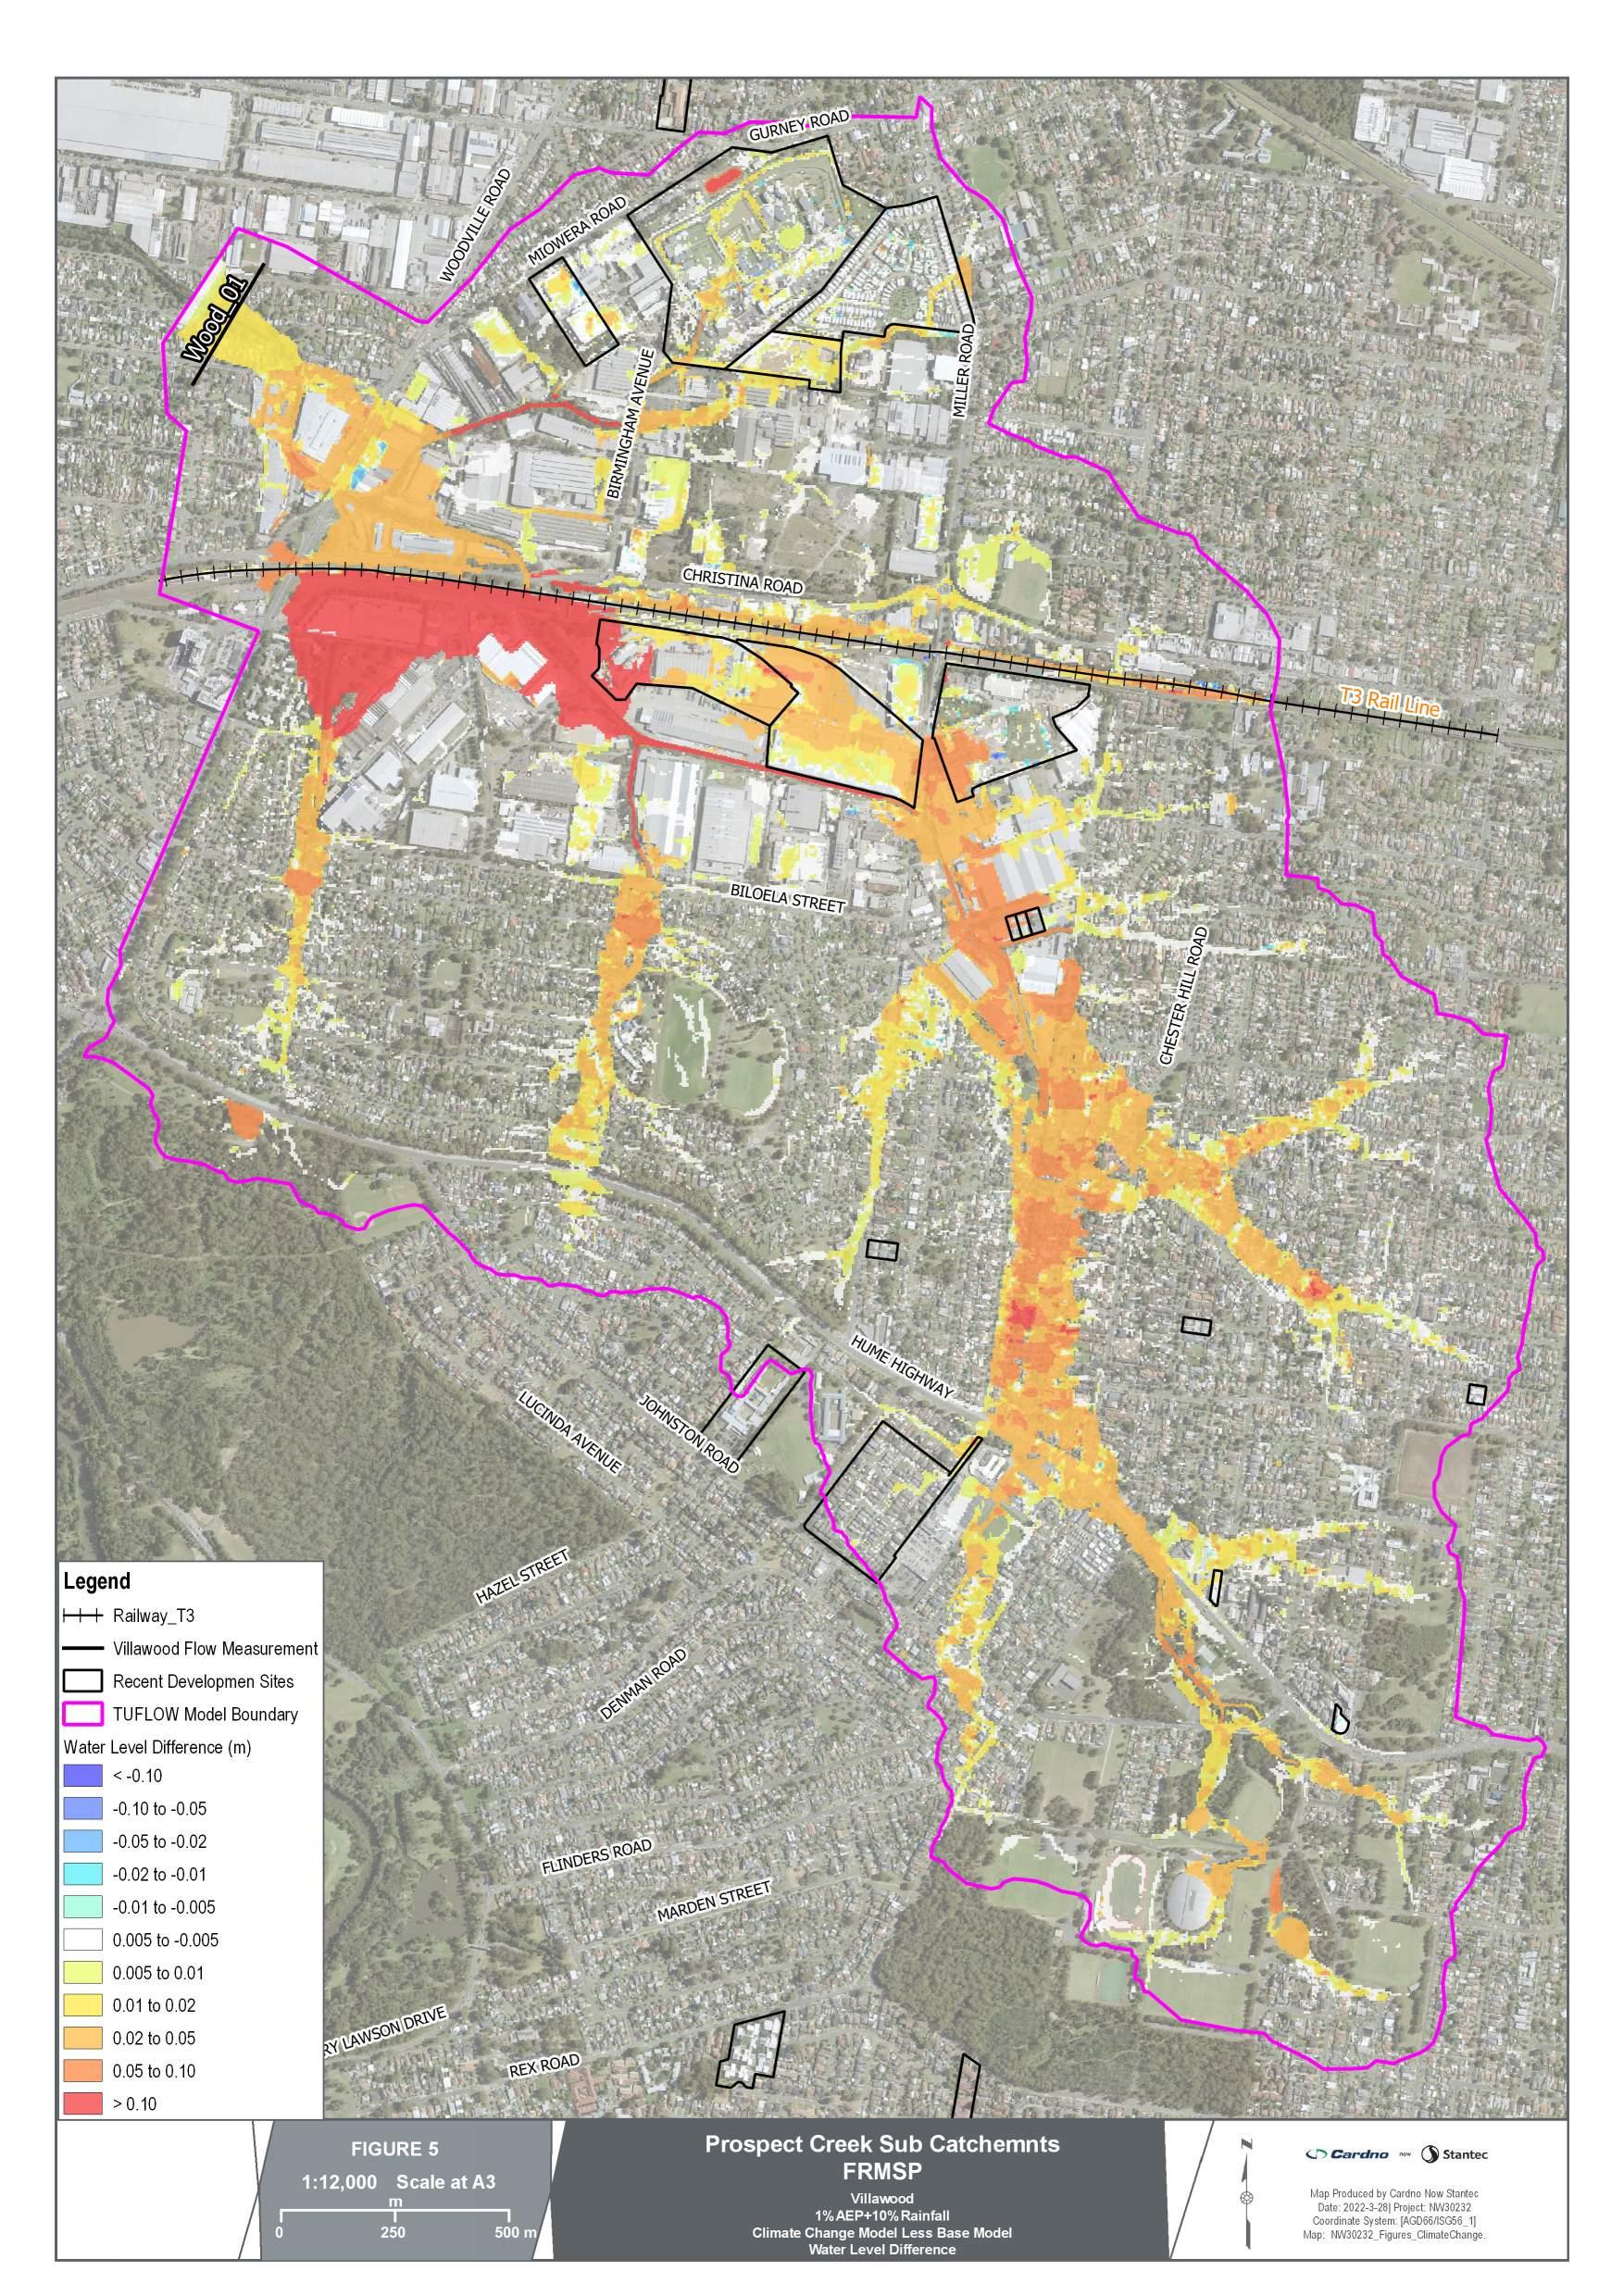

Prospect
Creek Sub-Catchments

APPENDIX

EMERGENCY MANAGEMENT MAPS
v
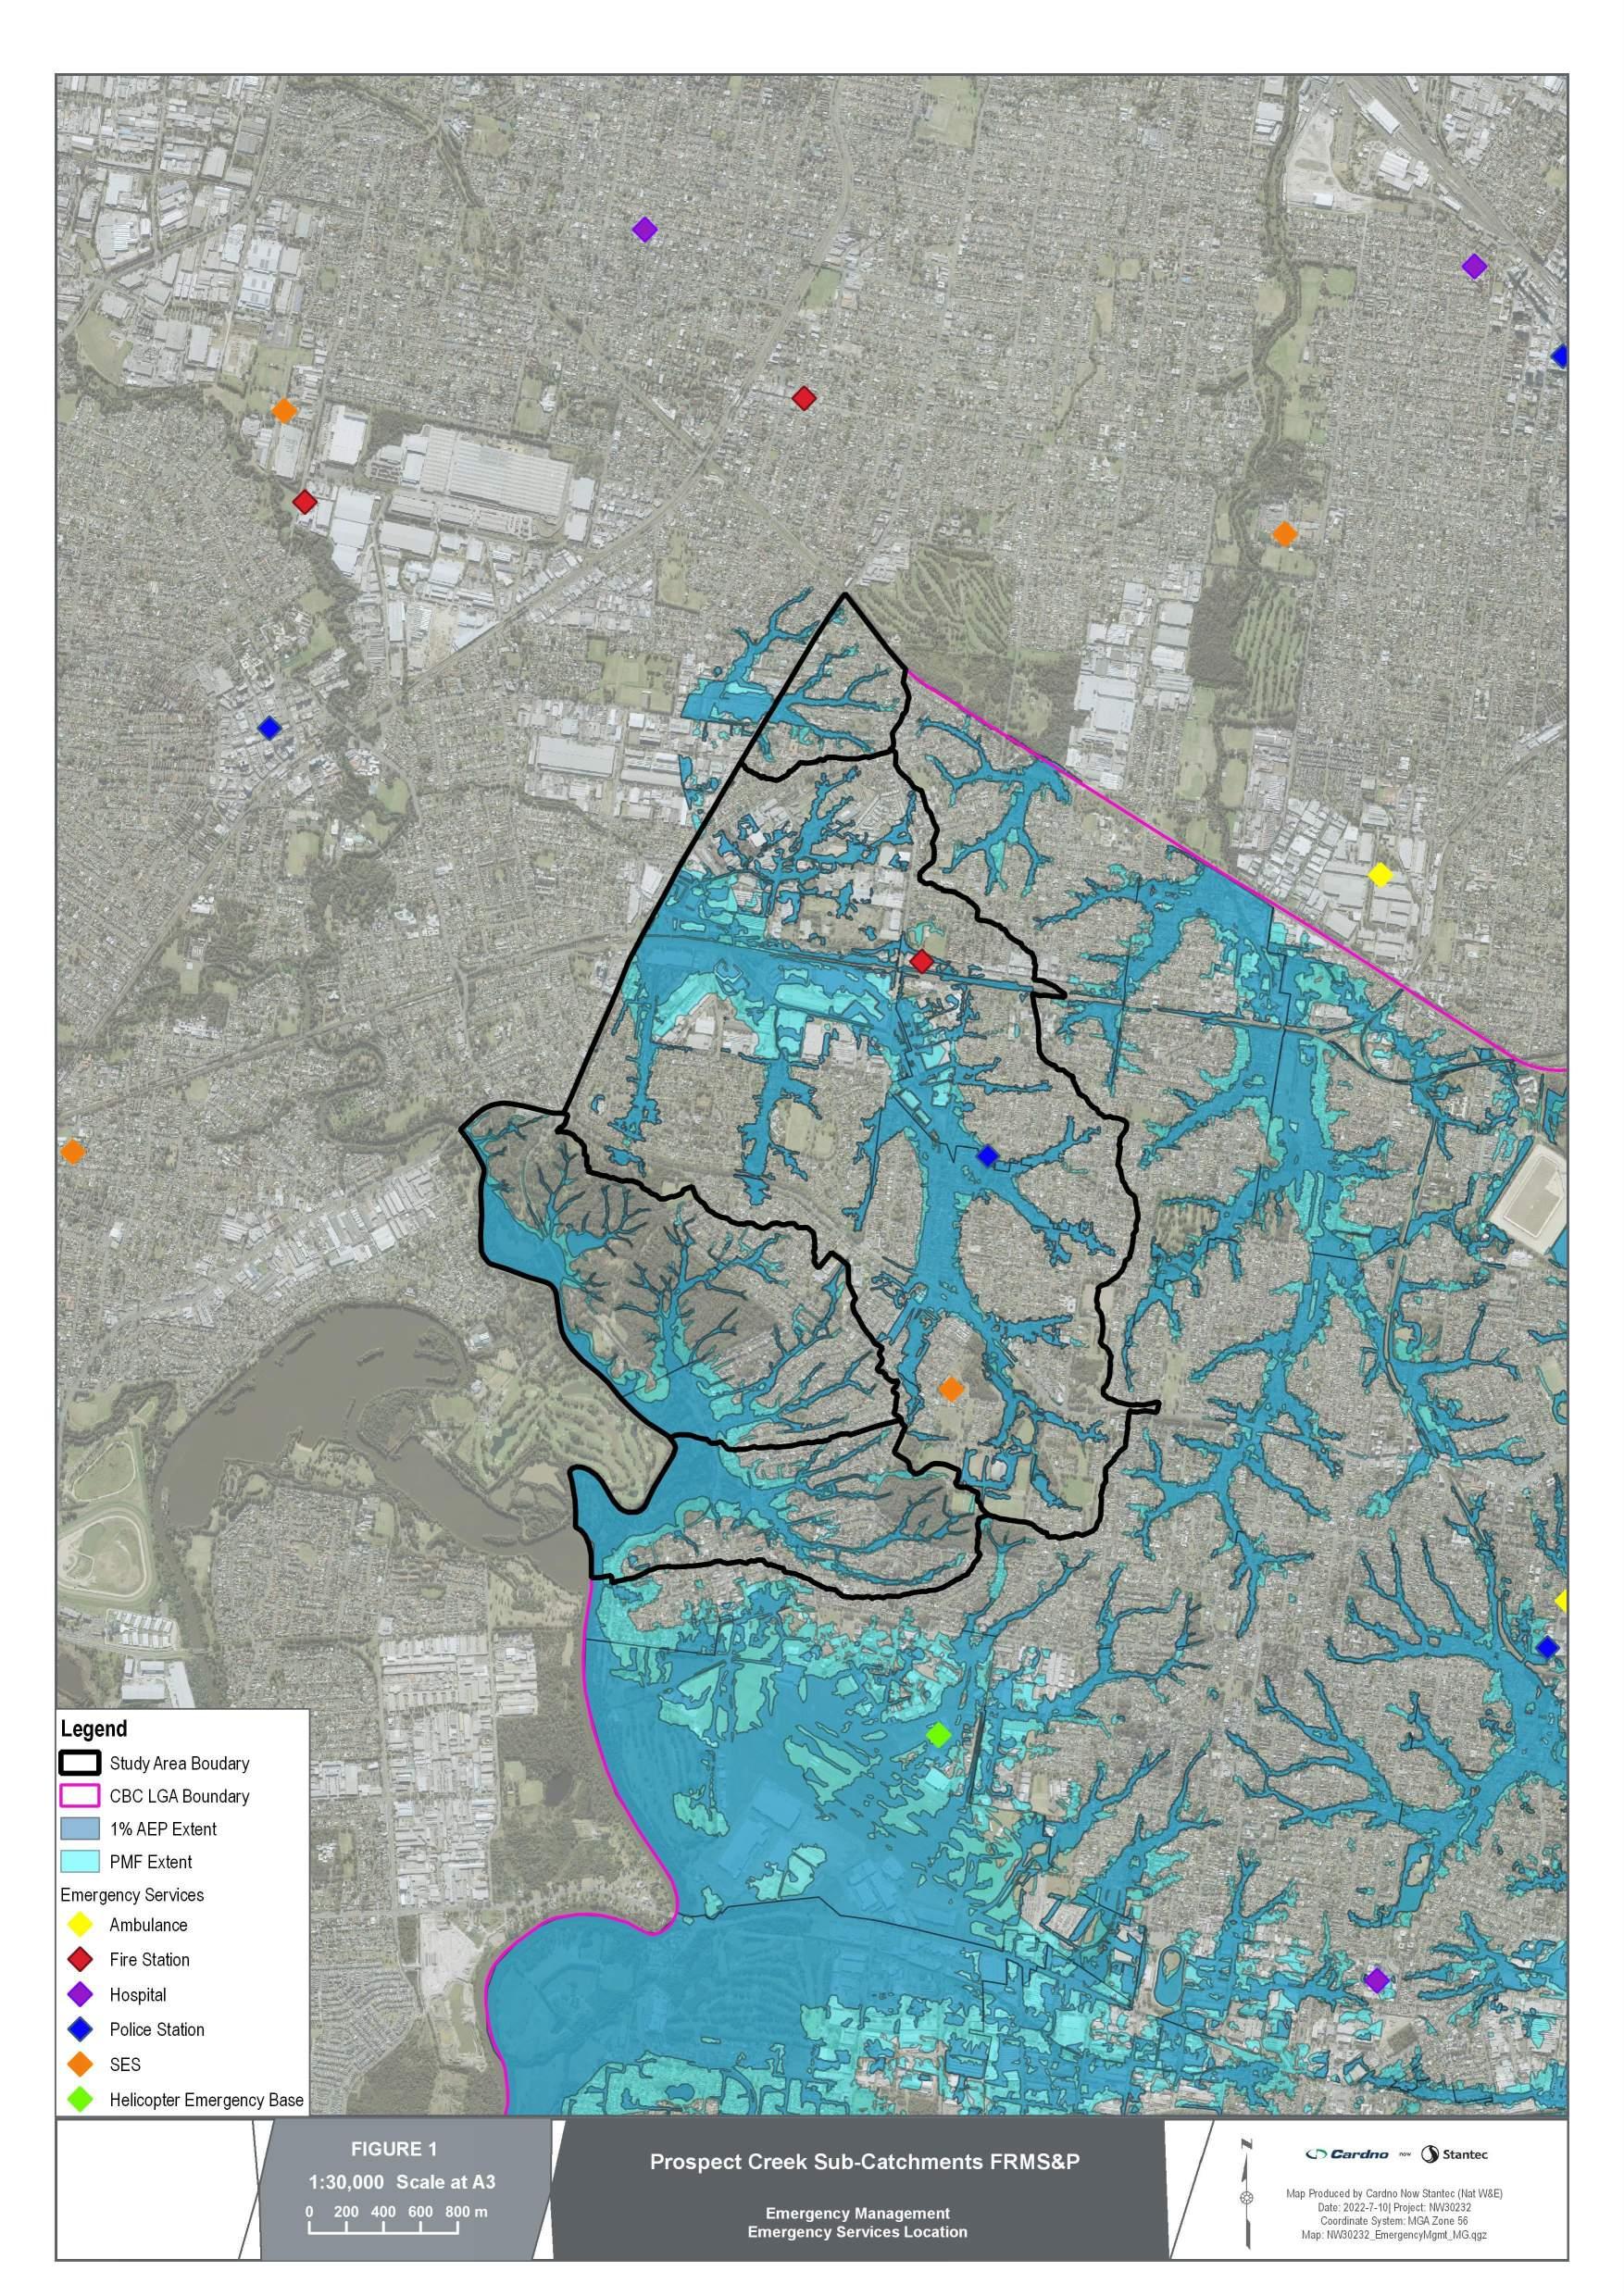

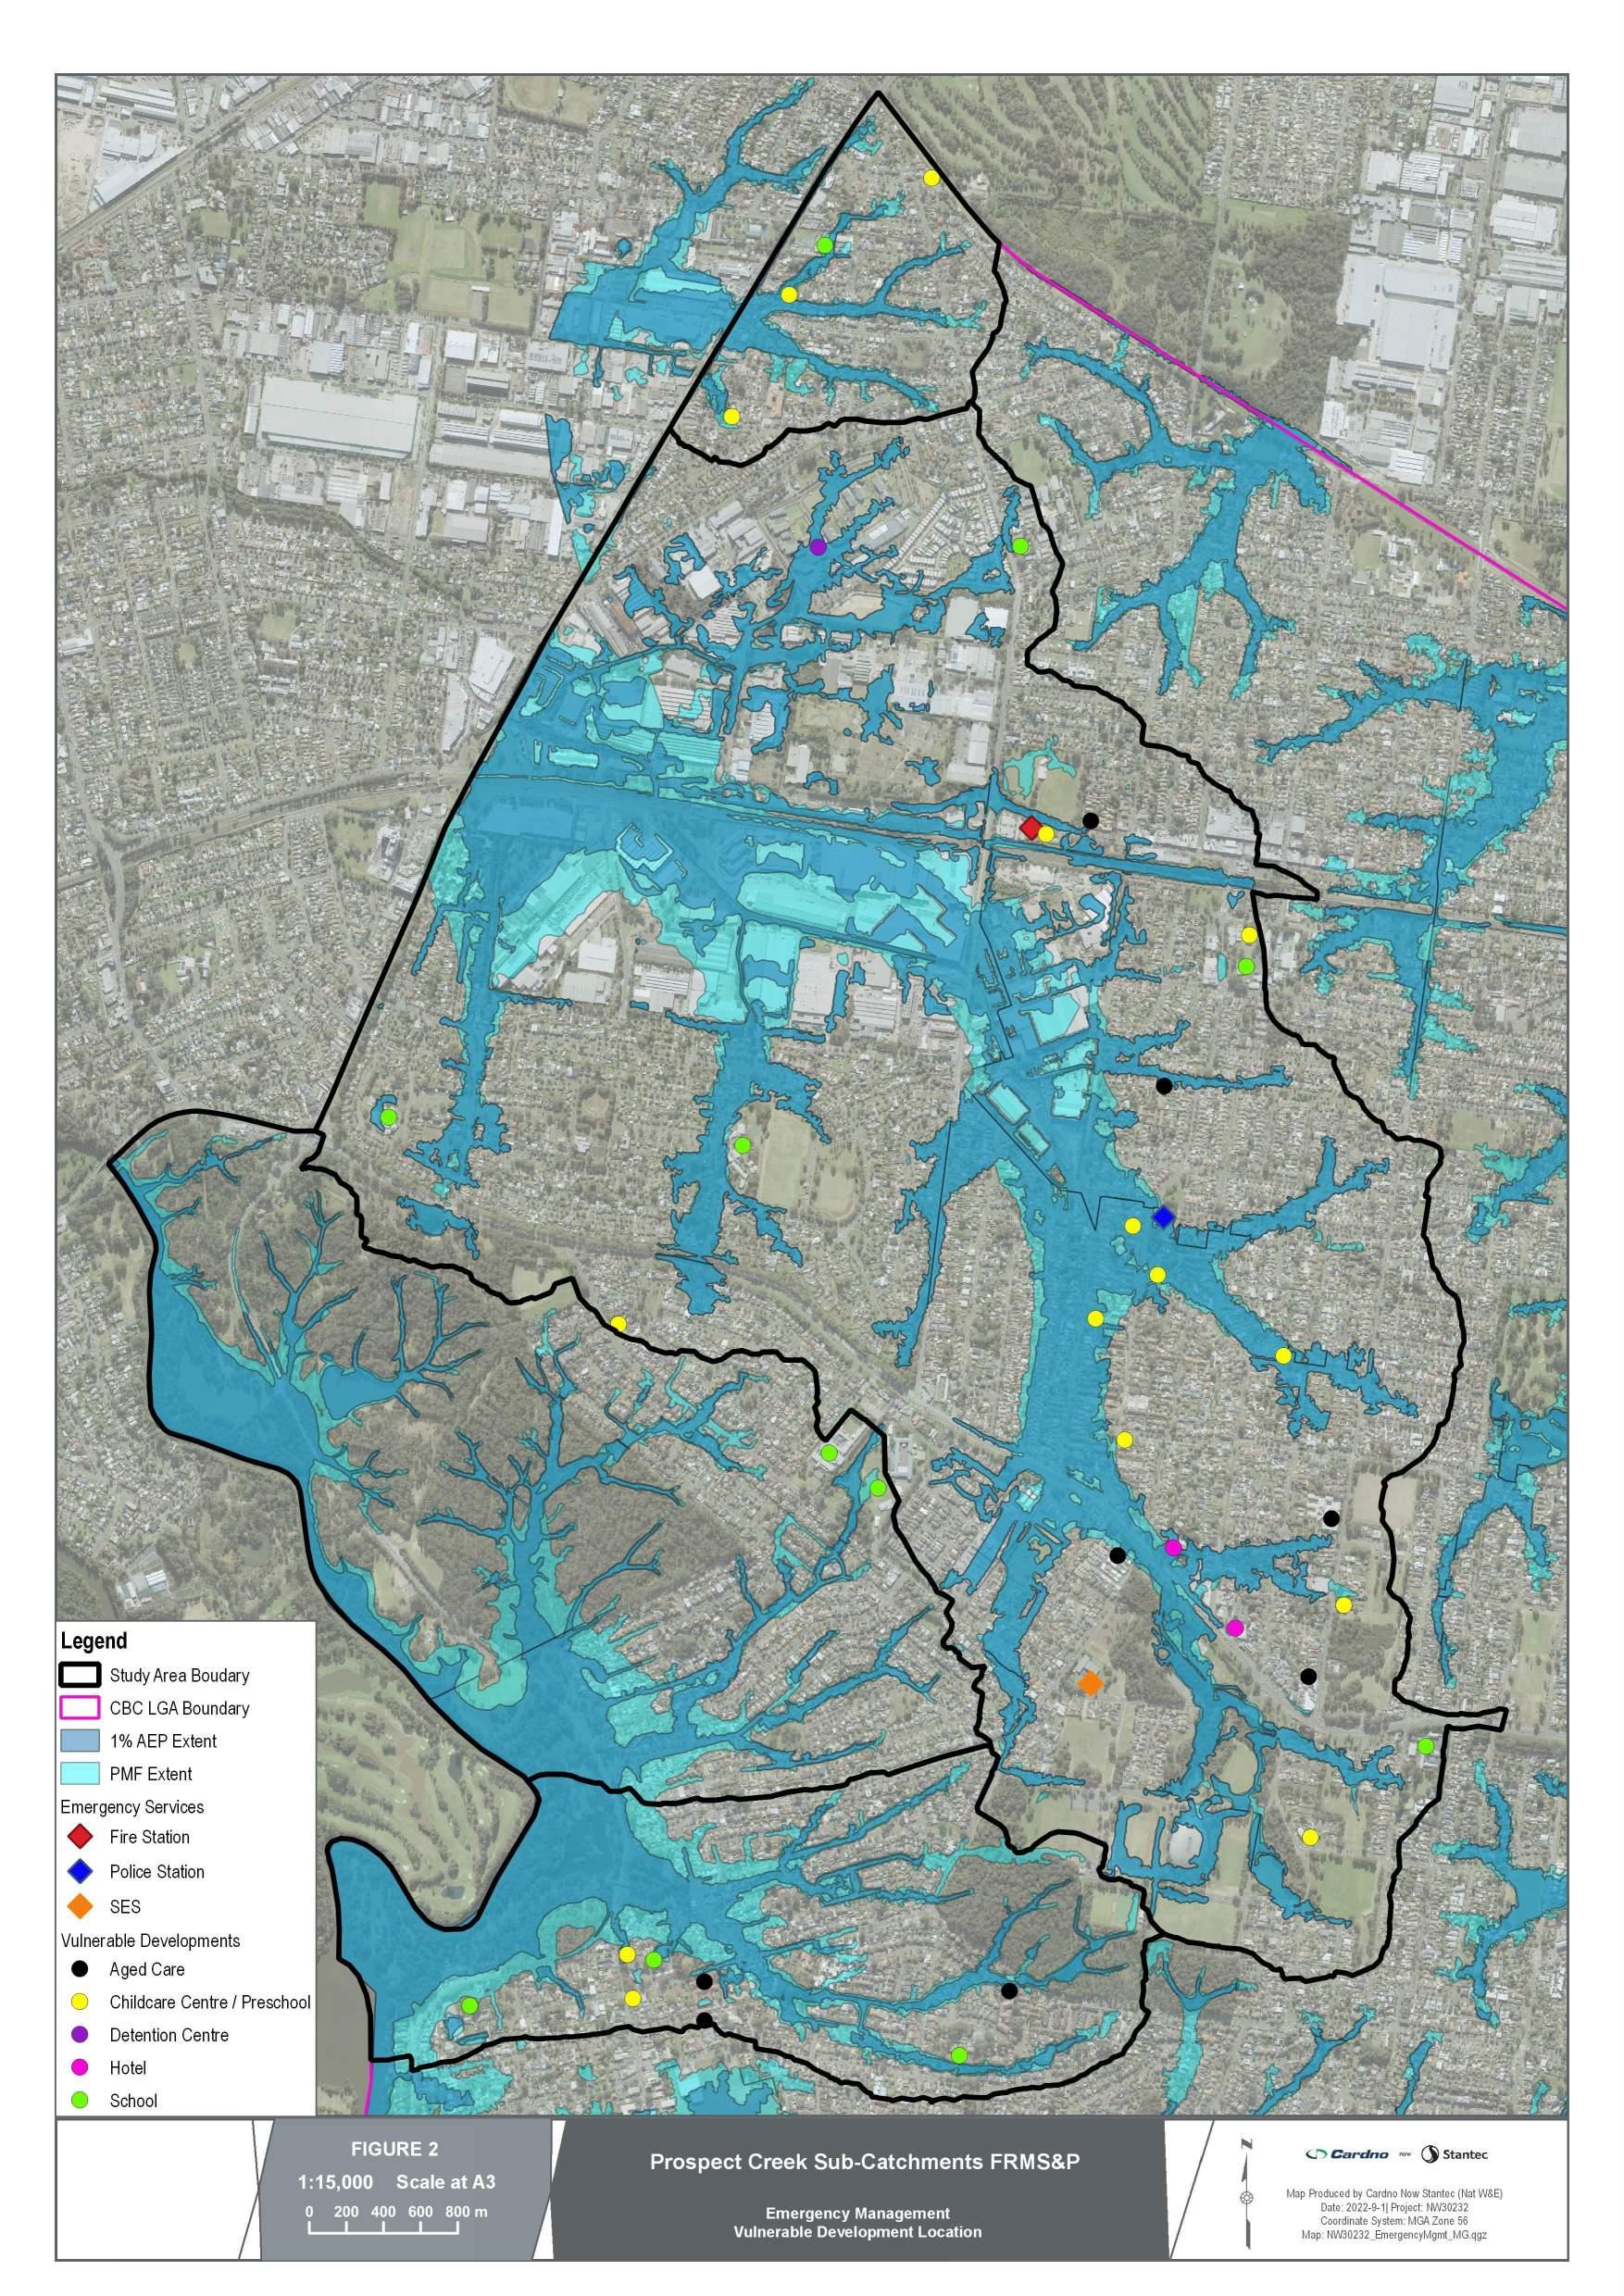

Base prospect creek subcatchments
GEORGESHALL
VILLAWOOD
CBC LGABoundary region
Emergency Hotspots
OverfloorFloodingDepth(m)
Lessthan0
0to02
02to04
04to06
06to08
08to1
Greaterthan1m
HazardCategory
H1-Generallysafeforvehicles, peopleandbuildings
H2-Unsafeforsmallvehicles
H3-Unsafeforvehicles
childrenandtheelderly
H4-Unsafeforvehiclesandpeople
H5-Unsafeforvehiclesandpeople
Allbuildingsvulnerabletostructural damage Somelessrobustbuildings subjecttofailure
H6-Unsafeforvehiclesandpeople
Allbuildingtypesconsidered vulnerabletofailure
GeorgeRiverFloodExtent


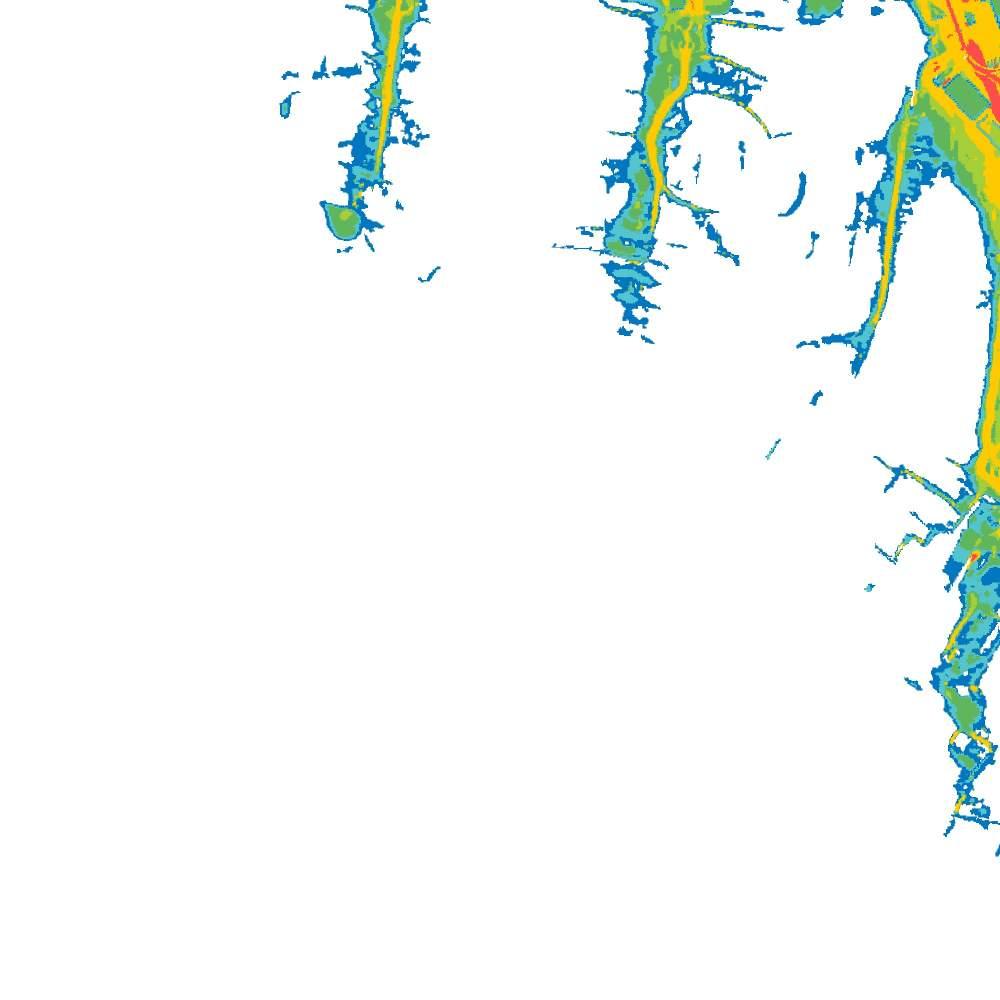


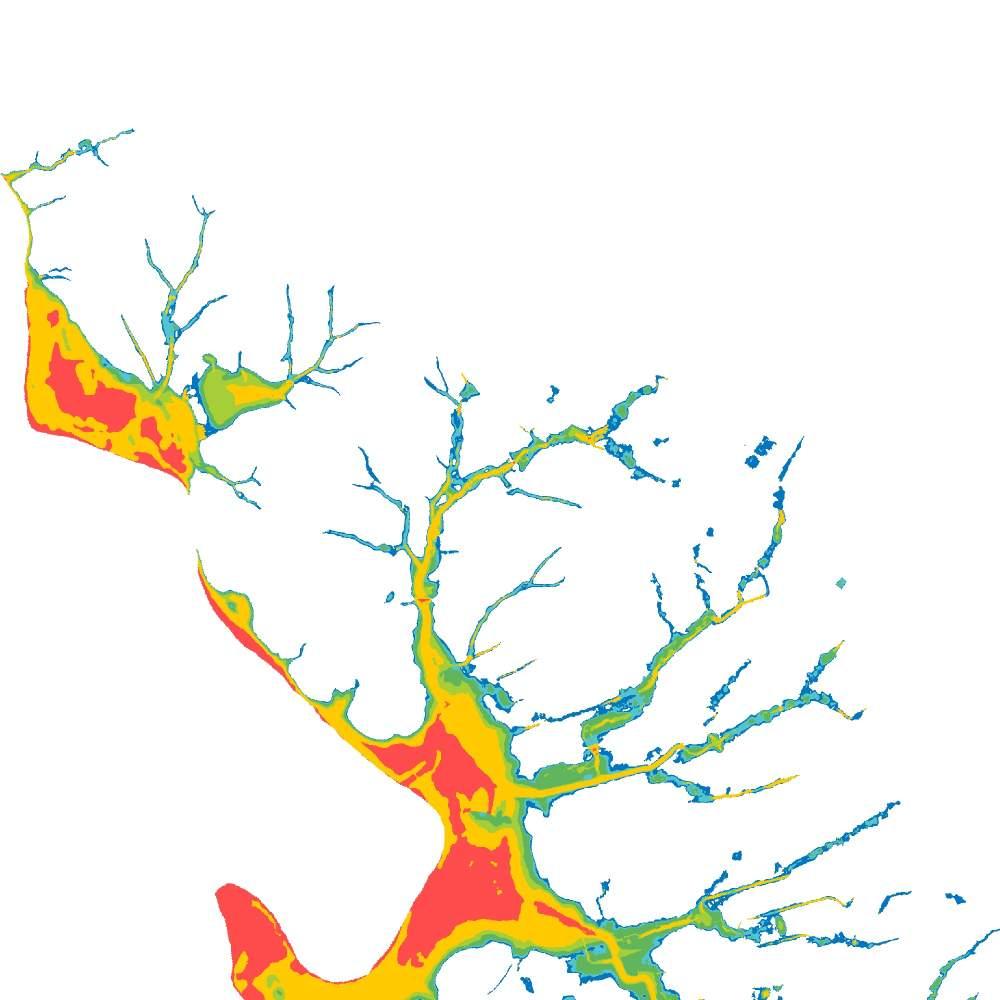




ProspectCreekSub-CatchmentsFRMS&P ScaleatA3 EmergencyManagement EmergencyManagementHotspotOverview PMF MapProducedbySantec(NatW&E Date 2023-8-16|Proect:NW30232 CoordnateSysem:MGAZone56 Map:NW30232 EmergencyMgmt MG v2qgz
FIGURE3
LANSDOWNE MILLERROAD
Legend

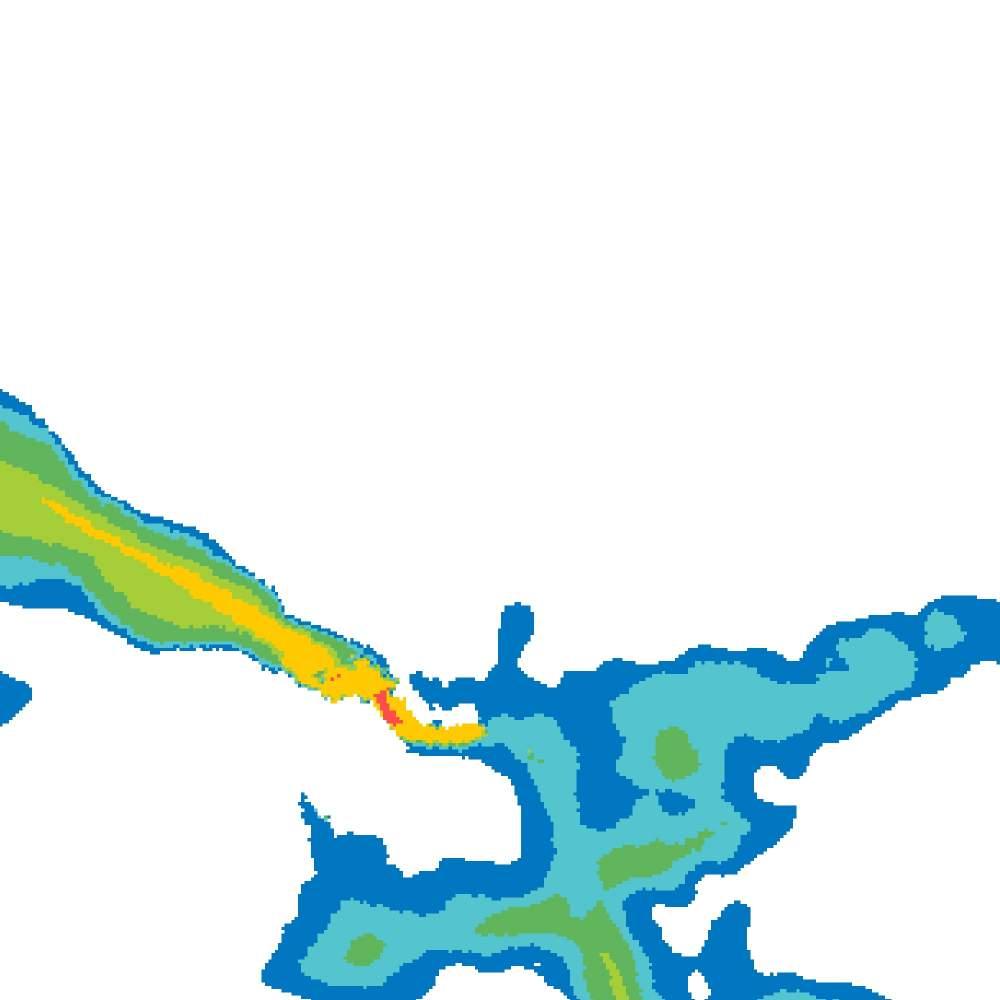
Legend
OverfloorFloodingDepth(m)
Lessthan0
0to02
02to04
HazardCategory
H1-Generallysafeforvehicles, peopleandbuildings
H2-Unsafeforsmallvehicles
H3-Unsafeforvehicles
childrenandtheelderly
H4-Unsafeforvehiclesandpeople
H5-Unsafeforvehiclesandpeople

Allbuildingsvulnerabletostructural damage Somelessrobustbuildings subjecttofailure
H6-Unsafeforvehiclesandpeople
Allbuildingtypesconsidered vulnerabletofailure
FERCCMapping
GeorgesRiverLowFloodIsland
LowFloodIsland
EvacuationRoutes
Vehicular




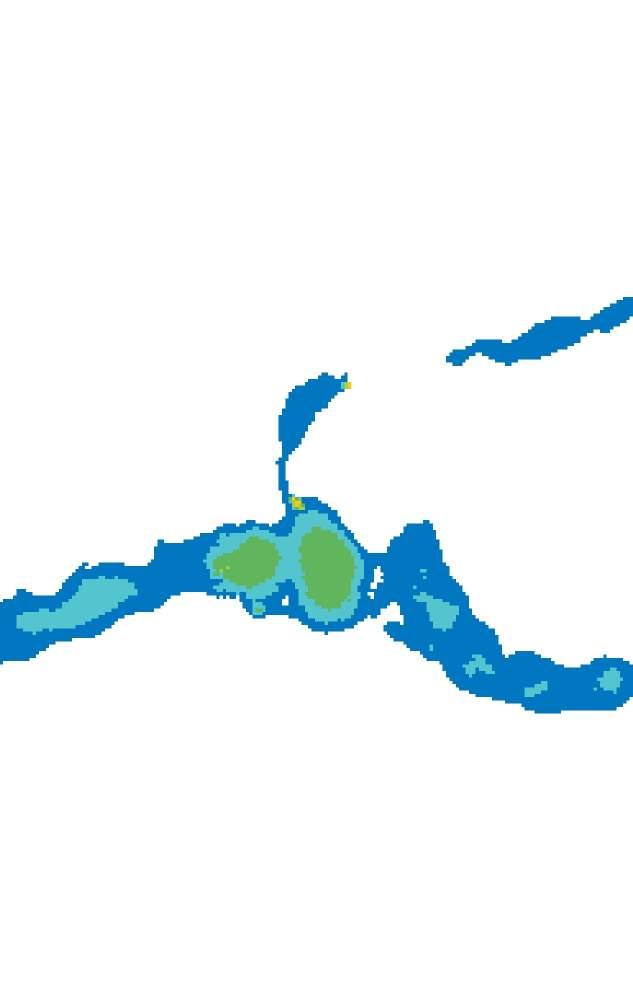


GeorgeRiverFloodExtent


ProspectCreekSub-CatchmentsFRMS&P ScaleatA3 EmergencyManagement EmergencyManagementHotspot1 20%AEP MapProducedbySantec(NatW&E Date 2023-8-16|Proect:NW30232 CoordnateSysem:MGAZone56 Map:NW30232 EmergencyMgmt MG v2qgz
FIGURE4


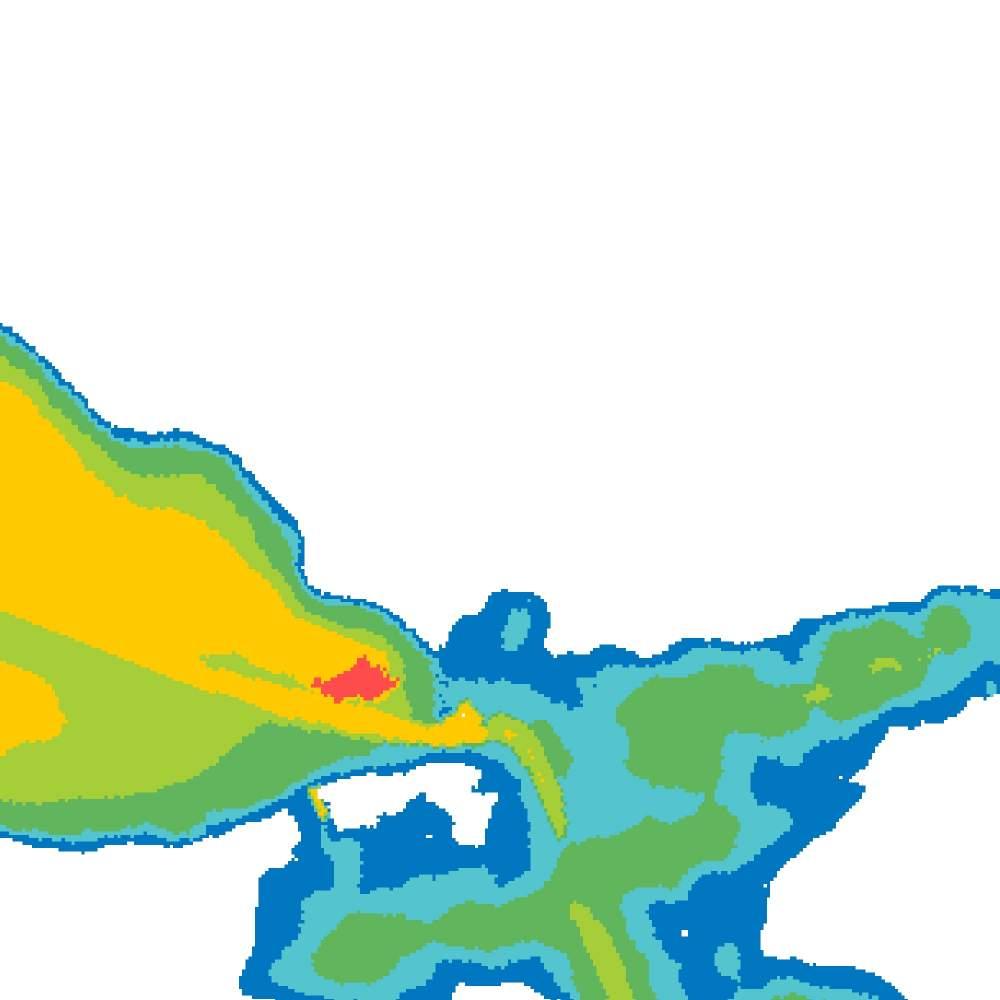
Legend
OverfloorFloodingDepth(m)
Lessthan0
0to02
02to04
04to06
HazardCategory
H1-Generallysafeforvehicles, peopleandbuildings
H2-Unsafeforsmallvehicles
H3-Unsafeforvehicles childrenandtheelderly
H4-Unsafeforvehiclesandpeople
H5-Unsafeforvehiclesandpeople


Allbuildingsvulnerabletostructural damage Somelessrobustbuildings subjecttofailure
H6-Unsafeforvehiclesandpeople
Allbuildingtypesconsidered vulnerabletofailure
FERCCMapping
GeorgesRiverLowFloodIsland LowFloodIsland EvacuationRoutes


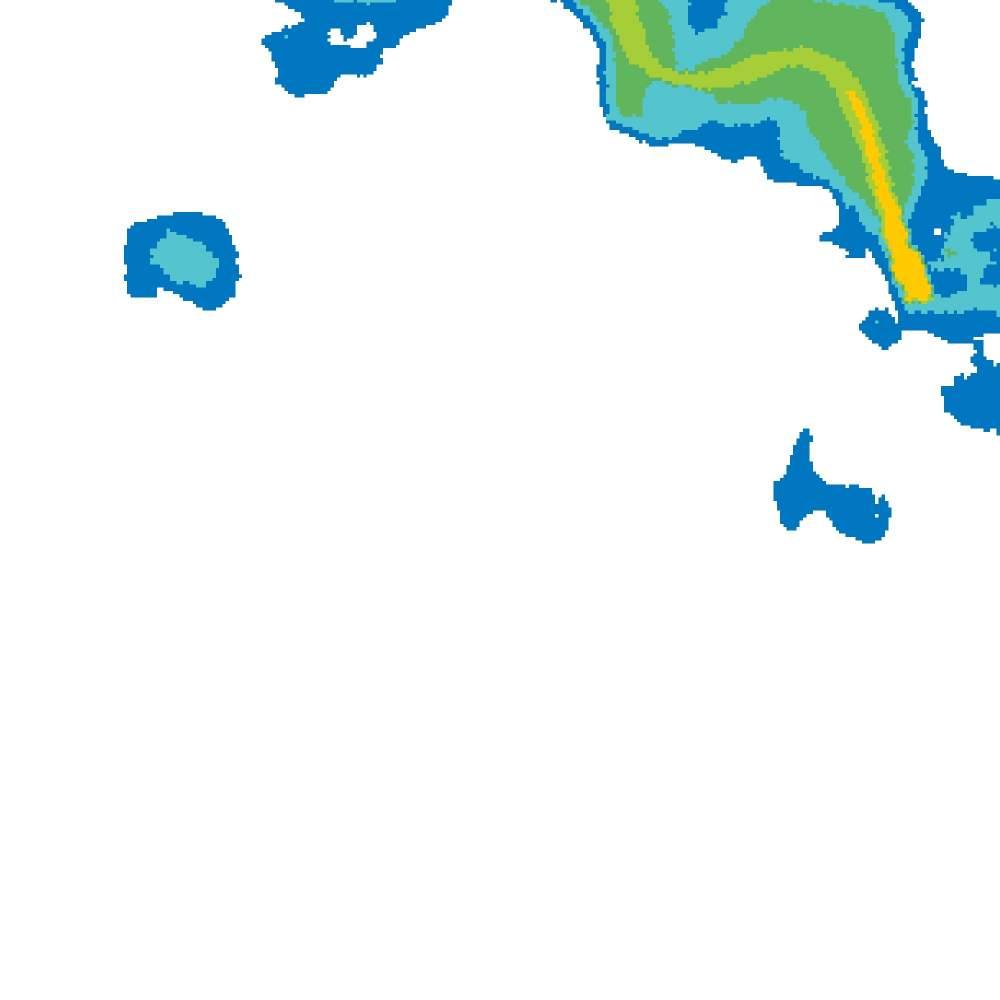
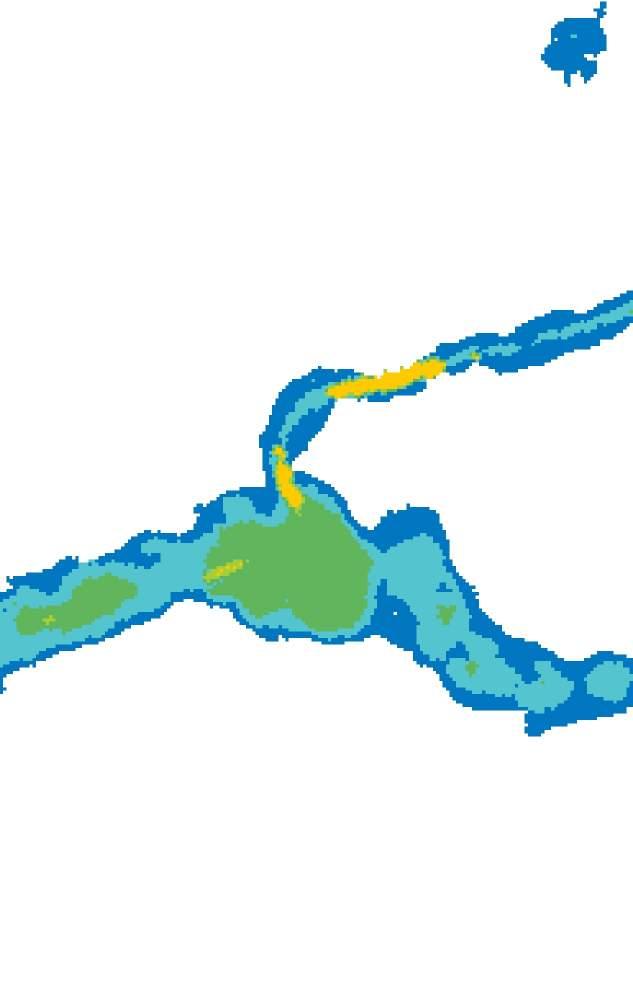


Vehicular GeorgeRiverFloodExtent


ProspectCreekSub-CatchmentsFRMS&P ScaleatA3 EmergencyManagement EmergencyManagementHotspot1 1%AEP MapProducedbySantec(NatW&E Date 2023-8-16|Proect:NW30232 CoordnateSysem:MGAZone56 Map:NW30232 EmergencyMgmt MG v2qgz
FIGURE5


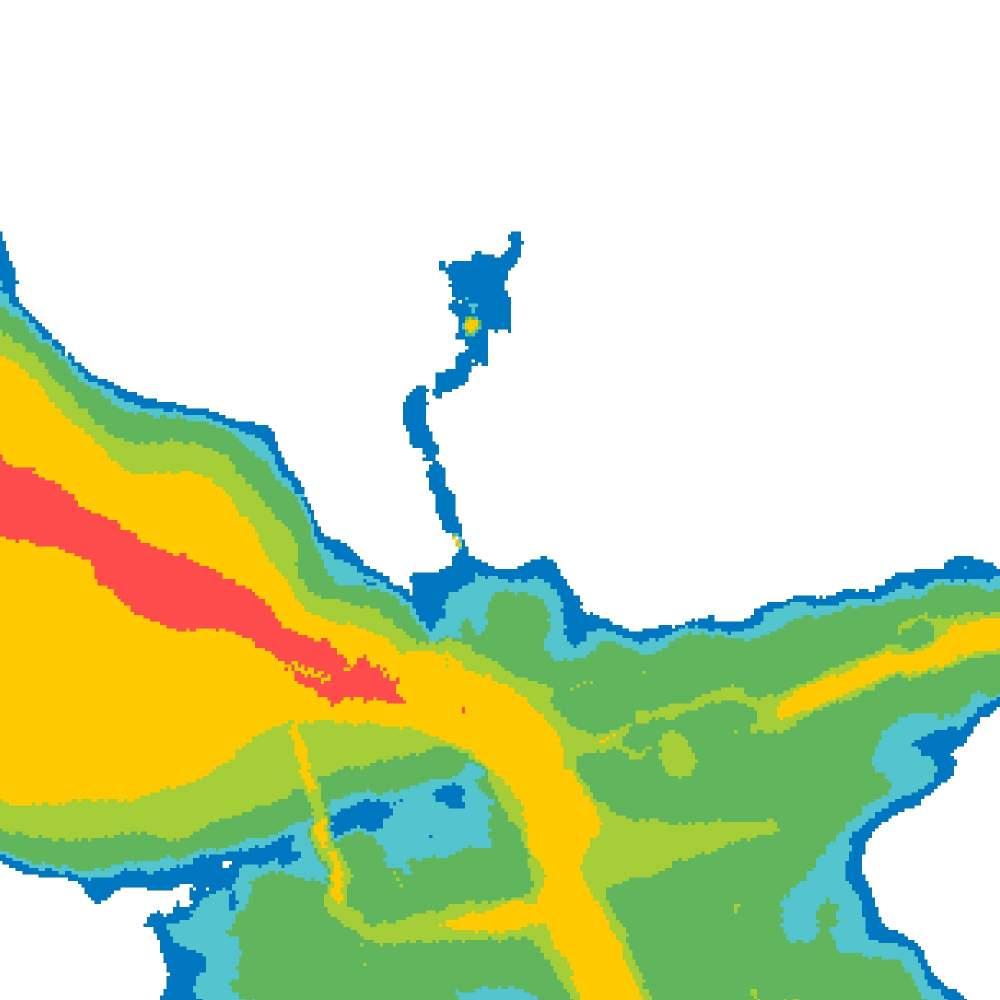
Legend
OverfloorFloodingDepth(m)
Lessthan0
0to02
02to04 04to06 06to08
08to1
Greaterthan1m
HazardCategory
H1-Generallysafeforvehicles, peopleandbuildings
H2-Unsafeforsmallvehicles
H3-Unsafeforvehicles childrenandtheelderly
H4-Unsafeforvehiclesandpeople
H5-Unsafeforvehiclesandpeople


Allbuildingsvulnerabletostructural damage Somelessrobustbuildings subjecttofailure
H6-Unsafeforvehiclesandpeople
Allbuildingtypesconsidered vulnerabletofailure
FERCCMapping
GeorgesRiverLowFloodIsland
LowFloodIsland
EvacuationRoutes
Vehicular


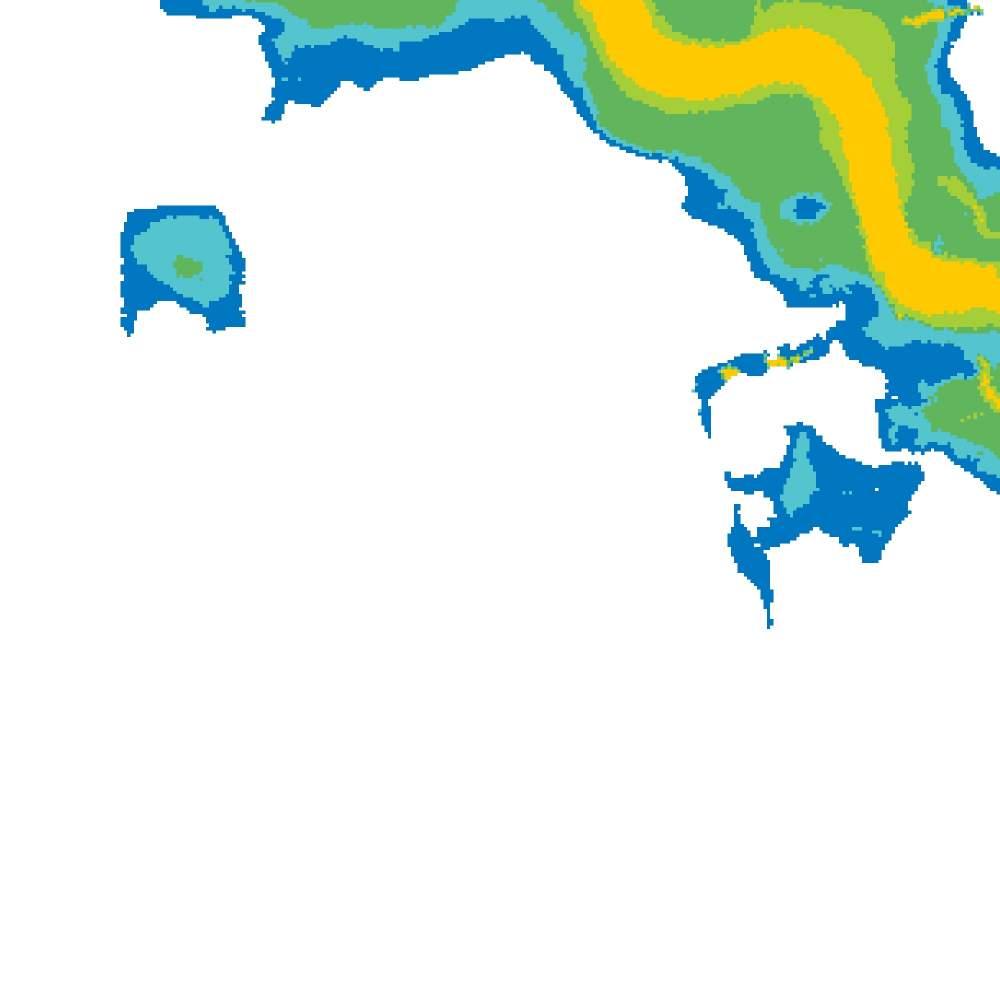
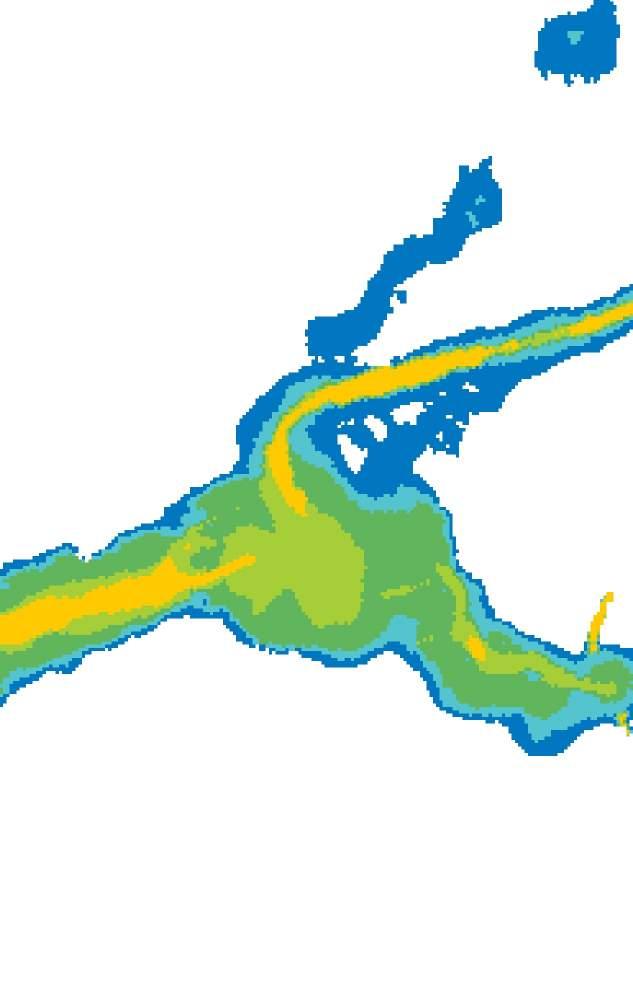


GeorgeRiverFloodExtent


ProspectCreekSub-CatchmentsFRMS&P ScaleatA3 EmergencyManagement EmergencyManagementHotspot1 PMF MapProducedbySantec(NatW&E Date 2023-8-16|Proect:NW30232 CoordnateSysem:MGAZone56 Map:NW30232 EmergencyMgmt MG v2qgz
FIGURE6

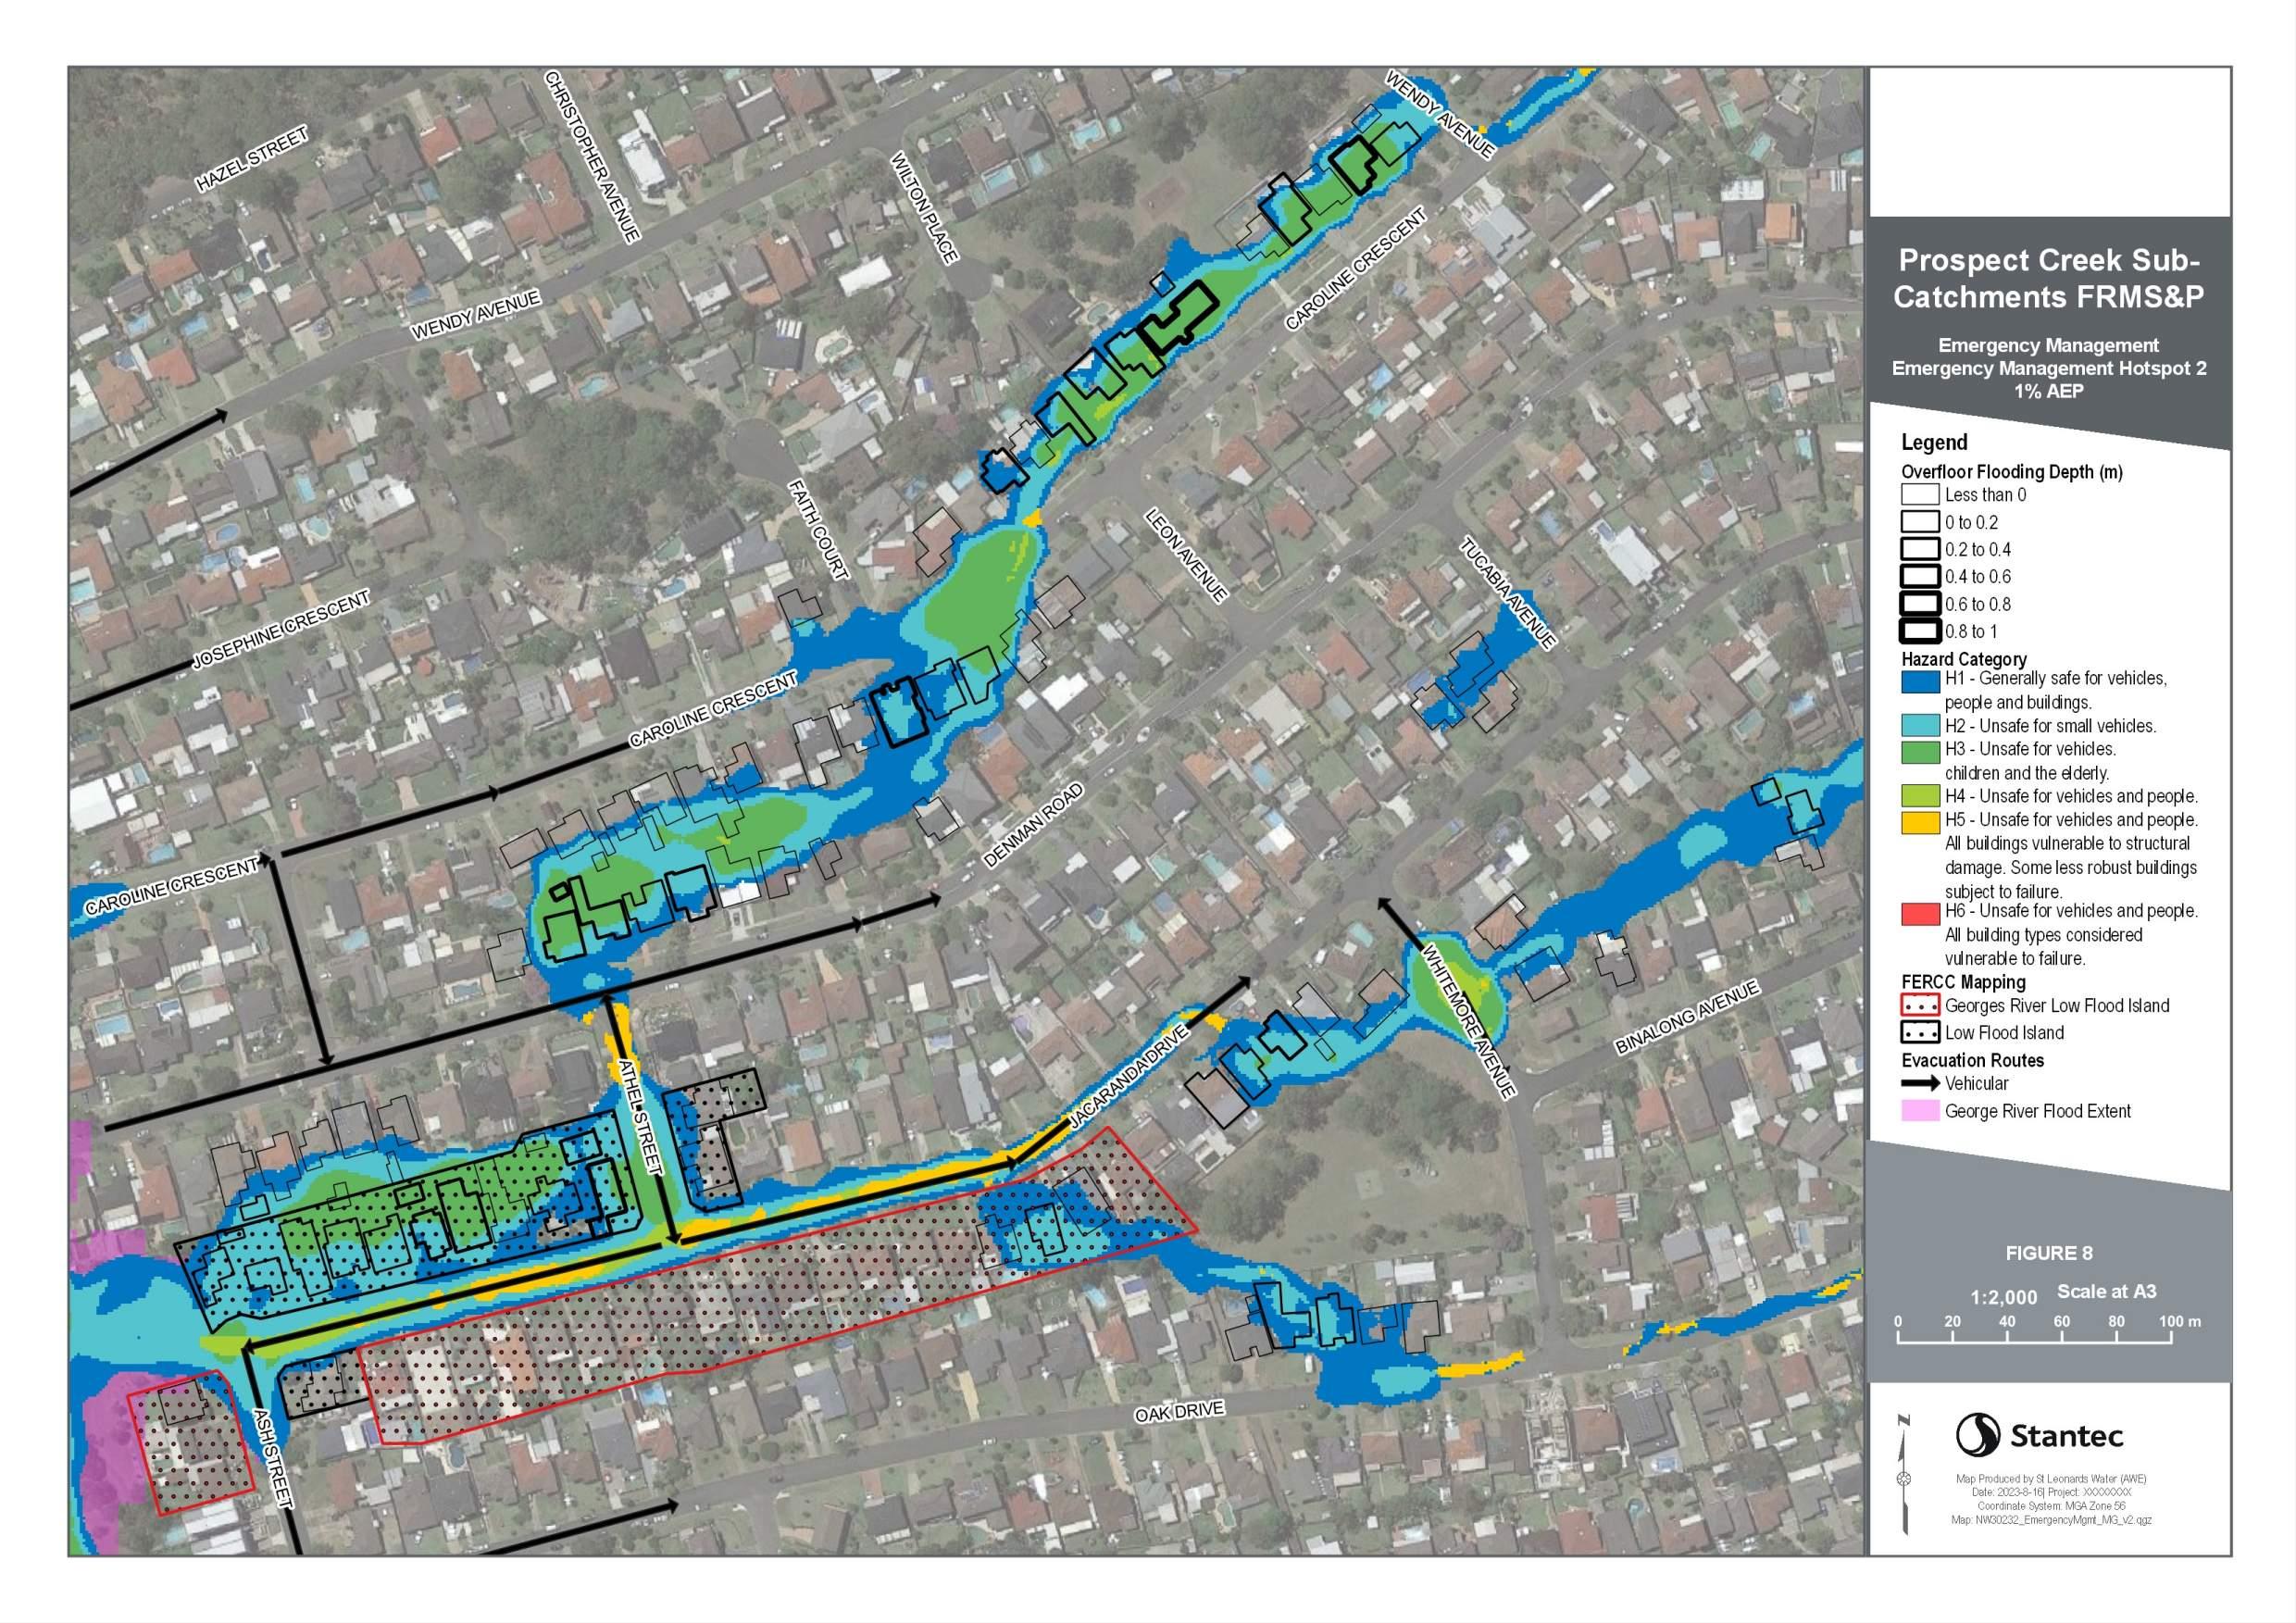
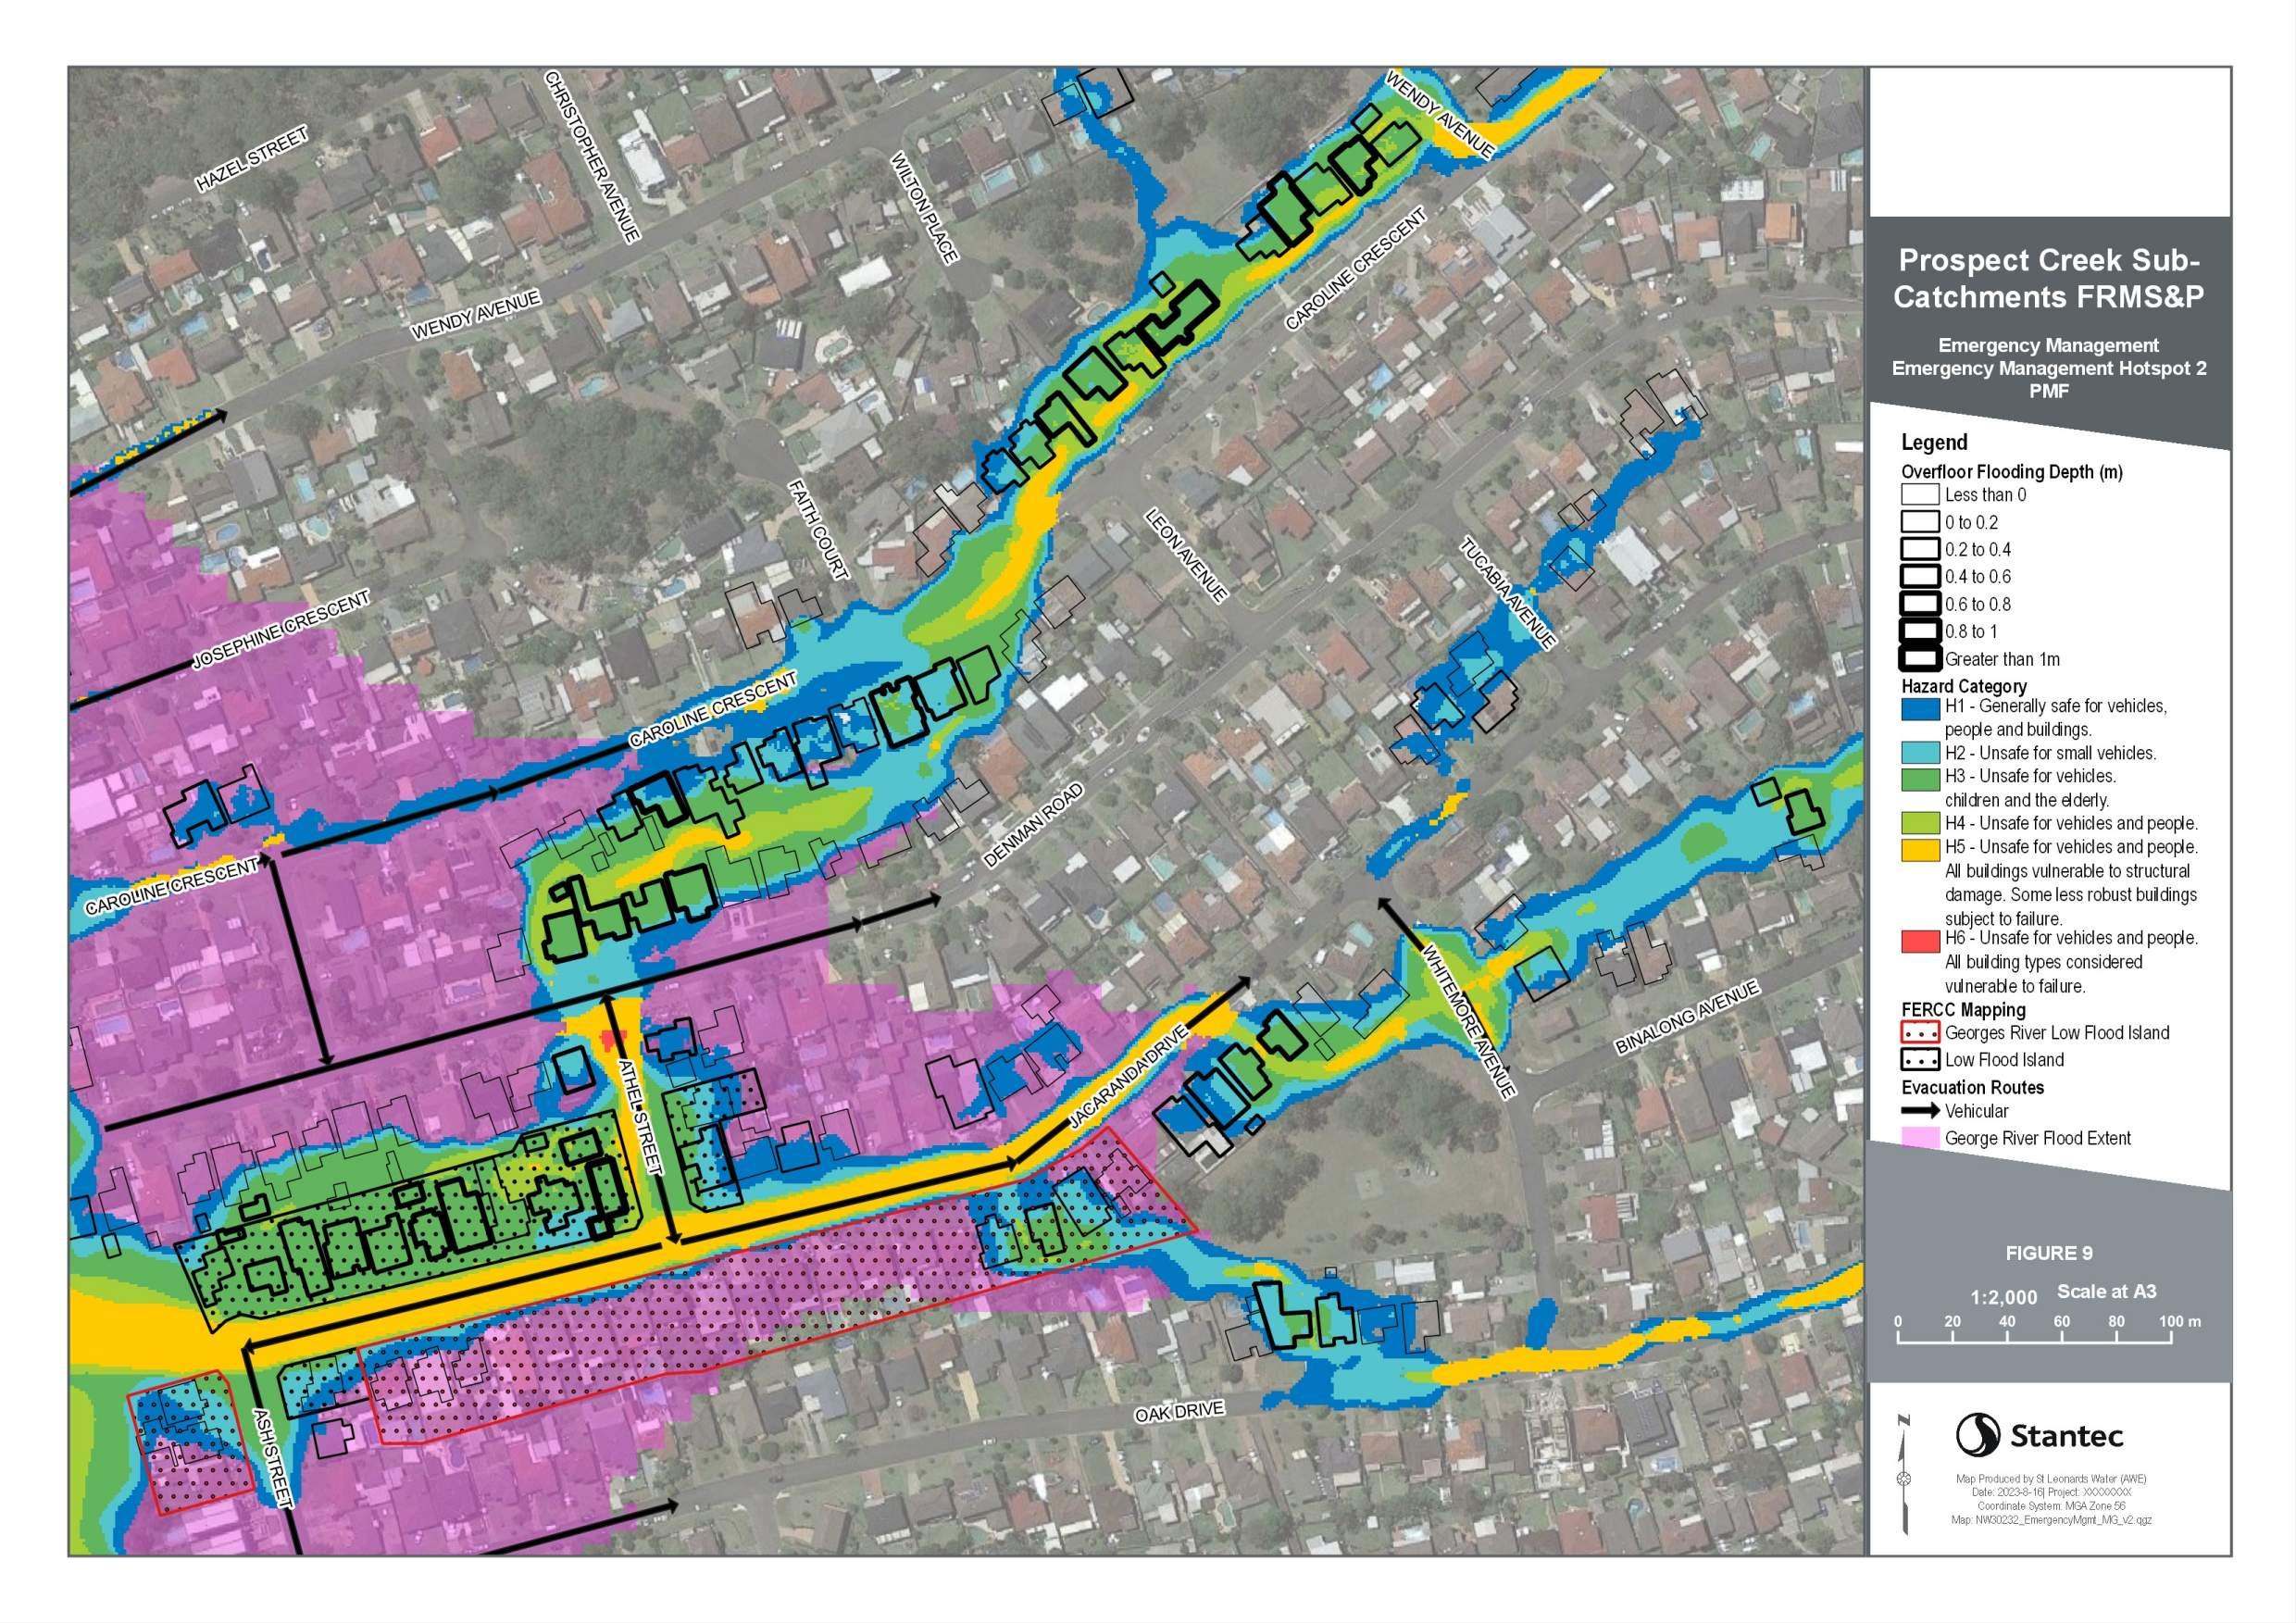


Legend
OverfloorFloodingDepth(m)
Lessthan0
0to02
02to04
04to06
HazardCategory
H1-Generallysafeforvehicles, peopleandbuildings
H2-Unsafeforsmallvehicles
H3-Unsafeforvehicles childrenandtheelderly
H4-Unsafeforvehiclesandpeople
H5-Unsafeforvehiclesandpeople
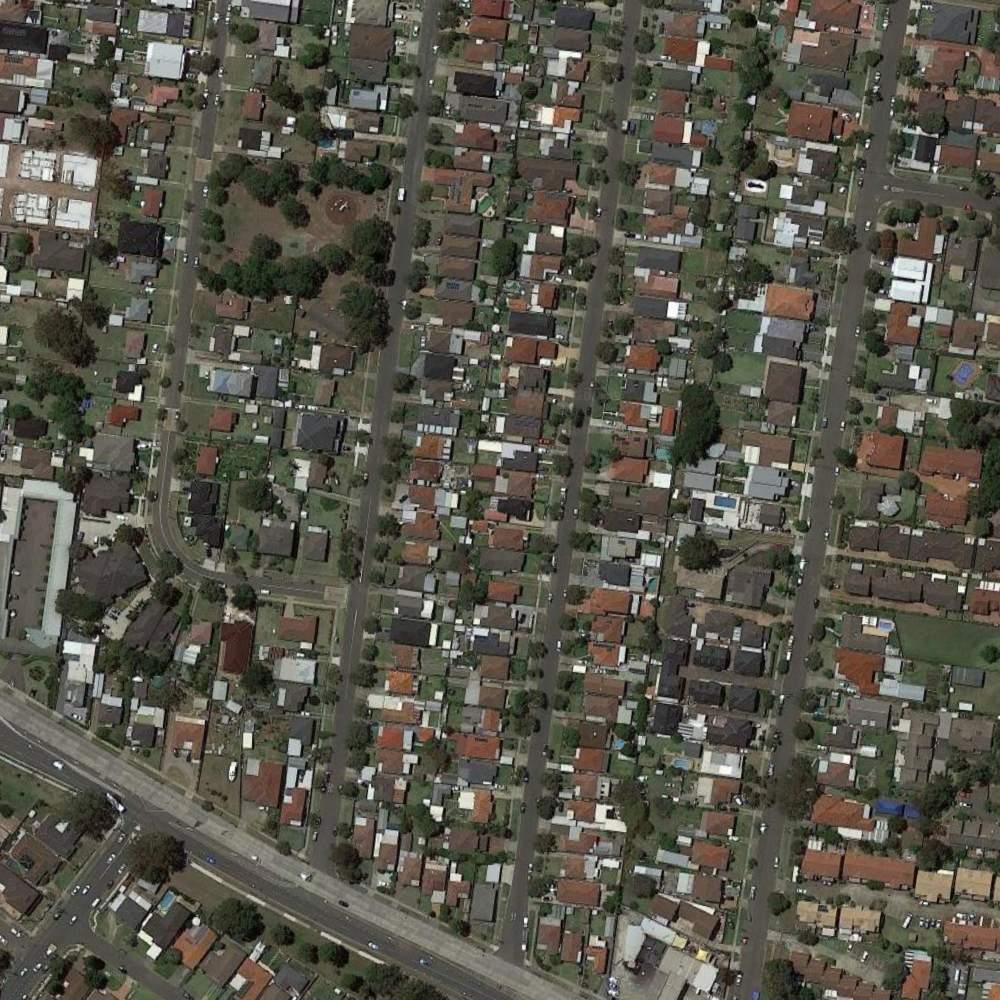
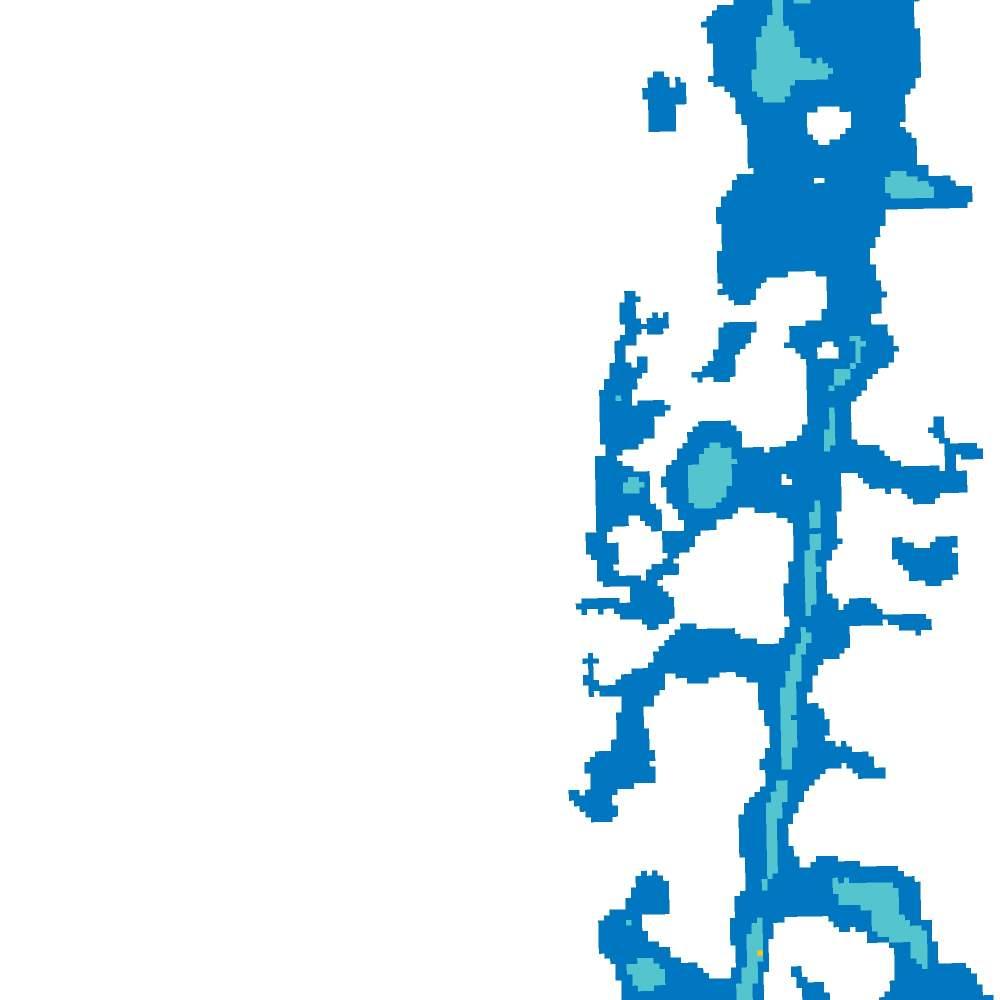
Allbuildingsvulnerabletostructural damage Somelessrobustbuildings subjecttofailure
H6-Unsafeforvehiclesandpeople
Allbuildingtypesconsidered vulnerabletofailure
FERCCMapping
IndustrialLowFloodIsland
LowFloodIsland
EvacuationRoutes
Pedestrian


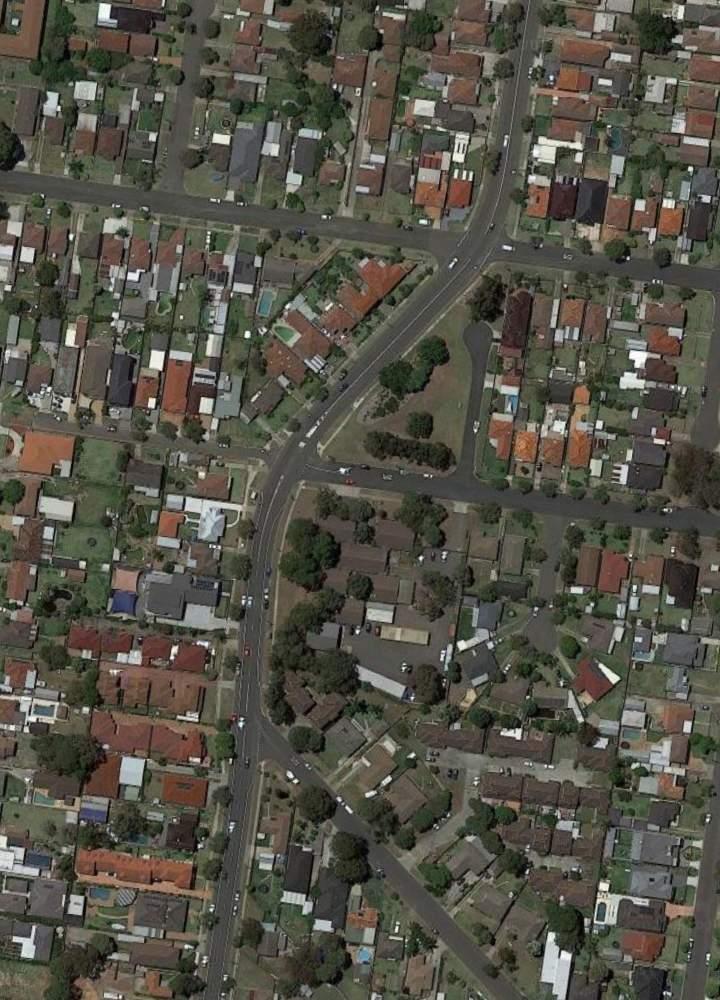


Vehicular


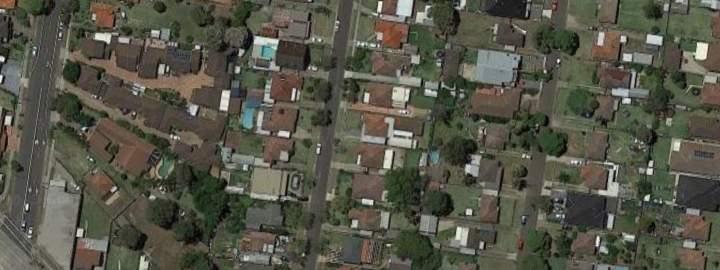


ProspectCreekSub-CatchmentsFRMS&P ScaleatA3 EmergencyManagement EmergencyManagementHotspot3 20%AEP MapProducedbySantec(NatW&E Date 2023-8-16|Proect:NW30232 CoordnateSysem:MGAZone56 Map:NW30232 EmergencyMgmt MG v2qgz
FIGURE10

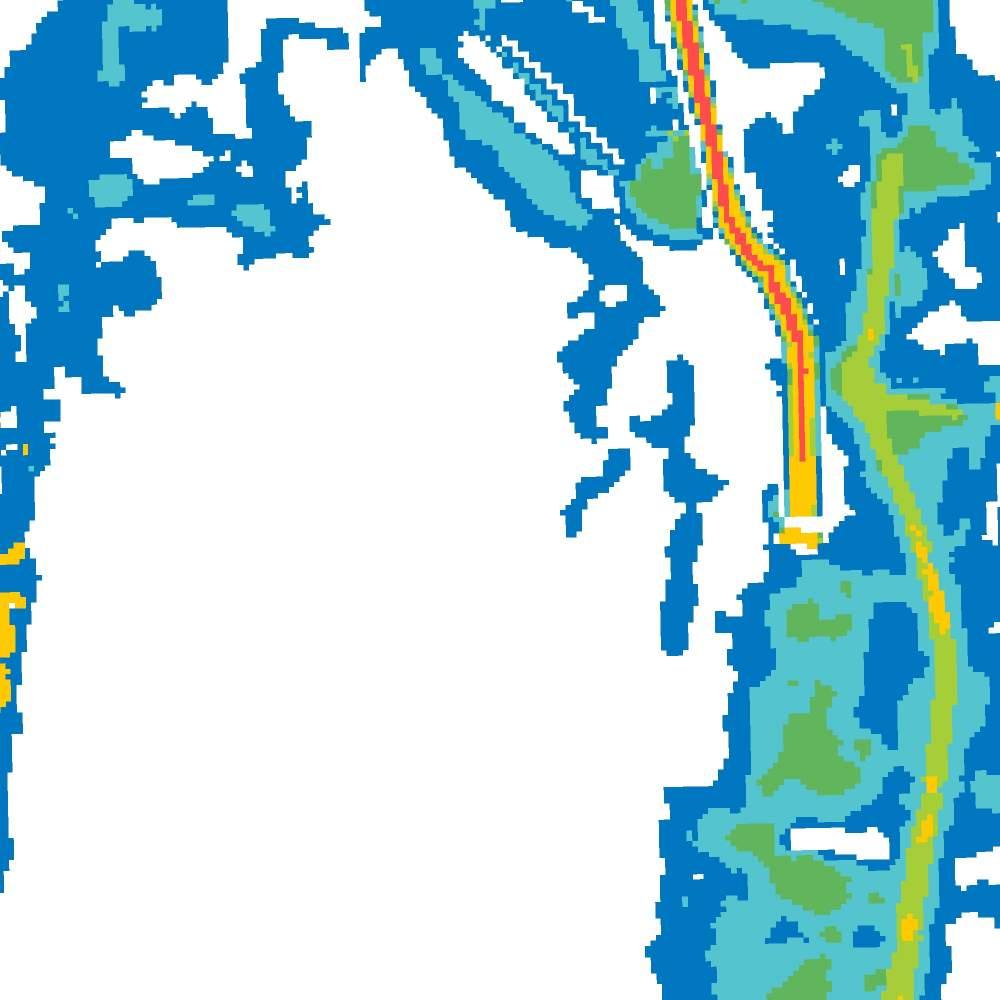

Legend
OverfloorFloodingDepth(m)
0to02 02to04 04to06 06to08 08to1
HazardCategory
H1-Generallysafeforvehicles, peopleandbuildings
H2-Unsafeforsmallvehicles
H3-Unsafeforvehicles childrenandtheelderly
H4-Unsafeforvehiclesandpeople
H5-Unsafeforvehiclesandpeople

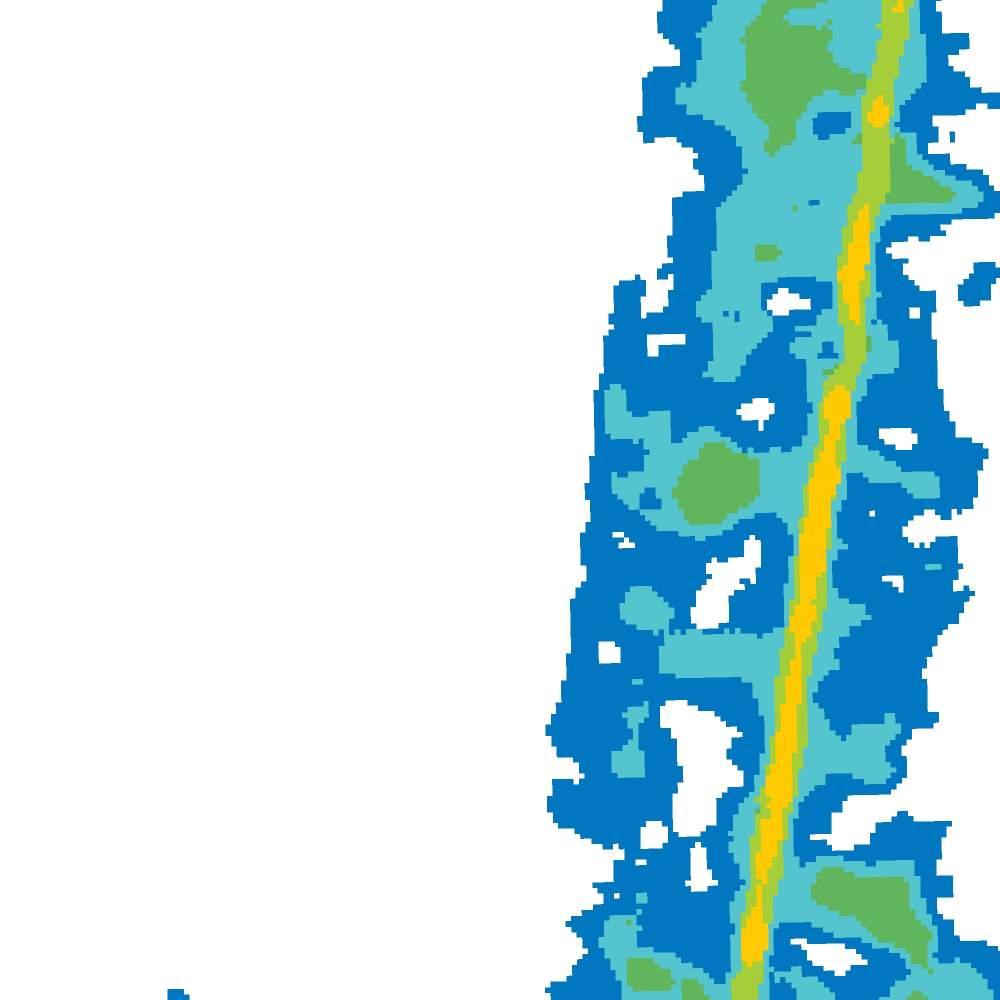
Allbuildingsvulnerabletostructural damage Somelessrobustbuildings subjecttofailure
H6-Unsafeforvehiclesandpeople
Allbuildingtypesconsidered vulnerabletofailure
FERCCMapping
IndustrialLowFloodIsland
LowFloodIsland
EvacuationRoutes
Pedestrian


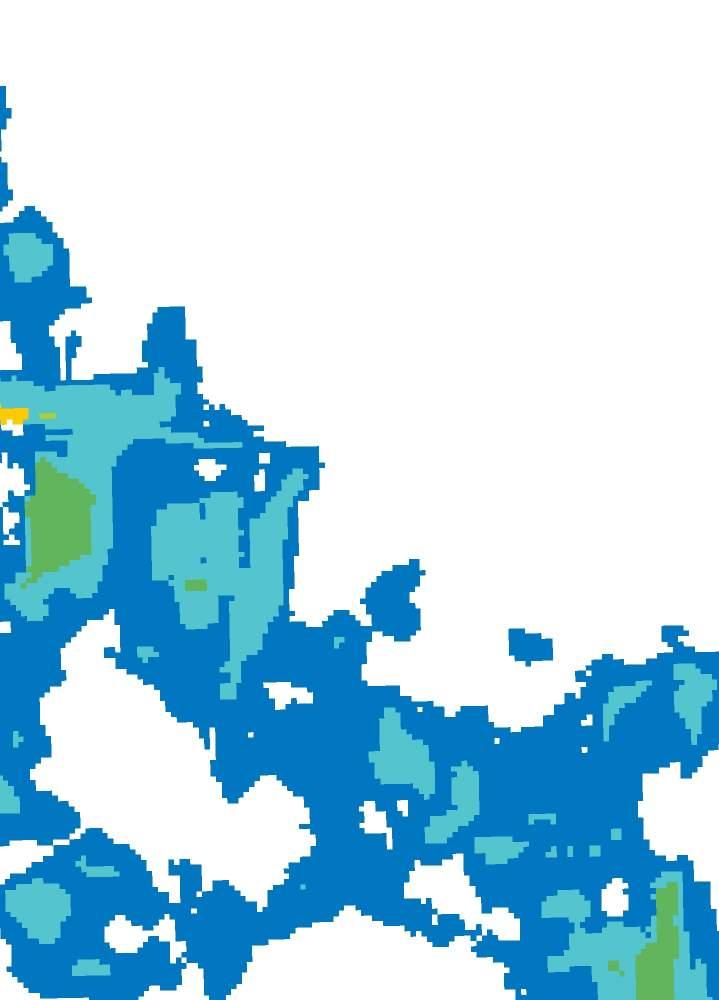


Vehicular


ProspectCreekSub-CatchmentsFRMS&P ScaleatA3 EmergencyManagement EmergencyManagementHotspot3 1%AEP MapProducedbySantec(NatW&E Date 2023-8-16|Proect:NW30232 CoordnateSysem:MGAZone56 Map:NW30232 EmergencyMgmt MG v2qgz
FIGURE11

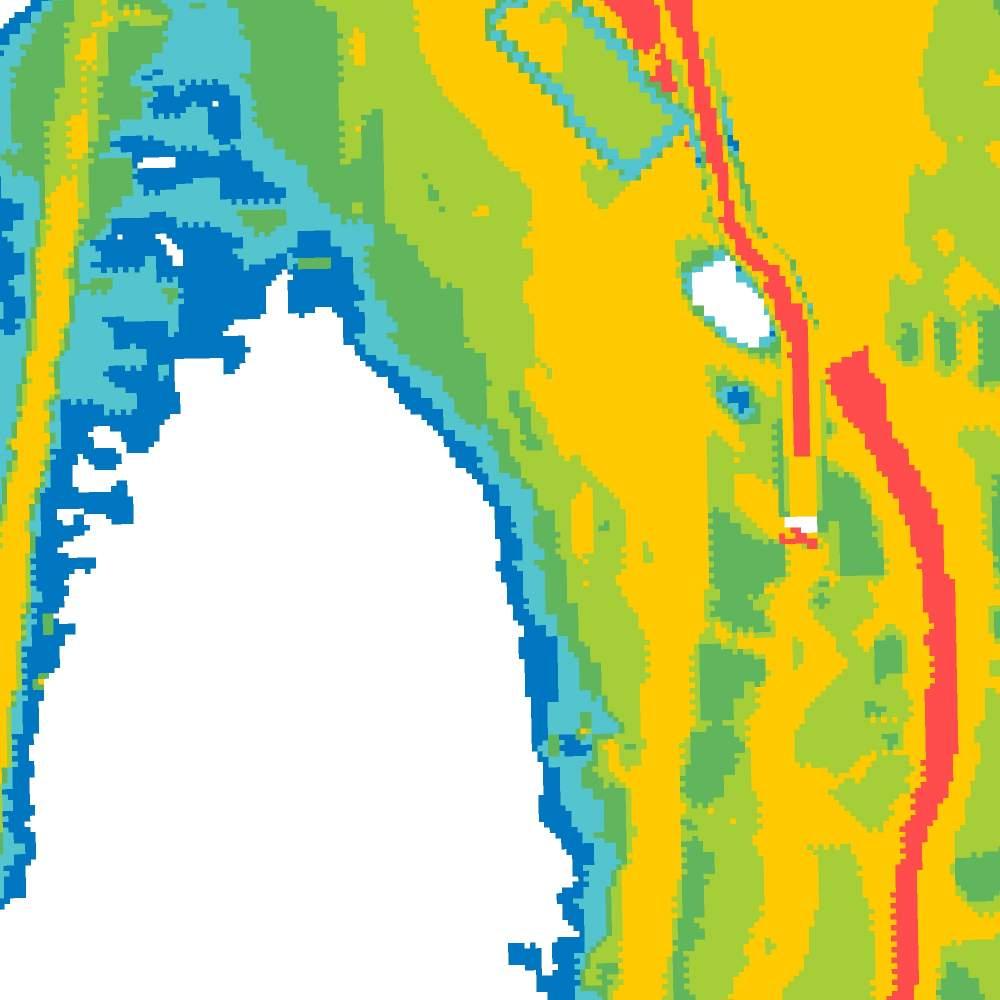




Legend
OverfloorFloodingDepth(m)
HazardCategory
H1-Generallysafeforvehicles, peopleandbuildings
H2-Unsafeforsmallvehicles
H3-Unsafeforvehicles childrenandtheelderly
H4-Unsafeforvehiclesandpeople
H5-Unsafeforvehiclesandpeople


Allbuildingsvulnerabletostructural damage Somelessrobustbuildings subjecttofailure
H6-Unsafeforvehiclesandpeople
Allbuildingtypesconsidered vulnerabletofailure
FERCCMapping
IndustrialLowFloodIsland

LowFloodIsland
EvacuationRoutes
Pedestrian Vehicular


ProspectCreekSub-CatchmentsFRMS&P ScaleatA3 EmergencyManagement EmergencyManagementHotspot3 PMF MapProducedbySantec(NatW&E Date 2023-8-16|Proect:NW30232 CoordnateSysem:MGAZone56 Map:NW30232 EmergencyMgmt MG v2qgz
FIGURE12
Lessthan0 0to02 02to04 04to06 06to08 08to1 Greaterthan1m

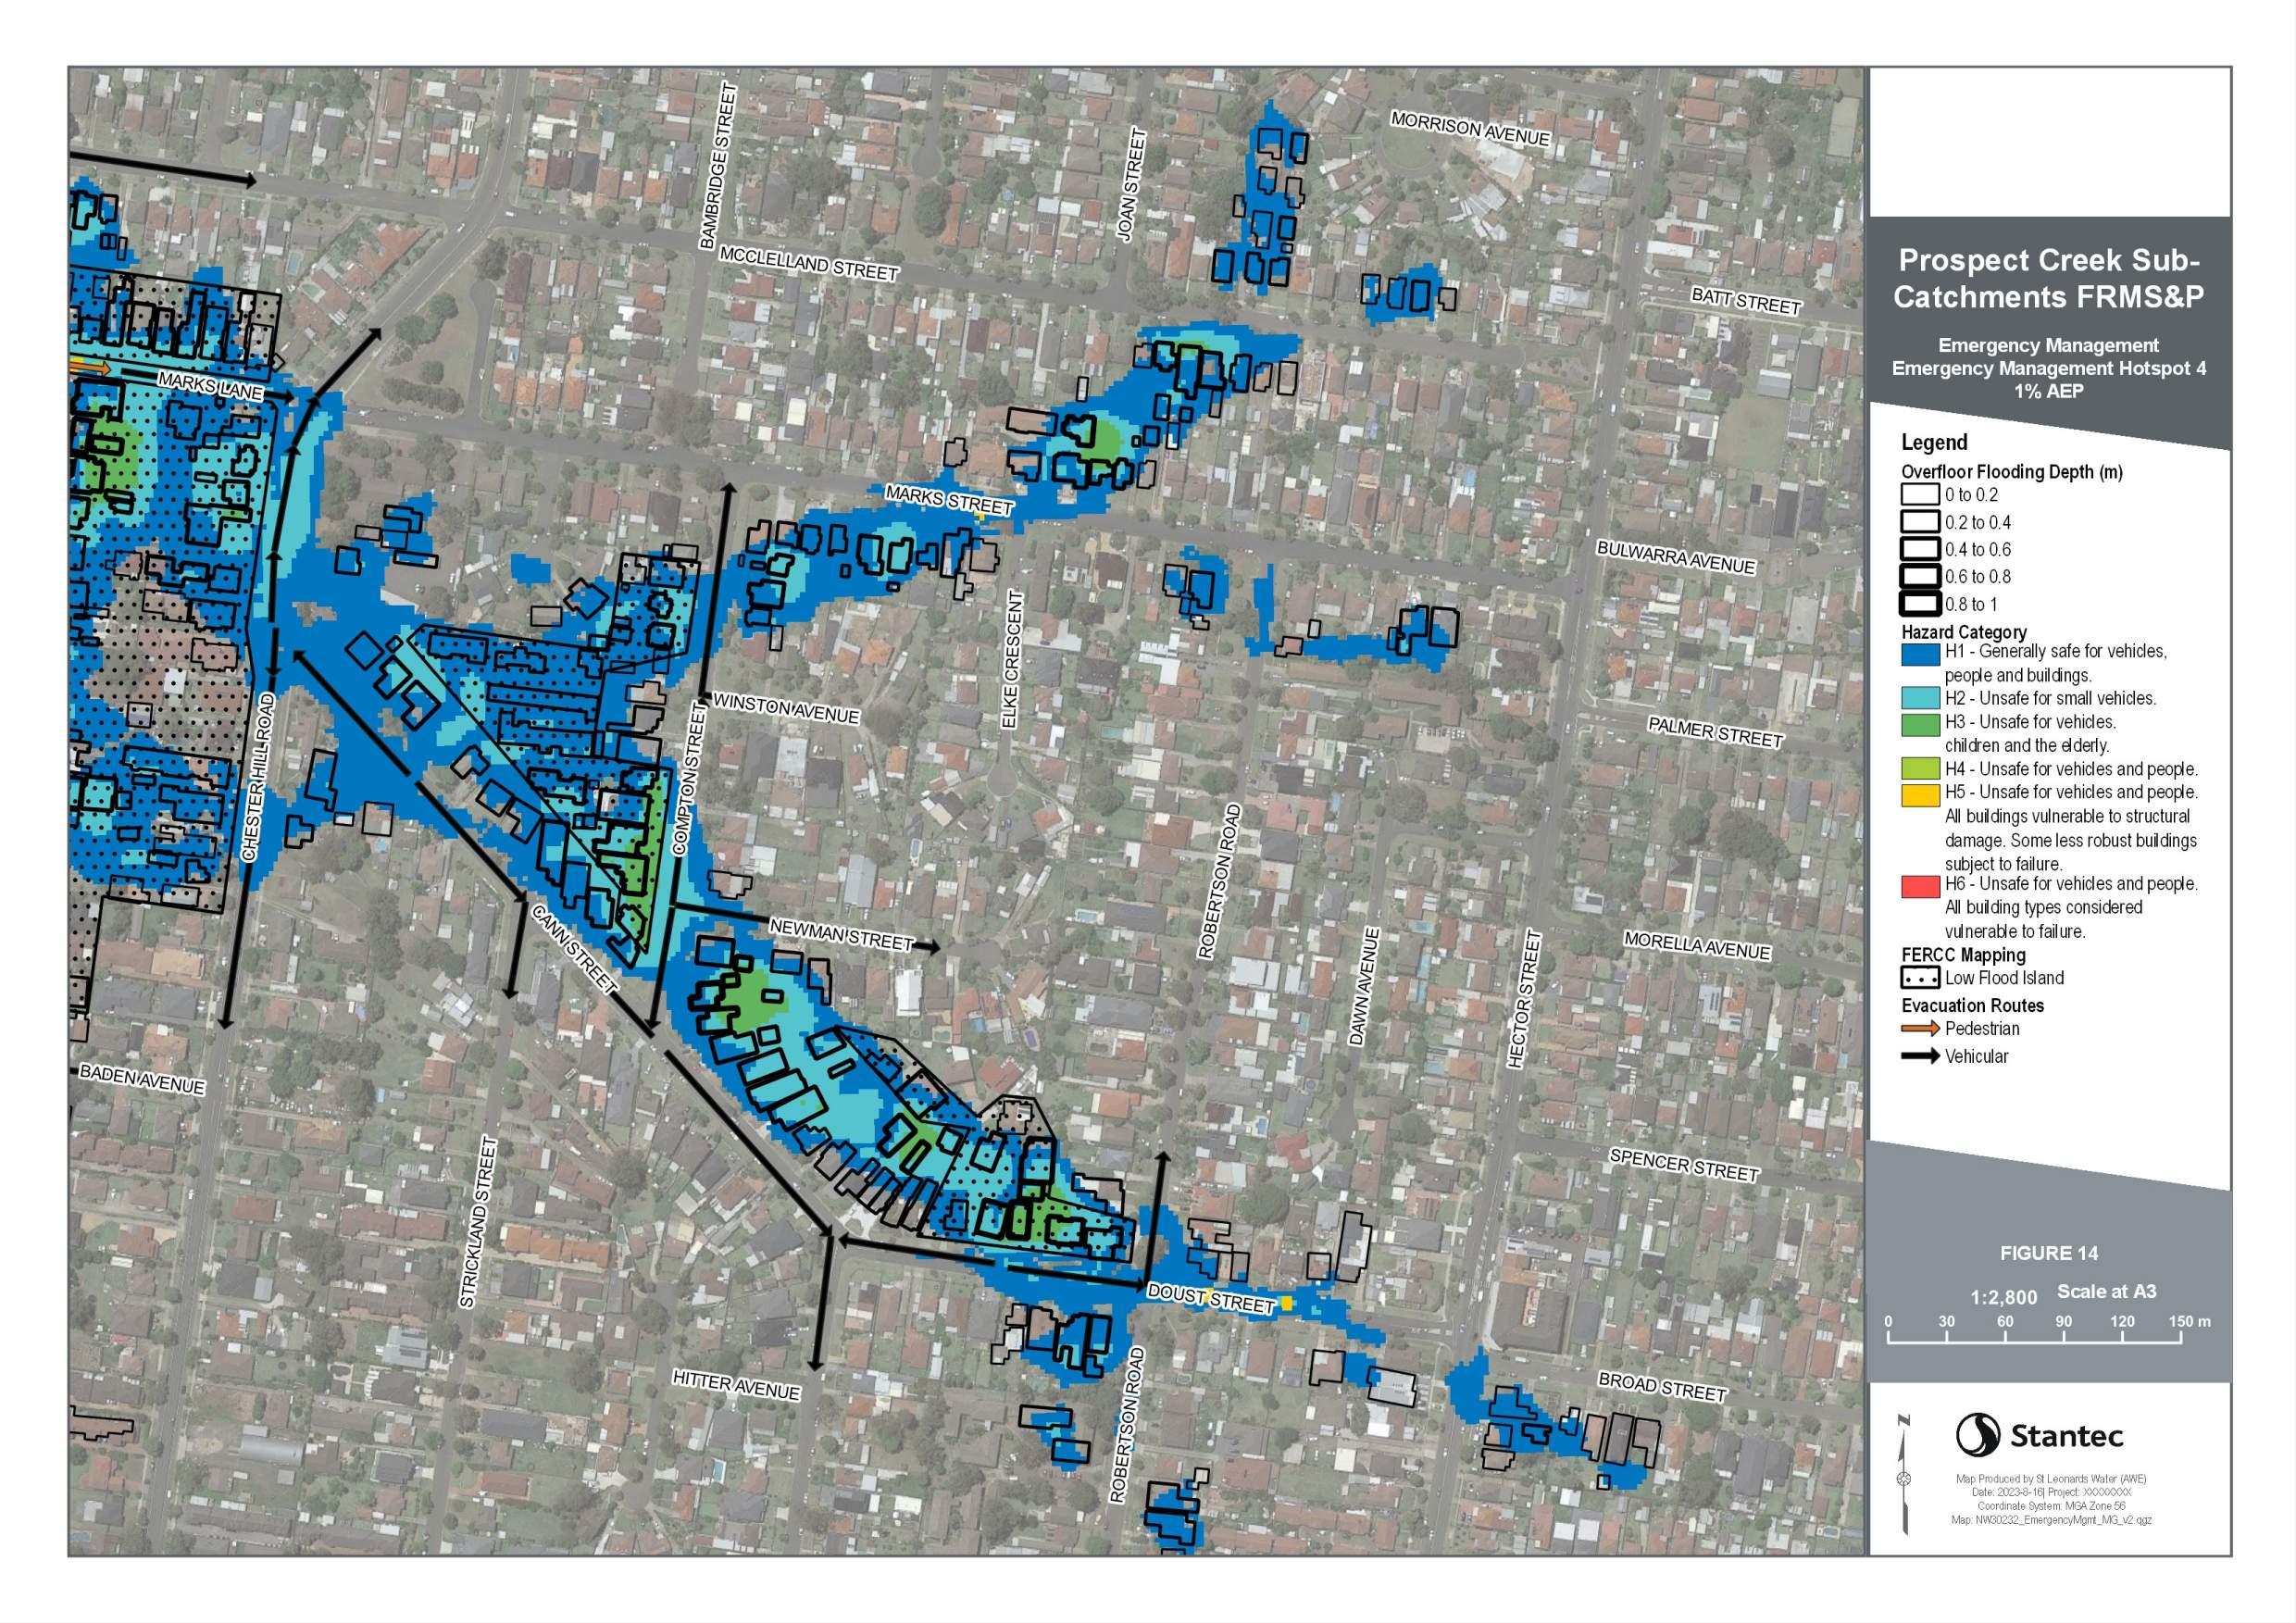
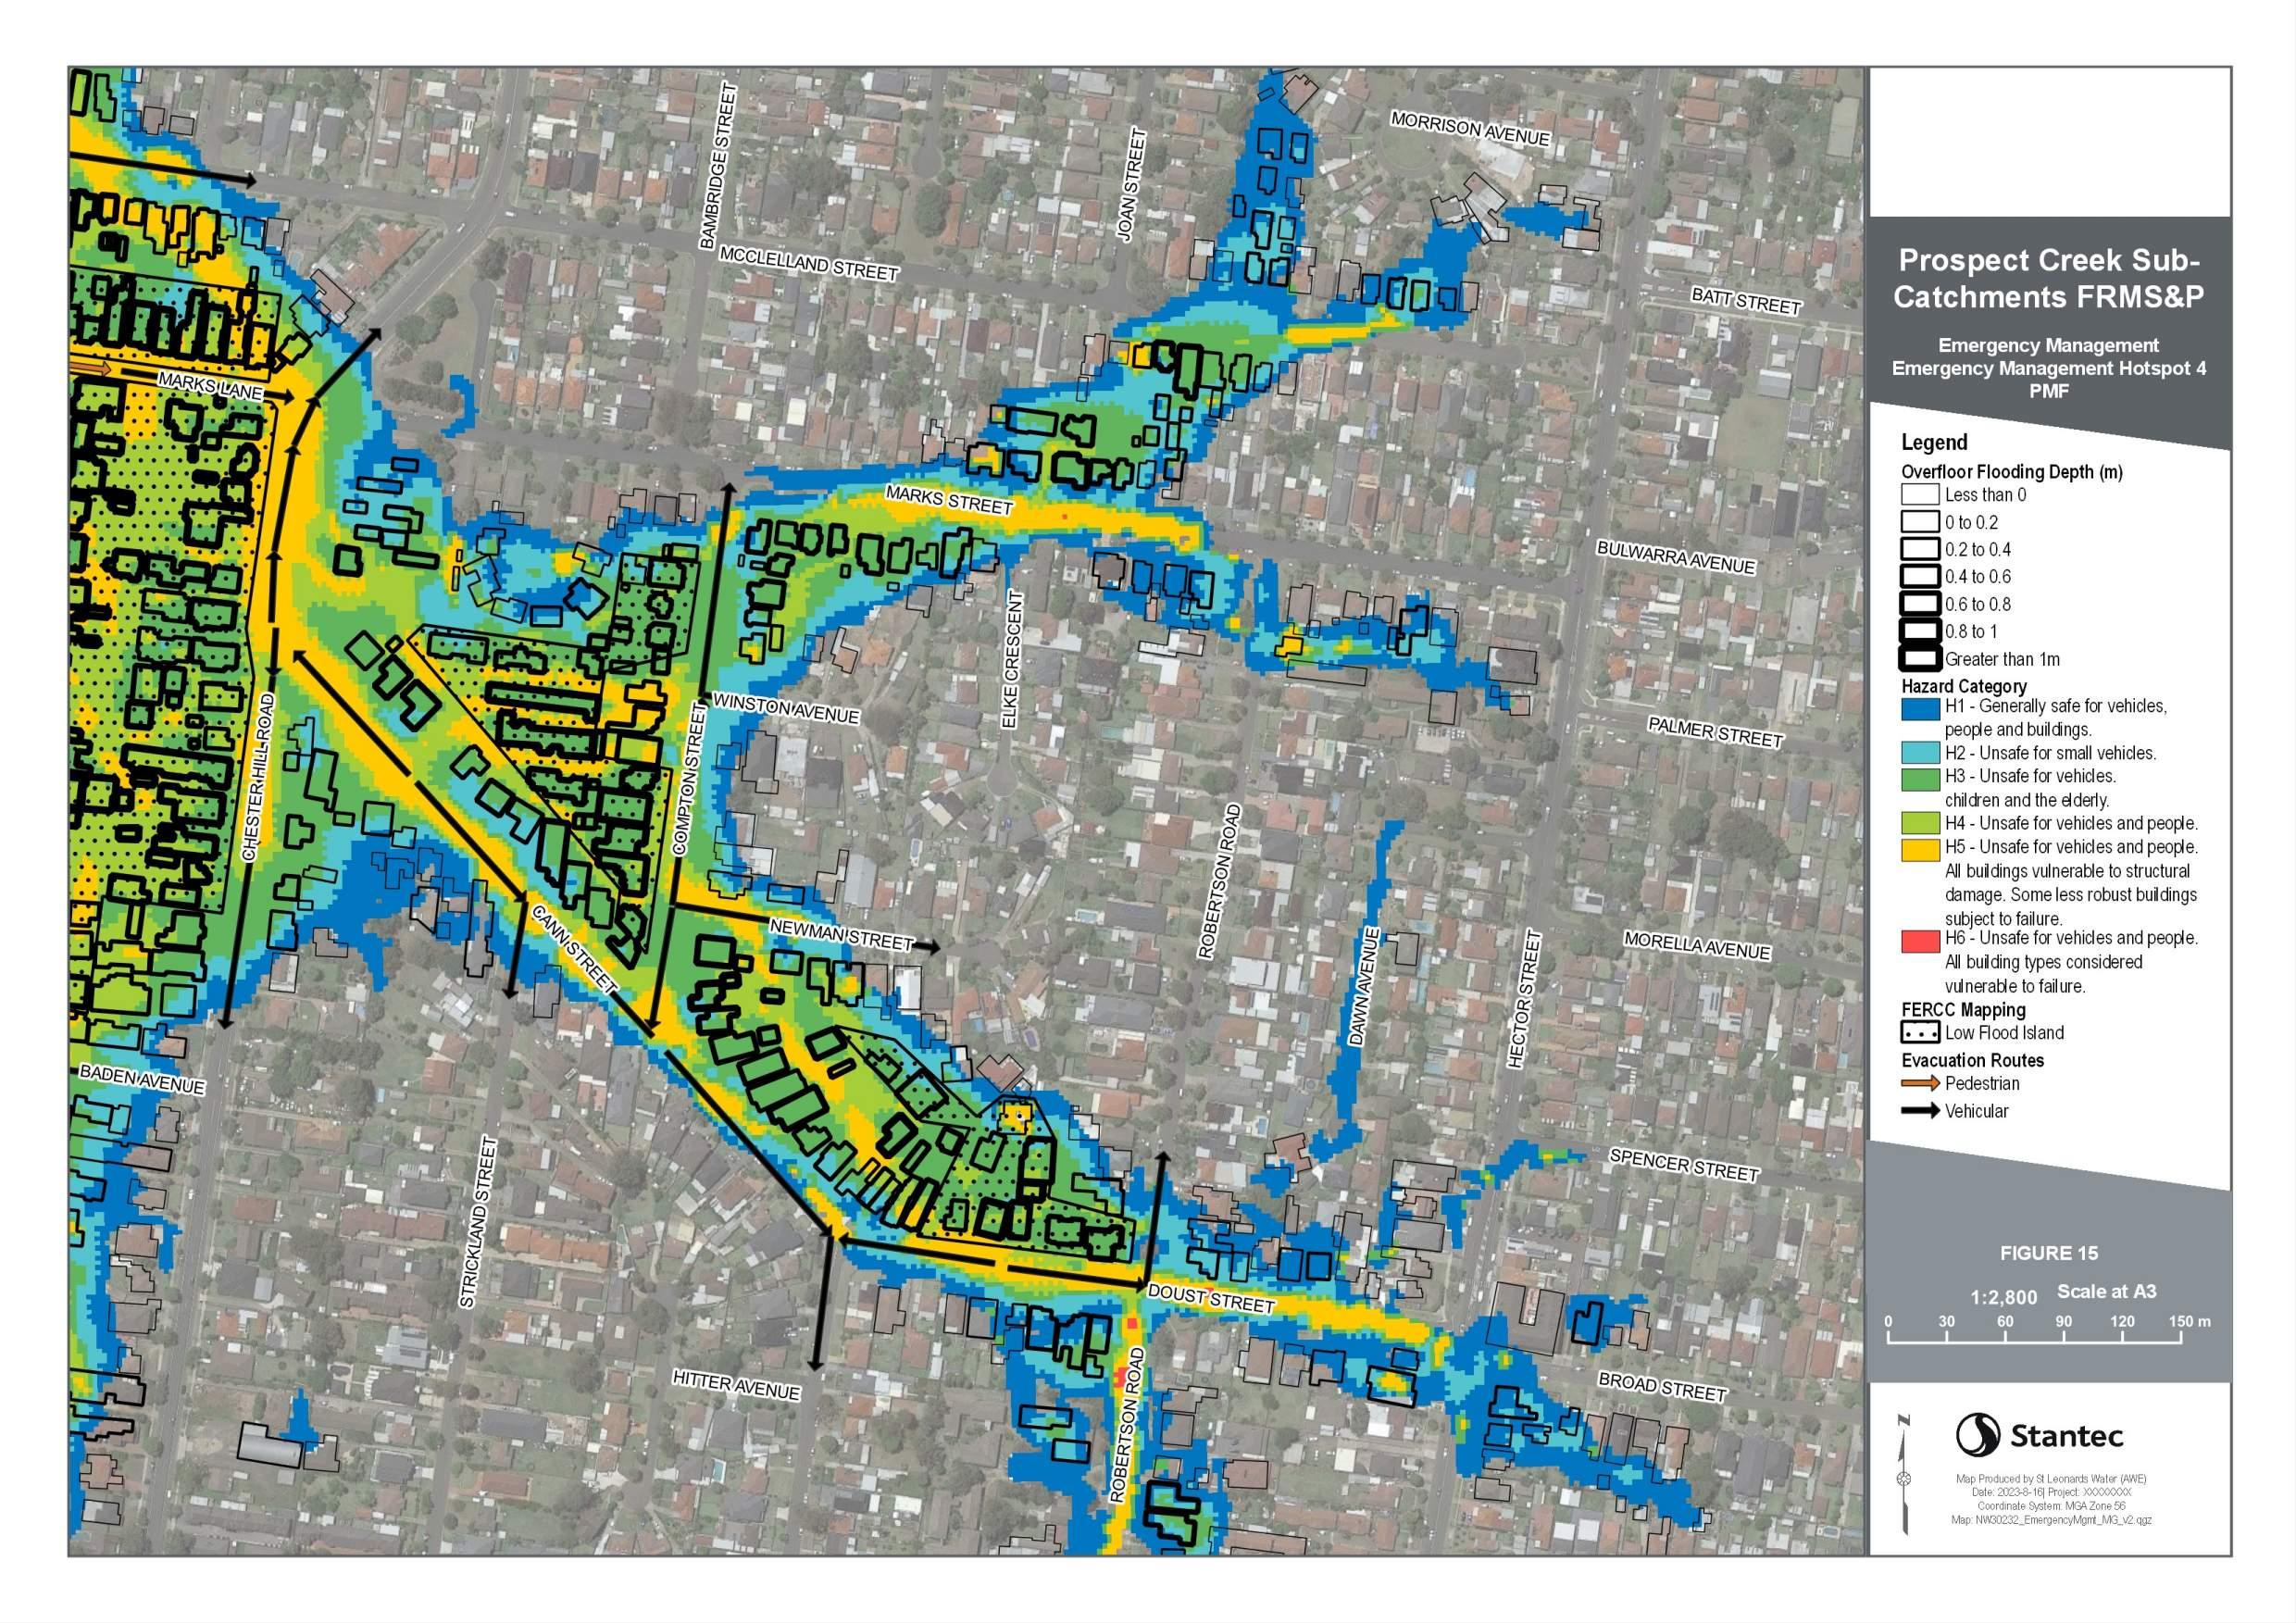

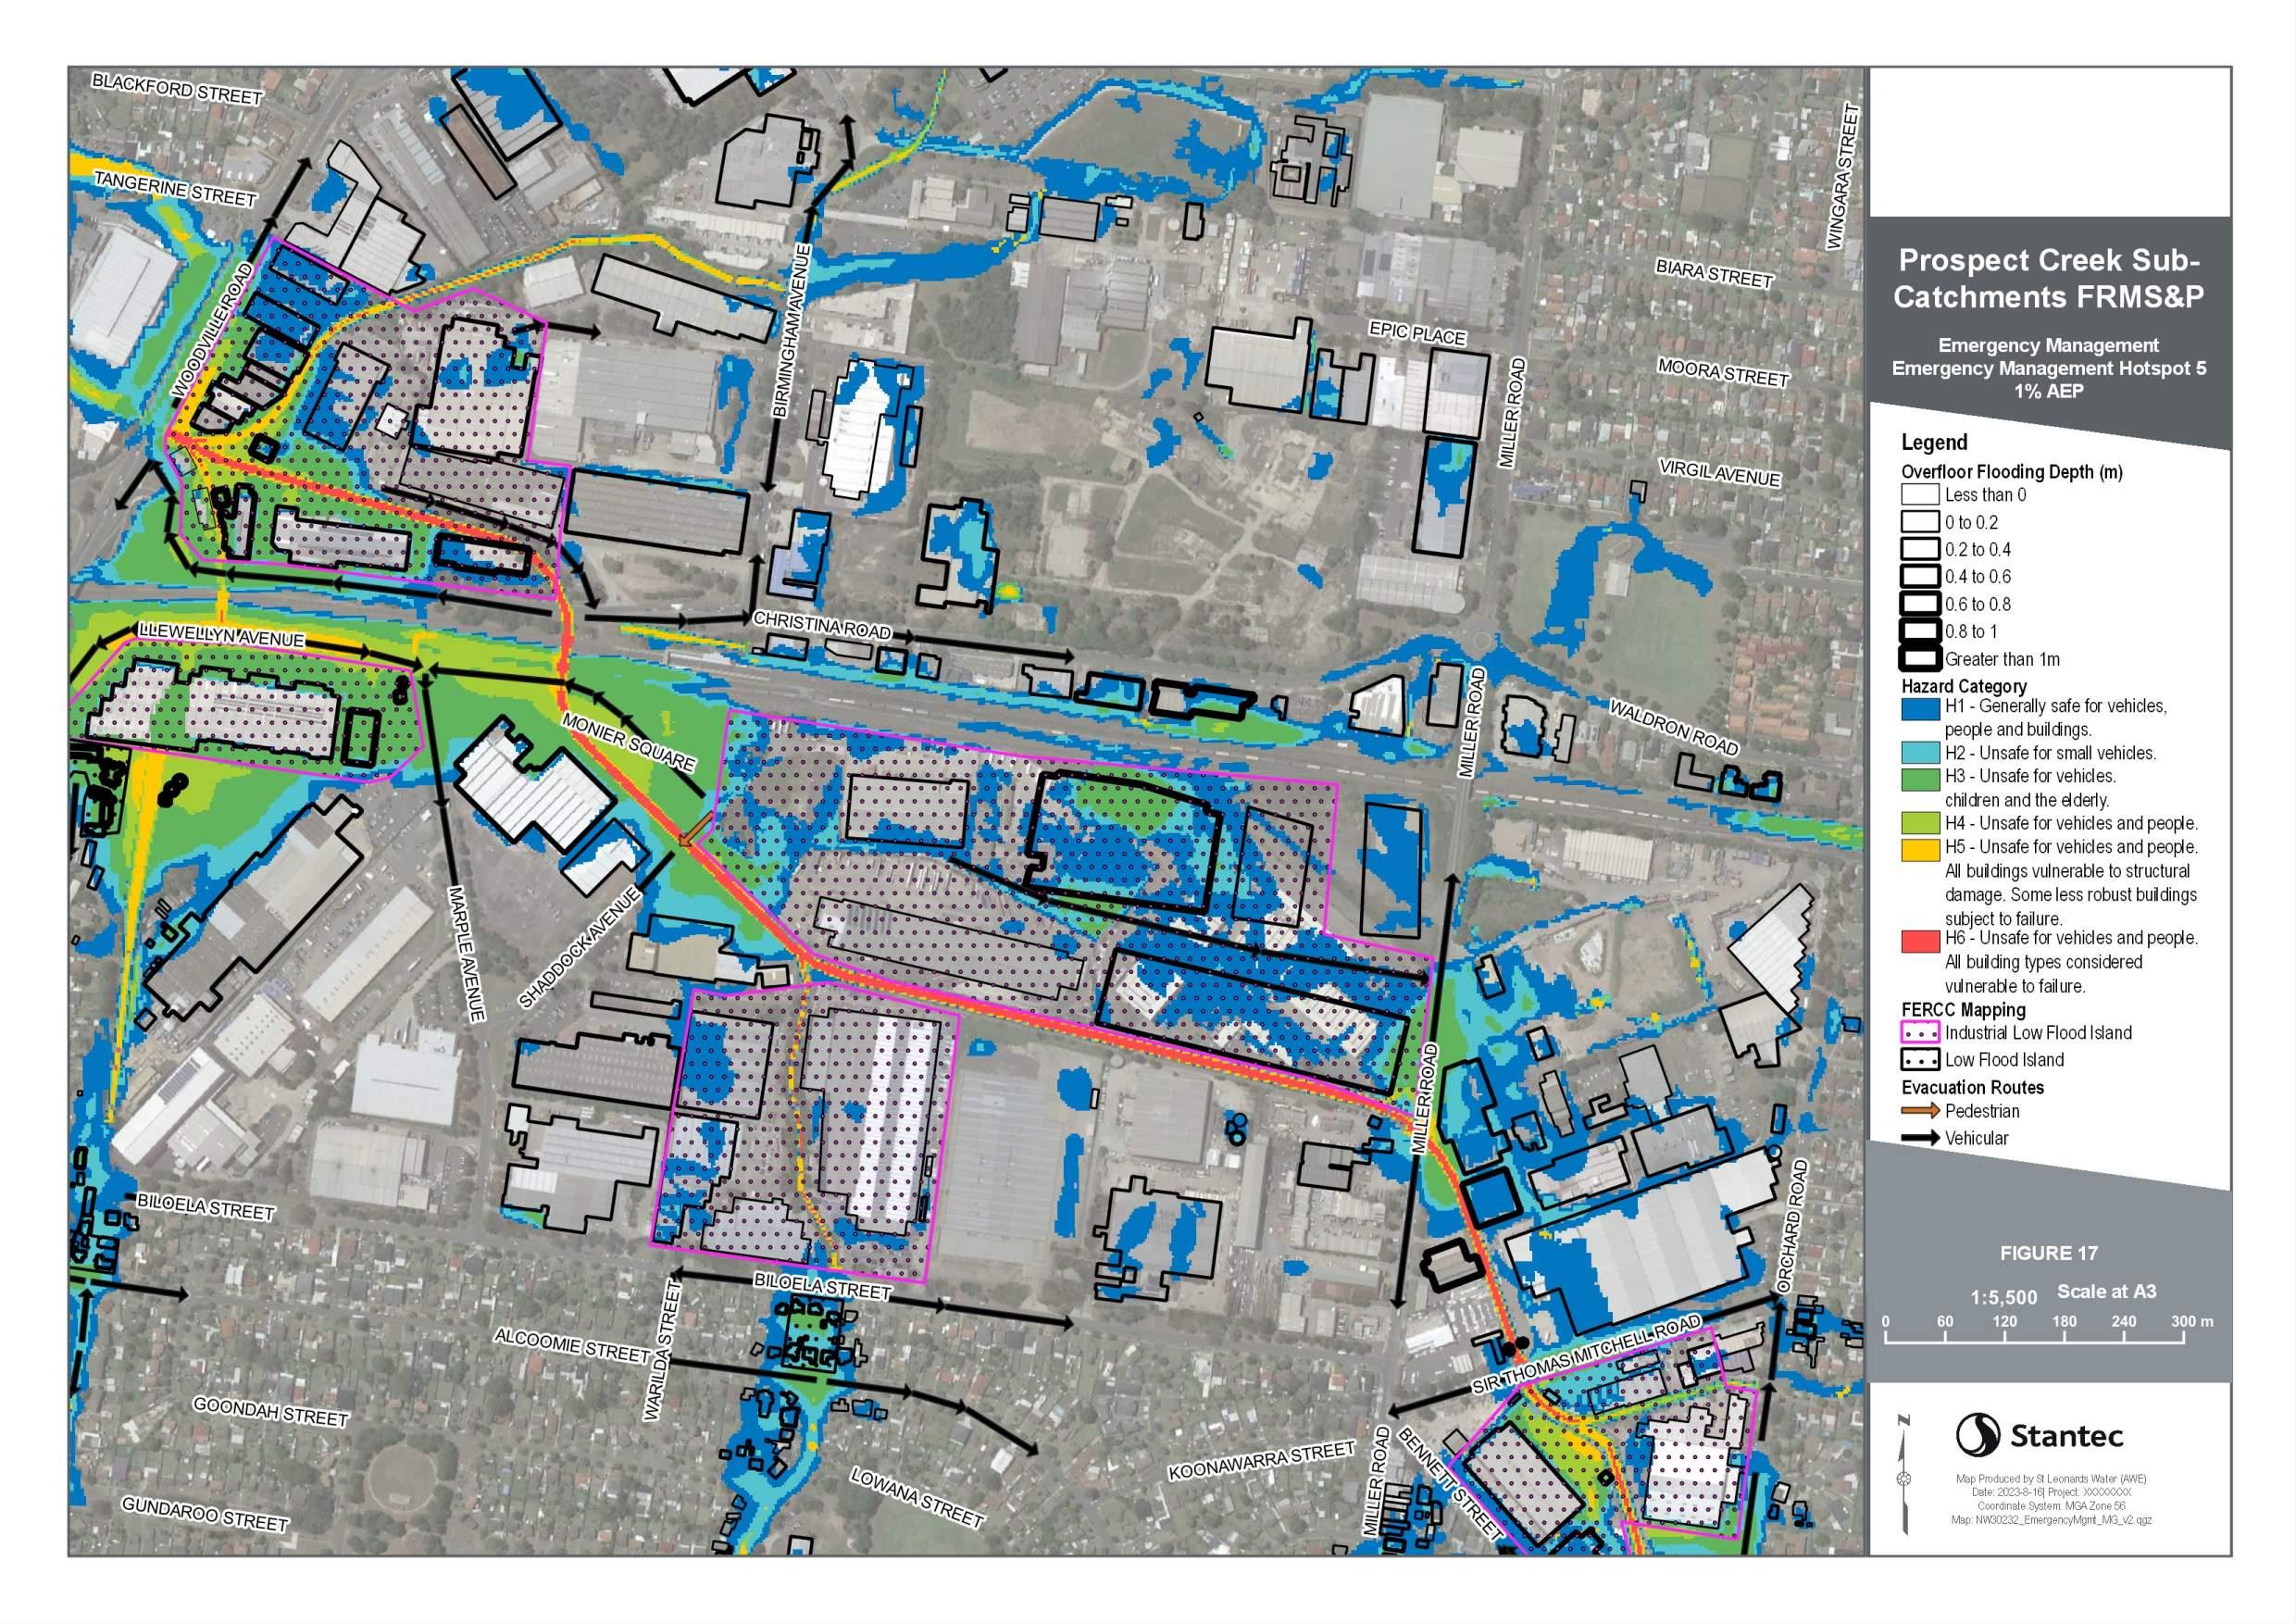
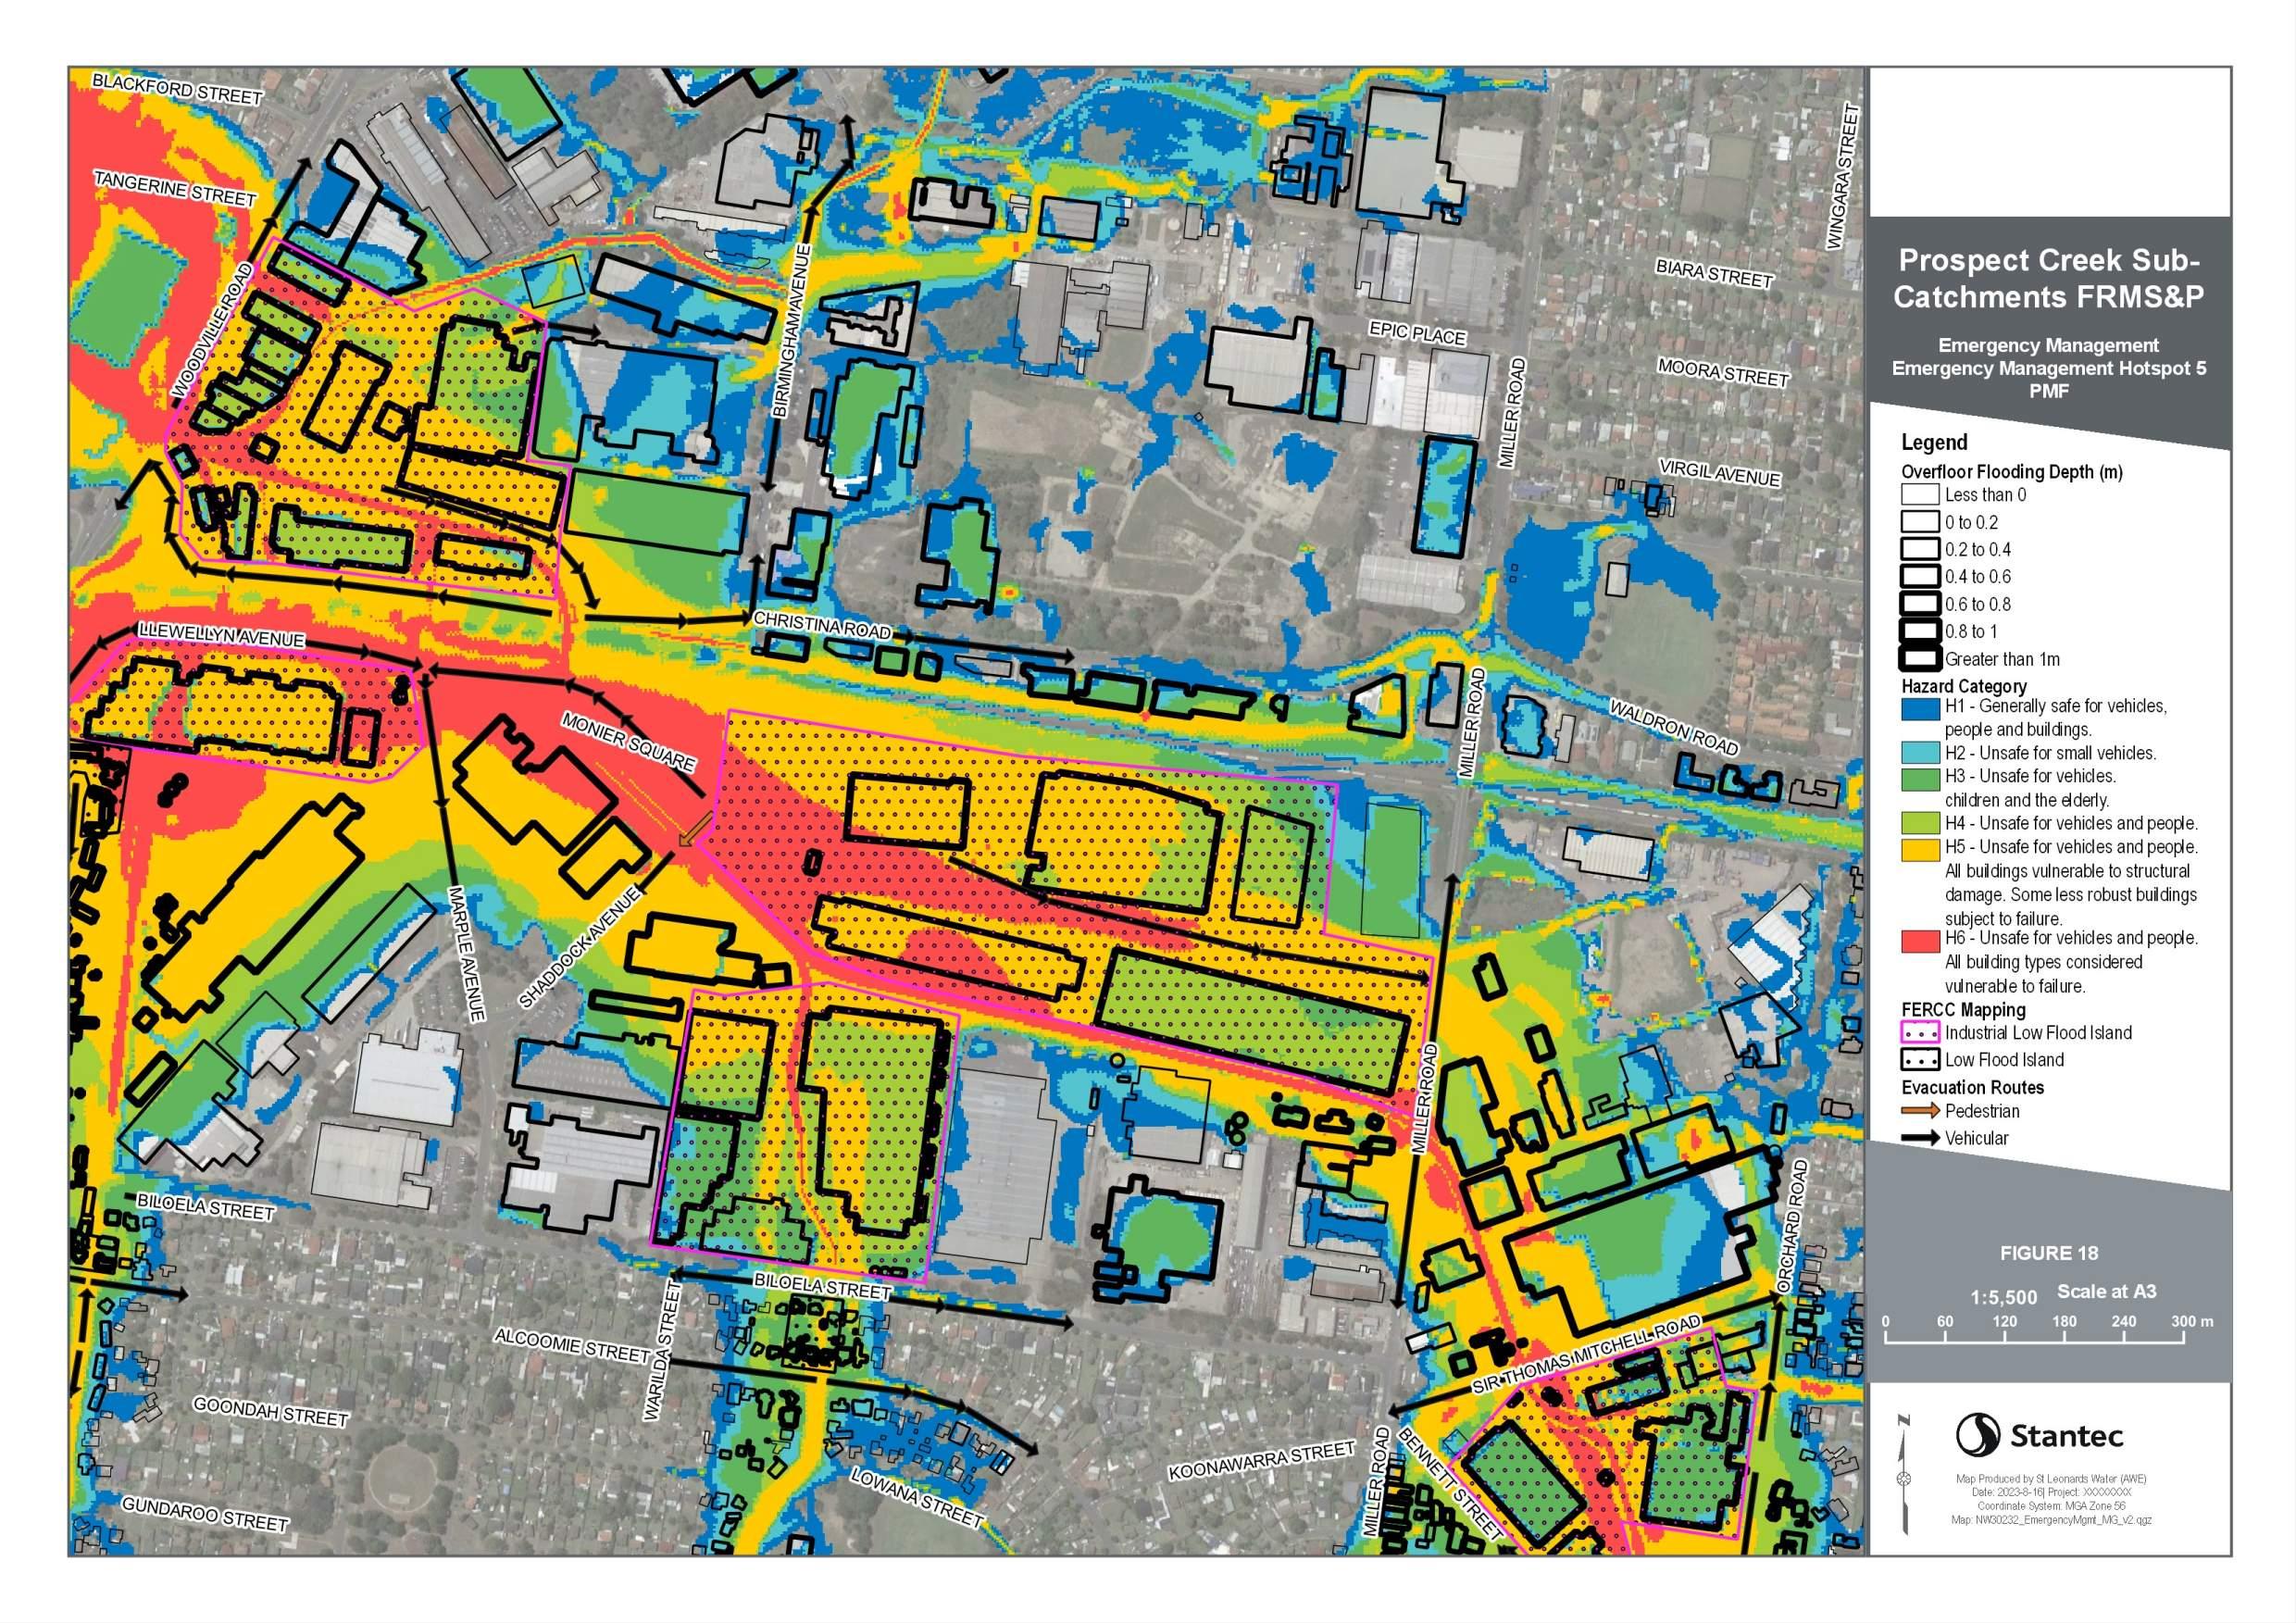

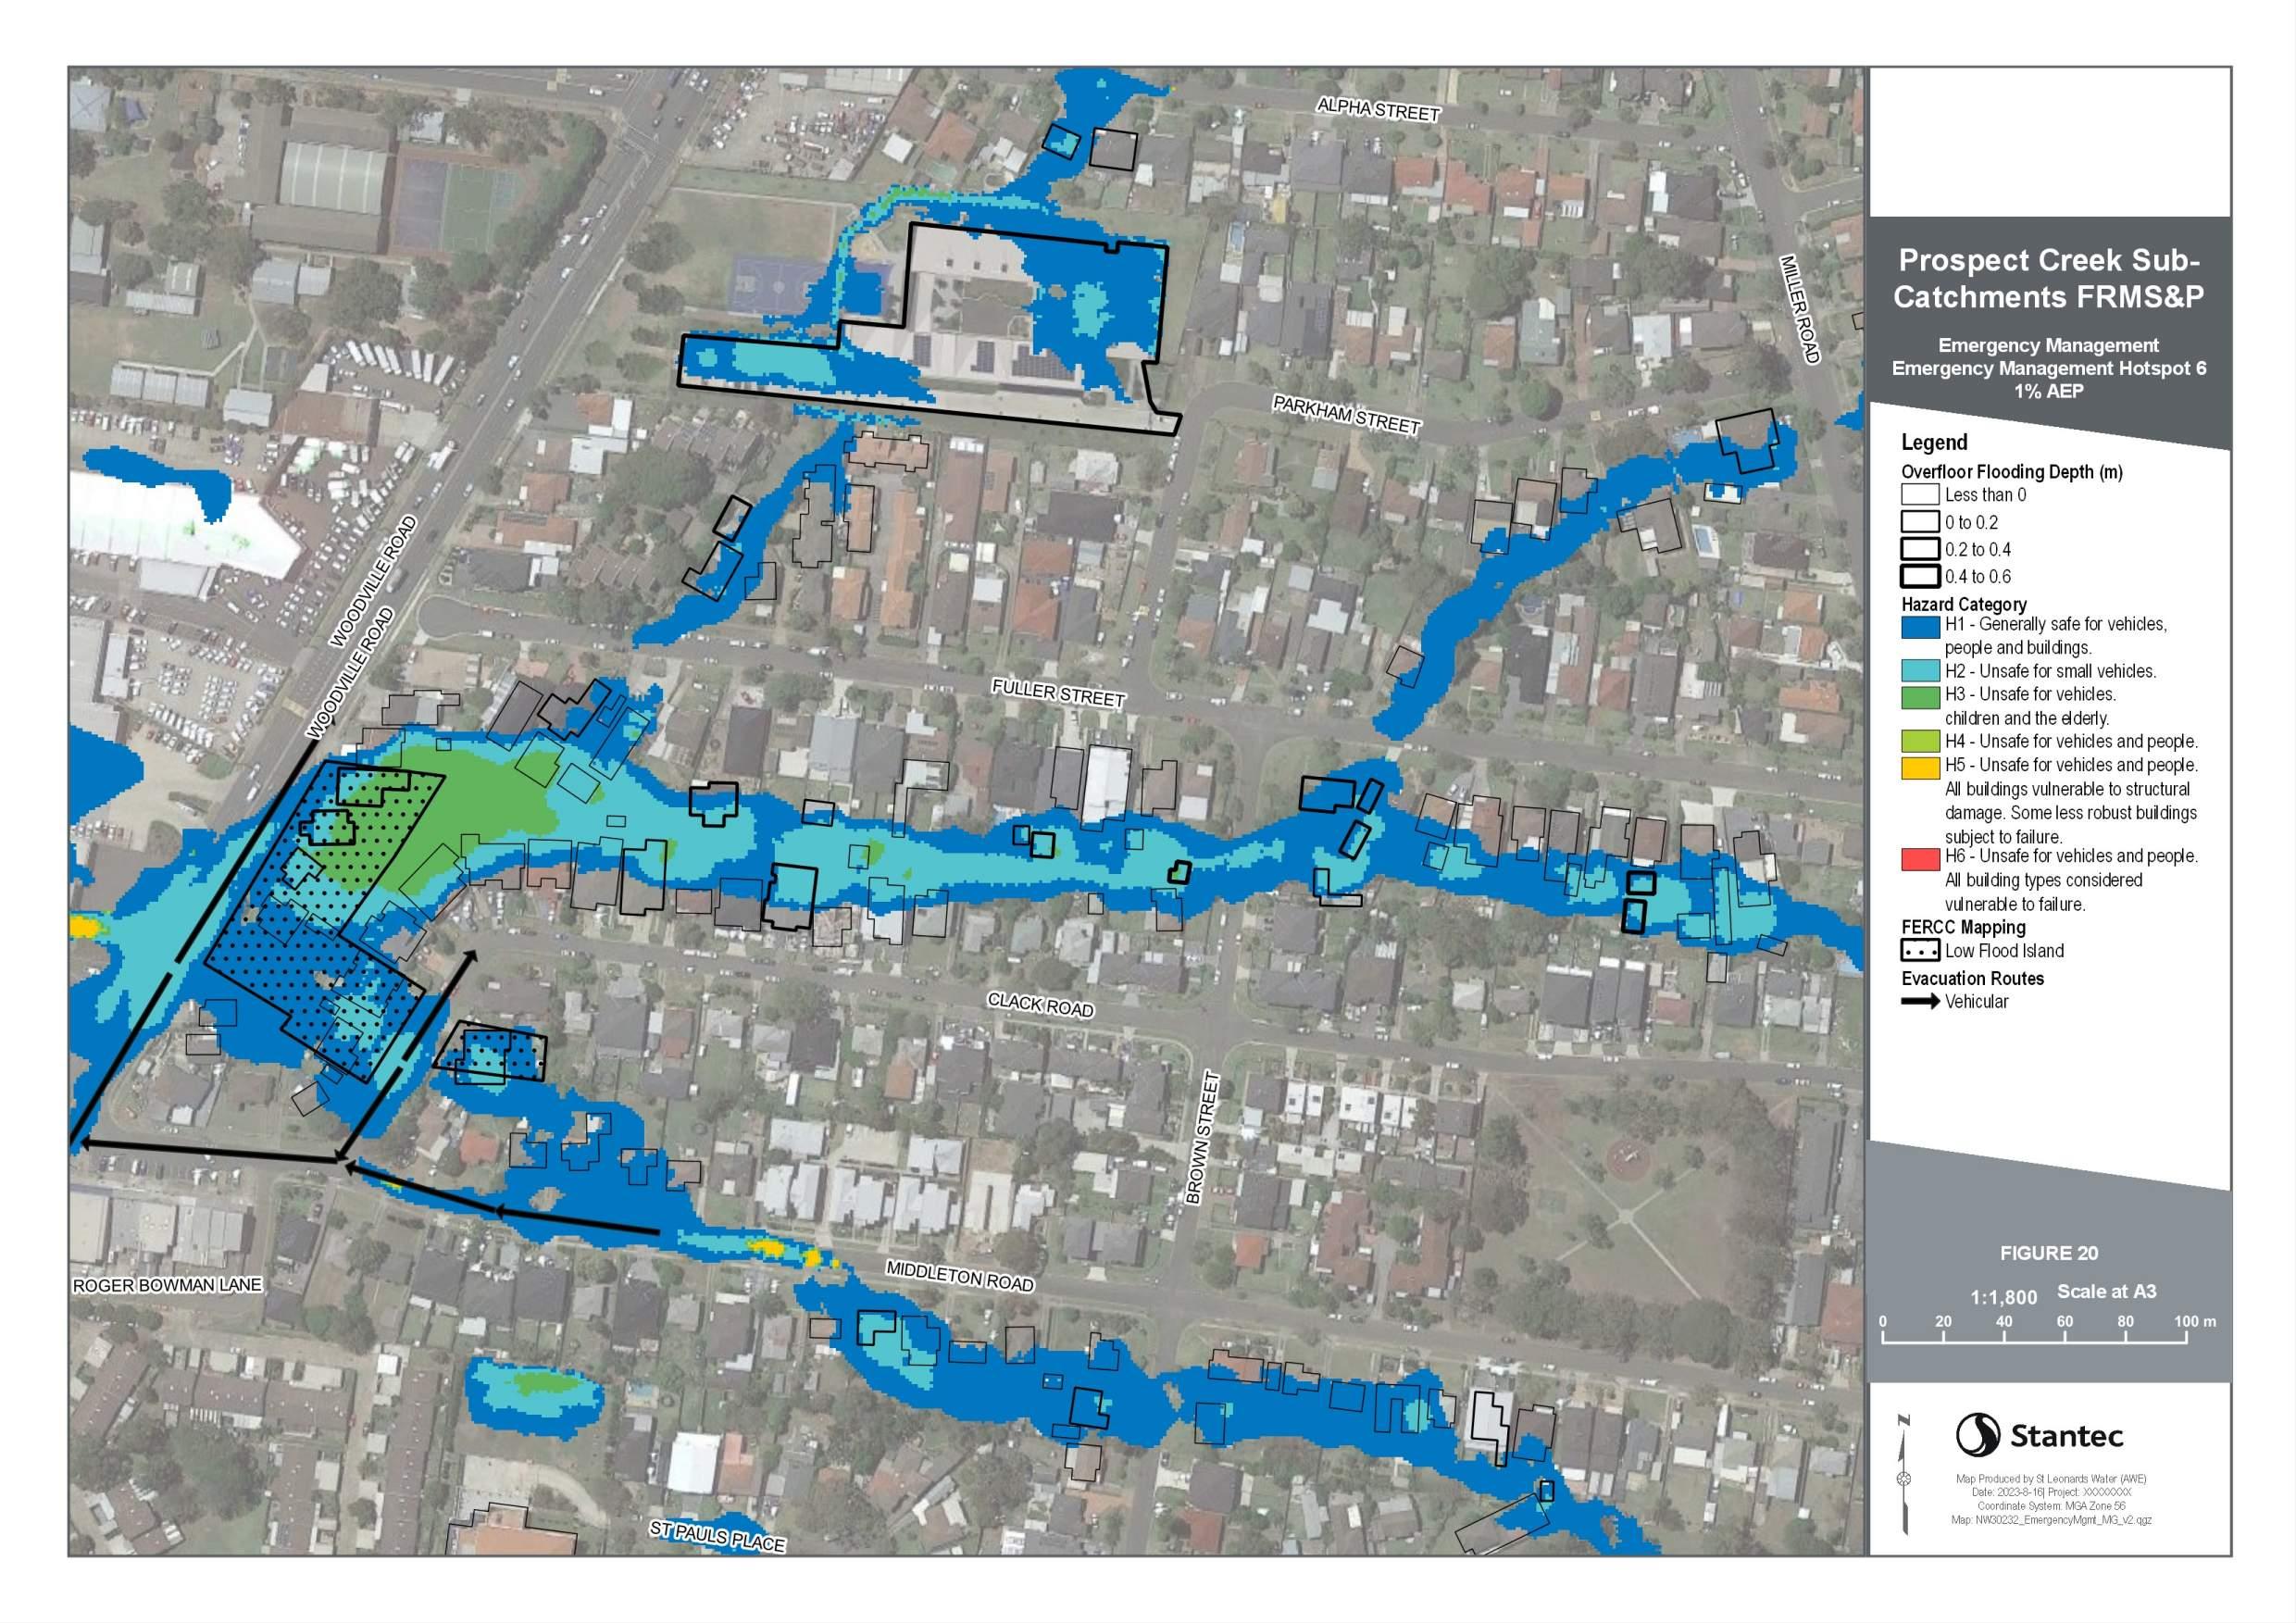

Prospect Creek Sub-Catchments

APPENDIX

SITE VISIT OUTCOMES AND PRELIMINARY OPTIONS SUMMARY
v
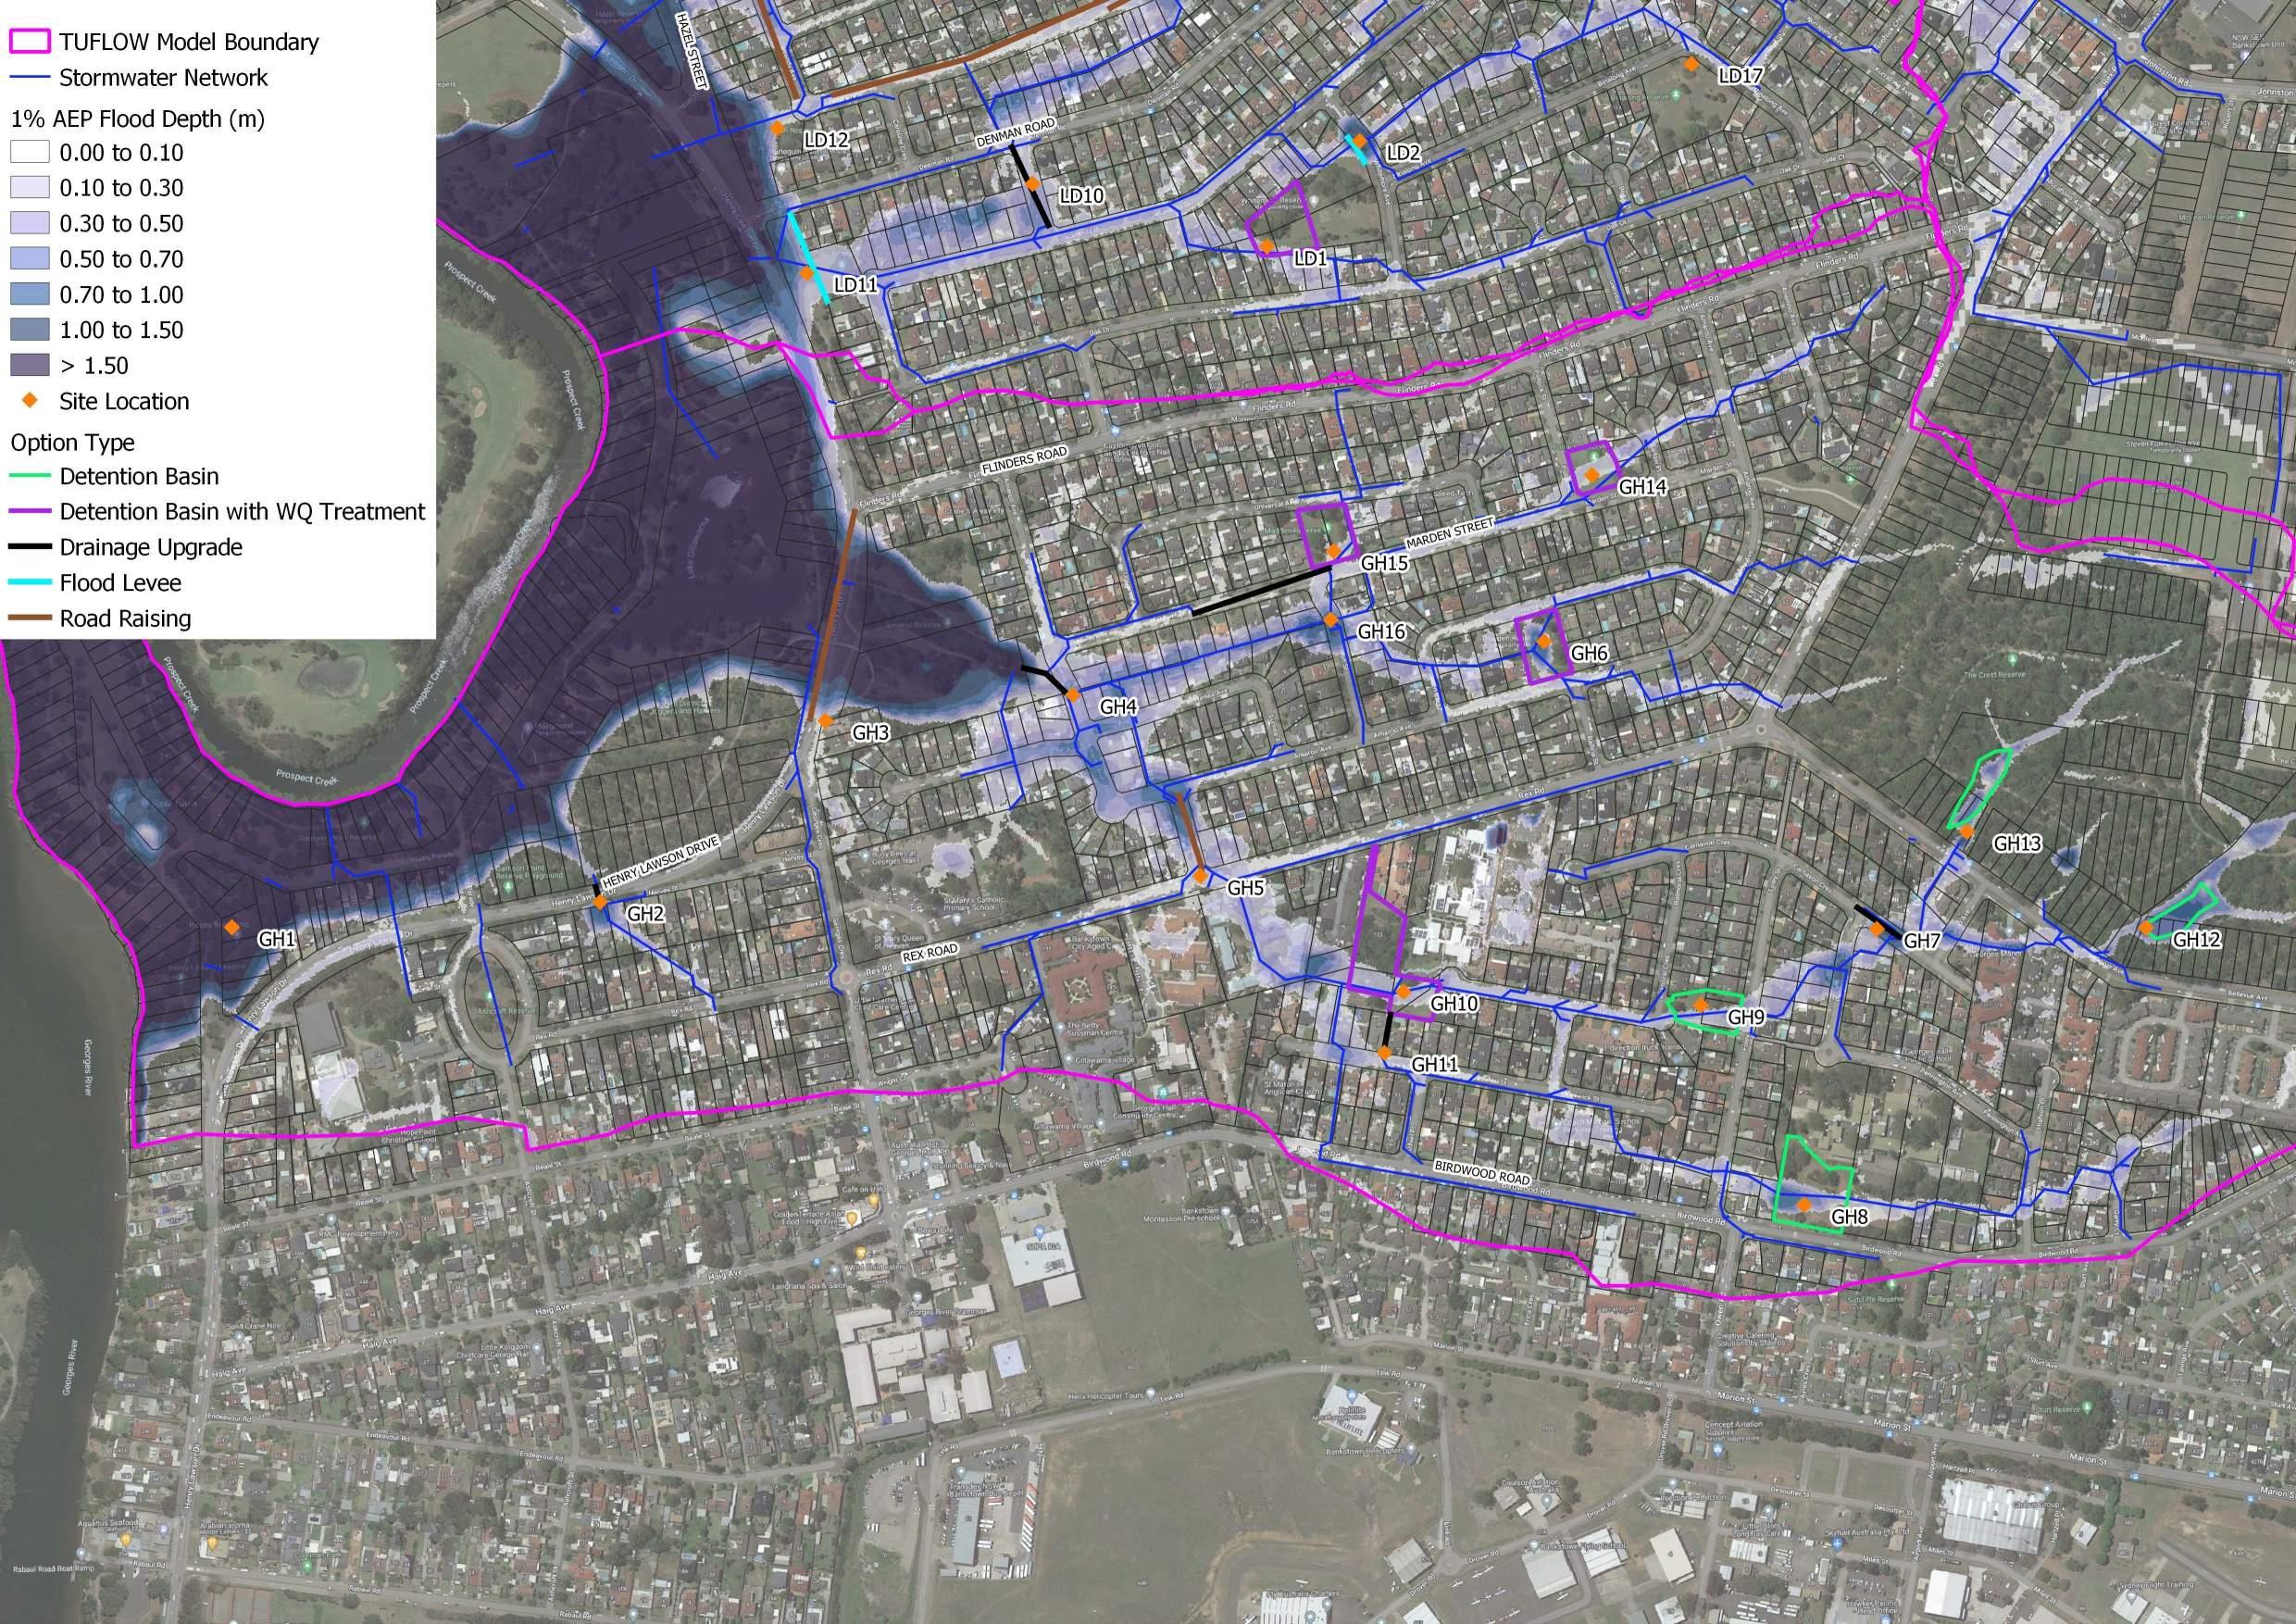
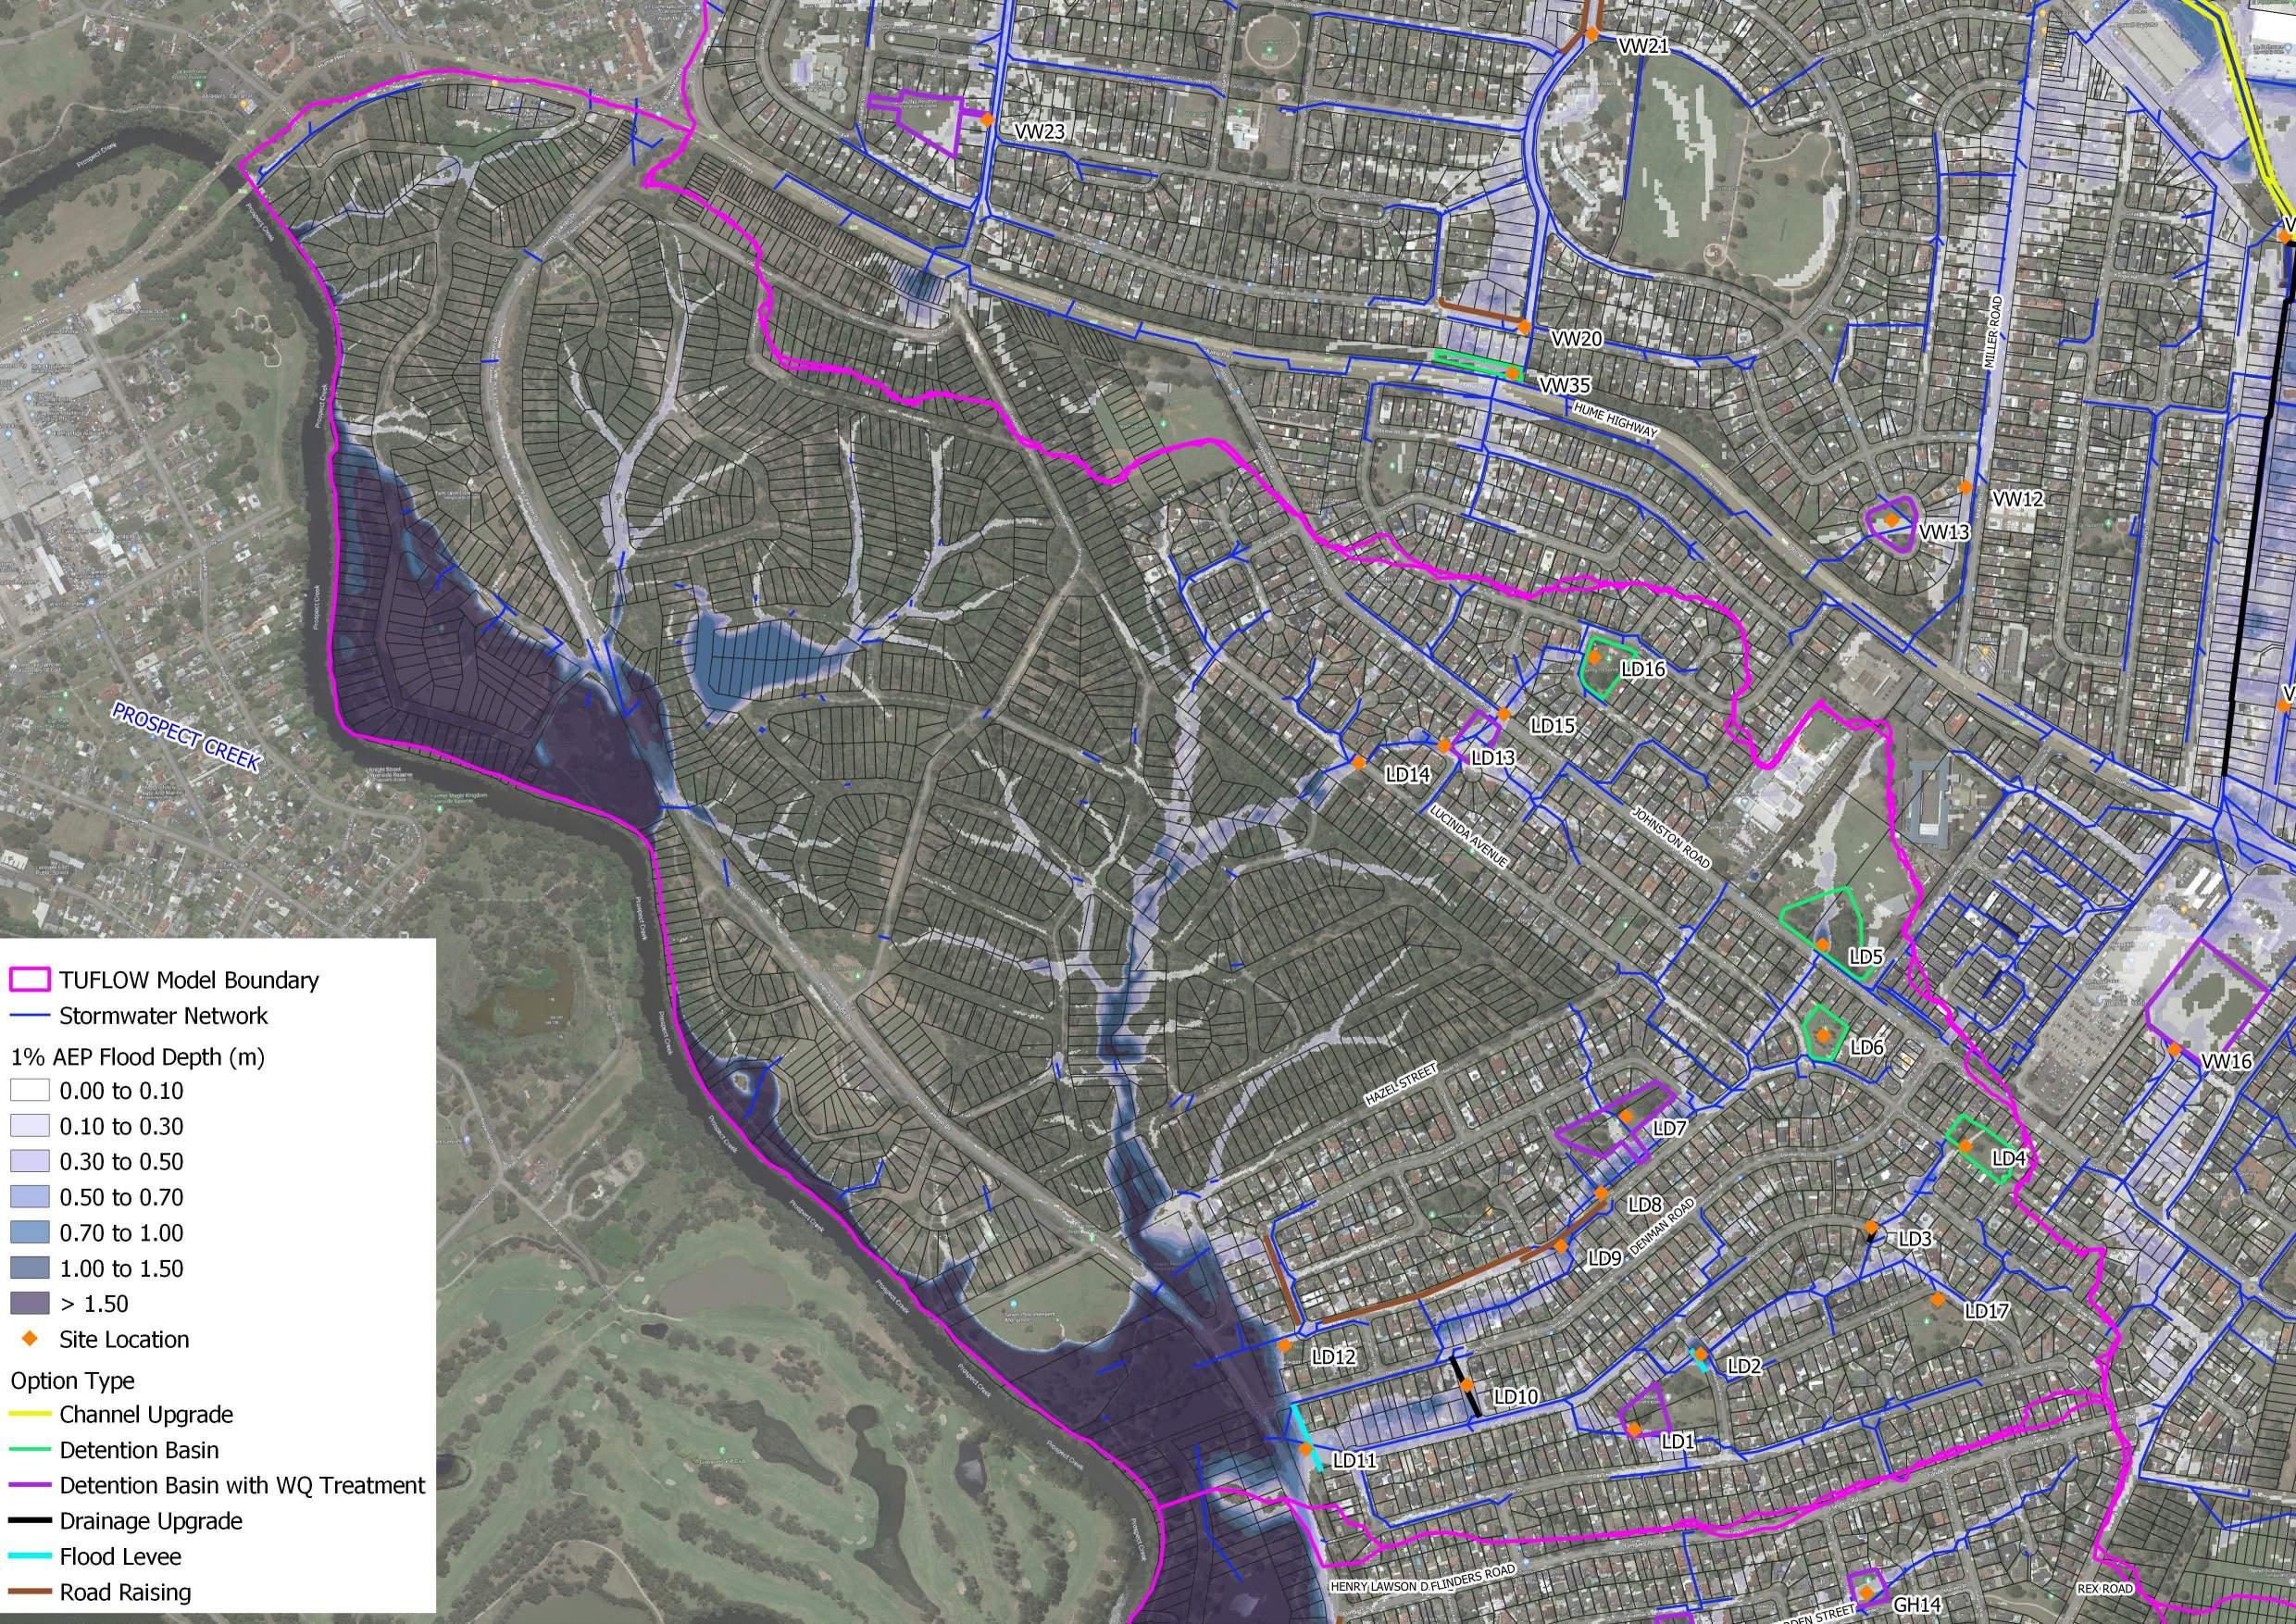
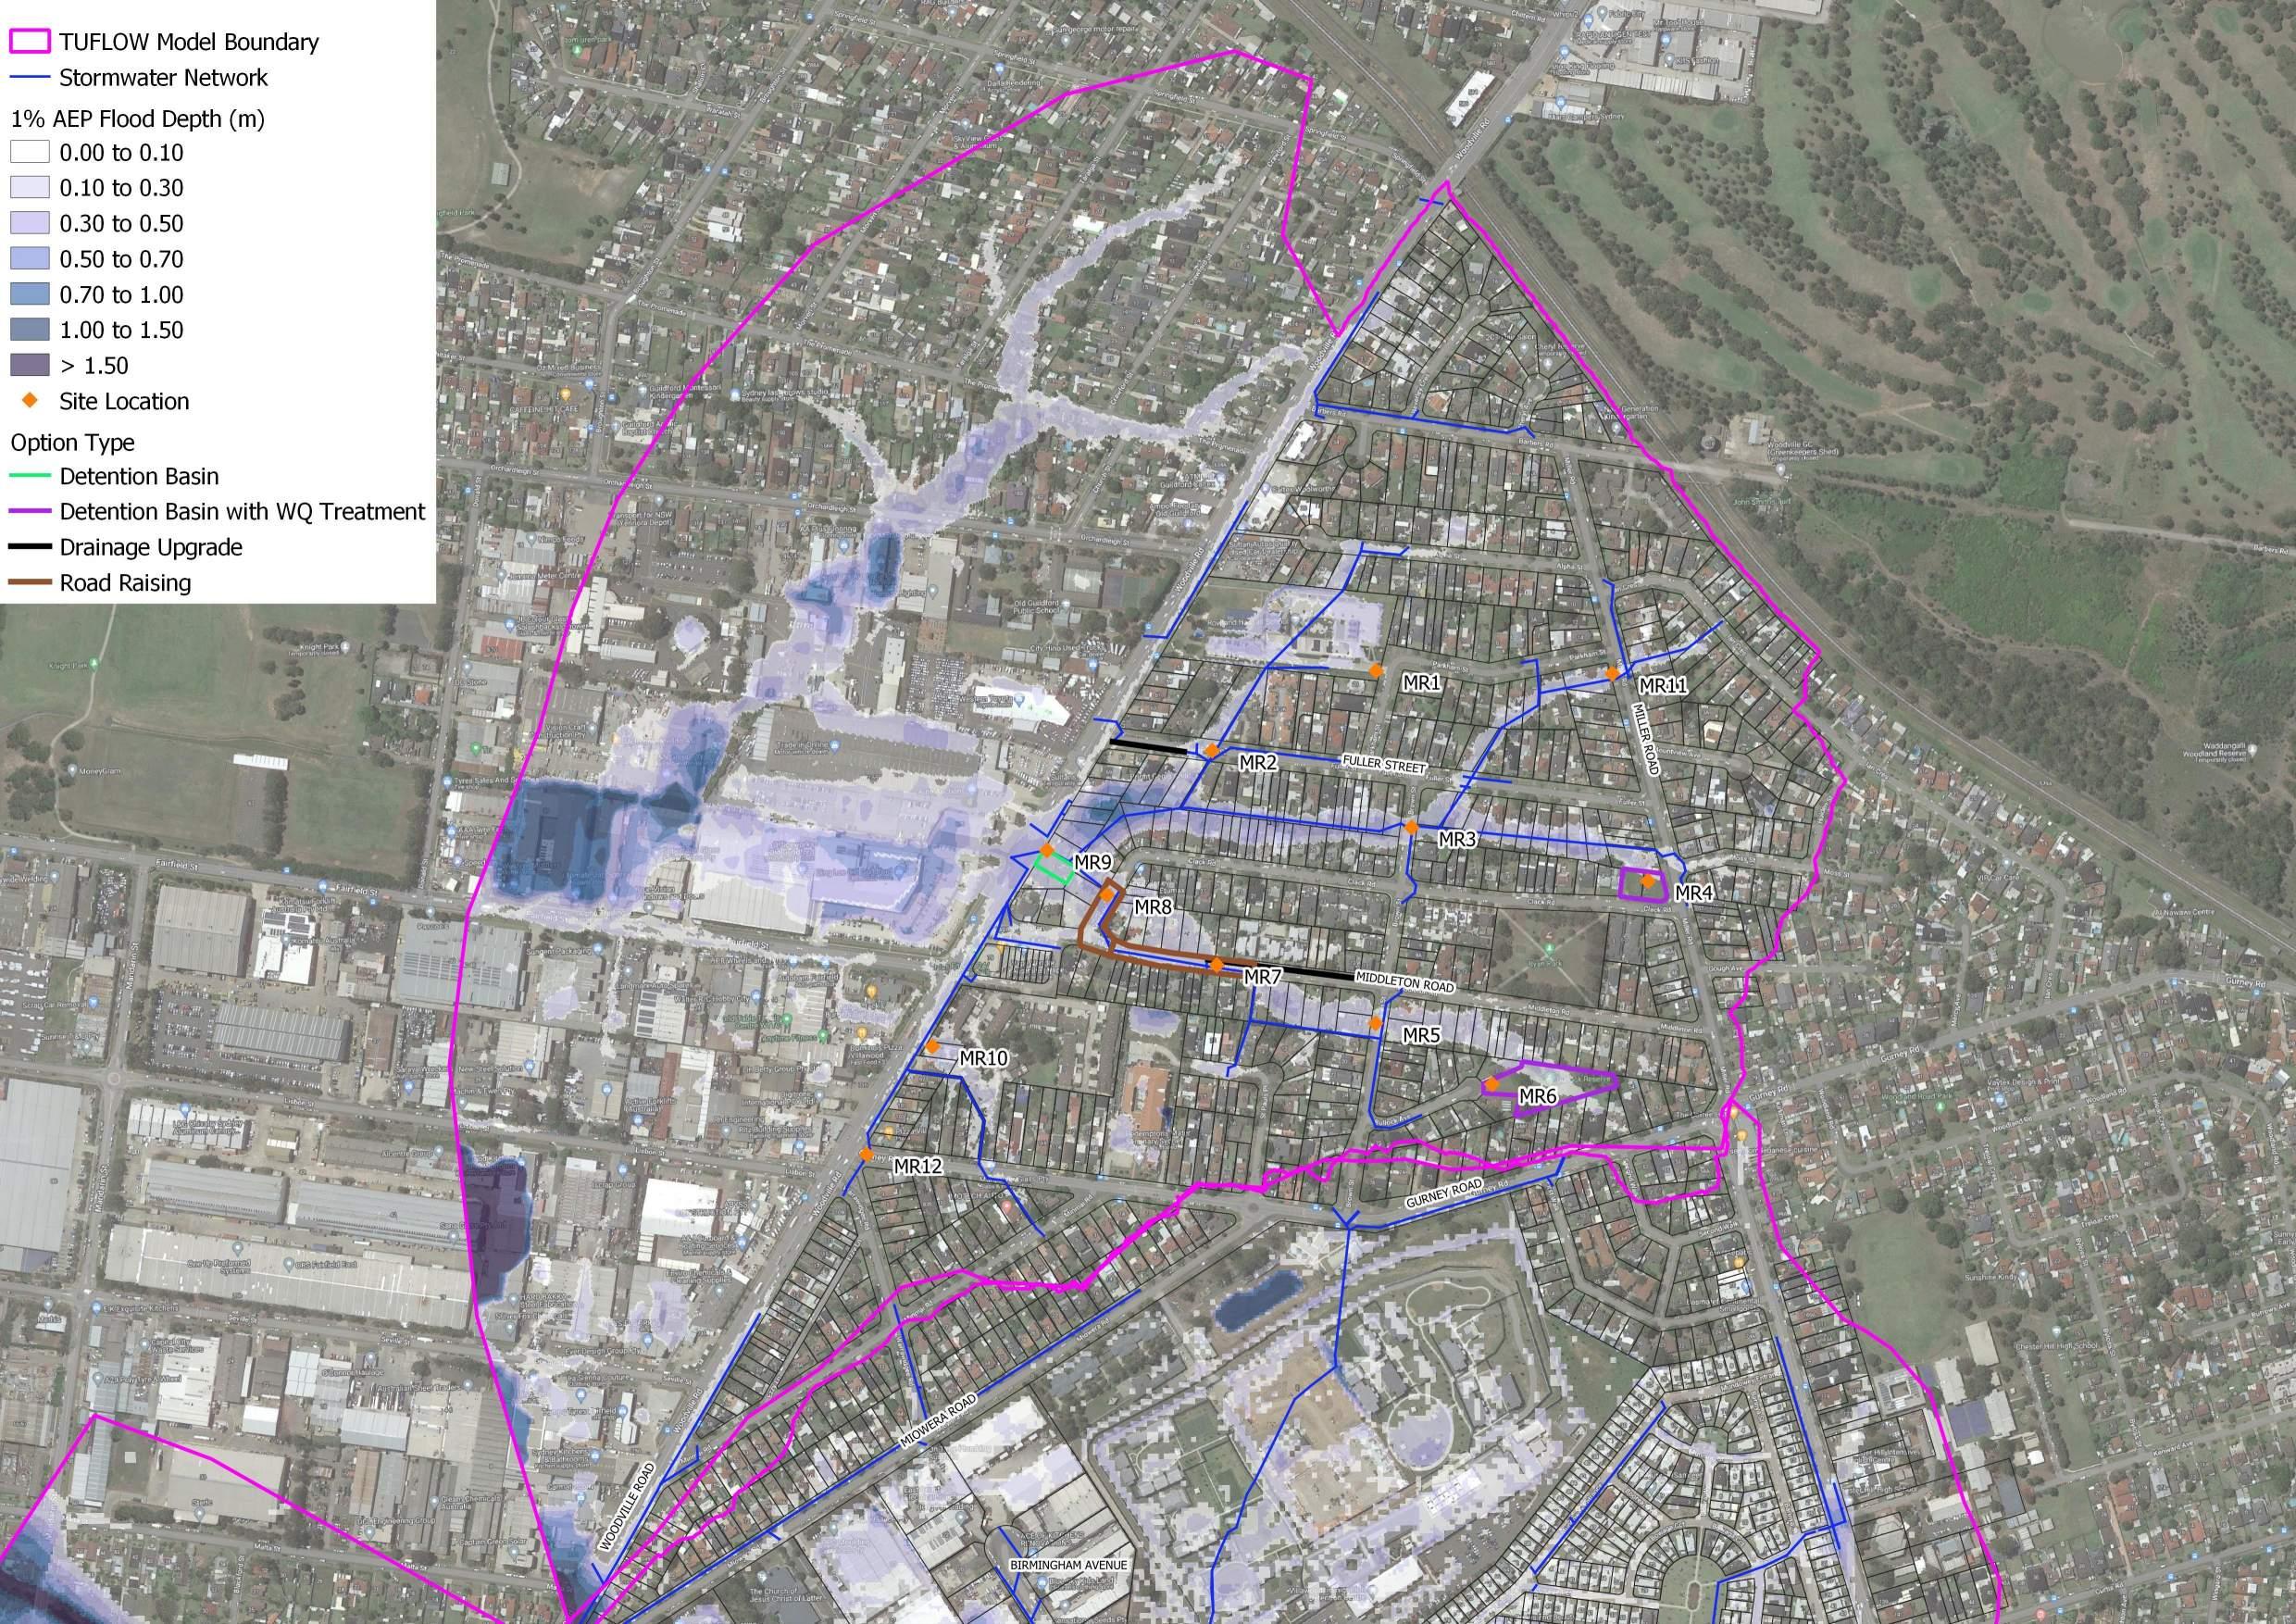
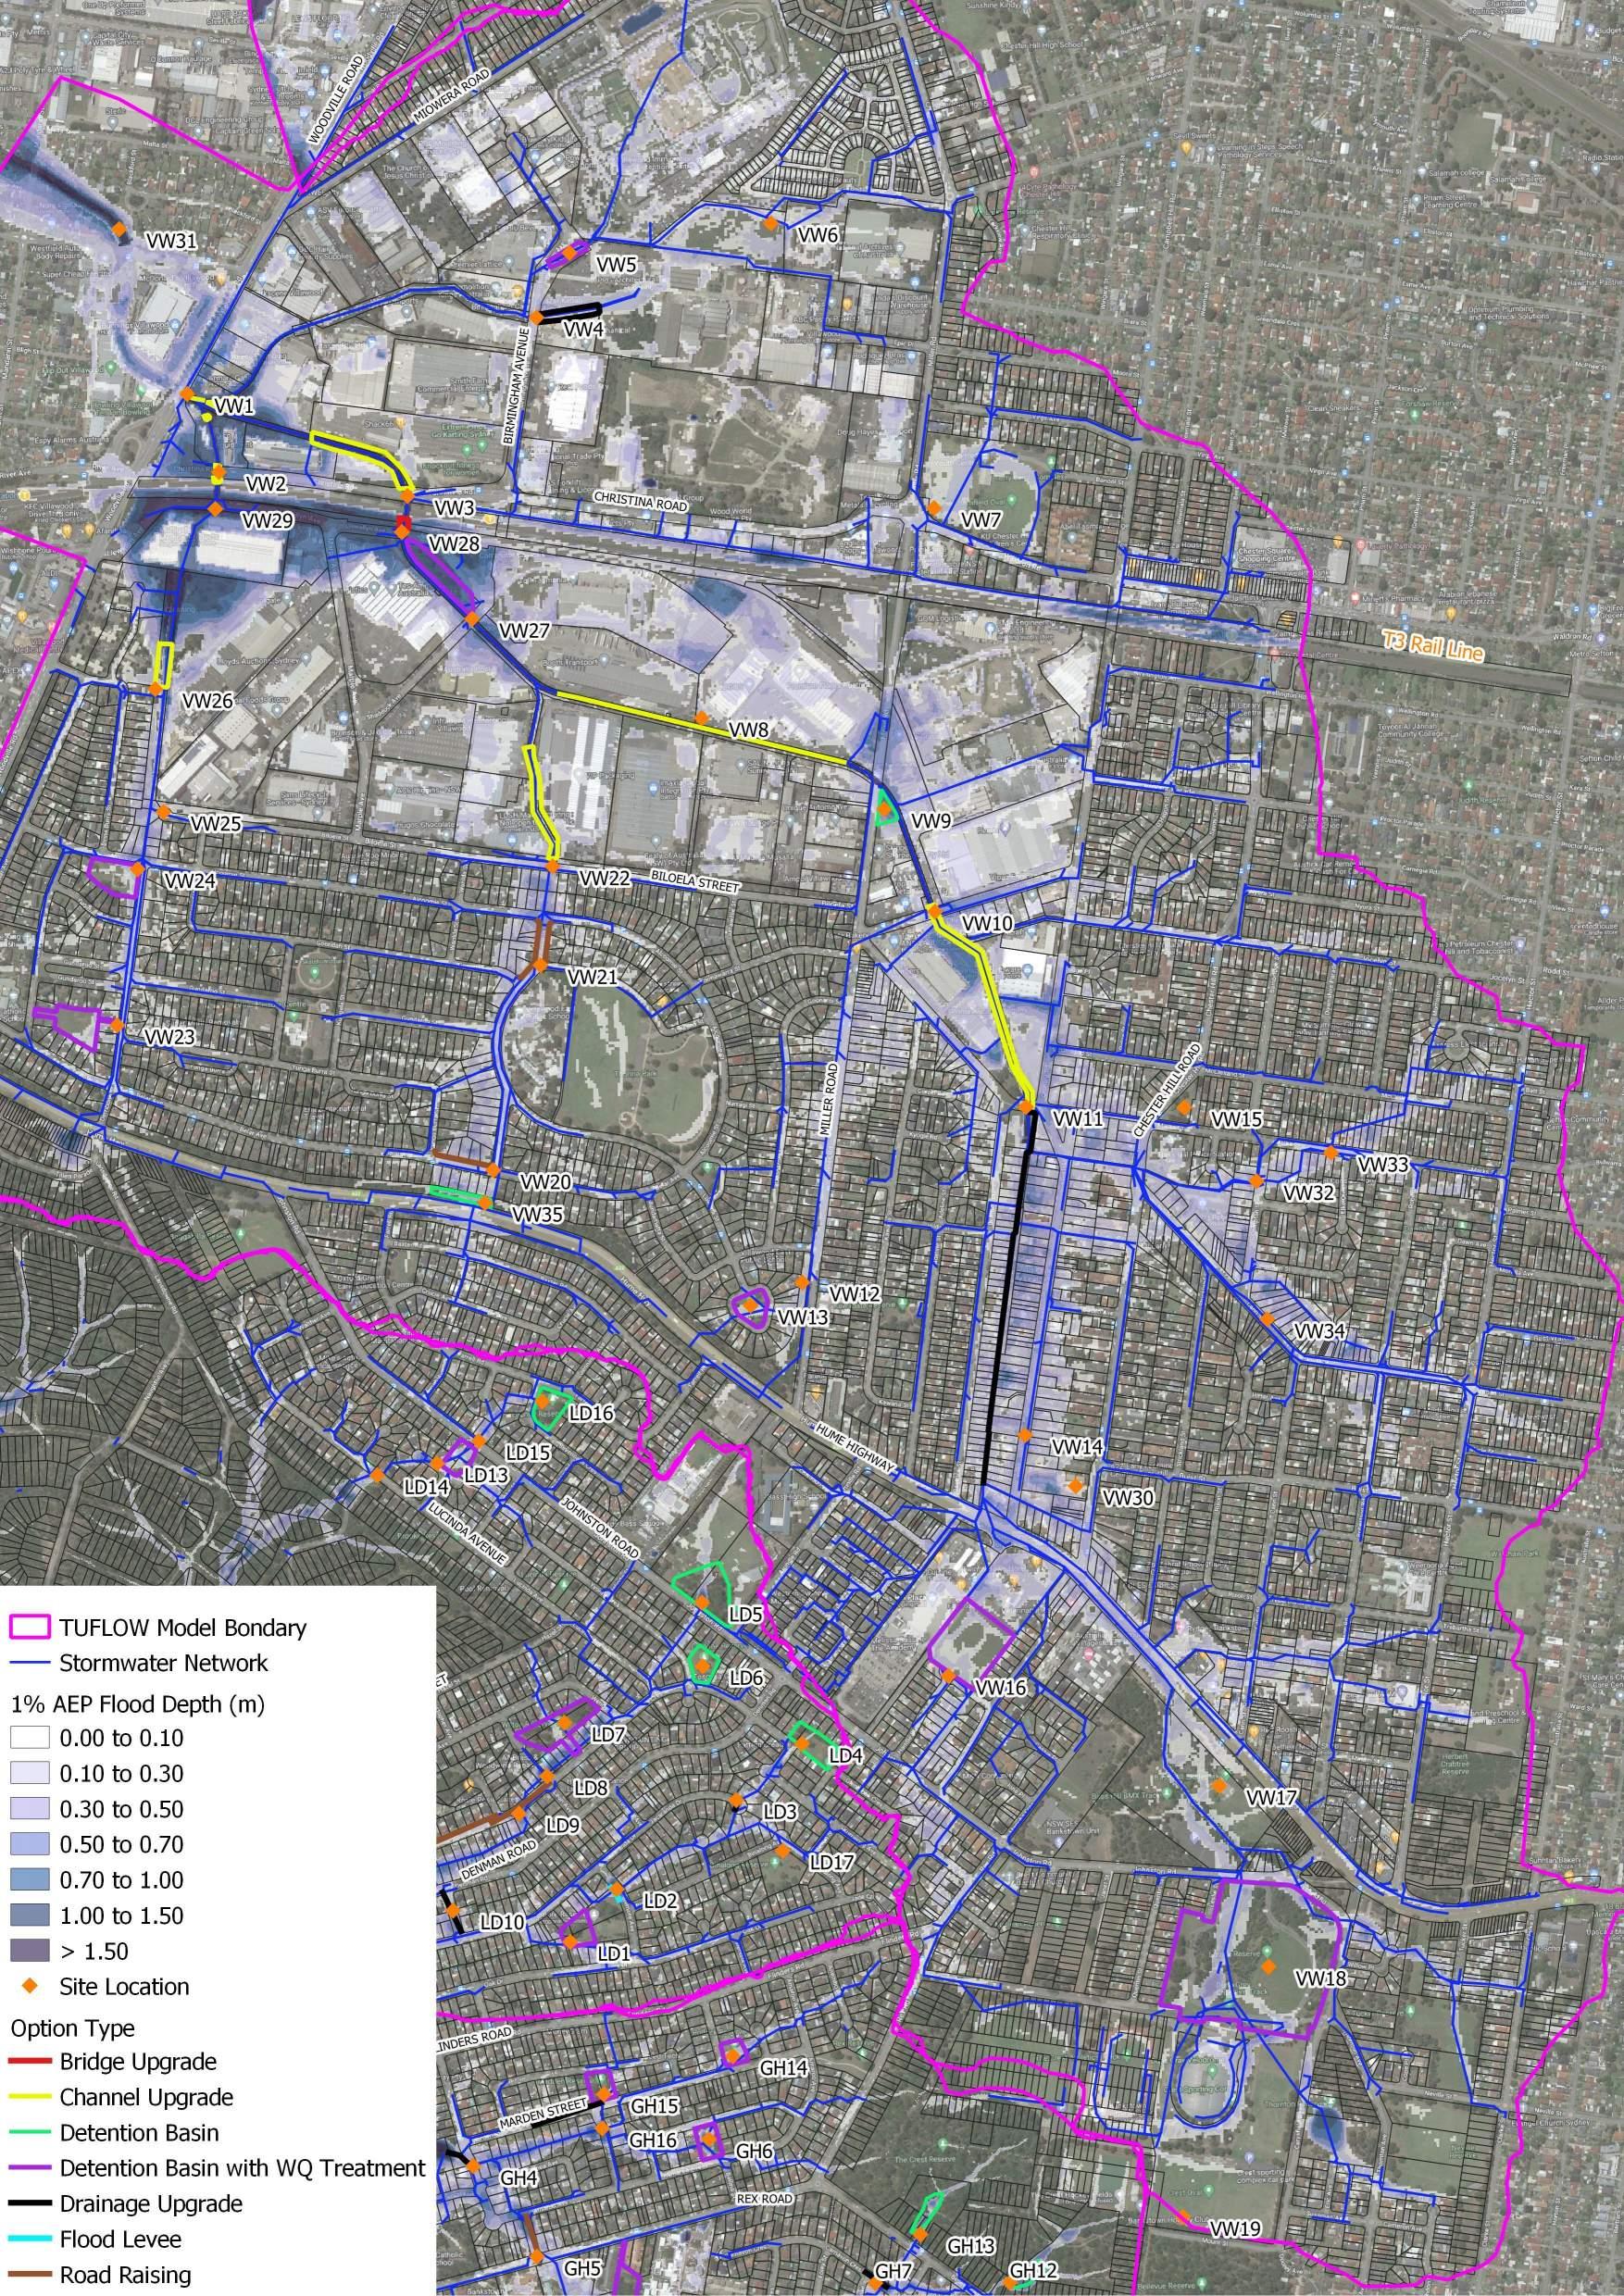
Prospect
Creek Sub-Catchments

APPENDIX

PRELIMINARY OPTIONS ASSESSMENT
v
Hall Replace 0.45mx0.9m grated inlet with 1.2mx1.2m grated inlet pit added in existing easement of ponding area in residential property
Replace short section of 0.45m diameter pipe with 0.6m diameter pipe to match downstream size
from the Keswick St diversion to the detention basin.
Detention basin placed in east, non-vegetated side of Keswick Reserve with invert of 10.7m AHD (1-2 metres cut), west side berm added to invert 12.2m AHD, with an 5m wide overflow weir at invert 11.6m AHD. Add inlet pit (0.9mx0.9m) to base of basin (10.7m AHD) connecting to existing drainage network through 0.45m pipe with 9.7m AHD invert.
FG4Rex Road Drainage Upgrade George Hall Two 0.3m high elevated side levels for Rex Road to slightly retain flows within road reserve and keep out of downstream properties. New 1.2mx1.2m grated inlet pit added in existing easement of ponding area in residential property 741341
For Amaroo Ave, add a 0.25m high diversion bund in the roadway, and 0.35m high bund for Harden Cres (7-8 metre ramp section on both sides to make it trafficable)
Add a 0.2m high bund along the property frontages downstream on Harden Crescent to retain flows in the road reserve Detention basin berm increased in height to 17.5m AHD instead of existing level 16.8m AHD. No change to base of the existing basin. No change to pit and pipe network. If the basin were to be converted into a WQ treatment basin, the inlet could be elevated to provide extended detention depth in the base of the basin, however this has not been modelled.
For Anembo Ave, Amaroo Ave and Barlow Place, add a 0.3m high berms on the low side of the road reserve to better contain flows in road.
282922172218
Low - Localised minor WL decreases in all events on 3-6 properties Very Low - Large basin to be constructed in public park with SydneyWater sewer in the area. Drainage easement to be lowered and significant road works required to create diversion
Low - Localised major WL decreases in 5yr & 20yr events on 4-7 properties, negligible benefit in 100yr
MediumWidespread moderate WL decreases in all events.
- Earthworks for basin berm,
High - Only requires two berms along
High - Retrofit of an existing basin with only change to increase berm height. Requires road works for speed bump to divert flows
Medium - Mostly earthworks for basin berm and roadworks for speed bumps
Yes - Widespread benefits with retrofit of existing basin FG6
To address additional ponding in road reserve, add 3m lintel with 0.45mx0.9m inlet pits at Anembo Ave, Amaroo Ave and Barlow Place connecting into existing 0.6m trunk drainage pipe through new 0.375m pipe connections Detention basin Pollock Reserve with invert of 18.0m AHD (1-2 metres cut), west side berm added to invert 20m AHD, with an 5m wide overflow weir at invert 19.7m AHD.
This 0.6m pipe is proposed to daylight into the lowered basin invert allowing water quality treatment of low flows from the drainage network.
The basin will be drained by a 0.6m diameter pipe with a pit inlet of 18.5m AHD to allow extended detention of 0.5m for WQ treatment.
For south Bambil Street, add a 0.2m high diversion bund on the west edge of the roadway, and 0.3m high bund for the east edge and Rex Road frontage to retain flows in the road reserve
2315 (-1)23 (-3)151922 (-2)
MediumWidespread moderate WL decreases in all events.
FL2Wilton ReserveDetention BasinLansdowne
Add a new trunk drainage line from Bambil St to the south to the existing culvert outlet location in Amaroo Reserve. The new trunk drainage line will divert flows from part of the existing stormwater network for Amaroo Ave. Details of the proposed trunk drainage line are included in the figure below. All 13 inlet pits (5 duplicates in model) are assumed to be 4.2m lintels with 0.45mx0.9m pits 353739303538
For Oak Drive add a 0.3m high berms on the low side of the road reserve to better contain flows in road Detention basin in Whitemore Reserve with invert of 10.5m AHD (1.3 metres cut), west side berm added to invert 11.35m AHD.
address additional ponding in road reserve, add two 3.6m lintel with 0.45mx0.9m inlet pits at Oak Drive connecting into new 0.45m
pipe to be continued west and then along existing drainage easement corridor to Whitemore Reserve
The basin will be drained by 0.45m x 0.9m pit and a 0.6m diameter pipe with a pit inlet of 9.85m AHD.
For Wendy Ave, a berm in the road edge has been added to elevation 19.3m AHD (0.5m high)
Lowering of Wendy Ave road to 18.7m AHD to divert flow north into Wilton Reserve and away from properties Diversion channel along reserve with 0.3m high berm and cut channel section to maintain flows away from residential properties Detention basin in Wilton Reserve with invert of 15.7m AHD (1-1.5 metre cut). The basin will be drained by 0.45m x 0.9m pit and a 0.45m diameter pipe into existing 1.2m dia trunk drainage.
For Athel Street, add a 0.3m high diversion bund on the west edge of the roadway
FL3
Add a new trunk drainage line from Athel St to the east to the existing culvert outlet location in Jacaranda Reserve near Henry Lawson Drive. The new trunk drainage line will duplicate the existing 1.2m diameter pipe along Jacaranda Drive. Details of the proposed trunk drainage line are included in the figure below. All 5 duplicate pits in the model are assumed to
(-1)7 (-2)3 (-3)76 (-2)3 (-2)
Medium - Major earthworks with SydneyWater sewer in the area and loss of public playground.
Medium - Mostly earthworks for lowering basin and adding berm wall
- Widespread major WL decreases in all events Low - New pit and pipe network proposed along Amaroo Ave with existing pit and pipe network and Sydney Water to be avoided
Low - Localised moderate WL decreases in all events. Localised WL increases that should be able to addressed in design refinement.
Medium - Major earthworks and new pipe along existing drainage corridor.
- Significant lengths of new large diameter pipes and additional inlet pits
Medium - Earthworks for lowering basin and adding berm wall and adding pipe length from Oak Drive to basin
No - Major benefits occur in the downstream road reserve with benefits further downstream. FG5 Harden Reserve has similar benefits downstream with lesser scope of works involved.
122823122320
High - Widespread major WL decreases in all events.
Low - Major earthworks and signfificant lowering for basin and altering of Wendy Ave terrain and diversion channel around properties. Sydney Water sewer near the basin
High - Mostly earthworks for lowering basin and adding diversion channel. Roadworks to divert flows
No - Limited downstream benefit with only localised improvments. Significant scope of works for such benefits
for
and
Preliminary Flood Modification Options 20% AEP 5% AEP1% AEP 20% AEP 5% AEP1% AEP
Drive Drainage Upgrade
FG1 Henry Lawson
George
333234 Low
Localised moderate WL decreases in all events on 3-4 properties Medium - Minor works with SydneyWater sewer in the area and works on private property in existing easement. Low - Works only include new inlet pits and short length of pipe adjustment No - Localised benefits mostly affecting front yards
Georges Hall Public School Detention BasinGeorge Hall Raise
boundary
height
long),
overflow
at elevation 24.5m
-
FG2
berm along property
to 25.0m AHD (2 metres max
and 55m
with an 8m wide
weir
AHD
basin. 3414236 Low
major
decreases
5yr
events
properties,
properties benefit
100yr Low
Medium
Mostly earthworks
basin berm
pipe alterations
new basin discharge
No
Low feasibility with works in school property with only localised benefits
Upgrade George Hall For Keswick St to the south, add a 0.25m high diversion bund in the roadway (7-8 metre ramp section on both sides to make it trafficable) Existing concrete easement is lowered by 0.3 - 0.5 metres to convey the additional surface runoff
Move existing inlet pit (0.9mx0.9m) to downstream of basin to drain low point on neighbouring property. Add a second 0.9mx0.9m inlet into base of
- Localised
WL
in
& 20yr
on 3-4
more
in
- Large basin to be constructed within public school grounds with SydneyWater sewer in the area
-
for
and
for
and inlet.
-
FG3 Keswick Reserve Detention Basin and Drainage
loss of playground, No - High cost, very low feasibility and only localised benefits. Could consider Keswick St diversion only
634734 Very
High
the edges of existing road. Only concern is driveway slopes. Adding inlet pit in backyard over existing pipe
within existing easement. Low - Minimal earthworks for two berms in road reserve and one inlet pit Yes - Localised benefits for minor works FG5 Harden Reserve Detention BasinGeorge Hall
and
Pollock Reserve Detention BasinGeorge Hall
FG7 Amaroo Reserve Drainage Upgrade George Hall
Yes
risk key area
Amaroo Ave FL1 Whitemore Reserve Detention BasinLansdowne
High
High
- High benefits for flood
on
To
diameter
13
Yes
High benefits
high flood risk
low feasibility
high
-
residential area with
cost
Jacaranda Drive Drainage Upgrade Lansdowne
match existing mostly 3.6m lintels with 0.45mx0.9m pits 21 (-2)23 (-2)2416 (-1)18 (-2)17 High - Widespread major WL decreases in all events. Localised WL increases that should be able to addressed in
Medium
High
Significant
new large diameter pipes
additional inlet pits Yes - High benefits for high flood risk residential area with medium feasibility and high cost FL4Amber ReserveDetention BasinLansdowne Detention basin in Amber Reserve with invert of 22.5m AHD (2 metres cut), west side berm added to invert 24.0m AHD (24.2m AHD on the north side) The basin will be drained by 1.2m x 0.9m pit
a 0.45m diameter pipe with a pit inlet of 21.0m AHD. 169013 Very Low
Localised minor WL decreases in all events on
properties Medium - Earthworks
signfificant lowering for basin Medium - Earthworks for lowering basin
adding berm wall No - Very low benefits Costs Recommendation for Detailed Option Benefits Summary Number
Overfloor Buildings with WL Number of Properties with WL Reductions Option Type SubCatchment Option Name Option ID Technical Feasibility Description
design refinement.
- New pit and pipe network proposed along Jacaranda Drive with existing pit and pipe network to be avoided
-
lengths of
and
and
-
3-6
and
and
of
Bullock Reserve berm to 39.3m AHD (1m high) and Bullock Avenue 0.2m high berm
Middleton Rd 0.3m high berm, Clack Rd 0.3m high berm and 0.2m high Middelton Rd near Woodville Miller Rd 0.3m high berm
Fuller St East berm to 34.8m AHD (0.4m high) and road cut to 34.5m AHD (0.3m lower)
Fuller St West berm to 30.2m AHD (0.3m high) and road cut to 29.9m AHD (0.6m lower)
Basin in Alcoomie Reserve with invert of 19.0m AHD (2 metres cut), north side berm added to 21.0m AHD (20.7m AHD spillway in centre that is 6m wide) 0.2m high berm across road to the south-west with slight lowering of grassed area to divert flows into the basin.
The existing 1.2m diameter pipe to the east is to be diverted into the basin, with a 1.2m pipe outlet to the existing location with upstream invert of 19.3m AHD (0.3m depth of ponding)
The existing 0.525m diameter pipe to the north is to be diverted into the basin, with
272933 (-3)142324 (-2)
MediumWidespread moderate WL decreases in all events
- Widespread
-
-
FV4Hume HighwayDetention BasinVillawood Basin in Hume Highway reserve with vertical walls and invert of 28.3m AHD (1.5 - 3.0 metres cut)
Four existing pipes to the south are to be diverted into the basin, with a 0.675m pipe, 0.375m pipe, 0.825m pipe, and twin 1.05m pipes with four outlets into the basin
230210
FV5Orchard Road Drainage Upgrade Villawood
Add two outlet pits on downstream end to drain basin with 0.675m pipe and twin 1.05m pipes, with inverts of 28.52m and 23.8m AHD respectively.
No changes to terrain are proposed
Add a new trunk drainage line from south end of Orchard Road to the existing culvert outlet location to the open channel to the north. The new trunk drainage line will divert flows from part of the existing stormwater network for Orchard Road. Details of the proposed trunk drainage line are included in the figure below. All 6 inlet pits are assumed to be four 4.2m lintels with 0.45mx0.9m pits
38 (-2)~90~10035 (-1)~70~90
NegligibleWidespread very minor WL reductions in 5yr and 20yr events
High - Widespread moderate WL decreases in all events. Localised WL increases that should be able to addressed in design refinement.
Medium - Basin to be constructed in road corridor. Native trees to be removed. Existing drainage to be diverted into basin and outlets to be added.
High - Mostly earthworks for basin berm and pipe alterations for new basin discharge and inlet.
Very low - Large pit and pipe network to be constructed with SydneyWater sewer in the area.
High - Significant lengths of new large diameter pipes and additional inlet pits
No - Negligible benefits
Yes - Despite scale of works required and high potential costs, the benefits for the large number of residential properties near Orchard Road is significant
FV6 Sir Thomas Mitchell Drive Channel Upgrade and Drainage Upgrade Villawood
The section under Sir Thomas Mitchell Road is proposed to be lowered by 0.9 metres as there is an existing vertical weir downstream of the bridge. So the bridge section and channel section immediately upstream would be lowered by 0.9 metres to tie in with downstream channel invert
Gradually the channel lowering reduces heading upstream to the side channel up until Orchard Road culvert. For the main channel section the base has been widened to 7.5m (in existing based on surveyed shapes). For the side channel the base has been widened to 4m (in existing varied typically between 2.5-3.0 metres)
Concrete lining is proposed for this length with roughness reduced to 0.018 (0.02 for main channel) from 0.04
FV7Llewellyn AveDetention BasinVillawood Basin in park with invert of 14.5m AHD (1.5 metres cut) to be 0.5-1.0 metres above existing channel invert. Channel section on this side was lowered to match the proposed basin invert
For Christina Ave side channel upgrades:
- The culvert under the railway line is proposed to be lowered by 0.6 metres
- The twin 1.5 metre pipes under Christina Ave are also proposed to be lowered by 0.6 metres and increased to twin 2.1m diameter pipes
- The channel section from Christina Ave to the confluence of channels is to also be lowered by 0.6 metres with the base of the channel widened through vertical side walls and a base width of 3.8 metres (existing base width is 0.9 metres)
68113613
Medium - Localised major WL decreases
Medium - Significant length of channel alteration and lowering of channel under road bridge
High
FV8Christina Ave Channel Upgrade and Detention Basin Villawood
- For the main channel section the base has been widened to 7.5m (in existing based on surveyed shapes).
- For the side channel the base has been widened to 4m (in existing varied typically between 2.5-3.0 metres) For Woodville Road basin:
- Basin in vegetated area with invert of 11.7m AHD (3.0 metres cut) to be 0.5 metres above existing main channel invert, but roughly in line with north side channel invert
- Channel sections for both the main channel (right bank) and north side channel (left bank) were lowered to match the proposed basin invert 5 (-3)885814
Widespread very minor WL reductions in 5yr and 20yr events
MediumWidespread moderate WL decreases in all events. WL increases that would be difficult to address Very Low - Lowering culvert under rail corridor requiring agreement from NSW Rail. Changing culverts under Christina Ave and channel edits. Highly contaminated vegetated area to be disturbed for detention basin High - Channel lowering for large length of channel and under railway and Christina Ave. Basin earthworks with contaminated lands Yes - Downstream impacts could be suitably removed and mitigated in later design stages. Potential benefits for the industrial area could be significant. Negligible, Very Low, Low, Medium, Very Low, Low, Medium, High
Low, Low, Medium, High No, Yes
20% AEP 5% AEP1% AEP 20% AEP 5% AEP1% AEP FM1 Miller Road Catchment Drainage Upgrade Miller Road
Alcoomie Reserve Detention BasinVillawood
Low
Minor eathworks to add berms along the side of roadways Low
Minor berm eathworks on side of roadways Yes
benefits with low cost works within road reserve. Will worsen flooding in road reserve FV1
7 (-1)17 (-2)14 (-3)7109 (-1) Low
increases that should be able to addressed
refinement. Medium
Large basin to be constructed in public park. Existing drainage to be diverted into basin
outlets to be added. Roadworks to add speed bump to divert flows into basin. Medium
Mostly earthworks for basin berm and roadworks for speed bumps Yes - Provides flood benefits for downstream residential properties. Also has co-location WQ opportunities FV2 Birmingham Ave Channel UpgradeVillawood Channel lowered by 1.5 metres below existing ground with 3m wide base and 15m total width Remove existing twin 1.2mW x 0.75mH trunk drainage line in place of swale Connect the swale into the existing twin 1.05m dia. Pipes under Birmingham Ave 233011 Negligible - Very localised benefits Medium - Earthworks to create drainage channel and alteration to pipes under Birmingham Ave. Existing drainage easement Medium - Earthworks to create drainage channel and headwall No - Localised benefits with negligible flood improvments outside of the area of proposed works FV3 Tucker Reserve Detention BasinVillawood Basin in Tucker Reserve with invert of 40.5m AHD (2.2 metres cut) The existing 0.9m diameter pipe to the east is to be diverted into the basin, with a 0.9m pipe outlet to the existing location with upstream invert of 41.0m AHD (0.5m depth of ponding)
Medium - Localised major WL decreases and widespread minor in all events Medium - Large basin to be constructed in public park. Existing drainage to be diverted into basin and outlets to be added. Native trees along reserve to be avoided Medium - Mostly earthworks for basin berm and pipe alterations for new basin discharge and inlet. Yes - Major localised benefits with relative feasibility
cost
a 0.525m pipe outlet to the existing location with upstream invert of 19.5m AHD (0.5m depth of ponding)
- Minor WL decreases in all events. Localised WL
in design
-
and
-
1510101679
and
- Channel lowering and concrete lining for large length of channel Yes - Localised benefits and continuation of Bennett St Drain upgrades
400000 Negligible
Very Low
the area. Native trees to be removed High - Utility movement, earthworks for basin lowering No - Negligible benefits
- Large basin to be constructed in public park with underground and overhead utilities in
Notes: Option Count: WL - Peak Water Level or Flood Level No9 Yes11 Option ID Option NameOption Type SubCatchment Description
brackets
Buildings
Benefits SummaryTechnical FeasibilityCosts
Detailed Option
Very
Approximate. Negative impact numbers in
Number of Properties with WL Reductions Number of Overfloor
with WL
Recommendation for
Preliminary Property Modification Options
House raising is a measure designed to reduce the incidence of over-floor flooding of existing buildings through works funded by Council, and with assistance from the NSW Office of Environment and Heritage (OEH). The Guidelines for voluntary house raising schemes (OEH, 2013a) sets out ineligibility criteria for house raising under the Voluntary House Raising (VHR) scheme and include the following:
PM1 Voluntary House Raising (VHR)
- Properties which are already benefiting substantially from other floodplain mitigation measures, such as houses already protected by a levee, and those that will be under future plans.
- Properties that would not achieve a positive benefit through damage reduction relative to cost (i.e. benefit-cost ratio less than 1). Consideration may be given to lower benefit-cost ratios where there are substantial social and community benefits, or where the VHR is compensatory work for the adverse impacts of other mitigation works.
The scheme should involve raising residential properties above a minimum design level, generally the council’s flood planning level (FPL), and comply with the council’s relevant development control requirements. This option is not applicable for properties which are “slab on ground” construction.
Flood proofing involves undertaking structural changes and other procedures in order to reduce or eliminate the risk to life and property, and thus the damage caused by flooding.
Flood proofing of buildings can be undertaken through a combination of measures incorporated in the design, construction and alteration of individual buildings or structures subject to flooding. It is primarily suited to industrial or commercial properties. Examples of proofing measures include:
- All structural elements below the FPL shall be constructed from flood compatible materials;
Recommendation for Detailed
Yes - Properties along Georges River, based on Georges River flooding to be recommended for house raising.
PM2Flood Proofing
- All structures must be designed and constructed to ensure structural integrity for immersion and impact of debris up to the 100 years ARI flood event. If the structure is to be relied upon for shelter-in-place evacuation then structural integrity must be ensured up to the level of the PMF; and
- All electrical equipment, wiring, fuel lines or any other service pipes and connections must be waterproofed to the FPL.
The NSW SES Flash Flood Tool Kit (SES, 2012) provides businesses with a template to create a flood-safe plan and to be prepared to implement flood proofing measures
Voluntary purchase is the optional purchase of pre-selected properties funded jointly by Council and the State Government. It would free both residents and emergency services personnel from the hazard of future floods by removing the risk, and is achieved by the purchase of properties and the removal and demolition of buildings. Properties could be purchased by Council at an equitable price and only when voluntarily offered. Such areas would then need to be re-zoned under the LEP to a flood compatible use, such as recreation or parkland, or possibly redeveloped in a manner that is consistent with the flood hazard.
PM3Voluntary Purchase (VP)
Voluntary House Purchase is funded by Council with assistance from the State Government. However, due to the relatively expensive nature of such a program, limited availability of Government and/or Council funding can be a major constraint to undertaking Voluntary House Purchases. Typically, only a small number of properties within a floodplain can be considered for Voluntary Purchase, however more can be assisted if funding is available.
No - Current DCP provisions should address future development.
PM4Land Swap
PM5Council Redevelopment
An alternative to voluntary purchase is the consideration of a land swap program whereby Council swaps a parcel of land outside of the flood prone area, such as an existing park, for a parcel of flood prone land with the appropriate transfer of any existing facilities to the acquired site. After the land swap, Council would then arrange for demolition of the building and have the land re-zoned under the LEP to open space. Since a detailed floor level survey has not been undertaken and over floor flooding has been estimated based on a desktop assessment, it is recommended that Council undertake a detailed floor level survey to validate if properties identified for voluntary purchase are suitable for land swap
This option also provides an alternative to the Voluntary Purchase scheme. While Council would still purchase the worst affected properties, it would redevelop these properties in a flood compatible manner and re-sell them with a break even objective.
Yes - Properties in the study area to be considered for house purchase.
PM6 Stormwater System Maintenance
No - Further analysis to be documented, however from high level review conducted to date no properties are immediately apparent for being suitable for a scheme of this type.
No - Further analysis to be documented, however from high level review conducted to date no properties are immediately apparent for being suitable for a scheme of this type.
Vegetated road sides result in significant leaf and branch drop which build up over time and often results in drainage inlet pits blocking rapidly when runoff events occur. This can lead to concentrated and uncontrolled overland flows occurring downslope of these inlets thereby increasing surface flows through streets and private properties. It is recommended that regular street sweeping is undertaken to reduce the potential for the inlets to become blocked and subsequently reduce the frequency of uncontrolled overland flows on streets and through private properties.
In addition to regular street sweeping which reduces the potential for inlet pits to become blocked, it is also recommended that stormwater pits in areas subject to flooding are cleaned on a more frequent basis. Suction machines can be used to remove silt and rubbish from the pits.
No - Current program of stormwater maintenance should be sufficient. Works unlikely to be covered by Flood funding. No, Yes
Option Count: No4 Yes2
Option Option ID Option Name Description
Preliminary Emergency Management Modification Options
The critical duration and response times for the study area floodplain limit the implementation of a flood warning system. The short duration flooding experienced in local systems is not well suited to flood warning systems. Severe weather warnings are likely to be the only assistance for these areas.
EM1
Flood Prediction and Warning
Council may wish to consider developing an early warning alert system to provide registered residents and business owners with free severe weather alerts. By monitoring BoM weather warnings and other sources, Council could send alerts based on potentially dangerous weather events. The alerts would likely cover weather events such as:
- Hail and severe thunderstorms;
- Destructive winds and cyclones; and
- Floods from a number of different sources including king tide, storm surge and tsunamis. Alerts could be sent by Email, SMS, Recorded message to a landline.
As a minimum, Council should co-ordinate and contribute with the regional flood warning system currently being developed for Georges River.
Having a robust EM plan that can provide the basis for responding to various scales of flood threat and be altered to fit the particular circumstances of an event can assist with flood preparation, response and recovery. The review of local flood plans should also include:
Recommendation for Detailed Option
Yes - Whether just contributing to the regional warning system being developed for Georges River, or implementing specific local warning systems
EM2
Review of Local Flood Planning and Information
Transfer to NSW SES
- A review of the current flood warning classifications (minor, moderate and major) for the location relative to the impacts on the community and any associated recommendations
- Clarification of the scale of impacts and the scale of the emergency response required in relation to key events and the associated flood timings so this can inform decisions and logistics. For example, for a levee protected community, having a plan in place on how to respond to floods that do not threaten the levee, threaten to result in minor overtopping of the levee, and for extreme floods that overwhelm the levee and town, can provide flexibility
- A review of other key information in the plan in light of the information in this study.
The findings of this FRMS&P are an important source of catchment specific information for the NSW SES and Council. Details of flood risks at specific locations are important for planning of operational tasks and for the future review of the Flood Emergency Sub-Plan.
Flood awareness is an essential component of flood risk management for people residing in the floodplain, it is important to maintain an adequate level of flood awareness during the extended periods when flooding does not occur. A continuous awareness program is required to ensure new residents are informed, the level of awareness of long-term residents is maintained, and to cater for changing circumstances of flood behaviour and new developments.
This option would focus on education of the entire LGA with the objective to educate residents that may be in the floodplain at the time of flooding, or may attempt to enter floodwaters. There are a broad range of approaches that can be adopted, which all should be done in close consultation with NSW SES:
- Develop FloodSafe Brochure and FloodSafe Toolkit;
- Develop a post-flood data collection strategy;
- Hold a FloodSafe launch event;
- Develop a flood information package for new residents.
EM4 School Education Program
The SES has developed a tailored program for school children in primary schools. The program, includes teacher’s resources, newsletters, activities and games, is designed to deliver knowledge and awareness of floods to young children. SES personnel are also available to visit schools to talk about flooding and flood response. Further details of these programs are available on the SES StormSafe website.
Education of parents / carers relating to the flood affectation of the school and the emergency response procedures in place to ensure the safety of their children could be provided directly or through children in the form of brochures etc. Particularly for the Prospect Creek sub-catchments floodplain it should be reinforced to parents that as all schools have programs in place so they should never enter floodwaters in an attempt to reach their children at school.
Yes - The Local Flood Plan is currently being developed by NSW SES with ongoing review by Council. Providing outcomes from the FRMS&P to NSW SES is essential.
Yes - Recommended outcome of the FRMS&P
No - SES / DoE requirement not Council
EM5 Flood Markers and Signage
EM6 Flood Data and Debrief
While the above public programs can be effective in improving the long term awareness of flood risk, in the event of flooding these education programs can easily be forgotten. Therefore flood warning signage can be an effective tool to remind or inform residents of the risks associated with entering floodwaters, and to also provide practical information in the event of flooding such as recommended evacuation routes.
Appropriate flood warning signs should be posted at all locations of significant flooding. These signs may contain information on flooding issues, or be depth gauges to inform residents of the flooding depth over roads and paths. Also evacuation route mapping could be provided on these signs to assist residents.
A flood event provides an ideal opportunity to capture information on the flood and learn from it. It helps understand the event, the consequences for the community, successes and limitations in current management practices and how the community recovered. Information can be captured in coordinated community surveys. This information should be collated and a report produced to catalogue what has been captured and its availability and format. The data should be securely stored and made publicly available. The information can be used in both explaining this event to the community and in considering future flood risk, EM and land-use planning decisions within and potentially beyond this community
Yes - Recommended outcome of the FRMS&P
Yes - Recommended outcome of the FRMS&P. Post flood funding available from NSW DPE No, Yes
Option Count: No 1, Yes 5
EM3 Community Flood Awareness
Description
Option ID Option Name

APPENDIX

MCA OPTION SCORING OUTCOMES
Prospect Creek Sub-Catchments
v
or
Community and Stakeholder Support 4.5%
Support for the option based on FRM Committee meeting, stakeholder engagement and community consultation outcomes 1 Modification of streetscape for flooding is the fourth ranked FM option, generally supported from stakeholder discussions 0
on
disruption
the open space is an existing detention basin
Detention basins ranked second lowest of FM options from community engagement, generally supported from stakeholder discussions
Significant reduction in flooding of the Amaroo Ave road reserve, providing social benefit
Increasing pipe size is the second top ranked FM option types from community engagement, generally supported from stakeholder discussions
Negligible impact on public space or social disruption as the current open space is only a portion of a wider open space corridor
Detention basins ranked second lowest of FM options from community engagement, generally supported from stakeholder discussions
Significant reduction in flooding of Jacaranda Drive road reserve, providing social benefit 0 Negligible impact on public space or social disruption
Increasing pipe size is the second top ranked FM option types from community engagement, generally supported from stakeholder discussions
Modification of streetscape for flooding is the fourth ranked FM option, generally supported from stakeholder discussions Impact on Fauna/Flora
Likely impacts on Threatened Ecological Communities
Table - Multi Criteria Assessment Outcomes – Flood Modification Options - Georges Hall, Lansdowne and Miller Road Sub-Catchments ScoreCommentScoreCommentScoreCommentScoreCommentScoreCommentScoreComment Benefit-Cost Ratio15% The cost effectiveness of the scheme, i.e. the tangible return on investment -1BCR = 0.612BCR = 2.300BCR = 1.100BCR = 1.002BCR = 1.88-1BCR = 0.62 Adaptability and longterm performance 10% The impact the option will have both in terms of feasibility, benefits and cost over the life of the option, and adaptability to climate change conditions 1 This option should improve flood risk for localised properties with minimal ongoing costs. Flood protection of diversions may be compromised slightly by climate change impacts flows 0 Detention basins will require maintenance otherwise flow capacity will diminish. Benefits of detention storage may be less significant under climate change increased flows. 0 Drainage upgrades will require consistent maintenance otherwise flow capacity will diminish. Benefits of drainage capacity may be less significant under climate change increased flows. 0 Detention basins will require maintenance otherwise flow capacity will diminish. Benefits of detention storage may be less significant under climate change increased flows. 0 Drainage upgrades will require consistent maintenance otherwise flow capacity will diminish. Benefits of drainage capacity may be less significant under climate change increased flows. 1 This option should improve flood risk for localised properties with minimal ongoing costs. Flood protection of diversions may be compromised slightly by climate change impacts flows Reduction in Risk to Property 5% Based on reduction in AAD, it establishes the tangible benefit of an option 0Damage Benefit AAD = $9,1001 Damage Benefit AAD = $179,000 1 Damage Benefit AAD = $198,000 1 Damage Benefit AAD = $147,000 2 Damage Benefit AAD = $214,000 0 Damage Benefit AAD = $58,000 Technical Feasibility20% Establishes the feasibility of options based on constructability, and bureaucratic difficulties such as land acquisition and agreements with external agencies 2 Very feasible with minimal works within Council owned lands, no subsurface utility risk, minor traffic management needed 2 Very feasible with modification of an existing detention basin in Council owned land. No subsurface utility risk, traffic management needed -1 High subsurface utility risk, major traffic management needed -1 High subsurface utility risk, significant re-grading of relatively steep Council park required 0 Subsurface utility risk, minimal works within Council owned lands, traffic management needed 2 Very feasible with minimal works within Council owned lands, no subsurface utility risk, minor traffic management needed Emergency Access and Evacuation 9% The impact on the ability to evacuate or for NSW SES or emergency services under extreme flood conditions 0 Negligible impact on emergency access and evacuation, slight risk of additional road flooding at a non-critical location 0 Negligible impact on emergency access and evacuation with negligible flood reduction in road reserve 2 Significant reduction in road flooding over a large area in a high risk evacuation area identified from the emergency response review 0 Negligible impact on emergency access and evacuation with negligible flood reduction in road reserve 1 Reduction in road flooding at a single location in a high risk evacuation area identified from the emergency response review -1 Increase in road flooding over a large area Reduction in Risk to Life 12% The impact on risk to life from the 20% AEP up to the PMF event 0 Reduced minor flooding of residential properties, not expected to reduce flood risk to life 1 Slight reduction of flooding of large number of properties in most design flood events 2 Significant reduction of flooding of large number of properties in most design flood events 2 Significant reduction of flooding of localised row of properties in most design flood events 2 Significant reduction of flooding of large number of properties in most design flood events 1 Reduced minor flooding of residential properties, only minor reduction of flood risk to life Social Disruption and Public Open Spaces 4.5% The
risk
option
public spaces 0 Negligible
0 Negligible
0
impact of the
management
on social disruption and the use of
impact on public space or social disruption
impact
public space
social
as
1
1
1
0
1
1
8%
and Threatened Species -1 Minor additional flooding of the west corner of the Crest Reserve which has many biodiversity observations 0 Negligible impact on fauna and flora 0 Negligible impact on fauna and flora 0 Negligible impact on fauna and flora 0 Negligible impact on fauna and flora 0 Negligible impact on fauna and flora Water Quality Benefits and WSUD Co-location Opportunities 12% Feasibility for co-location of water quality treatments and devices, creating commonality with Catchment Action Plan outcomes 0 No co-location or water quality treatment benefits 2 Co-location of bioretention treatement in base of the basin should be feasible as low flows should be discharged to basin 1 Opportunity for GPT device at the outlet of the proposed pipe upgrade 1 Co-location of bioretention treatement in base of the basin should be feasible however low flows in existing pit and pipe bypass the basin 1 Opportunity for GPT device at the outlet of the proposed pipe upgrade 0 No co-location or water quality treatment benefits 2873103 0.321.110.480.210.940.43 FM1 - Miller Road Alterations Total Score (from -20 to 20 Total Weighted Score (from -2.00 to 2.00) Description of Criterion Assessment Environment Economic Social CategoryCriterionWeighting FG4 - Rex Road AlterationsFG5 - Harden Reserve BasinFG7 - Amaroo Ave DrainageFL2 - Wilton Reserve BasinFL3 - Jacaranda Drive Drainage
Support for the option based on FRM Committee meeting, stakeholder engagement and community consultation outcomes
Detention basins ranked second lowest of FM options from community engagement, generally supported from stakeholder discussions
Detention basins ranked second lowest of FM options from community engagement, generally supported from stakeholder discussions
reduction of flooding of large number of properties in most design flood events
Localised reductions in flooding within mostly commercial / industrial area
Negligible impact on public space or social disruption
Increasing pipe size is the second top ranked FM option types from community engagement, generally supported from stakeholder discussions
Increasing channel
Concrete-lining of an existing
Minor but widespread reductions in flooding within mostly commercial / industrial area
Significant reduction in flooding of Lllewellyn Ave reserve, providing social benefit
Increasing channel size is the top ranked FM option types from community engagement
Removal of vegetated area with some native trees near confluence of channels. Disturbance of contaminated soil sites introduces ecological risk
Table - Multi Criteria Assessment Outcomes – Flood Modification Options - Villawood Sub-Catchments ScoreCommentScoreCommentScoreCommentScoreCommentScoreComment Benefit-Cost Ratio15% The cost effectiveness of the scheme, i.e. the tangible return on investment -2BCR = 0.142BCR = 1.65-1BCR = 0.72-1BCR = 0.620BCR = 0.86 Adaptability and longterm performance 10% The impact the option will have both in terms of feasibility, benefits and cost over the life of the option, and adaptability to climate change conditions 0 Detention basins will require maintenance otherwise flow capacity will diminish. Benefits of detention storage may be less significant under climate change increased flows. 0 Detention basins will require maintenance otherwise flow capacity will diminish. Benefits of detention storage may be less significant under climate change increased flows. 0 Drainage upgrades will require consistent maintenance otherwise flow capacity will diminish. Benefits of drainage capacity may be less significant under climate change increased flows. 1 Drainage channel upgrades will require relatively limited maintenance. Benefits of channel upgrades may be less significant under climate change increased flows. 1 Drainage channel upgrades will require relatively limited maintenance. Benefits of channel upgrades may be less significant under climate change increased flows. Reduction in Risk to Property 5% Based on reduction in AAD, it establishes the tangible benefit of an option 0Damage Benefit AAD = $32,0002 Damage Benefit AAD = $317,000 2 Damage Benefit AAD = $375,000 0Damage Benefit AAD = $56,0002 Damage Benefit AAD = $210,000 Technical
Establishes
feasibility
options
constructability,
bureaucratic difficulties such as land acquisition and agreements with external agencies 1 Feasible with minor extensive cut proposed in Council owned lands, alteration of existing stormwater network and minor traffic management 1 Feasible with minor extensive cut proposed in Council owned lands, alteration of existing stormwater network and minor traffic management -2 Significant scale of works with high subsurface utility risk, works within easement through a private property -1 Significant re-grading of natural channel, alteration of channel invert under road bridge with subsurface utility risk -2 High contaminated soil risk, high subsurface utility risk, works within rail corridor, works within easement through a private property Emergency Access and Evacuation 9% The impact on the ability to evacuate or for NSW SES or emergency services under extreme flood conditions 0 Negligible impact on emergency access and evacuation with only minor flood reduction in road reserve at one location 0 Negligible impact on emergency access and evacuation with only minor flood reduction in road reserve 2 Significant
flooding
a high risk
review 0 Negligible
access
only minor flood reduction in road reserve at one location 0 Negligible
emergency access
evacuation
only minor flood reduction in road reserve at one location Reduction in Risk to Life 12% The impact on risk to life from the 20% AEP up to the PMF event 1 Slight reduction of flooding of several residential properties in most design flood events 1 Significant reduction of flooding of localised
2
0
1
Social Disruption
Public Open Spaces 4.5% The
the risk management option on social disruption and the use of public spaces -1 Loss of use for public open space area in residential area 0 Negligible impact on public space or social disruption as the current open space is only a portion of a wider open space corridor 1 Significant reduction
flooding
0
1
Community
Support 4.5%
0
Feasibility20%
the
of
based on
and
reduction in road
over a large area in
evacuation area identified from the emergency response
impact on emergency
and evacuation with
impact on
and
with
row of properties in most design flood events
Significant
and
impact of
in
of Orchard Road reserve, providing social benefit
and Stakeholder
0
1
1
1
Impact on Fauna/Flora 8% Likely impacts on Threatened Ecological Communities and Threatened Species 0 Negligible impact on fauna and flora 0 Negligible impact on fauna and flora 0 Negligible impact on fauna and flora -1
size is the top ranked FM option types from community engagement, generally supported by Council stakeholders
naturalised channel section, though likely poor ecological value -2
Water Quality Benefits and WSUD Co-location Opportunities 12% Feasibility for co-location of water quality treatments and devices, creating commonality with Catchment Action Plan outcomes 2 Co-location of bioretention treatement in base of the basin should be feasible as low flows should be discharged to basin 2 Co-location of bioretention treatement in base of the basin should be feasible as low flows should be discharged to basin 1 Opportunity for GPT device at the outlet of the proposed pipe upgrade -1 Concrete-lining will remove any minor water quality treatment potential of the natural channel -2
contaminated
significant water quality risk. 186-20 0.220.960.18-0.41-0.39
Economic Social CategoryCriterionWeightingDescription of Criterion Assessment FV1 - Alcoomie Reserve BasinFV3 - Tucker Reserve Basin Environment Total Score (from -20 to 20 Total Weighted Score (from -2.00 to 2.00) FV5 - Orchard Road DrainageFV6 Sir Thomas Mitchell Channel
Disturbance of
soils sites introduces
FV8 - Christina Ave Channel
Benefit-Cost Ratio15% The cost effectiveness of the scheme, i.e. the tangible return on investment 2BCR = 4.130BCR = 0.9780
Due to intangible benefits the BCR of this scheme is not able to be calculated. However given relative low cost of option and potential risk to life improvements assumed that BCR would be in the order of 1.0
0 Due to intangible benefits the BCR of this scheme is not able to be calculated. However given relative low cost of option and potential risk to life improvements assumed that BCR would be in the order of 1.0 0 Due to intangible benefits the BCR of this scheme is not able to be calculated. However given relative low cost of option and potential risk to life improvements assumed that BCR would be in the order of 1.0 0 Due to intangible benefits the BCR of this scheme is not able to be calculated.
However given relative low cost of option and potential risk to life improvements assumed that BCR would be in the order of 1.0 0 Due to intangible benefits the BCR of this scheme is not able to be calculated. However given relative low cost of option and potential risk to life improvements assumed that BCR would be in the order of 1.0
Adaptability and longterm performance 10%
The impact the option will have both in terms of feasibility, benefits and cost over the life of the option, and adaptability to climate change conditions
This option should improve flood risk for these buildings within minimal ongoing costs. Flood immunity of raised buildings may be compromised by climate change impacts on flood levels
Establishes the feasibility of options based on constructability, and bureaucratic difficulties such as land acquisition and agreements with external agencies -2
Emergency Access and Evacuation 9% The impact on the ability to evacuate or for NSW SES or emergency services under extreme flood conditions
Dependent on agreement of residents and approval of the scheme from the State government. High proportion of properties eligible -2
0 More buildings elevated above the FPL, however flooded evacuation routes will remain unchanged 0
This option should improve flood risk for these three properties even under climate change with minor ongoing maintenance costs for the land
Ongoing costs to maintain the prediction and warning system, however ongoing benefits will continue to justify use. System can be adapted to climate change conditions
Dependent on agreement of residents and approval of the scheme from the State government. No clearly eligible properties (three are financially eligible) 0 Georges River regional scheme under development, however flash flooding local system would be quite complicated based on real-time modelling of rainfall forecasts
Removing buildings from the high risk areas will reduce SES demands however only 3 properties 2
Reduction in Risk to Life 12% The impact on risk to life from the 20% AEP up to the PMF event 1 Expected reduction in risk to life through less overfloor flooded buildings 1 Expected reduction in risk to life through removing residential buildings from floodplain (3 properties)
Minimal ongoing costs for review. Review can be revised to consider climate change impacts in the future 1
Ongoing costs to maintain the flood awareness program, however following initial engagement ongoing information should be more straightforward. Can be adapted to climate change
Minimal ongoing costs for flood markers and signage. Signs can be altered to account for climate change if necessary, however unlikely to be needed 2
Ongoing costs will be variable based on flood event occurrence. Climate change should not significantly influence scheme
Additional time available for SES to coordinate response likely to improve evacuation potential
Expected reduction in risk to life through better warnings for SES and residents to act prior to flooding. Effectiveness limited by flash flooding nature of study area
2
Easy to implement a local flood planning review and allow for sharing of information with NSW SES 1
Depending on the awareness program to be developed, could be some complications with regards to encouraging community engagement with such a program
2 Providing information to SES will assist them in their planning 2 A flood aware community will limit the number of instances of residents entering floodwaters
Negligible direct impact on risk to life for this study area as flash flooding nature limits SES capacity to directly assist
reduction in risk to life through better responses of majority of residents
2
2 Easy to implement and install flood markers and signage
Will assist residents and the NSW SES identify depth of flooding for some crossings on evacuation routes
Expected reduction in risk to life through residents not attempting
1
Council should already have a flood data collection scheme. Would need to ensure the availability of Council staff to respond to and record flooding at any time
0 Negligible direct impact on emergency access and evacuation
Table - Multi Criteria Assessment Outcomes – Property Modification and Emergency Management Options - All Sub-Catchments ScoreCommentScoreCommentScoreCommentScoreCommentScoreCommentScoreCommentScoreComment
1
0
1
2
2
Reduction in Risk to Property 5%
on reduction in AAD, it
tangible benefit
2 Damage Benefit AAD = $1,769,000 1 Damage Benefit AAD = $273,000 0 No direct
tangible flood damages benefits, however some indirect damage benefits in reduced risk to life 0 No direct or tangible flood damages benefits 0 No
flood damages benefits,
benefits
reduced risk to life 0 No direct or tangible flood damages benefits, however some indirect damage benefits in reduced risk to life
direct
tangible flood damages
Based
establishes the
of an option
or
direct or tangible
however some indirect damage
in
0 No
or
benefits Technical Feasibility20%
1
0
2
1
to enter floodwaters 0 Negligible direct impact on risk to life Social Disruption and Public Open Spaces 4.5% The impact of the risk management option on social disruption and the use of public spaces -2 Social disruption of residences during works, no impact on open space. Scattered location of properties creates unclear pereceptions for neighbouring residents -2 Displacement of residents, concerns with neighbouring residents 0 No direct impact on social disruption or public open space 0 No direct impact on social disruption or public open space 2 Improved community awareness seen as a social benefit 0 No direct impact on social disruption or public open space 0 No direct impact on social disruption or public open space Community and Stakeholder Support 4.5% Support for the option based on FRM Committee meeting, stakeholder engagement and community consultation outcomes -1 The third lowest ranked option type from community engagement, also not strongly supported in stakeholder meetings -2 The lowest ranked option type from community engagement, also not strongly supported in stakeholder meetings 2 The highest ranked option from community engagement, also generally supported in stakeholder meetings 2 Strongly supported in stakeholder meetings particularly from NSW SES 2 The second highest ranked option from community engagement, also generally supported in stakeholder meetings 2 The second highest ranked option from community engagement, also generally supported in stakeholder meetings 2 Strongly supported in stakeholder meetings particularly from NSW SES Impact on Fauna/Flora 8% Likely impacts on Threatened Ecological Communities and Threatened Species 0Negligible impact0Negligible impact0Negligible impact0Negligible impact0Negligible impact0Negligible impact0Negligible impact Water Quality Benefits and WSUD Co-location Opportunities 12% Feasibility for co-location of water quality treatments and devices, creating commonality with Catchment Action Plan outcomes 0Negligible impact0Negligible impact0Negligible impact0Negligible impact0Negligible impact0Negligible impact0Negligible impact 0-3681095 Total-0.02-0.310.490.870.900.990.49 Weighted Score (from -2.00 to 2.00) CategoryCriterionWeightingDescription of Criterion Assessment Social Environment Economic EM6 - Flood Data and Debrief Emergency Management (EM) Options EM3 - Community Flood Awareness EM5 - Flood Markers and Signage Total Score (from -20 to 20 Property Modification (PM) Options PM1 - Voluntary House RaisingPM3 - Voluntary PurchaseEM1 - Flood Prediction and Warning EM2 - Review of Local Flood Planning and Info to SES
Expected

Contact Stantec Australia Level 16 207 Kent Street Sydney NSW 2000 Australia Phone +61 2 9496 7868 Fax +61 7 3369 9722 Web Address www.stantec.com


