“from so simple a beginning endless forms most beautiful and most wonderful have been, and are being, evolved”
Charles Darwin,
“ The Origin of Species”
ABSTRACT
Through the mimic of evolutionary science principles, Evolutionary Algorithms are being used more and more in diverse disciplines, in order to find solutions for problems through optimization procedures of single and multiple objectives. In the design and architecture fields, the application of evolutionary solvers as a design tool, offers the possibility to find trade-off solutions for problems that present multiple fitness criteria, which are usually conflicting with one another 1. This allows the obtaining of results which would never be possible through traditional design tools. Efficient implementation of evolutionary computational tools rely not only on the understanding of the underlying algorithms driving the solver, but also of the biological evolutionary principles from which they emerge.
Evolutionary algorithms are based on the same biological principals that guide the evolution and development of all living organisms. The science of Evolutionary Development (“Evo-Devo”) studies these “two strongly coupled processes, operating over maximally differentiated life spans: the rapid process of embryological development from a single cell to an adult form, and the long slow process of the evolution of diverse species of forms over extended time”.2
With the access, in the last couple of decades, to the study of the genome, particularly the human genome, biologists could not only evidence Darwin’s theory, but also observe that diverse living organisms can share almost the exact same genetic information. This discovery in biology has been fundamental, since it has proven that despite phenotypical differences, all complex organisms, from insects to humans, share a common subset of the genome,
called the “tool kit” of master genes. These genes control the structuring and formation of their body parts, by acting on the timing and sequences of growth, regulating where and when growth starts and stops. Among the regulatory genes is a common sequence, known as the ‘homeobox’. Therefore, the switching on and off of genes for different body parts and at different time instances during the development process, can lead to highly diverse forms. The body plan structure will determine the body parts of any individual and the topological relation between them.
Each single cell of every living form carries the information (genome) for the development of the whole being. Through reproduction, this genetic information is transmitted down through the next generation. Random variations in the genome (mutations) occur naturally, and natural selection acts as the force that chooses the “ fittest” forms that will survive. In evolutionary algorithms that force is replaced by predefined criterions, which will determine the fitness target.
The rising appearance of evolutionary solvers is increasing the utilisation of evolutionary computation as a design strategy and tool, “ a development that has bridged the gap between the domains of biology, computer science and the field of architecture and design” 3. The following research investigates the application of these concepts, through a strategic design approach that is based on four main consecutive sequences.
1. M. Makki, “An Evolutionary Model for Urban Development” , ISUF, 2015
2. M. Weinstock, “The Architecture of Emergence- The Evolution of form in Nature and Civilisation”, Wiley, 2010,p31
3. M. Makki, “The Evolutionary Adaptation of Urban Tissues through Computational Analysis” ,eCAADe, 2015
INTRODUCTION
This research aims to understand how Evolution and Embryological Development theories can be reinterpreted and applied to design through Evolutionary Computational processes. The developed experiments are based on four main consecutive sequences, which start from applying standard operations to a simple geometry and progressively become more complex in terms of aims, techniques and utilised tools.
Sequence 1 starts by setting a series of simple operations (gene pool) that are applied to a basic geometry (primitive) in Rhino environment. After defining a genome structure, a number of operations (genes) are chosen in order to create 10 new individuals that will conform Generation 1. The resulting population is then evaluated under two defined criterions, and a remapped value is used to rank the individuals according to their fitness. Breeding and crossover strategies are determined to create Generations 2 and 3, with 10 new individuals each.
In Sequence 2, a body plan is introduced, and the primitive geometry is subdivided into body parts. Each gene is instructed to affect a single body part. In addition, new genes are added to the gene pool as well as slight modifications applied to some of the instructions. This modifications are made in order to avoid having un-unified individuals. Furthermore, the genome structure’s length is increased, and mutation strategies are incorporated, considering their type, rate and probability of appearance. Once breeding and crossover strategies are defined, Generations 4,5,6 (with 10 individuals each) are produced in Grasshopper, and ranked according to 2 new fitness criteria. In this dual-parameter optimisation process, differential weights are applied to the criteria assigned (determined through the crossover strategy) in order to achieve the evolutionary result.
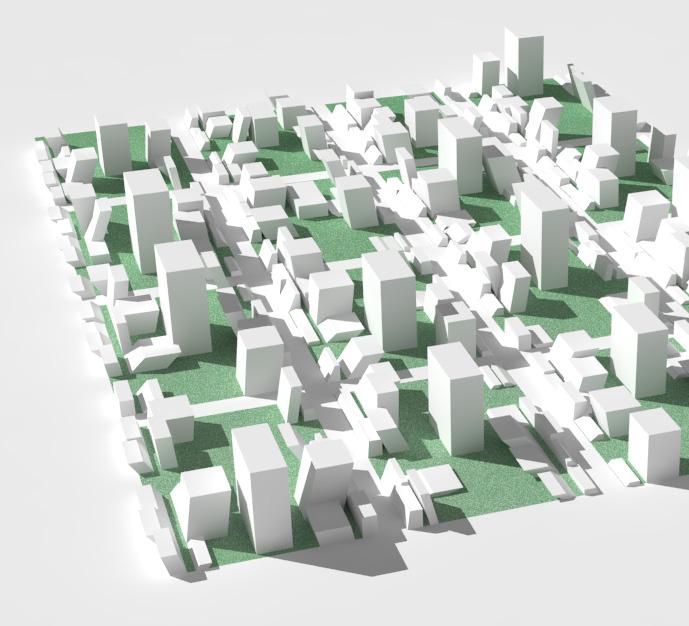
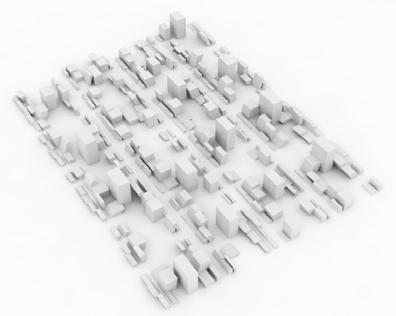
For the following sequences, the potential of Octopus/Gh plugin within Rhino to simulate a genetic experiment for the evolution of Urban Blocks is explored. For Sequence 3, the London based Brunswick centre is taken as a case study, and used as a primitive urban block geometry for the evolutionary process. A body plan is introduced, and a series of parameters are set, which will determine the resulting gene pool. Three fitness criteria are defined in relation to design ambitions and environmental factors. Therefore, multi- parameter optimisation and associative design tools are used to digitally simulate the evolutionary process. The utilisation of Octopus/Gh as a tool introduces a degree of complexity which enables to run a large number of generations in a short period of time. Generations 3,6 and 10 (with 10 individuals each) are analysed, ranked and reviewed.
For the final Sequence, the urban block primitive is increased to 16 superblocks (4 by 4). Adjustments are made to the body plan, parameters (gene pool) and fitness criteria considered in the previous sequence. The strategy is defined by the regulation of values such as Elitisim, Breeding, Crossover, Mutation rate and probability, which can be modified for each evaluated generation. A simulation of 80 generations (with 21 individuals each) was run, stopping in Generations 20, 40, 60 and 80. In between these, the strategy was adjusted accordingly. Data analysis and observations are made by comparison to the primitive urban block.
SEQUENCE
INTRODUCTION
In this first phase, simple 3D Rhino experiments are carried out in order to develop an empirical understanding of evolutionary computation, using concepts from Evo-Devo (Evolutionary Development) as a biological reference. It is important to consider that these biological concepts are not taken literally, but are abstracted and reinterpreted, to help in the comprehending of how the evolutionary process can be understood in digital terms.
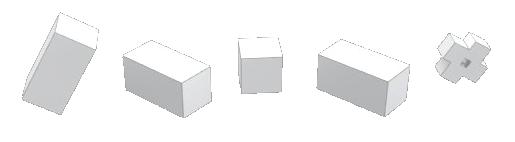
PRIMITIVE | CUBE
GENE POOL
Sequence 1 starts with the selection of a basic primitive geometry (cube) as a first step for the creation of new individuals . A set of basic Rhino operations (move, copy, non-uniform scaling, rotation, etc ) that are applied to the primitive geometry, are defined in order to set the rules, or “genes” that conform the “genepool”. The genome structure will determine the amount of genes that conform an individual.
The genepool used for the first generation consists of 6 genes, each defining a different action; while the genome contains only 3 genes. Once both genepool and genome are determined, it is possible to create the first population through a random combination of gene sequences. In this way, 10 individuals or “phenotypes” are created as Generation 1.
CRITERIA
A fitness criteria is defined in order to evaluate and rank the individuals. Breeding and Crossover stategies will then be established to further create Generations 2 and 3. Each generation is analized independently and compared to each other through standard deviation graphs.
Rotate 60o from center.
ZX Plan
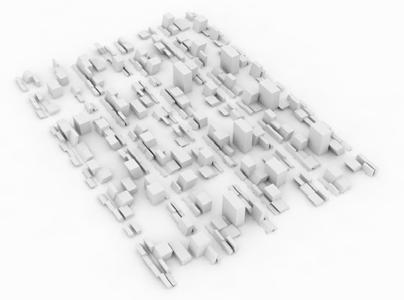
GENERATION 1
Figure 1.1. Primitive geometry
Figure 1.2. Genepool
Figure 1.3. Genomes from Generation 1
FITNESS CRITERIA 01 | Surface Area / Volume
Generation 1 is created randomly and ranked according to the fitness criteria (minimal Surface Area for maximum Volume = A/V). The individuals are ranked from left (fittest individual) to right (least fit individual). It is observed that larger unified phenotypes appear to be fitter individuals. As well, the lack of presence of genes E and D in the least fit individuals, and the repeated presence of that same genes in the 4 fittest individuals determine that this are a ‘good’ genes for the considered fitness criteria.
On the other hand, both genes B and A appear sytematically in between the least fit individuals, enabling to conclude that this genes are not helping to achieve fit individuals. However gene A does appear in the fittest individual’s genome. It is observed as well that individuals with more complex geometries, containing higher amount of faces, appear to to have less chances of becoming fit individuals.
Mean Fitness Value: 0.519997796
: 0.633827921
SD Factor: 0.253603452
0.251787385
In order to obtain a fitter population, a Breeding strategy is defined. By breeding the fittest individual (G1.3 )with the least fit (G1.10), the second fittest (G1.5) with the second least fit (G1.2), etc it is possible to expect a decrease of the Standard Deviation, and, as a consequence, an increase of the Mean Fitness value, for the next generation.
Figure 1.4. Generation 1- Sequence 1
Figure 1.6. Deviation Graph for Generation 1- Sequence 1
Copy and move 1 unit along X axis.
BREADING LOGIC 1
Copy and move 1 unit along X axis.
Rotate 45o from center. XY Plan
Rotate 45o
Copy and move 1 unit along Z axis. Scale 2 from center Un-uniform scale X*1,
In order to create Generation 2, the defined Breeding strategy is applied through a Crossover strategy that consists of crossing the 2 first genes in a parent’s genome with the last gene of the other parent’s genome. Once again, individuals are evaluated under the same fitness criteria and ranked in order to create the next generation. Most of the observations detected in the previous generation are repeated and proved in Generation 2.
Mean Fitness Value: 0.604743242
SD Factor: 0.207209498
Mean Fittness Value: 0.604743242 SD Factor: 0.207209498
As expected, it is observed that the Mean fitness value is increased as all of the individuals are getting closer to this value. On the other hand the Standard Deviation factor decreases. This means that the whole population has gotten fitter compared to Generation 1, but there has been a reduction in the variation.
Fittness Value: 0.519997796
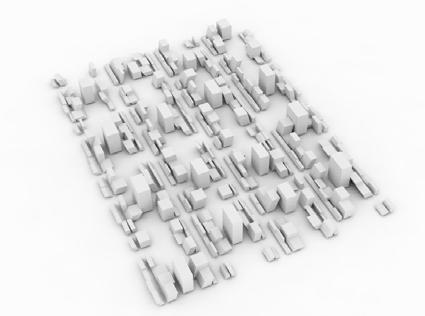
Figure 1.9. Generation 2 - Sequence 1
Figure 1.7. Crossover Strategy for Generation 2- Sequence 1
Figure 1.10. Deviation Graph for Generation 2 - Sequence 1
For the creation of Generation 3, new Breeding and Crossover stategies are defined. The fittest individual from Generation 1 breeds with the fittest individual from Generation 2. The second fittest of Gen.1 with the second fittest of Gen.2, and so on. The Crossover strategy consists in taking the first 2 genes from one parent’s genome and the last 2 genes from the other parent’s genome. This results in a longer genome structure, composed by 4 genes. The initital observations taken from Generation 1, and repeated in Generation 2 are further observed and proven in Generation 3. Simplified geometries are predominant in between fit individuals, as well as genes E and D. On the other hand, genes A and B still prove to be less efficient genes for this fitness criteria.
Mean Fitness Value: 0.633827921
SD Factor: 0.251787385
Since the strategy consists in the breeding of the fittest with the fittest individuals (from Gen. 1 and 2) and the least fitt with the least fitt (from Gen. 1 and 2.) it is to expect that there is an increase in the Standard Deviation, as well as a decrease in the Mean Fitness value. This means that the variation has increased , although there are less individuals closer to the Mean value. However the overall Mean Fitness is higher than in both other generations.
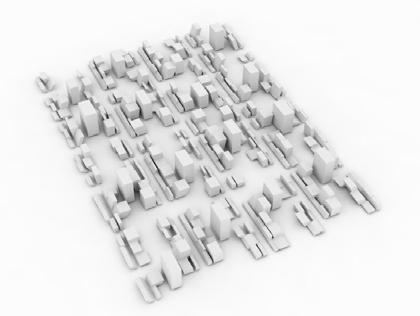
Figure 1.11. Crossover Strategy for Generation 3 - Sequence 1
Figure 1.14. Deviation Graph for Generation 3- Sequence 1
Figure 1.13. Generation 3 -Sequence 1
SEQUENCE 1 | OBSERVATIONS
Generation 1
Mean Fitness Value: 0.519997796
GENERATION 1: Mean Fittness Value: 0.633827921
Deviation: 0.251787385
Standard Deviation: 0.253603452
Generation 2
Mean Fitness Value: 0.604743242
GENERATION 2: Mean Fittness Value: 0.604743242
Standard Deviation: 0. 207209498
Standard Deviation: 0.207209498
Generation 3
Mean Fitness Value: 0.633827921
GENARATION 3: Mean Fittness Value: 0.519997796 Standard Deviation: 0.253603452
Standard Deviation: 0.207209498
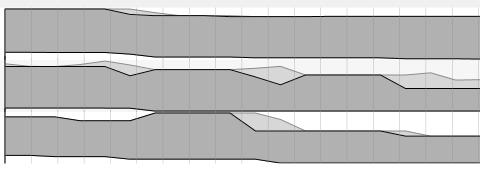
Comparing the three graphs it is detected that there is a constant shift to the right (increase in the Mean Fitness value), meaning that with each generation the average value in the population has gotten fitter than it was in the previous one.
Figure 1.15. Ranked Phenotypes of Generation 1, 2 and 3
SEQUENCE
02
SEQUENCE 2 | STRATEGY
INTRODUCTION
In Sequence 2, a body plan is introduced, and the primitive geometry is subdivided into 4 body parts, in which each gene is instructed to affect a single one. In addition, 2 new genes are added to the gene pool as well as slight modifications applied to some of the instruction’s values, not to their actions. This modifications are made in order to avoid having un-unified individuals with separate geometries, as they appeared in Sequence 1. The genes generating this phenotypical problem are detected and adjusted.
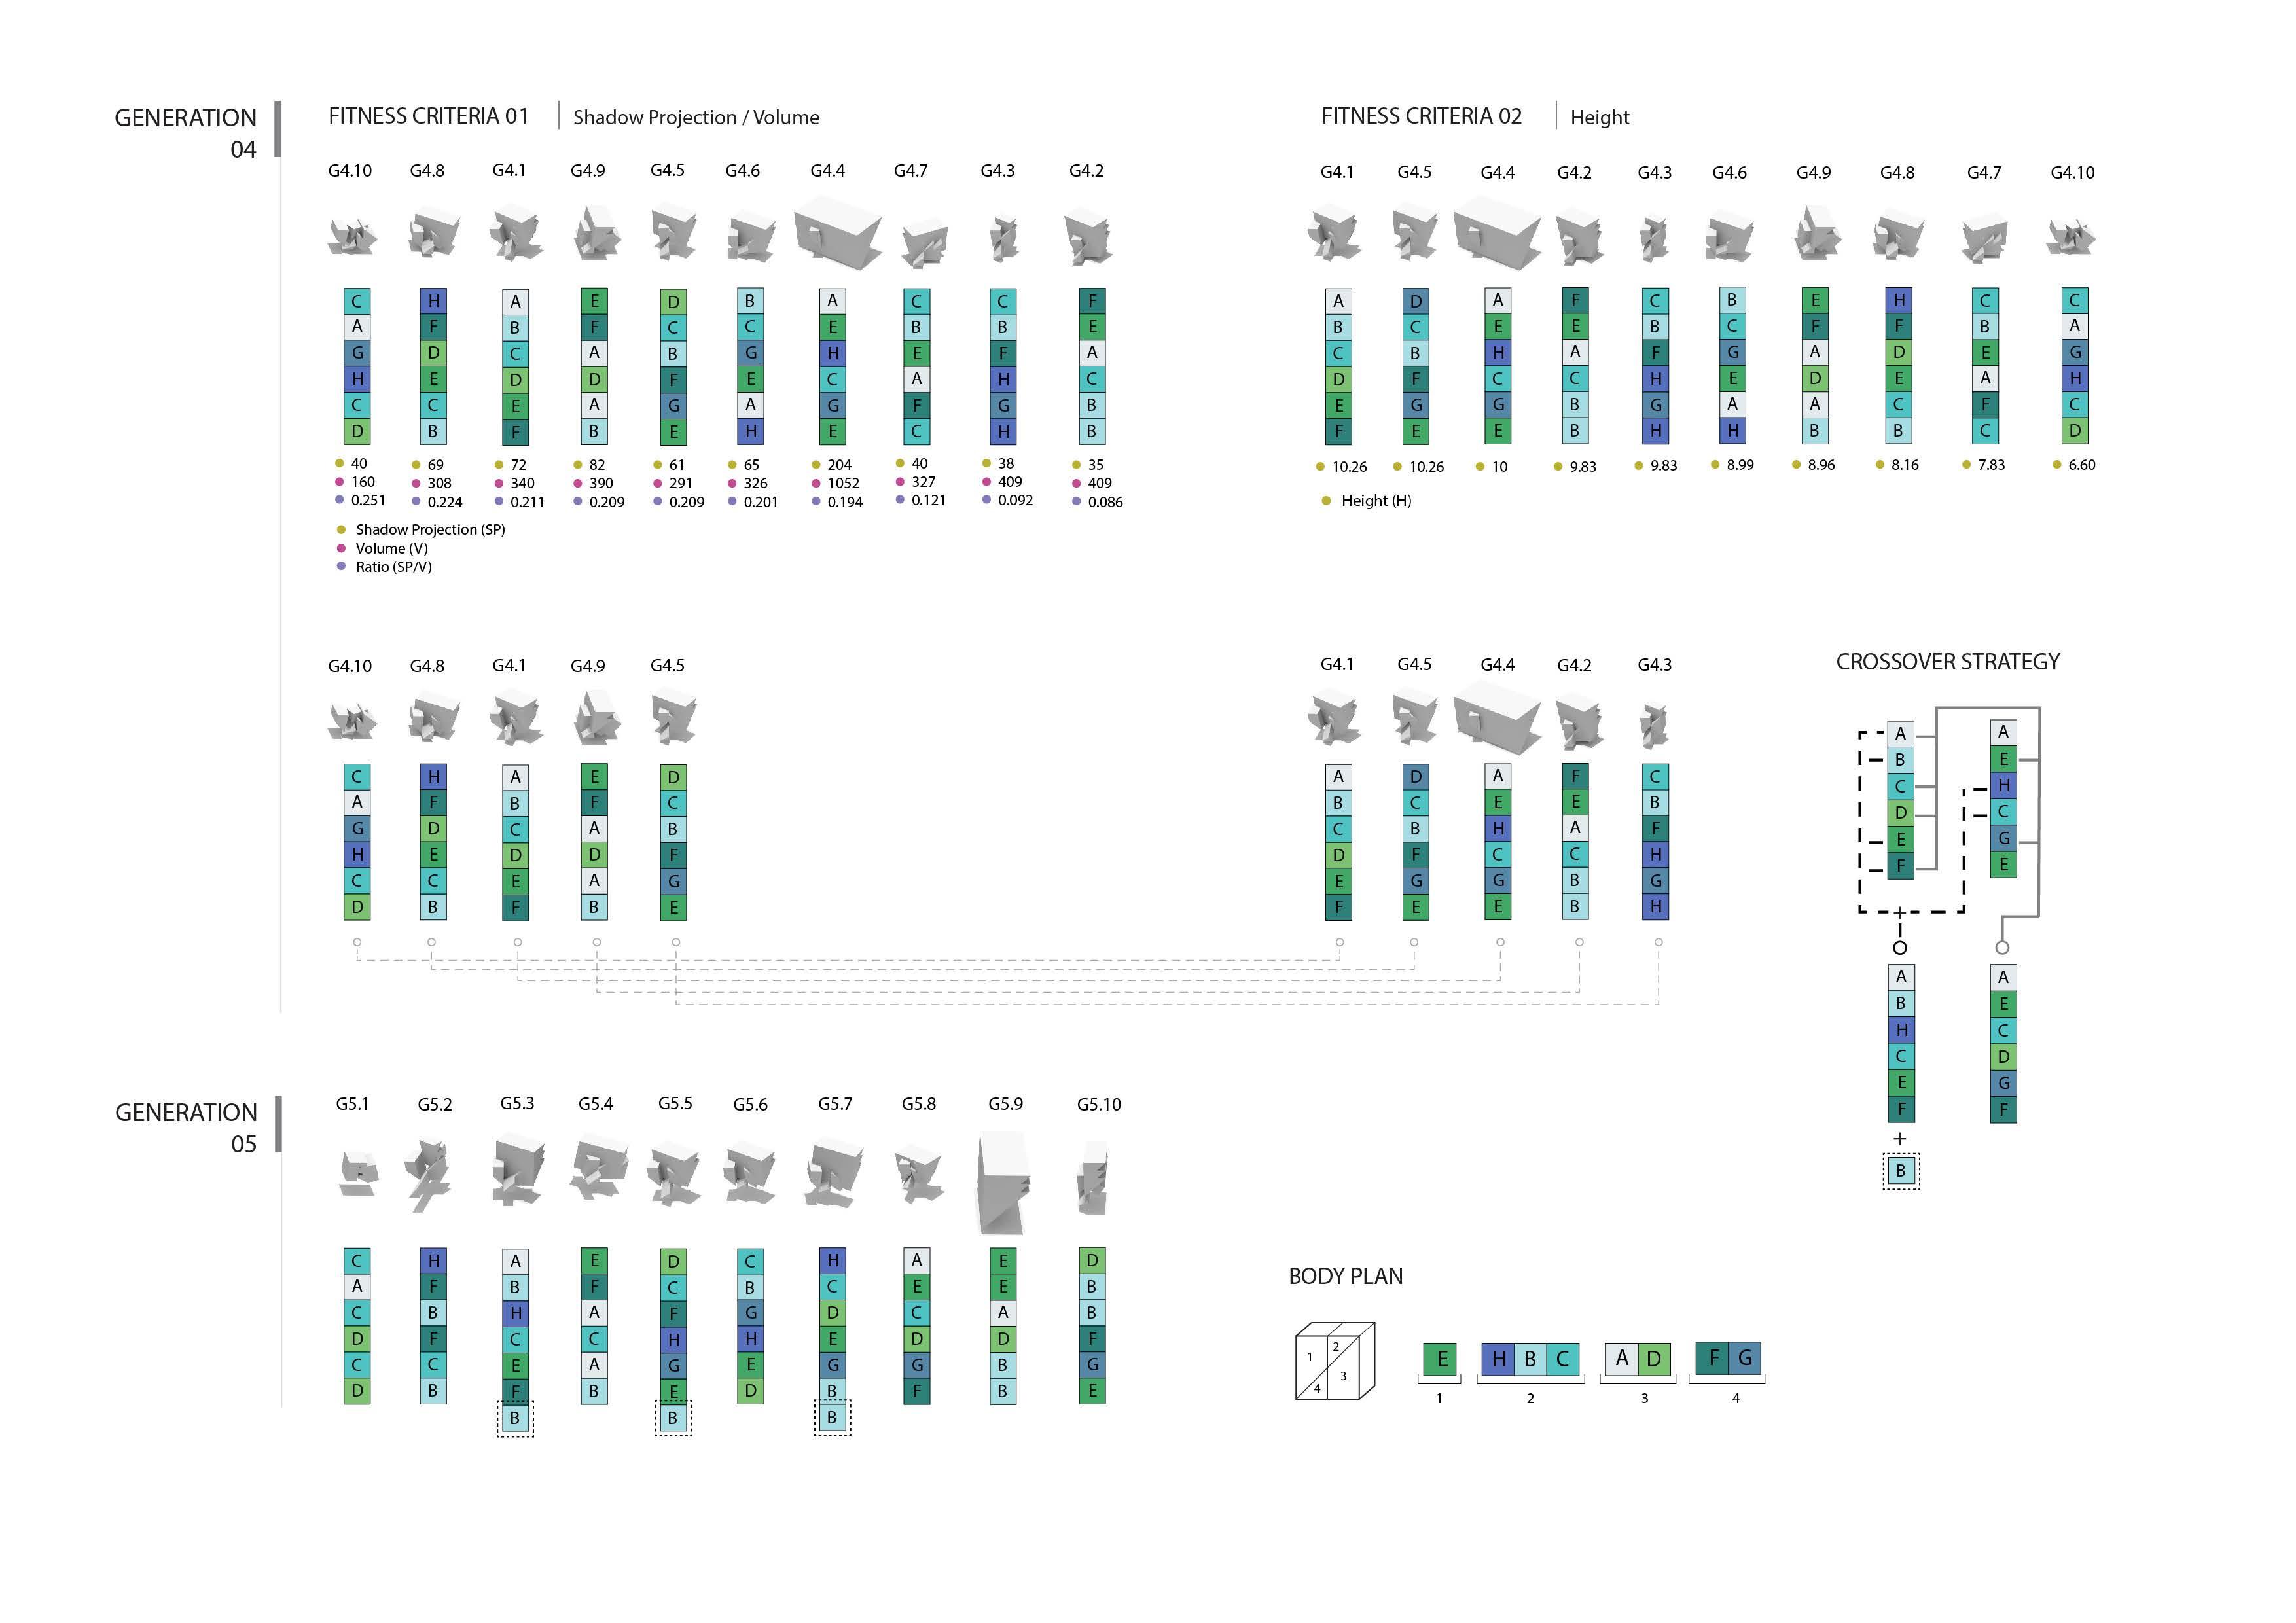
The length of the genome is increased, by the addition of 3 genes to the previous genome structure. Two new fitness criteria are defined: 1-maximisation of shadow projection from a normal vector with minimum volume, and 2- height maximisation. Mutation strategies are incorporated in Generation 5 and 6. Once breeding and crossover strategies are defined, Generations 4,5,6 (with 10 individuals each) are produced in Grasshopper, and ranked according to the 2 new fitness criteria.
GENE POOL
GENE A. Copy and move 2mm along X axis.
GENE B. Copy and move 2mm along Z axis.
GENE C. Rotate 45o from center. XY Plan
GENE D. Scale 2 from centroid
GENE E. UN-uniform scale X*1, Y*2, Z*1
GENE F. Rotate 60o from center ZX Plan
GENE G. Rotate 30o from center. ZY Plan
GENE H. Mirror YZ Plan
GENE MODIFICATION move: 5mm -> 2mm
Figure 2.1. Body plan assigned to primitive cube
Figure 2.2. Diagram of modifications on phenotype
Figure 2.3. Diagram for Fitness Criteria 1-Shadow/Projection
Figure 2.4. Diagram for Fitness Criteria 2 -Height
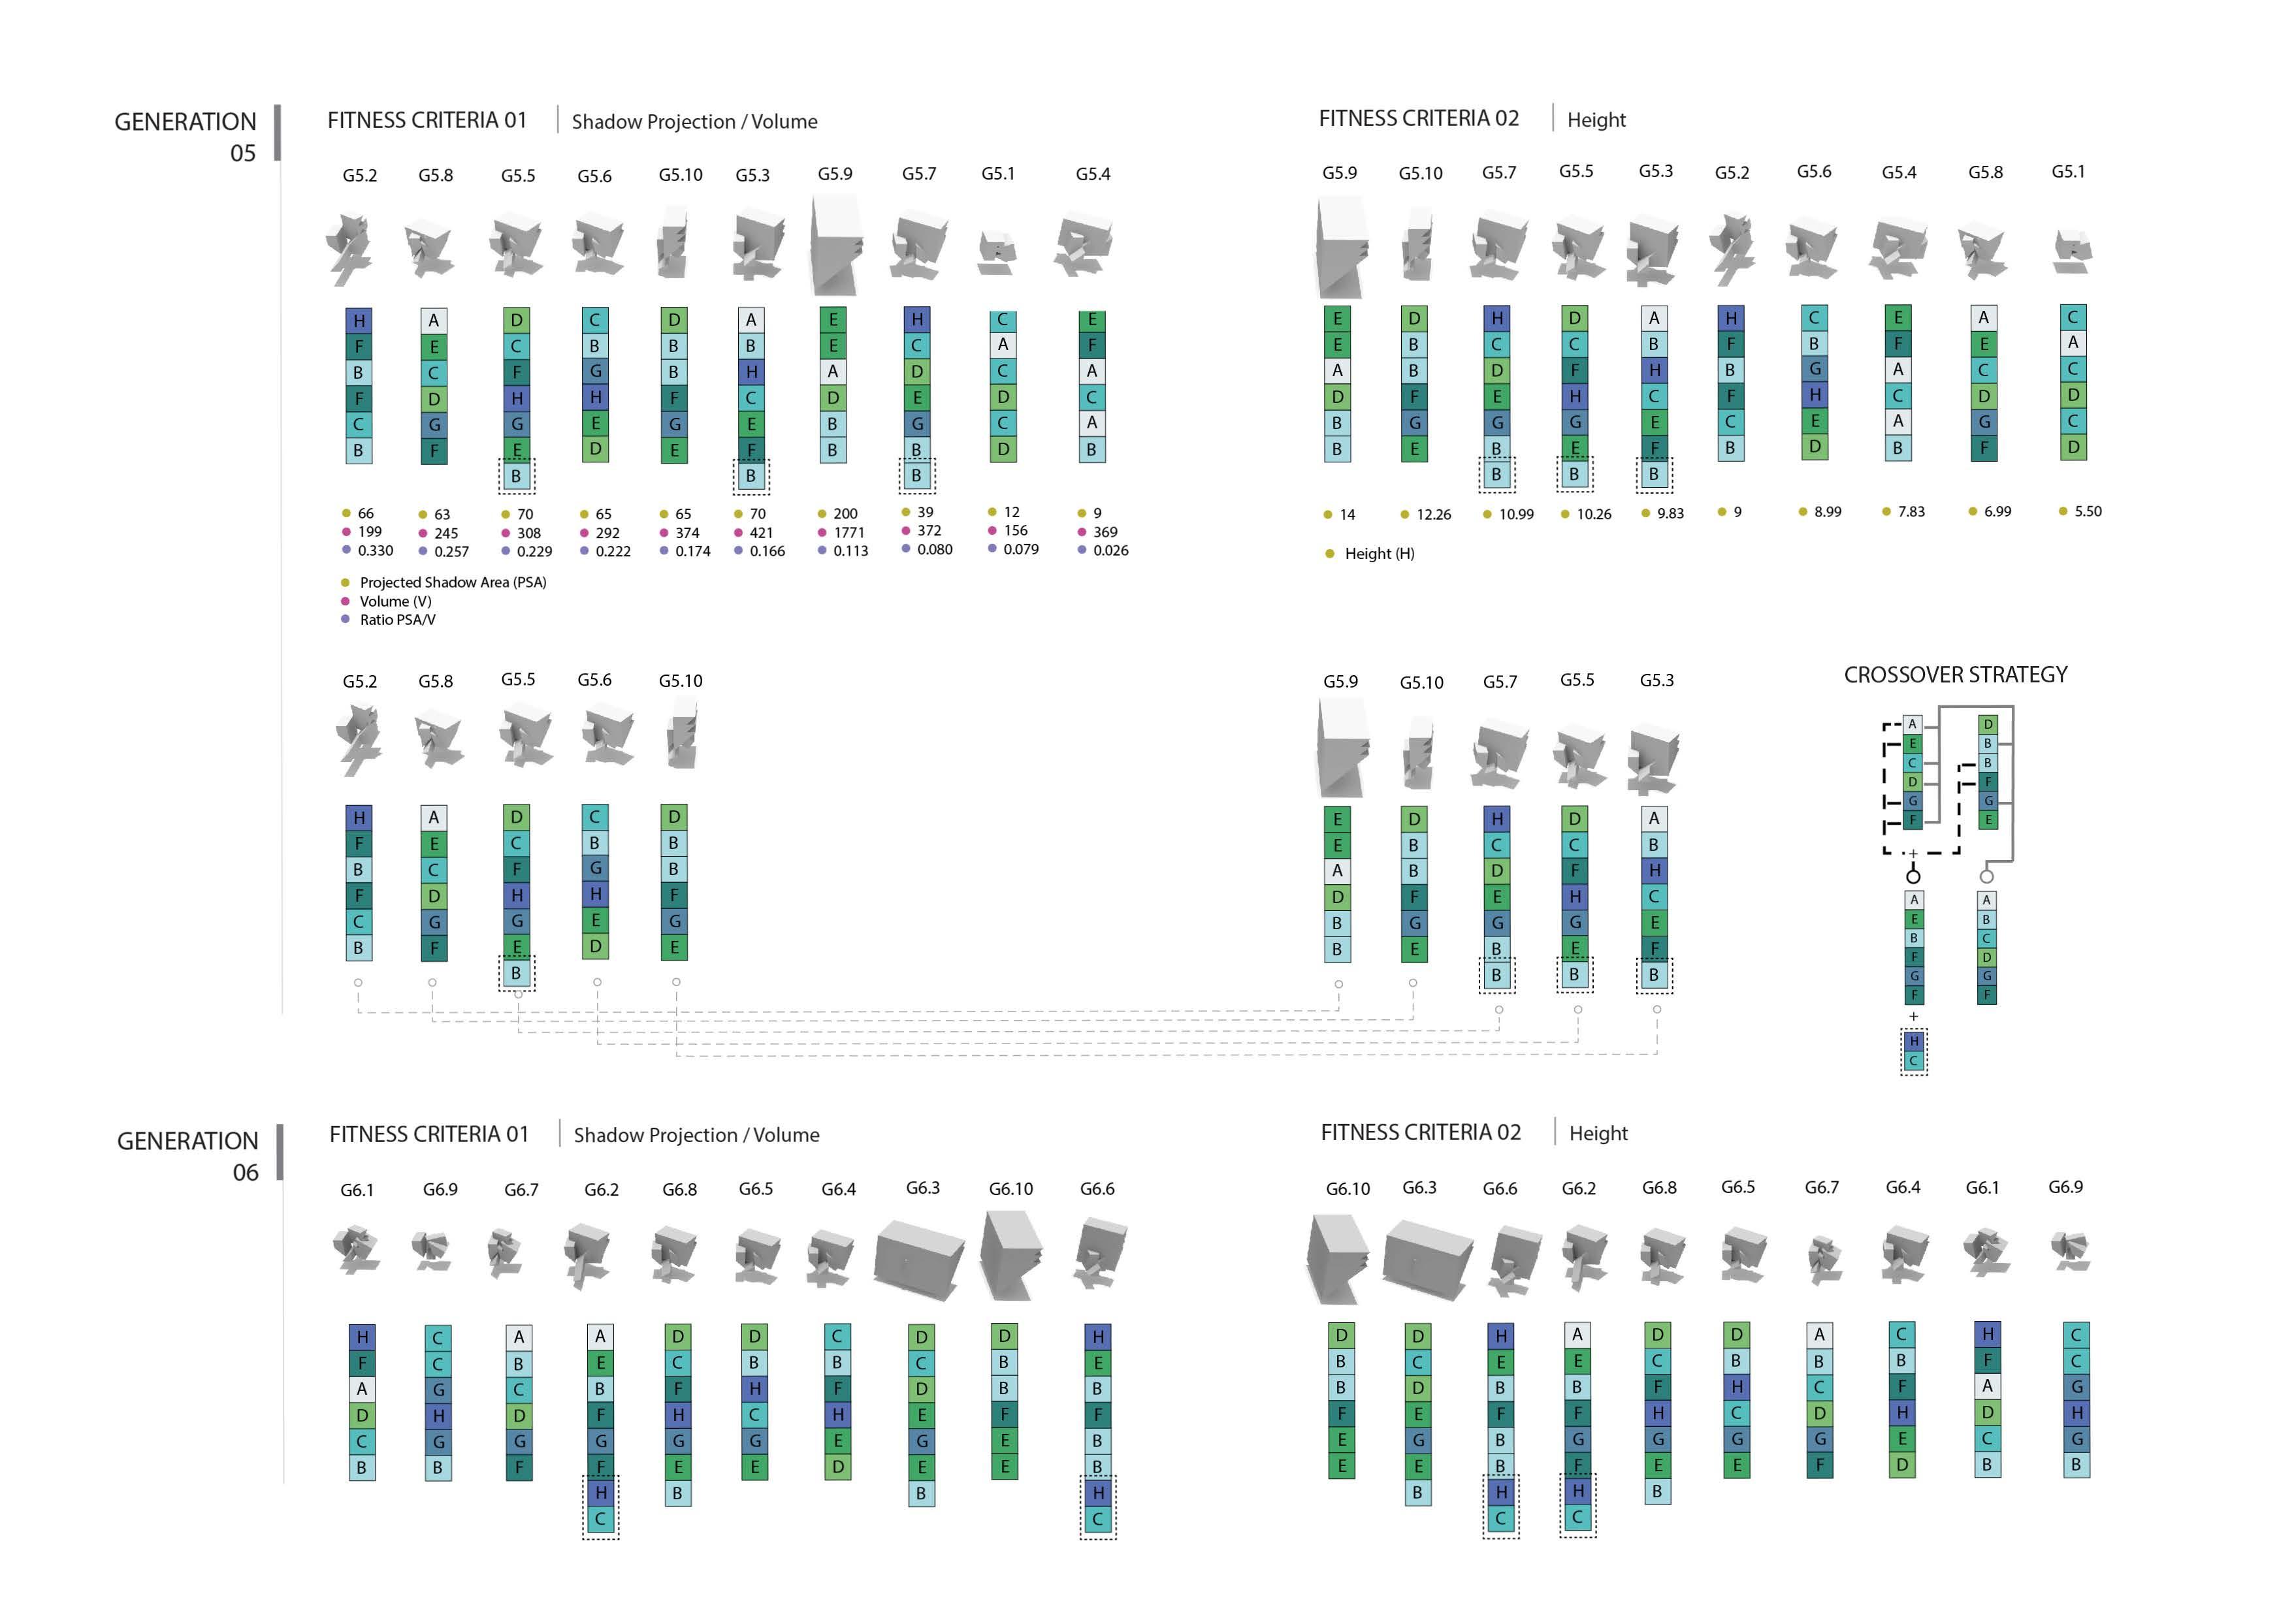
SEQUENCE 2 | GENERATION 04
FITNESS CRITERIA 01 | Shadow Projection / Volume
For Generation 4, 10 individuals are created randomly with genomes conformed by 6 genes. Individuals are ranked according to both fitness criteria, It is observed that the fittest individual under criteria 1 (G4.10) results to be the least fit individual under criteria 2, since both criterions are working against each other. In this dual-parameter optimisation process, differential weights will be applied to the criteria assigned through the crossover strategy. For this sequence, the aim is the achievement of the fittest possible individual, rather than having a whole population of fitter individuals.
This will define the breeding and crossover strategies for the creation of Generations 5 and 6. By breeding the 5 fittest individuals from criteria 1 with those of criteria 2, its is expected to find an increase in the Standard Deviation values, meaning a higher variation. This will increase the possibilities of finding a fitter individual. In order to allow criterion 1 (Shadow projection/Volume) to have a bigger weight than criterion 2 (Height) on the next generation, it is defined that for the crossover strategy 4 genes will be taken from the first parent, while only 2 genes will be taken from the second one.
In order to allow a comparison of the three generations (4,5 and 6) with a Graph deviation map, it is necessary to have a unique fitness value for the individuals of each generation. Therefore, through remapping the values obtained under both criterias, it is able to achieve a unique value which embeds them all. To do so, the ideal and least ideal situations for both criterions are considered. In this way, the domains can be defined for each case ( (0-1.64) for criterion 1, and (5-320) for criterion 2) , and the target domain is defined in between (0-1).
Figure 2.5. Generation 4 - Sequence 2 ranked according to fitness criteria 01-Shadow projection/Volume
Figure 2.6. Generation 4 -Sequence 2 ranked according to fitness criteria 02- Height
Figure 2.7. Remapped values for Generation 4
From the remapped ranking, It is detected that gene B is present in the genomes of the three fittest individuals. Therefore, through insertion mutation type, and a probability of 30%, it is decided that this gene will be inserted to the end of the mutated genomes.
FITNESS CRITERIA 01 | Shadow Projection / Volume
FITNESS CRITERIA 02 | Height
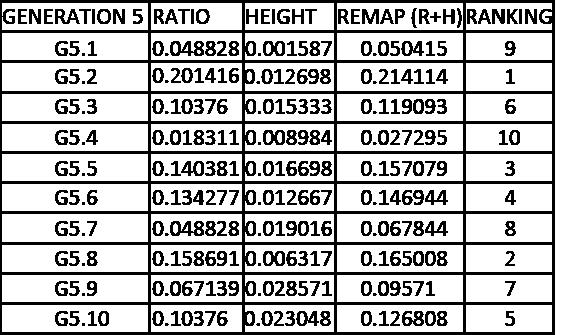
For Generation 5, the same remapping criteria than for previous Generation 4 is applied. It is now possible to start detecting some similiarities in between the individual’s phenotypes sharing the same ranking position (Figure 2.15). Whilst the fittest individual according to criterion 1 for the previous generation was the smallest individual, in Generation 5 the second smallest individual occupies the first place in this ranking. As well, the biggest individual in both generations occupies the 7th place in the 1st criterion rankings.
Figure 2.9. Generation 5 - Sequence 2, ranked according to fitness criteria 01- Shadow projection/Volume
Figure 2.12. Generation 6 of Sequence 2, Breeding Strategy
FITNESS CRITERIA 01 | Shadow Projection / Volume
Through analyzing the resulting phenotypes it is possible to detect similarities in between the individuals that share the same ranking position throughout the three generations. Certain patterns are observed such as the approximation in volume size as well as the arrangement and organization of their entire morphology.
In accordance to the general startegies developed in Sequence 2, it is observed that populations increase their Standard Deviation, therefore their variation, from generation to generation. Mean Fitness values are, on the other hand, progressively reduced. This allows for the fittest overall individual to appear in Generation 6, as
Figure 2.17. Deviation graph with remapped values from Gen. 4, 5, 6
Figure 2.16. Generation 4, 5, 6. Ranked phenotypes according to Fitness criteria 02- Height
SEQUENCE
SEQUENCE 3 | STRATEGY
INTRODUCTION
The purpose of Sequence 3 is to explore the potential of Octopus1 plug-in within Rhino to simulate a genetic experiment for the evolution of Urban Blocks. In this part of the sequence, the primitive is changed from an abstract geometry (cube) to an urban block. The Brunswick Center2 is taken as a case study, and used as a new primitive for this section. Meanwhile, a body plan is introduced for the primitive, with a subdivision into 5 ‘body parts’: internal bay, external bay, courtyard, tower unit, and external bay. Octopus/Gh is utilised as the evolutionary solver for the generation of new populations. Different parameters, that affect certain body parts, are defined, and now build up
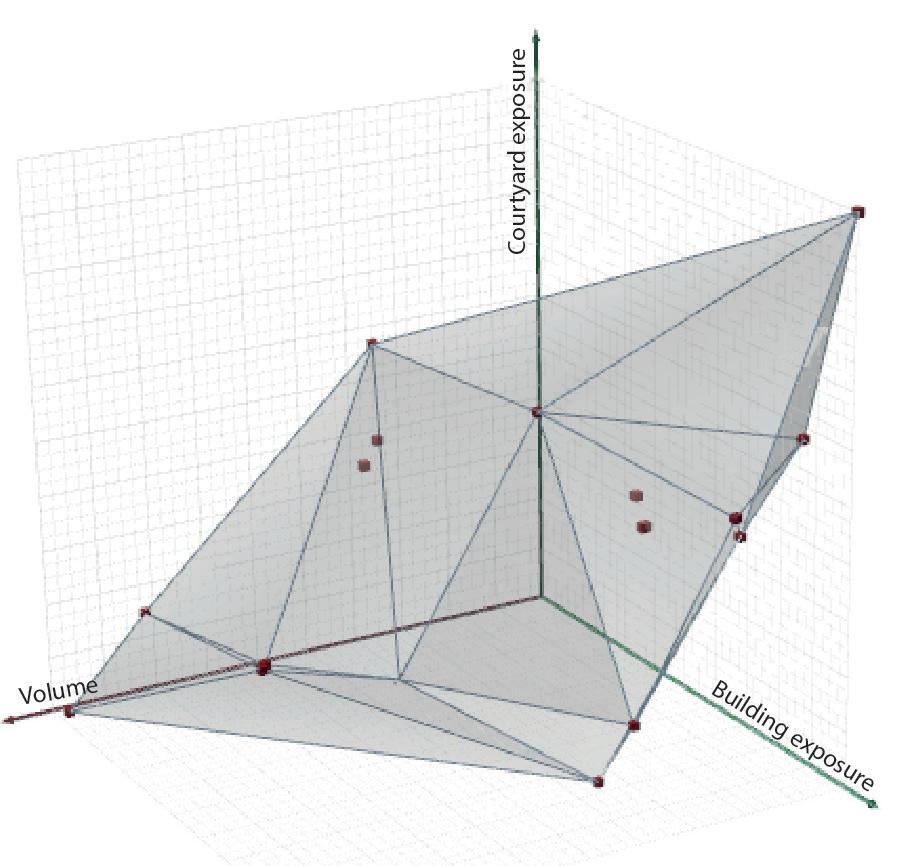
the extensive new genepool, containing over 900 genes. Figure 3.1 shows the corresponding parameters for each body part. Moreover, the adjustment of one parameter has an effect on other body parts. For instance, changes of the external bay depth will also impact the depth of internal bay and courtyard. Through Octopus, ten generations are created in a fairly short period of time. The running simulation is stoped at generations 3, 6 and 10 for analysis and evaluation. Three fitness criteria are defined and taken into account for analysis: minimum volume of blocks, maximum courtyard exposure, and maximum building exposure.
The mutation probability can be controlled through sliders in Octopus. From generation 1 to generation 6, the mutation probability is of 50%, while from generation 6 to generation 10, it is increased to 70% in order to increase exploration
Figure 3.1. Body plan of Brunswick Center and corresponding parameters
SEQUENCE 3 | GENERATION 3
Elitism: 0.5
Mut. Probability: 0.1
Mut. rate: 0.5
Crossover rate: 0.8
Ten individuals of Generation 3 are evaluated under three fitness criteria. The values obtained are remapped and added in order to rank them by their overall fitness value. As seen in Figure 3.2, G3.7 shows to be the fittest individual, and G3.10 the least fit individual.
The convergence graph shows that from Generation 1 to generation 3 all three fitness criteria values are gradually converging towards their optimal solution. It is able to observe as well, from both graphs, that the courtyard exposure criterion is ‘pushing’ more. The solutions appear to be closer to the courtyard exposure axis, meaning that this criterion is achieving better results.
Figure 3.2. Generation 3 - Sequence 3 with three fitness criteria values
Figure 3.3. Convergence graph evaluated at generation 3
Figure 3.4. Population distribution of Generation 3 in quadrant of three fitness criteria
SEQUENCE 3 | GENERATION 6
Elitism: 0.5
Mut. Probability: 0.1
Mut. rate: 0.5
Crossover rate: 0.8
Since the parameter settings used help achieved satisfying results in Generation 3, the settings are kept the same from Generation 3 to Generation 6. Whereas it is unanticipated that all three fitness values became less convergent after Generation 3 (See Figure3.6).
However, it is observed that Generation 6 has increased its standard deviation, since their is an increase in the variation of the individual’s fitness values. It is observed that maintaining the same settings in Octopus, does not necessarily offer a constant behaviour throughout generations. G6.1, as the fittest one in Generation 6, is fitter than G3.7, and the least fit G6.9 is less fit than G3.10.
Figure 3.5. Generation 6 -Sequence 3 with three fitness criteria values
Figure 3.6. Convergence graph evaluated at generation 6
Figure 3.7. Population distribution of Generation 6 in quadrant of three fitness criteria
SEQUENCE 3 | GENERATION 10
Elitism: 0.5
Mut. Probability: 0.1
Mut. rate: 0.7
Crossover rate: 0.8
From Generation 6 to Generation 10, the mutation rate is increased from 0.5 to 0.7. Figure 3.9 shows how the fitness values related to the volume criterion became more convergent, whereas building exposure slightly decreases in convergence, and courtyard exposure mantains constant levels of convergence.
The fittest individual in Generation 10 is G10.1, which turns to be less fit than G6.1 and fitter than G3.7. G10.9 is the least fit individual, but it is stilll fitter than both G6.9 and G3.10.
Figure 3.8. Generation 10 of Sequence 3 with three fitness criteria values
Figure 3.9. Convergence graph stopped at generation 10
Figure 3.10. Population distribution of Generation 10 in quadrant of three fitness criteria
SEQUENCE 3 | OBSERVATIONS
The value of three fitness criteria have been evaluated respectively.
FITNESS CRITERIA 01 MINIMUM VOLUME
FITNESS CRITERIA 02
MAXIMUM COURTYARD EXPOSURE
Generation 3
Generation 6
Generation 10
FITNESS CRITERIA 03
MAXIMUM BUILDING EXPOSURE
3.10. Deviation graph of fitness criteria 1
For fitness criteria 1 (Figure 3.10), the mean fitness value increased from Generation 3 to Generation 10, whereas the standard deviation increased in Generation 6 and decreased in Generation 10 again.
Figure 3.11. Deviation graph of fitness criteria 2
For fitness criteria 2 (Figure 3.11), from Generation 3 to Generation 10, standard deviation constantly decreased and the mean fitness value increased.
Figure 3.12. Deviation graph of fitness criteria 3
For fitness criteria 3 (Figure 3.12), standard deviation slightly decreased from Generation 3 to Generation 6, and substantially decreased from Generation 6 to Generation 10, whie the mean fitness value rapidly increased.
For the overall fitness criteria (Figure 3.13), mean fitness value increased from Generation 3 to Generation 6, while standard deviation increased in Generation 6. From Generation 6 to Generation 10 the mean fitness value increased even more, as the standard deviation was considerably reduced.
Figure 3.13. Deviation graph of integrated fitness value
Since the setting parameters in Octopus were kept same from Generation 3 to Generation 6, the overall performance of Generation 3 and Generation 6 are similar, in comparision to Generation 10. With the increase of the mutation probability from 0.5 to 0.7 at Generation 6, a
decrease in the standard deviation was observed, which means that the population of Generation 10 has less variation than previous generations. The relationship between mutation probability and standard deviation is subject to further testing.
Figure
SEQUENCE
04
SEQUENCE 4 | STRATEGY
INTRODUCTION
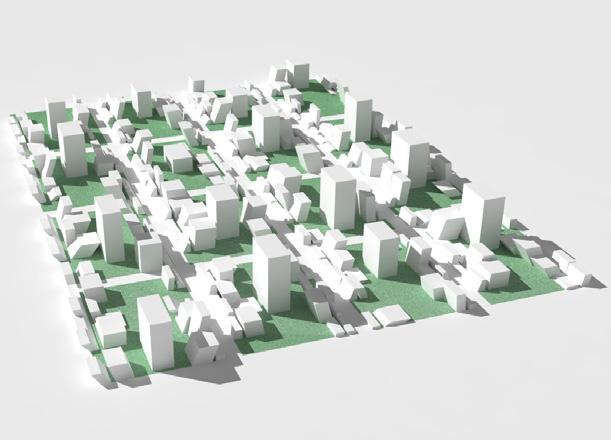
In this section, the superblock is increased to 16 units, and new strategies are developed. Previous fitness criteria, body plan and corresponding parameters are also adjusted. Through Octopus/Gh, 80 generations are evaluated and ranked according to three conflicting fitness criteria: maximum volume, maximum courtyard exposure and maximum street exposure (Figure 4.4).
PRIMITIVE
The retail bay from the previous primitive (Sequence 3) is removed since it was limiting both the movement of other divisions as well as the courtyard area.
The logic and relations defined within each block , are further exploded and accentuated in the relations in between different blocks. A hierarchy of network systems is set, defining the differences between interior network boundaries and exterior boundaries (Figure 4.3).
Seven parts of the body plan are as follows:
01. INTERNAL BAY 1
02. INTERNAL BAY 2
03. EXTERNAL BAY 1
04. EXTERNAL BAY 2 05. TOWER UNIT 06. COURTYARD 07. STREET
No. of Genes: 900 Generation: 20 - 40 - 60 - 80 Population Size: 21
CRITERIA
Primary network
Secondary network
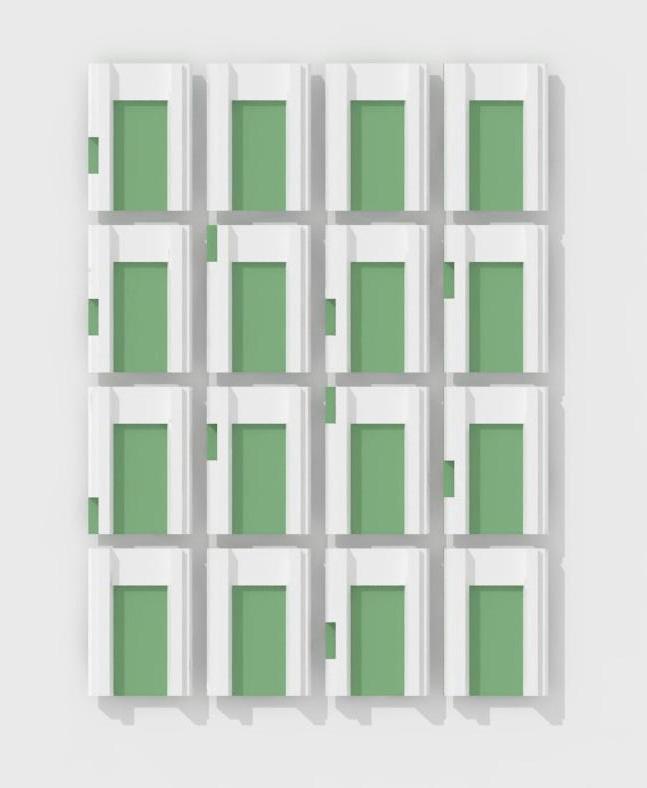
SUPER BLOCK
Figure 4.1. Simplified primitive of Brunswick Center
Figure 4.2. Body plan of primitive
Figure 4.3 Plan and elevation of super block
Figure 4.4. Fitness criteria diagrams
SEQUENCE 4 | GENERATION 20
The 21 individuals from Generation 20 are evaluated and ranked according to the three fitness criteria. The 5 fittest and the 5 least fit individuals are analyzed.
Figure 4.5. Fitness value of 5 fittest individuals and 5 least fit individuals for Generation 20
Figure 4.6. Convergence graph of Generation 20
Figure 4.7. Population distribution of Generation 20 in quadrant of three fitness criteria
Figure 4.8. Deviation graph of integrated fitness value of Generation 20 Generation 20
SEQUENCE 4 | GENERATION 40
After increasing the elitism parameter in Octopus at Generation 20, it is observed that there is a considerable decrease in variation for Generation 40, as well as a high increase in the mean fitness value.
Figure 4.9. Fitness value of 5 fittest individuals and 5 least fit individuals for Generation 40
Figure 4.10. Convergence graph of Generation 40
Figure 4.11. Population distribution of Generation 40 in quadrant of three fitness criteria
Figure 4.12. Deviation graph
SEQUENCE 4 | GENERATION 60
In order to achieve more variety, “Elitism” is decreased to 0.2, and “Crossover rate” is increased to 0.8. Individuals gradually become fitter and fitter from Generation 20 to Generation 60, but Generation 60 fails in the achievement of a wider variety.
Figure 4.13. Fitness value of five most fittest individuals and five least fit individuals of Generation 60
Figure 4.14. Convergence graph of Generation 60
Figure 4.15. Population distribution of Generation 60 in quadrant of three fitness criteria
Figure
SEQUENCE 4 | GENERATION 80
With the insistance in trying to achieve more variety, both “Mutation probability” and “Mutation rate” are increased at Generation 60. As a result, Generation 80 slightly achieved an increase of its standard deviation, compared to both Generation 40 and Generation 60.
Figure 4.17 Fitness value of five most fittest individuals and five least fit individuals of Generation 80
Figure 4.18. Convergence graph of Generation 80
Figure 4.19. Population distribution of Generation 80 in quadrant of three fitness criteria
Figure
SEQUENCE 4 | OBSERVATIONS
Primitive Block
Block:
Block Length: Block Width: Street Width:
Based on the evaluate result of fitness values of Generation 20, Generation 40, Generation 60, and Generation 80. The top 4 fittest individuals are ranked as following: G80.11, G80.19, G80.18, and G60.03. In comparison with the primitive super block, all of these four individual super blocks have better performance in aspect of three fitness criteria, which are maximum volume, maximum courtyard exposure, and maximum street exposure. Whereas fitter individuals of above three fitness criteria have been achieved, it is also important to assess these individuals in other aspects, which could provide a more comprehensive understanding towards current solutions.
The four our individuals have fitter value in aspect of Plot coverage, FAR, sun exposure on building surface and courtyard surface. Variety of height have been achieved comparing with primitive super block.
Observing super blocks from top view, it could be detected that main streets become primary network that separating and connecting each blocks, while the missing divisions of internal bay and external bay generated secondary network, which connecting adjacent courtyards.
There are still some limitations, Same area of blocks leads to grid street system. All the block areas increase and decrease together, always have some area, which lead to grid street network. More variety could be achieved via changing each block area independently. Besides, Generations could developed further than 80 with more population: In Sequence 4, the tests ended at Generation 80, the patterns of relationship between Octopus parameters and fitness values haven’t been in-depth explored. Running more generations with more population would be instrumental in this exploration.
CONCLUSIONS
Through the work developed in this research, concepts from Evolution and Embryological Development (Evo-Devo) theories are investigated and applied as a design approach through Evolutionary Computational processes. The developed experiments are based on four main consecutive sequences, which start from applying standard operations to a simple abstract geometry and progressively become more complex once the application is considered for urban design.
In the first sequences it was possible to create populations of individuals in an “analogical” way, by 3D modelling in Rhino environment simple geometrical operations that where applied to a basic primitive. The implementation of these simple actions and strategies allowed to have much control over this simplified evolutionary process. In both first sequences, a maximum of 2 criterions were defined. It was possible to easily manipulate the desired outcomes through the design of clear breeding and crossover strategies. It was quickly evidenced how the introduction of a body plan allows for much higher variation, even with a simple tool kit ( small genepool), and short genome structures. However, although somewhat harder than for the first experiments, it was still possible to predict and manipulate the outcomes through the strategies defined. Furthermore, with the introduction of Mutation operations it was possible to detect “helpful’ genes and to introduce them in a particular position that could ensure a gain in the fitness of the individual.
These empirical simplified experiments helped gain a basic understanding of evolutionary algorithms, and how to think about the design of strategies for evolutionary processes. However, they did not yet fully prove up to what extend this processes can be implemented for design purposes.
For the final sequences, which aimed for a clear urban design application, more complex design experiments involving a larger number of parameters and criterions, were evaluated. The potential of Octopus/Gh plugin within Rhino as a tool for finding multiple optimisation solutions was studied through the simulation of a genetic experiment for the evolution of urban blocks. Much of the control that had been gained in previous simplified experiments was lost once this new digital environment was introduced However it was still possible to establish a strategy, by adjusting some variable values such as elitism, crossover rate, mutation probability and mutation rate.
The utilisation of Octopus introduces a degree of complexity which enables to run a large number of generations in a short period of time, and to evaluate the optimal solution for up to 5 Fitness criteria, producing a range of optimised trade-off solutions between the extremes of each goal. This was proven to be an extremely useful tool for the application of evolutionary principles to design, and for the finding of optimal solutions, that would otherwise be impossible to anticipate.
Yue Zhu, Julia Hajnal, Camila Becerra February, 2016