December 2022
MARKET SNAPSHOT
ADA COUNTY
Median Sales Price
$515,000
Down 5.5% year over year
Down 1.9% over last month
Active Listing Inventory
1,462
Up 151.2% year over year
Down 20.6% over last month
Average Days On Market
62
Up 93.8% year over year
Up 3.1% over last month
Closed Sales
569
Down 41% year over year
CANYON COUNTY
Median Sales Price
$390,000
Down 7% year over year
Down 6% over last month
Active Listing Inventory

953
Up 86.1% year over year
Down 16.5% over last month
Average Days On Market
68
Up 70% year over year Up 20.3% over last month
Closed Sales
327
Down 40.4% year over year


December 2021/2022 – total $ shown in thousands 3 $0 $100 $200 $300 $400 $500 $600 $700 JAN FEB MAR APR MAY JUN JUL AUG SEP OCT NOV DEC 2021 2022
$0 $50 $100 $150 $200 $250 $300 $350 $400 $450 $500 JAN FEB MAR APR MAY JUN JUL AUG SEP OCT NOV DEC 2021 2022 Treasure Valley Market Report | December 2022
Monthly Median Sales Price Comparison
ADA COUNTY CANYON COUNTY
Median Sold Prices By City

ADA & CANYON COUNTIES | SINGLE FAMILY | December 2022 470 793 485 464 565 576 550 650 750 850 950

5
December 2022, month/year comparison 0 500 1000 1500 2000 2500 JAN FEB MAR APR MAY JUN JUL AUG SEP OCT NOV DEC 2019 2020 2021 2022 ADA COUNTY 0 200 400 600 800 1000 1200 1400 JAN FEB MAR APR MAY JUN JUL AUG SEP OCT NOV DEC 2019 2020 2021 2022
Treasure Valley Market Report | December 2022
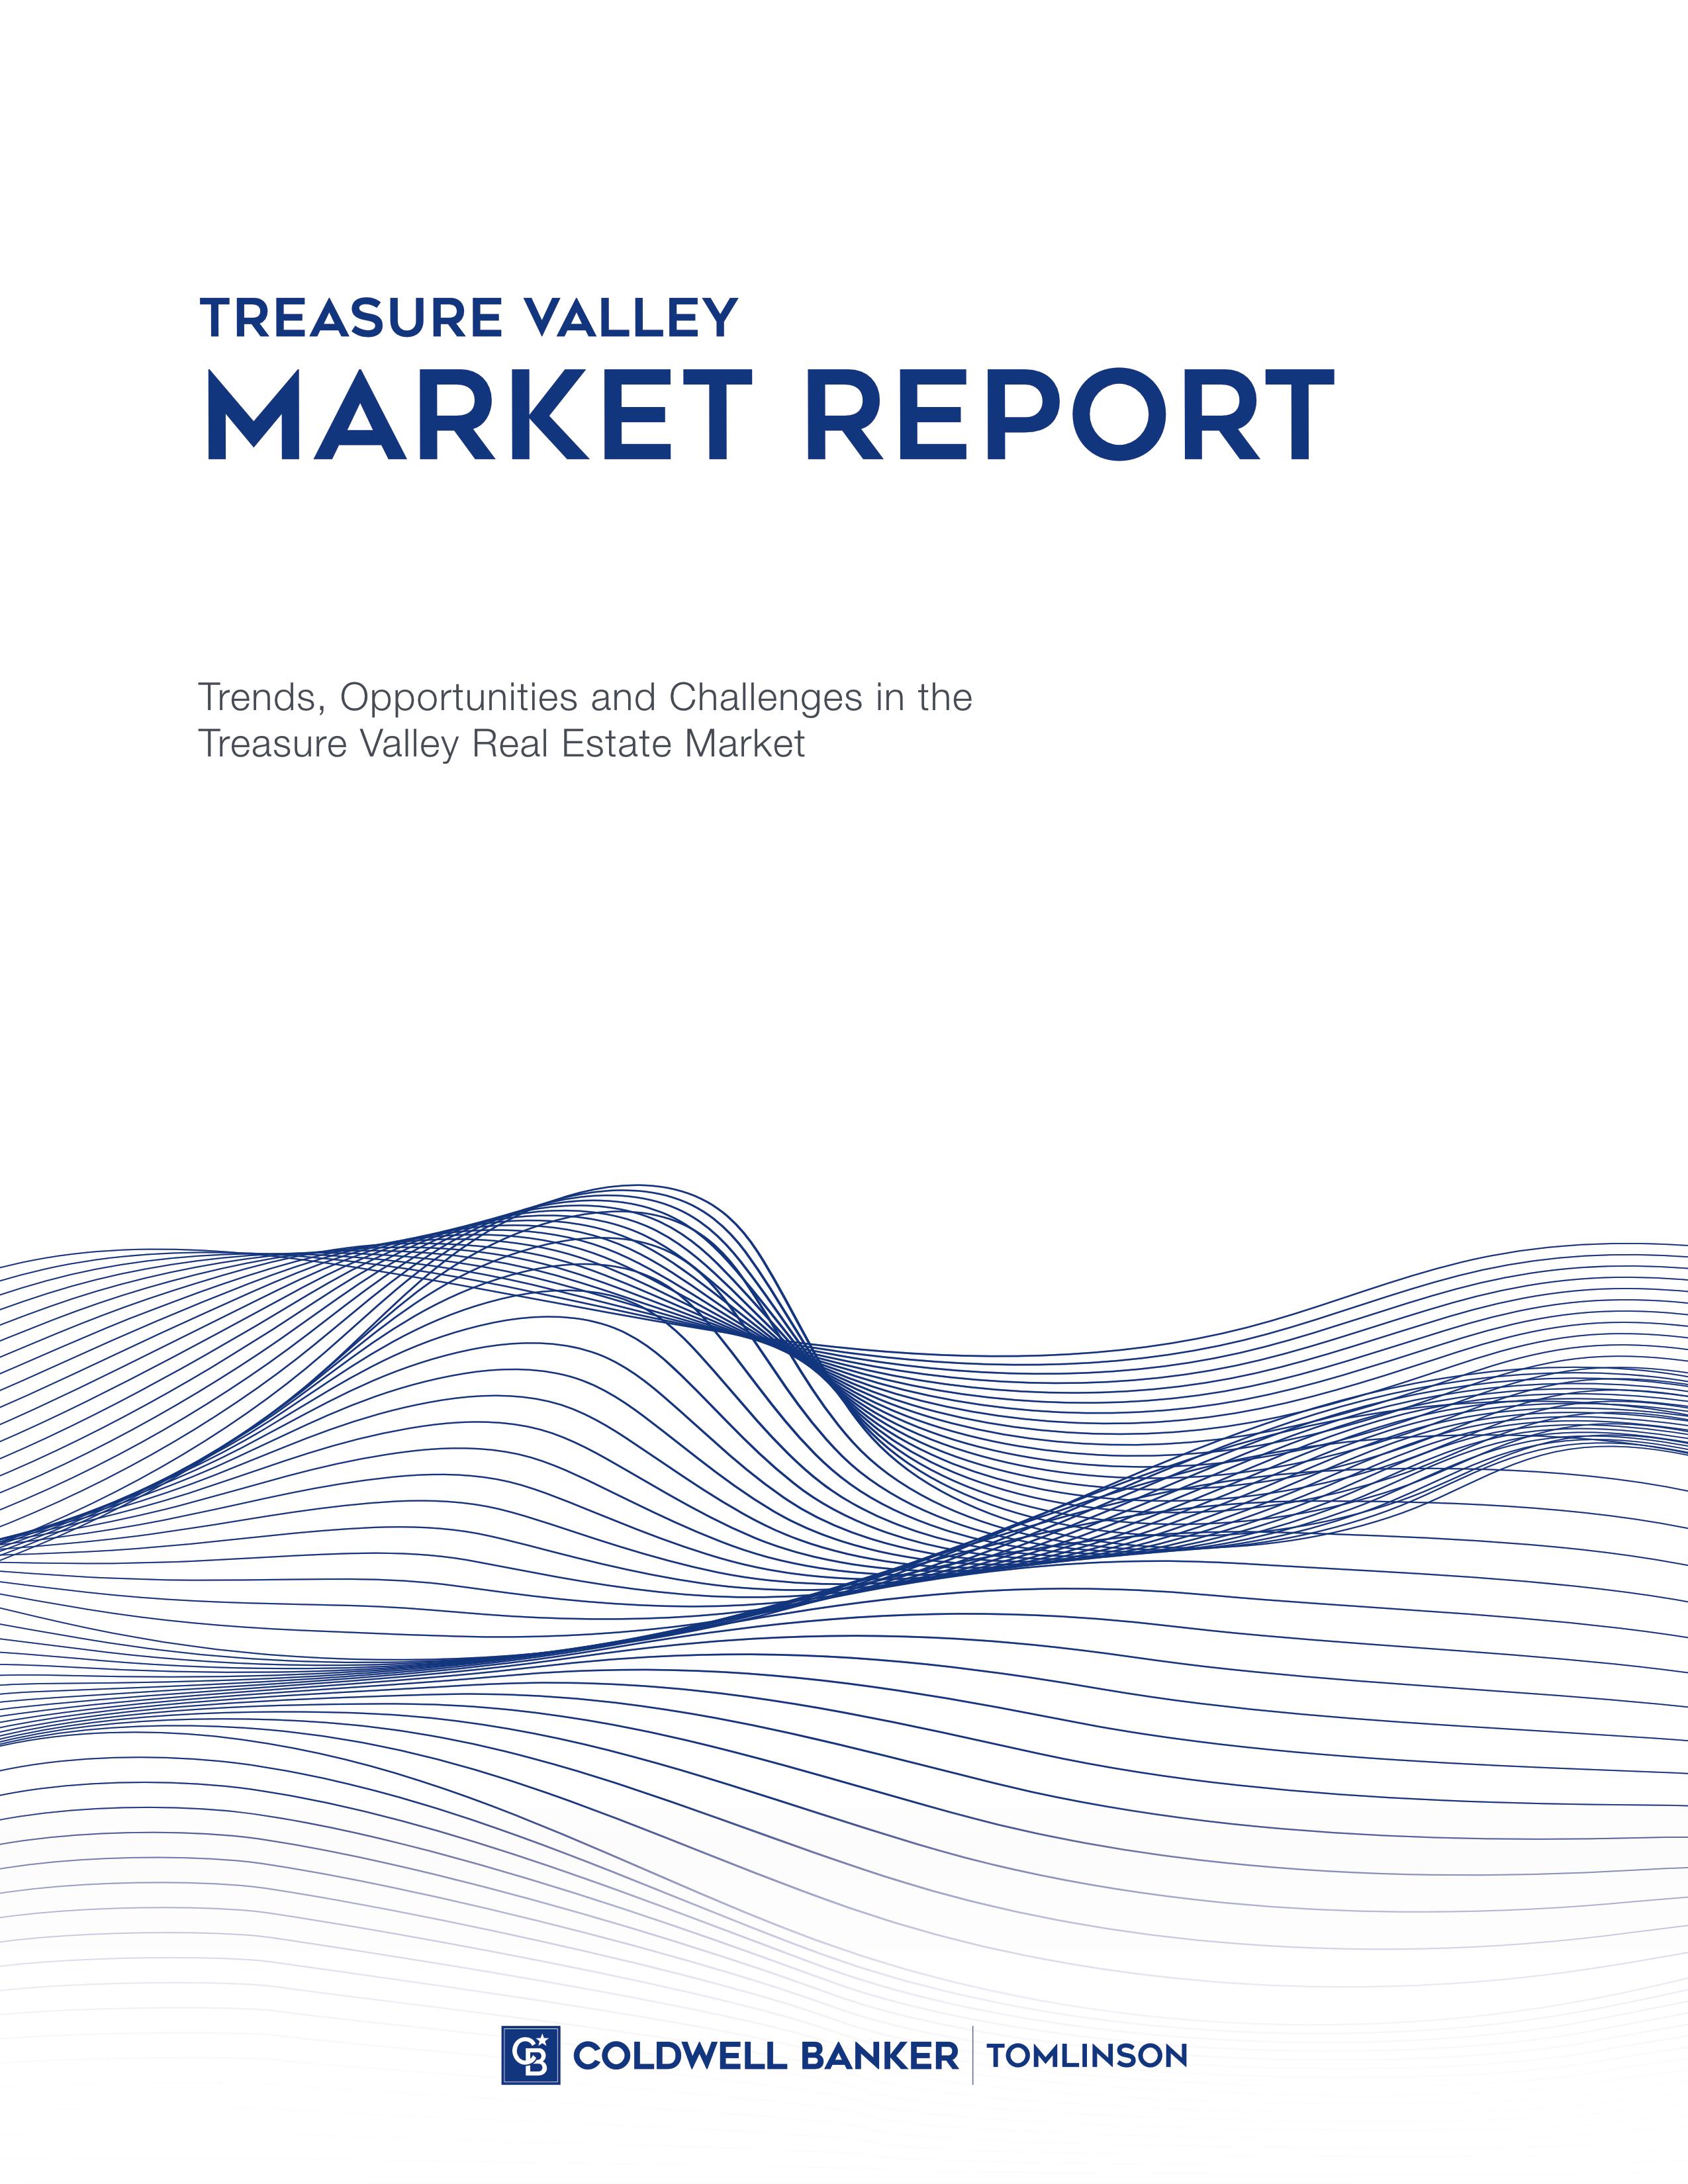
Active Residential Listings
CANYON COUNTY

Active Listings by Price Range December 2022 $300-$399 13% $400-$499 25% $500-$699 27% ADA COUNTY
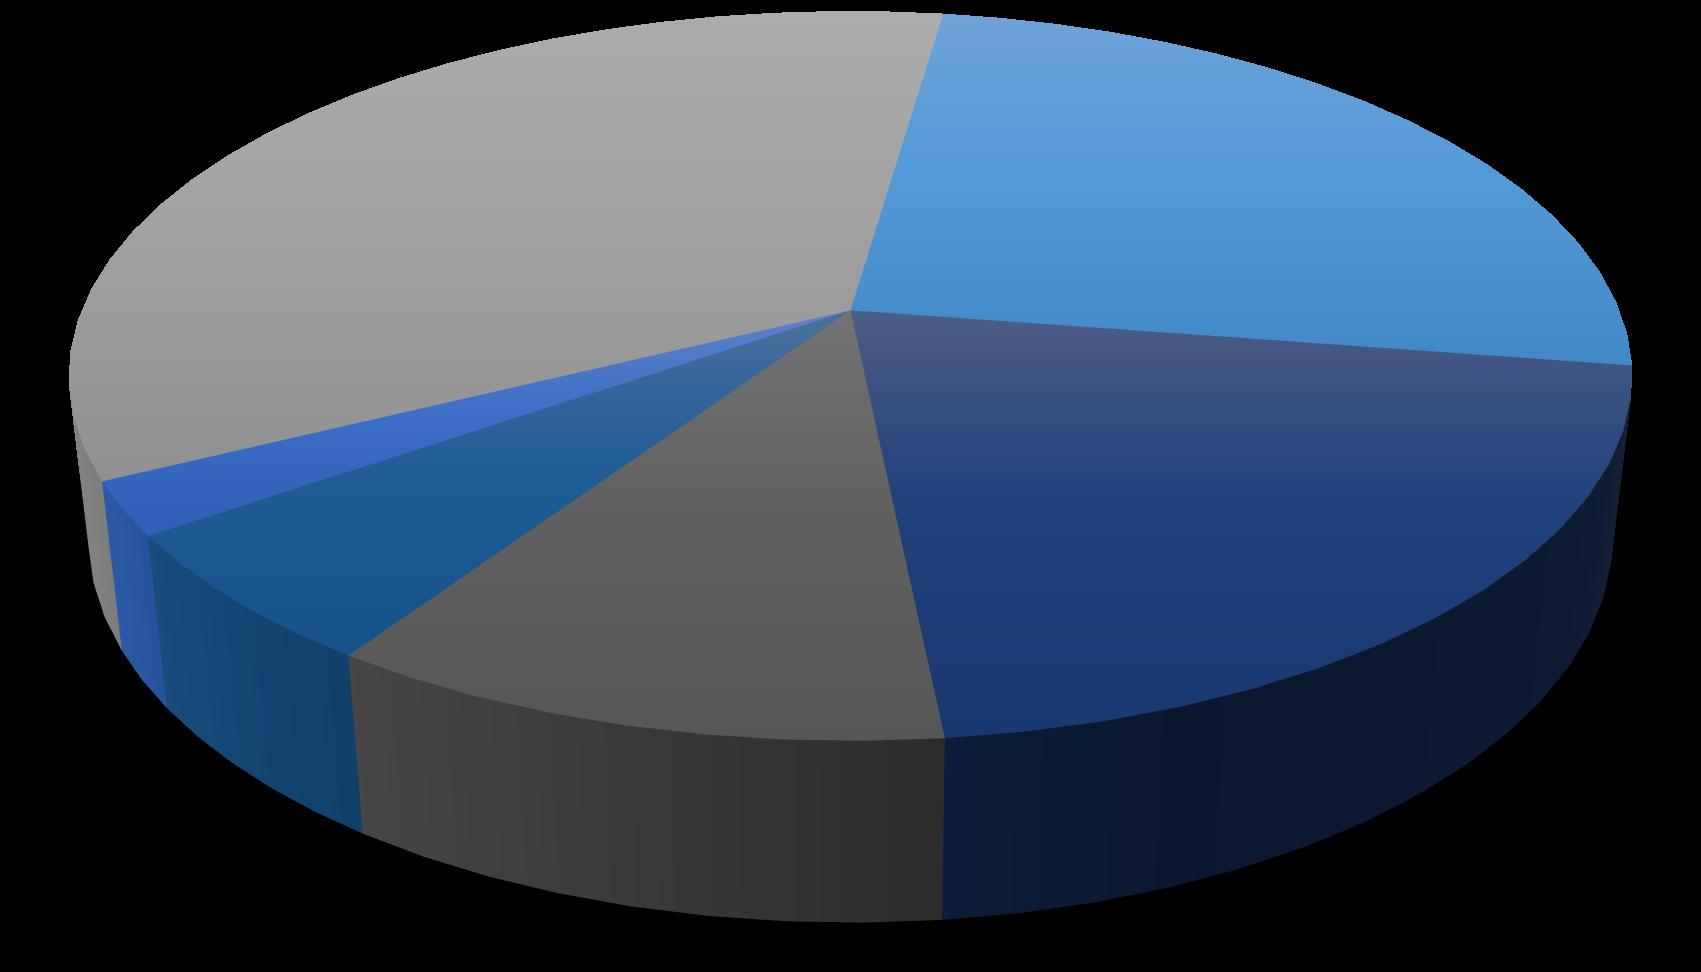

Active Listings by Price Range December 2022 CANYON COUNTY $250-$299 2% $300-$399 35% $400-$499 25% $500 $699
Residential Closed Sales


8
December 2022 0 200 400 600 800 1000 1200 1400 1600 JAN FEB MAR APR MAY JUN JUL AUG SEP OCT NOV DEC 2019 2020 2021 2022 0 100 200 300 400 500 600 700 JAN FEB MAR APR MAY JUN JUL AUG SEP OCT NOV DEC 2019 2020 2021 2022
Treasure Valley Market Report | December 2022 Treasure Valley Market Report | December 2022
ADA COUNTY CANYON COUNTY

9 Treasure Valley Market Report | December 2022
Let us help you find your home sweet home.
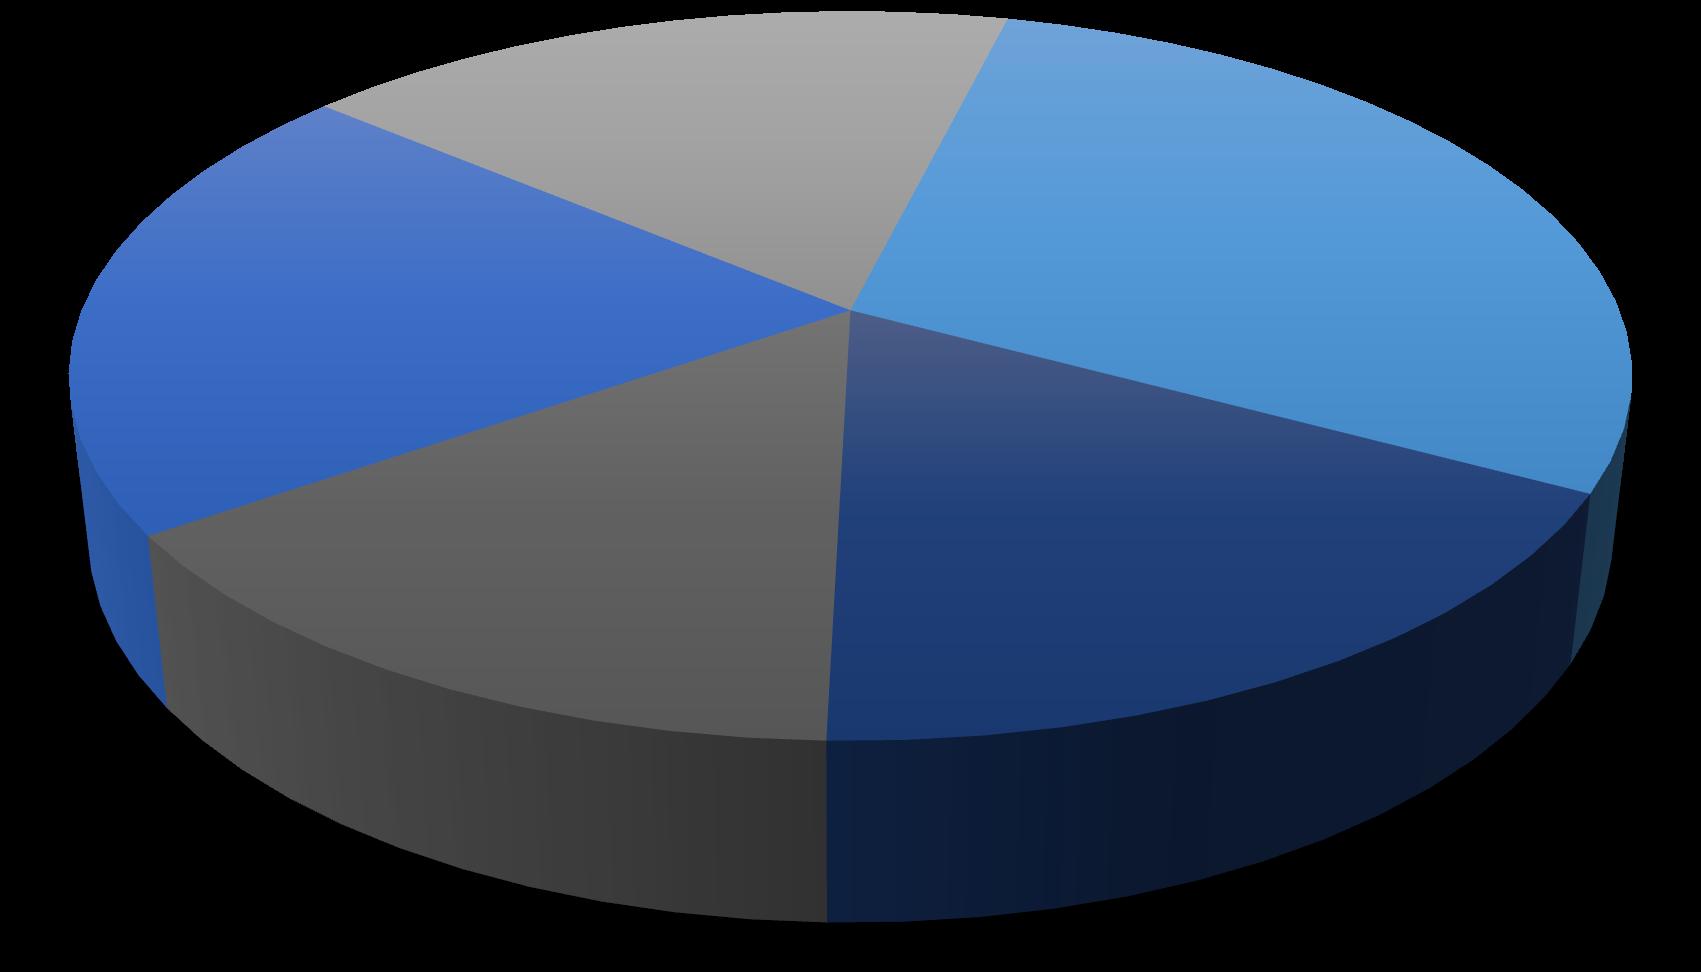

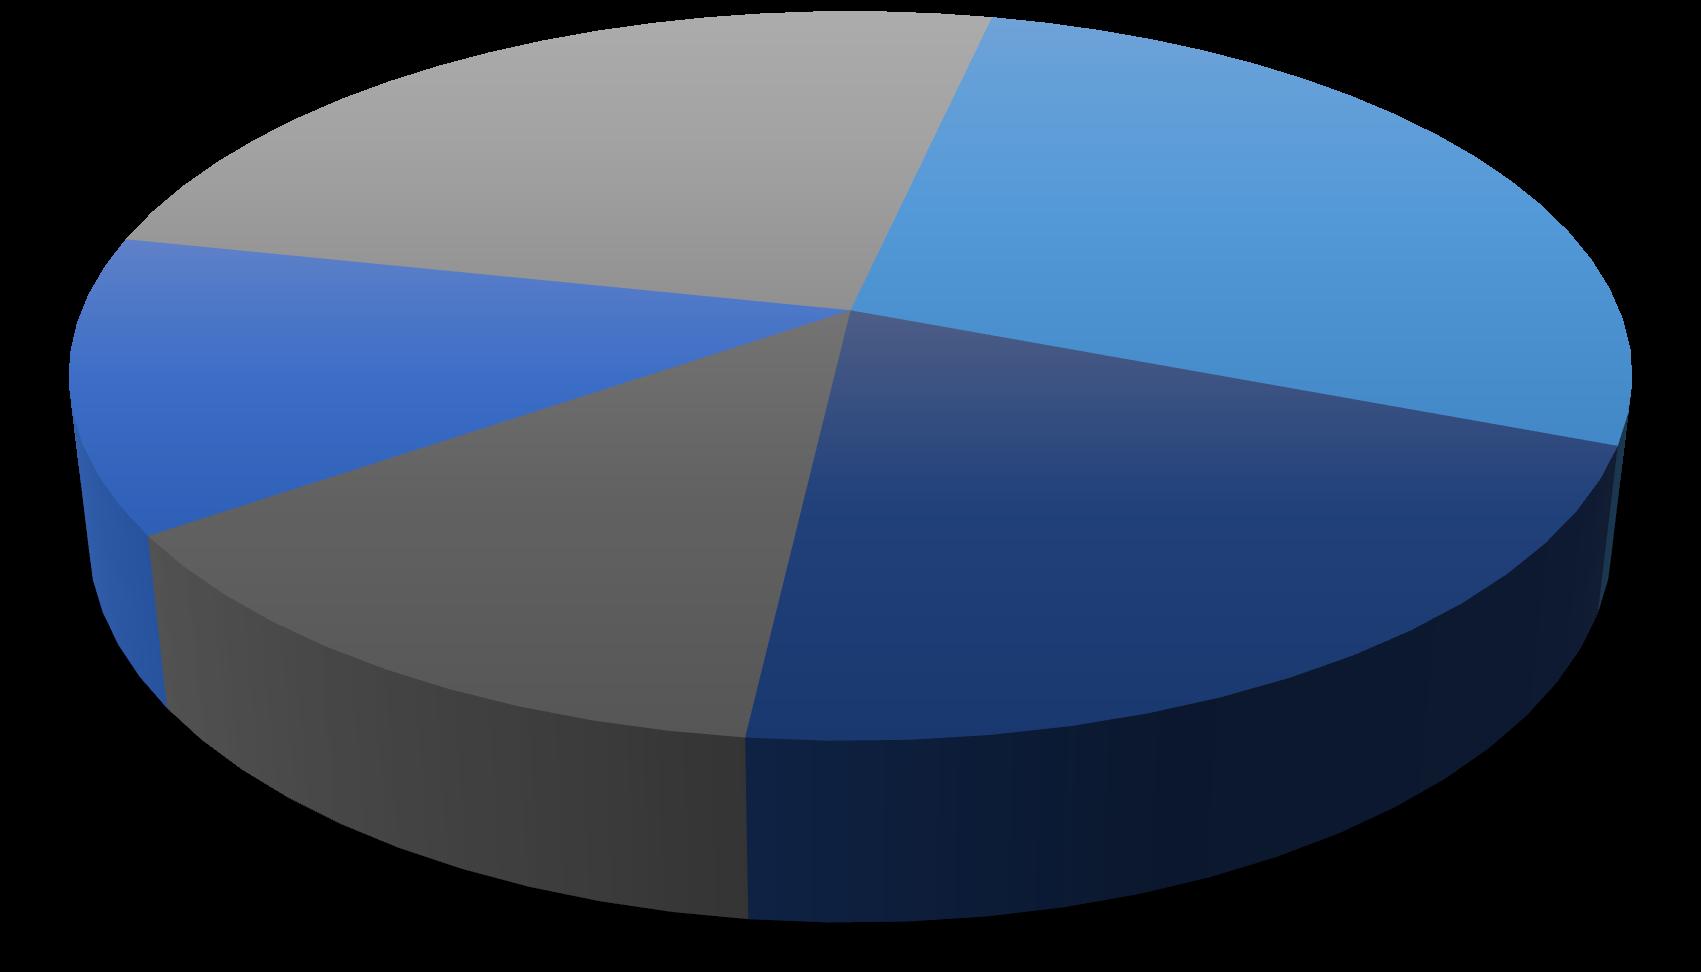
Sold Listings by Price Range December 2022 ADA COUNTY $300-$399 21% $400-$499 18% $500-$699 29% $700-$999 17% $1,000,000+ 15%

Sold Listings by Price Range December 2022 CANYON COUNTY $250-$299 25% $300-$399 25% $400-$499 22% $500-$699 $700-$999 $1,000,000+ 1%
Residential Closed Sales


RESALE vs. NEW CONSTRUCTION | December 2022
753 883 734 385 309 407 200 234 0 100 200 300 400 500 600 700 800 900 1000 1100 1200 1300 2019 2020 2021 2022 Re-Sale New 388 406 347 185 156 256 178 164 0 100 200 300 400 500 600 700 800 900 1000 2019 2020 2021 2022 Re-Sale New Treasure Valley Market Report | December 2022 12
ADA COUNTY CANYON COUNTY
#GuidingYouHome

Treasure Valley Market Report | December 2022 13
Annual Average Interest Rates
Treasure Valley Market Report | December 2022 14
2013 2014 2015 2016 2017 2018 2019 2020 2021 2022
30 - year fixed mortgage 3.98% 4.24% 3.85% 3.65% 3.99% 4.54% 3.94% 3.11% 2.95% 5.35% 0.00% 1.00% 2.00% 3.00% 4.00% 5.00% 6.00%


Treasure Valley Market Report | December 2022 15
We have you covered! www.iccu.com/CBT
Looking for the best loan officers in town?
 Treasure Valley Market Report | December 2022
