
2023 Ada&Canyon MarketReport MonthlyMarketReportforAda&CanyonCounty county June 2023
MARKET SNAPSHOT
ADA COUNTY
Median Sales Price
$545,000
Down 8% year over year Up 1.8% over last month
Active Listing Inventory
1,363
Down 36.2 % year over year Up 8.2% over last month
Average Days On Market
33
Up 120% year over year Down 8.3% over last month
CANYON COUNTY
Median Sales Price
$405,000
Down 9% year over year Down 2.4% over last month
Active Listing Inventory
743
Down 37.6% year over year Up 10.5% over last month
Average Days On Market
53
Up 165% year over year Up 1.9% over last month


June 2022/2023 – total $ shown in thousands 3 $0 $100 $200 $300 $400 $500 $600 $700 JAN FEB MAR APR MAY JUN JUL AUG SEP OCT NOV DEC JAN 2022 2023
$0 $50 $100 $150 $200 $250 $300 $350 $400 $450 $500 JAN FEB MAR APR MAY JUN JUL AUG SEP OCT NOV DEC 2022 2023 Treasure Valley Market Report | June 2023
Monthly Median Sales Price Comparison
ADA COUNTY CANYON COUNTY

ADA & CANYON COUNTIES | SINGLE FAMILY | June 2023 500 734 525 454 570 401 375 482 440 540 640 740 840 940
Median Sold Prices By City

5
Listings June 2023, month/year comparison 0 500 1000 1500 2000 2500 JAN FEB MAR APR MAY JUN JUL AUG SEP OCT NOV DEC 2020 2021 2022 2023 ADA COUNTY 0 200 400 600 800 1000 1200 1400 JAN FEB MAR APR MAY JUN JUL AUG SEP OCT NOV DEC 2020 2021 2022 2023 CANYON COUNTY Treasure Valley Market Report | June 2023
Active Residential
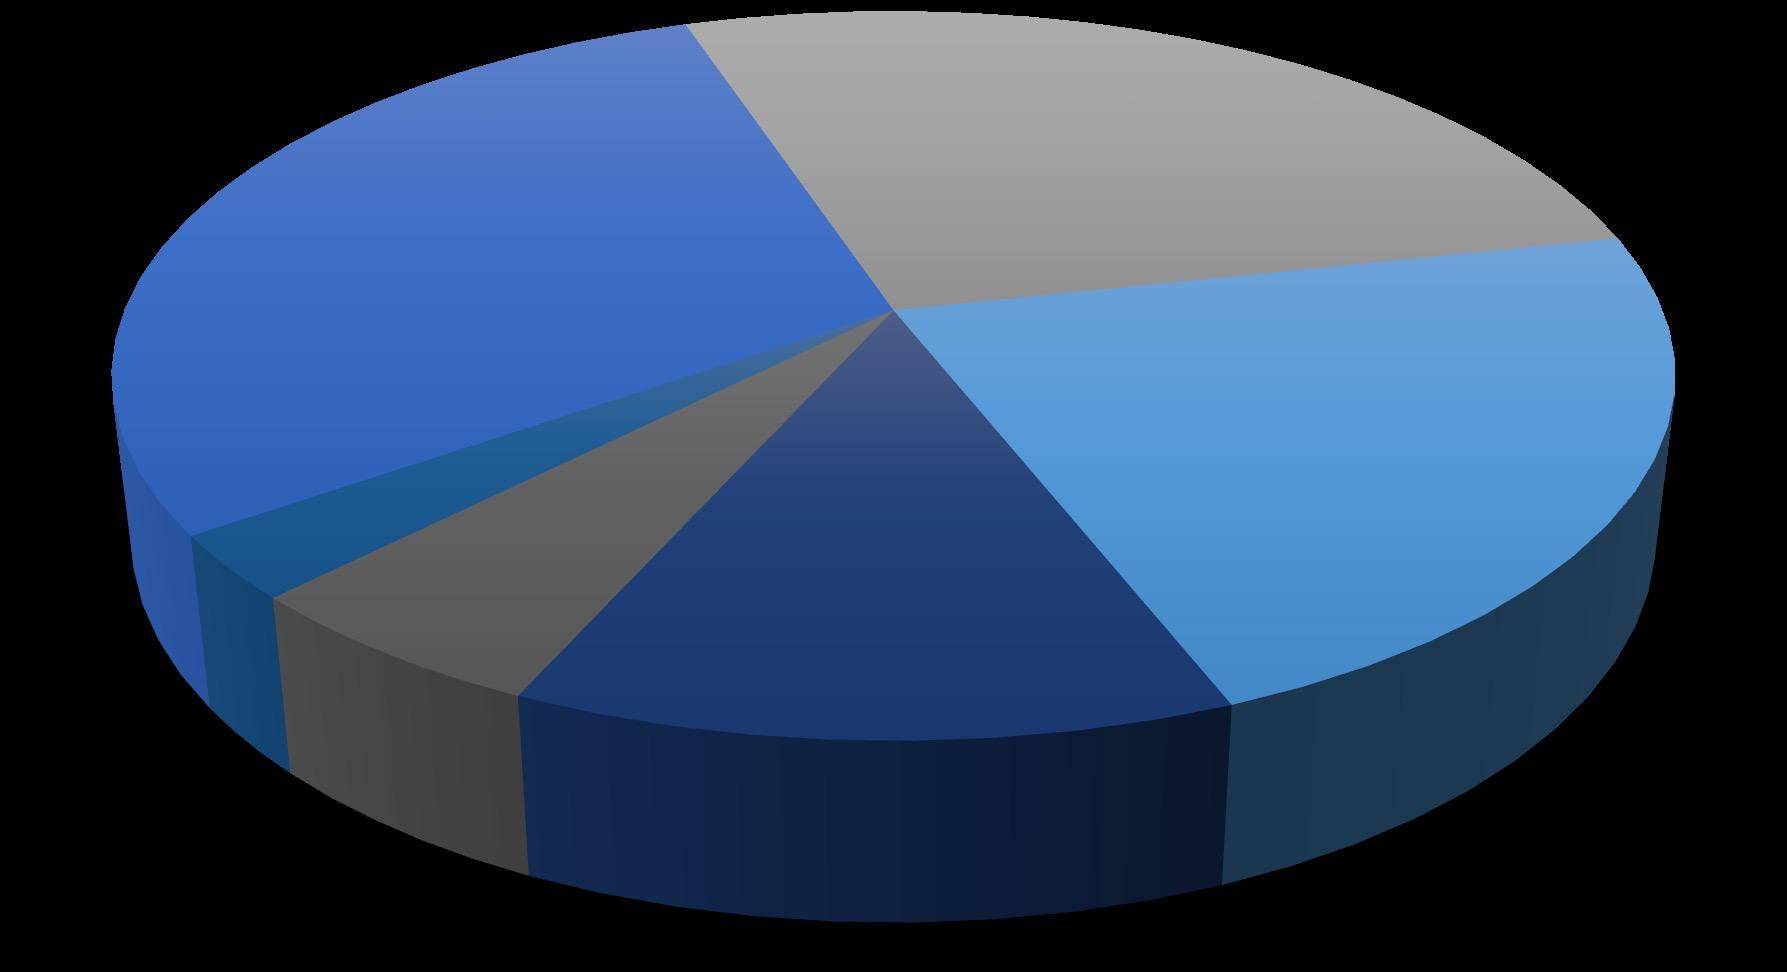
Active Listings by Price Range

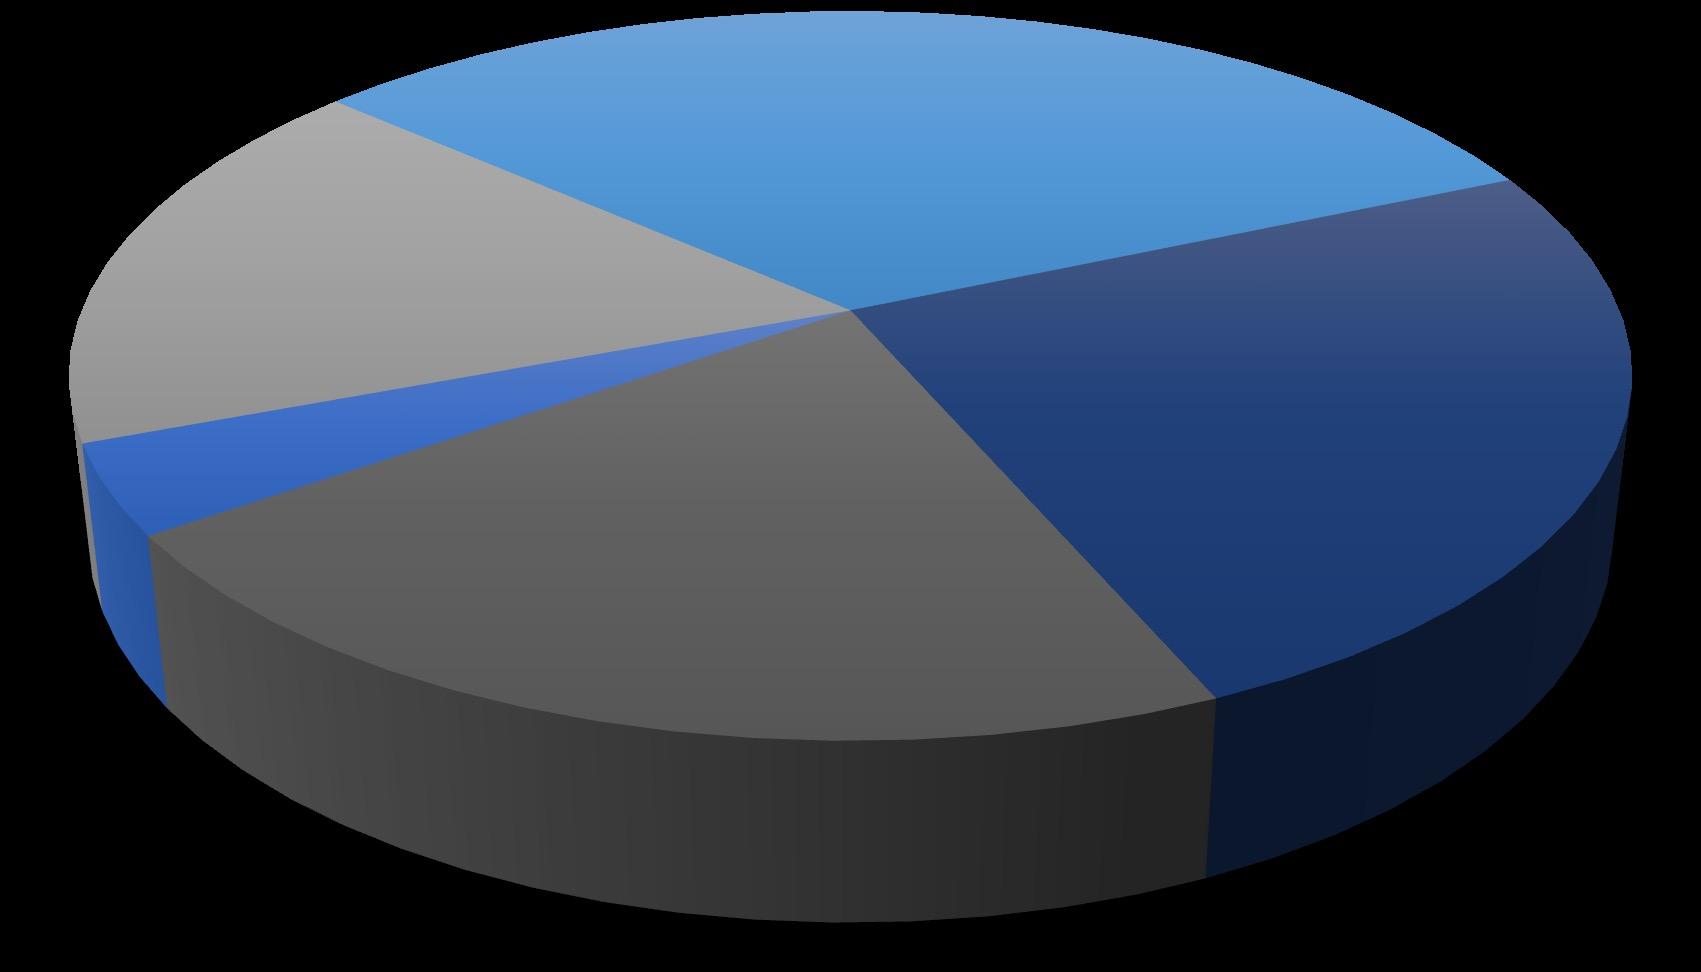
June 2023 $300-$399 4% $400-$499 17% $500-$699 32% $700-$999 25% $1,000,000+
ADA COUNTY
Active Listings by Price Range

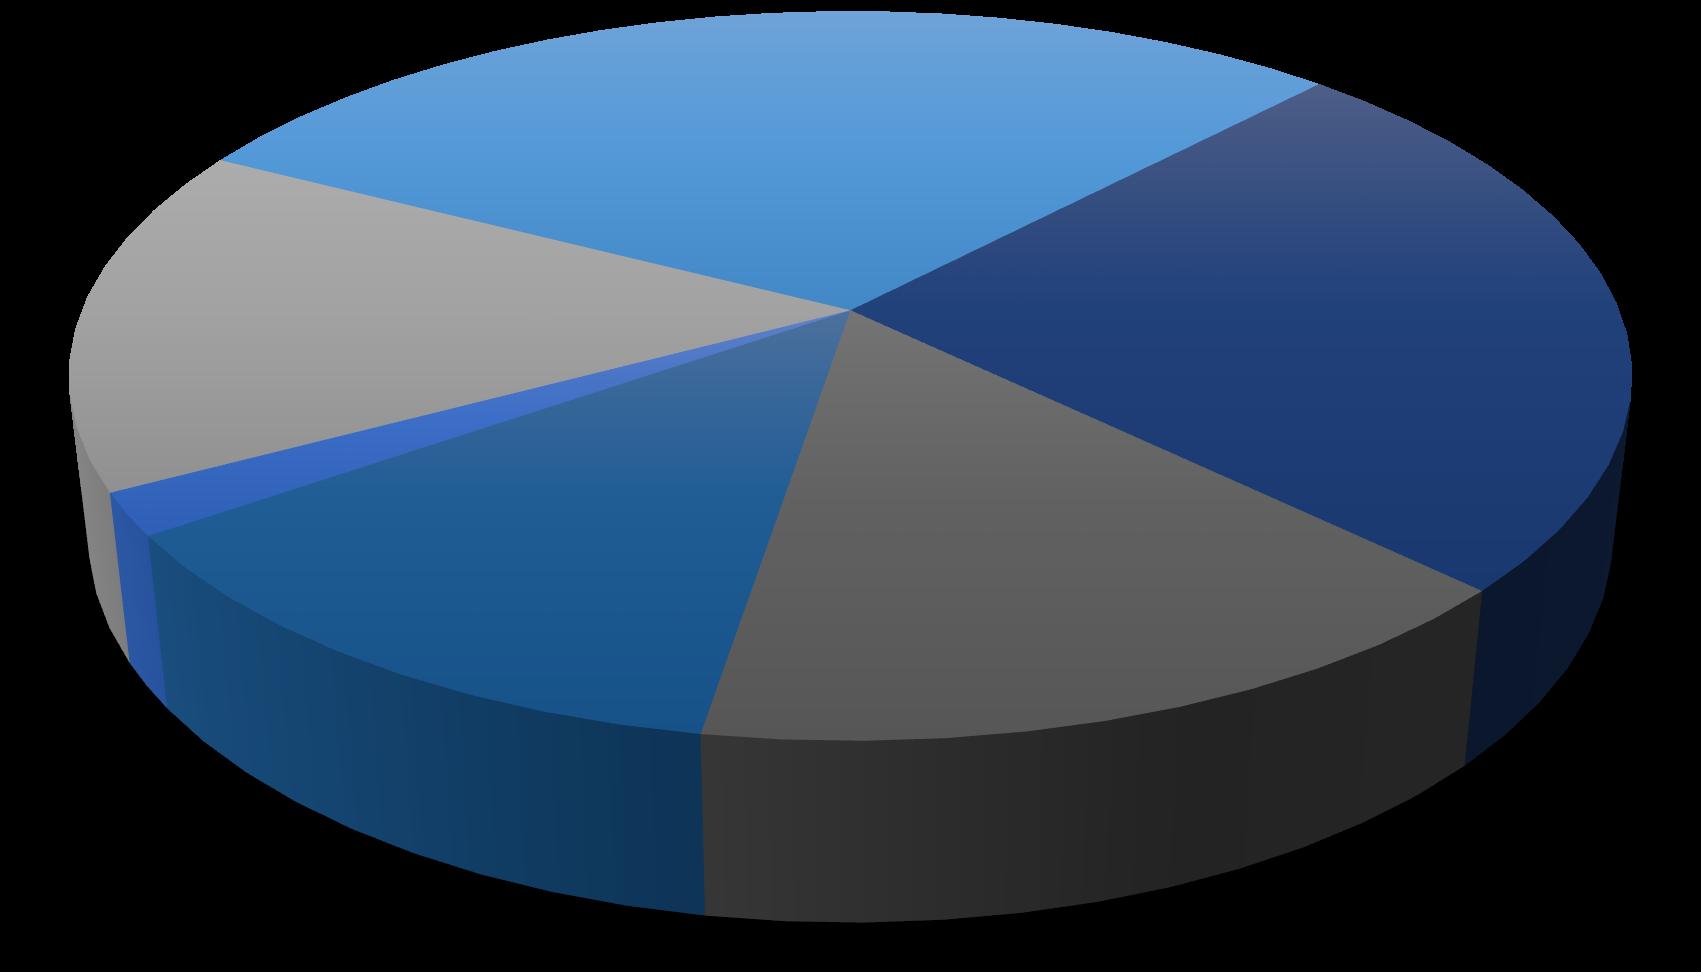
June 2023 CANYON COUNTY $250-$299 2% $300-$399 15% $400-$499 30% $500-$699 25%


8 Residential Closed Sales June 2023 0 200 400 600 800 1000 1200 1400 1600 JAN FEB MAR APR MAY JUN JUL AUG SEP OCT NOV DEC 2020 2021 2022 2023 0 100 200 300 400 500 600 700 JAN FEB MAR APR MAY JUN JUL AUG SEP OCT NOV DEC 2020 2021 2022 2023 ADA
CANYON
Treasure Valley Market Report | June 2023 Treasure Valley Market Report | June 2023
COUNTY
COUNTY
There’s no place like home.

9 Treasure Valley Market Report | June 2023
Sold Listings by Price Range

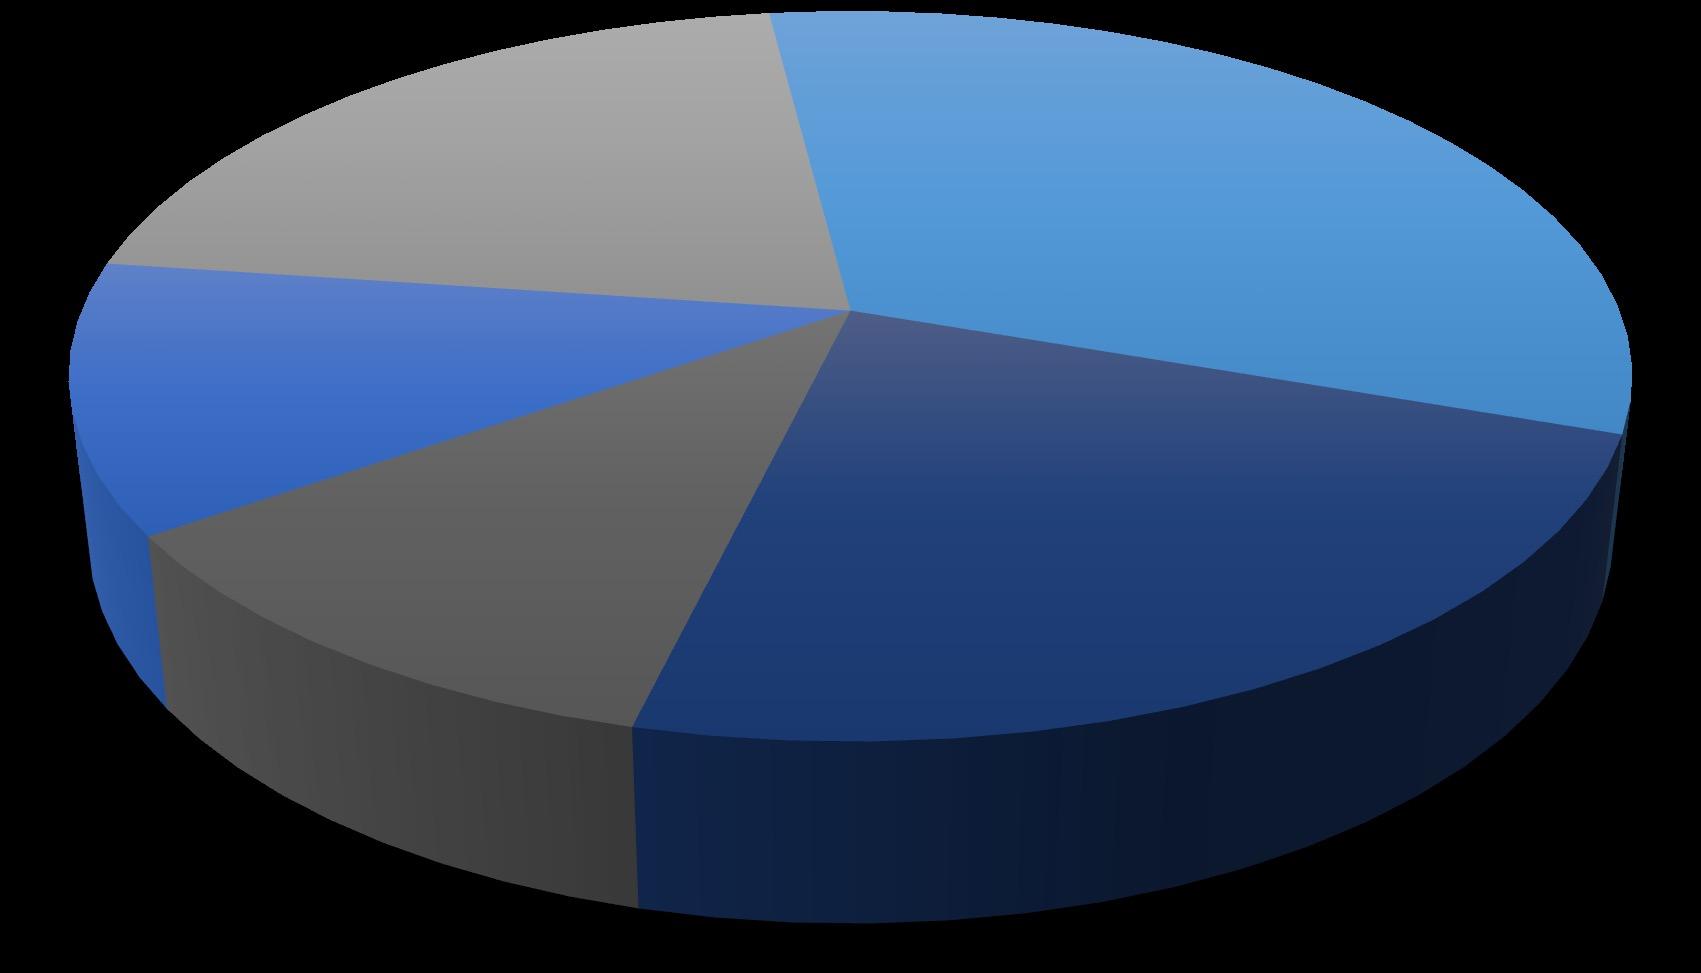
June 2023 ADA COUNTY $300-$399 12% $400-$499 21% $500-$699 32%
Sold Listings by Price Range
June 2023 CANYON COUNTY $250-$299 29% $300-$399 27% $400-$499 22% $500-$699 13% $700-$999 6% $1,000,000+ 3%


RESALE vs. NEW CONSTRUCTION | June 2023 ADA COUNTY CANYON COUNTY 883 734 338 553 407 200 234 217 0 100 200 300 400 500 600 700 800 900 1000 1100 1200 1300 2020 2021 2022 2023 Re-Sale New 406 347 160 261 256 178 164 154 0 100 200 300 400 500 600 700 800 900 1000 2020 2021 2022 2023 Re-Sale New Treasure Valley Market Report | June 2023 12
Residential Closed Sales

Treasure Valley Market Report | June 2023 13 Ready to buy or sell? Our agents have years of experience and are ready to help. #GuidingYouHome
Annual Average Interest Rates
Treasure Valley Market Report | June 2023 14
30 - year fixed mortgage 4.24% 3.85% 3.65% 3.99% 4.54% 3.94% 3.11% 2.95% 5.35% 6.41% 0.00% 1.00% 2.00% 3.00% 4.00% 5.00% 6.00% 7.00% 2014 2015 2016 2017 2018 2019 2020 2021 2022 2023

Treasure Valley Market Report | June 2023 15 Looking for the best loan officers in town? We have you covered!
The information in this report is compiled from a report given by Boise Regional REALTORS® and the Intermountain Multiple Listing Service and to the best of our knowledge is accurate and current.

©Coldwell Banker Real Estate LLC. All Rights Reserved. Coldwell Banker® and the Coldwell Banker Logo are registered service marks owned by Coldwell Banker Real Estate LLC. Coldwell Banker Real Estate LLC fully supports the principles of the Fair Housing Act and the Equal Opportunity Act. Each office is independently owned and operated. Information deemed reliable nut not guaranteed and should be independently verified.

Market
June 2023
cbboise.com Treasure Valley
Report |
