March 2024
MARKET SNAPSHOT

Median Sales Price $555,000 Up 14.4% year over year Up 6.3% over last month
COUNTY Active Listing Inventory 1,264 Up 11.5% year over year Up 12.2% over last month Closed Sales Average Days On Market 49 Down 31.0% year over year Same over last month Median Sales Price $413,395 Up 4.7% year over year Up 0.8% over last month Active Listing Inventory 818 Up 21.5% year over year Up 12.6% over last month
Closed Sales Average Days On Market 50 Down 37.5% year over year Same over last month CANYON COUNTY
ADA
373


Sales Price Comparison March 2022/2024 – total $ shown in thousands 3 400 500 600 JAN FEB MAR APR MAY JUN JUL AUG SEP OCT NOV DEC 2023 2024 ADA COUNTY CANYON COUNTY $350 $400 $450 JAN FEB MAR APR MAY JUN JUL AUG SEP OCT NOV DEC 2023 2024 Treasure Valley Market Report | March 2024
Monthly Median

Median Sold Prices By City ADA & CANYON COUNTIES | SINGLE FAMILY | March 2024 500 725 524 457 567 412 389 481 440 540 640 740 840 940

5 Active Residential Listings March 2024, month/year comparison 0 500 1000 1500 2000 2500 JAN FEB MAR APR MAY JUN JUL AUG SEP OCT NOV DEC 2021 2022 2023 2024 ADA COUNTY 0 200 400 600 800 1000 1200 1400 JAN FEB MAR APR MAY JUN JUL AUG SEP OCT NOV DEC 2021 2022 2023 2024 CANYON COUNTY Treasure Valley Market Report | March 2024
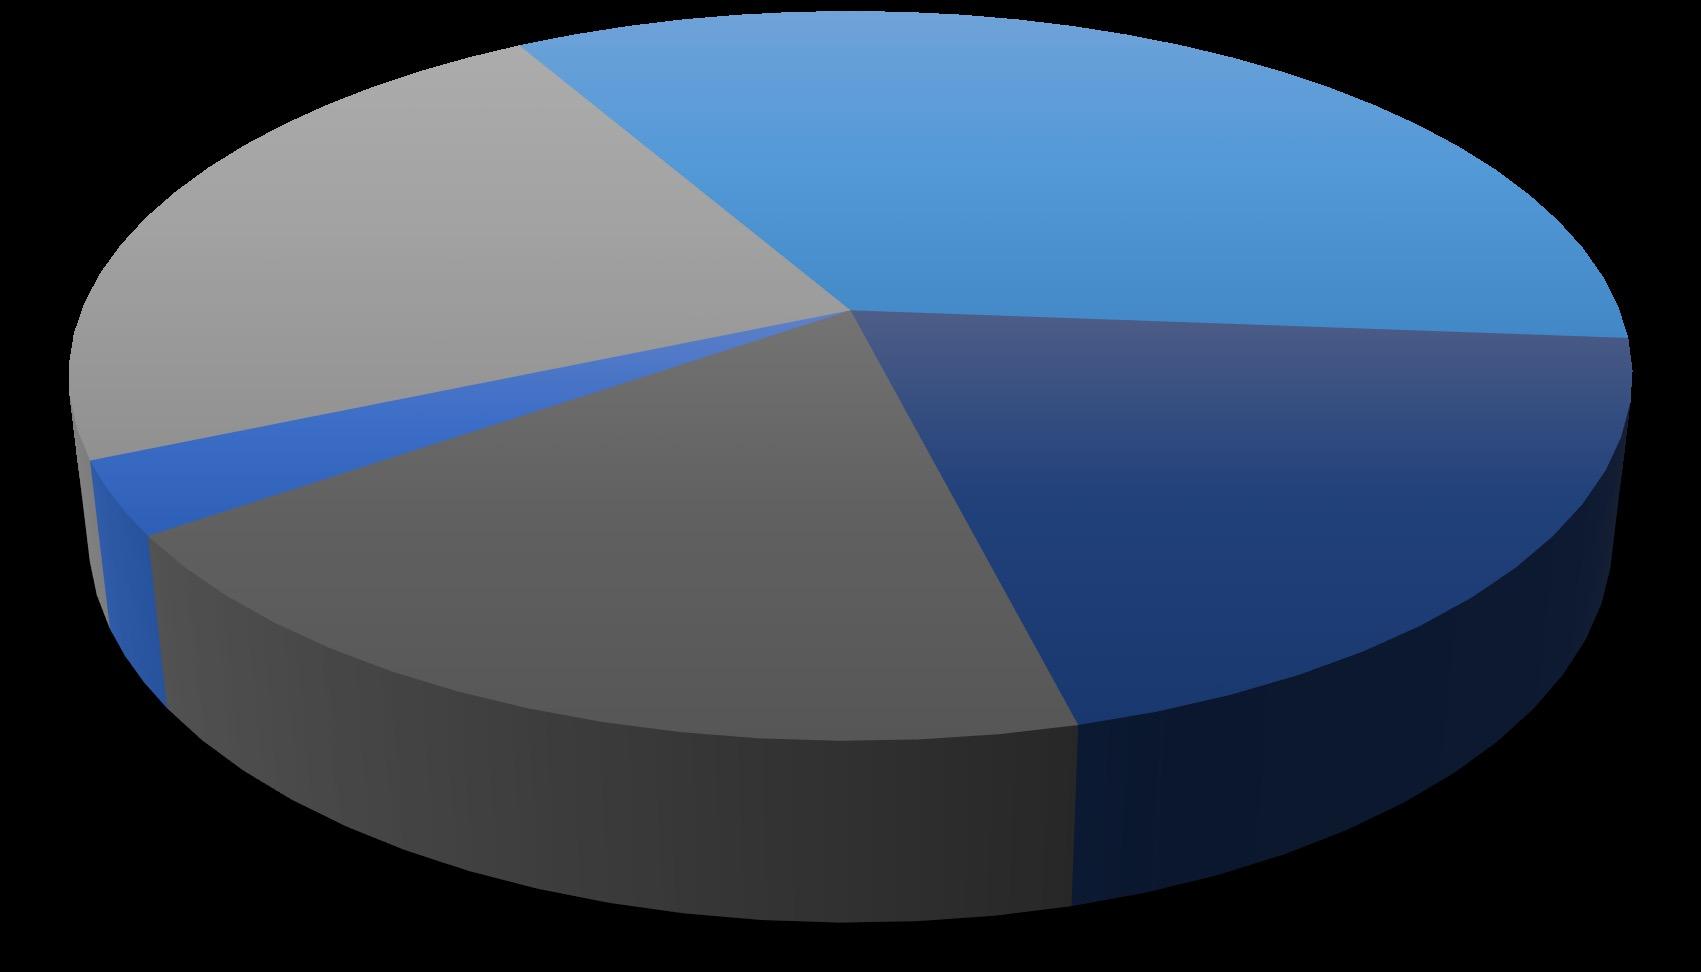

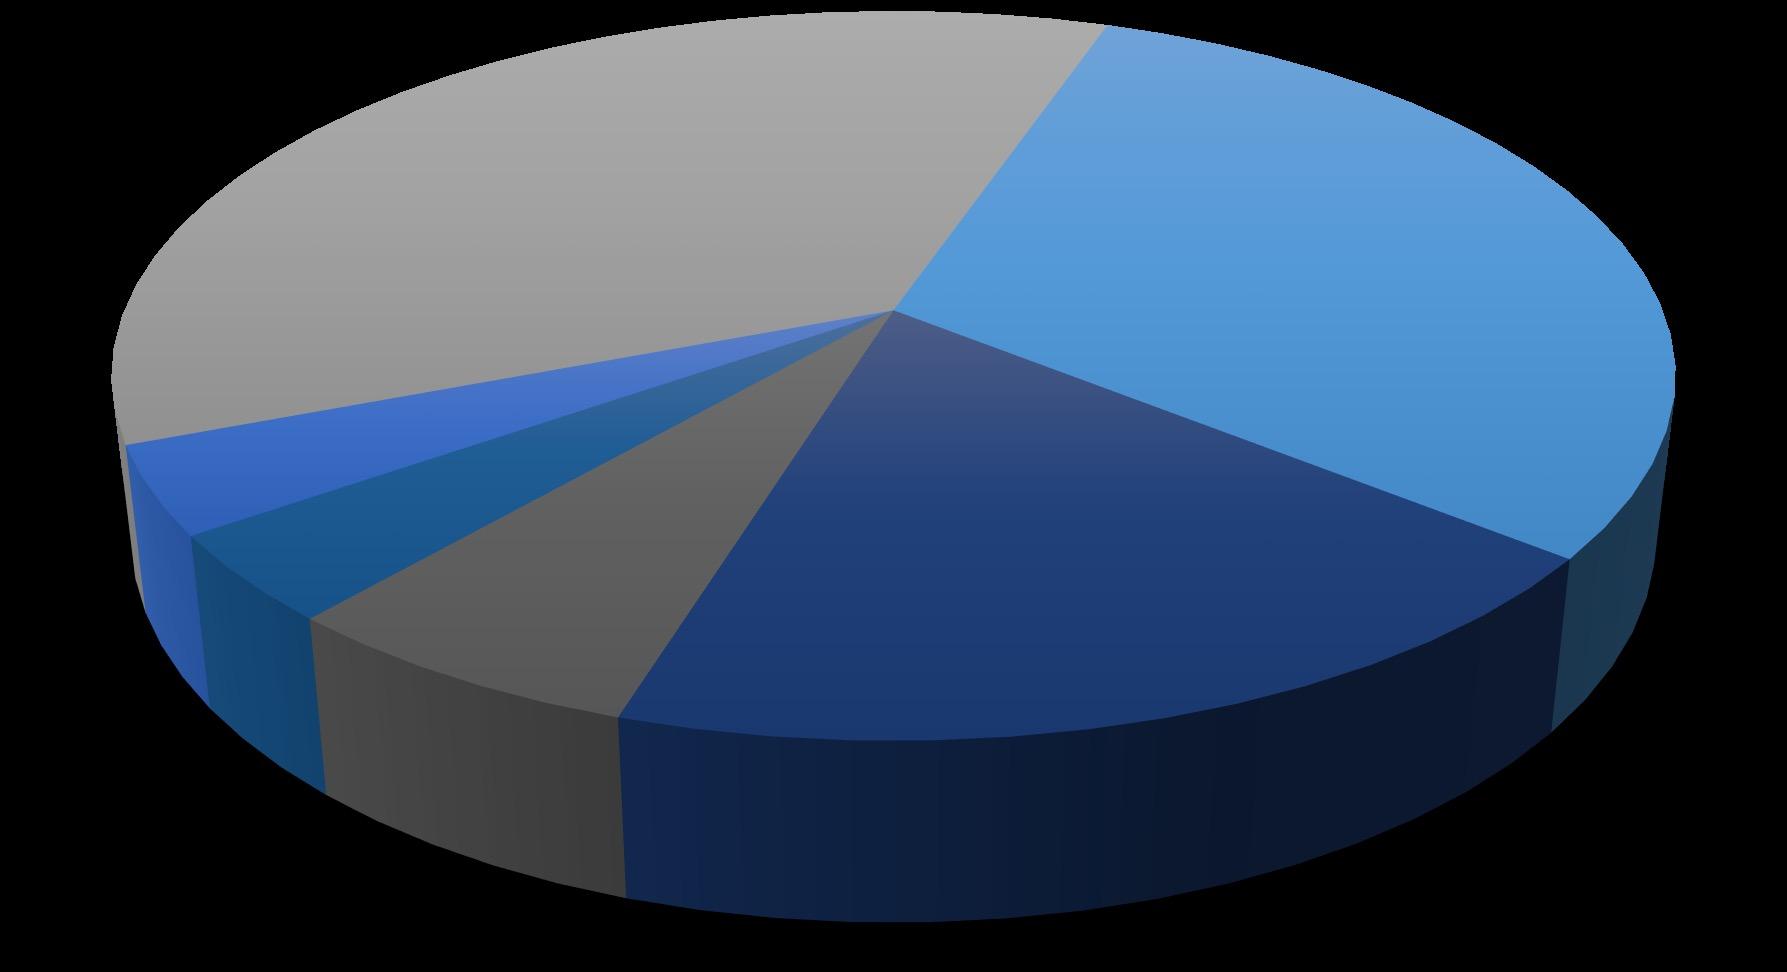
Active Listings by Price Range March 2024 $300-$399 3% $400-$499 23% $500-$699 35% $700-$999 20% $1,000,000+
COUNTY
ADA

Listings by Price Range
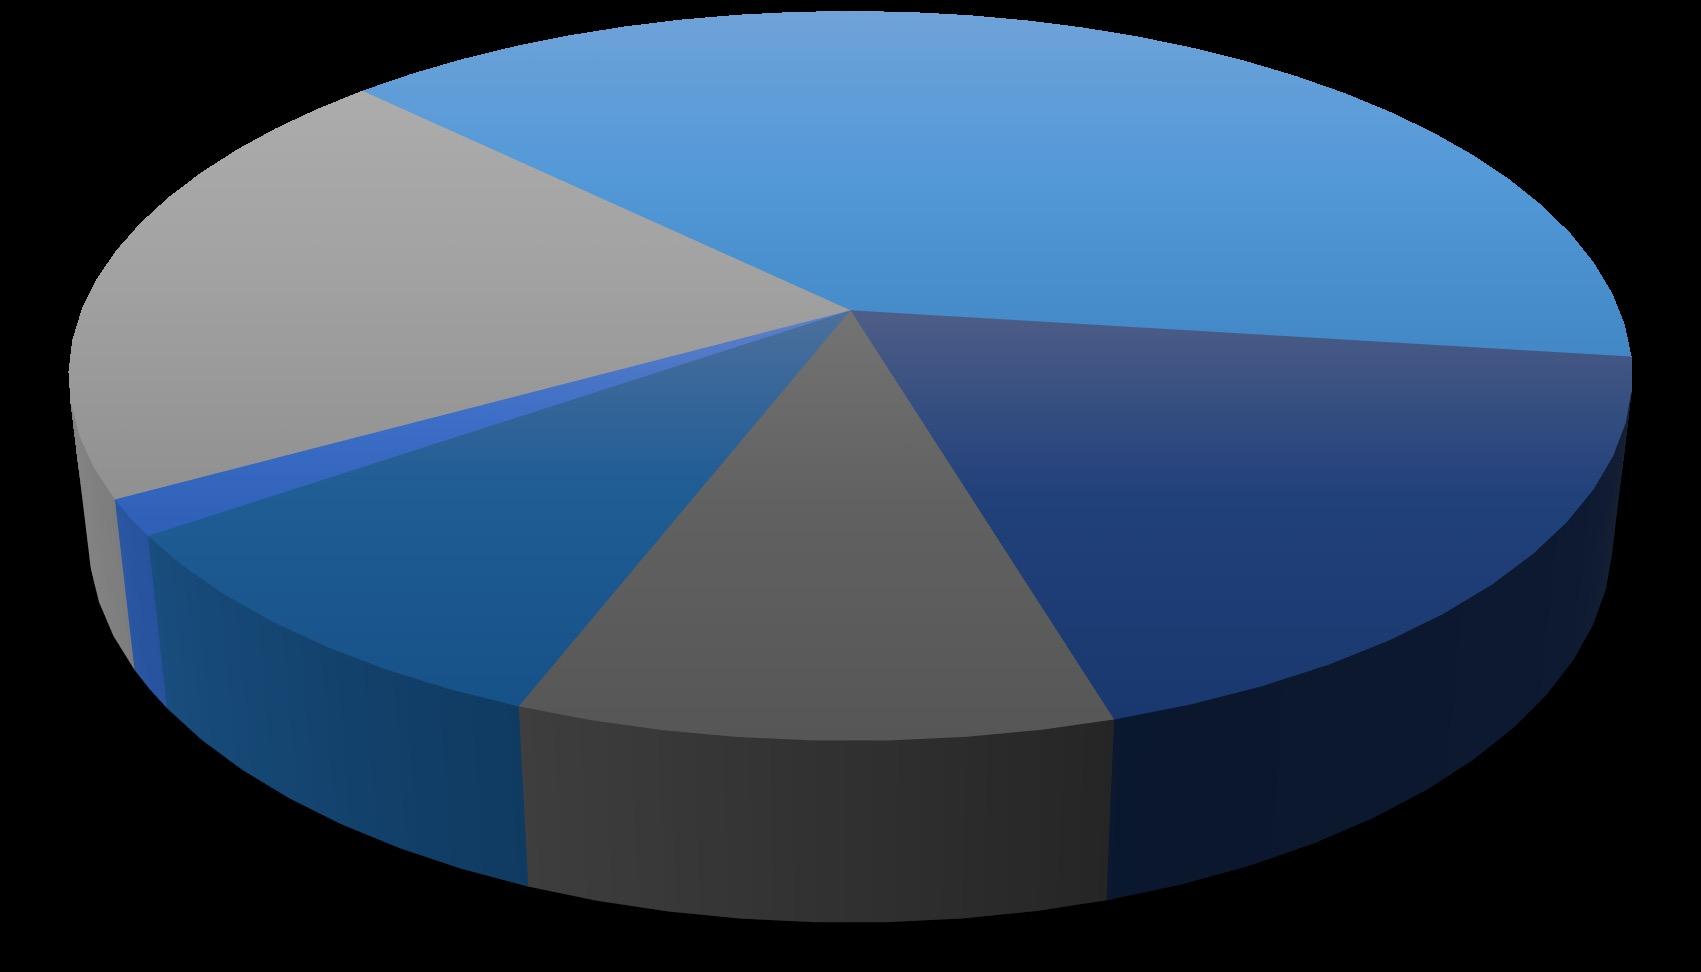
$250-$299 2% $300-$399 21% $400-$499 40% $500-$699 18% $700-$999 10% $1000000+ 9%
Active
March 2024 CANYON COUNTY


8 Residential Closed Sales March 2024 0 200 400 600 800 1000 1200 JAN FEB MAR APR MAY JUN JUL AUG SEP OCT NOV DEC 2021 2022 2023 2024 0 100 200 300 400 500 600 700 JAN FEB MAR APR MAY JUN JUL AUG SEP OCT NOV DEC 2021 2022 2023 2024 ADA COUNTY CANYON COUNTY Treasure Valley Market Report | March 2024 Treasure Valley Market Report | March 2024

Thinking of selling? Now might be the best time!
9 Treasure Valley Market Report | March 2024
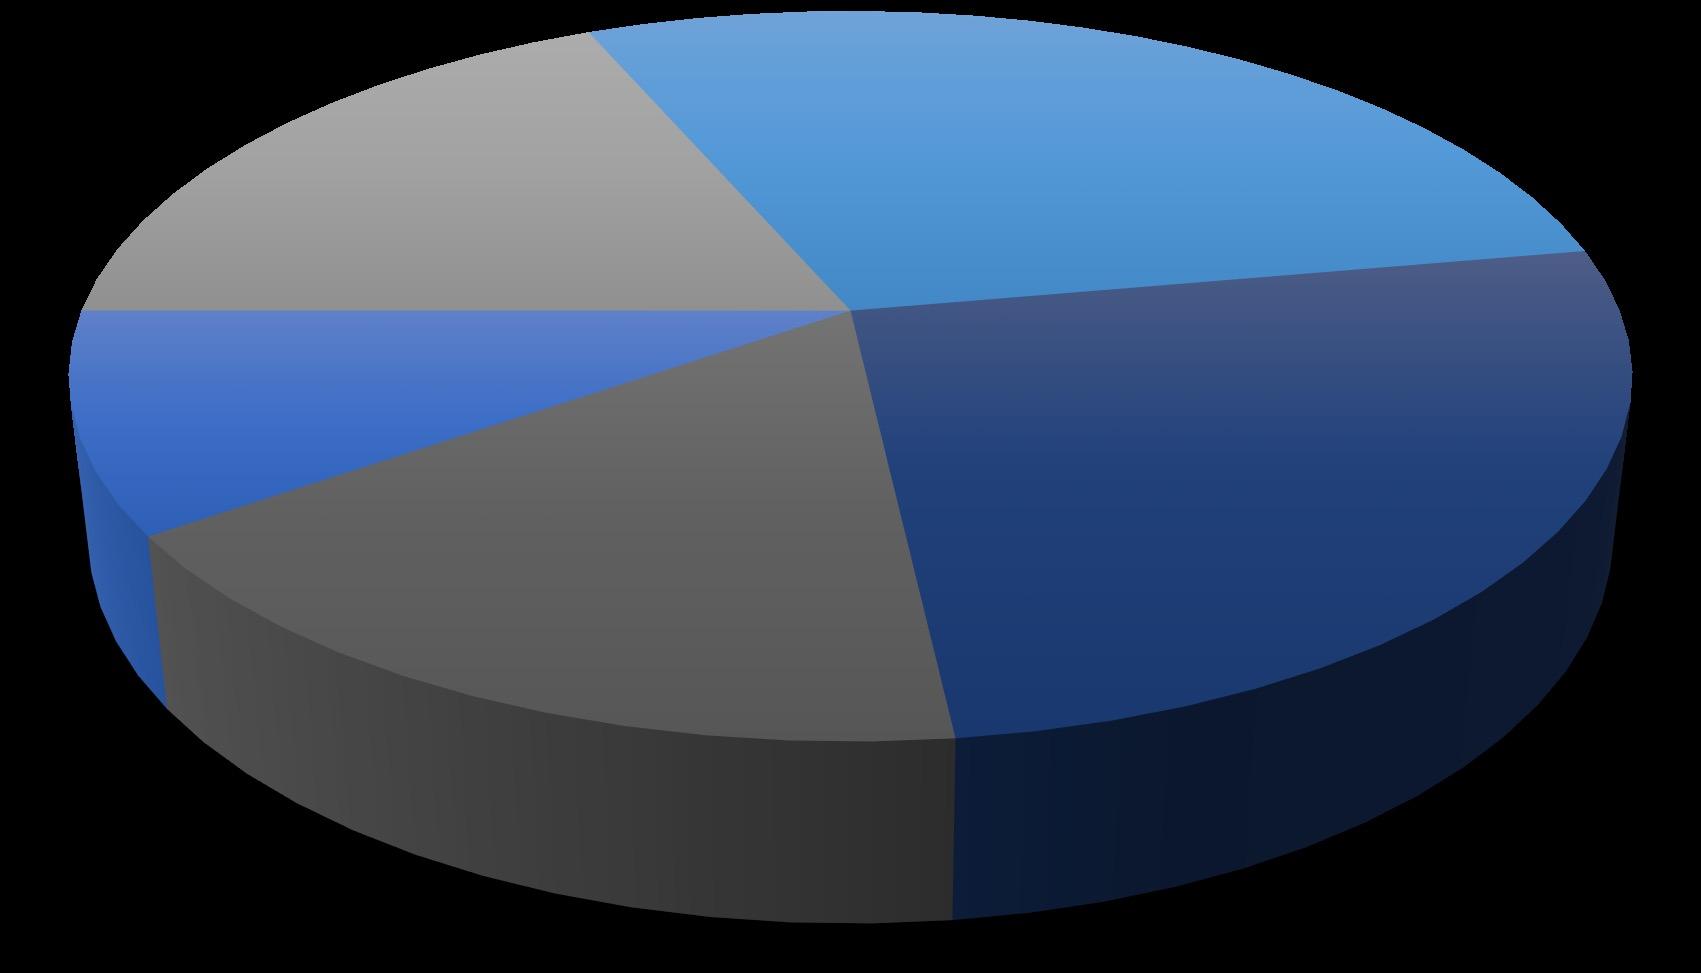

Listings by Price Range
2024
$300-$399 10% $400-$499 18%
29%
26%
Sold
March
ADA COUNTY
$500-$699
$700-$999
$1,000,000+

Listings by Price Range
$250-$299 4% $300-$399 36% $400-$499 30% $1,000,000+ 4%
Sold
March 2024 CANYON COUNTY


Residential Closed Sales RESALE vs. NEW CONSTRUCTION | March 2024 ADA COUNTY CANYON COUNTY 734 338 306 382 200 234 191 261 0 100 200 300 400 500 600 700 800 900 1000 1100 1200 1300 2021 2022 2023 2024 Re-Sale New 347 160 111 176 178 164 144 194 0 100 200 300 400 500 600 700 800 900 1000 2021 2022 2023 2024 Re-Sale New Treasure Valley Market Report | March 2024 12


Treasure Valley Market Report | March 2024 13
#GuidingYouHome
Treasure Valley Market Report | March 2024 14
Rates 30 - year fixed mortgage 4.24% 3.85% 3.65% 3.99% 4.54% 3.94% 3.11% 2.95% 5.35% 6.64% 6.75% 0.00% 1.00% 2.00% 3.00% 4.00% 5.00% 6.00% 7.00% 8.00% 2014 2015 2016 2017 2018 2019 2020 2021 2022 2023 2024
Annual Average Interest
Looking for the best loan officers in town?
We have you covered!

Treasure Valley Market Report | March 2024 15
cbboise.com
Treasure Valley Market Report | March 2024
The information in this report is compiled from a report given by Boise Regional REALTORS® and the Intermountain Multiple Listing Service and to the best of our knowledge is accurate and current.
©Coldwell Banker Real Estate LLC. All Rights Reserved. Coldwell Banker® and the Coldwell Banker Logo are registered service marks owned by Coldwell Banker Real Estate LLC. Coldwell Banker Real Estate LLC fully supports the principles of the Fair Housing Act and the Equal Opportunity Act. Each office is independently owned and operated. Information deemed reliable nut not guaranteed and should be independently verified.