September 2022
ADA COUNTY
Median Sales Price
$540,000
Up 0.9% year over year
Down 4.4% over last month
Active Listing Inventory
2,420
Up 93.8% year over year Up 1.9% over last month
Average Days On Market 38
CANYON COUNTY
Median Sales Price
$426,990
Up 1.2 % year over year Down 3.2% over last month
Active Listing Inventory
1,303
Up 67.1% year over year Down 2.5% over last month
Average Days On Market 44
Up 131.6% year over year
Up 41.9% over last month
Closed Sales
343
Down 37.2% year over year Down 11.8% over last month
MARKET SNAPSHOT
Treasure Valley Market Report | September 20222
Monthly
Sales Price


Median
Comparison September 2021/2022 total $ shown in thousands 3 $0 $100 $200 $300 $400 $500 $600 $700 JAN FEB MAR APR MAY JUN JUL AUG SEP OCT NOV DEC 2021 2022 ADA COUNTY CANYON COUNTY $0 $50 $100 $150 $200 $250 $300 $350 $400 $450 $500 JAN FEB MAR APR MAY JUN JUL AUG SEP OCT NOV DEC 2021 2022 Treasure Valley Market Report | September 2022
Median Sold Prices By City

ADA & CANYON COUNTIES | SINGLE FAMILY | September 2022 500 865 500 430 637 430 584 450 550 650 750 850 950 Treasure Valley Market Report | September 20224

5 Active Residential Listings September 2022, month/year comparison 0 500 1000 1500 2000 2500 JAN FEB MAR APR MAY JUN JUL AUG SEP OCT NOV DEC 2019 2020 2021 2022 ADA COUNTY 0 200 400 600 800 1000 1200 1400 JAN FEB MAR APR MAY JUN JUL AUG SEP OCT NOV DEC 2019 2020 2021 2022 CANYON COUNTY Treasure Valley Market Report | September 2022
Active
by

Treasure Valley Market Report | September 2022
Listings
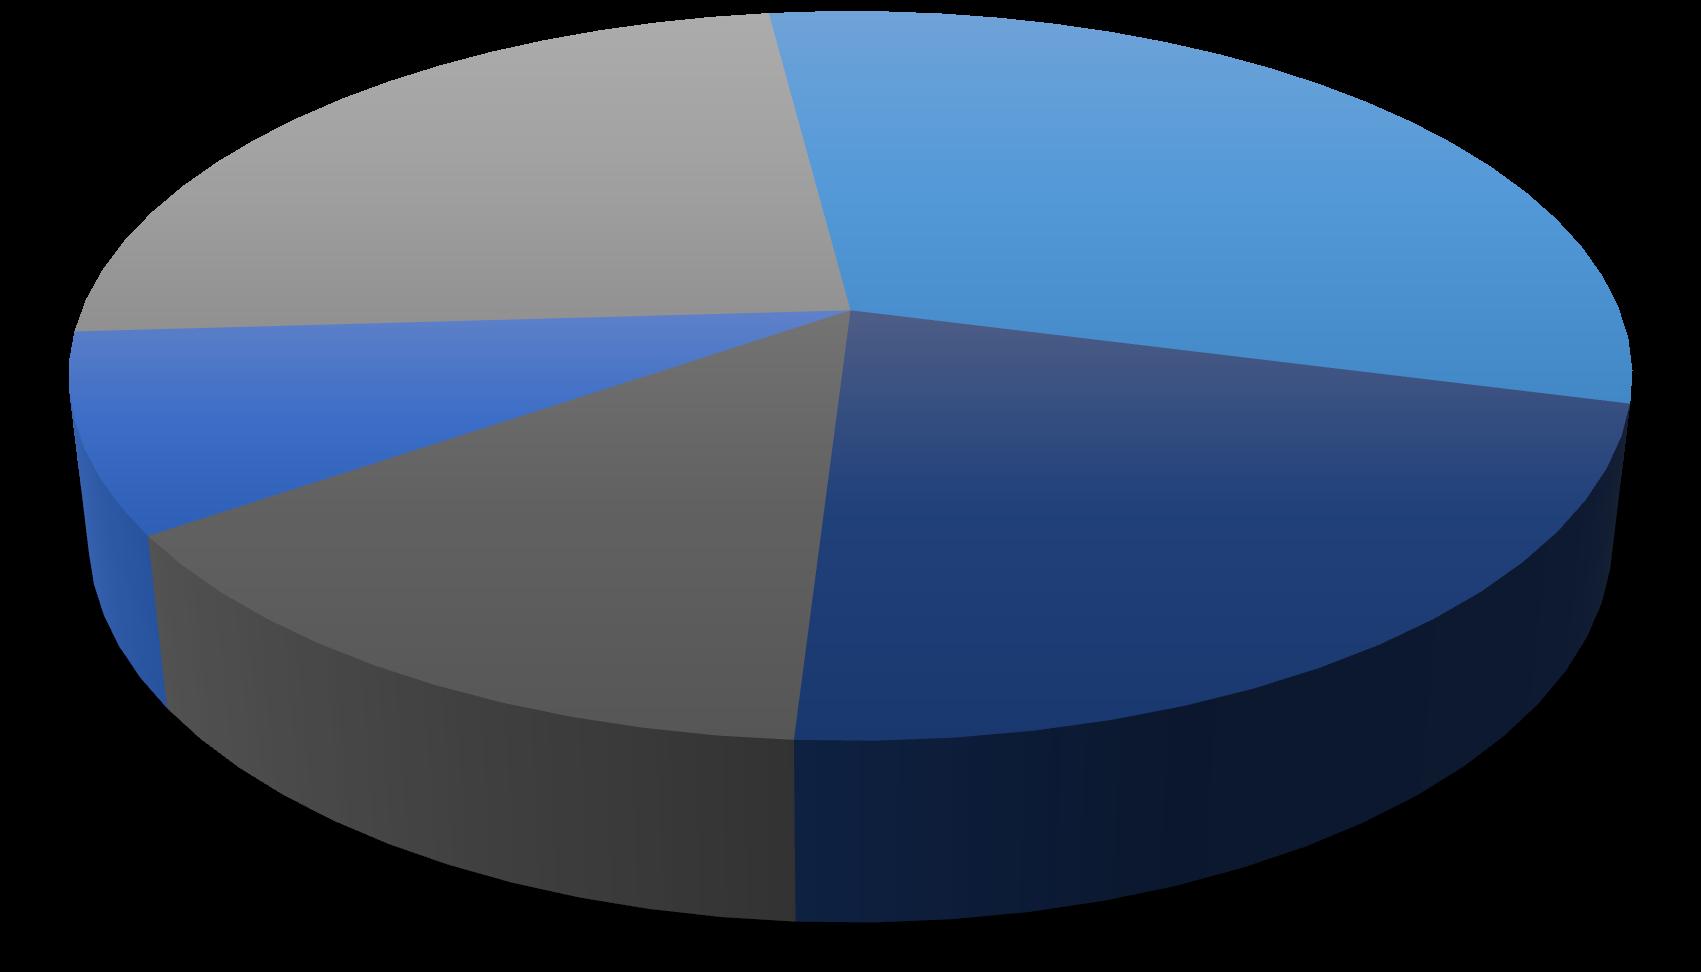
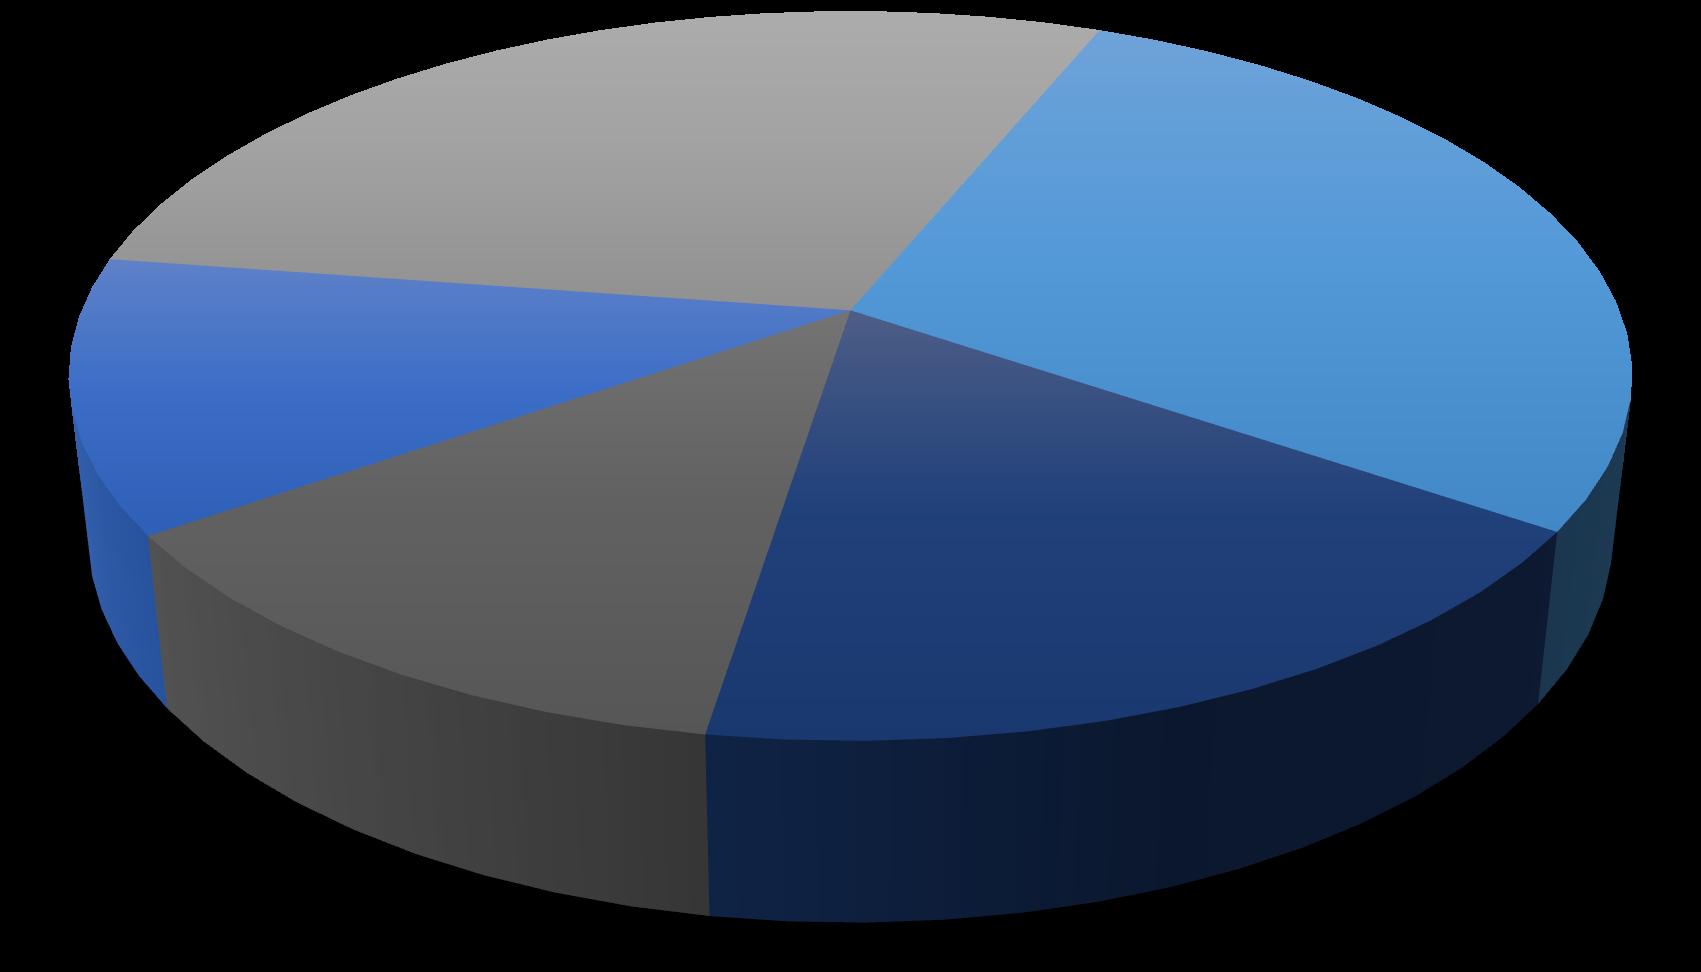
Price Range September 2022 $300 $399 9% $400 $499 24% $500 $699 31% $700 $999 22% $1,000,000+ 14% ADA COUNTY 6
Active
by Price

Listings
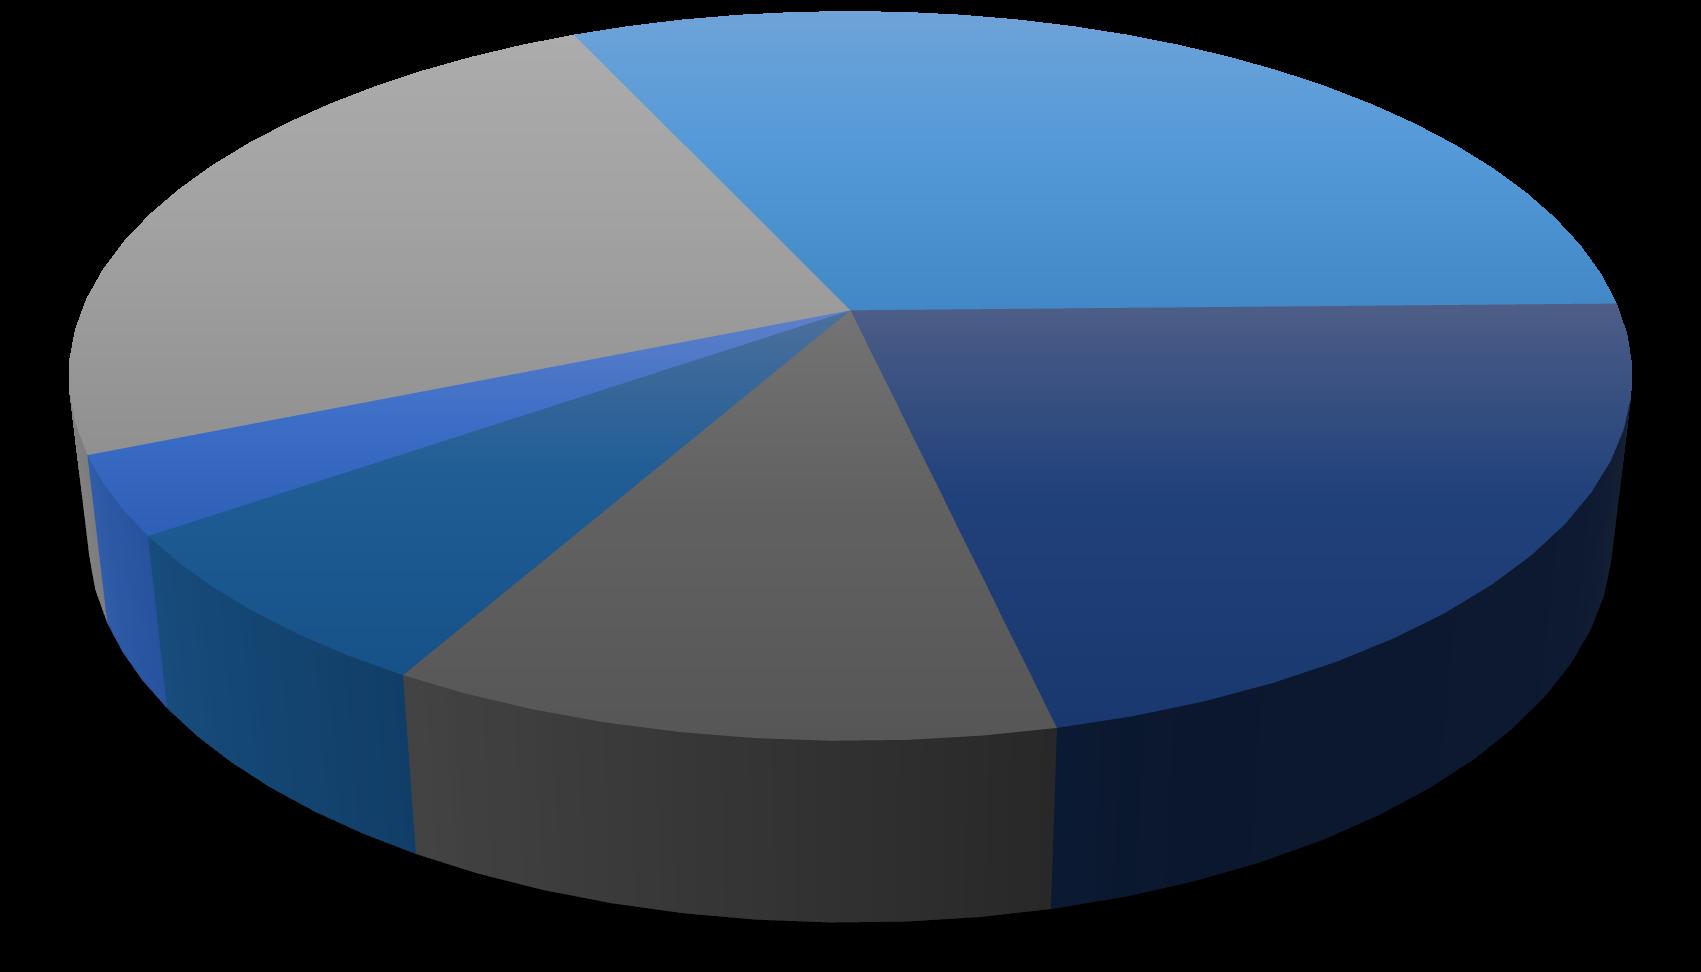
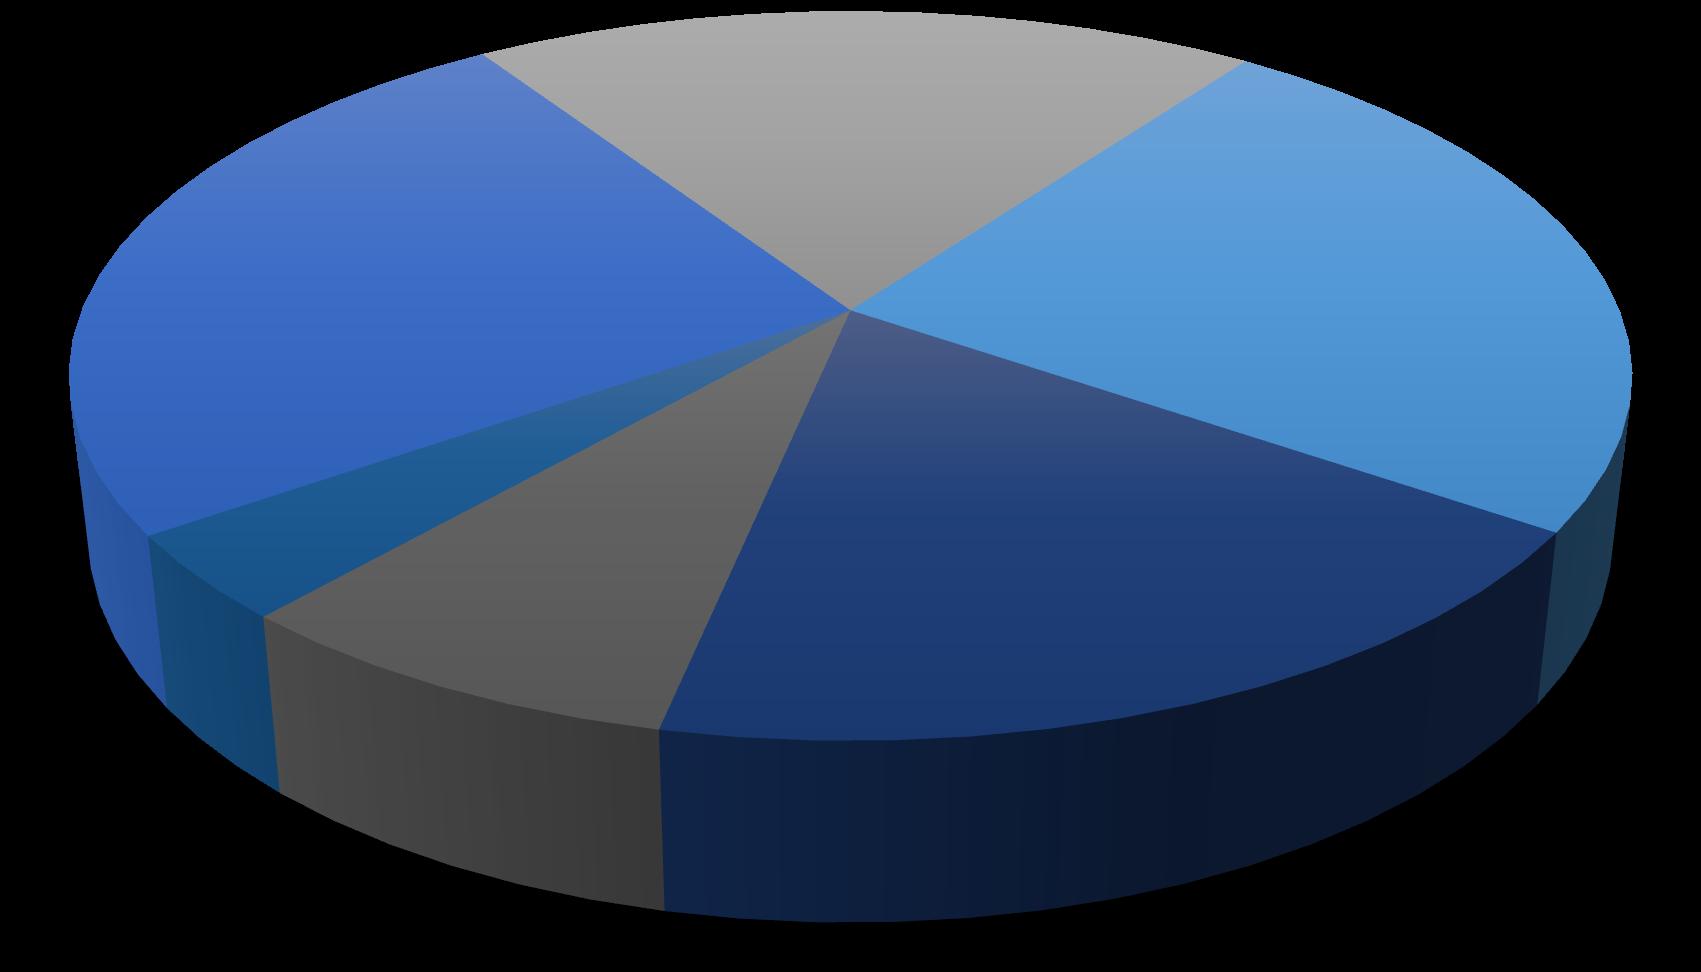
Range September 2022 CANYON COUNTY Treasure Valley Market Report | September2022 7 $250 $299 3% $300 $399 24% $400 $499 32% $500 $699 22% $700 $999 12% $1000000+ 7%


8 Residential Closed Sales September 2022 0 200 400 600 800 1000 1200 1400 1600 JAN FEB MAR APR MAY JUN JUL AUG SEP OCT NOV DEC 2019 2020 2021 2022 0 100 200 300 400 500 600 700 JAN FEB MAR APR MAY JUN JUL AUG SEP OCT NOV DEC 2019 2020 2021 2022 ADA COUNTY CANYON COUNTY Treasure Valley Market Report | September 2022 Treasure Valley Market Report | September 2022
9 #GuidingYouHome Treasure Valley Market Report | September 2022
Sold
by
10
Listings
Price Range September 2022 ADA COUNTY $300 $399 12% $400 $499 29% $500 $699 28% $700 $999 18% $1,000,000+ 13% Treasure Valley Market Report | September 2022
Sold
by

Listings
Price Range September 2022 CANYON COUNTY Treasure Valley Market Report | September 2022 $250 $299 25% $300 $399 19% $400 $499 25% $500 $699 19% $700 $999 8% $1,000,000+ 4% 11


Residential Closed Sales RESALE vs. NEW CONSTRUCTION | September 2022 ADA COUNTY CANYON COUNTY 753 883 734 501 309 407 200 200 0 100 200 300 400 500 600 700 800 900 1000 1100 1200 1300 2019 2020 2021 2022 Re-Sale New 388 406 347 156218 256 178 122 0 100 200 300 400 500 600 700 800 900 1000 2019 2020 2021 2022 Re-Sale New Treasure Valley Market Report | September 202212
Treasure Valley Market Report | September 2022 13 Homes
is the best place to be.
Let
us help you find yours.
Treasure Valley Market Report | September 202214 Annual Average Interest Rates 30 year fixed mortgage 3.98% 4.24% 3.85% 3.65% 3.99% 4.54% 3.94% 3.11% 2.95% 4.97% 0.00% 1.00% 2.00% 3.00% 4.00% 5.00% 6.00% 2013 2014 2015 2016 2017 2018 2019 2020 2021 2022
Looking for the best loan officers in town?


Treasure Valley Market Report | September 2022 15
We have you covered! www.iccu.com/CBT
Treasure Valley Market Report | September 2022 16
