Mastitiscanbecausedbymanyfactorstypicallyrelatedtoenvironmentalorcontagiousbacteriathatareintroducedby lessthanoptimalmilkingproceduresorhygieneoffacilitiesorcattle.Mastitiscancauselargeeconomiclossesfrom reducedmilkproduction,discardedmilk,loweredreproductiveperformanceandexcessiveherdturnover.
SomaticCellCount(SCC)fromaday’smilkisastandardindicatoroftheimpactofudderinfection.Cowswithlevels lessthan100,000/mlareconsideredhealthy-andlevelsof200,000+/mltypicallyindicateanudderinfection.This MonitorlabelsSCCsbetween100,000and199,999asSUSPECTandrevealscowsthatarenotoptimallyhealthy.
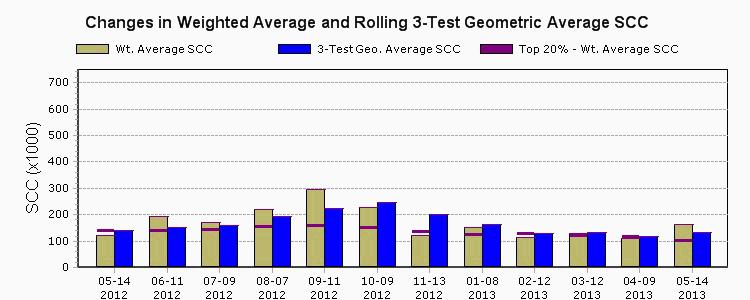
Since2010,someprocessorshavereported3-monthrollinggeometricSCCaveragestoherdsbecauseofinternational pressureforon-farmmilktobelessthantheE.U.’slegallimitof400,000/ml.A3-testdaygeometricaverage=cube rootof(currenttestdaySCCaverageXpriortestdaySCCaverageX2ndpriortestdaySCCaverage).Thismethod reducestheimpactofanysingleSCContheaverageforthe3-monthperiod.
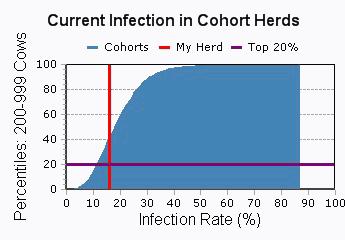
Howwellaretopherdsdoing?Usuallyherdmanagersshouldsettheirowngoals-but‘performanceoftopherds’can illustratewhatcanpracticallybeachieved.ThisMonitordefines‘Top20%’herdsusingeachherd’sweightedaverage SCC.Althoughaverageperformanceissimilaracrossallherdsizes,moresmallherdshavehighinfectionratesthan largerherds.Theherdsizecategoriesforthe‘Top20%’are1to199cows;200to999cows,and;1000+cows.
Processed: TestDate: UDDERHEALTHMONITORuDHI-427 Page1of5 55-00-9999 SMITHDAIRY HENRYSMITH 05-14-2013 05-15-2013
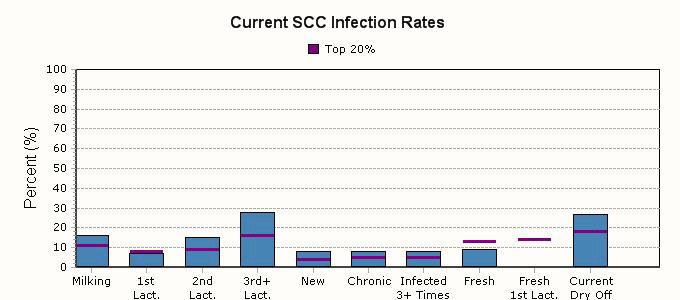
#Infected #Cows Milking 1st Lact. 2nd Lact. 3rd+ Lact.New 3+Times Infected Chronic Fresh Fresh 1stLact. Current DryOff 207 33 75 5 67 10 65 1816 207 11 1 16 207 16 207 615 4 Cur.3-TstCur. WgtedGeo.Score
NormalSCC=0-99K(0-2.9SCS)SuspectSCC=100K-199K(3.0-3.9SCS)InfectedSCC=200K+(4.0-9.9SCS) Both'Normal'and'Suspect'areconsideredNotInfectedandaresometimescalled'Negative'
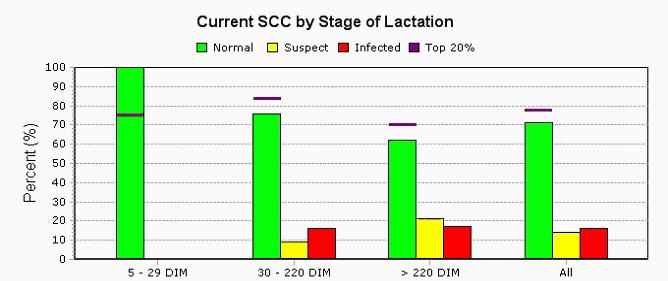
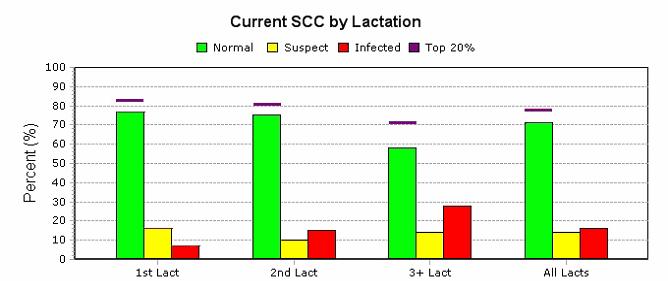
Processed: TestDate: UDDERHEALTHMONITORuDHI-427 Page2of5 55-99-9999 SMITHDAIRY HENRYSMITH 05-14-2013 05-15-2013 CurrentSCCbyLactation,StageofLactation(DaysinMilk)andLevel Lact. 1 2 3+ All DIM 5-29 30-220 220+ 5-29 30-220 220+ 5-29 30-220 220+ SCC CurrentTest Normal 0-99K 0-2.9 Suspect 100-199K 3.0-3.9 Mod-Inf 200-799K 4.0-5.9 Sev-Inf 800K+ 6.0+ Total-Inf 200K+ 4.0+ %%%%%# PreviousTest %# 4.0+ 200K+ Total-Inf 3 30 42 2 49 16 1 36 28 207 5 8 2 10 8 33 100 9 2 14 13 29 18 25 13 12 16 13 28 29 16 7114 8317 711712 100 82210 6 503813 100 61111711 54181811 11 5 3 1 2 5 4 8 6 29 SCC 1 32 45 14 40 14 2 44 24 216 with with Cows Cows # # All All All75 67 65 5 10 18 7 15 28 77 75 58 16 10 14 7 10 4 1711 5 16 20 4 11 14 78 68 70
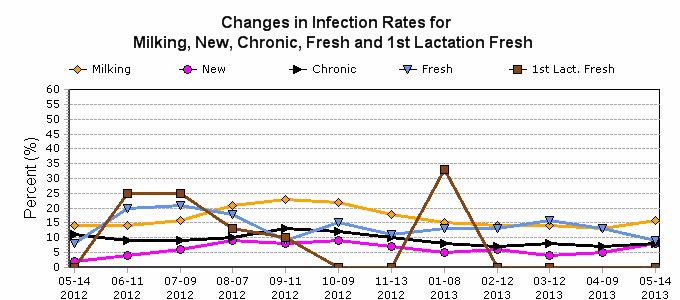
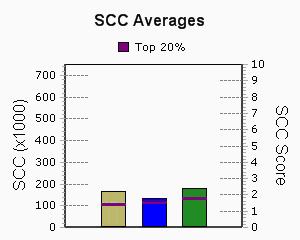
Processed: TestDate: UDDERHEALTHMONITORuDHI-427 Page3of5 55-99-9999 SMITHDAIRY HENRYSMITH 05-14-2013 05-15-2013 MilkingCows InfectedCows NewInfections FreshCows FreshInfections 1stLact.Fresh 1stLact.FreshInf. 05-14 2013 DateofTest 04-09 2013 03-12 2013 02-12 2013 01-08 2013 11-13 2012 10-09 2012 09-11 2012 08-07 2012 07-09 2012 06-11 2012 05-14 2012 Avg. 207 33 16 11 1 6 216 29 11 16 2 205 29 9 19 3 4 195 27 11 24 3 7 179 27 9 31 4 6 2 184 33 12 18 2 7 191 42 17 13 2 2 181 41 14 22 2 10 1 175 37 16 17 3 8 1 180 29 10 14 3 4 1 188 27 7 15 3 4 1 193 27 4 12 1 6 NumberofCowsandInfections 191 32 11 18 2 5 1 ChronicInfections 22171618242319141317161618 Avg.SCCScore DateofTest Avg. AverageSCCScore ~~~~ 05-14 2012 06-11 2012 07-09 2012 08-07 2012 09-11 2012 10-09 2012 11-13 2012 01-08 2013 02-12 2013 03-12 2013 04-09 2013 05-14 2013 2.42.22.02.22.52.72.72.42.52.42.42.22.4
NotInfectedSCC=0-199K(0-3.9SCS)InfectedSCC=200K+(4.0-9.9SCS) Both'Normal'and'Suspect'areconsideredNotInfectedandaresometimescalled'Negative'
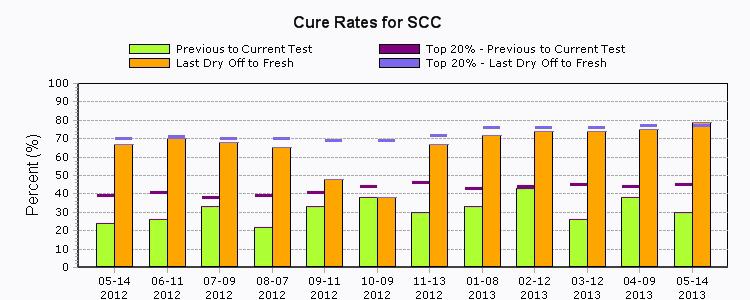
Processed: TestDate: UDDERHEALTHMONITORuDHI-427 Page4of5 55-99-9999 SMITHDAIRY HENRYSMITH 05-14-2013 05-15-2013 NotInfected NewInfections Cures Chronics PrevioustoCurrentTestLastDryOfftoFresh MyHerdTopMyHerd 20% Top20% #%%#%% 16384 730 16 168 12088 2779 75 89 45 6 86 77 4 9 8597 229 33 91 67 NetTrans.Rate~~~~ ~~~~ Chronic Cure New NotInfected NumberofSCCCures PrevioustoCurrent DateofTest Avg. 05-14 2012 06-11 2012 07-09 2012 08-07 2012 09-11 2012 10-09 2012 11-13 2012 01-08 2013 02-12 2013 03-12 2013 04-09 2013 05-14 2013 DryOfftoFresh 8 18 7 18 6 16 8 15 5 15 12 12 14 9 8 12 7 18 10 23 6 26 10 27 7 27
NetTransmissionRate NewInf./Cures*100
CowstoTreatorWatch-1stLactation
Infectedthistestorlasttest(SCC>=200K(SCS>=4.0))andDIM>=5
CowstoTreatorWatch-2nd+Lactations Newinfections(SCC>=200K(SCS>=4.0))andDIM>=5
Processed: TestDate: UDDERHEALTHMONITORuDHI-427 Page5of5 55-99-9999 SMITHDAIRY HENRYSMITH 05-14-2013 05-15-2013 Tests Infected #% IndexGrp Lact. #DIMMilkSCCSCC Prev. Level Inf. Lact. Avg. SCC Lact. Avg. SCC Prev. Date 1st Infected DIM 1st Inf. 30 Day Milk Loss DaysPreg. Since Bred
305 2XME Milk Prv.Lact. 305 2XME Milk 87723122681.2650429CHR2144572-12-131358328,487150P ~~~~ ~~~~ 87203140789.252866NEW2647547-09-12987733,155157P ~~~~ ~~~~ 87263138957.7348132NEW1002173-12-133266333,722221P ~~~~ ~~~~ 87143132238.3246115NEW1071105-14-133225226,368227P ~~~~ ~~~~ 87013143159.4214303CHR934312-12-133404731,044~~~~ ~~~~ 88121111989.093264PRV661254-09-13842025,76345P 88031110188.318528PRV661254-09-136623,09925
Tests Infected #% Grp Lact. #DIMMilk Prev. Level Inf. Lact. Avg. Lact. Avg. Prev. Date 1st Infected DIM 1st Inf. 30 Day Milk Loss DaysPreg. Since Bred IndexSCCSCCSCCSCC 305 2XME Milk Prv.Lact. 305 2XME Milk 87057230104.41838NEW183849211005-14-133023427,388 8297258114.891933NEW174411505-14-135818923,08431,151 84933314793.952881NEW571001205-14-1314715323,98627,75024 864912148116.252838NEW62181205-14-1314815333,74137,45731 8547273114.052822NEW76761335-14-137315324,15635,033 86531285103.4429100NEW123661335-14-138514023,11931,47710 81707511999.8325174NEW2642462503-12-135612221,33029,31545P 84603326236.7303141NEW115663382-12-1317111722,11427,198201P 793417117111.0264152NEW141441255-14-1311710823,27833,115 83991332564.2264123NEW57441105-14-1332510823,90522,276 84713315782.4246174NEW230814801-08-133110420,67826,03638 82148444930.3246107NEW174629643-12-122110420,43023,094143P 85641225763.321481NEW93252259-11-12129526,64430,62325 79503645357.8200123NEW81622149-11-122089028,94929,901213P Tests Infected #% Grp Lact. #DIMMilk Prev. Level Inf. Lact. Avg. Lact. Avg. Prev. Date 1st Infected DIM 1st Inf. 30 Day Milk Loss DaysPreg. Since Bred IndexSCCSCCSCCSCC CowstoCullforPoorUdderHealth Infected(CurrentSCC>=200K(SCS>=4.0))ANDInfected3+teststhislactationANDMilk<50lbs 305 2XME Milk Prv.Lact. 305 2XME Milk 83183351428.51056696CHR91981161001-13-122719827,22230,898P 227 82683434028.0919400CHR3482306609-11-129518918,15030,017P 185 84603326236.7303141NEW115663382-12-1317111722,11427,198P 201 82148444930.3246107NEW174629643-12-122110420,43023,094P 143
