23 minute read
Hypercar 2WD vs 4WD


Compare and contrast
An analysis of the performance balance between 2WD and 4WD Hypercars, using the rst season’s available data as the basis for the study
By ANDREA QUINTARELLI
The 2021 FIA World Endurance Championship saw the debut of the Hypercar class, comprising a two-wheel-drive car built by Jim Glickenhaus’ team and a four-wheeldrive hybrid from Toyota. In 2023, LMDh cars will also be eligible to race in the WEC, and in the American IMSA series, with a two-wheel-drive hybrid. It therefore makes sense to look at the available data from 2021, and make a comparison between the two very diff erent confi gurations.
After a season of racing, both the understanding of the rules and the lap time simulation tool the author coded and used to analyse LMH cars performance has improved signifi cantly and this, together with the data collected during 2021, enables a much better understanding of the real state of play in this new class.
Key parameters
With the tyres being supplied solely by Michelin, who should ensure level performance between their rubber for diff erent cars, there are four other crucial parameters that infl uence how LMH vehicles perform: • Overall traction power • Mass • Aerodynamics • Powertrain architecture (hybrid or traditional)
The fi rst two points are tightly regulated and are factors the FIA and ACO constantly monitor and use to balance the cars’ performance.
In terms of powertrain, the rules mandate the power window each car must be able to produce, providing power curves the engine designers must stick to. The window of maximum power is between 480 and 520kW, plus three per cent tolerance. The regulators monitor cars’ compliance to the rules using driveshaft-mounted torque sensors.
During the fi rst season, Toyota and Glickenhaus were given diff erent weights and powers, to try and bring them closer together in terms of pace. This was also done to compensate for the Toyota having an electric motor pulling the front wheels and, according to the rule set, being all-wheel drive above 120km/h (with a dry track). At Le Mans, the Toyota had a minimum weight of 1066kg and a maximum power of 515kW, while the Glickenhaus ran with 1030kg and 520kW.
The overall target referred to an aerodynamic effi ciency (lift-to-drag ratio, or L/D) of about four, although Racecar
understands that the final target mandated by the class regulations was slightly higher than this.
Downforce and drag
This is only a part of the story though. The teams are also given a window in terms of maximum and minimum downforce and drag their cars can produce, with the possibility to vary aerodynamic properties by adjusting only one single aerodynamic device (the rear wing, for example).
Racecar’s understanding is that the minimum downforce is set at a value of 4.05 for the aerodynamic downforce coefficient multiplied by the frontal area (CzA). The maximum allowed value for the same coefficient should be 4.25.
Beside this, each car’s aero map was populated by measurement tests performed in the Sauber wind tunnel. Basing on the obtained aero map, the regulations stipulate how to calculate the values of downforce and drag coefficients than need to be compared to the target figures.
The appendix of the regulations dealing in detail with the aerodynamics of LMH cars is not publicly available. Last year, Racecar Engineering assumed that, to be compared to the targets, the complete map needed to be averaged, with each point (combination of front and rear ride heights, roll angle and yaw angle) being given a different weight.
Latest insights reveal this to be true for downforce, but not for drag. While for downforce the weights each point has could still make a sensible difference on the final average value that will be calculated and compared to the targets, for a directional study like the one presented in this article, one would probably not go far wrong by simply averaging the aero map on a window of ride heights representative of the cars’ working window on track.
For drag, in terms of compliance with the regulations, the significant part of the map (again, combination of front and rear ride heights) is one representing end-of-straight (high-speed) conditions. In such scenarios, cars normally run at low ride heights because of the high downforce experienced. The rules mandate the drag value be checked against the rules and give a minimum measurement at four different combination of low front and rear ride heights.
In absence of better data, in our last article about the LMH class the author erroneously assumed that for drag the rules would mandate a weighted average of the aero map, and this influenced partially the results and the conclusions drawn.
While this aspect might seem a tiny detail, it completely changes how manufacturers set their aerodynamic targets in the design and development phases. In particular, with a high-speed circuit like Le Mans in mind, keeping drag as close as possible to the minimum accepted target for any ride height variation becomes very important, because this would lead to higher top speeds and better lap times.
The effects of different aerodynamics characteristics, in particular with respect to ride height sensitivity, is one of the properties that can be easily assessed using lap time simulation.
Tool and vehicle model
The lap time simulator coded by the author is based on a quasi-static approach. Each small section of a track is analysed assuming a constant acceleration and that the vehicle is in stable conditions. The four-wheel vehicle model incorporates full aero maps, suspension kinematics, corner and heave springs and bump stops for each axle, plus anti-roll bars. Powertrain model user inputs include a torque curve, gearbox efficiency, gear ratios, shift time, the portion of driving torque applied to each axle and the minimum speed at which an all-wheel-drive strategy can be activated. That latter point is critical for this study.
The tyre model is similar in structure to a Pacejka model, but with each effect modelled separately, including load, slip, camber and vertical characteristics (vertical stiffness and expansion with speed).
The representative LMH vehicle model has benefited from the data collected during the 2021 WEC season and race results, primarily those related to the BoP adjustments mandated for each track. This study will initially refer to a hybrid LMH car, with the following features: • Mass of 1161kg (1066kg for the car, as per Toyota’s BoP in Le Mans, 75kg for the driver and 20kg of fuel) • Static weight distribution of 47 per cent on the front axle • Maximum power at the wheels of 515kW, as per Toyota’s BoP in Le Mans (exactly equal to
BoP allowed nominal power, no tolerances, nor any other kind of deviation considered) • Front track width: 1670mm • Rear track width: 1660mm • Four 31/71-18 tyres with the same characteristics • Aerodynamic efficiency (meant as the ratio between downforce map average value and the regulations-mandated,
‘end-of-straight’-representative drag point of the map) slightly above four • Minimum allowed downforce configuration, to emphasise top speed and low drag • Average aerodynamic balance on map of about 45.5 per cent • LMP-like suspension design, based on existing Le Mans Prototype vehicles • Gearbox with seven forward gears, ratios optimised for Le Mans circuit • Being representative of an hybrid
LMH car, the model will also consider a four-wheel-drive system
Hybrid Le Mans Hypercars employ an electric motor propelling the front wheels with a mandated maximum power of 200kW. The application of torque to all four wheels is only activated only above a speed of 120km/h, as per the regulations. So, for this study, the tool uses a simplified
approach, with the distribution of torque between front and rear wheels assumed to be constant and equal to the value that produced the best performance. However, this is surely not the case for existing hybrid LMH vehicles like the Toyota GR010, and consequently this approximation will affect the accuracy of lap times predictions. Also, no limitation to the deployment over a lap because of battery capacity are considered in the simulation runs.
The model described will run on a virtual representation of La Sarthe circuit, generated using data logged on the circuit itself.
Aero map effects
Two different aero maps were tested to assess how a car with a stronger sensitivity to ride heights for the most significant aerodynamic metrics of downforce, drag and aerodynamic balance would perform, compared to another with a lower sensitivity, keeping all other parameters unchanged.
The results are summarised in Figure 1.
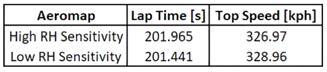
Fig 1: Effects of ride height sensitivity on performance
The gap between the two solutions is about 0.5 seconds in terms of lap time, and about 2km/h in terms of top speed. The pace difference produced by the two configurations is mainly due to straightline performance and, in general, to the average lower drag that a lower ride height sensitivity offers over a lap, because of how the regulations are written.
While the ‘low-sensitivity’ aero maps considered may represent an extreme example (being about half as sensible compared to the other map), this simple study still seems to highlight an important design target for manufacturers developing an LMH vehicle to fully exploit the regulations, especially on a high-speed circuit like Le Mans.
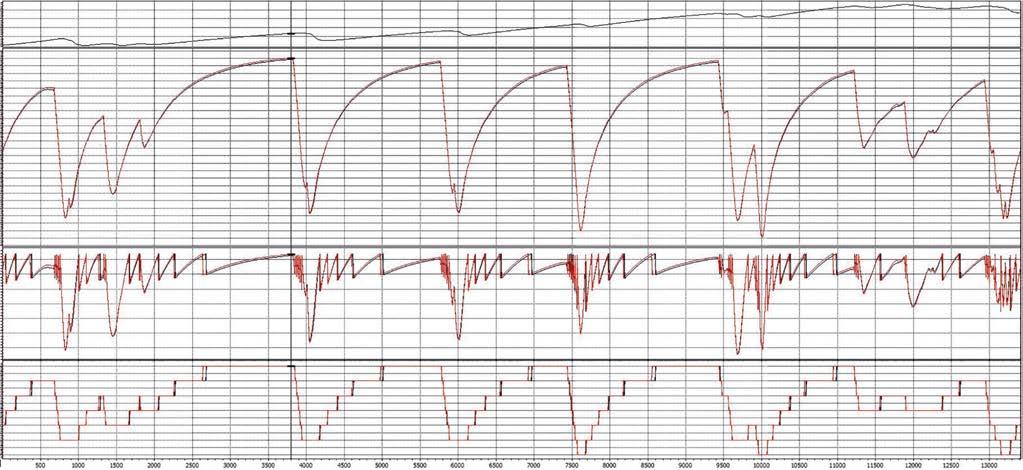
This becomes even clearer when looking at Figure 2, which shows the results of the two simulation runs. The data relative to an aero map with a higher sensitivity to ride heights are in red, while the black lines refer to the run with a lower sensitivity. From above, the first trace in the plot is the ‘compare time’, which indicates how much gap exists between the two runs at a certain point on the track (in seconds). The second trace is car’s speed, the third rpm and the fourth engaged gear.
It is easy to spot the top speed difference in every straight, where the black speed trace progressively climbed above the red one to finally reach a higher maximum velocity before the next braking point, while the ‘compare time’ changes with at a stronger rate in those sections of the circuit. This is even more interesting, considering that, in some medium or high-speed corners, the set-up with a higher ride height sensitivity actually produces higher mid-corner speed. For example, at Tertre Rouge, located about the 1870m mark at La Sarthe.
The advantage in terms of drag is sufficient not only to compensate the lower corner exit speed, but also to overcome this by about 2km/h at the end of the straight leading to the first chicane.
Figures 3 and 4 also offer an interesting perspective to these results. Figure 3 depicts the cars’ speed (first trace down from the top), together with the key aerodynamic metrics. The second trace down from the top is the downforce coefficient multiplied by car’s frontal area (CzA), the third aerodynamic balance and the fourth drag coefficient (CxA).
In Figure 2, the run relative to the aero map with higher ride height sensitivity is in red, the lower sensitivity run in black.
It is immediately clear how the downforce produced by the low sensitivity map varies much less over a lap, reaching lower peak values – for example, during braking phases – but also dropping much less in the following accelerations out of corners.
The same happens to the aerodynamic balance. With respect to this, the two set-ups produce very similar centre of pressure positions on the straights, but not quite at the apex of fast corners such as Tertre Rouge or the Porsche Curves, the latter around the 11,350m mark.
In particular, the higher ride heights sensitive set-up produces a more forwardbiased aerodynamic balance at the apex of those fast corners, which helps improve the minimum cornering speed even further. This highlights once more how the advantage in terms of drag at Le Mans can be dominant, enough even to overcome better performance in corners.
Finally, the most important element is the significant difference in terms of drag (the lowest trace in Figure 3) when both set-ups conform to the rules. This is surely the main driver for the pretty big difference in terms of lap time.
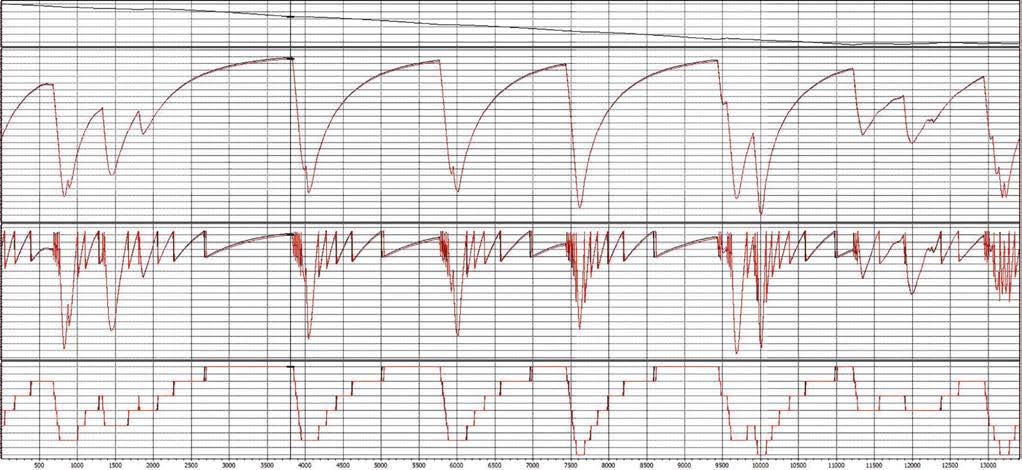
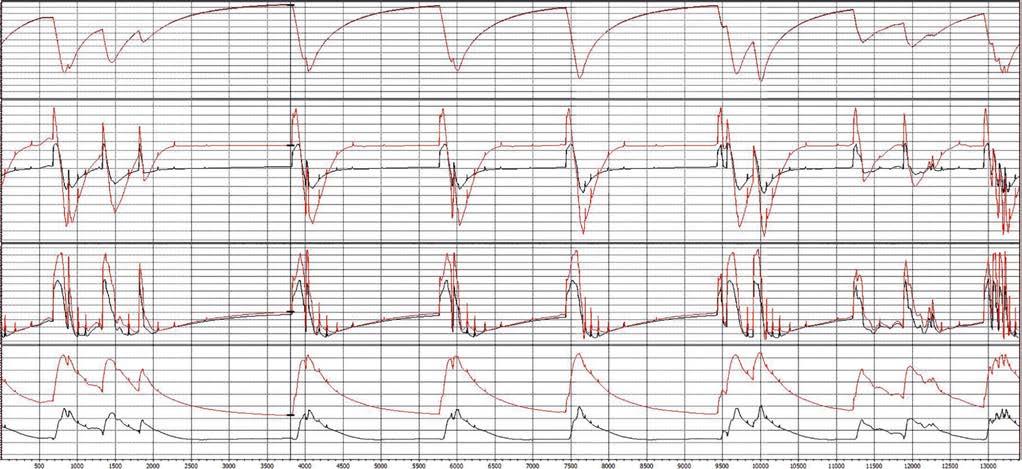
Fig 3: Aerodynamic parameters variation over a lap. Low sensitivity map shown in black, high sensitivity map in red. The traces from the top down are speed, CzA, aerodynamic balance and CxA
Fig 4: Ride heights variation over a lap at Le Mans. Low sensitivity map shown in black, high sensitivity map in red. The traces from the top down are speed, front ride height and rear ride height
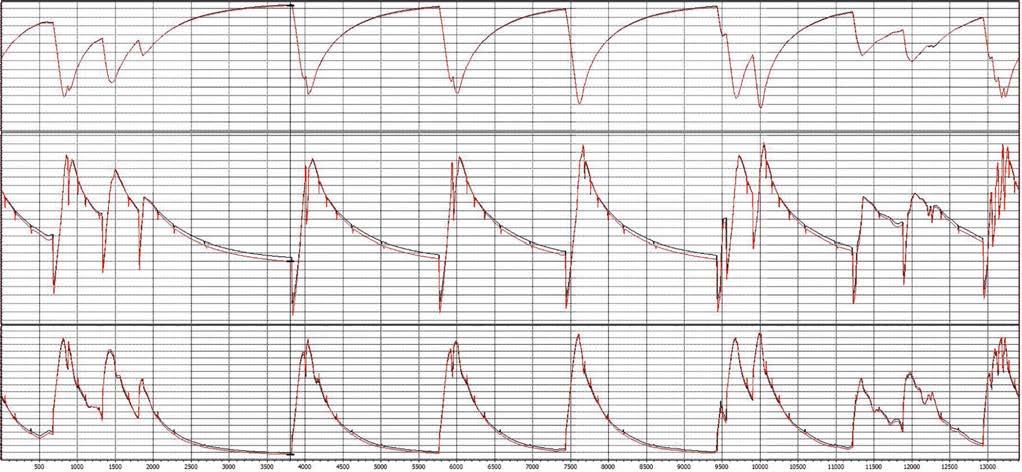
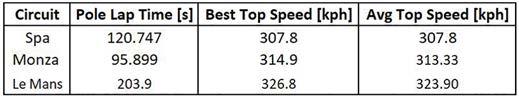
Fig 5: 2021 pole position lap times and top speeds (qualifying sessions)
Figure 4 is further confirmation of the effectiveness of a lower ride height sensitivity, within the actual rule set. Again, the red traces are relative to the higher sensitivity set-up, the black lines refer to the lower sensitive one.
The low sensitivity set-up produces pretty much constant higher ride heights over a lap. This is detrimental for performance, as both drag and downforce are worse with higher ride heights. However, the difference between the two laps is small, which confirms the comparison between the two set-ups was ‘fair’.
If one aimed for the same dynamic, minimum ride heights over the full lap, the low sensitivity set-up would require lower front and rear static ride heights and this would further improve the lap times obtained with this configuration, making the gap even bigger.
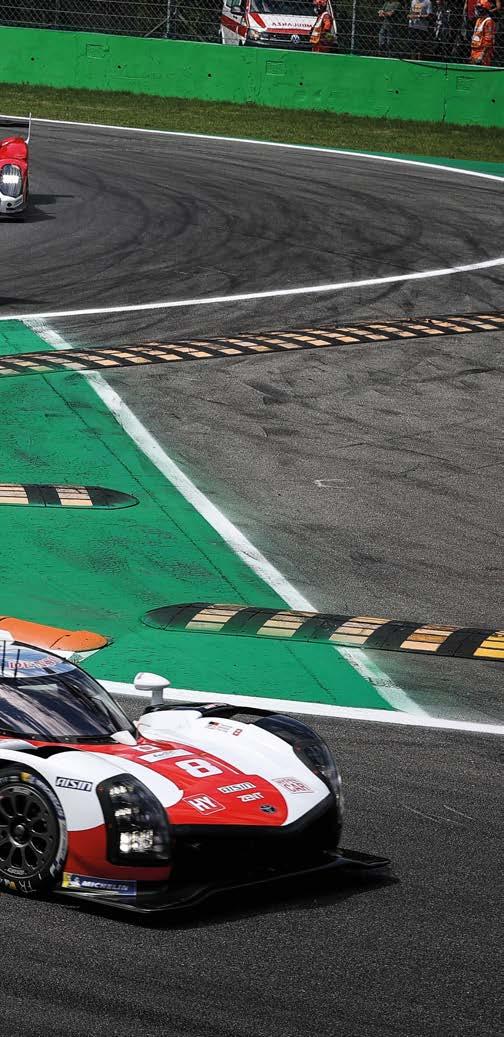
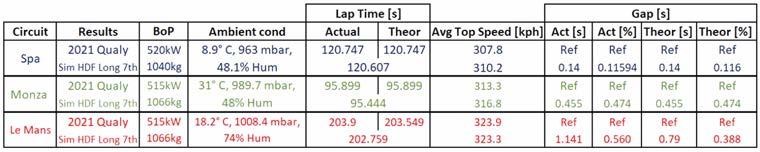
Figure 5 summarises the performance in qualifying sessions of Toyota’s no.7 car at different tracks in 2021.
The circuits of La Sarthe, Spa Francorchamps and Monza have been chosen on purpose. Both the Belgian and Italian circuits are high-speed tracks where teams often prepare for the 24 Hours of Le Mans and employ similar set-ups and aerodynamic trim to what they will use for the French race.
Beside the aforementioned assumptions for the vehicle model, a word of caution regarding the powertrain: the FIA / ACO employs torque sensors mounted on the halfshafts to measure cars’ actual power and verify their compliance to the rules. Since those signals always have noise, it is likely the teams tune their cars with a certain tolerance margin to avoid being disqualified. This, and the fact that sticking to a given power curve is not a simple task, could suggest the cars’ actual power curves could stay below the nominal one.
A quick comparison between Figures 1 and 2 shows immediately how both actual lap time and top speeds are worse than what simulation produced.
The first conclusion that can be drawn from this rough comparison is that it is probably more realistic to consider the aero map with a higher sensitivity to ride heights for the analysis that will follow. This seems to produce closer top speed to what the Toyota achieved during 2021 qualifying sessions.
Boundary conditions
The next step, then, is to consider the effects of actual ambient conditions in the simulation runs. Air temperature, ambient pressure and humidity all affect air density, and this directly influences the aerodynamic forces produced by the car.
In normal situations, this would have an effect on engine power. However, Racecar’s understanding is that, while the FIA / ACO mandates a specific correction, calculated with an equation provided in the rulebook, to the nominal, BoP power communicated to the teams, in 2021 this correction was not applied, to further increase the gap between the LMH and the LMP2 classes. In fact, any possible correction related to ambient conditions would have produced a power reduction and, hence, a performance deterioration for the Hypercars. For this reason, only the influence of ambient conditions on aerodynamic forces will be considered in the simulation runs.
The results obtained considering the above factors and the car in minimum downforce trim, are summarised in Figure 6. The denomination ‘Actual’ and ‘Theor’ indicate actual pole position time and a theoretical lap time, obtained by combining the three best sector times during the session.
What immediately catches attention is the sensible difference between simulation and logged data in terms of top speed. While a simulation will never be exact, especially in this case where the model was built up based only on the regulations and assumptions, the difference in terms of top speed should ring an alarm bell. The manufacturer tolerances mentioned earlier could play a role here, but that alone would not be enough.
In terms of lap times, the relative gap between simulation and logged data becomes interestingly bigger at Monza and Le Mans. Since those races came later in the season, and Toyota had time to develop its car, one would expect them to be closer to ‘ideal best’ lap times, which is what simulation should provide.
Further assumptions with this model include the car being totally reliable, the driver always following the fastest route and the circuit having elevation, which is not logged from the car.
The only accurate way to judge the correlation, then, is a comparison between simulation results and telemetry data, though that is obviously not possible in this case. Alternatively, some information could be derived from onboard videos, though none of Toyota’s available videos show metrics like speed or acceleration.
Trend spotting
The key message is that the simulations presented here need to be used directionally, to isolate trends, without focusing too much on the lap times.
For the next simulation run, the model was set up with the maximum allowed downforce, with both drag and aerodynamic balance were corrected accordingly. Balance, in particular, was moved backward to account for Toyota’s only adjustable aerodynamic device being rear wing angle.
The results obtained with this set-up are summarised in Figure 7.
The top speeds are now a bit closer to their real-world counterparts, in particular at Le Mans, while the lap time deteriorates by about 0.7 seconds. This could suggest that either Toyota had a relatively high downforce and drag set-up, or the team simply had relatively high drag, compromising the car’s top speed, though that seems unlikely.
Interestingly, with the high downforce configuration considered in the second run, the Porsche Curves sector time does not improve. This is partially due to the higher drag but also to the aerodynamic balance shift toward the rear, which negatively compensates the higher downforce and should in fact help in those corners.
This could hint at Toyota deliberately running a higher downforce set-up, while at the same time having the ‘right’ aerodynamic balance, even if top speed suffers as a consequence.
This study focused only on the general downforce and drag level and the aerodynamic balance, nothing else was changed. Other parameters, such as ride heights, could still have a sensible influence on both lap times and top speed.
A comparison between the minimum (in black) and the maximum downforce run (in red) is shown in Figure 8.
One final detail emerging from Toyota’s onboard videos is how the Japanese team seemed to have opted for a very long seventh gear. This was shown by a big rpm drop when shifting up from sixth.
As a side note, the regulations only allow two gear ratios set for the whole season, and the longer seventh gear was employed at least at Monza and Le Mans. At Spa Francorchamps, the Toyota drivers stayed in sixth on the longest straights, at least in qualifying, which hints at the alternative gear ratio choice.
Running the model with an arbitrarily longer seventh gear, and forcing the simulation to stay in sixth gear on the longest straights only at Spa, produced the results shown in Figure 9.
Top speeds further reduce and at Le Mans they are now very close to the average logged on track. Here, this ‘detail’ seems to be worth about 0.1 seconds.
AWD vs RWD
One very sensible topic to discuss, both for the LMH class itself, but also with respect to the plans to balance LMH and IMSA LMDh vehicles, is the effect of having a front electric motor, making cars so equipped all-wheel drive when speed exceeds 120km/h.
Assuming everything else to remain the same, what is the performance benefit of choosing this option? And how does it affect tyre degradation?
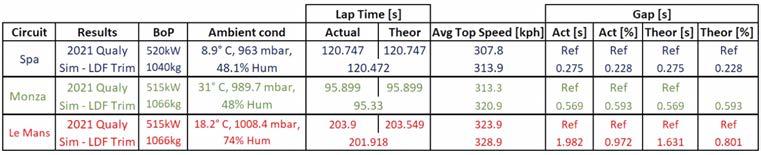
Fig 6: Pole position performance at Spa, Monza and Le Mans vs simulation results in minimum downforce trim
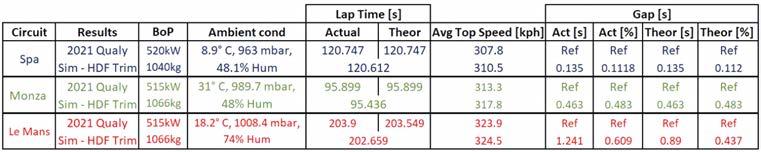
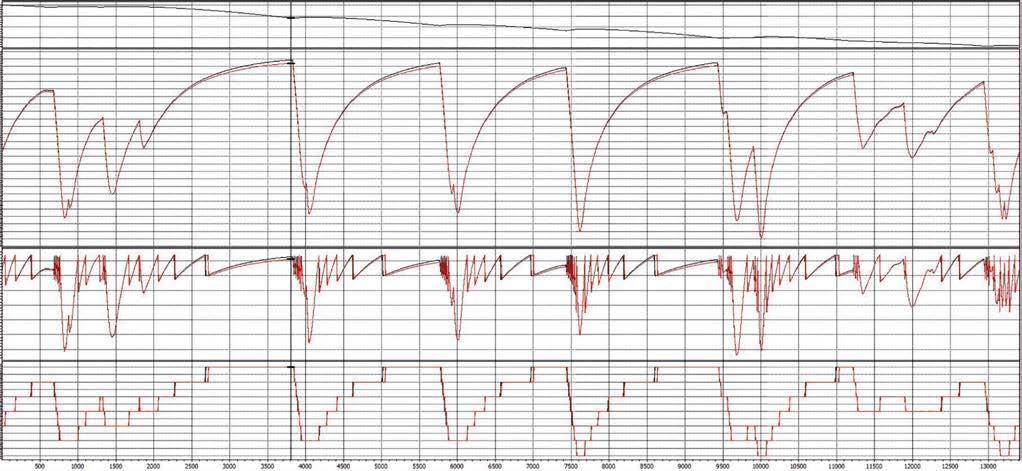
Fig 8: Minimum downforce (black) vs maximum downforce (red) configuration. From the top down, the plots show the compare time, speed, rpm and engaged gear
Fig 9: Pole position performance at Spa, Monza and Spa vs simulation results in maximum downforce trim and with longer seventh gear ratio
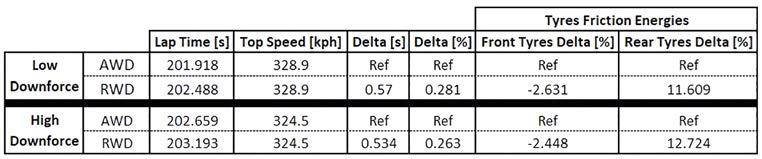
Fig 10: Results of low downforce and high downforce runs with AWD (above 120km/h) and RWD transmission
To answer these questions, the models with low and high downforce set-ups were re-run, removing the assumption of having an all-wheel-drive transmission, complying to LMH rules. It is important to underline how the approximations considered here in modelling the electric motor driving the front wheels (assuming constant torque distribution between front and rear axles) likely lead to an underestimation of the positive effects of this architecture.
The results are shown in Figure 10.
The first factor that can be extracted from Figure 10 is how the lap time improvement (between 0.5 and 0.6 seconds) depends on the aerodynamic configuration. The higher the downforce, and the portion of it acting on the rear wheels, the smaller the gain produced with an all-wheel drive application.
Besides pure performance, also critical is how the tyres are stressed with and without the front motor helping to accelerate the car out of the corners. This can be estimated by calculating the tyre friction energies over a lap. The higher the value of this metric, the harder the tyres are working and, likely, the quicker their degradation. As shown in Figure 10, a rear-wheel-drive car would produce friction energies 2.4-2.6 per cent lower at the front than an allwheel-drive vehicle, but 11.6-12.7 per cent higher at the rear. In other words, while a rear-wheel-drive car would save some work on the front tyres, the additional stress on the rear tyres would be much higher than with an all-wheel-drive solution.
Figure 11 can help in providing a feeling about the differences between RWD and AWD cars.
The compare time and speed trace clearly show most of the gap is produced when the car accelerates out of slower corners.

In those sections, the compare time jumps upward, while the red speed trace lies clearly above the black one.
The tyre friction energy traces give a visual feeling about the difference between the two architectures. At the end of the lap, the difference between all-wheel drive and rear-wheel drive for the front tyre energies is much smaller in magnitude than the same difference for the rear tyres, as anticipated by Figure 10.
Compensation scheme
To compensate for the gap between AWD and RWD architectures, the regulations give some breaks to non-hybrid, rear-wheeldrive cars. The rulebook clearly stipulates RWD vehicles can use wider rear tyres (34/71-18) and slightly narrower fronts (29/71-18), while Glickenhaus was allowed to run at the maximum allowed peak power (520kW) and minimum weight (1030kg) for the whole of the first WEC season.
So, what is the expected performance of non-hybrid cars, assuming the above breaks are fully exploited?
To assess this point, the model described here, in both low and high downforce configuration was run at Le Mans, leaving everything unchanged but with the following parameters: • Mass of 1125kg (1030kg for the car, as for Glickenhaus BoP, 75kg for the driver and 20kg of fuel) • Maximum power at the wheels of 520kW (no tolerance nor deviation from nominal power curve) • 29/71-18 front tyres and 34/71-18 rears
Because of the absence of data about the non-hybrid tyres, the author used a statistical approach to scale the hybrid car’s tyres’ grip to match the new dimensions. Other parameters, like tyre vertical stiffness, camber effects and expansion at speed have been left unchanged.
The results of the runs performed with the RWD model are shown in Figure 12, where the ‘Toyota-like’ car is still taken as a reference.
While this analysis is based on important approximations, and despite the lack of proper data and the number of assumed parameters, such as aero maps, weight distribution and suspension geometry all being the same for cars with such different architecture, the results still seem to show the regulators did a decent job in trying to balance the different vehicles. The non-hybrid concept produced better lap times by about 0.3 seconds in both low and high downforce configurations. At Le Mans, the gap seems to be mainly down to power and top speed, with the non-hybrid models outperforming the hybrid by about 2.5km/h in both runs.
This can be clearly appreciated in Figure 13, where the results of the low downforce runs with the hybrid (in black) and non-hybrid (in red) are compared. The nonhybrid model clearly has an edge, thanks to a higher power and top speed, but accelerating out of slow corners it is still at a disadvantage compared to the hybrid, despite its lower mass and the higher power. The black speed trace always lies above the red one at the exit of low-speed corners.
In cornering situations, the rearwheel-drive vehicle is slower, probably because of a worse, mid-corner understeer tendency. This could be cured by changing car balance (both aerodynamically and mechanically), but that would stress the rear tyres more and likely hurt performance over a stint, with the car tending more toward oversteer with worn rubber.
How different the two configurations would perform on longer stints is a topic for another article, though the more even tyre degradation of an all-wheel-driven car would surely give it an advantage in this respect.
One final critical point to stress is that the analysis presented here was based on the assumption that, with the exception of tyre characteristics, engine power, vehicle mass and, of course, the absence of an electric motor powering the front wheels, all the other key parameters remain the same for both hybrid and non-hybrid models.
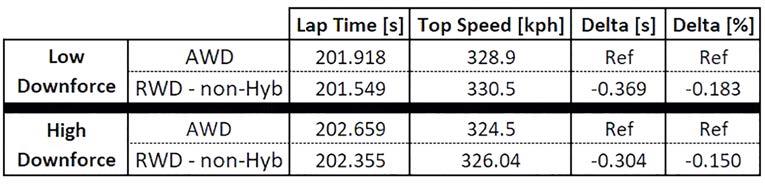
Fig 12: Results of low downforce and high downforce runs with AWD (above 120km/h) and RWD transmission, with the RWD model set up according to 2021 Glickenhaus BoP. All other parameters remained unchanged