13 minute read
SAGD RESERVOIR CHARACTERIZATION CONSIDERATIONS– PART 2 OF 2


TecHNIcAL ArTIcLeS
THE CORE OF THE CHOA JOURNAL. Impactful technical and business insight. Deep. Or broad. Solid. Peer-reviewed.
Advertisement
CONNECT. SHARE. LEARN. LEAD.
SAGD reservoir characterization considerations– Part 2 of 2
BY MARK SAVAGE, P.L.GEO.
INTRODUCTION
This article is Part Two of a two-part paper and addresses the petrophysical and geomodel stages of the reservoir characterization process (the process). Part One, published in the October 2021 issue of the CHOA Journal (https:// issuu.com/choajournal/docs/choa_journal_ edition_1_-_full), addressed the data collection and geoscience analysis stages of the process.
The process is the foundation for subsurface deliverables. The extent of the detail and focus areas required for the process are influenced by the overall project scope, schedule, and budget. The process should incorporate cross-functional (finance, facilities, etc.) and multidisciplinary (geoscience, reservoir engineering, etc.) input .
This process has been used for a range of project decisions, up to significant decision gate (DG) milestones, DG1 (concept), DG3 (sanction), Figure 1, and resource and reserve determination and validation. By following this process, a thorough understanding of the steamassisted gravity drainage (SAGD) asset potential and uncertainty can be gained. With some minor modifications, the workflow and considerations could be used across different asset types.
A vital component of the process is multidisciplinary collaboration . As a minimum, the following disciplines should be involved: geology, geophysics, petrophysics, geomodelling, and reservoir/production engineering. Depending on the project specifics, other cross-functional disciplines may be required: field operations, facilities, project engineering, drilling and completion engineering, risk analyst, and finance. There are three stages to the process workflow: data collection and geoscience analysis, petrophysical analysis and geomodel development, Figure 2. The 3-D geomodel and simulations are dynamic and may need updates from new learnings and information.
Figure 1: Simplified Decision Gate Example (Source: Savage, M., 2020)
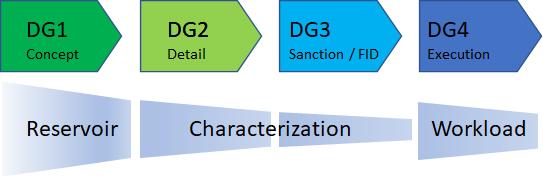
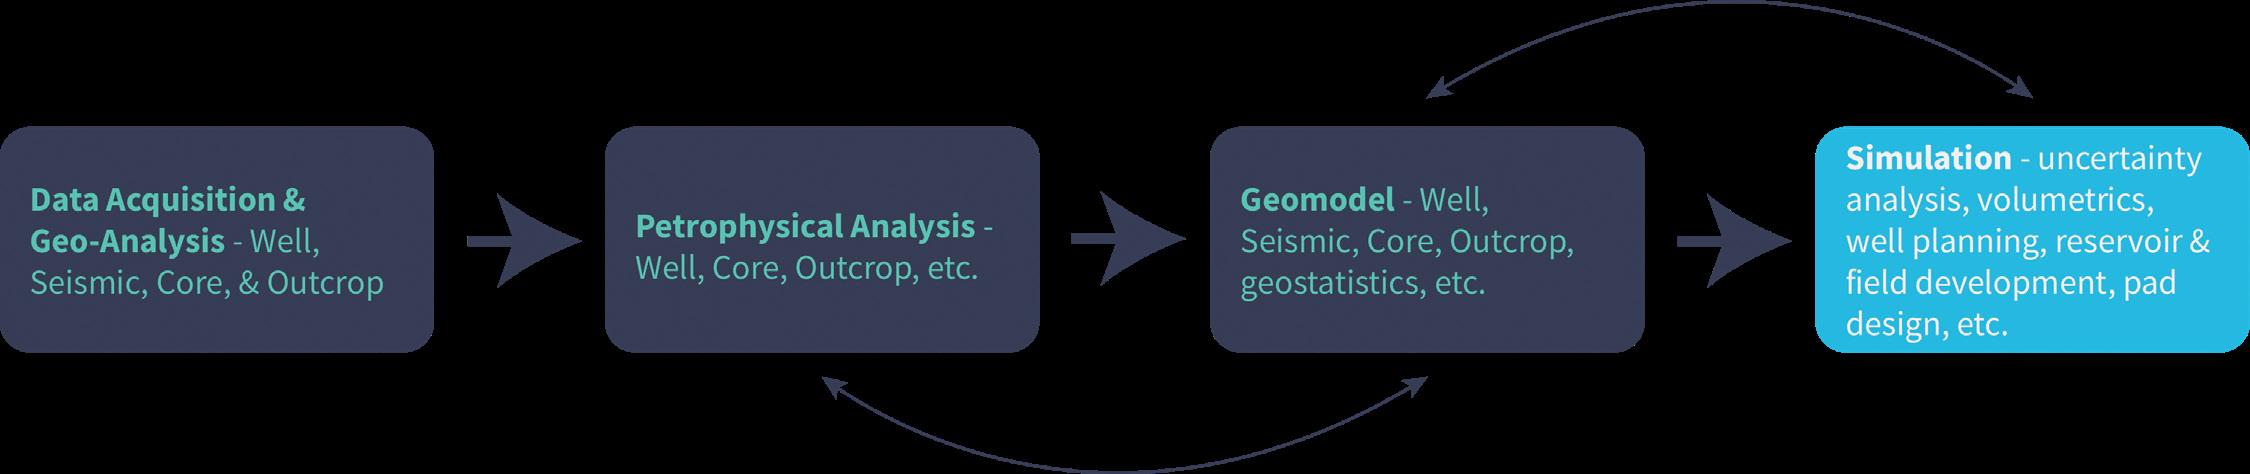
Figure 2: Reservoir Characterization Workflow (Source: Savage, M., 2020)
Each stage of this workflow will influence the degree of uncertainty captured in the reservoir performance predictions. These predictions are used to assess volumetrics, greenfield or brownfield optimal facility design capacity, number of wells required for a field or pad start-up, and the schedule for production rate sustaining pads. The schedule should incorporate performance learnings and required modifications from the producing pads, e.g., updated 3-D geomodels, type curves, and simulations.
Petrophysical Analysis Petrophysical analysis is fundamental to reservoir evaluation and assessment. This analysis provides input data for mapping, geomodelling and volumetric calculations. Well data including, geophysical wireline logs and core, are significant data contributors to the process. Well and core data is collected at different sample sizes, and from micro to macro scale. There are three key petrophysical parameters: porosity (Phi), saturation (water Sw and oil So), and permeability (vertical Kv and horizontal Kh). The complexity of a reservoir may require additional data and analysis to complete the characterization process. Data such as wettability, clay mineralogy, capillary pressure, geochemistry, and fluid properties will highlight reservoir complexities. It is important to determine the impact of this data on permeability, saturation, and porosity.
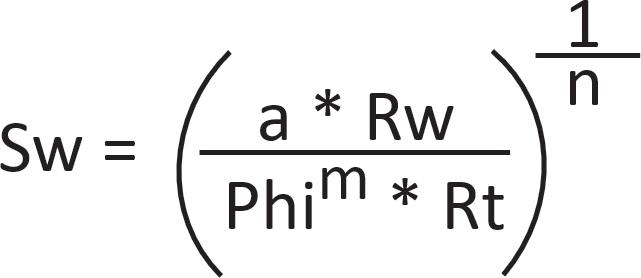
Figure 3: Archie Equation (Source: Geoloil Petrophysics www.geoloil. com/computingSW.php)
An early decision to make is which water saturation (Sw) equation to use. The most common formula used for clastic reservoirs is Archie equation1, Figure 3, but this may not represent your reservoir. The Archie equation was developed for reservoirs with intergranular2 porosity, Figure 4, minimal clay volume and mud beds, and non-potable formation water. It is necessary to understand the equation’s limitations when a reservoir departs from these specific parameters. For example, in mud dominated portions of reservoirs, the Archie equation will result in overestimating Sw due to the influence of mud beds on conductivity. For muddy reservoirs there are several equations useful for deriving Sw, e.g. Simandoux1 or Indonesian1. If using an equation with cementation (m) and saturation (n) exponents, then use electrical properties3 from core analysis to derive m and n. When defining the project scope, it is appropriate to determine which equation to use in the characterization process.
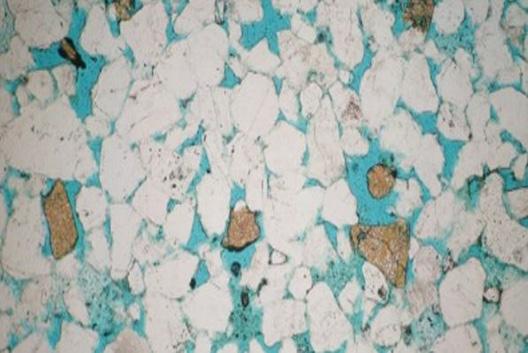
Figure 4: Thin Section showing intergranular porosity (blue colour fill) (Source: https://www.alsglobal.com/en-ca/services-and-products/oiland-gas/petrography/petrographic-analysis)
Two data sources provide information to obtain Sw: overburden (OB) core plugs and geophysical wireline logs. Log data has a higher frequency of data and measures a large rock volume. In contrast, core plug measurements are collected at a lower frequency of data and measure a small rock volume. To improve petrophysical input to geomodels, use core data to calibrate the wireline data. For oil sands core, some bitumen rich, massive sandstone intervals tend to expand when the core is brought to surface. Core expansion disturbs the sand original in-situ grain-to-grain contact, increasing the apparent porosity and permeability measurements from these intervals. The neutron-density logging tool can be used to acquire reliable density porosity values in oil sands. Running sonic logs in several wells can aid in seismic processing and geophysical interpretation. Permeability is a determining parameter for reservoir performance. The nuclear magnetic resonance (NMR) log4 can measure total and effective porosity, permeability, oil viscosity and hydrocarbon pore volume, even in thin beds. The value of NMR data is increased in heterogeneous reservoirs and for reservoirs where core derived permeability is of low reliability . To optimize cost savings when running the NMR, it is recommended to cut a core from the zone of interest in a few wells and calibrate the NMR data to core data. Using NMR data calibrated to a few cores will enable the operator to minimize the total number of cores taken.
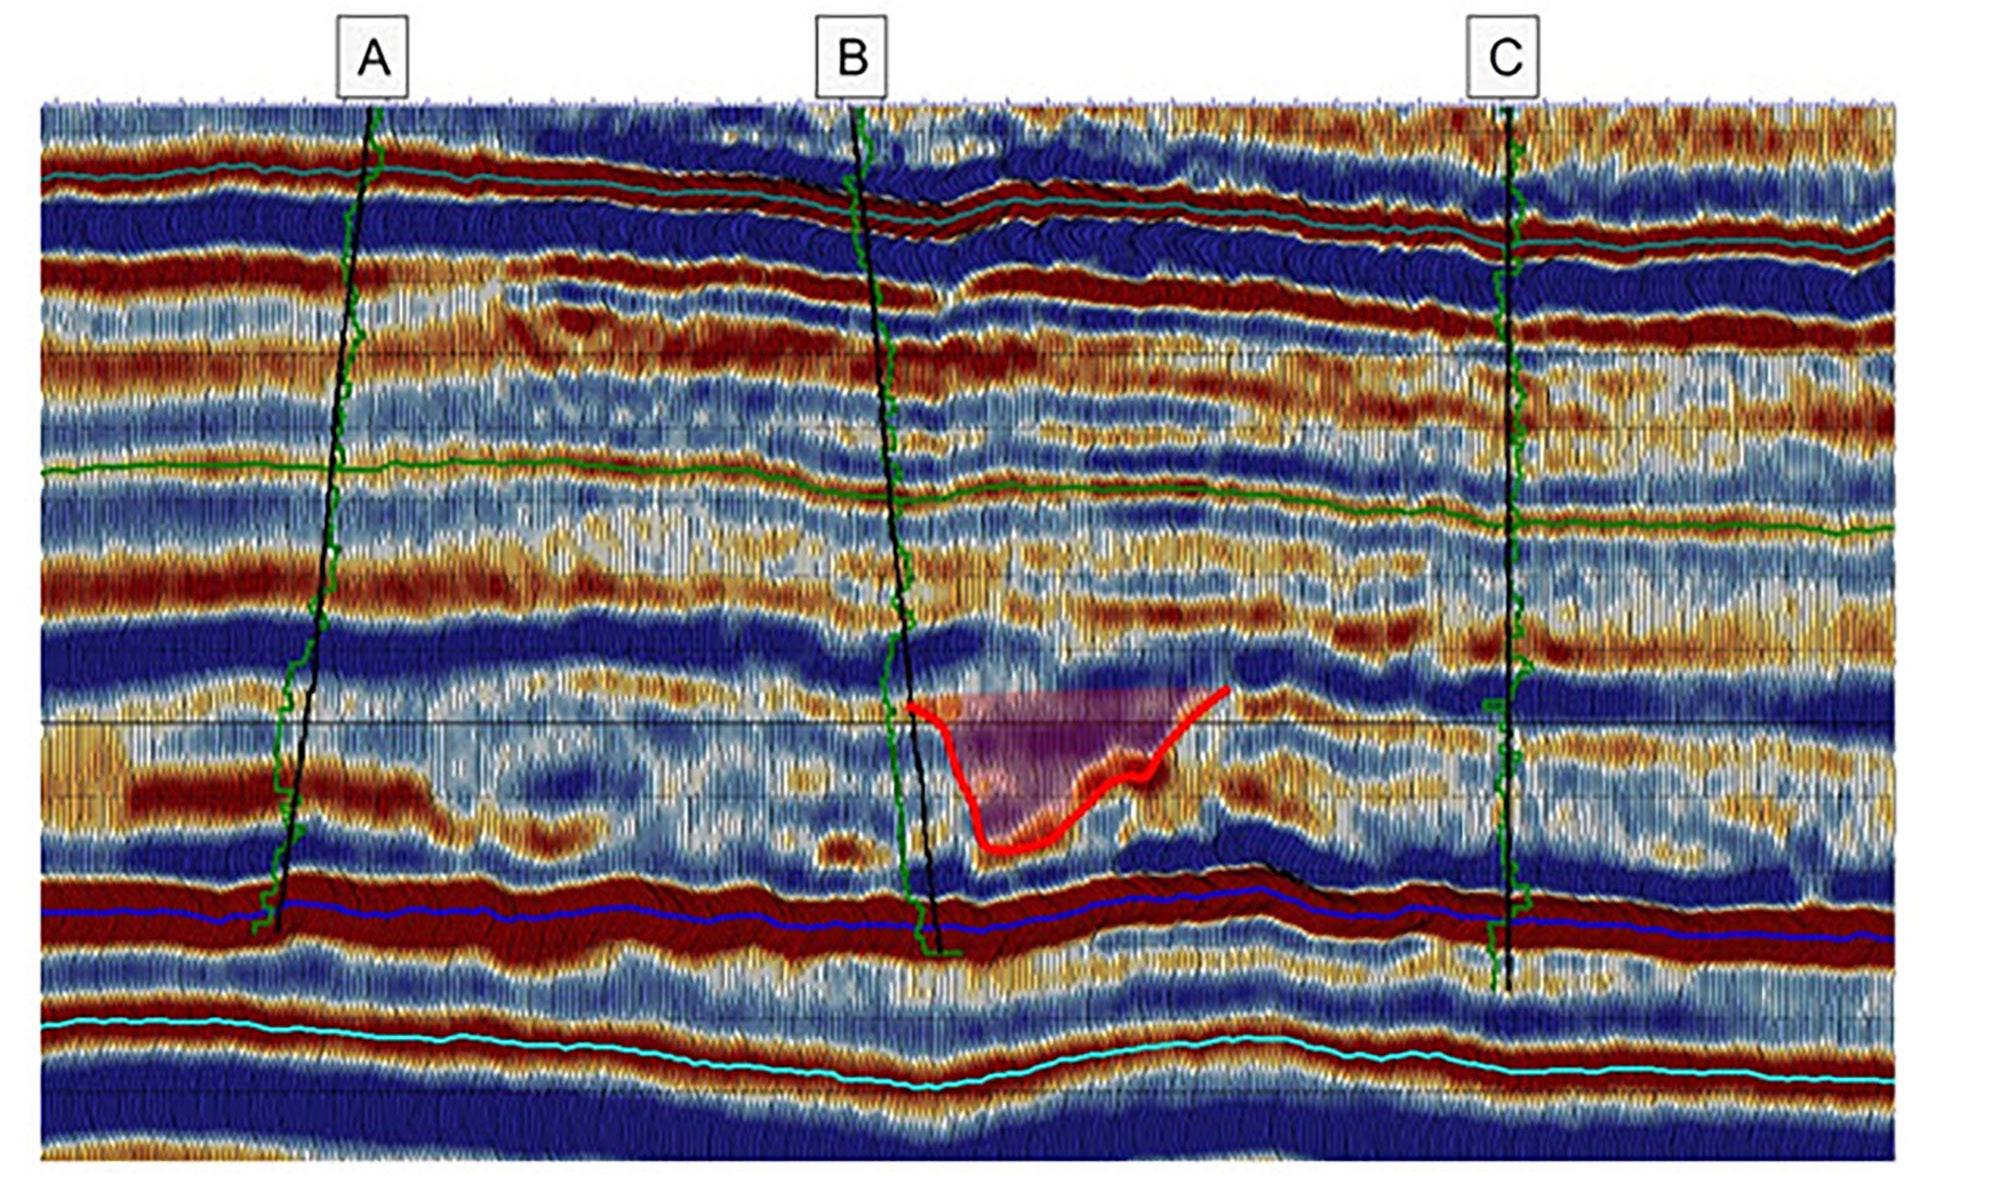
The primary source of permeability data will be individual horizontal and vertical OB core plugs and/or stacked plugs. Consider using stacked core plugs to measure vertical permeability for the geomodel. Use OB plug permeability data representing various reservoir facies, and which is free of impediments that can distort results, e.g., small fractures or mud laminae that span the full width of the plug. Pre-screening the plugs using CT-scan can aid in the sample selection for permeability testing. Improved representative test results can be achieved through a multidisciplinary review of sample selection. Consider upscaling the Kv and Kh data from core to geomodel grid cell scale. The University of Alberta, CCG5 group continues to develop this upscaling methodology. Another key geomodel parameter is reservoir facies, both pay and nonpay intervals, Figure 5.
The interpretation of the reservoir facies is conducted by the geologist using core and wireline logs, including borehole resistivity image logs. Collaboration between the petrophysicist and geologist enables consistency of facies identification and any potential outliers. Facies derived from wireline log analysis, termed electrofacies, may be necessary to fill gaps in the data set. If electrofacies are necessary, then understanding the limitations of this data source is required, e.g., distinguishing mud clast breccia from inclined heterolithic stratification (IHS). Petrophysical analysis is a dynamic process and aids in identifying uncertainties in reservoir parameters. Uncertainty attributed to saturation and porosity parameters can broaden the calculated range of reservoir volumetrics. A software tool such as @Risk or Spotfire can be used to capture ranges of uncertainty. Using an uncertainty range is beneficial in the simulation stage. It can provide reservoir engineers with direction to tune numerical simulations. Consideration of data ranges and associated uncertainty in geologic parameters, thermal dynamic properties and in historic field performance can increase confidence in the range of numerical simulation forecasts. Ensuring a holistic representation of uncertainty requires incorporating multidisciplinary input and feedback during the petrophysical analysis workflow. Implementing this type of workflow requires open communication, collaboration, and integration to ensure the project objective is achieved.
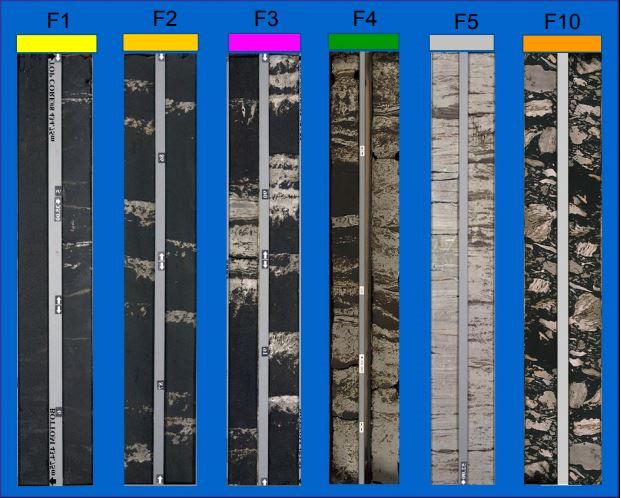
Figure 5: SAGD Facies Scheme (Source: AER D54 2019 8668) Geomodel The process of building multiple realizations of a geological model (geomodel) is a collaborative effort and requires multidisciplinary input throughout the geomodel development and its multiple uses including production forecast, well planning, and financial analysis. A 2-D or 3-D geomodel is an essential component of the process. Geomodels provide input parameters for simulation and analysis of static and dynamic uncertainty, Figure 6. The geomodel can also provide volumetric probabilistic assessments for the area of interest, well, pad or field. Below are a few discussion points regarding the development of a geomodel. Most companies have their own workflow. This is a discussion regarding the components for consideration in a modelling process.
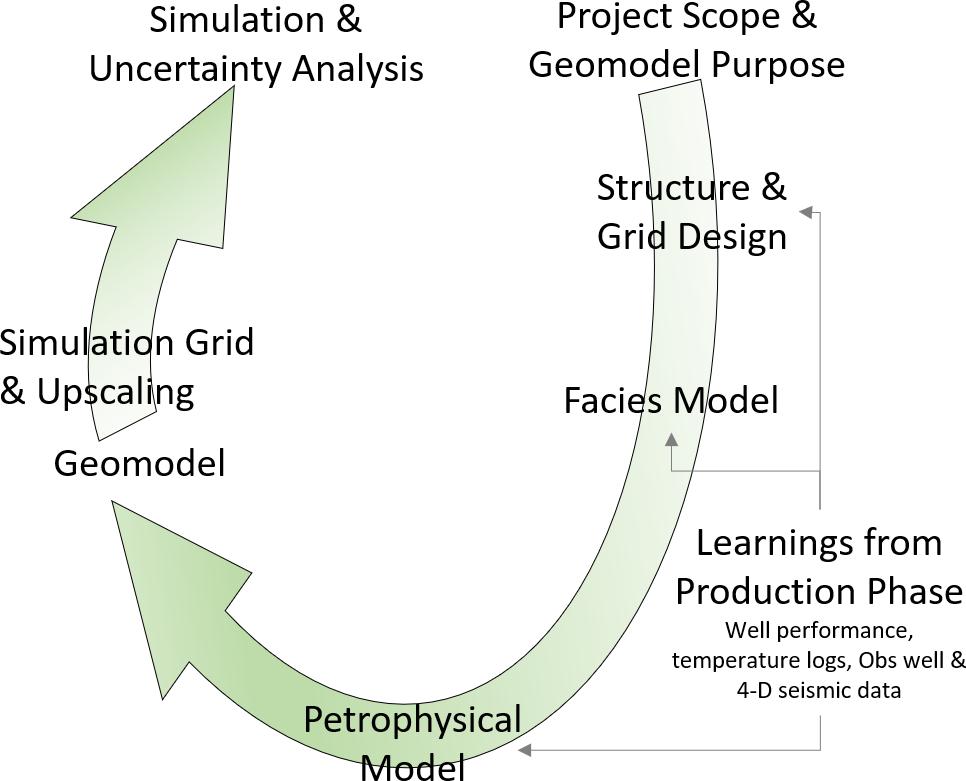
Figure 6: Simplified Geomodel Workflow (Source: Savage, M., 2020)
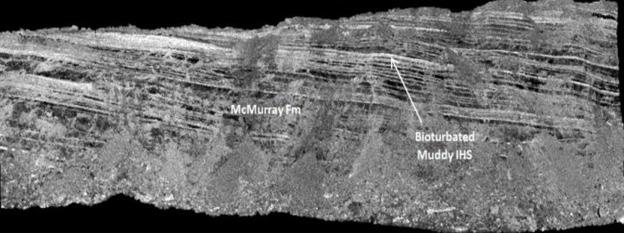
Figure 7: IHS at Syncrude Mildred Lake Mine Face (Source: GeoConvention 2014, Findlay, D., Nardin, T., Wright, A., Mojarad, R.S., Modeling Lateral Accretion in McMurray Formation Fluvial-Estuarine Channel Systems: Grizzly Oil Sands’ May River SAGD Project, Athabasca)
When defining the project scope, a critical step is to determine the purpose for the geomodel realizations. This can include well placement, volumetrics, recovery potential, production and injection rates, and impact of the aquifer pressure transient. Multidisciplinary confirmation of geomodel purpose will ensure that the geomodel is constructed to meet the project objectives. Erroneous outcomes can result when using a geomodel for purposes it was not designed to address; for example, attempting to use a large-scale grid cell volumetric geomodel for field performance forecasts. Using a large-scale grid cell geomodel could accent dominant low-quality reservoir parameters in a production simulation and can underestimate the production forecast. In contrast, using a small-scale grid cell geomodel will incorporate the higher-quality reservoir parameters and provide a more representative production forecast with higher volumes. The geomodel area of interest should be confirmed early in the project scope, i.e., a single subsurface drainage area, a full pad, or an entire field. The area of interest and the geomodel grid cell size will influence the project timeline. A third early decision is to confirm the number of geomodel realizations to generate. My recommendation is that a minimum of fifty realizations be generated, with more realizations if time and computing capability allow. Fifty or more can deliver a wide range of probabilistic (P) realizations to select the P10, P50 and P90 cases for the simulation stage.
Analogous outcrop data (riverbank and/or mine face) Figure 7, can assist in establishing the appropriate grid cell dimensions for the purpose intended, i.e., using outcrop facies dimensions as a guide for grid cell size. The degree of reservoir heterogeneity is a factor which influences grid cell size. To capture the appropriate complexities of a heterogeneous reservoir a smaller grid cell size may be required. Whether to build a deterministic or stochastic geomodel is typically driven by corporate geomodel guidelines. I have used realizations generated from each type of model and from a hybrid version. My preference for a SAGD reservoir is a hybrid model. Hybrid models incorporate a structure grid with several object-based zones limited by key definable surfaces, obtained from integrated interpretation of the 3-D seismic and wells. The object-based portion of the hybrid model can provide an improved geological representation in heterogeneous and complicated depositional and facies environments, such as multiple and stacked incised and abandonment channels. If generating an object-based “The main end-products of a geobody, use 3-D seismic, outcrop and geomodel are performance simulations (resource, reserve, and daily fluid rate) and uncertainty” modern analogue data to influence these object-based features. When considering such data, it should not be done as an absolute. An analogue, modern or outcrop, may not represent the spectrum of the reservoir’s depositional environment. Outcrop data can assist in deriving the value range used in the surface uncertainty process.
The main end-products of a geomodel are performance simulations (resource, reserve, and daily fluid rate) and uncertainty. To derive and capture the uncertainty range of reservoir parameters from core and wireline data, use software such as @Risk or Spotfire. Another key uncertainty to be incorporated is elevations of key inter-well surfaces, such as oil-water contacts, base and/or top of pay, and basement. Well spacing and 3-D seismic quality can reduce uncertainty, but it is still present and needs to be incorporated in the geomodels. The use of Cohiba6 software incorporates surface structure uncertainty into the geomodel. Facies variance is populated across a geomodel region using a vertical proportion curve (VPC). Complex reservoirs can benefit from applying multiple VPC regions within the overall geomodel area of interest. Each region will have a distinct VPC, allowing the geomodel to reflect the reservoir’s variable heterogeneity influenced by spatial position in the depositional environment, i.e., proximal or distal location in an estuarine environment. Reservoir facies petrophysical parameters are distributed using discrete 3-D facies parameters. The facies proportions for every zone of the geomodel are statistically derived from the wells that populate each geomodel zone. The geomodel can be conditioned using 3-D seismic attributes, coupled with geologically distinct reservoir characteristics, to derive a soft trend of facies propagation into inter-well regions. This article has highlighted key decisions and considerations that can be discussed with multidisciplinary team members to ensure the geomodelling workflow achieves project objectives. There are several resources available to assist in developing an appropriate geomodel workflow that best fits individual reservoir and corporate geomodelling philosophies. The two key messages of this article are that: 1. A geomodel is integral to any reservoir evaluation process. 2. When defining the project scope, the appropriate level of geomodel detail should be discussed and confirmed with the multidisciplinary team members. Conclusion Petrophysical and geomodel stages of the reservoir characterization process are essential to the overall evaluation and directly influence simulation outcomes. These stages ensure key reservoir parameters and uncertainties are integrated into the numerical simulations. Incorporating uncertainty from key reservoir parameters and surface structure will aid in ensuring the geomodel is geotechnically representative of the reservoir and that a robust uncertainty analysis can be produced . Early in the project scope defining the geomodel workflow should include contributions from multidisciplinary and if warranted, crossfunctional groups. Integration of different data sources, petrophysical analysis and uncertainty, and geomodel realizations will improve the representative range of simulation results, including both opportunity and risk.
Acknowledgement
Input provided by Gordon T. Stabb, P. Geol., towards writing this article is greatly appreciated.
References 1. Geoloil Petrophysics. http://www.geoloil.com/computingSW.php. 2. AAPG WIKI. http:// www.wiki.aapg.org/Porosity. 3. Lasswell, P.M., Laboratory Analysis of Electrical Rock Properties and
Capillary Pressure in Full Diameter Core Samples, International
Symposium of the Society of Core Analysis, 2005. 4. Schlumberger MR Scanner Brochure. http:// www.slb.com/-/media/ files/fe/brochure/mr-scanner-br.ashx. 5. Boisvert, J., Manchuk, J., Neufeld, C., Niven, E., and Deutsch, C.,
Micro-Modeling for Enhanced Porosity-Permeability Relationships,
Paper 211, CCG Annual Report 14, 2012. 6. Norsk Regnesentral, Norwegian Computing Center. https://www. nr.no/nb/COHIBA
Mark Savage, APEGA P.L.Geo
Mark has been in the oil sands industry since 2000. Mark started his oil sands career with Petro-Canada working on the Lewis, MacKay River and Fort Hills projects. Since leaving Petro-Canada in 2008, he has been actively engaged in various in situ oil sands assets with Ivanhoe Energy Ltd., Statoil Canada Ltd. and Athabasca OilCorporation. He has collaborated on and led in situ geoscience, operations and development teams.
Design. Construct. Deliver.

Industry leaders turn to Fluor to provide professional and technical solutions on the world’s toughest projects. In response, we provide solutions that deliver safe, well-executed, and capital-efficient projects to clients across Canada and around the world.
Working with our clients, we consistently deliver results with the safety and quality they expect.

www.fluor.com

© 2021 Fluor Corporation. All Rights Reserved. Fluor is a registered service mark of Fluor Corporation. ADCA211421
LIKE THE JOURNAL? LIKE TO PUBLISH SOMETHING IN THE JOURNAL?

CHOA is now accepting content proposals for 2022 issues of the Journal. • Full Technical Articles (peer reviewed) • Business Articles • Opinion Pieces • Tech Flashes • Industry Briefs


