
2 minute read
Centers for Disease Control and Prevention Social Vulnerability Index (SVI


Exhibits 22 through 25 show the Centers for Disease Control and Prevention’s Social Vulnerability Index (SVI) scores for census tracts throughout the community. Red highlighted census tracts are in the bottom quartile nationally for different indicators on which the SVI is based.
The overall SVI is based on 15 variables derived from U.S. census data. Variables are grouped into four themes, including:
• Socioeconomic status; • Household composition; • Race, ethnicity, and language; and • Housing and transportation. Exhibits 22 through 25 highlight SVI scores for each of these themes. Exhibit 22: Socioeconomic Status Index – Bottom Quartile Census Tracts
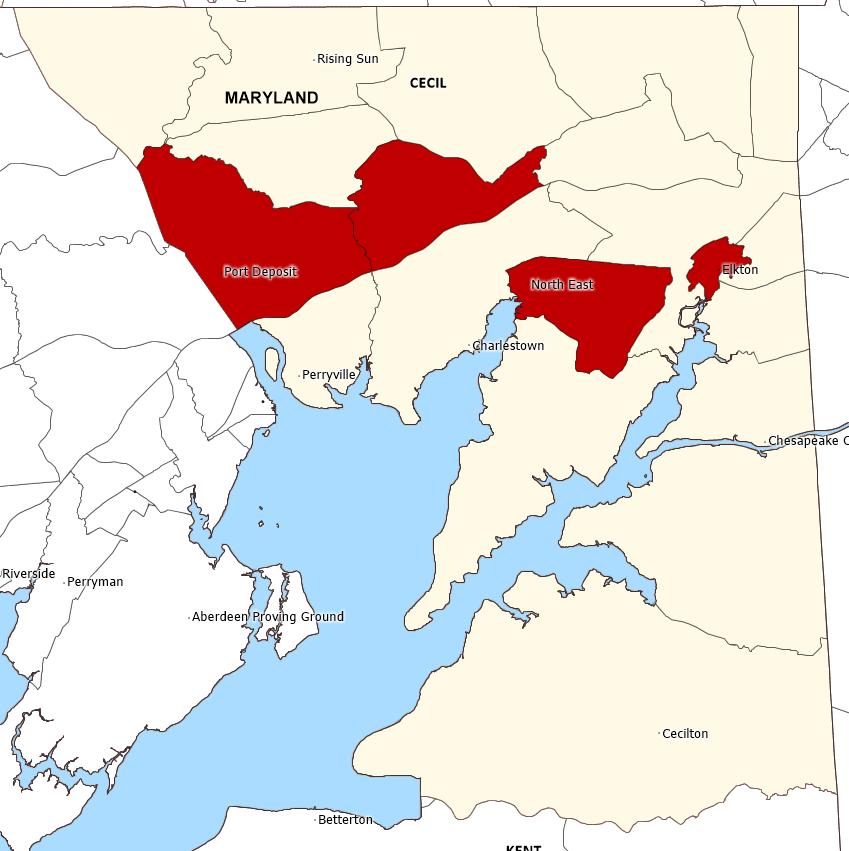
Source: Centers for Disease Control and Prevention, 2018, and Caliper Maptitude, 2021.
Description
Exhibit 22 identifies census tracts in the bottom quartile nationally for socioeconomic vulnerability. Observations
• Census tracts with the highest levels of socioeconomic vulnerability are located in
Port Deposit, North East, and Elkton. • About 19 percent of the community’s total population live in the four highlighted census tracts.
Exhibit 23: Household Composition and Disability Index – Bottom Quartile Census Tracts

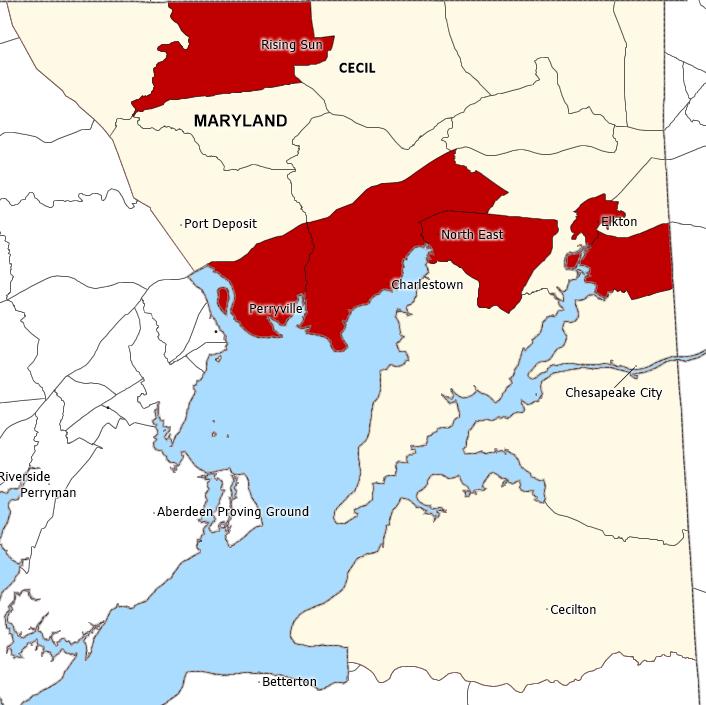
Source: Centers for Disease Control and Prevention, 2018, and Caliper Maptitude, 2021.
Description Exhibit 23 identifies census tracts in the bottom quartile nationally for household composition and disability vulnerability. Observations
• Census tracts with the highest household composition and disability index are in
Rising Sun, Perryville, North East, and Elkton. • About 37 percent of the community’s total population lives in the six highlighted census tracts.
Description Exhibit 24 portrays minority status and language vulnerability by census tract.
Exhibit 24: Minority Status and Language Index


Source: Centers for Disease Control and Prevention, 2018, and Caliper Maptitude, 2021.
Observations
• No census tracts in Cecil County are in the bottom quartile nationally for this measure.
• One census tract in Elkton has the highest percentage (50.2 percent) minority population and individuals who report speaking English “less than well”. • About 8 percent of the community’s total population lives in the census tract with the highest Minority Status and Language Index score. Exhibit 25: Housing Type and Transportation Index – Bottom Quartile Census Tracts


Source: Centers for Disease Control and Prevention, 2018, and Caliper Maptitude, 2021.
Description Exhibit 25 identifies census tracts in the bottom quartile nationally for housing type and transportation vulnerability.
Observations
• More than half the census tracts in Cecil County are in the bottom quartile for housing and transportation vulnerability. • About 65 percenet of the community’s total population lives in a census tract with high vulnerabiltiy for housing type and transportation issues.


