2 minute read
Maternal and Child Health


Maternal and Child Health
Exhibit 35: Percentage Low Birthweight Births, 2013-2019
Area Total Live Births
Low Birthweight Births
Low Birthweight Births
Low Birthweight Births NonHispanic White
Low Birthweight Births NonHispanic Black
Low Birthweight Births Hispanic or Latino
Cecil County Maryland United States 7,998 605 7.6% 6.9% 12.9% 9.0% 1,010,490 87,460 8.7% 6.6% 12.3% 7.0%
54,416,819 4,440,508 8.2% 6.8% 13.5% 7.3%
Source: National Center for Health Statistics - Natality Files, 2021
Description Exhibit 35 provides portrays percentage of low-birth-weight births by race. Light grey shading indicates measures that are above U.S. averages. Observations
• Cecil County had a higher percentage of low-birth weight babies for both NonHispanic White and Hispanic (or Latino) populations than the U.S. as a whole.
Exhibit 36: Number of Births per 1,000 Female Population Age 15-19, 2013-2019
Area
Female Population Age 15-19 Teen Births, Rate per 1,000 Female Population Teen Births NonHispanic White Teen Births NonHispanic Black Teen Births Hispanic or Latino
Cecil County Maryland United States
22,457 19.0 18.2 30.9 17.6 2,640,652 16.1 8.7 21.7 38.7
144,319,360 20.9 13.6 30.3 32.1
Source: Centers for Disease Control and Prevention, National Vital Statistics System, 2021
Description Exhibit 36 provides rates of babies born to teen mothers from 2013-2019 by race. Observations
• Rates for teen mothers giving birth were higher in Cecil County for both Non-
Hispanic White and Non-Hispanic Black mothers than in the U.S. as a whole.
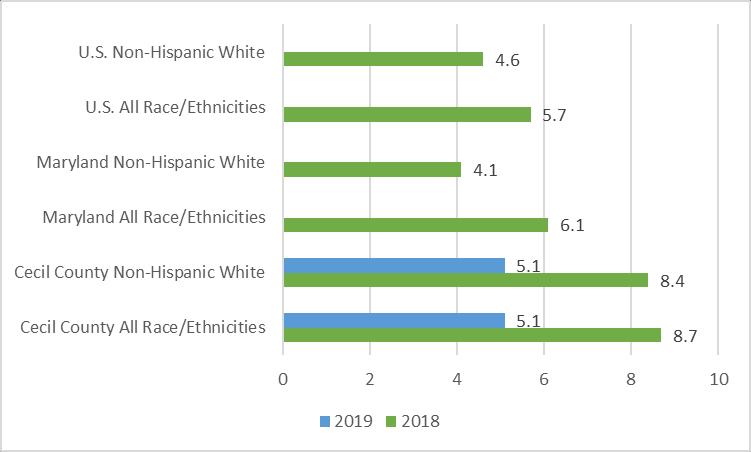
Exhibit 37: Infant Mortality Rates per 1,000 Live Births by Race, 2018-2019
Source: Maryland Department of Health, Vital Statistics Report, 2020.
Description Exhibit 37 compares infant mortality rates in Cecil County, Maryland, and the United States for 2018-2019. Maryland and the U.S. rates are for 2018 only, as that is the most recent year national data is available. Infant mortality rates for Non-Hispanic Black and for Hispanic populations are not available for Cecil County due to statistical unreliability. Observations
• In Cecil County, infant mortality rates for all races/ethnicities declined between 2018 and 2019.
• In 2019, the Cecil County infant mortality rate is lower than both Maryland and U.S. averages.
Exhibit 38: Substance-Exposed Newborns, 2018-2022

Source: Union Hospital, Cecil County Health Data, 2022
Description Exhibit 38 shows the percentage of substance-exposed newborns (SEN) from July 2019 to current year to date (4/8/22). Under Maryland law, a newborn under 30 days old must be reported as SEN if the infant:
• Displays a positive toxicology screen for a controlled substance as evidenced by any appropriate test after birth; • Displays the effects of controlled drug use or symptoms of withdrawal resulting from prenatal controlled drug exposure as determined by medical personnel; or • Displays the effects of Fetal Alcohol Spectrum Disorders (FASD).
Observations
• In Cecil County, the rate of SEN rose steadily from 2019 to 2021 and then experienced a slight decline.


