1 minute read
3.1. Surface-water trends

from Global status on water-related ecosystems and acceleration needs to achieve SDG6 target 6 by 2030

Changes in the extent of surface water are measured at five-year intervals relative to a 20-year baseline period (2000–2019) and based on the annual aggregation of monthly water occurrence maps. Permanent, seasonal and reservoir data have been merged into a single surface-water trends map (though they are also presented separately) to depict river basins with the highest changes in surface-water area in the last five years (2015–2019).
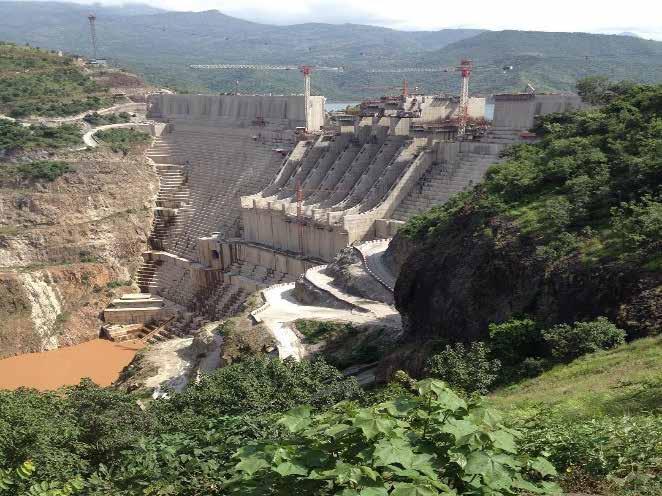
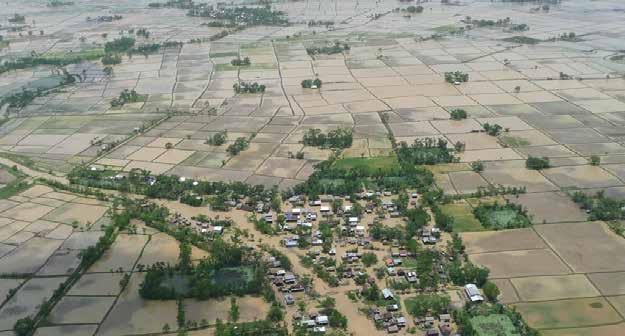
Analysis of surface-water extent over the last 20 years reveals that one fifth of the world’s river basins experienced either a high increase or decrease in surface water in the past five years (Figure 5). River basins with increased surfacewater area tended to correspond to locations with a growth in reservoirs, newly inundated land (i.e. land intentionally flooded for agriculture) and areas with increased flooding, with decreased surface-water areas linked to locations that experienced drought, increased demand and excessive water usage. The surface-water changes presented in Figure 5 are also indicative of climate change, the impacts of which have contributed to the drying out of lakes in arid regions and expansion of lakes due to glacial melt and permafrost thawing.
Advertisement
The map shown in Figure 5 presents the overall changes to all open inland surface waters, including natural waters (rivers and lakes) and artificial reservoirs, both permanent and seasonal. Individually, these types of surface water provide very different environmental, social and economic benefits, but together – and when adequately protected and well managed – they secure vital services for people and help maintain the health and integrity of ecosystems. It is therefore crucial to examine these water bodies together to gain an overall understanding of the situation, while also respecting their individual importance, exposure to different pressures and threats, and specific management needs. In the following sections, this report presents the mapping and analysis of changes in permanent water, seasonal water and reservoirs.
Online story maps can be accessed on the dedicated case studies website.
National data of combined surface-water changes (i.e. permanent + seasonal + reservoir changes) per country are available for download from the indicator 6.6.1 report website.8 The table provides country information on changes in surface-water area observed in 2015 and 2020, which are compared against a 20-year reference period. Countries can use this tabulated data to observe the extent to which surface waters are increasing or decreasing.
8 See https://stories.sdg661.app/#/pdfs/report-annexes.