9 minute read
Using Earned Value Management


Using Earned Value Management for evaluating the overall productivity of a project
It is generally acknowledged that the productivity of labour and equipment is one of the major risk factors in the success or failure of a project, but is it possible to evaluate, on an overall basis, how this productivity is affecting the project trend? In this article, the author reviews a methodology for measuring and interpreting the overall productivity of the Project, known as
Earned Value Management (EVM) or
Earned Value Analysis (EVA) . This methodology is available in most ‘high end’ planning packages .
The Baseline Schedule
In implementing EVM, the first challenge is the creation of the Baseline Schedule on which the ‘planned labour units’ (normally expressed in hours) and ‘quantities to be executed per activity’ are included for every activity of the Work Breakdown Structure (WBS) . For example – Activity 001: ‘installation of secondary cable trays’ has a planned labour unit of 0 .80 hour/m .
This means that the plan is to spend 48 minutes (60 minutes x 0 .80) for the installation of every metre of secondary cable tray . The same planned labour unit and quantity evaluation is made for all the activities of the WBS so that the ‘total planned hours’ to be spent on the project can be identified . Obviously, it is mandatory to align these hours at the moment that the contractor was chosen .
The Planned S Curve
Once the baseline schedule is defined, and the planned quantities and labour units inserted for each activity, it is possible to create a Planned S Curve, using the formula below: • Planned Hours (PH) = Planned
Quantities x Planned Labour Units Going back to the example, let´s consider that the planned quantity was 5,000m of secondary cable trays, so we would have: • Planned Hours (PH) = 5,000m x 0 .80 hours/m = 4,000 planned hours
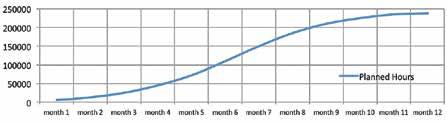
Doing the same exercise for all the activities of the project, and cumulating the working hours on a monthly basis using the planning software, it is possible to create an S-Curve for the Planned Hours (PH) . The graphic below is an example of an S Curve forecasting almost 250,000 working hours for an entire project .
The Baseline Schedule – Planned Hours ‘S’ Curve
Usually on a monthly basis, the actual progress (or quantities executed per activity) is recorded/monitored . In EVM, the actual progress is measured by the ‘Earned Hours,’ and it is a measure of the quantities installed multiplied by the Planned Labour Units . Using EVM, the simple formula for calculating the progress (EH) using this recorded data is therefore as follows: • Earned Hours (EH) = Actual Quantities
Executed x Planned Labour Units Continuing with our example, let´s say that the production of ‘secondary cable trays’ during the first month of the project was 400m . Our progress (Earned Hours) would be: • Earned Hours (EH) = 400m x 0 .80 hour/m = 320 hours Making the same calculations across all activities in the Schedule for the month, we would have an overall result of the ‘Earned Hours’ . But why is this information needed? Let´s compare both formulas: • Planned Hours (PH) = Planned
Quantities x Planned Labour Units • Earned Hours (EH) = Actual
Quantities x Planned Labour Units Comparing one formula to the other it is clear that the only variable is the difference between the ‘planned’ and ‘actual’ quantities . Therefore if the ‘actual’ quantities installed are more than the ‘planned’ quantities in the reporting period, the Earned Hours will be more than the Planned Hours . Common sense tells us that we would be ahead of our planned progress because we had installed more work than planned . More importantly, if Earned Hours were less than Planned Hours we should be aware that we are behind programme .
The Efficiency Analysis or the Actual Hours (AH) Curve
EVM goes a little further than that . The next step is to identify the efficiency of the direct labour or, in other words, verify if the hours spent in relation to the quantities executed are as per planned . The formula for this part of the EVM process is simply: • Actual Hours (AH) = Actual
Quantities x Actual Hours (Actual
Labour Units) The Actual Labour Units can be measured on a daily or weekly basis per activity depending on the level of accuracy required . It should be noted that this analysis requires a significant commitment from the foreman of the project and that an administrator will
be required for every 200 workers to record and monitor the data .
Comparing the Data
It is now possible to compare the 3 formulae, as follows: • Planned Hours (PH) = Planned
Quantities x Planned Labour Units • Earned Hours (EH) = Actual
Quantities x Planned Labour Units • Actual Hours (AH) = Actual
Quantities x Actual Hours (Actual
Labour Units) Comparing Planned Hours (PH) with Earned Hours (EH) provides us with an indication of progress . If the EVM analysis shows we are behind schedule then we need to know why and take corrective action . Comparing Actual Hours (AH) with Earned Hours (EH) gives us an indication of productivity . Common sense tells us that if we spend more time than planned on an activity our productivity is below par . Similarly if we spend less time than planned our productivity is above par . If the EVM analysis shows we are below par we need to find out why and take corrective action . In both cases, if we are above par we also need to know why and maintain it . Let´s go back to our example, and consider that for the production of 400m of cable trays, we spent 360 ‘Actual Hours’ instead of 320 ‘Earned Hours’ . This gives us a production factor of 89% when ideally we want 100% or more . Not good – we need to know why and implement corrective action .
Bringing all the Data Together
The summary of this methodology is presented below in another example on a project with 45,000 man hours to be constructed over a 4 month period . The data recorded in each period is shown in the table below:
Planned Hours (PH) Earned Hours (EH) Actual Hours (AH) Month 1 Month 2 Month 3 Month 4
5,000 13,000 25,000 45,000
3,000 18,000 35,000 40,000
1,000 18,000 30,000 50,000
By plotting this data each month the following graph emerges over time:

What we can tell from the data and graph in each month is:
Progress & Delay Productivity Months PH x EH EH x AH 1 5,000 > 3,000 = delay 2 13,000 < 18,000 = ahead
3 25,000 < 35,000 = ahead
4 45,000 > 40,000 = delay 3,000 > 1,000 = good 18,000 = 18,000 = as planned 35,000 > 30,000 = good 40,000 < 50,000 = bad productivity
In addition: • In Month 1 – the delay and the good productivity indicates a lack of manpower . • In Month 3 – indicates the perfect world: good progress and good productivity . • In Month 4 – indicates a disaster; delay and bad productivity .
Why Use EVM?
EVM is informative and allows the Project Manager to make decisions and take corrective actions where needed during the execution of the works . Like all things that are good, EVM comes at a cost, requiring good and accurate administration to be effective . Moreover, poor administration of EVM will result in poor information and inappropriate management decisions and actions . In the author’s experience one EVM Administrator working closely with the site superintendent, will be able to evaluate the daily EVM data for a work force of 200 workers .
About the author
Ricardo Delarue is the Country Manager of Systech International in Latin America, He is Master Civil Engineer and is Certified in Remarkable Knowledge (CRK) in Time & Cost Management by ICEC – International Cost Engineering Council, PHD level . As a Consultant, Ricardo worked in projects in Canada, Costa Rica, Panama, Brasil, Peru, Chile, Scotland, England, Spain, Morocco, Kuwait, Iran, Dubai, Indonesia and China, in the last 35 years . Ricardo is member of the British SCL – Society of Construction Law . He wrote a book in Portuguese about efficiency, delay & forensic analysis, based on the content of the SCL Delay & Disruption Protocol . His last lecture was in October 2016 at the World Congress of ICEC in Rio de Janeiro, about the same subject as this article .
In memoriam
Leslie Rueben White
It is with great sadness that we announce the passing of Leslie R . White on April 28, 2017 in the QE11 Health Sciences Centre at the age of 88 . Born in Halifax, he was the son of Ethel and Leslie R . White Sr . Leslie spent his life building churches, schools and hospitals for the benefit of others . He is survived by his loving wife Jean (McConnell); daughters Lynda Landry (Joe), Dartmouth and Deborah Aggas (Roger), Truro; son William L . White, Vancouver, B .C .; grandchildren Craig, Christopher, Holly, Becki and Robbie; great-grandchildren Clara, Charlie and Henry; and several nieces and nephews .
Leslie was a founding member and the first president of CIQS Maritimes (formerly Nova Scotia Association of Quantity Surveyors) in 1979 . He served a second term as President in 1986-87 and was presented the CIQS Award of Merit in 1992 . He worked tirelessly to keep CIQS Maritimes active during lean years and was well respected in the construction industry . Our heartfelt condolences go out to Leslie’s family and friends .
Connect with our advertisers


Company
Altus Group Bisceglia & Associates Canadian Tire Corporation CB Ross Partners ConEcon Consultants Exactal
Page
40 23 4 20 17 2
Phone #
Website/E-mail
905-953-9948 www .altusgroup .com 905-695-5200 www .lawtoronto .com 800-387-8803 www .corp .canadiantire .ca 416-487-3330 www .cbross .ca 604-522-8970 www .conecon .ca 512-768-8111 www .exactal .com
Finnegan Marshall Inc . George Brown College Goldman Sloan Nash & Haber LLP Lakeland Consulting Inc . LCO Construction and Mgmt . 31 3 26
416-929-0006 www .finneganmarshall .com 800-265-2002 www .coned .georgebrown .ca 416-597-9922 www .gsnh .com 25,39 905 829 4000 www .lakelandconsulting .com 16 514-846-8914 www .lcogroup .com
Macogep 9 514-223-9001 www .macogep .com
Ontario General Contractors Association 8 905-671-3969 www .ogca .ca
Osler, Hoskin & Harcourt LLP 25 416-362-2111 (Toronto Office) www .osler .com
Pelican Woodcliff Inc . 4
QS Online Cost Consultants Inc .
33 QSM – Mechanical Quantity Surveying 9 TD Insurance 9 905-889-9996 www .pelicanwoodcliff .com 902-405-1504 www .qsonlinecostconsultants .com 416-949-8540 www .qsmcon .ca 866-269-1371 www .melochemonnex .com
Please support these advertisers who help make Construction Economist possible.
To reach construction and quantity surveying professionals through Construction Economist and its targeted readership, contact Jeff at your earliest convenience to discuss your company’s promotional plans . Jeff Kutny, Marketing Manager jeff@kelman .ca 866-985-9789
Published for CIQS by: