Exile Bay Catchment Flood Study


Final Report


December 2020
Exile Bay Catchment Flood Study
Final Report
Project: Exile Bay Catchment Flood Study Project Number: 180064 Client: City of Canada Bay Client Contact: Brian Woolley Report Author: Beth Marson Prepared by: Beth Marson, Feiya He Date: 7 December 2020
GRC Hydro Level 9, 233 Castlereagh Street Sydney, NSW 2000 Tel: +61 2 9030 0342 Email: info@grchydro.com.au

Supplied
Verified By: Stephen Gray Date Version Description 29 Nov 2018 1 Draft Stage 1 Report 13 Mar 2019 1 Draft Stage 2 Report Model Calibration/Validation 31 July 2019 1 Draft Flood Study 14 Feb 2020 1 Draft Flood Study for Public Exhibition 7 Dec 2020 1 Final Flood Study Filepath: J:\180064\Admin\Reports\Draft_FloodStudy\ExileBay_Final_FS_v03.docx Cover Image:
by Council
EXECUTIVE SUMMARY
City of Canada Bay (Council) has, with the financial support of the NSW Government via the Floodplain Risk Management Program, commissioned GRC Hydro to undertake a Flood Study for the Exile Bay Catchment (the study area).
This study comprises stages 1 to 2 in the five stage process outlined in the NSW Government’s Floodplain Development Manual (FDM, 2005) (Reference 17). These works include:
1. Data collection collection of all applicable data to be used for the ensuing stages of the studies;
2. Flood Study a comprehensive technical investigation of flood behaviour that provides the main technical foundation for the development of a robust floodplain risk management plan;
3. Floodplain Risk Management Study (FRMS) assess the impacts of floods on the existing and future community and allows the identification of management measures to treat flood risk;
4. Floodplain Risk Management Plan (FRMP) outlines a range of measures, for future implementation, to manage existing, future and residual flood risk effectively and efficiently; and
5. Plan Implementation once the management plan is adopted, an implementation strategy (devised in Stage 4) is followed to stage components dependent on funding availability.
The objective of this study is to improve understanding of flood behaviour, and better inform management of flood risk for the Exile Bay catchment. The study will also provide a sound technical basis for any further flood risk management investigation Meeting the requirements of the key stakeholders is a critical objective of this study.
Work completed includes the following:
• Collected Council asset data and reviewed;
• Collected relevant reports and reviewed and provided a synopsis of same which is presented herein;
• Built a hydrologic model (DRAINS) for the entire study area. (See Figure 12);
• Built the hydraulic model for the entire study area (See Figure 14);
• Community Consultation;
• Calibration and Validation of the hydrologic and hydraulic modelling system;
• Design Flood Modelling;
• Analysis of Model outputs;
• Sensitivity Analysis;
• Climate Change Analysis;
• Hotspot Analysis
• Preliminary Mitigation Analysis; and
• Maps and Reporting as contained herein.
The model system built to represent flooding in the Exile Bay catchment has been demonstrated to recreate historical flood behaviour.
3 Exile Bay
Flood Study Final Report
Catchment
Further, the model suitability for design flood estimation was also confirmed, by comparison of the 1% AEP estimate, against other estimates achieved for other similar catchments in the Sydney Metropolitan area. This verification established that model estimates are reasonable.
Design flood behaviour has been defined for a full range of flood magnitudes, from the 1 EY to the PMF events. The flood study has used these design flood outputs to:
• Identify properties within the FPA (see Section 9.6) that may be subject to flood related development controls This ensures that, moving forward, Council can appropriately management flood risk in the catchment;
• Analyse key overland flow paths through the catchment and investigate flood mechanism in detail (see Section 12);
• Undertake a preliminary mitigation analysis of works identified by Council (see Section 13). This process assessed measures such as removal of potential flow impediments and increasing the capacity of Saltwater Creek for the 10% and 1% AEP events. It is recommended that these options are assessed in more detail in the FRMS&P.
This report constitutes the finalised report of the flood study. Following review by the Floodplain Risk Management Advisory Committee, a Public Exhibition Draft was published in early 2020 and made available for wider community comment.
This document is produced by GRC Hydro solely for the benefit and use by the client in accordance with the terms of the engagement. GRC Hydro do not and shall not assume any responsibility or liability whatsoever to any third party arising out of any use or reliance by any third party on the content of this document.
4
Study Final Report
Exile Bay Catchment Flood
FOREWORD
The New South Wales (NSW) Government’s Flood Prone Land Policy aims to reduce the impact of flooding and flood liability on individual owners and occupiers of flood prone property, and to reduce private and public losses resulting from floods.
Through the NSW Office of Environment and Heritage (OEH), NSW Department of Planning and Environment (DPE) and the NSW State Emergency Service (SES), the NSW Government provides specialist technical assistance to local government on all flooding, flood risk management, flood emergency management and land use planning matters.
The Floodplain development manual (NSW Government 2005) assists councils to meet their obligations through a five stage process resulting in the preparation and implementation of floodplain risk management plans. Image 1 presents the process for plan preparation and implementation.
Image 1: The floodplain risk management process in New South Wales (FDM, 2005)
Floodplain Risk Management Committee
Section 2.2 Appendix D
Data Collection
Section 2.3 Appendix E
Compilation of existing data and collection of additional data. Usually undertaken by consultants appointed by council.
Defines the nature and extent of the flood problem, in technical rather than map form. Usually undertaken by consultants appointed by council.
Source: NSW Government (2005)
Floodplain Risk Management Study
Section 2.5 Appendix G
Determines options in consideration of social, ecological and economic factors relating to flood risk. Usually undertaken by consultants appointed by council.
Established by the local council, must include community groups and state agency specialists
Floodplain Risk Management Plan
Sections 2.6 and 2.7 Appendix H
Preferred options publicly exhibited and subject to revision in light of responses. Formally approved by council after public exhibition and any necessary revisions due to public comments.
Plan Implementation Sections 2.8 and 2.9 Appendix I
Implementation of flood, response and property modification measures (including mitigation works, planning controls, flood warnings, flood readiness and response plans, environmental rehabilitation, ongoing data collection and monitoring) by council.
5 Exile Bay Catchment Flood Study Final Report
➔
➔
Flood Study Section 2.4 Appendix F
➔
➔
1. Introduction 12
1.1 Study Overview 12
1.2 The Floodplain Risk Management Program 12
1.3 Objectives 13 1.4 Company Contact 13 2. Background.................................................................................................................................................14
2.1 Study Area 14 2.2 Exile Bay Flood Mechanisms 14
2.3 Policies, Legislation and Guidance.........................................................................................................17
2.3.1 Implemented Guidelines and References 17
2.3.2 Review of Council Planning Policy 17 3. Available Data 19
3.1 Overview 19 3.2 Previous Studies...........................................................................................................................................19
3.2.1 Exile Bay, St Lukes and William Street Flood Study (WMAwater, 2017) (Reference 4) 19
3.2.2 WestConnex Technical Report Flood Mitigation Strategy (AECOM Hyder Joint Venture, 2016) (Reference 20) 19
3.2.3 Parramatta River Estuary Foreshore Management (Royal Haskoning DHV, 2013) (Reference 8) 20
3.2.4 Beaconsfield Depot Flooding Issues on Existing Properties (J. Wyndam Prince, 2012) (Reference 5) 20
3.2.5 Proposed Re Development of Beaconsfield Depot, Concord (Stage 2 Flood Study Report) (J. Wyndam Prince, 2011) (Reference 9) 20
3.2.6 Intersection of Brewer Street and Majors Bay Road Overland Flood Investigation (Taylor Thomson Whitting, 2010) (Reference 7) 20
3.2.7 Hydrological and Hydraulic Services for Proposed Development of Concord Council’s Former Depot in Beaconsfield Avenue, Concord (Bankstown Civic Services Group, 2000) (Reference 10) 21
3.2.8 Overland Flow Investigation Brewer Street/Majors Bay Road Intersection (Gardiner Willis & Associates, 1998) (Reference 11) 21
3.2.9 Report on the Massey Park Gross Pollutant Trap (UTS Sydney, 1997) (Reference 12) 21
3.2.10 Main South Drain Investigation of Stormwater System Parramatta Road to John Street (Ledingham Hensby Oxley & Partners, 1992) (Reference 13) 21
3.2.11 Sydney Storms November 1984 (Public Works, 1985) (Reference 17) 22
3.2.12 Stormwater Drainage capacity assessment within the Municipality of Concord (E. S. Rowe & Ennis, 1973) (Reference 16) 22
3.2.13 History of Canals and Bridges (Various Councils and Public Works) 22
3.3 Hydraulic Model Data............................................................................................................................... 22
Exile Bay Catchment Flood Study
6
Report
Final
Contents
7 Exile Bay Catchment Flood Study Final Report 3.3.1 LiDAR Data 22 3.3.2 Ground Level and Bathymetric Survey 23 3.3.3 Drainage Network Data 26 3.4 Hydrologic Data 26 3.4.1 Recorded Rainfall Data.............................................................................................................................................26 3.4.2 Historic Rainfall Events 29 3.4.3 Design Rainfall.............................................................................................................................................................32 4. Community Consultation 35 4.1 Newsletter and Questionnaire 35 4.2 Public Exhibition 35 5. Flood Modelling Overview 39 6. Hydrologic Model.....................................................................................................................................40 6.1 Overview 40 6.2 Sub Catchment Delineation 40 6.3 Percentage Impervious 40 6.4 Design Rainfall Losses 41 6.5 Calibration Rainfall Losses 41 6.6 Other Hydrologic Model Inputs.............................................................................................................42 7. Hydraulic Model........................................................................................................................................45 7.1 Overview 45 7.2 Model Topography 45 7.2.1 Selection of Cell Size 45 7.3 Boundary Conditions.................................................................................................................................45 7.3.1 Inflows 45 7.3.2 Downstream Boundary 45 7.4 Roughness Values 46 7.5 Hydraulic Features 47 7.6 Hydraulic Structure Blockage.................................................................................................................. 47 7.6.1 Saltwater Creek Structures 48 7.6.2 Drainage Network 48 8. Model Calibration & Validation 52 8.1 Overview 52 8.2 Confirmation of Flood Behaviour.......................................................................................................... 52 8.2.1 November 2018 Event 52
8
Flood Study Final Report
......................................................................................................................................78
Exile Bay Catchment
8.2.2 October 2018 Event 60 8.3 Model System Validation 63 8.3.1 Unit Flow Rate Estimates 63 8.4 Summary 64 9. Design Flood Modelling..........................................................................................................................66 9.1 Overview 66 9.2 Application of ARR2016 66 9.2.1 Selection of Critical Storm and Duration 67 9.3 Flood Depths, Levels & Flows................................................................................................................. 68 9.4 Flood Hazard 72 9.5 Flood Function 74 9.6 Preliminary Flood Planning Area 75 9.7 Flood Emergency Response 76 10. Sensitivity Analysis 78 10.1 Overview 78 10.2 Structure Blockage
10.3 Hydraulic Roughness 79 11. Climate Change 82 11.1 Sea Level Rise............................................................................................................................................... 83 12. Hotspot Analysis 86 12.1 Hotspot 1: Parramatta Road to John Street 86 12.2 Hotspot 2: Constriction downstream of Rothwell Park.................................................................. 86 12.3 Hotspot 3: Central Drain upstream of Davidson Avenue 87 12.4 Hotspot 4: Davidson Avenue 87 12.5 Hotspot 5: Majors Bay Road and Brewer Street intersection 88 12.6 Hotspot 6: Saltwater Creek 88 13. Preliminary Mitigation Analysis 89 13.1 Removal of Saltwater Creek Structures at Massey Park 89 13.2 Removal of Massey Park Mounding..................................................................................................... 90 13.2.1 Massey Park Mounding Reconfiguration 90 13.3 Increased capacity of Saltwater Creek 91 14. Flood Damages Assessment 93 14.1 Overview........................................................................................................................................................ 93 14.2 Floor Level Estimation 93
14.3 Property Inundation 94
14.4 Residential Flood Damages 94
15. Conclusion 95
16. References 96
APPENDIX A 98
APPENDIX B......................................................................................................................................................... 105
FIGURES 106
List of Figures
Figure 1: Exile Bay Study Area 16
Figure 2: Exile Bay LiDAR Data 24
Figure 3: Exile Bay Ground Level Survey 25
Figure 4: Available Daily and Pluviometer Gauges 28
Figure 5: Greenlees Park Bowling Club (566064) station, Magnitude of Historic Events against ARR2016 IFD Estimates 30
Figure 6: Homebush SP0041 (566022) station, Magnitude of Historic Events against ARR2016 IFD estimates 31
Figure 7: Greenlees Park Bowling Club, Concord (566064) station, ARR16 IFD Comparison 34
Figure 8: Homebush SP0041 (566022) station, ARR16 IFD Comparison 34
Figure 9: Community Consultation Response Locations ................................................................................. 36
Figure 10: Community Consultation flood observations...................................................................................37
Figure 11: Community Consultation Summary of Responses 38
Figure 12: Sub catchment Delineation 43
Figure 13: Exile Bay Land Use Map..........................................................................................................................44
Figure 14: Exile Bay Model Schematisation 49
Figure 15: Exile Bay Hydraulic Model Roughness 50
Figure 16: Exile Bay Sub surface Drainage Network 51
Figure 17: November 2018 Flood Event, Peak Flood Depths 59
Figure 18: October 2018 Flood Event, Peak Flood Depths 62
Figure 19: 1% AEP (ARR1987) Peak flood depths and Unit Flow Rate sample areas 65
Figure 20: Peak Flood Depths 1 EY Design Event 107
Figure 21: Peak Flood Depths 20% AEP Design Event 107
Figure 22: Peak Flood Depths 10% AEP Design Event..................................................................................107
Figure 23: Peak Flood Depths 5% AEP Design Event 107
Figure 24: Peak Flood Depths 2% AEP Design Event 107
Figure 25: Peak Flood Depths 1% AEP Design Event 107
Figure 26: Peak Flood Depths 0.5% AEP Design Event................................................................................107
Figure 27: Peak Flood Depths 0.2% AEP Design Event 107
Figure 28: Peak Flood Depths PMF Design Event 107
Figure 29: Flood Hazard 5% AEP Design Event 107
Exile Bay Catchment Flood Study
9
Final Report
Figure 30: Flood Hazard 1% AEP Design Event 107
Figure 31: Flood Hazard 0.2% AEP Design Event 107
Figure 32: Flood Hazard PMF Design Event....................................................................................................107
Figure 33: Flood Function 5% AEP Design Event 107
Figure 34: Flood Function 1% AEP Design Event 107
Figure 35: Flood Function 0.2% AEP Design Event 107
Figure 36: Flood Function PMF Design Event..................................................................................................107
Figure 37: 107
Figure 38: Emergency Response Classifications 107
Figure 39: Hotspot 1 Parramatta Road to John Street 107
Figure 40: Hotspot 2 Constriction downstream of Rothwell Park 107
Figure 41: Hotspot 3 Central Drain upstream of Davidson Avenue 107
Figure 42: Hotspot 4 Davidson Avenue 107
Figure 43: Hotspot 5 Majors Bay Road and Brewer Street intersection 107
Figure 44: Hotspot 6 Saltwater Creek 107
Figure 45: Preliminary Mitigation Analysis 10% AEP & 1% AEP Event Flood Impacts Removal of Saltwater Creek Structures 107
Figure 46: Preliminary Mitigation Analysis 10% AEP Event Flood Impact Removal of Massey Park Mounding 107
Figure 47: Preliminary Mitigation Analysis 1% AEP Event Flood Impact Removal of Massey Park Mounding 107
Figure 48: Preliminary Mitigation Analysis 1% AEP Event Flood Impact Removal of Massey Park Mound 1 107
Figure 49: Preliminary Mitigation Analysis 1% AEP Event Flood Impacts Removal of Massey Park Mound 2 107
Figure 50: Preliminary Mitigation Analysis 1% AEP Event 50% Increased Capacity of Saltwater Creek 108
Figure 51: Preliminary Mitigation Analysis 1% AEP Event 100% Increased Capacity of Saltwater Creek 108
Figure 52: Flood Damages Event Inundation Above Ground level 108
Figure 53: Flood Damages Event Inundation Above Floor level 108
List of Images
Image 1: The floodplain risk management process in New South Wales (FDM, 2005) 5
Image 2: Flood Mechanisms affecting Exile Bay 15
Image 3: McCarthy Lane, Observed Flood Behaviour 53
Image 4: McCarthy Lane, Modelled Flood Behaviour 53
Image 5: Brewer Street and Majors Bay Road, Observed Flood Behaviour 54
Image 6: Brewer Street and Majors Bay Road, Modelled Flood Behaviour 54
Image 7: Davidson Avenue and Majors Bay Road, Observed Flood Behaviour 55
Image 8: Davidson Avenue and Majors Bay Road, Modelled Flood Behaviour 55
Image 9: Davidson Avenue, Observed Flood Behaviour 56
Image 10: Davidson Avenue, Modelled Flood Behaviour................................................................................ 56
Exile Bay Catchment Flood Study Final Report
10
Image 11: Jones Street, Observed Flood Behaviour 57
Image 12: Jones Street, Modelled Flood Behaviour 57
Image 13: Rothwell Park, Observed Flood Behaviour ....................................................................................... 58
Image 14: Rothwell Park, Modelled Flood Behaviour 58
Image 15: Curtin Place, Observed Flood Behaviour 60
Image 16: Curtin Place, Modelled Flood Behaviour 60
Image 17: Davidson Avenue, Modelled Flood Behaviour.................................................................................61
Image 18: Davidson Avenue, Flood Cross Section 61
List of Tables
Table 1: Guidelines and reference documents 17
Table 2: Rainfall Gauges used in the study............................................................................................................27
Table 3: Historic Rainfall Events 29
Table 4: Design Rainfall Depths 32
Table 5: PMP Rainfall Depths 32
Table 6: Applied Impervious Percentages ............................................................................................................40
Table 7: ARR2016 Design Pre burst Depths (mm) 41
Table 8: ARR2016 Design Losses 41
Table 9: Adopted Hydrologic Model Calibration Loss Parameters 42
Table 10: Design Event Rainfall and Downstream Conditions........................................................................46
Table 11: Adopted Manning’s Values 47
Table 12: Blockage of Saltwater Creek Structures 48
Table 13: Validation of 1% AEP Event Unit Flow Rates 63
Table 14: Design events and durations assessed................................................................................................ 66
Table 15: Selected Critical Durations and Storms 67
Table 16: Peak Flood Depths at key locations (shown in Figure 20 to Figure 28) 68
Table 17: Peak Flood Levels at key locations (shown in Figure 20 to Figure 28) 69
Table 18: Peak Overland Flows at key locations (shown in Figure 20 to Figure 28) ...............................71
Table 19: Flood Hazard Vulnerability Thresholds 73
Table 20: Flood Emergency Response Classifications (Reference 1) 76
Table 21: Structure Blockage Sensitivity 78
Table 22: Hydraulic Roughness Sensitivity 80
Table 23: Climate Change Factors Percentage Increase in Rainfall Intensity in 2090 82
Table 24: Comparison between Design Rainfall Depths and Projected Climate Change Rainfall Depths 82
Table 25 Climate Change Sensitivity: 82
Table 26: Adopted 2100 Sea Level Rise Tailwater Conditions........................................................................84
Table 27: Sea Level Rise Sensitivity 84
Table 28: Exile Bay Property Affectation 94
Table 29: Exile Bay Flood Damages ........................................................................................................................94
Table 30: ARR 2016 Preferred Terminology (Reference 2) .............................................................................104
Exile Bay Catchment Flood Study
11
Final Report
1.INTRODUCTION
1.1 Study Overview
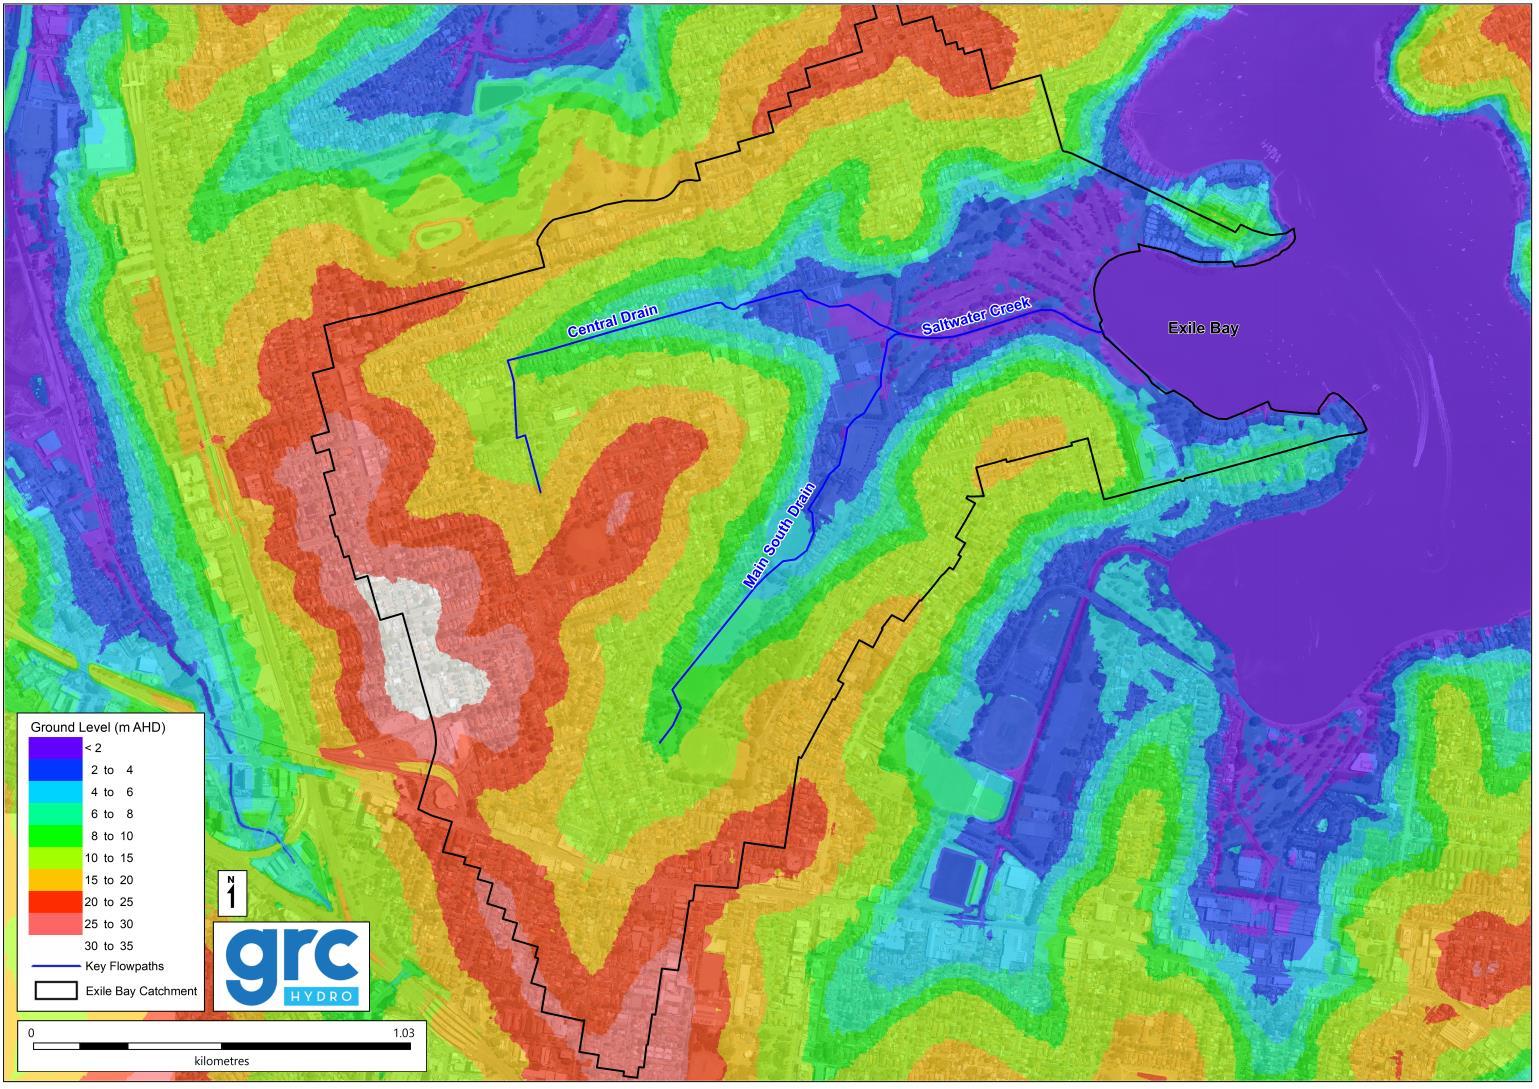
The Exile Bay catchment covers a 345 hectare area with elevations that range from approximately 33 m AHD to sea level at the Saltwater Creek channel and then discharges into Exile Bay proper. There are approximately 3700 cadastral lots within the catchment and as demonstrated in the recent flood event of 28 November 2018, heavy rainfall can cause flooding in the area, impacting both homes and commercial premises.
A key output of the study is a field checked set of “tagged” properties (i.e. lots within the FPA and subject to flood related development controls (see Section 9.6)). To achieve this output a calibrated best practise model is applied to the task of defining the 1% AEP event levels and flows. The purpose of this report is to inform stakeholders, especially Council, of the work completed to date, the history of flooding in the catchment and recommend to provide a basis for further work under the Floodplain Risk Management Program.
1.2 The Floodplain Risk Management Program
City of Canada Bay (Council) has, with the financial support of the NSW Government via the Floodplain Risk Management Program, commissioned GRC Hydro to undertake a Flood Study for the Exile Bay Catchment (the study area).
This study comprises stages 1 to 2 in the five stage process outlined in the NSW Government’s Floodplain Development Manual (FDM, 2005) (Reference 17). These works include:
1. Data collection collection of all applicable data to be used for the ensuing stages of the studies;
2. Flood Study a comprehensive technical investigation of flood behaviour that provides the main technical foundation for the development of a robust floodplain risk management plan;
3. Floodplain Risk Management Study (FRMS) assess the impacts of floods on the existing and future community and allows the identification of management measures to treat flood risk;
4. Floodplain Risk Management Plan (FRMP) outlines a range of measures, for future implementation, to manage existing, future and residual flood risk effectively and efficiently; and
5. Plan Implementation once the management plan is adopted, an implementation strategy (devised in Stage 4) is followed to stage components dependent on funding availability.
Following the completion of the FRMP, the final stage of the FDM (2005) floodplain management process will involve implementing the findings of the FRMP. Further details of each of these FDM (2005) stages are outlined below.
Data Collection (Included in Current Study)
The collection and collation of data necessary for the completion of the flood and floodplain risk management studies is a fundamental part of the floodplain management process. It is typically begun at the outset of the study, but generally continues throughout the period of the project as
12 Exile
Draft Flood Study Report
Bay Catchment Flood Study
data becomes available, through community involvement. The quality and quantity of available data is key to the success of a flood study and FRMS.
Flood Study (Included in Current Study)
A flood study is a comprehensive technical investigation of flood behaviour that provides the main technical foundation for the development of a robust floodplain risk management plan. It aims to provide an understanding of flood behaviour and consequences for a range for flood events. Consideration of the local flood history, flood data is used to assist in the development of hydrologic and hydraulic models which are calibrated and verified to improve confidence in model results.
Floodplain Risk Management Study (Part of a Future Study)
A floodplain risk management study increases understanding of the impacts of floods on the existing and future community. It also allows testing and investigating practical, feasible and economic management measures to treat existing, future and residual risk. The floodplain risk management study will provide a basis for informing the development of a floodplain risk management plan.
Floodplain Risk Management Plan (Part of a Future Study)
The floodplain risk management plan outlines a series of prioritised measures to address flood risk. The FRMP is built using the findings of a floodplain risk management study, to outline a range of measures to manage existing, future and residual flood risk effectively and efficiently.
1.3 Objectives
The objectiveof this studyis to define design flood affectation in the study area,and hence accurately inform future flood risk management. Specifically, the study will also provide a sound technical basis for any further flood risk management investigation.
1.4 Company Contact
13 Exile
Study Report
Bay Catchment Flood Study Draft Flood
Please refer any comments of queries in relation to this report to the contact below.
Name: Beth Marson Brian Woolley Position: Senior Engineer, GRC Hydro Drainage, Marine & Floodplain Engineer Telephone: 02 9030 0342 02 9911 6339 Email: exilebay@grchydro.com.au Brian.Woolley@canadabay.nsw.gov.au
2. BACKGROUND
2.1 Study Area
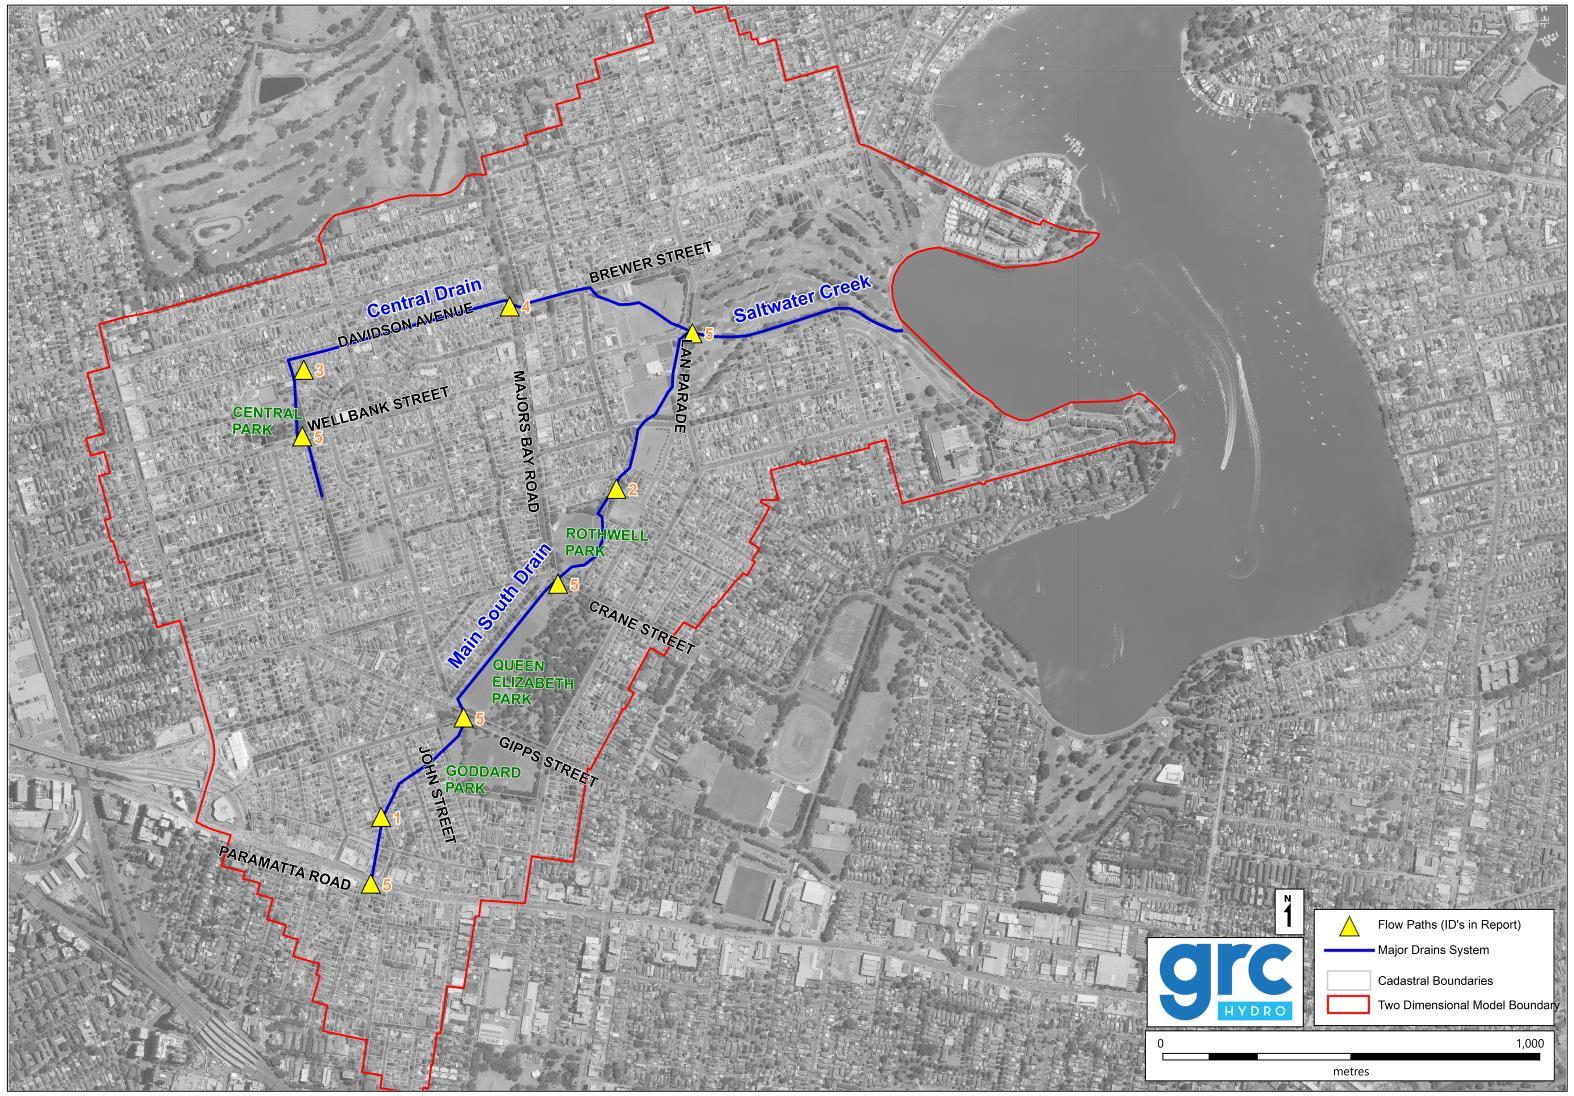
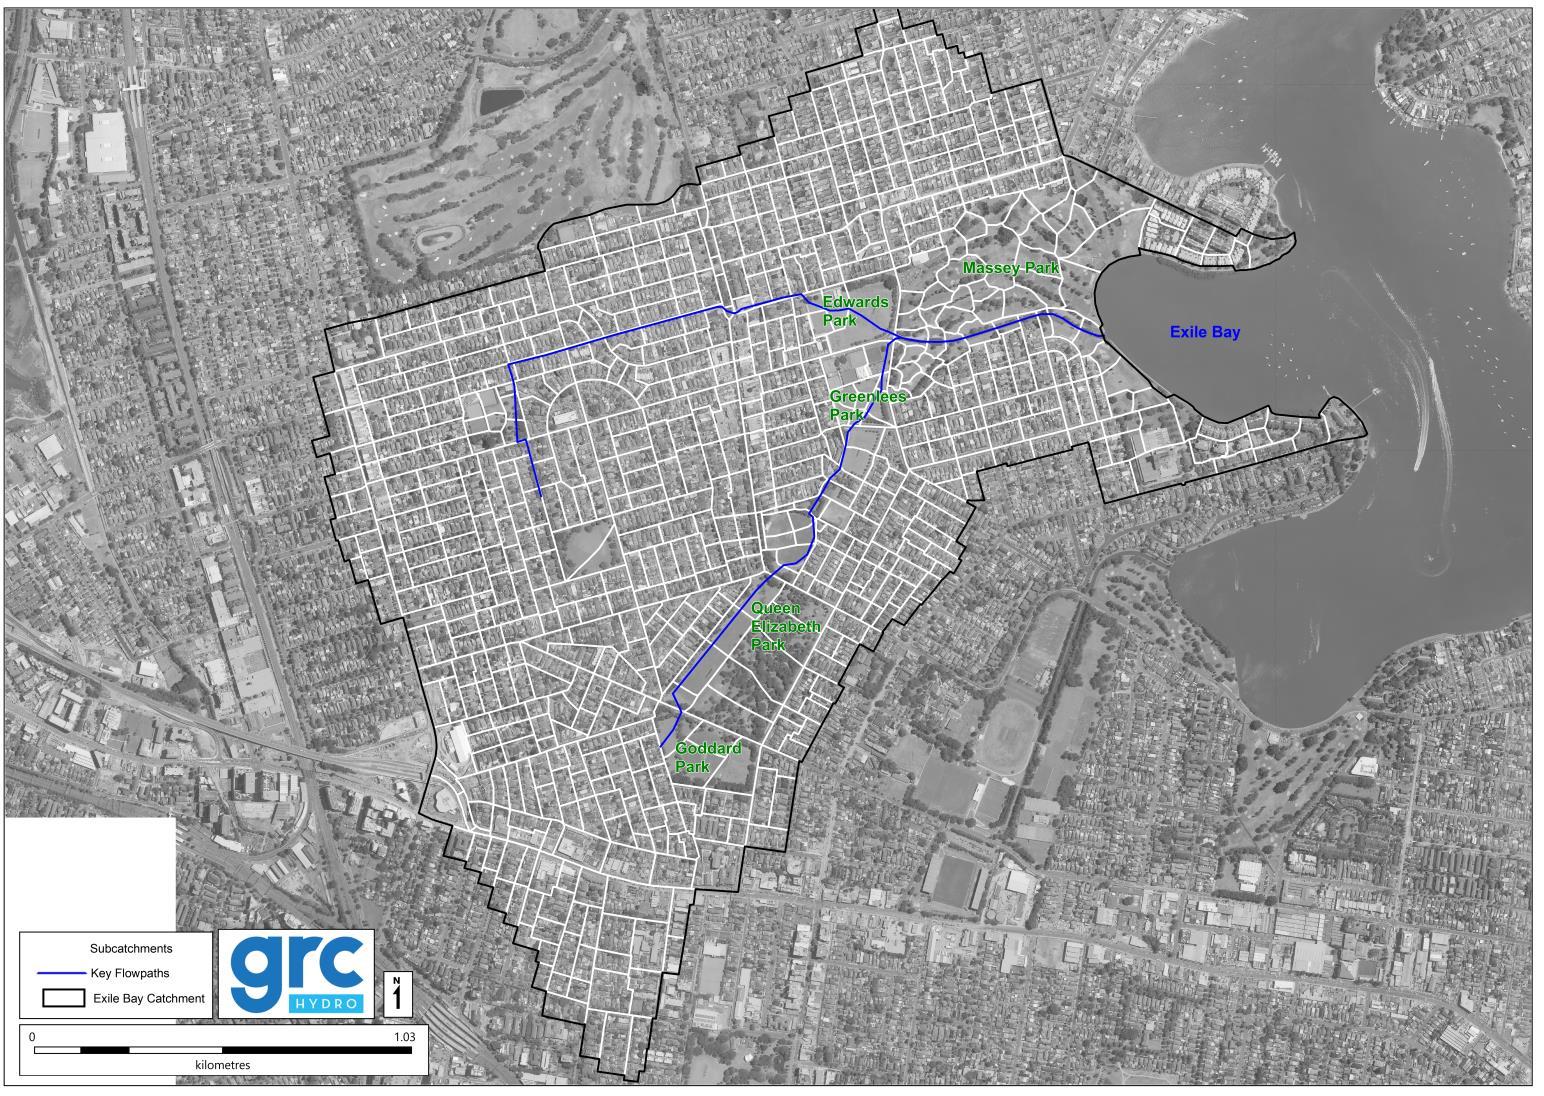
The Exile Bay catchment (the study area) is situated within the suburb of Concord in Sydney’s inner west. Concord has a population of 14,533 (2016 census) with a large proportion of this population living within the study area. The Exile Bay catchment is comprised of a 345 hectare area with the upper reaches of the catchment (upstream of Paramatta Road) situated within Burwood Council. Exile Bay is traversed by two key overland flow paths, the Central Drain and Main South Drain1 (shown in Figure 1). These flowpaths meet near the intersection of Wellbank Street and Ian Parade and form Saltwater Creek. Flow then moves downstream into Exile Bay via a trapezoidal channel, adjacent to the Massey Park Golf Club. Historically, Saltwater Creek extended along the Main South Drain to Crane Street, approximately. The catchment overall is a mixture of relatively steep upper areas and relatively flat, if not pan flat, downstream areas. The study area and its key features are shown in Figure 1
The study area is primarily comprised of residential properties with large areas of parks and reserves. As redevelopment and refurbishment of property occurs overtime, an opportunity exists to enhance flood risk outcomes for affected properties/residents and for the community more generally by having developers conform to specific flood related development controls.
2.2 Exile Bay Flood Mechanisms
Two key flood mechanisms occur in the Exile Bay catchment; overland flow flooding and mainstream flooding.
Overland flow flooding occurs when excess rainfall runoff is generated from impervious surfaces and flows toward a watercourse. This type of flooding is often referred to as “stormwater” flooding or “flash flooding” due to short warning times Typically this type of flooding rises and recedes over a short period of time and the floodwaters are usually relatively shallow and fast moving. Image 2 (page 15) (left hand side) depicts this mechanism.
Overland flow flooding occurs in the study area along the Central Drain and Main South Drain shown in Figure 1. These drains have catchment areas of approximately 134 hectares and 147 hectares respectively Flooding from overland flow has historically been known to occur at the following locations:
1. Between Paramatta Road and John Street;
2. At the constriction downstream of Rothwell Park;
3. Downstream of Central Park;
4. Near the intersections of Majors Bay Road with Davidson Avenue and Brewer Street; and
5. Low points in Paramatta Road, Gipps Street, Crane Street, Ian Parade, Majors Bay Road and Wellbank Street.
1 For consistency, this study adopts the foregoing nomenclature from Reference 16
14
Draft
Study Report
Exile Bay Catchment Flood Study
Flood
The locations of these flow paths are displayed in Figure 1
Mainstream flooding occurs from rising water on a defined watercourse causing the watercourse to break its banks and inundate areas that are usually dry. This mechanism typically occurs over a long period of time and generally results in deep, slow moving floodwaters Image 2 (right hand side) depicts this mechanism.
Mainstream flooding occurs in Exile Bay along the trapezoidal channel known as Saltwater Creek (shown in Figure 1). Historically flooding has occurred along this watercourse from high astronomical tides and was potentially exacerbated between the 1960s and 1990s from the implementation of a weir structure across the channel outlet which was used to retain water for irrigation of the Massey Park Golf Course.

Image 2: Flood Mechanisms affecting Exile Bay
Oveland Flow Flooding Mainstream Flooding
Exile Bay Catchment Flood Study Draft Flood

15
Report
Study
Figure 1: Exile Bay Study Area
16
Report
Exile Bay Catchment Flood Study Draft Flood Study
2.3 Policies, Legislation and Guidance
2.3.1 Implemented Guidelines and References
Table 1 presents the guidelines, manuals and technical reference documents used for this study. These documents detail best practice in regard to management of flood risk. They cover both best practice regarding the technical assessment of flood behaviour and flood risk, and, more generally, who has responsibility for managing flood risk and how this management is best achieved.
Table 1: Guidelines and reference documents
Reference Topic
Australian Emergency Management (AEM) Handbook Series, Managing the floodplain: A guide to best practice in flood risk management in Australia AEM Handbook 7
Best practice
AEM Handbook 7, Technical flood risk management guideline Flood Hazard Flood hazard
AEM Handbook 7, Technical flood risk management guideline Flood Emergency Response Classification Emergency response
AEM Handbook 7, Technical flood risk management guideline Flood risk information to support land use planning Land use
AEM Handbook 7, Technical flood risk management guideline Assessing options and service levels for treating existing risk
AEM Handbook 6, National Strategy for Disaster Resilience community engagement framework
Australian Rainfall & Runoff 2016
Mitigation options and service levels
Community engagement
Best practice
Section 733 of the Local Government Act, 1993 Flood prone land policy
NSW Government’s Floodplain Development Manual (2005) Flood prone land policy and industry practice
SES requirements from floodplain risk management process SES requirements
Practical consideration of climate change Climate change
Coincidence of Coastal Inundation and Catchment Flooding Coincidence
2.3.2 Review of Council Planning Policy
Local Environmental Plan Review
A Local Environmental Plan (LEP) is a statutory document developed to guide planning decisions for local government areas. LEP’s are primarily used as planning tool to aid the future of communities and to direct development in the study area
The City of Canada Bay LEP was adopted in 2013. Section 6.8 Flood Planning, addresses development on properties within the Flood Planning Area (FPA). The current study can be used in the development of a FPA for Exile Bay which will aid the application of these controls
17 Exile Bay
Study Draft Flood Study Report
Catchment Flood
Development Control Plan Review
A Development Control Plan (DCP) is a non statutory document which supports the planning controls in the LEP by providing detailed planning and design guidelines.
The City of Canada Bay DCP was adopted by Council in February 2017. Section C7 Flooding Control uses a Flood Planning Matrix to outline the relevant Planning and Development Controls within the study area. This approach uses the land use and the level of flood risk at the site to determine the applicable Flood Planning Controls.
The outcomes of the current study can be used to determine the level of flood risk for properties within the Exile Bay catchment
18 Exile Bay
Study Draft Flood Study Report
Catchment Flood
3. AVAILABLE DATA
3.1 Overview
A thorough review of available data has been undertaken for the Exile Bay catchment for the following key reasons:
• To obtain an understanding of how flooding has historically occurred in the study area; and
• To gather as much information as possible to aid the development of modelling tools
This process has involved examination of Council records, obtaining data to aid the hydrologic and hydraulic model development, reviewing previous flood related studies, procurement of historic rainfall records and engaging with the local community.
The following sections will provide detail on this process.
3.2 Previous Studies
There have been a range of relevant studies as listed and summarised below. These studies will aid the current flood study The following sections summarises the related studies and the data used for the current study.
3.2.1 Exile Bay, St Lukes and William Street Flood Study (WMAwater, 2017) (Reference 4)
The Exile Bay, St Lukes and William Street Flood Study was prepared by WMAwater in 2017 for Burwood Council. This study defined the existing flood behaviour for the Burwood LGA catchments which flow into the City of Canada Bay LGA (with Parramatta Road as the boundary between Burwood and Canada Bay LGA’s). This study used a DRAINS/TUFLOW hydrologic and hydraulic modelling system to define flood affection for a full range of flood event probabilities in the Exile Bay catchment upstream of Parramatta Road.
The pit and pipe delineation presented in this study within the Burwood LGA has been used for the current study. Furthermore, the results from this study will be used in the current study for validation of the flood model.
3.2.2
WestConnex Technical Report Flood Mitigation Strategy (AECOM Hyder Joint Venture, 2016) (Reference 20)
A flood investigation was undertaken as a part of the WestConnex M4 East Project to determine the flood impacts associated with the project for the 1% AEP and PMF events.
The WestConnex project is located at the upstream boundary of the current study area (at the intersection of Parramatta Road and Concord Road). As such, the current study has not incorporated the minor drainage features and on site detention which were built for the WestConnex project as they will not affect the property flood affectation downstream of the project. Major trunk drainage elements through the WestConnex project have been included in the current study.
19
Draft
Study Report
Exile Bay Catchment Flood Study
Flood
3.2.3
Parramatta River Estuary Foreshore Management (Royal Haskoning DHV, 2013) (Reference 8)
The Paramatta River Estuary Foreshore Management study was undertaken by Royal Haskoning DHV in 2013 and investigated actions for the repair and restoration of deteriorated and failed seawalls of the City of Canada Bay.
3.2.4 Beaconsfield Depot – Flooding Issues on Existing Properties (J. Wyndam Prince, 2012) (Reference 5)
The flood study undertaken in (Reference 9) highlighted to Council that there were several flood affected properties adjacent to the Beaconsfield Depot. Based on this analysis, a secondary study was commissioned to investigate measures to relieve the flood affectation at these properties. This study updated the hydrologic/hydraulic modelling system developed in Reference 9 using additional survey information. The study recommended an improved downstream piped system, the construction of an open concrete channel between Rothwell Park and Jessie Stewart Reserve the construction of a small retaining wall to minimise over floor flooding at five residential dwellings.
3.2.5 Proposed Re Development of Beaconsfield Depot, Concord (Stage 2 – Flood Study Report) (J. Wyndam Prince, 2011) (Reference 9)
A flood study was commissioned by Council in 2011 to assess the optimum development yield for the Council owned Beaconsfield Depot located on Beaconsfield Lane, Concord. This site is located adjacent to the Main South Drain and, as such, analysis of flooding is an important part of determining the development potential. This study used a hydrologic (XP RAFTS) and hydraulic (HEC RAS) modelling system to assess several development options to maximise the development footprint and minimise potential adverse impacts on neighbouring properties. This study recommended two filling options for the depot site.
3.2.6 Intersection of Brewer Street and Majors Bay Road – Overland Flood Investigation (Taylor Thomson Whitting, 2010) (Reference 7)
An overland flow investigation was undertaken by Taylor Thomson Whitting in 2010 at the intersection of Majors Bay Road and Brewer Street. This study used a hydrologic (DRAINS) and hydraulic (HEC RAS) modelling system to assess flood mitigation solutions at the intersection. Recommendations from the study included: moving the entrance location of a commercial property that is subject to frequent inundation; Council purchasing the flood affected property, and finally installing floodway signage to increase community awareness.
This study provides peak flow rates and flood levels for the 100 year ARI event. As with the other studies, metrics (if available and relevant), will be used to create context for revised results.
20
Report
Exile Bay Catchment Flood Study Draft Flood Study
3.2.7
Development of Concord Council’s Former Depot in Beaconsfield Avenue, Concord (Bankstown Civic Services Group, 2000) (Reference 10)
Hydrological and Hydraulic Services for Proposed
Bankstown Civic Services Group was engaged by Concord Council in 2000 to undertake an investigation into the flood levels and flood hazard for the 100 year ARI event at the Council Depot (Beaconsfield Avenue, Concord) for existing and proposed development conditions.
This study determined that the flood level and hazard impacts were beyond the desirable range for the proposed conditions however generally it was an improvement compared to the existing case.
The current study verified trunk structure sizes identified in this drainage investigation against the data provided by Council.
3.2.8 Overland Flow Investigation Brewer Street/Majors Bay Road Intersection (Gardiner Willis & Associates, 1998) (Reference 11)
An overland flow investigation was undertaken by Gardiner Willis & Associates in 1998 at the intersection of Majors Bay Road and Brewer Street. This study aimed to alleviate flood inundation at this intersection and flood affection for neighbouring commercial properties. This study used a hydrologic (XP RAFTS) and hydraulic (HEC2 RAS) modelling system to assess flood affection at this location. The investigation recommended the construction of bunding, increase in drainage capacity and the construction of hydraulically efficient pits outside the Concord Centre.
This study provides peak flow rates and flood levels at various locations As with the other studies, metrics (if available and relevant), will be used to create context for revised results.
3.2.9 Report on the Massey Park Gross Pollutant Trap (UTS Sydney, 1997) (Reference 12)
An investigation was undertaken into the construction of a Gross Pollutant Trap (GPT) along the Exile Bay Stormwater Channel by UTS Sydney 1997. This study reviewed all previous flood related studies and undertook community consultation regarding the installation of the GPT as there were concerns that it would exacerbate flooding. The investigation found using hydraulic (HEC RAS) modelling that no additional flooding would occur if the GPT is installed.
This study used channel cross sections to undertake 1D hydraulic modelling in HEC RAS. Council engaged a surveyor to undertake cross section survey of this channel in 2016 (see Section 3.3.2) and as such, the recent cross section survey will be used in preference to the cross sections from this study.
3.2.10 Main South Drain Investigation of Stormwater System Parramatta Road to John Street (Ledingham Hensby Oxley & Partners, 1992) (Reference 13)
An investigation into the drainage system, known as the Main South Drain (shown in Figure 1), between John Street and Paramatta Road was undertaken by Leginham Hensby Oxley & Partners in 1992. This study reviewed the capacity of the existing drainage system and developed strategies to improve the drainage system. The investigation recommended implementing floor level and
21 Exile
Draft
Study Report
Bay Catchment Flood Study
Flood
development controls for the flood affected properties, enhancing the 20 year ARI drainage capacity and facilitating an overland flow path for 100 year ARI overland flows.
The current study verified trunk structure sizes identified in this drainage investigation against the data provided by Council.
3.2.11 Sydney Storms November 1984 (Public Works, 1985) (Reference 17)
Between the 5th and 12th of November 1984, the Sydney metropolitan area was affected by a series of severe storms which caused widespread flooding and damage to public and private property. As such, Public Works undertook an analysis of these storms in 1985.
The report provides an excellent overview of the November 1984 event. Analysis of historical rainfall records (see Section 3.4.2) found that the nearby pluviometer gauges (Greenlees Park Bowling Club and Homebush SP0041) were not operational at the time. Due to the significant spatial variation of rainfall (determined in Section 3.4.2), use of pluviometer data from distant gauges would not be an accurate representation of rainfall in the study area.
3.2.12
Stormwater Drainage capacity assessment within the Municipality of Concord (E. S. Rowe & Ennis, 1973) (Reference 16)
A stormwater drainage capacity assessment was undertaken by E. S. Rowe & Ennis for the Department of Public works in 1973. This assessment reviewed the drainage system in the Exile Bay and Majors Bay catchments and recommended improvements where necessary. The report recommends that Council lower the level of the weir in the Exile Bay stormwater channel to the High Water Spring Tide level and install flood gates with the aim of ultimately removing the weir over ten years.
Since the time of this report, there have been significant changes in the catchment and also in standard hydrologic practices. As such, the study is of little utility.
3.2.13
History of Canals and Bridges (Various Councils and Public Works)
The history of Canals and Bridges included various documents pertaining to the study area. Some key elements include the approval for the construction of the Massey Park stormwater channel in March 1947 and the subsequent transfer of ownership from the Department of Public Works NSW to the Concord Municipal Council in 1947. These documents also included anecdotal evidence of flash flooding occurring in the study area in November 1972 with an approximate magnitude of 50 year ARI. It was noted that the weir within the stormwater channel at Massey Park may have exacerbated the flooding in this event.
3.3 Hydraulic Model Data
3.3.1 LiDAR Data
LiDAR data is used to define the topography of the study areas in the hydrologic and hydraulic models. In the hydrologic model, LiDAR data is used to delineate sub catchments. In the hydraulic models, ground points in the LiDAR set are sampled to form an elevation grid. The grid is one of the key model inputs and is used to simulate the flow of runoff from one grid cell to the next in the floodplain.
Exile Bay Catchment Flood Study Draft Flood Study
22
Report
LiDAR data was obtained from the NSW Government Spatial Services and used in the current study. Metadata indicates the LiDAR survey was undertaken in 2013. The data is best practice with an accuracy of ± 0.15 m (1st confidence interval) in the vertical direction and ± 0.4 m (1st confidence interval) in the horizontal direction. The 1 m LiDAR raster product is produced using a Triangular Irregular Network (TIN) method of averaging ground heights to formulate a surface which can then be sampled to generate a regular grid.
LiDAR data used in the current study is shown in Figure 2
3.3.2 Ground Level and Bathymetric Survey
Ground level survey was undertaken at a number of locations throughout the catchment including the intersection of Majors Bay Road and Davidson Avenue in 2008 and Brewer Street and Spring Street in 2018. Historically, these locations have been subject to frequent inundation from overland flows. This survey was used to incorporate key hydraulic features such as the kerb, gutter median strip and roundabout. This survey is incorporated into the current study using breaklines which denote hydraulic controls
The intersection of Favelle Street and Davidson Avenue underwent some resurfacing works in 2015 and as such, this data has been incorporated into the hydraulic model for the current study.
In 2016, Council commissioned detailed ground level survey of Massey Park Golf Course, Edwards Park, Greenlees Park and Jessie Stewart Reserve. Council have identified topographical changes in this area subsequent to the LiDAR capture in 2013 and as such, this data has been incorporated into the hydraulic model as a ground level surface.
As a part of the 2016 survey, the Saltwater Creek channel bathymetry was also surveyed at regular intervals (approximately 8 m) from Ian Parade to the creek outlet into Exile Bay. Since LiDAR data cannot penetrate water, this survey information is key to representing the Saltwater Creek channel shape. These cross sections have been incorporated into the hydraulic model (see Section 7.5).
The ground level survey data in the current study is shown in Figure 3
23 Exile Bay
Draft
Study Report
Catchment Flood Study
Flood
24
Report
Exile Bay Catchment Flood Study Draft Flood Study
Figure 2: Exile Bay LiDAR Data
Figure 3: Exile Bay Ground Level Survey

25
Report
Exile Bay Catchment Flood Study Draft Flood
Study
3.3.3
Drainage Network Data
Drainage network data is a critical hydraulic model input. Stormwater elements, inclusive of conduit size and invert levels, are input into the TUFLOW hydraulic model. During the model simulation, these structures are used to convey flow, with excess flow moving overland. Most drainage assets in the study area are owned and maintained by Council.
Council has supplied GRC Hydro with a GIS layer of the drainage network inclusive of structure dimensions and depth to invert (where available). Where the depth to invert was not available, invert levels were interpolated from known upstream and downstream inverts or, where interpolation was not possible, estimated based on an offset from the LiDAR (0.4 m specified by Council) Where dimensions are unavailable and the upstream and downstream structure sizes are known, structure sizes were interpolated
The drainage network is shown in Figure 16 (page 51).
3.4 Hydrologic Data
3.4.1 Recorded Rainfall Data
Recorded data was collected to define historical flood events in the study area and for use in calibration and validation of the hydrologic/hydraulic models. In general, the complete rainfall record of rainfall gauges in the vicinity of the study area was collected, and from this individual rainfall events were extracted. It is noteworthy that this data collection has included comprehensive Sydney Water gauge data.
Gauges included both pluviometers and daily read rainfall. Pluviometer gauges continuously record rainfall in small time increments (generally 5 minute intervals or less). This data forms rainfall hyetographs which show the pattern of a rainfall event over time. Daily read rainfall gauges provide a total recorded rainfall depth over a 24 hour period. Typically, daily read gauges are more common They inform the spatial variation of a rainfall event albeit without temporal distribution so are of limited use in this study
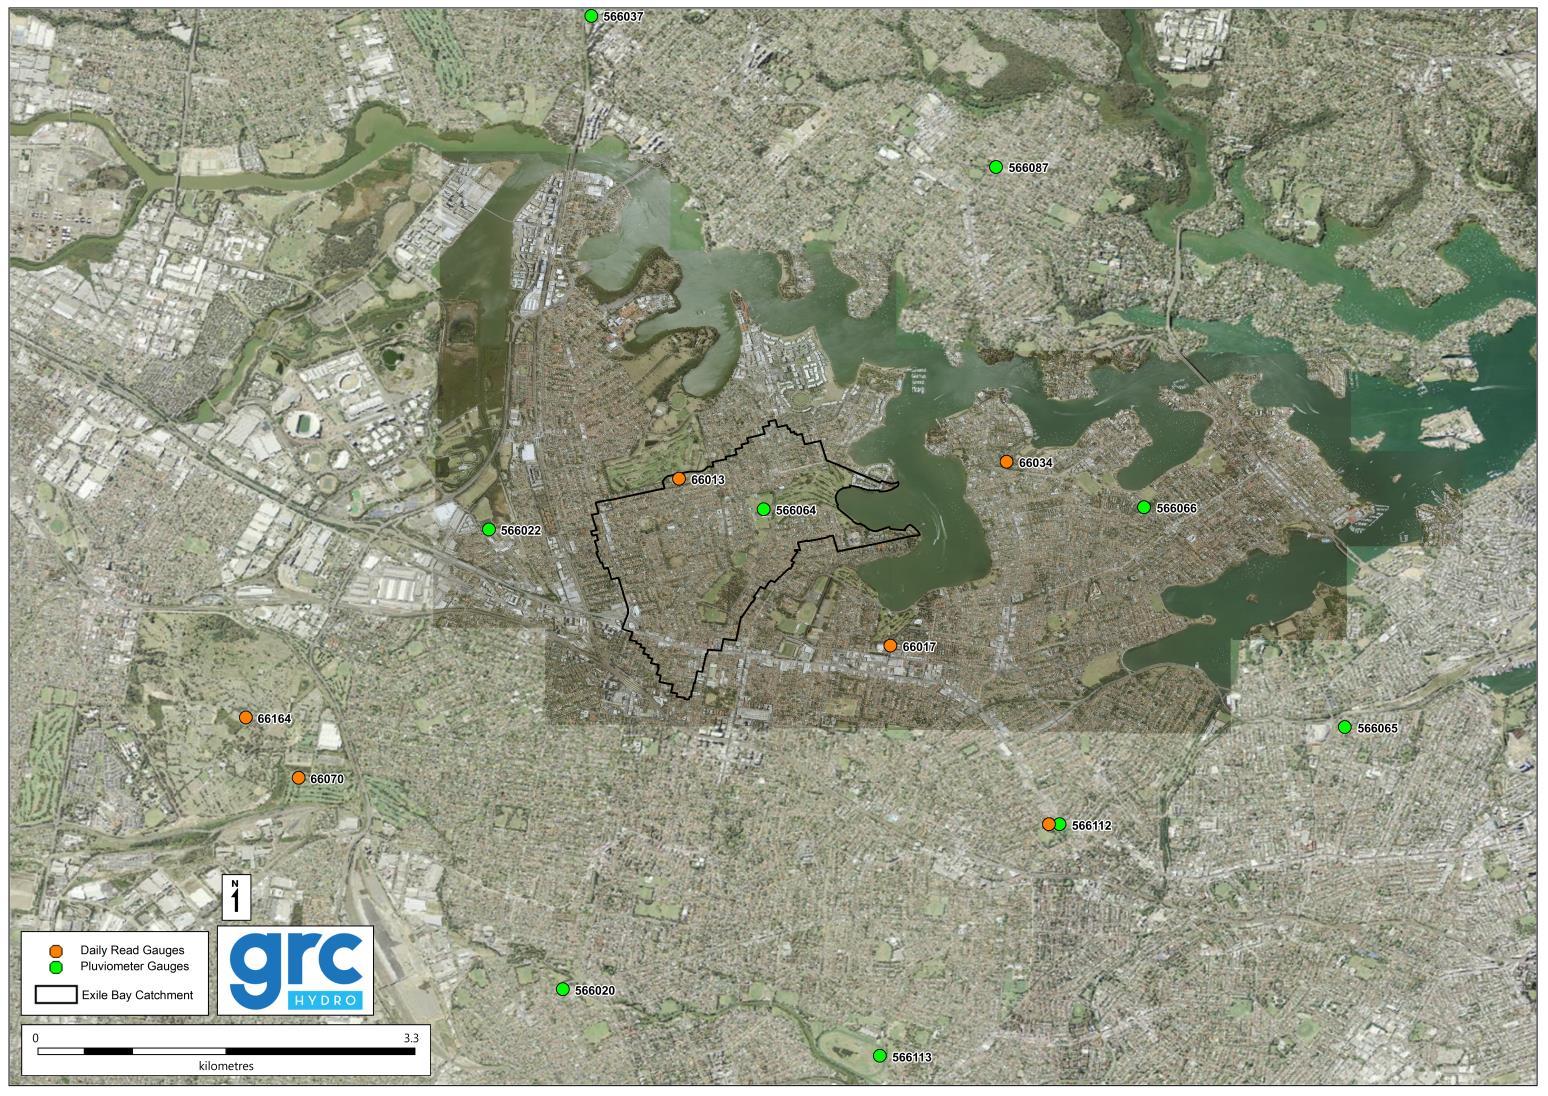
Data was available from the Bureau of Meteorology and Sydney Water. Table 2 lists the gauges for which data was obtained, and Figure 4 shows their locations.
26 Exile Bay Catchment Flood Study Draft Flood Study Report
Table 2: Rainfall Gauges used in the study
Station No. Station Name Type
Record Start Record End
Distance to Study Area (km) Source
566064
Greenlees Park Bowling Club
Pluvio 1988 Present 0 Sydney Water 66013
Concord Golf Club Daily 1930 Present 0 BOM 566022
Homebush SP0041 Pluvio 1969 Present 1 Sydney Water 66017 Barnwell Park Golf Course Daily 1929 2003 1 BOM 66034
Abbotsford (Blackwall Point Rd) Daily 2004 Present 2 BOM 566066
Five Dock SP0065 Pluvio 1989 Present 3 Sydney Water 566087
Gladesville Bowling Club Pluvio 1991 Present 3 Sydney Water 66070
Strathfield Golf Club Daily 1997 Present 4 BOM 566020 Enfield (composite site) Pluvio 1983 Present 4 Sydney Water 66164 Rookwood (Hawthorne Ave) Daily 1973 1985 4 BOM 566112
Ashfield (Ashfield Park Bowling Club) Pluvio 1993 Present 4 Sydney Water 66000 Ashfield Bowling Club Daily 1896 Present 4 BOM 566113 Canterbury Racecourse Pluvio 1993 Present 5 Sydney Water 566065 Lilyfield Bowling Club Pluvio 1989 Present 5 Sydney Water 566037 Ryde Pumping Station Pluvio 1948 Present 5 Sydney Water
27 Exile Bay Catchment Flood Study Draft Flood Study Report
28
Report
Exile Bay Catchment Flood Study Draft Flood Study
Figure 4: Available Daily and Pluviometer Gauges
3.4.2
Historic Rainfall Events
Recorded rainfall data is used to derive rainfall depths across the study area for key historical events. Events were chosen through analysis of available rainfall data, with more recent events favoured for the better data coverage, and the increased likelihood of flood information being available from Council or the community.
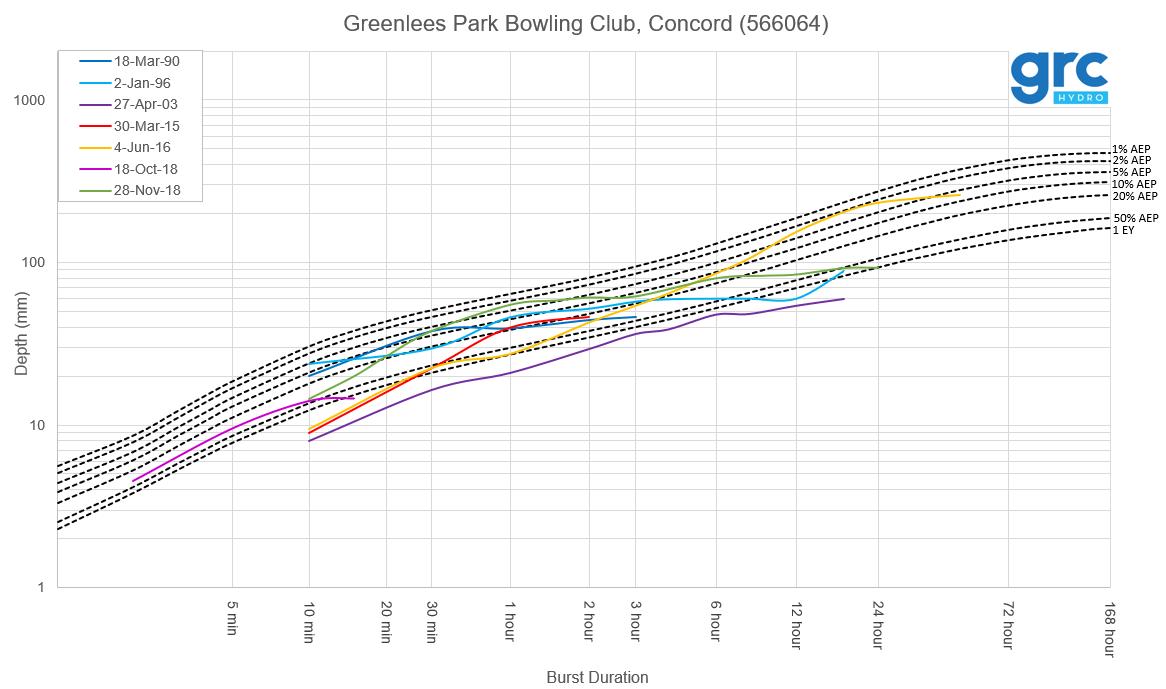
Pluviometer gauges were selected for rainfall analysis based on their proximity to the study area, their record period As such, the Greenlees Park Bowling Club (566064), Homebush SP0041 (566022) and Ryde Pumping Station (566037) were selected for analysis. Rainfall events at these gauges were compared to the Australian Rainfall and Runoff (ARR) 2016 Intensity Frequency Duration (IFD) data in order to estimate the probability of each event. Table 3 presents the significant rainfall events that have occurred during these gauge’s record period and their approximate magnitude (across a range of durations).
28 November 2018 >5% 5% 2% <1 EY1 18 October 2018 >50% >20% <1 EY1 <1 EY1
4 June 2016 2% 2% >10% 5% 30 March 2015 20% >1% <1 EY1 <1 EY1 27 April 2003 <1 EY1 1% 2% 50% 2 January 1996 10% 2% <1 EY1 >1% 18 March 1990 <1 EY1 2 2% >50%
5 December 1989 20% 2 >1% <1 EY1 30 April 1988 2 2 >1% >1% 4 August 1986 2 2 >1% >1%
1 EY Events per year. 1 EY is the equivalent to a 1 year ARI event.
2 Gauge was not operating during event
The event magnitudes presented in Table 3 indicate that there is significant spatial variation between events at each of the gauges. For example, for the November 2018 event, the Greenlees Park Bowling Club gauge recorded a peak rainfall depth of greater than a 5% AEP event whereas at Enfield (Composite site), approximately 5 km away, recorded rainfall of less than 1 EY in magnitude. Due to this spatial variation, it was determined that the gauges within the catchment or nearby would provide the most accurate representation of rainfall within Exile Bay.
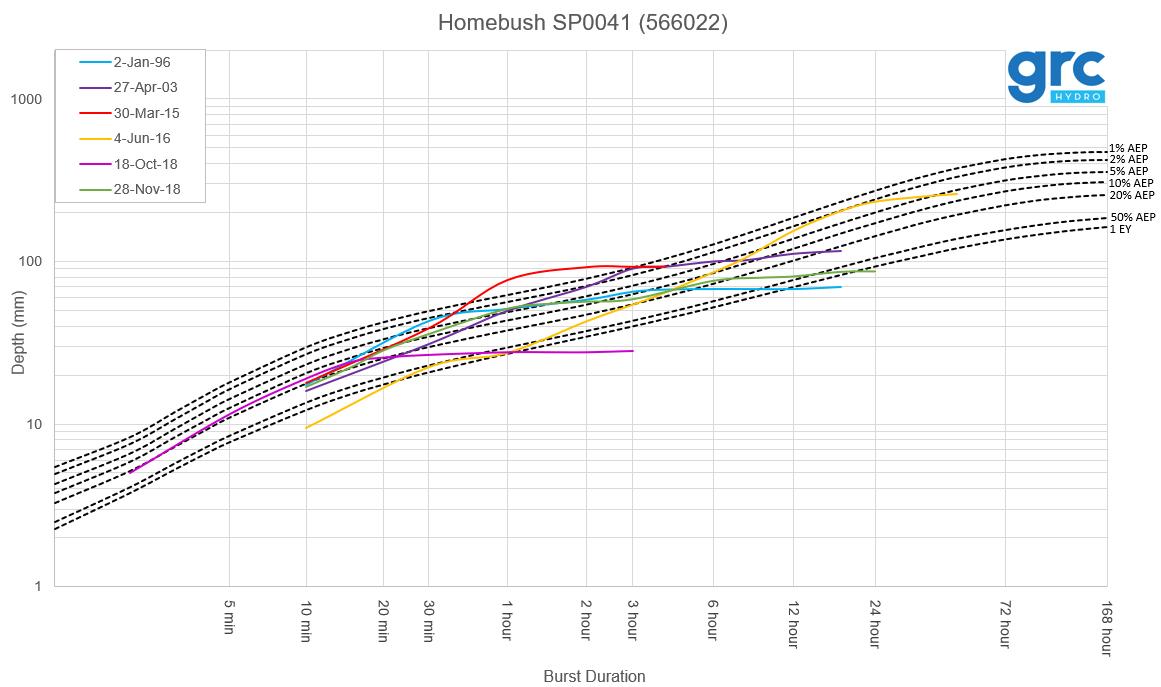
Both the November 2018 and June 2016 events were found to be consistently large at the two gauges closest to the study area (Greenlees Park Bowling Club and Homebush SP0041). Furthermore, the November and October 2018 events were the most reported event by residents during the community consultation.
Figure 5 to Figure 6 present the comparison of the rarest events to the ARR2016 IFD for the two closest gauges to Exile Bay (Greenlees Park Bowling Club and Homebush SP0041).
29 Exile Bay
Draft
Study Report
Catchment Flood Study
Flood
Historic
Event Date Approximate Annual Exceedance Probability (AEP) Greenlees Park Bowling Club (566064) Homebush SP0041 (566022) Ryde Pumping Station (566037) Enfield (Composite site) (566020)
Table 3:
Rainfall Events
30
Draft
Study Report
Exile
Bay Catchment Flood Study
Flood
Figure 5: Greenlees Park Bowling Club (566064) station, Magnitude of Historic Events against ARR2016 IFD Estimates
31
Draft Flood Study Report
Exile Bay Catchment Flood Study
Figure 6: Homebush SP0041 (566022) station, Magnitude of Historic Events against ARR2016 IFD estimates
3.4.3
Design Rainfall
Design rainfall data is used to model design flood events and has been collected for the current study from 2016 Intensity Frequency Duration (IFD) data and ARR2016 temporal patterns. IFD data describes the rainfall depths (mm) for a range of annual exceedance probabilities (AEP), for a range of durations (1 minute to 168 hours), for any location in Australia. The data is provided online on the BOM website. IFD data for various duration relevant to the study area are presented in Table 4
Table 4: Design Rainfall Depths
AEP Rainfall Depth (mm)
5 min 10 min 15 min 25 min 30 min 1 hour 2 hour 3 hour
1 EY 7.8 12.4 15.4 19.5 21.1 27.3 34.8 40.3 20% 11.2 18.1 22.7 28.5 25.9 30.6 38.7 48.6 10% 13.0 21.0 26.3 33.0 30.1 35.4 44.6 55.9 5% 14.7 23.9 29.9 37.5 34.2 40.1 50.4 63.2 2% 16.9 27.6 34.6 43.3 39.5 46.3 58.2 73.2 1% 18.6 30.5 38.1 47.7 43.5 51.0 64.2 81.0 0.5% 20.4 33.2 41.5 52 47.5 55.7 70.2 88.5 0.2% 23.1 37.5 47.0 58.9 53.7 63.1 79.6 100.0
The Probable Maximum Precipitation (PMP) rainfall depths were calculated in accordance with the Generalised Short Duration Method (GDSM) (Reference 3). The catchment was defined as 100% ‘Smooth’ and a Moisture Adjustment Factor of 0.71 was applied. The Elevation Adjustment Factor was not applied as catchment elevations do not exceed 1500 mAHD. PMP rainfall depths for various durations are presented in Table 5
Table
5: PMP Rainfall Depths
Duration 15 min 30 min 45 min 1 hr Rainfall depth (mm) 160 240 300 350
Areal Reduction Factors
Areal Reduction Factors (ARF) were applied to design rainfall depths to adjust for a Catchment’s areal average rainfall intensity. The ARFs were determined following the methods outlined in ARR2016 for the ‘South East Coast’ region. Calculated ARFs were based on the overall catchment area and event duration and probability.
Rainfall Temporal Patterns
Rainfall temporal patterns are used to describe how rainfall is distributed over time. The recommended ARR2016 ensemble approach to applying temporal patterns has been utilised in the current study. The ensemble approach to flood modelling applies a suite of 10 different temporal patterns for each duration. Point Temporal Patterns have been implemented for Exile Bay since the catchment is smaller than 75 km². The temporal patterns were obtained from ARR2016 for the ‘East Coast South’ region for the catchment area. Ensemble modelling techniques aim to overcome issues associated with the application of a single temporal pattern as per the methods used in ARR87.
32 Exile
Study Report
Bay Catchment Flood Study Draft Flood
Review of IFD Data Accuracy Based on Local Gauge Data
To confirm the accuracy of the IFD data, rainfall frequency analysis of historical pluviometer data was undertaken and compared to IFD curves provided by the BOM. The analysis was undertaken for the Greenlees Park Bowling Club (566064) and Homebush SP0041 (566022) gauges which have approximately 30 and 50 years of continuous rainfall data respectively. These gauges were selected based on their proximity to the study area. Analysis of historic rainfall events (see Section 3.4.2) found that, due to significant spatial variation, only nearby gauges were appropriate for rainfall analysis.
For each gauge, the annual maximum rainfall depth for various durations from 10 minutes to 72 hours was extracted to develop an annual maximum series for each duration. The rainfall frequency analysis consisted of fitting the Generalised ExtremeValue distribution to the annual maximum series, using the technique of LH moments, which is consistent with methods implemented by the BOM in derivation of the IFD data.
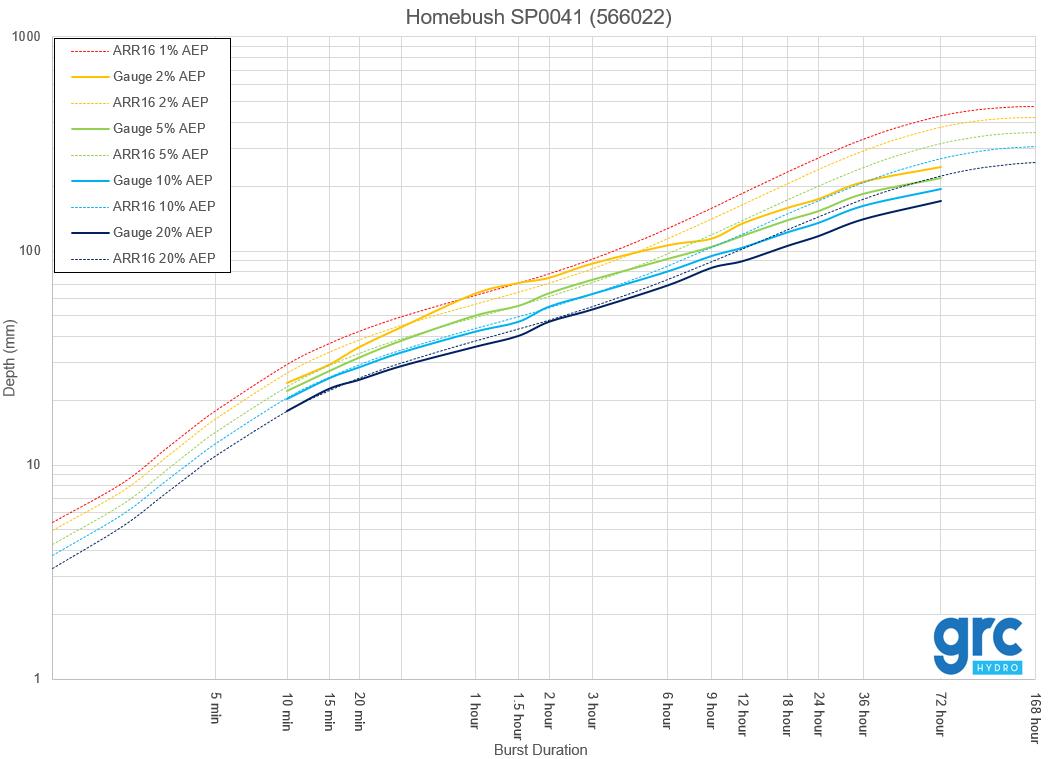
This process was undertaken for the two gauges listed and compared to the ARR2016 BOM IFD curves. Only events up to and including the 5% AEP (at Greenlees Park Bowling Club) and 2% AEP (at Homebush SP0041) were compared to the IFD curves due to the record period available for these gauges. This comparison is presented in Figure 7 for the Greenlees Park gauge and Figure 8 for Homebush SP0041.
The Greenlees Park derived curves (up to 5% AEP event) were found to be typically lower than the ARR2016 IFD curves indicating that ARR2016 would produce a slightly conservative estimate. At the Homebush SP0041 gauge, derived IFD curves were found to generally match the ARR2016 IFD curves for events up to the 2% AEP.
Overall, it was found that the ARR2016 IFD design estimates adequately matched the historical records and are suitable for use in the current study.
33 Exile Bay
Flood Study Draft Flood Study Report
Catchment
Figure 7: Greenlees Park Bowling Club, Concord (566064) station, ARR16 IFD Comparison
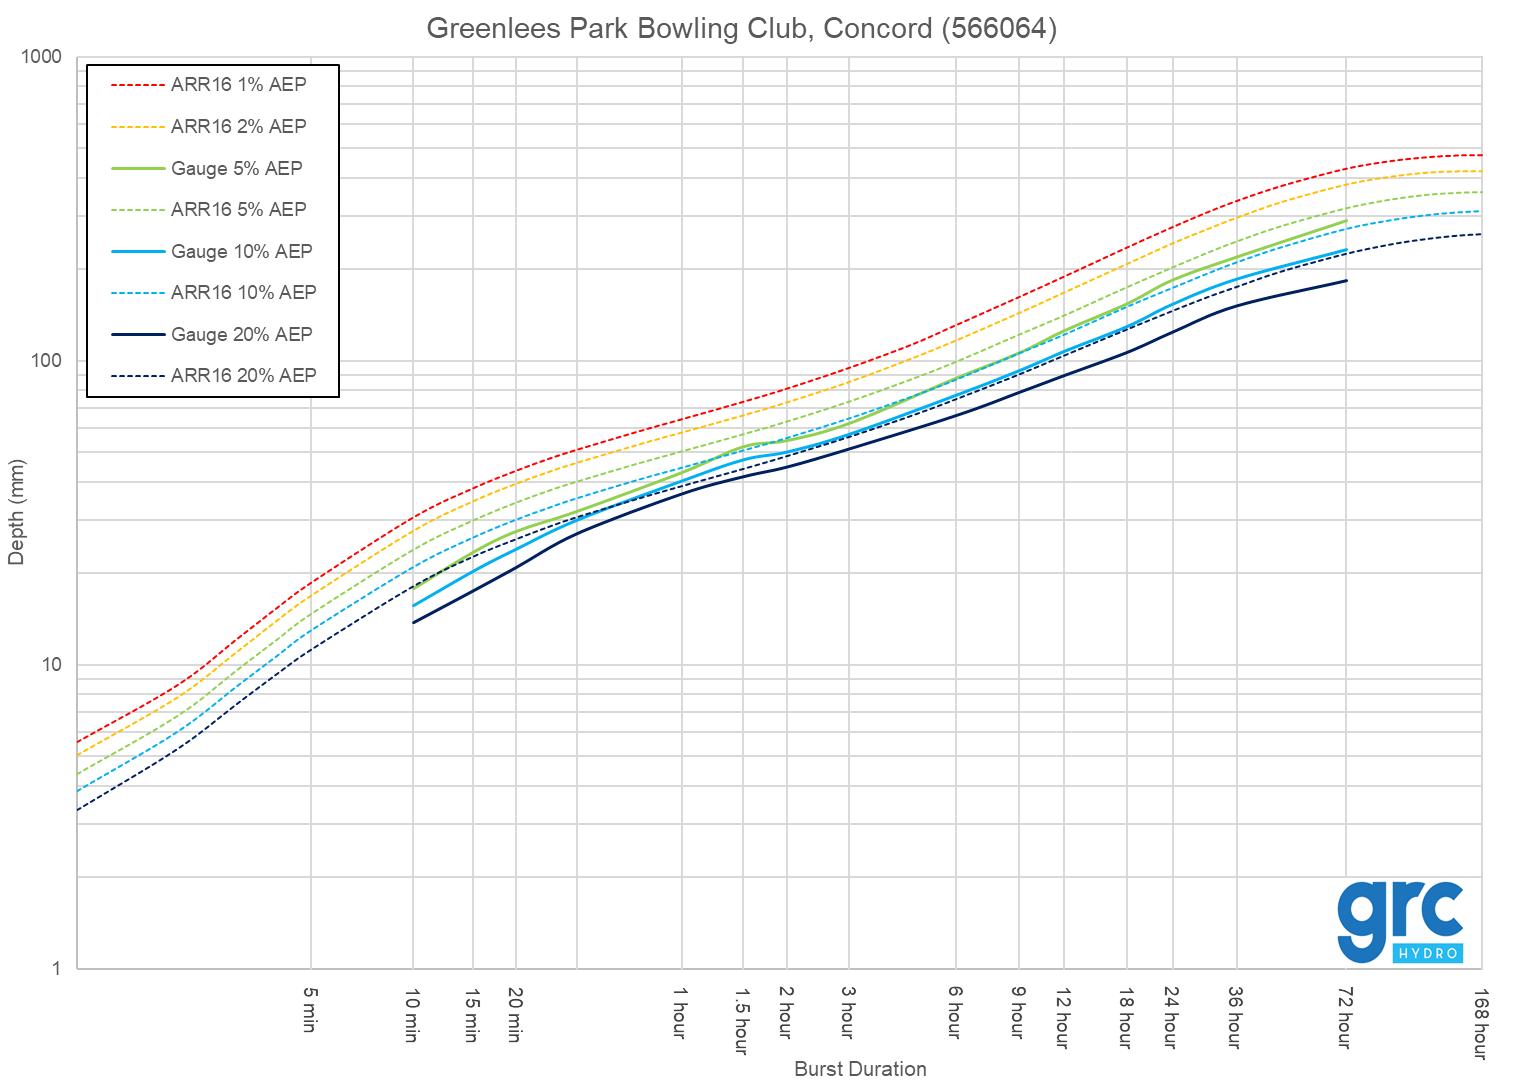
Figure 8: Homebush SP0041 (566022) station, ARR16 IFD Comparison
34 Exile Bay
Study Draft Flood Study Report
Catchment Flood
4. COMMUNITY CONSULTATION
Community consultation was undertaken in late 2018 to inform the community of the study and to collect information relating to previous floods In addition to these objectives, consultation aimed to identify community concerns and develop community confidence in the study through close collaboration. The consultation included a media release, newsletter/questionnaire and a website.
4.1 Newsletter and Questionnaire
A newsletter and questionnaire was developed for the Exile Bay community in collaboration with Council. The newsletter introduced the study and its objectives, and requested information via the questionnaire. The newsletter and questionnaire was distributed to all residents and property owners within the Exile Bay catchment. This newsletter and questionnaire is provided in Appendix B. Community members were able to participate in the questionnaire either via return of the paper questionnaire, email or submission on the flood study website.
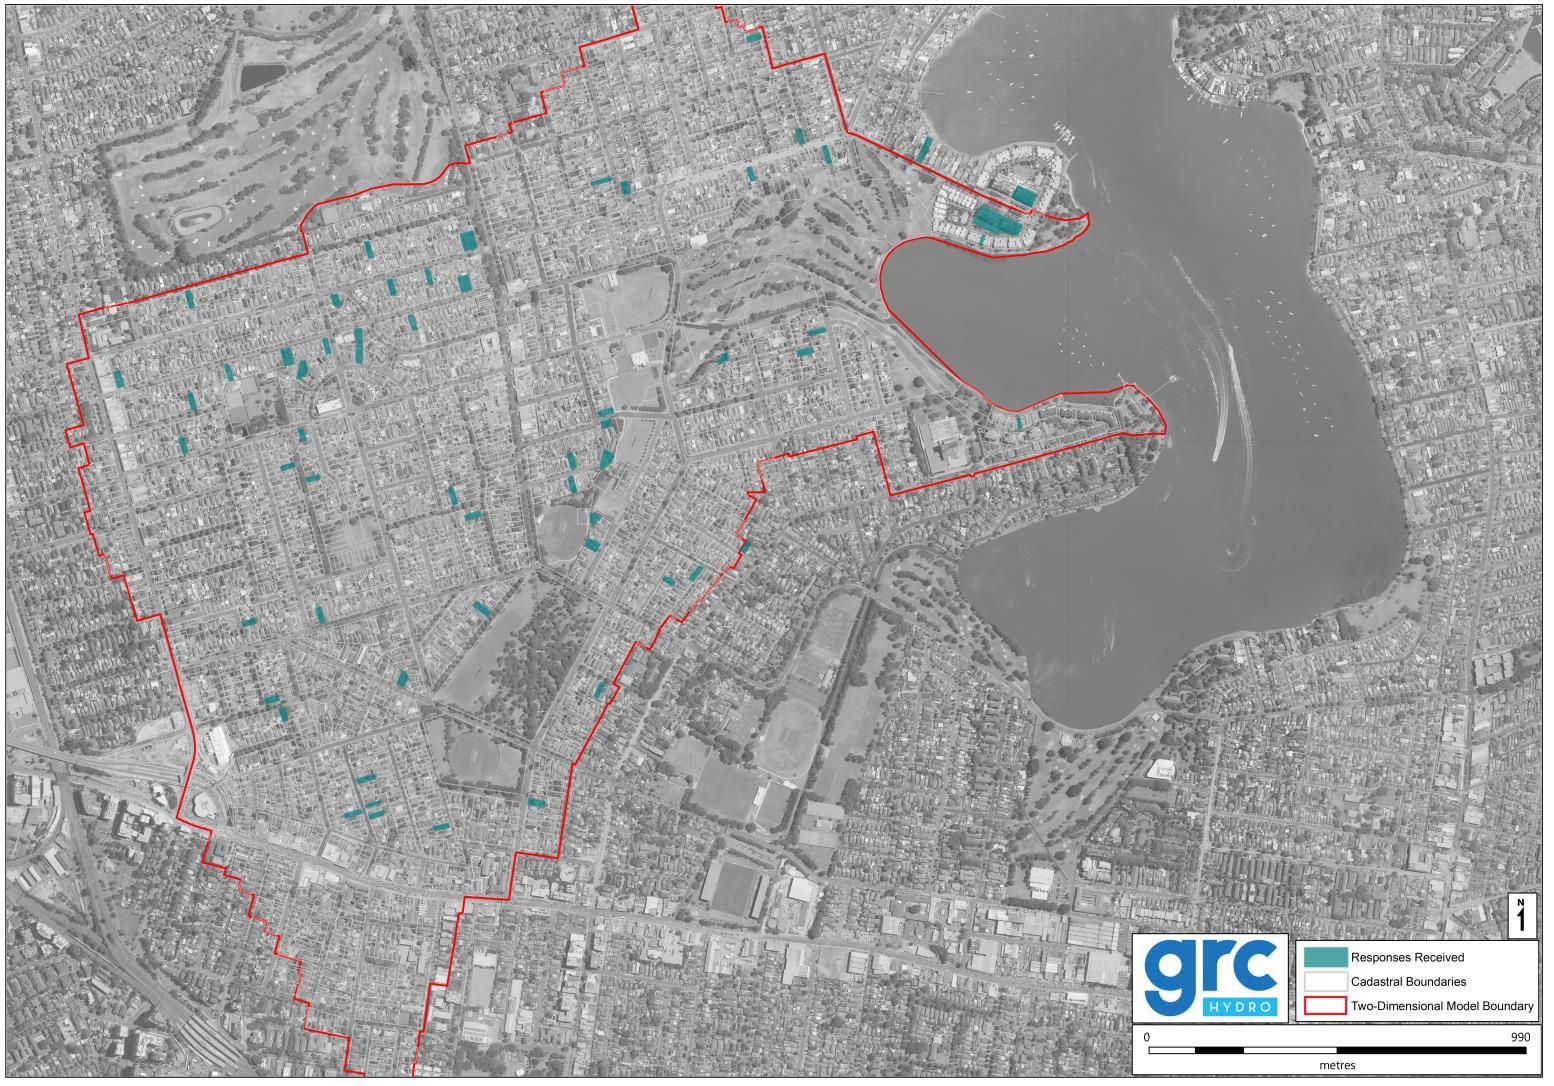
Newsletters and questionnaires were distributed by Council and 65 responses were received from the community Figure 9 maps the addresses from which responses were received. Approximately 50% of respondents indicated that they were aware of flooding from overland flow in the catchment. These results highlight there is a general awareness of flooding from overland flow in the community.
Furthermore, the community were asked whether their property had been affected by flooding. Approximately 45% of respondents answered that they had experienced flooding in their yard/garage and 8% of replies noted that above floor level flooding had occurred at their property.
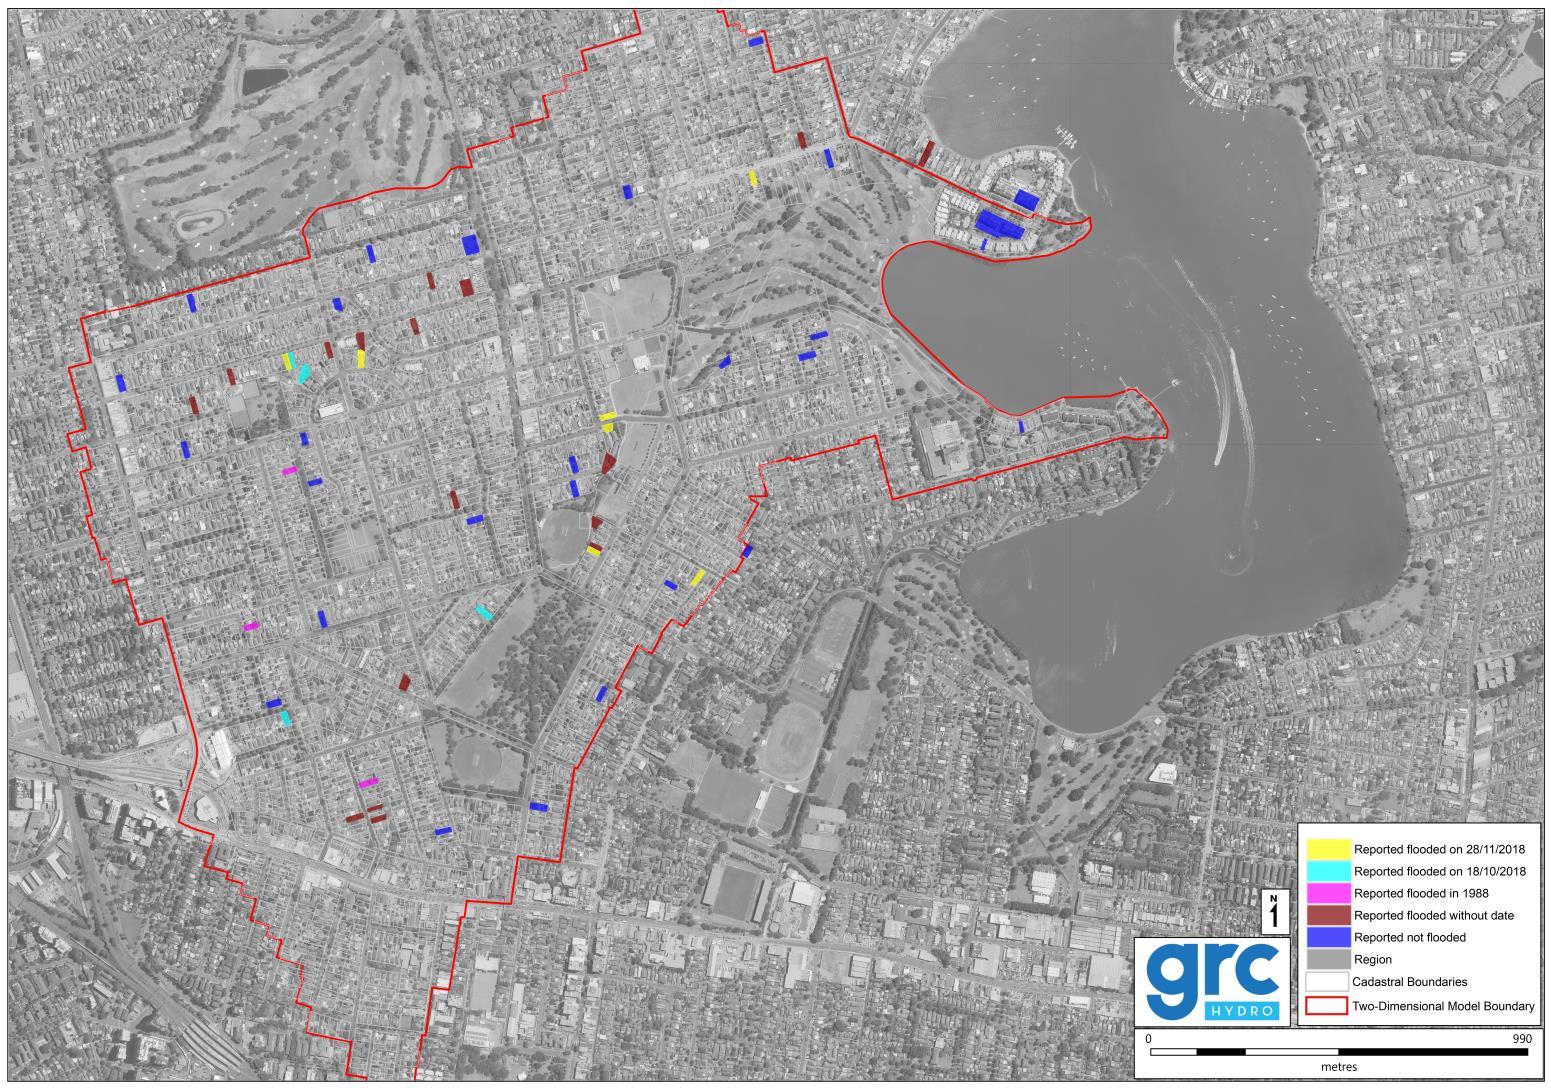
Flooding observations and dates, where available, were collated and mapped in Figure 10 This information has been used during the calibration/validation of the flood model (Section 8.2) to ensure model accuracy.
When asked whether there was anything that had made flooding worse in their area, 50% of respondents answered yes. Many submissions indicated that blockage of drains, or a lack of drainage had exacerbated flooding in their locality.
Figure 11 presents some statistics based on the questionnaire responses received.
4.2 Public Exhibition
This report was placed on public exhibition from 19 February to 1 April 2020. Various consultation channels were used during the period, including notification letters to residents (with factsheets for FPA properties), a dedicated phone number and email address for feedback, promotion via council’s website, door knocking of FPA properties, a feedback form and 1 on 1 in person and phone meetings with the consultant. The website had 172 visitors while the consultation page had 231 visitors. It was reported that 57% of the 274 FPA lots were directly communicated with and accepted the study findings, while 16% were neutral and 11% were unsatisfied (the remainder were not reached directly or did not give an opinion). A Council report on the exhibition is included in Appendix B
35 Exile Bay Catchment Flood Study Draft Flood Study Report
Figure 9: Community Consultation Response Locations
36
Exile Bay Catchment Flood Study Draft Flood Study Report
Figure 10: Community Consultation flood observations
37
Exile Bay Catchment Flood Study Draft Flood Study Report
Figure 11: Community Consultation Summary of Responses
Has your property ever been affected by flooding?
Are you aware of flooding from overland flow in Exile Bay? Yes No N/A
Have you noticed anything that has made flooding worse in Exile Bay? Yes No N/A
38 Exile Bay Catchment Flood Study Draft Flood Study Report
8% 45% 45% 2%
50% 37% 13%
Above Floor level Yard/ Garage No N/A
50% 47% 3%
5. FLOOD MODELLING OVERVIEW
Computer models can be used to simulate a catchment’s rainfall/runoff response and flood behaviour for a particular area of interest. The overall modelling system is typically comprised of:
• Hydrologic model a computer software tool that simulates catchment processes which affect how rainfall is converted into runoff; and a
• Hydraulic model a computer software tool that simulates the flow characteristics of a river, creek, channel or overland flow path in terms of flood extent, depths, levels and velocities.
To accurately model flood behaviour for Exile Bay, the development of both hydrologic and hydraulic models has been undertaken as part of a joint modelling exercise The system was used to firstly convert rainfall into flow via the hydrologic model, and then the hydrologic model flows were applied to the hydraulic model to define flood depths, extents and velocities. The details of the hydrologic model development are presented in Section 6 and the hydraulic model development is discussed in Section 7
To ensure accuracy of the computer modelling system, a process of model calibration and validation has also been undertaken. These processes are described below:
• Model calibration is the process of adjustment of computer model parameters to obtain a match to observed or recorded flood behaviour (i.e. ensuring the computer model matches observations of flooding provided by the community); and
• Model validation is used to check the accuracy of the calibrated computer model's representation of flood behaviour and substantiate the model parameters determined by the model calibration process.
The calibration/validation process has been undertaken for the joint modelling system with calibration of the hydrologic/hydraulic modelling system discussed in Section 8.2 and model validation discussed in Section 8.3
It is important to note that when the hydrologic model is not separately calibrated, the model system is called a joint model with verification only possible using hydraulic model predictions.
39 Exile Bay Catchment Flood Study Draft Flood Study Report
6. HYDROLOGIC MODEL
6.1 Overview
The following section addresses the hydrologic model developed and used in the current study. A hydrologic (DRAINS) model has been used to convert applied rainfall, of a given probability, into a flow hydrograph for input into the TUFLOW hydraulic model.
6.2 Sub-Catchment Delineation
Sub catchment delineation has been undertaken for the study area. This process defines how various areas of the overall catchment drain locally. In total, 694 subcatchments were delineated with an average catchment area of 0.5 hectares. These catchments are shown in Figure 12 At an average size of 0.5 hectares, the subcatchments resolution is very high and defines best practise.
6.3 Percentage Impervious
Urbanisation has resulted in increased impervious areas in catchments such as pavements, roads and buildings. Rainfall that lands on these surfaces typically produces significantly higher runoff rates than pervious areas. As such, there is less opportunity for rainfall in these areas to be intercepted by processes such as infiltration. Further built areas tend to be purposefully drained and so flow is delivered to the downstream with less attenuation and faster, relative to the development conditions.
A key process undertaken in the development of a hydrologic model is determining the percentage impervious for each sub catchment. This analysis was undertaken within the study area based on the land use category. Land use categories, supplied by Council, were assigned impervious percentages based on inspection of aerial imagery. Table 6 summarises the preliminary impervious percentages assigned for each land use category and the land use categories are shown in Figure 13
Table 6: Applied Impervious Percentages
Three surfaces types are categorised in DRAINS; paved areas, supplementary areas and grassed areas. DRAINS’ defined these areas as follows:
• Paved areas impervious areas directly connected to the drainage system
• Supplementary areas impervious areas not directly connected to the drainage system, draining onto the grassed area
• Grassed areas pervious areas.
40 Exile Bay Catchment Flood Study Draft Flood Study Report
Land Zone Classification Impervious Percentage
Neighbourhood Centre 90
Mixed Use 90
Enterprise Corridor 90
Low Density Residential 57
Medium
57
B1
B4
B6
R2
R3
Density Residential
RE1 Public Recreation 0 RE2 Private Recreation 0 SP2 Infrastructure 90 IN1 General Industrial 90
In the current study, 5% was adopted as a supplementary area with the remaining 95% estimated for pervious and impervious areas as per Table 6
6.4 Design Rainfall Losses
Rainfall losses were obtained from the ARR Data Hub and then adjusted during the calibration process. The ARR Data Hub recommends an initial loss of 33 mm and continuing loss of 1.8 mm/h. Book 9 of ARR2016, Runoff in Urban Areas (Reference 2), advises that storm initial losses should be 60 to 80% of rural catchment losses in Indirectly Connected Areas. As such, an initial loss of 23.1 mm (70% of 33 mm) was adopted for design event modelling.
ARR2016 initial losses include pre burst rainfall depths which must be deducted from the initial loss. These pre burst rainfall depths vary based on event duration and magnitude. Table 7 presents the pre burst depths obtained from the ARR Data hub and deducted from the initial loss of 23.1 mm.
Table 7: ARR2016 Design Pre burst Depths (mm)
Duration (min) \ AEP (%) 50 20 10 5 2 1 60 3.8 2.4 1.4 0.5 1.5 2.2 90 13.8 8.7 5.4 2.1 1.5 1.0 120 12.0 7.3 4.1 1.2 1.8 2.2 180 9.8 6.9 5 3.1 3.5 3.8 360 9.2 13.3 16.1 18.7 17.1 15.9
* Note for events shorter than 60 min, the 60 min pre burst depth has been used (excluding the PMF).
** Note for events rarer than 1% AEP, the 1% AEP pre burst depth has been used (excluding the PMF).
*** For duration not listed, pre burst depths were interpolated between durations.
Table 8 presents the design losses adopted in the current study.
Table 8: ARR2016 Design Losses Area
Rainfall Loss
Adopted Value
Effective Impervious Area1 Initial Loss (mm) 1 Continuing Loss (mm/hr) 0
Remaining Area
Initial Loss (mm) 23.1 (less pre burst depth) Continuing Loss (mm/hr) 1.8
1 According to ARR2016 (Reference 2), the Effective Impervious Area (EIA) represents the portion of a catchment that has an impervious response. The DRAINS manual outlines that the EIA is approximately 60% of the total impervious area in a catchment.
6.5 Calibration Rainfall Losses
ARR2016 recommended loss values were input into the DRAINS hydrologic model and adjusted during calibration of the flood modelling system. Table 9 provides a summary of the parameters adopted for calibration for the October and November 2018 rainfall events.
Catchment
41
Report
Exile Bay
Flood Study Draft Flood Study
Table 9: Adopted Hydrologic Model Calibration Loss Parameters
Area Rainfall Loss
Effective Impervious Area1
Remaining Area
Adopted Value October 2018 November 2018
Initial Loss (mm) 0 1
Continuing Loss (mm/hr) 0 0
Initial Loss (mm) 0 23.1
Continuing Loss (mm/hr) 1.8 1.8
1 According to ARR2016 (Reference 2), the Effective Impervious Area (EIA) represents the portion of a catchment that has an impervious response. The DRAINS manual outlines that the EIA is approximately 60% of the total impervious area in a catchment.
6.6 Other Hydrologic Model Inputs
DRAINS utilises the following additional data to derive flow hydrographs for input in the hydraulic model:
• Catchment Area (ha);
• Flow path length (m);
• Catchment slope (%); and
• Manning’s ‘n’ based on surface type.
The catchment area, in hectares, was automatically calculated using the delineated catchment in GIS.
To calculate a flow path length for each sub catchment, a relationship was derived based on 20 measured flow path lengths for sub catchments of various sizes within the study area. This relationship was applied to each sub catchment
The sub catchment slope was calculated using the maximum and minimum elevation within each sub catchment and the calculated sub catchment flow path length.
The following Manning’s ‘n’ values were applied for each surface type:
• Paved areas 0.015;
• Grassed areas 0.03; and
• Supplementary areas 0.03
42 Exile Bay Catchment Flood Study Draft Flood Study Report
Figure 12: Sub catchment Delineation
43
Report
Exile Bay Catchment Flood Study Draft Flood
Study
Figure
Exile Bay Land Use Map

44
Report
Exile Bay Catchment Flood Study Draft Flood
Study
13:
7. HYDRAULIC MODEL
7.1 Overview
Hydraulic models are used to produce flood depths, levels and velocities across the study area, based on the inflow hydrographs output from the hydrologic model. The current study has established a hydraulic model for Exile Bay based on the TUFLOW software. TUFLOW is a hydrodynamic modelling program that represents the floodplain as a grid of cells and resolves flow behaviour using a finite difference method.
The TUFLOW software used in the current study is the 64 bit version 2016 03 AE. A 2 m grid cell size was adopted on that basis that; it is fit for purpose, the smallest grid cell that can be reasonably utilised given the available topographic data and achieves reasonable runtimes. The hydraulic model extent and the model schematisation is shown in Figure 14 The sensitivity of the model results to the adopted values and boundary conditions assumptions has been investigated in Section 10
7.2 Model Topography
The TUFLOW hydraulic model uses the 1 m raster product from LiDAR data described in Section 3.3.1
7.2.1 Selection of Cell Size
TUFLOW uses a matrix of square (grid) cells as the computational structure. The selection of model cell size needs to be sufficiently small to adequately represent hydraulic behaviour yet large enough to minimise run times. Based on this criterion a 2 m cell size was adopted.
The cell size is also dependent on the resolution of input data. Given the LiDAR is ~1.44 m2 resolution, a resolution of 2 m was the smallest possible cell size. Furthermore, cell sizes of less than 2 m would cause issues with the shallow water equations used by TUFLOW.
7.3
Boundary Conditions
7.3.1 Inflows
Flow hydrographs generated in the hydrologic DRAINS model were applied at the downstream of each sub catchment within the TUFLOW hydraulic model. Where possible, these inflows were applied to pit locations at the downstream of each sub catchment.
7.3.2 Downstream Boundary
For all model iterations, it was necessary to define the downstream water level. The downstream model boundary is located at Exile Bay an inlet of the Parramatta River.
For calibration of the November and October 2018 events, the NSW Tide Charts for 2018 were used to derive the tidal level at the time of each event.
For the design flood modelling, the effects of both overland flow and mainstream flooding in Exile Bay must be considered (see Section 2.2). These mechanisms can occur independently or at the same time. OEH (Reference 18) recommend specific combinations between catchment flooding and ocean water levels for design flood modelling. These recommendations have been incorporated into the
45 Exile Bay Catchment Flood Study Draft Flood Study Report
current design flood modelling (see Table 10). For the 1% AEP event, design flood results are generated using the maximum flood level from each flood mechanism.
A static water level boundary has been applied in the downstream for each design event. Table 10 details the downstream conditions for each event.
Table 10: Design Event Rainfall and Downstream Conditions
Design Event (AEP) Catchment Flood Scenario Downstream Water Level
1 EY 1 EY Rainfall
20% 20% AEP Rainfall
10% 10% AEP Rainfall
HHWS Harbour Level 1.13 m AHD
HHWS Harbour Level 1.13 m AHD
HHWS Harbour Level 1.13 m AHD
HHWS Harbour Level 1.13 m AHD 2% 2% AEP Rainfall
5% 5% AEP Rainfall
5% AEP Harbour Level 1.375 m AHD
1% Envelope 5% AEP Rainfall 1% AEP Harbour Level 1.435 m AHD 1% AEP Rainfall 5% AEP Harbour Level 1.375 m AHD
0.5% 0.5% AEP Rainfall
0.2% 0.2% AEP Rainfall
PMF PMF Rainfall
7.4 Roughness Values
1% AEP Harbour Level 1.435 m AHD
1% AEP Harbour Level 1.435 m AHD
1% AEP Harbour Level 1.435 m AHD
The roughness of a surface will affect conveyance based on the amount of frictional resistance that the water experiences. As such, TUFLOW applies a Manning’s roughness coefficient (“n”) to different surface types.
Analysis of aerial imagery and land use categories was undertaken to apply suitable hydraulic roughness values throughout Exile Bay. These values were also informed based on knowledge from site inspections and verified via comparison with Chow (1959), Henderson (1966) and ARR2016 guidelines.
The Manning’s values adopted for the current study are presented in Table 11 and shown in Figure 15
46 Exile
Draft
Study Report
Bay Catchment Flood Study
Flood
Table 11: Adopted Manning’s Values
Surface Type Manning’s Value (n)
Roads 0.02
Residential 0.05
Parks 0.06
Commercial 0.02
7.5 Hydraulic Features
Hydraulic features that impacts on flood behaviour have been included in the TUFLOW hydraulic model. These features include:
• Road profiles;
• Buildings;
• Saltwater Creek bathymetry; and
• Drainage network.
The road profile was included in the hydraulic model using breaklines along the road crests and gutter lines. This ensures that the representation of gutter flow, a critical component of urban drainage, best matches reality.
Buildings can block flood waters and therefore significantly impact flood behaviour. Accordingly, aerial imagery was used to outline building footprints in the Exile Bay catchment and these were blocked out of the TUFLOW model (shown in Figure 14).
Survey data of the Saltwater Creek bathymetry (see Section 3.3.2) has been included in the TUFLOW model using breaklines to represent the channel shape. This ensures that the capacity of the channel is accurately represented.
The pit and pipe drainagenetwork was includedin the TUFLOW model.This network and the relevant conduit sizes are shown in Figure 16. This network is described in more detail in Section 3.3.3
7.6 Hydraulic Structure Blockage
The capacity of drainage systems and hydraulic structures can be significantly impacted by blockage. Blockage will tend to occur in the presence of suitably sized debris. In urban areas drainage systems can be subject to blockage from a variety of materials including garbage, vegetation, shopping trolleys, garbage bins, cars and sediments. Blockage of hydraulic structures to some degree is almost inevitable in the event of large and rare flood events.
ARR2016 provides guidance on the degree to whichstructures are blocked with a distinction between cross drainage structures over waterways (such as Saltwater Creek) and drainage system inlets and pipes. The design blockage is the blockage condition that is most likely to occur during a given design storm and needs to be an “average” of all potential blockage conditions to ensure that the calculated design flood levels reflect the defined probability.
47 Exile Bay Catchment Flood Study Draft Flood Study Report
7.6.1
Saltwater Creek Structures
For structures over Saltwater Creek, the ARR2016 guidelines consider blockage due to various sources and allowing for the factors listed below:
• Debris Type and Dimensions Whether floating, non floating or urban debris and typical sources and sizes;
• Debris Availability The volume of debris available in the source area;
• Debris Mobility The ease with which available debris can be moved into the stream;
• Debris Transportability The ease with which the mobilised debris is transported once it enters the stream; and
• Structure Interaction The resulting interaction between the transported debris and the bridge or culvert structure.
A blockage assessment was undertaken in accordance with ARR2016 guidelines. Each of the structures crossing the Saltwater Creek channel were assessed and blockages were derived (see Table 12).
Table 12: Blockage of Saltwater Creek Structures
Event AEP Blockage %
AEP > 5% 0%
AEP 5% AEP 0.5% 0%
AEP < 0.5% 15%
7.6.2 Drainage Network
Book 9 of ARR2016 addresses estimation of runoff in urban areas and provides detail on the blockage of pit inlets. A blockage factor of 50% is advised for sag pits and a blockage factor between 0% and 20% is specified for on grade pits depending on the specific catchment characteristics. The Community Consultation (see Section 4.1) responses consistently identified that the blockage of kerb inlets was exacerbating flooding. Therefore, a blockage factor of 20% has been adopted for on grade pits and 20% for sag pits in the catchment
For the PMF event, all structures were blocked completely.
48 Exile Bay Catchment Flood Study Draft Flood Study Report
Figure 14: Exile Bay Model Schematisation
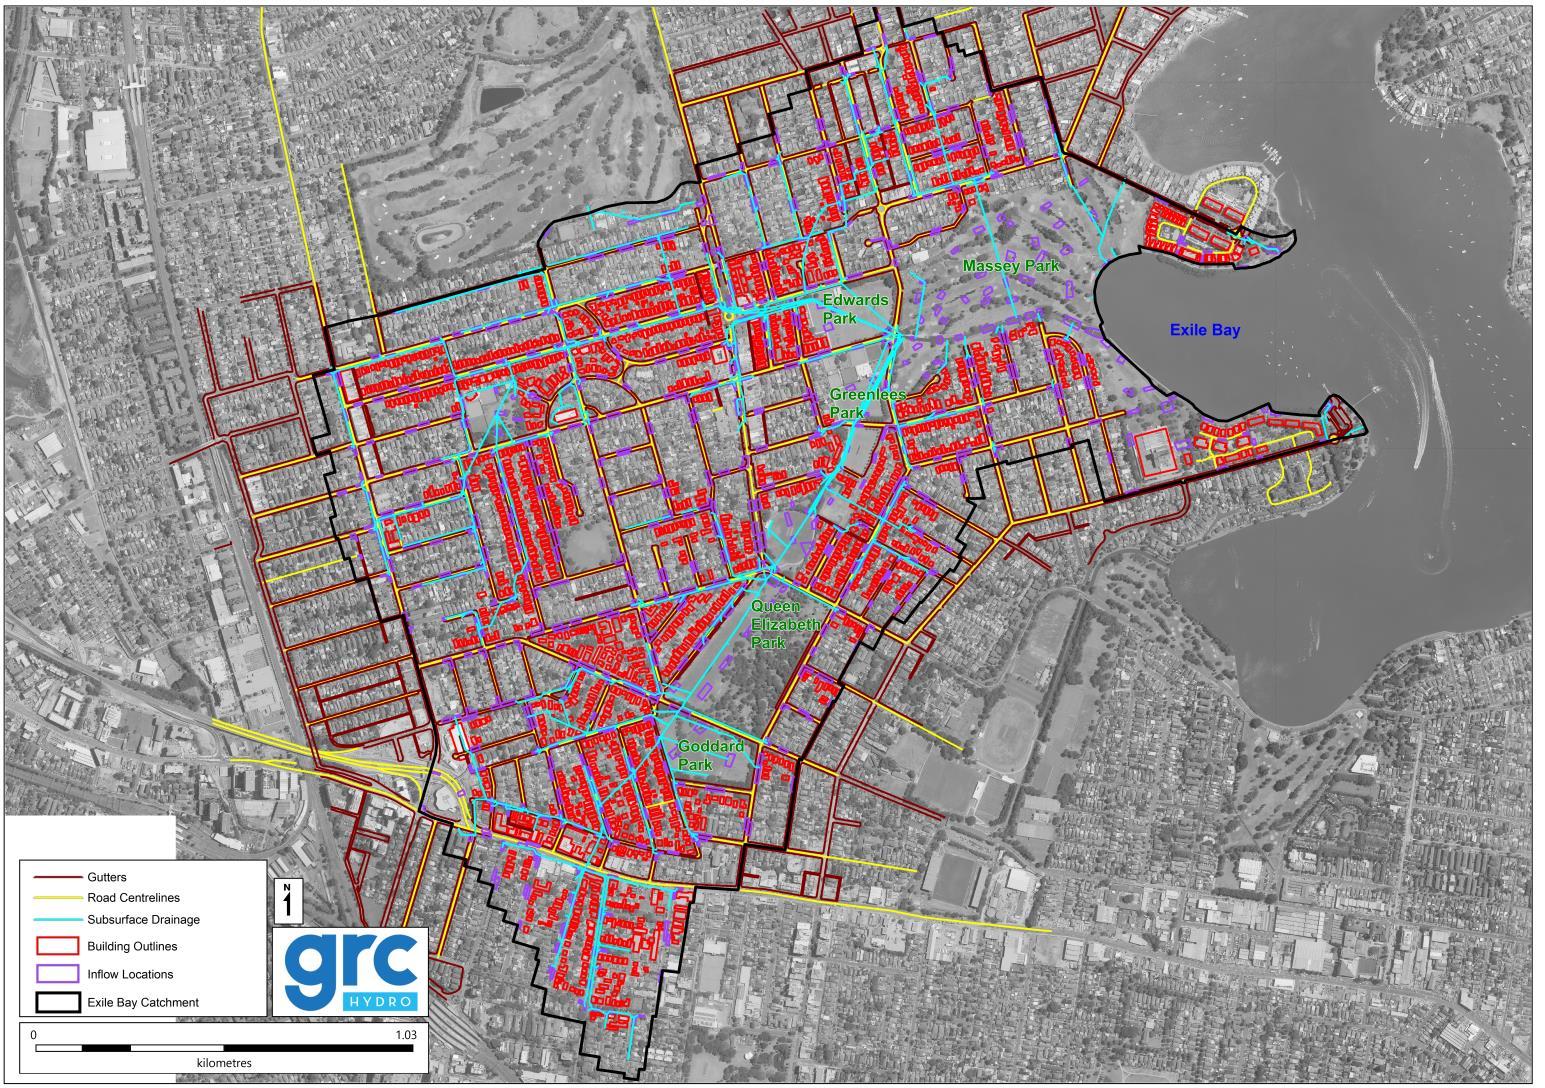
49
Report
Exile Bay Catchment Flood Study Draft Flood Study
Figure 15: Exile Bay Hydraulic Model Roughness
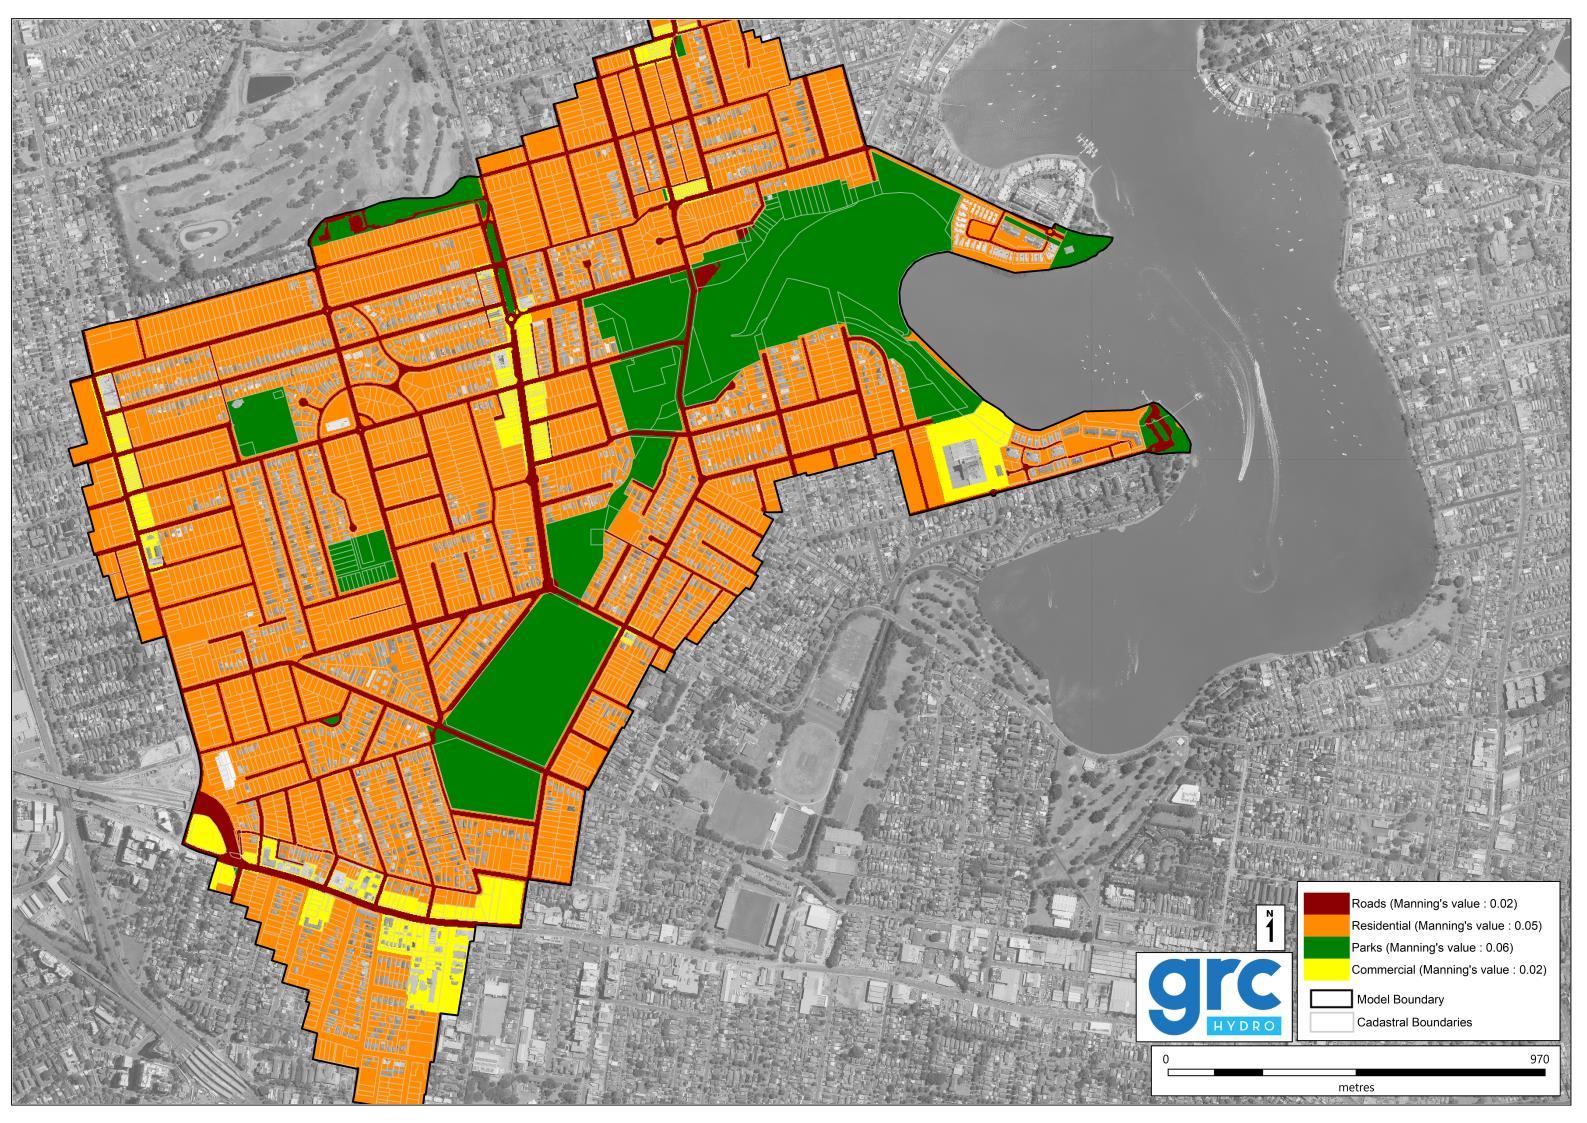
50
Report
Exile Bay
Catchment
Flood Study Draft Flood Study
Figure 16: Exile Bay Sub surface Drainage Network

51
Draft
Study Report
Exile Bay Catchment Flood Study
Flood
8.MODEL CALIBRATION & VALIDATION
8.1 Overview
Prior to using a model for design flood estimation, verification of the model’s suitability is required. For the current study this has been completed via:
• Calibration: using recorded rainfall data and confirming modelled flood behaviour against observed flood behaviour (see Section 8.2); and
• Validation: undertaking a comparison to nearby and similar catchments which have been calibrated/validated (see Section 8.3)
Due to a lack of stream gauges in the study area, calibration relies heavily on the collection of relevant historic flood data. This data includes:
• Historic flood observations, photos and videos from long term residents, newspapers and Councils records; and
• Observed rainfall data and pluviometer data from historic flood events (see Section 3.4.2).
This information is then used in the calibration process as a basis for adjusting parameters, such as losses, percentage impervious and Manning’s ‘n’ values, to achieve agreement between recorded and simulated flood behaviour.
Following calibration, model validation is undertaken to build confidence in the flood modelling system. This process has been carried out by comparison of known unit flow rates for the 1% AEP 2 hour event (ARR 1987) with similar catchments in the Sydney Metropolitan area. Further, comparison of known local flood locations in the study area (based on community feedback and Council knowledge) for preliminary design flood events is also undertaken.
8.2 Confirmation of Flood Behaviour
Two flood events occurred in Exile Bay during the community consultation period in late 2018. These events occurred in October 2018 and November 2018. Rainfall analysis and discussion of these events are provided in 3.4.2. The community submitted observations, photos and videos of flooding for these events. This observed data was used to calibrate the model by adjusting parameters such as losses and Manning’s ‘n’ value.
The following sections will provide a comparison between observed and modelled flood behaviour in the November 2018 and October 2018 flood events. The November 2018 event was a larger magnitude event than the October event Residents submitted data for both events and as such both events have been calibrated to.
8.2.1 November 2018 Event
Rainfall data from the Greenlees Park Bowling Club gauge (566064) (discussed in Section 3.4.2) was input into the flood modelling system for the November 2018 event. Modelled flood behaviour was matched to the following images and observations by adjusting the rainfall losses and Manning’s roughness values (discussed in Sections 6.5 and 7.4 respectively).
52 Exile Bay Catchment Flood Study Draft Flood Study Report
Figure 17 presents the peak flood depths for the 28th November 2018 event and the calibration points and their respective identification numbers.
ID 01 McCarthy Lane
Photos were submitted via the community consultation which depicted a pit on McCarthy Lane surcharging approximately 45 minutes after the storm peak on the November 2018 event (6:46 am photo taken, storm peak 6:00 am). Results were extracted from the flood model at the time that this photo was taken. The following images provide a comparison between observed flood behaviour and the modelled flood behaviour.

Image 3: McCarthy Lane, Observed Flood Behaviour

Image
Red arrow indicates the location of the photograph.
53 Exile
Report
Bay Catchment Flood Study Draft Flood Study
4: McCarthy Lane, Modelled Flood Behaviour
The observed flood behaviour (Image 3) depicts the extent of flooding to roughly the tree on the left side of the image. Similarly, the modelled flood behaviour (Image 4) reproduces this extent. Given the extent match a depth match is assumed. As such, this result indicates a clear match between modelled and observed flood behaviour.
ID02 Brewer Street and Majors Bay Road
Photos depicting the flood affectation experienced at Brewer Street and Majors Bay Road were obtained through the community consultation for the November 2018 event. These photos were taken approximately 50 minutes after the peak of the rainfall event. As such, results were extracted from the flood model at the time the photograph was taken and are presented below.
Image 5: Brewer Street and Majors Bay Road, Observed Flood Behaviour

Image 6: Brewer Street and Majors Bay Road, Modelled Flood Behaviour
Black arrows depict flood velocity
Red arrow indicates the location of the photograph.
The observed flood behaviour at this location (Image 5), depicts flood depths which have exceeded the level of the kerb and fast moving water, flowing down Brewer Street. This flood behaviour has been replicated in the modelled flood behaviour (Image 6), as flood depths are approximately 0.2 m and flood velocities reach up to 2 m/s at this time.

54 Exile Bay
Draft
Study Report
Catchment Flood Study
Flood
ID03 Davidson Avenue and Majors Bay Road
Photographs of the flood affectation at the intersection of Davidson Avenue and Majors Bay Road were submitted though the community consultation. As with ID01 and ID02, flood results were extracted from the flood model at the time that the photograph was taken. A comparison of observed and modelled flood behaviour is provided below.
Image 7: Davidson Avenue and Majors Bay Road, Observed Flood Behaviour
Image 8: Davidson Avenue and Majors Bay Road, Modelled Flood Behaviour

Black arrows depict flood velocity
Red arrow indicates the location of the photograph.
The observed flood behaviour (Image 7) shows fast moving water entering Majors Bay Road from Davidson Road. In the foreground of Image 7, flood levels are shallower and becoming deeper (~0.5 m) toward the Majors Bay Road roundabout. The modelled flood behaviour (Image 8) similarly

55 Exile Bay Catchment
Study Draft Flood Study Report
Flood
reproduces this flood behaviour of fast moving water becoming deeper up to 0.5 m on Majors Bay Road.
ID04 Davidson Avenue
A video depicting fast moving water moving along Davidson Avenue in the November 2018 event was submitted by a community member. The images below provide a comparison between this observed and modelled flood behaviour.
Image 9: Davidson Avenue, Observed Flood Behaviour
Image 10: Davidson Avenue, Modelled Flood Behaviour

Black arrows depict flood velocity
Red arrow indicates the location of the photograph.
The observed flood behaviour, presented in Image 9, and the video submitted by a resident showed fast moving water flowing along Davidson Avenue with deeper depths occurring in the road gutters and shallow depths at the centre of the road. This flood behaviour has been reproduced in the flood model, with flood depths of up to 0.3 m in the gutter and velocities of up to 1.5 m/s.
It is important to note that while the modelled flood behaviour (shown in Image 10) is notably more extensive than the observed flood behaviour (in Image 9), a key reason for this is the unknown video timestamp. The video submitted by the resident did not have a timestamp and as such, comparison was made using the modelled flood peak. It is likely that the video was not taken during the flood peak and therefore, some extent differences can be seen.

56
Exile Bay Catchment Flood Study Draft Flood Study Report
ID05 Main South Drain, Jones Street
A series of photographs were submitted showing the flood waters flowing along the Main South Drain, downstream of Rothwell Park, in the November 2018 event. These photos were taken from the back of a property at Jones Street. The images below compare the observed and modelled flood behaviour at the time that the photographs were taken.
Image 11: Jones Street, Observed Flood Behaviour
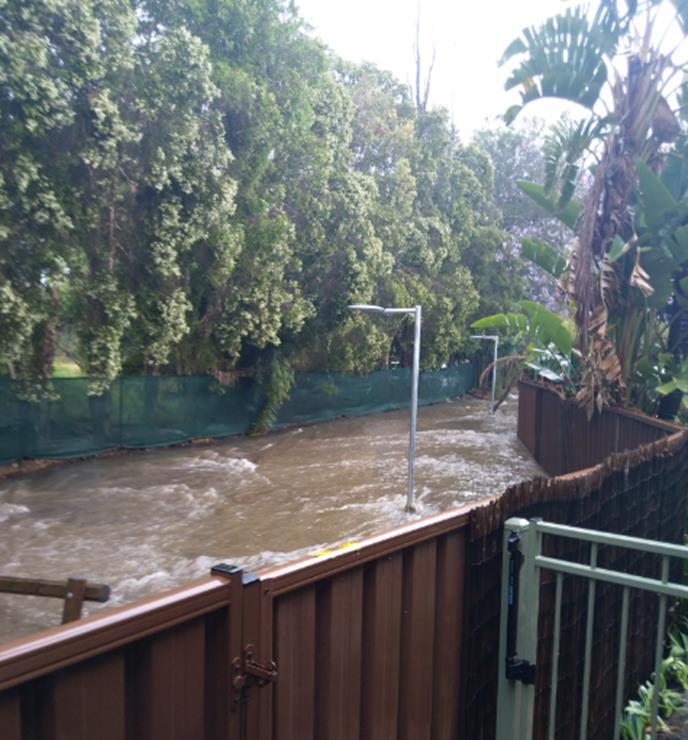
Image 12: Jones Street, Modelled Flood Behaviour
Black arrows depict flood velocity
Red arrow indicates the location of the photograph.
The observed flood behaviour, shown in Image 11, presents water flowing downstream primarily confined to the flow path behind the Jones Street properties. The modelled flood behaviour replicates this flood behaviour with depths of up to 0.15 m and velocities up to 0.6 m/s at the time of the photograph.
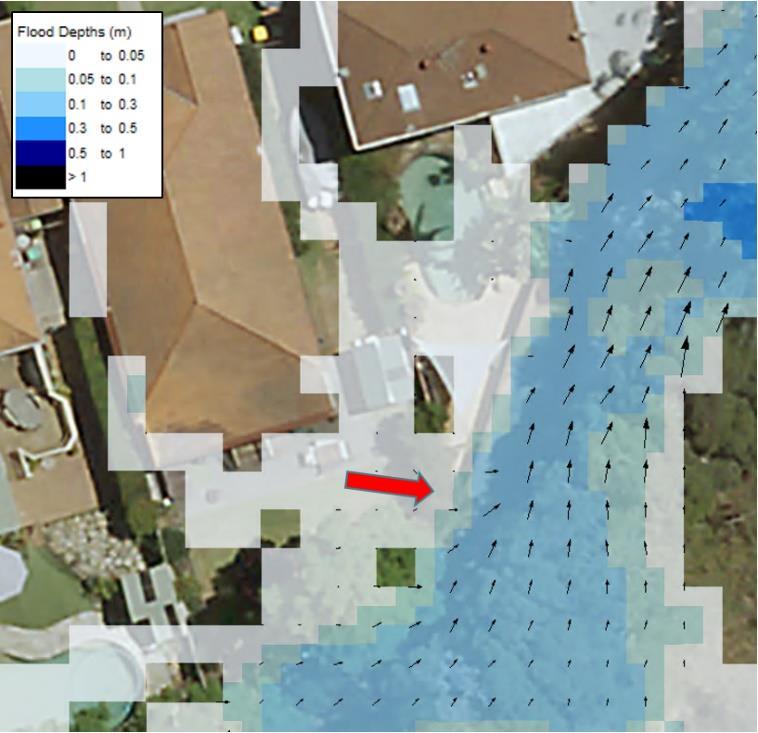
57 Exile Bay
Draft
Study Report
Catchment Flood Study
Flood
ID06 Rothwell Park
A video, taken from the Beaconsfield Avenue properties that back onto Rothwell Park, was supplied and presented widespread shallow flooding across the oval and flood waters moving along the bike path around the oval. The images below compare the observed and modelled flood behaviour.
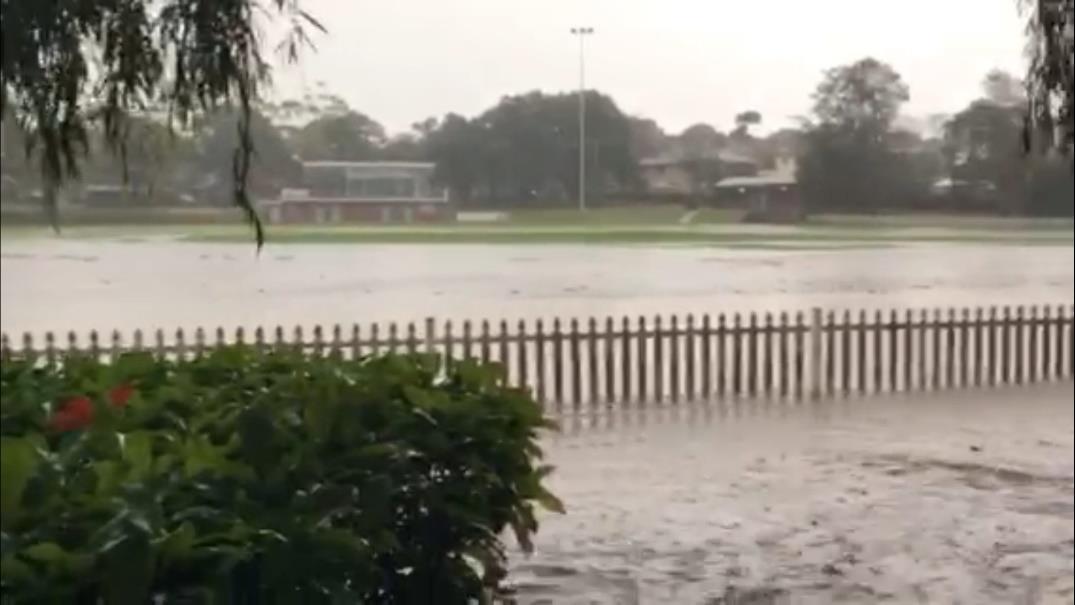
Image 13: Rothwell Park, Observed Flood Behaviour
Image 14: Rothwell Park, Modelled Flood Behaviour
Black arrows depict flood velocity
Red arrow indicates the location of the photograph.
Observed flood behaviour (Image 13), supplied in a video of Rothwell Park, was reproduced in the flood model (Image 14) with widespread shallow depths across the oval and deeper flood depths along the cycle way at edge of the park.
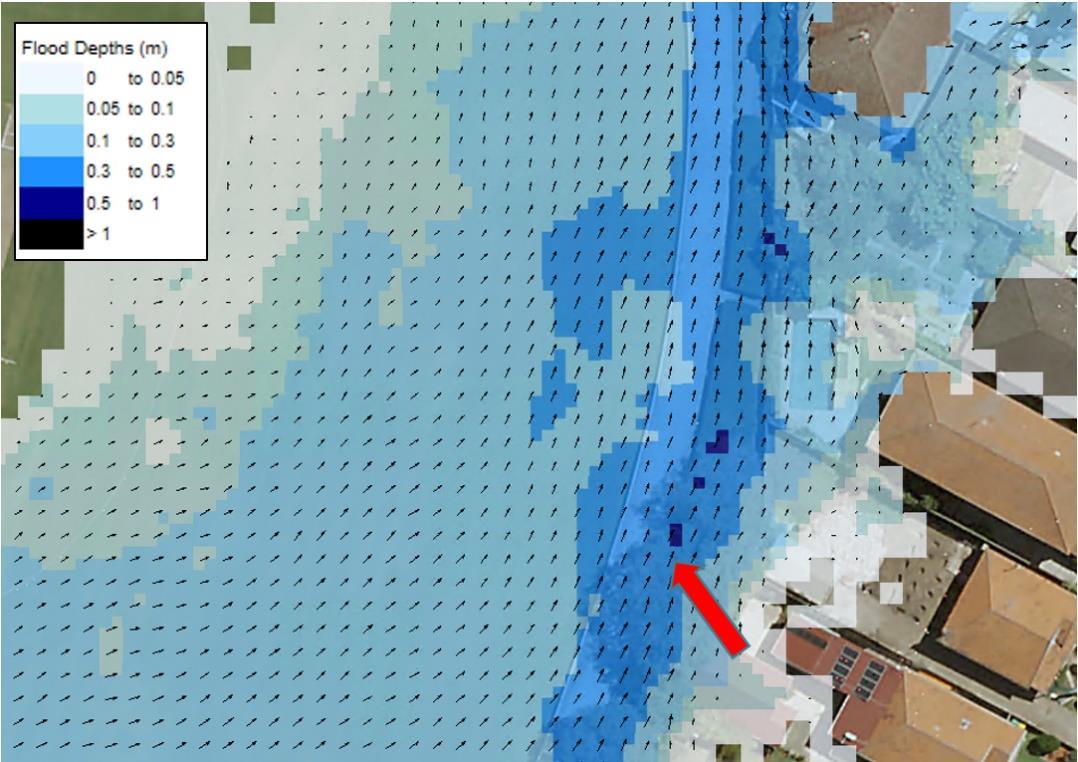
58 Exile Bay
Draft Flood Study Report
Catchment Flood Study
17: November 2018 Flood Event, Peak Flood Depths
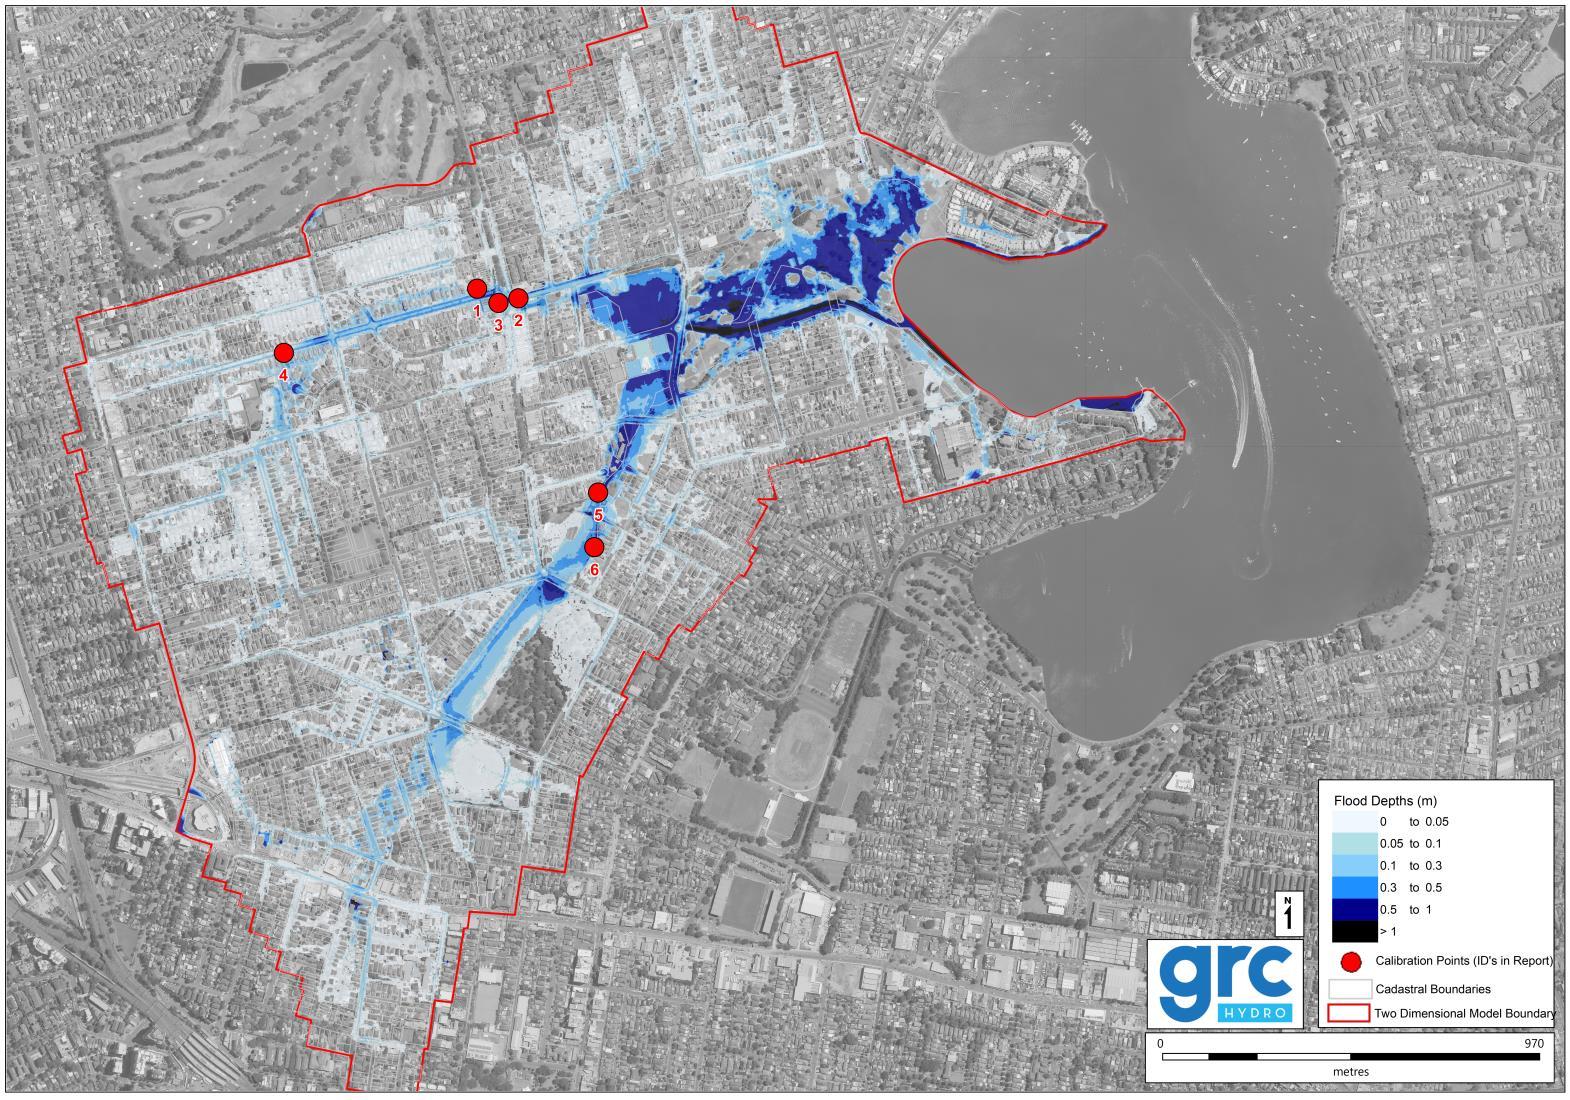
59
Exile Bay Catchment Flood Study Draft Flood Study Report
Figure
8.2.2 October 2018 Event
Rainfall data from the Greenlees Park Bowling Club gauge (566064) (discussed in Section 3.4.2) was input into the flood modelling system for the October 2018 event. Modelled flood behaviour was matched to the following images and observations by adjusting the rainfall losses and Manning’s roughness values (discussed in Sections 6.5 and 7.4 respectively).
Figure 18 presents the peak flood depths for the 18th October 2018 event and the calibration points and their respective identification numbers.
ID01 Curtin Place
Photographs of flooding from the October 2018 event were submitted via the community consultation. A comparison of observed and modelled flood behaviour is presented below.
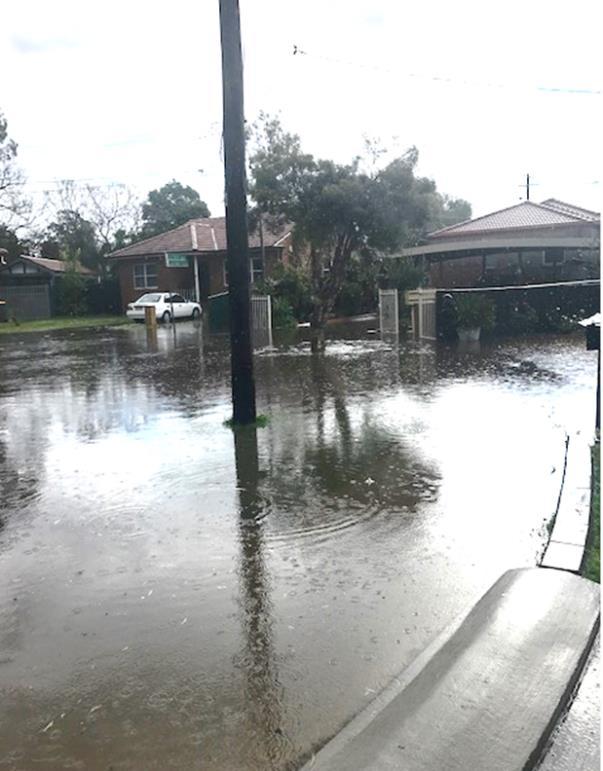
Image 15: Curtin Place, Observed Flood Behaviour Image 16: Curtin Place, Modelled Flood Behaviour
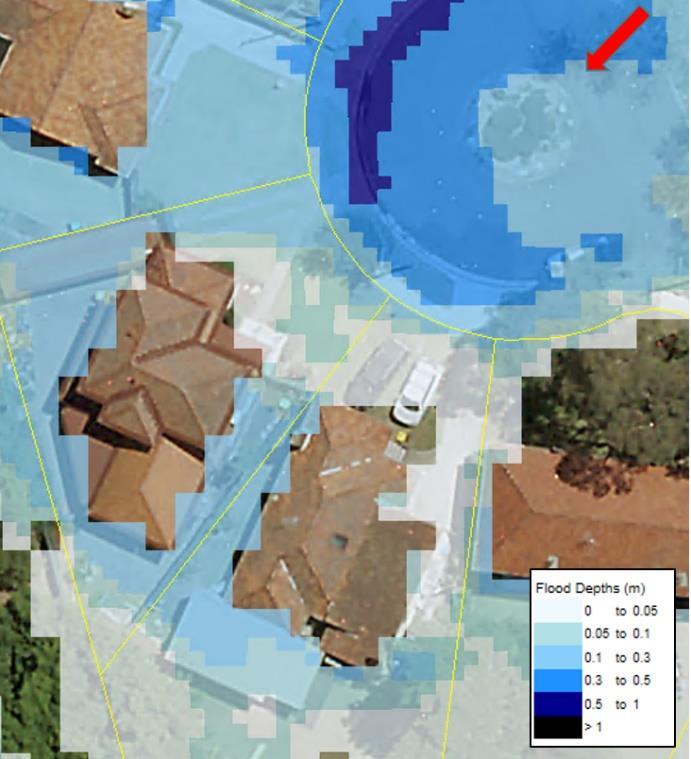
Red arrow indicates the location of the photograph.
The observed flood behaviour, shown in Image 15, stretches across the cul de sac with the flood extent finishing at the houses opposite. Deeper flood depths can be seen toward the left of Image 15. Similar flood depths and extents are shown in the modelled flood behaviour shown in Image 16
60 Exile Bay
Draft
Study Report
Catchment Flood Study
Flood
ID02 Davidson Avenue
A resident at Davidson Avenue provided a flood observation from the October 2018 event, indicating that the “water level in the street raised to above footpath level”. As such this observation was calibrated in the flood model by extracting the peak flood level and comparing it to the foot path level.
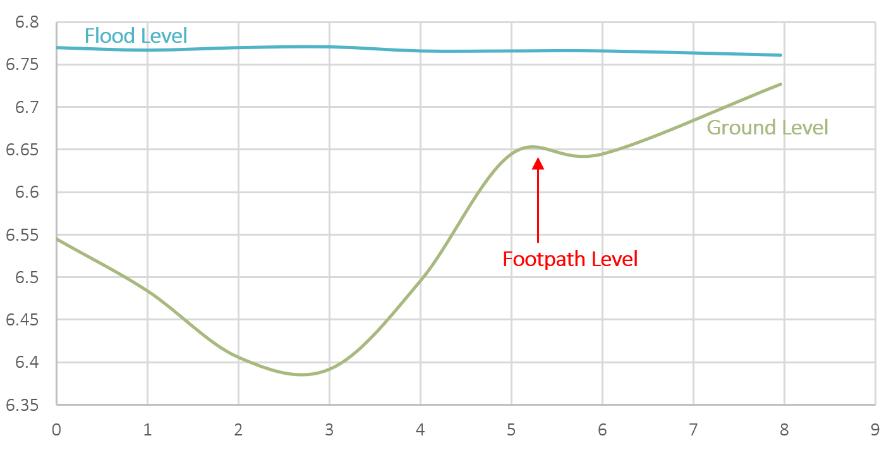
Image 17: Davidson Avenue, Modelled Flood Behaviour
Cross section in Image 18 taken along red arrow
Image 18: Davidson Avenue, Flood Cross Section
The cross section (shown in Image 18) was taken along the red arrow shown in Image 17. As observed by the resident, it was found that the modelled flood level in the October 2018 event on Davidson Avenue exceeded the level of the footpath by 0.11 m
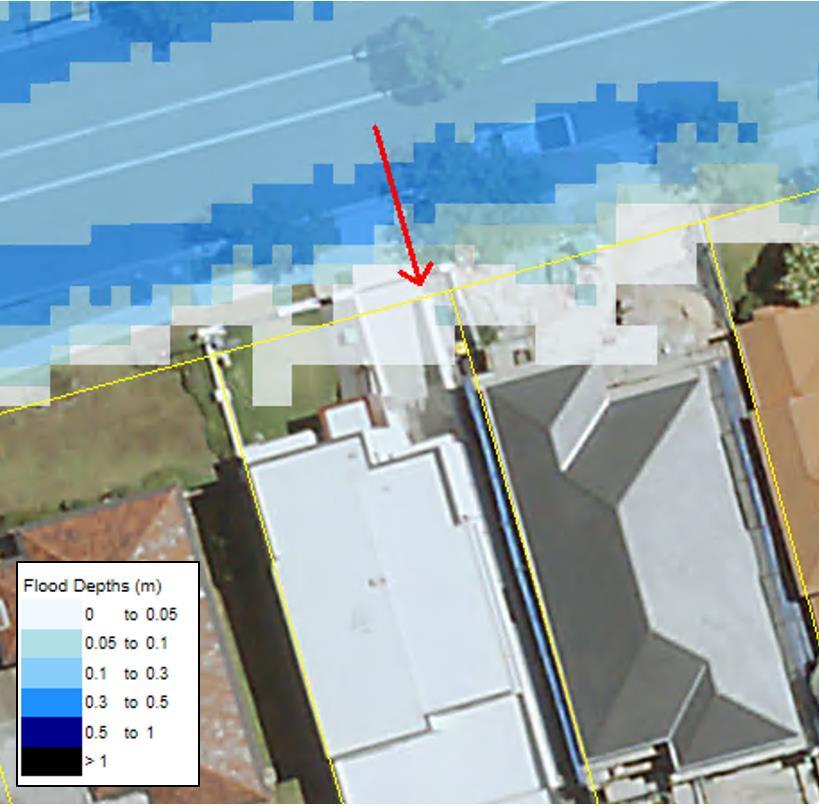
61 Exile Bay
Draft
Study Report
Catchment Flood Study
Flood
Figure 18: October 2018 Flood Event, Peak Flood Depths
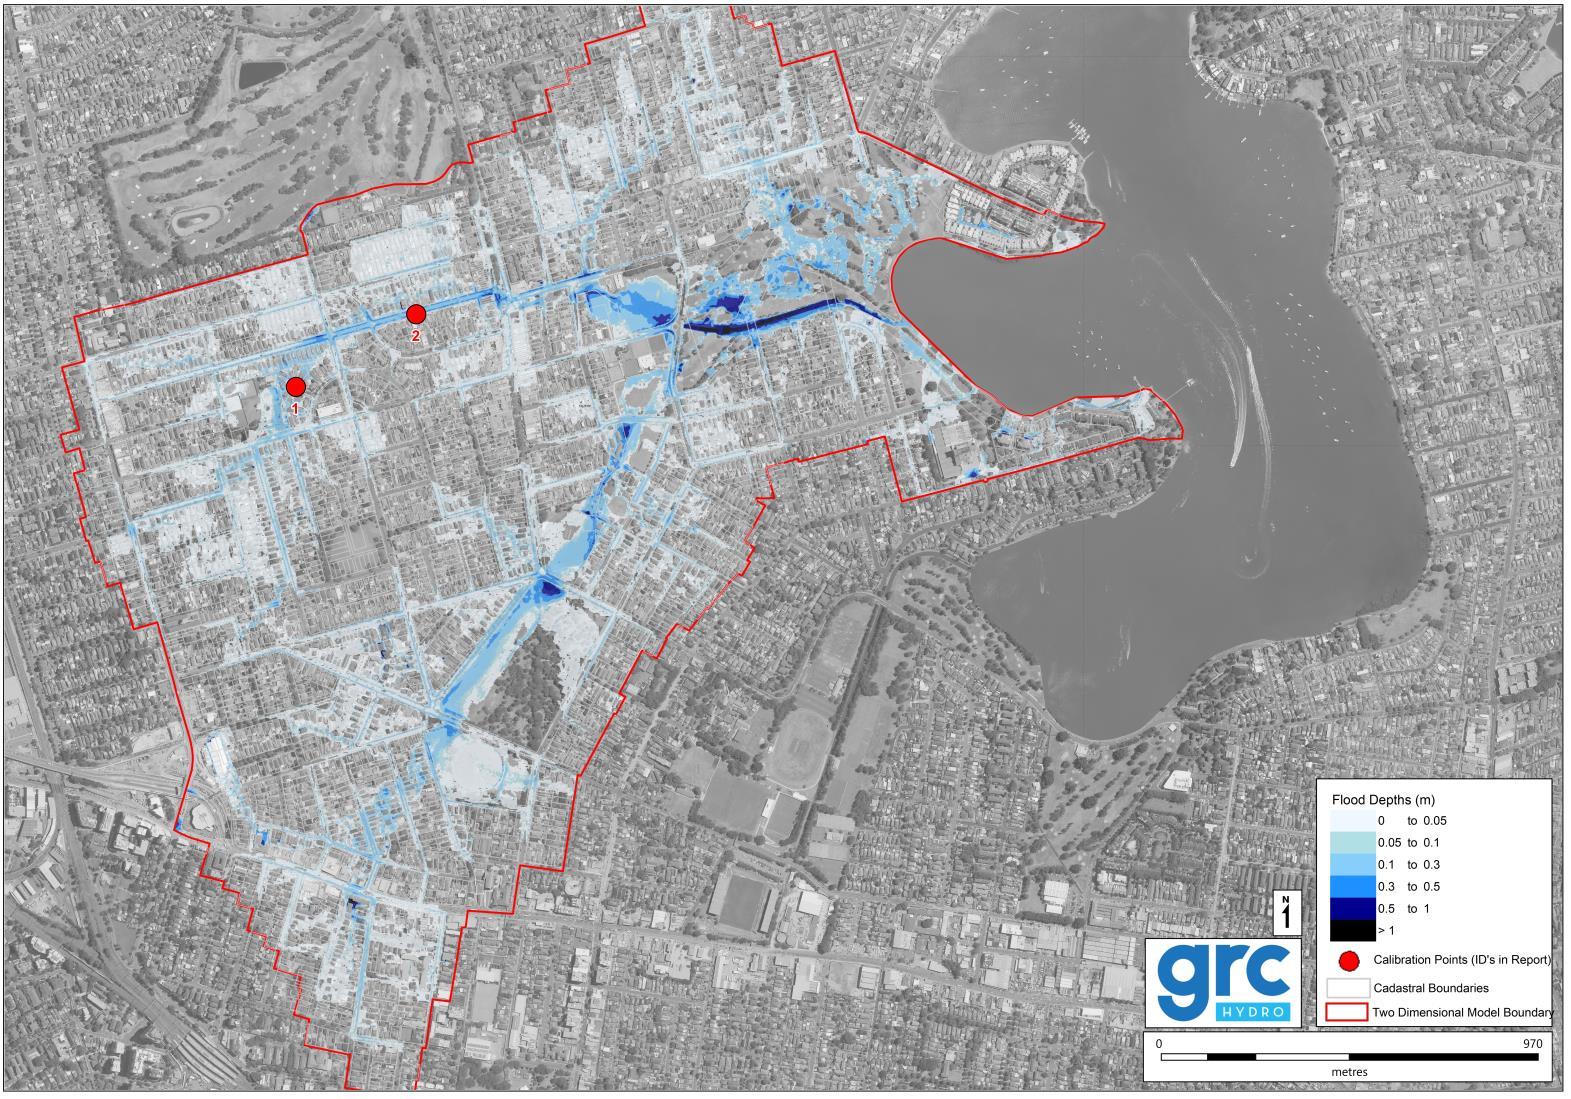
62
Exile Bay Catchment Flood Study Draft Flood Study Report
8.3 Model System Validation
8.3.1 Unit Flow Rate Estimates
Comparison of study area unit flow rates estimates (also known as the specific yield) for the 1 % AEP event, with known values from the Sydney metropolitan area has been undertaken as a means of verification of the flood modelling system. The unit flow rate refers to the peak flow generated per unit area and has units of m3/s per hectare.
Calculations of unit flow rate area affected by the following factors:
• Catchment slope: a steeper catchment will tend to produce a higher rate of runoff;
• Catchment roughness: a smooth catchment will tend to produce a higher rate of runoff than a vegetated catchment;
• Catchment size: a larger catchment will tend to produce lower specific yield. Accordingly, catchment areas of up to 20 hectares only are recommended and were selected for the analysis (see Table 13); and
• Flow obstructions: catchments with defined flow paths (such as roads in urban areas) will produce higher rates of runoff than catchments where flow is obstructed (such as flow which meanders between buildings).
Across the Sydney Metropolitan area, typical unit flow rates range between 0.3 to 0.6 m3/s per hectare for the 1% AEP event (ARR 1987), depending on the individual catchment characteristics.
Comparable catchments within Sydney include:
• Hawthorne Canal (Inner West Council): This catchment in similarly dense and urban. A unit flow rate of 0.5 m3/s per hectare was calculated for the 1 % AEP; and
• North Sydney (North Sydney Council): North Sydney is a dense, urban catchment with an average slope of 10% with flow mainly confined to roadways. An average unit flow rate of 0.52 m3/s per hectare was calculated for the 1% AEP event.
In comparison, Exile Bay has an average slope of 4% and many upstream flow paths meander through areas of residential development and as such unit flow rate was expected to be relatively low. Four locations were selected and the unit flow rates were calculated (see Table 13). The 1% AEP (ARR 1987) peak flood depths and the location of the four sample areas are shown in Figure 19
63 Exile Bay Catchment Flood Study Draft Flood Study Report
Table
Validation of 1% AEP Event Unit Flow Rates ID Area (ha) Peak Flow (m3/s) Unit Flow Rate (m3/s per hectare) 1 10.6 3.6 0.34 2 7.3 2.5 0.34 3 9.5 4.0 0.42 4 14.9 5.5 0.37 Average 0.37
13:
It was found that the calculated unit flow rates, presented in Table 13, align with the calculated flow rates in similar Sydney Metropolitan areas and the specific catchment characteristics. As such, the flood modelling system is producing robust design flow estimates.
The 1% AEP 2 hour event (ARR 1987) was specifically derived for model validation purposes to ensure continuity between comparisons at other Sydney Metropolitan catchments.
8.4 Summary
The model system built to represent flooding in the Exile Bay catchment has been demonstrated to recreate historical flood behaviour (based on eight community observations distributed throughout the study area).
Further, the model’s suitability for design flood estimation was also assessed, by comparison of 1% AEP estimate, against unit flow rates with those achieved for other similar catchments in the Sydney Metropolitan area. This verification established that model estimates are reasonable.
Overall, it was determined that the model was suitable for design flood estimation.
64
Draft
Study Report
Exile Bay Catchment Flood Study
Flood
Figure 19: 1% AEP (ARR1987) Peak flood depths and Unit Flow Rate sample areas
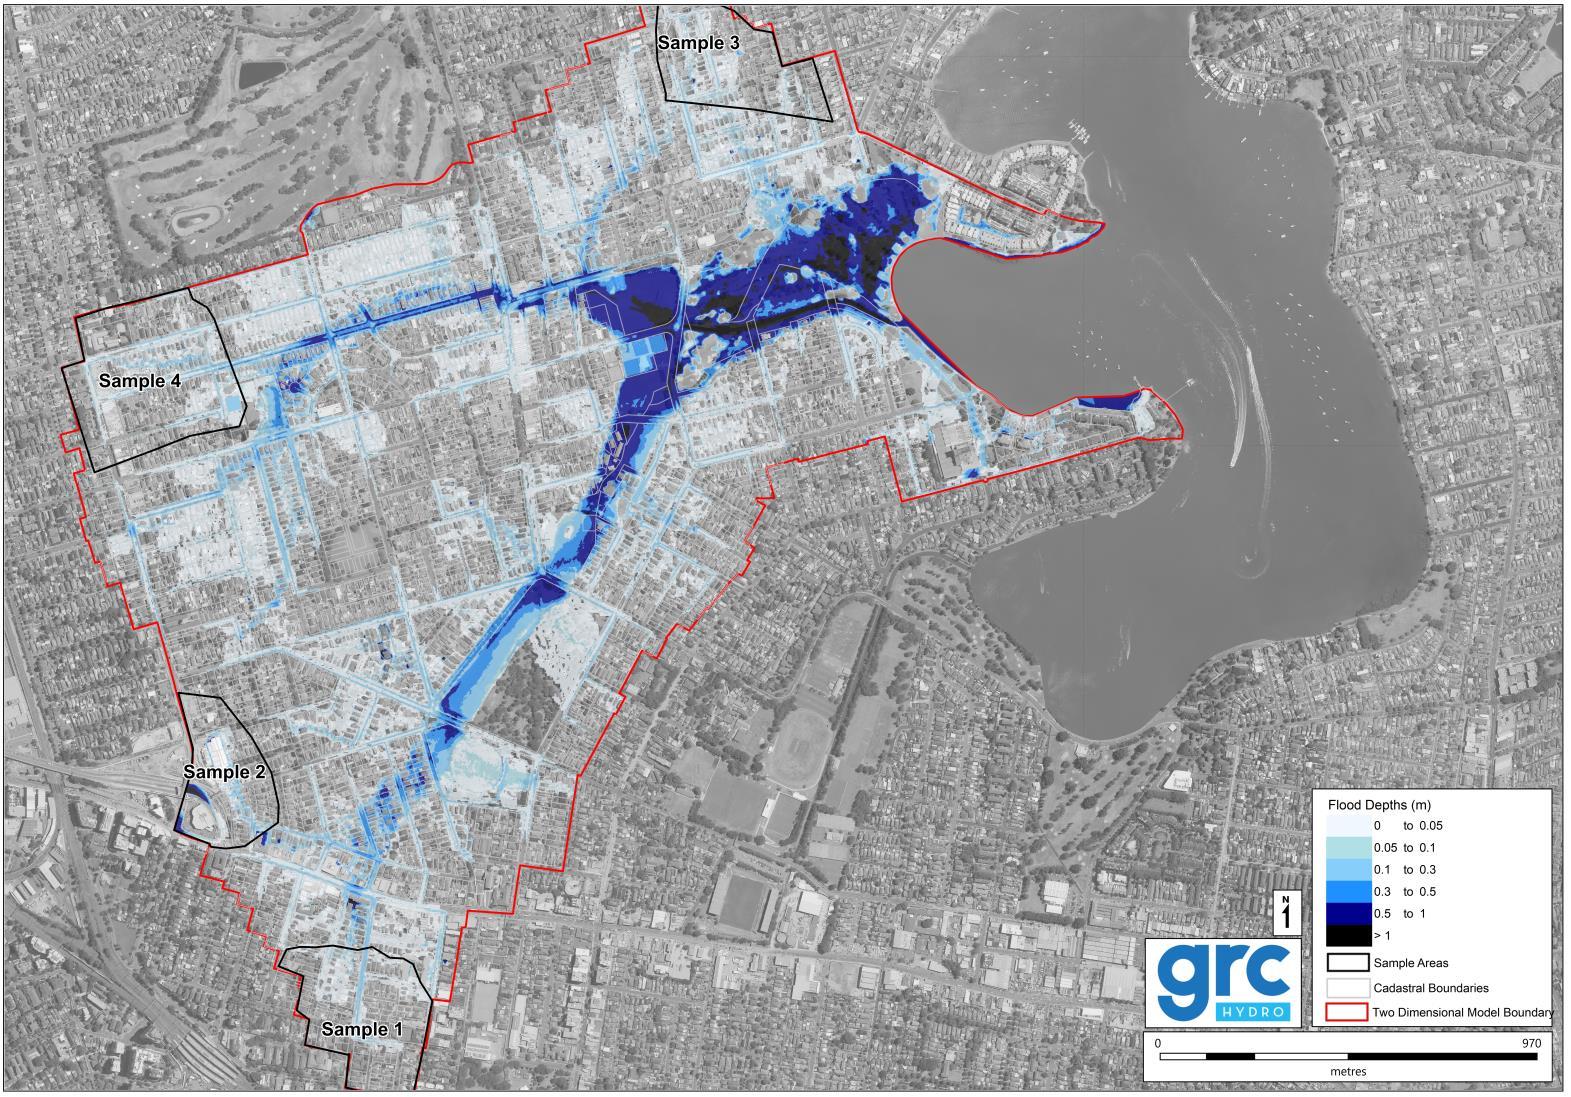
65
Exile Bay Catchment Flood Study Draft Flood Study Report
9. DESIGN FLOOD MODELLING
9.1 Overview
The following sections present the design flood behaviour in Exile Bay using the calibrated hydrologic/hydraulic modelling system. Design flood behaviour has been derived for the 1 EY, 20%, 10%, 5%, 2%, 1%, 0.5%, 0.2% AEP and PMF events. This modelling has been undertaken utilising the methodologies outlined in ARR2016 for mainstream and overland flow flood affectation.
Please note that all figures for Design Flood Modelling are presented at the end of the report.
9.2 Application of ARR2016
ARR2016 provides guidance on the industry best practise approach for design flood estimation across Australia. Key changes to design flood estimation utilising the ARR2016 methodology include:
• Design rainfalldata (i.e. intensity frequency duration data) across Australiahasbeen updated utilising an additional three decades of data (see Section 3.4.3);
• Where previously a single temporal pattern was used for a particular design event and duration, now an ensemble of 10 temporal patterns is modelled per storm duration (see Section 3.4.3);
• Use of the pre burst rainfall incorporated prior to the design storm burst (see Section 6.5); and
• Update to the Initial and Continuing Loss values which better reflect local conditions (see Section 6.4).
Since the nature of overland flow flooding in an urban catchment is typically relatively distributed (multiple flow paths as opposed to one in mainstream flooding), determining the critical storm and duration for design events can be difficult and inaccurate using the hydrologic model. As such, the ensemble of 10 temporal patterns for a range of durations were modelled in both the hydrologic (DRAINS) model and hydraulic (TUFLOW) model. Table 14 presents the durations assessed for each design event.
Table 14: Design events and durations assessed Event (AEP) Durations Assessed (min) No. Model Iterations
1 EY
20%
10%
20, 25, 30, 45, 60, 90, 120, 180 80
20, 25, 30, 45, 60, 90, 120, 180 80
20, 25, 30, 45, 60, 90, 120, 180 80
5% 20, 25, 30, 45, 60, 90, 120, 180, 270 90
2%
1%
0.5%
20, 25, 30, 45, 60, 90, 120, 180, 270 80
10, 15, 20, 25, 30, 45, 60, 90, 120, 180 100
20, 25, 30, 45, 60, 90, 120, 180 80
0.2% 20, 25, 30, 45, 60, 90, 120, 180 80
Total 670
66 Exile Bay
Study Draft Flood Study Report
Catchment Flood
ARR2016 recommends that the critical storm is selected based on the storm that produces the median peak flood level. As such, a critical storm was selected for each event and duration.
For each critical storm a range of durations was then tested. The critical storm duration that produced the peak flood level was then selected as the critical duration Table 15 summarises the critical storms and durations selected for each design event.
Table 15: Selected Critical Durations and Storms Event (AEP) Critical Durations (min) Critical Storm
1 EY 90 Storm 5
20% 90 Storm 5
10% 60 & 90 Storm 7 (60 & 90)
5% 60 & 180 Storm 6 (60) & Storm 4 (180)
2% 45 & 180 Storm 6 (45) & Storm 7 (180)
1% Envelope1
5% Tailwater 25, 45 & 120 1 % Tailwater 60 & 180
Storm 7 (25), Storm 6 (45) & Storm 2 (120) Storm 6 (60) & Storm 4 (180)
0.5% 25, 45 & 120 Storm 7 (25), Storm 6 (45) & Storm 2 (120)
0.2% 25, 45 & 120 Storm 7 (25), Storm 8 (45) & Storm 2 (120)
1 Note: Assessment of the 1% AEP envelope found that peak flood levels are governed by 1% rainfall and 5% tailwater results (25, 45 and 120 min durations). As such, the 5% rainfall and 1% tailwater results have not been considered further. Please see Section 7.3.2 for more information on tailwater levels.
A detailed explanation of the assessment of the critical storms and durations is provided in Section 9.2.1
9.2.1 Selection of Critical Storm and Duration
For each design event ensemble and duration, a median flood level result was generated. For example, for the 10 results (10 temporal patterns for ensemble) in the 1% AEP 25 min event, a median flood level result was calculated for each grid cell throughout the study area. This was repeated for every design event and duration. Thus, producing ten results for comparison for the 1% AEP event for example (see the six durations that were modelled in Table 14).
For each design event, the median flood level results from each duration modelled were compared, and a maximum flood level result was generated from these inputs. For example, for the 1% AEP event, ten median flood level results (six durations as per Table 14) were used to generate an overall maximum flood level result. Therefore, compiling one hundred 1% AEP flood level results into one result.
Since it is impractical to adopt this overall maximum result generated due to time and data allowances, analysis of these results then followed to determine the critical storm duration. This analysis compared the median flood level result for each duration to the overall maximum flood level output and calculated the mean difference between the two results across the entire catchment Analysis was also undertaken to determine the proportion of the median results that were within 2%, 5% and 10% of the overall maximum result. The durations that were found to be closest to the maximum result were selected as critical (see selected durations in Table 15).
67 Exile Bay
Study Report
Catchment Flood Study Draft Flood
Multiple storm durations were found to be critical in the Exile Bay catchment for a range for design events (see Table 15). This result was expected since Exile Bay is a relatively flat catchment (4% average slope) with overland flow paths that meander through residential areas. As such, overland flow paths in upstream areas typically yielded shorter durations while downstream areas such as Massey Park Golf Course yielded longer storm durations.
Once the critical storm duration was selected, a similar process ensued, whereby the median flood level result for that duration was compared to each of the 10 results from the ensemble (ensemble of 10 temporal patterns). For example, the median flood level result for the 1% AEP 25 minute event was compared to the 10 1% AEP 25 minute ensemble results (10 temporal patterns) that produced the median. Analysis was undertaken to calculate the mean difference between the median and each ensemble result as well as determining the proportion of the results that were within 2%, 5% and 10% of the median flood level output. The storm that was found to be closest to the median result was selected as critical (see selected storms in Table 15). Critical storms typically had 98% of the results with less than a 2% difference from the median result.
Since multiple durations were selected for design events, critical storms are then used to produce a maximum flood result. For example, for the 5% AEP event the 60 min (Storm 6) and the 180 min (Storm 4) results were used to produce the 5% AEP design result.
9.3 Flood Depths, Levels & Flows
Design flood results for the full range of design events (1 EY to the PMF events) are presented in Figure 20 to Figure 28.
The following tables provide the peak flood depths (Table 16), level (Table 17) and overland flows (Table 18) at specific locations throughout the catchment.
Table 16: Peak Flood Depths at key locations (shown in Figure 20 to Figure 28) ID Location
1 Low Point on Davidson Ave, near Flavelle St 0.4 0.4 0.5 0.5 0.6 0.6 0.6 0.7 1.4 2 Intersection of Davidson Ave & Majors Bay Rd 0.5 0.6 0.6 0.7 0.7 0.7 0.8 0.8 1.6 3 Low Point on Spring St, near Brewer St 0.3 0.5 0.6 0.7 0.7 0.8 0.9 1.0 2.0 4 Low Point on Curtin Pl 0.5 0.5 0.6 0.7 0.7 0.8 0.8 0.9 1.5 5 Low Point on Wellbank St, near Central Park 0.2 0.2 0.3 0.3 0.3 0.3 0.3 0.4 0.6 6 Low Point on Creewood St 0.2 0.2 0.3 0.3 0.3 0.3 0.3 0.4 0.7 7 Low Point on Kentwell Ave 0.1 0.2 0.4 0.4 0.4 0.4 0.4 0.5 0.8 8 Low Point on Parramatta Rd 0.3 0.3 0.4 0.4 0.4 0.5 0.5 0.5 1.0 9 Low Point on Ada St 0.2 0.3 0.3 0.3 0.3 0.3 0.4 0.4 0.7 10 Low Point on Coles St 0.2 0.3 0.3 0.3 0.4 0.4 0.4 0.5 1.1 11 Low Point on Melbourne St 0.2 0.3 0.3 0.4 0.4 0.5 0.5 0.5 1.3
68
Report
Exile Bay Catchment Flood Study Draft Flood Study
Peak
1 EY 20% AEP 10% AEP 5% AEP 2% AEP 1% AEP 0.5% AEP 0.2% AEP PMF
Flood Depth (m)
12 Low Point on John St, near Goddard Park 0.3 0.4 0.4 0.4 0.5 0.5 0.5 0.6 1.1
13 Low Point on Gipps St, downstream of Goddard Park 0.3 0.4 0.4 0.5 0.5 0.6 0.6 0.6 1.2
14 Intersection of Crane St & Majors Bay Rd 0.4 0.4 0.4 0.5 0.5 0.5 0.6 0.6 1.2
15 Eastern edge of Rothwell Park 0.5 0.5 0.6 0.6 0.7 0.7 0.8 0.8 1.6
16 Downstream of the Rothwell Park 1.3 1.4 1.5 1.5 1.5 1.6 1.6 1.7 2.7
17 Low Point on Jones St 0.3 0.4 0.5 0.6 0.6 0.7 0.8 0.9 2.2
18 Western edge of Jessie Stewart Reserve 0.6 0.8 0.8 0.8 0.9 1.0 1.1 1.1 2.2
19 Low Point on Greenlees Ave 0.2 0.4 0.4 0.5 0.5 0.6 0.7 0.8 1.8
20 Low Point on Ian Parade 0.4 0.6 0.7 0.7 0.8 0.9 1.0 1.0 2.0
21 Intersection of Wellbank St & Ian Parade 0.5 0.7 0.8 0.9 1.0 1.1 1.1 1.2 2.2
22 Low Point on Brewer St, close to Edwards Park 0.5 0.6 0.6 0.7 0.7 0.7 0.8 0.8 1.8
23 Low Point on Smythes St 0.1 0.2 0.3 0.2 0.3 0.4 0.4 0.4 1.2
24 Low Point on Anderson Rd 0.1 0.3 0.4 0.4 0.4 0.4 0.4 0.5 0.8 25 Upstream of the first Saltwater Creek Crossing 1.8 1.9 2.0 2.1 2.2 2.3 2.3 2.4 3.6 26 Upstream of the second Saltwater Creek Crossing 1.8 1.8 1.8 1.9 2.1 2.1 2.2 2.3 3.4 27 Upstream of the Saltwater Creek Crossing closest to Exile Bay 2.1 2.1 2.1 2.3 2.4 2.4 2.4 2.4 2.7 28 Low Point on Cabarita Rd, near Massey Park Golf Club 0.2 0.3 0.3 0.3 0.3 0.3 0.3 0.3 0.5 29 Low Point on Massey Park Golf Course 0.6 0.7 0.7 0.8 1.0 1.0 1.1 1.2 2.4 30 Low Point on Broughton St 0.1 0.3 0.4 0.4 0.4 0.4 0.4 0.4 0.6 31 Downstream of Central Park <0.1 0.1 0.1 0.1 0.1 0.2 0.2 0.2 0.9
Low Point on Davidson Ave, near Flavelle St 8.8 8.9 9.0
9.0 9.1 9.1 9.2 9.9
Intersection of Davidson Ave & Majors Bay Rd 4.8 4.9 4.9 5.0 5.0 5.1 5.1 5.1 5.9 3 Low Point on Spring St, near Brewer St 2.3 2.5 2.5 2.6 2.7 2.8 2.8 2.9 3.9 4 Low Point on Curtin Pl 10.5 10.6 10.7 10.7 10.8 10.8 10.9 10.9 11.6
69 Exile Bay
Study Draft Flood Study Report
Catchment Flood
Table 17: Peak Flood Levels at key locations (shown in Figure 20 to Figure 28) ID Location Peak Flood Level (m AHD) 1 EY 20% AEP 10% AEP 5% AEP 2% AEP 1% AEP 0.5% AEP 0.2% AEP PMF
1
9.0
2
5 Low Point on Wellbank St, near Central Park 12.7 12.8 12.8 12.8 12.8 12.9 12.9 12.9 13.2
6 Low Point on Creewood St 23.8 23.8 23.9 23.9 23.9 23.9 24.0 24.0 24.3
7 Low Point on Kentwell Ave 20.9 21.1 21.2 21.2 21.2 21.3 21.3 21.3 21.6
8 Low Point on Parramatta Rd 15.1 15.1 15.2 15.2 15.2 15.3 15.3 15.3 15.8
9 Low Point on Ada St 13.8 13.8 13.8 13.8 13.9 13.9 13.9 13.9 14.3
10 Low Point on Coles St 12.8 12.9 13.0 13.0 13.0 13.0 13.1 13.1 13.7
11 Low Point on Melbourne St 11.1 11.1 11.2 11.2 11.2 11.3 11.3 11.4 12.1
12 Low Point on John St, near Goddard Park 9.6 9.6 9.6 9.7 9.7 9.7 9.7 9.8 10.3
13 Low Point on Gipps St, downstream of Goddard Park 8.9 9.0 9.1 9.1 9.1 9.2 9.2 9.3 9.8
14 Intersection of Crane St & Majors Bay Rd 5.9 5.9 5.9 6.0 6.0 6.1 6.1 6.1 6.7
15 Eastern edge of Rothwell Park 4.3 4.3 4.4 4.4 4.5 4.5 4.6 4.6 5.4
16 Downstream of the Rothwell Park 3.8 3.9 3.9 4.0 4.0 4.1 4.1 4.2 5.2
17 Low Point on Jones St 2.7 2.8 2.9 3.0 3.0 3.1 3.2 3.3 4.6
18 Western edge of Jessie Stewart Reserve
2.3 2.5 2.6 2.6 2.7 2.8 2.8 2.9 3.9
19 Low Point on Greenlees Ave 2.3 2.5 2.6 2.6 2.6 2.7 2.8 2.9 3.9
20 Low Point on Ian Parade 2.1 2.3 2.4 2.5 2.6 2.7 2.7 2.8 3.8 21 Intersection of Wellbank St & Ian Parade 2.1 2.3 2.4 2.4 2.5 2.6 2.7 2.7 3.7
22 Low Point on Brewer St, close to Edwards Park 2.7 2.8 2.8 2.8 2.9 2.9 2.9 3.0 3.9 23 Low Point on Smythes St 5.5 5.6 5.7 5.7 5.7 5.8 5.8 5.9 6.6 24 Low Point on Anderson Rd 7.8 8.0 8.1 8.1 8.1 8.1 8.1 8.1 8.4 25 Upstream of the first Saltwater Creek Crossing 1.7 1.8 1.8 1.9 2.1 2.1 2.2 2.3 3.5 26 Upstream of the second Saltwater Creek Crossing 1.2 1.2 1.3 1.4 1.5 1.6 1.6 1.7 2.9 27 Upstream of the Saltwater Creek Crossing closest to Exile Bay 1.2 1.2 1.2 1.4 1.4 1.5 1.5 1.5 1.7 28 Low Point on Cabarita Rd, near Massey Park Golf Club 5.9 5.9 6.0 6.0 6.0 6.0 6.0 6.0 6.2 29 Low Point on Massey Park Golf Course 1.7 1.8 1.9 2.0 2.1 2.1 2.2 2.3 3.5 30 Low Point on Broughton St 6.6 6.8 6.9 6.9 6.9 6.9 6.9 6.9 7.1 31 Downstream of Central Park 10.5 10.5 10.5 10.5 10.5 10.6 10.6 10.6 11.3
Based on Book 6 of ARR2016 (Reference 2, Section 7.2.4), small vehicles can withstand flood depths of up to 0.3 m before beginning to float and therefore, flood depth over roadways is critical. The peak flood depths and levels presented in Table 16 and Table 17 indicate that flood depths of 0.3 m are exceeded at many locations in the study area during events as frequent at the 1 EY event, albeit
70 Exile Bay
Draft
Study Report
Catchment Flood Study
Flood
for very short periods. The locations selected in Table 16 and Table 17 are particularly vulnerable to flooding however most of these experience flood depths greater than 0.3 m in the 1 EY event. It also should be noted that with an increase in flood magnitude, the flood depth tends to increase substantially and as such, flood access and evacuation is a critical constraint in Exile Bay.
Table 18: Peak Overland Flows at key locations (shown in Figure 20 to Figure 28) ID Location
1 Low Point on Davidson Ave, near Flavelle St 1.7 3.3 5.1 6.0 8.3 10.1 12.2 15.5 79.1
2 Intersection of Davidson Ave & Majors Bay Rd 2.4 5.1 6.7 8.1 11.0 13.4 15.6 18.4 100.0
3 Low Point on Spring St, near Brewer St 0.0 0.2 0.3 0.6 1.0 1.7 2.5 3.5 35.1
4 Low Point on Curtin Pl 0.7 1.0 1.5 1.7 2.2 2.7 3.2 3.9 15.4
5 Low Point on Wellbank St, near Central Park 0.9 1.6 2.8 3.3 4.6 6.3 7.7 9.7 61.4
6 Low Point on Creewood St 0.1 0.1 0.3 0.3 0.4 0.6 0.7 0.9 5.7
7 Low Point on Kentwell Ave 0.0 0.1 0.3 0.4 0.5 0.9 1.0 1.3 8.6
8 Low Point on Parramatta Rd 0.8 1.3 2.3 2.5 3.1 4.1 4.7 5.5 16.1
9 Low Point on Ada St 0.5 1.2 2.5 2.7 3.6 4.8 5.6 6.9 43.3
10 Low Point on Coles St 0.2 0.9 1.8 2.1 3.0 4.0 4.8 5.9 29.4
11 Low Point on Melbourne St 0.4 1.1 2.2 2.5 3.6 4.6 5.6 7.0 39.9
12 Low Point on John St, near Goddard Park 0.8 1.7 2.3 2.6 3.3 3.7 4.0 4.6 13.8 13 Low Point on Gipps St, downstream of Goddard Park 1.6 3.4 5.1 6.8 9.7 12.0 14.0 17.1 98.2 14 Intersection of Crane St & Majors Bay Rd 3.1 5.7 7.3 9.9 13.2 16.8 20.2 25.5 151.8 15 Eastern edge of Rothwell Park 3.2 5.8 7.4 10.0 13.3 16.8 20.0 25.1 136.8 16 Downstream of the Rothwell Park 2.2 4.8 6.6 9.0 12.3 16.0 19.4 24.9 154.8 17 Low Point on Jones St 0.6 1.7 2.3 3.2 4.5 5.9 7.2 9.4 49.5
18 Western edge of Jessie Stewart Reserve 1.0 2.9 4.3 6.0 8.6 11.7 14.5 19.3 143.5 19 Low Point on Greenlees Ave 0.3 1.9 2.7 3.7 5.2 6.6 8.0 10.2 57.9 20 Low Point on Ian Parade 0.4 2.3 3.6 5.0 7.7 11.9 14.8 19.0 155.2 21 Intersection of Wellbank St & Ian Parade 0.0 0.7 2.3 5.0 10.9 16.9 21.6 28.3 143.5 22 Low Point on Brewer St, close to Edwards Park 0.1 0.3 1.0 1.2 1.8 2.7 3.3 4.2 24.2 23 Low Point on Smythes St 0.2 0.3 0.8 0.9 1.3 1.9 2.4 3.0 16.3 24 Low Point on Anderson Rd 0.3 0.6 1.1 1.2 1.6 2.1 2.4 3.0 16.0 25 Upstream of the first Saltwater Creek Crossing 11.1 12.7 13.6 14.5 15.9 18.0 19.4 21.8 82.6
71 Exile
Report
Bay Catchment Flood Study Draft Flood Study
Peak
1 EY 20% AEP 10% AEP 5% AEP 2% AEP 1% AEP 0.5% AEP 0.2% AEP PMF
Overland Flow (m3/s)
26 Upstream of the second Saltwater Creek Crossing 11.7 13.7 14.9 17.5 21.2 23.0 26.0 30.4 63.9
27 Upstream of the Saltwater Creek Crossing closest to Exile Bay 11.7 13.7 14.9 17.5 21.2 23.0 26.0 30.5 70.1
28 Low Point on Cabarita Rd, near Massey Park Golf Club 0.3 0.5 0.9 1.0 1.1 1.4 1.6 1.8 6.0
29 Low Point on Massey Park Golf Course 0.6 1.2 1.3 1.5 1.9 2.1 2.2 2.5 2.2
30 Low Point on Broughton St 0.0 0.1 0.7 0.8 1.0 1.5 1.7 2.1 8.5
31 Downstream of Central Park 0.3 0.9 1.6 1.9 2.7 3.4 4.2 5.3 30.6
9.4
Flood Hazard
Flood hazard is defined as a source of potential harm or a situation with the potential to result in loss (Reference 2). It is initially calculated based on the depth and velocity of floodwaters. Typically, a flood study will present the provisional hazard mapping and the ensuing Floodplain Risk Management Study and Plan will finalise the hazard calculation by considering other factors such as:
• Isolation During a Flood;
• Effective Warning Time; and
• Rate of Rise of Floodwater.
Flood Hazard is calculated in accordance with the Australian Emergency Management Handbook 7 Guideline (Reference 1) and ARR2016. This considers the threat to people of various ages (children, adults) and to the community interacting with floodwaters (pedestrians, vehicles and those within buildings). Chart 1 and Table 19 present the relationship between the velocity and depth of floodwaters and the corresponding classification.
72 Exile Bay
Study Draft Flood Study Report
Catchment Flood
Chart 1: Flood Hazard Curves (Australian Emergency Management Handbook 7)

Table 19: Flood Hazard Vulnerability Thresholds Hazard Classification Description
H1
H2
H3
H4
H5
H6
Generally safe for vehicles, people and buildings.
Unsafe for small vehicles.
Unsafe for vehicles, children and the elderly.
Unsafe for vehicles and people.
Unsafe for vehicles and people. All buildings vulnerable to structural damage. Some less robust buildings subject to failure.
Unsafe for vehicles and people. All building types considered vulnerable to failure.
Figure 29 to Figure 32 present the flood hazard classifications for the 5% AEP, 1 % AEP, 0.2% AEP and PMF events respectively. Across all design flood events, the majority of the study area has been classified as H1 hazard indicating that flooding in these areas is generally safe for the community. As the flood event increases in magnitude, so too does the flood hazard classifications along the Central Drain and the Main South Drain.
In the 1% AEP event, the majority of the Main South Drain is either a H2 or H3 hazard classification indicating that flooding along this waterway is unsafe for vehicles, children and the elderly. On the Main South Drain there is a small area of H4 to H5 at the constriction downstream of Rothwell Park (Hotspot 2, see Section 12.2) indicating that flooding is unsafe for all vehicles and people. Similarly, along the Central Drain, the hazard classification in the 1% AEP event is typically H2 or H3 with areas of H4 or H5 along on Davidson Avenue as it approaches Majors Bay Road and along Brewer Street. These high hazard classifications (H4 to H5) are primarily located along roadways rather than within
73 Exile Bay
Study Draft Flood Study Report
Catchment Flood
properties in the 1% AEP event As such, it is recommended that traffic and pedestrian management measures are implemented to ensure those in the hazardous areas are safe i.e. cars and pedestrians are not entering hazardous floodwaters. These measures will be further investigated during the Floodplain Risk Management Study and Plan (FRMS&P) however measures may include flood education, flood signage and temporary road/footpath closures during significant predicted downpours.
In the 5% AEP event, a number of key roadways in the catchment are affected by H2 hazard. These include, John Street, Gipps Street, Crane Street, Greenlees Avenue, Davidson Avenue, Majors Bay Road, Brewer Street and Spring Street. Further, Ian Parade and Wellbank Street are both affected by H3 hazard in the 5% AEP making it unsafe for vehicles and people during this event.
9.5 Flood Function
Flood Function (also known as Hydraulic Categories) refers to the classification of floodwaters into three categories; flow conveyance, flood storage and flood fringe. These categories help to describe the nature of flooding across the floodplain and aid planning when assessing developable areas. According to the Australian Emergency Management Handbook 7 (Reference 1), these three categories can be defined as:
• Flow Conveyance the areas where a significant proportion of the floodwaters flow and typically align with defined channels. If these areas are blocked or developed, there will be significant redistribution of flow and increased flood levels across the floodplain. Generally, flow conveyance areas have deep and/or fast moving floodwaters;
• Flood Storage areas where, during a flood, a significant proportion of floodwaters extend into, water is stored and then recedes after a flood. Significant filling or development in these areas may increase flood levels nearby.
• Flood Fringe areas that make up the remainder of the flood extent. Development in these areas are unlikely to alter flood behaviour in the surrounding area.
There is no prescribed methodology for deriving each category and as such categorisation is typically determined based on experience and knowledge of the study area.
For the current study, the flood function classifications have been undertaken in accordance with the findings of Howells et al, 2003 (Reference 15), who defined these categories based on the depth and velocity of flood waters. For the technical calculation of these classifications in Exile Bay the following is proposed:
• Flow Conveyance areas where:
o the velocity depth product > 0.25 m2/s and peak velocity >0.25 m/s or
o velocity > 1 m/s
• Flood Storage areas outside the Flow Conveyance where depths exceed 0.5 m
• Flood Fringe areas outside of Flow Conveyance where depths are less than 0.5 m
Figure 33 to Figure 36 present the Flood Function for the 5% AEP, 1% AEP, 0.2% AEP and PMF events respectively.
74 Exile
Report
Bay Catchment Flood Study Draft Flood Study
In the 1% AEP event, the flow conveyance in Exile Bay occurs primarily along key flow paths such as the Central Drain, Main South Drain and Saltwater Creek. Flow conveyance also occurs along key overland flow paths through private properties. Development in these areas is likely to significantly alter the distribution of flow and increase flood levels nearby.
Flood Storage areas are predominantly found along the downstream areas at Edwards Park, Greenlees Park and in Massey Park Golf Course. Filling of flood storage areas may cause flood level impacts in downstream neighbouring areas.
The remainder of flood affected areas in the catchment are classified as Flood Fringe. Development in areas of Flood Fringe are unlikely to significantly alter flood behaviour.
9.6 Preliminary Flood Planning Area
The Flood Planning Area (FPA) defines properties that are subject to flood related development controls. The FPA is a key planning tool for managing and mitigating flood risk in an LGA.
The process of deriving the FPA varies greatly depending on the dominant flood mechanism in a study area. The Floodplain Development Manual (Reference 17) recommends the generation of the FPA using the 1% AEP flood level plus 0.5 m freeboard level. This methodology is suitable for mainstream flooding however in Exile Bay if this approach is used to define the FPA, homes with no level of flood affectation will be subject to flood related development controls. Since such an outcome is untenable, a different approach is utilised for deriving the FPA in areas of overland flow. Where the two flood mechanisms exist, such as in the study area, FPA’s generated by both methods will be enveloped.
For areas affected by overland flow, analysis of the flood affection of each cadastral lot can be undertaken to derive the FPA. This approach has been adopted in numerous studies within the Sydney Metropolitan area.
The following methodology has been used to select cadastral lots within the preliminary Exile Bay FPA:
• Mainstream Flooding: The 1% AEP peak flood level within Saltwater Creek, Edwards Park and Greenlees Park plus 0.5 m freeboard, then extending the level perpendicular to the direction of flow.
• Overland Flow Flooding: Cadastral lots where 10% or greater of the cadastral lot is affected by 1% AEP peak flood depths of greater than 0.15 m
This selection process will be finalised during the subsequent Floodplain Risk Management Study and Plan after a detailed assessment of flood risk is undertaken.
The current study has undertaken a preliminary FPA lot selection and has identified properties that may be included for notation in the Section 10.7 certificate. Residents of these properties were be notified during public exhibition of the Draft Flood Study
75 Exile
Draft
Study Report
Bay Catchment Flood Study
Flood
9.7 Flood Emergency Response
Flood Emergency Response pertains to a set of classifications that advise how a community is affected by flooding and informs the decision making process during a flood event. These classifications consider the full range of flood behaviour up to the PMF event. Factors such as isolation, evacuation routes, effective warning times, the rate of rise of floodwaters and the duration of isolation are considered when determining the classification. In the current study, Flood Emergency Response classifications have been undertaken in accordance with the Australian Emergency Management Handbook 7 (Reference 1) and are detailed in Table 20
Table 20: Flood Emergency Response Classifications (Reference 1)
Primary Classification Secondary Classification Tertiary Classification
Isolated (I)
Submerged (FIS)
Flooded (F)
The area is flooded in the PMF
Isolated from community evacuation facilities by floodwater and/or impossible terrain as waters rise during events up to the PMF. Likely to lose services during a flood.
Exit Route (E)
Areas that are not isolated in the PMF and have an exit route to community evacuation facilities.
Where all land in isolate area will be fully submerged in PMF after becoming isolated. Elevated (FIE)
Where there is a substantial amount of land in isolated areas elevated above the PMF.
Overland Escape (FEO)
Evacuation from the area relies upon overland escape routes that rise out of the floodplain Rising Road (FER)
Evacuation routes from the area follow roads that rise out of the floodplain.
Indirect Consequence (NIC)
Not Flooded
Areas that are not flooded but may lose services. Flood Free Areas that are not flood affected or indirectly affected by flooding.
Emergency response classifications typically pertain to areas impeded by mainstream flooding where there are significant warning times allowing for preventative action to be taken. In areas predominantly affected by overland and flash flooding, such as Exile Bay, preventative action cannot be undertaken due to a lack of flood warning time (effectively zero). In the event of flooding, generally, residents are safest indoors and should avoid walking or driving in flood waters. Therefore, in Exile Bay, emergency response classifications will be most useful for agencies, such as the SES, as a response to the aftermath of a flood.
Figure 38 presents the emergency response classifications for Exile Bay. Much of the catchment was found to be Flood Free, Indirect Consequence or Flooded with a Rising Road Exit Route (see Table 20). Along the Main South Drain and the Central Drain there are large areas of Flooded, Isolated and Submerged (FIS) or areas with an Overland Escape Exit Route (FEO).
76 Exile Bay
Study Draft
Study Report
Catchment Flood
Flood
In areas of FEO, road access would not be possible for the duration of the flood event however access can be achieved overland (i.e. on foot). Due to the short duration of these events (for much of the catchment peak duration will be measured in minutes), residents in these areas would generally be safest waiting for floodwaters to recede before exiting their properties.
In areas of FIS, road access would be cut prior to properties being inundated by floodwaters. The flooding Hotspots assessed in Section 12 are located within areas classified as FIS.
Flood Emergency Response classifications are derived for the PMF flood event only Due to the flash flood nature of the catchment the event magnitude is unknown at the time of the event If those responding to a flood used Emergency Response classifications derived for a smaller event than that which is occurring, these classifications may be incorrect. A key example of this is the classification of Flooded, Isolated, Elevated (FIE) and Flooded, Isolated, Submerged (FIS). The classifications derived for a smaller event may define areas as FIE meaning that they lose flood access however they are not inundated. In larger events however, these FIE areas may become inundated meaning that their classification changes to FIS and as such their affectation is more severe. Thus, given the flash flood nature of the catchment and the unknown event magnitude, it is precautionary to only use the PMF emergency response classifications.
77 Exile Bay
Study Draft Flood Study Report
Catchment Flood
10. SENSITIVITY ANALYSIS
10.1 Overview
Sensitivity analysis describes the sensitivity of model results to changes in the modelling parameters. In hydraulic modelling, each model parameter is estimated based on the available data, guidance and knowledge of the catchment. These estimates, however, rely on a series of assumptions and therefore the hydraulic model has a degree of uncertainty. A sensitivity analysis therefore qualifies the assumptions that have been made by measuring their effect on the modelled flood behaviour. Large changes in flood behaviour indicate parameters that the model is particularly sensitive to.
In the current study the following parameters have been assessed:
• Structure blockage (see Section 10.2); and
• Hydraulic roughness (see Section 10.3)
The model sensitivity is tested by varying each parameter within a reasonable estimate range, and then assessing the output from the hydraulic model to determine the change in peak flood level results for each scenario. This analysis has been undertaken for the 5%, 1% and 0.2% AEP events. The following sections present the results of the sensitivity analysis.
10.2
Structure Blockage
Sensitivity analysis was undertaken on the blockage assumptions made in the hydraulic model. This analysis assessed two scenarios based on guidance from ARR2016 (Reference 2); an ‘all clear’ approach where all structures are completely unblocked and then a twice blocked approach where the calculated design blockage level is doubled. These scenarios were tested for the 5%, 1% and 0.2% AEP flood events and the results are summarised in Table 21 at various locations in the catchment Based on this analysis, it was found that there was very little sensitivity to structure blockage in Exile Bay.
Table 21:
Blockage Sensitivity
78 Exile Bay Catchment Flood Study Draft Flood Study Report
ID Location Change in Flood Design Level (m) 5% AEP 1% AEP 0.2% AEP Zero Doubled Zero Doubled Zero Doubled 1 Low Point on Davidson Ave, near Flavelle St 0.00 0.00 0.00 0.00 0.00 0.00 2 Intersection of Davidson Ave & Majors Bay Rd 0.01 0.00 0.00 0.02 0.00 0.01 3 Low Point on Spring St, near Brewer St 0.01 0.00 0.00 0.02 0.00 0.01 4 Low Point on Curtin Pl 0.05 0.00 0.00 0.03 0.00 0.02 5 Low Point on Wellbank St, near Central Park 0.03 0.00 0.00 0.02 0.00 0.02 6 Low Point on Creewood St 0.02 0.00 0.00 0.01 0.00 0.01 7 Low Point on Kentwell Ave 0.03 0.00 0.00 0.03 0.00 0.02 8 Low Point on Parramatta Rd 0.03 0.00 0.00 0.02 0.00 0.01
Structure
9 Low Point on Ada St 0.01 0.00 0.00 0.00 0.00 0.00
10 Low Point on Coles St 0.02 0.00 0.00 0.01 0.00 0.01
11 Low Point on Melbourne St 0.02 0.00 0.00 0.01 0.00 0.01
12 Low Point on John St, near Goddard Park 0.01 0.00 0.00 0.00 0.00 0.00
13 Low Point on Gipps St, downstream of Goddard Park 0.00 0.00 0.00 0.00 0.00 0.01
14 Intersection of Crane St & Majors Bay Rd 0.01 0.00 0.00 0.01 0.00 0.00
15 Eastern edge of Rothwell Park 0.01 0.00 0.00 0.01 0.00 0.00
16 Downstream of the Rothwell Park 0.04 0.00 0.00 0.03 0.00 0.02
17 Low Point on Jones St 0.06 0.00 0.00 0.05 0.00 0.03
18 Western edge of Jessie Stewart Reserve 0.04 0.00 0.00 0.03 0.00 0.02
19 Low Point on Greenlees Ave 0.04 0.00 0.00 0.03 0.00 0.02
20 Low Point on Ian Parade 0.04 0.00 0.00 0.03 0.00 0.02 21 Intersection of Wellbank St & Ian Parade 0.04 0.00 0.00 0.03 0.00 0.02 22 Low Point on Brewer St, close to Edwards Park 0.02 0.00 0.00 0.01 0.00 0.01 23 Low Point on Smythes St 0.11 0.00 0.00 0.07 0.00 0.05 2 4 Low Point on Anderson Rd 0.03 0.00 0.00 0.02 0.00 0.02 25
Upstream of the first Saltwater Creek Crossing 0.00 0.00 0.01 0.02 0.00 0.02 26 Upstream of the second Saltwater Creek Crossing 0.00 0.00 0.04 0.03 0.00 0.01 27 Upstream of the Saltwater Creek Crossing closest to Exile Bay 0.00 0.00 0.05 0.05 0.00 0.00 28 Low Point on Cabarita Rd, near Massey Park Golf Club 0.01 0.00 0.00 0.01 0.00 0.00 29 Low Point on Massey Park Golf Course 0.01 0.00 0.01 0.02 0.00 0.02 30 Low Point on Broughton St 0.00 0.00 0.00 0.00 0.00 0.00 31 Downstream of Central Park 0.00 0.03 0.00 0.01 0.00 0.00
10.3 Hydraulic Roughness
Hydraulic roughness values adopted in the hydraulic modelling were tested for their sensitivity. This assessment increased and decreased the adopted roughness values by 20% for the 5%, 1% and 0.2% AEP flood events. The results of this analysis are presented in Table 22 at various locations in the study area. This analysis found that there was very little sensitivity to the hydraulic roughness values in Exile Bay with all variations within 0.1 m of the current results.
79 Exile Bay
Draft
Study Report
Catchment Flood Study
Flood
Table 22: Hydraulic Roughness Sensitivity
ID Location
Change in Flood Design Level (m)
5% AEP 1% AEP 0.2% AEP 20% 20% 20% 20% 20% 20%
Low Point on Davidson Ave, near Flavelle St 0.01 0.01 0.02 0.01 0.01 0.01 2 Intersection of Davidson Ave & Majors Bay Rd 0.00 0.01 0.01 0.02 0.02 0.03
1
3 Low Point on Spring St, near Brewer St 0.02 0.02 0.03 0.02 0.04 0.03
4 Low Point on Curtin Pl 0.01 0.01 0.01 0.01 0.00 0.01 5 Low Point on Wellbank St, near Central Park 0.01 0.01 0.01 0.01 0.00 0.01
6 Low Point on Creewood St 0.00 0.01 0.01 0.01 0.01 0.01 7 Low Point on Kentwell Ave 0.00 0.01 0.01 0.01 0.01 0.01
8 Low Point on Parramatta Rd 0.01 0.00 0.00 0.00 0.00 0.00
9 Low Point on Ada St 0.00 0.00 0.01 0.01 0.01 0.01 10 Low Point on Coles St 0.00 0.00 0.01 0.01 0.01 0.01 11 Low Point on Melbourne St 0.00 0.01 0.00 0.01 0.01 0.01 12 Low Point on John St, near Goddard Park 0.01 0.01 0.01 0.01 0.01 0.01
13 Low Point on Gipps St, downstream of Goddard Park 0.02 0.02 0.04 0.02 0.03 0.02 14 Intersection of Crane St & Majors Bay Rd 0.00 0.00 0.01 0.00 0.00 0.00
15 Eastern edge of Rothwell Park 0.01 0.01 0.01 0.01 0.03 0.02 16 Downstream of the Rothwell Park 0.01 0.02 0.00 0.02 0.02 0.03 17 Low Point on Jones St 0.02 0.02 0.01 0.03 0.01 0.02 18 Western edge of Jessie Stewart Reserve 0.01 0.01 0.01 0.02 0.02 0.02 19 Low Point on Greenlees Ave 0.01 0.01 0.01 0.02 0.02 0.02 20 Low Point on Ian Parade 0.01 0.02 0.00 0.01 0.00 0.01 21 Intersection of Wellbank St & Ian Parade 0.00 0.02 0.01 0.00 0.01 0.00 22 Low Point on Brewer St, close to Edwards Park 0.01 0.00 0.01 0.01 0.00 0.00 23 Low Point on Smythes St 0.04 0.03 0.01 0.02 0.00 0.02 24 Low Point on Anderson Rd 0.01 0.00 0.01 0.00 0.00 0.00 25 Upstream of the first Saltwater Creek Crossing 0.06 0.05 0.04 0.03 0.04 0.04 26 Upstream of the second Saltwater Creek Crossing 0.00 0.00 0.05 0.03 0.02 0.02 27 Upstream of the Saltwater Creek Crossing closest to Exile Bay 0.00 0.00 0.06 0.05 0.00 0.00
80 Exile Bay
Study Draft
Study Report
Catchment Flood
Flood
28
Low Point on Cabarita Rd, near Massey Park Golf Club 0.00 0.00 0.00 0.00 0.00 0.00 29 Low Point on Massey Park Golf Course 0.05 0.04 0.04 0.03 0.04 0.04 30 Low Point on Broughton St 0.00 0.00 0.00 0.00 0.00 0.00 31 Downstream of Central Park 0.01 0.00 0.01 0.00 0.01 0.01
81 Exile Bay
Study Draft
Study Report
Catchment Flood
Flood
11. CLIMATE CHANGE
The impact of climate change on flood behaviour in Exile Bay has been assessed in accordance with ARR2016. The assessment used the IPCC (Intergovernmental Panel on Climate Change) greenhouse gas concentration scenarios and subsequent modelling estimating each scenario’s effect on rare rainfall events. There are four IPCC greenhouse gas concentration projections named RCP 2.5, 4.5, 6.0 and 8.5, with RCP 2.5 being the most optimistic and 8.5 the least optimistic.
The ARR2016 methodology recommends the use of RCP 4.5 and 8.5 and the relative projected increase in precipitation intensity. These intensities are obtained from the ARR Data Hub and are presented in Table 23 for the 2090 estimate at Exile Bay.
Table 23: Climate Change Factors Percentage Increase in Rainfall Intensity in 2090 Year RCP 4.5 RCP 8.5 2090 +9.1 % +18.6 %
Table 23 indicates that under a relatively low emissions scenario (RCP 4.5), rainfall intensity will increase by 9.1% in Exile Bay in 2090. The significance of this percentage is measured by comparing it to the range of design flood events. The results of this assessment are shown in Table 24, which compares the total rainfall depths for three rare flood events (1%, 0.5% and 0.2% AEP) to each event with increased rainfall in accordance with the two emissions scenarios.
Table 24: Comparison between Design Rainfall Depths and Projected Climate Change Rainfall Depths Scenario\Rainfall Depth (mm) 1% AEP 0.5% AEP 0.2% AEP Design 48 52 59 RCP 4.5 52 57 64 RCP 8 5 57 62 70
Table 24 shows that the 1% AEP event will increase to a magnitude between the 0.5% and 0.2% AEP events in each emission scenario.
Table 25 presents the changes to peak flood levels resulting from the adopted climate change scenarios. It was found that on average, the change in peak flood level was less than 0.1 m in all scenarios., with the exception of the RCP 8.5 in the PMF which had an average change in design level of 0.12 m.
Table 25 Climate Change Sensitivity:
82 Exile Bay
Draft
Study Report
Catchment Flood Study
Flood
ID Change in Flood Design Level (m) 1% AEP 0.5% AEP 0.2% AEP PMF RCP 4.5 RCP 8.5 RCP 4.5 RCP 8.5 RCP 4.5 RCP 8.5 RCP 4.5 RCP 8.5 1 0.03 0.07 0.04 0.08 0.04 0.08 0.07 0.14 2 0.03 0.06 0.03 0.05 0.03 0.06 0.09 0.18 3 0.06 0.11 0.05 0.10 0.05 0.11 0.08 0.17 4 0.05 0.09 0.04 0.08 0.05 0.08 0.05 0.10
5 0.02 0.04 0.02 0.04 0.03 0.04 0.02 0.04
6 0.01 0.02 0.01 0.02 0.01 0.02 0.03 0.05
7 0.02 0.03 0.02 0.03 0.02 0.03 0.03 0.05 8 0.02 0.04 0.02 0.04 0.02 0.04 0.03 0.05 9 0.02 0.03 0.01 0.03 0.02 0.03 0.04 0.08 10 0.03 0.05 0.03 0.06 0.03 0.05 0.06 0.11 11 0.04 0.07 0.04 0.07 0.04 0.07 0.07 0.14 12 0.02 0.05 0.03 0.06 0.03 0.05 0.05 0.10 13 0.03 0.06 0.04 0.07 0.03 0.06 0.05 0.10 14 0.04 0.06 0.03 0.06 0.03 0.06 0.04 0.09 15 0.04 0.08 0.04 0.08 0.04 0.08 0.07 0.14 16 0.05 0.09 0.05 0.09 0.05 0.09 0.09 0.17 17 0.09 0.15 0.08 0.14 0.08 0.15 0.09 0.18 18 0.06 0.10 0.06 0.11 0.06 0.10 0.09 0.18 19 0.06 0.10 0.05 0.11 0.05 0.10 0.09 0.18 20 0.05 0.10 0.05 0.09 0.05 0.09 0.09 0.18 21 0.05 0.10 0.04 0.08 0.05 0.09 0.09 0.18 22 0.03 0.05 0.03 0.06 0.03 0.06 0.09 0.18 23 0.04 0.07 0.04 0.07 0.04 0.07 0.06 0.12 24 0.01 0.02 0.01 0.02 0.01 0.02 0.06 0.12 25 0.06 0.12 0.07 0.13 0.07 0.13 0.09 0.18 26 0.01 0.06 0.06 0.12 0.05 0.11 0.07 0.14 27 0.04 0.03 0.01 0.02 0.01 0.02 0.03 0.06 28 0.01 0.01 0.01 0.02 0.01 0.02 0.01 0.03 29 0.06 0.12 0.07 0.13 0.07 0.13 0.09 0.18 30 0.01 0.02 0.01 0.01 0.01 0.01 0.01 0.02 31 0.02 0.05 0.03 0.05 0.02 0.05 0.06 0.12
11.1 Sea Level Rise
Guidance on predicted sea level rise was released by the NSW Government in 2009 and by OEH in 2010 and then, in 2012, the NSW State Government retracted this advice. Since that time, sea level rise has been determined by individual local government areas.
In the absence of sea level rise advice, a 2100 level of 0.9 m has been adopted and tested for the current study in accordance with the “NSW Sea Level Rise Policy Statement” (October 2009). The application of these levels in the Exile Bay hydraulic model are summarised in Table 26
83 Exile Bay
Study Report
Catchment Flood Study Draft Flood
Table 26: Adopted 2100 Sea Level Rise Tailwater Conditions Design Event (AEP) 2100 Sea Level Rise Tailwater Level (m AHD)
1% Harbour Level + 0.9 m 1.435 m AHD + 0.9 m = 2.335 m AHD
1% Envelope
5% Harbour Level + 0.9 m 1.375 m AHD + 0.9 m = 2.275 m AHD 0.5%
1% Harbour Level + 0.9 m 1.435 m AHD + 0.9 m = 2.335 m AHD 0.2%
1% Harbour Level + 0.9 m 1.435 m AHD + 0.9 m = 2.335 m AHD PMF
1% Harbour Level + 0.9 m 1.435 m AHD + 0.9 m = 2.335 m AHD
Changes to peak flood levels from the sea level rise scenario are presented in Table 27. As expected, peak, flood levels in upstream areas were found to be generally unaffected by a change in sea level however significant increases of up to 0.86 m were found in downstream areas such as Massey Park Golf Club and along Saltwater Creek.
Table 27: Sea Level Rise Sensitivity
ID Location
Change in Design Flood level with 2090 sea level rise (0.9 m)
1% AEP 0.5% AEP 0.2% AEP PMF
1 Low Point on Davidson Ave, near Flavelle St 0.00 0.00 0.00 0.00 2 Intersection of Davidson Ave & Majors Bay Rd 0.01 0.01 0.00 0.00 3 Low Point on Spring St, near Brewer St 0.04 0.04 0.04 0.02 4 Low Point on Curtin Pl 0.01 0.01 0.01 0.00 5 Low Point on Wellbank St, near Central Park 0.01 0.01 0.01 0.00 6 Low Point on Creewood St 0.00 0.00 0.00 0.00 7 Low Point on Kentwell Ave 0.00 0.00 0.00 0.00 8 Low Point on Parramatta Rd 0.00 0.00 0.00 0.00 9 Low Point on Ada St 0.00 0.00 0.00 0.00 10 Low Point on Coles St 0.00 0.00 0.00 0.00 11 Low Point on Melbourne St 0.00 0.00 0.00 0.00 12 Low Point on John St, near Goddard Park 0.00 0.00 0.00 0.00 13 Low Point on Gipps St, downstream of Goddard Park 0.00 0.00 0.00 0.00 14 Intersection of Crane St & Majors Bay Rd 0.00 0.00 0.00 0.00 15 Eastern edge of Rothwell Park 0.00 0.00 0.00 0.00 16 Downstream of the Rothwell Park 0.01 0.01 0.01 0.00 17 Low Point on Jones St 0.03 0.03 0.02 0.00 18 Western edge of Jessie Stewart Reserve 0.05 0.04 0.04 0.02 19 Low Point on Greenlees Ave 0.05 0.04 0.04 0.02 20 Low Point on Ian Parade 0.05 0.04 0.03 0.02
84 Exile
Report
Bay Catchment Flood Study Draft Flood Study
21 Intersection of Wellbank St & Ian Parade 0.06 0.04 0.03 0.03 22 Low Point on Brewer St, close to Edwards Park 0.01 0.01 0.01 0.02 23 Low Point on Smythes St 0.01 0.01 0.01 0.00 24 Low Point on Anderson Rd 0.00 0.00 0.00 0.00 25 Upstream of the first Saltwater Creek Crossing 0.27 0.27 0.22 0.03 26 Upstream of the second Saltwater Creek Crossing 0.73 0.73 0.67 0.06 27
Upstream of the Saltwater Creek Crossing closest to Exile Bay 0.81 0.86 0.85 0.68 28
Low Point on Cabarita Rd, near Massey Park Golf Club 0.00 0.00 0.00 0.00 29 Low Point on Massey Park Golf Course 0.26 0.26 0.22 0.03 30 Low Point on Broughton St 0.00 0.00 0.00 0.00 31 Downstream of Central Park 0.00 0.00 0.00 0.00
85 Exile Bay Catchment Flood Study Draft Flood Study Report
12. HOTSPOT ANALYSIS
Hotspots refer to areas that are particularly flood affected and/or affected by hazardous flooding. These areas have been identified over the course of the flood study via consultation with Council and the community and analysis of flood modelling results. The following sections will discuss the flood mechanisms affecting the selected hotspots and suggest potential measures for mitigation. Please note that all figures for the Hotspot Analysis are presented at the end of the report.
12.1 Hotspot
1: Parramatta Road to
John Street
Hotspot 1 denotes the natural overland flow path at the upstream reach of the Main South Drain. Hotspot 1 traverses properties between Parramatta Road and John Street. Figure 39 presents the 5% AEP, 1% AEP and PMF design flood results at Hotspot 1 and the peak flow results at various locations along the flow path.
Flow originates in the upper Exile Bay catchment areas (in Burwood Council LGA) and flows in a northerly direction toward Parramatta Road where it enters the Canada Bay LGA. The catchment area upstream of Parramatta Road is approximately 22 hectares. In the 1% AEP event, approximately 5.5 m3/s (4.3 m3/s overland flow and 1.2 m3/s of pipe flow) crosses Parramatta Road at the low point downstream of Phillip Street, Strathfield. Flood waters then enter Coles Street where 6.6 m3/s (4.7 m3/s of overland flow and 1.9 m3/s of pipe flow) flows toward the low point in the road before traversing properties along Coles Street and Melbourne Street. In the 1% AEP event, 10 m3/s (7.2 m3/s of overland flow and 2.8 m3/s of pipe flow) moves through properties on Melbourne Street toward John Street.
The capacity of the trunk drainage system, between Ada Street and Gipps Street is reached in the 1 EY event and as such additional flow is conveyed overland. Increasing the capacity of the trunk drainage system would provide some benefit however the application of this measure has limited feasibility as the current pipe network lies beneath private property. Furthermore, increasing the drainage capacity is unlikely to be an economic means of eliminating overland flow along Hotspot 1. It is recommended that the Floodplain Risk Management Study and Plan (FRMS&P) investigate mitigation measures along this overland flow path.
12.2 Hotspot 2: Constriction downstream of Rothwell Park
Hotspot 2 represents a flow constriction along the Main South Drain downstream of Rothwell Park. At this constriction, overland flow moves along the low point between the Council Depot in the east and behind properties on Jones Street in the west. Figure 40 present the 5% AEP, 1% AEP and PMF design flood results at Hotspot 2 and the peak flow results at various locations along the flow path.
The Main South Drain at Hotspot 2 has an upstream catchment area of approximately 115 hectares. In the 1% AEP event, 19.6 m3/s (10.1 m3/s of overland flow and 9.5 m3/s of pipe flow) flows through the constriction and properties nearby are inundated by depths of up to 0.7 m. Although Hotspot 2 is traversed by several large stormwater assets, these assets are full in the 1EY event. As such, it is recommended that the FRMS&P investigate mitigation measures along this flow path such as
86 Exile Bay
Study Draft Flood Study Report
Catchment Flood
modifications to the mounding of the Council depot site to increase the conveyance capacity along this flow path.
12.3 Hotspot 3: Central Drain upstream of Davidson Avenue
Hotspot 3 pertains to the upper reaches of the Central Drain where several overland flow paths meet at Wellbank Street, upstream of Central Park. Figure 41 present the 5% AEP, 1% AEP and PMF design flood results at Hotspot 3 and the peak flow results at various locations along the flow path.
Overland flow paths from the 34 hectare catchment, upstream of Wellbank Street, combine before flowing through Central Park and Curtin Place and moving toward Davidson Avenue (see Section 12.4). These overland flow paths and their respective peak 1% AEP flows are listed below:
• Overland flow path from Station Street and Cross Street 4.1 m3/s (2.8 m3/s of overland flow and 1.3 m3/s of pipe flow);
• Overland flow path from Macnamara Avenue 4.9 m3/s (4.4 m3/s of overland flow and 0.5 m3/s of pipe flow);
• Overland flow path from Castlereagh Street 1.4 m3/s of overland flow; and
• Minor overland flow path from the catchment east of Wellbank Street 0.8 m3/s (0.7 m3/s of overland flow and 0.1 m3/s of pipe flow).
As flow moves downstream, through Central Park, 8.8 m3/s approaches Davidson Avenue (6.3 m3/s of overland flow and 2.5 m3/s of pipe flow) in the 1% AEP event. Approximately 4.3 m3/s of the overland flow from Central Park, deviates and inundates Curtin Place to the east where floodwaters store in the cul de sac. Flow from Curtin Place and Central Park then traverses properties on Davidson Avenue and moving in an easterly direction (see Section 12.4).
Despite there being several large trunk drainage assets along Hotspot 3, the capacity of this system is typically reached in the 1EY event. It is recommended that the FRMS&P investigate mitigation measures to alleviate flooding along the Central Drain. Mitigation measures may include implementing a detention basin in Central Park or formalising an overland flow path between Central Park and Davidson Avenue to prevent overland flow from traversing properties.
12.4 Hotspot 4: Davidson Avenue
Hotpot 4 is a continuation of the Central Drain from Hotspot 3 (see Section 12.3) and denotes the natural overland flow path that moves along Davidson Avenue toward Majors Bay Road. Figure 42 present the 5% AEP, 1% AEP and PMF design flood results at Hotspot 4 and the peak flow results at various locations along the flow path.
At Favelle Street, overland flow paths from the north, south and west, with a total catchment area of 64 hectares, meet at Davidson Avenue and continue to flow in an easterly direction. From the north of Favelle Street, 1.2 m3/s in the 1% AEP event (1.1 m3/s of overland flow and 0.1 m3/s of pipe flow) approach Davidson Avenue. To the south, 1.5 m3/s (1.2 m3/s of overland flow and 0.3 m3/s of pipe flow) approach Davidson Avenue in the 1% AEP event. Upstream of Favelle Street (west), 12.5 m3/s (9.7 m3/s of overland flow and 2.8 m3/s of pipe flow) flow along Davidson Avenue. Downstream of Favelle Street, 14 5 m3/s (12 1 m3/s of overland flow and 2.4 m3/s of pipe flow) flows along Davidson Avenue in the 1% AEP event.
Exile Bay Catchment Flood Study Draft Flood Study Report
87
As floodwaters on Davidson Avenue approach Majors Bay Road, flood depths increase to up to 0.85 m in the 1% AEP event as the flow path crosses Majors Bay Road to Brewer Street (see Hotspot 5, Section 12.5)
Hotspot 4 is a key thoroughfare for flood waters along the Central Drain and as such, it is recommended that the FRMS&P investigate response modification measures, to derive flood related planning solutions as well as investigating measures to ameliorate flooding.
12.5 Hotspot 5: Majors Bay Road and Brewer Street intersection
Hotspot 5 is located downstream of Hotspot 4 (see Section 12.4), along the Central Drain, at the intersection of Majors Bay Road and Brewer Street. Figure 43 present the 5% AEP, 1% AEP and PMF design flood results at Hotspot 4 and the peak flow results at various locations along the flow path.
At the Majors Bay Road intersection, the Davidson Avenue flow path (Hotspot 4, see Section 12.4) meets flow from the north and south of Majors Bay Road and then flows along Brewer Street. In the 1% AEP event, 15.7 m3/s (13.4 m3/s of overland flow and 2.3 m3/s of pipe flow) enters the Hotspot 5 intersection from Davidson Avenue. This flow is met by 1.0 m3/s (0.7 m3/s of overland flow and 0.3 m3/s of pipe flow) from the north of Majors Bay Road and 2.2 m3/s (1.7 m3/s of overland flow and 0.5 m3/s of pipe flow) from the south. On Brewer Street, 19.2 m3/s (14.2 m3/s of overland flow and 5.0 m3/s of pipe flow) continues downstream.
Similar to Hotspot 4 (see Section 12.4), Hotspot 5 is a key thoroughfare for floodwaters on the Central Drain and as such, given the large upstream catchment area, flooding is unlikely to be eliminated. It is recommended that the FRMS&P investigate response modification measures and flood modification measures to improve flooding in the vicinity. Flood modification measures may include, removing mounding from the vegetated area on Majors Bay Road at the Davidson Avenue intersection or regrading the intersection to allow for efficient flow to Brewer Street and thus, minimising pooling of floodwaters upstream.
12.6 Hotspot 6: Saltwater Creek
Hotspot 6 denotes Saltwater Creek, downstream of Ian Parade, which acts as the key drain to the catchment outlet at Exile Bay. The Saltwater Creek channel flows through the Massey Park Golf Course and is adjacent to properties on the southern side. Figure 44 present the 5% AEP, 1% AEP and PMF design flood results at Hotspot 4 and the peak flow results at various locations along the flow path.
In the 1% AEP event, 25.3 m3/s flows along Saltwater Creek toward Exile Bay. The capacity of Saltwater Creek is reached in the 1 EY event albeit for a very brief period. In the 10% AEP event, flooding from the overtopped creek begins to encroach on nearby properties to the south which becomes progressively worse as flood magnitude increases. Given this flood affectation, the current study has investigated a number of mitigation strategies outlined by Council to mitigate flooding in this area. These strategies are presented in Section 13 Additionally, it is recommended that the FRMS&P assess planning controls to minimise flooding from future developments in the vicinity.
88 Exile
Study Report
Bay Catchment Flood Study Draft Flood
13. PRELIMINARY MITIGATION ANALYSIS
Flood Risk Mitigation can be achieved in two fundamental ways Either the hazard can be abated, or the people/asset can be moved from harm’s way.
By and large, previously undescribed overland flow paths that run through the urbanised landscape of the Exile Bay catchment constitute the greatest flood risk and arguably the greatest relative risk occurs at road crossings
The Floodplain Development Manual (Reference 17) classifies the management of flood risk into three categories:
• Property Modification Measures (such as voluntary purchase or voluntary house raising);
• Response Modification Measures (improving community flood readiness through planning or flood warning); and
• Flood Modification Measures (modifying the behaviour of the flood itself through construction of a levee, basin or drainage modifications).
Detailed assessment of these measures and their relative cost/benefit will form the basis of the future Floodplain Risk Management Study and Plan (FRMS&P). The current study has undertaken a preliminary analysis of Flood Modification Measures in the following sections that provide some flood mitigation at key locations identified by Council.
Saltwater Creek acts as a drain for the study area into Exile Bay and Massey Park Golf Course conveys additional overland flows in the downstream catchment areas. Given this, the capacity and maintenance of the Saltwater Creek channel is crucial for the catchment to efficiently drain.
The current study includes the requirement to assess mitigation strategies as outlined below.
13.1 Removal of Saltwater Creek Structures at Massey Park
Saltwater Creek channel has three bridge crossings in its downstream reach which act as connection points for the Massey Park Golf Course and for pedestrians on the bay foreshore. There has been concern that these bridges impede flows and exacerbate flooding in the surrounding areas. As such, flood level sensitivity to these crossings has been assessed in the flood model
Figure 45 presents the peak flood level impacts associated with the removal of these structures for the 10% and 1% AEP events. Flood level impacts of less than 0.01 m are not considered significant. In the 10% AEP event, peak flood levels are decreased by up to 0.01 m in the local vicinity. In the 1% AEP event, peak flood levels decreases are primarily experienced within the Massey Park Golf Course with some minor decreases of up to 0.01 m at properties to the south of the Saltwater Creek channel.
The peak flood level impacts demonstrate that there is limited sensitivity to the bridge crossings in the 10% AEP and 1% AEP events.
89 Exile Bay Catchment Flood Study Draft Flood Study Report
13.2 Removal of Massey Park Mounding
The Massey Park Golf Course is located in the downstream of the study area and has numerous artificial mounds which change the natural flood behaviour in the vicinity. The flood impact of these topographic changes has been assessed in the current study by flattening the mounds in the flood model.
Figure 46 and Figure 47 present the associated peak flood level impacts for the 10% and 1% AEP events, respectively.
Analysis of the removal of the Massey Park mounding found that the flood model was most sensitive to the removal of mounding immediately downstream of Ian Parade on the southern side of Saltwater Creek. Removal of these mounds increased the conveyance capacity for overland flows from the Main South Drain and the Central Drain. This resulted in decreases to peak flood levels upstream of Ian Parade and flood level increases in downstream areas in both the 10% AEP (up to 0.07 m) and 1% AEP (up to 0.1 m ) events. Critically, peak flood levels are increased at properties to the south of Saltwater Creek by the complete removal of the mounding.
Removal of the mounding in other areas of the Massey Park Golf Course were found to only result in localised flood impacts and did not benefit on neighbouring properties.
Furthermore, additional analysis was undertaken to assess the impact of removing the mounds immediately downstream of Ian Parade to the north of Saltwater Creek however the resulting flood impacts were isolated and minor.
13.2.1 Massey Park Mounding Reconfiguration
Given the sensitivity of the flood model to the removal of mounds immediately downstream of Ian Parade to the south of Saltwater Creek, the configuration of these mounds and their removal were further analysed in the flood model. This analysis aimed to devise a mounding configuration that decreased flood levels upstream of Ian Parade without overly increasing flood levels on residential properties neighbouring Saltwater Creek. This involved the removal of each of these mounds individually in the flood model and the assessment of the associated peak flood level impacts.
Figure 48 presents the 1% AEP peak flood impacts of the removal of Mound 1 (as labelled in Figure 48)
Figure 49 presents the 1% AEP peak flood impacts of the removal of Mound 2 (as labelled in Figure 49)
Analysis of 1% AEP peak flood level impacts found that the removal of Mound 1, decreases peak flood levels by up to 0.1 m in the areas upstream of Ian Parade and increases flood levels by up to 0.04 m at properties adjacent to Saltwater Creek
With the removal of Mound 2, peak flood levels in the 1% AEP event are decreased up to 0.05 m at properties on the Central Drain and up to 0.03 m at properties on the Main South Drain. Peak flood levels are increased by up to 0.15 m at properties adjacent to Saltwater Creek in the 1% AEP event.
The result of this analysis has found that some benefit can be attained in upstream areas by reconfiguring the mounds to the south of Saltwater Creek however this has consistently resulted in
90 Exile Bay
Study Draft Flood Study Report
Catchment Flood
increased peak flood levels at properties in downstream areas. It is recommended that this measure is further analysed across a range of flood magnitudes in the subsequent Floodplain Risk Management and Plan (FRMS&P).
13.3 Increased capacity of Saltwater Creek
The conveyance capacity of Saltwater Creek channel is greatly affected by its cross sectional area. The cross sectional area of the Saltwater Creek channel was increased by 50% and 100% in the flood model and the associated peak flood level impacts were assessed.
50% Cross Sectional Area Increase
Figure 50 presents the peak flood level impacts for a 50% increase in the Saltwater Creek channel cross section for the 10% and 1% AEP events
In the 10% AEP event, significant peak flood level decreases of up to 0.4 m are experienced in the Saltwater Creek channel with decreases of up to 0.04 m at the properties neighbouring the channel. Furthermore, peak flood levels are also reduced by up to 0.03 m at properties on the Central Drain and the Main South Drain.
In the 1% AEP event, flood levels in the channel are decreased by up to 0.3 m and at neighbouring properties by up to 0.3 m. Further, flood levels are also decreased by up to 0.03 m at upstream properties on the Central Drain and the Main South Drain.
Chart 2 presents a profile of this scenario against the existing 1% AEP profile. Analysis of this profile found that the channel conveyance is greatly affected by a decrease in conveyance capacity downstream of the “Second Bridge Crossing”. At this location, bathymetric survey (see Section 3.3.2) shows that the channel becomes notable more constrained, resulting in backwatering of flood waters upstream
100% Cross Sectional Area Increase
Figure 51 presents the peak flood level impacts for a 100% increase in the Saltwater Creek channel cross section for the 10% and 1% AEP events.
Peak flood levels for the 10% AEP event were found to decrease by up to 0.6 m in the Saltwater Creek channel and by up to 0.04 m at residential properties neighbouring the channel. At properties upstream on the Central Drain and Main South Drain, peak flood levels are decreased by up to 0.04 m.
In the 1% AEP event, peak flood levels decrease by up to 0.3 m at properties to the south of the Saltwater Creek channel. Furthermore, peak flood levels decreases were of up to 0.3 m occurred in the Massey Park Golf Course. Other properties on Spring Street and adjacent to Jessie Stewart Reserve experience peak flood level decreases of up to 0.04 m in the 1% AEP event Chart 2 presents a profile of this scenario against the 1% AEP existing flood level and the flood level from a 50% increase in cross sectional area. Overall, the 1% AEP significant peak flood level impacts were found to occur in the vicinity of the Saltwater Creek channel with some decreases occurring at residential properties in upstream areas.
91 Exile Bay
Study Report
Catchment Flood Study Draft Flood
Overall, an increase in the conveyance capacity was found generally to decrease peak flood levels along Saltwater Creek, along the Main South Drain to Jessie Stewart Reserve and along the Central Drain to Brewer Street. It is recommended that the this result is investigated further in the Floodplain Risk Management Study and Plan (FRMS&P) independently as well as together with the removal of mounding assessed in Section 13.2.1
Chart 2: Saltwater Creek 1% AEP Flood Profile comparison
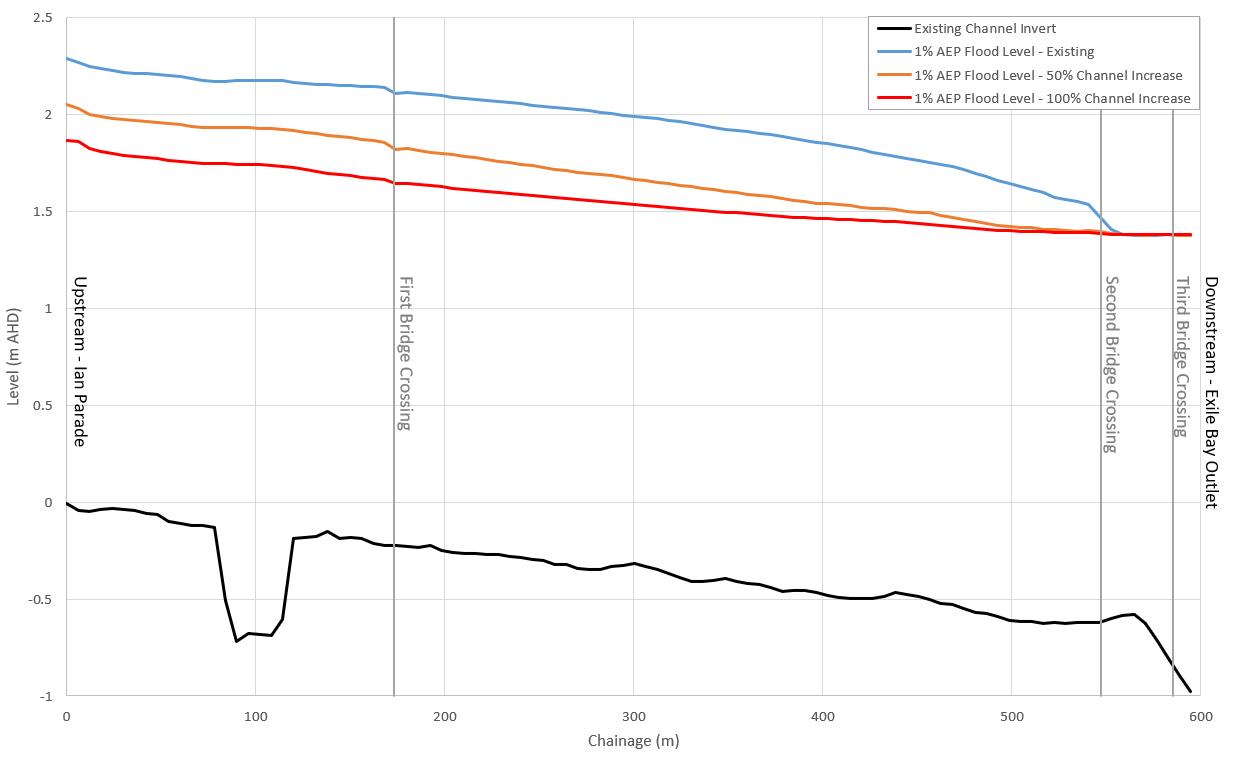
92 Exile Bay
Draft
Study Report
Catchment Flood Study
Flood
14. FLOOD DAMAGES ASSESSMENT
14.1 Overview
A flood damages assessment is used to quantitively assess the impacts of flooding on the community (Reference 2). Generally, a flood damages assessment aggregates the following:
• Direct costs to individual properties such as structural damages or damage to contents;
• Indirect costs to individual properties such as clean up, disposal or loss of income; and
• Cost of damage to infrastructure.
The flood damages assessment for the current study has been completed in accordance with guidance for estimating residential flood damages from the NSW Department of Environment and Climate Change (Reference 14). This guideline uses the depth of flooding above ground and floor level to estimate the variation of damage to structures and yards.
The flood damages assessment described herein has been completed for 2151 properties within the PMF flood extent. Section 14.2 addresses the estimation of floor levels within the Flood Planning Area and within the PMF extent. Floor levels and ground levels for each property are compared to the design flood levels at the same location. Based on this comparison, a site specific level of flood affectation is derived (Section 14.3). This informs the Residential Flood Damages (Section 14.4), whereby a monetary value is applied to each property based on the level of property damage over a range of design flood events.
14.2 Floor Level Estimation
Floor level estimation was completed for all properties within the Flood Planning Area (FPA) (see Section 9.6) This process was undertaken by estimating the height between the ground level and the lowest habitable floor level. The ground level for each property was determined using LiDAR data. The floor level was determined by adding the LiDAR ground level to the estimated height from ground to floor level.
The height from ground level and to the lowest habitable floor level was estimated, where possible, via Google StreetView for each property within the FPA Nearby physical features were used to aid the estimation of the ground to floor height, such as the number of bricks to the floor level or the height of a nearby garbage bin. A site visit was undertaken to verify existing floor level estimates and obtain ground to floor estimates for properties that were unable to be seen from Google StreetView. During this process, additional information pertaining to each property was recorded such as the type of house construction and the number of storeys.
For the properties outside of the FPA but within the PMF extent, the ground to floor level was estimated based on the average ground to floor level difference derived for the properties within the FPA.
93 Exile Bay Catchment Flood Study Draft Flood Study Report
14.3
Property Inundation
The level of flood affectation for residential properties within the FPA was derived by comparing design flood levels to ground and floor level estimates. This process identified the flood event (with respect to probability) that first inundates each property over ground and floor level Figure 52 and Figure 53 present the first event to inundate each property over ground level and floor level, respectively.
Table 28 quantifies the number of properties affected in each design flood event.
Table 28: Exile Bay Property Affectation
Design Event (AEP)
Number of Properties affected Number of Properties affected above Floor Level
20% 92 20 10% 145 29 5% 170 39 2% 212 55 1% 264 73 0.5% 292 81 0.2% 338 96 PMF 875 414
14.4 Residential Flood Damages
Residential Flood Damage estimates provide a monetary value of flood damages for each property for a range of design flood events. A key outcome of this assessment is the Average Annual Damage (AAD). The AAD is equal to the total damage caused by all floods over a long period of time divided by the number of years in that period (Reference 17). The AAD is primarily used during a Floodplain Risk Management Study and Plan (FRMS&P) to compare the relative economic merits of various proposed flood mitigation measures.
An AAD of $1,614,400 was calculated for the Exile Bay catchment. Table 29 presents the AAD and the total Residential Flood Damages per design event.
Table 29: Exile Bay Flood Damages
Design Event (AEP) Flood Damages Total Flood Damage per property
20% $2,110,300 $22,900 10% $3,212,400 $21,600 5% $4,039,000 $23,100 2% $5,544,400 $25,600 1% $7,209,500 $26,900 0.5% $8,235,900 $28,000 0.2% $9,775,600 $28,800 PMF $40,219,700 $46,000
Average Annual Damages (AAD) $1,614,400
94 Exile Bay
Study Draft Flood Study Report
Catchment Flood
15. CONCLUSION
The Exile Bay Catchment Flood Study has been undertaken by GRC Hydro on behalf of the City of Canada Bay Council with the assistance of Council and the NSW Office of Environment and Heritage. This study has completed the first two stages of the NSW Floodplain Risk Management Program in Exile Bay.
This study has developed, calibrated and validated a hydrologic and hydraulic modelling system which defines the existing nature and extent of flooding from overland flow and mainstream waterways in the Exile Bay Catchment. Flooding has been defined for a full range of design flood magnitudes, from the 1 EY to the PMF events. This modelling system and the results documented herein provides a robust foundation for any future Floodplain Risk Management Study and Plan.
95 Exile Bay Catchment Flood Study Draft Flood Study Report
16. REFERENCES
1 Australian Institute for Disaster Resilience, Managing the Floodplain: A Guide to Best Practice in Flood Risk Management in Australia, Australian Institute for Disaster Resilience, 2017.
2 Ball J, Babister M, Nathan R, Weeks W, Weinmann E, Retallick M, Testoni I, (Editors) Australian Rainfall and Runoff: A Guide to Flood Estimation, © Commonwealth of Australia (Geoscience Australia), 2016.
3 Bureau of Meteorology, The Estimation of Probable Maximum Precipitation in Australia: Generalised Short Duration Method, Bureau of Meteorology, June 2003.
4 Burwood Council, Exile Bay, St Lukes and William Street Flood Study, WMAwater, March 2017
5 City of Canada Bay, Beaconsfield Depot Flooding Issues on Existing Properties, J. Wyndham Prince, November 2012
6 City of Canada Bay, Development Control Plan, City of Canada Bay, April 2018
7 City of Canada Bay, Intersection of Brewer Street and Majors Bay Road Overland Flood Investigation, TaylorThomsonWhitting, February 2010
8 City of Canada Bay, Paramatta River Estuary Foreshore Management Study, Royal HaskoningDHV, March 2013
9 City of Canada Bay, Proposed Re Development of Beaconsfield Depot, Concord, J. Wyndham Prince, September 2011
10. Concord Council, Hydrological and Hydraulic Services for Proposed Development of Concord Council’s Former Depot in Beaconsfield Avenue, Bankstown Civic Services Group, March 2000
11 Concord Council, Overland Flow Investigation
Brewer Street/Majors Bay Road Intersection, Gardiner Willis & Associates, October 1998
96 Exile Bay Catchment Flood Study Draft Flood Study Report
12 Concord Council, Report on the Massey Park Gross Pollutant Trap, UTS Sydney, October 1997
13. Concord Municipal Council, Main South Drain Investigation of Stormwater System Paramatta Road to John Street, Ledingham Hensby Oxley and Partners, September 1992
14 DECC (NSW Department of Environment and Climate Change), Floodplain Risk Management Guideline Residential Flood Damages, DECC, 2007
15 Howells L, McLuckie D, Collings G, Lawson N, Defining the Floodway Can one Size Fit All?, Lawson and Treloar, 2003.
16. Municipality of Concord, Stormwater Drainage capacity assessment within the Municipality of Concord, E. S. Rowe & Ennie, July 1973
17 NSW Government, NSW Floodplain Development Manual, April 2005, DIPNR
18 Office of Environment and Heritage NSW Government, Floodplain Risk Management Guide, Cardno, Office of Environment and Heritage, November 2015.
19. Public Works , Sydney Storms November 1984, Public Works, October 1985
20 WestConnex M4 East Project, M4 East Design and Construct Technical Report Flood Mitigation Strategy, AECOM Hyder Joint Venture, June 2016
97 Exile
Report
Bay Catchment Flood Study Draft Flood Study
APPENDIX A
Glossary of Key Terminology (Reference 17)
annual exceedance probability (AEP)
the chance of a flood of a given or larger size occurring in any one year, usually expressed as a percentage. Eg, if a peak flood discharge of 500 m3/s has an AEP of 5%, it means that there is a 5% chance (that is one in 20 chance) of a 500 m3/s or larger events occurring in any one year (see ARI). (see Table 30, Appendix A)
Australian Height Datum (AHD) a common national surface level datum approximately corresponding to mean sea level
average annual damage (AAD) depending on its size (or severity), each flood will cause a different amount of flood damage to a flood prone area. AAD is the average damage per year that would occur in a nominated development situation from flooding over a very long period of time.
average recurrence interval (ARI) the long term average number of years between the occurrence of a flood as big as or larger than the selected event. For example, floods with a discharge as great as or greater than the 20 year ARI flood event will occur on average once every 20 years. ARI is another way of expressing the likelihood of occurrence of a flood event.
catchment the land area draining through the main stream, as well as tributary streams, to a particular site. It always relates to an area above a specific location.
consent authority the council, government agency or person having the function to determine a development application for land use under the EP&A Act. The consent authority is most often the council, however legislation or an EPI may specify a Minister or public authority (other than a council), or the Director General of DIPNR, as having the function to determine an application.
development is defined in Part 4 of the EP&A Act infill development: refers to the development of vacant blocks of land that are generally surrounded by developed properties and is permissible under the current zoning of the land. Conditions such as minimum floor levels may be imposed on infill development
new development: refers to development of a completely different nature to that associated with the former land use. Eg, the urban subdivision of an area previously used for rural purposes. New developments involve re zoning and typically require major extensions of existing urban services, such as roads, water supply, sewerage and electric power.
redevelopment: refers to rebuilding in an area. Eg, as urban areas age, it may become necessary to demolish and reconstruct buildings on a
98 Exile Bay Catchment Flood Study Draft Flood Study Report
relatively large scale. Redevelopment generally does not require either re zoning or major extensions to urban services.
disaster plan (DISPLAN) a step by step sequence of previously agreed roles, responsibilities, functions, actions and management arrangements for the conduct of a single or series of connected emergency operations, with the object of ensuring the coordinated response by all agencies having responsibilities and functions in emergencies.
discharge the rate of flow of water measured in terms of volume per unit time, for example, cubic metres per second (m3/s). Discharge is different from the speed or velocity of flow, which is a measure of how fast the water is moving for example, metres per second (m/s).
effective warning time the time available after receiving advice of an impending flood and before the floodwaters prevent appropriate flood response actions being undertaken. The effective warning time is typically used to move farm equipment, move stock, raise furniture, evacuate people and transport their possessions.
emergency management a range of measures to manage risks to communities and the environment. In the flood context it may include measures to prevent, prepare for, respond to and recover from flooding.
flash flooding flooding which is sudden and unexpected. It is often caused by sudden local or nearby heavy rainfall. Often defined as flooding which peaks within six hours of the causative rain.
flood relatively high stream flow which overtops the natural or artificial banks in any part of a stream, river, estuary, lake or dam, and/or local overland flooding associated with major drainage (refer Section C6) before entering a watercourse, and/or coastal inundation resulting from super elevated sea levels and/or waves overtopping coastline defences excluding tsunami.
flood awareness Awareness is an appreciation of the likely effects of flooding and a knowledge of the relevant flood warning, response and evacuation procedures.
flood education
flood education seeks to provide information to raise awareness of the flood problem so as to enable individuals to understand how to manage themselves and their property in response to flood warnings and in a flood event. It invokes a state of flood readiness.
flood fringe areas the remaining area of flood prone land after floodway and flood storage areas have been defined.
flood liable land is synonymous with flood prone land (ie) land susceptible to flooding by the PMF event. Note that the term flood liable land covers the whole floodplain, not just that part below the FPL (see flood planning area).
99 Exile Bay
Draft
Study Report
Catchment Flood Study
Flood
flood mitigation standard the average recurrence interval of the flood, selected as part of the floodplain risk management process that forms the basis for physical works to modify the impacts of flooding.
floodplain area of land which is subject to inundation by floods up to and including the probable maximum flood event, that is, flood prone land.
floodplain risk management options the measures that might be feasible for the management of a particular area of the floodplain. Preparation of a floodplain risk management plan requires a detailed evaluation of floodplain risk management options.
floodplain risk management plan a management plan developed in accordance with the principles and guidelines in this manual. Usually includes both written and diagrammatic information describing how particular areas of flood prone land are to be used and managed to achieve defined objectives.
flood plan (local) A sub plan of a disaster plan that deals specifically with flooding. They can exist at state, division and local levels. Local flood plans are prepared under the leadership of the SES.
flood planning area the area of land below the FPL and thus subject to flood related development controls. The concept of flood planning area generally supersedes the “flood liable land” concept in the 1986 Manual.
flood planning levels (FPLs) are the combinations of flood levels (derived from significant historical flood events or floods of specific AEPs) and freeboards selected for floodplain risk management purposes, as determined in management studies and incorporated in management plans. FPLs supersede the “standard flood event” in the 1986 manual.
flood proofing a combination of measures incorporated in the design, construction and alteration of individual buildings or structures subject to flooding, to reduce or eliminate flood damages.
flood prone land land susceptible to flooding by the PMF event. Flood prone land is synonymous with flood liable land.
flood readiness Readiness is an ability to react within the effective warning time.
flood risk potential danger to personal safety and potential damage to property resulting from flooding. The degree of risk varies with circumstances across the full range of floods. Flood risk in this manual is divided into 3 types, existing, future and continuing risks. They are described below:
existing flood risk: the risk a community is exposed to as a result of its location on the floodplain.
future flood risk: the risk a community may be exposed to as a result of new development on the floodplain.
continuing flood risk: the risk a community is exposed to after floodplain risk management measures have been implemented. For a town
100 Exile Bay
Study Draft Flood Study Report
Catchment Flood
protected by levees, the continuing flood risk is the consequences of the levees being overtopped. For an area without any floodplain risk management measures, the continuing flood risk is simply the existence of its flood exposure.
flood storage areas those parts of the floodplain that are important for the temporary storage of floodwaters during the passage of a flood. The extent and behaviour of flood storage areas may change with flood severity, and loss of flood storage can increase the severity of flood impacts by reducing natural flood attenuation. Hence, it is necessary to investigate a range of flood sizes before defining flood storage areas.
floodway areas those areas of the floodplain where a significant discharge of water occurs during floods. They are often aligned with naturally defined channels. Floodways are areas that, even if only partially blocked, would cause a significant redistribution of flood flow, or a significant increase in flood levels.
freeboard provides reasonable certainty that the risk exposure selected in deciding on a particular flood chosen as the basis for the FPL is actually provided. It is a factor of safety typically used in relation to the setting of floor levels, levee crest levels, etc. (See Section K5). Freeboard is included in the flood planning level.
habitable room in a residential situation: a living or working area, such as a lounge room, dining room, rumpus room, kitchen, bedroom or workroom.
in an industrial or commercial situation: an area used for offices or to store valuable possessions susceptible to flood damage in the event of a flood.
hazard a source of potential harm or a situation with a potential to cause loss. In relation to this manual the hazard is flooding which has the potential to cause damage to the community.
hydraulics term given to the study of water flow in waterways; in particular, the evaluation of flow parameters such as water level and velocity.
hydrograph a graph which shows how the discharge or stage/flood level at any particular location varies with time during a flood.
hydrology term given to the study of the rainfall and runoff process; in particular, the evaluation of peak flows, flow volumes and the derivation of hydrographs for a range of floods.
local overland flooding inundation by local runoff rather than overbank discharge from a stream, river, estuary, lake or dam.
local drainage smaller scale problems in urban areas. They are outside the definition of major drainage in this glossary.
101 Exile Bay Catchment Flood Study Draft Flood Study Report
mainstream flooding inundation of normally dry land occurring when water overflows the natural or artificial banks of a stream, river, estuary, lake or dam.
major drainage councils have discretion in determining whether urban drainage problems are associated with major or local drainage. For the purposes of this manual major drainage involves:
• the floodplains of original watercourses (which may now be piped, channelised or diverted), or sloping areas where overland flows develop along alternative paths once system capacity is exceeded; and/or
• water depths generally in excess of 0.3m (in the major system design storm as defined in the current version of Australian Rainfall and Runoff). These conditions may result in danger to personal safety and property damage to both premises and vehicles; and/or
• major overland flowpaths through developed areas outside of defined drainage reserves; and/or
• the potential to affect a number of buildings along the major flow path.
mathematical/computer models the mathematical representation of the physical processes involved in runoff generation and stream flow. These models are often run on computers due to the complexity of the mathematical relationships between runoff, stream flow and the distribution of flows across the floodplain.
merit approach the merit approach weighs social, economic, ecological and cultural impacts of land use options for different flood prone areas together with flood damage, hazard and behaviour implications, and environmental protection and well being of the State’s rivers and floodplains. The merit approach operates at two levels. At the strategic level it allows for the consideration of social, economic, ecological, cultural and flooding issues to determine strategies for the management of future flood risk which are formulated into council plans, policy, and EPIs. At a site specific level, it involves consideration of the best way of conditioning development allowable under the floodplain risk management plan, local flood risk management policy and EPIs.
minor, moderate and major flooding both the SES and the BoM use the following definitions in flood warnings to give a general indication of the types of problems expected with a flood:
minor flooding: causes inconvenience such as closing of minor roads and the submergence of low level bridges. The lower limit of this class of flooding on the reference gauge is the initial flood level at which landholders and townspeople begin to be flooded.
moderate flooding: low lying areas are inundated requiring removal of stock and/or evacuation of some houses. Main traffic routes may be covered.
102 Exile Bay Catchment Flood Study Draft Flood Study Report
major flooding: appreciable urban areas are flooded and/or extensive rural areas are flooded. Properties, villages and towns can be isolated.
modification measures measures that modify either the flood, the property or the response to flooding.
peak discharge the maximum discharge occurring during a flood event.
probable maximum flood the PMF is the largest flood that could conceivably occur at a particular location, usually estimated from probable maximum precipitation, and where applicable, snow melt, coupled with the worst flood producing catchment conditions. Generally, it is not physically or economically possible to provide complete protection against this event. The PMF defines the extent of flood prone land, that is, the floodplain. The extent, nature and potential consequences of flooding associated with a range of events rarer than the flood used for designing mitigation works and controlling development, up to and including the PMF event should be addressed in a floodplain risk management study.
probable maximum precipitation the PMP is the greatest depth of precipitation for a given duration meteorologically possible over a given size storm area at a particular location at a particular time of the year, with no allowance made for long term climatic trends (World Meteorological Organisation, 1986). It is the primary input to PMF estimation.
probability a statistical measure of the expected chance of flooding (see AEP).
risk chance of something happening that will have an impact. It is measured in terms of consequences and likelihood. In the context of the manual it is the likelihood of consequences arising from the interaction of floods, communities and the environment.
runoff the amount of rainfall which actually ends up as streamflow, also known as rainfall excess.
stage equivalent to water level (both measured with reference to a specified datum).
stage hydrograph a graph that shows how the water level at a particular location changes with time during a flood. It must be referenced to a particular datum.
survey plan a plan prepared by a registered surveyor.
water surface profile a graph showing the flood stage at any given location along a watercourse at a particular time.
103 Exile Bay
Study Draft Flood Study Report
Catchment Flood
Table 30: ARR 2016 Preferred Terminology (Reference 2)
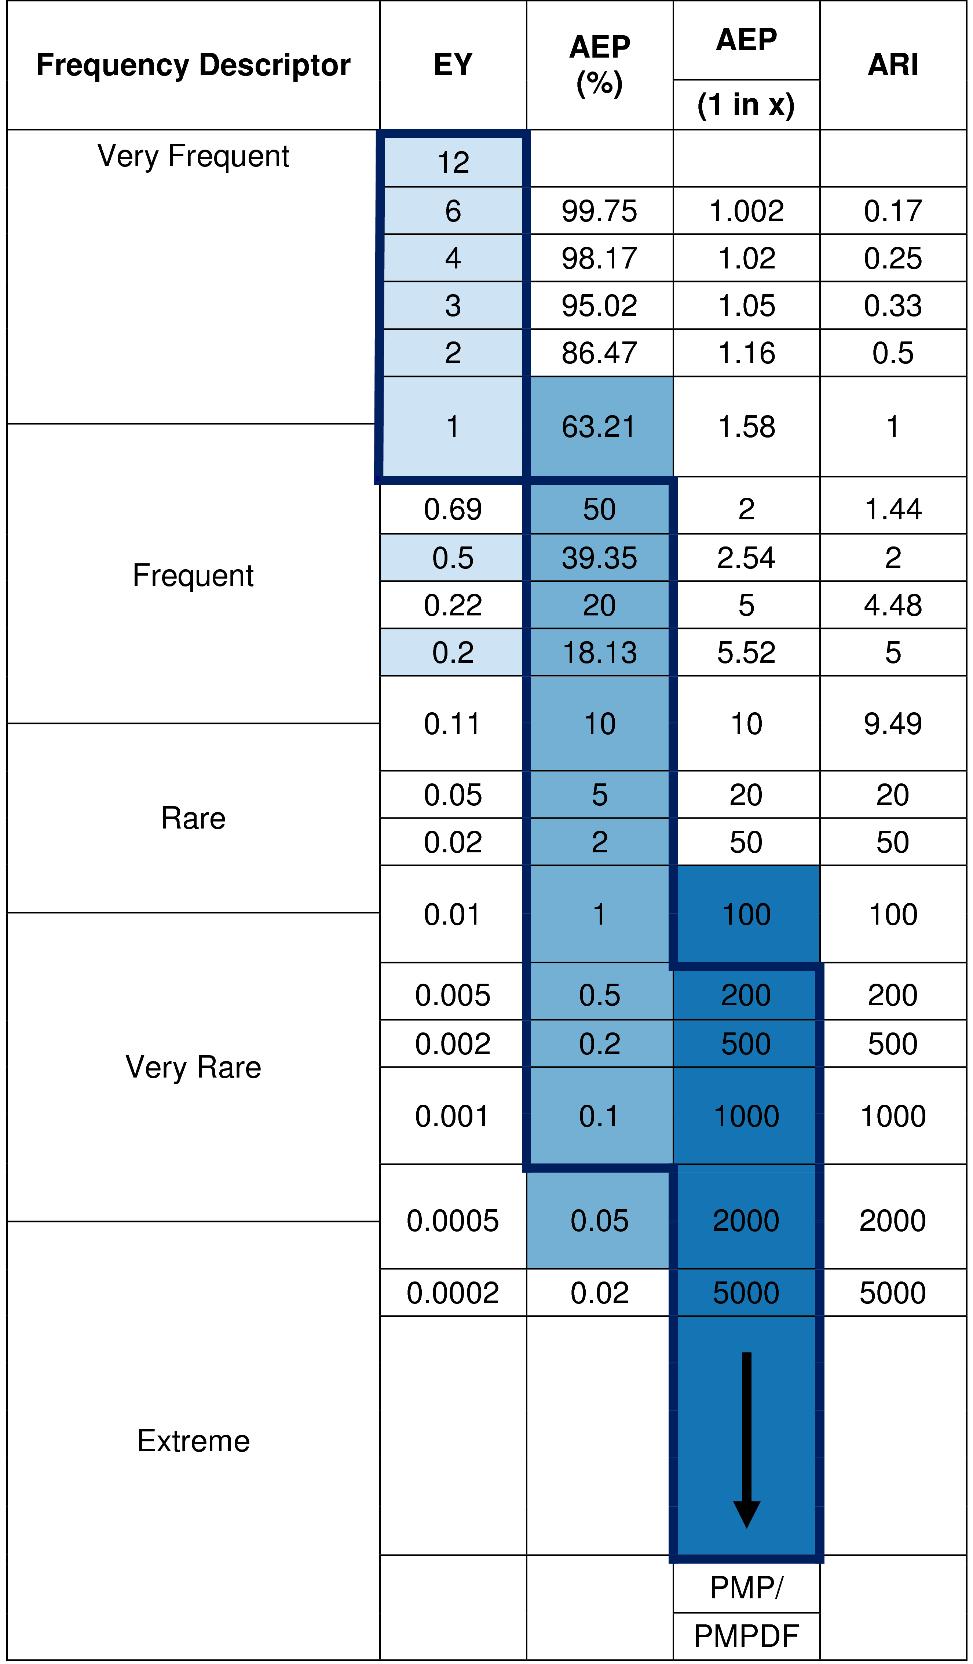
104 Exile Bay Catchment Flood Study Draft Flood Study Report
APPENDIX B
Community Consultation Newsletter and Questionnaire
Council report on Public Exhibition
105 Exile Bay Catchment Flood Study Draft Flood Study Report
FloodinginYourArea TheExileBayCatchmentFloodStudy
ExileBay Catchment FloodStudy
Whatisthe FloodplainRisk Management Program?

OnbehalfoftheCityofCanadaBay,GRCHydroisundertakingaFloodStudyinyourarea (theExileBaycatchment).Wewouldliketohearyourexperiencesoffloodingtobetter understandhowfloodingoccursinyourarea.

ThisstudywilldefinetheexistingconditionspertainingtofloodingintheExileBay catchmentandassessthelikelyfrequencyandextentoffloodingunderavarietyof scenarios.ThisinformationwillbeusedbyCounciltohelpmanagerisksinyourarea.
TheFloodplainRiskManagementProgramisrunbytheNSWGovernment.Thisprogram helpscouncilsmakeinformeddecisionsaboutmanagingfloodrisk,implementing managementplanstoreducefloodriskandtoprovideessentialinformationtotheSESto dealwithfloodemergencyresponse.
Thisprogramconsistsoffivestagesandthecurrentstudywillundertakethefirsttwostages ofthisprocess;DataCollectionandFloodStudy.
ThestagesoftheFloodplainRiskManagementProgramarepresentedbelow:
Whatis Flooding?
WhatisaFlood Study?
Thiscurrentstudydealswith thesefirsttwostages.
Floodingisoftenassociatedwithinundationfromlargerivers;however,thereareother floodmechanismsthatcancauseinundation.Yourareaisprimarilyaffectedbytwotypesof flooding;overlandflowfloodingandmainstreamflooding.
Afloodstudyisacomprehensivetechnicalinvestigationoffloodbehaviour.Thisstudywill definethenatureoffloodriskinyourareabyprovidinginformationontheextent,leveland velocityoffloodwatersforafullrangeoffloodmagnitudesuptoandincludingthelargest possibleflood,termedthe‘ProbableMaximumFlood’.Acommonlyusedoutcomefroma FloodStudyisthe1%AEPfloodresult(alsoknownasthe1in100yearflood).Sensitivity testingisalsoundertakeninthesestudiestoaccountforfactorssuchasclimatechange andblockageofdrainagesystems.
HaveYourSayon
floodingoccursas rainfallrunoffmoves towarddownstream waterways.
occurswhenrunoff fromstreetsand drainsflowinto waterwayscausing themtoriseand inundateareasthat areusuallydry GRCHydro:WaterEngineersandHydrologistsgrchydro.com.au
Overlandflow
Mainstreamflooding
HaveYourSayon FloodinginYourArea TheExileBayCatchmentFloodStudy
Whatisafloodstudyusedfor?
FloodstudiesprovidekeyinformationforCouncil,theSES andthecommunityandarepartoftheprocesstomanagean area’sfloodrisk.
ForCouncil,floodstudiesareprimarilyaplanningtoolfor futuredevelopmentinyourarea(theExileBaycatchment). ExamplesofapplicationsforCouncilarelistedbelow:
•toensurethatsensitiveinfrastructure(suchaschildcare centresandnursinghomes)arenotbuiltonfloodprone land;and
•toensurethatdevelopmentdoesnotincreasetheflood affectationonneighbouringprivateproperty.
InformationfromthefloodstudywillassisttheSESinits evacuationandlogisticsplanning.Theoutcomesofthestudy willprovidetheSESwith:
•acleardescriptionoffloodbehaviourinthestudyareafor afullrangeoffloodevents;
•adescriptionoffloodwarningtimesforyourarea;and
•identificationofcriticalevacuationissuesinyourareasuch aslocationswhereroadaccessiscutandthewarning timebeforeroadaccessiscut.
TheStudyArea
TheExileBaycatchmentcoversa3.5squarekilometrearea withtwokeyoverlandflowpaths(theMainSouthernDrain andtheCentralDrain)whichmeetatSaltwaterCreek (adjacenttoMasseyParkGolfClub)andflowsintothe ParramattaRiver.Thesekeyfeaturesareshowninthemap below.
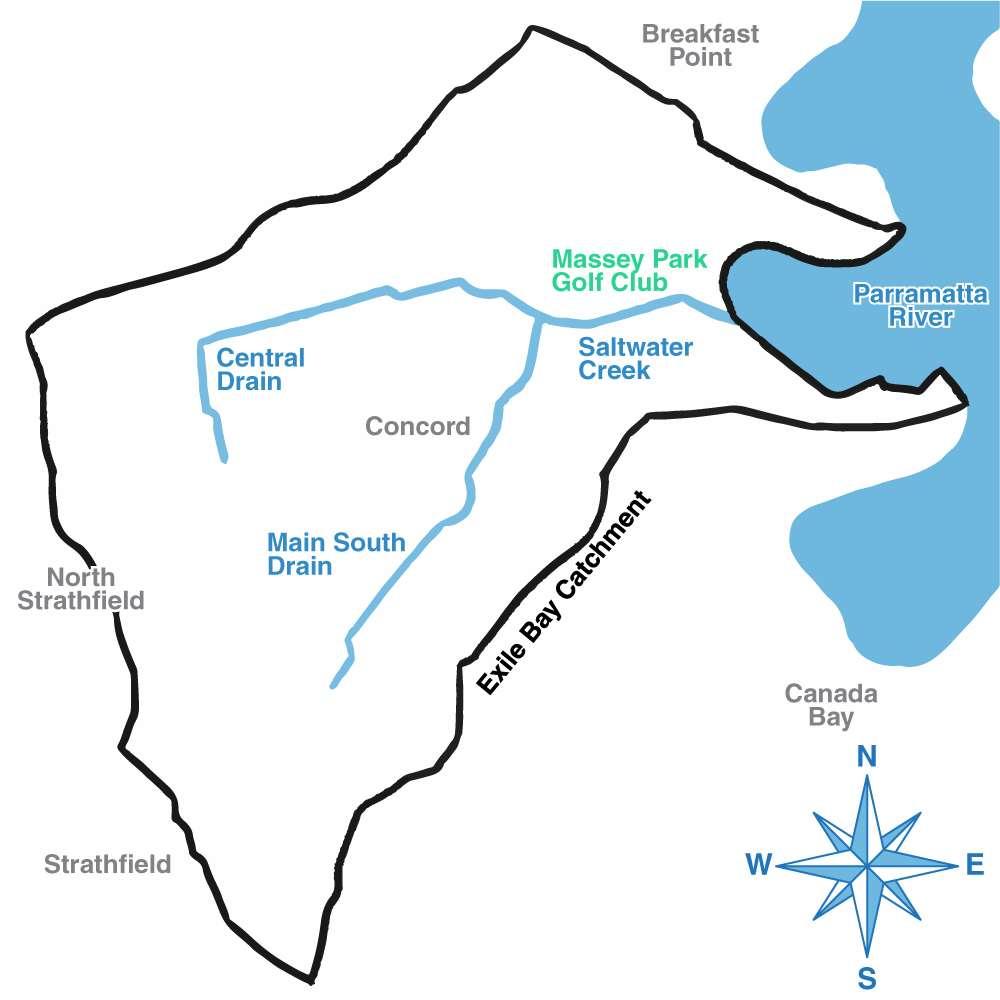
Significantfloodeventsoccurredinyourareaintheearly 1970s,1986and1988.
Anyinformationthatthecommunitycanprovideonhistoric floodingwillbewelcomed.
Whyyourfeedbackisimportant
GRCHydrowilldevelopcomputermodelstodetermine theexistingfloodaffectationinthearea.Calibrationand validationisakeyphaseinthedevelopmentofthese models.Thisprocessensuresthatthemodelledflood behaviouraccuratelyreflectsthefloodbehaviourinreality. Assuch,communityinputandknowledgeofhistoricalflood affectationisinvaluabletothisstudy.
Howcanyouhelpus?
Yourfeedbackisimportantinhelpingusgetacomplete pictureoffloodbehaviourinyourarea(theExileBay catchment)andhowthisaffectsyourcommunity.There areavarietyofwaysyoucanshareyourexperiencesand knowledgewithus.Theseareasfollows:
01.Filloutthequestionnaireincludedwiththisletterand senditbackusingtheself-addressedenvelopeprovided oremailittoexilebay@grchydro.com.au
02.Filloutthequestionnaireonlinebygoingtothe websitelistedbeloworusingyoursmartphoneto navigatetothequestionnaireusingtheQRcodebelow.
QRCode:

Website: grchydro.com.au/exilebay
03.Formoreinformation,pleasedonothesitateto contacttherepresentativesnominatedatthebottomof thispage.
Whathappensnext?
GRCHydrowillmodelthearea’sfloodbehaviourand produceadraftfloodstudyreportforCouncil.Itwillbe placedonPublicExhibitionin2019andcommentwillbe invited.
Whocanyoucontactformoreinfo?
Ifyouhaveanyfurtherquestionsregardingthefloodstudy oranyfurtherfloodinformation/photospleaseattachthem toyourquestionnaireorcontactthefollowing representatives.
BethMarson
SeniorEngineer,GRCHydro exilebay@grchydro.com.au 0290300342
BrianWoolley
Drainage,Marine&FloodplainEngineer, CityofCanadaBayCouncil Brian.Woolley@canadabay.nsw.gov.au 0299116339


Pleasereturnyourquestionnaireby1December2018.
GRCHydro:WaterEngineersandHydrologistsgrchydro.com.au


Name Address: PhoneNumber: Email: Canwecontactyouformoreinformation?YesNo WouldyouliketoreceiveCouncil’smonthlynewsletter?YesNo Contact Details Whatbuildingtypeisyourproperty? Residential(House/Terrace)Residential(Apartment) CommercialIndustrial BusinessName: Howlonghaveyoulivedorworkedatthisproperty?YearsMonths Your Property Hasyourpropertyeverbeenaffectedbyflooding? Yes,abovethefloorlevelYes,intheyardorgarageNo Ifyes,couldyoupleaseprovidemoreinformationinthespacebeloworattachedto
HaveYourSayonFloodinginYourArea TheExileBayCatchment FloodStudyQuestionnaire GRCHydro:WaterEngineersandHydrologistsgrchydro.com.au Flood Exacerbation Haveyounoticedanythingthathasmadefloodingworseinyourarea? YesNo Forexample,haveblockeddrainagestructuresorchangesnearyourpropertymade floodingworse?Informationsuchasdates,maximumextent,topwaterleveland photosoffloodingareveryhelpful.
thisquestionnaire.Informationsuchasdates,topwaterlevelandphotosofflooding areveryhelpful.
HaveYourSayonFloodinginYourArea
TheExileBayCatchment FloodStudyQuestionnaire
OverlandFlow Flooding
Areyouawareoffloodingfromtheoverlandflowinyourarea?
YesNo
Ifyes,couldyoupleaseprovideinformationinthespacebeloworattachedtothis questionnaire.Informationsuchasdates,maximumextent,topwaterleveland photosoffloodingareveryhelpful.
Other Information
Isthereanyotherinformationrelatedtofloodingthatyouwouldliketogiveus?
YesNo
Ifyes,couldyoupleaseprovideinformationinthespacebeloworattachedtothis questionnaire.Informationsuchasdates,maximumextent,topwaterleveland photosoffloodingareveryhelpful.
Pleasereturnyourquestionnaireby1December2018. Ifyourinformationdoesnotfitinthespaceprovided,pleaseemailittoexilebay@grchydro.com.au
GRCHydro:WaterEngineersandHydrologistsgrchydro.com.au
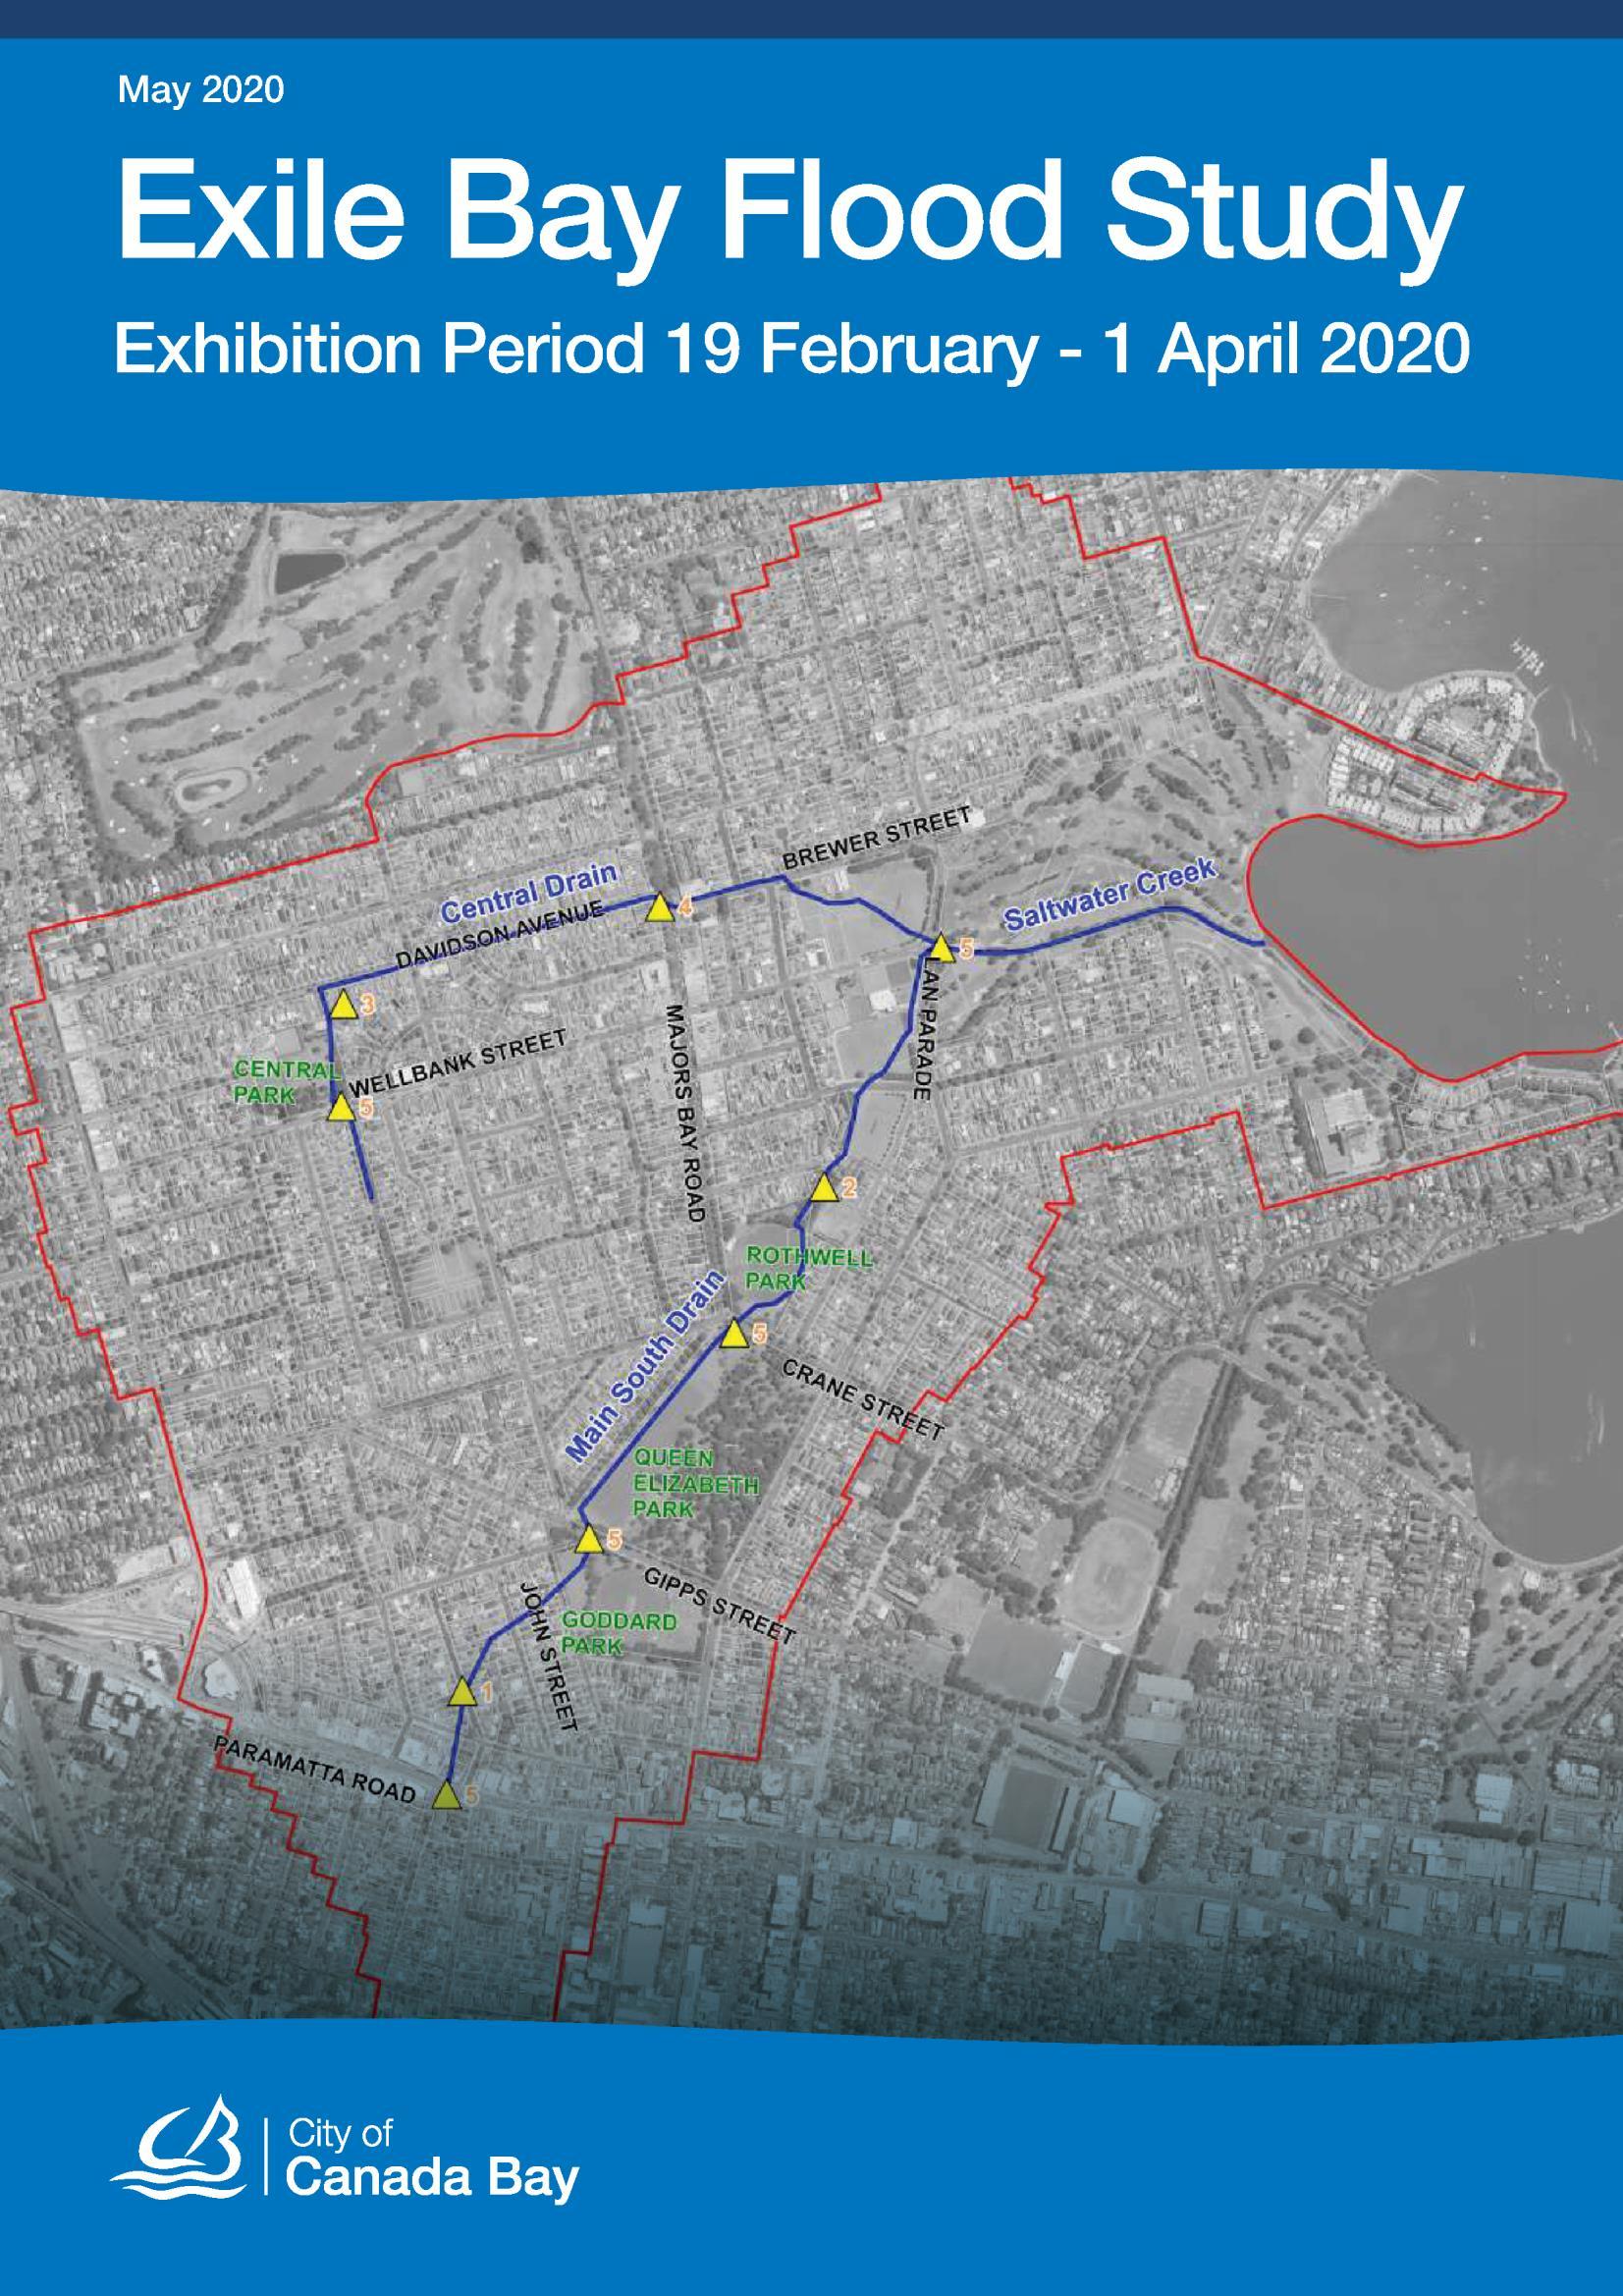

Executive Summary
This report, Exile Bay Flood Study Public Exhibition Period, summarises the background of the Flood Study Program and the community consultation process, undertaken between 19 February and 1 April 2020.
Project Background
The commissioning of flood studies is a requirement of Councils under the NSW Government’s Floodplain Risk Management Program. The objective of a flood study is to improve understanding of flood behaviour to better inform flood risk management for property owners and publicly managed community assets. The overall Flood Management Program’s outcomes is to increase community safety whist mitigating damage to private and public assets.
Council appointed GRC Hydro to manage the development of the flood study
Floodplain Risk Management Process
The delivery of this Draft Flood Study comprised stages 1 to 2 in the five stage process outlined in the NSW Government’s Floodplain Development Manual (FDM, 2005) These works include:
Stage Timeframe Detail
1 Late 2018
Data collection collection of all applicable data to be used for the ensuing stages of the studies; and, community consultation to inform the community of the study and collect information from them on previous flood events.
2 Drafted in 2019 Pubic Exhibition Period: 19 February to 1 April 2020
3 2020 2023
Flood Study a comprehensive technical investigation of flood behaviour that provides the main technical foundation for the development of a robust floodplain risk management plan
Floodplain Risk Management Study (FRMS) assess the impacts of floods on the existing and future community and allows the identification of management measures to treat flood risk
4 Floodplain Risk Management Plan (FRMP) outlines a range of measures, for future
implementation, to manage existing, future and residual flood risk effectively and efficiently
5 Plan Implementation once the management plan is adopted, an implementation strategy (devised in Stage 4) is followed to stage components dependent on funding availability.
Stage 1+2: Development of the Draft Flood Study
In developing the Draft Exile Bay Flood Study, all private properties and public assets within the Exile Bay catchment were assessed as to flood level depth and risk. It is the industry standard reference point and the recommended measurement within the NSW Government’s Floodplain Development Manual, to map private and public assets at risk of flooding by applying the potential 1% Annual Exceedance Probability (AEP), which is a way of understanding the likelihood of a flood event occurring in any year. This probability is expressed as a percentage. For example, a large flood (formerly known as a 1 in 100 year flood) which may be calculated to have a 1% chance to occur in any one year, is described as 1% AEP.
The following methodology was applied to identify properties which are considered to be a flood prone lot:
• Mainstream Flooding: The 1% AEP peak flood level within Saltwater Creek, Edwards Park and Greenlees Park plus 0.5 m freeboard, then extending the level perpendicular to the direction of flow.
• Overland Flow Flooding: Cadastral lots where 10% or greater of the cadastral lot is affected by 1% AEP peak flood depths of greater than 0.15 m.
Floor level estimations were completed on individual lots which met the above criteria to ascertain the individual flood risk to assist property owners and tenants.
The initial stage of developing the Exile Bay Flood Study included seeking data from property owners on past flood events in late 2018.
Page | 2
Exile Bay Catchment Summary
4190
Individual properties including strata
Consultation Summary
3,916 (93.5%) 274 (6.5%)
Number of all properties not at moderate to high risk in a 1% AEP flood event (Non FPA)
Timeframe Action Outcomes
November 2018
Development of Flood Study
Residents in catchment area surveyed about about historic flood events that they had experienced
18 February 2020
19 and 26 February 2020
Identified as a flood prone lot (FPA), including individual strata properties in a 1% AEP flood event
Communication and Engagement Channels
• Letter and survey distributed to property owners within the Exile Bay Catchment
• Inner West Courier
• Council Website Engagement Level
• 65 surveys received
Council Meeting Agenda Item to place the Draft Exile Bay Flood Study on Public Exhibition from 19 February to 1 April 2020. Status: Endorsed
Draft Exile Bay Flood Study Exhibition Period
Notification 19 February 1 April 2020
26 February29 March 2020
Draft Exile Bay Flood Study Exhibition Period Notification 19 February 1 April 2020
Communication Channels
• Notification letters with attached factsheets posted via Australia Post to FPA property owner occupiers, absentee landlords and tenants (19 Feb)
• Notification letters posted via Australia Post to Non FPA property owners and relevant Government Agencies (26 Feb)
• PromotedonCouncil’swebsiteandcollaborationSite
• Inner West Courier
Engagement Methods
• Dedicated project phone number and email address feedback@exilebay.com
• Online feedback form
• Door knocking of FPA properties to discuss the draft study
• 159 properties door knocked between 27 Feb and 4 March 80 of these were not at home or did not answer the door and a card to contact was left, which several did then contact
• Due to the merging COVID 19 crisis, the remainder of properties were left a reminder note with card in their letterboxes on 18 and 19 March prompted several to then contact via phone and email
• Schedule any 1 on 1 in person and phone meetings with flood consultants for additional technical information
Page | 3
Feedback Summary
172 unique visitors
Canadabay.nsw.gov.au Public Exhibition Item Exile Bay Flood Study
FPA Identified Properties
274 Properties identified with notificatio n letters posted to owner occupiers, absentee landlords and tenants
76 (28%) Properties successfully communicate d with via door knocking, email and phone
43 (57%) Property owners directly communicate d with accept the study’s findings
231 unique visitors
Collaborate.canadabay.nsw.gov.au Exile Bay Flood Study consultation page
12 (16%) Property owners directly communicate d with neutral and stating stormwater system is creating the issue
8 (11%) Property owners directly communicate d with unsatisfied with the identification of their properties as flood prone lots
13 (17%) Property owners directly communicate d with opinion not stated
Key issues raise
• Property values / Resale
• Future development opportunities
• Home and Contents Insurance premiums
• Maintenance / cleaning of stormwater drains
• Edwards Park stormwater network including surge pit
• Road grading and kerb heights
• Soft landscaping provision of new developments (provision too low with hard surfaces creating more run off)
• A few property owners cited they were not informed of the study previously and did not receive the 2018 notification letter or survey.
Non-FPA Identified Properties
3916
Properties identified with notification letters posted to owners
9 (0.2%) Responded to the letter
3 (33%) Respondents cited issues with stormwater
1 (11%) Respondent unhappy that their property is included in the flood level diagrams with the Exile Bay Flood Study
Page | 4
FIGURES
106 Exile Bay Catchment Flood Study Draft Flood Study Report

