DOWNTOWN PARKING STUDY
City of Van Wert, Ohio

Summer, 2021

City of Van Wert, Ohio

Summer, 2021
Seth Baker, Executive Director, Van Wert County Foundation
Hall Block, Property + Development, Van Wert County Foundation
Laney Nofer, Planning + Resources, Van Wert County Foundation
Amanda Miller, Marketing + Relations, Van Wert County Foundation
Mitch Price, Executive Director, Main Street Van Wert
Matt Saunier, Operations Steward, Niswonger Performing Arts Center
Dan Baisden, Plan Advisor
Jones Petrie Rafinski, Engineering Consultant
FIGURE
"You can't rely on bringing people downtown; you have to put them there." - Jane Jacobs
The heart of any community lies within its downtown. Van Wert is no exception, as downtown serves as the civic, cultural, and commercial center for both the city and county. In 2020, the Van Wert County Foundation and Main Street Van Wert Inc. both led significant community reinvestment efforts to create a vibrant heart for a community through three significant redevelopment efforts.
The first was Van Wert Forward's creation, a civic-minded redevelopment project to bring community partners together to expedite the restoration and preservation of core building assets downtown. Driven by the Van Wert County Foundation, the project's mission is to redevelop the downtown area for future economic development and investment by creating new multi-use properties that attract people to the community. To secure properties for the redevelopment effort, Van Wert Forward is placing critical downtown building assets into a "downtown trust" to redevelop each building to meet new innovative uses to serve the community and region.
The second was establishing a predominantly commercial district as the Downtown Van Wert Historic District, which contains 76 contributing resources that are now listed on the National Register of Historic Places. The historic district reflects a high concentration of buildings demonstrating the density and continuity of the commercial center of the city for more than 100 years. Van Wert, which was established as a small rural settlement, quickly grew due to its location on the railroad and the Lincoln Highway, which connected the Atlantic Ocean to the Pacific Ocean. The establishment of this historic district supports financial incentives to redevelop existing properties while protecting critical historic resources.
The third was creating the Downtown Van Wert Redevelopment Master Plan led by the Van Wert County Foundation. The plan was a year-long community visioning process that led to a long-term strategy to aid in the community's redevelopment efforts. Several months of community engagement sessions, public stakeholder interviews, and a dedicated planning team worked in unison to create the strategy, which provides a crucial insight into how people perceive and use the downtown area. This document is the basis on which the Downtown Van Wert Parking Plan is developed, using critical insights into understanding the Van Wert community’s future needs.
The Van Wert County Foundation initiated the idea that a parking study is needed as the organization begins to implement the recently completed Downtown Redevelopment Master Plan, which the Van Wert City Council adopted in February of 2021. This study examines the existing parking adequacy to depict a comprehensive view of parking activity and downtown issues. It also identifies both short and long-term parking strategies to ensure downtown Van Wert can accommodate the proposed developments as recommended in the plan.
The Downtown Van Wert Parking Study will aid the Van Wert County Foundation in accomplishing the following goals:
1. Ensure that downtown attracts new businesses and is conducive for residential growth
2. Parking supports both existing and future strategies
3. Mobility is supportive of all users in the Van Wert community

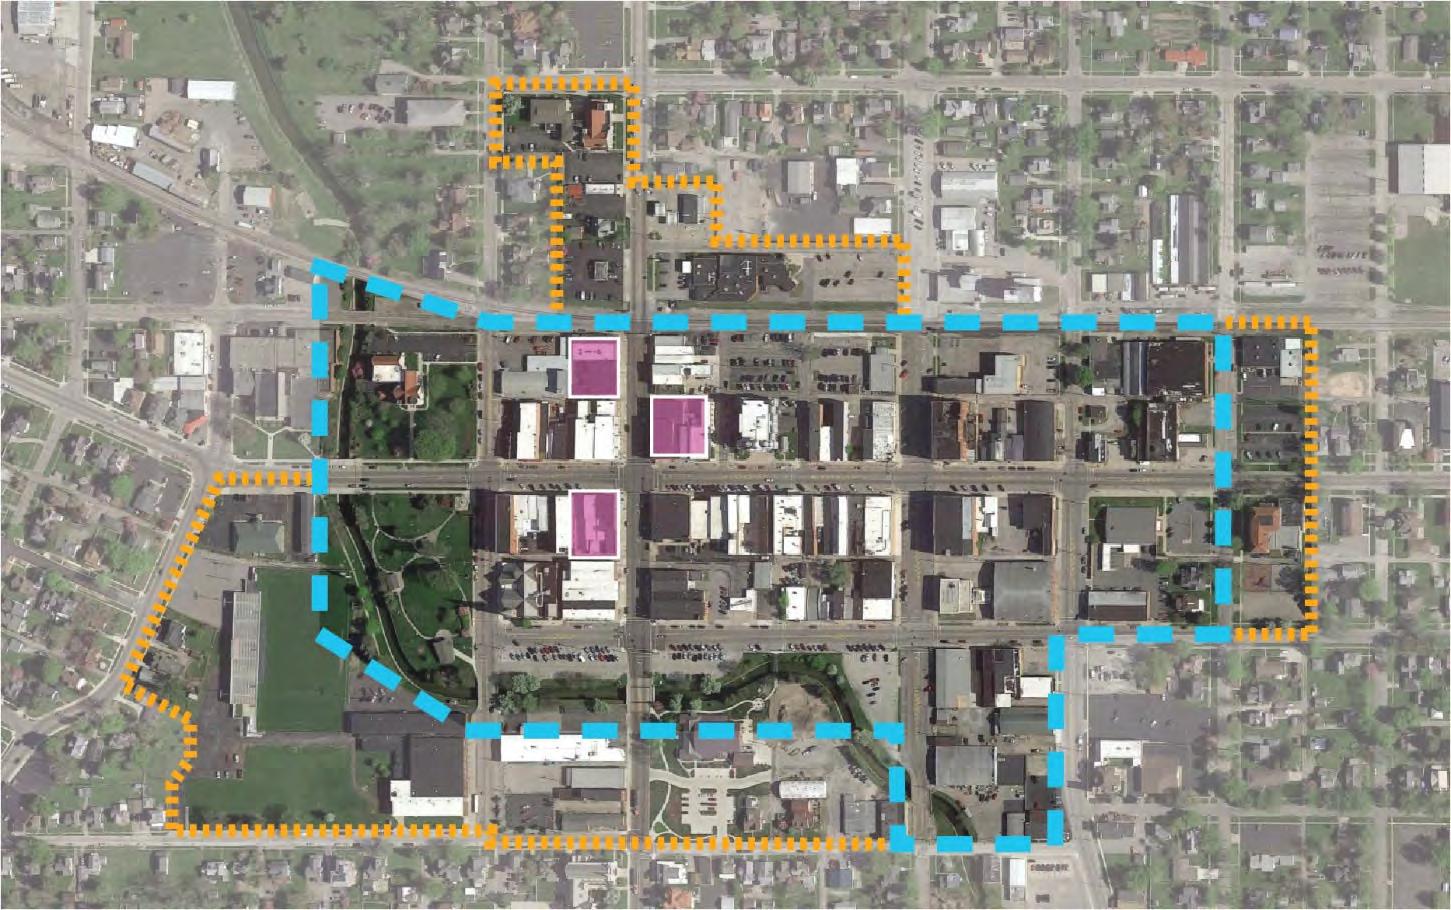
The study area closely aligns with the same found in the Downtown Redevelopment Master Plan. In FIGURE ONE below, the yellow outline shows the previously mentioned plan’s boundaries, while the blue outline identifies the boundary of the parking study area. The three pink boxes identify the anticipated Phase 1 improvements by Van Wert Forward. The parking study area was condensed down to the downtown core which will consist of varying land uses, including government, professional office space, retail, restaurants, and other civic areas. The impacts of future residential development and occupancy was considered in the following report.
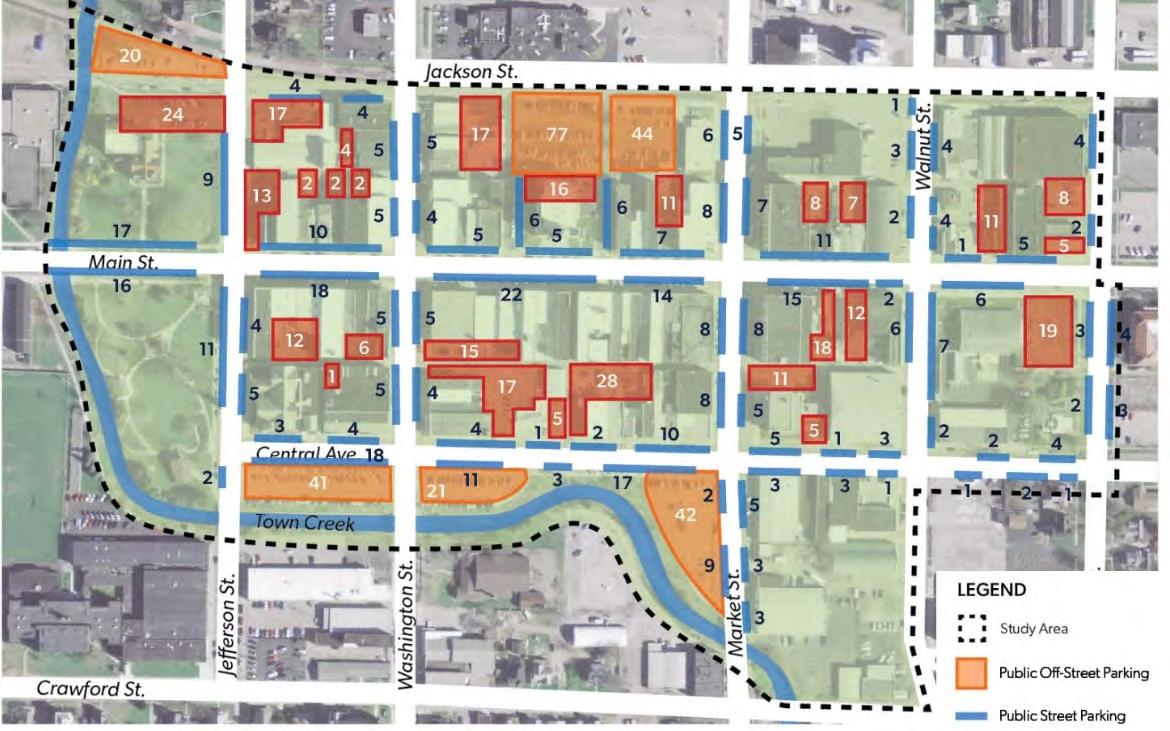
Block boundaries are defined using the road system's centerline to assign on-street parking to each block accurately. Each section of on-street and off-street parking were assigned a series of numbers or letters to assist with tracking data and displaying information that summarizes the capacity of both on-street and off-street parking.
To provide a complete understanding of the parking system in downtown Van Wert, this parking study takes a comprehensive approach to documenting users' current capacity and behavior to seek patterns of how customers, visitors, residents, and business owners use the current system. This data is then used to support a series of parking strategies that will reduce conflicts and improve the community's parking experience.
In October 2020, staff and volunteers from the Van Wert County Foundation conducted multiple field surveys to assess the existing inventory and use for both on-street and off-street parking facilities. The October 2020 data was gathered during a timeframe in which COVID-19 restrictions were mandated by the state. Knowing that this mandate portrayed a lower existing parking demand than should have been seen, a second series of field surveys, using the same measurement process, was completed in June 2021. The parking study analysis was conducted solely utilizing the field survey data gathered during the June 2021 field surveys. The current parking system consists of publicly available lots, privately owned lots restricted to both customers and employees, and on-street public parking. A few of the parking lots have time restrictions; however, a clear majority of on-street parking has an average of a two-hour parking time limit. The inventory of spaces was validated using multiple sources, including a hand-count of total spaces available, field observations, and a recent aerial photography map review. As of this parking study's writing, downtown Van Wert boasts a total of 977 parking spaces in the study area. The following sections detail the distribution of the current parking supply.
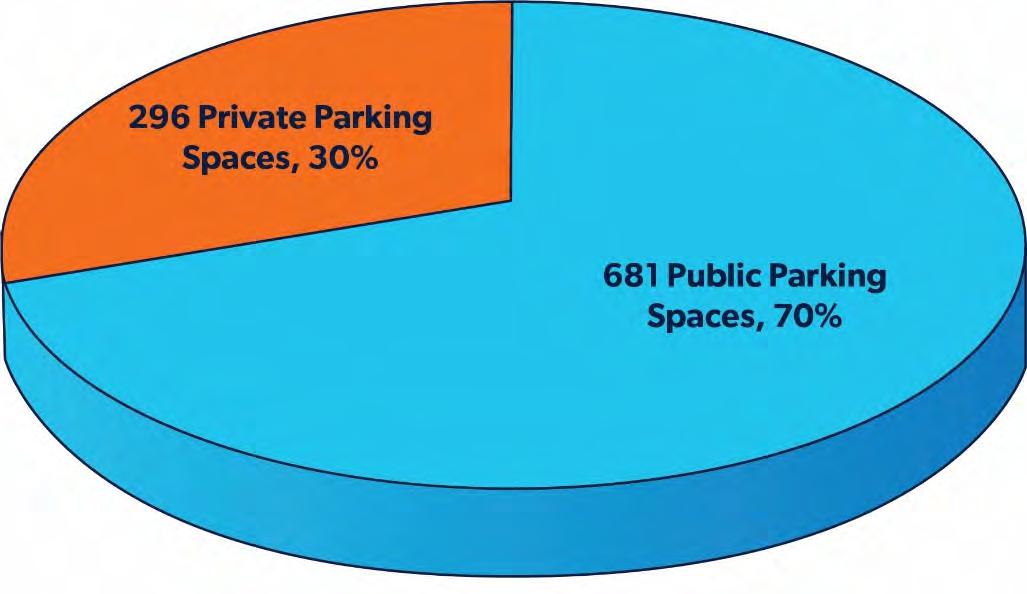
977 Total Parking Spaces in Monitored Area
681 Total Public Parking Spaces in Monitored Area
296 Total Private Parking Spaces in Monitored Area
The City of Van Wert provides free on-street parking for all of the downtown study area. While most were marked, additional field observation and measurement efforts were taken to more accurately account for available spaces along curbs. In the study area, a total of 448 spaces were calculated as on street parking. To create a parking system calculation, all on-street parking spaces were inventoried and assigned to corresponding block numbers. Through our observation, on street parking was found to be in plentiful supply throughout the entire study area with a range of parking restrictions, although not strictly enforced.
Several small businesses, private property owners, and local government agencies provide off street parking for a portion of the downtown study area. While many of the spaces had some marking level to define the number of spaces clearly, not all were adequately striped, requiring additional field observation to obtain an accurate account. In the study area, a total of 529 spaces were calculated as off-street parking. It is important to note that not all off-street parking spaces were available to the public, requiring that the study set-aside a much lower number of 233 in the study area. To create a parking system calculation, all off-street parking spaces were inventoried and assigned to corresponding block numbers.
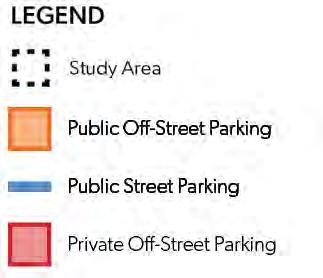
FIGURE THREE depicts the location of both on-street and off-street public and private parking spaces. There are 977 parking spaces in downtown Van Wert, and currently, 681 spaces, or 70% percent of the parking system, are available for public parking. A general rule of thumb in understanding is that public parking downtown should account for at least 50 percent of the total parking supply. Van Wert well exceeds that figure as calculated.
To create an effective parking system, it is crucial to understand the current utilization of the system. To assess the conditions, Van Wert Forward staff and volunteers conducted parking occupancy surveys to determine how many vehicles utilize both the on-street and off-street parking supply. Excluding the Fall 2020 data due to COVID-19 restrictions, the field observations from Spring 2021 illustrate the typical parking occupancy throughout the study area. The dates and times are listed below:
● SPRING 2021:
○ June 9, 10, 11, 14, 16, 18, 21, 23 and 25th
○ Times are - 9 AM, 11:30 AM, 2 PM and 5 PM
The survey was completed over four time periods crucial to understanding how the parking system is currently utilized. Two were completed in commute times (9 AM, 5 PM), and two were completed during peak hours of operation (11:30 AM, 2 PM).
Seeking to analyze the practical use and behaviors of how residents and visitors use the parking system, the plan divided the parking system of thirteen blocks into five Walk Zones, seen in FIGURE FOUR. Each Walk Zone consists of downtown blocks concentrated around a significant activity most likely to generate parking demand. The Walk Zones provide a more accurate portrayal of how people are likely to utilize the parking system.


Public Parking Average Occupancy
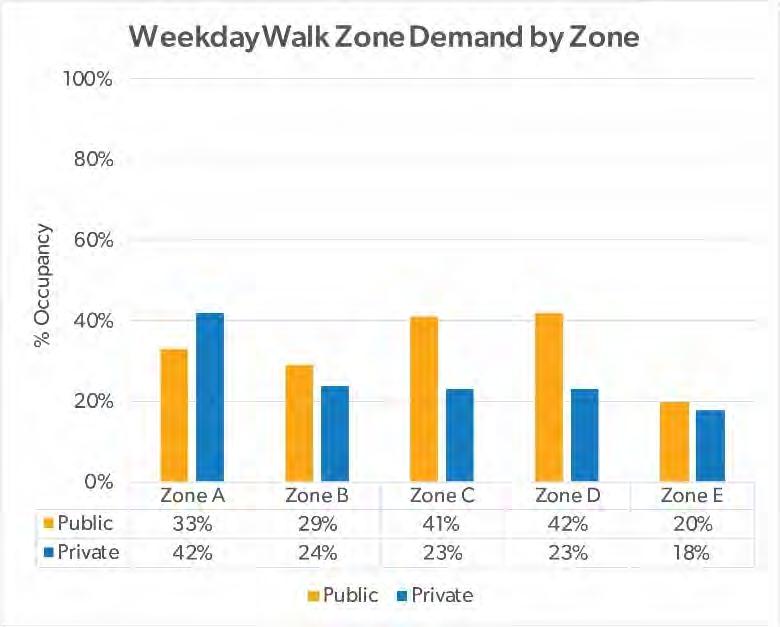
The average public parking occupancy was determined through observational data of the downtown study area. With the addition of one Thursday of data due to weather conditions, parking counts were primarily taken on Monday, Wednesday, and Friday. Each day parking counts were taken at 9:00 AM, 11:30 AM, 2:00 PM, and 5:00 PM. Overall, the occupancy throughout the downtown area was highest on Wednesday at 24% and highest at 11:30 AM/2:00 PM with 20% occupancy. The lowest occupancy is on Monday and Friday at 21% and lowest at 9:00AM/5:00PM with 15% occupancy. Van Wert’s current parking occupancy remains consistently under fifty percent with minor fluctuations in parking volume. See below for more detailed accounts of parking occupancy by walking zone
Occupancy by Day – Walk Zones A-D experience the highest percentages of occupancy on Wednesdays and averages with the lowest on Fridays, suggesting there is more need for parking during the weekdays. Walk Zone E is the outlier with the lowest occupancy percentages consistent throughout the week.
o Walk Zone A
Zone A appears slightly busier on Wednesdays at 38% occupancy of public parking with a 32% average occupancy on Mondays and Fridays. Overall, Walk Zone A’s average occupancy remains consistent throughout the week.
o Walk Zone B
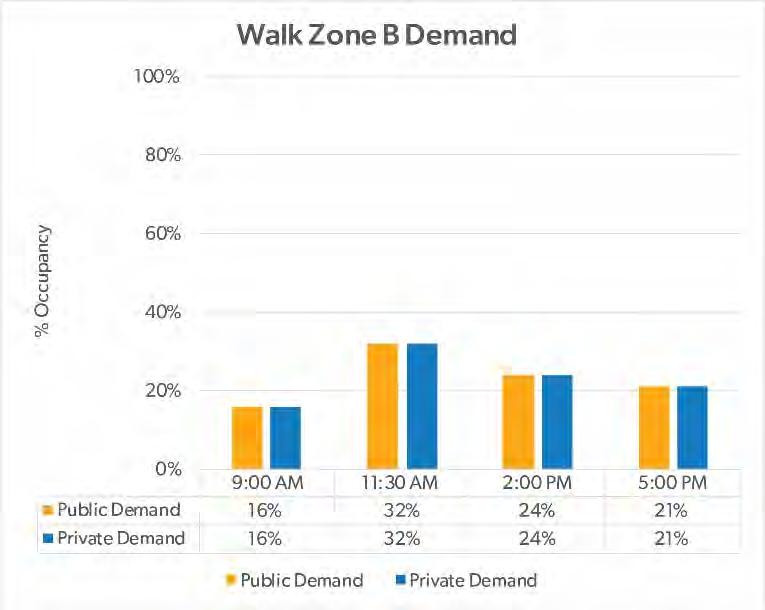
Walk Zone B is slightly busier on Wednesdays with 29% occupancy of public parking. Monday is recorded lower at 23% and Friday averages at 24% occupancy.
o Walk Zone C
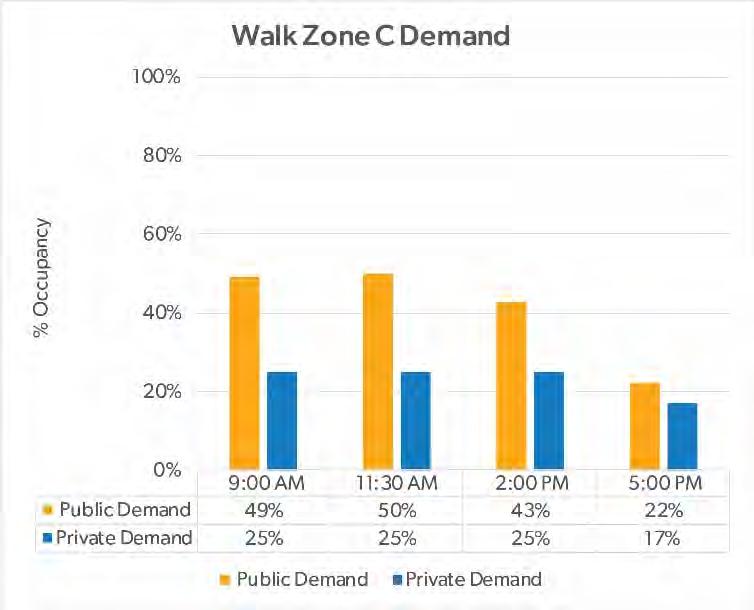
Zone C, like the other zones, is busiest on Wednesdays with 47% occupancy, but drops to 32% occupancy on Fridays.
o Walk Zone D
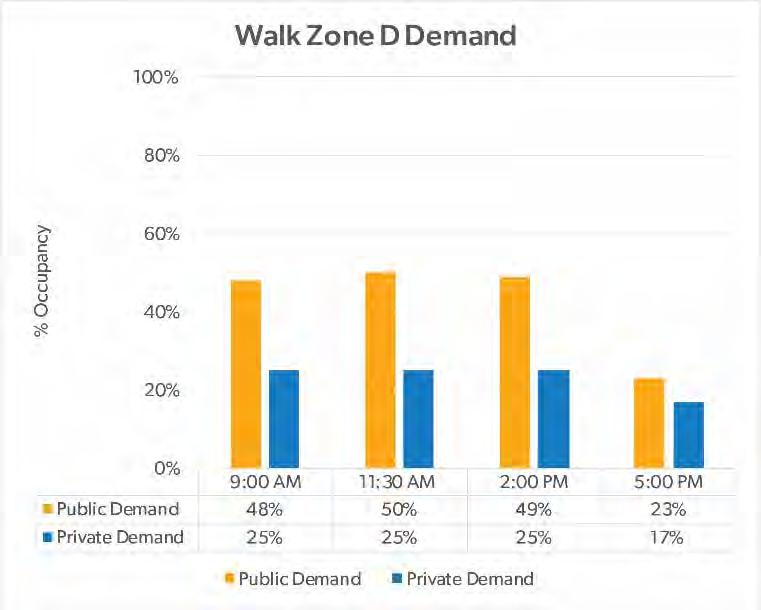
Walk Zone D is consistent at 46% occupancy for Mondays and Wednesdays but drops to 32% for Fridays, suggesting there is less of a need for public parking for weekends.
o Walk Zone E
Walk Zone E, unlike the other zones, remains consistent around 20% occupancy throughout the week.
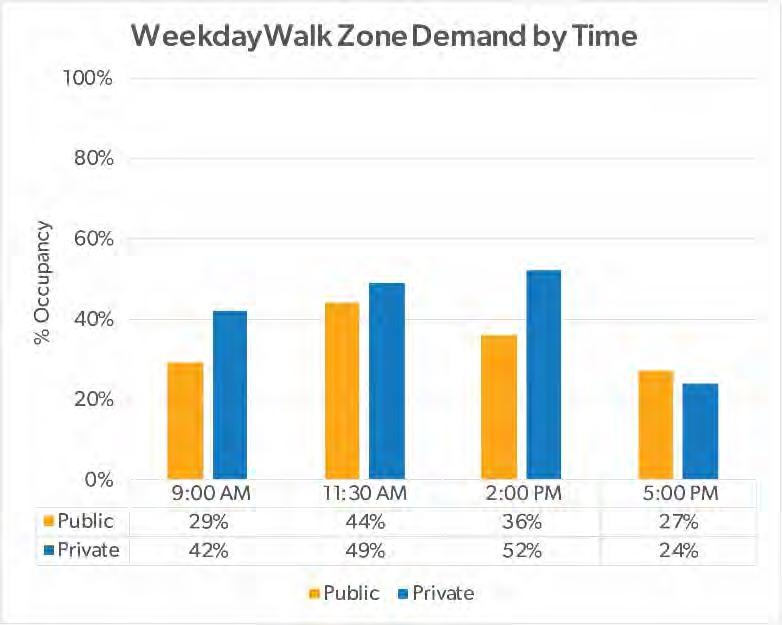
Occupancy by Time – Walk Zones A-D experience the highest percentages of occupancy at the peak time of 11:30 AM and the lowest at 5:00 PM. This suggests that the current parking demand results from customers for lunch or local businesses during the day and that the demand dramatically decreases during the evenings.
o Walk Zone A
Similar to the findings throughout the study area, Walk Zone A is busiest at the peak time of 11:30 AM with 43% occupancy. The other study hours shift between 25-35% occupancy of public parking.
o Walk Zone B
Peak time (11:30 AM) is busiest for Walk Zone B at 35% occupancy while it is the emptiest at 5:00 PM with 19% occupancy. The other times are consistent with an average of 30% occupancy.
o Walk Zone C
Walk Zone C is busiest at 9:00 AM and 11:30 AM at 49% occupancy. However, the occupancy decreases to 22% at 5:00 PM, suggesting there is currently less need in the evenings.
o Walk Zone D
Zone D remains consistent at 50% from 9:00 AM to 2:00 PM but drops to 23% at 5:00 PM. This suggests there is less need for parking in the evenings.
o Walk Zone E
Walk Zone E remains consistently around 20% occupancy throughout the day, showing only a two percent increase at peak time.
Public Parking Peak Occupancy
Peak overall parking demand occurs during both morning and mid-day observations, which is traditionally expected in downtown parking study areas. During these time frames, parking systems may be considered the most frustrating to navigate and because of this, visitors who typically find parking abundant in other parts of the community may consider parking hard to find in the downtown core. Based on our findings, below are some of the highest parking occupancy areas by time and location in Downtown Van Wert
● Walk Zone A | 11:30 AM
○ Main Street from Jefferson Street to Washington Street (South Block Face)
■ The parking in this block remains consistent between measurement periods which means that those who park on this block are likely employees or longterm customers of businesses in this same block. Low turnover causes the perception of a parking issue, although there is likely an inadequate supply of private parking for these businesses causing the long-term parking.
● Walk Zone C | 9 AM & 11:30 AM
○ Main Street from West Court Street to Market Street (South Block Face), and Market Street from Main Street to Central Avenue (West Block Face)
■ The parking in this walk zone is mixed with both consistent long-term parking between measurement periods and high turnover which is likely the effect of nearby 133 Bistro and Fettig’s Flowers. The consistent parking is evidenced in supporting the office uses by businesses situated along East Main Street. This does not necessarily require additional parking, but instead better parking management.
● Walk Zone D | 9 AM, 11:30 AM & 2 PM
○ Main Street from West Court Street to Market Street (North Block Face), and East Court Street
■ The parking in these blocks have high turnover, but are constant, which means that there is demand for accessible parking to 133 Bistro and the Van Wert County Courthouse. This shows that the existing parking supply is sufficient because it does not approach the 85% threshold, but that better parking management may be needed.
● The only private parking area which sees any stress is Walk Zone A at both 11:30 AM and 2 PM
○ Private Parking Areas A & G are regularly used by employees of offices on West Main Street, which results in these areas nearly approaching capacity. This does, however, free up on-street parking in Walk Zone A.
The above peak occupancy demand expresses a couple of items which need to be addressed. The first includes the need to re-imagine the parking availability in Walk Zone D, and ensuring the businesses in Walk Zone A and C have enough private employee parking available.
Downtown Van Wert provides a wide variety of land uses and a dense, walkable street grid that encourages users to park once and not drive to each destination. The existing business mix supports this opportunity to an extent but lacks the mass appeal for regular practice. With the recently completed Downtown Van Wert Redevelopment Master Plan and ongoing Van Wert Forward investment, much of this business mix will be addressed in the coming years to support dense and walkable mixed-uses.
The analysis recognizes that even with increased density and a business mix, many patterns of how Van Wert uses the parking system will be hard to change. The approach used in the following pages is based on national standards and practices while using observed behaviors and local data to better account for future needs. This analysis provides the City and the Van Wert County Foundation with the current and future parking demands to identify potential implementation strategies.
Most parking studies have used the long-standardized Institute of Transportation Engineers (ITE) Parking Generation Manual to determine a development's demand on existing and future parking systems. ITE rates are derived from multiple case studies around the nation and provide an analysis based on the size and scope of development in urban and suburban contexts and multiply this with a standard peak parking rate to estimate the maximum number of spaces each use or building needs. While ITE rates and methodologies are widely used, it fails to capture actual parking behavior or demand and assumes that spaces are utilized in a consistent role throughout the day and calculates a peak-demand rate for the worst-case scenario.
An example of how ITE is impractical is recognizing that the Van Wert County Courthouse is not being used consistently throughout the day. It observes peak usage times between 8 AM and 5 PM; however, it is underutilized on nights and weekends, making the use of ITE calculations obsolete.
The Downtown Van Wert Parking Study seeks to analyze the practical use and behaviors of how residents and visitors utilize the parking system. The plan as written divides the parking system into five Walk Zones, each consisting of downtown blocks concentrated around a significant activity that is most likely to generate parking demand.
The Walk Zones provide a more accurate portrayal of how people are likely to utilize the parking system. Contrary to the widely used ITE methodology that provides an observed peak rate, Walk Zones provide a way of measuring the parking system capacity and use and allows partners to understand the current and future needs identified in the next section of the report. These findings will also be used to provide strategic recommendations for each zone and general strategies for the entire study area. See FIGURE FOUR above for the Walk Zones identified within the study area.
It is important to note, within each Walk Zone, the downtown parking system includes restricted parking areas provided for specific users that do not satisfy the greater need for public parking. While the plan will recommend promoting shared-use parking, it may not always be possible due to owner-user conflict.
The Observed Parking Demand is measured over several consecutive periods monitoring the usage of the same number of available spaces and calculating the percentage of use from the total availability. The following is a summary of the observations:
Average
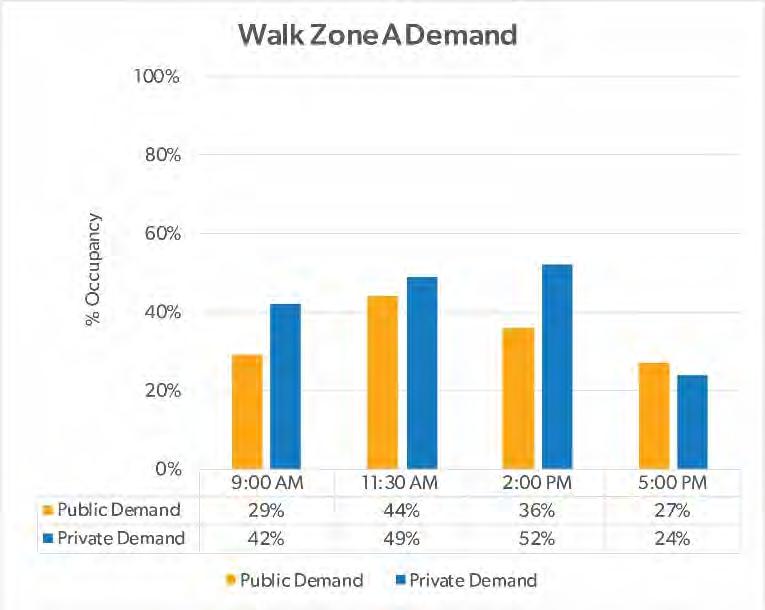
FIGURE SIX | OBSERVED
Average
Average
Average
Average
Average
Average
Average
Average
Average
Average
Average Weekday Public Demand at 9:00 AM
Average Weekday Public Demand at 11:30 AM
Average Weekday Public Demand at 2:00 PM
Average Weekday Public Demand at 5:00 PM
Average Weekday Public Demand on Mondays 18%
Average
Average
Average
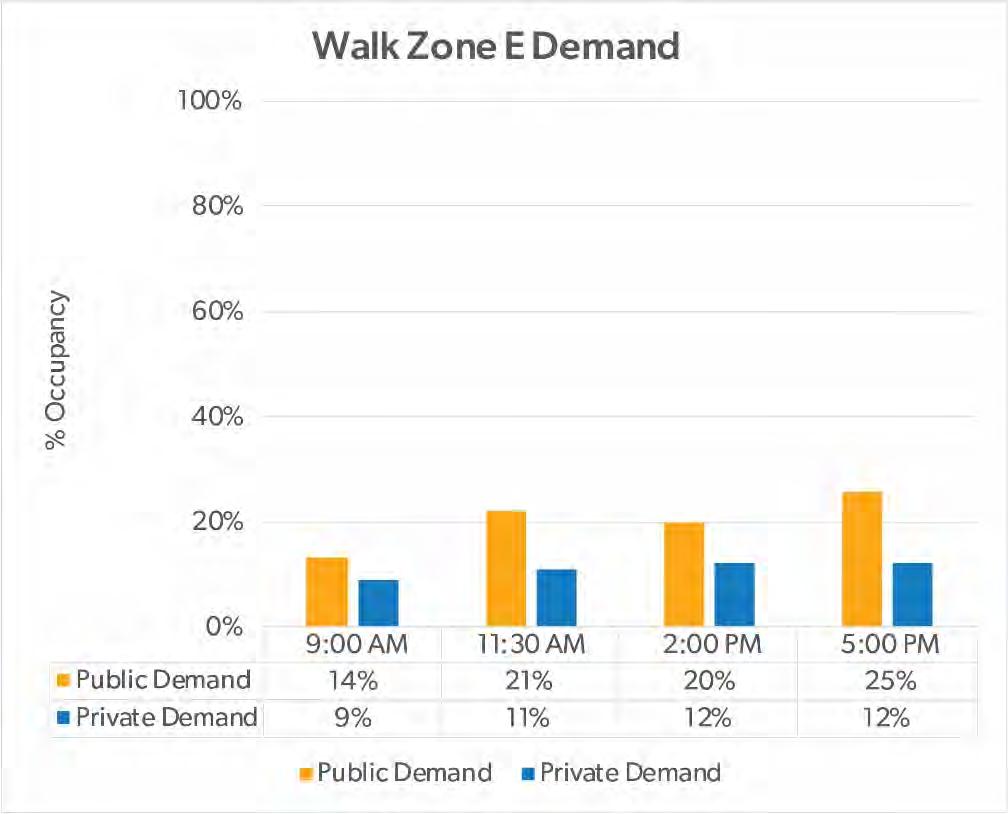
FIGURE TEN | OBSERVED


The Downtown Van Wert Parking Study analyzes each zone by adjusting the supply by 85 percent to reflect the parking system's practical capacity. Standards created by the parking industry often acknowledge that parking facilities are efficiently utilized when 85 percent of spaces are full, and any use beyond this threshold causes significant inconvenience, such as spending additional time finding space, increased circulation, and a farther distance for walking. When this threshold is passed, there is an increase in congestion and these travel times, leading to potential safety concerns.
As you can see above in FIGURES FIVE through TEN, ZONE C and ZONE D both experience the highest demand at 48% of the supply, although it still remains far from reaching practical capacity.
Walk Zone A:
● Located closest to Fountain Square Park, ZONE A provides a maximum of 73 On-Street Public Parking Spaces. Measuring On-Street supply and the total public parking supply is essential because of future plans to remove the surface parking for a new linear park in the Downtown Van Wert Redevelopment Master Plan.
● ZONE A averaged a 34% weekly public parking demand.
● Only 30% of the On-Street Public Parking is utilized in ZONE A.
● The busiest time of day is 11:30 AM which averages at 44% of capacity and aligns with
the entire system's highest daytime demand.
● The two public surface lots provide 73 spaces to the system capacity, and the usage rarely exceeds 30%. The surface lots' peak usage does not exceed 36%, which means the current spaces are underutilized and likely under programmed for efficiency. These two surface parking lots serve few purposes beyond church parking for First Methodist, event parking for Fountain Park, and potentially overnight residential.
Walk Zone B:
● Located closest to the Brumback Library, ZONE B is unique in that it provides only 54 public spaces, but 64 private spaces which creates an imbalance of daily public availability for the highly trafficked zone.
● Public Parking in ZONE B remains heavily underutilized although in some regards, it may be the most transient of spaces based on the business mix along West Main Street. The study found that only 29% of the public spaces were utilized. The privately held spaces remained steady between 21% and 24%.
● As experienced in other walk zones, ZONE B had its peak usage during the 11:30AM measurement period, topping out at 35%.
● As properties in ZONE B are rehabilitated and demand will increase due to a larger variety of commercial and residential uses, the demand for parking too will increase. The existing parking supply is too low to support the future uses that will be implemented in Walk Zone B. This will require that the projects should consider ways in which to protect residential parking in the rear of structures and consider alternatives for public parking in shared agreements with existing private parking spaces.
Walk Zone C:
● On-Street Public Parking provides a maximum of 120 spaces in ZONE C. This is important to segregate the number of On-Street spaces from surface spaces located on Central Avenue to understand the proposed impact of the Downtown Van Wert Redevelopment Master Plan. With on-street and off-street public parking, ZONE C provides 173 public parking spaces.
● Walk Zone C had an overall demand at 41%, which is still far less than practical capacity.
● No more than 40% of the On-Street Public Parking is utilized in ZONE C.
● The busiest time of day is 11:30 AM which is a 50% usage of the total on-street parking supply. This aligns with the other Walk Zones and is likely due to an increase of downtown traffic during the lunch hour.
● The two public surface lots provide 53 spaces to the system capacity, and the usage is approximately 17%. The surface lots' peak usage does not exceed 57%, which means the current spaces are well situated for downtown office use, but likely remain under programmed for efficiency. Due to their location, these two surface lots are more likely to be used as overflow parking for the Wassenberg Art Center during events.
Walk Zone D:
● On-Street Public Parking provides a maximum of 52 spaces in Zone D. A majority of the public spaces in this zone are provided through public parking lots located at the Van Wert County Courthouse, where the capacity increases 121 for a total of 173.
● Only 30% of On-Street Public Parking is utilized in Zone D. The busiest time of day is 11:30 AM at 50% occupied parking, which supports the theory that 133 Bistro creates temporary demand on the parking system.
● Zone D is the location for both the Van Wert County Courthouse, and Van Wert County Sheriff’s Office, both of which can significantly alter private vehicle use day-by-day, causing a minor impact on the overall demand. ZONE D saw an average weekday parking demand of 43%.
● The two public surface lots provide 121 spaces to the system capacity, and the usage is approximately 47%. The surface lots' peak usage does not exceed 50%, which means the current spaces are underutilized and likely under programmed for efficiency.
● The two public surface lots, one of which is owned by Van Wert County has its highest use between the hours of 8AM and 5PM which means that a majority of the vehicles that use the space are low turnover, and likely employees of the county. This shows that the public surface lot directly behind the Van Wert County Courthouse could serve multiple functions throughout the day, from employees during the day to entertainment or downtown living in the evenings.
● The largest downtown parking anomaly is found in ZONE E where businesses tend to have an ample supply of private parking and public parking is extremely underutilized making portions of the downtown east of Market Street feel abandoned at peak usage times.
● A total of 149 Public parking spaces exist in ZONE E, the average weekday occupancy never reaches more than 20% of the total which means ample parking remains in the walk zone for most of the day. During the peak time of 11:30 AM, ZONE E increases to an average occupancy of 24%, still well below the 85% occupancy threshold and indicating the underutilization of the current available parking.
● The zone also has a total of 104 Privately owned parking spaces, a number which far exceeds any other walk zone meaning the already high number of public spaces is further under-programmed by the high number of private spaces creating a potential psychological barrier for safe pedestrian experiences. At no point do the private spaces in ZONE E exceed 25% of the total capacity, which shows there is room for significant reutilization of the existing spaces for potential infill projects.
● One opportunity to reduce the overall stress on ZONE C and ZONE D is to create more attractive and welcoming nearby spaces on East Main, East Central and the east face of Market to draw users with new streetscape, lighting, trees, and other fixtures that enhance the experience and improve user safety.
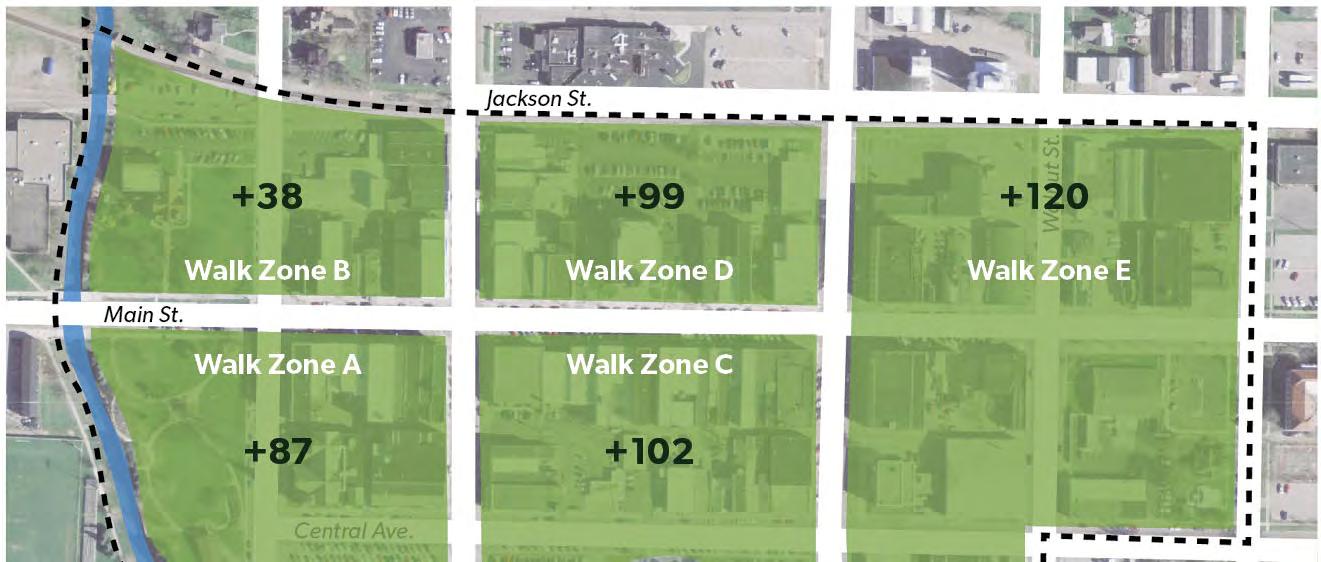
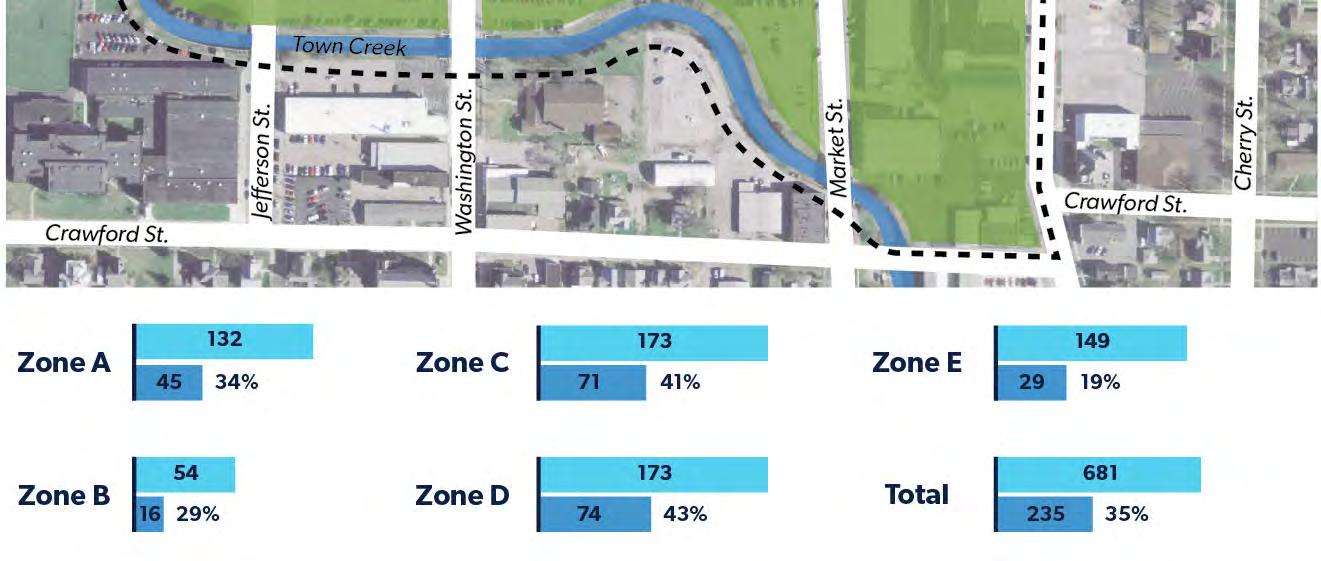
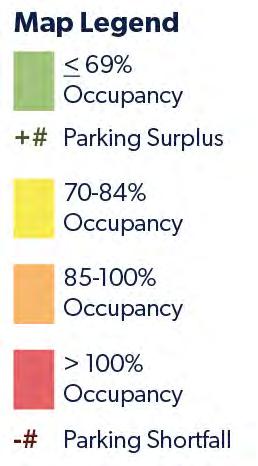
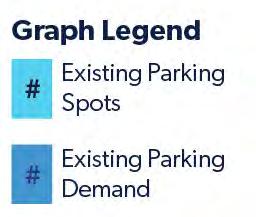
FIGURE TWELVE | OBSERVED EXISTING PUBLIC PARKING DEMAND - AVERAGE (8AM –5PM)
Figure Twelve above emphasizes the extensive surplus of parking spaces currently available in the study area. Walk Zones C and D see the highest percentage of occupancy, but Walk Zone B shows the lowest number of available parking spaces. The low number of spaces built in Walk Zone B will be important to remember for the future impacts of redevelopment.

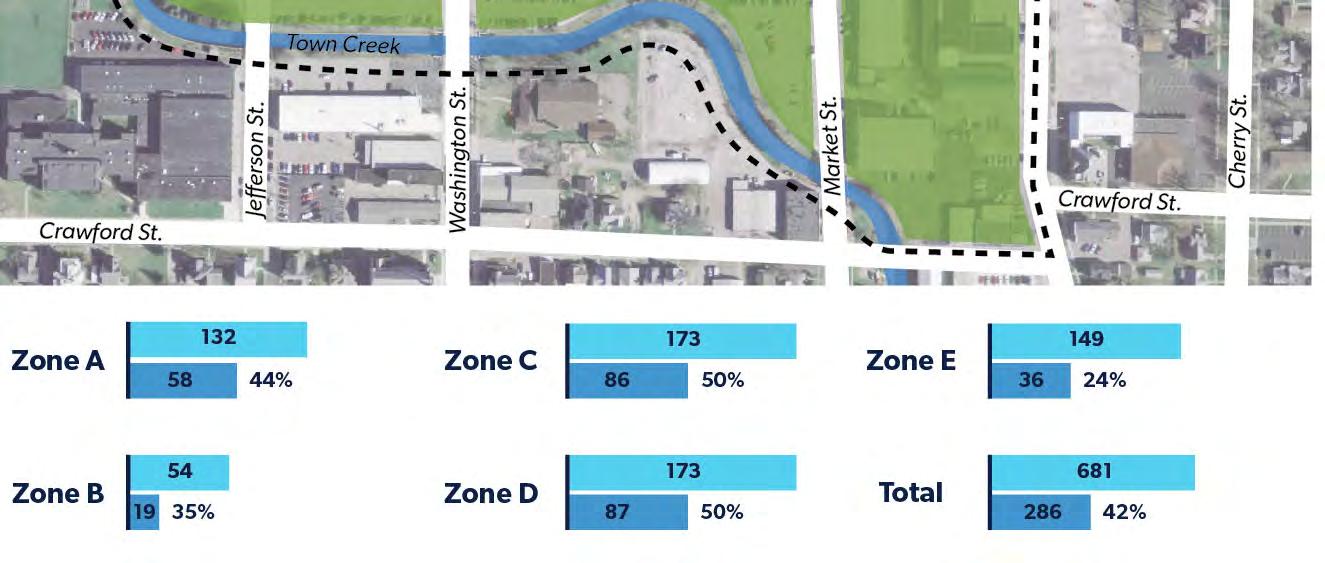


Additionally, the Zone A parking supply is in higher demand than the Zone B supply. The same is true regarding Zone D, which has higher demand than the Zone C supply. While each zone has several parking spaces available, it is often in the areas that are the furthest away from the destination people are traveling to.
This shows that while parking demand does not reach potential capacity, there are some stressors on the existing parking system, and those can be experienced throughout specific times of the day.
The observed demands from each zone help generate a better understanding of the impact the observed parking demand has on the parking system.
Using the summarized building area by zone, the plan can calculate the zone's parking supply rate, the observed rate, and the number of parking spaces needed to support peak demand. There are approximately 2.25 public parking spaces provided per 1,000 square feet of occupied downtown businesses. Comparing the adjusted parking needs by zone with the available parking
supply to determine the zone's calculated parking deficiencies provides a better picture of what may be needed in downtown Van Wert to absorb new commercial and residential development expected within the parking system boundaries.
The available parking supply is 977 total spaces, and the calculated spaces needed to meet demand are 323 total spaces. This shows a current surplus of 654 total spaces according to the downtown Van Wert development pattern. When considering how parking system users navigate public parking only, this number shows 681 public parking spaces, and the calculated spaces needed to meet demand is 235 total spaces. This shows a current surplus of 446 total public parking spaces according to the current user.
To understand how the current parking occupancy may impact the estimates of supply and demand, it is crucial to recognize that of the 977 total spaces available during the week; there is only a demand for 290 total spaces or 29% of the supply.
Public-accessible parking is in slightly higher demand during the week, as there are only 681 public spaces, and the calculated demand is 225 public parking spaces or 33% of the supply. This being said, the evidence from both measurements show there is not a parking space shortage in downtown Van Wert; instead there are usage and distribution issues. For example, many of the employees for storefront businesses park in the prime public spaces in front of the building. A more successful distribution of employee parking would be in an underutilized surface lot within walking distance (about 600’) of the business. This way the employees are still parking comfortably close to work but the customers are able to park closer and spend more time shopping. The same scenario is true for residents; a better utilization of public parking for residents would be in a designated, nearby lot. Additional approaches to create a more efficient utilization of the parking supply are explained in-depth within the Parking Strategies section of this study.
In Walk Zone A, there are currently 151 total spaces, and the calculated space needed to meet demand is 51 total spaces. This shows a surplus of 100 total spaces.
The public currently can use 132 spaces, and the calculated space needed to meet demand is 45 spaces, which shows a surplus of 87 total public spaces.
When considering the system's weekday usage, the parking system only needs 66 total spaces to meet existing demand, which is a surplus of 85 total spaces and needs 58 public spaces for demand, which is a surplus of 74 total public spaces.
In Walk Zone B, there are currently 118 total spaces, and the calculated space needed to meet demand is 33 total spaces. This shows a surplus of 85 total spaces.
The public currently can use 54 spaces, and the calculated space needed to meet demand is 16 spaces, which shows a surplus of 38 total public spaces. When considering the system's weekday usage, the parking system only needs 33 total spaces to meet existing demand, which is a surplus of 85 total spaces and needs 16 public spaces for demand, which is a surplus of 38 total public spaces.
In Walk Zone C, there are currently 238 total spaces, and the calculated space needed to meet demand is 61 total spaces. This shows a surplus of 177 total spaces.
The public currently can use 173 spaces, and the calculated space needed to meet demand is 71 spaces, which shows a surplus of 102 total public spaces. When considering the system's weekday usage, the parking system only needs 78 total spaces to meet existing demand, which is a surplus of 160 total spaces and needs 71 public spaces for demand, which is a surplus of 102 total public spaces.
In Walk Zone D, there are currently 217 total spaces, and the calculated space needed to meet demand is 67 total spaces. This shows a surplus of 150 total spaces.
The public currently can use 173 spaces, and the calculated space needed to meet demand is 62 spaces, which shows a surplus of 111 total public spaces. When considering the system's weekday usage, the parking system only needs 68 total spaces to meet existing demand, which is a surplus of 149 total spaces and needs 61 public spaces for demand, which is a surplus of 112 total public spaces.
In Walk Zone E, there are currently 253 total spaces, and the calculated space needed to meet demand is 49 total spaces. This shows a surplus of 204 total spaces.
The public currently can use 149 spaces, and the calculated space needed to meet demand is 35 spaces, which shows a surplus of 114 total public spaces. When considering the system's weekday usage, the parking system only needs 88 total spaces to meet existing demand, which is a surplus of 165 total spaces and needs 40 public spaces for demand, which is a surplus of 109 total public spaces.
As the Downtown Van Wert Redevelopment Master Plan provides strategies to transform downtown into an attractive, cultural center for Van Wert County where people want to live and work, this parking strategy must recognize its own recommendations. When any downtown is redeveloped, a new business is opened, or a new resident moves into a converted second-floor suite, an increased demand on the existing parking supply is seen. In concert, these activities will add to the demand, with more users having to compete for parking during peak periods throughout the day. Creative strategies will be needed to offset the current demand and support future development in the study area.
This plan utilized the Downtown Van Wert Redevelopment Master Plan and current development strategies of Van Wert Forward to gain a better understanding of how future development within downtown will affect the current parking demand. As the downtown evolves with greater business and residential occupancy rates, the parking needs will increase. This study calculates estimated parking demands for future developments to serve as an aid in future planning decisions to accommodate parking impacts and maintain an attractive downtown environment.
The presence of attractive destinations within downtown environments are key to their success but providing a convenient and safe means of access to these destinations is pivotal to their success. Downtown Van Wert is fortunate to have many existing buildings with historic character that remain and to have sidewalks of generous width to promote a safe environment for pedestrians. This presence of walkways should be built upon within the downtown to promote the walkability within the downtown and to increase the Level of Service (LOS) for patrons. The walking distance from a parking space to a destination should meet the needs of the intended parkers. One of those considerations would be the maximum walking distance that is reasonable for one to walk. Below are standards typically applied when planning for parking supply:
- 600’ maximum walking distance for patrons (4ft/second = 2-3 minute walk)
- 1,200 – 1,600’ walking distance for employees (4ft/second = 5-10 minute walk)
To provide an adequate LOS for the downtown, it is recommended that patrons be required to walk no more than 2-3 minutes or 600’. Employees at local businesses or visitors to large events could be asked to walk 5-10 minutes or 1,200’-1,600’. The range in time incorporates wait time for traffic and traffic signals. FIGURE FOURTEEN provides an overlay of downtown Van Wert to show the walk distances from the heart of downtown. FIGURE FIFTEEN provides and overlay of the Walmart within Van Wert to show the walking distance a patron would typically walk from their parked vehicle to the entrance.


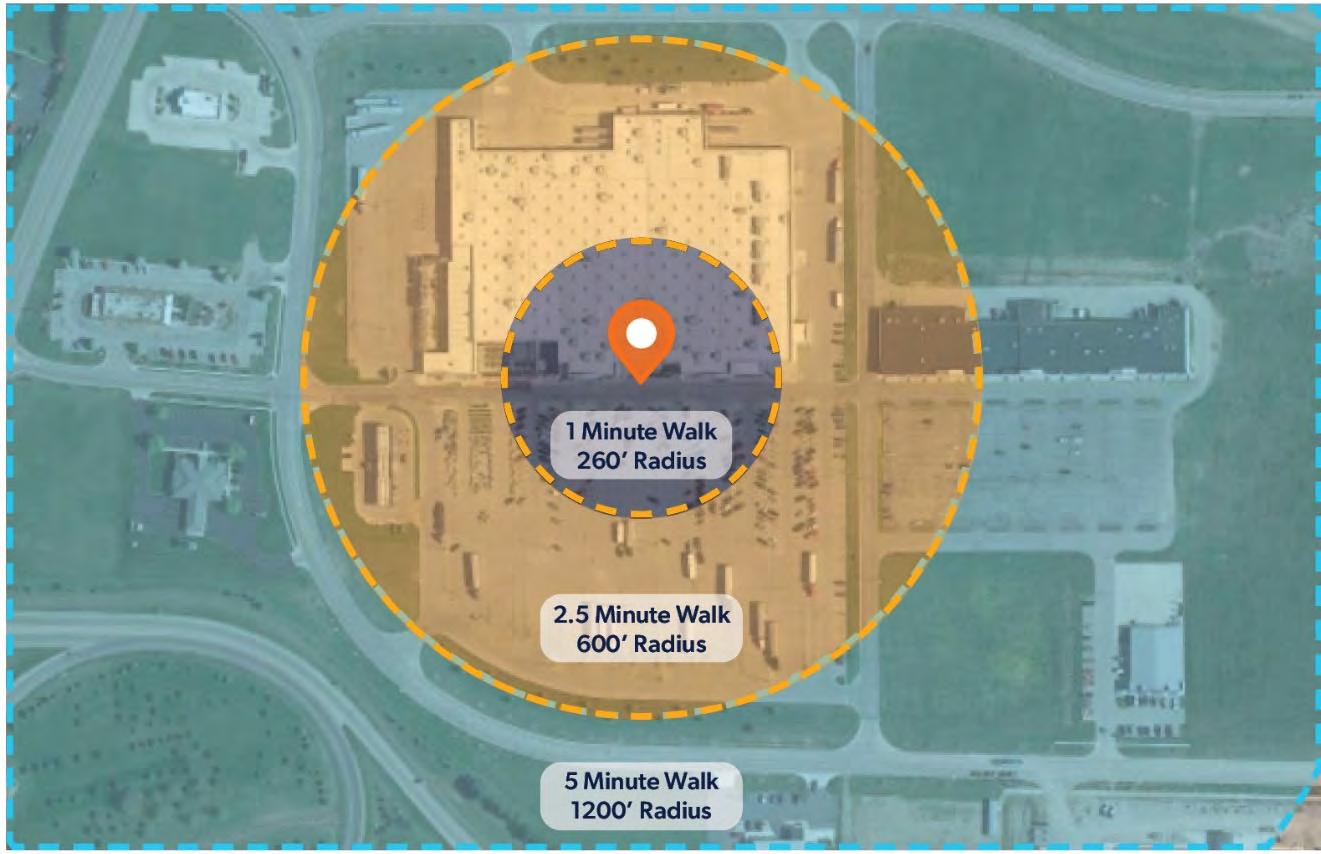
As FIGURE FOURTEEN shows, most of the downtown falls within the 2-3 minute walk distance, but the 5-10 minute walk range covers the entire parking study area. Walkable conditions allow downtowns to thrive by allowing visitors to access multiple business with ease and without the need to get back in their car. Walkable downtown conditions also promote versatility when it comes to parking. Strategically located parking spaces can provide access to multiple destinations. Since a single parking space can serve multiple destinations throughout a downtown, it is important to analyze the use of spaces across walk zones and the entire downtown area. This method of analysis is a more accurate portrayal of the practical use and behaviors of how residents and visitors utilize the whole parking system.
The top map shows Van Wert’s downtown and how long it would take to walk from the courthouse to various attractions in the area. The second map shows the same walk times over top of Van Wert’s Walmart and parking lot. The majority of the downtown study area falls within a 2.5 minute walk, or the time it takes to walk from Walmart’s parking lot to the entrance. Assuming the walk time from a parked car to the entrance of Walmart is acceptable, it would be beneficial to design future parking within a five-minute walking distance. For example, while there may not be parking immediately outside the businesses, residents and visitors should be comfortable walking from a parking lot at Main Street and Jefferson to walk to a business at Central Avenue and Washington.
After completing the observations and analysis of the existing parking supply and demand, the next step involved the assessment of the future parking needs. This step of the parking study is necessary to ensure the parking supply demands of today and the foreseeable future can be met. The results serves as a valuable tool for the long-term planning efforts of downtown and the efficient management of the downtown parking system.
To accomplish this assessment the proposed development of the Downtown Van Wert Redevelopment Master Plan and current development strategies of Van Wert Forward were analyzed. All downtown properties anticipated potential development were identified and information about the existing/proposed use and the square footage of the improvements were gathered into TABLE TWO. Roughly 50 properties throughout all five Walk Zones were identified.
E 200-206 E. Main Retail Grocery 8010 20
E 210 E. Main Personal Services Business 3600
E 212 E. Main Parking Lot Business, Rest./Bar -
E 218-222 E. Main Restaurant/Bar Restaurant/Bar 5949 6
E 201 E. Main Vacant Corporate Bldg./Hotel 26000
E 209 E. Main Personal Services - -
E 211 E. Main Restaurant/Bar - -
E 213 E. Main Vacant - -
E 223 E. Main Vacant Brew Pub 8712
E 309 E. Main Vacant Personal Services 2904
E 311 E. Main Vacant Fitness 1400 9
E 315 E. Main Vacant Mixed Use 8705
E 115 N. Cherry Vacant Mixed Use 9000
E 323-325 E. Main Vacant Restaurant/Bar 1569
The next step was to determine what parking demands these proposed improvements would require. It is the belief that the current ordinance and standardized set of rules and regulations do not allow for proper redevelopment of the downtown as most of the downtown would be required to be parking. To support downtown businesses and capitalize on the walkability of the downtown, it would be recommended that the City of Van Wert adjust the current parking ordinance to develop a Downtown Parking District with specific rules. The preferred adjustment would be to remove parking minimum requirements for development within the downtown redevelopment area boundaries. The removal of parking minimums does not mean parking should not be provided within downtown. Parking is still a necessary amenity to service downtown businesses, so this study analyzed zoning ordinances of similar Ohio and Indiana cities to determine more appropriate ordinance requirements for the downtown area to provide an adequate parking supply for the downtown area.
Of the fifteen Ohio and Indiana cities studied, eleven do not have parking requirements for their downtown districts. These cities do not alter their existing parking ordinance other than stating that the downtown districts are exempt from the parking minimum requirements. It would be beneficial for Van Wert to outline the parameters of their downtown core and eliminate the parking minimums within to allow for successful development; if the existing ordinance remains, nearly half of downtown will have to be demolished (buildings shaded in red within FIGURE EIGHTEEN) to meet the current parking standards (see orange parking spaces in FIGURE SEVENTEEN for parking requirement to meet current ordinance). The current zoning requirements for Van Wert are made for the entirety of the city, and what functions best in more suburban areas for parking is not
beneficial in the urban downtown development. For example, locally, Wapakoneta and Celina have defined central business districts within their downtown areas to do without parking minimums and, regionally, Fort Wayne, Toledo, Dayton, and Findlay have been successful without parking minimums to for allow redevelopment to flourish. If Van Wert were to establish no parking minimums, it would allow for the current plan for downtown redevelopment to be successful while still including a supply of parking for the local businesses and residents.


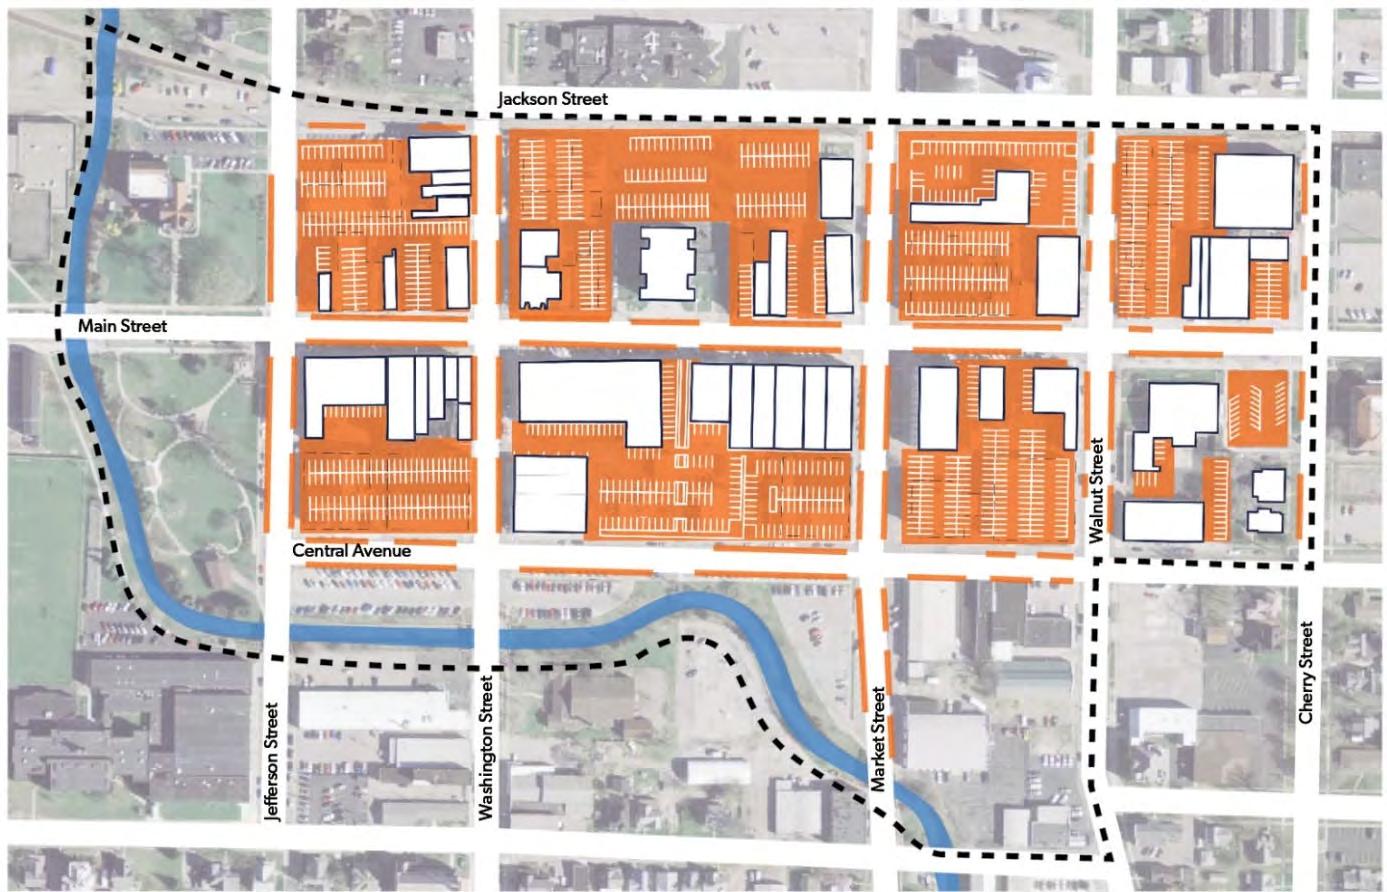
FIGURE SEVENTEEN | PROPOSED PARKING REQUIREMENTS PER ORDINANCE
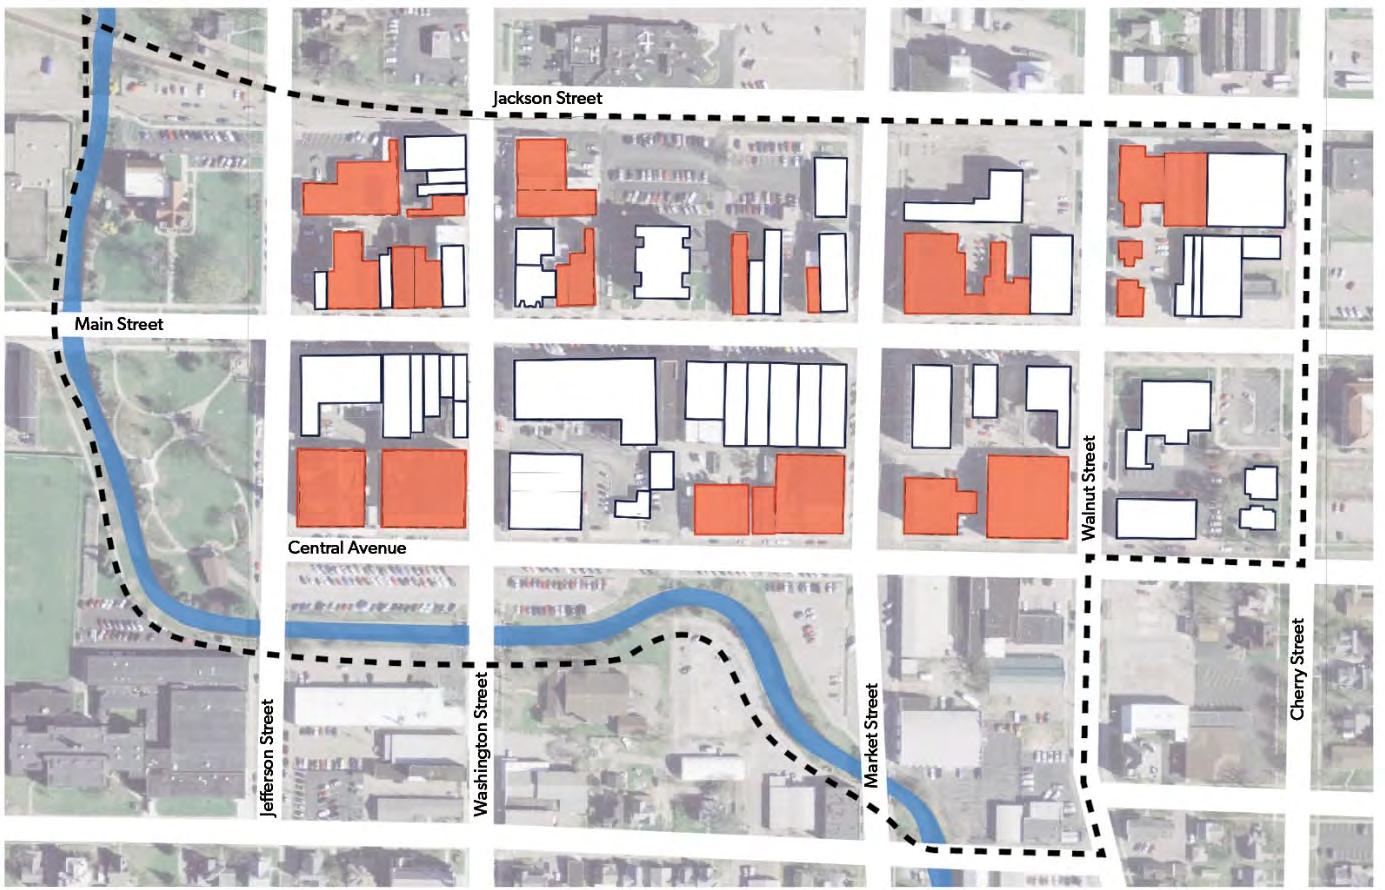
FIGURE EIGHTEEN | PROPOSED BUILDING LOSS TO MEET PARKING ORDINANCE
TABLE THREE | PARKING REQUIREMENTS OF SIMILAR CITIES
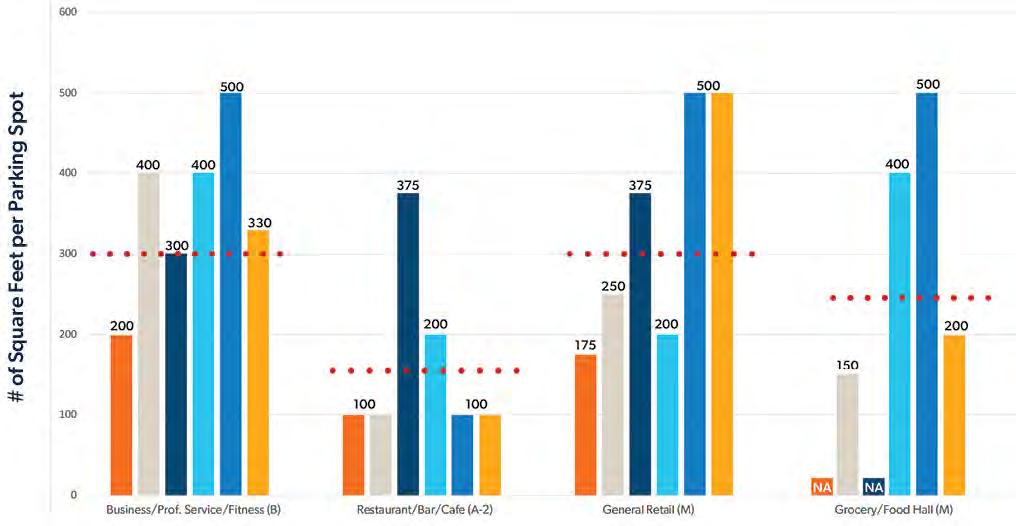
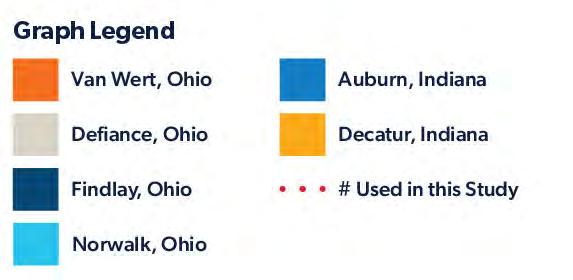

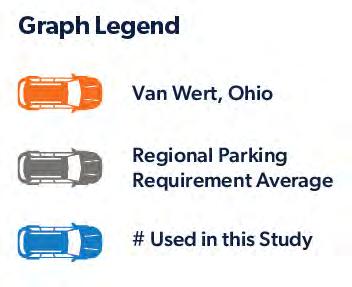
NINETEEN | AVERAGE PARKING REQUIREMENTS OF SIMILAR CITIES
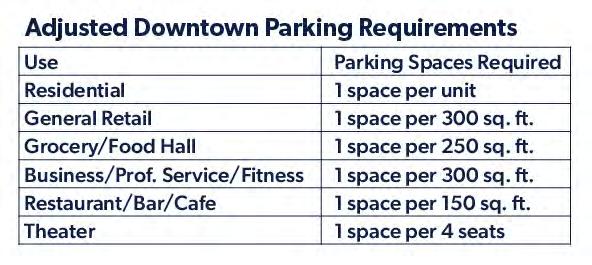
While the goal is to have a downtown with no parking minimums, this study realizes that the downtown still needs to provide an appropriate level of parking supply. To determine this, the adjusted downtown parking requirements outlined in TABLE FOUR were utilized in conjunction with the proposed future uses that we identified in the master plan.
A preliminary master plan was developed outlining potential future uses for buildings currently owned by the Van Wert County Foundation. FIGURE TWENTY shows the preliminary layout and breakdown of potential uses for many of the downtown buildings.
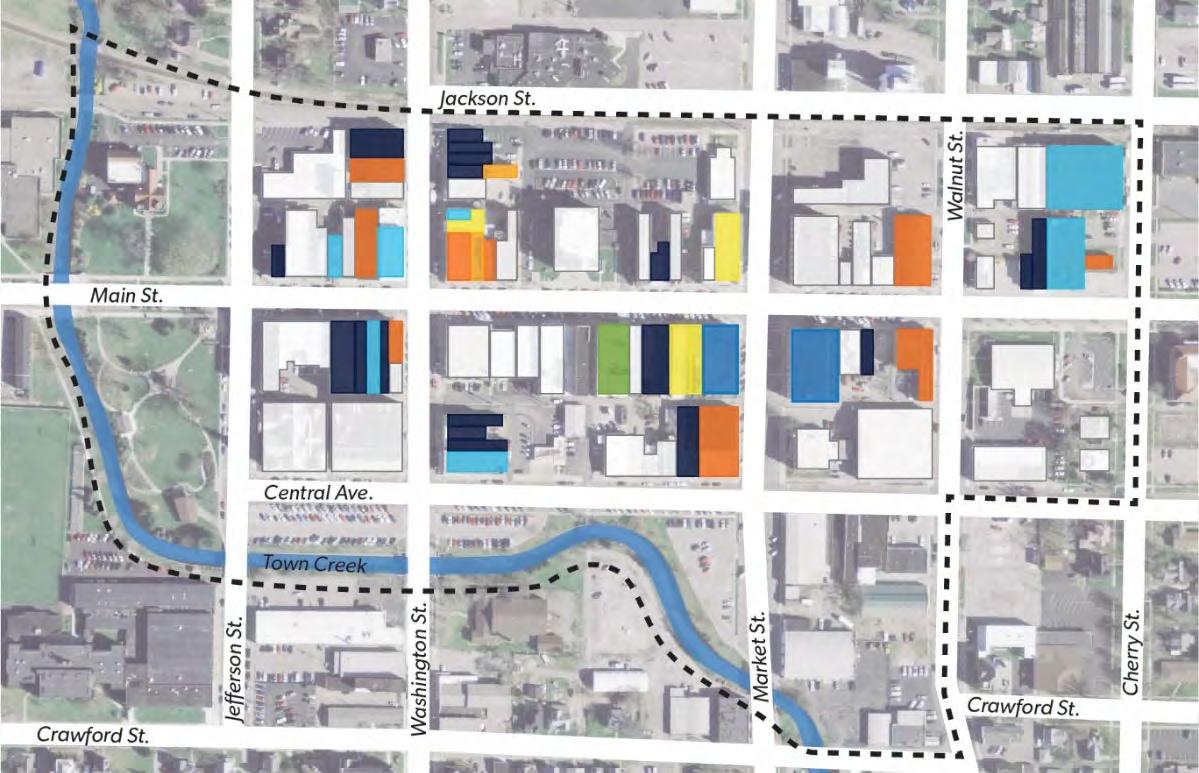

To analyze the additional parking supply demands that would be placed on the downtown parking system, the parking demand was calculated for each individual property based on the adjusted downtown parking requirements outlined in TABLE FOUR. At the time of the parking supply observations in June, several of the buildings noted for proposed development in the master plan had existing uses. If the existing use matched that of the proposed use, then the parking supply demand for that property was reduced to zero as the demand would remain the same. For buildings having an existing use at time of observation that did not match the proposed developed use, the demand required of the existing building use (based on the adjusted downtown parking requirements) served as an offset to the demand identified in the master plan. For example, the building located at 100 W. Main Street was home to a professional service (insurance company) in June, but in the developed master plan the building would be a restaurant. So, the proposed parking demand of nine required parking spaces for the restaurant would be offset by the existing parking supply demand of four required parking spaces by the professional service providing a net parking supply demand of five parking spaces.
Additionally, the parking demand of a proposed building use could be offset if the building had private parking spaces associated with it that would remain with the building. For example, the building located at 111 W. Main had two private parking spaces in the back of the building. The two private spaces would serve as the first two parking spaces of the six parking spaces that the proposed business use would require, leaving a demand on the public parking supply of four spaces.
TABLE FOUR below outlines this process of identifying and determining the required parking demand by analyzing the existing and proposed uses of a building and any private parking spaces associated with the building. The demand for 133 parking spaces would be required with the first phase of development with the demand coming from Walk Zones A (36%) and B (64%). The master plan would require a total of 465 parking spaces to meet the demand of the master planned uses within downtown. Of this demand, about 75% of the parking demand would be located within Walk Zones B, D, and E and the remaining 25% would be within Walk Zones A and C.
In addition to determining the demand for commercial spaces within buildings, the demand for each proposed residential unit demand was determine. TABLE FIVE outlines the breakdown of demand required for the parking demand of 38 spaces required within Phase 1 and the 96 spaces required for the master plan. Walk Zone A had the smallest increase of residential parking need at 8 additional spaces while Walk Zone E had the greatest increase of 35 spaces.
The master plan in FIGURE SEVENTEEN not only identified proposed building uses affecting the parking demand, but it also identified locations for proposed parking that would affect the parking supply within downtown. TABLE SIX below shows the breakdown of the additions and deductions identified to the parking supply, resulting in an additional 311 parking spaces being added to the parking supply within downtown. 26 of these spaces would be added during the Phase 1 improvements. Almost 80% of the additional parking spaces added in the master plan would occur within Walk Zones B, C, and D.
The public parking demands for the proposed master plan and Phase 1 uses were combined with the existing parking demands observed during observations in June to determine the total parking demands. The parking supply for Phase 1 had a net increase of 26 spaces, taking the parking supply from 681 spaces to 707 spaces. Most of the added spaces were located in Walk Zone B due to the inclusion of public parking spaces on the gravel lot north of the library, along the south side of Jackson Street north of the library, and the conversion to angled parking along the west side of Jefferson Street.
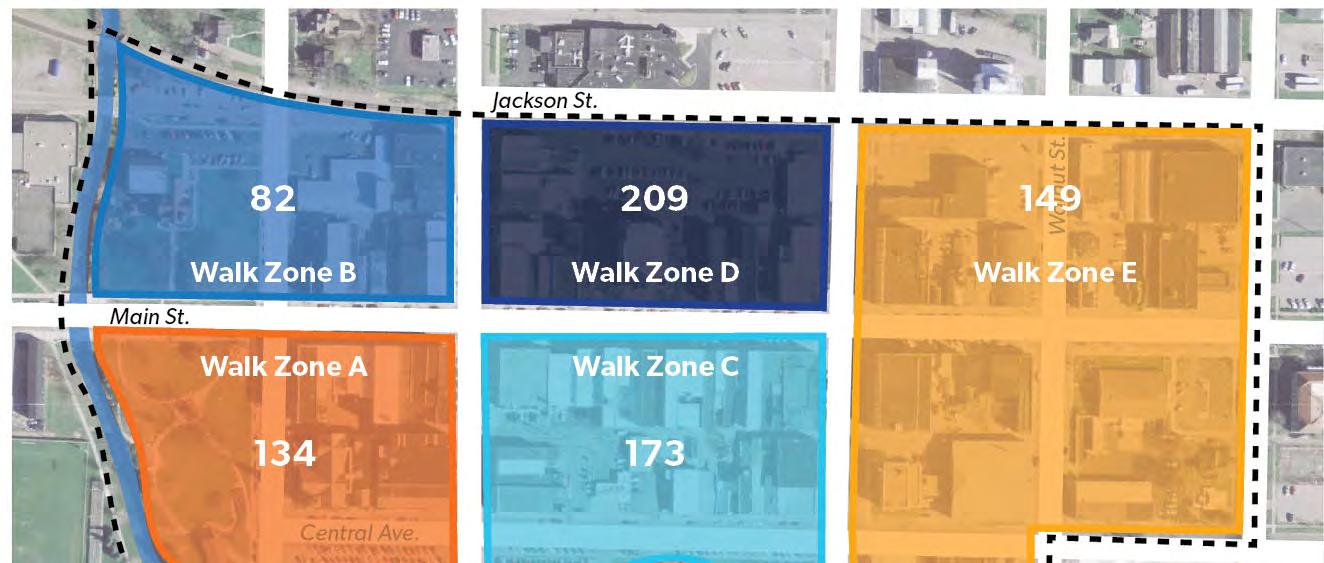
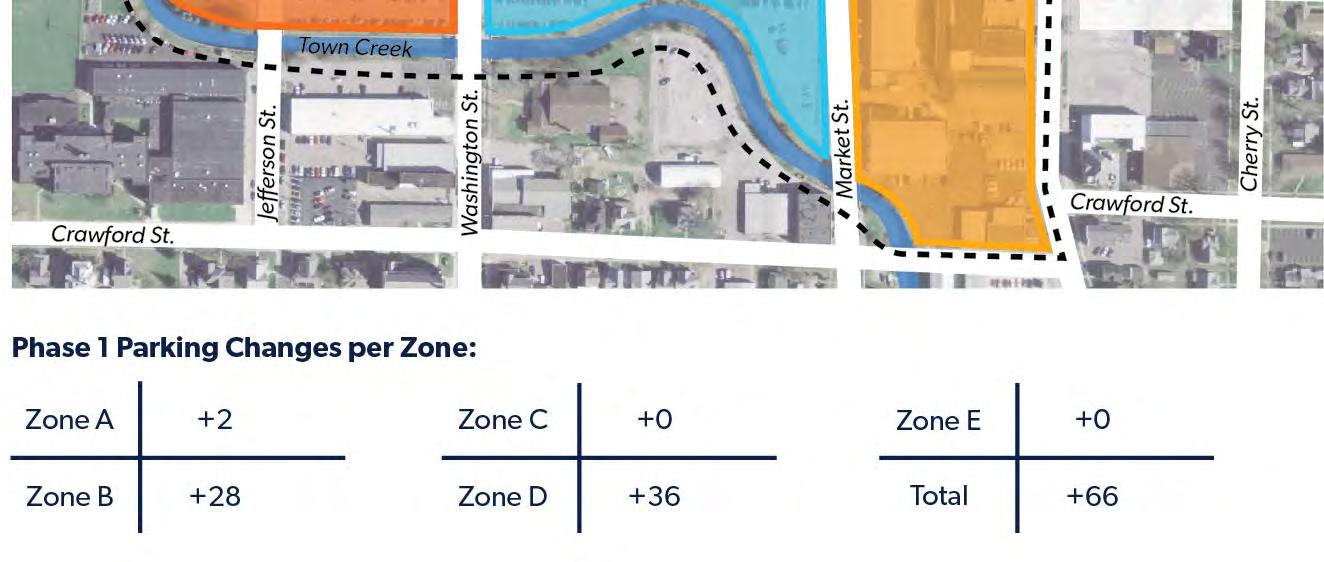
The adjusted existing parking supply was offset to accommodate the proposed parking demand required for the improvements planned for Phase 1. The Phase 1 improvements that are focused mainly in Walk Zones A, B, and C required 163 parking spaces. After incorporating these additional parking spaces into the downtown parking supply the total parking demand increased to 53% occupancy on average and during the peak demand time (11:30am) increased to 60% occupancy. Both fall below the desired 85% threshold. For both the average and peak timeframes, Walk Zone B will experience parking occupancy above 85%. However this can be accommodated within a reasonable walking distance to available parking supply within adjacent Walk Zones A, C, and D. Based on the quantitative analysis, it is not believed that there would be significant parking supply shortfalls that would require the immediate need for new parking supply in general.
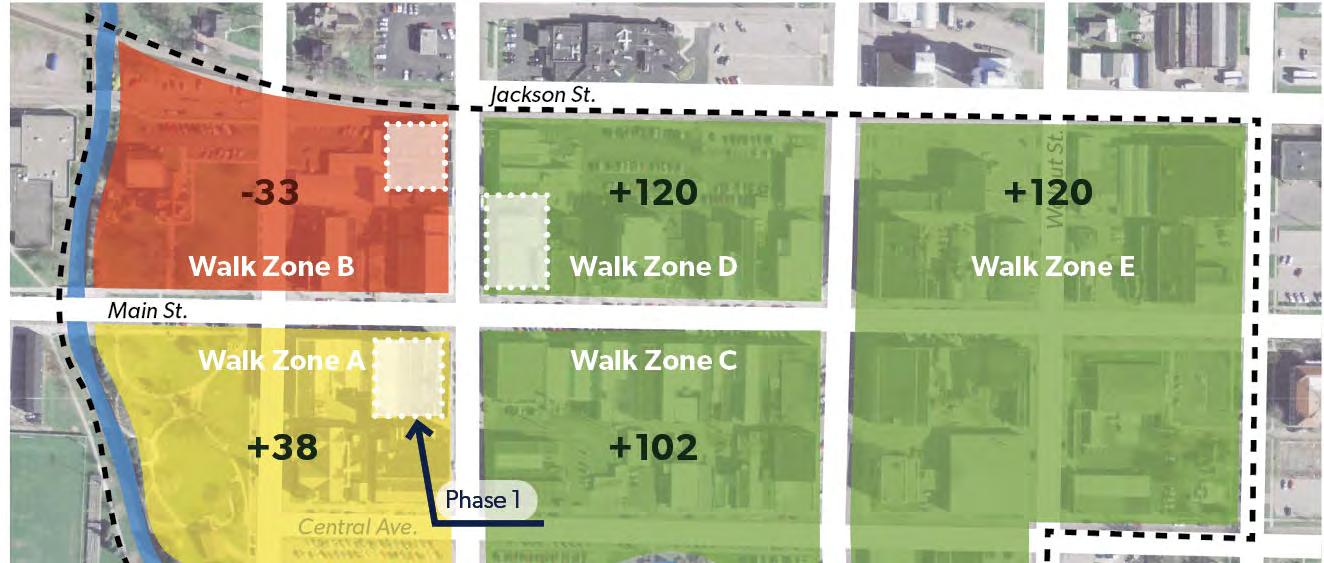
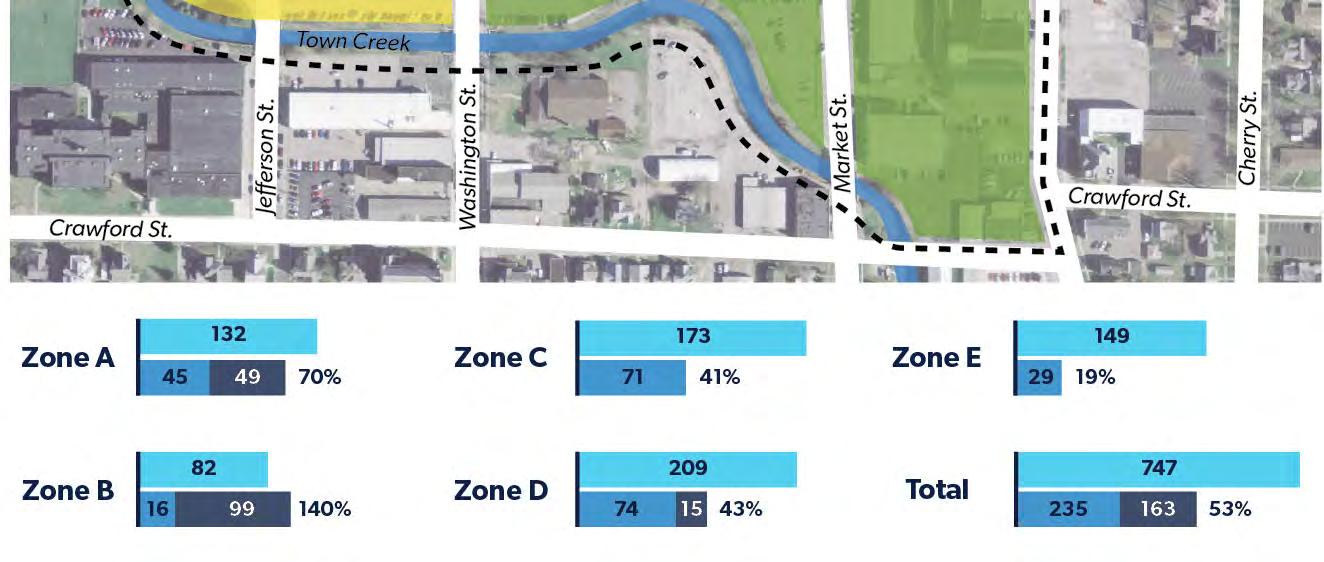


FIGURE TWENTY-TWO | PHASE 1 PARKING SUPPLY DEMAND – AVERAGE (8AM – 5PM)
As highlighted in FIGURE TWENTY-TWO, the parking demand within Walk Zones A, B, and D see the greatest impact. Walk Zone D is slightly affected, but most of the increased demand is located within Walk Zones A and B. Walk Zone A remains below the 85% threshold, however Walk Zone B sees a demand greater than the supply. While Walk Zone B sees a parking shortfall, this can be accommodated within a reasonable walking distance to nearby Walk Zones with available supply. During aveage parking demand conditions of Phase 1, the overall parking system sees a parking occupancy rate which is well below the desired 85% threshold. The parking system is only 53% occupied, leaving a surplus of over 300 parking spaces.
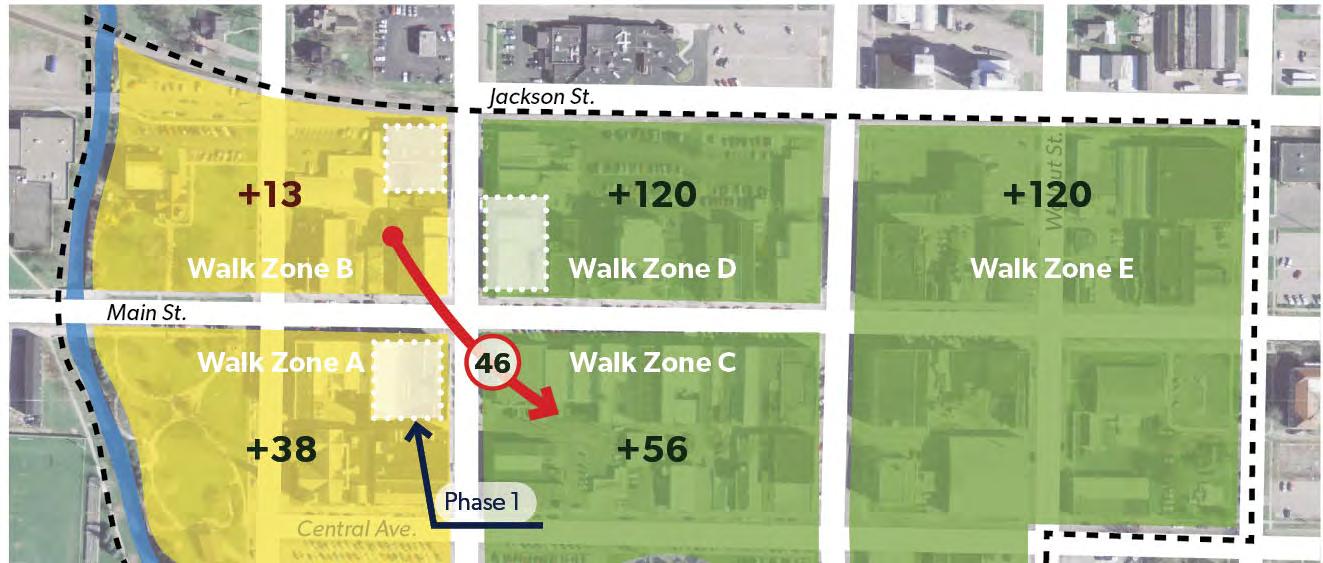
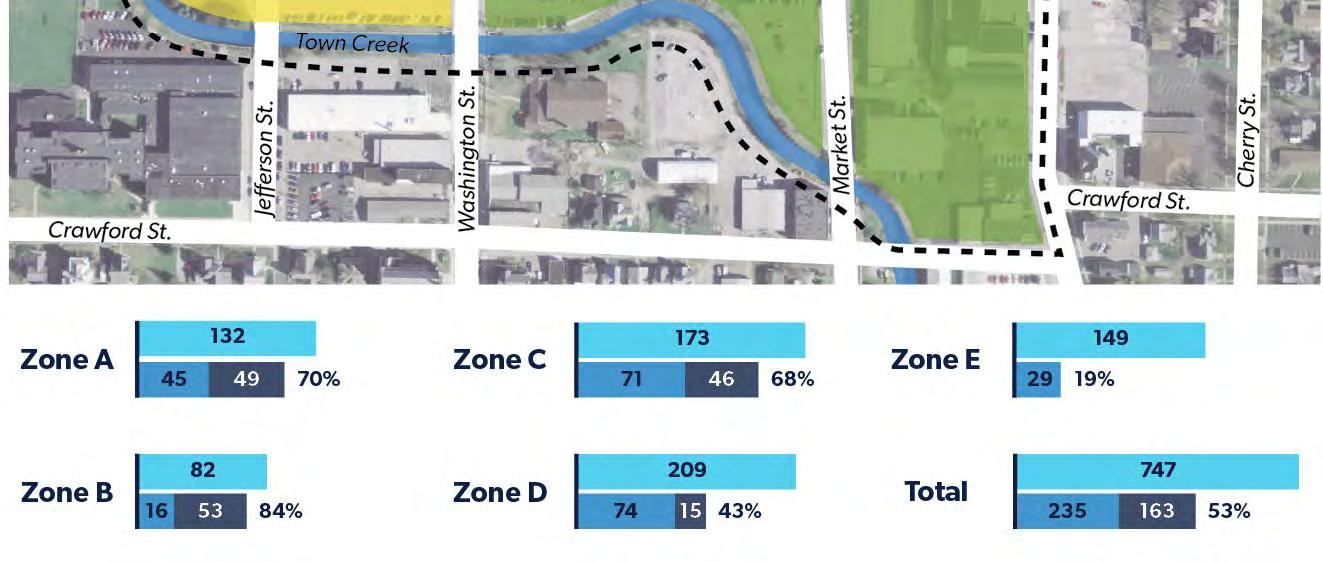


FIGURE TWENTY-THREE | PHASE 1 PARKING SUPPLY DEMAND ADJUSTED – AVERAGE (8AM – 5PM)
FIGURE TWENTY-THREE identifies the impacts to the walk zone occupancy loads if users of the parking system were to also utilize nearby Walk Zone C to access destinations within Walk Zone B. This could be visitors utilizing the spaces in Walk Zone C, but to promote a more accessible downtown it might be suggested that employees from businesses or residents in Walk Zone A might utilize parking spaces in Walk Zone C.
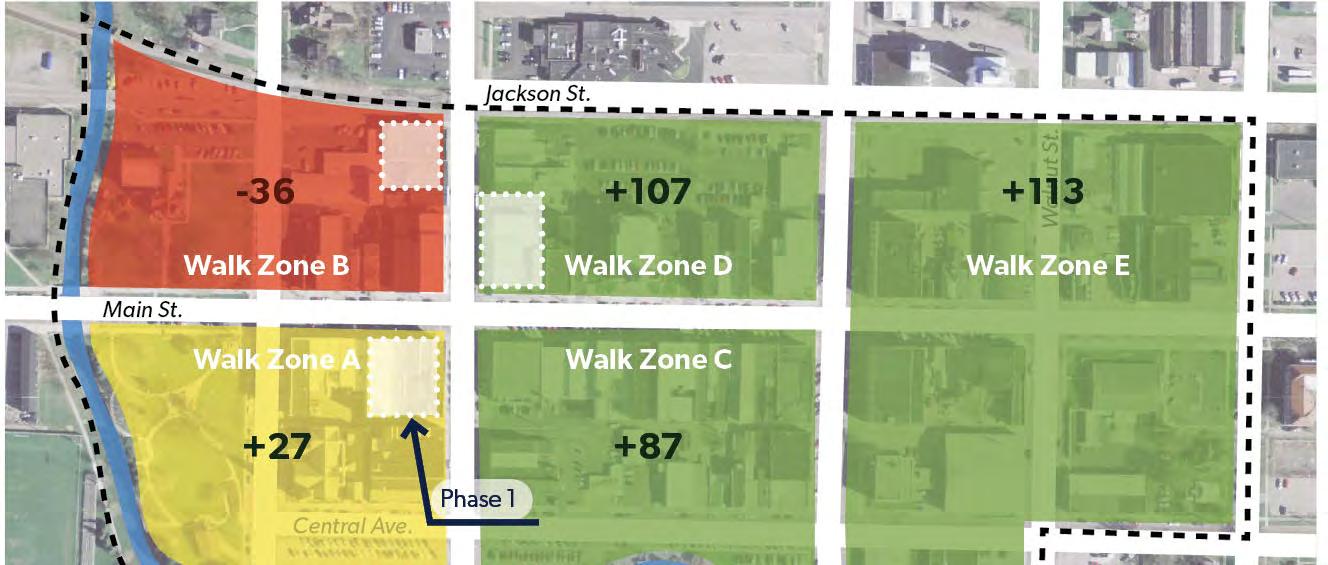

FIGURE TWENTY-FOUR | PHASE 1 PARKING SUPPLY DEMAND – PEAK (11:30AM)


Similar to the average demand in FIGURE TWENTY-TWO, during the lunch hour peak demand time Walk Zones A and B still see the greatest impact in parking demand, as highlighted in FIGURE TWENTY-FOUR. Again, Walk Zone A remains below the 85% threshold, however Walk Zone B sees a demand greater than the supply. While Walk Zone B sees a project shortfall, but this can be accommodated within a reasonable walking distance to nearby Walk Zones with available supply. During peak parking demand conditions, the overall parking system sees a parking occupancy rate which is below the desired 85% threshold. With a 60% occupancy level, the entire parking system still has a surplus of 300 parking spaces.
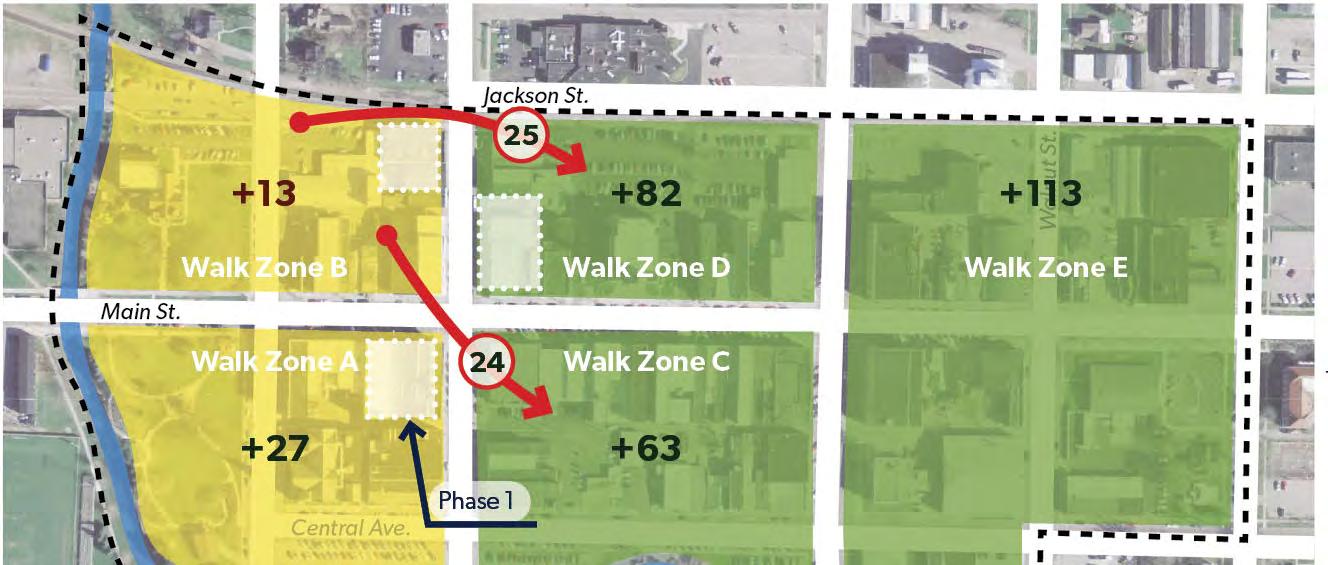
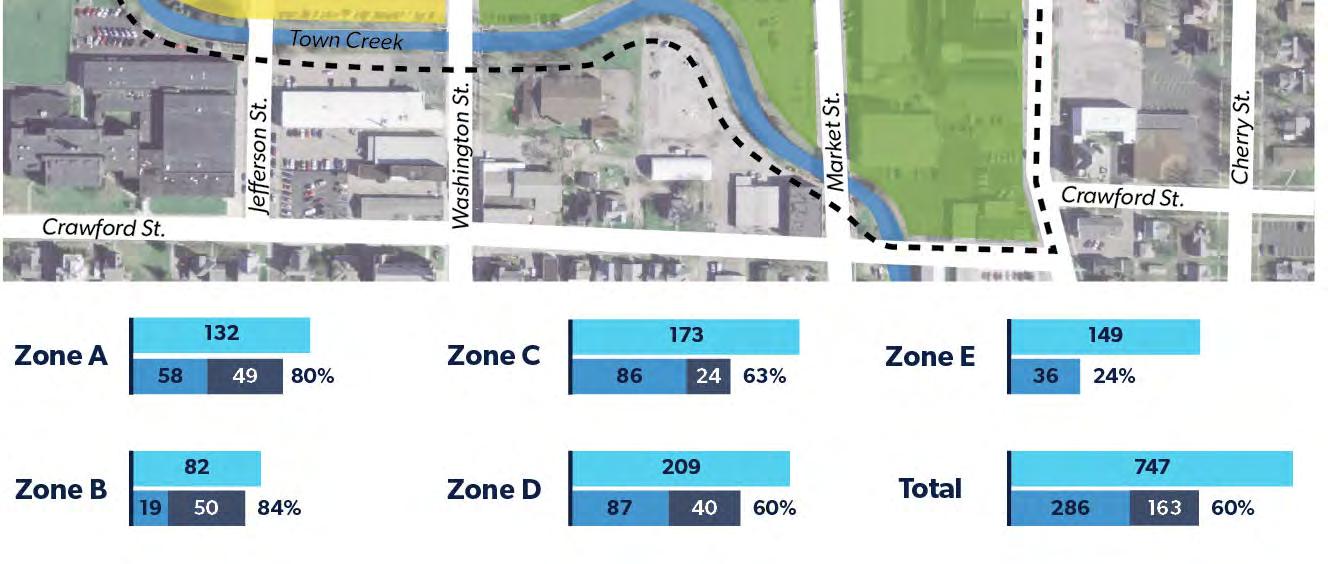


FIGURE TWENTY-FIVE | PHASE 1 PARKING SUPPLY DEMAND ADJUSTED – PEAK (11:30AM)
FIGURE TWENTY-FIVE identifies the impacts to the walk zone occupancy loads if users of the parking system were to also utilize nearby Walk Zones C and D to access destinations within Walk Zone B. This could be visitors utilizing the spaces in Walk Zones C and D, but to promote a more accessible downtown it might be suggested that employees from businesses or residents in Walk Zone B might utilize parking spaces in Walk Zones C and D.
The public parking supply for the master plan saw a net increase of 309 spaces, taking the parking supply from 681 spaces to 990 spaces. The additional supply was mostly added to Walk Zones B, C, D, and E and came in the form of additional on-street parking, off-street public parking, and shared parking opportunities.
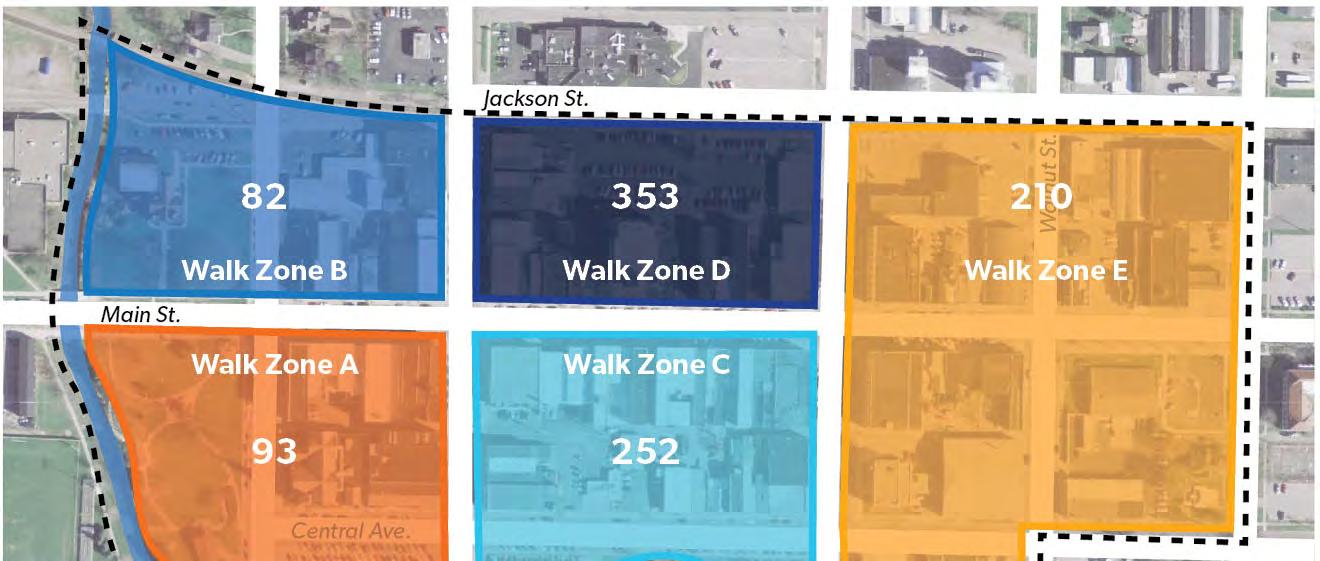

Like the approach with Phase 1, the adjusted existing parking supply was offset to accommodate the proposed parking demand required for the improvements planned for the full master plan. The improvements proposed in the master plan required 553 parking spaces. After incorporating these additional parking spaces into the downtown parking supply the total parking demand increased to 80% occupancy on average and during the peak demand time (11:30am) increased to 85% occupancy. The average occupancy falls below the desired 85% threshold, meanwhile the peak time is exactly 85%. With the knowledge that the peak parking demand was observed to occur only during the lunch hour window, this would be a reasonable condition for a short one-hour timeframe during weekdays. Even during this peak window, it is estimated that 150 parking spaces would still be available within the downtown. This may require visitors to ‘circle’ slightly more to find an available spaces, but a reasonable parking supply would be available.
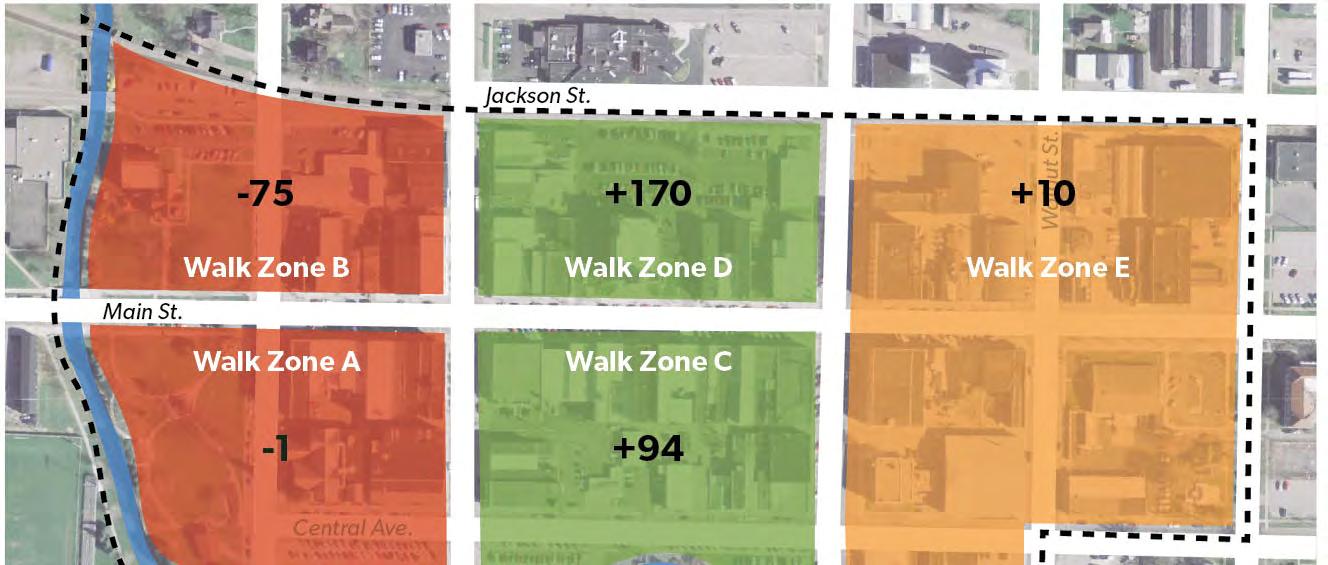
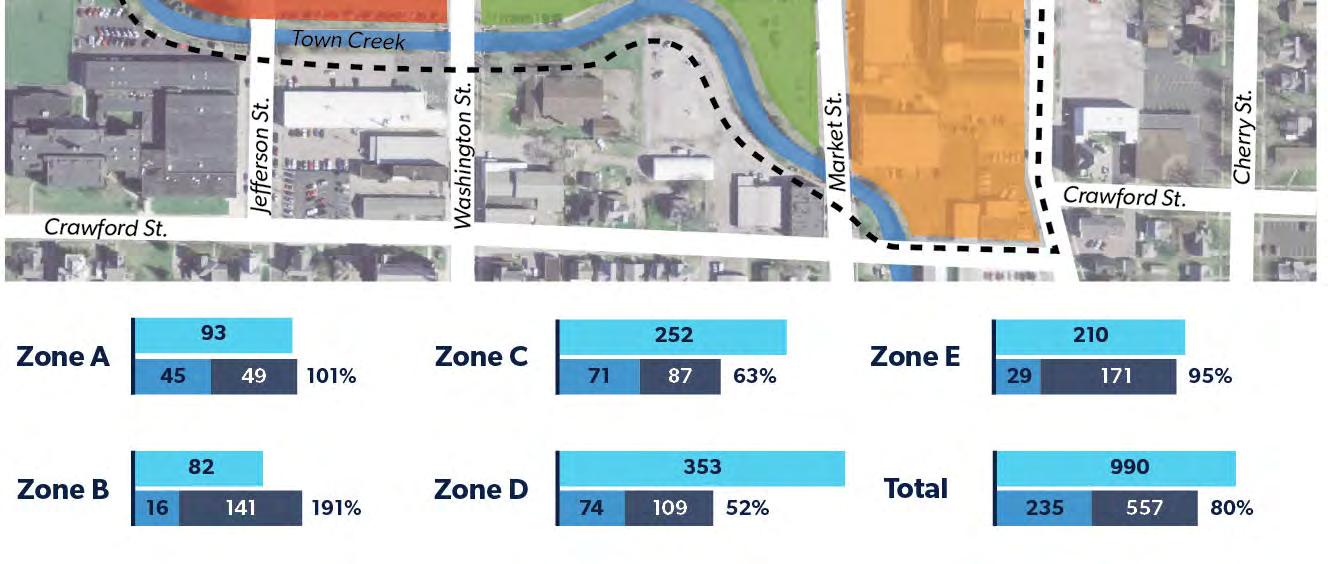


FIGURE TWENTY-SEVEN | MASTER PLAN PARKING SUPPLY DEMAND – AVERAGE (8AM – 5PM)
As highlighted in FIGURE TWENTY-SEVEN, the parking demand within all of the Walk Zones were impacted to a certain degree by the projected parking demands identified within the master plan. Walk Zones A, B, and E saw the greatest increase in demand with an added demand of 49, 141, and 171 spaces, respectively. This additional demand pushed Walk Zone A to 101% occupancy, which is more than the parking capacity. Walk Zone B was pushed to 191% occupancy, which creates a parking shortfall within this Walk Zone. The increased demand in Walk Zone E pushes the occupancy about the desired threshold into 95%. The projected shortfall and high occupancy can be accommodated within nearby Walk Zones with available supply within a reasonable walking distance. During aveage parking demand conditions, the overall parking system sees a parking occupancy rate of 80% with a surplus of 200 parking spaces.
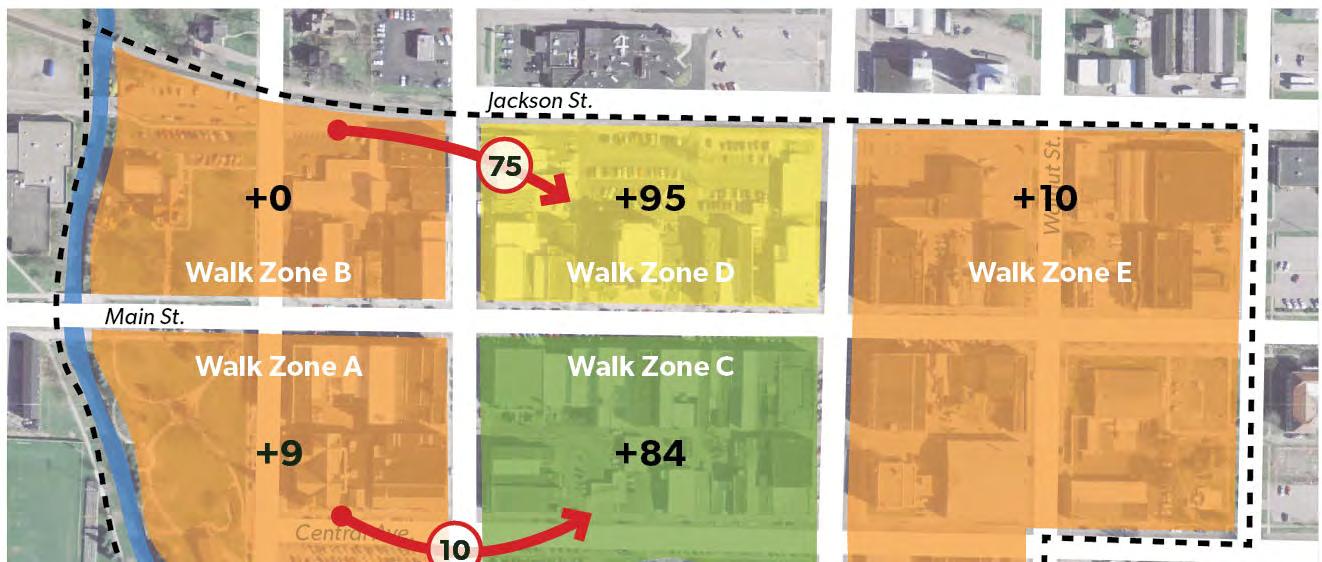
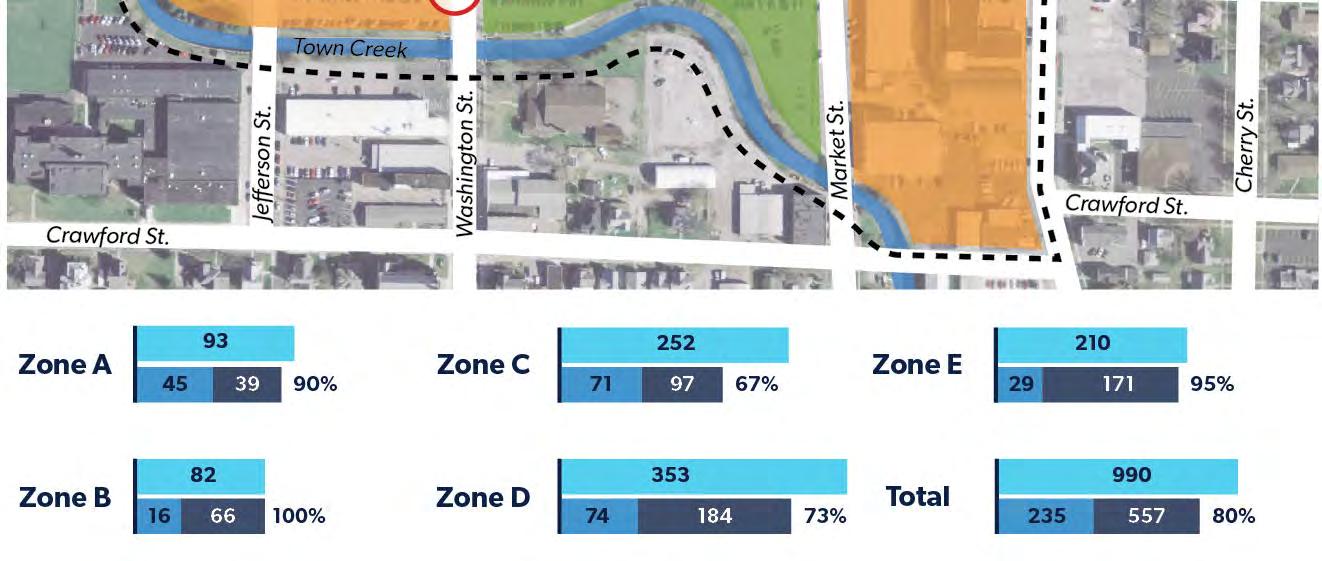


FIGURE TWENTY-EIGHT | MASTER PLAN PARKING SUPPLY DEMAND ADJUSTED –AVERAGE (8AM – 5PM)
FIGURE TWENTY-EIGHT identifies the impacts to the walk zone occupancy loads if users of the parking system were to also utilize nearby Walk Zones C and D to access destinations within Walk Zones A and B. This could be visitors utilizing the spaces in Walk Zones C and D, but to promote a more accessible downtown it might be suggested that employees from businesses or residents in Walk Zones A and B might utilize parking spaces in Walk Zones C and D.
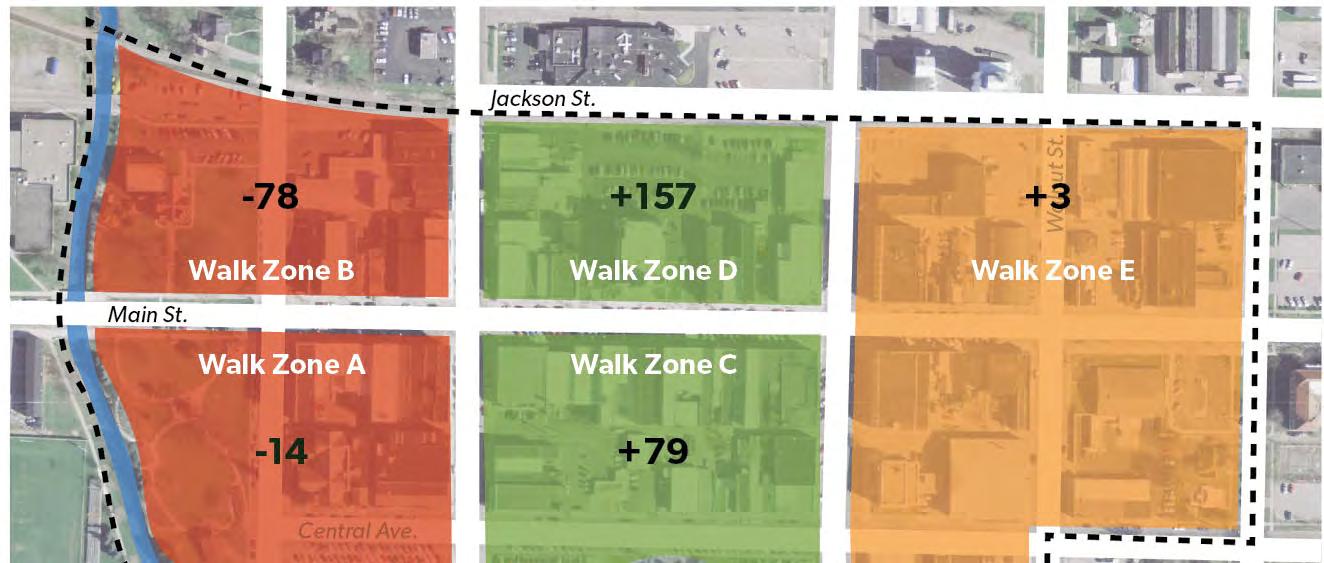
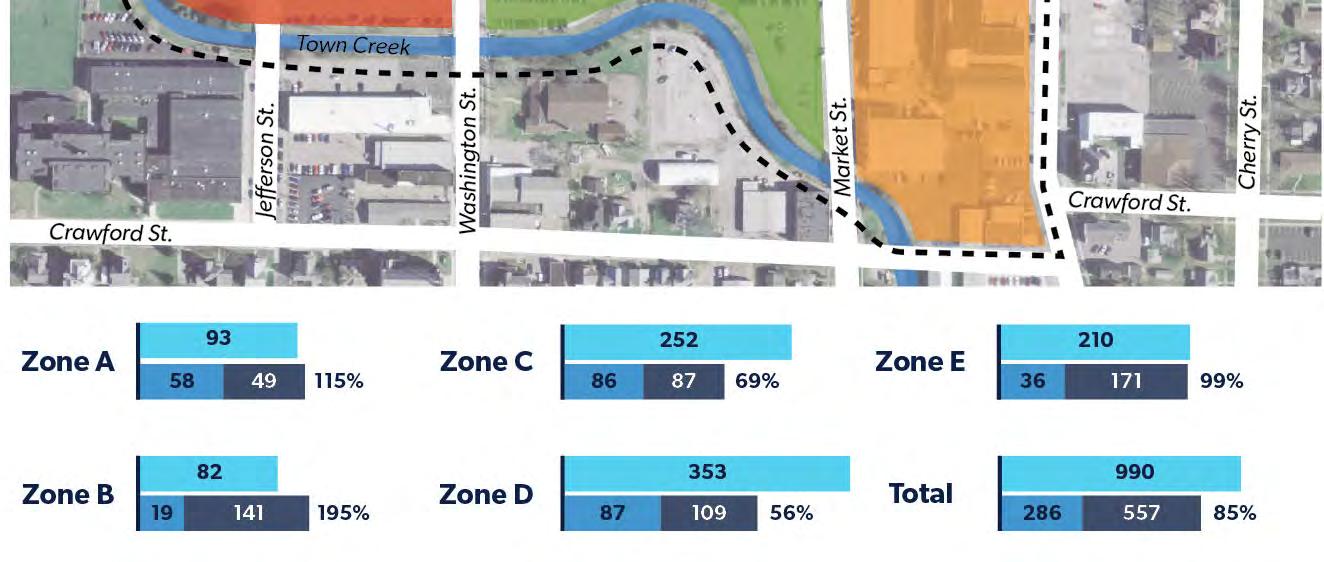


FIGURE TWENTY-NINE | MASTER PLAN PARKING SUPPLY DEMAND – PEAK (11:30AM)
Similar to the average demand in FIGURE TWENTY-SEVEN, during the lunch hour peak demand time, all of the zones increase their occupancy numbers and parking demand, as highlighted in FIGURE TWENTY-NINE. Walk Zone A saw the greatest project increase in demand with an added demand of 49 spaces at 115% occupancy. Walk Zone B has the highest overall occupancy percentage of 195% with a future demand of 141 spaces. Walk Zone E sits at 99% occupancy, well over the desired percentage of 85%, and will be fully occupied at the peak lunch hour. The identified shortfall in parking supply in Walk Zones A and B can be accomodated thorugh the additional supply within a reasonable walking distance to nearby Walk Zones C and D. Even during the peak conditions of the master plan, the parking system still has a surplus of 150 parking spaces within downtown.
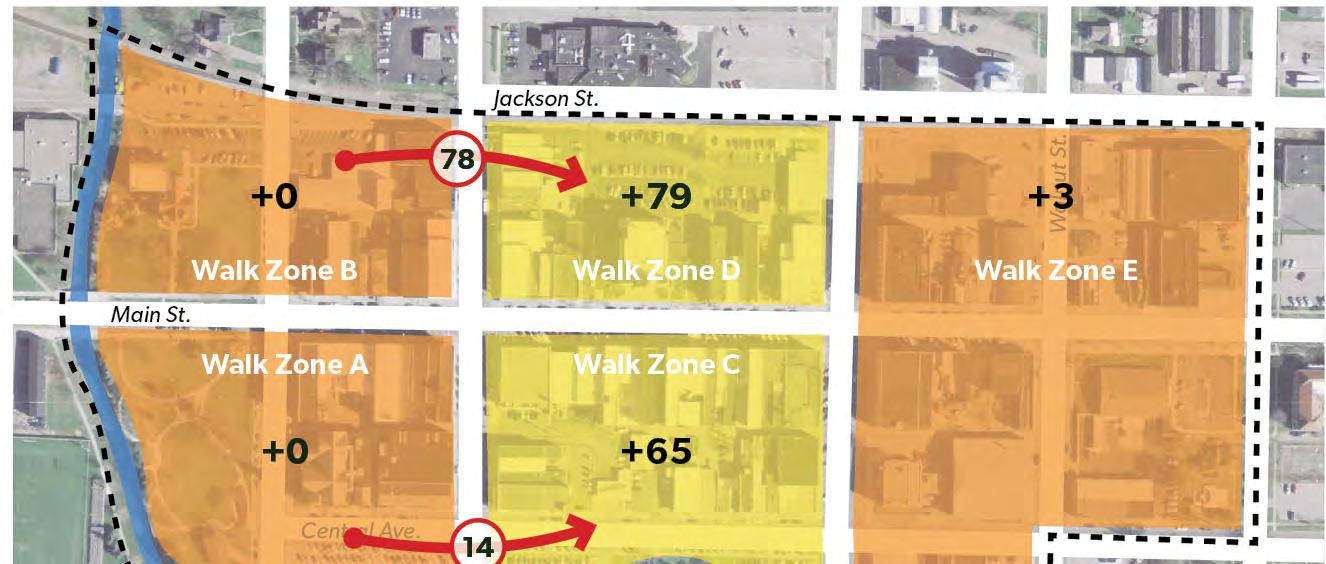
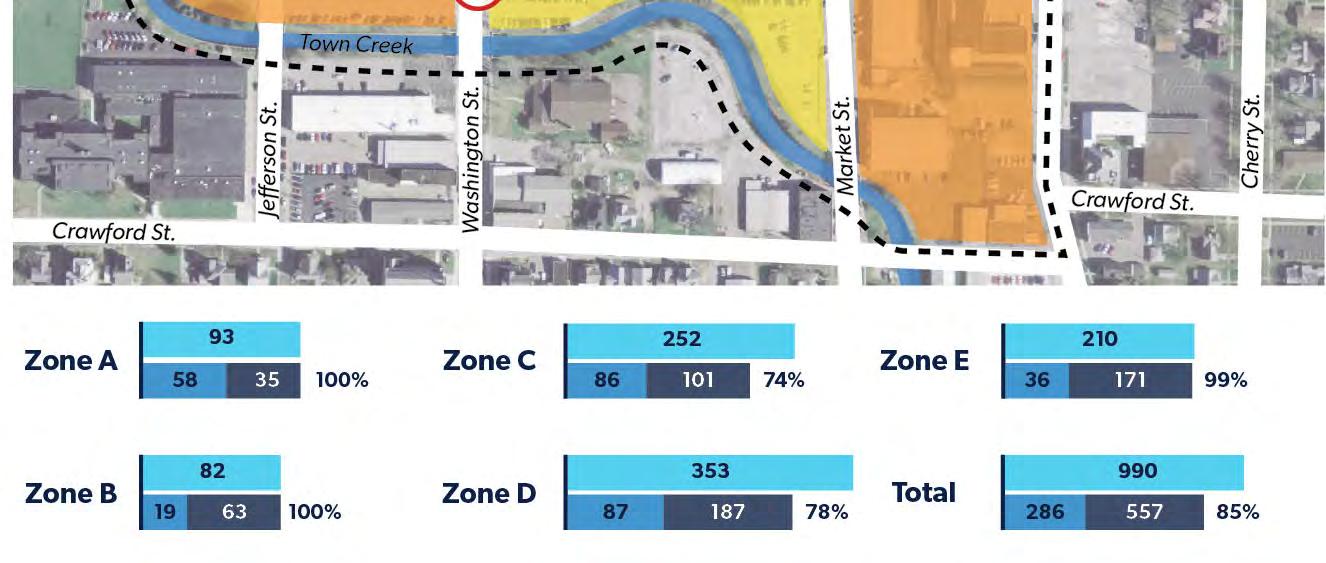


FIGURE THIRTY | MASTER PLAN PARKING SUPPLY DEMAND ADJUSTED – PEAK (11:30AM)
FIGURE THIRTY identifies the impacts to the walk zone occupancy loads if users of the parking system were to also utilize nearby Walk Zones C and D to access destinations within Walk Zones A and B. This could be visitors utilizing the spaces in Walk Zones C and D, but to promote a more accessible downtown it might be suggested that employees from businesses or residents in Walk Zone A and B might utilize parking spaces in Walk Zones C and D.
The following key findings were identified during the parking policy and demand review:
- The current parking requirements within the City of Van Wert ordinance involve a significant amount of parking that would require the removal of a considerable number of existing buildings to install parking lots within downtown. Revising the ordinance to have no minimum parking requirements within an identified Downtown Parking District would allow for proper redevelopment of the downtown.
- Incorporating shared parking areas within the downtown would provide parking to employees and residents of downtown, thus utilizing otherwise unavailable and empty offstreet private parking supply. This would provide more availability of on-street parking while also promoting a higher utilization of parking resources.
- The downtown currently has generously wide walkways and the master plan promotes additional improvements to the walkability of the downtown environment. This increased walkability will be important in providing downtown parking users with safe walking routes to connect parking supply locations with desired destinations.
- Most identified small localized areas of high utilization occur during the lunch hour peak demand window. These perceived shortfalls by parking system users can be alleviated using adjacent Walk Zones and promoting the introduction of wayfinding signage to direct drivers to nearby parking supplies.
- After conducted a quantitative analysis of existing conditions and projecting future parking demand based off anticipated uses, the projected demands suggest an overall increase in parking demand and some isolated hot spot areas of increased demand. These projected hot spots suggest that strategic management of the downtown parking system resources will be needed to better meet the needs of the parking system users.
In the above sections, we outline the existing conditions of parking inventory, and go in depth on what the parking data collected means for downtown Van Wert. This section is intended to share tangible & realistic strategies to enhance and improve parking
The Downtown Van Wert Parking Study is intended to aid the Van Wert County Foundation and the City of Van Wert in accomplishing the following goals to improve the parking experience for visitors and residents, and business owners.
1. Ensure that downtown is conducive for business and residential growth
2. Parking supports both existing and future strategies
3. Downtown continues to attract new employers and residents
4. Mobility is supportive of all users in the Van Wert community
For any parking strategy to work and provide a better system for area businesses, customers, and residents, the city and partnering organizations will need to establish a strong partnership to navigate strategies and implement programmatic and policy changes that best reflect the future of downtown Van Wert.
Each strategy listed below includes an abbreviation as to which organization(s) should be responsible for ensuring the strategy is implemented.
The following abbreviations are utilized to represent partners who could assist with the implementation of the strategies listed below:
- City of Van Wert (CVW)
- Van wert Forward (VWF)
- Van Wert Community Foundation (VCF)
- Main Street Van Wert (MSV)
- Van Wert Economic Development (VED)
Data uncovered through the efforts of this parking study shows that Downtown Van Wert has an adequate parking inventory currently to service the public. Although, some areas could be improved or ‘reimagined’ to be better utilized - such as the direction of parking spaces or improving vacant, gravel lots. We see this in Walk Zone A where there is a potential increase in demand with limited available supply after the existing surface lot is removed to make way for additional green space. While it will not be feasible to replace each space that is removed due to the already built infrastructure in Walk Zone A, much of this can be reimagined through converting some of the ways the parking system is designed on both Jefferson Street and Central Avenue.
The most significant concern and immediate need to consider is the parking supply in Walk Zone B. The Downtown Van Wert Redevelopment Master Plan calls for this zone not only to be the first area to experience site redevelopment but the densest of all scenarios. Naturally, users will consider relocating to other on-street and off-street parking spaces in nearby walk zones, but it remains crucial to seek potential alternatives to add public supply to Walk Zone B. Potential opportunities include:
1. Jackson Street between Jefferson and Washington - Vacate the existing street for public use and redevelop it into a visually appealing on-street parking supply. Rebuild the street to discourage traffic and provide additional parking spaces where the Walk Zone currently lacks.
2. Jackson Street between Jefferson and Town Creek – Utilize the additional right of way along the north side of the Van Wert County Library property to incorporate additional onstreet parallel parking for public use.
3. Utilize the existing gravel lot north of the Van Wert County Library as public parking or as a location for designated residential parking.
4. Secure additional properties that could be converted to public parking spaces.
Partners: CVW, VWF
In analyzing the data, the existing supply is adequate, even after taking into account all the development identified in the master plan. The community cannot absorb this many underprogrammed parking spaces to create a sense of safety and belonging, thus making downtown feel less welcoming.
The Downtown Van Wert Redevelopment Master Plan recommends removing 126 Surface Lot spaces along Town Creek and reutilizing the space as a linear park. This will reduce the total
capacity, but depending on what other strategies are utilized, this could be an excellent function for this space to benefit the health and wellbeing of the community.
Additional spaces could be removed in smaller quantities that would promote walkability and safety for downtown pedestrians. These measures could include incorporating bumpouts at intersections or the inclusion of midblock crossings at key pedestrian traffic locations.
Partners: CVW, VWF
For decades, as cities removed structures from the downtown business core, many communities replaced buildings with new parking structures. This was often considered an easy fill rather than a vacant lot, although, over time, many communities recognized that surface parking is precisely what they fear the most, another vacant lot.
Without understanding the complexities of parking and its role in the transportation system, people often say, "Build more parking." Many have altered this statement with "Wal-Mart has ample parking, why doesn't downtown?" The problem is not the lack of parking; it is the lack of understanding of how the parking system works. Parking structures are expensive, often cost upwards to $30,000 per space, and never pay for themselves in almost every case. The design and management of parking supply affect the livability and walkability of any downtown and the vitality for businesses and residents who use the district. Building additional parking without managing the existing supply can induce driving and increase the demand for more parking. Conversely, managing the existing supply can be a cost-effective way to reduce demand or increase the attractiveness of underutilized spaces.
Once the community understands the parking supply and demand, you can begin to identify strategies that better manage the supply. As stated in the plan, a desirable occupancy rate is 85%, which amounts to one or two open parking spaces on each block at all times. When parking occupancy rates approach 90%, drivers spend more time searching for parking and add to congestion on roadways reducing the perception that downtown is meant for them.
Partners: CVW, VWF
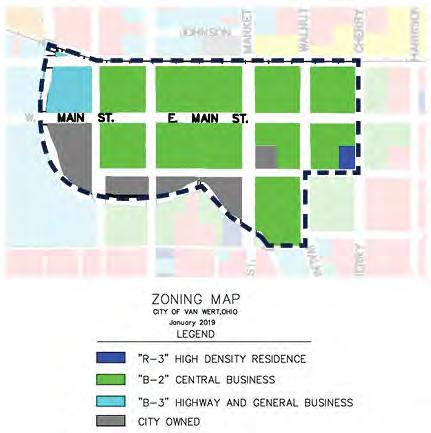
Source: City of Van Wert
The current City of Van Wert ordinances applies legal parking requirements that specify a minimum number of parking spaces required for each type of land use. Using the parking study findings, the current ordinance and standardized set of rules and regulations do not meet the true parking supply and demands of downtown.
For the City of Van Wert to support the Van Wert County Foundation's redevelopment efforts, it is recommended that the current parking ordinance be adjusted to create a Downtown Parking District with specific rules. These should include:
● Remove the existing parking minimum requirements for development within the downtown redevelopment area boundaries. This allows future development to utilize the existing parking capacity without adding unnecessary and burdensome parking spaces that would likely go underutilized by the public.
● Pursue a strategy that promotes walking and biking into the downtown core replacing unnecessary vehicular trips.
Existing parking minimums are based on the idea that more parking is better. This assumption is that without enough parking, drivers will "cruise," causing unwanted congestion. To avoid such conflicts, governmental bodies often establish a set of parking minimum requirements that are often irrelevant to the community's needs. The most commonly used requirements are based on
the Institute of Transportation Engineers' (ITE) Parking Generation handbook, which, as described prior in this study, is irrelevant to Van Wert and the needs of downtown businesses and residents. A majority of the ITE handbook uses data from the 1980s, which uses data that averages the maximum observed demand in isolated suburban areas that require significant use of personal automobiles. This parking survey provides a much more reliable measure of area-specific parking needs to serve the community best.
Partners: CVW
During the data collection and field observation process, most parking spaces in downtown Van Wert were observed to be underutilized during the peak times of the day. This implies that there remains a significant number of parking spaces that exceed the maximum demand.
This Shared Parking strategy calls for creating a shared parking agreement between entities whose peak demand times are at different times of the day. The needs of various land use types vary throughout the day and across a given week. This can mean that a demand for one type of land use may not always align with the availability of public parking but might align with a low demand window of a nearby private parking zone. For example, a shared parking agreement would allow a private lot owned by a business whose peak operation occurs during the day to allow their lot to be available to adjacent land uses needing parking during evening or nighttime hours. This would help increase the capacity for lots in higher demand during the differing peak operation times.
For example, the Van Wert County Courthouse and various public offices utilize the public surface lot in Walk Zone D Monday thru Friday from 8 AM to 5 PM. This means that while this surface lot is utilized 9 hours a day, it remains underutilized 15 hours each weekday. A shared parking agreement between the City of Van Wert and Van Wert County would allow each user to maximize the available parking supply by opening the surface lot throughout the day, and future potential evening-oriented businesses such as a restaurant in Walk Zone's B and D could use the surface parking from 5 PM to 9 PM without any use conflicts. To ensure the surface lot would be safe for users, pedestrian-level lighting should be added to the lot in lieu of the existing high neck Cobra lights that function for security lighting and not pedestrian safety.
Other privately owned lots include Truly D'Vine Bakery at the intersection of Jefferson and West Main, NAPA Auto Parts at the intersection of Jefferson and Jackson, and the Brumback Public Library opposite NAPA. Sharing these lots with other non-conflicting uses would allow the downtown to absorb 74 spaces within Walk Zone B that are currently reserved for restricted parking uses, increasing the walkability of businesses on West Main. To increase the safety and security of all restricted lots in Walk Zone B, additional landscaping and lighting should commence through a shared agreement with either the City of Van Wert or the Van Wert County Foundation to ensure the parking spaces meet the needs of users.
Partners: CVW, VWC, VCF, MSV
One of the most critical components of an adequate parking system is clear and consistent parking wayfinding and signage denoting the various parking uses. Wayfinding should provide a clear direction guiding users to the appropriate parking locations as well as practical uses. Parking signage must be easily seen, clearly understood, and consistently present around destination areas to eliminate any confusion regarding whether a parking facility has any restrictions. The City of Van Wert currently does not have good directional wayfinding signage system to highlight destinations, which causes significant concern for users, thus reducing downtown's appeal as a destination. When a city lacks wayfinding and marketing components to make the parking experience welcoming, it creates additional barriers and a negative perception to positive development.
It is recommended that Van Wert use the following strategies to address this issue:
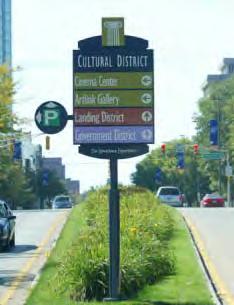

● Develop a comprehensive signage and wayfinding study for the downtown district, shown in FIGURE THIRTY-TWO. This would serve the needs of the existing businesses and institutions that have located downtown and serve the future needs in implementing the Downtown Van Wert Redevelopment project.
● Install clear and consistent signage and wayfinding once the plan is complete to improve the visibility of parking to visitors, employees, and residents. The signage will help eliminate confusion about whether or not public parking is offered and make it easier to spot as users move around downtown.
○ Signs should be located for maximum effectiveness, as determined by the Comprehensive signage and wayfinding study criteria. In general, directional signs should be located at every decision point throughout downtown and direct to and
identify parking for visitors, employees and residents.
○ Downtown informational kiosks are most effective when paired with high activity and pedestrian traffic areas at specific locations where people will walk from parking concentration areas to their desired destinations. The city should install pedestrian kiosks in public lots to orient and welcome arriving visitors and thank those leaving.
○ Develop transition zones between public parking areas and the public street. These should include specialized signage, pavement, and landscape treatments that could be utilized to help users navigate to entry points.
○ Use paint, pavement treatments, and other graphics to supplement directional signage and identify on-street parking and entrances to surface lots.
● The city should actively seek to install parking signs using the universal "P" symbol for users to quickly and identify public parking spaces, as seen in FIGURE THIRTY-TWO.
● Promotional materials should be provided to communicate the parking system better and enhance the users' experience. This may include brochures, website, parking map, kiosks, display of real-time availability, and social media.
Partners: CVW, VWC, VCF, MSV
STRATEGY 7: PROVIDE A MULTIMODAL
As downtown Van Wert's redevelopment continues to take shape, more people will be encouraged to visit downtown regularly. Without effective management strategies, increased traffic congestion and demand for parking are inevitable. A solution to supporting this growing economy is to increase efficiency with all transportation options. While most system users in Van Wert depend upon private automobiles, investments in multimodal infrastructure can make other transportation modes more viable. For this to occur, it is vital to make other transportation modes convenient for those who don't need to drive. When a community has limited or unsafe alternatives to driving, it should make a concerted effort to develop its pedestrian and bicycling infrastructure while implementing a parking management strategy. This strategy should always prioritize converting spaces to metered parking, as there should be options for drivers who do not want to pay.
For Van Wert to consider a multimodal environment, it must recognize that residents and businesses may also like to walk and bike and use their personal automobile. The city should make it a priority to increase the number of routine trips made by bicycle rather than the car and provide the community with an interconnected pedestrian network along significant thoroughfares that are safe, accessible, and comfortable for a diverse group of users. Downtown Van Wert lacks the appropriate infrastructure needed for these modes to be safe and convenient. Residents and visitors primarily choose to drive and park instead of using other transportation modes, which has significant impacts on the local economy, public health, wellbeing, social capital, and quality of life. It is vital to note that inadequate infrastructure also creates connectivity challenges. Having the appropriate infrastructure is essential, but only if it gets people to their destinations.
Multimodal infrastructure provides an attractive environment to a larger group of users: By improving the multimodal functionality of downtown Van Wert, the city can enhance its ability to
attract pedestrians and cyclists. The diversification of transportation modes will result in less traffic congestion and decreased demand for parking spaces.
Multimodal infrastructure provides increased safety: Many of the infrastructure improvements and best practices involve minimizing vehicle and pedestrian conflicts at intersections, increasing space between vehicles and pedestrians along roadways and sidewalks, and designating pathways for each transportation mode. All of these measures are proven to increase safety.
The following is a list of recommendations to improve multimodal access to downtown Van Wert for residents and visitors of the city:
● Develop a walk/bike plan for the City of Van Wert that looks at the entire city transportation system and provides research and community-oriented recommendations to enhance users' connectivity.
● Implement recommendations from the plan that connect major community anchors through downtown via a network of bike lanes and improved sidewalk connections.
○ Park Connections: The most straightforward project, to begin with, is connecting the principal public park facilities with pedestrian and bike-friendly pathways, which could include a series of dedicated bike lanes painted on the road or a series of wide sidewalks that encourage multiple uses. For example, one of the first connections should be Franklin Park to Fountain Park, followed by a spur connection to Jubilee Park and Smiley Park.
○ Business Connections: Extending from the Franklin Park connection should be a spur supporting pedestrians and bicyclists who want to connect to downtown from Central Insurance Companies, which provides a significant number of downtown users.
○ Develop a multimodal trail that connects downtown Van Wert to Vantage Career Center using a series of existing right-of-way along the current street grid. This connects downtown to a high-use education and community facility and provides future investment into the East Main Street neighborhood, which is critical to the redevelopment of downtown.
○ Consider secondary streets to implement bike-only lanes, including Central, Jefferson, Walnut, and East Main.
● Develop an employer incentive with the goal of employer parking strategies that reward people who carpool or take alternative modes of transportation and discourage or penalize single-occupant drivers with the use of incentives or disincentives. Since the most significant peak-period demand for parking comes from home-to-work trips, and most commuters drive to work alone, employer parking management strategies can be very successful at reducing the number of employees that add to downtown parking and street congestion.
○ One of the easiest ways to do this is to work with both the City and County to incentivize employees to use alternative transportation modes. A municipality can manage its parking and reward workers who use alternative modes. Municipal assistance to employers can include providing bicycle maps, explaining commuter benefits, safety training, bike-to-work challenges, and even financial incentives that
support healthier lifestyles that impact health-care costs and quality of life.
○ If employers offer incentives to use other modes and continue to subsidize parking, it is difficult or impossible to reduce the number of single-occupant drivers; if employers continue to provide free parking, there will always be a high demand for it.
○ Reducing parking subsidies while increasing subsidies to alternative modes of transportation provides a more equitable balance in the community.
● For any multimodal program to be successful, ample bike parking and support facilities are necessary. This should include at a minimum a mixture of bicycle racks that bike users can attach their bicycle to during quick visits to various downtown businesses, and bicycle lockers where bike users who spend several hours downtown (potentially downtown employees) can safely store their bicycle from the outdoor elements while they are inside at work.
Partners: CVW, VWC, VCF, MSV, VED
An integrated parking management strategy can be used to increase the retail center’s attractiveness by reinvesting parking revenue into streetscape improvements. The concept, which often is referred to as a "Parking Benefits District," is how the community can pay for improvements and beautification projects within the district boundaries through collecting fees, assessments, and taxes. Returning parking money to directly benefit the community often improves the general public's acceptance of the idea and helps gain support.
The idea supports the research that improved street environments will attract pedestrians and bicyclists who add to commercial foot traffic without congesting existing roadways. Rather than using excess parking to compete with the shopping centers on both the north and southwest sides of Van Wert, the creation of a Parking Benefits District enhances the aspects of a small downtown that make it attractive and lively. The revenue from the district's enforcement can be spent on physical improvements such as street furniture, trees, decorative grating, better lighting, improved policing, more street and sidewalk cleaning, and marketing. Local merchants in Parking Benefit Districts tend to see an increase in business once a place becomes more attractive for customers to shop and spend additional time.
However, it is crucial to recognize that Strategy 8 should only be considered after all other parking strategies have been considered and implemented or vetted thoroughly by all parties.
Partners: CVW, VWC, VCF, MSV
While on-street parking in downtown Van Wert was observed to be in high demand during peak usage (11:30 AM - Monday thru Friday), most public lots are underutilized. Each parking facility should be designed to encourage similar dynamic parking competition between customers, business owners, and employees. Each group wants the convenience of parking either in front of the business or the immediately adjacent parking lot.
In terms of public parking supply, the lack of enforcement reduces turnover, making spaces for incoming customers less friendly. To spread the high demand of the existing capacity, the downtown parking system should follow restrictions to encourage higher turnover, especially during peak periods. This will discourage long-term users who may take valuable on-street or highdemand off-street parking spaces and provide prime space for customers benefiting from the downtown experience. To better accommodate employees, it is recommended to advertise the public parking lots on the periphery, underutilized, for long-term employee parking. Besides, with downtown Van Wert seeking to add new housing options in addition to traditional commercial, office, and institutional spaces, public on-street parking, and high-demand off-street parking will need to be carefully monitored during the peak usage times (11:30 AM - Monday thru Friday) to ensure enough supply is available for visitors.
● Develop a Permit System: Not all publicly accessible spaces are utilized effectively, and moving physical parking spaces is a timely, costly, and efficient use of energy. As Walk Zone A and Walk Zone B see the highest public use demand, it may be beneficial to create a new Downtown Employee Permit that businesses and institutions in the district may use for their employees. This permit serves two purposes initially:
○ A permit allows you to track the number of long-term system users (individuals who park downtown for more than 4 hours per day). This tracking system not only helps you measure the current demand on the supply but what to prepare for as new businesses consider locating downtown.
○ A permit system helps you engage with long-term system users and, over time, change behaviors. Downtown Van Wert has long lacked any significant enforcement measures, thus allowing users to park freely as they wish, enforcing habits that would challenge the reimagination of the system.
● The Downtown Employee Permit should allow long-term system users to register their vehicle through their employer or at Main Street Van Wert and park in dedicated areas. With the downtown parking system's current capacity, it is highly recommended that permit spaces remain open to the general public for peak use, but vehicles who register with permits must use those spaces if they plan on being in the downtown area for greater than four hours per day. The permit system requires a few special considerations for it to be a useful management tool:
○ Permits should be affordable for downtown business owners, institutions, and employees. Because the system availability is significantly higher than demand, permits should be no more than 1% of an employee’s annual salary.
■ Example: Downtown Employee makes $40,000 per year - the permit would cost the employee $400 per year (or $33 per month). ○ Permits should encourage downtown business owners, institutions, and employees to consider alternative transportation modes when possible through incentives. Considering the implementation of Strategy 7, users who bike or walk to work a specific number of days (determined by the system manager) and do not use their permit for vehicular parking may enroll in credits and rewards that benefit multimodal behavior. Benefits could include:
■ Entry into an annual bike giveaway
■ Annual cash bonuses
○ Permits must be enforced. This is the most challenging consideration to be monitored because Van Wert currently lacks active enforcement of its downtown parking ordinance. Instead of a traditional "hang tag" permit, consider opting for a window cling permit with a unique number that cannot be easily duplicated. Since enforcement continues to be an issue, consider employing a part-time enforcement officer a few days per week to monitor permit use during peak usage times.
● The Downtown Resident Permit is another critical tool to encourage positive parking system usage. Many communities' perception is that downtown residents only use the parking system after hours and in the evening when the supply is mostly available. While this history may have been confirmed, the recent pandemic has changed that perception, and recognizing that downtown residents may use the system at all times is a new reality. The permit system should closely mirror the Downtown Employee Permit with a few noticeable differences:
○ Permits should be a part of the cost of living downtown. Because the system’s availability is significantly higher than demand, permits should cost no more than 4% of an apartment or condominium's monthly cost.
■ Example: Downtown Unit Rental Cost is $650 per month - the permit would cost the renter or condominium owner $312 per year (or $26 per month).
○ Permits should encourage downtown residents to reduce the number of vehicles in which they own. Permits should be designed to promote multimodal transportation alternatives considering the implementation of Strategy 7. Users who reduce the number of vehicles they own per their unit could enroll in credits and rewards that benefit reduced vehicle use.
Benefits could include:
■ Entry into a month of free rent
■ Allowances to shop at local businesses in downtown
○ Downtown Resident Permits MUST be monitored, as they have the potential of unknowingly causing the most hardship during peak usage of the system. If an employee works from home or happens to be home during the highest system use (11:30 AM Monday - Friday), they are likely to use valuable spaces that could be used for short visits. The enforcement should follow that of the Downtown Employee Permit.
● Main Street and Washington Street Timed Restrictions. The most considerable public parking abuse continues to stem from long-term parking system users who take
valuable parking during peak system usage times. The current time restrictions on Main and Washington Streets vary between 15 minutes and 2 hours, although much of both streets have little or no posted time limits making it hard to create good parking behavior.
○ Enforcement could include a monitored parking system, such as a modern photo capture system that recognizes license plates, or a traditional chalking system, which an enforcement officer would "chalk" the rear tire in a unique color, and the person could be penalized for improperly using the system.
Partners: CVW, VWC, VWF, MSV, VED