
CITY OF INDEPENDENCE, MISSOURI COMPREHENSIVE ANNUAL FINANCIAL REPORT
FOR THE FISCAL YEAR ENDED JUNE 30, 2014
Mayor Eileen Weir
City Council
Marcie Gragg District #1
Curt Dougherty District #2
Scott Roberson District #3
Vacant District #4
Karen DeLuccie At-large
Chris Whiting At-large
City Manager
Robert Heacock
Prepared by the Department of Finance
Brian C. Watson, Director of Finance
i
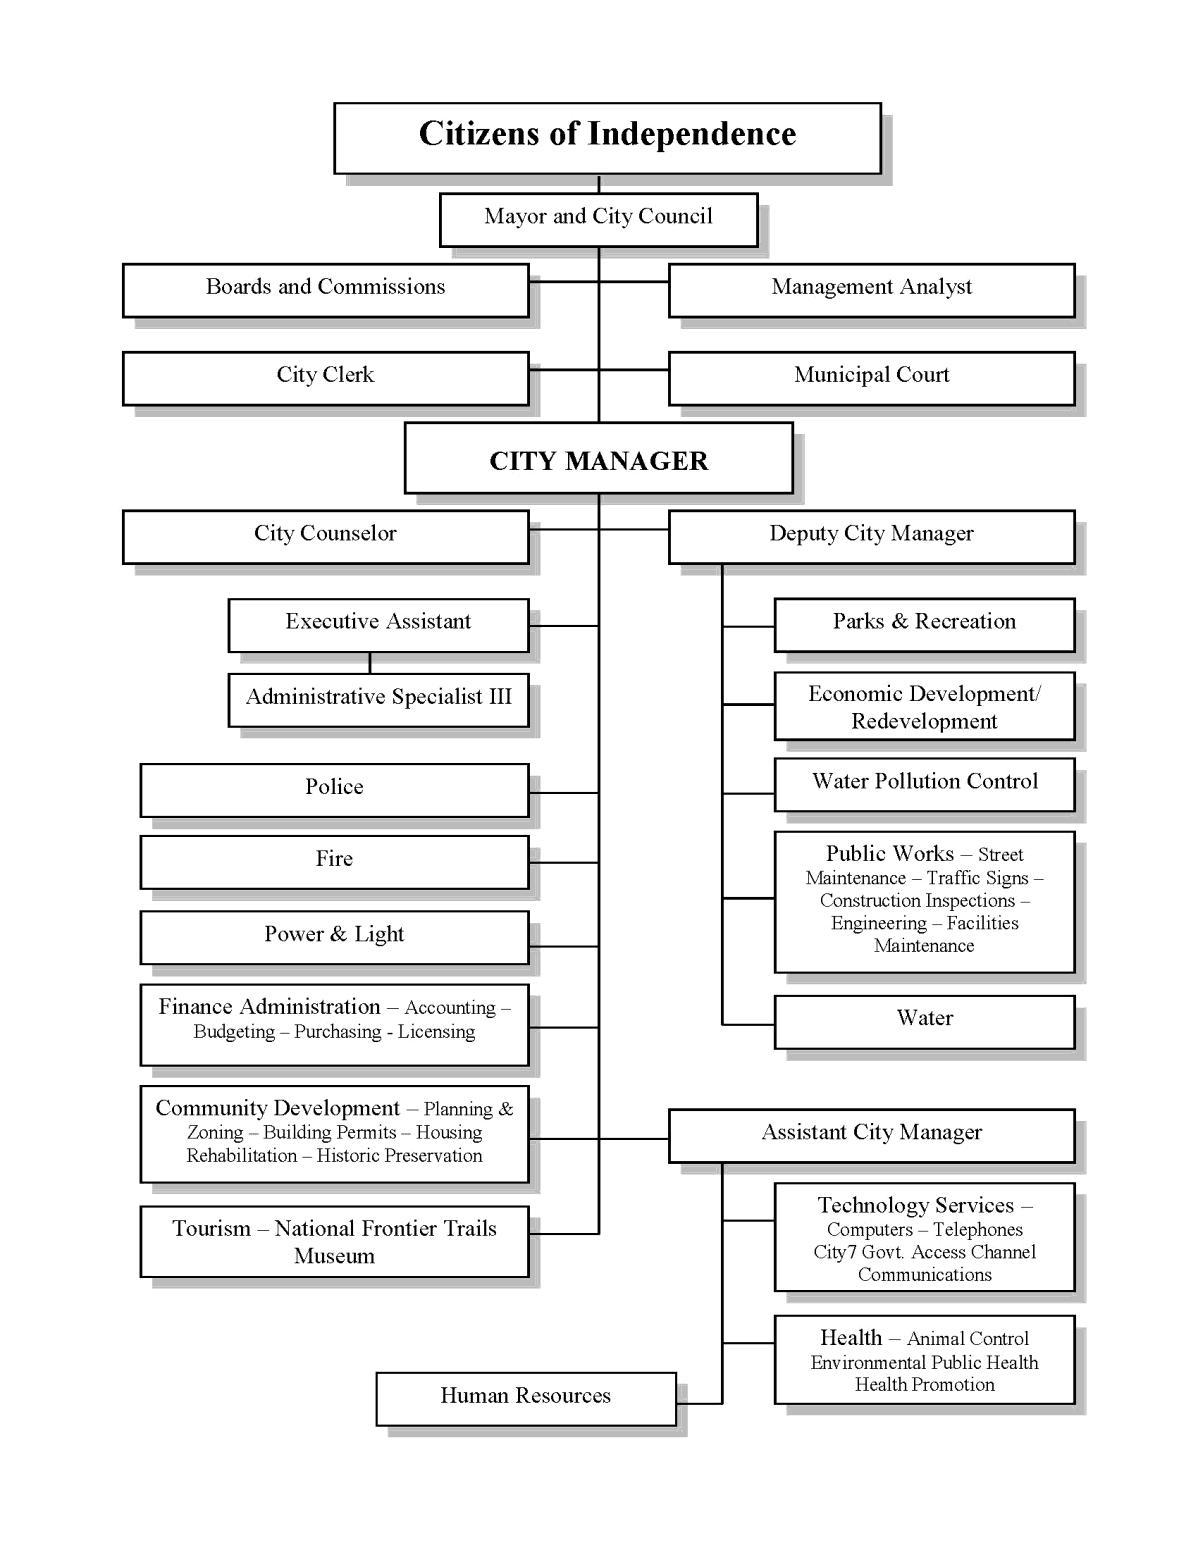
Table of Contents Page Introductory Section: Organizational Chart 1 Letter of Transmittal 2-6 GFOA Certificate of Achievement 7 Financial Section: Independent Auditors’ Report 8-9 Management’s Discussion and Analysis 10-20 Exhibit Basic Financial Statements: Government-wide: Statement of Net Position 1 21 Statement of Activities 2 22 Fund Financial Statements: Governmental Funds: Balance Sheet 3 23 Reconciliation of the Governmental Funds Balance Sheet to the Statement of Net Position 3.1 24 Statement of Revenues, Expenditures, and Changes in Fund Balances 4 25 Reconciliation of the Governmental Funds Statement of Revenues, Expenditures, and Changes in Fund Balances to the Statement of Activities 4.1 26 Proprietary Funds: Statement of Net Position 5 27 Statement of Revenues, Expenses, and Changes in Fund Net Position 6 28 Statement of Cash Flows 7 29 Fiduciary Funds: Statement of Fiduciary Net Position 8 30 Statement of Changes in Fiduciary Net Position 9 31 Notes to Financial Statements 32-78 Required Supplementary Information: Notes to Budgetary Comparison Schedules 79 Budgetary Comparison Schedule – General Fund 10 80 Budgetary Comparison Reconciliation Schedule – General Fund 10.1 81 Schedule of Funding Progress – Retirement & Other Post Employment Plans 11 82
CITY OF INDEPENDENCE, MISSOURI
ii
Table of Contents Exhibit Page Supplementary Information: Combining Balance Sheet – Nonmajor Governmental Funds 12 83 Combining Statement of Revenues, Expenditures, and Changes in Fund Balances – Nonmajor Governmental Funds 13 84 Combining Balance Sheet – Nonmajor Special Revenue Funds 14 85 Combining Statement of Revenues, Expenditures, and Changes in Fund Balances – Nonmajor Special Revenue Funds 15 86 Budgetary Comparison Schedules Tourism Fund 16 87-88 Community Development Block Grant Fund 17 89-90 Rental Rehabilitation Fund 18 91-92 Street Improvement Sales Tax Fund 19 93-94 Park Improvement Sales Tax Fund 20 95-96 Storm Water Sales Tax Fund 21 97-98 Police Public Safety Sales Tax Fund 22 99-100 Fire Public Safety Sales Tax Fund 23 101-102 Grant Fund 24 103-104 Combining Balance Sheet – Nonmajor Sales Tax Funds 25 105 Combining Statement of Revenues, Expenditures, and Changes in Fund Balances – Nonmajor Sales Tax Funds 26 106 Combining Balance Sheet – Nonmajor Capital Projects Funds 27 107 Combining Statement of Revenues, Expenditures, and Changes in Fund Balances (Deficit) – Nonmajor Capital Projects Funds 28 108 Combining Balance Sheet – Component Unit – Tax Increment Financing 29 109-110 Combining Statement of Revenues, Expenditures, and Changes in Fund Balances (Deficit) – Component Unit – Tax Increment Financing 30 111-112 Combining Statement of Net Position – Internal Service Funds 31 113 Combining Statement of Revenues, Expenses, and Changes in Net Position –Internal Service Funds 32 114 Combining Statement of Cash Flows – Internal Service Funds 33 115 Combining Statement of Changes in Assets and Liabilities – All Agency Funds 34 116 Schedules of Operating Expenses – Power and Light Fund 35 117-118 Schedule of Operating Statistics – Power and Light Fund 36 119 Schedules of Operating Expenses – Water Fund 37 120 Schedule of Operating Statistics – Water Fund 38 121 Schedule of Operating Statistics – Sanitary Sewer Fund 39 122
CITY OF INDEPENDENCE, MISSOURI
iii Table Page Statistical Data (Unaudited): Net Position by Component 1 124 Changes in Net Position 2 125-126 Fund Balances of Governmental Funds 3 127 Changes in Fund Balances of Governmental Funds 4 128 Total City Taxable Sales by Category 5 129 Sales Tax Rates Direct and Overlapping Governments 6 130 Assessed Value and Estimated Actual Value of Taxable Property 7 131 Property Tax Rates Direct and Overlapping Debt 8 132 Principal Property Taxpayers 9 133 Property Tax Levies and Collections 10 134 Utility Sales by Category 11 135 Utility Rates by Category 12 136 Principal Utility Payers – Power and Light 13 137 Principal Utility Payers – Water 14 138 Principal Utility Payers – Sewer 15 139 Ratios of Outstanding Debt by Type 16 140 Ratios of General Bonded Debt Outstanding 17 141 Direct and Overlapping Governmental Activities Debt 18 142 Legal Debt Margin Information 19 143 Pledged-Revenue Coverage 20 144 Demographic and Economic Statistics 21 145 Principal Employers 22 146 Full-time Equivalents City Government Employees by Function/Program 23 147 Operating Indicators by Function/Program 24 148 Capital Asset Statistics by Function/Program 25 149
1
October 28, 2014
Honorable Mayor, Members of the City Council, and Citizens of the City of Independence, Missouri
The Finance Department is pleased to present the Comprehensive Annual Financial Report (CAFR) of the City of Independence, Missouri, for the fiscal year ended June 30, 2014. This report is submitted to you for your review in compliance with the provisions of Article 3, Section 3.34 of the City Charter.
The responsibility for accuracy, completeness and fairness of the data presented, including all disclosures, rests with the City. We believe the report, as presented, is accurate in all material aspects and is presented in a manner designed to fairly set forth the financial position and the results of the City, on a Governmentwide and Fund basis. It is our belief that all disclosures necessary to enable the reader to gain an understanding of the City’s financial activities have been included. To enhance the reader’s understanding of these financial statements, note disclosures have been included as an integral part of this document.
This report was prepared by the City’s Finance Department staff in accordance with generally accepted accounting principles (GAAP), which are uniform minimum standards and guidelines for financial accounting and reporting in the United States. This report is intended to provide sufficient information to permit the assessment of stewardship and accountability and to demonstrate legal compliance.
The City of Independence’s financial statements, as required by the Charter, have been audited. The independent audit was conducted by McGladrey LLP. The goal of the independent audit was to provide reasonable assurance that the financial statements of the City of Independence for fiscal year ended June 30, 2014 are free of material misstatement. The independent audit involved examining, on a test basis, evidence supporting the amounts and disclosures in the financial statements; assessing the accounting principles used and significant estimates made by management; and evaluating the overall financial statement presentation. The independent auditor concluded, based upon the audit, that there was a reasonable basis for rendering an unmodified opinion that the City of Independence’s financial statements for the fiscal year ended June 30, 2014, are fairly presented in conformity with GAAP. The independent auditor’s report is presented as the first component of the financial section of this report.

The independent audit of the financial statements of the City of Independence was part of a broader, federally mandated “Single Audit” designed to meet the special needs of Federal grantor agencies. The standards governing Single Audit engagements require the independent auditor to report not only on the fair presentation of the financial statements, but also on the audited government’s internal controls and compliance with legal requirements, with special emphasis on internal controls and compliance with legal requirements involving the administration of federal awards. These reports are available in the City of Independence’s separately issued Single Audit Report.
In fulfilling its responsibilities for reliable financial statements, management depends on the City's system of internal control. This system is designed to provide reasonable assurance that assets are effectively safeguarded and that transactions are executed in accordance with management's authorization and are properly recorded. Because the cost of internal control should not exceed anticipated benefits, the objective is to provide reasonable, rather than absolute, assurance that the financial statements are free of any material misstatements. In addition to the independent audit and the internal control system, the Charter provides that the Council appoint a Management Analyst. The Management Analyst performs such duties as directed by the Council. These duties include the periodic review of all departments and the preparation of an annual report to the Council.
The Audit and Finance Committee, comprised of three members of the Council, acts in an advisory capacity to the Council and reviews financial information for appropriateness, reliability, clarity, timeliness and compliance with generally accepted accounting principles and legal requirements. In addition, this committee reviews the audit functions and adequacy of internal control systems.
GAAP requires that management provide a narrative introduction, overview and analysis to accompany the basic financial statements in the form of Management’s Discussion and Analysis (MD&A). This letter of transmittal is designed to complement the MD&A and should be read in conjunction with it. The City of Independence’s MD&A can be found immediately following the report of the independent auditor.
Profile of the City
Incorporated in 1849, the City of Independence is the county seat of Jackson County and borders on the eastern edge of Kansas City, Missouri. Independence has a rich history as The Queen City of the Trails and former home of Harry S Truman, 33rd President of the United States. Independence is the fourth largest city in Missouri with an estimated population of 117,240.
Working Woman magazine named Independence one of the ten best districts for children and families because of the availability of school-based care with its 21st Century Community Learning Centers. Patricia Schultz included several tourism attractions in Independence in her recent travel book, 1,000 Places to See in the United States and Canada Before You Die. National Geographic Traveler, September 2010, included Independence's Santa-Cali-Gon Days, an annual festival celebrating the start of the Santa Fe, California, and Oregon Trails, as one of "our pick of travel-worthy events." The Kansas City Convention and Visitors Association awarded Independence the "Best Day Trip" award for 2010 and 2011 based on votes received from visitors outside of the state. Independence was also named “Best Day Tour from Kansas City” for the second year in a row by the readers of AAA Midwest Traveler magazine.
Its central location in the "Heart of America" offers residents and businesses unique location advantages and means that traveling, shipping, receiving and communications are more economical because of shorter distances to most parts of the country. Situated along major interstate highways (I-70, I-49, I-35, I-29) and rail routes, access to Independence from all parts of the nation, as well as, Canada and Mexico is excellent. The City’s 78 square miles accommodate its residents and numerous businesses with 32 square miles of mixed-use land in eastern Independence available for development.
The City of Independence is home to Lake City Army Ammunition Plant, the largest small-caliber ammunition manufacturing plant in the world. Lake City is the largest employer in Independence and encompasses 458 buildings on 3,935 acres. Independence is home to the Harry S Truman Presidential Museum & Library, one of only thirteen in the nation There are six major industrial and business parks in Independence. A large portion of the manufacturing, warehousing and office space is located underground in three separate, sub-surface business parks. This area has over 750 acres of mixed-use business parks with over 32 million square feet of industrial space, underground warehousing, and a cold storage facility with 1.2 million square feet.
3
The City of Independence is organized, as a constitutional charter city under the Missouri statutes utilizing the Council-Manager form of government. In accordance with the charter, the registered voters within the City elect a mayor and six council members to serve four-year terms as representatives on the City Council. An election for four districts is conducted as a unit, while elections for mayor and two atlarge seats are conducted two years later. The Council appoints a City Manager to serve as the chief administrative officer of the City.
The City of Independence provides a comprehensive range of municipal services normally associated with a municipality, including police and fire protection, public works services, public health services, parks and recreation facilities, general administrative services and a trails history museum. The City also provides electric, water, and sanitary sewer services, all of which are accounted for in the financial statements as business-type activities.
In evaluating the City as a reporting entity, management has considered all potential component units. Determination of whether an entity is controlled by, or dependent on, the City is made on the basis of budget adoption, taxing authority, outstanding debt secured by revenues or general obligations of the City, or the City’s obligation to fund any deficit that may occur. As allowed by accounting principles generally accepted in the United States of America, the City has included the Tax Increment Financing (TIF) Commission, Independence Events Center Management Corporation (IECMC), Events Center Community Improvement District (CID) and the Crackerneck Creek Transportation Development District’s (TDD) activities in its financial statements as blended component units.
The annual budget serves as the foundation for the City of Independence’s financial planning and control. The appropriated budget is prepared by fund, function (e.g. public safety), and department (police). Department heads may make transfers of appropriations within their department. Transfers of appropriations between departments, however, require approval of the City Council. Budget-to-actual comparisons for the General and Special Revenue Funds, which are required for each individual governmental fund for which an appropriated annual budget has been adopted, are included in this report.
Purchase orders and contracts are encumbered prior to their release to vendors. Any item, which would result in expenditures in excess of a department’s budget, is not released until alternative sources of payment are made available. Open encumbrances as of June 30, 2014, are reported as committed and assigned fund balance since the City intends to honor the purchase orders and contracts.
Local economy
The City is continuing to experience growth on the eastern side of town. The I-70 interchange has made the Little Blue Parkway the professional business corridor of the 21st Century. This is due to a strong business climate and a history of successful development efforts utilizing Tax Increment Financing (TIF). This area has three million square feet of retail development, two million of which has been built since 1995. The Little Blue Parkway is located in the heart of a fast growing commercial area. This area is home to the Independence Events Center which includes an arena with 5,800 seats for sports with additional seating for concerts and a community ice rink. The Events Center is home to the Central Hockey League franchise the Missouri Mavericks and Major Indoor Soccer League the Comets. The Missouri Mavericks have a signed contract that expires in 2020 and the Comets contract expires March 2016. The Events Center opened in November 2009 providing approximately 120 new jobs.
4
The following table sets forth average annual unemployment figures for Independence and Jackson County, compared to the State of Missouri.
Source: MERIC MO Economic Research and Information Center/MO Dept of Economic Development
*Average estimated thru June 2014
Long-term financial planning
The City of Independence prepares a five-year financial projection of our financial condition, which includes capital outlay projections as well as a six-year Capital Improvements Program (CIP). The CIP includes proposed projects for constructing, maintaining, upgrading, and replacing the City’s physical infrastructures. The budget for fiscal year 2014-2015 includes projects totaling an estimated $25 5 million on capital projects. In preparing the capital budget, needs are assessed, public improvements are prioritized and costs are projected. This budget is reviewed annually and projects are re-prioritized and the financial condition of the City is evaluated. Many of the streets improvements, parks improvements and storm water projects are funded by the voter approved street, parks, and storm water sales taxes.
The City’s policy is to maintain an unassigned fund balance level in the General Fund equal to 5% of annual revenues. Unassigned fund balance in the General Fund does fall within the policy guidelines set by the Council for budgetary and planning purposes.
Relevant financial policies
It is the City of Independence's policy to restore the unassigned fund balance through revenue allocations or expenditure reductions when it falls below the 5% of annual revenues. The City Manager has not funded vacant positions whenever possible in an effort to reduce salary and benefit costs. In addition, each department has been asked to reduce expenditures in an effort to reduce costs. The unassigned fund balance as of June 30, 2014 was 5.0% of the General Fund revenues. This is an increase from 0.8% last year.
Major initiatives
Development of the Little Blue Parkway, a new thoroughfare connecting the eastern portion of the City to the north-eastern portion is now complete This roadway links four major highways and covers 32 square miles with plans to add an additional 20,000 residents and 5,000 new jobs over the next twenty years
The Neighborhood Stabilization Program continues to bring a number of private and public entities together to redevelop Northwest Independence as a vibrant community. The City anticipates the Neighborhood Stabilization Program will run through fiscal year 2015-16, until all funding sources have been exhausted. Development incentives, school redistricting, and tax abatements have combined to encourage construction of new housing, rehabilitation of existing housing, and redevelopment of commercial nodes. Additional infrastructure investments by both the City and Missouri Department of
Year City Unemployment Rate Jackson County Unemployment Rate Statewide Unemployment Rate 2014* 6.8% 7.5% 6.6% 2013 6.9% 7.5% 6.5% 2012 7.1% 7.7% 6.9% 2011 10.2% 9.5% 8.4% 2010 10.4% 10.7% 9.4%
5
Transportation have improved access and enhanced property values. The City anticipates that population will continue to rebound in this geographic area over the next five to ten years.
Awards and Acknowledgements

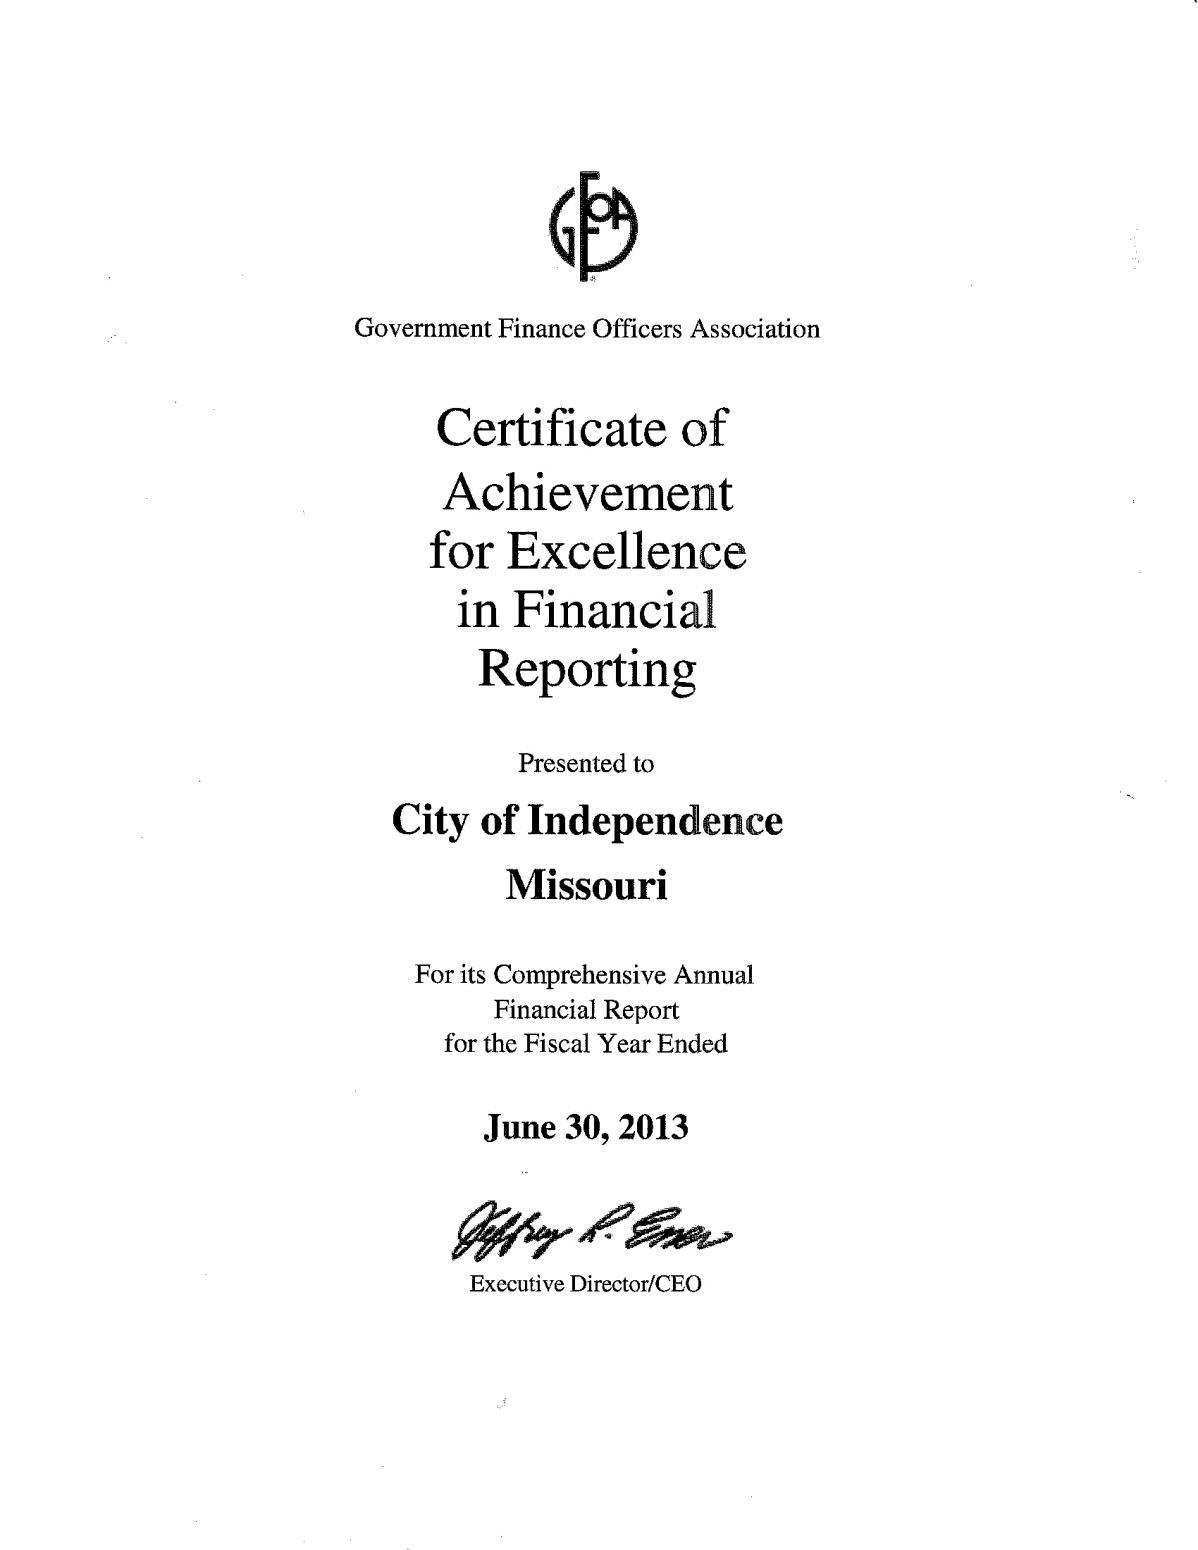
The Government Finance Officers Association of the United States and Canada (GFOA) awarded a Certificate of Achievement for Excellence in Financial Reporting to the City of Independence for its Comprehensive Annual Financial Report for the fiscal year ended June 30, 2013. In order to be awarded a Certificate of Achievement, a governmental unit must publish an easily readable, efficiently organized comprehensive annual financial report, the contents of which conform to program standards. Such reports must satisfy both generally accepted accounting principles and applicable legal requirements.
A Certificate of Achievement is valid for a period of one year only. We believe our current CAFR continues to conform to the Certificate of Achievement Program requirements and we are submitting it to the GFOA to determine its eligibility for another certificate.
The City is also the recipient of GFOA's Award for Distinguished Budget Presentation for its annual budget for the fiscal year beginning July 1, 2013. In order to receive this award, a governmental unit must publish a budget document that meets program criteria as a policy document, as an operations guide, as a financial plan and as a communications medium. This award is valid for a period of one year only. We believe our current budget continues to conform to program requirements, and we are submitting it to GFOA to determine its eligibility for another award
The preparation of this report would not have been possible without the efficient and dedicated services of several members of the Finance Department. I wish to express my appreciation to all members of the department who assisted and contributed to the preparation of this report. I also would like to thank the firm of McGladrey LLP for their assistance and patience in the preparation of this annual report.
Respectfully submitted,
Brian C. Watson Director of Finance6
7
Independent Auditor's Report
To the Honorable Mayor and Members of the City Council City of Independence, Missouri Independence, Missouri
Report on the Financial Statements
We have audited the accompanying financial statements of the governmental activities, the business-type activities, each major fund, and the aggregate remaining fund information of the City of Independence, Missouri (the City) as of and for the year ended June 30, 2014, and the related notes to the financial statements, which collectively comprise the City’s basic financial statements as listed in the table of contents.
Management’s Responsibility for the Financial Statements
Management is responsible for the preparation and fair presentation of these financial statements in accordance with accounting principles generally accepted in the United States of America; this includes the design, implementation, and maintenance of internal control relevant to the preparation and fair presentation of financial statements that are free from material misstatement, whether due to fraud or error.
Auditor’s Responsibility
Our responsibility is to express opinions on these financial statements based on our audit. We did not audit the financial statements of the Independence Events Center Management Corporation (IECMC), which is a blended component unit presented within the Events Center Fund, a major enterprise fund of the City. This activity represents 2 percent and 43 percent, respectively, of the total assets and total revenues of the major enterprise fund and 0.20 percent and 2 percent, respectively, of the total assets and total revenues of the business-type activities. Those statements were audited by other auditors, whose report has been furnished to us, and our opinion, insofar as it relates to the amounts included for the IECMC is based solely on the report of the other auditors. We conducted our audit in accordance with auditing standards generally accepted in the United States of America and the standards applicable to financial audits contained in Government Auditing Standards, issued by the Comptroller General of the United States. Those standards require that we plan and perform the audit to obtain reasonable assurance about whether the financial statements are free from material misstatement. The financial statements of the IECMC, a blended component unit presented within the Events Center major enterprise fund, were not audited in accordance with Government Auditing Standards.
An audit involves performing procedures to obtain audit evidence about the amounts and disclosures in the financial statements. The procedures selected depend on the auditor’s judgment, including the assessment of the risks of material misstatement of the financial statements, whether due to fraud or error. In making those risk assessments, the auditor considers internal control relevant to the entity’s preparation and fair presentation of the financial statements in order to design audit procedures that are appropriate in the circumstances, but not for the purpose of expressing an opinion on the effectiveness of the entity’s internal control. Accordingly, we express no such opinion. An audit also includes evaluating the appropriateness of accounting policies used and the reasonableness of significant accounting estimates made by management, as well as evaluating the overall presentation of the financial statements.
We believe that the audit evidence we have obtained is sufficient and appropriate to provide a basis for our audit opinions.
Opinions
In our opinion, based on our audit and the report of other auditors, the financial statements referred to above present fairly, in all material respects, the respective financial position of the governmental activities, the business-type activities, each major fund, and the aggregate remaining fund information of the City of Independence, Missouri, as of June 30, 2014, and the respective changes in financial position and, where applicable, cash flows thereof for the year then ended in accordance with accounting principles generally accepted in the United States of America.
8
Other Matters
Required Supplementary Information
Accounting principles generally accepted in the United States of America require that the Management’s Discussion and Analysis on pages 10 through 20, the Budgetary Comparison Schedules on pages 80 and 81, and the Schedules of Funding Progress on page 82 be presented to supplement the basic financial statements. Such information, although not a part of the basic financial statements, is required by the Governmental Accounting Standards Board who considers it to be an essential part of financial reporting for placing the basic financial statements in an appropriate operational, economic or historical context. We and other auditors have applied certain limited procedures to the required supplementary information in accordance with auditing standards generally accepted in the United States of America, which consisted of inquiries of management about the methods of preparing the information and comparing the information for consistency with management’s responses to our inquiries, the basic financial statements, and other knowledge we obtained during our audit of the basic financial statements. We do not express an opinion or provide any assurance on the information because the limited procedures do not provide us with sufficient evidence to express an opinion or provide any assurance.
Other Information
Our audit was conducted for the purpose of forming opinions on the financial statements that collectively comprise the City of Independence, Missouri’s basic financial statements. The combining and individual nonmajor fund financial statements and other schedules, listed in the table of contents as supplementary information, and the other information, such as the introductory and statistical section are presented for purposes of additional analysis and are not a required part of the basic financial statements.
The combining and individual nonmajor fund financial statements and other schedules are the responsibility of management and were derived from and relate directly to the underlying accounting and other records used to prepare the basic financial statements. Such information has been subjected to the auditing procedures applied in the audit of the basic financial statements and certain additional procedures, including comparing and reconciling such information directly to the underlying accounting and other records used to prepare the basic financial statements or to the basic financial statements themselves, and other additional procedures in accordance with auditing standards generally accepted in the United States of America. In our opinion, based on our audit, the procedures performed as described above, and the report of other auditors, this information is fairly stated, in all material respects, in relation to the basic financial statements as a whole.
The accompanying introductory, statistical sections and other schedules, as listed in the table of contents, have not been subjected to the auditing procedures applied in the audit of the basic financial statements, and accordingly, we do not express an opinion or provide any assurance on them.

Other Reporting Required by Government Auditing Standards
In accordance with Government Auditing Standards, we have also issued our report dated October 27, 2014 on our consideration of the City of Independence, Missouri’s internal control over financial reporting and on our tests of its compliance with certain provisions of laws, regulations, contracts, and grant agreements and other matters. The purpose of that report is to describe the scope of our testing of internal control over financial reporting and compliance and the results of that testing, and not to provide an opinion on internal control over financial reporting or on compliance.That report is an integral part of an audit performed in accordance with Government Auditing Standards in considering City of Independence, Missouri’s internal control over financial reporting and compliance.
Kansas City, Missouri
October 27, 2014
9
CITY OFINDEPENDENCE, MISSOURI Management’s Discussion and Analysis
June 30, 2014
This section of the City of Independence’s comprehensive annual financial report presents our review of the City’s financial performance during the fiscal year that ended on June 30, 2014 Please read it in conjunction with the transmittal letter at the front of this report and the City’s financialstatements, which follow this section.
Financial Highlights
The City’s total net position decreased $1.2 million. The City’s ‘governmental-type activities’ had a decrease of $5.1 million and the ‘business-type activities’ had an increase of $3.9 million.
Sales tax revenue increased by $557,835 Again this year, the lagging growth in revenue from sales tax can mostly be attributed to two factors. The first and probably the most significant is the slow economy that has generally been felt throughout the country. The second is the retailcompetition that continues to develop within the trade area of the City. Blue Springs and Lee’s Summit continue to expand their retailshopping opportunities
The economy has continued to impact development in the 39th Street and I-70 commercialarea of the City. This lack of growth has significantly impacted the Falls at Crackerneck Tax Increment Financing project. Since retail shopping has not occurred as originally expected the General Fund has had to fund the debt service gap on the bonds issued for public improvements in this project. Several of the debt issues for the Falls at Crackerneck project were refinanced to reduce the GeneralFund coverage in future years.
Revenues of the GeneralFund were also significantly impacted by the combined impact of extremely low cost of naturalgas and weather. As a result of the low cost of fueland a very mild winter revenues from the franchise tax on natural gas sales within the City were $418,512 less than originally projected. Weather has also impacted revenues from sales of electricity and water.
The Independence Events Center opened in the southeast part of the City during November 2009. This project allowed for the establishment of a community improvement district and a sales tax in the district to finance the obligations issued to construct the events center. The Events Center’s primary tenant is the Mavericks a member of the CentralHockey League (CHL) A second tenant with a multi-year lease is the Comets of the Major Indoor Soccer League (MISL). During 2011 the City established the Independence Events Center Management Corporation and assumed the operation of the events center. The Management Corporation is operating the events center with staff from a prior operator.
Overviewof the Financial Statements
This annual report consists of four parts, management’s discussion and analysis, the basic financial statements, required supplementary information, and an optional section that presents combining statements for non-major governmental funds and internal service funds. The basic financial statements include two kinds of statements that present different views of the City:
The first two statements are government-wide financial statements that provide both long-term and shortterm information about the City’s overallfinancialstatus.
The remaining statements are fund financialstatements that focus on individualparts of the City government, reporting the City’s operation in more detailthan the government-wide statements:
o The governmental funds statements tell how general government services, like public safety, were financed in the short-term, as wellas, what remains for future spending.
10
o Proprietary fund statements offer short-term and long-term financial information about the activities the government operates like a business, such as the Power and Light system, Water system, Sanitary Sewer system, and the Events Center.
o Fiduciary fund statements provide information about financial relationships for which the City acts solely as a trustee or agent for the benefit of others, to whom the underlying resources belong, such as the Seniors TravelFund, and Flexible Benefit Plan Fund.
The financial statements also include notes that provide additionalexplanatory information to the financial statements. The statements are followed by a section of required supplementary information, which explains and supports the information in the financial statements. Figure MD-1 shows how the required parts of this annual report are arranged and relate to one another.
In addition to these required elements, we have included a section with combining statements that provide details about our non-major governmental funds and internal service funds, each of which are added together and presented in single columns in the basic financialstatements.
Figure MD-2 summarizes the components of the City’s financial statements, including the portion of the City government, which each covers and the types of information each contain. The remainder of this section explains the structure andcontent of each of the statements.
FigureMD-2
FigureMD-1
RequiredComponents ofCityofIndependence's Annual FinancialReport
Management's Discussion and Analysis
BasicFinancial Statements Required Supplementary Information
Requiredfinancial statements
*BalanceSheet
*Statementofrevenues, expenditures,andchangesinfund balances
GovernmentwideFinancial Statements
FundFinancial Statements
Notes tothe Financial Statements Summary Detail
MajorFeaturesoftheCityofIndependence'sGovernment-wideandFundFinancialStatements
FundStatements
*Statementofnetposition
*Statementofrevenues,expenses, andchangesinnetposition
*Statementofcashflows
*Statementoffiduciarynetposition
*Statementofchangesinfiduciarynet position
Typeofinflow/outflow information Allrevenuesandexpenses duringyear,regardlessofwhen cashisreceivedorpaid
thatcomedueduring theyearorsoonthereafter,no capitalassetsincluded
Revenuesforwhichcashisreceived duringorsoonaftertheendofthe year;expenditureswhengoodsor serviceshavebeenreceivedand paymentisdueduringtheyearor soonthereafter
Allassetsandliabilities,bothfinancial andcapital,andshort-termandlongterm
Allrevenuesandexpensesduring year,regardlessofwhencashis receivedorpaid
Allassetsandliabilities,bothshorttermandlong-term;theCity'sfundsdo notcurrentlycontaincapitalassets, althoughtheycan
Allrevenuesandexpensesduringyear, regardlessofwhencashisreceivedor paid
CITY OFINDEPENDENCE,
Management’s
11
MISSOURI
Discussion and Analysis June 30, 2014
Government-WideStatements GovernmentalFunds ProprietaryFunds FiduciaryFunds Scope EntireCitygovernment(except fiduciaryfunds) TheactivitiesoftheCitythatare notproprietaryorfiduciary,suchas police,fire,andparks ActivitiestheCityoperatessimilarto privatebusinesses:electric,water,and sanitarysewer InstancesinwhichtheCityisthe trusteeoragentforsomeoneelse's resources
Statementofnetposition
Statementofactivities Accountingbasisand measurementfocus Accrualaccountingand economicresourcesfocus. Modifiedaccrualaccountingand currentfinancialresourcesfocus Accrualaccountingandeconomic resourcesfocus Accrualaccountingandeconomic resourcesfocus Typeofasset/liability information Allassetsandliabilities,both financialandcapital,andshorttermandlong-term Onlyassetsexpectedtobeusedup andliabilities
*
*
Government-wide Statements
The government-wide statements report information about the City as a whole using accounting methods similar to those used by private-sector companies. The statement of net position includes allof the government’s assets , liabilities, and deferred inflows/outflows of resources. All of the current year’s revenues and expenses are accounted for in the statement of activities regardless of whencash is received or paid.
The two government-wide statements report the City’s net position and how they have changed. The term “net position” refers to the difference between the City’s assets, liabilities, and deferred inflows/outflows of resources and is one way to measure the City’s financialhealth or position.
Over time, increases or decreases in the City’s net position are an indicator of whether its financialhealth is improving or deteriorating, respectively.
To further assess the overall health of the City, additional non-financial factors such as changes in the City’s property tax base and the condition of the City’s roads should be considered.
The government-wide financialstatements of the City can be divided into two categories:
Governmental activities – Most of the City’s basic services are included here, such as the police, fire, public works, and parks departments, as wellas, generaladministration. Property taxes, sales taxes, and state and federalgrants finance most of these activities.
Business-type activities – The City charges fees to customers to help it cover the costs of certain services it provides. The City’s Power and Light system, Water system, Sanitary Sewer system, and Events Center are included here.
Fund Financial Statements
The fund financialstatements provide more detailed information about the City’s most significant funds, not the City as a whole. Funds are accounting devices that the City uses to keep track of specific sources of funding and spending for particular purposes.
Some funds are required by the City’s Charter, State Statutes, and bond covenants.
The Council establishes other funds to control and manage money for particular purposes or to show that it is properly using certain taxes and grants.
The City has three kinds of funds:
Governmentalfunds – Most of the City’s basic services are included in governmentalfunds, which focus on (1) how cash and other financial assets that can readily be converted to cash flow in and out and (2) the balances left at year-end that are available for spending. Consequently, the governmental fund statements provide a detailed short-term view that helps you determine whether there are more or fewer financial resources that can be spent in the near future to finance the City’s programs. Because this information does not encompass the additional long-term focus of the government-wide statements, we provide additional information at the bottom of the governmentalfunds statement, or on the subsequent page, that explains the relationship (or differences) between them.
12
CITY OFINDEPENDENCE, MISSOURI Management’s Discussion and Analysis June 30, 2014
Proprietary funds – Business operations for which the City charges customers a fee are generally reported in proprietary funds. Proprietary funds, like the government-wide statements, provide both long-term and short-term financial information.
o The City’s enterprise funds are the same as its business-type activities, but provide more detail and additionalinformation, such as cash flows.
o The City uses internal service funds to report activities that provide supplies and services for the City’s other programs and activities. The City has three internal service funds. These are the selffunded Staywellhealth insurance fund, Central Garage fund, and the Workers’ Compensation fund
Fiduciary funds – Periodically, the City may be responsible for other assets that have been given to the City under the terms of a trust agreement initiated by an outside third party. Generally these funds are limited in use for the benefit of the designated trust beneficiary. The City is responsible for ensuring that the assets reported in these funds are used for their intended purposes. Currently, the City is the trustee, or fiduciary, for the following funds: Vaile Mansion/Anderson Trust Fund, Susie Paxton Block Trust Fund, Seniors’ Travel Fund, and the Flexible Benefit Plan Fund. All of the City’s fiduciary activities are reported in a separate statement of fiduciary net position and a statement of changes in fiduciary net position. We exclude these activities from the City’s government-wide financial statements because the City cannot use these assets to finance its operations.
13
CITY OFINDEPENDENCE, MISSOURI Management’s Discussion and Analysis June 30, 2014
CITY OFINDEPENDENCE, MISSOURI Management’s Discussion and Analysis
FINANCIALANALYSIS OF THECITY AS A WHOLE
The following Table (MD-1) reflects the condensed Statement of Net Position:
The City’s combined net position decreased 0 3% to $433.0 million from $434.2 million. Net position of the City’s governmental activities decreased 4.1% to $117.0 million. Governmental assets decreased $487,260 and liabilities increased $4.6 million. Long-term obligations for Governmental activities increased $3.9 million and Business-type activities increased $40.0 million. The increase in long term obligations for Business-type activities is primarily the result of issuing obligations for Sanitary Sewer system improvements. Other factors include an increase in the amount reported for other post employment benefits, and the net pension obligation for the LAGERS retirement program
Total unrestricted net position (deficit) was ($174.7) million with the Business-type activities being $59.2 million. The City’s unrestricted net position (deficit) for Governmentalactivities was ($233.9) million.
Unrestricted net position for Business-type activities was $59.2 million and increased $14.1 million from the previous year. Net investment in capital assets is $240.5 million and decreased $11.0 million from the previous year.
14
June 30, 2014
Net Positon
2014 2013 2014 2013 2014 2013 Currentandotherassets $ 58,747,300 55,467,642 159,206,494 160,883,829 217,953,794 216,351,471 Capitalassets 338,548,368 342,315,286 545,208,480 496,267,164 883,756,848 838,582,450 Totalassets 397,295,668 397,782,928 704,414,974 657,150,993 1,101,710,642 1,054,933,921 3,319,709 3,283,623 10,801,595 10,133,821 14,121,304 13,417,444 Long-termobligations 268,550,624 264,694,691 377,280,821 337,327,232 645,831,445 602,021,923 Otherliabilities 15,106,689 14,360,438 21,916,165 17,792,875 37,022,854 32,153,313 Totalliabilities 283,657,313 279,055,129 399,196,986 355,120,107 682,854,299 634,175,236 Netposition 333,902,700 336,357,164 240,517,938 251,523,417 574,420,638 587,880,581 Restricted 16,931,671 16,853,297 16,288,747 15,545,776 33,220,418 32,399,073 Unrestricted(deficit) (233,876,307) (231,199,039) 59,212,898 45,095,514 (174,663,409) (186,103,525) Totalnetposition $ 116,958,064 122,011,422 316,019,583 312,164,707 432,977,647 434,176,129
Total Netinvestmentincapital assets Governmental Activities Business-Type Activities Totaldeferredoutflowsof resources
TableMD-1 CityofIndependence'sNetPosition
CITY OFINDEPENDENCE, MISSOURI Management’s Discussion and Analysis
June 30, 2014
Change In Net Position
The following Table (MD-2) reflects the revenues and expenses from the City’s activities:
Total revenues increased 8.1% or $23.9 million, Business-type activities increased 9.1% or $17.8 million, and Governmentalrevenues increased 6.2% or $6.1 million The increase in Operating grants and contributions is the result of reimbursements in areas, such as, Neighborhood Stabilization and Rental Rehabilitation programs. The increase in Capital grants and contributions is primarily due to an increase in the capital contributions in the Power and Light and Water funds. Of significance is the small increase from sales taxes. This is a reflection of the economy and retail competition. The increase in charges for services for Business-type activities is the result of rate increases andweather conditions.
Total expenses increased 4.1% or $12.5 million, Governmental expenses increased 2.9% or $3.5 million and Business-type expenses increased 5.0% or $9.0 million
15
2014 2013 2014 2013 2014 2013 Revenues Programrevenues Chargesforservices $ 15,900,514 14,976,665 191,190,224 188,969,047 207,090,738 203,945,712 Operatinggrants&contributions 10,680,433 9,462,570 — — 10,680,433 9,462,570 3,769,347 3,590,902 2,386,511 763,127 6,155,858 4,354,029 Generalrevenues Propertytaxes 7,993,199 7,618,559 — — 7,993,199 7,618,559 Salestaxes 41,142,183 40,689,725 5,397,059 5,291,682 46,539,242 45,981,407 Intergovernmentalactivitytaxes 10,809,061 9,635,263 — — 10,809,061 9,635,263 Othertaxes 10,311,869 10,430,048 — — 10,311,869 10,430,048 Interest 302,394 302,467 45,754 66,215 348,148 368,682 Specialitem-litigationsettlement 2,203,430 — 12,796,570 — 15,000,000 — Other 695,896 1,049,065 1,660,835 557,965 2,356,731 1,607,030 Totalrevenues 103,808,326 97,755,264 213,476,953 195,648,036 317,285,279 293,403,300 Expenses Administrativeservices 9,096,123 9,225,738 — — 9,096,123 9,225,738 Publicworks 18,079,671 17,428,294 — — 18,079,671 17,428,294 Publicsafety 56,859,801 55,139,731 — — 56,859,801 55,139,731 Culture&recreation 7,435,735 7,275,087 — — 7,435,735 7,275,087 Communitydevelopment 6,316,004 5,318,490 — — 6,316,004 5,318,490 Health&welfare 3,622,207 3,810,863 — — 3,622,207 3,810,863 Electric — — 138,801,854 127,959,254 138,801,854 127,959,254 Water — — 22,140,775 21,886,576 22,140,775 21,886,576 Sanitarysewer — — 19,015,060 18,900,129 19,015,060 18,900,129 Eventscenter — — 10,859,704 13,091,457 10,859,704 13,091,457 Stormwater 3,000,734 2,862,544 — — 3,000,734 2,862,544 Generalgovernment 8,730,105 8,405,914 — — 8,730,105 8,405,914 Taxincrementfinancing 14,273,775 14,281,820 — — 14,273,775 14,281,820 Debtservicecomponentunit — — — — — — Interest 252,213 379,760 — — 252,213 379,760 Totalexpenses 127,666,368 124,128,241 190,817,393 181,837,416 318,483,761 305,965,657 Excess(deficiency)ofrevenues overexpensesbeforetransfers (23,858,042) (26,372,977) 22,659,560 13,810,620 (1,198,482) (12,562,357) Transfers-In(Out) 18,804,684 18,232,349 (18,804,684) (18,232,349) — — (5,053,358) (8,140,628) 3,854,876 (4,421,729) (1,198,482) (12,562,357) 122,011,422 130,152,050 312,164,707 316,586,436 434,176,129 446,738,486 Netposition,endofyear $ 116,958,064 122,011,422 316,019,583 312,164,707 432,977,647 434,176,129 Netposition,beginningofyear Changeinnetposition Capitalgrants&contributions Total
Governmental Activities Business-Type Activities
TableMD-2 CityofIndependence'sNetPosition
CITY OFINDEPENDENCE, MISSOURI Management’s Discussion and Analysis
June 30, 2014
The change in the Business-type expenses is attributable to normaloperations; some of the changes are related to the effect of weather on electric and water sales. The transfers out of the Business Type Activities and in to the GovernmentalActivities represents the payment in-lieu of taxes that would be paid and received if they operated as private utilities
Revenues
For the fiscal year ending June 30, 2014 revenues totaled $317.3 million. Of this amount charges for services (Governmental and Business-type) was $207.1 million or 65.3% of the total. Revenue from Business-type activities represents $213.5 million or 67.3% of the totalCity revenues (Figure MD-3).
Revenues from Governmental activities were $103.8 million. Sales taxes, the largest Governmental category, were $41.1 million or 39.6%. All taxes represent $70.3 million or 67.7% of Governmental revenue. Operating and capital grants were $14.4 million or 13.9% of Governmentalrevenues. Charges for services at $15.9 million were 15.3% of the total.
16
Property taxes 3% Sales taxes 13% Intergovernmental actvitiestaxes 3% Franchisefees 3% Grants& Contributions 5% Chargesfor services 5% Interest 0% Specialitemlitigation settlement 1% Other 0% Electric 48% Water 9% Sanitary Sewer 7% EventsCenter CapitalGrants 3%
FigureMD-3 Cityof Independence Sources ofRevenuesforFY2014
CITY OFINDEPENDENCE, MISSOURI Management’s Discussion and Analysis
June 30, 2014
Expenses
For the fiscal year ending June 30, 2014 expenses totaled $318.5 million. Of this amount the electric utility was $138.8 million or 43.6% of the total. Business-type expenses represent $190.8 million or 59.9% of the totalCity expenses (Figure MD-4).
Expenses from Governmental activities were $127.7 million. Public safety expenses, the largest Governmental category, were $56.9 million or 44.5% of the total. Public Works is the next largest category at $18.1 million, which is 14.2% of the total.
17
Administrative services 3% Publicsafety 18% Publicworks 6% Health & welfare 1% Culture& recreation 2% Community development 2% Storm water 1% Generalgovernment 3% Tax increment financing 4% Interest 0% Electric 44% Water 7% Sanitary sewer 6% Eventscenter 3%
FigureMD-4 City ofIndependence FunctionalExpensesFY2014
Governmental Activities 2014 2013 2014 2013 Administrative services $ 9,096,123 9,225,738 2,174,766 2,583,907 Public works 18,079,671 17,428,294 10,182,751 10,869,478 Public safety 56,859,801 55,139,731 49,310,539 47,973,435 Culture & Recreation 7,435,735 7,275,087 6,239,090 5,008,612 Community development 6,316,004 5,318,490 2,320,762 2,738,989 Health & Welfare 3,622,207 3,810,863 2,078,421 2,358,748 Storm water 3,000,734 2,862,544 2,982,143 2,846,107 8,982,318 8,785,674 8,982,318 8,712,619 Tax increment financing 14,273,775 14,281,820 13,045,284 13,006,209 Total $ 127,666,368 124,128,241 97,316,074 96,098,104 General government and interest on long-term debt
Net Cost of City of Independence's Governmental Activities Total Cost of Services Net Cost of Services
Table MD-3
As noted in Table MD-3 expenses from Governmental activities for fiscal year 2014 were $127.7 million. However, the net costs of these services were $97.3 million. The difference represents direct revenues received from charges for services of $15.9 million, operating grants and contributions of $10.7 million, and capital grants and contributions of $3.8 million. Taxes and other revenues of $73.5 million were collected to cover these net costs.
Business-type Activities
Revenues of the City’s Business-type activities increased $17.8 million or 9.1% and expenses increased $9.0 million or 4.9%. This change in revenues is primarily the result of scheduled rate increases and favorable weather conditions for the electric and water utilities Fluctuations in weather for the electric and water utilities impact both the revenues and expenses of these utilities.
FINANCIAL ANALYSIS OF THE CITY’S FUNDS
As the City completed the year, its Governmental funds reported a combined fund balance of $43.6 million. The fund balance of the TIF Debt Service Fund increased $149,428 during fiscal year 2014. The fund balance of the General Fund increased $3.0 million during fiscal year 2014. The unassigned portion of the General Fund’s fund balance increased $3.0 million. Fund balance of the General Fund was impacted by several of the financial highlights pointed out earlier, as well as the following:
Position vacancies continued to be managed with the intent of controlling termination and recruitment costs.
Sales tax revenue continued to reflect the direction of the economy and is affected by retail development in other communities within our primary trade area.
Mild weather during the winter period and lower cost of fuel impacted natural gas and electric franchise taxes and payments in-lieu of taxes.
The Business-type funds reported a combined net position of $318.1 million. The net position of the Power and Light fund increased $777,317, the Water fund increased $5.3 million, the Sewer fund decreased $287,255, and the Events Center fund decreased $1.4 million. Net position was impacted by several of the financial highlights pointed out earlier, as well as the following:
During fiscal year 2014 the Water fund had a rate increase that will go towards capital project and maintenance activities.
The lagging growth in sales tax revenues due to the struggling economy has impacted the Events Center Community Improvement District sales tax revenues which are used to cover the debt service and depreciation expenses for the Events Center.
General Fund Budgetary Highlights
Resources available for appropriation increased $49,635 from the original estimate. Actual revenues at the end of the year were more than projected by $810,054. The largest variance was in the area of taxes and payments in lieu of taxes, which were $1.2 million below estimated A large variance also occurred in the area of other revenues, which were $2.3 million above estimated
Over the course of the fiscal year, the Council revised the City budget several times. Appropriations were increased $831,704 in the General Fund. These budget amendments generally fall into the following categories:
18
CITY OF INDEPENDENCE, MISSOURI Management’s Discussion and Analysis June 30, 2014
CITY OFINDEPENDENCE, MISSOURI Management’s Discussion and Analysis June 30, 2014
Approval of new grants or the extension of current grants that was not previously included in the approved budget. These adjustments generally also include offsetting revenues.
Transfer of previously approved salary and benefit appropriations to operating departments where expenditures occur when the actual distribution of the expenditure could not be anticipated at the time that the appropriation was originally approved.
Increase or decrease appropriations for unanticipated events, including overtime costs, which may arise throughout the fiscalyear.
Actualexpenditures, including encumbrances, were $1.4 million less than the amount appropriated, representing operating savings of 1.9%. This was largely the result of an intentionalunder-spending of the budget by means of delaying capital expenditures and the filling of vacant positions to offset projected declining revenues and fund balance reserves.
CAPITAL ASSETAND DEBT ADMINISTRATION
Capital Assets
At the end of fiscal year 2014, the City had invested $883.8 million in a broad range of capitalassets, including police and fire equipment, buildings, park facilities, and electric, water and sewer systems. Assets increased $45.2 million or 5.4% during the period.
The budget for fiscalyear 2015 projects the City will spend an additional $25.5 million for capital projects. The largest category at $12.0 million is improvements to the City’s Power and Light system.
Additional information regarding capital assets can be found in the ‘Notes to FinancialStatements’, Note (6), of this report.
19
Total Percentage Change 2014 2013 2014 2013 2014 2013 2013-2014 Land&landimp $ 38,363,024 37,424,070 12,163,413 11,353,398 50,526,437 48,777,468 3.59% Buildings& Improvements 65,854,001 67,049,147 — — 65,854,001 67,049,147 -1.78% Officefurniture& equipment 18,856 39,604 — — 18,856 39,604 -52.39% Computerequipment 1,105,765 1,449,829 — — 1,105,765 1,449,829 -23.73% Mobileequipment 7,185,373 5,642,876 — — 7,185,373 5,642,876 27.34% Otherequipment 3,490,577 3,875,854 12,128,451 11,484,512 15,619,028 15,360,366 1.68% Infrastructure 206,339,142 212,514,774 433,448,005 438,626,147 639,787,147 651,140,921 -1.74% Constructioninprogress 16,191,630 14,319,132 87,468,611 34,803,107 103,660,241 49,122,239 111.03% Total $ 338,548,368 342,315,286 545,208,480 496,267,164 883,756,848 838,582,450 5.39%
Total Governmental Activities Business-Type Activities (net
TableMD-4 CityofIndependence'sCapitalAssets
ofdepreciation)
Debt Administration
CITY OFINDEPENDENCE, MISSOURI Management’s Discussion and Analysis
June 30, 2014
The City at the end of fiscal year 2014 had a total of $512.2 million of outstanding obligations. This was an increase of $41.9 million or 8.9% from the previous fiscal year. None of these amounts relate to general obligations of the City and $342.8 million or 66.9% are obligations of the Business-type activities.
Additional information regarding debt can be found in the ‘Notes to Financial Statements’ section, Note (7), of this report.
Economic Factors
In the last five years the City, as a community, gained 4,615 jobs, with current totalemployment at 53,739 jobs. Unemployment by mid-2014 was 6.8%; this is lower than Jackson County at 7.7% and higher than the State at 6.7%. Average household income for 2014 is estimated to be $53,310, compared to $62,828 for the State as a whole.
Contacting the City’s Financial Management
This financial report is designed to provide our citizens, taxpayers, customers, investors and creditors with a general overview of the City’s finances and to demonstrate the City’s accountability for the money it receives. Questions concerning this report or requests for additional information should be directed to Brian C. Watson, Director of Finance, City of Independence, P.O. Box 1019, Independence, MO 64051.
20
Total Percentage Change 2014 2013 2014 2013 2014 2013 2013-2014 Loansandbonds payable $ 3,419,255 4,838,746 342,793,093 296,937,015 346,212,348 301,775,761 14.73% TIFloanspayable 164,262,050 166,533,228 — — 164,262,050 166,533,228 -1.36% Capitallease obligations 1,226,414 1,407,347 — — 1,226,414 1,407,347 -12.86% Neighborhood ImprovemtDistrict 453,477 528,423 — — 453,477 528,423 -14.18% Total $ 169,361,196 173,307,744 342,793,093 296,937,015 512,154,289 470,244,759 8.91%
TableMD-5
Governmental Activities Business-type Activities Total
CityofIndependence'sOutstandingDebt
Exhibit1
StatementofNetPosition June30,2014 GovernmentalBusiness-Type Activities Activities Total Assets: Currentassets: Pooledcashandinvestments $ 22,433,739 74,636,567 97,070,306 Receivables: Taxes 8,420,679 959,989 9,380,668 Accounts 779,452 13,858,466 14,637,918 Unbilledrevenue — 13,418,128 13,418,128 Specialassessmentprincipal 1,838,269 159,048 1,997,317 Internalbalances 2,465,224 (2,465,224) — Duefromothergovernments 3,012,222 284,555 3,296,777 Salestaxbond — 1,570 1,570 Inventory 102,578 12,162,003 12,264,581 Prepaiditems 49,190 299,101 348,291 Restrictedcashandinvestments — 4,057,316 4,057,316 Totalcurrentassets 39,101,353 117,371,519 156,472,872 Noncurrentassets: Capitalassets: Nondepreciable 47,897,389 99,632,024 147,529,413 Depreciable,net 290,650,979 445,576,456 736,227,435 Goodwill — 999,203 999,203 Otherassets — 3,744 3,744 Restrictedcashandinvestments 19,645,947 40,832,028 60,477,975 Totalnoncurrentassets 358,194,315 587,043,455 945,237,770 Totalassets 397,295,668 704,414,974 1,101,710,642 Deferredoutflowsofresources: Deferredchargeonrefunding 3,319,709 10,801,595 14,121,304 Totaldeferredoutflowsofresources 3,319,709 10,801,595 14,121,304 $400,615,377 715,216,569 1,115,831,946 LiabilitiesandNetPosition Currentliabilities:
Totalassets&deferredoutflowsofresources Accountsandcontractspayable $ 1,827,840 12,830,724 14,658,564 Accrueditems 5,840,714 2,603,702 8,444,416 Othercurrentliabilities 426,290 284,794 711,084 Unearnedrevenue 454,810 486,706 941,516 Currentportionoflong-termobligations 14,353,304 11,862,320 26,215,624 Self-insuranceclaimspayable 3,964,127 — 3,964,127 Liabilitiespayablefromrestrictedassets 176,229 5,495,312 5,671,541 Totalcurrentliabilities 27,043,314 33,563,558 60,606,872 Noncurrentliabilities: Noncurrentportionoflong-termobligations 198,846,740 338,920,498 537,767,238 Self-insuranceclaimspayable 2,416,679 — 2,416,679 Otherpost-employmentbenefits 49,902,029 23,287,986 73,190,015 Netpensionobligation 5,448,551 3,210,017 8,658,568 Advancesforconstruction — 214,927 214,927 Totalnoncurrentliabilities 256,613,999 365,633,428 622,247,427 Totalliabilities 283,657,313 399,196,986 682,854,299 Netposition: Netinvestmentincapitalassets 333,902,700 240,517,938 574,420,638 Restrictedfor: Publicsafety 3,235,081 — 3,235,081 Publicworks 5,016,202 — 5,016,202 Stormwater 8,267,224 — 8,267,224 Generalgovernment 30,842 — 30,842 Debtservice 182,322 13,531,074 13,713,396 Worker'scompensationescrow 200,000 — 200,000 DogwoodSPPescrow — 61,500 61,500 SouthwestPowerPoolcollateral — 831,040 831,040 Communityimprovementdistrict — 1,865,133 1,865,133 Unrestricted(deficit) (233,876,307) 59,212,898 (174,663,409) Totalnetposition 116,958,064 316,019,583 432,977,647 $400,615,377 715,216,569 1,115,831,946
CITYOFINDEPENDENCE,MISSOURI
PrimaryGovernment
21
Seeaccompanyingnotestofinancialstatements. Totalliabilitiesandnetposition
See accompanying notes to financial statements
CITY OF INDEPENDENCE, MISSOURI Statement of Activities
Year ended June 30, 2014
Exhibit 2
OperatingCapital Charges forGrants andGrants andNet (Expense) Functions/ProgramsExpensesServicesContributionsContributionsRevenue Primary government: Governmental activities: Administrative services $9,096,123 6,904,917 16,440 — (2,174,766) Public safety 56,859,801 5,154,144 2,310,547 84,571 (49,310,539) Public works18,079,671 401,793 4,341,250 3,153,877 (10,182,751) Health and welfare 3,622,207 758,211 745,254 40,321 (2,078,421) Culture and recreation 7,435,735 613,238 106,772 476,635 (6,239,090) Community development 6,316,004 1,089,720 2,905,522 — (2,320,762) Storm water 3,000,734 — 4,648 13,943 (2,982,143) General government 8,730,105 — — — (8,730,105) Tax increment financing 14,273,775 978,491 250,000 — (13,045,284) Interest on long-term debt 252,213 — — — (252,213) Total governmental activities127,666,368 15,900,514 10,680,433 3,769,347 (97,316,074) Business-type activities: Power and light 138,801,854 138,813,984 — 438,026 450,156 Water 22,140,775 27,545,623 — 1,948,485 7,353,333 Sewer 19,015,060 21,471,299 — — 2,456,239 Events center 10,859,704 3,359,318 — — (7,500,386) Total business-type activities190,817,393 191,190,224 — 2,386,511 2,759,342 Total primary government$318,483,761 207,090,738 10,680,433 6,155,858 (94,556,732) GovernmentalBusiness-Type ActivitiesActivitiesTotal Changes in net position: Net (expense) revenue $(97,316,074) 2,759,342 (94,556,732) General revenues: Taxes Property taxes 7,993,199 — 7,993,199 Sales and use taxes 41,142,183 5,397,059 46,539,242 Intergovernmental activity taxes 10,809,061 — 10,809,061 Franchise taxes 10,292,488 — 10,292,488 Financial institutions tax 19,381 — 19,381 Investment earnings 302,394 45,754 348,148 Special items - litigation settlement 2,203,430 12,796,570 15,000,000 Miscellaneous 695,896 1,660,835 2,356,731 Transfers in (out)18,804,684 (18,804,684) — Total general revenues, special items and transfers 92,262,716 1,095,534 93,358,250 Change in net position(5,053,358) 3,854,876 (1,198,482) Net position (deficit), beginning122,011,422 312,164,707 434,176,129 Net position (deficit), ending$116,958,064 316,019,583 432,977,647
22
Exhibit3
GovernmentalFunds June30,2014 Nonmajor Total TIF Governmental Governmental Assets General DebtService Funds Funds Pooledcashandinvestments $ 2,564,419 6,499,701 9,272,651 18,336,771 Receivables: Taxes 4,347,951 330,304 3,742,424 8,420,679 Accounts,net 214,138 396,063 25,906 636,107 Specialassessmentprincipal 817,961 — 1,020,308 1,838,269 Duefromotherfunds 1,801,854 2,609,401 5,478,181 9,889,436 Duefromothergovernments 729,770 470,554 1,811,898 3,012,222 Prepaiditems 14,141 — — 14,141 Restrictedassets 176,229 19,041,460 228,258 19,445,947 Totalassets $ 10,666,463 29,347,483 21,579,626 61,593,572 Liabilities: Accountsandcontractspayable $ 646,726 719 1,096,500 1,743,945 Duetootherfunds — 2,610,574 6,848,926 9,459,500 Accrueditems 3,254,400 — 157,990 3,412,390 Othercurrentliabilities 423,981 — 2,309 426,290 Unearnedrevenue 2,000 — 452,810 454,810 Liabilitiespayablefromrestrictedassets: Depositsandcourtbonds 176,229 — — 176,229 Totalliabilities 4,503,336 2,611,293 8,558,535 15,673,164 Deferredinflowsofresources: Unavailablerevenue-specialassessments 817,961 — 1,020,308 1,838,269 Unavailablerevenue-realestatetaxes 500,770 20,627 — 521,397 Totaldeferredinflowsofresources 1,318,731 20,627 1,020,308 2,359,666 Fundbalances: Nonspendable 14,141 — — 14,141 Restricted 402,899 27,654,533 17,024,939 45,082,371 Committed 437,083 — 204,117 641,200 Assigned 398,283 — — 398,283 23 Unassigned 3,591,990 (938,970) (5,228,273) (2,575,253) Totalfundbalance 4,844,396 26,715,563 12,000,783 43,560,742 $ 10,666,463 29,347,483 21,579,626 61,593,572
Totalliabilities,deferredinflowsof resourcesandfundbalance
CITYOFINDEPENDENCE,MISSOURI BalanceSheet
Seeaccompanyingnotestofinancialstatements.
CITYOFINDEPENDENCE,MISSOURI
currentperiodandthereforearenotreportedinthefunds
Exhibit3.1
ReconciliationoftheGovernmentalFundsBalanceSheet totheStatementofNetPosition June30,2014 Fundbalances–totalgovernmentalfunds $ 43,560,742 Capitalassetsusedingovernmentalactivitiesarenotfinancialresourcesand thereforearenotreportedinthefunds: Governmentalcapitalassets 562,673,324 Lessaccumulateddepreciation (224,245,185) 338,428,139 Interestonlong-termdebtisnotaccruedingovernmentalfundsbut,rather, isrecognizedasexpenditurewhenpaid (2,391,114) Adjustmentofdeferredinflowsofresources 2,359,666 InternalServiceFundsareusedbymanagementtochargethecostsofcertain
areincludedinthegovernmentalactivitiesinthestatementofnetposition (572,836) Long-termliabilities,includingbondspayablearenotdueandpayableinthe
Loanspayable/NIDpayable (168,969,000) Capitalleaseobligations (1,226,414) Compensatedabsences (15,422,570) Discounts(premiums) 834,218 Deferredchargeonrefunding 3,319,709 Otherpost-employmentbenefits (49,283,406) 24 Netpensionobligation (5,390,847) Unreimbursedcertifiedcosts-TIF (28,288,223) (264,426,533) Netpositionofgovernmentalactivities(Exhibit1) $116,958,064 Seeaccompanyingnotestofinancialstatements.
activitiestoindividualfunds.TheassetsandliabilitiesoftheInternalServiceFunds
Exhibit4
GovernmentalFunds YearendedJune30,2014 TIF Nonmajor Total General DebtService Funds Funds Revenues: Taxes $ 34,855,329 14,482,514 21,042,734 70,380,577 Licensesandpermits 3,273,979 — 190,652 3,464,631 Intergovernmental 5,157,129 — 8,515,401 13,672,530 Chargesforservices 1,940,920 — 758,893 2,699,813 Interfundchargesforsupportservices 3,987,029 — — 3,987,029 Fines,forfeitures,andcourtcosts 4,790,383 — — 4,790,383 Investmentincome 103,750 148,345 7,813 259,908 Developercontributions — 250,000 — 250,000 Other 561,577 1,088,115 795,681 2,445,373 Totalrevenues 54,670,096 15,968,974 31,311,174 101,950,244 Expenditures: Current: Administrativeservices 7,531,167 — 16,190 7,547,357 Publicsafety 42,957,720 — 6,135,857 49,093,577 Publicworks 5,600,032 — 299,628 5,899,660 Healthandwelfare 2,545,057 — 777,709 3,322,766 Cultureandrecreation 1,485,924 — 4,261,904 5,747,828 Communitydevelopment 3,026,831 — 2,980,621 6,007,452 Stormwater — — 1,686,782 1,686,782 Generalgovernment 7,669,464 — 19,062 7,688,526 Taxincrementfinancing — 2,886,495 — 2,886,495 Capitaloutlay 293,549 — 12,002,811 12,296,360 Debtservice: Principal 179,009 5,872,642 1,563,051 7,614,702 Interestandfiscalagentfees 37,816 8,563,381 243,789 8,844,986 Debtissuancecosts — 201,254 — 201,254 Totalexpenditures 71,326,569 17,523,772 29,987,404 118,837,745 Excess(deficiency)ofrevenuesover expenditures (16,656,473) (1,554,798) 1,323,770 (16,887,501) Otherfinancingsources(uses): 25 Debtissuance — 6,885,000 96,126 6,981,126 Reofferingpremium/originalissuediscount — 74,056 — 74,056 Paymenttorefundedloansescrowagent — (6,982,279) — (6,982,279) Transfersin–utilitypaymentsinlieuoftaxes 18,144,063 — — 18,144,063 Transfersin — 1,732,384 897,947 2,630,331 Transfersout (720,679) (4,935) (1,244,095) (1,969,709) Totalotherfinancingsources(uses) 17,423,384 1,704,226 (250,022) 18,877,588 Specialitems: Litigationsettlement 2,203,430 — — 2,203,430 Netchangeinfundbalances 2,970,341 149,428 1,073,748 4,193,517 Fundbalances,beginning 1,874,055 26,566,135 10,927,035 39,367,225 Fundbalances,ending $ 4,844,396 26,715,563 12,000,783 43,560,742 Seeaccompanyingnotestofinancialstatements.
CITYOFINDEPENDENCE,MISSOURI StatementofRevenues,Expenditures,andChangesinFundBalances
CITYOFINDEPENDENCE,MISSOURI
Amountsreportedforgovernmentalactivitiesinthestatementofactivitiesare differentbecause:
Governmentalfundsreportcapitaloutlaysasexpenditures.However,in thestatementofactivities,thecostofthoseassetsisallocatedover theirestimatedusefullivesasdepreciationexpense.Thisistheamount bywhichcapitaloutlaysexceededdepreciationinthecurrentperiod:
Theproceedsfromthesaleofcapitalassetsarereportedasrevenueinthe governmentalfunds.However,thecostoftheassetsanddepreciationis removedfromthecapitalassetsaccountinthestatementofnetpositionand offsetagainsttheproceeds,resultinginagainonthesaleofcapitalassetsinthe statementofactivities.Morerevenueisreportedinthegovernmentalfunds thangaininthestatementofactivities:
Bondproceedsprovidecurrentfinancialresourcestogovernmentalfunds, butissuingdebtincreaseslong-termliabilitiesinthestatementofnetposition. Repaymentofbondprincipalisanexpenditureinthegovernmentalfunds, buttherepaymentreduceslong-termliabilitiesinthestatementofnetposition. Thisistheamountbywhichproceedsexceededrepayments.Also, governmentalfundsreporttheeffectofissuancecosts,premiums,discounts, andsimilaritemswhendebtisfirstissued,whereastheseamountsaredeferred andamortizedinthestatementofactivities.Thisamountistheneteffectof
thesedifferencesinthetreatmentoflong-termdebtandrelateditems:
Someexpensesreportedinthestatementofactivitiesdonotrequiretheuseof currentfinancialresourcesandthereforearenotreportedasexpendituresinthe governmentalfunds:
InternalServiceFundsareusedbymanagementtochargethecostsofcertain activities,suchasinsuranceandgaragecharges,toindividualfunds.Thenet expenseoftheinternalservicefundsisreportedwiththegovernmentalactivities:
Exhibit4.1
Netchangeinfundbalances–totalgovernmentalfunds
4,193,517
ReconciliationoftheGovernmentalFundsStatementofRevenues,Expenditures,andChanges inFundBalancestotheStatementofActivities YearendedJune30,2014
$
Capitaloutlay 15,305,872 Depreciationexpense (18,945,810) (3,639,938)
Bookvalueofassetsdisposed (123,080) Revenuesinthestatementofactivitiesthatdonotprovidecurrentfinancial resourcesarenotreportedasrevenuesinthefunds (270,903)
26
Proceedsfromdebtissuance (6,885,000) Reofferingpremium/originalissuediscount (74,056) Paymenttorefundedloansescrowagent 6,982,279 Principalpayments 7,522,060 Debtpremiums,discounts&deferredrefundingamortizations (182,899) Capitalleaseproceeds (96,126) 7,266,258
Compensatedabsences (124,835) Accruedinterest (142,436) Otherpost-employmentbenefits (7,708,421) LAGERSnetpensionobligation (963,251) Unreimbursedcertifiedcosts-TIF (2,145,839) (11,084,782)
(1,394,430) Changeinnetpositionofgovernmentalactivities(Exhibit2) $ (5,053,358)
Seeaccompanyingnotestofinancialstatements.
Exhibit5
StatementofNetPosition ProprietaryFunds June30,2014 Enterprisefunds Governmental Activities Powerand Sanitary Events InternalService Assets Light Water Sewer Center Total Funds Currentassets: Pooledcashandinvestments $ 48,585,776 10,792,645 13,431,245 1,826,901 74,636,567 4,096,968 Receivables: Taxes — — — 959,989 959,989 — Accounts(netofallowanceof$1,090,064) 9,988,640 2,276,992 1,505,126 87,708 13,858,466 143,345 Unbilledrevenue 10,972,650 1,320,836 1,124,642 — 13,418,128 — Specialassessmentprincipal 158,135 — 913 — 159,048 — Duefromothergovernments 284,555 — — — 284,555 — Salestaxbond — — — 1,570 1,570 — Inventory 11,442,057 643,928 69,290 6,728 12,162,003 102,578 Prepaiditems 263,869 — — 35,232 299,101 35,049 Restrictedcashandinvestments 2,972,003 584,466 500,847 — 4,057,316 — Totalcurrentassets 84,667,685 15,618,867 16,632,063 2,918,128 119,836,743 4,377,940 Noncurrentassets: Capitalassets: Nondepreciable 15,651,951 3,640,570 74,543,188 5,796,315 99,632,024 93,979 Depreciable,net 214,580,290 105,090,296 65,572,555 60,333,315 445,576,456 26,250 Goodwill — — — 999,203 999,203 — Otherassets — 3,744 — — 3,744 — Restrictedcashandinvestments 15,901,118 4,133,048 13,488,035 7,309,827 40,832,028 200,000 Totalnoncurrentassets 246,133,359 112,867,658 153,603,778 74,438,660 587,043,455 320,229 Totalassets 330,801,044 128,486,525 170,235,841 77,356,788 706,880,198 4,698,169 Deferredoutflowsofresources: Deferredchargeonrefunding 2,166,341 1,535,486 — 7,099,768 10,801,595 — Totaldeferredoutflowsofresources 2,166,341 1,535,486 — 7,099,768 10,801,595 — Totalassets&deferredoutflowsofresources $332,967,385 130,022,011 170,235,841 84,456,556 717,681,793 4,698,169 LiabilitiesandNetPosition Currentliabilities: Accountsandcontractspayable $ 5,227,367 652,627 6,697,501 253,229 12,830,724 83,895 Duetootherfunds — — — 429,936 429,936 — Accrueditems 1,665,306 381,238 545,086 12,072 2,603,702 37,210 Othercurrentliabilities 225,349 26,968 32,477 — 284,794 — Unearnedrevenue — — — 486,706 486,706 — Currentportionoflong-termobligations 5,169,353 4,671,677 1,301,290 720,000 11,862,320 54,687 27 Self-insuranceclaimspayable — — — — — 3,964,127 Liabilitiespayablefromrestrictedassets 2,552,009 803,423 1,103,394 1,036,486 5,495,312 — Totalcurrentliabilities 14,839,384 6,535,933 9,679,748 2,938,429 33,993,494 4,139,919 Noncurrentliabilities: Revenuebondspayable 128,232,433 34,836,307 80,056,566 90,437,787 333,563,093 — Compensatedabsences–long-term 3,819,641 969,689 568,075 — 5,357,405 73,368 Otherpostemploymentbenefits 13,564,849 5,405,852 4,317,285 — 23,287,986 618,623 Netpensionobligation 2,271,938 555,208 382,871 — 3,210,017 57,704 Self-insuranceclaimspayable — — — — — 2,416,679 Advancesforconstruction 110,105 104,822 — — 214,927 — Totalnoncurrentliabilities 147,998,966 41,871,878 85,324,797 90,437,787 365,633,428 3,166,374 Totalliabilities 162,838,350 48,407,811 95,004,545 93,376,216 399,626,922 7,306,293 Netposition: Netinvestmentincapitalassets 104,108,431 74,833,093 72,532,212 (10,955,798) 240,517,938 120,229 Restrictedfor: Debtservice/capitaloutlay 12,693,837 500,000 — 337,237 13,531,074 — Workerscompensationescrow — — — — — 200,000 DogwoodSPPescrow 61,500 — — — 61,500 — SouthwestPowerPoolcollateral 831,040 — — — 831,040 — Communityimprovementdistrict — — — 1,865,133 1,865,133 — Unrestricted 52,434,227 6,281,107 2,699,084 (166,232) 61,248,186 (2,928,353) Totalnetposition(deficit) 170,129,035 81,614,200 75,231,296 (8,919,660) 318,054,871 (2,608,124) $332,967,385 130,022,011 170,235,841 84,456,556 4,698,169 Adjustmenttoreflecttheconsolidationofinternal servicefundactivitiesrelatedtoenterprisefunds (2,035,288) Netpositionofbusiness-typeactivities $316,019,583 Seeaccompanyingnotestofinancialstatements. Totalliabilitiesandnetposition
CITYOFINDEPENDENCE,MISSOURI
Exhibit6
ProprietaryFunds YearendedJune30,2014 Enterprisefunds Governmental Activities Powerand Sanitary Events InternalService Light Water Sewer Center Total Funds Operatingrevenues: Chargesforservices $ 136,704,602 27,176,061 21,239,944 3,359,318 188,479,925 26,369,901 Salestax — — — 5,397,059 5,397,059 — Miscellaneous 2,109,382 369,562 231,355 — 2,710,299 — Totaloperatingrevenues 138,813,984 27,545,623 21,471,299 8,756,377 196,587,283 26,369,901 Operatingexpenses: Personalservices 25,550,145 7,226,458 5,647,281 — 38,423,884 876,228 Otherservices 20,430,755 4,788,482 8,101,014 — 33,320,251 27,728,793 Supplies 55,286,184 1,966,472 1,088,328 — 58,340,984 1,197,417 Capitaloutlay 1,660 47,746 — — 49,406 — Otherexpenses 8,064,083 3,683,432 106,012 4,492,068 16,345,595 — Depreciationandamortization 18,775,454 3,236,330 2,734,074 1,891,143 26,637,001 3,900 Totaloperatingexpenses 128,108,281 20,948,920 17,676,709 6,383,211 173,117,121 29,806,338 Operatingincome(loss) 10,705,703 6,596,703 3,794,590 2,373,166 23,470,162 (3,436,437) Nonoperatingrevenues(expenses): Interestrevenue 29,439 3,532 6,861 5,922 45,754 5,807 Miscellaneousrevenue 777,883 1,825,363 23,096 740,501 3,366,843 1,411,456 Miscellaneousexpense (5,245,942) — — — (5,245,942) — Interestandamortizationexpense (5,130,214) (2,184,807) (1,744,079) (4,476,493) (13,535,593) — Totalnonoperatingrevenue(expenses) (9,568,834) (355,912) (1,714,122) (3,730,070) (15,368,938) 1,417,263 1,136,869 6,240,791 2,080,468 (1,356,904) 8,101,224 (2,019,174) Capitalcontributions 438,026 1,948,485 — — 2,386,511 — Transfersout–utilitypaymentsinlieuoftaxes (13,368,096) (2,646,902) (2,129,065) — (18,144,063) — Transfersin — — 10,000 — 10,000 — Transfersout (226,052) (195,912) (248,658) — (670,622) — Specialitem-litigationsettlement 12,796,570 — — — 12,796,570 — Changeinnetposition 777,317 5,346,462 (287,255) (1,356,904) 4,479,620 (2,019,174) Totalnetposition(deficit): Beginningoftheyear 169,351,718 76,267,738 75,518,551 (7,562,756) (588,950) Endoftheyear $170,129,035 81,614,200 75,231,296 (8,919,660) (2,608,124) Income(loss)beforecontributions,transfersand specialitem 28 Adjustmenttoreflecttheconsolidationofinternal servicefundactivitiesrelatedtoenterprisefunds (624,744) Changeinnetpositionofbusiness-typeactivities $ 3,854,876 Seeaccompanyingnotestofinancialstatements.
CITYOFINDEPENDENCE,MISSOURI StatementofRevenues,Expenses,andChangesinFundNetPosition
Exhibit7
StatementofCashFlows ProprietaryFunds YearendedJune30,2014 Enterprisefunds Governmental Activities Powerand Sanitary Events InternalService Light Water Sewer Center Total Funds Cashflowsfromoperations: Receiptsfromcustomersandothers $ 140,454,791 29,245,727 20,579,750 9,480,751 199,761,019 28,036,204 Paymentstosuppliers (82,559,555) (10,229,930) (5,944,048) (4,334,889) (103,068,422) (28,978,811) Paymentstoemployees (22,679,973) (6,416,055) (4,601,645) — (33,697,673) (721,045) Paymentstootherfunds — — — 1,230 1,230 — Netcashprovidedby(usedin)operatingactivities 35,215,263 12,599,742 10,034,057 5,147,092 62,996,154 (1,663,652) Cashflowsfromnoncapitalfinancingactivities: Transfersin — — 10,000 — 10,000 — Transfersout–paymentsinlieuoftaxes (13,368,096) (2,842,814) (2,377,723) — (18,588,633) — Specialitem-litigationsettlementrevenues 12,796,570 — — — 12,796,570 — Specialitem-litigationsettlementexpenses (5,245,942) — — — (5,245,942) — Advancesto(from)otherfunds (226,052) — — — (226,052) — Netcash(usedin)noncapital financingactivities (6,043,520) (2,842,814) (2,367,723) — (11,254,057) — Cashflowsfromcapitalandrelatedfinancingactivities: Acquisitionandconstructionofcapitalassets (14,387,552) (466,351) (55,717,964) — (70,571,867) 1 Interestpaidonrevenuebondsandequipmentcontracts (5,853,306) (2,089,779) (1,761,223) (4,882,621) (14,586,929) — Debtexpensepaidonrevenuebonds 10,874 (1,050,695) — — (1,039,821) — Disposalcostsfromdispositionofequipment (579,483) — — — (579,483) — Proceedsfrombondissue 38,220,000 43,437,385 — 81,657,385 — Redemptionofrevenuebonds (5,015,000) (40,065,000) (745,000) — (45,825,000) — (25,824,467) (5,451,825) (14,786,802) (4,882,621) (50,945,715) 1 Cashflowsfrominvestingactivities: Interestoninvestments 26,541 3,532 6,861 5,922 42,856 5,807 Netcashprovidedbyinvestingactivities 26,541 3,532 6,861 5,922 42,856 5,807 Netincrease(decrease)incashandcashequivalents 3,373,817 4,308,635 (7,113,607) 270,393 839,238 (1,657,844) Cashandcashequivalentsatbeginningofyear 64,085,080 11,201,524 34,533,734 8,866,335 118,686,673 5,754,813 Cashandcashequivalentsatendofyear $ 67,458,897 15,510,159 27,420,127 9,136,728 119,525,911 4,096,969 Noncashcapitalandrelatedfinancingactivities: Contributedcapital $ 438,026 1,948,485 — 5,000 2,391,511 — Componentsofcashandshort-terminvestmentsatendoffiscalyear: Unrestrictedassets $ 48,585,776 10,792,645 13,431,245 1,826,901 74,636,567 4,096,969 Restrictedassets 18,873,121 4,717,514 13,988,882 7,309,827 44,889,344 200,000 Totalpooledcashandinvestments $ 67,458,897 15,510,159 27,420,127 9,136,728 119,525,911 4,296,969 Netcashprovidedby(usedin)capitalandrelatedfinancingactivities 29 Reconciliationofoperatingincome(loss)tonetcashprovided (used)byoperatingactivities: Operatingincome(loss) $ 10,705,703 6,596,703 3,794,590 2,373,166 23,470,162 (3,436,437) Depreciationandamortization 18,775,454 3,236,330 2,734,074 1,891,143 26,637,001 3,900 Miscellaneousrevenue 777,883 1,825,363 (976,904) 740,501 2,366,843 1,411,456 Changeinassetsandliabilities: Accountsreceivable 719,084 (113,556) 176,234 (165,171) 616,591 254,847 Inventory 1,063,656 30,547 (12,052) 39,062 1,121,213 78,203 Prepaiditemsandotherassets (29,086) — — 8,498 (20,588) (35,049) Unbilledrevenue 40,387 (9,027) (90,879) — (59,519) — Duefromothergovernments 90,016 — — — 90,016 — Specialassessmentsreceivable 13,437 — — — 13,437 — Accountsandcontractspayable (38,840) 227,735 2,954,593 164,463 3,307,951 38,745 Internalbalances — — — 1,230 1,230 — Accruedandotherliabilities 163,440 (4,756) 47,273 (49,966) 155,991 (154,515) Otherpost-employmentbenefits&netpensionobligation 2,692,320 856,269 1,093,232 — 4,641,821 123,114 Self-insuranceclaimspayable — — — — — 31,440 Deferredrevenue — — — 149,044 149,044 — Customerdeposits 156,672 — 375,132 (4,878) 526,926 — Compensatedabsences 85,137 (45,866) (61,236) — (21,965) 20,644 Totaladjustments 24,509,560 6,003,039 6,239,467 2,773,926 39,525,992 1,772,785 Netcashprovided(used)byoperatingactivities $ 35,215,263 12,599,742 10,034,057 5,147,092 62,996,154 (1,663,652) Seeaccompanyingnotestofinancialstatements. Adjustmentstoreconcileoperatingincome(loss)tonetcashprovided(used) byoperatingactivities:
CITYOFINDEPENDENCE,MISSOURI
Seeaccompanyingnotestofinancialstatements.
Exhibit8
FiduciaryFunds June30,2014 PrivatePurpose Agency TrustFunds Funds Assets: Pooledcashandinvestments $ 19,690 142,044 Accruedinterestreceivable — 490 Totalassets 19,690 142,534 Liabilities: Accountsandcontractspayable 2,074 6,207 Fundsheldinescrow 812 48,016 Flexiblebenefitpayable — 88,311 Totalliabilities 2,886 $ 142,534 Netposition: Heldintrust $ 16,804
CITYOFINDEPENDENCE,MISSOURI StatementofFiduciaryNetPosition
30
Seeaccompanyingnotestofinancialstatements.
Exhibit9 CITYOFINDEPENDENCE,MISSOURI StatementofChangesinFiduciaryNetPosition FiduciaryFunds YearendedJune30,2014 PrivatePurpose TrustFunds Additions: Chargesforservices $ 14,454 Interest 11 Totaladditions 14,465 Deductions: Preservationandmaintenanceexpense 22,595 Totaldeductions 22,595 Changeinnetposition (8,130) Netposition,beginning 24,934 Netposition,ending $ 16,804
31
CITY OF INDEPENDENCE, MISSOURI Index to Notes to Financial Statements June 30, 2014 32 (1) Summary of Significant Accounting Policies.............................................................................................34 (a) The Financial Reporting Entity...............................................................................................................34 (b) Basis of Presentation 35 (c) Basis of Accounting................................................................................................................................36 (d) Accounts Receivable 37 (e) Investments 37 (f) Inventory.................................................................................................................................................37 (g) Prepaid Items 37 (h) Interfund Activity....................................................................................................................................37 (i) Capital Assets 38 (j) Bond Premiums/Discounts, and Issuance Costs 39 (k) Deferred Inflows/Outlflows....................................................................................................................40 (l) Compensated Absences 40 (m) Fund Balances.........................................................................................................................................40 (n) Net Position 41 (o) Statement of Cash Flows.........................................................................................................................42 (p) Use of Estimates......................................................................................................................................42 (q) New Accounting Pronouncements 42 (2) Deposits and Investments............................................................................................................................43 (3) Tax Revenue 45 (4) Intergovernmental Revenue and Receivables.............................................................................................46 (5) Interfund Activity........................................................................................................................................48 (a) Interfund Balances 48 (b) Interfund Charges for Support Services..................................................................................................48 (c) Payments in Lieu of Taxes 49 (d) Interfund Transfers 49
Index to Notes to Financial Statements June 30, 2014 33 (6) Capital Assets..............................................................................................................................................50 (7) Long-Term Obligations...............................................................................................................................56 (a) Governmental activities 59 (1) Loans Payable........................................................................................................................................59 (2) Neighborhood Improvement District 59 (3) Capital Lease Obligations 60 (4) Blended component unit........................................................................................................................61 (a) Tax Increment Financing Loans and Developer Obligations 61 (1) Tax Increment Financing Refunding...........................................................................................63 (2) Tax Increment Financing Prior Year Defeasance of Debt 64 (b) Bass Pro Lease 64 (b) Business-type Activities..........................................................................................................................66 (1) Revenue Bonds 66 (a) Advance Refunding...........................................................................................................................67 (a) Pledged Revenues 68 (2) Events Center Bonds..............................................................................................................................68 (8) Advances for Construction............................................................................................................................69 (9) Employee Retirement System 69 (10) Post-Employment Health Benefits..............................................................................................................71 (11) Risk Management 74 (12) Commitments..............................................................................................................................................75 (13) Deficits........................................................................................................................................................77 (14) Special Item 77 (15) Fund Balance...............................................................................................................................................78
CITY OF INDEPENDENCE, MISSOURI
CITY OF INDEPENDENCE, MISSOURI
Notes to Financial Statements
June 30, 2014
(1) Summary of Significant Accounting Policies
The City of Independence, Missouri (the City) was incorporated in 1849 and covers an area of approximately 79 square miles in Jackson County, Missouri. The City is a charter city and operates under the City Council/City Manager form of government. The City Manager is the chief administrative officer of the City. The City provides services to residents in many areas, including law enforcement, fire protection, electrical, water and sewer services, community enrichment and development, recreation and various social services. Elementary, secondary and junior college education services are provided by various school districts, all of which are separate governmental entities.
The accounting and reporting policies of the City conform to accounting principles generally accepted in the United States of America (GAAP) applicable to local governments. The following is a summary of the more significant accounting and reporting policies and practices of the City.
(a) The Financial Reporting Entity
In evaluating how to define the government for financial reporting purposes, management has considered all potential component units. Component units are separate legal entities which are included in the primary government’s financial report. The decision to include a potential component unit in the reporting entity was made by applying the criteria set forth in GAAP. The basic, but not only, criterion for including a potential component unit within the reporting entity is the City’s financial accountability for the potential component unit. An entity is considered a component unit if City officials appoint a voting majority of the component unit’s governing body and the City is able to impose its will upon the component unit. Additionally, if the entity provides specific financial benefits to or imposes specific financial burdens on the City, it may be considered a component unit.
This report includes the financial statements of the City (the primary government) which includes the Independence Events Center Management Corporation (Corporation) as a blended component unit. The Corporation performs management functions for the City's Events Center, a propriety fund. Financial statements for the Corporation may be obtained by writing to the City Clerk, City of Independence, P. O. Box 1019, Independence, MO 64051.
The Events Center Community Improvement District (CID) and Crackerneck Creek Transportation Development District (TDD) are included in the financial statements of the City as blended component units. The TDD and CID account for the taxes that are collected within these districts, and they provide services exclusively for the City as the taxes collected by these districts are utilized to repay outstanding debt The TDD is governed by a 5-member board, appointed by property owners within the district. The City as a property owner appoints three members which are City employees. The CID is governed by a 5member board, of which three are City employees appointed by the City Council. The CID is reported as a blended component unit in the Events Center fund and the TDD is reported as a blended component unit in the TIF Debt Service fund. Financial statements for the TDD and CID may be obtained by writing to the City Clerk, City of Independence, P.O. Box 1019, Independence, MO 64051.
The Tax Increment Financing (TIF) Commission of the City of Independence, Missouri (the Commission) is a blended component unit under the Debt Service Fund category of the City because the outstanding debt of the TIF commission is expected to be repaid from payments in lieu of taxes and economic activity taxes collected by the City. The Commission is governed by an 11-member board, of which six members are appointed by the City Council. The remaining five members (two from the county, two from the local
34
CITY OF INDEPENDENCE, MISSOURI
Notes to Financial Statements
June 30, 2014
school district and one from other taxing jurisdictions) are appointed by the respective taxing districts’ boards. Financial transactions of the Commission are processed by the Finance Department of the City on the Commission’s behalf. No separate financial statements are issued by the Commission.
(b) Basis of Presentation
Government-wide Statements. The statement of net position and the statement of activities display information about the City. These statements include the financial activities of the overall government, except for fiduciary activities. Eliminations of internal charges and interfund balances have been made to minimize the double-counting of internal activities. However, interfund activity between governmental and enterprise funds has not been eliminated. These statements distinguish between the governmental and business-type activities of the City. Governmental activities generally are financed through taxes, intergovernmental revenues, and other non-exchange transactions. Business-type activities are financed, in whole or in part, by fees charged to external parties.
The statement of activities presents a comparison between direct expenses and program revenues for the different business-type activities of the City and for each function of the City’s governmental activities. Direct expenses are those that are specifically associated with a program or function and, therefore, are clearly identifiable to a particular function. Indirect expense allocations that have been made in the funds have been reversed for the statement of activities. Program revenues include (a) fees, fines, and charges paid by the recipients of goods or services offered by the programs, and (b) grants and contributions that are restricted to meeting the operational or capital requirements of a particular program. Revenues that are not classified as program revenues, including all taxes, are presented as general revenues.
Fund Financial Statements. The fund financial statements provide information about the City’s funds, including its fiduciary funds. Separate statements for each fund category – governmental, proprietary, and fiduciary – are presented. The emphasis of fund financial statements is on major governmental and enterprise funds, each displayed in a separate column. All remaining governmental and enterprise funds are aggregated and reported as non-major funds.
Proprietary fund operating revenues, such as charges for services, result from exchange transactions associated with the principal activity of the fund. Exchange transactions are those in which each party receives and gives up essentially equal values. Non-operating revenues, such as subsidies and investment earnings, result from non-exchange transactions or ancillary activities.
The City reports the following major governmental funds: General Fund – This is the City’s primary operating fund. It accounts for all financial resources of the general government, except those required to be accounted for in another fund.
Tax Increment Financing Debt Service Fund – This fund is used to account for the financing of redevelopment project expenses through payments in lieu of taxes and economic activity taxes.
The City reports the following major enterprise funds: Power and Light Fund – This fund accounts for the acquisition, operation, and maintenance of the City’s power and light utility facilities and services.
35
CITY OF INDEPENDENCE, MISSOURI
Notes to Financial Statements
June 30, 2014
Water Fund – This fund accounts for the acquisition, operation, and maintenance of the City’s water utility facilities and services.
Sanitary Sewer Fund – This fund accounts for the acquisition, operation, and maintenance of the City’s sanitary sewer utility facilities and services.
Events Center Fund – This fund accounts for the acquisition and maintenance of the City’s events center facility This fund also includes the operational activities which are managed by the Corporation and the activity of the Events Center CID
The City reports the following fund types of non-major funds:
Special Revenue Funds – These funds account for specific revenue sources (other than major capital projects) that are legally restricted to expenditure for specified purposes.
Capital Projects Funds – These funds account for the expenditures and related financing sources of major City projects.
Debt Service Funds – These funds account for the resources accumulated and payments made for principal and interest on long-term general obligation debt of governmental funds.
Internal Service Funds – These funds account for the costs of fleet maintenance, the Staywell Healthcare program, Workers’ Compensation fund, and other benefits provided to other departments on a cost-reimbursement basis.
Trust Funds – These funds account for monies held in trust by the City for preservation and maintenance of the Vaile Mansion.
Agency Funds – These funds account for monies held on behalf of the Flexible Benefits Plan for contributions made by employees to the City’s cafeteria plan, monies held for the Susie Paxton Block Distinguished Public Service Award, and monies held for the Seniors Travel Program.
(c) Basis of Accounting
Government-wide, Proprietary, and Private-Purpose Trust Fund Financial Statements. The government-wide, proprietary and private-purpose trust fund financial statements are reported using the economic resources measurement focus and the accrual basis of accounting. Revenues related to exchange transactions are recorded when earned, and expenses are recorded at the time liabilities are incurred, regardless of when the related cash flows take place. Non-exchange transactions, in which the City gives (or receives) value without directly receiving (or giving) equal value in exchange, include property taxes, grants, entitlements and donations. On an accrual basis, revenue from property taxes is recognized in the fiscal year for which the taxes are levied. Revenue from grants, entitlements, and donations is recognized in the fiscal year in which all eligibility requirements have been satisfied.
Proprietary funds distinguish operating revenues and expenses from non-operating items. Operating revenues and expenses generally result from providing services and producing and delivering goods in connection with a proprietary fund’s principal ongoing operations.
Governmental Fund Financial Statements. Governmental funds are reported using the current financial resources measurement focus and the modified accrual basis of accounting. Under this method, revenues
36
CITY OF INDEPENDENCE, MISSOURI
Notes to Financial Statements
June 30, 2014
are recognized when both measurable and available. The City considers all revenues reported in the governmental funds to be available if the revenues are collected within 60 days after year-end. Property taxes, sales taxes, franchise taxes, licenses and interest are considered to be susceptible to accrual under this definition. Expenditures are recorded when the related fund liability is incurred, except for principal and interest on general long-term debt, claims and judgments and compensated absences, which are recognized as expenditures to the extent they have matured. General capital asset acquisitions are reported as expenditures in governmental funds. Proceeds of general long-term debt and acquisitions under capital lease are reported as other financing sources.
Agency Funds. Agency funds only have asset and liability accounts and the accrual basis of accounting is used to recognize receivables and payables within these accounts Agency funds do no have operating accounts such as revenues and expenses, so therefore a measurement focus does not apply to these funds.
(d) Accounts Receivable
Accounts receivable result primarily from sales of electricity, water and sewer services accounted for in the Power and Light, Water, and Sanitary Sewer (Enterprise) Funds, respectively. An estimated amount has been recorded for services rendered, but not yet billed, as of the close of the fiscal year. Accounts receivable are expressed net of allowances for doubtful accounts. Allowances for doubtful accounts are based on historical collection trends for the related receivables.
(e) Investments
Investments are recorded at fair value, based on quoted market prices
(f)
Inventory
Inventory of the enterprise funds consists of the coal supply and electric, water and sanitary sewer utility materials and is valued at average cost. Inventory of the Internal Service Fund consists of fuel and vehicle and equipment parts and materials and is valued at the lower of cost or market. Inventory of the Events Center consists of merchandise available for sale, valued at cost.
(g) Prepaid Items
Certain payments to vendors reflecting costs applicable to future accounting periods have been recorded as prepaid items in both the government-wide and fund financial statements.
(h) Interfund Activity
The City has the following types of interfund activity:
Loans – amounts provided with a requirement for repayment. Interfund loans are reported as interfund receivables (i.e., due from other funds) in lender funds and interfund payables (i.e. due to other funds) in borrower funds.
Services provided and used – sales and purchases of goods and services between funds for a price approximating their fair value. Interfund services provided and used are reported as revenues in funds providing the good or service and expenditures or expenses in the fund purchasing the good or service. Unpaid amounts are reported as interfund receivables and payables in the fund balance sheets or fund statements of net assets.
37
CITY OF INDEPENDENCE, MISSOURI
Notes to Financial Statements
June 30, 2014
Reimbursements – repayments from the funds responsible for particular expenditures or expenses to the funds that initially paid for them. Reimbursements are reported as expenditures in the reimbursing fund and as a reduction of expenditures in the reimbursed fund.
Transfers – flows of assets (such as cash or goods) without equivalent flows of assets in return and without a requirement for repayment. In governmental funds, transfers are reported as other financing uses in the funds making transfers and as other financing sources in the funds receiving transfers. The payments in lieu of taxes that the enterprise funds pay to the general fund are handled as transfers out for the enterprise funds and transfers in for the general fund.
(i) Capital Assets
Capital assets, which include property, plant, equipment and infrastructure assets (e.g., roads, bridges, drainage systems, and similar items) are reported in the applicable governmental or business-type activities columns in the government-wide financial statements. Capital assets are defined by the City as assets with an initial individual cost of more than $5,000 and an estimated useful life in excess of one year. Capital assets are stated at cost or estimated historical cost. For property acquired from another utility, the difference between the net cost of plant assets recorded by the selling entity and the purchase price is recorded as an acquisition adjustment. Contributions of capital assets received from federal, state, or local sources are recorded as assets and a capital contribution at fair value at the time of receipt. Additions, improvements and expenditures that significantly extend the useful life of an asset are capitalized.
Interest incurred during the construction phase of capital assets of business-type activities is included as part of the capitalized value of the assets constructed. The total interest expense incurred by the City’s business-type activities during the fiscal year was $17,692,441. Of this amount, $4,156,848 was included as part of the cost of the capital assets under construction in connection with Power and Light, Water, Sewer and Events Center projects.
Depreciation has been provided over the estimated useful lives using the composite and straight-line methods. Depreciation on utility vehicles and heavy equipment is charged to clearing accounts and redistributed to various operating, construction, and other accounts. The estimated useful lives are as follows:
38
Years Governmental activities: Buildings and improvements 20-40 Improvements other than buildings 20 Roads 20 Bridges 40 Drainage systems 35 Office equipment and furniture 7 Mobile equipment – vehicles 5 Mobile equipment – heavy equipment 10 Fire trucks 15 Other equipment 10 Computer equipment 5
June 30, 2014
Property, plant, and equipment financed by capital leases are reflected as assets and corresponding liabilities, and the related depreciation expense is provided on the same basis as assets financed with other resources. General capital assets financed by capital leases are reported as expenditures and other financing sources in the governmental funds.
(j) Bond Premiums/Discounts, and Issuance Costs
In the government-wide and proprietary fund financial statements, bond premiums and discounts are deferred and amortized over the life of the bonds using the straight-line method, a method which approximates the effective interest method. Bonds payable are reported net of the applicable bond premium or discount. Bond issuance costs are expensed in the period in which the debt is issued.
In the fund financial statements, governmental fund types recognize bond premiums and discounts, as well as bond issuance costs, during the period in which the debt is issued. The face amount of debt issued and any related premiums or discounts are reported as other financing sources/uses. Issuance costs, whether or not withheld from the actual debt proceeds received, are reported as debt service expenditures during the year they are incurred.
CITY OF INDEPENDENCE, MISSOURI Notes to Financial Statements
39 Years Business-type activities: Power and Light Fund: Production plant 25-45 Transmission plant 28-40 Distribution plant 25-40 Transportation equipment 7 General plant 19-40 Machinery and equipment 7-25 Water Fund: Source of supply 15-50 Pumping 20-50 Water treatment 40-50 Transmission and distribution system 20-100 General plant 5-50 Acquisition adjustment 30 Nonutility property 10 Machinery and equipment 5-22 Sanitary Sewer Fund: Equipment 5-25 Sewer system 40-100 Plant 25 Machinery and equipment 5-20 Events Center Fund: Buildings and improvements 20-40 Improvements other than buildings 20 Machinery and equipment 4-20
CITY OF INDEPENDENCE, MISSOURI
Notes to Financial Statements
June 30, 2014
(k) Deferred Inflows/Outflows
In addition to assets, the statement of financial position will sometimes report a separate section for deferred outflows of resources. This separate financial statement element, deferred outflows of resources, represents a consumption of net position that applies to a future period(s) and so will not be recognized as an outflow of resources (expense/ expenditure) until then. The City only has one item that qualifies for reporting in this category. It is the deferred charge on refunding reported in the government-wide and the proprietary funds statements of net position. A deferred charge on refunding results from the difference in the carrying value of refunded debt and its reacquisition price. This amount is deferred and amortized over the shorter of the life of the refunded or refunding debt.
In addition to liabilities, the statement of financial position will sometimes report a separate section for deferred inflows of resources. This separate financial statement element, deferred inflows of resources, represents an acquisition of net position that applies to a future period(s) and so will not be recognized as an inflow of resources (revenue) until that time. The government has only one type of item that qualifies for reporting in this category, unavailable revenue. The governmental funds report unavailable revenues from two sources: real estate taxes and special assessments. These amounts are deferred and recognized as an inflow of resources in the period that the amounts become available.
(l) Compensated Absences
Under the terms of the City’s personnel policy, City employees are granted vacation based upon length of service. Sick leave is granted at the rate of eight hours per month. Sick leave may be accumulated without limitation. Upon termination, compensation for accrued sick leave is paid up to the equivalent of six months’ for General Fund employees and nine months for Firefighters of regular earnings at the employee’s current rate of pay and compensation for vacation is paid up to a maximum of 400 hours for General Fund employees and 780 hours for 24 hour shift Firefighters
The liability for compensated absences reported in the government-wide and proprietary fund statements has been calculated using the vesting method, in which leave amounts for both employees who currently are eligible to receive termination payments and other employees who are expected to become eligible in the future to receive such payments upon termination are included. A liability for these amounts is reported in governmental funds only if they have matured, for example, as a result of employee resignations and retirements.
(m) Fund Balances
In the fund financial statements, governmental funds report the following fund balance classifications:
Non-Spendable – consists of amounts that cannot be spent because they are either not in spendable form or legally or contractually required to be maintained intact.
Restricted – consists of amounts where constraints are placed on their use either by (1) external groups such as creditors, grantors, contributors, or laws or regulations of other governments; or (2) law through constitutional provisions or enabling legislation.
40
CITY OF INDEPENDENCE, MISSOURI
Notes to Financial Statements
June 30, 2014
Committed – consists of amounts which can only be used for specific purposes pursuant to constraints imposed by formal action (ordinance) of the City Council, which is the highest level of decision-making authority. Those committed amounts cannot be used for any other purpose unless the City Council removes or changes the specified amounts by use of the same formal action that it employed to previously commit the funds.
Assigned – consists of amounts which are constrained by City management’s intent for these to be used for a specific purpose but are neither formally restricted by external sources nor committed by City Council action. The City’s Fund Balance Policy authorizes the City Manager to assign amounts for a specific purpose in this category. Likewise, the City Manager has the authority to take necessary actions to un-assign amounts in this category. Encumbrances shall be considered as assigned, unless they specifically meet the requirements to be committed or restricted.
Unassigned – consists of the residual fund balance that does not meet the requirements for the nonspendable, restricted, committed, or assigned classifications. The General Fund is the only fund that would report a positive amount in unassigned fund balances.
The City has a fund balance policy that provides guidance for programs with multiple revenue sources. The policy is to use restricted resources first when an expenditure is incurred for purposes for which both restricted and unrestricted fund balance is available. For purposes of fund balance classification expenditures are to be spent from restricted fund balance first, followed in order by committed fund balance, assigned fund balance and lastly unassigned fund balance.
The City has a minimum Unassigned Fund Balance policy for the General Fund equal to 5% of annual revenues. If the fund balance falls below this target level of 5% then the City will strive to restore the Unassigned Fund Balance through revenue allocations or expenditure reductions back to the target level over a five (5) year period.
Detailed information on the City’s governmental fund balance classifications may be found in Note 15 in the notes to the financial statements.
(n) Net Position
In the government-wide and proprietary fund financial statements, equity is displayed in three components as follows:
Net Investment in Capital Assets – This consists of capital assets, net of accumulated depreciation, less the outstanding balances of any bonds, mortgages, notes, or other borrowings that are attributable to the acquisition, construction or improvement of those assets. Net investment in capital assets excludes unspent debt proceeds of $3,207,282 for Power and Light, $3,633,048 for Water, $13,488,035 for Sewer and $6,972,591 for the Events Center.
Restricted – This consists of net position that is legally restricted by outside parties or by law through constitutional provisions or enabling legislation. Net position restricted through enabling legislation consists of $994,568 for the License Surcharge; $3,665,198 for the Street Sales Tax; $8,267,224 for Storm Water Sales Tax; $3,235,081 for Public Safety Sales Tax; and $13,713,396 for debt service.
41
CITY OF INDEPENDENCE, MISSOURI
Notes to Financial Statements
June 30, 2014
Unrestricted – This consists of net position that does not meet the definition of “restricted” or “net investment in capital assets.”
When both restricted and unrestricted resources are available for use, it is generally the City’s policy to use restricted resources first, then unrestricted resources as they are needed.
(o) Statement of Cash Flows
For purposes of the statement of cash flows, short-term investments held in proprietary funds with a maturity date within three months of the date acquired by the City, are considered cash equivalents.
(p) Use of Estimates
The preparation of financial statements in conformity with GAAP requires management to make estimates and assumptions that affect the reported amounts of assets and liabilities and disclosure of contingent assets and liabilities at the date of the financial statements and the reported amounts of revenues and expenses during the reporting period. Actual results could differ from those estimates.
(q) New Accounting Pronouncements
In June 2012, GASB issued Statement No. 68, Accounting and Financial Reporting for Pensions – and Amendment of GASB Statement No. 27. The primary objective of this statement is to improve accounting and financial reporting by state and local governments for pensions. This statement requires governments providing defined benefit pensions (both single and multi-employer plans) to recognize their long-term obligation for pension benefits as a liability within their financial statements for the first time, and to more comprehensively and comparably measure the annual costs of pension benefits. This statement also enhances the accountability and transparency through revised and new note disclosures and required supplementary information. The City will implement GASB No. 68 beginning with the year ended June 30, 2015.
In January 2013, GASB issued Statement No. 69, Government Combinations and Disposals of Government Operations. This statement establishes accounting and financial reporting standards related to government combinations and disposals of government operations which can include a variety of transactions referred to as mergers, acquisitions, and transfers of operations. The City will implement GASB No. 69 beginning with the year ended June 30, 2015.
In November 2013, GASB issued Statement No. 71, Pension Transition for Contributions Made Subsequent to the Measurement Date – an Amendment of GASB Statement No.68. This statement amends GASB Statement No. 68 that relates to the amounts associated with contributions, if any, made by a state or local government employer or non-employer contributing entity to a defined pension plan after the measurement date of the government’s beginning net pension liability. The City will implement GASB No. 71 beginning with the year ended June 30, 2015.
42
CITY OF INDEPENDENCE, MISSOURI
Notes to Financial Statements
June 30, 2014
(2) Deposits and Investments
At June 30, 2014, the carrying values of deposits and investments are summarized as follows:
held in trust (bond reserves):
Deposits and investments of the City are reflected in the government-wide financial statements as follows:
Investment Policy
Missouri state statutes authorize the City, with certain restrictions, to deposit or invest in open accounts, time deposits, U.S. Treasury notes, and certificates of deposit. Statutes also require that collateral pledged must have a fair value equal to 100% of the funds on deposit, less insured amounts. Collateral securities must be held by the City or a disinterested third party and must be of the kind prescribed by state statutes and approved by the State of Missouri.
43
Investments: Short-term investments
Federal Home Loan Mortgage Corporation $ 7,241,913 Federal National Mortgage Association 3,624,186 Federal Home Loan Bank 27,412,926 Money Market 20,118,756 U.S. Treasury Bill 200,000 Investment pool: U.S. Treasury Bond 26,652 Total investments 58,624,433 Deposits and repurchase obligations 103,133,292 Petty cash 9,606 Total $ 161,767,331
Fiduciary Government-Wide Funds Primary Statement Statement Government of Net Position of Net Position Total Pooled cash and investments $ 97,070,306 161,734 97,232,040 Restricted cash and investments 64,535,291 — 64,535,291 $ 161,605,597 161,734 161,767,331
CITY OF INDEPENDENCE, MISSOURI
Notes to Financial Statements
June 30, 2014
The City maintains a cash and investment pool, which is available for use by most funds. Substantially all excess cash is invested in U.S. Government securities and money market funds. Each fund’s portion of this pool is displayed as pooled cash and investments or in restricted assets. Interest earned is allocated to the funds on the basis of average monthly cash and investment balances. Only funds with overdrawn balances (cash and investments) are charged for interest. Cash and investments are held separately by some of the City’s funds. Additionally, certain restricted assets, related to bond ordinances and indentures and capital lease certificates, are held in escrow by financial institutions’ trust departments.
Credit Risk/Concentration of Credit Risk
The credit risk for deposits and investments is the possibility that the issuer/counterparty to an investment will be unable to fulfill its obligations. It is the City’s policy to limit its investments to Certificates of Deposit and Bonds or other obligations of the United States. The City’s investment policy does not specify maximum or minimum investment concentrations by investment type. The credit rating and concentration of the City’s investment in debt securities are as follows:
Custodial Credit Risk
The custodial credit risk for deposits is the risk that, in the event of the failure of a depository financial institution, the City will not be able to recover deposits or will not be able to recover collateral securities that are in the possession of an outside party. The custodial credit risk for investments is the risk that, in the event of the failure of the counterparty to a transaction, the City will not be able to recover the value of investment or collateral securities that are in the possession of an outside party. The City’s policy is to collateralize the demand deposits and repurchase agreements with securities held by the financial institution’s agent and in the City’s name.
At June 30, 2014, the City’s deposits and repurchase obligations were insured by Federal depository insurance and uninsured deposits and repurchase obligations were fully collateralized by securities held in the City’s name by their financial institution’s agent. The City’s securities were registered and held by the City’s financial institution in the City’s name. Accordingly, management has determined that none of the City’s deposits or investments was exposed to custodial credit risk as of June 30, 2014
Interest Rate Risk
The City’s investment policy does not limit investment maturities as a means of managing its exposure to fair value losses arising from increasing interest rates. The City has elected to use the segmented time distribution method of disclosure for its interest rate risk.
As of June 30, 2014, all of the City’s securities had maturities of less than one year with the exception of a U.S. treasury bond with a fair value of $26,652 that will mature in 2027.
44
Percent of Total Issuer Moody's Credit Rating Investments Federal Home Loan Bank AAA 46.76% Federal Home Loan Mortgage Corporation AAA 12.35% Federal National Mortgage Association AAA 6.18%
CITY OF INDEPENDENCE, MISSOURI
Notes to Financial Statements
June 30, 2014
(3) Tax Revenue
Tax revenue, including interest and penalties, by fund type for the year ended June 30, 2014 is as follows:
The City’s real estate tax is levied each November 1 on the assessed value as of the prior January 1 for all real property located in the City. Real estate taxes are due on December 31 following the levy date. On January 1, a lien attaches to all property for which taxes are unpaid. Jackson County bills and collects all real estate taxes for the City and charges a 1.5% to 1.6% commission on all taxes collected.
Assessed values are established by the Clay and Jackson County assessors, subject to review by the Jackson County Board of Equalization and State Tax Commission. The assessed value for real property, including railroad and utility properties, located in the City as of January 1, 2013, on which the fiscal 2014 levy was based, was $1,280,827,879.
The City is permitted by Missouri state statutes to levy taxes up to $1.00 per $100 of assessed valuation for general governmental services, other than payment of principal and interest on long-term debt, up to $0.40 per $100 of assessed valuation for public health and recreation, and in unlimited amounts for the payment of principal and interest on long-term debt. Property tax levies per $100 assessed valuation for the year ended June 30, 2014 were $0.5026 for the General Fund, $0.2368 for Public Health and Recreation, and $0.5367 for the Independence Square Benefit District Fund.
45
Nonmajor TIF Governmental General Debt Service Funds Total Real estate tax $ 7,486,129 7,274,793 23,834 14,784,756 Railroad utilities tax 39,716 — — 39,716 Cigarette tax 477,865 — — 477,865 Transient guest tax — — 1,468,758 1,468,758 Sales tax 16,559,131 7,207,721 19,550,142 43,316,994 Franchise tax 10,292,488 — — 10,292,488 $ 34,855,329 14,482,514 21,042,734 70,380,577
CITY OF INDEPENDENCE, MISSOURI
Notes to Financial Statements
June 30, 2014
(4) Intergovernmental Revenue and Receivables
Intergovernmental revenue during fiscal year 2014 consisted of the following:
46
General Fund Nonmajor Governmental Funds Total Federal Department ofAgriculture $ — 17,114 17,114 Department ofDefense — 20,118 20,118 Department ofHousing&UrbanDevelopment CommunityDevelopment BlockGrant — 540,579 540,579 Neighborhood StabilizationProgram — 1,405,142 1,405,142 Home Investment Partnership — 707,436 707,436 Lead Hazard Control Funds — 7,830 7,830 PlanningSustainable Neighborhoods — 80,000 80,000 Department ofthe Interior — 13,000 13,000 Department ofJustice 39 380,578 380,617 Department ofTransportation — 3,725,354 3,725,354 Department ofHealth&HumanServices 25,000 337,555 362,555 Corporationfor National and CommunityService — 217,897 217,897 Executive Office ofthe President — 149,470 149,470 Department ofHomeland Security — 529,204 529,204 Total Federal 25,039 8,131,277 8,156,316 State & Local Department ofHealth&HumanServices — 144,937 144,937 Department ofPublic Safety — 132,835 132,835 Department ofHighwaySafety — 22,332 22,332 Department ofRevenue Motor Vehicle Fuel Tax 2,979,706 — 2,979,706 Motor Vehicle License 487,407 — 487,407 Motor Vehicle Sales Tax 874,137 — 874,137 Financial InstitutionsTax 19,381 — 19,381 DivisionofTourism — 58,300 58,300 JacksonCountyAnti DrugTax 559,459 — 559,459 JacksonCountyDARE 212,000 — 212,000 Healthcare FoundationofGreater Kansas City — 21,958 21,958 Public HealthFoundation — 652 652 Incarnate Word Foundation — 2,305 2,305 VAX Care Corp — 805 805 Total State &Local 5,132,090 384,124 5,516,214 Grand Total $ 5,157,129 8,515,401 13,672,530
CITY OF INDEPENDENCE, MISSOURI
Notes to Financial Statements
June 30, 2014
Amounts due from other governments at June 30, 2014 are as follows:
47
Federal State Local Total GeneralFund: DepartmentofHealth&HumanServices $ 4,167 — — 4,167 DepartmentofRevenue MotorVehicleFuelTax — 519,951 — 519,951 MotorVehicleSalesTax — 82,410 — 82,410 MotorVehicleLicenseFees — 121,701 — 121,701 — — 1,541 1,541 4,167 724,062 1,541 729,770 TIFDebtService: StateSalesTax — 95,000 — 95,000 CountySalesTax — — 287,091 287,091 KansasCityZooTax — — 49,255 49,255 39thStTransportationDevelopmentDistrict — — 39,208 39,208 — 95,000 375,554 470,554 NonmajorGovernmentalFunds: DepartmentofAgriculture 1,512 — — 1,512 DepartmentofHousing&UrbanDevelopment CommunityDevelopmentBlockGrant 15,465 — — 15,465 HomeInvestmentPartnership 5,997 — — 5,997 NeighborhoodStabilizationProgram 111,171 — — 111,171 LeadHazardControlFunds 7,830 — — 7,830 DepartmentoftheInterior 15,000 — — 15,000 DepartmentofJustice 64,091 — — 64,091 DepartmentofTransportation 1,333,723 — — 1,333,723 DepartmentofHealth&HumanServices 55,407 — — 55,407 DepartmentofHomelandSecurity 50,398 — — 50,398 ExecutiveOfficeofthePresident 91,435 — — 91,435 MissouriDepartmentofHealth — 10,869 — 10,869 MissouriDivisionofTourism — 49,000 — 49,000 1,752,029 59,869 — 1,811,898 Totals $ 1,756,196 878,931 377,095 3,012,222 EventsCenterCommunityImprovementDistrictandCrackerneck TransportationDevelopmentDistrict
CITY OF INDEPENDENCE, MISSOURI
Notes to Financial Statements
June 30, 2014
(5) Interfund Activity
(a) Interfund Balances
Interfund balances at June 30, 2014, consisted of the following:
Interfund payables and receivables represent loans between funds for operating purposes, short-term negative balances and pending reimbursements
(b) Interfund Charges for Support Services
Interfund charges for support services and rent paid to the General Fund during fiscal year 2014 were as follows:
Rent charges, which consist of leased office space, are included in other revenue of the General Fund. Interfund charges for customer service support services and telephone operators were paid to the Water Fund during fiscal year 2014, and are included in non-operating miscellaneous revenue as follows:
48
DueFrom Duefrom Duefrom TIF Nonmajor Events Debt Service Governmental Center Total Dueto: Governmental activities: General Fund $ 1,173 1,370,745 429,936 1,801,854 TIFDebt Service 2,609,401 — — 2,609,401 Nonmajor governmental — 5,478,181 — 5,478,181 Total governmental activities $ 2,610,574 6,848,926 429,936 9,889,436
Interfund Charges Rent Nonmajor governmental funds $ 96,335 $ — Power and Light Fund 2,043,397 64,010 Sanitary Sewer Fund 877,372 22,732 Water Fund 969,925 29,680 $ 3,987,029 $ 116,422
Sanitary Sewer Fund $ 274,782 Power and Light Fund 1,431,225 $ 1,706,007
CITY OF INDEPENDENCE, MISSOURI
Notes to Financial Statements
June 30, 2014
Interfund charges for meter reading services were paid to the Power and Light Fund during fiscal year 2014, and are included as a credit to Power and Light’s operating expenses as follows:
(c) Payments in Lieu of Taxes
The payments in lieu of taxes of $13,368,096, $2,646,902 and $2,129,065 in fiscal year 2014 by the Power and Light, Water, and Sanitary Sewer (Enterprise) Funds, respectively, to the General Fund approximate franchise taxes and real estate taxes on plant in service. The franchise tax rate, established by City ordinance at 9.08%, is applied to gross billed operating revenues less amounts written off to arrive at the franchise tax due the General Fund. Real estate taxes are charged at a set amount.
(d) Interfund Transfers
Interfund transfers for the year ended June 30, 2014, consisted of the following:
Transfers are the result of reimbursements for capital projects, general operations and debt service payments.
49
Sanitary Sewer Fund $
Water Fund 1,122,397
1,348,077
225,680
$
TransferOut Tax Increment Nonmajor Powerand Sanitary General Financing Governmental Light Water Sewer Total TransfersIn: TaxIncrementFinancing $ 710,679 — 351,083 226,052 195,912 248,658 1,732,384 SanitarySewerFund 10,000 — — — — — 10,000 Nonmajorgovernmental — 4,935 893,012 — — — 897,947 TotalPrimaryGovernment $ 720,679 4,935 1,244,095 226,052 195,912 248,658 2,640,331
CITY OF INDEPENDENCE, MISSOURI
Notes to Financial Statements
June 30, 2014
(6) Capital Assets
Capital asset activity for the year ended June 30, 2014 is as follows:
50
Balance Balance June 30, 2013 Additions Retirements June 30, 2014 Governmental activities: Nondepreciable capital assets: Land $ 30,500,972 1,204,787 — 31,705,759 Construction work in progress 14,319,132 11,277,933 (9,405,435) 16,191,630 Total nondepreciable capital assets 44,820,104 12,482,720 (9,405,435) 47,897,389 Depreciable capital assets: Land improvements 8,583,109 171,603 — 8,754,712 Buildings 49,825,622 1,711,106 — 51,536,728 Building improvements 15,814,827 223,658 — 16,038,485 Improvements other than buildings 32,275,318 503,565 — 32,778,883 Office furniture and equipment 530,639 — (10,054) 520,585 Computer equipment 3,462,223 80,874 — 3,543,097 Mobile equipment 22,591,480 2,947,487 (1,051,502) 24,487,465 Other equipment 8,311,745 275,674 (95,056) 8,492,363 Infrastructure 362,592,017 6,331,744 — 368,923,761 Total depreciable capital assets 503,986,980 12,245,711 (1,156,612) 515,076,079 Less accumulated depreciation for: Land improvements (1,660,011) (437,436) — (2,097,447) Buildings (13,082,385) (1,267,958) — (14,350,343) Building improvements (6,245,330) (787,229) — (7,032,559) Improvements other than buildings (11,538,905) (1,578,288) — (13,117,193) Office furniture and equipment (491,035) (13,686) 2,992 (501,729) Computer equipment (2,012,394) (424,938) — (2,437,332) Mobile equipment (16,948,604) (1,294,218) 940,730 (17,302,092) Other equipment (4,435,891) (655,705) 89,810 (5,001,786) Infrastructure (150,077,243) (12,507,376) — (162,584,619) Total accumulated depreciation (206,491,798) (18,966,834) 1,033,532 (224,425,100) Total depreciable capital assets, net 297,495,182 (6,721,123) (123,080) 290,650,979 Governmental activities capital assets, net $ 342,315,286 5,761,597 (9,528,515) 338,548,368
CITY OF INDEPENDENCE, MISSOURI
Notes to Financial Statements
June 30, 2014
Depreciation expense was charged to functions as follows:
In addition, depreciation on capital assets held by the City’s Central Garage Fund is charged to the various functions based on their usage of the assets
Depreciation charged to Central Garage is different due to the addition of a fully depreciated asset. As of June 30, 2014 the difference for Central Garage is $17,124.
51
Administrative services $ 250,821 Public safety 2,936,292 Public works 11,539,659 Health and welfare 109,707 Culture and recreation 1,729,227 Community development 65,254 Storm water 1,374,030 General government 940,820 Total 18,945,810
3,900 Total depreciation expense $ 18,949,710
CITY OF INDEPENDENCE, MISSOURI
Notes to Financial Statements
June 30, 2014
* See page 55 note regarding depreciation.
52 Balance Balance June 30, 2013 Additions Retirements June 30, 2014 Business-type activities: Power and Light Fund: Nondepreciable capital assets: Land $ 3,062,115 810,015 — 3,872,130 Construction in progress 14,261,142 16,409,141 (18,890,462) 11,779,821 Total nondepreciable capital assets 17,323,257 17,219,156 (18,890,462) 15,651,951 Depreciable capital assets: Infrastructure: Production plant 232,548,455 4,505,174 (316,240) 236,737,389 Transmission plant 38,917,988 15,067 (4,924) 38,928,131 Distribution plant 147,315,718 10,808,990 (3,430,498) 154,694,210 General plant 6,307,463 379,971 — 6,687,434 Other 2,755,568 — — 2,755,568 Total infrastructure 427,845,192 15,709,202 (3,751,662) 439,802,732 Machinery and equipment 20,592,476 2,371,245 (562,529) 22,401,192 Total depreciable capital assets 448,437,668 18,080,447 (4,314,191) 462,203,924 Less accumulated depreciation: Infrastructure (217,822,404) (18,244,082) 4,799,108 (231,267,378) Machinery and equipment (15,276,068) (1,174,754) 94,566 (16,356,256) * Total accumulated depreciation (233,098,472) (19,418,836) 4,893,674 (247,623,634) Total depreciable capital assets, net 215,339,196 (1,338,389) 579,483 214,580,290 Total power and light capital assets $ 232,662,453 15,880,767 (18,310,979) 230,232,241
CITY OF INDEPENDENCE, MISSOURI
Notes to Financial Statements
* See page 55 note regarding depreciation.
June 30, 2014 53 Balance Balance June 30, 2013 Additions Retirements June 30, 2014 Water Fund: Nondepreciable capital assets: $ Land 2,164,777 — — 2,164,777 Construction in progress 569,313 2,600,910 (1,694,430) 1,475,793 Total nondepreciable capital assets 2,734,090 2,600,910 (1,694,430) 3,640,570 Depreciable capital assets: Infrastructure: Nonutility property 40,014 — — 40,014 Source of supply 7,881,511 17,831 (71,441) 7,827,901 Pumping plant 15,326,199 147,712 (19,822) 15,454,089 Treatment plant 23,152,528 21,130 (80,733) 23,092,925 Transmission plant 84,328,266 1,420,987 (139,707) 85,609,546 General plant 1,935,967 7,877 — 1,943,844 Other 12,547,766 — — 12,547,766 Total infrastructure 145,212,251 1,615,537 (311,703) 146,516,085 Machinery and equipment 6,358,798 201,789 (143,583) 6,417,004 Total depreciable capital assets 151,571,049 1,817,326 (455,286) 152,933,089 Less accumulated depreciation: Intrastructure (41,127,001) (2,923,274) 182,175 (43,868,100) Machinery and equipment (3,755,226) (363,051) 143,584 (3,974,693) * Total accumulated depreciation (44,882,227) (3,286,325) 325,759 (47,842,793) Total depreciable capital assets, net 106,688,822 (1,468,999) (129,527) 105,090,296 Total water capital assets $ 109,422,912 1,131,911 (1,823,957) 108,730,866
CITY OF INDEPENDENCE, MISSOURI
Notes to Financial Statements
June 30, 2014 54 Balance Balance June 30, 2013 Additions Retirements June 30, 2014 Sanitary Sewer Fund: Nondepreciable capital assets: Land $ 330,191 — — 330,191 Construction in progress 19,972,652 56,301,121 (2,060,776) 74,212,997 Total nondepreciable capital assets 20,302,843 56,301,121 (2,060,776) 74,543,188 Depreciable capital assets: Infrastructure: Nonutility property 46,368 — — 46,368 Collection plant 97,415,072 1,624,001 — 99,039,073 Pumping plant 5,325,151 18,546 (8,543) 5,335,154 Treatment plant 14,562,535 28,347 (261,822) 14,329,060 General plant 1,591,994 — (42,648) 1,549,346 Total infrastructure 118,941,120 1,670,894 (313,013) 120,299,001 Machinery and equipment 6,499,967 793,888 (143,162) 7,150,693 Total depreciable capital assets 125,441,087 2,464,782 (456,175) 127,449,694 Less accumulated depreciation: Infrastructure (54,011,248) (2,284,800) 313,013 (55,983,035) Machinery and equipment (5,571,656) (449,274) 126,826 (5,894,104) Total accumulated depreciation (59,582,904) (2,734,074) 439,839 (61,877,139) Total depreciable capital assets, net 65,858,183 (269,292) (16,336) 65,572,555 Total sewer capital assets 86,161,026 56,031,829 (2,077,112) 140,115,743 Events Center: Nondepreciable capital assets: Land 5,796,315 — — 5,796,315 Construction in progress — — — — Total nondepreciable capital assets 5,796,315 — — 5,796,315 Depreciable capital assets: Infrastructure 65,581,451 — — 65,581,451 Machinery and equipment 3,555,930 — — 3,555,930 Total depreciable capital assets 69,137,381 — — 69,137,381 Less accumulated depreciation: Infrastructure (5,993,214) (1,639,537) — (7,632,751) Machinery and equipment (919,709) (251,606) — (1,171,315) Total accumulated depreciation (6,912,923) (1,891,143) — (8,804,066) Total depreciable capital assets, net 62,224,458 (1,891,143) — 60,333,315 Total events center capital assets 68,020,773 (1,891,143) — 66,129,630 Total business-type activities capital assets $ 496,267,164 71,153,364 (22,212,048) 545,208,480
CITY OF INDEPENDENCE, MISSOURI
Notes to Financial Statements
June 30, 2014
Depreciation expense was charged to functions as follows:
Depreciation charged to Power and Light and Water funds are different because certain depreciation related to utility vehicles and heavy equipment are charged to clearing accounts and redistributed to various operating, construction, and other capital accounts As of June 30, 2014 the difference for Power and Light is $643,382 and the difference for Water is $49,995
Under accounting practices promulgated in the utility industry by the Federal Energy Regulatory Commission (FERC) and the National Association of Regulatory Utility Commissioners (NARUC), for business-type activities, units are retired plus the cost of removal, less salvage, are charged against accumulated depreciation, with no gain or loss recognized.
55
Business-type activities: Power and light $ 18,775,454 Water 3,236,330 Sanitary sewer 2,734,074 Events center 1,891,143 Total business-type activities depreciation expense $ 26,637,001
CITY OF INDEPENDENCE, MISSOURI
Notes to Financial Statements
June 30, 2014
(7) Long-Term Obligations
The State Constitution permits a city, by vote of two-thirds of the voting electorate, to incur general obligation indebtedness for “city purposes,” not to exceed 10% of the assessed value of taxable tangible property. The State Constitution also permits a city, by vote of two-thirds of the voting electorate under a special election or four-sevenths under a general election, to incur additional general obligation indebtedness not exceeding, in the aggregate, an additional 10% of the assessed value of taxable tangible property for the purpose of acquiring rights-of-way, constructing, extending, and improving streets and avenues and/or sanitary or storm sewer systems, and purchasing or constructing waterworks, electric, or other plants, provided that the total general obligation indebtedness of the city does not exceed 20% of the assessed valuation of taxable property.
The following is a summary of changes in long-term debt of the City for the year ended June 30, 2014:
The compensated absences, other post-employment benefits and pension obligation liabilities attributable to governmental activities will be liquidated primarily by the General Fund.
56
Beginning Ending AmountDue Balance Additions Reductions Balance WithinOneYear Governmentalactivities: Loansandnotespayable: Loanspayable $ 4,785,000 — 1,390,000 3,395,000 1,450,000 TIFloans 170,925,000 6,885,000 12,690,000 165,120,000 6,130,000 Capitalleaseobligations 1,407,347 96,126 277,059 1,226,414 183,853 NeighborhoodImprovement District(NID) 529,000 — 75,000 454,000 75,000 Premium(discount),net (1,054,980) 74,056 (146,706) (834,218) 24,254 Totalloansandnotepayable 176,591,367 7,055,182 14,285,353 169,361,196 7,863,107 Otherliabilities: Compensatedabsences 15,405,146 5,780,182 5,634,703 15,550,625 6,370,343 Otherpost-employmentbenefits 42,078,920 7,823,109 — 49,902,029 — Netpensionobligation 4,476,874 971,677 — 5,448,551 — TIFdeveloperobligations 26,142,384 2,207,831 61,992 28,288,223 119,854 Totalotherliabilities 88,103,324 16,782,799 5,696,695 99,189,428 6,490,197 TotalGovernmentalActivities $ 264,694,691 23,837,981 19,982,048 268,550,624 14,353,304
CITY OF INDEPENDENCE, MISSOURI
Notes to Financial Statements
June 30, 2014
The following is a summary of changes in long-term debt of the Proprietary Funds for the year ended June 30, 2014:
57
AmountDue Beginning Ending Within Balance Additions Reductions Balance OneYear Business-typeactivities: PowerandLightFund: Revenuebonds $ 131,655,000 — 5,015,000 126,640,000 3,265,000 Premiumonbondspayable 5,068,787 — 211,354 4,857,433 — Totalrevenuebonds 136,723,787 — 5,226,354 131,497,433 3,265,000 Compensatedabsences 5,627,256 2,698,467 2,601,729 5,723,994 1,904,353 Otherpost-employmentbenefits 11,325,836 2,239,013 — 13,564,849 — Netpensionobligation 1,818,631 453,307 — 2,271,938 — TotalPowerandLightFund 155,495,510 5,390,787 7,828,083 153,058,214 5,169,353 WaterFund: Revenuebonds 40,065,000 38,220,000 40,065,000 38,220,000 4,230,000 Premiumonbondspayable 393,714 878,503 425,910 846,307 — Totalrevenuebonds 40,458,714 39,098,503 40,490,910 39,066,307 4,230,000 Compensatedabsences 1,457,342 506,070 552,046 1,411,366 441,677 Otherpost-employmentbenefits 4,645,647 760,205 — 5,405,852 — Netpensionobligation 459,144 96,064 — 555,208 — TotalWaterFund 47,020,847 40,460,842 41,042,956 46,438,733 4,671,677 SanitarySewerFund: RevenueBonds 37,035,000 4,380,000 745,000 80,090,000 1,015,000 Premiumonbondspayable 990,483 25,977 34,894 981,566 — Totalrevenuebonds 38,025,483 4,405,977 779,894 81,071,566 1,015,000 Compensatedabsences 932,745 419,397 497,777 854,365 286,290 Otherpost-employmentbenefits 3,676,548 640,737 — 4,317,285 — Netpensionobligation 313,247 69,624 — 382,871 — TotalSanitarySewerFund 42,948,023 5,535,735 1,277,671 86,626,087 1,301,290 EventsCenterFund: Revenuebonds 91,985,000 — 710,000 91,275,000 720,000 Premiumonbondspayable 164,687 — 6,654 158,033 — Discountonbondspayable (286,835) — (11,589) (275,246) — TotalEventsCenterFund 91,862,852 — 705,065 91,157,787 720,000 Totalbusiness-typeactivities $ 337,327,232 51,387,364 50,853,775 377,280,821 11,862,320
CITY OF INDEPENDENCE, MISSOURI
Notes to Financial Statements
June 30, 2014
Debt service requirements on long-term debt with schedules maturities at June 30, 2014 are as follows:
58
Principal Interest Principal Interest Principal Interest Principal Interest 2015 $ 1,450,000 139,856 75,000 23,987 6,130,000 7,990,942 7,655,000 8,154,785 2016 460,000 69,694 80,000 20,212 7,280,000 7,783,811 7,820,000 7,873,717 2017 475,000 52,153 81,000 15,999 9,865,000 7,472,559 10,421,000 7,540,711 2018 495,000 32,741 86,000 11,732 10,075,000 7,015,127 10,656,000 7,059,600 2019 515,000 11,266 91,000 7,202 10,735,000 6,525,183 11,341,000 6,543,651 2020-2024 — — 41,000 7,873 59,705,000 23,687,980 59,746,000 23,695,853 2025-2029 — — — — 61,330,000 8,732,685 61,330,000 8,732,685 $ 3,395,000 305,710 454,000 87,005 165,120,000 69,208,287 168,969,000 69,601,002 PowerandLight Water Sewer EventsCenter Principal Interest Principal Interest Principal Interest Principal Interest Principal Interest 2015 $ 3,265,000 5,670,557 4,230,000 1,281,338 1,015,000 3,601,306 720,000 4,143,288 9,230,000 14,696,489 2016 3,395,000 5,539,957 4,260,000 1,206,338 1,285,000 3,570,556 730,000 4,119,116 9,670,000 14,435,967 2017 3,530,000 5,404,157 3,275,000 1,114,613 1,480,000 3,531,581 830,000 4,094,094 9,115,000 14,144,445 2018 3,685,000 5,246,707 1,480,000 1,043,288 1,720,000 3,483,581 965,000 4,063,931 7,850,000 13,837,507 2019 3,850,000 5,082,257 1,530,000 998,138 1,770,000 3,431,231 1,055,000 4,022,981 8,205,000 13,534,607 2020-2024 22,220,000 22,650,233 8,565,000 4,053,563 9,855,000 16,164,684 7,695,000 19,287,406 48,335,000 62,155,886 2025-2029 25,640,000 17,818,270 10,620,000 2,047,919 12,025,000 13,998,775 14,210,000 17,349,738 62,495,000 51,214,702 2030-2034 31,900,000 11,569,301 4,260,000 90,525 14,930,000 11,089,663 28,135,000 12,940,563 79,225,000 35,690,052 2035-2039 29,155,000 3,061,425 — — 19,105,000 6,912,331 36,935,000 4,838,163 85,195,000 14,811,919 2040-2043 — — — — 16,905,000 1,631,925 — — 16,905,000 1,631,925 $ 126,640,000 82,042,864 38,220,000 11,835,722 80,090,000 67,415,633 91,275,000 74,859,280 336,225,000 236,153,499 Total Business-typeActivities GovernmentalActivities Total NIDPayable LoansPayable TIFLoans
CITY OF INDEPENDENCE, MISSOURI
Notes to Financial Statements
June 30, 2014
(a) Governmental activities
(1)
Loans Payable – Missouri Development Finance Board
Governmental activities loans payable at June 30, 2014 are comprised of the following:
$8,225,000 Series 2005 (Public Safety Facilities Projects) annual installments of $670,000 to $1,010,000 through 2015; interest at 4.00% to 5.25%.
$4,020,000 Series 2009 (Streets Projects) annual installments of $395,000 to $515,000 through 2018; interest at 3.50% to 4.375%.
(2) Neighborhood Improvement District
The Neighborhood Improvement District Bonds constitute a valid and legally binding indebtedness of the City, payable as to both principal and interest from special assessments to be assessed on certain real property within the District which will be benefited by the improvements and, if not so paid, from monies in the Bond Reserve Fund and, to the extent required, from first available moneys in the City’s general fund or other legally available fund. The full faith and credit of the City are irrevocably pledged for the prompt payment, when due, of the principal and interest on the Bonds; provided, however, the City is not obligated nor authorized to levy taxes for the purpose of paying principal of or interest on the Bonds and the taxing power of the City is not pledged to the payment of the Bonds.
Neighborhood Improvement District bonds payable at June 30, 2014 are comprised of the following:
$995,000 Series 2004 (Noland Road and Englewood Improvements) annual installments of $55,000 to $85,000 through 2019; interest at 4.50% to 5.75% $
$111,000 Series 2004 (Fall Drive Sanitary Sewer Project) annual installments of $5,000 to $6,000 through 2024; interest at 5.375% to 5.50%
59
$ 1,010,000
2,385,000 Total Governmental Activities Loans Payable $ 3,395,000
385,000
69,000 Total Neighborhood Improvement District $ 454,000
CITY OF INDEPENDENCE, MISSOURI Notes to Financial Statements
June 30, 2014
(3) Capital Lease Obligations
Capital leases payable at June 30, 2014 are comprised of the following:
The net book value of assets acquired under the capital leases described above amounted to $1,389,908 as of June 30, 2014
The future minimum lease obligations and the net present value of these minimum lease payments as of June 30, 2014 were as follows:
60
Missouri
$ 55,201 Motorola Solutions (radio equipment) semi-annual installments
$78,539 through 2022; interest at 3.4593% 1,108,416 John Deere Financial
annual installments
2016; interest at 4.00% 62,797 Total Capital Lease Obligations $ 1,226,414
Development Finance Board (IBM computer) monthly installments of $2,868 to $3,111 through 2016; interest at 2.04%
of $56,700 to
(mowers)
of $30,771 to $33,330 through
Year ending June 30: 2015 $ 229,680 2016 211,824 2017 159,794 2018 159,794 2019 159,794 2020 - 2022 479,383 1,400,269 Less imputed interest (173,855) Present value of minimum lease payments $ 1,226,414
CITY OF INDEPENDENCE, MISSOURI
Notes to Financial Statements
June 30, 2014
(4) Blended Component Unit
(a) Tax Increment Financing Loans and Developer Obligations
The City’s tax increment financing loan (TIF loans) indebtedness is recorded as a liability of the TIF Commission to match revenue streams to the related debt for which they have been pledged. The obligation of the City and the Commission to pay principal and interest on these bonds is limited solely to the tax increment financing (TIF) revenues generated from each project, and in certain instances an annual appropriation pledge from the City
The City and other taxing districts and governmental entities have pledged a portion of future property tax and sales tax revenues to repay $234 million in tax increment financing loans (TIF Loans) issued at various dates beginning in 1999 to finance redevelopment projects within each of the respective TIF plans. The loans are payable solely from the incremental increase in property taxes and sales taxes generated within the TIF plans. TIF revenues were projected to produce sufficient funds to meet debt service requirements over the life of the TIF loans. Should TIF revenues not be sufficient to meet the required debt service obligations, neither the City nor the Commission is obligated to make such loan payments from any other sources of its revenues. However, the City has appropriated funds sufficient to make all payments required by the bonds for the next fiscal year. During this fiscal year, the City paid $710,679 from the General Fund, $351,083 from the Storm Water Sales Tax Fund, $226,052 from the Power & Light Fund, $195,912 from the Water Fund, $248,658 from the Sewer Fund, and $75,000 from the Crackerneck Transportation Development District in debt service payments for the Crackerneck Creek development. The City has appropriated $419,716 from the General Fund, $722,565 from the Storm Water Sales Tax Fund, $83,642 from the Power & Light Fund, $72,490 from the Water Fund, and $92,006 from the Sewer Fund for the Crackerneck Creek development debt service payments due in fiscal year 2014-15
Developer obligations represent developer project costs that have been certified by the City as eligible for reimbursement from tax increment financing revenues attributable to each respective project. Under tax increment financing plans, the developer may be reimbursed up to the certified cost amount from incremental taxes during a period not to exceed 23 years. Accordingly, certified project costs in excess of amounts reimbursed to date are reflected as a long-term obligation of the Commission. TIF revenues were projected to produce sufficient funds to reimburse the developer for certified costs. The developer obligations are limited solely to the amount of incremental taxes received attributable to each respective project; any deficiencies are the sole responsibility of the developer and do not constitute an obligation of the Commission or of the City.
At June 30, 2014, total principal and interest remaining on the loans was $234 million and the outstanding developer obligations was $28.3 million. The loans are scheduled to mature at varying amounts through 2029 and the developer obligations are payable to the extent incremental taxes are available for a period not to exceed 23 years.
For the current year, principal and interest paid on TIF loans and developer obligations totaled $14.4 million. Incremental revenues from the City included $3.1 million in sales taxes and $.7 million in property taxes. The remaining funds necessary to meet the current year debt service requirements were derived from incremental tax revenues and other sources from other taxing districts and governmental entities, City and developer contributions, cash reserves, and debt trust funds.
61
CITY OF INDEPENDENCE, MISSOURI
Notes to Financial Statements
June 30, 2014
Missouri Development Finance Board Loans Payable
$1,030,000
Series 2007 B (Hartman Heritage TIF) annual installments of $555,000 to $1,060,000 through 2020; interest at 4.00% to 5.00%
Series 2007 C (Santa Fe TIF) annual installments of $385,000 to $1,795,000 through 2023; interest at 5.41% to 6.096%
Series 2007 D (Drumm Farm TIF) annual installments of $70,000 to $80,000 through 2020;
62
Series
$ 490,000 $48,370,000 Series 2006 A&B
installments
$340,000 to $8,225,000 through 2026; interest at 5.30% to 6.00% 37,625,000 $12,790,000 Series 2006 C (Crackerneck Creek TIF) annual installments of $3,500,000 to $5,385,000 through 2026; interest at 5.00% 12,790,000 $1,590,000 Series 2006 (Drumm Farm TIF)
installments
$70,000
$170,000 through 2020; interest at 4.00% to 4.625% 865,000 $4,980,000 Series 2006 F (HCA
Centerpoint
installments
$120,000 to $445,000 through 2028; interest at 4.00% to 4.25% 4,110,000 $19,390,000 Series 2007 A (Eastland Center
installments
to $2,570,000 through 2022; interest at 4.00% to 5.00% 10,975,000 $10,330,000
5,785,000 $10,060,000
7,015,000
470,000 $19,720,000
interest
5.125% 16,600,000 $5,035,000
1,205,000 $7,920,000
$1,635,0000
interest
4.00%
5.125% 7,920,000 $8,000,000
6,450,000 $1,230,000
1,050,000
2005 B (Drumm Farm TIF) annual installments of $50,000 to $90,0000 through 2020; interest at 3.00% to 4.50%
(Crackerneck Creek TIF) annual
of
annual
of
to
-
TIF) annual
of
TIF) annual
of $815,000
$995,000
interest at 4.00% to 4.50%
Series 2007 E (HCA - Centerpoint TIF) annual installments of $425,000 to $2,670,000 through 2028;
at 4.75% to
Series 2008 A (Crackerneck Creek TIF) annual installments of $280,000 to $925,0000 through 2017; interest at 4.30% to 5.70%
Series 2008 B (Crackerneck Creek TIF) annual installments of $615,000 to
through 2025;
at
to
Series 2008 C (Eastland Center TIF) annual installments of $370,000 to $2,515,0000 through 2022; interest at 4.00% to 5.125%
Series 2008 E (Drumm Farm TIF) annual installments of $30,000 to $420,000 through 2022; interest at 3.250% to 5.00%
CITY OF INDEPENDENCE, MISSOURI
Notes to Financial Statements
June 30, 2014
$6,720,000 Series 2011 B (Hartman Heritage TIF) annual installments of $365,000 to $1,815,000 through 2021; interest at 2.000% to 4.125%
$490,000 Series 2011 C (HCA - Centerpoint TIF) annual installments of $50,000 to $165,000 through 2017; interest at 2.000% to 3.000%
$12,050,000 Series 2012 D (HCA - Centerpoint TIF) annual installments of $575,000 to $1,865,000 through 2027; interest at 3.00% to 4.00%
$3,965,000 Series 2012 E (Eastland Center TIF) annual installments of $310,000 to $805,000 through 2022; interest at 2.00% to 3.00%
$14,005,000 Series 2013 A (Crackerneck Creek TIF) annual installments of $50,000 to $5,200,000 through 2028; interest at 4.693% to 4.993%
$10,835,000 Series 2013 B (Crackerneck Creek TIF) one installment of $10,835,000 through 2029; interest at 4.125%
$4,855,000 Series 2014 A (Eastland Center TIF) annual installments of $500,000 to $1,095,000 through 2022; interest at 3.000%
$2,030,000 Series 2014 B (HCA - Centerpoint TIF) annual installments of $105,000 to $495,000 through 2027; interest at 2.000% to 4.000%
Restricted assets held by the Commission of $19,041,460 consist of funds available for costs related to the redevelopment of the Santa Fe, Hartman Heritage, Eastland Center, Crackerneck Creek and HCA areas.
(1) Tax Increment Financing Refunding
On May 22, 2014, the City entered into a loan payable through the Missouri Development Finance Board of $4,855,000 with an interest rate of 3.00%, to refund $2,395,000 of the outstanding 2009 B and $2,550,000 of the outstanding 2009 J Eastland Project TIF loan payables, with interest rates ranging from 4.00% to 5.500%. The acquisition of the new refunding loan carried a premium of $83,493 and resulted in a deferred charge on refunding of $293,606. Both items will be amortized over the life of the bonds. This advance refunding was undertaken to reduce the total debt service payments by $384,228 which resulted in an economic gain of $347,249.
63
5,605,000
215,000
10,895,000
3,330,000
14,005,000
10,835,000
4,855,000
2,030,000 Total TIF Loans Payable $ 165,120,000
CITY OF INDEPENDENCE, MISSOURI
Notes to Financial Statements
June 30, 2014
On May 22, 2014, the City entered into a loan payable through the Missouri Development Finance Board of $2,030,000 with interest rates ranging from 2.00% to 4.00%, to refund $1,965,000 of the outstanding 2009 HCA Centerpoint Project TIF loan payable, with interest rates ranging from 4.125% to 5.000%. The acquisition of the new refunding loan carried a discount of $9,437 and resulted in a deferred charge on refunding of $41,003. Both items will be amortized over the life of the bonds. This advance refunding was undertaken to reduce the total debt service payments by $98,274 which resulted in an economic gain of $81,762.
(2) Tax Increment Financing Prior Year Defeasance of Debt
In prior years, the City defeased certain loans payable with the Missouri Development Finance Board by placing the proceeds of refunding TIF loans in an irrevocable trust to provide for all future debt service payments on the old loans. Accordingly, the trust account assets and the liability for the defeased loans are not included in the City’s financial statements. At June 30, 2014, $6,555,000 of loans payable are considered defeased.
(b) Bass Pro Lease
On October 18, 2004, the City approved the Crackerneck Creek Tax Increment Financing (TIF) Plan. The Crackerneck Creek TIF Plan provides for the development and construction of a proposed 450,000 square foot commercial retail center. The Crackerneck Creek Project (the Project) is scheduled to include (i) the Bass Pro Store described below, (ii) a minimum of 300,000 square feet of additional retail space and (iii) a hotel. In January 2010, a 55,000 square foot Hobby Lobby opened and in late 2009 a 23,000 square foot Mardel opened. During early 2011, an 8,000 square foot Cheddar’s Restaurant opened. The City and the developer remain in discussions regarding securing additional retail and hotel development for the project. However, no additional agreements exist requiring any retailers to open for business in the Crackerneck Creek Redevelopment Area other than Bass Pro.
As part of the Project, the City has entered into the Lease Agreement (as amended from time to time, the “Bass Pro Lease”) with Bass Pro Outdoor World L.L.C. (“Bass Pro”). Pursuant to the Bass Pro Lease the City will own a 150,000 square foot Bass Pro retail store (the “Bass Pro Store”) and will lease the Bass Pro Store to Bass Pro under the terms and conditions as contained in the Bass Pro Lease. Under the Bass Pro Lease the City was obligated to make $25,000,000 available to Bass Pro. This amount was funded from the proceeds of the Series 2006A Bonds. The Bass Pro Store is located on an approximate 20-acre parcel owned by the City.
The initial term of the Bass Pro Lease is 20 years. Bass Pro has various renewal options under the lease agreement. During the initial 20 year term, Bass Pro is required to pay the City “Percentage Rent” rent equal to 2% of “Gross Sales” as defined in the Bass Pro Lease except that the “Minimum Percentage Rent” will not be less than of $1,000,000 during each year of the initial term. During any of the nine one-year renewal options, Bass Pro will pay rent equal to $10 per year provided the TIF bond financing provided by the City in a maximum of $35,000,000 has been paid in full, or until the expiration of the third one year renewal option (whichever occurs first), Bass Pro shall be obligated to pay $1,000,000 per year to the City.
64
CITY OF INDEPENDENCE, MISSOURI
Notes to Financial Statements
June 30, 2014
During any of the three five year renewal options, Bass Pro will pay rent equal to 1% of “Gross Sales” as defined in the lease agreement.
A summary of the minimum rental payments due for this operating lease are as follows:
Under the Bass Pro Lease, Bass Pro has the option to purchase the Bass Pro Store at the expiration of the 20 year initial term and at the expiration of any renewal option for a purchase price equal to 90% of the fair market value thereof as determined by an appraisal.
Also under the Lease the City constructed an approximate 15-acre lake and an additional wilderness habitat area of approximately 15 acres. The City park includes a waterfall and presents a unique natural setting. The City also constructed 600 parking spaces adjacent to the Bass Pro Store.
65
Calendar Year Amount 2014 1,000,000 2015 1,000,000 2016 1,000,000 2017 1,000,000 2018 1,000,000 2019 - 2023 5,000,000 2024 - 2026 3,000,000 Total $ 13,000,000
CITY OF INDEPENDENCE, MISSOURI
Notes to Financial Statements
June 30, 2014
(b) Business-type Activities
(1) Revenue Bonds
Revenue bonds payable at June 30, 2014 are comprised of the following individual issues:
66
PowerandLightFund: $33,645,000Series2010
2035;interestat2.00%to5.250% $ 20,675,000 $55,185,000Series2012Aannualinstallmentsof$150,000to$11,900,000 through2037;interestat2.00%to5.00% 53,765,000 $52,525,000Series2012Fannualinstallmentsof$140,000
$3,630,000through 2037;interestat3.00%to4.00% 52,200,000 TotalPowerandLightfund 126,640,000 WaterFund: $36,240,000Series2013Dannualinstallmentsof$1,480,000
$4,260,000 through2029;interestat2.00%to5.00% 36,240,000 $1,980,000Series2013Eoneannualinstallmentof$1,980,000through2014; interestat1.00% 1,980,000 TotalWaterFund 38,220,000 SanitarySewerFund: $37,035,000Series2012Bannualinstallmentsof$745,000
through2041;interestat2.00%to5.00% 36,290,000 $43,800,000Series2013Cannualinstallmentsof$250,000to$2,855,000through 2042;interestat2.00%to5.25% 43,800,000 TotalSanitarySewerfund 80,090,000 EventsCenterFund: $12,325,000Series2008Dsemi-annualinstallmentsof
through2038;interestat4.00%to5.75% 11,320,000 $11,815,000Series2011
2038;interestat2.00%to5.50% 11,470,000 $68,945,000Series2012Cannualinstallmentsof$105,000to$12,540,000 through2038;interestat2.00%to4.00% 68,485,000 TotalEventsCenterFund 91,275,000 Totalrevenuebonds $ 336,225,000
Bannualinstallmentsof$600,000to$4,030,000 through
to
to
to$2,220,000
$30,000to$410,000
Aannualinstallmentsof$70,000to$1,585,000through
CITY OF INDEPENDENCE, MISSOURI
Notes to Financial Statements
June 30, 2014
The power and light revenue bond ordinance and the water revenue bond indenture require that the systems be accounted for in separate enterprise funds. They also require that after sufficient current assets have been set aside to operate the systems, all remaining monies held in the funds be segregated and restricted in separate special reserves and accounts in the following sequences:
Account Restriction
Principal and interest
For the monthly accumulation of monies to meet the maturing revenue bond principaland-interest requirements
Depreciation and emergency (water only) For the accumulation of $500,000 to finance emergency repairs and system improvements
Surplus account monies are reflected as unrestricted cash. The above required reserves and other reserves are reported in the accompanying statement of net position as restricted assets as follows:
Various bond ordinances and indentures contain significant limitations and restrictions on annual debt service requirements, maintenance of and flow of monies through various restricted accounts, minimum amounts to be maintained in various sinking funds, and minimum revenue bond coverage. The City is in compliance with all such financial limitations and restrictions.
(a) Advance Refunding
On November 4, 2013, the City issued revenue bonds through the Missouri Development Finance Board of $38,220,000 with interest rates ranging from 2.00% to 5.00%, to provide funding to advance refund $17,520,000, $9,705,000 and $9,445,000 of the outstanding Water revenue bonds, with interest rates ranging from 3.00% to 5.75%. The acquisition of the new refunding bonds carried a premium of $878,503 and resulted in a deferred charge on refunding of $1,436,376. Both items will be amortized over the life of the bonds. This advance refunding was undertaken to reduce the total debt service payments by $2,149,451 which resulted in an economic gain of $1,474,981.
67
Power and Sanitary Events Account Light Water Sewer Center Principal and interest $ 12,693,837 — — 337,237 Depreciation and emergency — 500,000 — — Bond reserve and project accounts 3,207,281 3,633,048 13,488,035 6,972,590 Total revenue bond reserves 15,901,118 4,133,048 13,488,035 7,309,827 Customer deposits 2,079,463 584,466 500,847 — Purchase of Dogwood Plant 61,500 — — — Southwest Power Pool collateral 831,040 — — — Total $ 18,873,121 4,717,514 13,988,882 7,309,827 Enterprise Funds
CITY OF INDEPENDENCE, MISSOURI
Notes to Financial Statements
June 30, 2014
(b) Pledged Revenues
The Power and Light and Water Bonds are secured by a pledge of revenues, net of specified operating expenses to repay revenue bonds issued. The pledged revenue information for June 30, 2014 is as follows:
(2) Events Center Bonds
The Events Center Bonds (Bonds) are secured by a pledge of certain community improvement district sales taxes (CID sales taxes) and related Tax Increment Financing (TIF) revenues generated within the Independence Events Center Community Improvement District (District) boundaries. In addition, the Bonds include an annual appropriation covenant pursuant to which the City agrees to budget and appropriate sufficient funds to meet the scheduled debt service requirements of the Bonds should the CID sales taxes and TIF revenues not be sufficient to do so. For the year ended June 30, 2014, District revenues paid to the City for debt service totaled $5,263,703 The remaining debt service amounts of $1,007 were funded from capitalized interest funds that were established at the time the Bonds were issued. Management does not anticipate that any of the City’s general funds will be required to make up any deficiency in payments during the next fiscal year.
68
Principal Principal NetAvailable Date Revenue Termof &Interest &Interest Revenues Issued Description PurposeofDebt Pledged Commitment Remaining 2013-2014 2013-2014 11/2010 PowerandLightLeasehold RevenueBonds ElectricSystemProjects Appropriated Revenues through2035 31,963,726 5,201,787 03/2012 PowerandLightRevenue Bonds ElectricSystem-Dogwood Appropriated Revenues through2037 100,983,487 3,447,219 12/2012 PowerandLightLeasehold RevenueBonds-Refunding ElectricSystemProjects Appropriated Revenues through2037 75,735,651 2,219,300 $ 208,682,864 10,868,306 33,434,107 06/2004 WaterRevenueBonds WaterSystemImprovements Appropriated Revenues through2025 $ - 915,298 03/2009 WaterRevenueBonds WaterSystemImprovements Appropriated Revenues through2030 - 475,931 10/2009 WaterRevenueBondsRefunding WaterSystemImprovements Appropriated Revenues through2017 - 2,978,600 11/2013 WaterRevenueBondsRefunding WaterSystemImprovements Appropriated Revenues through2029 48,065,822 481,632 11/2013 WaterRevenueBondsRefunding WaterSystemImprovements Appropriated Revenues through2014 1,989,900 7,370 $ 50,055,722 4,858,831 12,518,197 08/2012 SewerSystemRevenue Bonds Sewer SystemImprovements Appropriated Revenues through2041 63,747,464 2,277,081 09/2013 SewerSystemRevenue Bonds Sewer SystemImprovements Appropriated Revenues through2042 83,758,169 1,207,931 $ 147,505,633 3,485,012 7,199,358
CITY OF INDEPENDENCE, MISSOURI
Notes to Financial Statements
June 30, 2014
(8) Advances for Construction
As new developments are constructed, the Power and Light (Enterprise) Fund requires a nonrefundable cash payment from a customer or developer to be paid toward the cost of extending the distribution system, installation of street lights, and other additions or modifications solely for the benefit of the customer or developer. The advances for construction at June 30, 2014, were $110,105.
As new additions to the water distribution system are constructed, the Water (Enterprise) Fund requires the developer or wholesaler to advance the estimated cost of the water main extension or improvement. Upon project completion, any excess of the advance over the project cost is refunded to the developer or wholesaler or vice versa. The advances for construction at June 30, 2014, were $104,822
(9) Employee Retirement System Plan Description
The City participates in the Missouri Local Government Employees Retirement System (LAGERS), an agent multiple-employer public employee retirement system that acts as a common investment and administrative agent for local government entities in Missouri. LAGERS is a defined benefit pension plan which provides retirement, disability, and death benefits to plan members and beneficiaries. LAGERS was created and is governed by Statute, Section RSMo. 70.600 – 70.755. As such, it is the system’s responsibility to administer the law in accordance with the expressed intent of the General Assembly. The plan is qualified under the Internal Revenue Code Section 401(a) and it is tax exempt.
LAGERS issues a publicly available financial report that includes financial statements and required supplementary information. That report may be obtained by writing to LAGERS, P.O. Box 1665, Jefferson City, Missouri 65102 or by calling 1-800-447-4334.
Funding Policy
Effective November 1, 2009, the City’s LAGERS benefit program changed from LT-8(65) to L-6 with employees contributing 4% of gross salaries and wages. The City is required by Missouri state statute to contribute at an actuarially determined rate; the current rate is 12 3% (General), 13.5% (Police), and 14.1% (Fire) of annual covered payroll. The contribution requirements of plan members are determined by the City Council. The contribution provisions of the City are established by Missouri state statute.
As of February 28, 2014, which represents the most recent actuarial valuation date, the actuarial accrued liability for benefits within the plan for the City was $223,456,945. The actuarial value of assets was $125,226,912 which results in an unfunded accrued liability (UAL) of $98,230,033 and a funded ratio of 56%. The covered payroll (annual payroll of active employees covered by the plan) was $69,463,809 which results in a ratio of the UAL to the covered payroll of 141%.
The schedule of funding progress (Exhibit 11), presented as required supplementary information following the notes to the financial statements, presents multi-year trend information about whether the actuarial value of plan assets is increasing or decreasing over time relative to the actuarial accrued liability.
The number of retirees and beneficiaries receiving LAGERS benefits, as of February 28, 2014, which is the effective date of the current LAGERS actuarial valuation, is 921. There have been no significant changes in the number of covered participants since that date.
69
CITY OF INDEPENDENCE, MISSOURI
Notes to Financial Statements
June 30, 2014
Annual Pension Cost & Net Pension Obligation
The City’s annual pension cost and net pension obligation as of June 30, 2014 are as follows:
The City’s annual pension cost (APC), the percentage of APC contributed to the plan, and the net pension obligation for the fiscal year ending June 30, 2014 is as follows:
For 2014, the City’s annual pension cost of $10,318,202 was not equal to the required and actual contribution which resulted in an increase to the net pension obligation of $1,590,672 resulting in an ending net pension obligation balance of $8,658,568. The required contribution was determined as part of the February 29, 2012 annual actuarial valuation using the entry-age actuarial cost method. The actuarial assumptions included:
(a) a rate of return on the investment of present and future assets of 7.25% per year, compounded annually;
(b) projected salary increases of 3.5% per year, compounded annually, attributable to inflation;
(c) additional projected salary increases ranging from 0.0% to 6.0% per year, depending on age, attributable to seniority/merit;
(d) pre-retirement mortality based on 75% of the RP-2000 Combined Healthy Table, set back 0 years for men and women; and
70
Annual required contribution $ 10,195,713 Interest on net pension obligation 512,422 Adjustment to annual required contribution (389,933) Annual pension cost 10,318,202 Actual contributions 8,727,530 Increase in net pension obligation 1,590,672 Beginning net pension obligation 7,067,896 Ending net pension obligation $ 8,658,568
Annual Percentage Pension of APC Net Pension Cost (APC) Contributed Obligation Fiscal year ending: June 30, 2012 $ 9,092,429 % 79.9 $ 5,123,666 June 30, 2013 9,905,910 80.4 7,067,896 June 30, 2014 10,318,202 84.6 8,658,568
CITY OF INDEPENDENCE, MISSOURI
Notes to Financial Statements
June 30, 2014
(e) post-retirement mortality based on 105% of the 1994 Group Annuity Mortality table, set back 0 years for men and women. The actuarial value of assets was determined using techniques that smooth the effects of short-term volatility in the market value of investments over a five-year period. The unfunded actuarial accrued liability is being amortized as a level percentage of projected payroll on an open basis. The amortization period at February 29, 2012 was 30 years.
See Exhibit 11 for Schedule of Funding Progress for the years ended 2014, 2013, and 2012.
(10) Post-Employment Health Benefits
In addition to the pension benefits described in Note (9), the City provides post-employment healthcare benefits to all retired employees meeting the service criteria for this benefit. From an accrual accounting perspective, the cost of post-employment healthcare benefits, like the cost of pension benefits, generally should be associated with the periods in which the cost occurs, rather than in a future year when it actually will be paid. Under the guidelines of GASB Statement No. 45, the City recognizes the cost of postemployment healthcare benefits in the year when the employee services are provided, reports the accumulated liability from prior years, and provides additional information useful to assess potential demands on the City’s future cash flows. Recognition of the liability that has accumulated from prior year’s service will be phased in over 30 years, commencing with the initial liability recorded in 2007-08.
Plan Description
The City provides for a continuation of medical, prescription drug, hearing and vision insurance benefits to employees that retire from City employment and who participate in the Missouri Local Government Employees Retirement System (LAGERS). The various benefit plan options offered by the City collectively operate as a single-employer defined benefit healthcare plan and are the same as provided to active City employees. Coverage is available for the lifetime of the retiree and their spouses upon payment of required retiree contribution premiums which includes an adjustment when the retiree becomes eligible to participate in the Medicare program. The contribution requirement for plan members is split between the retiree and the City at percentages that are comparable to active City employees and may be amended at any time by the City Council.
The number of participants that either are, or potentially could be, covered by the City’s plan, as of January 1, 2013, which is the effective date of the current OPEB actuarial valuation, is listed below. There have been no significant changes in the number of covered participants or the type of coverage since that date.
71
Active Employees 972 Retirees & covered spouses of retirees 994 Total Participants 1,966
CITY OF INDEPENDENCE, MISSOURI
Notes to Financial Statements
June 30, 2014
Funding Policy
The City pays for the employer portion of eligible retiree healthcare claims, administrative fees and retiree premiums of the participants in the plan on a pay-as-you-go basis from general operating assets of the City. As noted earlier, retirees are required to make contributions to the plan at the same level as required for active employees until the retirees become Medicare eligible and then the contributions are modified to reflect the inclusion of Medicare participation in the payment of eligible healthcare costs.
Annual OPEB Cost and Net OPEB Obligation
The City’s annual other post-employment benefit (OPEB) cost (expense) is calculated based on the annual required contribution of the employer (ARC) which represents an amount that is actuarially determined in accordance with the requirements of GASB Statement No. 45. The ARC represents the level of funding that, if paid on an ongoing basis, is projected to cover normal costs each year plus the amortization of the unfunded actuarial liability over a period of time that the City has selected as being thirty years. The following table shows the components of the City’s annual OPEB cost for the year, the amount of expected employer contributions to the plan, and changes in the City’s net OPEB obligation.
The City’s annual OPEB cost, the percentage of annual OPEB costs estimated to be contributed to the plan, and the net OPEB obligation for the fiscal year ending June 30, 2014 is as follows:
72
Annual required contribution $ 19,537,378 Interest on net OPEB obligation 2,137,448 Adjustment to annual required contribution (2,495,613) Annual OPEB cost (expense) 19,179,213 Less: Employer contributions (7,716,149) Increase in net OPEB obligation 11,463,064 Net OPEB obligation – July 1, 2013 61,726,951 Net OPEB obligation – June 30, 2014 $ 73,190,015
Percentage of Annual Annual OPEB Net OPEB OPEB Cost Cost Contributed Obligation Fiscal year ending: June 30, 2012 $ 19,325,765 % 34.22 $ 49,055,349 June 30, 2013 19,284,602 34.29 61,726,951 June 30, 2014 19,179,213 40.23 73,190,015
CITY OF INDEPENDENCE, MISSOURI
Notes to Financial Statements
June 30, 2014
Funded Status and Funding Progress
As of January 1, 2013, which is the most recent actuarial valuation date, the actuarial accrued liability for benefits within the plan for the City is $263.5 million dollars. There are no assets set aside for funding the plan as of that date, thus, the entire amount is unfunded. The covered payroll (annual payroll of active employees covered by the plan) was $59.9 million which results in a ratio of the unfunded actuarial accrued liability (UAAL) to the covered payroll of 440 percent.
Actuarial valuations of an ongoing plan involve estimates of the value of reported amounts and assumptions about the probability of occurrence of events far into the future. Examples include assumptions about future employment, mortality, and the healthcare cost trend. Amounts determined regarding the funded status of the plan and the annual required contributions of the employer are subject to continual revision as actual results are compared with past expectations and new estimates are made about the future. The schedule of funding progress, presented as required supplementary information following the notes to the financial statements, presents multi-year trend information about whether the actuarial value of plan assets is increasing or decreasing over time relative to the actuarial accrued liabilities for benefits.
Actuarial Methods and Assumptions
Projections of benefits for financial reporting purposes are based on the substantive plan (the plan as understood by the employer and the plan members) and include the types of benefits provided at the time of each valuation and the historical pattern of sharing of benefit costs between the employer and plan members to that point. The actuarial methods and assumptions used include techniques that are designed to reduce the effects of short-term volatility in actuarial accrued liabilities and the actuarial value of assets, consistent with the long-term perspective of the calculations.
The entry age normal (level percent of pay) cost method is used in the January 1, 2013 actuarial valuation. At this valuation date, the annual cost accruals (individual normal cost for each participant) are determined as a level percentage of pay for each year from entry age until expected retirement. The sum of these individual normal costs for all active participants whose attained ages are under the assumed retirement age is the normal cost for the initial plan year. The excess of all normal costs falling due prior to the initial valuation date, accumulated with interest over the plan assets, represents the initial unfunded actuarial accrued liability.
The actuarial assumptions include a 3.5 percent investment rate of return (net of administrative expenses) which is a blended rate of the expected long-term investment return on the City’s investments. Because the plan is unfunded, reference to the expected long-term investment returns, which tend to be short-term in nature (such as certificates of deposit and United State agencies securities), were considered in the selection of the 3.5 percent rate. The actuarial assumptions for healthcare cost trend is a growth factor of 7.00 percent for the first year and then declining by one half of one percent (0.25%) per year until 5.00 percent is reached. The 5.00 percent growth is used on a go-forward basis. The actuarial assumptions include a 3.00 percent rate for general inflation and a 2.00 percent rate for aggregate payroll growth. The UAAL will be amortized over a period of 30 years using a level percentage of projected payroll on an open basis.
73
CITY OF INDEPENDENCE, MISSOURI
Notes to Financial Statements
June 30, 2014
(11) Risk Management
The City is exposed to various risks of loss related to torts; theft of, damage to, and destruction of assets; errors and omissions; injuries to employees; and natural disasters. As a result, there are a number of claims and/or lawsuits to which the City is a party as a result of certain law enforcement activities, injuries, and various other matters and complaints arising in the ordinary course of City activities. The City is entitled to the defense of sovereign and official immunity against tort action that provides immunity except in two areas
motor vehicles and the condition of property of governmental entities. The City carries commercial property, boiler and machinery, life, and flood insurance, and settlements have not exceeded insurance coverage for each of the past three fiscal years.
The City is a member of the Missouri Public Entity Risk Management Fund (MOPERM). The Missouri General Assembly created MOPERM to provide liability protection to participating public entities, their officials, and employees. The City pays annual premiums to MOPERM for law enforcement liability, general liability, public official errors and omissions liability, automobile liability, and medical malpractice insurance coverage. The agreement with MOPERM provides that MOPERM will be self-sustaining through member premiums. MOPERM has the authority to assess members for any deficiencies of revenues under expenses for any single plan year. Likewise, MOPERM has the authority to declare refunds to members for the excess of revenues over expenses relating to any single plan year. MOPERM had no deficiencies in any of the past three fiscal years. The City purchases excess liability insurance coverage from OneBeacon Insurance Company to provide additional liability insurance coverage above MOPERM’s coverage limits for claims that are not subject to the State’s Sovereign Immunity Statute.
The City is self-insured for workers’ compensation. An excess coverage insurance policy, limited to $3,000,000 per occurrence for workers’ compensation claims in excess of $1,000,000 per occurrence. In order to maintain this self-insured status for workers’ compensation, the State of Missouri requires the City to maintain a surety bond in the amount of $2,320,000 and an escrow account in the amount of $200,000. This amount is reflected as restricted assets in the Power and Light, Water, and Sanitary Sewer Funds. Estimated workers’ compensation claims incurred but not reported are accrued as liabilities in the City’s Workers’ Compensation Fund.
The City offers its employees and retirees a contributory self-insurance healthcare plans (Staywell Open Access Plan or Staywell In-Network Plan). An excess coverage insurance policy covers the portion of specific claims in excess of $250,000 and aggregate claims in excess of $27,271,636 for the open access plan and for the in-network plan. The City’s share of the premiums for this employee benefit was approximately $17,784,572. Premiums paid by the City are recorded as expenditures/expenses of the various funds and premium revenue in the Staywell Health Care (Internal Service) Fund. Incurred but not reported medical, vision, and prescription claims are accrued as a liability in the Internal Service Fund.
74
–
CITY OF INDEPENDENCE, MISSOURI
Notes to Financial Statements
June 30, 2014
Changes in the balances of the workers’ compensation and health care claims liability during the last two years are as follows:
Claims Payable
Workers' Compensation
(12) Commitments
Construction Commitments
At June 30, 2014, the City had commitments of approximately $17.8 million to complete construction contracts. Of this amount, $12.7 million relates to the enterprise funds.
Purchase/Sales of Capacity and Energy
The City purchases a portion of its power supply needs under three long-term purchase agreements – a participation power agreement with Omaha Public Power District (OPPD), a participation power agreement with Missouri Joint Municipal Electric Utility Commission (MJMEUC), and a renewable energy purchase agreement with Smoky Hills Wind Project II, LLC (Smoky Hills)
In January 2004, the City entered into a participation power agreement with OPPD. Under this agreement, the City purchases an 8.33% share (approximately 57 megawatts) of a 682 megawatt coal-fired baseload generating unit at OPPD’s existing Nebraska City power station site (Nebraska City Unit 2). The agreement provides that OPPD is the owner/operator of the unit and OPPD sells the City’s share of the output on a cost-based approach. OPPD issued tax-exempt bonds to pay for the construction of the unit and the City is obligated to pay its proportionate share of the debt service on the bonds, the fixed operation and maintenance costs, the variable operating costs including fuel and renewals and replacements of the unit. The unit began commercial operation on May 1, 2009. The term of the agreement is 40 years from the commercial operation date and can be extended by the City for the life of the proposed unit. The future minimum payments (City’s portion of the debt service) are approximately $162,000,000 through the year 2049. During fiscal year 2014, the delivered cost of capacity and energy under the agreement, including all demand, energy, transmission costs, and debt service was approximately $18,000,000 for 437,592 megawatt-hours of wholesale energy. For fiscal year 2015, the projected costs under the agreement are estimated to be approximately $18,300,000.
In June 2006, the City entered into a unit power purchase agreement with the MJMEUC. Under this agreement, the City purchases a 50% share (approximately 53 megawatts) of MJMEUC’s 106 MW ownership share of the nominal 875 megawatt Iatan 2 coal-fired generating unit located at Kansas City Power & Light Company’s (KCPL) existing power station site in Weston, Missouri. The agreement provides that MJMEUC sells the City’s share of the output on a cost-based approach. MJMEUC issued
75
Staywell 2013 2014 2013 2014 Beginning of year $ 2,681,196 4,165,807 2,257,468 2,349,929 Current year claims and changes in estimates 3,128,458 1,738,578 24,976,934 24,995,550 Claims payments (1,643,847) (1,707,138) (24,884,473) (25,161,920) End of year $ 4,165,807 4,197,247 2,349,929 2,183,559
CITY OF INDEPENDENCE, MISSOURI
Notes to Financial Statements
June 30, 2014
tax-exempt bonds to pay for its share of the construction of the unit and the City is obligated to pay its share of the debt service on the bonds, the fixed operation and maintenance costs, the variable operating costs including fuel, renewals and replacements of the unit and related administrative costs incurred by MJMEUC. The unit began commercial operations on December 31, 2010. The term of the agreement is 40 years from the commercial operation date and can be extended by the City for the life of the proposed unit. The future minimum payments (City’s portion of the debt service) are approximately $236,000,000 through the year 2039. During fiscal year 2014, the delivered cost of capacity and energy under the agreement, including all demand, energy, transmission costs, and debt service was approximately $21,200,000 for 335,874 megawatt-hours of wholesale energy. For fiscal year 2015, the projected costs under the agreement are estimated to be approximately $21,000,000.
In August 2008, the City entered into a renewable energy purchase agreement with Smoky Hills. Under this agreement, the City purchases a 10.10% share (15 megawatts) of a 148.5 megawatt wind farm generation project located in north-central Kansas. The agreement provides that the City will purchase its share of the energy output of the Smoky Hills project and will pay a flat fixed rate (in dollars per megawatt-hour) for the entire term of the agreement. Energy deliveries from the wind farm began on December 8, 2008 and will continue for a term of 20 years with certain renewal options at the mutual agreement of the parties. During fiscal year 2014, the cost of the energy purchases including transmission costs was approximately $3,000,000 for 58,709 megawatt-hours of wholesale energy.
Dogwood Energy Facility
On April 5, 2012, pursuant to an Asset Purchase Agreement with Dogwood Energy, LLC, the City purchased a 12.3% undivided interest (approximately 75 MW) in the Dogwood Energy Facility – a nominal 610 megawatt natural gas-fired combined cycle generating plant located in Pleasant Hill, Missouri. The Facility was originally developed as a joint venture between Aquila, Inc. and Calpine Corporation. The facility (originally named Aries) was placed into commercial operation in two phases: first as a peaking facility during the summer of 2001 and then as a combined cycle plant on February 27, 2002. In addition to the City, Kansas Power Pool (KPP), Missouri Joint Municipal Electric Utility Commission (MJMEUC) and the Unified Government of Wyandotte County (KCBPU) also purchased 7.0%, 8.2% and 17.0% shares respectively of the Dogwood Energy Facility in 2012. Dogwood Energy, LLC maintains the remaining ownership share (55.5%) in the facility.
Each of the owners has entered into certain project agreements that provide for the joint ownership and operation of the Dogwood Facility. Under the project agreements, each of the owners are responsible for their respective share of the fixed operation and maintenance costs, the variable operating costs including fuel, and renewals and replacements of the facility. In addition, the owners share in any revenues from sales of unused capacity and energy in the facility.
The plant had a value of $53,785,771 with $6,049,771 accumulated depreciation, making the net purchase price $47,736,000. An operating reserve account was established in the amount of $430,500 for working capital and $61,500 for SPP credit. Prepaid operating expenses as of June 30, 2014 were $169,843 and depreciation expense for fiscal year end June 30, 2014 was $1,404,718.
76
CITY OF INDEPENDENCE, MISSOURI
Notes to Financial Statements
June 30, 2014
Litigation
The City is involved in lawsuits arising in the ordinary course of activities, including claims regarding construction contract issues, personal injury and discriminatory personnel practices, property condemnation proceedings, and suits contesting the legality of certain taxes. While other cases may have future financial effect, management, based on advice of counsel, believes that their ultimate outcome will not be material to the basic financial statements.
(13) Deficits
The accumulated deficits of $228,054 in the Street Improvements Fund, $4,984,064 in the Parks Sales Tax Fund, $16,155 in the Storm Drainage Fund, $1,150,671 in the Staywell Health Care Fund, $1,501,487 in the Workers’ Compensation Fund, $8,919,660 in the Events Center Fund, $826,751 in the Santa Fe TIF project; $7,654 in the 23rd & Noland TIF project 2, $75,745 in the Independence Square TIF project and $28,820 in the Little Blue Parkway project 1 will be eliminated by future revenues or transfers.
(14) Special Item
During fiscal year 2014, the City was awarded a litigation settlement resulting from significant damage that occurred in fiscal year 2006 to a Power and Light RCT generating unit.
77
CITY OF INDEPENDENCE, MISSOURI
Notes to Financial Statements
June 30, 2014
(15) Fund Balance
Fund balances at year-end are as follows:
GovernmentalFunds
The outstanding encumbrances are amounts needed to pay any commitments related to purchase orders and contracts that remain unperformed at year-end. Totals above include encumbrances as follows: General Fund $505,811 and Non-major Funds $7,182,970
78
General TIFDebtService Nonmajor Total Fundbalances: Nonspendablefor: Prepaiditems $ 14,141 — — 14,141 Totalfundbalances nonspendable 14,141 — — 14,141 Restrictedfor: Protestedrevenues 29,027 — — 29,027 Policeequipment 373,872 — — 373,872 Tourism — — 585,689 585,689 Independencesquarebenefitdistrict — — 30,842 30,842 Grants — — 1,330 1,330 Licensesurcharge — — 994,568 994,568 Streetsalestax — — 3,716,655 3,716,655 Stormwatersalestax — — 8,358,432 8,358,432 Policesalestax — — 2,356,260 2,356,260 Firesalestax — — 896,496 896,496 Debtservicefund — — 84,667 84,667 TIFdebtservice — 27,654,533 — 27,654,533 Totalfundbalances restricted 402,899 27,654,533 17,024,939 45,082,371 Committedfor: Domesticviolence 14,474 — — 14,474 Capitalprojects 46,080 — 204,117 250,197 Strategicgoals 265,278 — — 265,278 Vandalismreward 3,000 — — 3,000 Economicdevelopment 108,251 — — 108,251 Totalfundbalances committed 437,083 — 204,117 641,200 Assignedfor: Encumbrances: Professionalservices 150,042 — — 150,042 Capitaloutlay/equipment 122,086 — — 122,086 Supplies 40,564 — — 40,564 Maintenance 36,610 — — 36,610 Communicationservices 27,460 — — 27,460 Miscellaneous 21,521 — — 21,521 Totalfundbalances assigned 398,283 — — 398,283 Unassigned 3,591,990 (938,970) (5,228,273) (2,575,253) Totalfundbalance $ 4,844,396 26,715,563 12,000,783 43,560,742
Required Supplementary Information
CITY OF INDEPENDENCE, MISSOURI
Notes to Budgetary Comparison Schedules
Year ended June 30, 2014
(1) Budgets and Budgetary Accounting
The City follows these procedures in establishing the budgetary data reflected in the accompanying government-wide financial statements:
Prior to May 15, the City Manager submits to the City Council a proposed operating budget for the fiscal year commencing the following July 1. The operating budget includes proposed expenditures and the means of financing them.
Public hearings are conducted to obtain taxpayer comments.
Prior to June 27, the City Council adopts the budget. If the City Council fails to adopt the budget on or before that date, the budget, as submitted or amended, goes into effect.
The City Manager is authorized to transfer budgeted amounts between divisions of a department within any fund; however, any revisions that alter the total appropriations within any fund, or that transfer appropriations between departments, must be approved by the City Council. The 2013-2014 budget was amended during the year for transfers and supplemental appropriations. The budget amendments were approved by the City Council.
Expenditures may not exceed appropriations for any department without City Council approval. Unencumbered appropriations lapse at year-end.
Formal budgets are used as a control device for most funds; however, there is no requirement to report on the budget. Therefore, the financial statements include a comparison of budget to actual only for the General, Tourism, Community Development Block Grant, Rental Rehabilitation, Street Improvement Sales Tax, Park Improvements Sales Tax , Storm Water Sales Tax, Police Public Safety Sales Tax, Fire Public Safety Sales Tax, and Grant Funds. Annual operating budgets are not prepared for Capital Projects Funds, although budgets on a project basis are prepared.
The City’s policy is to prepare the annual operating budget on a basis which includes encumbrances as the equivalent of expenditures. The budgetary comparison schedules are prepared on this basis. Certain reclassifications between budgeted revenues and transfers have been made to facilitate the comparison with actual operations.
79
CITYOFINDEPENDENCE,MISSOURI BudgetaryComparisonSchedule
Exhibit10
GeneralFund YearendedJune30,2014 Actual Variance BudgetedAmounts Amounts withFinal Original Final (BudgetBasis) Budget Revenues: Taxes $ 35,815,078 35,815,078 34,855,329 (959,749) Licensesandpermits 3,259,145 3,259,145 3,273,979 14,834 Stateandcountysharedrevenue 5,209,832 5,209,832 5,157,129 (52,703) Chargesforcurrentservices 1,957,418 1,962,262 1,940,920 (21,342) Interfundchargesforsupportservices 4,072,304 4,072,304 3,987,029 (85,275) Finesandforfeitures 4,864,348 4,864,348 4,790,383 (73,965) Otherrevenue 556,285 600,986 665,327 64,341 Totalrevenues 55,734,410 55,783,955 54,670,096 (1,113,859) Otherfinancingsources: Paymentsinlieuoftaxes 18,423,580 18,423,580 18,144,063 (279,517) Totalotherfinancingsources 18,423,580 18,423,580 18,144,063 (279,517) Specialitems: Litigationsettlement — — 2,203,430 2,203,430 Totalspecialitems — — 2,203,430 2,203,430 Totalrevenues,otherfinancingsourcesandspecialitems 74,157,990 74,207,535 75,017,589 810,054 Expenditures: CityCouncil 416,575 443,256 443,252 4 CityClerk 410,342 416,984 416,859 125 CityManager 852,378 862,924 862,627 297 NationalFrontierTrailsMuseum 334,312 340,710 312,593 28,117 Technologyservices 1,632,191 1,659,863 1,627,925 31,938 Municipalcourt 826,997 843,711 793,317 50,394 Law 669,855 679,643 677,186 2,457 80 Finance 1,891,244 2,026,669 2,026,664 5 Humanresources 385,091 441,117 429,740 11,377 Communitydevelopment 2,695,888 3,086,604 3,086,604 — Police 26,422,081 26,715,978 26,407,530 308,448 Fire 16,440,900 16,645,755 16,643,899 1,856 Health 2,603,548 2,646,920 2,554,644 92,276 Publicworks 5,831,146 5,884,827 5,550,244 334,583 Parksandrecreation 1,597,731 1,616,775 1,494,014 122,761 Generalgovernment 8,228,443 7,579,694 7,525,446 54,248 CityCouncilstrategicgoals 250,000 428,996 265,502 163,494 Capitaloutlay 374,848 374,848 272,979 101,869 Totalexpenditures 71,863,570 72,695,274 71,391,025 1,304,249 Otherfinancinguses: Paymentstocomponentunit 710,679 710,679 710,679 — Transfersout 10,000 10,000 10,000 — Totalexpendituresandotherfinancinguses 72,584,249 73,415,953 72,111,704 1,304,249 Excessofrevenueandotherfinancing sourcesover(under)expendituresand otherfinancinguses $ 1,573,741 791,582 2,905,885 2,114,303 Unassignedfundbalanceatbeginningofyear 600,662 Cancellationofprioryearencumbrances 128,426 Changeinotherfundbalancecomponentsduringtheyear (42,983) Unassignedfundbalanceatendofyear $ 3,591,990
CITYOFINDEPENDENCE,MISSOURI BudgetaryBasisReconciliationSchedule
GeneralFund
YearendedJune30,2014
TheStatementofRevenues,Expenditures,andChangesinFundBalances-GovernmentalFundsdoesnot includeencumbrancesoutstandingatyear-endasexpendituresbecauseencumbrancesarereportedas reservationsoffundbalancesinaccordancewithGAAPforthemodifiedaccrualbasisofaccounting. Adjustmentsnecessarytoconverttheresultsofoperationsunderthemodifiedaccrualbasistothebudget basisareincludedasreconcilingitemsonthefollowingbudget-basisstatement:
Exhibit10.1
General Fund Sources/inflowsofresources: Actualamounts(budgetarybasis)fortotalrevenuesfromthebudgetary comparisonschedule $ 75,017,589 Basisdifferences–budgettoGAAP: None — Totalrevenuesasreportedonthestatementofrevenues,expenditures, andchangesinfundbalances–governmentalfunds $ 75,017,589 Uses/outflowsofresources: Actualamounts(budgetarybasis)fortotalexpendituresfromthebudgetary comparisonschedule $ 71,391,025 Basisdifferences–budgettoGAAP: Outstandingencumbrancesatyear-endchargedtothecurrentyear’sbudget (448,820) Currentyearexpendituresofencumbrancesoutstandingattheendoftheprior 384,364 81 fiscalyearTotalexpendituresasreportedonthestatementofrevenues,expenditures, andchangesinfundbalances–governmentalfunds(GAAPbasis) $ 71,326,569
TheaboveassetsandactuarialaccruedliabilitydonotincludetheassetsandpresentvalueofbenefitsassociatedwiththeBenefit ReserveFundandtheCasualtyReserveFund.TheactuarialassumptionswerechangedinconjunctionwiththeFebruary28,2011 annualvaluations.Foracompletedescriptionoftheactuarialassumptionsusedintheannualvaluations,pleasecontactLAGERS’s officeinJeffersonCityatP.O.Box1665JeffersonCity,Missouri65102ortelephone1-800-447-4334.
Exhibit11
ScheduleofFundingProgress: LAGERSRetirementPlan (b)–(a) Unfunded (b) (assetsin (b)–(a)/(c) (a) Entry-Age excessof) (c) UALasa Actuarial Actuarial Accrued (a)/(b) Annual Percentage Actuarial Valueof Accrued Liability Funded Covered ofCovered ValuationDate Assets Liability (UAL) Ratio Payroll Payroll RetirementPlanFebruary29,2012 125,863,329 210,700,773 84,837,444 60% 65,208,725 130% 124,786,458 215,306,565 90,520,107 58% 66,004,494 137% 125,226,912 223,456,945 98,230,033 56% 69,463,809 141%
CITYOFINDEPENDENCE,MISSOURI ScheduleofFundingProgress RetirementPlanandOtherPostEmploymentBenefitPlan
OtherPostEmploymentBenefits (b)–(a) (b) Unfunded (b)–(a)/(c) (a) Actuarial Actuarial (c) UAALasa Actuarial Accrued Accrued (a)/(b) Annual Percentage Actuarial Valueof Liability Liability Funded Covered ofCovered ValuationDate Assets (AAL) (UAAL) Ratio Payroll Payroll February28,2013 February28,2014 82 January1,2009 — 198,767,219 198,767,219 0% 61,350,244 324% January1,2011 — 246,341,296 246,341,296 0% 65,353,754 377% January1,2013 — 263,513,494 263,513,494 0% 59,861,860 440%
Nonmajor Governmental Funds Special Revenue Funds
Special Revenue Funds are used to account for specific revenues that are legally restricted to expenditures for particular purposes.
Tourism – This fund is used to account for expenditures for tourism that are financed out of the transient guest tax.
Independence Square Benefit District – This fund is used to account for expenditures to improve the City’s downtown business district that are financed by a special property tax levy on those businesses which are benefited.
Community Development Grant Act – This fund is used to account for all projects that are funded by the Federal Community Development Block Grant.
Rental Rehabilitation – This fund is used to account for expenditures to improve rental property within the City that are funded by state and federal grants.
Street Improvement Sales Tax – This fund is used to account for all street projects that are funded by the three-eighths cent street improvement sales tax.
Park Improvement Sales Tax Fund – This fund accounts for all park projects that are funded by the onequarter cent park improvement sales tax.
Storm Water Sales Tax – This fund is used to account for all storm water projects that are funded by the one-fourth cent storm water sales tax.
Police Sales Tax – This fund is used to account for receipts and expenditures of the City’s sales tax for police protection services.
Fire Sales Tax – This fund is used to account for receipts and expenditures of the City’s sales tax for fire protection services.
License Surcharge – This fund is used to account for street improvements funded by an excise tax that is based on increased traffic flow relating to new development.
Grant Fund – This fund is used to account for expenditures that are funded by grants.
Capital Projects Funds
Capital Project Funds are used to account for the acquisition and construction of major capital facilities other than those financed by the proprietary funds or trust funds.
Street Improvements Fund – This fund is used to account for major street improvement construction projects. Revenues received by this fund come primarily from a sales tax allocation for capital improvements and from federal and state grants and other contributions.
Revolving Public Improvements – This fund, which is legally mandated by City Charter, is used to account for the cost of public works or improvements funded by special assessments.
CITY OF INDEPENDENCE, MISSOURI
CITY OF INDEPENDENCE, MISSOURI
Building and Other Improvements – This fund is used to account for the acquisition, construction, and improvement of nonproprietary buildings and facilities of the City.
Storm Drainage – This fund is used to account for the acquisition and construction of the City’s infrastructure to control the run-off surface water.
Park Improvements – This fund is used to account for the acquisition and construction of the City’s parkland.
Debt Service Fund
The debt service fund accounts for the resources accumulated and payments made for principal and interest on long-term general obligation debt of governmental funds.
Exhibit12
CombiningBalanceSheet NonmajorGovernmentalFunds June30,2014 Special Capital TotalNonmajor Revenue Projects DebtService Governmental Assets (Exhibit14) (Exhibit27) Fund Funds Pooledcashandinvestments $ 9,189,795 82,856 — 9,272,651 Receivables: Taxes 3,742,424 — — 3,742,424 Accounts 25,906 — — 25,906 Specialassessmentprincipaland accruedinterest — 461,180 559,128 1,020,308 Duefromotherfunds 5,478,181 — — 5,478,181 Duefromothergovernments 538,856 1,273,042 — 1,811,898 Restrictedassets — 134,258 94,000 228,258 Totalassets $ 18,975,162 1,951,336 653,128 21,579,626 LiabilitiesandFundBalances Liabilities: Accountsandcontractspayable $ 938,425 158,075 — 1,096,500 Duetootherfunds 5,467,420 1,372,173 9,333 6,848,926 Accrueditems 157,990 — — 157,990 Othercurrentliabilities 2,309 — — 2,309 Unearnedrevenue 452,810 — — 452,810 Totalliabilities 7,018,954 1,530,248 9,333 8,558,535 Deferredinflowsofresources: Unavailablerevenue-specialassessments — 461,180 559,128 1,020,308 Totaldeferredinflowsofresources — 461,180 559,128 1,020,308 Fundbalances: Restricted 16,940,272 — 84,667 17,024,939 Committed — 204,117 — 204,117 Unassigned (4,984,064) (244,209) — (5,228,273) Totalfundbalances 11,956,208 (40,092) 84,667 12,000,783 $ 18,975,162 1,951,336 653,128 21,579,626 Totalliabilities,deferredinflowsof resourcesandfundbalances 83
CITYOFINDEPENDENCE,MISSOURI
Exhibit13
NonmajorGovernmentalFunds YearendedJune30,2014 Special Capital TotalNonmajor Revenue Projects DebtService Governmental (Exhibit15) (Exhibit28) Fund Funds Revenues: Taxes $ 21,042,734 — — 21,042,734 Licensesandpermits 190,652 — — 190,652 Intergovernmental 5,245,462 3,269,939 — 8,515,401 Chargesforservices 635,600 9,047 114,246 758,893 Investmentincome 6,465 280 1,068 7,813 Other 743,561 52,120 — 795,681 Totalrevenues 27,864,474 3,331,386 115,314 31,311,174 Expenditures: Current: Administrativeservices 16,190 — — 16,190 Publicsafety 6,135,857 — — 6,135,857 Publicworks 299,628 — — 299,628 Healthandwelfare 777,709 — — 777,709 Cultureandrecreation 4,261,904 — — 4,261,904 Communitydevelopment 2,980,621 — — 2,980,621 Stormwater 1,686,782 — — 1,686,782 Generalgovernment 18,075 — 987 19,062 Capitaloutlay 7,535,733 4,467,078 — 12,002,811 Debtservice: Principal 1,488,051 — 75,000 1,563,051 Interestandfiscalagentfees 215,724 — 28,065 243,789 Totalexpenditures 25,416,274 4,467,078 104,052 29,987,404 Excess(deficiency)ofrevenues overexpenditures 2,448,200 (1,135,692) 11,262 1,323,770 Otherfinancingsources(uses): Proceedsfromcapitalleases/bondissuance 96,126 — — 96,126 Transfersin — 897,947 — 897,947 Transfersout (1,244,095) — — (1,244,095) Totalotherfinancingsources(uses) (1,147,969) 897,947 — (250,022) Netchangeinfundbalances 1,300,231 (237,745) 11,262 1,073,748 Fundbalances,beginning 10,655,977 197,653 73,405 10,927,035 Fundbalances,ending $ 11,956,208 (40,092) 84,667 12,000,783 84
CITYOFINDEPENDENCE,MISSOURI CombiningStatementofRevenues,Expenditures,andChangesinFundBalances
Exhibit14 CITYOFINDEPENDENCE,MISSOURI CombiningBalanceSheet NonmajorSpecialRevenueFunds June30,2014 Independence Community CombinedSales SquareBenefit Development Rental TaxFunds License Assets Tourism District GrantAct Rehabilitation (Exhibit25) Surcharge Grants Total Pooledcashandinvestments $ 424,829 23,655 11,669 — 7,717,386 994,568 17,688 9,189,795 Receivables:Taxes 165,000 7,187 — — 3,570,237 — — 3,742,424 Accounts 1,525 — — — — — 24,381 25,906 Duefromotherfunds — — — — 5,478,181 — — 5,478,181 Duefromothergovernments 49,000 — 15,465 5,997 — — 468,394 538,856 Totalassets $ 640,354 30,842 27,134 5,997 16,765,804 994,568 510,463 18,975,162 LiabilitiesandFundBalances Liabilities:Accountsandcontractspayable $ 35,578 — 15,441 — 847,360 — 40,046 938,425 Duetootherfunds — — — 5,394 5,462,026 — — 5,467,420 Accrueditems 17,993 — 10,370 — 112,020 — 17,607 157,990 Othercurrentliabilities 1,094 — — 596 619 — — 2,309 Unearnedrevenue — — — — — — 452,810 452,810 Totalliabilities 54,665 — 25,811 5,990 6,422,025 — 510,463 7,018,954 Fundbalances:Restricted 585,689 30,842 1,323 7 15,327,843 994,568 — 16,940,272 Unassigned — — — — (4,984,064) — — (4,984,064) 85 Totalfundbalances 585,689 30,842 1,323 7 10,343,779 994,568 — 11,956,208 Totalliabilitiesandfundbalances $ 640,354 30,842 27,134 5,997 16,765,804 994,568 510,463 18,975,162
Exhibit15
CombiningStatementofRevenues,Expenditures,andChangesinFundBalances NonmajorSpecialRevenueFunds YearendedJune30,2014 Independence Community CombinedSales SquareBenefit Development Rental TaxFunds License Tourism District GrantAct Rehabilitation (Exhibit26) Surcharge Grants Total Revenues: Taxes $ 1,468,758 23,834 — — 19,550,142 — — 21,042,734 Licensesandpermits — — — — — 190,652 — 190,652 Intergovernmental 58,300 — 540,579 707,436 — — 3,939,147 5,245,462 Chargesforservices — — — — 402,723 — 232,877 635,600 Investmentincome 208 268 — — 5,400 589 — 6,465 Other 5,915 — — — 197,202 — 540,444 743,561 Totalrevenues 1,533,181 24,102 540,579 707,436 20,155,467 191,241 4,712,468 27,864,474 Expenditures:Current: Administrativeservices — — — — — — 16,190 16,190 Publicsafety — — — — 4,381,410 — 1,754,447 6,135,857 PublicWorks — — — — 299,628 — — 299,628 Healthandwelfare — — — — — — 777,709 777,709 Cultureandrecreation 1,455,328 — — — 2,375,060 — 431,516 4,261,904 Communitydevelopment — — 540,579 707,436 — — 1,732,606 2,980,621 Stormwater — — — — 1,686,782 — — 1,686,782 Generalgovernment — — — — 18,075 — — 18,075 Capitaloutlay — 381 — — 7,535,352 — — 7,535,733 86 Debtservice: Principal — — — — 1,488,051 — — 1,488,051 Interestandfiscalagentfees — — — — 215,724 — — 215,724 Totalexpenditures 1,455,328 381 540,579 707,436 18,000,082 — 4,712,468 25,416,274 77,853 23,721 — — 2,155,385 191,241 — 2,448,200 Otherfinancingsources(uses): Proceedsfrombondissuance — — — — 96,126 — — 96,126 Transfersout (286,963) — — — (417,577) (539,555) — (1,244,095) Totalotherfinancingsources(uses) (286,963) — — — (321,451) (539,555) — (1,147,969) Netchangeinfundbalances (209,110) 23,721 — — 1,833,934 (348,314) — 1,300,231 Fundbalances,beginning 794,799 7,121 1,323 7 8,509,845 1,342,882 — 10,655,977 Fundbalances,ending $ 585,689 30,842 1,323 7 10,343,779 994,568 — 11,956,208 Excess(deficiency)ofrevenues overexpenditures
CITYOFINDEPENDENCE,MISSOURI
CITYOFINDEPENDENCE,MISSOURI BudgetaryComparisonSchedule
Exhibit16
TourismFund YearendedJune30,2014 Actual Variance BudgetedAmounts Amounts withFinal Original Final (BudgetBasis) Budget Revenues: Transientguesttaxes $ 1,200,000 1,200,000 1,468,758 268,758 Interest 700 700 208 (492) Grants–federal,state,andlocal 100,000 100,000 58,300 (41,700) Otherrevenue 500 500 5,915 5,415 Totalrevenues 1,301,200 1,301,200 1,533,181 231,981 Expenditures: Tourism 1,298,159 1,503,100 1,482,763 20,337 Totalexpenditures 1,298,159 1,503,100 1,482,763 20,337 Otherfinancinguses–transfersout — — 286,963 (286,963) Totalotherfinancinguses — — 286,963 (286,963) Totalexpendituresandotheruses 1,298,159 1,503,100 1,769,726 (266,626) Excessofrevenuesover(under) 87 expenditures $ 3,041 (201,900) (236,545) 498,607 Restrictedfundbalanceatbeginningofyear 794,799 Cancellationofprioryearencumbrances 11,525 Increase(Decrease)inPriorYear 15,910 Encumbrances Restrictedfundbalanceatendofyear $ 585,689
CITYOFINDEPENDENCE,MISSOURI BudgetaryBasisReconciliationSchedule
(1)Encumbrancesforsuppliesandequipmentorderedbutnotreceivedarereportedintheyeartheorder isplacedforbudgetarypurposes,butintheyearthesuppliesarereceivedforfinancialreporting
purposes.
Exhibit16.1
TourismFund YearendedJune30,2014 Tourism Fund Sources/inflowsofresources: Actualamounts(budgetarybasis)fortotalrevenuesfromthebudgetary comparisonschedule $ 1,533,181 Basisdifferences–budgettoGAAP: None — Totalrevenuesasreportedonthestatementofrevenues,expenditures, andchangesinfundbalances–governmentalfunds $ 1,533,181 Uses/outflowsofresources: Actualamounts(budgetarybasis)fortotalexpendituresfromthebudgetary comparisonschedule $ 1,482,763 Basisdifferences–budgettoGAAP: Outstandingencumbrancesatyear-endchargedtothecurrentyear’sbudget(1) (93,471) Currentyearexpendituresofencumbrancesoutstandingattheendoftheprior fiscalyear(1) 66,036 Totalexpendituresasreportedonthestatementofrevenues,expenditures, andchangesinfundbalances–governmentalfunds $ 1,455,328
88
CITYOFINDEPENDENCE,MISSOURI BudgetaryComparisonSchedule
(1)ThisamountrepresentstransactionsincludedintheExcessofRevenuesover(under) ExpendituresandOtherFinancingUsesamountlistedabovethataffectedFundBalance componentsotherthantheUndesignatedFundBalanceortransactionsthatwererecorded directlyfromtheUndesignatedFundBalanceaccounttootherFundBalancecomponentaccounts.
Exhibit17 Actual Variance BudgetedAmounts Amounts withFinal Original Final (BudgetBasis) Budget Revenues: Federalgrant-CDBG $ 578,000 578,000 540,579 (37,421) Totalrevenues 578,000 578,000 540,579 (37,421) Expenditures: CDBGadministration 157,633 157,768 86,885 70,883 CDBGexpenditures 420,367 965,123 587,415 377,708 Commercialfacadeprogram — 75,165 — 75,165 Totalexpenditures 578,000 1,198,056 674,300 523,756 Excessofrevenuesover(under) expendituresandother financinguses $ — (620,056) (133,721) 486,335 Restrictedfundbalanceatbeginningofyear 1,323 Cancellationofprioryearencumbrances —
CommunityDevelopmentBlockGrantFund YearendedJune30,2014 89 Increase(Decrease)inPriorYear Encumbrances 133,721 Restrictedfundbalanceatendofyear $ 1,323
CITYOFINDEPENDENCE,MISSOURI BudgetaryBasisReconciliationSchedule
(1)Encumbrancesforsuppliesandequipmentorderedbutnotreceivedarereportedintheyeartheorder isplacedforbudgetarypurposes,butintheyearthesuppliesarereceivedforfinancialreporting purposes.
Exhibit17.1
CommunityDevelopmentBlockGrantFund YearendedJune30,2014 CommunityDevelopment BlockGrant Sources/inflowsofresources: Actualamounts(budgetarybasis)fortotalrevenuesfromthebudgetary comparisonschedule $ 540,579 Basisdifferences–budgettoGAAP: None
Totalrevenuesasreportedonthestatementofrevenues,expenditures, andchangesinfundbalances–governmentalfunds $ 540,579 Uses/outflowsofresources: Actualamounts(budgetarybasis)fortotalexpendituresfromthebudgetary comparisonschedule $ 674,300 Basisdifferences–budgettoGAAP: Outstandingencumbrancesatyear-endchargedtothecurrentyear’sbudget(1) (133,721) Currentyearexpendituresofencumbrancesoutstandingattheendoftheprior fiscalyear(1) — Totalexpendituresasreportedonthestatementofrevenues,expenditures, andchangesinfundbalances–governmentalfunds $ 540,579
—
90
(1)ThisamountrepresentstransactionsincludedintheExcessofRevenuesover(under) ExpendituresamountlistedabovethataffectedFundBalancecomponentsotherthanthe UndesignatedFundBalanceortransactionsthatwererecordeddirectlyfromtheUndesignated FundBalanceaccounttootherFundBalancecomponentaccounts.
Exhibit18 Actual Variance BudgetedAmounts Amounts withFinal Original Final (BudgetBasis) Budget Revenues: HOMEprogramgrant $ 300,000 300,000 707,436 407,436 Totalrevenues 300,000 300,000 707,436 407,436 Expenditures: HOMEadministration 30,000 32,239 1,022 31,217 Multifamilyhousing 225,000 694,870 694,869 1 Communityhousingdevelopment 45,000 164,250 161,932 2,318 Totalexpenditures 300,000 891,359 857,823 33,536 Excessofrevenuesover(under) expenditures $ — (591,359) (150,387) 440,972 Restrictedfundbalanceatbeginningofyear 7 Cancellationofprioryearencumbrances —
RentalRehabilitation YearEndedJune30,2014 91 Increase(Decrease)inPriorYear Encumbrances 150,387 Restrictedfundbalanceatendofyear $ 7
CITYOFINDEPENDENCE,MISSOURI BudgetaryComparisonSchedule
(1)Encumbrancesforsuppliesandequipmentorderedbutnotreceivedarereportedintheyeartheorder isplacedforbudgetarypurposes,butintheyearthesuppliesarereceivedforfinancialreporting
purposes.
Exhibit18.1
RentalRehabilitation YearendedJune30,2014 Rental Rehabilitation Sources/inflowsofresources: Actualamounts(budgetarybasis)fortotalrevenuesfromthebudgetary comparisonschedule $ 707,436 Basisdifferences–budgettoGAAP: None — Totalrevenuesasreportedonthestatementofrevenues,expenditures, andchangesinfundbalances–governmentalfunds $ 707,436 Uses/outflowsofresources: Actualamounts(budgetarybasis)fortotalexpendituresfromthebudgetary comparisonschedule $ 857,823 Basisdifferences–budgettoGAAP: Outstandingencumbrancesatyear-endchargedtothecurrentyear’sbudget(1) (150,387) Currentyearexpendituresofencumbrancesoutstandingattheendoftheprior fiscalyear(1) — Totalexpendituresasreportedonthestatementofrevenues,expenditures, andchangesinfundbalances–governmentalfunds $ 707,436
CITYOFINDEPENDENCE,MISSOURI BudgetaryBasisReconciliationSchedule
92
CITYOFINDEPENDENCE,MISSOURI BudgetaryComparisonSchedule
(1)ThisamountrepresentstransactionsincludedintheExcessofRevenuesandOtherFinancing sourcesover(under)ExpendituresamountlistedabovethataffectedFundBalancecomponentsother thantheUndesignatedFundBalanceortransactionsthatwererecordeddirectlyfromthe UndesignatedFundBalanceaccounttootherFundBalancecomponentaccounts.
Exhibit19 Actual Variance BudgetedAmounts Amounts withFinal Original Final (BudgetBasis) Budget Revenues: Salestaxes $ 7,839,896 7,839,896 7,767,525 (72,371) Interest 1,000 1,000 781 (219) Otherrevenue — — 50,000 50,000 Totalrevenues 7,840,896 7,840,896 7,818,306 (22,590) Expenditures: GeneralGovernment 13,200 13,200 12,049 1,151 Streetmaintenance 300,428 300,428 300,416 12 Capitaloutlay 7,090,000 9,184,208 6,475,965 2,708,243 Debtservice 531,069 531,069 530,569 500 Totalexpenditures 7,934,697 10,028,905 7,318,999 2,709,906 Otherfinancinguses: Transfersout — — 66,494 (66,494) Totalotherfinancinguses — — 66,494 (66,494) Totalexpendituresandotherfinancinguses 7,934,697 10,028,905 7,385,493 2,643,412 Excessofrevenuesandotherfinancing sourcesover(under)expenditures $ (93,801) (2,188,009) 432,813 2,620,822
StreetImprovementsSalesTaxFund YearendedJune30,2014 93 Restrictedfundbalanceatbeginningofyear 2,846,198 Cancellationofprioryearencumbrances — Increase(Decrease)inPriorYear Encumbrances 437,644 Restrictedfundbalanceatendofyear $ 3,716,655
(1)Encumbrancesforsuppliesandequipmentorderedbutnotreceivedarereportedintheyeartheorder isplacedforbudgetarypurposes,butintheyearthesuppliesarereceivedforfinancialreporting purposes.
Exhibit19.1
StreetImprovementsSalesTaxFund YearendedJune30,2014 StreetsImprovements SalesTax Sources/inflowsofresources: Actualamounts(budgetarybasis)fortotalrevenuesfromthebudgetary comparisonschedule $ 7,818,306 Basisdifferences–budgettoGAAP: None — Totalrevenuesasreportedonthestatementofrevenues,expenditures, andchangesinfundbalances–governmentalfunds $ 7,818,306 Uses/outflowsofresources: Actualamounts(budgetarybasis)fortotalexpendituresfromthebudgetary comparisonschedule $ 7,318,999 Basisdifferences–budgettoGAAP: Outstandingencumbrancesatyear-endchargedtothecurrentyear’sbudget(1) (437,644) Currentyearexpendituresofencumbrancesoutstandingattheendoftheprior — fiscalyear(1) Totalexpendituresasreportedonthestatementofrevenues,expenditures, andchangesinfundbalances–governmentalfunds $ 6,881,355
CITYOFINDEPENDENCE,MISSOURI BudgetaryBasisReconciliationSchedule
94
(1)ThisamountrepresentstransactionsincludedintheExcessofRevenuesandOtherFinancing sourcesover(under)ExpendituresamountlistedabovethataffectedFundBalancecomponentsother thantheUndesignatedFundBalanceortransactionsthatwererecordeddirectlyfromthe UndesignatedFundBalanceaccounttootherFundBalancecomponentaccounts.
Exhibit20 Actual Variance BudgetedAmounts Amounts withFinal Original Final (BudgetBasis) Budget Revenues: Salestaxes $ 3,919,948 3,919,948 3,884,655 (35,293) Publichealthandrecreation — 67,000 121,451 54,451 AdventureOasisWaterPark 480,000 480,000 284,910 (195,090) Otherrevenue 106,000 39,000 (3,638) (42,638) Totalrevenues 4,505,948 4,505,948 4,287,378 (218,570) Otherfinancingsources: Proceedsfrombondissuance/capitallease — — 96,126 96,126 Totalotherfinancingsources — — 96,126 96,126 Totalrevenuesandotherfinancingsources 4,505,948 4,505,948 4,383,504 (122,444) Expenditures: Cultureandrecreation 2,543,193 2,543,193 2,440,528 102,665 Generalgovernment 6,800 6,800 6,025 775 Capitaloutlay 750,000 1,168,211 488,626 679,585 Debtservice — — 115,726 (115,726) Totalexpenditures 3,299,993 3,718,204 3,050,905 667,299 Excessofrevenuesandotherfinancing sourcesover(under)expenditures $ 1,205,955 787,744 1,332,599 544,855
ParkImprovementsSalesTaxFund YearendedJune30,2014 95 Restrictedfundbalance(deficit)atbeginningofyear (6,382,130) Cancellationofprioryearencumbrances 2,474 Increase(Decrease)inPriorYear Encumbrances 62,993 Restrictedfundbalance(deficit)atendofyear $(4,984,064)
CITYOFINDEPENDENCE,MISSOURI BudgetaryComparisonSchedule
(1)Encumbrancesforsuppliesandequipmentorderedbutnotreceivedarereportedintheyeartheorder isplacedforbudgetarypurposes,butintheyearthesuppliesarereceivedforfinancialreporting purposes.
Exhibit20.1
ParkImprovementsSalesTaxFund YearendedJune30,2014 ParkImprovements SalesTax Sources/inflowsofresources: Actualamounts(budgetarybasis)fortotalrevenuesfromthebudgetary comparisonschedule $ 4,287,378 Basisdifferences–budgettoGAAP: None — Totalrevenuesasreportedonthestatementofrevenues,expenditures, andchangesinfundbalances–governmentalfunds $ 4,287,378 Uses/outflowsofresources: Actualamounts(budgetarybasis)fortotalexpendituresfromthebudgetary comparisonschedule $ 3,050,905 Basisdifferences–budgettoGAAP: Outstandingencumbrancesatyear-endchargedtothecurrentyear’sbudget(1) (194,123) Currentyearexpendituresofencumbrancesoutstandingattheendoftheprior fiscalyear(1) 128,656 Totalexpendituresasreportedonthestatementofrevenues,expenditures, andchangesinfundbalances–governmentalfunds $ 2,985,438
CITYOFINDEPENDENCE,MISSOURI BudgetaryBasisReconciliationSchedule
96
CITYOFINDEPENDENCE,MISSOURI BudgetaryComparisonSchedule
(1)ThisamountrepresentstransactionsincludedintheExcessofRevenuesover(under) ExpendituresamountlistedabovethataffectedFundBalancecomponentsotherthanthe UndesignatedFundBalanceortransactionsthatwererecordeddirectlyfromtheUndesignated FundBalanceaccounttootherFundBalancecomponentaccounts.
Exhibit21 Actual Variance BudgetedAmounts Amounts withFinal Original Final (BudgetBasis) Budget Revenues: Salestaxes $ 3,919,948 3,919,948 3,884,641 (35,307) Interest 5,000 5,000 3,169 (1,831) Otherrevenue — — 28,657 28,657 Totalrevenues 3,924,948 3,924,948 3,916,467 (8,481) Expenditures: Stormwater Administration 312,877 312,677 167,275 145,402 Maintenance 1,553,261 1,553,261 1,112,761 440,500 Permitcompletion 349,175 349,175 345,350 3,825 Generalgovernment 6,800 7,000 6,025 975 Capitaloutlay 2,190,000 6,496,984 925,221 5,571,763 Totalexpenditures 4,412,113 8,719,097 2,556,632 6,162,465 Otherfinancinguses: Transfersout 351,083 351,083 351,083 — Totalotherfinancinguses 351,083 351,083 351,083 — Totalexpendituresandotherfinancinguses 4,763,196 9,070,180 2,907,715 6,162,465 Excessofrevenuesover(under)expenditures $ (838,248) (5,145,232) 1,008,752 6,153,984
StormWaterSalesTaxFund YearEndedJune30,2014 97 Restrictedfundbalanceatbeginningofyear 7,405,051 Cancellationofprioryearencumbrances 52,568 Increase(Decrease)inPriorYear Encumbrances (107,939) Restrictedfundbalanceatendofyear $ 8,358,432
CITYOFINDEPENDENCE,MISSOURI BudgetaryBasisReconciliationSchedule
(1)Encumbrancesforsuppliesandequipmentorderedbutnotreceivedarereportedintheyeartheorder isplacedforbudgetarypurposes,butintheyearthesuppliesarereceivedforfinancialreporting
purposes.
Exhibit21.1
StormWaterSalesTaxFund YearendedJune30,2014 StormWater SalesTax Sources/inflowsofresources: Actualamounts(budgetarybasis)fortotalrevenuesfromthebudgetary comparisonschedule $ 3,916,467 Basisdifferences–budgettoGAAP: None — Totalrevenuesasreportedonthestatementofrevenues,expenditures, andchangesinfundbalances–governmentalfunds $ 3,916,467 Uses/outflowsofresources: Actualamounts(budgetarybasis)fortotalexpendituresfromthebudgetary comparisonschedule $ 2,556,632 Basisdifferences–budgettoGAAP: Outstandingencumbrancesatyear-endchargedtothecurrentyear’sbudget(1) (108,313) Currentyearexpendituresofencumbrancesoutstandingattheendoftheprior fiscalyear(1) 163,684 Totalexpendituresasreportedonthestatementofrevenues,expenditures, andchangesinfundbalances–governmentalfunds $ 2,612,003
98
(1)ThisamountrepresentstransactionsincludedintheExcessofRevenuesover(under) ExpendituresandOtherFinancingUsesamountlistedabovethataffectedFundBalance componentsotherthantheUndesignatedFundBalanceortransactionsthatwererecorded directlyfromtheUndesignatedFundBalanceaccounttootherFundBalancecomponentaccounts.
Exhibit22 Actual Variance BudgetedAmounts Amounts withFinal Original Final (BudgetBasis) Budget Revenues: Salestaxes $ 2,095,033 2,095,033 2,069,621 (25,412) Investmentincome 1,650 1,650 845 (805) Otherrevenue — — 103,633 103,633 Totalrevenues 2,096,683 2,096,683 2,174,099 77,416 Expenditures: Publicsafety Communications 295,951 291,180 262,996 28,184 Facilities 868,000 911,319 999,801 (88,482) Equipment 1,210,488 1,215,170 1,154,869 60,301 Debtservice 517,113 517,113 515,038 2,075 Totalexpenditures 2,891,552 2,934,782 2,932,704 2,078 Excessofrevenuesover(under)expenditures andotherfinancinguses $ (794,869) (838,099) (758,605) 79,494 Restrictedfundbalanceatbeginningofyear 2,317,625 Cancellationofprioryearencumbrances 7,980
BudgetaryComparisonSchedule PolicePublicSafetySalesTaxFund YearEndedJune30,2014 99 Increase(Decrease)inPriorYear Encumbrances 789,260 RestrictedFundBalanceatendofyear $ 2,356,260
CITYOFINDEPENDENCE,MISSOURI
CITYOFINDEPENDENCE,MISSOURI BudgetaryBasisReconciliationSchedule
(1)Encumbrancesforsuppliesandequipmentorderedbutnotreceivedarereportedintheyeartheorder isplacedforbudgetarypurposes,butintheyearthesuppliesarereceivedforfinancialreporting purposes.
Exhibit22.1
PolicePublicSafetySalesTaxFund YearendedJune30,2014 PolicePublicSafety SalesTax Sources/inflowsofresources: Actualamounts(budgetarybasis)fortotalrevenuesfromthebudgetary comparisonschedule $ 2,174,099 Basisdifferences–budgettoGAAP: None — Totalrevenuesasreportedonthestatementofrevenues,expenditures, andchangesinfundbalances–governmentalfunds $ 2,174,099 Uses/outflowsofresources: Actualamounts(budgetarybasis)fortotalexpendituresfromthebudgetary comparisonschedule $ 2,932,704 Basisdifferences–budgettoGAAP: Outstandingencumbrancesatyear-endchargedtothecurrentyear’sbudget(1) (1,005,297) Currentyearexpendituresofencumbrancesoutstandingattheendoftheprior fiscalyear(1) 208,057 Totalexpendituresasreportedonthestatementofrevenues,expenditures, andchangesinfundbalances–governmentalfunds $ 2,135,464
100
CITYOFINDEPENDENCE,MISSOURI BudgetaryComparisonSchedule
(1)ThisamountrepresentstransactionsincludedintheExcessofRevenuesover(under) ExpendituresandOtherFinancingUsesamountlistedabovethataffectedFundBalance componentsotherthantheUndesignatedFundBalanceortransactionsthatwererecorded directlyfromtheUndesignatedFundBalanceaccounttootherFundBalancecomponentaccounts.
Exhibit23 Actual Variance BudgetedAmounts Amounts withFinal Original Final (BudgetBasis) Budget Revenues: Salestaxes $ 1,959,974 1,959,974 1,943,700 (16,274) Investmentincome 1,600 1,600 605 (995) Otherrevenue — — 14,912 14,912 Totalrevenues 1,961,574 1,961,574 1,959,217 (2,357) Expenditures: Publicsafety 1,394,800 1,502,615 1,502,612 3 Debtservice 555,963 587,893 587,891 2 Totalexpenditures 1,950,763 2,090,508 2,090,503 5 Excessofrevenuesover(under)expenditures andotherfinancinguses $ 10,811 (128,934) (131,286) (2,352) Restrictedfundbalanceatbeginningofyear 2,323,101 Cancellationofprioryearencumbrances 69,336 Increase(Decrease)inPriorYear
FirePublicSafetySalesTaxFund YearEndedJune30,2014 101 Encumbrances (1,364,655) Restrictedfundbalanceatendofyear $ 896,496
(1)Encumbrancesforsuppliesandequipmentorderedbutnotreceivedarereportedintheyeartheorder isplacedforbudgetarypurposes,butintheyearthesuppliesarereceivedforfinancialreporting purposes.
Exhibit23.1
FirePublicSafetySalesTaxFund YearendedJune30,2014 FirePublicSafety SalesTax Sources/inflowsofresources: Actualamounts(budgetarybasis)fortotalrevenuesfromthebudgetary comparisonschedule $ 1,959,217 Basisdifferences–budgettoGAAP: None — Totalrevenuesasreportedonthestatementofrevenues,expenditures, andchangesinfundbalances–governmentalfunds $ 1,959,217 Uses/outflowsofresources: Actualamounts(budgetarybasis)fortotalexpendituresfromthebudgetary comparisonschedule $ 2,090,503 Basisdifferences–budgettoGAAP: Outstandingencumbrancesatyear-endchargedtothecurrentyear’sbudget(1) (164,446) Currentyearexpendituresofencumbrancesoutstandingattheendoftheprior fiscalyear(1) 1,459,765 Totalexpendituresasreportedonthestatementofrevenues,expenditures, andchangesinfundbalances–governmentalfunds $ 3,385,822
CITYOFINDEPENDENCE,MISSOURI BudgetaryBasisReconciliationSchedule
102
CITYOFINDEPENDENCE,MISSOURI BudgetaryComparisonSchedule
(1)ThisamountrepresentstransactionsincludedintheExcessofRevenuesover(under) ExpendituresamountlistedabovethataffectedFundBalancecomponentsotherthanthe UndesignatedFundBalanceortransactionsthatwererecordeddirectlyfromtheUndesignated FundBalanceaccounttootherFundBalancecomponentaccounts.
Exhibit24 Actual Variance BudgetedAmounts Amounts withFinal Original Final (BudgetBasis) Budget Revenues: Grantsandothersharedrevenue $ 2,226,804 5,918,886 3,939,147 (1,979,739) Chargesforcurrentservices 79,633 233,107 232,877 (230) Interestincomeandotherrevenue 100,000 637,737 540,444 (97,293) Totalrevenues 2,406,437 6,789,730 4,712,468 (2,077,262) Expenditures: Lawdepartment 26,407 66,001 16,190 49,811 Policedepartment 438,445 1,921,991 1,387,298 534,693 Firedepartment 325,971 761,124 441,030 320,094 Publicworks — 7,000 7,000 — Healthdepartment 703,832 1,230,392 783,543 446,849 Communitydevelopment 911,782 2,373,928 2,165,790 208,138 Cultureandrecreation — 429,294 424,516 4,778 Totalexpenditures 2,406,437 6,789,730 5,225,367 1,564,363 Excessofrevenuesover(under)expenditures $ — — (512,899) (512,899) Restrictedfundbalanceatbeginningofyear —
GrantsFund YearEndedJune30,2014 103 Cancellationofprioryearencumbrances — Increase(Decrease)inPriorYear Encumbrances 512,899 Restrictedfundbalanceatendofyear $ —
(1)Encumbrancesforsuppliesandequipmentorderedbutnotreceivedarereportedintheyeartheorder isplacedforbudgetarypurposes,butintheyearthesuppliesarereceivedforfinancialreporting
purposes.
Exhibit24.1
YearendedJune30,2014 Grants Sources/inflowsofresources: Actualamounts(budgetarybasis)fortotalrevenuesfromthebudgetary comparisonschedule $ 4,712,468 Basisdifferences–budgettoGAAP: None — Totalrevenuesasreportedonthestatementofrevenues,expenditures, andchangesinfundbalances–governmentalfunds $ 4,712,468 Uses/outflowsofresources: Actualamounts(budgetarybasis)fortotalexpendituresfromthebudgetary comparisonschedule $ 5,225,367 Basisdifferences–budgettoGAAP: Outstandingencumbrancesatyear-endchargedtothecurrentyear’sbudget(1) (512,899) Currentyearexpendituresofencumbrancesoutstandingattheendoftheprior fiscalyear(1) — Totalexpendituresasreportedonthestatementofrevenues,expenditures, andchangesinfundbalances–governmentalfunds $ 4,712,468
CITYOFINDEPENDENCE,MISSOURI BudgetaryBasisReconciliationSchedule GrantsFund
104
Exhibit25
CombiningBalanceSheet NonmajorSalesTaxFunds June30,2014 Street Parks StormWater Police Fire Total Assets SalesTax SalesTax SalesTax SalesTax SalesTax (Exhibit14) Pooledcashandinvestments $ 2,364,987 — 2,427,521 2,032,523 892,355 7,717,386 Receivables: Taxes 1,420,953 710,534 710,534 372,726 355,490 3,570,237 Duefromotherfunds — — 5,478,181 — — 5,478,181 Totalassets $ 3,785,940 710,534 8,616,236 2,405,249 1,247,845 16,765,804 LiabilitiesandFundBalances Liabilities: Accountsandcontractspayable $ 64,803 171,444 210,775 48,989 351,349 847,360 Duetootherfunds — 5,462,026 — — — 5,462,026 Accrueditems 4,482 60,509 47,029 — — 112,020 Othercurrentliabilities — 619 — — — 619 Totalliabilities 69,285 5,694,598 257,804 48,989 351,349 6,422,025 Fundbalances: Restricted 3,716,655 — 8,358,432 2,356,260 896,496 15,327,843 Unassigned — (4,984,064) — — — (4,984,064) Totalfundbalances(deficit) 3,716,655 (4,984,064) 8,358,432 2,356,260 896,496 10,343,779 $ 3,785,940 710,534 8,616,236 2,405,249 1,247,845 16,765,804 Totalliabilitiesandfundbalances 105
CITYOFINDEPENDENCE,MISSOURI
CITYOFINDEPENDENCE,MISSOURI CombiningStatementofRevenues,Expenditures,andChangesinFundBalances
Exhibit26
NonmajorSalesTaxFunds YearendedJune30,2014 Park Street Improvements StormWater Police Fire Total SalesTax SalesTax SalesTax SalesTax SalesTax (Exhibit15) Revenues: Taxes $ 7,767,525 3,884,655 3,884,641 2,069,621 1,943,700 19,550,142 Chargesforservices — 402,723 — — — 402,723 Investmentincome 781 — 3,169 845 605 5,400 Other 50,000 — 28,657 103,633 14,912 197,202 Totalrevenues 7,818,306 4,287,378 3,916,467 2,174,099 1,959,217 20,155,467 Expenditures: Current: Publicsafety — — — 1,583,479 2,797,931 4,381,410 Publicworks 299,628 — — — — 299,628 Cultureandrecreation — 2,375,060 — — — 2,375,060 Stormwater — — 1,686,782 — — 1,686,782 Generalgovernment 12,050 6,025 — — — 18,075 Capitaloutlay 6,039,108 571,023 925,221 — — 7,535,352 Debtservice: Principal 425,000 33,330 — 498,655 531,066 1,488,051 Interestandfiscalagentfees 105,569 — — 53,330 56,825 215,724 Totalexpenditures 6,881,355 2,985,438 2,612,003 2,135,464 3,385,822 18,000,082 Excess(deficiency)ofrevenues overexpenditures 936,951 1,301,940 1,304,464 38,635 (1,426,605) 2,155,385 Otherfinancingsources(uses): Proceedsfromdebtissuance — 96,126 — — — 96,126 Transfersout (66,494) — (351,083) — — (417,577) Totalotherfinancingsources(uses) (66,494) 96,126 (351,083) — — (321,451) Netchangeinfundbalances 870,457 1,398,066 953,381 38,635 (1,426,605) 1,833,934 Fundbalances(deficit),beginning 2,846,198 (6,382,130) 7,405,051 2,317,625 2,323,101 8,509,845 Fundbalances(deficit),ending $ 3,716,655 (4,984,064) 8,358,432 2,356,260 896,496 10,343,779 106
Exhibit27
CombiningBalanceSheet NonmajorCapitalProjectsFunds June30,2014 Revolving Buildings Street Public andOther Storm Park Total Assets Improvements Improvements Improvements Drainage Improvements (Exhibit12) Pooledcashandinvestments $ — 19,782 — — 63,074 82,856 Receivables: Specialassessmentprincipalandaccruedinterest 461,180 — — — — 461,180 Duefromothergovernments 1,273,042 — — — — 1,273,042 Restrictedassets — — 134,258 — — 134,258 Totalassets $ 1,734,222 19,782 134,258 — 63,074 1,951,336 LiabilitiesandFundBalances Liabilities: Accountsandcontractspayable $ 154,595 — 2,041 — 1,439 158,075 Duetootherfunds 1,346,501 — 9,517 16,155 — 1,372,173 Totalliabilities 1,501,096 — 11,558 16,155 1,439 1,530,248 Deferredinflowsofresources: Unavailablerevenue-specialassessments 461,180 — — — — 461,180 Totaldeferredinflowsofresources 461,180 — — — — 461,180 Fundbalances(deficit): Committed — 19,782 122,700 — 61,635 204,117 Unassigned (228,054) — — (16,155) — (244,209) Totalfundbalances(deficit) (228,054) 19,782 122,700 (16,155) 61,635 (40,092) $ 1,734,222 19,782 134,258 — 63,074 1,951,336 Totalliabilities,deferredinflowsof resourcesandfundbalances 107
CITYOFINDEPENDENCE,MISSOURI
CITYOFINDEPENDENCE,MISSOURI
CombiningStatementofRevenues,Expenditures,andChangesinFundBalances(Deficit)
Exhibit28
NonmajorCapitalProjectsFunds YearendedJune30,2014 Revolving Buildings Street Public andOther Storm Park Total Improvements Improvements Improvements Drainage Improvements (Exhibit13) Revenues: Intergovernmental $ 3,269,939 — — — — 3,269,939 Chargesforservices 9,047 — — — — 9,047 Investmentincome 233 9 26 — 12 280 Other — — — — 52,120 52,120 Totalrevenues 3,279,219 9 26 — 52,132 3,331,386 Expenditures: Capitaloutlay 3,880,924 — 555,196 — 30,958 4,467,078 Totalexpenditures 3,880,924 — 555,196 — 30,958 4,467,078 Excess(deficiency)ofrevenues overexpenditures (601,705) 9 (555,170) — 21,174 (1,135,692) Otherfinancingsources: Transfersin 610,985 — 286,962 — — 897,947 Totalotherfinancingsources 610,985 — 286,962 — — 897,947 Netchangeinfundbalances 9,280 9 (268,208) — 21,174 (237,745) Fundbalances(deficit),beginning (237,334) 19,773 390,908 (16,155) 40,461 197,653 Fundbalances(deficit),ending $ (228,054) 19,782 122,700 (16,155) 61,635 (40,092) 108
Midtown Hartman Drumm Eastland North Mount NolandRd Crackerneck Old Cinema Assets Truman RSO SanteFe Heritage Farm Center Independence Washington AutoPlaza Creek Landfill East Pooledcashandinvestments $ 92,625 80,524 — — 1,000,907 2,961,272 3,708 32,307 7,040 557,069 122,953 84,334 Receivables: Taxes 4,164 — 4,119 17,700 15,029 163,500 2,315 — — 110,877 2,900 — Accounts 13,925 — 250,000 — — 73,907 — — — 58,231 — — Duefromotherfunds — — — — — 2,609,401 — — — — — — Duefromothergovernments 77 19,780 420 49,477 1,348 227,648 913 48 — 140,445 1,313 11,022 Restrictedassets — — 953,238 1,033,260 — 3,498,451 — — — 9,865,648 — — Totalassets $ 110,791 100,304 1,207,777 1,100,437 1,017,284 9,534,179 6,936 32,355 7,040 10,732,270 127,166 95,356 Liabilities: Accountsandcontractspayable $ — — — — — — — — — 719 — — Duetootherfunds — — 2,030,409 466,773 — — — — — 1,173 — — Totalliabilities — — 2,030,409 466,773 — — — — — 1,892 — — Deferredinflowsofresources: Unavailablerevenue-realestatetaxes 4,164 — 4,119 — 12,229 — 115 — — — — — Totaldeferredinflowsofresources 4,164 — 4,119 — 12,229 — 115 — — — — — Fundbalances: Restricted 106,627 100,304 — 633,664 1,005,055 9,534,179 6,821 32,355 7,040 10,730,378 127,166 95,356 Unassigned — — (826,751) — — — — — — — — — Totalfundbalances(deficits) 106,627 100,304 (826,751) 633,664 1,005,055 9,534,179 6,821 32,355 7,040 10,730,378 127,166 95,356 $ 110,791 100,304 1,207,777 1,100,437 1,017,284 9,534,179 6,936 32,355 7,040 10,732,270 127,166 95,356 Totalliabilities,deferredinflowsof resourcesandfundbalances CITYOFINDEPENDENCE,MISSOURI CombiningBalanceSheet ComponentUnit-TaxIncrementFinancing June30,2014 109
Assets Pooledcashandinvestments $ Receivables: Taxes Accounts Duefromotherfunds DuefromothergovernmentsRestrictedassets Totalassets $ Liabilities: Accountsandcontractspayable $ Duetootherfunds Totalliabilities Deferredinflowsofresources: Unavailablerevenue-realestatetaxes Totaldeferredinflowsofresources Fundbalances: Restricted Unassigned Totalfundbalances(deficits) $ Totalliabilities,deferredinflowsof resourcesandfundbalances Exhibit29 23rd&Noland 23rd&Noland Independence LittleBlue LittleBlue TIFApp Trinity HCA Project1 Project2 Square Parkway1 Parkway3 Fees Total 384,882 1,159,498 6,886 — — — 150 5,546 6,499,701 6,900 2,800 — — — — — — 330,304 — — — — — — — — 396,063 — — — — — — — — 2,609,401 13,483 2,674 1,856 — — — 50 — 470,554 — 3,690,863 — — — — — — 19,041,460 405,265 4,855,835 8,742 — — — 200 5,546 29,347,483 — — — — — — — — 719 — — — 7,654 75,745 28,820 — — 2,610,574 — — — 7,654 75,745 28,820 — — 2,611,293 — — — — — — — — 20,627 — — — — — — — — 20,627 405,265 4,855,835 8,742 — — — 200 5,546 27,654,533 — — — (7,654) (75,745) (28,820) — — (938,970) 405,265 4,855,835 8,742 (7,654) (75,745) (28,820) 200 5,546 26,715,563 405,265 4,855,835 8,742 — — — 200 5,546 29,347,483 110
Midtown Hartman Drumm Eastland North Mount NolandRd Crackerneck Old Cinema Truman RSO SanteFe Heritage Farm Center Independence Washington AutoPlaza Creek Landfill East Revenues: Taxes $ 7,594 158,916 16,577 1,662,998 517,451 6,357,499 35,724 1,863 3,731 1,400,578 129,770 96,693 Investmentincome 153 1,758 151 22,610 1,833 114,400 3 17 3 5,955 119 7 Developercontributions — — 250,000 — — — — — — — — — Other — — 109,624 — — — — — — 978,491 — — Totalrevenues 7,747 160,674 376,352 1,685,608 519,284 6,471,899 35,727 1,880 3,734 2,385,024 129,889 96,700 Expenditures:Taxincrementfinancing 235 685 5,198 350,535 18,036 2,050,174 639 10,038 70 56,251 2,548 1,147 Debtservice: Principal 30,650 — 500,000 1,150,000 290,000 2,280,000 — — — — — — Interestandfiscalagentfees — 100,000 450,014 513,694 144,925 1,244,038 53,500 — — 4,271,064 61,500 — Debtissuancecosts — — — — — 140,533 — — — — — — Totalexpenditures 30,885 100,685 955,212 2,014,229 452,961 5,714,745 54,139 10,038 70 4,327,315 64,048 1,147 Excess(deficiency)ofrevenuesoverexpenditures (23,138) 59,989 (578,860) (328,621) 66,323 757,154 (18,412) (8,158) 3,664 (1,942,291) 65,841 95,553 Otherfinancingsources:Issuanceofdebt — — — — — 4,855,000 — — — — — — Reofferingpremium/originalissuediscount — — — — — 83,493 — — — — — — Paymenttorefundedloansescrowagent — — — — — (4,996,407) — — — — — — Transfersin — — — — — — — — — 1,732,384 — — Transfersout — — — — — — — — — — — — Totalotherfinancingsources — — — — — (57,914) — — — 1,732,384 — — Netchangeinfundbalances (23,138) 59,989 (578,860) (328,621) 66,323 699,240 (18,412) (8,158) 3,664 (209,907) 65,841 95,553 Fundbalances(deficits),beginning 129,765 40,315 (247,891) 962,285 938,732 8,834,939 25,233 40,513 3,376 10,940,285 61,325 (197) Fundbalances(deficits),ending $ 106,627 100,304 (826,751) 633,664 1,005,055 9,534,179 6,821 32,355 7,040 10,730,378 127,166 95,356 CITYOFINDEPENDENCE,MISSOURI CombiningStatementofRevenues,Expenditures,andChangesinFundBalances(Deficit) ComponentUnit-TaxIncrementFinancing YearendedJune30,2014 111
Revenues: Taxes $ Investmentincome DevelopercontributionsOther Totalrevenues Expenditures:TaxincrementfinancingDebtservice: PrincipalInterestandfiscalagentfeesDebtissuancecosts Totalexpenditures Excess(deficiency)ofrevenuesoverexpenditures Otherfinancingsources:Issuanceofdebt Reofferingpremium/originalissuediscountPaymenttorefundedloansescrowagentTransfersin Transfersout Totalotherfinancingsources Netchangeinfundbalances Fundbalances(deficits),beginning Fundbalances(deficits),ending $ Exhibit30 23rd&Noland 23rd&Noland Independence LittleBlue LittleBlue TIFApp Trinity HCA Project1 Project2 Square Parkway1 Parkway3 Fees Total 526,086 3,536,323 28,997 1,514 — — 200 — 14,482,514 99 1,235 — — — — — 2 148,345 — — — — — — — — 250,000 — — — — — — — — 1,088,115 526,185 3,537,558 28,997 1,514 — — 200 2 15,968,974 118,016 204,782 142 — 59,484 6,120 — 2,395 2,886,495 61,992 1,560,000 — — — — — — 5,872,642 168,008 1,556,638 — — — — — — 8,563,381 — 60,721 — — — — — — 201,254 348,016 3,382,141 142 — 59,484 6,120 — 2,395 17,523,772 178,169 155,417 28,855 1,514 (59,484) (6,120) 200 (2,393) (1,554,798) — 2,030,000 — — — — — — 6,885,000 — (9,437) — — — — — — 74,056 — (1,985,872) — — — — — — (6,982,279) — — — — — — — — 1,732,384 — (4,935) — — — — — — (4,935) — 29,756 — — — — — — 1,704,226 178,169 185,173 28,855 1,514 (59,484) (6,120) 200 (2,393) 149,428 227,096 4,670,662 (20,113) (9,168) (16,261) (22,700) — 7,939 26,566,135 405,265 4,855,835 8,742 (7,654) (75,745) (28,820) 200 5,546 26,715,563 112
CITY OF INDEPENDENCE, MISSOURI
Internal Service Funds
Internal Service Funds are used to account for the financing of goods or services provided by one department or agency to other departments or agencies of the government and to other governmental units on a cost-reimbursement basis.
Central Garage – This fund is used to account for costs of maintenance of the City’s fleet of vehicles and mobile equipment and related charges to other departments.
Staywell Health Care – This fund is used to account for the costs of the City’s self-insured healthcare plan.
Workers’ Compensation – This fund is used to account for the costs of the City’s self-insured Worker’s Compensation claims and administration plan.
Exhibit31
CombiningStatementofNetPosition InternalServiceFunds June30,2014 Staywell Central Health Workers' Total Garage Care Compensation (Exhibit5) Assets: Currentassets: Pooledcashandinvestments $ 633,797 970,514 2,492,657 4,096,968 Accountsreceivable 6,701 62,374 74,270 143,345 Inventory 102,578 — — 102,578 Prepaiditems — — 35,049 35,049 Totalcurrentassets 743,076 1,032,888 2,601,976 4,377,940 Noncurrentassets: Capitalassets: Land 93,979 — — 93,979 Depreciableproperty,plant,andequipment 206,165 — — 206,165 Lessaccumulateddepreciation (179,915) — — (179,915) Restrictedassets — — 200,000 200,000 Totalnoncurrentassets 120,229 — 200,000 320,229 Totalassets $ 863,305 1,032,888 2,801,976 4,698,169 Liabilities: Currentliabilities: Accountsandcontractspayable $ 82,139 — 1,756 83,895 Accruedliabilities 33,093 — 4,117 37,210 Compensatedabsences–current 40,803 — 13,884 54,687 Self-insuranceclaimspayable — 2,183,559 1,780,568 3,964,127 Totalcurrentliabilities 156,035 2,183,559 1,800,325 4,139,919 Noncurrentliabilities: Compensatedabsences–long-term 41,794 — 31,574 73,368 Otherpostemploymentbenefits 575,974 — 42,649 618,623 Netpensionobligation 45,468 — 12,236 57,704 Self-insuranceclaimspayable — — 2,416,679 2,416,679 Totalnoncurrentliabilities 663,236 — 2,503,138 3,166,374 113 Totalliabilities 819,271 2,183,559 4,303,463 7,306,293 Netposition: NetInvestmentincapitalassets 120,229 — — 120,229 Restrictedfor: Worker'scompensationescrow — — 200,000 200,000 Unrestricted (76,195) (1,150,671) (1,701,487) (2,928,353) Totalnetposition(deficit) 44,034 (1,150,671) (1,501,487) (2,608,124) $ 863,305 1,032,888 2,801,976 4,698,169 Totalliabilitiesandnetposition
CITYOFINDEPENDENCE,MISSOURI
Exhibit32
InternalServiceFunds YearendedJune30,2014 Staywell Central Health Workers' Total Garage Care Compensation (Exhibit6) Operatingrevenues: Chargesforservices $ 2,090,683 21,858,175 2,421,043 26,369,901 Totaloperatingrevenues 2,090,683 21,858,175 2,421,043 26,369,901 Operatingexpenses: Personalservices 716,817 — 159,411 876,228 Otherservices 430,554 25,161,920 2,136,319 27,728,793 Supplies 1,194,422 — 2,995 1,197,417 Depreciationandamortization 3,900 — — 3,900 Totaloperatingexpenses 2,345,693 25,161,920 2,298,725 29,806,338 Operatingincome(loss) (255,010) (3,303,745) 122,318 (3,436,437) Nonoperatingrevenues: Interestrevenue 246 4,072 1,489 5,807 Miscellaneousrevenue 40,216 1,289,328 81,912 1,411,456 Totalnonoperatingrevenue 40,462 1,293,400 83,401 1,417,263 Changeinnetposition (214,548) (2,010,345) 205,719 (2,019,174) Totalnetposition: Beginningoftheyear(deficit) 258,582 859,674 (1,707,206) (588,950) Endoftheyear(deficit) $ 44,034 (1,150,671) (1,501,487) (2,608,124) 114
CITYOFINDEPENDENCE,MISSOURI CombiningStatementofRevenues,Expenses,andChangesinNetPosition
Exhibit33
InternalServiceFunds YearendedJune30,2014 InternalServiceFunds Central Staywell Workers' Total Garage HealthCare Compensation (Exhibit7) Cashflowsfromoperations: Receiptsfromcustomers $ 2,127,284 23,409,535 2,499,385 28,036,204 Paymentstosuppliers (1,507,576) (25,328,290) (2,142,945) (28,978,811) Paymentstoemployees (575,928) — (145,117) (721,045) Netcashprovided(used)byoperatingactivities 43,780 (1,918,755) 211,323 (1,663,652) Cashflowsfrominvestingactivities: Interestoninvestments 246 4,072 1,489 5,807 Netcashprovidedbyinvestingactivities 246 4,072 1,489 5,807 Netincrease(decrease)incashandcashequivalents 44,027 (1,914,683) 212,812 (1,657,844) Cashandcashequivalentsatbeginningofyear 589,771 2,885,197 2,279,845 5,754,813 Cashandcashequivalentsatendofyear $ 633,798 970,514 2,492,657 4,096,969 Componentsofcashandshort-terminvestmentsatendoffiscalyear Unrestrictedassets 633,798 970,514 2,492,657 4,096,969 Restictedassets — — 200,000 200,000 Pooledcashandinvestments $ 633,798 970,514 2,692,657 4,296,969 Reconciliationofoperatingincome(loss)tonetcash provided(used)byoperatingactivities: Operatingincome(loss) $ (255,010) (3,303,745) 122,318 (3,436,437) Depreciationandamortization 3,900 — — 3,900 Miscellaneousrevenue 40,216 1,289,328 81,912 1,411,456 Changeinassetsandliabilities: Accountsreceivable (3,615) 262,032 (3,570) 254,847 Adjustmentstoreconcileoperatingincome(loss)tonetcash provided(used)byoperatingactivities: 115 Inventory 78,203 — — 78,203 Prepaiditems — — (35,049) (35,049) Accountsandcontractspayable 39,197 — (452) 38,745 Accruedliabilities 11,425 (166,370) 430 (154,515) Otherpost-employmentbenefits 110,063 — 13,051 123,114 Self-insuranceclaimspayable — — 31,440 31,440 Compensatedabsences 19,401 — 1,243 20,644 Totaladjustments 298,790 1,384,990 89,005 1,772,785 Netcashprovided(used)byoperatingactivities $ 43,780 (1,918,755) 211,323 (1,663,652)
CITYOFINDEPENDENCE,MISSOURI CombiningStatementofCashFlows
Exhibit34
AllAgencyFunds YearendedJune30,2014 Balance Balance June30, June30, 2014 2013 Additions Deductions (Exhibit8) FlexibleBenefitPlan: Assets: Pooledcashandinvestments $ 96,264 73,634 81,587 88,311 $ 96,264 73,634 81,587 88,311 Liabilities: Flexiblebenefitpayable $ 96,264 550,814 558,767 88,311 SusieBlockTrust: Assets: Pooledcashandinvestments $ 31,944 1,328 1,116 32,156 Accruedinterestreceivable 491 1,324 1,325 490 $ 32,435 2,652 2,441 32,646 Liabilities: Fundsheldinescrow $ 32,435 1,327 1,116 32,646 SeniorsTravelPrograms: Assets: Pooledcashandinvestments $ 18,599 45,830 42,852 21,577 116 Liabilities: Accountsandcontractspayable $ 5,767 37,432 36,992 6,207 Fundsheldinescrow 12,832 46,455 43,917 15,370 $ 18,599 83,887 80,909 21,577 AllAgencyFunds: Assets: Pooledcashandinvestments $ 146,807 120,792 125,555 142,044 Accruedinterestreceivable 491 1,324 1,325 490 $ 147,298 122,116 126,880 142,534 Liabilities: Flexiblebenefitpayable $ 96,264 550,814 558,767 88,311 Accountsandcontractspayable 5,767 37,432 36,992 6,207 Fundsheldinescrow 45,267 47,782 45,033 48,016 $ 147,298 636,028 640,792 142,534
CITYOFINDEPENDENCE,MISSOURI CombiningStatementofChangesinAssetsandLiabilities
Exhibit35
2014 2013 Operations Maintenance Total Operations Maintenance Total Productionfuel: Coal $ 5,101,889 7,094,343 Gas 3,040,794 4,433,002 Oil 221,272 226,832 Totalproductionfuel 8,363,955 11,754,177 Purchasedpower: Purchasedenergy 19,957,742 18,636,338 Purchasedcapacity(net) 22,999,441 17,733,329 Bordercustomers 79,794 63,304 Controlanddispatching 2,465,159 2,026,907 Totalpurchasedpower 45,502,136 38,459,878 Production(other): BlueValleyStation: Supervisionandengineering $ 785,858 715,865 1,501,723 755,778 733,758 1,489,535 Steam 850,232 2,584,719 3,434,951 856,586 2,591,926 3,448,512 Electric 843,186 579,696 1,422,882 821,063 697,667 1,518,729 Structuresandimprovements 184,406 184,406 — 381,745 381,745 Allowance 3,817 — 3,817 5,344 — 5,344 Miscellaneous 1,038,767 639,347 1,678,114 1,188,471 624,713 1,813,184 3,521,860 4,704,033 8,225,893 3,627,241 5,029,808 8,657,049 MissouriCityStation: Supervisionandengineering 104,726 7,519 112,246 102,648 17,589 120,237 Steam 397,503 812,826 1,210,329 370,089 1,780,184 2,150,272 Electric 410,842 194,042 604,884 380,246 208,296 588,541 Structuresandimprovements — 208,429 208,429 — 83,196 83,196 Miscellaneous 411,108 255,454 666,562 389,821 191,974 581,795 1,324,179 1,478,270 2,802,449 1,242,804 2,281,238 3,524,042 CombustionTurbineStation: Supervisionandengineering 2,149,519 — 2,149,519 2,306,330 — 2,306,330 Generationexpenses 198 240,784 240,982 868 276,349 277,217 Structuresandimprovements — 4,000 4,000 — 22,106 22,106 117 Miscellaneous 12,156 46,335 58,491 43,800 45,467 89,267 2,161,873 291,118 2,452,991 2,350,998 343,922 2,694,921 Totalproduction(other)$ 7,007,912 6,473,422 13,481,334 7,221,043 7,654,968 14,876,011 Transmissionanddistribution: Transmission: Supervisionandengineering $ 528,508 20,485 548,994 395,171 26,266 421,437 Overheadexpenses 8,531 2,278 10,808 — 1,498 1,498 Stationexpenses 151,134 703,739 854,873 10,819 610,594 621,413 Wheelingcharges 6,175,999 — 6,175,999 5,291,148 — 5,291,148 Undergroundlineexpense 4,481 49,123 53,603 2,021 — 2,021 Miscellaneous — — — 99,050 — 99,050 Totaltransmission 6,868,652 775,625 7,644,277 5,798,209 638,357 6,436,566
CITYOFINDEPENDENCE,MISSOURI SchedulesofOperatingExpenses–PowerandLightFund YearsendedJune30,2014and2013
Exhibit35
YearsendedJune30,2014and2013 2014 2013 Operations Maintenance Total Operations Maintenance Total Distribution: Supervisionandengineering $ 166,353 61,512 227,865 167,519 63,743 231,262 Overheadlines 1,027,605 3,656,829 4,684,434 1,071,332 3,480,083 4,551,415 Stationexpenses 51,821 838,805 890,626 2,480 519,915 522,394 Streetlightsandtrafficsignals 223,562 489,973 713,534 219,665 489,318 708,983 Meters 103,687 634,720 738,406 90,773 573,711 664,485 Customerinstallations 3,015 — 3,015 3,732 — 3,732 Undergroundlines 1,151,055 635,522 1,786,576 1,113,590 530,729 1,644,319 Dispatchingcommunication 995,707 — 995,707 1,023,498 — 1,023,498 Linetransformers — 176,145 176,145 — 111,578 111,578 Miscellaneous 560,479 632,769 1,193,248 575,339 580,990 1,156,329 Totaldistribution 4,283,283 7,126,274 11,409,556 4,267,929 6,350,067 10,617,996 Totaltransmissionand distribution $ 11,151,935 7,901,898 19,053,833 10,066,137 6,988,424 17,054,562 Customerservice: Supervision $ 144,531 172,799 Meterreading 629,994 632,798 Customerrecordsandcollections 2,147,835 1,898,642 Provisionsfordoubtfulaccounts 766,629 997,435 Miscellaneous 179,184 129,742 Totalcustomerservice 3,868,172 3,831,416 Generalandadministrative: Salaries 1,550,273 1,430,774 Officesupplies 950,296 808,571 Insurance 1,379,412 1,190,953 Injuriesanddamage 1,140,426 1,082,571 Employeebenefits 8,677,422 8,110,312 Outsideservices 2,767,209 2,553,542 Miscellaneous 1,370,481 1,305,893 Administrativeexpenses–transfers (72,991) (76,247) Totalgeneraland administrative 17,762,528 16,406,369 118 Depreciationandamortization 18,775,454 17,989,424 Payrolltaxes 1,300,868 1,200,113 Totaloperatingexpenses $128,108,281 121,571,949
CITYOFINDEPENDENCE,MISSOURI SchedulesofOperatingExpenses–PowerandLightFund
Exhibit36
Numberofcustomers Beginning ofyear Endofyear Revenue KWH Saleofelectricenergy: Metered: Residential 51,150 51,432 $ 72,394,232 518,922,748 Smallgeneralservices 3,032 3,008 4,524,696 26,213,054 Generalservices–spaceheating 3 3 2,612 26,338 Largegeneralservices 1,616 1,623 39,157,662 311,534,503 Largegeneralservices–primevoltage 6 6 1,021,362 8,888,046 Largegeneralservices–spaceheating 2 2 17,847 150,921 Totalelectricgeneralservices 108 110 6,006,112 61,873,102 Schools,churches,andhospitals 288 277 4,854,923 37,497,598 Schools,churches,andhospitals,allelectric 11 11 508,225 5,035,598 Largepowerservices 3 3 2,261,427 23,107,800 Combinedinterruptibleservices 2 2 2,465,354 28,321,000 Sewerpumping 6 6 295,487 2,312,020 Citytrafficsignals 64 64 78,254 112,333 Wholesale(bordercustomers) 2 2 166,473 3,375,862 Wholesale(interchange) — — 2,002,194 56,378,100 56,293 56,549 135,756,860 1,083,749,023 Unmetered: Privatesecuritylighting 1,722 1,714 392,595 1,591,964 Citypublicstreetlighting 12,091 12,090 510,004 5,890,409 13,813 13,804 902,598 7,482,373 Changeinunbilledrevenue (40,387) (1,226,282) Otheroperatingrevenue 2,154,663 — EVTC 40,249 — Totaloperatingrevenueandtotalenergysales $ 138,813,984 1,090,005,114 119 Netgeneration 170,117,602 Wholesalepowerpurchased 970,054,914 Unintentionalinterchange — Netgenerationandpowerpurchased 1,140,172,516 Retailenergysales 1,086,629,252 Wholesale(bordercustomers)sales 3,375,862 Powerandlightusage(buildingandsubstations) 1,565,266 Netdisposition 1,091,570,380 Transmissionanddistributionoperatinglosses 48,602,136
CITYOFINDEPENDENCE,MISSOURI ScheduleofOperatingStatistics–PowerandLightFund YearendedJune30,2014
Exhibit37
SchedulesofOperatingExpenses–WaterFund YearsendedJune30,2014and2013 2014 2013 Operations Maintenance Total Operations Maintenance Total Production: Sourceofsupply: Supervisionandengineering $ 29,863 — 29,863 27,692 (5) 27,687 Laborandexpenses 391,245 — 391,245 355,097 — 355,097 Structuresandimprovements — 31,065 31,065 — 40,211 40,211 Miscellaneous — 234,673 234,673 — 322,028 322,028 Totalsourceofsupply 421,108 265,738 686,846 382,789 362,234 745,023 Powerandpumping: Supervisionandengineering 41,917 20,784 62,701 39,420 20,782 60,202 Fuel/powerpurchased 1,808,777 — 1,808,777 1,787,783 — 1,787,783 Laborandexpenses 234,511 — 234,511 259,056 — 259,056 Structuresandimprovements — 11,223 11,223 — 11,932 11,932 Miscellaneous — 1,666 1,666 — 3,453 3,453 Totalpowerandpumping 2,085,205 33,673 2,118,878 2,086,259 36,167 2,122,426 Watertreatment: Supervisionandengineering 48,931 20,283 69,214 47,573 19,901 67,474 Chemicals 1,480,573 — 1,480,573 1,404,697 — 1,404,697 Laborandexpenses 596,752 — 596,752 626,072 — 626,072 Structuresandimprovements — 678,069 678,069 — 297,993 297,993 Miscellaneous — 274,341 274,341 — 331,804 331,804 Totalwatertreatment 2,126,256 972,693 3,098,949 2,078,342 649,698 2,728,040 Totalproduction $ 4,632,569 1,272,104 5,904,673 4,547,390 1,048,099 5,595,489 Transmissionanddistribution: Supervisionandengineering $ 215,453 48,787 264,240 79,294 52,163 131,457 Storagefacilities 19,255 55,823 75,078 19,529 40,482 60,011 Transmissionanddistributionlines 710,519 1,145,835 1,856,354 734,385 1,292,465 2,026,850 Meters 49,622 54,407 104,029 44,336 54,459 98,795 Customerinstallations 83,198 — 83,198 86,989 — 86,989 Services — 162,903 162,903 — 220,238 220,238 Hydrants — 87,812 87,812 — 49,106 49,106 Miscellaneous 589,574 184,734 774,308 618,294 233,299 851,593 Totaltransmissionanddistribution$ 1,667,621 1,740,301 3,407,922 1,582,827 1,942,212 3,525,039 Customerservice: 120 Customeraccountingpaidandcollecting: Supervision $ 196,204 148,511 Meterreading 1,138,704 998,133 Customerrecords 283,125 545,225 Provisionforuncollectibleamounts 116,437 89,007 Totalcustomeraccounting paidandcollecting 1,734,470 1,780,876 Salespromotion: Expenses 39,298 26,730 Totalcustomerservice 1,773,768 1,807,606 Generalandadministrative: Salaries 531,400 591,541 Officesuppliesandexpense 394,469 379,808 Injuriesanddamages 472,033 502,583 Employeebenefits 1,829,398 1,745,095 Outsideservices 1,000,455 1,132,140 Miscellaneous 303,845 260,983 Totalgeneralandadministrative 4,531,600 4,612,150 Depreciationandamortization 3,236,330 3,205,490 Payrolltaxes 307,431 306,778 Other 73,534 73,328 Totaloperatingexpenses 19,235,258 19,125,880 Certainamountsarepresentedasareductionof operatingexpenses,whereastheyareincluded asmiscellaneousrevenueinthestatementof revenues,expenses,andchangesinfundnetposition 1,713,662 1,414,391 $ 20,948,920 20,540,271
CITYOFINDEPENDENCE,MISSOURI
Exhibit38
ScheduleofOperatingStatistics–WaterFund YearendedJune30,2014 Numberofcustomers Beginning ofyear Endofyear Revenue MGS* Saleofwater: Residential 44,501 44,617 $ 13,052,557 2,907,837 Commercial 3,092 3,099 3,555,507 867,269 Industrial 6 6 769,857 318,659 Publicauthority 77 77 262,012 62,909 Resale 13 14 8,136,297 4,802,914 Privatefireprotection 432 440 159,329 — Publicfireprotection — — 1,231,475 — 48,121 48,253 27,167,034 8,959,588 Changeinunbilledrevenue 9,027 Otheroperatingrevenue 369,562 Totaloperatingrevenue $ 27,545,623 Thousandsofgallonspumped: CourtneyBendPlant 10,460,139 Lesstotalsales 8,959,588 Unaccountedforwater 1,500,551 *Thousandgallonssold. 121
CITYOFINDEPENDENCE,MISSOURI
Exhibit39 CITYOFINDEPENDENCE,MISSOURI ScheduleofOperatingStatistics–SanitarySewerFund YearendedJune30,2014 Numberofcustomers Beginning ofyear Endofyear Revenue CCF* Saleofsanitarysewerservices: Residential 40,588 40,927 $ 11,329,939 2,626,435 Commercial: Base 3,463 3,418 4,434,651 1,509,696 Surcharge — — 1,320,644 — Contractwastetreatment 14 3 229,946 — RegulatoryCompliance — — 3,191,390 — Intermunicipalagreements: SugarCreek — — 541,547 — KansasCity — — 109,939 — 44,065 44,348 21,158,056 4,136,131 Otheroperatingrevenue 222,364 Changeinunbilledrevenue 90,879 Totaloperatingrevenue $ 21,471,299 *Hundredcubicfeet. 122
STATISTICAL DATA
The statistical data “relates to the physical, economic, social, and political characteristics of the City.” Its design is to provide “a broader and more complete understanding of the City and its financial affairs than is possible from the financial statements, notes, and supporting schedule presentation in the Financial Section.”
STATISTICALSECTION
ThispartoftheCityofIndependence'scomprehensiveannualfinancialreportpresentsdetailedinformation asacontextforunderstandingwhattheinformationinthefinancialstatements,notedisclosures,and requiredsupplementaryinformationsaysabouttheCity'soverallfinancialhealth.
Theseschedulespresentinformationtohelpthereaderassesstheaffordabilityofthe
DemographicandEconomicInformation
Theseschedulesofferdemographicandeconomicindicatorstohelpthereader understandtheenvironmentwithinwhichtheCity'sfinancialactivitiestakeplace.
OperatingInformation
Theseschedulescontainserviceandinfrastructuredatatohelpthereaderunderstand howtheinformationintheCity'sfinancialreportrelatestotheservicestheCityprovides andtheactivitiesitperforms.
Sources: Unlessotherwisenoted,theinformationintheseschedulesisderivedfromthecomprehensive annualfinancialreportsfortherelevantyear.TheCityimplementedGASBStatement34in2002; schedulespresentinggovernment-wideinformationincludeinformationbeginninginthatyear.
Contents Tables FinancialTrends
financialperformanceandwell-beinghavechangedovertime. 1-4 RevenueCapacity TheseschedulescontaininformationtohelpthereaderassesstheCity'smost significantlocalrevenuesources. 5-15 DebtCapacity
TheseschedulescontaintrendinformationtohelpthereaderunderstandhowtheCity's
City'scurrentlevelsofoutstandingdebtandtheCity'sabilitytoissueadditionaldebt inthefuture 16-20
123
21-22
23-25
Note:In2005theTaxIncrementFinancingfundswereremovedfromtheprimarygovernmentpresentationandshownasadiscretelycomponentunit.In2012theTaxIncrementFinancingfundswereaddedbacktotheprimarygovernmentpresentationasablendedcomponentunit.
Note:In2007theGASB34RetroactiveInfrastructurewasadded.
Note:In2008thenewWorkers'CompensationFundwasaddedasanInternalServiceFund.
Note:In2011theEventsCenterLLCwasaddedasablendedcomponentunitunderthebusiness-typeactivities.
Note:In2012theEventsCenterCommunityImprovementDistrictwasaddedasablendedcomponentunitunderthebusiness-typeactivities.
Note:In2012theCrackerneckCreekTransportationDevelopmentDistrictwasaddedasablendedcomponentunitunderthegovernmentalactivities.
Table1 2005 2006 2007 2008 2009 2010 2011 2012 2013 2014 Governmentalactivities Netinvestmentincapitalassets $ 102,014,271 165,333,646 195,251,671 233,350,380 289,028,019 305,569,028 321,072,648 334,320,197 336,357,164 333,902,700 Restricted 26,147,417 25,262,407 28,164,683 25,270,518 15,475,723 16,889,552 16,275,115 17,220,970 16,853,297 16,931,671 Unrestricted (5,752,346) (4,028,884) (3,132,802) (4,410,121) (10,487,249) (23,784,298) (41,705,135) (219,659,905) (231,199,039) (233,876,307) Totalgovernmentalactivitiesnetposition $ 122,409,342 186,567,169 220,283,552 254,210,777 294,016,493 298,674,282 295,642,628 131,881,262 122,011,422 116,958,064 Business-typeactivities $ Netinvestmentincapitalassets 233,908,193 246,080,008 267,330,916 285,931,913 281,280,070 279,970,114 272,062,890 262,631,937 251,523,417 240,517,938 Restricted 500,000 731,652 731,101 5,216,672 3,691,325 3,692,885 6,423,693 14,629,418 15,545,776 16,288,747 Unrestricted 72,143,939 70,071,662 60,010,180 31,311,367 29,929,991 32,197,583 37,479,969 46,597,826 45,095,514 59,212,898 Totalbusiness-typeactivitiesnetposition $ 306,552,132 316,883,322 328,072,197 322,459,952 314,901,386 315,860,582 315,966,552 323,859,181 312,164,707 316,019,583 Primarygovernment Netinvestmentincapitalassets $ 335,922,464 411,413,654 462,582,587 519,282,293 570,308,089 585,539,142 593,135,538 596,952,134 587,880,581 574,420,638 Restricted 26,647,417 25,994,059 28,895,784 30,487,190 19,167,048 20,582,437 22,698,808 31,850,388 32,399,073 33,220,418 Unrestricted 66,391,593 66,042,778 56,877,378 26,901,246 19,442,742 8,413,285 (4,225,166) (173,062,079) (186,103,525) (174,663,409) Totalprimarygovernmentnetposition $ 428,961,474 503,450,491 548,355,749 576,670,729 608,917,879 614,534,864 611,609,180 455,740,443 434,176,129 432,977,647
CityofIndependence,Missouri NetPositionbyComponent LastTenFiscalYears (accrualbasisofaccounting) 124
Table2 2005 2006 2007 2008 2009 2010 2011 2012 2013 2014 Expenses Governmentalactivities: Administrativeservices $ 7,148,065 7,363,102 7,749,779 8,487,120 8,216,824 9,172,736 9,305,826 8,344,371 9,225,738 9,096,123 Publicsafety 35,069,866 36,796,996 38,253,819 44,390,164 47,972,502 49,861,503 53,067,764 53,836,564 55,139,731 56,859,801 Publicworks 6,889,773 12,817,343 13,231,006 13,013,430 13,197,612 13,687,890 13,647,390 15,562,839 17,428,294 18,079,671 Healthandwelfare 2,421,255 2,638,369 2,898,542 3,287,200 3,599,725 3,607,469 3,732,795 3,575,162 3,810,863 3,622,207 Cultureandrecreation 4,247,735 5,161,139 6,965,260 7,813,486 8,135,903 7,604,501 7,947,692 8,476,301 7,275,087 7,435,735 Communitydevelopment 3,372,610 3,809,726 4,096,835 4,381,932 4,003,876 4,386,689 7,032,272 5,128,323 5,318,490 6,316,004 Stormwater 1,493,534 1,641,992 2,193,290 2,270,858 2,445,470 2,569,381 2,876,073 2,765,629 2,862,544 3,000,734 Generalgovernment 6,266,060 6,678,208 8,225,760 7,921,217 8,374,983 9,421,062 9,366,479 9,293,399 8,405,914 8,730,105 Taxincrementfinancing — — — — — — — 2,992,581 14,281,820 14,273,775 Debtservicecomponentunit — — — — — — 7,709,611 — — — Interestonlong-termdebt 536,124 991,856 1,050,153 1,073,318 891,473 640,902 625,778 10,125,399 379,760 252,213 Totalgovernmentalactivitiesexpenses 67,445,022 77,898,731 84,664,444 92,638,725 96,838,368 100,952,133 115,311,680 120,100,568 124,128,241 127,666,368 Business-typeactivities: Powerandlight 73,531,757 84,564,657 89,265,988 101,665,442 101,097,606 105,486,932 113,956,212 124,533,699 127,959,254 138,801,854 Water 16,394,488 17,097,507 17,723,114 19,131,054 20,250,295 20,324,005 20,239,748 20,563,502 21,886,576 22,140,775 Sewer 11,995,774 12,236,654 12,721,171 14,451,363 15,233,127 15,268,389 16,304,874 16,157,412 18,900,129 19,015,060 Eventscenter — — — 179,032 1,888,027 4,862,017 13,764,087 12,869,289 13,091,457 10,859,704 Totalbusiness-typeactivitiesexpenses 101,922,019 113,898,818 119,710,273 135,426,891 138,469,055 145,941,343 164,264,921 174,123,902 181,837,416 190,817,393 Totalprimarygovernmentexpenses $ 169,367,041 191,797,549 204,374,717 228,065,616 235,307,423 246,893,476 279,576,601 294,224,470 305,965,657 318,483,761 ProgramRevenues Governmentalactivities: Chargesforservices: Administrativeservices $ 5,067,474 5,512,413 5,696,158 5,905,973 6,247,933 6,276,153 6,453,890 6,676,240 6,611,432 6,904,917 Publicsafety 3,841,471 4,588,766 4,202,328 4,202,059 4,432,454 4,867,364 4,943,734 4,829,421 4,567,625 5,154,144 Publicworks 802,206 1,003,761 1,338,479 739,643 449,172 462,490 437,032 398,071 362,732 401,793 Healthandwelfare 482,601 435,775 723,574 791,825 776,194 819,659 732,116 817,774 735,708 758,211 Cultureandrecreation 619,630 975,889 845,560 925,880 842,523 771,890 796,820 871,799 727,220 613,238 CityofIndependence,Missouri ChangesinNetPosition LastTenFiscalYears (accrualbasisofaccounting) Communitydevelopment 2,050,172 2,203,367 2,292,638 1,949,275 1,172,512 1,242,376 1,167,853 968,438 934,442 1,089,720 Stormwater — — — 645 — — — — — — Generalgovernment — — — — — — — 1,012,898 1,037,506 978,491 Operatinggrantsandcontributions 9,336,061 9,199,332 9,957,178 8,902,787 8,223,227 9,182,959 13,517,593 12,487,041 9,462,570 10,680,433 Capitalgrantsandcontributions 7,242,924 26,417,977 23,963,312 27,772,386 41,557,506 11,912,031 12,598,018 14,465,335 3,590,902 3,769,347 Totalgovernmentalactivitiesprogramrevenues 29,442,539 50,337,280 49,019,227 51,190,473 63,701,521 35,534,922 40,647,056 42,527,017 28,030,137 30,350,294 Business-typeactivities: Chargesforservices: Powerandlight 82,592,294 98,278,354 103,133,249 107,619,947 105,064,847 114,744,814 126,755,826 139,878,341 137,749,295 138,813,984 Water 17,080,050 18,312,720 17,744,404 18,114,183 18,607,799 20,134,421 22,203,258 24,635,637 26,642,646 27,545,623 Sewer 13,975,780 14,364,165 15,058,695 15,283,055 15,347,894 15,263,586 17,061,489 18,233,724 20,231,637 21,471,299 Eventscenter — — — — — — 4,874,623 8,370,481 4,345,469 3,359,318 Operatinggrantsandcontributions — — — — — — 4,813,612 5,000 — — Capitalgrantsandcontributions 3,491,383 2,964,925 5,562,049 4,363,127 3,396,999 7,760,380 4,012,182 1,122,019 763,127 2,386,511 Totalbusiness-typeactivitiesprogramrevenues 117,139,507 133,920,164 141,498,397 145,380,312 142,417,539 157,903,201 179,720,990 192,245,202 189,732,174 193,576,735 Totalprimarygovernmentprogramrevenues $ 146,582,046 184,257,444 190,517,624 196,570,785 206,119,060 193,438,123 220,368,046 234,772,219 217,762,311 223,927,029 125
Note:In2005theTaxIncrementFinancingfundswereremovedfromtheprimarygovernmentpresentationandshownasadiscretelycomponentunit.In2012theTaxIncrementFinancingfundswereaddedbacktotheprimarygovernmentpresentationasablendedcomponentunit.
Note:In2007theGASB34RetroactiveInfrastructurewasadded.
Note:In2008thenewWorkers'CompensationFundwasaddedasanInternalServiceFund.
Note:In2011theEventsCenterLLCwasaddedasablendedcomponentunitunderthebusiness-typeactivities.
Note:In2012theEventsCenterCommunityImprovementDistrictwasaddedasablendedcomponentunitunderthebusiness-typeactivities.
Note:In2012theCrackerneckCreekTransportationDevelopmentDistrictwasaddedasablendedcomponentunitunderthegovernmentalactivities.
Table2 2005 2006 2007 2008 2009 2010 2011 2012 2013 2014 CityofIndependence,Missouri ChangesinNetPosition LastTenFiscalYears (accrualbasisofaccounting) Net(expense)/revenue Governmentalactivities $ (38,002,483) (27,561,451) (35,645,217) (41,448,252) (33,136,847) (65,417,211) (74,664,624) (77,573,551) (96,098,104) (97,316,074) Business-typeactivities 15,217,488 20,021,346 21,788,124 9,953,421 3,948,484 11,961,858 15,456,069 18,121,300 7,894,758 2,759,342 Totalprimarygovernmentnetexpense $ (22,784,995) (7,540,105) (13,857,093) (31,494,831) (29,188,363) (53,455,353) (59,208,555) (59,452,251) (88,203,346) (94,556,732) GeneralRevenuesandOtherChangesin NetPosition Governmentalactivities: Taxes Propertytaxes $ 6,564,690 6,895,323 6,952,380 7,067,966 7,963,698 7,276,215 7,458,788 8,652,704 7,618,559 7,993,199 Salesandusetaxes 33,295,203 37,754,853 37,728,799 38,086,941 37,353,520 36,021,505 36,030,316 39,836,686 40,689,725 41,142,183 Intergovernmentalactivitytaxes — — — — — — — 9,534,652 9,635,263 10,809,061 Franchisetaxes 7,500,356 7,645,601 8,209,734 16,519,852 13,138,965 11,823,113 10,696,214 10,914,940 10,414,823 10,292,488 Financialinstitutionstax 37,149 22,181 34,802 31,960 44,195 15,669 28,410 21,646 15,225 19,381 Investmentearnings 922,701 1,385,126 1,785,111 1,476,448 605,453 197,476 138,471 228,812 302,467 302,394 Specialitem-litigationsettlement — — — — — — — — — 2,203,430 Miscellaneous 1,143,207 714,149 589,469 348,143 438,354 466,775 1,079,391 397,567 1,049,065 695,896 Paymentstocomponentunit (24,722) — — — — — — — — — Transfers 10,038,823 13,167,930 13,180,055 14,181,015 13,398,378 14,274,247 16,201,380 17,329,950 18,232,349 18,804,684 Totalgovernmentalactivities 59,477,407 67,585,163 68,480,350 77,712,325 72,942,563 70,075,000 71,632,970 86,916,957 87,957,476 92,262,716 Business-typeactivities: Salesandusetaxes — — — — — — — — 5,291,682 5,397,059 Investmentearnings 1,567,536 2,449,623 2,532,853 1,850,519 485,895 69,869 171,413 28,936 66,215 45,754 Specialitem-litigationsettlement — — — — — — — — — 12,796,570 Miscellaneous 1,022,417 436,132 47,953 37,982 1,405,433 609,962 679,868 2,212,916 557,965 1,660,835 Transfers (10,038,823) (13,167,930) (13,180,055) (14,181,015) (13,398,378) (14,274,247) (16,201,380) (17,329,950) (18,232,349) (18,804,684) Totalbusiness-typeactivities (7,448,870) (10,282,175) (10,599,249) (12,292,514) (11,507,050) (13,594,416) (15,350,099) (15,088,098) (12,316,487) 1,095,534 Totalprimarygovernment $ 52,028,537 57,302,988 57,881,101 65,419,811 61,435,513 56,480,584 56,282,871 71,828,859 75,640,989 93,358,250 ChangesinNetPosition Governmentalactivities $ 21,474,924 40,023,712 32,835,133 36,264,073 39,805,716 4,657,789 (3,031,654) 9,343,406 (8,140,628) (5,053,358) Business-typeactivities 7,768,618 9,739,171 11,188,875 (2,339,093) (7,558,566) (1,632,558) 105,970 3,033,202 (4,421,729) 3,854,876 Totalprimarygovernment $ 29,243,542 49,762,883 44,024,008 33,924,980 32,247,150 3,025,231 (2,925,684) 12,376,608 (12,562,357) (1,198,482)
126
Note:In2005theTaxIncrementFinancingfundswereremovedfromtheprimarygovernmentpresentationandshownasadiscretelycomponentunit.In2012theTaxIncrement Financingfundswereaddedbacktotheprimarygovernmentpresentationasablendedcomponentunit.
Note:In2011GASB54wasimplementedwhichchangestheFundBalanceclassifications.2010hasbeenrestatedforthenewcategoriesaswell.
Note:In2012theCrackerneckCreekTransportationDevelopmentDistrictwasaddedasablendedcomponentunitunderthegovernmentalactivities.
Table3 2005 2006 2007 2008 2009 GeneralFund Reserved $ 1,650,890 1,756,039 2,200,693 1,265,717 1,319,086 Unreserved 3,196,765 6,029,006 4,534,005 8,062,100 5,739,682 TotalGeneralFund $ 4,847,655 7,785,045 6,734,698 9,327,817 7,058,768 Allothergovernmentalfunds Reserved $ 18,110,669 20,786,620 10,928,435 41,091,787 19,583,280 Unreserved,reportedin: Specialrevenuefunds 17,461,153 14,250,375 17,620,241 12,648,957 5,357,555 Capitalprojectfunds (3,837,893) (10,687,320) (1,859,546) (29,245,744) (10,675,562) Debtservicefunds 92,278 86,300 82,229 71,068 56,553 Permanentfunds 13,616 14,220 9,670 — — Totalallothergovernmentalfunds $ 31,839,823 24,450,195 26,781,029 24,566,068 14,321,826 2010 2011 2012 2013 2014 GeneralFund Nonspendable $ — — — — 14,141 Restricted 236,365 442,556 584,917 417,361 402,899 Committed 2,277,479 1,413,292 453,285 391,399 437,083 Assigned 662,881 667,065 593,561 464,633 398,283 FiscalYear CityofIndependence,Missouri FundBalancesofGovernmentalFunds LastTenFiscalYears (modifiedaccrualbasisofaccounting) 127 Unassigned 2,012,374 2,302,039 1,831,406 600,662 3,591,990 $ 5,189,099 4,824,952 3,463,169 1,874,055 4,844,396 Allothergovernmentalfunds Nonspendable $ — — — 480,253 — Restricted 17,329,836 16,659,329 44,378,155 43,513,724 44,679,472 Committed 440,243 437,150 1,404,187 451,142 204,117 Unassigned (5,118,794) (5,369,883) (6,237,737) (6,951,949) (6,167,243) $ 12,651,285 11,726,596 39,544,605 37,493,170 38,716,346
Note:In2005theTaxIncrementFinancingfundswereremovedfromtheprimarygovernmentpresentationandshownasadiscretelycomponentunit.In2012theTaxIncrementFinancingfundswereaddedbacktotheprimarygovernmentpresentationas ablendedcomponentunit.
Note:For2011theDebtserviceasapercentageofnoncapitalexpendituresincludesthedebtservicepaymentforthecomponentunit
Note:In2012theCrackerneckCreekTransportationDevelopmentDistrictwasaddedasablendedcomponentunitunderthegovernmentalactivities.
Table4 2005 2006 2007 2008 2009 2010 2011 2012 2013 2014 Revenues Taxes $ 47,360,251 52,295,777 52,890,913 58,474,761 55,131,682 55,953,427 59,053,886 68,437,032 68,799,104 70,380,577 Licenses,feesandpermits 4,670,617 5,073,944 5,472,192 4,642,719 3,695,971 3,483,767 3,426,859 3,319,496 3,255,877 3,464,631 Intergovernmental 13,013,181 21,762,714 16,534,433 10,862,317 19,131,915 16,921,164 24,785,082 24,127,728 12,724,286 13,672,530 Chargesforservices 2,023,297 2,926,800 2,587,783 2,784,144 2,774,284 2,759,317 3,015,294 3,095,040 2,966,943 2,699,813 Interfundchargesforsupportservices 2,700,215 2,949,682 3,105,514 3,222,406 3,389,629 3,580,384 3,743,875 3,791,444 3,835,972 3,987,029 Fines,forfeitures,andcourtcosts 3,521,377 4,023,981 3,900,967 3,724,608 4,009,673 4,510,754 4,398,111 4,329,537 4,061,879 4,790,383 Investmentearnings 901,209 1,309,569 1,588,358 1,197,790 495,337 165,939 124,223 214,584 287,686 259,908 Reimbursementsfromcomponentunit — — 3,502,961 11,413,444 12,274,171 3,792,466 581,524 — — — Developercontributions — — — — — — — 832,549 238,105 250,000 Other 1,260,113 493,127 799,580 740,435 924,092 816,818 1,115,938 2,355,665 2,263,964 2,281,201 Totalrevenues 75,450,260 90,835,594 90,382,701 97,062,624 101,826,754 91,984,036 100,244,792 110,503,075 98,433,816 101,786,072 Expenditures Administrativeservices 6,618,488 6,897,346 7,592,963 7,460,421 7,728,128 7,867,425 7,862,603 7,332,146 6,997,537 7,547,357 Publicsafety 35,462,979 38,976,460 39,693,647 40,950,718 40,956,235 45,150,437 48,037,112 45,457,931 46,169,791 49,093,577 Publicworks 5,930,041 6,586,771 7,173,004 7,173,709 6,719,666 6,513,379 6,159,868 5,191,326 5,645,470 5,899,660 Healthandwelfare 2,419,833 2,614,557 2,835,949 2,875,392 3,150,172 3,226,705 3,277,614 3,055,362 3,362,706 3,322,766 Cultureandrecreation 4,048,187 4,628,228 5,098,826 5,800,784 5,942,029 6,160,686 5,995,558 6,205,463 5,694,462 5,747,828 Communitydevelopment 3,278,951 3,712,454 4,182,354 4,090,318 3,657,531 4,119,818 6,730,888 4,877,604 5,029,870 6,007,452 Stormwater 1,180,789 1,141,595 1,538,857 1,388,856 1,542,289 1,668,148 1,772,387 1,581,460 1,532,184 1,686,782 Generalgovernment 7,148,583 6,678,208 7,582,224 7,612,540 7,486,977 8,541,586 8,507,142 8,343,550 7,461,577 7,688,526 Taxincrementfinancing — — — — — — — 2,992,581 2,578,489 2,886,495 Capitaloutlay 21,040,394 33,296,700 31,736,638 28,561,029 42,442,528 26,346,981 22,527,627 24,697,928 15,475,351 12,296,360 DebtService Principal 1,019,196 3,230,099 3,256,394 3,378,132 7,277,755 3,465,682 2,963,391 12,935,067 12,223,792 7,614,702 Debtservicecomponentunit — — — — — — 3,566,752 — — — Interest 246,458 996,600 1,001,306 1,114,072 977,116 814,620 600,864 10,283,032 9,505,756 8,844,986 Debtissuancecosts — — — — — — — 258,358 1,059,129 201,254 Totalexpenditures 88,393,899 108,759,018 111,692,162 110,405,971 127,880,426 113,875,467 118,001,806 133,211,808 122,736,114 118,837,745 Excessofrevenues over(under)expenditures (12,943,639) (17,923,424) (21,309,461) (13,343,347) (26,053,672) (21,891,431) (17,757,014) (22,708,733) (24,302,298) (17,051,673) CityofIndependence,Missouri ChangesinFundBalancesofGovernmentalFunds LastTenFiscalYears (modifiedaccrualbasisofaccounting) 128 OtherFinancingSources(Uses) Transfersin 222,429 1,724,648 2,102,299 1,266,294 3,897,938 3,069,619 2,499,761 8,446,498 9,771,846 2,630,331 Transfersout (362,921) (1,181,579) (1,961,707) (1,371,651) (4,003,295) (3,020,619) (2,461,566) (8,446,498) (9,560,573) (1,969,709) Issuanceofdebt 20,748,448 — 8,477,809 100,695 101,734 4,020,000 — 8,694,700 40,855,000 6,981,126 Premiums/Discountsondebtissued — — — — — 18,402 — (99,950) (14,334) 74,056 Paymenttorefundedloansescrowagent — — — — — — — (6,426,286) (38,713,690) (6,982,279) Transfersin-utilitypaymentsinlieuoftaxes 10,179,317 12,624,861 13,039,463 13,702,586 13,503,735 14,225,247 16,211,380 17,329,950 18,021,077 18,144,063 Saleofcapitalassets 56,379 303,255 50,834 23,581 40,269 38,572 218,603 100,901 302,423 164,172 Totalotherfinancingsources(uses) 30,843,652 13,471,185 21,708,698 13,721,505 13,540,381 18,351,221 16,468,178 19,599,315 20,661,749 19,041,760 Specialitems: Litigationsettlement — — — — — — — — — 2,203,430 Netchangeinfundbalances $ 17,900,013 (4,452,239) 399,237 378,158 (12,513,291) (3,540,210) (1,288,836) (3,109,418) (3,640,549) 4,193,517 Debtserviceasapercentage ofnoncapitalexpenditures 1.95% 5.76% 5.42% 5.63% 9.75% 5.04% 3.83% 21.55% 21.61% 16.09%
Amounts for 2014 are not provided due to only receiving partial year figures.
Source:
Table 5 Sales by Retail Category:2004200520062007200820092010201120122013 Apparel stores$115,283 122,165 126,307 132,957 125,832 124,168 103,406 109,372 100,727 105,579 General merchandise411,327 420,186 436,832 430,331 434,782 408,200 388,061 424,435 431,720 433,166 Food stores166,671 171,641 173,595 170,099 178,747 179,031 166,018 177,019 167,729 165,814 Eating and drinking establishments170,143 179,418 190,478 194,970 201,085 211,739 207,363 220,458 220,6 21 223,733 Home furnishings and appliances85,821 87,789 84,366 80,420 72,902 67,124 54,274 55,222 49,381 45,410 Building materials and farm tools20,842 23,345 25,578 22,720 19,998 17,213 16,937 14,753 17,949 17,1 33 Construction/Remodeling5,432 5,869 2,040 4,724 3,415 3,596 3,317 4,383 3,356 2,919 Auto dealers and supplies32,284 32,593 33,865 35,314 38,260 36,967 41,703 39,526 37,625 38,257 Service stations55,475 60,533 61,586 62,430 65,741 68,633 70,891 75,773 81,702 74,396 Other retail stores186,594 229,869 227,864 222,237 245,406 233,860 219,787 236,382 222,049 228,625 All other outlets109,023 116,068 121,081 119,236 113,711 119,813 118,046 123,443 128,081 116,758 Total$1,358,895 1,449,476 1,483,592 1,475,438 1,499,879 1,470,344 1,389,803 1,480,766 1,460,940 1,45 1,790
Note: City of Independence, Missouri Total City Taxable Sales by Category Last Ten Calendar Years (in thousands of dollars) 129
Missouri Department of Revenue
Table6 DirectSalesTaxRateCityofIndependence 2005 2006 2007 2008 2009 2010 2011 2012 2013 2014 GeneralFund 1.000 1.000 1.000 1.000 1.000 1.000 1.000 1.000 1.000 1.000 StreetImprovements 0.375 0.375 0.375 0.375 0.500 0.500 0.500 0.500 0.500 0.500 ParkImprovements 0.250 0.250 0.250 0.250 0.250 0.250 0.250 0.250 0.250 0.250 StormWaterImprovements 0.250 0.250 0.250 0.250 0.250 0.250 0.250 0.250 0.250 0.250 PolicePublicSafety 0.000 0.125 0.125 0.125 0.125 0.125 0.125 0.125 0.125 0.125 FirePublicSafety 0.000 0.250 0.250 0.250 0.125 0.125 0.125 0.125 0.125 0.125 DirectSalesTaxRateCityofIndependence 1.875 2.250 2.250 2.250 2.250 2.250 2.250 2.250 2.250 2.250 TransportationDevelopmentDistrict 0.125 0.125 0.125 0.125 0.125 0.125 0.125 0.125 0.125 0.125 TotalDirectSalesTaxRate 2.000 2.375 2.375 2.375 2.375 2.375 2.375 2.375 2.375 2.375 TotalLocalOptionSalesTaxRate 2005 2006 2007 2008 2009 2010 2011 2012 2013 2014 StateofMissouri 4.000 4.000 4.000 4.000 4.000 4.000 4.000 4.000 4.000 4.000 Mo.StateConservation 0.125 0.125 0.125 0.125 0.125 0.125 0.125 0.125 0.125 0.125 Mo.StateParksandSoil 0.100 0.100 0.100 0.100 0.100 0.100 0.100 0.100 0.100 0.100 JacksonCounty 0.750 0.750 1.125 1.125 1.125 1.125 1.125 1.125 1.125 1.125 KansasCityZoo 0.000 0.000 0.000 0.000 0.000 0.000 0.000 0.125 0.125 0.125 (inpercent) CityofIndependence,Missouri SalesTaxRates DirectandOverlappingGovernments LastTenCalendarYears 130 CityofIndependence 1.875 2.250 2.250 2.250 2.250 2.250 2.250 2.250 2.250 2.250 TransportationDevelopmentDistrict 0.125 0.125 0.125 0.125 0.125 0.125 0.125 0.125 0.125 0.125 TotalDirectandOverlappingSalesTaxRate 6.975 7.350 7.725 7.725 7.725 7.725 7.725 7.850 7.850 7.850
Note:TherateshownfortheTransportationDevelopmentDistrictisforthe39thStreetcorridoronly. Source:MissouriDepartmentofRevenue
Table7 Assessed FiscalYear TotalTaxable Estimated Valueasa Ended Residential Agricultural Commercial State Personal Railroads Assessed TotalDirect Market Percentageof June30, Property Property Property Assessed Total Property &Utilities Value TaxRate Value ActualValue 2005 $ 774,627,429 1,142,640 256,016,698 5,525,949 1,037,312,716 256,782,138 251,053 1,294,345,907 0.6930 5,675,731,312 22.80% 2006 789,999,343 1,132,567 255,766,766 5,244,739 1,052,143,415 266,654,033 1,105,062 1,319,902,510 0.6930 5,787,206,471 22.81% 2007 826,183,410 1,077,386 289,266,376 4,991,962 1,121,519,134 278,254,929 836,952 1,400,611,015 0.6630 6,115,085,122 22.90% 2008 835,415,560 1,092,071 280,076,363 4,385,286 1,120,969,280 289,243,271 1,720,003 1,411,932,554 0.6630 6,168,940,666 22.89% 2009 774,152,986 1,020,696 255,474,757 3,793,786 1,034,442,225 268,317,482 1,114,259 1,303,873,966 0.6560 5,702,449,660 22.87% 2010 770,979,192 1,083,868 257,788,756 4,145,717 1,033,997,533 263,606,423 1,237,018 1,298,840,974 0.7030 5,680,839,244 22.86% 2011 781,239,728 1,126,981 235,721,480 4,951,250 1,023,039,439 262,875,610 1,242,492 1,287,157,541 0.7280 5,666,580,865 22.71% 2012 781,254,601 1,128,703 236,979,066 4,844,455 1,024,206,825 252,082,951 2,943,813 1,279,233,589 0.7236 5,643,175,957 22.67% 2013 779,674,017 1,128,605 235,695,566 4,816,906 1,021,315,094 254,225,408 3,612,882 1,279,153,384 0.7281 5,639,283,894 22.68% 2014 779,683,482 1,138,200 233,988,631 5,106,421 1,019,916,734 257,382,527 3,528,618 1,280,827,879 0.7394 5,644,201,744 22.69% Note: Theassessedvalueissetat19%forresidentialproperty;12%foragriculturalproperty;and32%forcommercialpropertyoftheestimatedfairmarketvalue. Note: TheCitydoesnotassesstaxesonpersonalproperty. Source: JacksonCountyAssessor'sOfficeandClayCountyAssessor'sOffice. OtherProperty CityofIndependence,Missouri AssessedValueandEstimatedActualValueofTaxableProperty LastTenFiscalYears RealProperty 131
TaxesaredueNovember1,delinquentafterDecember31.Apenaltyof1%permonth,uptoamaximumof10%isaddedforeachmonthofdelinquency. Collectionsareenforcedthroughtheattachmentandsaleoftheproperty.Commercialrealpropertyisalsoassessedanadditional"replacementtax"of1.437per $100assessedvalue.
TheGeneralFundandPublicHealth&RecreationFundlevyratesarelimitedbyMissouriStatutesto$1.00and$.40per$100.00assessedvaluation.Thereisno
(1) (2)
Table8 Basic/General PublicHealth Debt Total Metropolitan Junior Independence School Jackson TaxingYear Rate &Recreation Service Direct College District County State 2004 2003 $ 0.510 0.240 — 0.750 0.230 5.190 1.113 0.030 2005 2004 0.471 0.222 — 0.693 0.230 5.190 1.107 0.030 2006 2005 0.471 0.222 — 0.693 0.230 5.190 1.107 0.030 2007 2006 0.451 0.212 — 0.663 0.217 5.084 1.060 0.030 2008 2007 0.451 0.212 — 0.663 0.217 5.084 1.063 0.030 2009 2008 0.446 0.210 — 0.656 0.213 5.084 1.053 0.030 2010 2009 0.478 0.225 — 0.703 0.214 5.084 1.061 0.030 2011 2010 0.495 0.233 — 0.728 0.2329 5.430 1.0596 0.030 2012 2011 0.4924 0.2312 — 0.7236 0.2335 5.580 1.0596 0.030 2013 2012 0.4950 0.2331 — 0.7281 0.2349 5.670 1.0464 0.030 2014 2013 0.5026 0.2368 — 0.7394 0.2369 5.700 1.0464 0.030 Notes:
OverlappingRates CityofIndependence,Missouri PropertyTaxRates DirectandOverlappingGovernments LastTenFiscalYears (rateper$100assessedvalue)
FiscalYear ending(June30) CityDirectRates 132 (3)CountyTaxBreakdown(seenote5): Health&WelfareFund 0.1529 GeneralFund 0.1481 Road&BridgeFund 0.1391 ParkFund 0.0897 Mid-ContinentPublicLibrary 0.3200 DevelopmentallyDisabled 0.0748 MentalHealth 0.1218 TotalCounty 1.0464 (4)ThreeotherschooldistrictsareintheJacksonCountyportionoftheCityofIndependence.Schooltaxratesforthesedistrictsare: FortOsageReorganized#1 5.6000 BlueSpringsReorganized#4 5.7286 KansasCitySchoolDistrict 4.9500 limitonthelevyratesforGeneralDebtandInterest.
Table9 Total PercentageofTotal Total PercentageofTotal Assessed TaxableAssessed Assessed TaxableAssessed Taxpayer Value Rank Value Value Rank Value SimonPropertyGroupLP $ 26,224,136 1 2.05% $ 18,525,568 1 1.43% ColeEDDMtIndependenceLLC 8,963,343 2 0.70% SpaceCenterofKansasCity 6,730,787 3 0.53% 8,550,233 3 0.66% SouthernUnionCompany 5,953,893 4 0.46% 3,926,922 7 0.30% Sprint 4,893,443 5 0.38% AT&T 4,813,889 6 0.38% UnileverBestfoodsNA 4,737,385 7 0.37% MansionApartment 4,530,213 8 0.35% CenterpointMedicalCenter 4,125,533 9 0.32% ComcastCablevision 3,685,525 10 0.29% DDRMDTIndpendenceCommons 9,286,793 2 0.72% BradleyOperatingLTDPTP 7,402,354 4 0.57% AlliantLakeCity 5,755,545 5 0.44% NolandFashionSquarePartners 5,103,999 6 0.39% SouthwesternBell 3,844,865 8 0.30% IndependenceRegionalHospital 3,587,375 9 0.28% 2014 2005 CityofIndependence,Missouri PrincipalPropertyTaxpayers CurrentYearandTenYearsAgo 133 Burd&Fletcher 3,477,899 10 0.27% Total $ 74,658,147 5.83% $ 69,461,553 5.37% Source:JacksonCountyCollectionDepartment
Table10 FiscalYear TaxesLevied Percentage Collectionsin Percentage EndedJune30, forFiscalYear Amount ofLevy SubsequentYears Amount ofLevy 2005 $ 6,444,741 $ 6,084,821 94.42% $ 357,771 $ 6,442,592 99.97% 2006 6,818,619 6,164,479 90.41% 651,237 6,815,716 99.96% 2007 6,905,547 6,557,341 94.96% 344,905 6,902,246 99.95% 2008 7,103,810 6,645,387 93.55% 453,960 7,099,347 99.94% 2009 7,287,258 6,807,203 93.41% 477,905 7,285,108 99.97% 2010 7,232,424 6,883,318 95.17% 319,118 7,202,435 99.59% 2011 7,493,616 7,145,073 95.35% 292,856 7,437,929 99.26% 2012 7,495,895 6,971,357 93.00% 335,053 7,306,410 97.47% 2013 7,402,402 7,065,183 95.44% 167,306 7,232,488 97.70% 2014 7,625,313 7,145,159 93.70% — 7,145,159 93.70% Source:CityofIndependence CollectedwithinFiscalYearofLevy TotalCollectionstoDate CityofIndependence,Missouri PropertyTaxLeviesandCollections LastTenFiscalYears 134
Table11 SalesbyCategory: 2005 2006 2007 2008 2009 2010 2011 2012 2013 2014 PowerandLight: Residential $ 41,375,000 50,668,000 53,326,000 55,218,000 52,555,000 56,500,000 64,723,000 71,334,000 71,667,000 72,259,000 Commercial 36,011,000 40,881,000 43,673,000 44,708,000 45,171,000 48,273,000 52,003,000 58,366,000 56,044,000 56,838,000 Industrial 2,504,000 2,649,000 2,891,000 2,999,000 2,904,000 3,085,000 3,292,000 4,462,000 4,839,000 4,867,000 SoldtoOtherUtilities 779,000 1,839,000 796,000 2,081,000 1,765,000 4,039,000 3,077,000 1,909,000 2,380,000 2,254,000 Other 1,008,000 1,128,000 1,214,000 1,328,000 1,434,000 1,621,000 1,551,000 1,644,000 606,000 570,000 Water: Residential 7,789,773 8,488,894 8,657,593 8,994,600 9,037,744 9,403,985 10,726,567 11,699,971 13,080,814 13,052,557 Commercial 2,053,011 2,245,526 2,347,234 2,458,013 2,450,246 2,404,953 2,835,271 3,325,167 3,847,161 3,555,507 Industrial 331,251 362,537 367,863 308,642 300,577 407,313 450,156 479,477 547,930 769,857 PublicAuthority 189,489 231,257 228,957 267,428 281,615 297,218 263,137 256,730 270,391 262,012 SoldtoOtherUtilities 5,670,010 5,858,904 5,232,779 5,023,444 4,930,608 6,302,495 6,659,302 7,153,628 7,714,290 8,136,297 Other 960,563 968,733 1,060,453 1,081,606 1,344,666 1,217,907 1,245,524 1,289,923 1,531,318 1,760,366 SanitarySewer: Residential 8,834,127 9,196,013 9,584,113 9,854,124 9,841,314 9,733,214 9,873,906 10,460,524 10,601,887 11,329,939 Commercial 4,322,804 4,364,268 4,585,890 4,559,524 4,560,728 4,569,721 4,841,546 5,099,839 5,288,864 5,755,295 Other 797,791 774,222 854,930 881,836 906,142 897,895 2,443,875 2,628,416 4,340,296 4,295,186 Total $112,625,819 129,655,354 134,819,812 139,763,217 137,482,640 148,752,701 163,985,284 180,108,675 182,758,951 185,705,016 Source:CityofIndependence CityofIndependence,Missouri TotalUtilitySalesbyCategory LastTenFiscalYears 135
Table12 RatesbyCategory: 2005 2006 2007 2008 2009 2010 2011 2012 2013 2014 PowerandLight(perKwh): $ Residential 0.08 0.09 0.10 0.10 0.10 0.11 0.12 0.14 0.14 0.14 Commercial 0.07 0.08 0.09 0.09 0.09 0.10 0.10 0.12 0.12 0.13 Industrial 0.05 0.06 0.06 0.07 0.07 0.07 0.08 0.09 0.09 0.09 SoldtoOtherUtilities 0.03 0.04 0.04 0.05 0.03 0.03 0.03 0.02 0.03 0.04 Other 0.11 0.12 0.13 0.14 0.15 0.16 0.15 0.15 0.06 0.10 Water(per1,000gallons): Residential 2.49 2.54 2.63 2.80 3.06 3.35 3.61 3.91 4.14 4.49 Commercial 2.27 2.34 2.41 2.52 2.78 3.08 3.33 3.59 3.82 4.10 Industrial 1.14 1.31 1.34 1.44 1.73 1.97 2.23 2.25 2.29 2.42 PublicAuthority 2.28 2.34 2.42 2.58 2.86 3.11 3.34 3.67 3.89 4.16 SoldtoOtherUtilities 1.17 1.21 1.10 1.03 1.10 1.23 1.35 1.46 1.57 1.69 Other NA NA NA NA NA NA NA NA NA NA SanitarySewer(per100cubicfeet): Residential 2.97 3.13 3.18 3.35 3.50 3.40 3.62 3.90 4.16 4.31 Commercial 2.32 2.46 2.64 2.68 2.69 3.08 3.09 3.42 3.09 3.81 Total $ 14.98 15.72 16.13 16.84 18.16 19.70 21.05 22.73 23.39 25.48
CityofIndependence,Missouri TotalUtilityRatesbyCategory LastTenFiscalYears 136
Source:CityofIndependence
Table13 Total PercentageofTotal Total PercentageofTotal UtilityCustomer-PowerandLight Sales Rank Sales Sales Rank Sales Unilever(ThomasJ.LiptonCo) $ 2,057,363 1 1.50% $ 1,157,539 1 1.42% CenterpointMedicalCenter 1,758,546 2 1.29% — 0.00% BurdandFletcher(CombinedAccounts) 1,646,393 3 1.20% 961,888 2 1.18% SimonPropertyGroupLP 1,096,734 4 0.80% 888,323 4 1.09% SmartWarehouse/CommercialDistributionsCenter 857,793 5 0.63% 889,651 3 1.09% HCPMOBCenterpoint(BoyerCompany) 638,431 6 0.47% — 0.00% CostcoWholesalesInc. 538,476 7 0.39% 306,052 10 0.37% IndependenceEventsCenter 531,343 8 0.39% — 0.00% PriceChopper(23rdStreet) 468,670 9 0.34% 364,706 8 0.45% Hy-Vee(NolandRoad) 447,393 10 0.33% — 0.00% IndependenceRegionalHealthCenter — 0.00% 407,982 5 0.50% PriceChopper(NolandRoad) — 0.00% 385,970 6 0.47% City'sRockCreekSanitarySewerPlant — 0.00% 371,756 7 0.46% MedicalCenterofIndependence — 0.00% 309,518 9 0.38% 2014 2005 CityofIndependence,Missouri PrincipalUtilityPayers- CurrentYearandNineYearsAgo PowerandLight 137 Total $ 10,041,142 7.34% $ 6,043,385 7.40% Source:CityofIndependence
Table14 Total PercentageofTotal Total PercentageofTotal UtilityCustomer-Water Sales Rank Sales Sales Rank Sales Lee'sSummit $ 4,646,265 1 16.87% $ 2,841,988 1 16.72% BlueSprings 1,210,225 2 4.39% 1,179,131 2 6.94% District#2,JacksonCounty 573,793 3 2.08% 379,696 3 2.23% District#1,LafayetteCounty 413,388 4 1.50% 279,612 5 1.65% Audubon(Lafarge)Corporation 409,265 5 1.49% 137,811 9 0.81% OakGrove 397,388 6 1.44% 280,176 4 1.65% District#15,JacksonCounty 285,731 7 1.04% 147,375 8 0.87% GrainValley 243,447 8 0.88% 242,290 6 1.43% Unilever(ThomasJ.LiptonCo) 207,465 9 0.75% 129,022 10 0.76% Buckner 162,742 10 0.59% 150,277 7 0.88% Total $ 8,549,709 31.05% $ 5,767,378 33.94% 2014 2005 CityofIndependence,Missouri PrincipalUtilityPayers- CurrentYearandNineYearsAgo Water 138
Source:CityofIndependence
Note:Amountsforcustomers7through10arenotavailablefor2005.
Table15 Total PercentageofTotal Total PercentageofTotal UtilityCustomer-Sewer Sales Rank Sales Sales Rank Sales Unilever(ThomasJ.LiptonCo) $ 1,044,639 1 4.89% $ 515,432 1 3.69% BP/AMOCO 194,244 2 0.91% 261,001 3 1.87% CityofIndependence,Power&Light 79,080 3 0.37% 376,599 2 2.70% SmartWarehouse/CommercialDistributionsCenter 57,836 4 0.27% 21,619 6 0.15% CenterpointMedicalCenter 49,976 5 0.23% SpaceCenterofKC 49,755 6 SimonPropertyGroupLP 46,585 7 0.22% 34,632 5 0.25% HighlandParkInvestors 46,265 8 0.22% BassPro 23,089 9 0.11% PriceChopper(23rdStreet) 18,091 10 0.08% IndependenceRegionalHealthCenter 0.00% 376,599 4 2.70% Total $ 1,609,560 7.30% $ 1,585,882 11.36%
2014 2005 CityofIndependence,Missouri PrincipalUtilityPayers- CurrentYearandNineYearsAgo SanitarySewer 139 Source:CityofIndependence
Table16 Neighborhood Capital Certificatesof FiscalYear LoansPayable ImprovementDistrict Leases Participation 2005 (2)$ 21,498,153 $ 1,039,990 $ 1,015,831 $ — 2006 (2) 18,590,023 982,044 737,370 — 2007 23,870,529 923,099 712,483 — 2008 20,681,754 864,153 650,673 — 2009 13,586,351 800,207 603,524 — 2010 14,366,011 736,261 431,454 — 2011 11,580,656 667,315 292,063 — 2012 (3) 180,792,033 598,369 1,642,764 — 2013 171,371,974 528,423 1,407,347 — 2014 167,681,305 453,477 1,226,414 — Percentageof Capital Certificatesof TotalPrimary Personal Per FiscalYear RevenueBonds LoansPayable Leases Participation Government Income(1) Capita(1) 2005 $ 62,969,608 $ — $ — $ — $ 86,523,582 3.39% $ 751.42 2006 59,361,323 — — — 79,670,760 3.03% 687.10 2007 55,548,038 — — — 81,054,149 3.06% 696.59 2008 63,829,753 — — — 86,026,333 3.48% 788.08 2009 178,411,467 — 65,954 — 193,467,503 7.48% 1,695.18 GovernmentalActivities Business-TypeActivities CityofIndependence,Missouri RatiosofOutstandingDebtbyType LastTenFiscalYears 140 2010 175,035,863 — 43,988 — 190,613,577 6.77% 1,572.56 2011 195,970,016 — 21,353 — 208,531,403 7.91% 1,784.91 2012 243,037,399 — — — 426,070,565 15.64% 3,635.01 2013 296,937,015 — — — 470,244,759 16.92% 4,010.96 2014 342,793,093 — — — 512,154,289 18.43% 4,368.43 Notes: (1)SeeTable21forpersonalincomeandpopulationdata. (2)In2005theTaxIncrementFinancingfundswereremovedfromtheprimarygovernmentpresentationandshownasadiscretelypresentedcomponentunit. (3)In2012theTaxIncrementFinancingfundswereaddedbacktotheprimarygovernmentpresentationandshownasablendedpresentedcomponentunit.
CityofIndependence,Missouri RatiosofGeneralBondedDebtOutstanding
LastTenFiscalYears
GeneralBondedDebtOutstanding
Notes: (1)SeeTable7forpropertyvaluedata.
(2)SeeTable21forpopulationdata.
Note: TheCitydoesnothaveanyGeneralBondedDebtoverthepasttenfiscalyears.DetailsregardingtheCity's outstandingdebtcanbefoundinthenotestothefinancialstatements.
Table17 PercentageofEst. General LessAmounts ActualTaxable Per FiscalYear ObligationBonds AvailableinDebtService Total ValueofProperty(1) Capita(2) 2005 $ — $ — $ — 0.00% $ — 2006 — — — 0.00% — 2007 — — — 0.00% — 2008 — — — 0.00% — 2009 — — — 0.00% — 2010 — — — 0.00% — 2011 — — — 0.00% — 2012 — — — 0.00% — 2013 — — — 0.00% — 2014 — — — 0.00% —
141
Overlappinggovernmentsarethosethatcoincide,atleastinpart,withthegeographicboundariesoftheCity. Thisscheduleestimatestheportionoftheoutstandingdebtofthoseoverlappinggovernmentsthatisbornebythe residentsandbusinessesofIndependence.Thisprocessrecognizesthat,whenconsideringtheCity'sability toissueandrepaylong-termdebt,theentiredebtburdenbornebytheresidentsandbusinessesshouldbe takenintoaccount.However,thisdoesnotimplythateverytaxpayerisaresident,andthereforeresponsible forrepayingthedebt,ofeachoverlappinggovernment.
Note:
Source:Thedebtoutstandingdataandapplicablepercentagesareprovidedbyeachgovernmentalentity,andisbasedonthe City'spercentageofassessedvaluationwithintheschooldistrict.
Table18 EstimatedShare Debt EstimatedPercentage ofOverlapping GovernmentalUnit Outstanding Applicable Debt Debtrepaidwithpropertytaxes BlueSpringsReorganized#4SchoolDistrict $ 137,380,000 4.90% $ 6,731,620 IndependenceSchoolDistrict 138,585,000 93.61% 129,729,419 RaytownSchoolDistrict 86,704,999 6.00% 5,202,300 FortOsageReorganized#1SchoolDistrict 49,630,000 12.50% 6,203,750 Subtotal,overlappingdebt 147,867,088 Citydirectdebt 169,361,196 Totaldirectandoverlappingdebt $ 317,228,284 CityofIndependence,Missouri DirectandOverlappingGovernmentalActivitiesDebt AsofJune30,2014 142
(1)-Article6,Section26(b)oftheMissouriConstitutionpermitsanycountyorcity,byvoteoffour-seventhsofqualifiedelectorsvotingthereon,toincuranindebtednessofcitypurposesnot toexceed5percentofthevalueofthetaxabletangiblepropertytherein,asshownbythelastassessment.
(1)-Article6,Section26(c)oftheMissouriConstitutionpermitsanycountyorcity,byvoteoffour-seventhsofqualifiedelectorsvotingthereon,toincuradditionalindebtednessofcitypurposesnot toexceed5percentofthevalueofthetaxabletangiblepropertytherein,asshownbythelastassessment.
(1)-Article6,Section26(d)&(e)oftheMissouriConstitutionprovidesthatanycitymaybecomeindebtednotexceedingintheaggregateanadditional10percentofthevalueofthe taxabletangiblepropertyforthepurposeofacquiringright-of-ways,constructing,extendingandimprovingstreetsandavenuesand/or sanitaryorstormsewersystemsandanadditional10percentforpurchasingorconstructionofwaterworks,electricorotherlightplantsprovided thetotalgeneralobligatedindebtednessofthecitydoesnotexceed20percentoftheassessedvaluation.
Table19 2005 2006 2007 2008 2009 2010 2011 2012 2013 2014 DebtLimit(1) $ 258,869,181 263,980,502 280,122,203 282,386,511 282,386,511 259,768,195 257,431,508 255,846,718 255,830,677 256,165,576 Totalnetdebtapplicabletolimit 948,722 896,700 840,870 790,240 790,240 650,505 585,340 515,768 455,018 368,810 LegalDebtMargin $ 257,920,459 263,083,802 279,281,333 281,596,271 281,596,271 259,117,690 256,846,168 255,330,950 255,375,659 255,796,766 Totalnetdebtapplicabletothe limitasapercentageofdebtlimit 0.366% 0.340% 0.300% 0.280% 0.280% 0.250% 0.227% 0.202% 0.178% 0.144% LegalDebtMarginCalculationforFiscalYear2014 AssessedValue $ 1,280,827,879 DebtLimit(20%ofassessedvalue) 256,165,576 Generalobligation: City-Wide — NeighborhoodImprovementDistricts 453,477 RevenueBonds 342,793,093 TotalBondedDebt 343,246,570 Less: ElectricUtilityBonds 131,497,433 WaterUtilityBonds 39,066,307 SewerUtilityBonds 81,071,566 EventsCenterBonds 91,157,787 DebtServiceFundBalance 84,667 Totalnetdebtapplicabletolimit 368,810 Legaldebtmargin $ 255,796,766 Notes: CityofIndependence,Missouri LegalDebtMarginInformation LastTenFiscalYears 143
CityofIndependence,Missouri Pledged-RevenueCoverage
Note: DetailsregardingtheCity'soutstandingdebtcanbefoundinthenotestothefinancialstatements.
Notes:
(1)Operatingexpensesexcludesdepreciation,interestexpense,amortization,non-operatingexpenses,OPEB,andpaymentsinlieuoftaxes.
(2)NumbersdisplayedforPowerandLightareinaccordancewithFERCaccounting.NumbersdisplayedforWaterareinaccordancewith NARUCaccounting.
Table20 Fiscal Less:Operating NetAvailable Year Revenues Expenses(1) Revenue Principal Interest(2) Coverage Power&Light(2) 2005 $ 84,020,908 $ 64,452,736 $ 19,568,172 $ 1,855,000 $ 921,038 $ 7.05 2006 100,254,630 75,369,477 24,885,153 1,925,000 855,273 8.95 2007 105,313,797 80,423,304 24,890,493 1,995,000 784,823 8.95 2008 109,358,222 90,141,975 19,216,247 2,065,000 708,218 6.93 2009 106,810,460 88,778,796 18,031,664 2,155,000 1,157,423 5.44 2010 115,265,625 91,580,614 23,685,011 2,245,000 2,149,388 5.39 2011 127,486,725 98,684,455 28,802,270 2,965,000 2,645,010 5.13 2012 140,997,371 104,196,848 36,800,523 3,820,000 3,042,435 5.36 2013 138,561,630 100,672,846 37,888,784 4,080,000 6,100,037 3.72 2014 139,621,307 106,187,200 33,434,107 5,015,000 5,853,306 3.08 Water(2) 2005 $ 17,928,618 $ 11,096,626 $ 6,831,992 $ 1,285,000 $ 2,014,517 $ 2.07 2006 19,285,620 12,300,943 6,984,677 1,905,000 2,053,730 1.76 2007 18,473,889 12,850,111 5,623,778 2,040,000 1,923,627 1.42 2008 18,422,122 13,268,938 5,153,184 2,200,000 1,838,014 1.28 2009 18,709,946 13,618,857 5,091,089 2,380,000 2,032,591 1.15 2010 20,224,820 13,386,180 6,838,640 2,525,000 2,413,924 1.38 2011 22,292,691 13,133,820 9,158,871 2,790,000 2,210,141 1.83 2012 25,043,870 13,882,468 11,161,402 2,965,000 2,096,341 2.21 2013 28,165,483 16,255,647 11,909,836 3,180,000 2,003,608 2.30 2014 29,374,518 16,856,321 12,518,197 3,395,000 1,463,831 2.58 SanitarySewer 2005 $ 14,272,438 $ 10,017,560 $ 4,254,878 $ — $ — $ — 2006 14,850,445 10,400,801 4,449,644 — — — 2007 15,519,278 10,884,567 4,634,711 — — — 2008 15,860,966 11,852,963 4,008,003 — — — 2009 15,585,793 13,005,365 2,580,428 — — —
LastTenFiscalYears DebtService 144 2010 15,310,352 13,001,081 2,309,271 — — — 2011 17,099,048 13,451,850 3,647,198 — — — 2012 19,260,332 13,840,938 5,419,394 — — — 2013 20,249,977 13,440,965 6,809,012 — 1,030,631 6.61 2014 21,501,256 14,301,898 7,199,358 745,000 2,740,012 2.07
Table21 PersonalIncome PerCapita Median School Unemployment CalendarYear(3) Population(1) (thousandsofdollars) PersonalIncome(1) Age(1) Enrollment(2) Rate(1) 2004 114,745 $ 2,465,640,560 $ 21,488 38.55 18,215 6.50% 2005 115,146 2,552,786,820 22,170 38.57 16,278 6.00% 2006 115,953 2,632,249,053 22,701 38.91 14,829 5.30% 2007 116,359 2,651,123,456 22,784 39.22 14,113 5.40% 2008 109,159 2,471,141,442 22,638 39.28 13,550 6.40% 2009 114,128 2,585,569,840 22,655 39.56 16,065 9.80% 2010 121,212 2,817,572,940 23,245 39.81 20,755 10.35% 2011 116,830 2,636,035,290 22,563 38.79 19,505 10.20% 2012 117,213 2,723,795,694 23,238 38.18 24,900 7.10% 2013 117,240 2,778,588,000 23,700 39.60 25,320 6.90% Note: (3)Theinformationshownisforcalendaryears. CityofIndependence,Missouri DemographicandEconomicStatistics LastTenCalendarYears 145 Sources: (1)InformationprovidedbyU.S.CensusBureau,Mid-AmericaRegionalCouncilorClaritas,Inc. (2)Informationprovidedbyschooldistricts.
Table22 Percentageof Percentageof TotalCity TotalCity Employer Employees Rank Employment Employees Rank Employment AlliantTechSystems(LakeCity) 2,000 1 3.70% 1,286 2 2.33% IndependenceSchoolDistrict 2,000 2 3.70% CenterpointMedicalCenter 1,600 3 2.96% 0.00% CityofIndependence 1,126 4 2.08% GovernmentEmployeeHealthAssociation 650 5 1.20% 650 3 1.18% RosewoodHealthCenterattheGroves 400 6 0.74% 300 6 0.54% Burd&Fletcher 350 7 0.65% 350 5 0.64% JacksonCountyCircuitCourt 274 8 0.51% Mid-ContinentLibrary 220 9 0.41% Unilever 190 10 0.35% 290 7 0.53% HealthMidwest 1,400 1 2.54% SouthwesternBellTelephone 550 4 1.00% Sprint 200 8 0.36% Comcast 165 9 0.30% SpaceCenterDistribution 150 10 0.27% Total 8,810 16.17% 5,341 9.58% 2014 2005 CityofIndependence,Missouri PrincipalEmployers CurrentYearandNineYearsAgo 146 Source:IndependenceCouncilforEconomicDevelopmentandMid-AmericaRegionalCouncil.
Table 23 2005200620072008200920102011201220132014 Function/Program General Government City council office10.00 10.00 10.00 10.00 10.00 10.00 10.00 10.00 10.00 10.00 City clerk6.50 6.00 6.00 6.00 6.00 6.00 6.00 6.00 6.00 7.00 City manager7.00 7.50 10.50 10.50 10.50 9.50 9.50 7.00 7.00 7.00 National Frontiers Trails Museum6.00 6.00 6.00 6.00 6.00 6.00 6.00 5.75 5.75 5.75 Technology services20.00 20.00 21.00 21.00 21.00 21.00 21.00 22.00 22.00 22.00 Municipal court13.00 13.00 13.00 14.00 14.00 14.00 14.00 14.00 14.67 14.65 LawGeneral fund5.50 5.75 6.75 6.51 6.50 6.50 6.00 6.25 6.25 6.25 LawGrant fund0.50 0.50 0.50 0.37 0.25 0.25 0.25 0.25 0.25 0.25 Finance24.00 25.00 26.00 25.00 24.15 24.15 24.15 22.65 22.65 22.65 Human resources7.50 7.50 7.50 7.50 7.50 7.50 6.50 6.50 6.44 7.44 Public Safety PoliceGeneral fund277.00 281.50 281.50 283.00 290.40 290.40 292.90 274.65 276.91 291.91 PoliceGrant fund15.00 12.00 10.00 14.00 15.00 15.00 13.00 14.00 13.00 13.00 FireGeneral fund173.25 173.25 173.25 173.25 173.25 173.25 173.25 173.25 173.25 169.25 FireGrant fund0.75 0.75 0.75 0.75 0.75 0.75 0.75 0.75 0.75 4.75 Public Works General Fund81.00 82.00 83.00 82.00 82.00 82.00 83.00 79.90 79.90 80.27 Street Sales Tax Fund— — — — — — — — 3.00 3.00 Health and Welfare General fund33.50 34.25 34.25 35.25 35.25 35.25 36.00 35.16 40.20 29.33 Grant fund5.50 6.00 7.70 6.25 7.10 5.35 4.95 8.65 7.65 9.06 Culture and Recreation General fund41.70 36.70 35.53 32.65 32.65 33.46 31.71 28.71 30.15 27.85 Tourism fund4.41 4.41 4.41 4.41 4.41 4.41 4.41 4.66 4.66 5.66 ParkImprovementSalesTaxfund 1159 1259 1712 2529 2529 2398 2248 2175 2075 2470 Last Ten Fiscal Years Full-time Equivalent City Government Employees by Function/Program City of Independence, Missouri 147 P ar k I mprovemen t S a l es T ax f un d 11 59 12 59 17 12 25 29 25 29 23 98 22 48 21 75 20 75 24 70 Community Development General fund22.00 26.00 25.75 26.64 26.05 27.55 27.05 27.30 27.30 27.30 Community Dev Block Grant fund3.00 3.00 2.50 2.11 2.70 2.00 2.00 2.00 2.00 2.00 HOME Program fund1.00 1.00 1.00 1.00 1.00 1.00 1.00 1.00 1.00 1.00 Storm Water Water Poll ControlGeneral Fund5.00 5.00 5.00 5.00 5.00 5.00 5.00 — — — Storm Water Sales Tax fund8.00 8.00 8.00 8.00 8.00 8.00 8.00 13.00 13.00 13.00 Power and Light Technology ServicesGeneral Fund1.00 1.00 1.00 1.00 1.00 1.00 1.00 1.50 1.50 1.50 Power and Light220.00 220.00 220.00 220.00 217.00 218.00 222.00 233.00 236.00 238.00 Water FinanceGeneral fund1.00 1.00 0.17 0.15 0.85 0.85 0.85 0.85 0.85 0.85 Water97.48 98.48 97.48 98.50 101.65 101.65 101.65 93.65 93.42 92.42 Sewer Public WorksGeneral fund1.00 1.00 1.00 1.00 1.00 1.00 1.00 1.00 1.00 1.00 Water Pollution Control70.00 70.00 70.00 70.00 70.00 70.00 70.00 70.00 70.00 70.00 Central Garage fund9.00 9.00 9.00 10.00 10.00 9.75 9.75 9.75 9.75 9.75 Worker' Compensation Fund— — — 1.75 1.75 1.75 1.75 2.00 2.00 2.00 Total1,182.18 1,188.18 1,195.66 1,208.88 1,218.00 1,216.30 1,216.90 1,196.93 1,209.05 1,220.59 Source: City of Independence Budget
Source:CityofIndependence
Note:Therewasatrackingissueduring2013-14forTourism'sleisurevistorinquiresthatshouldnowbecorrected.
Table24 2005 2006 2007 2008 2009 2010 2011 2012 2013 2014 Function/Program GeneralGovernment NationalFrontiersTrailsMuseum Numberofvisitorstomuseum 17,183 15,986 14,621 15,095 14,900 16,691 15,126 14,123 12,932 13,470 PublicSafety Police PoliceIncidentCalls 128,891 130,242 126,301 122,667 125,899 126,087 100,096 98,282 112,197 90,403 TrafficUnitCitationsIssued 31,323 20,257 30,984 31,241 31,969 38,465 19,082 19,977 33,234 40,761 Fire TotalAlarms 12,895 13,166 13,354 13,130 15,374 16,081 16,931 16,907 17,126 16,929 PublicEducationAudience 18,363 18,818 18,502 18,830 10,291 38,133 35,243 19,508 26,099 25,591 PublicWorks StreetOverlay(lanemiles) 88 66 26 — 53 63 16 35 32 39 StreetPatchingJobs 542 474 3,897 6,822 3,168 6,163 7,181 5,069 4,319 7,718 HealthandWelfare FoodHandlersTrained 9,680 7,696 8,663 10,112 8,850 9,333 7,036 6,582 5,863 5,187 FluShotsGiven 431 680 1,118 764 789 7,369 661 422 — — AnimalControlServiceCalls 6,446 7,294 8,415 6,641 9,314 9,489 6,957 7,499 6,343 6,255 CultureandRecreation ParkShelterReservations 214 462 457 646 872 715 730 524 579 657 NumberofSermonCenterMemberships 948 930 1,095 1,500 1,323 1,574 1,577 1,577 1,671 1,332 CommunityDevelopment PermitsIssued 5,281 4,792 4,048 4,100 3,782 3,246 4,538 3,177 2,728 3,049 FiscalYear CityofIndependence,Missouri OperatingIndicatorsbyFunction/Program LastTenFiscalYears 148 Tourism SiteAttendance 290,499 295,381 260,342 244,524 230,483 222,104 287,466 374,525 130,249 293,772 LeisureVisitorInquiries 34,512 44,943 34,116 35,446 33,392 39,925 38,828 50,517 37,126 1,282 PowerandLight Averagenumberofmonthlycustomers 55,921 56,402 56,562 56,790 56,656 56,585 56,458 56,292 56,297 56,474 Water Numberofcustomers 47,461 47,769 48,358 48,350 48,318 47,822 48,089 48,145 48,121 48,253 Watermainbreaks 182 241 271 179 171 202 267 249 402 318 Sewer Numberofcustomers 43,909 44,290 44,351 44,210 44,279 44,232 44,078 44,085 44,062 44,166 WastewaterTreated(MillionGallons) 3,207 2,935 2,348 2,701 3,080 3,249 2,515 2,261 2,361 2,124
Table25 2005 2006 2007 2008 2009 2010 2011 2012 2013 2014 Function/Program PublicSafety Police Policestations 3 3 4 4 4 5 4 3 5 5 Vehicles 90 177 203 206 201 215 166 180 191 191 K-9Facility 1 1 1 1 1 1 1 1 1 1 Fire FireStations 10 10 10 10 10 10 10 10 10 10 FireTrainingFacilities — — — — 1 1 1 1 1 1 Vehicles 41 44 45 42 45 48 47 45 44 45 PublicWorks Totalarea(squaremiles) 78 78 78 78 78 78 78 78 78 78 Pavedmiles 535 580 550 564 547 557 565 565 560 560 CultureandRecreation Parkacreage 724 757 826 728 728 781 730 843 843 887 Parks 42 43 44 42 42 45 43 45 46 42 CommunityCenters 3 3 3 3 3 3 3 4 3 3 FitnessCenters 2 2 2 2 2 2 2 2 2 3 BallFields 53 53 53 54 54 57 54 42 45 44 PowerandLight Powerstations 5 5 5 5 5 5 5 6 6 5 Transmission/DistributionCircuits(miles) 809 817 829 835 840 844 847 859 853 869 Maximumdailyuse(Mwh) 5,320 5,464 5,865 5,579 5,472 4,909 5,456 5,780 5,654 4,818 Water Watermains(miles) 711 729 736 741 742 746 750 757 758 759 FiscalYear CityofIndependence,Missouri CapitalAssetStatisticsbyFunction/Program LastTenFiscalYears 149 Firehydrants 4,186 4,401 4,520 4,635 4,679 4,728 4,787 4,854 4,875 4,910 Maximumdailypumpage(millionsofgallons) 41 44 44 39 38 35 42 42 47 40 Sewer Numberoftreatmentplants 1 1 1 1 1 1 1 1 1 1 Sewersmains(miles) 576 578 590 578 596 597 596 614 614 614 Maximumdailycapacityoftreatment(MGD) 19 19 18 16 18 18 18 16 16 32 Source:CityofIndependence