2015-16 Adopted
Operating Budget
OPERATING BUDGET
City of Independence, Missouri
FOR THE FISCAL YEAR
July 1, 2015 through June 30, 2016
MAYOR
Eileen N. Weir
CITY COUNCIL
Karen M. DeLuccie
Chris Whiting
Marcie I. Gragg
Curt Dougherty
Dr. Scott Roberson
At-Large
At-Large
District #1
District #2
District #3
Tom Van Camp District #4
CITY MANAGER
Robert E. Heacock
The Government Finance Officers Association of the United States and Canada (GFOA) presented a Distinguished Budget Presentation Award to the City of Independence, Missouri for its annual budget for the fiscal year beginning July 1, 2014. In order to receive this award, a governmental unit must publish a budget document that meets program criteria as a policy document, as an operations guide, as a financial plan, and as a communications device.
This award is valid for a period of one year only. We believe our current budget continues to conform to program requirements, and we are submitting it to GFOA to determine its eligibility for another award.
TABLE OF CONTENTS
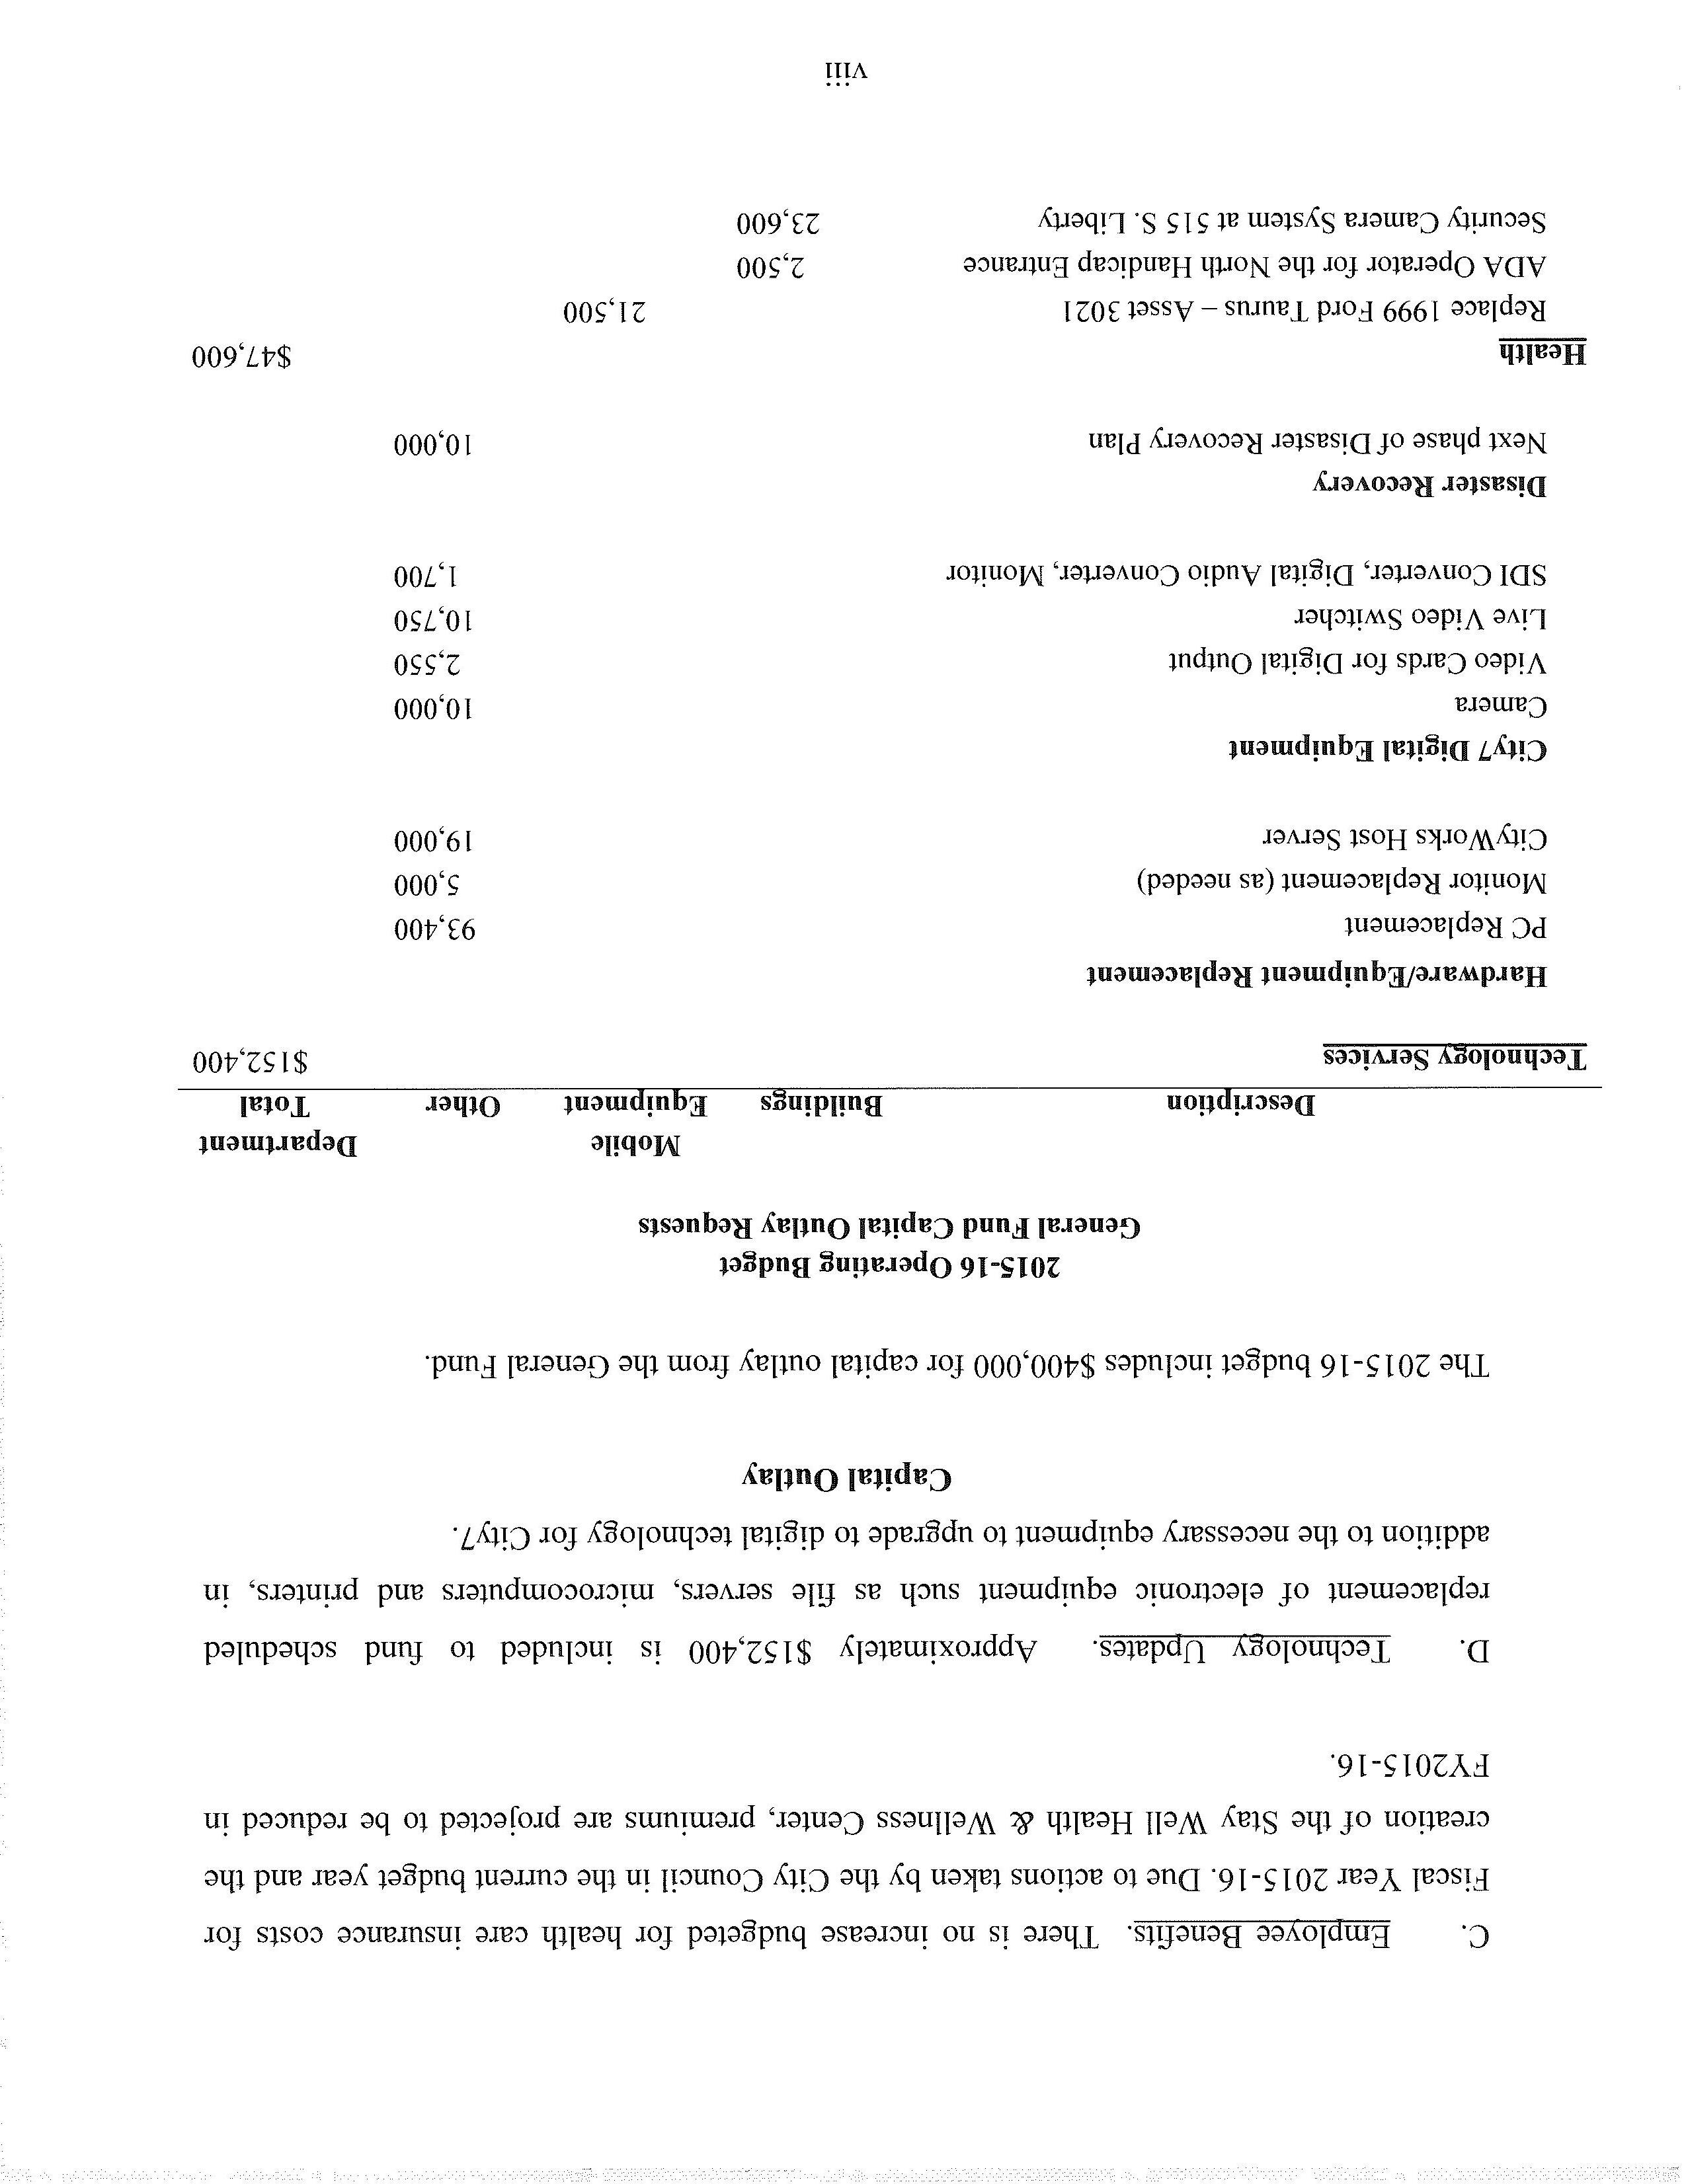
Guide to Independence’s Budget Document Budget Message .................................................................................................................. i City Vision, Goals and Objectives ...................................................................................... 1 Financial Policies .................................................................................................................3 Budget Procedures & Policies..............................................................................................6 Budget Calendar .................................................................................................................11 Equal Employment Opportunity Plan ................................................................................13 General Fund Financial SummaryBudget Summary .....................................................................................................17 Fund Balance History ..............................................................................................18 Revenue Summary...................................................................................................20 Summary of Appropriations Allocated by Department and Division .....................23 Summary of Appropriations by Type of Expenditure ............................................25 Summary of Operating Transfers/Designations of Fund Balance ...........................27 Authorized Positions ...............................................................................................28 Operating Departments: City Council ...........................................................................................................31 City Clerk ...............................................................................................................37 City Manager .........................................................................................................46 Technology Services ..............................................................................................52 Municipal Court ....................................................................................................62 Law .........................................................................................................................67 Finance ..................................................................................................................75 Human Resources ..................................................................................................88 Community Development .....................................................................................96 Police .....................................................................................................................120 Fire ........................................................................................................................160 Health ...................................................................................................................183 Public Works........................................................................................................203 Parks and Recreation ..........................................................................................222 Other AccountsNon-Departmental (All Funds)..............................................................................252 Capital Outlay........................................................................................................254 City Council Strategic Goals Accounts .................................................................255 Power and Light Fund Budget Summary............................................................................................265 Historical Data and Budgeted Positions Summary ........................................266 Revenue Summary .........................................................................................267 Rate Survey With Area Utilities ....................................................................268 Power and Light Department .....................................................................269 Debt Service ...................................................................................................301 Capital Budget ..............................................................................................302
TABLE OF CONTENTS (Continued)
Sanitary Sewer Fund Budget Summary............................................................................................304 Historical Data and Budgeted Positions Summary ........................................305 Revenue Summary .........................................................................................306 Rate Survey With Area Utilities ....................................................................307 Water Pollution Control Department ........................................................308 Debt Service ..................................................................................................326 Capital Budget ...............................................................................................327 Water Fund Budget Summary............................................................................................329 Historical Data and Budgeted Positions Summary ........................................330 Revenue Summary .........................................................................................331 Rate Survey With Area Utilities ....................................................................332 Water Department .......................................................................................333 Debt Service ...................................................................................................348 Capital Budget ...............................................................................................349 Other Funds Tourism Fund Budget Summary ..........................................................................351 Tourism Fund Balance History ......................................................................352 Tourism Department ...................................................................................353 Street Improvements Sales Tax Fund ..................................................................363 Park Improvements Sales Tax Fund .....................................................................366 Storm Water Improvements Sales Tax Fund .......................................................369 Police Public Safety Sales Tax Fund ...................................................................372 Fire Public Safety Sales Tax Fund .......................................................................374 Grants Fund ..........................................................................................................376 Budget Summary - CDBG, HOME Program, Central Garage, Worker’s Comp, and Staywell Health Care Funds ........................................................377 Revenue Summary - Tourism, CDBG, HOME Program, Central Garage, Worker’s Comp, & Staywell Health Care Funds, and Sales Tax Funds........379 Combined Summary - All Funds Budget Summary ...................................................................................................383 Summary of Sources and Uses by Fund and Fund Type .......................................384 Estimated Revenues ..............................................................................................388 Appropriations .......................................................................................................398 Appropriations Allocated by Expenditure Type ....................................................406 Summary of Operating Transfers/Designations of Fund Balance .........................407 Debt Service ..........................................................................................................408 Capital Budget .......................................................................................................416 Authorized Positions .............................................................................................426 AppendixDemographic Statistics ..........................................................................................435 Financial Statistics .................................................................................................436 Acronyms ..............................................................................................................438 Glossary of Budget and Finance Terms.................................................................441 (Operating departments are shown in bold letters)
to Independence’s Budget Document Guide
Organization of the Budget Document
The budget document is intended as a tool for residents, elected officials, and City staff. The document contains narratives, graphics, and financial data at summary and detailed levels. It represents the culmination of the process of projecting available resources for the upcoming fiscal year and represents the financial plan as to how those resources will be spent. It is intended that this document is both understandable to the average reader and useful as a working document for managing the City's finances.
The document is divided into six main sections . . . . . . the Budget Message, the General Fund operations, the Utility Funds operations, the operations of Other Funds,
A Combined Summary of all funds, and an Appendix
The budget begins with the City Manager's Budget Message. The message provides an overview of the budget document and provides a narrative discussion of other related issues.
The General Fund section represents financial, operating, and employee staffing data for the General Fund. Departmental schedules include: an organization chart, departmental budget summary, and detail appropriation data for each organizational budget level within each department.
The Utility Funds section represents financial, operating, and employee staffing data for the City’s three Utility Funds: Power and Light, Sanitary Sewer, and Water Funds. Departmental schedules include: an organization chart, departmental budget summary, graphical and chart historical data, and detail appropriation data for each organizational budget level within each department.
The Other Funds section represents financial, operating, and employee staffing data for the remaining funds of the City for which an operating budget is prepared. These funds are as follows: Tourism, Community Development Block Grant Act, HOME Program, Street Improvements Sales Tax, Parks and Recreation Sales Tax, Storm Water Improvements Sales
Guide to Independence’s Budget Document
Tax, Police Public Safety Sales Tax, Fire Public Safety Sales Tax, Grants Fund, Central Garage, Staywell Health Care Funds, and Worker’s Compensation Fund. Departmental schedules include: an organization chart, departmental budget summary, graphical and chart historical data, and detail appropriation data for each organizational budget level within each department.
The Combined Summary section represents consolidated financial, operating, debt service, and employee staffing data across all fund and department lines. While this section provides a City wide perspective of the budget document, spending decisions are made at the individual fund level.
The Appendix section contains the following: budget calendar, demographic statistics, financial statistics, list of acronyms, and glossary of budget and finance terms.
Structure of the City's Finances
Funds
The City has thirty separate groups of accounts called funds. Each fund is separately accounted for with its own set of self-balancing accounts. Sixteen of these funds have formal budgets which are included in this budget document. Of the remaining fourteen funds, six are capital project funds and are part of the Capital Budget. The other eight funds are special purpose funds that do not require the use of formal budgets.
The sixteen Operating Budget funds are broken down into four fund classifications. The classifications are listed below along with the individual funds within that category and a description of the purpose for each fund:
General Fund – Represents the primary operating fund for general governmental services. It provides most traditional tax supported municipal services such as police and fire protection.
Special Revenue Funds – Special revenue sources that are restricted in their use. These are listed below:
Tourism Fund - Accounts for the proceeds of the transient guest tax.
Community Development Block Grant Fund – Accounts for the federally funded Community Development Block Grant Act program.
Home Program Fund - Accounts for the Federally Funded Home Program.
Guide to Independence’s Budget Document
Street Improvements Sales Tax Fund - Accounts for the revenues received on the Capital Improvement Sales Tax approved by voters in August, 1998 for street improvement purposes. The tax was renewed in August, 2002 and again in August, 2007.
Parks Improvements Sales Tax Fund - Accounts for the revenues received from the Parks Improvement Sales Tax approved by voters in August, 1998 for parks and recreation improvement purposes and was renewed in August, 2002 and August, 2010. The tax will remain in effect until repealed.
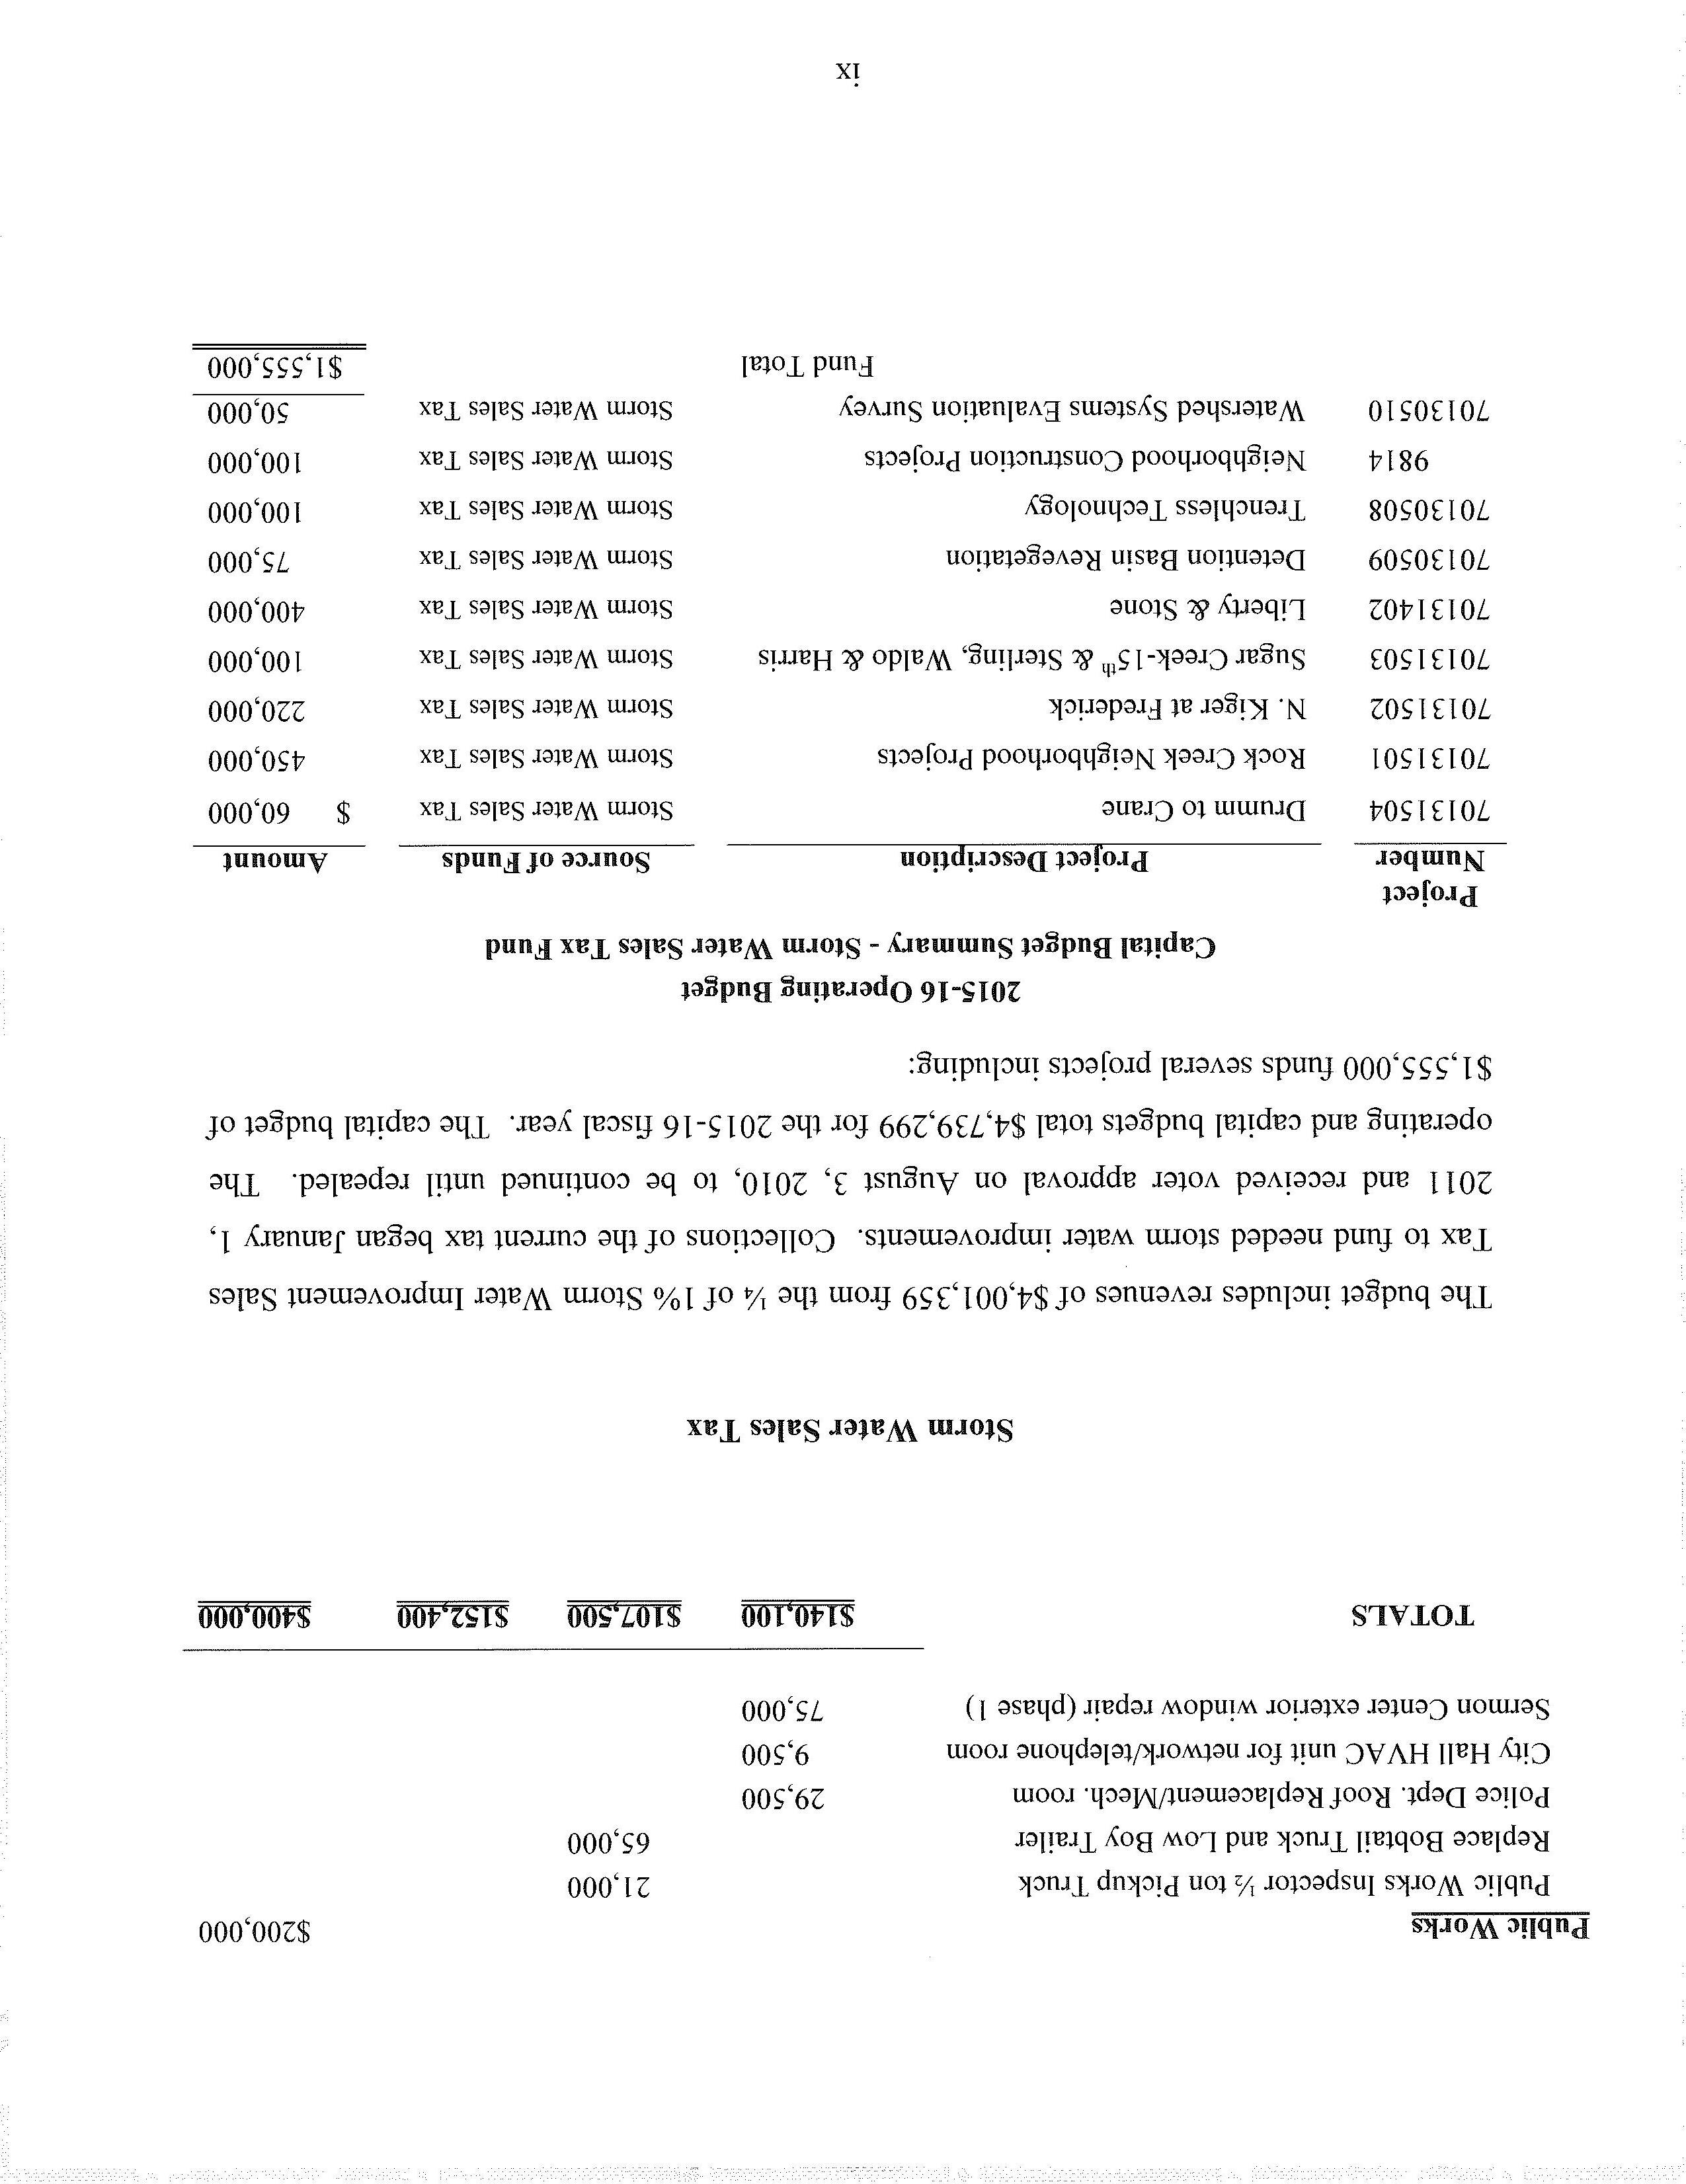
Storm Water Improvements Sales Tax Fund - Accounts for the revenues received from the Storm Water Improvement Sales Tax approved by voters in August, 2000 for storm water improvement purposes. The tax was renewed in August, 2010 and will remain in effect until repealed.
Police Public Safety Sales Tax Fund - Accounts for the revenues received from the Police Public Safety Sales Tax approved by voters in August, 2004 for Police department purposes.
Fire Public Safety Sales Tax Fund - Accounts for the revenues received from the Fire Public Safety Sales Tax approved by voters in August, 2004 for Fire department purposes.
Grants Fund - Accounts for revenues received from Federal and State Grant Funds
Enterprise Funds - Government operations that are accounted for in a manner similar to private sector operations.
Power and Light Fund - Accounts for Power and Light Utility operations.
Sanitary Sewer Fund - Accounts for Sanitary Sewer Utility operations.
Water Fund - Accounts for Water Utility operations.
Internal Service Funds - Funds used to account for the furnishing of goods or services by one department or fund within the City to other City departments and funds.
Central Garage - Accounts for the costs of maintaining a portion of the City's fleet.
Staywell Health Care Fund - Accounts for activities related to the City's self-insured health care plan.
Worker’s Compensation Fund – Accounts for the activities related to the City’s self-funded worker’s compensation plan.
Funds
Departments
The City has eighteen operating departments that are responsible for all operations of the City. The budget establishes appropriations for each department to support their operations for the ensuing fiscal year. Each department can potentially be funded out of any one or more of the different fund categories listed earlier.
City Council
City Clerk
City Manager
Tourism
Technology Services
Municipal Court
Law
Finance
Human Resources
Community Development
Police
Fire
Health
Public Works
Water
Water Pollution Control
Parks and Recreation
Power and Light
Non-Departmental
In addition to the operating departments, the City also has a non-departmental and debt service category that are accounted for in a manner similar to operating departments. The items included in these two categories are not specifically assignable to any particular department.
Guide to Independence’s Budget Document
General EnterpriseSpecial GrantsInternal Fund Funds Revenue Fund Fund Service Fund
Funds
Departments
Cost Centers
Cost Centers -
Most departments are broken down into multiple cost centers based on the types of services or groups of services provided. These cost centers form the foundation of the organizational structure of the city. As noted earlier, departments can be funded from multiple funds however at the cost center level, all of the activities within a given cost center must be funded from the same fund.
Funds
Departments
Cost Centers
Object of Expenditures
Object of Expenditures -
Departmental appropriations within a given cost center are broken down into various object of expenditure accounts based on the type of goods or services to which an expenditure relates. Object of expenditure accounts represent such items as salaries, benefits, contractual services, office supplies, etc. Object of expenditure accounts are further grouped into five major class categories: Personal Services, Other Services, Supplies, Capital Outlay, and Debt Service/Other.
Organizational Structure Recap
At the very lowest level, expenditures are recorded at the object of expenditure level within a cost center. The cost center represents the lowest level organizational unit of the city and generally represents a group of common services within a department. The funding for any one cost center is uniquely funded from a single fund. Multiple cost centers make up a Department. Finally, at the very highest level of the financial structure are funds which represent a unique and distinct group of funding sources, many of which are legally restricted for use in a limited manner. Departments can include funding from different funds; however, cost centers within a department must be funded from a specific fund.
Guide to Independence’s Budget Document


The City of Independence Vision Statement
The pride we feel as a community will make Independence a centerpiece for the metropolitan area.
The City of Independence will be a community that provides an exceptional quality of life for residents through a healthy economy that provides jobs and livelihoods for citizens; with well planned, safe and secure neighborhoods; and through excellence in the delivery of public services.
The City of Independence will be a community that takes pride in its history, by maintaining its unique heritage for future residents and for visitors from throughout the world.
The City of Independence will meet the needs of its citizens through fostering citizen participation and involvement in local government; through the establishment of clear policy guidelines; and through a responsive, well-trained, professional City staff.
(reaffirmed by Resolution number 5213 – September 19, 2005)
1
The City of Independence Strategic Goals
Consistent with the Vision Statement, the City Council hereby establishes the following four (4) strategic goals:
1. To cultivate and preserve attractive and desirable neighborhoods by encouraging well-maintained property and architecturally-diverse housing, conducting strategic needs assessments, identifying and allocating prioritized resources, and providing focused services to meet identified needs.
2. To increase operational efficiencies and enhance citizen engagement through implementation and use of advanced technologies.
3. To meet existing and emerging health, safety and welfare needs of residents and businesses by evaluating existing standards and procedures and effectively administering property maintenance compliance, infrastructure construction and repairs, historic preservation and public safety services.
4. To promote a strong local economy with an expanding employment and tax base through focused strategies to redevelop existing business districts, aid in the establishment of new businesses, provide exceptional customer service and aggressively pursue economic development and redevelopment opportunities.
(approved by Resolution number 5879 –January 6, 2014)
2
Financial Policies
A. Fund Balance
1.Fund Balance Target - The City shall maintain an Undesignated Fund Balance level in the General Fund equal to 5% of annual revenues. The purpose for maintaining this reserve fund will be for meeting emergencies arising from: (1) the loss or substantial reduction in actual revenue collections over anticipated amounts;
2)unexpected expenditures due to natural disasters or casualty losses; 3) nonbudgeted expenditures for the satisfaction of court judgments and litigation costs; and, 4) conditions that threaten the loss of life, health or property within the community.
2.Recovery Plan when Fund Balance is below Target - Whenever the General Fund Undesignated Fund Balance account balance falls below the target level of 5% then the City will strive to restore the Undesignated Fund Balance through revenue allocations or expenditure reductions back to the target level over a five (5) year period.
3.Utilization of Funds that Exceed the Fund Balance Target - Any amounts in the General Fund Undesignated Fund Balance account that exceed the target amount may be utilized in the following year's operating budget with the same restrictions identified below for one-time revenues.
B. Revenues
1.Use of One-Time Revenues - One time revenues will be used only for one-time expenditures. The City will avoid using temporary revenues to fund on-going programs and activities.
2.Grant Acceptance and Cost Recovery Analysis - The City shall actively pursue federal, state and other grant opportunities when deemed appropriate. Before accepting any grant the City shall thoroughly consider all implications related to costs associated with complying with the terms of the grant agreement and the ongoing obligations that will be required in connection with the acceptance of the grant. Programs financed with grant monies will be budgeted in separately, and the service program will be adjusted to reflect the level of available funding. In the event of reduced grant funding, City resources may be substituted only after all program priorities and alternatives are considered during the budget process.
3.Revenues Diversification - The City will strive to develop and maintain a diversified and reliable revenue stream so as to avoid becoming overly dependent upon any single source of revenue. Efforts will be directed to optimize existing revenue sources while periodically reviewing potential new revenue sources.
City of Independence, Missouri 2015-16
Operating Budget
3
Financial Policies
4.Estimation of Annual Budgeted Revenues - The Finance Department will provide an annual estimate of anticipated revenues using an objective and analytical process. When faced with assumption uncertainties, conservative projections will be utilized.
5.Support Services provided to Funds - The City shall set user fees for each fund at a rate that fully covers direct and indirect costs of providing support services to other funds.
6.Fees and Charges for Services - Fees and charges shall be periodically evaluated and, if necessary, adjusted annually to assure that they cover all direct and indirect costs, unless it is determined full cost recovery would not be in the best interest of the public.
7.Investment of City Funds - Cash and investment programs will be maintained in accordance with State Statutes and the City Charter and will ensure proper controls and safeguards are maintained. City funds will be managed in a prudent and diligent manner with an emphasis on safety of principal, liquidity, and financial return on principal, in that order.
8.Restricted Revenues - Revenues will not be dedicated for specific purposes, unless required by law, generally accepted accounting practices (GAAP), or authorized by the Council. All non-restricted revenues will be deposited in the General Fund and appropriated by the budget process. This will preserve the ability of the City Council to determine the best use of available revenues to meet changing service requirements.
C. Expenditures
1.Employee Staffing Levels - The addition of new positions will only be requested after service needs have been thoroughly examined and it is substantiated that the additional staffing will result in increased revenue, enhanced operating efficiencies, or the achievement of specific objectives approved by the Council. To the extent feasible, personnel cost reductions will be achieved through attrition and reassignment.
2.Service Delivery Analysis - The City will seek to optimize the efficiency and effectiveness of its services to reduce costs and improve service quality. Alternative means of service delivery will be evaluated to ensure that quality services are provided to our residents at the most competitive and economical cost. Department directors, in cooperation with the City Manager's office, will identify all activities that could be provided by another source and review options/alternatives to current service delivery methods. The review of service delivery alternatives and the need for the service will be performed annually or on an "opportunity" basis.
City of Independence,
Missouri 2015-16 Operating Budget
4
Financial Policies
3.Capital Outlay (vehicles, equipment, building repairs) for Operations - The City will budget for capital items through the process used to prepare the annual operating budget.
a.The City will prepare and update annually a long-range capital plan for operating capital outlay.
b.The City will strive to fund capital outlay expenditures at a level to maximize service delivery and minimize maintenance costs with the objective of achieving the greatest useful life of the asset.
c.When planning for capital outlay expenditures of any type, each department director must estimate the impact on the City’s operating budget.
D. Other Financing Sources and Uses
1.Lease Purchase Financing - The City will lease purchase high-cost items of equipment only if necessary due to lack of alternative funding options, or if lease rates are less than the rate attained from investment return. In no case shall the City lease purchase equipment items whose useful life is not greater than term of the lease.
City of Independence, Missouri 2015-16 Operating Budget
5
Budget Procedures and Policies
Budget Preparation/Control -
The fiscal year of the City shall start on July 1 and end on June 30.
Formal annual operating budgets are used as a control device for the General, Tourism, Community Development, HOME Program, Street Improvements Sales Tax, Park Improvements Sales Tax, Storm Water Improvements Sales Tax, Power and Light, Sanitary Sewer, Water, Stay Well Health Care and Central Garage Funds. Expenditures may not exceed appropriations for any department within each applicable fund. Unexpended operating budget appropriations lapse at year end.
Annual operating budgets are not prepared for Capital Project Funds although budgets are prepared on a life to date project basis.
City Charter, Section 8.2 Budget: Preparation and submission. At least forty-five (45) days before the beginning of the fiscal year, the City Manager shall prepare and submit to the Council a proposed budget for the next fiscal year, which shall contain detailed estimates of anticipated revenues including any resources available from the current fiscal year, and proposed expenditures for the year, and an explanatory message. The budget shall include the general fund and at least all other regular operating funds which are deemed to require formal annual budgeting, and shall be in such form as the City Manager deems desirable or as the Council may require. The total of the proposed expenditures from any fund shall not exceed the total of the anticipated resources thereof. The budget and budget message shall be public records in the office of the City Clerk, and shall be open to public inspection. Copies of the budget; and budget message shall be made for distribution to persons on request.
Prior to June 27, the Council shall adopt the budget. If the Council fails to adopt the budget on or before that date, the budget, as submitted or amended, shall go into effect.
City Charter, Section 8.3 Comparison of anticipation revenues and proposed expenditures with prior years.
(1) In parallel columns opposite the several items of anticipated revenues in the budget, there shall be placed the amount of revenue during the last preceding fiscal year, and the amount of revenue up to the time of preparing the budget plus anticipated revenue for the remainder of the current fiscal year estimated as accurately as may be.
(2) In parallel columns opposite the several items of proposed expenditures in the budget, there shall be placed the amount of each such item actually expended during the last preceding fiscal year, and the amount of each such item actually expended up to the time of preparing the budget plus the expenditures for the remainder of the current fiscal year estimated as accurately as may be.
City of Independence, Missouri 2015-16
Operating Budget
6
Budget Procedures and Policies
City Charter, Section 8.4 Budget: Public hearing. The Council shall hold a public hearing on the proposed budget at least one (1) week after a notice of the time of the hearing has been published in a newspaper of general circulation within the City; and any interested person shall have an opportunity to be heard. The Council may continue the hearing at later meetings without further notice.
City Charter, Section 8.5 Budget: Amendment, adoption, appropriations. The Council may insert, strike out, increase, or decrease items in the budget, and otherwise amend it, but may not increase any estimate of anticipated revenues therein unless the City Manager certifies that, in the City Manager's judgment, the amount estimated will be revenue of the fiscal year. The Council, not later than the twenty-seventh (27th) day of the last month of the fiscal year, shall adopt the budget and make the appropriations for the next fiscal year. If the Council fails to adopt the budget and make the appropriations on or before that day, the budget as submitted or as amended, shall go into effect and be deemed to have been finally adopted by the Council; and the proposed expenditures therein shall become the appropriations for the next fiscal year. The appropriations, when made by the Council by a general appropriation ordinance separate from the budget document, need not be in as great detail as the proposed expenditures in the budget. Appropriations from a fund shall never exceed the anticipated resources thereof in the budget as adopted.
City Charter, Section 8.6 Budget: Transfer of appropriation balances, amendment. After the appropriations are made, and except as the Council by ordinance may provide otherwise, the City Manager may transfer unencumbered appropriation balances or parts thereof from any item of appropriation within a department, office, or agency to any other items of appropriation, including new items within the same department, office, or agency; and upon recommendation by the City Manager, the Council may transfer unencumbered appropriation balances or parts thereof from any item of appropriation , including an item for contingencies, in a fund to any other item of appropriation, including new items, in the fund.
Upon recommendation by the City Manager, the Council by ordinance may also amend the budget as adopted by changing the estimates of anticipated revenues or proposed expenditures of a fund and otherwise; and may increase or decrease the total appropriations from a fund when a change in revenues or conditions justify such action; but total appropriations from any fund shall never exceed the anticipated revenues thereof in the budget as adopted or as amended, as the case may be. The Council shall not increase any estimate of anticipated revenues in the budget unless the City Manager certifies that, in the City Manager's judgment, the amount estimated will be revenue of the fiscal year.
City of Independence,
2015-1
Missouri
6 Operating Budget
7
Budget Procedures and Policies
Budget PoliciesFund Types
Governmental Funds - are those through which most governmental functions of the City are financed. The acquisition, use and balances of the City's expendable financial resources and the related liabilities (other than those in proprietary funds) are accounted for through governmental funds. The measurement focus is upon determination of changes in financial position. The following are the City's governmental fund types for which annual operating budgets are prepared:
The General Fund is the principal operating fund of the City and accounts for all financial transactions not accounted for in other funds. The general operating expenditures, fixed charges, and capital improvement costs that are not paid through other funds are financed through revenues received by the General Fund.
Special Revenue Funds (Tourism, Community Development, HOME Program, Street Improvements Sales Tax, Park Improvements Sales Tax, Storm Water Improvements Sales Tax) are used to account for revenues derived from specific taxes, governmental grants or other revenue sources which are designated to finance particular functions or activities of the City.
Proprietary Funds - are used to account for the City's on-going organizations and activities which are similar to those often found in the private sector. The measurement focus is upon determination of net income. The following are the City's proprietary fund types:
Enterprise Funds (Power and Light, Sanitary Sewer, Water) are used to account for operations that are financed and operated in a manner similar to private business enterprises where the intent of the governing body is that the costs (expenses, including depreciation) of providing goods or services to the general public on a continuing basis be financed or recovered primarily through user charges or where the periodic determination of net income or loss is deemed appropriate.
Internal Service Funds (Central Garage/Staywell Health Care Fund) are used to account for the financing of goods or services provided by one department or agency to other departments or agencies of the City on a cost-reimbursement basis.
Basis of Accounting/Measurement Focus for Budgets
Basis of accounting refers to when revenues and expenditures or expenses are recognized in the accounts and recorded in the financial statements. Basis of accounting relates to the timing of the measurements made, regardless of the measurement focus applied. Measurement focus determines what actually is being recorded, not when. The measurement focus for governmental funds is based upon expenditures - decreases in net financial resources. The measurement focus
City of Independence,
2015-1
Missouri
6 Operating Budget
8
Budget Procedures and Policies
for proprietary funds is based upon expenses - decreases in net total assets. The principal difference between expenditures and expenses is that with expenditures, the primary concern is the flow of resources, however with expenses; the primary concern is the substance of transactions and events which may not specifically relate to the actual flow of resources.
As already indicated, the basis of accounting relates to when transactions are recorded, not what is actually being recorded. The three different types of accounting basis are 1) Cash, 2) Modified Accrual, and 3) Accrual. The latter two are recognized as Generally Accepted Accounting Principles (GAAP); the Cash basis is not.
The modified accrual basis of accounting is utilized by all governmental fund types and expendable trust funds. Under the modified accrual basis of accounting, revenues are recorded as collected unless susceptible to accrual, i.e., amounts measurable and available to finance the City's operations or of a material amount and not received at the normal time of receipt. Available means collectible within the current period or soon enough thereafter to be used to pay liabilities of the current period. Significant revenues which are considered susceptible to accrual include real estate taxes, sales taxes, utility franchise taxes, interest, and certain State and Federal grants and entitlements. Expenditures, other than interest on long-term debt, are recorded when the liability is incurred.
In applying the susceptible to accrual concept to intergovernmental revenues (i.e. grants), the legal and contractual requirements of the individual program is used as guidance. There are, however, essentially two types of these revenues. In one, monies must be expended on the specific purpose or project before any amounts will be paid to the City; therefore, revenues are recognized based upon the expenditures recorded. In the other, monies are virtually unrestricted as to purposes or expenditures and nearly irrevocable, i.e., revocable only for failure to comply with prescribed compliance requirements. These resources are reflected as revenues at the time of receipt or earlier if they meet the available and measurable criteria.
Real estate taxes levied and expected to be collected within sixty days after the fiscal year-end are considered available and, therefore, are recognized as revenues.
Licenses and permits, fines and forfeitures, charges for services, and miscellaneous revenues are recorded as revenues when received in cash because they are generally not measurable until actually received.
The accrual basis of accounting is utilized by the proprietary and nonexpendable trust fund types. Under this basis of accounting, revenues are recognized when earned (including unbilled revenue) and expenses are recorded when liabilities are incurred.
Encumbrances
The City's policy is to prepare the annual operating budget on a basis which includes encumbrances as the equivalent of expenditures in order to assure effective budgetary control and accountability and to facilitate effective cash planning and control. Encumbrance
City of Independence,
2015-1
Missouri
6 Operating Budget
9
Budget Procedures and Policies
accounting is where purchase orders, contracts, and other commitments for the expenditures of funds are recorded in order to reserve that portion of the applicable appropriation.
Encumbrances outstanding at year-end represent the estimated amount of the expenditures ultimately to result if unperformed contracts in process at year-end are completed. Encumbrances outstanding at year-end are reported in the Comprehensive Annual Financial Report (CAFR) as reservations of fund balances because they do not constitute expenditures or liabilities. Outstanding encumbrances at year-end are re-appropriated in the following fiscal year in order to provide authority to complete these transactions.
Difference between Budget Basis and Financial Reporting Basis
The City’s Comprehensive Annual Financial Report (CAFR) reports on the status of the City’s finances in accordance with the GAAP basis of accounting. In most cases this is also the same basis of accounting as used in preparing the budget. Exceptions to the basis of accounting used for financial reports and in preparing the budget are listed below:
Governmental Fund Types - All governmental fund types use the same basis of accounting for reporting and budgeting with the exception that the budget also recognizes encumbrance accounting. In the CAFR, the “Combined Statement of Revenues, Expenditures and Changes in Fund Balance - All Governmental Fund Types and Expendable Trust Funds” presents revenues and expenditures in accordance with the GAAP basis of accounting. The “Combined Statement of Revenues, Expenditures and Changes in Fund Balance - Budget and Actual (Budget Basis)” in the CAFR presents the same information, however it also includes the recognition of encumbrances. This later statement provides a reconciliation of the presented data to the GAAP basis statement.
Proprietary Fund Types - All proprietary fund types use the same basis of accounting for reporting and budgeting with the exception of “non-cash” expenses and disbursements that affect balance sheet accounts. “Non-cash” expenses are included in the financial reports but not in the budget. An example of this type of expense would be depreciation where an expense is recorded but a cash disbursement does not take place. Balance sheet account disbursements are items that are included in the budget as expenditures, however they do not affect the “Combined Statement of Revenues, Expenses and Changes in Retained Earnings/Fund Balances - All Proprietary Fund Types and Nonexpendable Trust Funds” (i.e. the operating statement) in the CAFR. An example of these types of items would be inventory purchases, debt principal payments, and capitalized labor and material costs.
City of Independence,
Missouri 2015-16 Operating Budget
10
Budget Calendar for 2015-16 Operating Budget
Budget Orientation meetings – individual meetings with each
Wed. January 7Department
Departments begin entering budget text data
Department complete cost allocation forms
Departments begin reviewing Position Management Projections
Central Garage to complete 2015-16 budget projections.
Departments begin entering budget financial data
Departments complete reviewing Position Management Projections
All Budget forms (including Departmental Summary, Detail
Fri. January 16
Wed. January 7
Fri. January 9
Wed. January 28
Fri. January 30
Fri. January 30
Fri. February 6
Tues. February 17 Budget Sheets and Detail Program Sheets) due to Budget Office for review
All completed budget forms due to the Budget Office
Wed. February 25 for final review. The reviewed Department Requested budgets that are complete will be forwarded to the City Manager
Updated 2015-16 Revenue Estimates sent to the City
Fri. February 27 Manager by Finance
Estimated Fund Balance Summary based on
Fri. February 27 Department’s requested budgets due to the City Manager from the Budget Office
City Manager Budget reviews with departments
Updated 2015-16 Revenue Estimates sent to the City
Tues. March 3-
Fri March 20
Fri. March 20 Manager by Finance
City Council Review of Proposed Council Goals Allocations
Updated Revenue Manual completed by Finance for
Wed. April 15
Mon. May 4 distribution to the City Council
City Manager Proposed Budget submitted to the City
Mon. May 4 Council (must be at least 45 days prior to the beginning of the new fiscal year) a
Publication of Legal Notice on Budget Hearing (must be
Fri. May 8 at least 10 days before the hearing) a
11
Public Hearing by the City Council on the Proposed
Mon. May 18 Budget a
First reading on the 2015-16 Operating Budget
Mon. June 1 Appropriation Ordinance
Council adoption of the 2015-16 Operating Budget
Mon. June 15 Appropriation Ordinance. (Must be before June 27 or the proposed budget as amended will become effective.) a
Preparation and public filing in the City Clerk’s
Wed. July 1 Office of the Adopted Budget
Receive the Certification of Assessed Valuation from
Wed. July 1 the County Clerk for setting Property Tax Levy Rates
Legal Notice on Public Hearing on the Tax Levy Rate
Fri. July 24 (Must be at least 7 days before the hearing) b
Public Hearing on the Tax Levy Rate and First Reading
Mon. August 3 on the Tax Levy Ordinance b
City Council adoption of the Tax Levy Ordinance (the
Mon. August 17 tax levy rates must be certified to Clay County by September 1, 2015 and Jackson County no later than October 1, 2015) b
GFOA budget review submittal
Footnotes-
a City Charter Requirement
b Tax Levy Requirement under the “Open Window Law”
Fri. August 21
Budget Calendar for 2015-16 Operating Budget - Page 2
12
Missouri 2015-16 Operating Budget
Equal Employment Opportunity Plan
The City of Independence shall take affirmative action to promote and ensure equal employment opportunity for all persons. Recruitment, hiring, promotions, personnel actions, benefits, training and all other terms, conditions and privileges of employment shall be conducted without regard to race, color, religion, sex, national origin, age, disability, or status as a disabled veteran, or veteran of the Vietnam Era. Department directors, supervisors, and City employees involved in the hiring and interviewing process shall base employment decisions on the principles of Equal Employment Opportunity (EEO) and with the intent to further the City’s commitment to those principles.
Directors and supervisors shall take affirmative action to ensure that minority group individuals, females, veterans of the Vietnam Era, disabled veterans, and persons with disabilities are introduced into the work force and that these employees are considered when opportunities for promotion arise.
In addition, the City shall assert leadership in the community and put forth the maximum effort to achieve non-discriminatory, equal employment opportunities throughout the political jurisdiction of the City. Affirmative action will be taken to ensure that equal employment opportunities are available on the basis of merit of the individual and consistent with the City’s goals and timetables for staffing. The City will strive for a workforce diversity in each occupation group which corresponds to the availability of minority and female persons in the appropriate recruitment areas.
Equal Employment Opportunity Goals for 2015-16
1. City Department Directors will promote and ensure equal employment opportunity for all persons without regard to race, color, sex, religion, national origin, ancestry, age, disability, or political affiliation.
2. City Department Directors assure that no discrimination will occur in recruitment, selection, training, advancement, compensation, working conditions, demotion, layoff and termination.
3. City recruitment activity will continue to utilize wide and diverse distribution sources in the metro area, including but not limited to, area colleges, community colleges, churches, Indian centers, Hispanic and black organizations, City’s website which is linked to Facebook and Twitter and area newspapers (as requested).
4. City Department Directors will strive to achieve a workforce in each occupational group which corresponds to the actual availability of qualified minorities and females in the community and surrounding area.
City
Independence,
of
13
City of Independence, Missouri 2015-16 Operating Budget
Equal Employment Opportunity Plan
5. The City’s affirmative goals shall not discriminate against any individual or group of individuals with respect to any employment opportunity for which they are qualified for on the grounds that they are not the beneficiaries of affirmative action themselves, since the City does not sanction the discriminatory treatment of any person.
Recruitment Activity
In preparation for the recruitment activity for 2016, Department Directors have been provided the staffing profile of their departments, effective July 1, 2015. All Departments have a copy of the City’s Affirmative Action Plan and Affirmative Action hiring guideline/goals.
14
EEO Calendar Year 2014 Data
The following information is reporting the City’s overall new hire activity for 2014. The report serves as positive evidence that the City is increasing the diversity of its workforce.
Total 2014 Full Time New Hires: 65
Males Race: Male Female Race: Female 42
White – 36
Black – 3
Hispanic – 2
Ameri. Indian – 0
Asian – 1
Unknown - 0
23
White – 19
Black – 0
Hispanic – 2
Ameri. Indian – 0
Asian – 1
Unknown - 1
Total 2014 Full time new hire percentage of minorities: 14%
• Black - 5%
• Hispanic - 6%
• American Indian - 0%
• Asian – 3%
• Total percentage of females: 36%
Total 2014 Part time New Hires: 1
Males Race: Male Female Race: Female 0 White – 0
1
White – 1
Black – 0 Hispanic – 0
Ameri. Indian – 0
Asian - 0
Total percentage of females: 100%
Total Workforce data for Calendar Year 2014:
• 1,112 FT/PT employees
• Black – 2%
• Hispanic – 2%
• American Indian – 1%
• Asian – 1%
• Unknown -2%
Black – 0
Hispanic – 0
Ameri. Indian – 0
Asian - 0
15
2015-16 Operating Budget General Fund
Source of Budget Dollars
Allocation of Budget Dollars
Taxes 48% Grants & Shared Rev. 7% Pymts. In Lieu of Taxes 25% Licenses & Permits 4% Other Revenue 16%
Police 37% Parks & Recreation 2% Health 4% Public Works 8% Fire 23% NonDept./Capital/ Debt 12% Community Dev. 4% Other Depts. 10%
16
City of Independence, Missouri
2015-16 Operating Budget
Budget Summary - General Fund
For the Fiscal Years 2013-14, 2014-15 and 2015-16
Source of Budget Dollars
Use of Budget Dollars
2015-16 Increase 2014-15 % City Council % (Decrease) 2013-14 Original of Adopted of Over Last % Description Actual Budget Total Budget Total Year Change 600,662 $ 3,326,172 $ 2,856,584 $ (469,588) $
Transfers from Other Funds - $ - $ Other Fund Balance 85,443 - -Components Estimated RevenuesTaxes 34,855,329 $ 36,004,609 $ 47.7% 36,455,905 $ 47.8% 451,296 $ 1.3% Payments in Lieu of Taxes 18,144,063 18,927,939 25.1% 18,868,596 24.7% (59,343) -0.3% Licenses & Permits 3,273,979 3,284,687 4.3% 3,403,687 4.5% 119,000 3.6% State & County Shared Rev. 5,157,129 5,179,046 6.9% 5,275,139 6.9% 96,093 1.9% Charges for Current Services 1,940,920 1,861,663 2.5% 2,020,770 2.6% 159,107 8.5% Fines and Forfeitures 4,790,383 4,860,377 6.4% 4,921,960 6.5% 61,583 1.3% Interfund Charges 3,987,029 4,616,045 6.1% 4,741,289 6.2% 125,244 2.7% Other Revenue 2,868,757 784,900 1.0% 614,900 0.8% (170,000) -21.7% Total Estimated Revenues 75,017,589 $ 75,519,266 $ 100.0% 76,302,246 $ 100.0% 782,980 $ 1.0% Capital Lease Proceeds - $ - $ - $ Total Sources 75,103,032 $ 75,519,266 $ 76,302,246 $ 782,980 $ 1.0%
Operating DepartmentsCity Council 443,252 $ 441,183 $ 0.6% 453,821 $ 0.6% 12,638 $ 2.9% City Clerk 416,859 404,718 0.5% 366,691 0.5% (38,027) -9.4% City Manager 862,627 934,131 1.2% 984,378 1.3% 50,247 5.4% Nat'l Frontier Trails Museum 312,593 260,907 0.3% - 0.0% (260,907) -100.0% Technology Services 1,627,925 1,828,880 2.4% 1,867,106 2.5% 38,226 2.1% Municipal Court 793,317 849,872 1.1% 836,066 1.1% (13,806) -1.6% Law 677,186 687,741 0.9% 741,884 1.0% 54,143 7.9% Finance 2,026,664 1,966,982 2.6% 1,968,698 2.6% 1,716 0.1% Human Resources 429,740 454,287 0.6% 459,444 0.6% 5,157 1.1% Community Development 3,086,604 3,155,386 4.2% 3,257,399 4.4% 102,013 3.2% Police 26,407,530 27,227,469 36.3% 27,034,885 36.2% (192,584) -0.7% Fire 16,643,899 16,966,162 22.6% 17,042,758 22.8% 76,596 0.5% Health 2,554,644 2,754,318 3.7% 2,650,711 3.5% (103,607) -3.8% Public Works 5,550,244 5,870,029 7.8% 5,812,067 7.8% (57,962) -1.0% Parks and Recreation 1,494,014 1,632,342 2.2% 1,634,988 2.2% 2,646 0.2% Non-Departmental 7,525,446 9,030,295 12.0% 8,916,027 11.9% (114,268) -1.3% City Council Strategic Goals 265,502 250,000 0.3% 250,000 0.3% - 0.0% Capital Outlay 272,979 374,848 0.5% 400,000 0.5% 25,152 6.7% Capital Leases - - 0.0% - 0.0% - 0.0% Total Operating Departments 71,391,025 $ 75,089,550 $ 100.0% 74,676,923 $ 100.0% (412,627) $ -0.5% Transfers Transfers to Other Funds 10,000 10,000 10,000Falls at Crackerneck TIF 710,679 419,716 1,545,149 1,125,433 268.1% Total Uses 72,111,704 $ 75,519,266 $ 76,232,072 $ 712,806 $ 0.9% 3,591,990 $ 3,326,172 $ 2,926,758 $ (399,414) $ -12.0% Beginning Unassigned Fund Balance Ending Undesignated Fund Balance 17
City of Independence, Missouri 2015-16 Operating Budget
Fund Balance Summary - General Fund
For the Fiscal Years Ending June 30, 2010 through June 30, 2015
Fund Balance Components
(a) based on 5% of Annual Revenues less one-time non-reoccurring items
Ten Year Fund Balance Comparison
Actual Actual Actual Actual Actual Projected Description 6/30/10 6/30/11 6/30/12 6/30/13 6/30/14 6/30/15
Nonspendable: (Prepaid) - - - - $14,141 Restricted: Protested Revenues 42,030 $ 24,351 $ 65,702 $ 5,608 $ 29,027 $ Police Forfeitures 180,545 418,205 519,215 411,753 373,872 Other 13,790 - - -Total Restricted 236,365 $ 442,556 $ 584,917 $ 417,361 $ 402,899 $ Committed: Capital Projects 111,852 $ 120,851 $ 48,581 $ 48,581 $ 46,080 $ TIF Distributions 620,198 - - -City Council Strat. Goals 207,596 243,646 281,630 218,337 265,278 Other 1,337,832 1,048,795 123,074 124,481 125,725 Total Committed 2,277,478 $ 1,413,292 $ 453,285 $ 391,399 $ 437,083 $ Assigned: Encumbrances 662,882 $ 667,065 $ 593,561 $ 464,633 $ 398,283 $ Unassigned 2,012,374 2,302,039 1,831,406 600,662 3,591,990 2,856,584 Total Fund Balance 5,189,099 $ 4,824,952 $ 3,463,169 $ 1,874,055 $ 4,844,396 $ 2,856,584 $ Fund Balance Target (a) 3,325,177 3,749,104 3,587,498 3,577,438 3,640,708 3,725,558 Actual over (under) Target (a) (1,312,803) (1,447,065) (1,756,092) (2,976,776) (48,718) (868,974)
2 3 5 6 8 9 11 2004-05 2005-06 2006-07 2007-08 2008-09 2009-10 2010-11 2011-12 2012-13 2013-14
Millions
Assigned Committed Restricted 18
Unassigned
Fund Balance Summary - General Fund
Unassigned Projected Fund Balance for 2015-16
City of Independence, Missouri 2015-16 Operating Budget
Unassigned Fund Balance at June 30, 2015 (Projected) 2,856,584 $ Transfers from Other Fund Balance Components: Proposed Operating Budget (Net Sources and Uses) 2015-16Falls at Crackerneck Creek TIF Debt RefinancingProjected Unassigned Fund Balance at June 30, 2016 2,926,758 $ Projected Unassigned Fund Balance Target (5% of Est. Revenues) 3,815,112 $ 19
City of Independence, Missouri 2015-16 Operating Budget
Revenue Summary
For the Fiscal Years 2013-14 through 2015-16
2015-16 %Chg. Acct. 2013-14 Original Current Adopted Adopted to Curr Est. No. Description Actual Budget Estimate Budget General Fund Property Taxes 2-3011 Real Estate 7,486,129 7,480,000 7,430,770 7,480,000 0.7% 2-3013 R.R. & Other Utility 39,716 36,500 39,503 36,500 -7.6% Total Property Taxes 7,525,845 7,516,500 7,470,273 7,516,500 0.6% Sales and Use Taxes 2-3041 Local Option Sales Tax 16,559,131 17,012,109 16,764,768 17,095,404 2.0% 2-3042 Cigarette Tax 477,865 475,000 455,000 475,000 4.4% 2-3044 Local Option Use Tax Total Sales and Use Taxes 17,036,996 17,487,109 17,219,768 17,570,404 2.0% Utility Franchise Fees 2-3052 Water 27,317 27,000 23,880 27,000 13.1% 2-3053 Gas 4,201,302 4,620,000 4,620,000 4,850,000 5.0% 2-3054 Telephone 4,728,602 5,050,000 4,700,000 5,050,000 7.4% 2-3055 Electricity 565,189 535,000 540,832 585,000 8.2% 2-3057 Cable Television 770,077 769,000 821,113 857,000 4.4% Total Utility Franchise Fees 10,292,487 11,001,000 10,705,825 11,369,000 6.2% Payments in Lieu of Taxes 2-3281 Power & Light In Lieu of Taxes 13,368,095 13,851,343 13,273,220 13,562,517 2.2% 2-3282 Water Service In Lieu of Taxes 2,646,902 2,807,329 2,689,832 2,947,919 9.6% 2-3283 Sanitary Sewer In Lieu of Taxes 2,129,065 2,269,267 2,310,972 2,358,160 2.0% Total Pymt. in Lieu of Taxes 18,144,063 18,927,939 18,274,024 18,868,596 3.3% Total Taxes 52,999,392 54,932,548 53,669,890 55,324,501 3.1% Business Licenses and Permits 2-3101 Occupation Licenses 1,438,655 1,487,000 1,487,000 1,518,000 2.1% 2-3102 Liquor Licenses 106,029 110,000 109,671 111,000 1.2% 2-3103 Bld. Trades Licenses and Exams 117,980 105,000 110,000 110,000 2-3104 Fin-Other License/Permits 109,157 121,000 110,183 121,000 9.8% 2-3108 Building Permits, Com.Develop. 520,471 475,000 665,048 525,000 -21.1% 2-3109 Construction Permits, Pub.Works 164,219 210,000 181,318 210,000 15.8% 2-3120 Nursing Home Permits 1,000 1,000 853 1,000 17.2% 2-3121 Day Care Permits 6,917 6,687 9,358 6,687 -28.5% 2-3122 Food Handler's Permits 100,825 98,000 93,450 98,000 4.9% 2-3123 Massage Therapist Appl 5,220 1,000 4,346 5,000 15.0% 2-3124 Other Food Permits 157,195 142,000 175,601 155,000 -11.7% 2-3125 Ambulance Permits & Licenses 55,488 37,000 39,195 45,000 14.8% 2-3126 Plan Reviews - Health Dept. 8,730 6,000 7,568 8,000 5.7% Total Bus. Lic. & Permits 2,791,887 2,799,687 2,993,591 2,913,687 -2.7% Non-Business Licenses and Permits 2-3151 Motor Vehicle Licenses 482,092 485,000 485,000 490,000 1.0% Total Licenses and Permits 3,273,979 3,284,687 3,478,591 3,403,687 -2.2% 2014-15 20
City of Independence, Missouri 2015-16 Operating Budget
Revenue Summary
For the Fiscal Years 2013-14 through 2015-16
2015-16 %Chg. Acct. 2013-14 Original Current Adopted Adopted to Curr Est. No. Description Actual Budget Estimate Budget 2014-15 GrantsFederal Government Grants 2-3219 Other 39 Total Federal Grants 39 State Government Grants 2-3241 Financial Institutions Tax 19,381 19,500 16,570 19,500 17.7% 2-3242 Gasoline Tax 2,979,706 3,100,000 3,100,000 3,150,000 1.6% 2-3243 Motor Vehicle License Fees 487,407 510,000 510,000 510,000 2-3244 Motor Vehicle Sales Tax 874,138 795,000 795,000 795,000 Total State Grants 4,360,631 4,424,500 4,421,570 4,474,500 1.2% Other Sources 2-3272 Jackson County Drug Task Force 559,459 535,774 555,494 556,867 0.2% 2-3274 Jackson County Dare Program 212,000 218,772 210,000 218,772 4.2% 2-3275 Mid Am Reg Council 25,000 24,956 25,000 0.2% 2-3279 Other Misc. Grants Total Other Sources 796,459 754,546 790,450 800,639 1.3% Total Grants 5,157,129 5,179,046 5,212,020 5,275,139 1.2% Charges for Services General Government 2-3302 Planning & Zoning Fees 19,982 10,000 14,240 15,000 5.3% 2-3303 Board Of Adjustment Fees 2,700 4,050 2,859 4,050 41.7% 2-3304 Sale Of Maps, Books, Plans 1,319 5,000 1,741 5,000 187.2% 2-3305 Sale Of Police Reports 30,846 30,000 31,130 30,000 -3.6% 2-3306 Sale Of Fire Reports 1,403 1,500 1,224 1,500 22.5% 2-3307 Computer Service Charges 300 150 -100.0% 2-3309 Transit Rider Fares 177,582 145,000 155,000 150,000 -3.2% Health 2-3311 Animal Shelter Fees 2,695 2,000 2,000 2,000 2-3312 Animal Shelter Services 16,145 15,000 12,000 15,000 25.0% 2-3313 Other Health Programs 8,005 7,200 11,111 7,900 -28.9% Public Safety 2-3316 Reimb. For Police Services 16,540 12,250 19,578 15,500 -20.8% 2-3317 School Resource Officers 452,922 477,385 447,288 477,385 6.7% 2-3318 Alarm Charges - Police 4,525 40,000 26,640 40,000 50.2% 2-3319 Alarm Charges - Fire 1,650 1,675 3,002 3,000 -0.1% Recreation 2-3322 Program Fees 29,937 40,000 29,710 48,000 61.6% 2-3323 Concessions 4,103 4,000 3,559 4,000 12.4% 2-3326 Pool Fees 2-3327 Center Fees/Club Memberships 42,957 57,103 47,780 80,935 69.4% 2-3329 Facility Rentals 60,997 50,000 49,053 52,000 6.0% 21
City of Independence, Missouri 2015-16 Operating Budget
Revenue Summary
For the Fiscal Years 2013-14 through 2015-16
2015-16 %Chg. Acct. 2013-14 Original Current Adopted Adopted to Curr Est. No. Description Actual Budget Estimate Budget 2014-15 National Frontier Trails Museum 2-3331 NFTM-Admissions 45,207 46,000 39,564 -100.0% 2-3332 NFTM-Gift Shop 23,398 25,000 Cemetery 2-3341 Sale Of Cemetery Lots 1,050 3,000 7,031 3,000 -57.3% 2-3342 Sale Of Monument Bases 2,721 3,000 3,213 3,000 -6.6% 2-3343 Grave Opening Charges 34,550 40,000 50,759 40,000 -21.2% Other Charges 2-3392 Sale Of Street Signs 795 500 241 500 107.5% 2-3393 Special Assessments 188,054 175,000 206,053 180,000 -12.6% 2-3396 Sale Of Recycled Material 7,609 14,000 16,405 15,000 -8.6% 2-3397 Solid Waste Disp Fees 67,995 78,000 35,136 78,000 122.0% 2-3398 Miscellaneous Charges 694,933 750,000 751,151 750,000 -0.2% Total Charges for Services 1,940,920 2,036,663 1,967,618 2,020,770 2.7% Fines and Court Costs 2-3401 Fines & Forfeitures 4,220,172 4,307,430 4,307,430 4,307,430 2-3402 Court Costs 438,014 403,079 403,079 403,079 2-3403 Police Training 59,274 61,583 61,583 61,583 2-3404 Domestic Violence 59,273 61,583 75,847 123,166 62.4% 2-3405 Dwi/Drug 13,650 26,702 26,702 26,702 Total Fines & Court Costs 4,790,383 4,860,377 4,874,641 4,921,960 1.0% Interest Income 2-3411 Interest 1,181 500 856 500 -41.6% 2-3412 Special Assessments - Interest -691 400 -677 400 2-3413 Interest - Other 103,259 90,000 90,000 95,000 5.6% Total Interest Income 103,750 90,900 90,179 95,900 6.3% 2-3421 Interfund Chgs. For Supp. Serv. 3,987,029 4,616,045 4,616,045 4,741,289 2.7% Other Revenue 2-3431 Sale Of Land 1,000 1,000 2-3432 Sale Of Fixed Assets 50,570 125,000 87,595 125,000 42.7% 2-3433 Rents 189,133 181,000 194,394 181,000 -6.9% 2-3434 Damage Claims 2,204,630 2,000 8,986 2,000 -77.7% 2-3435 Contributions 10,165 10,000 12,320 10,000 -18.8% 2-3439 Cash Over/Short 123 -62 2-3440 Discounts Taken 67 42 -100.0% 2-3449 Misc. Non-Operating Revenue 310,319 200,000 298,907 200,000 -33.1% Total Other Revenue 2,765,007 519,000 602,182 519,000 -13.8% Total General Fund Revenues $75,017,589 $75,519,266 $74,511,166 $76,302,246 2.4% 22
City of Independence, Missouri
2015-16 Operating Budget
Budget Summary - General Fund
(continued on the next page)
2013-14, 2014-15
2014-15 2014-15 2013-14 Original Revised Description Actual Budget Budget 2015-16 City Council Adopted Budget General Government: City Council 443,252 $ 441,183 $ 441,183 $ 453,821 $ City Clerk 416,859 404,718 406,031 366,691 City Manager 862,627 934,131 934,131 984,378 Technology Services 1,627,925 1,828,880 1,828,880 1,867,106 Municipal Court 793,317 849,872 849,872 836,066 Total General Government 4,143,980 4,458,784 4,460,097 4,508,062 National Frontier Trails Museum 312,593 260,907 260,907Law Department 677,186 687,741 687,741 741,884 Finance Department: Administration 584,061 482,719 482,719 383,418 Accounting 932,952 951,489 951,489 1,009,723 Purchasing 276,760 291,156 291,156 289,106 Occupation Licensing 232,891 241,618 241,618 286,451 Total Finance Department 2,026,664 1,966,982 1,966,982 1,968,698 Human Resources Department 429,740 454,287 454,287 459,444 Community Development Department: Administration 264,666 403,222 403,222 366,022 Neighborhood Services 60,185 56,875 56,875 52,317 Comprehensive Planning 170,837 291,035 291,035 347,260 Current Planning 187,081 193,554 193,554 221,101 Transportation 1,763,856 1,466,935 1,466,935 1,548,735 Historic Preservation 57,291 75,342 75,342 75,356 Building Inspection 582,688 668,423 668,423 646,608 Total Community Development 3,086,604 3,155,386 3,155,386 3,257,399 Police Department: Administration 3,107,383 3,227,209 3,370,781 3,347,500 Police Operations 17,490,634 17,991,552 18,002,552 17,709,003 Police Services 5,809,513 6,008,708 6,008,677 5,978,382 Total Police Department 26,407,530 27,227,469 27,382,010 27,034,885
For the Fiscal Years
and 2015-16
23
City of Independence, Missouri
2015-16 Operating Budget
Budget Summary - General Fund For
Fiscal Years 2013-14, 2014-15 and 2015-16 2014-15 2014-15 2013-14 Original Revised Description Actual Budget Budget 2015-16 City Council Adopted Budget Fire Department: Administration 418,882 $ 636,412 $ 630,412 $ 597,236 $ Suppression 15,285,928 15,124,832 15,124,832 15,187,320 Fire Prevention 473,237 573,040 573,040 662,644 Maintenance 270,135 327,945 330,945 270,025 Training/Emer. Preparedness 195,717 303,933 306,933 325,533 Total Fire Department 16,643,899 16,966,162 16,966,162 17,042,758 Health Department: Administration 227,119 231,014 231,014 237,616 Disease Prevention & Control 1,133,867 1,129,921 1,129,920 1,206,816 Com. Disease & Immunization - 147,320 145,785 71,707 Environmental Public Health 1,193,658 1,246,063 1,247,598 1,134,572 Total Health Department 2,554,644 2,754,318 2,754,317 2,650,711 Public Works: Administration 324,132 $ 348,120 $ 348,120 $ 344,903 $ Engineering 437,444 463,836 453,836 391,321 Administrative Support 297,629 258,802 258,802 284,421 Property Management 679,633 668,825 689,295 728,952 Street Maintenance 3,811,406 4,130,446 4,119,976 4,062,470 Total Public Works 5,550,244 5,870,029 5,870,029 5,812,067 Parks and Recreation: Administration 262,360 $ 249,584 $ 249,584 $ 269,540 $ Park Maintenance 660,708 701,276 707,376 718,555 Recreation 370,039 504,260 529,260 515,287 Cemetery Maintenance 200,907 177,222 177,222 131,606 Total Parks and Recreation 1,494,014 1,632,342 1,663,442 1,634,988 Non-Departmental 7,525,445 9,030,295 9,211,524 8,916,027 City Council Strategic Goals 265,503 250,000 413,494 250,000 Capital Outlay - Operating 272,979 374,848 374,848 400,000 Capital Leases Total General Fund 71,391,025 $ 75,089,550 $ 75,621,226 $ 74,676,923 $ 24
the
City of Independence, Missouri 2015-16 Operating Budget
Appropriations by Type Summary - General Fund
For the Fiscal Years 2013-14, 2014-15 and 2015-16
2013-14 2014-15 2015-16 Actual Budget Budget Personal Services: Full Time Salaries 37,054,238 $ 37,508,400 $ 37,984,082 $ Part Time Salaries 578,234 483,076 437,709 Overtime 1,859,979 1,257,795 1,282,126 Allowances 347,618 347,334 362,429 Benefits: FICA 2,910,879 3,014,616 3,049,660 LAGERS 5,057,422 5,445,716 5,900,196 Health Insurance 6,834,450 8,009,457 6,654,268 Dental Insurance 331,120 377,773 362,707 Life Insurance 84,121 69,182 70,029 Deferred Compensation 12,226 12,228 12,265 Long Term Disability 35,522 34,408 34,848 Retiree Health Insurance 3,992,380 4,631,905 3,905,139 Total Benefits 19,258,120 $ 21,595,285 $ 19,989,112 $ Other Personal Services 295,667 1,213,315 1,052,337 Total Personal Services 59,393,857 $ 62,405,205 $ 61,107,795 $ Other Services 8,955,688 9,035,636 9,596,382 Supplies 2,046,496 2,120,213 2,236,760 Capital Outlay - Operating Budget 617,360 857,616 881,833 City Council Strategic Goals 265,501 250,000 250,000 Other 112,123 420,880 604,153 Total Expenditures 71,391,025 $ 75,089,550 $ 74,676,923 $
25
City of Independence, Missouri 2015-16 Operating Budget
Appropriations by Type - General Fund
Capital Personal Other Outlay & Description Services Services Supplies Other Total Allocation by Amount City Council 419,799 $ 29,252 $ 4,770 $ 453,821 $ City Clerk 318,199 30,125 18,367 366,691 City Manager 952,768 28,150 3,460 984,378 Technology Services 1,642,337 196,940 16,810 11,019 1,867,106 Municipal Court 795,889 32,155 8,022 836,066 Law 618,084 98,500 25,300 741,884 Finance 1,747,808 203,713 17,177 1,968,698 Human Resources 440,705 13,046 5,693 459,444 Community Development 1,490,288 1,751,309 15,802 3,257,399 Police 24,944,270 1,269,986 808,129 12,500 27,034,885 Fire 16,007,834 699,689 299,906 35,329 17,042,758 Health 1,920,889 671,856 57,966 2,650,711 Public Works 3,087,009 1,430,715 828,807 465,536 5,812,067 Parks and Recreation 1,285,799 222,306 123,086 3,797 1,634,988 Non-Departmental 5,436,117 2,918,640 3,465 557,805 8,916,027 City Council Strategic Goals 250,000 250,000 Capital Outlay 400,000 400,000 General Fund Total 61,107,795 $ 9,846,382 $ 2,236,760 $ 1,485,986 $ 74,676,923 $ Allocation by Percentage City Council 92.50% 6.45% 1.05% 0.00% 100.00% City Clerk 86.78% 8.22% 5.01% 0.00% 100.00% City Manager 96.79% 2.86% 0.35% 0.00% 100.00% Technology Services 87.96% 10.55% 0.90% 0.59% 100.00% Municipal Court 95.19% 3.85% 0.96% 0.00% 100.00% Law 83.31% 13.28% 3.41% 0.00% 100.00% Finance 88.78% 10.35% 0.87% 0.00% 100.00% Human Resources 95.92% 2.84% 1.24% 0.00% 100.00% Community Development 45.75% 53.76% 0.49% 0.00% 100.00% Police 92.27% 4.70% 2.99% 0.05% 100.00% Fire 93.93% 4.11% 1.76% 0.21% 100.00% Health 72.47% 25.35% 2.19% 0.00% 100.00% Public Works 53.11% 24.62% 14.26% 8.01% 100.00% Parks and Recreation 78.64% 13.60% 7.53% 0.23% 100.00% Non-Departmental 60.97% 32.73% 0.04% 6.26% 100.00% City Council Strategic Goals 0.00% 100.00% 0.00% 0.00% 100.00% Capital Outlay 0.00% 0.00% 0.00% 100.00% 100.00% General Fund Total 81.82% 13.19% 3.00% 1.99% 100.00% 26
City of Independence, Missouri
2015-16 Operating Budget
Summary of Operating/Other Transfers and Designations of Fund Balance - General Fund
For the Fiscal Years 2014-15 and 2015-16
Description Amount 2014-15 Operating Transfers InFrom Other Funds - $ Total Operating Transfers In - $ Operating Transfers OutTo Falls at Crackerneck Creek TIF (419,716) $ To Amortize the Storm Water Fund accumulated deficit (10,000) Total Operating Transfers Out (429,716) $ Net Transfers (429,716) $ 2015-1 Operating Transfers InFrom Other Funds - $ Total Operating Transfers In - $ Operating Transfers OutTo Falls at Crackerneck Creek TIF (1,545,149) $ To Amortize the Storm Water Fund accumulated deficit (10,000) Total Operating Transfers Out (1,555,149) $ Net Transfers (1,555,149) $ 27
City of Independence, Missouri
2015-16 Operating Budget
Authorized Positions Summary - General Fund
Note 1: The above totals are based on full time equivalent positions
Note 2: Changes by department and position between fiscal years 2014-15 and 2015-16 are shown on the following page(s).
For the Fiscal Years 2009-10 through 2015-16 Budget Description 2009-10 2010-11 2011-12 2012-13 2013-14 2014-15 2015-16 City Council 10.00 10.00 10.00 10.00 10.00 10.00 10.00 City Clerk 6.00 6.00 6.00 6.00 7.00 7.00 7.00 City Manager 9.50 9.50 7.00 7.00 7.00 7.00 7.00 National Frontier Trails Museum 6.00 6.00 5.75 5.75 5.75 5.00Technology Services 21.00 21.00 22.00 22.00 22.00 23.00 24.00 Municipal Court 14.00 14.00 14.00 14.67 14.65 14.65 14.65 Law 6.50 6.00 6.25 6.25 6.25 6.23 6.23 Finance 24.15 24.15 22.65 22.65 22.65 22.15 22.15 Human Resources 7.50 6.50 6.50 6.44 7.44 6.75 6.75 Community Development 27.55 27.05 27.30 27.30 27.30 28.68 28.68 Police 290.40 292.90 288.65 289.91 291.91 296.91 296.91 Fire 173.25 173.25 173.25 173.25 169.25 169.75 173.75 Health 35.25 36.00 35.16 40.20 29.33 28.56 28.56 Public Works 82.00 83.00 79.90 79.90 80.27 80.27 80.27 Water Pollution Control 5.00 5.00 - - - -Parks and Recreation 33.46 31.71 28.71 29.15 27.85 27.10 27.10 General Fund Total - Authorized 751.56 752.06 733.12 740.47 728.65 733.05 733.05 Less: Positions not Funded (18.05) (40.55) (60.05) (79.27) (73.77) (70.27) (69.77) General Fund Total - Funded 733.51 711.51 673.07 661.20 654.88 662.78 663.28
28
City of Independence, Missouri
2015-16 Operating Budget
Authorized Position Changes - General Fund
For the Fiscal Years 2014-15 and 2015-16
Total Change Change Changes During for for Fund/ Department/Function/Position Title 2014-15 2015-16 2015-16 Comments General Fund City Manager Public Management Intern II (1.00) (1.00) Community Liaison Specialist 1.00 1.00 Department Total - -National Frontiers Trails Museum Museum Administrator Curator (1.00) (1.00) positions transferred to Tourism Museum Operations Manager (1.00) (1.00) Museum Service Assistant (2.00) (2.00) NFTM Director (1.00) (1.00) Department Total - (5.00) (5.00) Technology Services GIS Analyst 1.00 1.00 Senior Network Systems Specialist (1.00) (1.00) Network Systems Engineer 1.00 1.00 Department Total - 1.00 1.00 Law Asst City Counselor III (1.00) (1.00) Utility Counselor 1.00 1.00 Department Total - -Finance Senior Accountant (1.00) (1.00) Accounting Supervisor 1.00 1.00 Controller (1.00) (1.00) Deputy Finance Director 1.00 1.00 Department Total - -Police Chief of Police Administrative Spec II (1.00) (1.00) Police Professional Standards Asst. 1.00 1.00 Department Total - -Fire Fire Operations Firefighter 4.00 4.00 transferred from Grants Fund Department Total - 4.00 4.00 Health Comm. Disease & Immum. Public Health Prgm Coordinator (1.00) (1.00) Com Dis & Epidemiology Supv (1.00) (1.00) position reclassified position reclassified position reclassified position reclassified position reclassified position reclassified transferred to Disease Prevention and Control 29
City of Independence, Missouri
2015-16 Operating Budget
Authorized Position Changes - General Fund
the Fiscal Years 2014-15 and 2015-16 Total Change Change Changes During for for Fund/ Department/Function/Position Title 2014-15 2015-16 2015-16 Comments Disease Prevention and Control Public Health Prgm Coordinator 1.00 1.00 Com Dis & Epidemiology Supv 1.00 1.00 Department Total - -Public Works Property Management Building Maintenance Worker I (1.00) (1.00) Building Maintenance Worker II 1.00 1.00 Department Total -Parks and Recreation Administration Administrative Spec II (0.50) (0.50) Parks and Recreation Technician 0.50 0.50 Turf Facilities Maintenance Light Equipment Operator 1.00 1.00 transferred from George Owens Nature Park Senior Adult Services Seasonal Recreation Worker (0.30) (0.30) Kitchen Aide 0.30 0.30 George Owens Nature Park Light Equipment Operator (1.00) (1.00) transferred to Turf Facilities Maintenance Department Total - -General Fund Total - -position reclassified position reclassified position reclassified transferred from Comm. Disease & Immum. 30
For
City of Independence, Missouri
City Council / Mayor's Office
CITY COUNCIL / MAYOR'S OFFICE
Management Analyst Administrative Specialist III
31
Exec. Asst. to City Council
2015-16 Operating Budget City Council

Appropriations by Type: Expenditure Actual Original Revised Adopted Type 2013-14 2014-15 2014-15 2015-16 Personal Ser. 410,498 $ 410,161 $ 410,161 $ 419,799 $ Other Services 24,948 26,252 26,772 29,252 Supplies 7,806 4,770 4,250 4,770 Capital Outlay - - -Other - - -Total 443,252 $ 441,183 $ 441,183 $ 453,821 $ Historical Comparison: Actual Actual Actual Actual Budget Budget 2010-11 2011-12 2012-13 2013-14 2014-15 2015-16 Employees: Full Time Equiv. 10.00 10.00 10.00 10.00 10.00 10.00 Amount by Fund: General Fund 429,242 $ 374,989 $ 392,093 $ 443,252 $ 441,183 $ 453,821 $ Total All Funds 429,242 $ 374,989 $ 392,093 $ 443,252 $ 441,183 $ 453,821 $ Comparative Ratios: Per Capita 3.54 $ 3.21 $ 3.36 $ 3.78 $ 3.76 $ 3.87 $ Per Household 7.94 $ 7.69 $ 8.30 $ 8.98 $ 8.17 $ 8.32 $ 92.5% 6.4% 1.1% 0.0% 0.0% 2015-16 Budget Personal Ser. Other Services Supplies Capital Outlay Other 0 200 400 600 800 1,000 2010-11 2011-12 2012-13 2013-14 2014-15 2015-16 $429 $375 $392 $443 $441 $454 Dollars (1,000's) Fiscal Year 32
33
34
35
36
City of Independence, Missouri
City Clerk
CLERICAL SUPPORT CITY COUNCIL City Clerk
Administrative Specialist III
RECORDS MANAGEMENT
Assistant City Clerk
(1) Records Analyst
COPY CENTER
(1) Copy/Records Center Specialist
(1) Mail/Copy Center Operator
(1) Mail Carrier/Copy Center Aide
37
2015-16 Operating Budget City Clerk

Appropriations by Type: Expenditure Actual Original Revised Adopted Type 2013-14 2014-15 2014-15 2015-16 Personal Ser. 370,292 $ 341,263 $ 341,263 $ 318,199 $ Other Services 26,293 45,575 46,888 30,125 Supplies 18,728 17,880 17,880 18,367 Capital Outlay 1,546 - -Other - - -Total 416,859 $ 404,718 $ 406,031 $ 366,691 $ Historical Comparison: Actual Actual Actual Actual Budget Budget 2010-11 2011-12 2012-13 2013-14 2014-15 2015-16 Employees: Full Time Equiv. 6.00 6.00 6.00 7.00 7.00 7.00 Amount by Fund: General Fund 357,035 $ 326,377 $ 385,511 $ 416,859 $ 404,718 $ 366,691 $ Total All Funds 357,035 $ 326,377 $ 385,511 $ 416,859 $ 404,718 $ 366,691 $ Comparative Ratios: Per Capita 2.95 $ 2.79 $ 3.30 $ 3.56 $ 3.45 $ 3.13 $ Per Household 6.60 $ 6.70 $ 8.16 $ 8.44 $ 7.50 $ 6.72 $ 86.8% 8.2% 5.0% 0.0% 0.0% 2015-16 Budget Personal Ser. Other Services Supplies Capital Outlay Other 0 200 400 600 800 1,000 2010-11 2011-12 2012-13 2013-14 2014-15 2015-16 $357 $326 $386 $417 $405 $367 Dollars (1,000's) Fiscal Year 38
39
40
41
42
43
44
45
Citizens of Independence
Mayor and City Council
Boards and Commissions
Management Analyst
City Clerk Municipal Court
CITY MANAGER
City Counselor
Executive Assistant
Administrative Specialist III
Public Information Officer
Police
Fire
Power & Light
Finance Administration – Accounting –Budgeting – Purchasing - Licensing
Community Development – Planning & Zoning – Building Permits – Housing
Rehabilitation – Historic Preservation
Tourism – National Frontier Trails Museum
Deputy City Manager
Parks & Recreation
Economic Development/ Redevelopment
Water Pollution Control
Public Works – Street
Maintenance – Traffic Signs –
Construction Inspections –Engineering – Facilities
Maintenance
Water
Assistant City Manager
Technology Services –
Computers – Telephones
City7 Govt. Access Channel Communications
Health – Animal Control
Environmental Public Health Health Promotion
Human Resources
46
2015-16 Operating Budget
City Manager

Appropriations by Type: Expenditure Actual Original Revised Adopted Type 2013-14 2014-15 2014-15 2015-16 Personal Ser. 838,983 $ 912,727 $ 898,189 $ 952,768 $ Other Services 21,826 19,254 28,851 28,150 Supplies 1,818 2,150 4,565 3,460 Capital Outlay - - 2,526Other - - -Total 862,627 $ 934,131 $ 934,131 $ 984,378 $ Historical Comparison: Actual Actual Actual Actual Budget Budget 2010-11 2011-12 2012-13 2013-14 2014-15 2015-16 Employees: Full Time Equiv. 9.50 7.00 7.00 7.00 7.00 7.00 Amount by Fund: General Fund 1,039,220 $ 936,770 $ 833,576 $ 862,627 $ 934,131 $ 984,378 $ Total All Funds 1,039,220 $ 936,770 $ 833,576 $ 862,627 $ 934,131 $ 984,378 $ Comparative Ratios: Per Capita 8.57 $ 8.02 $ 7.13 $ 7.36 $ 7.97 $ 8.40 $ Per Household 19.21 $ 19.22 $ 17.65 $ 17.47 $ 17.30 $ 18.05 $ 96.8% 2.8% 0.4% 0.0% 0.0% 2015-16 Budget Personal Ser. Other Services Supplies Capital Outlay Other 0 250 500 750 1,000 1,250 1,500 2010-11 2011-12 2012-13 2013-14 2014-15 2015-16 $1,039 $937 $834 $863 $934 $984 Dollars (1,000's) Fiscal Year 47
48
49
50
51
City of Independence, Missouri Technology Services
TECHNOLOGY
Administrative
CYBER
Cyber
SERVICES
Information Technology Director
Specialist III
SECURITY
Security Specialist
APPLICATIONS PROGRAMMING Information Technology Systems Manager
(3) Systems Analyst
(2) Programmer Analyst
(1) Web Developer / Administrator
(1) Software Engineer
(1.5) Video Production Specialist
SYSTEMS COORDINATION Information Technology Systems Manager
(4) Network Systems Specialist
(2) Desktop Support Tecnhician
(1) Sr. Network Systems Specialist
COMPUTER OPERATIONS Computer Operations Supervisor
(1) Computer Operator II
52
(1) Computer Operator I
2015-16 Operating Budget Technology Services

Appropriations by Type: Expenditure Actual Original Revised Adopted Type 2013-14 2014-15 2014-15 2015-16 Personal Ser. 1,600,464 $ 1,771,321 $ 1,771,321 $ 1,771,172 $ Other Services 111,925 166,800 167,055 197,600 Supplies 16,115 14,310 14,055 16,810 Capital Outlay 6,003 - -Other 18,890 4,149 4,149 11,019 Total 1,753,397 $ 1,956,580 $ 1,956,580 $ 1,996,601 $ Historical Comparison: Actual Actual Actual Actual Budget Budget 2010-11 2011-12 2012-13 2013-14 2014-15 2015-16 Employees: Full Time Equiv. 22.00 23.50 23.50 23.50 24.50 25.50 Amount by Fund: General Fund 1,683,058 $ 1,650,858 $ 1,542,233 $ 1,627,925 $ 1,828,880 $ 1,867,106 $ Power and Light Fund 115,064 116,431 119,161 125,472 127,700 129,495 Total All Funds 1,798,122 $ 1,767,289 $ 1,661,394 $ 1,753,397 $ 1,956,580 $ 1,996,601 $ Comparative Ratios: Per Capita 14.83 $ 15.13 $ 14.22 $ 14.96 $ 16.68 $ 17.03 $ Per Household 33.24 $ 36.26 $ 35.17 $ 35.51 $ 36.25 $ 36.61 $ 88.7% 9.9% 0.8% 0.0% 0.6% 2015-16 Budget Personal Ser. Other Services Supplies Capital Outlay Other 0 500 1,000 1,500 2,000 2,500 2010-11 2011-12 2012-13 2013-14 2014-15 2015-16 $1,798 $1,767 $1,661 $1,753 $1,957 $1,997 Dollars (1,000's) Fiscal Year 53
54
55
56
57
58
59
60
61
City of Independence, Missouri Municipal Court
MUNICIPAL COURT Presiding Judge Municipal Judge Municipal Court Administrator (.65) Court Bailiff (3) Senior Court Clerk (3) Court Clerk (5) Clerk II 62
2015-16 Operating Budget Municipal Court

Appropriations by Type: Expenditure Actual Original Revised Adopted Type 2013-14 2014-15 2014-15 2015-16 Personal Ser. 757,470 $ 814,095 $ 814,095 $ 795,889 $ Other Services 32,370 31,355 31,355 32,155 Supplies 3,477 4,422 4,422 8,022 Capital Outlay - - -Other - - -Total 793,317 $ 849,872 $ 849,872 $ 836,066 $ Historical Comparison: Actual Actual Actual Actual Budget Budget 2010-11 2011-12 2012-13 2013-14 2014-15 2015-16 Employees: Full Time Equiv. 14.00 14.00 14.67 14.65 14.65 14.65 Amount by Fund: General Fund 776,786 $ 747,759 $ 748,027 $ 793,317 $ 849,872 $ 836,066 $ Total All Funds 776,786 $ 747,759 $ 748,027 $ 793,317 $ 849,872 $ 836,066 $ Comparative Ratios: Per Capita 6.41 $ 6.40 $ 6.40 $ 6.77 $ 7.25 $ 7.13 $ Per Household 14.36 $ 15.34 $ 15.84 $ 16.06 $ 15.74 $ 15.33 $ 95.2% 3.8% 1.0% 0.0% 0.0% 2015-16 Budget Personal Ser. Other Services Supplies Capital Outlay Other 0 300 600 900 1,200 1,500 2010-11 2011-12 2012-13 2013-14 2014-15 2015-16 $777 $748 $748 $793 $850 $836 Dollars (1,000's) Fiscal Year 63
64
65
66
City of Independence, Missouri Law
Legal Services
Deputy City Counselor (.50) Admin Spec. II City Prosecutor (.75) Asst. City Counselor II
(1) Asst. City Counselor III (.25) Asst. City Counselor II*
(1) Admin Spec. III
*Grant Funde d
Workers' Compensation
Workers' Comp Coordinator (.50) Asst. City Counselor II
(.50) Admin Spec. II
LAW City Counselor
67
2015-16 Operating Budget Law
Historical Comparison:

Appropriations by Type: Expenditure Actual Original Revised Adopted Type 2013-14 2014-15 2014-15 2015-16 Personal Ser. 714,336 $ 746,960 $ 760,286 $ 803,962 $ Other Services 2,242,301 2,479,950 2,484,700 2,494,050 Supplies 19,601 33,400 33,400 31,800 Capital Outlay 1,648 2,500 2,500 2,500 Other - - -Total 2,977,886 $ 3,262,810 $ 3,280,886 $ 3,332,312 $
Actual Actual Actual Actual Budget Budget 2010-11 2011-12 2012-13 2013-14 2014-15 2015-16 Employees: Full Time Equiv. 8.00 8.50 8.50 8.50 8.51 8.51 Amount by Fund: 781,876 $ 727,684 $ 613,562 $ 677,186 $ 687,741 $ 741,884 $ 29,981 29,913 29,900 16,190 31,735 31,944 General Fund Grants Compensation Fund 2,037,882 1,549,131 3,645,782 2,284,510 2,543,334 2,558,484 Total All Funds 2,849,739 $ 2,306,728 $ 4,289,244 $ 2,977,886 $ 3,262,810 $ 3,332,312 $ Comparative Ratios: Per Capita 23.51 $ 19.74 $ 36.71 $ 25.41 $ 27.82 $ 28.42 $ Per Household 52.69 $ 47.33 $ 90.81 $ 60.30 $ 60.44 $ 61.10 $ 24.1% 74.8% 1.0% 0.1% 0.0% 2015-16 Budget Personal Ser. Other Services Supplies Capital Outlay Other 0 1,000 2,000 3,000 4,000 5,000 2010-11 2011-12 2012-13 2013-14 2014-15 2015-16 $2,850 $2,307 $4,289 $2,978 $3,263 $3,332 Dollars (1,000's) Fiscal Year 68
69
70
71
72
73
74
FINANCE DEPARTMENT Finance and Administration Director Budget Manager Budget Analyst Administrative Specialist III ACCOUNTING Deputy Finance Director (1) Accounting Supervisor (1) Payroll Specialist (1) Accounts Receivable Spec. (1) Accounting Supervisor (1) Accounts Payable Spec. (1) Accounts Spec. (1) Accounting Supervisor (2) Accountant I PURCHASING Purchasing Manager (2) Procurement Spec. (1) Asst. Procurement Spec. (1) Clerk II OCCUPATION LICENSING Risk & Business License Manager (2) Business License Compliance Officer (1) Accounts Spec. 75
City of Independence, Missouri Finance
2015-16 Operating Budget Finance

Appropriations by Type: Expenditure Actual Original Revised Adopted Type 2013-14 2014-15 2014-15 2015-16 Personal Ser. 1,890,697 $ 1,850,174 $ 1,849,785 $ 1,799,309 $ Other Services 175,068 154,068 154,741 203,713 Supplies 11,268 14,177 13,893 17,177 Capital Outlay - - -Other - - -Total 2,077,033 $ 2,018,419 $ 2,018,419 $ 2,020,199 $ Historical Comparison: Actual Actual Actual Actual Budget Budget 2010-11 2011-12 2012-13 2013-14 2014-15 2015-16 Employees: Full Time Equiv. 25.00 23.50 23.50 23.50 23.00 23.00 Amount by Fund: General Fund 1,963,393 $ 1,819,555 $ 1,778,961 $ 2,026,664 $ 1,966,982 $ 1,968,698 $ Water Fund 58,992 50,535 46,210 50,369 51,437 51,501 Total All Funds 2,022,385 $ 1,870,090 $ 1,825,171 $ 2,077,033 $ 2,018,419 $ 2,020,199 $ Comparative Ratios: Per Capita 16.68 $ 16.01 $ 15.62 $ 17.72 $ 17.21 $ 17.23 $ Per Household 37.39 $ 38.37 $ 38.64 $ 42.06 $ 37.39 $ 37.04 $ 89.1% 10.1% 0.8% 0.0% 0.0% 2015-16 Budget Personal Ser. Other Services Supplies Capital Outlay Other 0 500 1,000 1,500 2,000 2,500 3,000 2010-11 2011-12 2012-13 2013-14 2014-15 2015-16 $2,022 $1,870 $1,825 $2,077 $2,018 $2,020 Dollars (1,000's) Fiscal Year 76
77
78
79
80
81
82
83
84
85
86
87
City of Independence, Missouri Human Resources HUMAN RESOURCES Human Resources Director Human Resources Analyst (.75) Human Resources Technician Benefits Administrator Employment / Volunteer Services Administrator
Human Resources Assistant 88
(2)
2015-16 Operating Budget Human Resources

Appropriations by Type: Expenditure Actual Original Revised Adopted Type 2013-14 2014-15 2014-15 2015-16 Personal Ser. 414,014 $ 435,548 $ 435,548 $ 440,705 $ Other Services 12,458 13,046 13,496 13,046 Supplies 3,268 5,693 5,243 5,693 Capital Outlay - - -Other - - -Total 429,740 $ 454,287 $ 454,287 $ 459,444 $ Historical Comparison: Actual Actual Actual Actual Budget Budget 2010-11 2011-12 2012-13 2013-14 2014-15 2015-16 Employees: Full Time Equiv. 6.50 6.50 6.44 7.44 6.75 6.75 Amount by Fund: General Fund 436,614 $ 429,515 $ 402,913 $ 429,740 $ 454,287 $ 459,444 $ Total All Funds 436,614 $ 429,515 $ 402,913 $ 429,740 $ 454,287 $ 459,444 $ Comparative Ratios: Per Capita 3.60 $ 3.68 $ 3.45 $ 3.67 $ 3.87 $ 3.92 $ Per Household 8.07 $ 8.81 $ 8.53 $ 8.70 $ 8.42 $ 8.42 $ 95.9% 2.9% 1.2% 0.0% 0.0% 2015-16 Budget Personal Ser. Other Services Supplies Capital Outlay Other 0 150 300 450 600 750 2010-11 2011-12 2012-13 2013-14 2014-15 2015-16 $437 $430 $403 $430 $454 $459 Dollars (1,000's) Fiscal Year 89
90
91
92
93
94
95
COMMUNITY DEVELOPMENT Community Development & Planning Director Administrative Specialist III Economic Development Manager Economic Development Projects Coordinator Assistant Department Director (1) Administrative Spec. II Comprehensive Planning Senior Planner Planner Sr. GIS Tech Current Planning Senior Planner (2) Planner Zoning Tech. Historic Preservation Manager Hist. Pres. Specialist Neighborhood Services (.80) Manager Neighborhood Srvs. Coord. (.88) Com. Dev. Program Spec. Com. Dev. Program Supvr. (CDBG) Com. Dev. Program Spec. (CDBG) (1) Com. Dev. Program Coord. (HOME) Building Inspections Manager (2) Plans Examiner (4) Bldg. Inspector (3) Planning & Zoning Technician Dangerous Bldg. Spec. 96
City of Independence, Missouri Community Development
2015-16 Operating Budget Community Development
Historical Comparison:

Appropriations by Type: Expenditure Actual Original Revised Adopted Type 2013-14 2014-15 2014-15 2015-16 Personal Ser. 1,254,434 $ 1,677,135 $ 1,671,398 $ 1,650,905 $ Other Services 2,520,065 2,113,878 2,478,534 1,978,869 Supplies 13,810 20,713 18,319 17,802 Capital Outlay 706,569 1,500 345,917 1,500 Other - - -Total 4,494,878 $ 3,813,226 $ 4,514,168 $ 3,649,076 $
Actual Actual Actual Actual Budget Budget 2010-11 2011-12 2012-13 2013-14 2014-15 2015-16 Employees: Full Time Equiv. 30.05 30.30 30.30 30.30 31.68 31.68 Amount by Fund: General Fund 2,670,431 $ 2,429,773 $ 3,017,887 $ 3,086,604 $ 3,155,386 $ 3,257,399 $ Grants Fund - 30,741 417,705 319,536 467,000 209,000 Community Dev Block 602,053 485,433 281,500 392,847 155,416 151,865 HOME Fund 914,112 197,127 67,740 695,891 35,424 30,812 Total All Funds 4,186,596 $ 3,143,074 $ 3,784,832 $ 4,494,878 $ 3,813,226 $ 3,649,076 $ Comparative Ratios: Per Capita 34.54 $ 26.90 $ 32.40 $ 38.35 $ 32.52 $ 31.12 $ Per Household 77.40 $ 64.48 $ 80.13 $ 91.02 $ 70.64 $ 66.90 $ 45.3% 54.2% 0.5% 0.0% 0.0% 2015-16 Budget Personal Ser. Other Services Supplies Capital Outlay Other 0 1,500 3,000 4,500 6,000 7,500 2010-11 2011-12 2012-13 2013-14 2014-15 2015-16 $4,187 $3,143 $3,785 $4,495 $3,813 $3,649 Dollars (1,000's)
Year 97
Fiscal
98
99
100
101
102
103
104
105
106
107
108
109
110
111
112
113
114
115
116
117
118
119
City of Independence, Missouri
Police Department
CHIEF OF POLICE Police Chief Administrative Specialist III Operations Support Bureau Deputy Chief A Field Operations Bureau Deputy Chief B 120
City of Independence, Missouri Police Department (Cont'd.)
A Support Services Major Detention Administrator Detention Supervisor A Shift (2) Detention Officers B Shift (3) Detention Officers Detention Supervisor C Shift (2) Detention Officers D Shift (3) Detention Officers Records Administrator A Shift (1) Supervisor (3) Records Clerks (4) Desk Clerks (2) Records Technicians (0.63) PT Records Clerk B Shift (1) Supervisor (3) Records Clerks (4) Desk Clerks C Shift (3) Records Clerks Communications Administrator A Shift (1) Emergency Communication Supervisor (1) Telecommunicator II (7) Telecommunicator I (3) Telecommunicators B Shift (1) Emergency Communication Supervisor (1) Telecommunicator II (7) Telecommunicator I (3) Telecommunicators C Shift (1) Emergency Communication Supervisor (1) Telecommunicator II (6) Telecommunicator I Proxy Shift (1) Telecommunicator I Administrative Services Major Internal Affairs Captain (1) Police Officer (1) Police Professional Standards Assistant Training Unit Sergeant (1) Public Information Officer (2) Community Services Officers Volunteers in Police Services Technology Electronic Fleet Technician (1) Police Technology Coordinator Fiscal Management Administrator (1) Fiscal Technician II (1) Grant Project Coordinator (0.63) Inventory Clerk Major 121
City of Independence, Missouri Police Department (Cont'd.)
B (1) Crime Analyst Lead (2) Crime Analysts Patrol Major A Watch (1) Captain (2) Sergeants (18) Police Officers B Watch (1) Captain (2) Sergeants (18) Police Officers C Watch (1) Captain (2) Sergeants (20) Police Officers D Watch (1) Captain (2) Sergeants (20) Police Officers (1) Administrative Specialist II Extended Workmen's Comp (1) Police Officer Police Chaplain Program Special Operations Major Tactical Operations (1) Captain (1) Sergeant (1) Police Officer Special Response Team (1) Sergeant (2) Hawthorne Police Officers (6) Police Officers Canine Unit (1) Sergeant (4) Police Officers (2) Independence Center Police Officers Special Enforcement (1) Captain School Resource Officer (SRO) (1) Sergeant (7) SRO Police Officers (2) SRTO Police Officers (Truancy) (3) DARE Police Officers (1) DARE Sergeant Selective Enforcement Unit (SEU) (1) Sergeant (1) Administrative Specialist II (8) Police Officers (1) Parking Enforcement Officer Accident Investigation Unit (AIU) (1) Sergeant (9) Police Officers Reserve Program Criminal Investigations Major North Area of Command Captain Jackson County Drug Task Force (1) Sergeant (3) Police Officers Drug Enforcement (1) Sergeant (6) Police Officers (2) DEA Task Force Police Officers Crimes Against Persons (1) Sergeant (5) Police Officers Property Crimes (1) Sergeant (6) Police Officers (1) ATF Task Force Police Officer South Area of Command Captain Crimes Against Persons (1) Sergeant (5) Police Officers (1) FBI Task Force Police Officer (1) HARCFL Police Officer Property Crimes (1) Sergeant (6) Police Officers (1.25) Property/Evidence Clerk (2) Adminstrative Specialist II Career Criminal Unit (1) Sergeant (4) Police Officers Crime Scene (1) Lab Administrator (5) Crime Scene Investigators (2) Criminalists (1.4) Latent Print Examiners 122
2015-16 Operating Budget Police
Fiscal Year

Appropriations by Type: Expenditure Actual Original Revised Adopted Type 2013-14 2014-15 2014-15 2015-16 Personal Ser. 24,336,694 $ 25,206,157 $ 25,206,157 $ 24,944,270 $ Other Services 1,662,697 1,881,367 1,887,751 1,785,179 Supplies 969,596 1,031,599 1,084,302 1,066,220 Capital Outlay 1,817,936 2,000,082 2,095,536 1,288,675 Other 38,273 - - 38,274 Total 28,825,196 $ 30,119,205 $ 30,273,746 $ 29,122,618 $ Historical Comparison: Actual Actual Actual Actual Budget Budget 2010-11 2011-12 2012-13 2013-14 2014-15 2015-16 Employees: Full Time Equiv. 292.90 288.65 289.91 291.91 296.91 296.91 Amount by Fund: General Fund 25,239,490 $ 25,126,483 $ 25,839,421 $ 26,407,530 $ 27,227,469 $ 27,034,885 $ Police Public Safety 1,173,094 1,412,354 1,588,295 2,417,666 2,891,736 2,087,733 Total All Funds 26,412,584 $ 26,538,837 $ 27,427,716 $ 28,825,196 $ 30,119,205 $ 29,122,618 $ Comparative Ratios: Per Capita 217.90 $ 227.16 $ 234.77 $ 245.92 $ 256.84 $ 248.40 $ Per Household 488.32 $ 544.48 $ 580.67 $ 583.71 $ 557.95 $ 533.95 $ 85.7% 6.1% 3.7% 4.4% 0.1% 2015-16 Budget Personal Ser. Other Services Supplies Capital Outlay Other 0 10,000 20,000 30,000 40,000 50,000 2010-11 2011-12 2012-13 2013-14 2014-15 2015-16 $26,413 $26,539 $27,428 $28,825 $30,119 $29,123 Dollars (1,000's)
123
124
125
126
127
128
129
130
131
132
133
134
135
136
137
138
139
140
141
142
143
144
145
146
147
148
149
150
151
152
153
154
155
156
157
158
159
City of Independence, Missouri Fire Department
FIRE DEPARTMENT Fire Chief EMERGENCY PREPAREDNESS Emerg. Preparedness Manager (.5) Admin. Spec. II Emergency Prepardness Planner Administrative Specialist III OPERATIONS (1) Deputy Chief OPERATIONS "A" SHIFT (1) Battalion Chief (14) Fire Captain (14) Fire Equip. Oper. (23) Firefighter OPERATIONS "B" SHIFT (1) Battalion Chief (14) Fire Captain (14) Fire Equip. Oper. (23) Firefighter OPERATIONS "C" SHIFT (1) Battalion Chief (14) Fire Captain (14) Fire Equip. Oper. (23) Firefighter EMERGENCY MEDICAL SERVICES (1) Assistant Fire Chief ADMINISTRATION & BUDGET (1) Deputy Chief Admin. Specialist II MAINTENANCE (1) Battalion Chief of Services FIRE PREVENTION (1) Battalion Chief Admin. Spec. II (5) Fire Inspector TRAINING /PROFESSIONAL DEVELOPMENT (1) Assistant Fire Chief (.5) Admin. Spec. II 160
2015-16 Operating Budget Fire
Fiscal Year

Appropriations by Type: Expenditure Actual Original Revised Adopted Type 2013-14 2014-15 2014-15 2015-16 Personal Ser. 16,054,946 $ 16,308,635 $ 16,366,390 $ 16,090,642 $ Other Services 822,628 922,373 949,067 921,289 Supplies 366,802 388,783 409,231 430,406 Capital Outlay 1,249,931 1,003,625 984,965 1,595,175 Other 681,125 591,295 591,295 35,329 Total 19,175,432 $ 19,214,711 $ 19,300,948 $ 19,072,841 $ Historical Comparison: Actual Actual Actual Actual Budget Budget 2010-11 2011-12 2012-13 2013-14 2014-15 2015-16 Employees: Full Time Equiv. 174.00 174.00 174.00 174.00 175.00 175.00 Amount by Fund: 16,620,726 $ 16,237,861 $ 15,911,151 $ 16,643,899 $ 16,966,162 $ 17,042,758 $ 908,631 326,997 331,843 441,030 352,061 82,808 General Fund Grants Public Safety Sales Tax 1,910,872 2,099,702 1,898,509 2,090,503 1,896,488 1,947,275 Total All Funds 19,440,229 $ 18,664,560 $ 18,141,503 $ 19,175,432 $ 19,214,711 $ 19,072,841 $ Comparative Ratios: Per Capita 160.38 $ 159.76 $ 155.28 $ 163.59 $ 163.85 $ 162.68 $ Per Household 359.41 $ 382.93 $ 384.07 $ 388.30 $ 355.95 $ 349.69 $ 84.4% 4.7% 2.3% 8.4% 0.2% 2015-16 Budget Personal Ser. Other Services Supplies Capital Outlay Other 0 5,000 10,000 15,000 20,000 25,000 2010-11 2011-12 2012-13 2013-14 2014-15 2015-16 $19,440 $18,665 $18,142 $19,175 $19,215 $19,073 Dollars (1,000's)
161
162
163
164
165
166
167
168
169
170
171
172
173
174
175
176
177
178
179
180
181
182
(1)
City of Independence, Missouri Health Department
(1)
(.5)
(.5)
(1) Administrative Specialist III
(1) Animal Services Manager
(1.1) Administrative Specialist II
(4) Animal Services Officer
(1) Environmental Health Supervisor
(.5) Administrative Specialist II
(.25) Clerk Typist II
(3) Public Health Investigator
(.3) Public Health Investigator*
(1) Environmental Health Supervisor
(.5) Administrative Specialist II
(.25) Clerk Typist II
(7) Property Maintenance Officer
*Indicates Grant Funded Position HEALTH DEPARTMENT Public Health Director
Administrative Specialist III Advisory Board of Health
ACCREDITATION & QI MANAGER DISEASE PREVENTION (1) Manager
Administrative Specialist III
Administrative Specialist II*
Public Health Program Coordinator
Emergency Response Planner* (2) Public Health Specialist* (.5) Public Health Educator* COMMUNICABLE DISEASE and IMMUNIZATION (.5) Manager
(.6)
(1)
(1)
Administrative Specialist III (1) Epidemiologist* (1) Public Health Nurse (1.05) Public Health Nurse*
HEALTH
Assistant Health Director
ENVIRONMENTAL
(1)
183
2015-16 Operating Budget Health

Appropriations by Type: Expenditure Actual Original Revised Adopted Type 2013-14 2014-15 2014-15 2015-16 Personal Ser. 2,379,709 $ 2,429,443 $ 2,750,106 $ 2,317,928 $ Other Services 760,981 679,702 762,397 678,026 Supplies 112,927 77,726 118,886 81,986 Capital Outlay 84,570 - 2,093Other - - -Total 3,338,187 $ 3,186,871 $ 3,633,482 $ 3,077,940 $
Actual Actual Actual Actual Budget Budget 2010-11 2011-12 2012-13 2013-14 2014-15 2015-16 Employees: Full Time Equiv. 40.95 43.81 47.85 38.39 35.42 35.69 Amount by Fund: General Fund 2,553,599 $ 2,519,483 $ 2,617,796 $ 2,554,644 $ 2,754,318 $ 2,650,711 $ Grants 763,693 702,364 849,927 783,543 432,553 427,229 Total All Funds 3,317,292 $ 3,221,847 $ 3,467,723 $ 3,338,187 $ 3,186,871 $ 3,077,940 $ Comparative Ratios: Per Capita 27.37 $ 27.58 $ 29.68 $ 28.48 $ 27.18 $ 26.25 $ Per Household 61.33 $ 66.10 $ 73.41 $ 67.60 $ 59.04 $ 56.43 $ 75.3% 22.0% 2.7% 0.0% 0.0% 2015-16 Budget Personal Ser. Other Services Supplies Capital Outlay Other 0 1,000 2,000 3,000 4,000 5,000 2010-11 2011-12 2012-13 2013-14 2014-15 2015-16 $3,317 $3,222 $3,468 $3,338 $3,187 $3,078 Dollars (1,000's) Fiscal Year 184
Historical Comparison:
185
186
187
188
189
190
191
192
193
194
195
196
197
198
199
200
201
202
City of Independence, Missouri Public Works
PUBLIC WORKS Public Works Director Administrative Specialist III Administrative Specialist II ENGINEERING Assistant Dept Director Engineer III CONSTRUCTION Engineer III (3) Construction Inspector (4) Engineering Admininstrator (1) Contract Mngr. DEVELOPMENT Engineer III (1) Engineer II (1) Engineer I (3) Engineering Tech III (1) Engineering Tech II COMMUNITY PROGRAMS Program Manager (1) GIS Tech. OPERATIONS Assistant Department Director PROPERTY MANAGEMENT Properties Manager (1) Maintenance Supervisor (1.26) Building Mtc. Worker I (2) Building Mtc. Worker II (1) Building Mtc. Worker III (4) Custodian ADMINISTRATIVE SUPPORT Asst. Dept. Director (1) Engineering Administrator (1) Engineering Tech III (2) Engineering Tech II (.75) Recycling Site Operator STREET MAINTENANCE Lead Maint. Supv. Streets (4) Maint. Supervisor (1) Asst. Foreman (8) Heavy Eqmt. Oper. (13) Light Eqmt. Oper (9.89) Constr. Aid (1) Admin. Spec. III (1) Data Control Clerk Sign Shop Maintenance Supervisor (1) Asst. Foreman (4) Sign & Marking Tech Central Garage Garage Supervisor (3) Auto Mechanic (4) Heavy Eqmt. Mechanic (1) Fleet Parts Inventory Clerk (.75) Admin. Spec. II 203
2015-16 Operating Budget Public Works
Historical Comparison:

Appropriations by Type: Expenditure Actual Original Revised Adopted Type 2013-14 2014-15 2014-15 2015-16 Personal Ser. 4,130,211 $ 4,150,723 $ 4,150,723 $ 3,995,922 $ Other Services 1,643,767 1,859,764 1,818,298 1,869,153 Supplies 1,915,411 2,007,244 2,033,288 2,017,578 Capital Outlay 432,902 616,596 632,018 605,522 Other - - -Total 8,122,291 $ 8,634,327 $ 8,634,327 $ 8,488,175 $
Actual Actual Actual Actual Budget Budget 2010-11 2011-12 2012-13 2013-14 2014-15 2015-16 Employees: Full Time Equiv. 93.75 90.65 93.65 94.02 94.02 94.02 Amount by Fund: General Fund 6,180,748 $ 5,126,539 $ 5,398,741 $ 5,550,244 $ 5,870,029 $ 5,812,067 $ Central Garage Fund 2,153,712 2,151,050 2,096,696 2,183,317 2,394,478 2,316,090 Street Improv. Sales - - 192,166 300,416 278,972 265,323 Sewer Fund 75,008 75,518 54,153 88,314 90,848 94,695 Total All Funds 8,409,468 $ 7,353,107 $ 7,741,756 $ 8,122,291 $ 8,634,327 $ 8,488,175 $ Comparative Ratios: Per Capita 69.38 $ 62.94 $ 66.27 $ 69.30 $ 73.63 $ 72.40 $ Per Household 155.47 $ 150.86 $ 163.90 $ 164.48 $ 159.95 $ 155.63 $ 47.1% 22.0% 23.8% 7.1% 0.0% 2015-16 Budget Personal Ser. Other Services Supplies Capital Outlay Other 0 3,000 6,000 9,000 12,000 15,000 2010-11 2011-12 2012-13 2013-14 2014-15 2015-16 $8,409 $7,353 $7,742 $8,122 $8,634 $8,488 Dollars (1,000's)
Year 204
Fiscal
205
206
207
208
209
210
211
212
213
214
215
216
217
218
219
220
221
City of Independence, Missouri Parks and Recreation
PARKS & RECREATION Parks & Recreation Director (.80) Staff Assistant - Volunteer Coord. Administrative Specialist III (.50) Parks and Recreation Technician SERMON / TRUMAN MEM. BLDG. (1) Recreation Program/Fac. Supv. (1) Recreation Specialist (.50) Parks and Recreation Technician (4.76) Sermon Center Attendant (2.29) Truman Center Attendant SENIOR ADULT SERV./PALMER (1) Recreation Program/Fac. Supv. (1) Senior Prog. Spec. (.7) Nutrition Site Aide (.61) Admin. Spec. II (1.83) Center Attendant (.3) Seasonal Recreation Worker GEORGE OWENS/ FAMILY PROG. SUPV. (1) Recreation Programs/Fac. Supv. (1) Park Naturalist (.91) Seasonal Maint. Worker (1.45) Center Attendant (.55) Seasonal Maint. Worker SPORTS/AQUATICS (1) Supervisor (1) Recreation Specialist (1) Seasonal Maint. Worker PARKS MAINT. ADMIN. (1) Manager Security & Insp. (.5) Auto Mechanic (1) Maint. Aide (1) Light Equip. Operator (2) Maint. Mechanics Sports Administration (1) Maint. Aide (1) Asst. Foreman (4) Light Equip. Operator (2.88) Seasonal Maint. Worker (2) Turf & Fac. Maint. Supv. (1) Parks Horticulturist (1) Asst. Foreman (3) Light Equip. Operator (2) Maint. Aide (.5) Auto Mechanic (2.34) Seasonal Maint. Worker Cemetery Maint. (.5) Cemetery Sexton (2) Maintenance Aide (.58) Seasonal Maint. Worker 222
2015-16 Operating Budget Parks and Recreation

Appropriations by Type: Expenditure Actual Original Revised Adopted Type 2013-14 2014-15 2014-15 2015-16 Personal Ser. 2,393,429 $ 2,613,754 $ 2,638,754 $ 2,621,291 $ Other Services 1,259,955 1,311,744 1,321,064 1,273,163 Supplies 268,848 314,421 295,741 316,700 Capital Outlay 12,310 - 15,460 3,797 Other - - -Total 3,934,542 $ 4,239,919 $ 4,271,019 $ 4,214,951 $
Actual Actual Actual Actual Budget Budget 2010-11 2011-12 2012-13 2013-14 2014-15 2015-16 Employees: Full Time Equiv. 54.19 50.46 50.90 52.55 53.71 53.71 Amount by Fund: General Fund 2,128,174 $ 2,015,219 $ 1,570,832 $ 1,494,014 $ 1,632,342 $ 1,634,988 $ Parks Improv. Sales 2,504,369 2,469,920 2,374,601 2,440,528 2,607,577 2,579,963 Total All Funds 4,632,543 $ 4,485,139 $ 3,945,433 $ 3,934,542 $ 4,239,919 $ 4,214,951 $ Comparative Ratios: Per Capita 38.22 $ 38.39 $ 33.77 $ 33.57 $ 36.16 $ 35.95 $ Per Household 85.65 $ 92.02 $ 83.53 $ 79.67 $ 78.54 $ 77.28 $ 62.2% 30.2% 7.5% 0.1% 0.0% 2015-16 Budget Personal Ser. Other Services Supplies Capital Outlay Other 0 1,500 3,000 4,500 6,000 7,500 2010-11 2011-12 2012-13 2013-14 2014-15 2015-16 $4,633 $4,485 $3,945 $3,935 $4,240 $4,215 Dollars (1,000's) Fiscal Year 223
Historical Comparison:
224
225
226
227
228
229
230
231
232
233
234
235
236
237
238
239
240
241
242
243
244
245
246
247
248
249
250
251
252
253
CITY OF INDEPENDENCE, MISSOURI 2015-16 Operating Budget
Mobile Department Description Buildings Equipment Other Total Technology Services: 152,400 $ Hardware/Equipment Replacement PC Replacement 93,400 Monitor Replacement (as needed) 5,000 CityWorks Host Server 19,000 City7 Digital Equipment Camera 10,000 Video Cards for Digital Output 2,550 Live Video Switcher 10,750 SDI Converter 1,000 Digital Audio Converter 200 Monitor 500 Disaster Recovery 10,000 Next phase of Disaster Recovery Plan Health: 47,600 Replace 1999 Ford Taurus - Asset 3021 21,500 ADA Operator for the North Handicap Entrance 2,500 Install security camera system at 515 S. Liberty 23,600 Public Works 200,000 Public Works Inspector 1/2 ton pickup truck 21,000 Replace Bobtail Truck and Low Boy Trailer 65,000 Police Dept. roof replacement over mechanical room 29,500 City Hall HVAC unit for Network (telephone) room 9,500 Sermon Center exterior window repair (phase 1) 75,000 Total 140,100 $ 107,500 $ 152,400 $ 400,000 $ 254
General Fund Operating Budget - Capital Outlay Appropriations
Description Appropriations Allocation Amount Projected Beginning Balance of Available Funds 220,094 $ 2015-16 Appropriations 250,000 $ Total Available Funds 470,094 $ Allocations: Northwest Communities Development Corporation 20,000 Community Gardens 28,300 Neighborhood Cleanup Program 60,000 Tourism Hosting (NAIA) 20,000 Hungry & Homeless 20,000 Economic Development 300,000 Total Allocations 448,300 $ 2015-16 Ending Balance of Available Funds 21,794 $
2015-16 Operating Budget City Council Goals Account Summary 255
CITY OF INDEPENDENCE, MISSOURI
256
257
258
259
260
261
262
263
2015-16 Operating Budget Power and Light Fund
Source of Budget Dollars
Allocation of Budget Dollars
Operating Revenues 99% Interest Income 0% Interfund Charges 1%
Capital Budget 8% Power and Light Dept. 71% NonDepartmental/ Other 15% Debt Service 6%
264
Source of Budget Dollars
Use of Budget Dollars
City of Independence, Missouri 2015-16 Operating Budget Budget Summary Power and Light Fund For the Fiscal Years 2013-14, 2014-15 and 2015-16 2015-16 Increase 2014-15 City Council % (Decrease) 2013-14 Current Adopted of Over Last % Description Actual Estimate Budget Total Year Change $ 36,066,284 $ 52,529,332 $ 35,400,000 29,509,823 7,197,993 -
Estimated RevenuesOperating Revenues 138,582,455 $ 137,364,004 $ 140,786,000 $ 98.9% 3,421,996 $ 2.5% Interest Income 29,439 12,000 12,000 0.0% - 0.0% Interfund Charges 1,348,077 1,560,441 1,484,545 1.0% (75,896) -4.9% Other Revenues 231,530 - - - n/a Total Estimated Revenues 140,191,501 $ 138,936,445 $ 142,282,545 $ 100.0% 3,346,100 $ 2.4% Transfers from Other Funds- - - - n/a Debt Proceeds - - - - n/a Total Sources 140,191,501 $ 138,936,445 $ 142,282,545 $ 3,346,100 $ 2.4%
Operating Budget: Technology Services 125,472 $ 127,700 $ 129,495 $ 0.1% 1,795 $ 1.4% Power and Light Dept. 104,921,884 111,052,304 109,912,847 71.5% (1,139,457) -1.0% Non-Departmental 24,312,833 22,980,015 22,501,886 14.6% (478,129) -2.1% Debt Service 10,718,844 8,944,557 8,946,957 5.8% 2,400 0.0% Total Operating Budget 140,079,033 $ 143,104,576 $ 141,491,185 $ 92.1% (1,613,391) $ -1.1% Capital Budget: Capital Projects 12,933,191 $ 20,075,552 12,127,550 7.9% (7,948,002) -39.6% Transfers: Falls at Crackerneck Creek TIF 226,052 $ 83,642 83,642 0.1% - 0.0% Total Uses 153,238,276 $ 163,263,770 $ 153,702,377 $ (9,561,393) $ -5.9% $ 52,529,332 $ 35,400,000 $ 23,980,168 $ (11,419,832) -32.26% Beginning Net Available Resources Change in non-budgetary Net Available Resources Ending Net Available Resources 265
City of Independence, Missouri
2015-16 Operating Budget
Historical Data - Power and Light Fund
For the Fiscal Years 2009-10 through 2014-15
Net Available Resources
Utility Statistics
Projected Description 2009-10 2010-11 2011-12 2012-13 2013-14 2014-15 Net Income (Loss) Net Income (Loss) (1,700,900) $ (616,514) $ 1,807,024 $ (2,821,422) $ 339,291 $ Capital Contributions 1,413,624 1,905,706 154,564 585,916 438,026 Change in Net Assets (287,276) $ 1,289,192 $ 1,961,588 $ (2,235,506) $ 777,317 $ (7,600,000) $
Net Available ResourcesTotal Current Assets 41,310,513 $ 46,415,386 $ 60,588,681 $ 72,227,861 $ 84,667,685 $ Less: Inventories (10,306,056) (12,939,459) (12,759,050) (12,505,713) (11,442,057) Prepaid Items (91,666) (140,101) (281,935) (234,783) (263,869) Current Liabilities (14,278,809) (12,139,397) (13,849,277) (16,249,323) (14,839,384) Capital Budget (1,996,521) (1,715,415) (2,368,086) (3,270,885) (648,131) Appropriations Carryover Outstanding (4,727,993) (2,715,447) (4,835,350) (3,900,873) (4,944,912) Encumbrances Net Available Resources 9,909,468 $ 16,765,567 $ 26,494,983 $ 36,066,284 $ 52,529,332 $ 35,400,000 $ Target Working Capital 21,000,000 $ 21,000,000 $ 21,000,000 $ 21,000,000 $ 21,000,000 $ 21,000,000 $
2014-15 - Operating Staff projections Employee Staffing (in Full Time Equivalents) Department: Technology Services 1.00 1.50 1.50 1.50 1.50 1.50 Power and Light 218.00 222.00 233.00 236.00 238.00 239.00 Total 219.00 223.50 234.50 237.50 239.50 240.50
Source: 2009-10 through 2013-14 - Comprehensive Annual Financial Report
No. of Residential Customers 51,458 51,277 51,124 51,150 51,432 51,450 No. of Other Customers 5,128 5,181 5,168 5,142 5,117 5,110 Generated Power (MWH) 134,843 120,588 271,460 286,682 170,118 193,000 Purchased Power (MWH) 1,088,887 1,129,598 928,803 880,110 968,562 879,000 266
City of Independence, Missouri 2015-16 Operating Budget
Revenue Summary
For the Fiscal Years 2013-14 through 2015-16
2015-16 %Chg. Acct. 2013-14 Original Current Adopetd Adopted No. Description Actual Budget Estimate Budget to Curr Est. 2014-15 Power and Light Fund Operating Revenue 20-4010 Electric Service Charges 136,744,989 141,836,000 135,375,437 138,580,000 2.4% 20-4600 Other Operating Revenue 1,877,852 2,022,000 1,988,567 1,884,000 -5.3% 20-4700 Change in Unbilled Revenue -40,386 -109,000 322,000 Total Operating Revenue 138,582,455 143,749,000 137,364,004 140,786,000 2.5% 20-3421 Interfund Charges 1,348,077 1,560,441 1,560,441 1,484,545 -4.9% 20-3411 Interest Income 29,439 21,000 12,000 12,000 20-4900 Other Revenues, Net 231,530 Total Revenues $140,191,501 $145,330,441 $138,936,445 $142,282,545 2.4% 267

268
(1)
City of Independence, Missouri Power & Light Department
(1)
(1)
& LIGHT Power & Light Director
Planning & Rates Manager
POWER
Economic
Planning & Rates Supervisor
Engineer III
Director P&L
(1)
Deputy
Document Management Specialist Administrative Specialist III Environmental Program Supervisor
Environmental Program Specialist Support Services A Production B Transmission & Distribution C Engineering D System Operations E 269
City of Independence, Missouri
Power & Light (Cont'd.)
A
SUPPORT SERVICES Support Services Manager
Contract Compliance Coordinator Utility Support Specialist
Utility Support Clerk
Security Administrator Meter Reading Meter Reader Supervisor
(1) Asst. Meter Reader Supvr.
(1) Meter Records Clerk
(14) Utility Meter Reader I
Vehicle Maintenance Fleet Administrator
(4) Heavy Equip. Mechanic
(1) Utility Maint. Worker
(1) Fleet Control Data Tech.
Warehouse & Stores Warehouse Superintendent
Warehouse Clerk Lead Warehouseman
(2) Warehouseman
(1) Utility Maint. Worker
Utility Field Service Customer Operations Supvervisor
(7) Utility Field Service Worker
Marketing & Customer Programs Customer Programs Administrator
(2) Energy Applications Spec.
Accounting & Finance Utility Acct. Administrator
270
(1) Utility Property Accountant
(1)
City of Independence, Missouri Power & Light (Cont'd.)
(1)
(3)
(5)
B
Engineer
PRODUCTION Power Production Manager Administrative Spec. III Performance & Contract
Utility Data Specialist - P&L
Engineer II Power Plant Electrical/Electronic Supervisor
Journeyman Power Plant Electrician
(1) Engineer III PP Instrument Control Supervisor
Facility Mtc. Supv.
Journeyman Mechanic/Welder
Machinist/Mechanic
Journeyman Power Plant Mech.
Inst./Pneumatic Technician Plant Maintenance Superintendent
(1)
(1)
(13)
(2) Production Operations Supt.
Tech
Shift Supervisor
Power Plant Oper. III
Power Plant Oper. II
Power Plant Oper. I Facility Maintenance Supv.
PP Gen. Util. Worker
Utility Maint. Worker Warehouse Superintendent
Inventory Clerk Safety & Training Specialist - Production 271
(1) Lab Control
(5) Operations
(6)
(6)
(12)
(4)
(3)
(2)
City of Independence, Missouri Power & Light (Cont'd.)
C
Transmission & Distribution Electric Distribution Manager
Utility Data Specialist - P&L Safety & Training Specialist System Protection Engineer T&D Superintendent Substation Foreman, Wkg.
(2) Substation Lineman
(2) Relay Technicians
(2) T&D Superintendent Inspector/Locator
(9) Crew Leader, Wkg.
(24) Journeyman Lineman
(3) Apprentice Lineman
(4) Troubleman
(5) Dispatcher Utility Maint. Lead Worker
(1) Utility Maint. Worker
Tree Trim Supt. Arborist - P&L
T&D Superintendent Meter Foreman, Wkg.
(3) Journeyman Meterman
272
(1) Meter Records Clerk
City of Independence, Missouri Power & Light (Cont'd.)
D Engineering Power Engineer Manager Systems Program Coord. Administrative Specialist III Engineering Supervisor
Engineer III Telecommunications Supervisor
Senior Electronics Tech (2) Electronics Tech District Engineering Planning Supv. (3) Senior District Planner (1) District Planner II
Engineering Tech III
Engineer II GIS Supervisor
GIS/CAD Technician 273
(3)
(1)
(1)
(1)
(3)
City of Independence, Missouri
Power & Light (Cont'd.)
E System Operations System Operations Manager
Energy Management System Coord. II Energy Management System Coord.
P&L Operations Supervisor
NERC Compliance Supervisor
Energy Markets Coordinator
Electric System Operations Engineer
(4) Senior System Operator
(1) System Operator II
Reliability Compliance Coord.
CIP/Cyber Security Coord.
Cyber Security Coord.
274
2015-16 Operating Budget Power & Light

Appropriations by Type: Expenditure Actual Original Revised Adopted Type 2013-14 2014-15 2014-15 2015-16 Personal Ser. 28,464,162 $ 29,491,935 $ 29,491,935 $ 29,651,723 $ Other Services 16,515,495 22,095,277 22,076,987 20,465,648 Supplies 58,723,466 58,249,992 58,306,772 58,534,326 Capital Outlay 1,218,761 1,215,100 1,176,610 1,261,150 Other - - -Total 104,921,884 $ 111,052,304 $ 111,052,304 $ 109,912,847 $ Historical
Actual Actual Actual Actual Budget Budget 2010-11 2011-12 2012-13 2013-14 2014-15 2015-16 Employees: Full Time Equiv. 222.00 233.00 236.00 238.00 239.00 239.00 Amount by Fund: Power and Light Fund 96,753,984 $ 104,229,826 $ 99,672,439 $ 104,921,884 $ 111,052,304 $ 109,912,847 $ Total All Funds 96,753,984 $ 104,229,826 $ 99,672,439 $ 104,921,884 $ 111,052,304 $ 109,912,847 $ Comparative Ratios: Per Capita 798.22 $ 892.15 $ 853.14 $ 895.14 $ 946.98 $ 937.50 $ Per Household 1,788.79 $ 2,138.40 $ 2,110.14 $ 2,124.66 $ 2,057.21 $ 2,015.20 $ 27.0% 18.6% 53.3% 1.1% 0.0% 2015-16 Budget Personal Ser. Other Services Supplies Capital Outlay Other 0 30,000 60,000 90,000 120,000 150,000 2010-11 2011-12 2012-13 2013-14 2014-15 2015-16 $96,754 $104,230 $99,672 $104,922 $111,052 $109,913 Dollars (1,000's)
275
Comparison:
Fiscal Year
276
277
278
279
280
281
282
283
284
285
286
287
288
289
290
291
292
293
294
295
296
297
298
299
300
City of Independence, Missouri
2015-16 Operating Budget
Capital Lease/Debt Service Requirements - Power and Light Fund
Total Debt Service Series Principal Interest Fees Requirements Revenue Bonds (Refunding): Revenue Bonds: 2010 Series B (6238) 1,560,000 $ 950,588 $ 4,000 $ 2,514,588 $ Revenue Bonds: 2012 Series A (6239) - 2,631,219 4,000 2,635,219 Revenue Bonds: 2012 Series F (6241) 1,835,000 1,958,150 4,000 3,797,150 Total Power and Light Fund 3,395,000 $ 5,539,957 $ 12,000 $ 8,946,957 $ 301
City of Independence, Missouri
2015-16 Operating Budget
Capital Budget Summary - Power and Light Fund
Project Number Project Description Source of Funds Amount Production System70201401 Combustion Turbine Generators Exciter Upgrades Power and Light Fund $ 600,000 70201501 Substation H-5/H-6 Hot Gas Path/Generator Inspect. Power and Light Fund 1,300,000 70201502 BV 1&2 Turbine Inspection/Repair Power and Light Fund 2,000,000 70201503 Combustion Turbine Controls Upgrade Power and Light Fund 750,000 Transportation and Distribution System70201310 Substation J Facility Improvements Power and Light Fund 1,033,000 70201106 Substation Facilities/Equipment Improvements Power and Light Fund 260,000 70201505 Substation L Switchgear Replacement Power and Light Fund 990,000 70201506 69 KV Transmission Line & Terminal Improvements Power and Light Fund 2,469,000 70201507 Substation I Switchgear & Transformer Replacement Power and Light Fund 1,615,000 Other Projects70201405 IPL Property Security Project Power and Light Fund 300,000 70201509 New Billing System Power and Light Fund 535,550 70201510 System Operations/Dispatch - System Upgrades Power and Light Fund 275,000 12,127,550 $ 302
2015-16 Operating Budget Sanitary Sewer Fund
Source of Budget Dollars
Allocation of Budget Dollars
Operating Revenues 100% Other Revenues / Sources 0%
Capital Budget 6% Water Pollution Control 54% NonDepartmental/ Other 18% Debt Service 22% Public Works 0%
303
Net Available
Source of Budget Dollars
Use of Budget Dollars
Change in Net Available Resources greater than 10% due to the timing of Capital Expenditures
City of Independence, Missouri 2015-16 Operating Budget Budget Summary Sanitary Sewer Fund For the Fiscal Years 2013-14, 2014-15 and 2015-16 2015-16 Increase 2014-15 City Council % (Decrease) 2013-14 Current Adopted of Over Last % Description Actual Estimate Budget Total Year Change $ 3,110,783 $ (14,964,034) $ 9,328,894 $ 24,292,928 -162.34% (7,343,920) 24,353,306 - (24,353,306)
Estimated RevenuesOperating Revenues 21,471,299 $ 23,094,824 $ 23,464,156 $ 100.0% 369,332 $ 1.6% Interest Income 6,861 5,900 5,000 0.0% (900) -15.3% Other Revenues 0.0% - n/a Total Estimated Revenues 21,478,160 $ 23,100,724 $ 23,469,156 $ 100.0% 368,432 $ 1.6% Transfers from Other FundsGeneral Fund - Amort. of 10,000 10,000 10,000 - 0.0% Storm Water Deficit Debt Proceeds 43,800,000 21,170,000 1,400,000 (19,770,000) -93.4% Total Sources 65,288,160 $ 44,280,724 $ 24,879,156 $ (19,401,568) $ -43.8%
Operating Budget: Water Pollution Control 12,493,186 $ 14,170,572 $ 14,861,772 $ 54.2% 691,200 $ 4.9% Public Works 88,314 90,848 94,695 0.3% 3,847 4.2% Non-Departmental 4,363,805 4,650,311 4,758,641 17.3% 108,330 2.3% Debt Service 4,724,634 4,626,307 5,923,882 21.6% 1,297,575 28.0% Total Operating Budget 21,669,939 $ 23,538,038 $ 25,638,990 $ 93.5% 2,100,952 $ 8.9% Capital Budget: Capital Projects 54,100,461 $ 26,082,497 $ 1,701,775 $ 6.2% (24,380,722) $ Transfers: Falls at Crackerneck Creek TIF $ 248,658 $ 92,006 $ 92,006 0.3% - $ n/a Total Uses 76,019,057 $ 49,712,541 $ 27,432,771 $ 100.0% (22,279,770) $ -44.8% $ (14,964,034) $ 9,328,894 $ 6,775,279 $ (2,553,615) -27.37%
Beginning Net Available Resources Ending
Resources Change in non-budgetary Net Available Resources 304
City of Independence, Missouri
2015-16 Operating Budget
Historical Data - Sanitary Sewer Fund
For the Fiscal Years 2009-10 through 2014-15
Net Available Resources
Source: 2009-10 through 2013-14 - Comprehensive Annual Financial Report 2014-15 - Operating Staff projections
Employee Staffing (in Full Time Equivalents)
Utility Statistics
Projected Description 2009-10 2010-11 2011-12 2012-13 2013-14 2014-15 Net Income (Loss) Net Income (Loss) (1,847,364) $ (742,269) $ 764,972 $ (940,921) $ (287,255) $ Capital Contributions 392,710 1,941,161 36,249 32,033Change in Net Assets (1,454,654) $ 1,198,892 $ 801,221 $ (908,888) $ (287,255) $ 1,730,383 $
Net Available ResourcesTotal Current Assets 9,006,699 $ 9,387,357 $ 7,217,768 $ 9,883,146 $ 16,632,063 $ Less: Inventories (59,587) (48,898) (55,221) (57,238) (69,290) Restricted Cash and (339,349) (387,711) (453,786) (471,674) (500,847) Investments Current Liabilities (573,259) (785,452) (2,633,873) (6,049,894) (9,679,748) Carryover Capital Budget (1,791,608) (1,968,000) (265,704) (21,042,497) Appropriations Carryover Outstanding (177,271) (147,073) (148,836) (193,557) (303,715) Encumbrances Net Available Resources 6,065,625 $ 6,050,223 $ 3,660,348 $ 3,110,783 $ (14,964,034) $ 9,328,894 $ Target Working Capital 2,250,000 $ 2,250,000 $ 2,250,000 $ 2,250,000 $ 2,250,000 $ 2,250,000 $
Department: Public Works 1.00 1.00 1.00 1.00 1.00 1.00 Water Pollution Control General Fund 5.00 0.00 0.00 0.00 0.00 0.00 Sanitary Sewer Fund 70.00 70.00 70.00 70.00 70.00 70.00 Storm Water Sales Tax 8.00 13.00 13.00 13.00 13.00 13.00 Total 84.00 84.00 84.00 84.00 84.00 84.00
No. of Residential Customers 40,676 40,579 40,572 40,588 40,927 40,750 No. of Commercial Cust. 3,494 3,483 3,481 3,463 3,418 3,465 Wastewater Treated 3,326 2,515 2,261 2,361 2,124 2,436 (million gallons) 305
City of Independence, Missouri 2015-16 Operating Budget
Revenue Summary
For the Fiscal Years 2013-14 through 2015-16
2015-16 %Chg. Acct. 2013-14 Original Current Adopted Adopted No. Description Actual Budget Estimate Budget to Curr Est. 2014-15 Sanitary Sewer Fund Operating Revenue 30-3109 Construction Permits, Pub.Works 30-4010 Residential 11,329,939 11,626,328 11,380,229 12,308,166 8.2% 30-4110 Commercial Base 4,434,651 4,507,086 4,682,280 4,743,125 1.3% 30-4120 Commercial Surcharge 1,320,644 547,100 1,111,000 491,550 -55.8% 30-4130 Regulatory Compliance Base 3,191,390 4,786,025 4,792,315 4,792,315 30-4430 Contract Services 229,946 197,000 250,000 250,000 30-4570 Intermunicipal Agreements 642,495 600,000 650,000 650,000 30-4600 Other Operating Revenue 231,355 190,000 229,000 229,000 30-4700 Change in Unbilled Revenue 90,879 Total Operating Revenue 21,471,299 22,453,539 23,094,824 23,464,156 1.6% Non-Operating Revenue 30-3411 Interest Income 6,861 6,000 5,900 5,000 -15.3% 30-4900 Other Revenues, Net Total Revenues $21,478,160 $22,459,539 $23,100,724 $23,469,156 1.6% 306
*The average bill is calculated using average water consumption of 600 cubic feet per month. Survey conducted in February, 2015
Average Monthly Utility Bill * Base Rate Volume Charge Belton, Mo. $59.24 $10.25 + $15.33 $1.1219/100 gallons > 1500 rounded winter avg.) Liberty, Mo. $53.24 $11.64 + $1 $11.64/1,000 gallons > 1,000 Kansas City, Mo. $46.60 $15.10 $5.25/100 cubic feet Sugar Creek, Mo $39.64 $15.92 + $9 $3.28/1,000 gallons Raytown, Mo. $36.42 $12.28 $6.92/1000 gallons > 1000 Olathe, Ks. $36.61 $13.81 $3.80/100 cubic feet Kansas City, Ks. $35.69 $15.17 $3.42/100 cubic feet Independence, Mo. $34.60 $11.60 + $9 $2.3333/100 cubic feet Lee's Summit, Mo. $33.62 $12.35 $4.74/1,000 gallons Raymore, Mo. $29.62 none $6.60/1,000 gallons Blue Springs, Mo. $23.72 $6.80 $0.377/100 gallons Grandview, Mo. $20.80 $11.15 $2.15/1,000 gallons
CITY OF INDEPENDENCE, MISSOURI 2015-16 Operating Budget Average Bill/Rate Comparison - Sanitary Sewer Fund
307

308
2015-16 Operating Budget Water Pollution Cont

Appropriations by Type: Expenditure Actual Original Revised Adopted Type 2013-14 2014-15 2014-15 2015-16 Personal Ser. 5,250,284 $ 6,421,822 $ 6,415,622 $ 6,717,600 $ Other Services 7,120,297 8,629,521 8,629,521 8,805,189 Supplies 1,278,086 1,303,617 1,303,617 1,354,014 Capital Outlay 475,930 60,900 67,100 468,185 Other - 10,000 10,000 10,000 Total 14,124,597 $ 16,425,860 $ 16,425,860 $ 17,354,988 $
Actual Actual Actual Actual Budget Budget 2010-11 2011-12 2012-13 2013-14 2014-15 2015-16 Employees: Full Time Equiv. 83.00 83.00 83.00 83.00 83.00 86.20 Amount by Fund: Storm Water Sales Tax 1,502,073 $ 1,561,808 $ 1,651,509 $ 1,631,411 $ 2,255,288 $ 2,493,216 $ Sanitary Sewer Fund 11,161,107 11,216,817 11,518,320 12,493,186 14,170,572 14,861,772 General Fund 296,347 - - - -Total All Funds 12,959,527 $ 12,778,625 $ 13,169,829 $ 14,124,597 $ 16,425,860 $ 17,354,988 $ Comparative Ratios: Per Capita 106.92 $ 109.38 $ 112.73 $ 120.50 $ 140.07 $ 148.03 $ Per Household 239.60 $ 262.17 $ 278.82 $ 286.02 $ 304.28 $ 318.19 $ 38.7% 50.7% 7.8% 2.7% 0.1% 2015-16 Budget Personal Ser. Other Services Supplies Capital Outlay Other 0 5,000 10,000 15,000 20,000 2010-11 2011-12 2012-13 2013-14 2014-15 2015-16 $12,960 $12,779 $13,170 $14,125 $16,426 $17,355 Dollars (1,000's) Fiscal Year 309
Historical Comparison:
310
311
312
313
314
315
316
317
318
319
320
321
322
323
324
325
City of Independence, Missouri
2015-16 Operating Budget
Capital Lease / Debt Service Service Requirements - Sanitary Sewer Fund
Total Debt Service Series Principal Interest Fees Requirements Revenue Bonds (Refunding): Revenue Bonds: 2012 Series B (6240) 785,000 $ 1,489,907 $ 5,000 $ 2,279,907 $ 2013 Series C (6240) 500,000 2,080,650 5,000 2,585,650 2014 Series C (6240) 250,000 803,325 5,000 1,058,325 Total Sanitary Sewer Fund 1,535,000 $ 4,373,882 $ 15,000 $ 5,923,882 $ 326
City of Independence, Missouri
2015-16 Operating Budget
Capital Budget Summary - Sanitary Sewer Fund
Project Number Project Description Source of Funds Amount Sanitary Sewer Collection System Projects70301503 Truman & Crescent to Brookside Sanitary Sewer Fund 200,000 $ Subtotal 200,000 $ Treatment Plant / Pump Station Projects70301504 Security Improvements Sanitary Sewer Fund 75,000 70301505 Sewage Sludge Incinerator Improvements Sanitary Sewer Fund 1,200,000 Subtotal 1,275,000 $ Other70301502 Utility Billing System Sanitary Sewer Fund 226,775 Subtotal 226,775 $ Fund Total 1,701,775 $ 327
2015-16 Operating Budget
Source of Budget Dollars
Water Fund
Allocation of Budget Dollars
Operating Revenues 95% Interest Income 0% Interfund Charges 5% Other Revenues 0%
Capital Budget 13% Water Department 49% NonDepartmental/ Other 21% Debt Service 17%
328
City of Independence, Missouri
2015-16 Operating Budget
Budget Summary Water Fund
For the Fiscal Years 2013-14, 2014-15 and 2015-16
Source of Budget Dollars
Use of Budget Dollars
2015-16 Increase 2014-15 City Council % (Decrease) 2013-14 Current Adopted of Over Last % Description Actual Estimate Budget Total Year Change $ 3,178,328 $ 10,102,437 $ 9,337,144 $ (765,293) 7.58% 5,225,913 2,050,339 (2,050,339)
Estimated RevenuesOperating Revenues 27,545,623 $ 27,600,000 $ 30,200,000 $ 95.3% 2,600,000 $ 9.4% Interest Income 3,532 3,600 3,500 0.0% (100) -2.8% Interfund Charges 1,706,007 1,719,189 1,476,226 4.7% (242,963) -14.1% Other Revenues 65,748 - - 0.0% - n/a Total Estimated Revenues 29,320,910 $ 29,322,789 $ 31,679,726 $ 100.0% 2,356,937 $ 8.0% Bond Issuance ProceedsTotal Sources 29,320,910 $ 29,322,789 $ 31,679,726 $ 2,356,937 $ 8.0%
Operating Budget: Finance 50,369 $ 51,437 $ 51,501 $ 0.2% 64 $ 0.1% Water Department 14,545,488 15,531,913 15,624,836 49.0% 92,923 0.6% Non-Departmental 5,881,752 6,794,159 6,602,387 20.7% (191,772) -2.8% Debt Service 5,543,538 5,527,338 5,474,338 17.2% (53,000) -1.0% Total Operating Budget 26,021,147 $ 27,904,847 $ 27,753,062 $ 87.1% (151,785) $ -0.5% Capital Budget: Capital Projects 1,405,654 $ 4,177,584 $ 4,030,000 $ 12.7% (147,584) $ -3.5% Transfers Out: Falls at Crackerneck Creek TIF 195,912 $ 72,490 $ 72,490 $ - $ 0.0% Total Uses 27,622,714 $ 32,154,921 $ 31,855,552 $ 100.0% (299,369) $ -0.9% $ 10,102,437 $ 9,337,144 $ 9,161,318 $ (175,826) 1.88% Beginning Net Available Resources Change in non-budgetary Net Available Resources Ending Net Available Resources 329
City of Independence, Missouri
2015-16 Operating Budget
Historical Data - Water Fund
For the Fiscal Years 2009-10 through 2014-15
Net Available Resources
Source: 2009-10 through 2013-14 - Comprehensive Annual Financial Report 2014-15 - Operating Staff projections
Employee Staffing (in Full Time Equivalents)
Utility Statistics
Projected Description 2009-10 2010-11 2011-12 2012-13 2013-14 2014-15 Net Income (Loss) Net Income (Loss) (790,043) $ 1,094,610 $ 2,400,675 $ 3,024,455 $ 3,397,977 $ 5,039,498 $ Capital Contributions 977,339 165,315 931,206 145,178 1,948,485 1,442,865 Change in Net Assets 187,296 $ 1,259,925 $ 3,331,881 $ 3,169,633 $ 5,346,462 $ 6,482,363 $
Net Available ResourcesNet Adj. Current Assets 3,417,638 $ 4,906,916 $ 6,864,697 $ 9,843,103 $ 14,390,473 $ 15,679,287 $ Net Adj. Current Liab. (1,003,984) (1,151,768) (683,874) (844,354) (1,060,833) (891,942) Outstanding Operating Enc. (320,207) (340,653) (305,073) (293,593) (483,685) (334,722) Unexpended Capital Appn (10,736,283) (8,152,553) (5,899,576) (5,187,855) (6,077,000) (6,658,424) Capital Amounts to be 7,559,303 4,991,257 3,080,474 1,161,027 4,833,482 3,042,945 expended past 12 months Less Target Reserve Balance (1,500,000) (1,500,000) (1,500,000) (1,500,000) (1,500,000) (1,500,000) Net Available Resources (2,583,533) $ (1,246,801) $ 1,556,648 $ 3,178,328 $ 10,102,437 $ 9,337,144 $
Department: Finance 0.85 0.85 0.85 0.85 0.85 0.85 Water 101.65 101.65 93.65 93.42 92.42 93.42 Total 102.50 102.50 94.50 94.27 93.27 94.27
No. of Residential Customers 44,732 44,619 44,520 44,501 44,617 44,768 No. of Commercial Cust. 3,111 3,102 3,097 3,092 3,099 3,073 No. of Other Customers 475 472 528 528 537 538 Water Pumped 10,117 10,465 10,604 10,715 10,460 10,600 (million gallons) Water Sold 8,609 8,997 9,110 9,375 8,959 9,100 (million gallons) 330
City of Independence, Missouri 2015-16 Operating Budget
Revenue Summary
For the Fiscal Years 2013-14 through 2015-16
2015-16 %Chg. Acct. 2013-14 Original Current Adopted Adopted No. Description Actual Budget Estimate Budget to Curr Est. 2014-15 Water Fund Operating Revenue 40-4010 Residential Sales 13,052,557 13,500,000 13,200,000 14,400,000 9.1% 40-4110 Commercial Sales 3,555,507 4,290,000 3,800,000 4,000,000 5.3% 40-4130 Industrial Sales 769,857 630,000 590,000 800,000 35.6% 40-4400 Public Authority Sales 262,012 280,000 340,000 300,000 -11.8% 40-4410 Private Fire Protection 159,329 170,000 170,000 170,000 40-4420 Public Fire Protection 1,231,475 1,200,000 1,300,000 1,250,000 -3.8% 40-4550 Sales for Resale 8,136,297 8,250,000 7,900,000 8,900,000 12.7% 40-4600 Other Operating Revenue 369,562 380,000 300,000 380,000 26.7% 40-4700 Change in Unbilled Revenue 9,027 Total Operating Revenue 27,545,623 28,700,000 27,600,000 30,200,000 9.4% 40-3421 Interfund Charges 1,706,007 1,719,189 1,719,189 1,476,226 -14.1% 40-3411 Interest Income 3,532 3,500 3,600 3,500 -2.8% 40-3440 Other Revenues, Net 65,748 Total Revenues $29,320,910 $30,422,689 $29,322,789 $31,679,726 8.0% 331
City of Independence, Missouri
2015-16 Operating Budget
Typical Home Water Consumption Rate Comparison - Water Fund
*The typical bill is calculated using an average water consumption amount of 5,236 gallons per month (7 ccf)
Note: Survey conducted in February 2015
City Typical Bill* Kansas City, KS $52.12 Harrisonville, MO $49.62 Raytown, MO $47.49 Belton, MO $47.29 Kansas City, MO $44.54 Grandview, MO $43.23 Raymore, MO $32.85 Overland Park, KS $31.83 Liberty, MO $30.48 Lee's Summit, MO $29.96 Blue Springs, MO $27.93 Sugar Creek, MO $27.79 Independence, MO $27.54 Olathe, KS $26.46
332
WATER DEPARTMENT Water System Director Support Services Supervisor Account Clerk II Safety and Training Officer CUSTOMER SERVICE & ACCOUNTS Customer Service Manager A PRODUCTION Water Production Manager B TRANSMISSION & DISTRIBUTION Water Distribution/Engineer Manager C 333
City of Independence, Missouri Water Department
City of Independence, Missouri Water Department (Continued) A CUSTOMER SERVICE & ACCOUNTS Customer Service Manager Customer Service (2) Customer Service Supervisor I (22) Account Info. Rep. Water Field Services Customer Service Supervisor I (1) Meter Repair Worker (7) Service Worker (1) Utility Clerk 334
City of Independence, Missouri Water Department
* These Employees are funded 4810 -
(Continued)
Administration B PRODUCTION Water Production Manager Engineer III Fiscal Technician II Water Operations Supv. (2) Plant Operator "A" (2) Plant Operator "D" .Laboratory Supervisor (2.50) Lab Technician Production Maintenance Supv. (8) Plant Maintenance Utility Worker (1.25) Laborer C TRANSMISSION & DISTRIBUTION Water Distribution/Engineer Manager (1) Utility Clerk Engineering Technician Supv. * (1) Engineering Tech III* (1.17) Engineering Tech II* (1) Administrative Spec. III* (1) GIS Technician* Maintenance Supervisor (4) Pipeworker (4) Const. Equip. Oper. Maintenance Supervisor (2) Maint. & Util. Worker (2) Leak Repair Worker (1) Service Worker (2) Pipeworker (5.5) Laborer (1) Yard Worker 335
2015-16 Operating Budget Water
Historical Comparison:

Appropriations by Type: Expenditure Actual Original Revised Adopted Type 2013-14 2014-15 2014-15 2015-16 Personal Ser. 6,225,150 $ 7,333,110 $ 7,333,110 $ 7,347,490 $ Other Services 5,588,486 5,696,963 5,676,963 5,769,251 Supplies 2,260,944 2,065,540 2,061,340 2,125,235 Capital Outlay 470,908 436,300 460,500 382,860 Other - - -Total 14,545,488 $ 15,531,913 $ 15,531,913 $ 15,624,836 $
Actual Actual Actual Actual Budget Budget 2010-11 2011-12 2012-13 2013-14 2014-15 2015-16 Employees: Full Time Equiv. 101.65 93.65 93.42 92.42 93.42 93.42 Amount by Fund: Water Fund 13,256,387 $ 12,610,259 $ 13,704,564 $ 14,545,488 $ 15,531,913 $ 15,624,836 $ Total All Funds 13,256,387 $ 12,610,259 $ 13,704,564 $ 14,545,488 $ 15,531,913 $ 15,624,836 $ Comparative Ratios: Per Capita 109.37 $ 107.94 $ 117.30 $ 124.09 $ 132.45 $ 133.27 $ Per Household 245.08 $ 258.71 $ 290.14 $ 294.54 $ 287.72 $ 286.47 $ 47.0% 36.9% 13.6% 2.5% 0.0% 2015-16 Budget Personal Ser. Other Services Supplies Capital Outlay Other 0 5,000 10,000 15,000 20,000 2010-11 2011-12 2012-13 2013-14 2014-15 2015-16 $13,256 $12,610 $13,705 $14,545 $15,532 $15,625 Dollars (1,000's) Fiscal Year 336
337
338
339
340
341
342
343
344
345
346
347
City of Independence, Missouri 2015-16 Operating Budget
Capital Lease/Debt Service Requirements - Water Fund
Total Debt Service Series Principal Interest Fees Requirements Revenue Bonds: 2013 Series D (6352) 4,260,000 1,206,338 8,000 5,474,338 Fund Total 4,260,000 $ 1,206,338 $ 8,000 $ 5,474,338 $ 348
City of Independence, Missouri
2015-16 Operating Budget
Capital Budget Summary - Water Fund
Project Number Project Description Source of Funds Amount 9749 Main Replacement Water Fund $ 200,000 70401304 Sludge House Roofs Replacement Water Fund 30,000 70401402 Lagoon Cleanout Water Fund 90,000 70401501 35th Street Reservoir Water Fund 2,000,000 70401502 Utility Billing System Replacement Water Fund 500,000 70401503 Building Improvements Water Fund 500,000 70401504 Northern Blvd. (28th to 31st) Water Fund 350,000 70401505 Distribution System Improvements Water Fund 150,000 70401506 Truman Road Booster Station Upgrades Water Fund 100,000 70401507 Operations Building Improvements Water Fund 60,000 70401508 Transmission Main Cathodic Protection System Water Fund 50,000 Fund Total 4,030,000 $ 349
Source of Budget Dollars
Allocation of Budget Dollars
Transient Guest Taxes 96% Other Income 4%
2015-16 Operating Budget Tourism Fund
Tourism 73% Nat'l Frontier Trails Museum 27%
350
City of Independence, Missouri
2015-16 Operating Budget
Budget Summary - Tourism Fund
Source of Budget Dollars
Use of Budget Dollars
Increase 2014-15 2015-16 % (Decrease) 2013-14 Current City Council of Over Last % Description Actual Estimate Adopted Total Year Change
For the Fiscal Years 2013-14, 2014-15 and 2015-16
794,799 $ 585,689 $ 335,136 $ (250,553) $ -42.78% Transfer from Fund Balance - n/a Designations Estimated RevenuesTransient Guest Taxes 1,468,758 $ 1,550,000 $ 1,800,000 $ 96.3% 250,000 $ 16.1% Interest 208 85 200 0.0% 115 135.3% Federal & State Grants 58,300 - - 0.0% - n/a Misc. Non-Operating Revenue - 28,000 28,000 1.5% - 0.0% Other Income 5,915 - 40,000 2.1% 40,000 n/a Total Estimated Revenues 1,533,181 $ 1,578,085 $ 1,868,200 $ 100.0% 290,115 $ 18.4% Total Sources 2,327,980 $ 2,163,774 $ 2,203,336 $ 39,562 $
Operating Budget: Tourism 1,455,328 $ 1,681,267 $ 1,356,399 $ 73.3% (324,868) $ -19.3% Nat'l Frontier Trails Museum 80,775 495,194 26.7% 414,419 513.1% Historic Sites Capital Improv. - 0.0% - n/a Total Operating Budget 1,455,328 $ 1,762,042 $ 1,851,593 $ 100.0% 89,551 $ 5.1% Total Uses 1,455,328 $ 1,762,042 $ 1,851,593 $ 89,551 $ Changes in Fund Balance Operating Transfer Out (286,963) (66,596) 585,689 $ 335,136 $ 351,743 $ 16,607 $ 4.96% Beginning Restricted Fund Balance Ending Restricted Fund Balance 351
City of Independence, Missouri 2015-16
Operating Budget
Fund Balance Summary - Tourism Fund For the Fiscal Years 2009-10 through 2014-15
Fund Balance Components
*based on 25% (3 months) of Annual Revenues (compared to Undesignated Fund Balance)
Source: Audited Annual Financial Statement for actual amounts Estimated based on current year projections
Restricted Projected Fund Balance for 2015-16
Actual Actual Actual Actual Actual Projected Description 6/30/2010 6/30/2011 6/30/2012 6/30/2013 6/30/2014 6/30/2015
Reserved for: Encumbrances Restricted for: Encumbrances 59,485 $ 38,535 $ - $ - $ - $ - $ Visitor Orientation Center 753,987 753,987 503,987 118,037 146,180NFTM Complex Development - - 168,560 81,060 44,597Unprogrammed Tourism Fund Purposes 735,512 550,918 237,258 595,702 394,912 335,136 Total Fund Balance 1,548,984 $ 1,343,440 $ 909,805 $ 794,799 $ 585,689 $ 335,136 $ Fund Balance Target * 311,310 306,867 331,910 360,297 367,190 385,043 Actual over (under) Target 424,202 244,051 (94,652) 235,405 27,723 (49,907)
Unprogrammed Tourism Fund Balance at June 30, 2015 (Projected) 335,136 $ Transfers from Other Fund Balance Components: Fund Balance Uses for 2015-16 16,607 ** Projected Unprogrammed Tourism Fund Balance at June 30, 2016 351,743 $ Plus Restricted Fund Balance Components: Visitor Orientation CenterNFTM Complex DevelopmentProjected Restricted Tourism Fund Balance at June 30, 2016 351,743 $ ** Projected Unprogrammed Tourism Fund Balance Target 467,050 $
352
Social Media / Group Sales Specialist
National Frontier Trails Museum
City of Independence, Missouri Tourism City Manager TOURISM Tourism and Marketing Director Tourism & Volunteer Coordinator Visitor Center Attendant Tourism Specialist Tourism Services Specialist (0.18) Public Management Intern I
353
Events/Education Program Manager Convention Services Manager
2015-16 Operating Budget Tourism
Fiscal Year

Appropriations by Type: Expenditure Actual Original Revised Adopted Type 2013-14 2014-15 2014-15 2015-16 Personal Ser. 467,267 $ 577,426 $ 577,426 $ 692,379 $ Other Services 849,602 777,702 773,810 967,710 Supplies 165,100 42,500 42,500 41,504 Capital Outlay 794 2,500 6,392 150,000 Other - - -Total 1,482,763 $ 1,400,128 $ 1,400,128 $ 1,851,593 $
Actual Actual Actual Actual Budget Budget 2010-11 2011-12 2012-13 2013-14 2014-15 2015-16 Employees: Full Time Equiv. 4.41 4.66 4.66 5.66 8.18 14.18 Amount by Fund: Tourism Fund 1,413,604 $ 1,734,251 $ 1,551,913 $ 1,482,763 $ 1,400,128 $ 1,851,593 $ Total All Funds 1,413,604 $ 1,734,251 $ 1,551,913 $ 1,482,763 $ 1,400,128 $ 1,851,593 $ Comparative Ratios: Per Capita 11.66 $ 14.84 $ 13.28 $ 12.65 $ 11.94 $ 15.79 $ Per Household 26.13 $ 35.58 $ 32.86 $ 30.03 $ 25.94 $ 33.95 $ 37.4% 52.3% 2.2% 8.1% 0.0% 2015-16 Budget Personal Ser. Other Services Supplies Capital Outlay Other 0 500 1,000 1,500 2,000 2010-11 2011-12 2012-13 2013-14 2014-15 2015-16 $1,414 $1,734 $1,552 $1,483 $1,400 $1,852 Dollars (1,000's)
Historical Comparison:
354
355
356
357
358
359
360
361
362
City of Independence, Missouri
2015-16 Operating Budget
Budget Summary - Street Improvements Sales Tax Fund
For the Fiscal Years 2013-14, 2014-15 and 2015-16
Source of Budget Dollars
Use of Budget Dollars
Note 1) The Street Improvements Sales Tax was approved by Independence voters August 2002 and went into effect on January 1, 2004. The tax was renewed in August 2007 for the time period January 1, 2009 to December 31, 2019 at a rate of 1/2 of one percent of the local option sales tax.
2015-16 Increase 2014-15 City Council % (Decrease) 2013-14 Current Adopted of Over Last % Description Actual Estimate Budget Total Year Change
2,846,198 $ 3,716,655 $ 137,190 $ (3,579,465) $ 96.31% Estimated RevenuesSales Taxes 7,767,525 $ 7,842,056 $ 7,996,718 $ 100.0% 154,662 $ 2.0% Interest Income and Other 50,781 85,600 900 0.0% (84,700) -98.9% Total Estimated Revenues 7,818,306 $ 7,927,656 $ 7,997,618 $ 100.0% 69,962 $ 0.9% Proceeds from Debt Issuance - $ - $ - $ - $ Total Sources 10,664,504 $ 11,644,311 $ 8,134,808 $ (3,509,503) $
Operating Budget Public Works 299,629 $ 279,759 $ 265,323 $ 3.3% (14,436) $ Debt Service 530,569 529,831 532,694 6.5% 2,863 0.5% Total Operating Budget 830,198 $ 809,590 $ 798,017 $ 9.8% (11,573) $ Capital Budget: Overlay Program 4,185,362 $ 6,105,144 $ 5,498,591 $ 67.6% (606,553) $ -9.9% Bridge Improvements 555,121 588,918 - 0.0% (588,918) 0.0% Street Improvements 1,191,980 1,883,910 1,270,000 15.6% (613,910) Intersection Improvements 47,076 406,209 - 0.0% (406,209) 0.0% Safety Improvements 59,570 1,341,919 390,000 4.8% (951,919) 0.0% Other Programs - 165,000 2.0% 165,000 Total Capital Budget 6,039,108 $ 10,326,100 $ 7,323,591 $ 90.0% (3,002,510) $ Other Financing Sources: Santa Fe TIF 12,049 $ 13,200 $ 13,200 $ 0.2% - $ 0.0% Capital Project Transfers 66,494 $ 358,231 $ Total Uses 6,947,849 $ 11,507,121 $ 8,134,808 $ (3,372,314) $ 3,716,655 $ 137,190 $ 0 (137,190) $ -100.00%
Beginning
Balance Ending Fund Balance 363
Fund
City of Independence, Missouri 2015-16 Operating Budget
Fund Balance Summary - Street Improvements Sales Tax Fund
For the Fiscal Years 2009-10 through 2014-15
Fund Balance Components
Source: Audited Annual Financial Statement for actual amounts March 31, 2015 monthly Financial and Operating Report for projected amounts
Actual Actual Actual Actual Actual Projected Description 6/30/2010 6/30/2011 6/30/2012 6/30/2013 6/30/2014 6/30/2015
Restricted for: Encumbrances 1,134,962 $ - $ - $ - $ - $ - $ Other Purposes 10,417 - -Unprogrammed Street Improv. Sales Tax Fund Purposes (610,063) 2,491,735 4,567,570 2,846,198 3,716,655 137,190 Total Fund Balance 535,316 $ 2,491,735 $ 4,567,570 $ 2,846,198 $ 3,716,655 $ 137,190 $
364
City of Independence, Missouri
2015-16 Operating Budget
Capital Budget Summary - Street Improvements Sales Tax Fund
Project Number Project Description Source of Funds Amount Street Improvements: Overlay 70111501 2015-16 Overlay Program Street Improv. Sales Tax 5,498,591 $ Total Overlay 5,498,591 $ Street Improvements 70110806 Whitetopping Program Street Improv. Sales Tax 300,000 $ 70111103 Alley Rehabilitation Street Improv. Sales Tax 100,000 70111301 Truman Gateway Street Improv. Sales Tax 70,000 70111307 78 Highway and Truman Street Improv. Sales Tax 600,000 70111402 Crysler Complete Streets Street Improv. Sales Tax 200,000 Total Street Improvements 1,270,000 $ Safety Improvements 70110409 Operation Green Light Street Improv. Sales Tax 40,000 $ 70110807 Sidewalks to City Parks Improvements Street Improv. Sales Tax 150,000 70110808 Sidewalks to Schools Improvements Street Improv. Sales Tax 200,000 Total Safety Improvements 390,000 $ Other Programs 70511001 Delaware Streetscape Street Improv. Sales Tax 45,000 $ 70511002 Winner Road Streetscape Street Improv. Sales Tax 120,000 Total Other Programs 165,000 $ Fund Total 7,323,591 $ 365
City of Independence, Missouri
2015-16 Operating Budget
Budget Summary - Park Improvements Sales Tax Fund
For the Fiscal Years 2013-14, 2014-15 and 2015-16
Source of Budget Dollars
Beginning Fund Balance
Use of Budget Dollars
Ending Fund Balance
Note 1) The Park Improvements Sales Tax was approved by Independence voters August 2002 and went into effect on January 1, 2004. The tax rate of 1/4 of one percent of local option sales was renewed August 2010 and will be in effect until repealed.
Note 2) The above negative Fund Balance amounts reflect authorized appropriations for multi-year projects where the actual cash disbursement will occur in subsequent fiscal years and will be paid from future sales tax receipts. Staff continually monitors the cash flow on these projects to assure that cash is available at the time needed to pay for project expenses and that the timing for initiating the projects is handled in such a way that projects are not started without a cash flow plan in hand to pay for project expenses as they occur.
2015-16 Increase 2014-15 City Council % (Decrease) 2013-14 Current Adopted of Over Last % Description Actual Estimate Budget Total Year Change
(6,382,130) $ (4,984,064) $ (5,327,848) $ (343,784) $ -6.90% Estimated RevenuesSales Taxes 3,884,655 $ 3,921,028 $ 3,998,359 $ 87.4% 77,331 $ 2.0% Adventure Oasis Water Park 284,910 480,000 440,000 9.6% (40,000) -8.3% Interest Income and Other 117,813 126,000 136,000 3.0% 10,000 7.9% 0 Total Estimated Revenues 4,287,378 $ 4,527,028 $ 4,574,359 $ 47,331 $ 1.0% Proceeds from Debt Issuance 96,126 - $ - $ Capital Project Transfers - - - $Total Sources (1,998,626) $ (457,036) $ (753,489) $ (296,453) $
Operating Budget: 6041-Security & Inspection 670,257 $ 706,672 $ 687,249 $ 22.7% (19,423) $ -2.7% 6042-Truman Memorial Bldg. 276,218 251,119 314,945 10.4% 63,826 25.4% 6043-Palmer Senior Adult 143,955 162,245 214,334 7.1% 52,089 32.1% Center 6044-Family Recreation 216,382 236,860 164,853 5.5% (72,007) -30.4% Programs - 0.0% 6045-Adventure Oasis Water 567,589 791,043 558,602 18.5% (232,441) -29.4% Park6046 - Sports Complex 500,659 662,488 639,980 21.2% (22,508) -3.4% Total Operating Budget 2,375,061 2,810,427 2,579,963 (230,464) Debt Service 115,726 - - 0.0% - n/a Total Operating Budget 2,490,787 $ 2,810,427 $ 2,579,963 $ 85.4% (230,464) $ -8.2% Capital Budget: Capital Projects 488,626 $ 2,053,585 $ 435,000 14.4% (1,618,585) -78.8% Total Capital Budget 488,626 $ 2,053,585 $ 435,000 $ Operating Transfers: Santa Fe TIF 6,025 6,800 7,000 0.2% 200 Total Uses 2,985,438 $ 4,870,812 $ 3,021,963 $ 100.0% (1,848,849) $ -38.0% (4,984,064) $ (5,327,848) $ (3,775,452) $ 1,552,396 $ 29.14%
366
City of Independence, Missouri
2015-16 Operating Budget
Fund Balance Summary - Parks and Recreation Improvements Sales Tax Fund
For the Fiscal Years 2009-10 through 2014-15
Fund Balance Components
Source: Audited Annual Financial Statement for actual amounts March 31, 2015 monthly Financial and Operating Report for projected amounts
Actual Actual Actual Actual Actual Projected Description 6/30/2010 6/30/2011 6/30/2011 6/30/2013 6/30/2014 6/30/2015
Restricted for: Encumbrances 317,770 $ - $ - $ - $ - $ - $ Other Purposes - - - - -Unprogrammed Parks Improv. Sales Tax Fund Purposes (5,062,228) (5,006,608) (5,793,401) (6,382,130) (4,984,064) (5,327,848) Total Fund Balance (4,744,458)$ (5,006,608)$ (5,793,401)$ (6,382,130)$ (4,984,064)$ (5,327,848)$
367
City of Independence, Missouri 2015-16 Operating Budget
Capital Budget Summary - Park Improv. Sales Tax Fund
Project Number Project Description Source of Funds Amount 9719 Athletic Fields and Court Renovations Park Improv. Sales Tax 175,000 $ 9723 Walking Trails and Bicycle Paths Park Improv. Sales Tax 25,000 9970 Park Revitalization Park Improv. Sales Tax 200,000 9971 Park Maintenance- Mobile Equipment Park Improv. Sales Tax 35,000 Fund Total 435,000 $ 368
City of Independence, Missouri
2015-16 Operating Budget
Budget Summary - Storm Water Sales Tax Fund For
Source of Budget Dollars
Beginning Fund Balance
Use of Budget Dollars
Note 1) The Storm Water Improvements Sales Tax was approved by Independence voters on August 3, 2010 and went into effect on January 1, 2011. The tax rate of 1/4 of one percent of local option sales tax and will be in effect until repealed.
2013-14, 2014-15
2015-16 Increase 2014-15 City Council % (Decrease) 2013-14 Current Adopted of Over Last % Description Actual Estimate Budget Total Year Change
the Fiscal Years
and 2015-16
7,405,051 $ 8,358,432 $ 1,958,386 $ (6,400,046) $ -76.57% Estimated RevenuesSales Taxes 3,884,641 $ 3,921,028 $ 3,998,359 $ 99.9% 77,331 $ 2.0% Grants and Shared Revenue - - - 0.0%Interest Income and Other 31,826 1,750 3,000 0.1% 1,250 71.4% Total Estimated Revenues 3,916,467 $ 3,922,778 $ 4,001,359 $ 100.0% 78,581 $ 2.0% Other Sources - -Total Sources 11,321,518 $ 12,281,210 $ 5,959,745 $ (6,321,465) $
Operating Budget: Storm Water Administration 157,254 $ 339,590 $ 302,237 $ 5.1% (37,353) $ -11.0% Storm Water Maintenance 1,094,586 1,667,910 1,822,754 30.6% 154,844 9.3% Storm Water Permit 428,917 349,301 361,425 6.1% 12,124 3.5% Compliance Total Operating Budget 1,680,757 $ 2,356,801 $ 2,486,416 $ 41.7% 129,615 $ 5.5% Capital Budget: Capital Projects 925,221 $ 7,231,763 $ 1,555,000 $ 26.1% (5,676,763) $ -78.5% $ Total Capital Budget 925,221 $ 7,231,763 $ 1,555,000 $ (5,676,763) $ Operating Transfers: Santa Fe TIF Transfer 6,025 $ 6,800 $ 6,800 $ 0.1%Falls at Crackerneck Creek 351,083 722,565 691,083 11.6% (31,482) Capital Project Transfers - 4,895 - (4,895) Total Transfers 357,108 $ 734,260 $ 697,883 $ (36,377) $ Total Uses 2,963,086 $ 10,322,824 $ 4,739,299 $ 100.0% (5,583,525) $ 8,358,432 $ 1,958,386 $ 1,220,446 $ (737,940) $ 37.68%
Ending Fund Balance 369
City of Independence, Missouri
2015-16 Operating Budget
Fund Balance Summary - Stormwater Improvements Sales Tax Fund
For the Fiscal Years 2009-10 through 2014-15
Fund Balance Components
Source: Audited Annual Financial Statement for actual amounts March 31, 2015 monthly Financial and Operating Report for projected amounts
Actual Actual Actual Actual Actual Projected Description 6/30/2010 6/30/2011 6/30/2012 6/30/2013 6/30/2014 6/30/2015
Restricted for: Encumbrances 1,924,019 $ - $ - $ - $ Emergency Response -Detention Basin Const. -Detention Basin Maint. -Unprogrammed Stormwater Improv. -Sales Tax Fund Purposes 7,014,972 7,257,027 6,568,453 7,405,051 8,358,432 1,958,386 Total Fund Balance 8,938,991 $ 7,257,027 $ 6,568,453 $ 7,405,051 $ 8,358,432 $ 1,958,386 $
370
City of Independence, Missouri 2015-16
Operating Budget
Capital Budget Summary - Storm Water Sales Tax Fund
Project Number Project Description Source of Funds Amount 70131504 Drumm to Crane Storm Water Sales Tax $ 60,000 70131501 Rock Creek Neighborhood Projects Storm Water Sales Tax 450,000 70131502 N. Kiger at Frederick Storm Water Sales Tax 220,000 70131503 Sugar Creek - 15th & Sterling, Waldo & Harris Storm Water Sales Tax 100,000 70131402 Liberty & Stone Storm Water Sales Tax 400,000 70130509 Detention Basin Revegetation Storm Water Sales Tax 75,000 70130508 Trenchless Technology Storm Water Sales Tax 100,000 9814 Neighborhood Construction Projects Storm Water Sales Tax 100,000 70130510 Watershed Systems Evaluation Survey Storm Water Sales Tax 50,000 Fund Total 1,555,000 $ 371
City of Independence, Missouri
2015-16 Operating Budget
Budget Summary - Police Public Safety Sales Tax Fund
For the Fiscal Years 2013-14, 2014-15 and 2015-16
Source of Budget Dollars
Beginning Fund Balance
Use of Budget Dollars
2015-16 Increase 2014-15 City Council % (Decrease) 2013-14 Current Adopted of Over Last % Description Actual Estimate Budget Total Year Change
2,317,625 $ 2,356,260 $ 61,116 $ (2,295,144) $ -97.41% Estimated RevenuesSales Taxes 2,069,621 $ 2,095,596 $ 2,136,926 $ 100.0% 41,330 $ 2.0% Interest Income and Other 104,478 47,818 900 0.0% (46,918) -98.1% Total Estimated Revenues 2,174,099 $ 2,143,414 $ 2,137,826 $ 100.0% (5,588) $ -0.3% Proceeds from Debt Issue - -Total Sources 4,491,724 $ 4,499,674 $ 2,198,942 $ (2,300,732) $
Operating Budget: Police Department: Communications 260,905 $ 346,760 $ 351,944 $ 16.9% 5,184 $ 1.5% Facilities 114,758 2,255,462 569,000 27.3% (1,686,462) -74.8% Equipment 1,241,751 1,314,473 1,163,489 55.7% (150,984) -11.5% Total Police Department 1,617,414 $ 3,916,695 $ 2,084,433 $ 99.8% (1,832,262) $ Debt Service 515,038 513,863 - 0.0% (513,863) -100.0% Total Operating Budget 2,132,452 $ 4,430,558 $ 2,084,433 $ 99.8% (2,346,125) $ -53.0% Capital Budget: Capital Projects - - - 0.0%Operating Transfers: Santa Fe TIF 3,012 $ 3,300 $ 3,300 $ 0.2%Capital Project Transfers 4,700 $ 0.0% (4,700) Total Uses 2,135,464 $ 4,438,558 $ 2,087,733 $ 100.0% (2,350,825) $ 2,356,260 $ 61,116 $ 111,209 $ 50,093 $ 81.96%
Note 1) The Police Public Safety Sales Tax was approved by Independence voters on August 3, 2004 and went into effect on January 1, 2005. The rate of 1/8 of one percent of local option sales tax will expire on December 31, 2016. Ending Fund Balance 372
City of Independence, Missouri
2015-16 Operating Budget
Fund Balance Summary - Police Public Safety Sales Tax Fund
For the Fiscal Years 2009-10 through 2014-15
Fund Balance Components
Source: Audited Annual Financial Statement for actual amounts March 31, 2015 monthly Financial and Operating Report for projected amounts
Actual Actual Actual Actual Actual Projected Description 6/30/2010 6/30/2011 6/30/2012 6/30/2013 6/30/2014 6/30/2015
Restricted for: Encumbrances 558,215 $ - $ - $ - $ - $ - $ Debt Service Unprogrammed Police Sales Tax Fund Purposes 1,341,871 1,967,871 2,161,900 2,317,625 2,356,260 61,116 Total Fund Balance 1,900,086 $ 1,967,871 $ 2,161,900 $ 2,317,625 $ 2,356,260 $ 61,116 $
373
City of Independence, Missouri
2015-16 Operating Budget
Budget Summary - Fire Public Safety Sales Tax Fund
For the Fiscal Years 2013-14, 2014-15 and 2015-16
Source of Budget Dollars
Use of Budget Dollars
Note 1) The Fire Public Safety Sales Tax was approved by Independence voters on August 3, 2004 and went into effect on January 1, 2005. The rate of 1/4 of one percent of local option sales tax dropped to 1/8 of one percent on January 1, 2009 and will expire on December 31, 2016.
2015-16 Increase 2014-15 City Council % (Decrease) 2013-14 Current Adopted of Over Last % Description Actual Estimate Budget Total Year Change
2,323,101 $ 896,496 $ 778,360 $ (118,136) $ -13.18% Estimated RevenuesSales Taxes 1,943,700 $ 1,964,165 $ 2,002,902 $ 100.0% 38,737 $ 2.0% Interest Income and Other 15,517 200 800 0.0% 600 300.0% Total Estimated Revenues 1,959,217 $ 1,964,365 $ 2,003,702 $ 100.0% 39,337 $ 2.0% Proceeds from Debt IssuanceTotal Sources 4,282,318 $ 2,860,861 $ 2,782,062 $ (2,860,861) $
Operating Budget: Fire Department: Operations 337,565 $ 620,408 $ 587,775 $ 30.2% (32,633) $ -5.3% Vehicles 1,900,910 596,476 1,060,000 54.4% 463,524 77.7% Repair Fire Stations 414,874 169,500 165,000 8.5% (4,500) -2.7% Tools and Equipment 140,146 131,762 130,500 6.7% (1,262) -1.0% Total Fire Department 2,793,495 $ 1,518,146 $ 1,943,275 $ 99.8% 425,129 $ Debt Service 587,891 555,963 - 0.0% (555,963) -100.0% Total Operating Budget 3,381,386 $ 2,074,109 $ 1,943,275 $ 99.8% (130,834) $ -6.3% Capital Budget: Capital Projects - $ - $ - $ 0.0% - $ n/a Total Capital Budget - $ - $ - $ - $ Operating Transfers: Santa Fe TIF 4,437 3,300 4,000 0.2% 700 21.2% Capital Project Transfers 5,092 Total Uses 3,385,822 $ 2,082,501 $ 1,947,275 $ 100.0% (135,226) $ 896,496 $ 778,360 $ 834,787 $ 56,427 $ 7.25%
Beginning Fund Balance Ending Fund Balance 374
City of Independence, Missouri
2015-16 Operating Budget
Fund Balance Summary - Fire Public Safety Sales Tax Fund
For the Fiscal Years 2009-10 through 2014-15
Fund Balance Components
Source: Audited Annual Financial Statement for actual amounts March 31, 2015 monthly Financial and Operating Report for projected amounts
Actual Actual Actual Actual Actual Projected Description 6/30/2010 6/30/2011 6/30/2012 6/30/2013 6/30/2014 6/30/2015
Restricted for: Encumbrances 181,454 $ - $ - $ - $ - $ - $ Debt Service Unprogrammed Fire Sales Tax Fund Purposes 1,250,669 810,193 1,846,225 2,323,101 896,496 778,360 Total Fund Balance 1,432,123 $ 810,193 $ 1,846,225 $ 2,323,101 $ 896,496 $ 778,360 $
375
Source of Budget Dollars
Use of Budget Dollars
Note 1) This fund was created during the 2003-04 fiscal year.
Note 2) The above listed appropriations are for planning purposes only. Due to varying time frames and the uncertainty of renewal, actual appropriations will be approved by City Council action as each grant is renewed.
City of Independence, Missouri 2015-16 Operating Budget
2013-14,
Increase 2014-15 % (Decrease) 2013-14 Current of Over Last % Description Actual Estimate 2015-16 City Council Adopted Budget Total Year Change
Budget Summary - Grants Fund For the Fiscal Years
2014-15 and 2015-16
Estimated RevenuesGrants and Shared Revenue 3,939,147 $ 3,380,574 $ 847,104 $ 73.3% (2,533,470) $ -74.9% Charges for Current Services 232,877 - 308,540 26.7% 308,540 n/a Interest Income and Other 540,444 80,380 - 0.0% (80,380) n/a Total Estimated Revenues 4,712,468 $ 3,460,954 $ 1,155,644 $ 100.0% (2,305,310) $ -66.6% Total Sources 4,712,468 $ 3,460,954 $ 1,155,644 $ (2,305,310) $ -66.6%
Operating Budget: Law Department 16,190 $ 49,811 $ 31,944 $ 2.8% (17,867) $ -35.9% Human Resources - 387 - 0.0% (387) $ -100.0% Community Development 1,732,607 713,119 209,000 18.1% (504,119) Police Department 1,313,416 1,275,269 404,663 35.0% (870,606) -68.3% Fire Department 441,030 438,298 82,808 7.2% (355,490) -81.1% Health Department 777,709 979,292 427,229 37.0% (552,063) -56.4% Public Works 7,000 - - 0.0%Parks & Recreation 424,516 4,778 - 0.0% (4,778) Total Operating Budget 4,712,468 $ 3,460,954 $ 1,155,644 $ 100.0% (2,305,310) $ -66.6% Total Uses 4,712,468 $ 3,460,954 $ 1,155,644 $ 100.0% (2,305,310) $ -66.6% Balance Available - $ - $ - $ - $
376
City of Independence, Missouri 2015-16 Operating Budget
Budget Summary - Other Funds
For the Fiscal Year 2015-16
Source of Budget Dollars
Allocation of Budget Dollars
Note 1) Each of these funds are intended to be "zero balance" funds whereby the total sources and allocations equal each other.
Community Development HOME Worker's Block Grant Program Compensation Description Fund Fund Fund
Estimated RevenuesFederal Grant - CDBG 759,326 $ HOME Program Grant 308,121 $ Worker's Compensation 2,635,000 $ Total Estimated Revenues 759,326 $ 308,121 $ 2,635,000 $ Proceeds from Debt Service - $ - $ - $ Total Sources 759,326 $ 308,121 $ 2,635,000 $
Operating DepartmentsLaw 2,558,484 $ Community Development 151,865 $ 30,812 $ Total Operating Departments 151,865 $ 30,812 $ 2,558,484 $ Grant Authorized Programming Community Dev. Block Grant 607,461 277,309 Home Program Total Allocations 759,326 $ 308,121 $ 2,558,484 $ Balance Available - $ - $ 76,516 $ (see Note 1) (see Note 1) (see Note 1)
Premiums 377
City of Independence, Missouri
2015-16 Operating Budget
Budget Summary - Internal Service Funds
For the Fiscal Year 2015-16
Source of Budget Dollars
Allocation of Budget Dollars
(see Note 1) (see Notes 1 & 2)
Each of these funds are intended to be "zero balance" funds whereby the total sources and allocations equal This Internal Service fund represents activity for the City's self funded employee health insurance program. Because it is operated as an "Insurance" type fund, sometimes it has either a positive or negative Balance Available which represents planned changes.
Central Staywell Garage Healthcare Description Fund Fund
Estimated RevenuesCentral Garage Charges 2,316,090 $ Staywell Healthcare Premiums 22,509,576 $ Premiums Total Estimated Revenues 2,316,090 $ 22,509,576 $ Total Sources 2,316,090 $ 22,509,576 $
Operating DepartmentsPublic Works 2,316,090 $ Non-Departmental 22,509,576 Total Operating Departments 2,316,090 $ 22,509,576 $ Total Allocations 2,316,090 $ 22,509,576 $
Available
$
$
Balance
-
-
Note 1) Note 2) Pharmacy Benefit 378
City of Independence, Missouri 2015-16 Operating Budget
Revenue Summary
For the Fiscal Years 2013-14 through 2015-16
2015-16 %Chg. Acct. 2013-14 Original Current Adopted Adopted No. Description Actual Budget Estimate Budget to Curr Est. 2014-15 Tourism Fund 4-3043 Transient Guest Tax 1,468,758 1,400,000 1,550,000 1,800,000 16.1% 4-3413 Interest and Penalties 4-3219 Federal Grant - Other 4-3250 State Grant - Other 58,300 4-3331 NFTM-Admissions 40,000 4-3398 Miscellaneous Charges 4-3411 Interest Income 208 200 85 200 135.3% 4-3449 Misc. Non-Operating Revenue 5,915 3,000 28,000 28,000 Total Revenues $1,533,181 $1,403,200 $1,578,085 $1,868,200 18.4%
11-3041 Sales Tax 7,767,525 7,957,701 7,842,056 7,996,718 2.0% 11-3279 Other Misc. Grants 11-3398 Miscellaneous Charges 11-3411 Interest 781 900 600 900 50.0% 11-3449 Misc. Non-Operating Revenue 50,000 85,000 -100.0% Total Revenues $7,818,307 $7,958,601 $7,927,656 $7,997,618 0.9%
Improvements Sales
12-3041 Sales Tax 3,884,655 3,978,851 3,921,028 3,998,359 2.0% 12-3321 Atheletic Fees 3,607 12-3322 Program Fees 40,776 50,000 50,000 50,000 12-3323 Concessions 17,536 32,000 32,000 32,000 12-3326 Water Park Fees/Memberships 284,911 480,000 480,000 440,000 -8.3% 12-3327 Center Fees/Club Memberships 12,189 9,000 9,000 6,000 -33.3% 12-3329 Facility Rentals 47,343 35,000 35,000 48,000 37.1% 12-3411 Interest 12-3449 Misc. Non-Operating Revenue 52 Total Revenues $4,291,069 $4,584,851 $4,527,028 $4,574,359 1.0% Storm Water Improvements Sales Tax Fund 13-3041 Sales Tax 3,884,641 3,978,851 3,921,028 3,998,359 2.0% 13-3250 Other State Grants 13-3411 Interest 3,169 3,000 1,750 3,000 71.4% 13-3435 Contributions 18,591 13-3449 Misc. Non-Operating Revenue 10,067 Total Revenues $3,916,467 $3,981,851 $3,922,778 $4,001,359 2.0% 379
Street Improvements Sales Tax Fund
Parks
Tax Fund
City of Independence, Missouri 2015-16 Operating Budget
Revenue Summary
For the Fiscal Years 2013-14 through 2015-16
2015-16 %Chg. Acct. 2013-14 Original Current Proposed Adopted No. Description Actual Budget Estimate Budget to Curr Est. 2014-15 Police Sales Tax Fund 16-3041 Sales Tax 2,069,621 2,126,514 2,095,596 2,136,926 2.0% 16-3411 Interest 845 900 425 900 111.8% 16-3449 Misc. Non-Operating Revenue 103,633 47,393 -100.0% Total Revenues $2,174,099 $2,127,414 $2,143,414 $2,137,826 -0.3% Fire Sales Tax Fund 17-3041 Sales Tax 1,943,700 1,989,425 1,964,165 2,002,902 2.0% 17-3411 Interest 605 800 200 800 300.0% 17-3449 Misc. Non-Operating Revenue 14,912 Total Revenues $1,959,217 $1,990,225 $1,964,365 $2,003,702 2.0% License Surcharge (Excise Tax) Fund 14-3108 License Tax 190,652 150,000 150,000 175,000 16.7% 14-3411 Interest 589 300 200 300 50.0% Total Revenues $191,241 $150,300 $150,200 $175,300 16.7% Community Development Block
8-3204 Federal Grant - CDBG 540,579 750,000 766,000 759,326 -0.9% 8-3449 Misc. Non-Operating Revenue Total Revenues $540,579 $750,000 $766,000 $759,326 -0.9% HOME Program Fund 9-3209 HOME Program Grant 707,436 300,000 339,000 308,121 -9.1% 9-3411 Interest Income Total Revenues $707,436 $300,000 $339,000 $308,121 -9.1% Grants Fund 15-3210 Emergency Mgmt. Assist. 171,704 79,668 130,000 82,808 -36.3% 15-3211 Public Health Nursing 199,606 192,686 200,000 215,479 7.7% 15-3218 Dial-A-Ride 15-3219 Other Federal Grants 3,386,951 749,742 1,425,000 462,494 -67.5% 15-3250 Other State Grants 155,167 77,602 71,000 80,323 13.1% 15-3279 Other Misc. Grants 25,720 28,371 53,375 6,000 -88.8% 15-3316 Reimb. For Police Services 132,742 79,633 140,000 99,540 -28.9% 15-3317 School Resource Officers 15-3398 Miscellaneous Charges 100,135 467,000 120,000 209,000 74.2% 15-3411 Interest 15-3435 Contributions 465,346 34,000 -100.0% Total Revenues $4,637,370 $1,674,702 $2,173,375 $1,155,644 -46.8% 380
Grant Fund
City of Independence, Missouri 2015-16 Operating Budget
Revenue Summary
For the Fiscal Years 2013-14 through 2015-16
2015-16 %Chg. Acct. 2013-14 Original Current Proposed Adopted No. Description Actual Budget Estimate Budget to Curr Est. 2014-15 Central Garage Fund 90-3380 Central Garage Charges 2,128,402 2,389,228 2,350,000 2,310,840 -1.7% 90-3411 Interest Income 246 250 140 250 78.6% 90-3449 Misc. Non-Operating Revenue 2,497 5,000 5,000 5,000 Total Revenues $2,131,145 $2,394,478 $2,355,140 $2,316,090 -1.7% Staywell Healthcare Fund 91-3461 Premiums 21,858,175 25,872,174 21,803,576 21,803,576 91-3413 Interest - Other 4,072 6,000 3,200 6,000 87.5% 91-3449 Misc. Non-Operating Revenue 921,061 700,000 700,000 700,000 Total Revenues $22,783,308 $26,578,174 $22,506,776 $22,509,576 0.0% Workers' Compensation Fund 92-3411 Interest 1,489 2,000 1,000 2,000 100.0% 92-3413 Interest - Other 92-3449 Misc. Non-Operating Revenue 92-3471 Workers' Comp. Premiums 2,421,043 2,551,500 2,551,500 2,561,000 0.4% 92-3472 Reinsurance Reimbursements 81,912 72,000 71,253 72,000 1.0% Total Revenues $2,504,444 $2,625,500 $2,623,753 $2,635,000 0.4% 381
2015-16 Operating Budget All Funds Summary
Source of Budget Dollars
Allocation of Budget Dollars
Grants & Shared Rev. 3% Taxes 20% Licenses & Permits 1% Pymts. In Lieu of Taxes 6% Utility Service Charges 67% Other Revenue 3%
Power and Light Fund 52% Sanitary Sewer Fund 9% Water Fund 10% Other Funds 2% General Fund 27%
382
City of Independence, Missouri
2015-16 Operating Budget
Budget Summary - All Funds
For the Fiscal Years 2013-14, 2014-15 and 2015-16
Source of Budget Dollars
Use of Budget Dollars
2015-16 Increase 2014-15 City Council % (Decrease) 2013-14 Original Adopted of Over Last % Description Actual Budget Budget Total Year Change
Fund Balance Unassigned Fund Balance 60,682,162 $ 55,354,487 $ (5,327,675) $ Proceeds from Debt 1,400,000 1,400,000 Estimated RevenuesTaxes, excluding PILOTS 56,064,881 $ 57,585,951 $ 58,564,169 $ 20.1% 978,218 $ 1.7% Payment in Lieu of Taxes 18,144,063 18,927,939 18,868,596 6.5% (59,343) -0.3% Licenses & Permits 3,273,979 3,284,687 3,403,687 1.2% 119,000 3.6% Grants & Shared Revenue 11,100,814 7,903,748 7,498,230 2.6% (405,518) -5.1% Charges for Current Ser. 2,347,282 2,642,663 2,636,770 0.9% (5,893) -0.2% Fines and Forfeitures 4,790,383 4,860,377 4,921,960 1.7% 61,583 1.3% Utility Service Charges 187,599,377 194,902,539 194,450,156 66.8% (452,383) -0.2% Other Revenue 3,415,233 649,500 669,500 0.2% 20,000 3.1% Total Est. Revenues 286,736,012 $ 290,757,404 $ 291,013,068 $ 100.0% 255,664 $ 0.1% Net Transfers In 10,000 $ 10,000 $ - $ Total Sources 351,449,566 $ 347,777,555 $ (3,672,011) $ -1.0%
Operating DepartmentsCity Council 443,252 $ 441,183 $ 453,821 $ 0.2% 12,638 $ 2.9% City Clerk 416,859 404,718 366,691 0.1% (38,027) -9.4% City Manager 862,627 934,131 984,378 0.4% 50,247 5.4% Tourism 1,482,763 1,550,128 1,851,593 0.7% 301,465 19.4% Nat'l Front. Trails Museum 312,593 260,907 - 0.0% (260,907) -100.0% Technology Services 1,753,397 1,956,580 1,996,601 0.7% 40,021 2.0% Municipal Court 793,317 849,872 836,066 0.3% (13,806) -1.6% Law 693,376 719,476 773,828 0.3% 54,352 7.6% Finance 2,077,033 2,018,419 2,020,199 0.7% 1,780 0.1% Human Resources 429,740 454,287 459,444 0.2% 5,157 1.1% Community Dev. 4,494,878 3,813,226 3,649,076 1.3% (164,150) -4.3% Police 30,212,494 30,510,558 29,527,281 10.7% (983,277) -3.2% Fire 18,587,541 18,658,748 19,072,841 6.9% 414,093 2.2% Health 3,338,187 3,186,871 3,077,940 1.1% (108,931) -3.4% Water 14,545,488 15,531,913 15,624,836 5.7% 92,923 0.6% Public Works 5,938,974 6,239,849 6,172,085 2.2% (67,764) -1.1% Water Pollution Contr. 14,124,597 16,425,860 17,354,988 6.3% 929,128 5.7% Parks and Recreation 3,934,542 4,239,919 4,214,951 1.5% (24,968) -0.6% Power and Light 104,921,884 111,052,304 109,912,847 40.0% (1,139,457) -1.0% Non-Departmental 35,349,614 35,829,105 35,347,081 12.9% (482,024) -1.3% Debt Service 10,712,166 20,697,859 20,877,871 7.6% 180,012 0.9% Capital Outlay 272,979 374,848 400,000 0.1% 25,152 6.7% Total Departments 255,698,301 $ 276,150,761 $ 274,974,418 $ 100.0% (1,176,343) $ -0.4% Utility/Sales Tax Funds-Cap. Budget 25,455,275 27,172,916 1,717,641 6.7% Net Transfers Out/Designations 2,259,579 3,379,140 1,119,561 49.5% Total Uses 303,865,615 $ 305,526,474 $ 1,660,859 $ 0.5% Balance Available 47,583,951 $ 42,251,081 $ (5,332,870) $ 383
City of Independence, Missouri
2015-16 Operating Budget
Summary of Sources and Uses by Fund and Fund Type - Combined Total for All Funds
(continued on the next page)
Special Enterprise Funds Internal Grand General Revenue Power & Sanitary Water Service Total Description / Fund=> Fund Funds Light Fund Sewer Fund Fund Funds All Funds Sources: Beginning Fund Balance 2,856,584 $ (1,568,135) $ 35,400,000 $ 9,328,894 $ 9,337,144 $ 55,354,487 $ Estimated Revenues 76,302,246 24,981,455 142,282,545 23,469,156 31,679,726 27,460,666 326,175,794 Proceeds from Debt Issuance - 1,400,000 1,400,000 Consolidation AdjustmentsInterfund Charges for Support Ser. (91,611) (3,801,402) (1,418,718) (2,390,329) (7,702,060) Internal Service Fund Chgs (27,460,666) (27,460,666) Transfers InFrom Other Funds / Sources - 10,000 10,000 Total Sources 79,158,830 $ 23,321,709 $ 173,881,143 $ 32,789,332 $ 38,626,541 $ - $ 347,777,555 $ Uses: Operating BudgetsCity Council 453,821 $ 453,821 $ City Clerk 366,691 366,691 City Manager 984,378 984,378 Tourism 1,851,593 1,851,593 Nat'l Front. Trails Museum -Technology Services 1,867,106 129,495 1,996,601 Municipal Court 836,066 836,066 Law 741,884 31,944 2,558,484 3,332,312 Finance 1,968,698 51,501 2,020,199 Human Resources 459,444 459,444 Community Development 3,257,399 391,677 3,649,076 Police 27,034,885 2,492,396 29,527,281 Fire 17,042,758 2,030,083 19,072,841 Health 2,650,711 427,229 3,077,940 Water 15,624,836 15,624,836
384
City of Independence, Missouri
2015-16 Operating Budget
Summary of Sources and Uses by Fund and Fund Type - Combined Total for All Funds
Special Enterprise Funds Internal Grand General Revenue Power & Sanitary Water Service Total Description / Fund=> Fund Funds Light Fund Sewer Fund Fund Funds All Funds Operating Budgets (continued)Public Works 5,812,067 265,323 94,695 2,316,090 8,488,175 Water Pollution Control 2,493,216 14,861,772 17,354,988 Parks and Recreation 1,634,988 2,579,963 4,214,951 Power and Light 109,912,847 109,912,847 Non-Departmental 9,166,027 20,200 22,501,886 4,758,641 6,602,387 22,509,576 65,558,717 Debt Service/Lease Purch. 532,694 8,946,957 5,923,882 5,474,338 20,877,871 Capital Outlay 400,000 400,000 Operating Budget Total 74,676,923 $ 13,116,318 $ 141,491,185 $ 25,638,990 $ 27,753,062 $ 27,384,150 $ 310,060,628 $ Consolidation AdjustmentsInterfund Charges for Support Ser. (91,611) (3,801,402) (1,418,718) (2,390,329) (7,702,060) Internal Service Fund Chgs (27,384,150) (27,384,150) Consolidated Operating Budg. 74,676,923 13,024,707 137,689,783 24,220,272 25,362,733 - 274,974,418 Capital Budget 9,313,591 12,127,550 1,701,775 4,030,000 27,172,916 Total Operating/Capital Budg. 74,676,923 $ 22,338,298 $ 149,817,333 $ 25,922,047 $ 29,392,733 $ - $ 302,147,334 $ Transfers OutDesig. for Capital & Grants 884,770 884,770 To Other Funds 1,555,149 691,083 83,642 92,006 72,490 2,494,370 Total Uses 76,232,072 $ 23,914,151 $ 149,900,975 $ 26,014,053 $ 29,465,223 $ - $ 305,526,474 $ Ending Fund Balance / Net Assets 2,926,758 $ (592,442) $ 23,980,168 $ 6,775,279 $ 9,161,318 $ - $ 42,251,081 $ 385
City of Independence, Missouri
2015-16 Operating Budget
Summary of Sources and Uses by Fund and Fund Type - Combining Total for Special Revenue Funds
Note1) the combined total for these Funds is included in the calculation of the City-wide total on the previous schedule.
License Total Combined Surcharge CDBG HOME Special Sales Tax Grants Tourism (Excise Tax) Program Program Revenue Description / Fund=> Funds Fund Fund Fund Fund Fund Funds Sources: Beginning Fund Balance (2,392,796) $ 335,136 $ 489,525 $ - $ - $ (1,568,135) $ Estimated Revenues 20,714,864 1,155,644 1,868,200 175,300 759,326 308,121 24,981,455 Proceeds from Debt Issuance
Consolidation AdjustmentsInterfund Charges for Support Ser. (21,217) (70,394) (91,611) Transfers InFrom Other FundsTotal Sources 18,300,851 $ 1,155,644 $ 2,132,942 $ 664,825 $ 759,326 $ 308,121 $ 23,321,709 $ Uses: Operating BudgetsTourism 1,851,593 $ 1,851,593 $ Law 31,944 $ 31,944 Community Development 209,000 151,865 30,812 391,677 Police 2,087,733 404,663 2,492,396 Fire 1,947,275 82,808 2,030,083 Health 427,229 427,229 Public Works 265,323 265,323 Water Pollution Control 2,493,216 2,493,216 Parks and Recreation 2,579,963 2,579,963 Non-Departmental 20,200 20,200 Debt Service 532,694 532,694 Consolidation AdjustmentsInterfund Charges for Support Ser. (21,216) (70,394) (91,610) Consolidated Operating Budget 9,905,188 $ 1,155,644 $ 1,781,199 $ - $ 151,865 $ 30,812 $ 13,024,708 $ Capital Budget 9,313,591 9,313,591 Total Operating & Capital Budget 19,218,779 $ 1,155,644 $ 1,781,199 $ - $ 151,865 $ 30,812 $ 22,338,299 $ Transfers OutDesig. for Capital & Grant Proj. 607,461 $ 277,309 $ 884,770 $ To Other Funds 691,083 691,083 Total Uses 19,909,862 $ 1,155,644 $ 1,781,199 $ - $ 759,326 $ 308,121 $ 23,914,152 $ Ending Fund Balance / Net Assets (1,609,011) $ - $ 351,743 $ 664,825 $ - $ - $ (592,443) $
-
386
City of Independence, Missouri
2015-16 Operating Budget
Summary of Sources and Uses by Fund and Fund Type - Combining Total for Sales Tax Funds
Note1) the combined total for these Funds is included in the calculation of the Special Revenue Fund total on the previous schedule.
Street Park Storm Water Police Fire Improv. Improv. Improv. Public Safety Public Safety Sales Tax Sales Tax Sales Tax Sales Tax Sales Tax Total Description / Fund=> Fund Fund Fund Fund Fund All Funds Sources: Beginning Fund Balance 137,190 $ (5,327,848) $ 1,958,386 $ 61,116 $ 778,360 $ (2,392,796) $ Estimated Revenues 7,997,618 4,574,359 4,001,359 2,137,826 2,003,702 20,714,864 Proceeds from Debt IssuanceConsolidation AdjustmentsInterfund Charges for Support Ser. (18,482) (2,735) (21,217) Transfers InFrom Other FundsTotal Sources 8,116,326 $ (753,489) $ 5,957,010 $ 2,198,942 $ 2,782,062 $ 18,300,851 $ Uses: Operating BudgetsPolice 2,087,733 $ 2,087,733 $ Fire 1,947,275 1,947,275 Public Works 265,323 265,323 Water Pollution Control 2,493,216 2,493,216 Parks and Recreation 2,579,963 2,579,963 Non-Departmental 13,200 7,000 20,200 Debt Service 532,694 - - - 532,694 Consolidation Adjustments-Interfund Charges for Support Ser. (18,482) (2,734) (21,216) Consolidated Operating Budget 792,735 $ 2,586,963 $ 2,490,482 $ 2,087,733 $ 1,947,275 $ 9,905,188 $ Capital Budget 7,323,591 435,000 1,555,000 9,313,591 Total Operating & Capital Budget 8,116,326 $ 3,021,963 $ 4,045,482 $ 2,087,733 $ 1,947,275 $ 19,218,779 $ Transfers OutDesig. for Capital & Grant Proj. - $ To Other Funds 691,083 691,083 Total Uses 8,116,326 $ 3,021,963 $ 4,736,565 $ 2,087,733 $ 1,947,275 $ 19,909,862 $ Ending Fund Balance / Net Assets - $ (3,775,452) $ 1,220,445 $ 111,209 $ 834,787 $ (1,609,011) $
387
Estimated Revenues
388
2015-16 Operating Budget Estimated Revenues Revenues by Source

The single largest source of revenue for the City is Utility Service Charges from the City's electric, water and sanitary sewer utilities; comprising two thirds of total revenues. Taxes represent the second largest category making up twenty-seven percent of the total. For the General Fund alone, taxes represent seventy-three percent of total revenues.
Total revenues are projected to increase in the 2015-16 fiscal year by .10 percent from the 2014-15 fiscal year. The largest single increase in terms of dollar amount is the Taxes Revenue category which is projected to increase by $900,000 and represents a 1.2 percent increase. Also, the Licenses & Permits Revenue Category is projected to increase by $119,000 representing a 3.6 percent increase.

Taxes 27% Licenses & Permits 1% Utility Revenues 67% Grants & Shared Revenues 2% Other Revenue 3% $77 $3 $195 $8 $8 $77 $3 $194 $7 $8 $- $25 $50 $75 $100 $125 $150 $175 $200 $225 Taxes Licenses & Permits Utility Revenues Grants & Shared Revenues Other Revenue Millions 2015-16 2014-15 389
City of Independence, Missouri 2015-16
Revenue Overview/Projections
This section provides an overview of the various revenue sources in the City and a discussion of the basis upon which the revenue estimates were made. A separate Revenue Manual is available to provide additional revenue details and a more detailed discussion of the projection basis for all revenue sources within the City.
One of the key components of the City's annual budget process is the estimation of revenues for the ensuing fiscal year. These revenue estimates form the basis upon which appropriations are established which in turn dictate the level of public services that can be provided to the community. The economic environment locally, as well as nationally, creates conditions that affect the receipt of these revenues. Therefore, the City's budget is based on the latest economic forecast available, however it must also be flexible to reflect changes that occur through the year. A continuation of the level of services provided by the City depends on how quickly management recognizes these changes and reacts to adjust for them.
The following chart compares the annual percentage change in total revenues to the percentage change in the Consumer Price Index (CPI) for the local area. Generally, on an overall basis, expenditures have a stronger degree of correlation to inflation based changes than revenues. Therefore, this comparison helps to identify the ability of revenues to adjust to inflation driven demands on the expenditure side.
Comparison of Annual Percentage Change in Total Revenues to Annual Percentage change in the Consumer Price Index
During the period shown on the above graph, for all years except two, actual revenues have increased at a larger annual rate than the increase in the CPI index for the area. Total Revenues for 2015-16 are estimated to increase from total revenues for 2014-15 at a rate of .10 percent compared to a projected consumer price index increase for this area of .50 percent.
-4.00% -2.00% 0.00% 2.00% 4.00% 6.00% 8.00% 10.00% 12.00% 14.00% -2.00% 0.00% 2.00% 4.00% 6.00% 8.00% 10.00% 12.00% 2007-08 2008-09 2009-10 20102011 2011-12 2012-13 2013-14 2014-15 2015-16 Annual Percentage Change
CPI Revenues 390
City of Independence, Missouri 2015-16
Revenue Overview/Projections
Shown below is a comparison of the actual total revenues by source for the 2007-08 fiscal year through the 2013-14 fiscal year. Also listed are budgeted amounts for the 2014-15 and 2015-16 fiscal years. The component mix of revenues has remained largely unchanged over the listed period of time. Revenues have increased at an average annual rate of 2.9 percent.
Comparison of Actual and Estimated Revenue Components
Other Revenue Grants & Shared Revenues Licenses & Permits Taxes
Revenue Estimates by FundGeneral Fund
Taxes - taxes comprise seventy-three percent of the total revenue within the General Fund. Included in this category are Real Estate Taxes, Local Option Sales Taxes, Payments in Lieu of Taxes from the City's three municipally owned utility companies and Utility Franchise Fees from privately owned utility companies. Projections in these categories are based on historical trend analysis with adjustments for projected changes in economic conditions and rate changes, as applicable. For the Payments in Lieu of Taxes and Utility Franchise Fees, the revenue is based on 9.08 percent of the gross receipts collected by each utility.
Grants and Shared Revenue - Grant revenues represent seven percent of the total revenues in the General Fund. This revenue source, particularly at the Federal level, continues to decline from year to year. Revenue for each grant type is based on historical trend analysis as adjusted for projected changes in grant activity.

Other Revenue - Projections for other revenue sources within the General Fund are based primarily on historical trend analysis with adjustments for projected economic and rate changes, as applicable.
Transient Guest Tax - The primary source of revenue in the Tourism Fund is Transient Guest Taxes. The tax rate is 6.5% and assessed to Hotel/Motel occupants. Revenue estimates are based on a historical trend analysis with adjustments for projected changes in occupancy rates and the number of available hotel/motel units.
Tourism Fund
$$20 $40 $60 $80 $100 $120 200708 200809 200910 20102011 201112 201213 201314 201415 201516 Millions
391
City of Independence, Missouri 2015-16
Revenue Overview/Projections
Community Development Block Grant Act Fund
Federal Grant (CDBG) - Revenue in this fund comes directly from the Federal Government. Estimates are based on the latest available information from the Federal Government.
HOME Program Fund
Federal Grant (HOME Program) - Revenue in this fund comes directly from the Federal Government. Estimates are based on the latest available information from the Federal Government.
Enterprise Funds
The City has three enterprise funds: Electric, Sanitary Sewer and Water utilities. Service charge revenue estimates for each utility are based on projected consumption, as determined by historical trends and anticipated changes in service area, which is factored into the rate structure including changes for anticipated rate adjustments, as appropriate.
Central Garage Fund
The City's Central Garage Internal Service Fund's revenue is based on the actual maintenance and fuel charges for the preceding calendar year as adjusted for approved appropriations for the ensuing fiscal year. Estimated revenues in this fund are offset by appropriations for the use of the garage facility in the various operating departments.
For additional revenue details and projection information, refer to the separate Revenue Manual. This document provides detail information regarding each revenue source in the City including authorization, projection parameters, historical data, etc.
392
City of Independence, Missouri
2015-16 Operating Budget
Revenue Summary
For the Fiscal Years 2013-14 through 2015-16
16 - Police Public Safety Sales Tax Fund 17 - Fire Public Safety Sales Tax Fund 20 - Power and Light Fund 30 - Sanitary Sewer Fund 40 - Water Fund 90 - Central Garage Fund 91 - Staywell Healthcare Fund 92 - Worker's Compensation Fund 2015-16 %Chg. 2015-16 2013-14 Original Current Adopted Adopted % to Total Fund Description Actual Budget Estimate Budget to Curr. Est Budget Property Taxes 2-3011 Real Estate 7,486,129 7,480,000 7,430,770 7,480,000 0.7% 2.3% 2-3013 R.R. & Other Utility 39,716 36,500 39,503 36,500 -7.6% 0.0% Total Property Taxes 7,525,845 7,516,500 7,470,273 7,516,500 0.6% 2.3% Local Option Sales Tax 2-3041 Local Option Sales Tax 16,559,131 17,012,109 16,764,768 17,095,404 2.0% 5.2% 11-3041 Local Option Sales Tax 7,767,525 7,957,701 7,842,056 7,996,718 2.0% 2.5% 12-3041 Local Option Sales Tax 3,884,655 3,978,851 3,921,028 3,998,359 2.0% 1.2% 13-3041 Local Option Sales Tax 3,884,641 3,978,851 3,921,028 3,998,359 2.0% 1.2% 16-3041 Local Option Sales Tax 2,069,621 2,126,514 2,095,596 2,136,926 2.0% 0.7% 17-3041 Local Option Sales Tax 1,943,700 1,989,425 1,964,165 2,002,902 2.0% 0.6% Total Sales Tax 36,109,273 37,043,451 36,508,642 37,228,668 2.0% 11.4% 2-3042 Cigarette Tax 477,865 475,000 455,000 475,000 4.4% 0.1% 4-3043 Transient Guest Tax 1,468,758 1,400,000 1,550,000 1,800,000 16.1% 0.6% 14-3108 License Tax 190,652 150,000 150,000 175,000 16.7% 0.1% Total Other Taxes 2,137,275 2,025,000 2,155,000 2,450,000 13.7% 0.8% Utility Franchise Fees 2-3052 Water 27,317 27,000 23,880 27,000 13.1% 0.0% 2-3053 Gas 4,201,302 4,620,000 4,620,000 4,850,000 5.0% 1.5% 2-3054 Telephone 4,728,602 5,050,000 4,700,000 5,050,000 7.4% 1.5% 2-3055 Electricity 565,189 535,000 540,832 585,000 8.2% 0.2% 2-3057 Cable Television 770,077 769,000 821,113 857,000 4.4% 0.3% Total Utility Franchise Fees 10,292,487 11,001,000 10,705,825 11,369,000 6.2% 3.5% Payments in Lieu of Taxes 2-3281 Power & Light In Lieu of Taxes 13,368,095 13,851,343 13,273,220 13,562,517 2.2% 4.2% 2-3282 Water Service In Lieu of Taxes 2,646,902 2,807,329 2,689,832 2,947,919 9.6% 0.9% 2-3283 Sanitary Sewer In Lieu of Taxes 2,129,065 2,269,267 2,310,972 2,358,160 2.0% 0.7% Total Pymt. in Lieu of Taxes 18,144,063 18,927,939 18,274,024 18,868,596 3.3% 5.8% Total Taxes 74,208,944 76,513,890 75,113,764 77,432,765 3.1% 23.7% 4 - Tourism Fund 8 - Community Development Block Grant Fund 9 - HOME Fund 11 - Street Improvements Sales Tax Fund 2014-15 Other Taxes Fund Number Reference 2 - General Fund 15 - Grants Fund 12 - Park Improvements Sales Tax Fund 13 - Storm Water Sales Tax Fund 14 - License Surcharge Fund 393
City of Independence, Missouri 2015-16 Operating Budget
Revenue Summary
For the Fiscal Years 2013-14 through 2015-16
2015-16 %Chg. 2015-16 2013-14 Original Current Adopted Adopted % to Total Fund Description Actual Budget Estimate Budget to Curr. Est Budget 2014-15 Business Licenses and Permits 2-3101 Occupation Licenses 1,438,655 1,487,000 1,487,000 1,518,000 2.1% 0.5% 2-3102 Liquor Licenses 106,029 110,000 109,671 111,000 1.2% 0.0% 2-3103 Bld. Trades Licenses and Exams 117,980 105,000 110,000 110,000 0.0% 0.0% 2-3104 Fin-Other License/Permits 109,157 121,000 110,183 121,000 9.8% 0.0% 2-3108 Building Permits, Com.Develop. 520,471 475,000 665,048 525,000 -21.1% 0.2% 2-3109 Construction Permits, Pub.Works 164,219 210,000 181,318 210,000 15.8% 0.1% 2-3120 Nursing Home Permits 1,000 1,000 853 1,000 17.2% 0.0% 2-3121 Day Care Permits 6,917 6,687 9,358 6,687 -28.5% 0.0% 2-3122 Food Handler's Permits 100,825 98,000 93,450 98,000 4.9% 0.0% 2-3123 Massage Therapist Appl 5,220 1,000 4,346 5,000 15.0% 0.0% 2-3124 Other Food Permits 157,195 142,000 175,601 155,000 -11.7% 0.0% 2-3125 Ambulance Permits & Licenses 55,488 37,000 39,195 45,000 14.8% 0.0% 2-3126 Plan Reviews - Health Dept. 8,730 6,000 7,568 8,000 5.7% 0.0% Total Bus. Lic. & Permits 2,791,887 2,799,687 2,993,591 2,913,687 -2.7% 0.9% Non-Business Licenses and Permits 2-3151 Motor Vehicle Licenses 482,092 485,000 485,000 490,000 1.0% 0.2% Total Licenses and Permits 3,273,979 3,284,687 3,478,591 3,403,687 -2.2% 1.0% GrantsFederal Government Grants 8-3204 Federal Grant - CDBG 540,579 750,000 766,000 759,326 -0.9% 0.2% 9-3209 HOME Program Grant 707,436 300,000 339,000 308,121 -9.1% 0.1% 15-3210 Emergency Mgmt. Assist. 171,704 79,668 130,000 82,808 -36.3% 0.0% 15-3211 Public Health Nursing 199,606 192,686 200,000 215,479 7.7% 0.1% 2-3218 Dial-A-Ride - - - - 0.0% 15-3218 Dial-A-Ride - - - - 0.0% 2-3219 Other 39 - - - 0.0% 15-3219 Federal Grants - Other 3,386,951 749,742 1,425,000 462,494 -67.5% 0.1% 4-3219 Federal Grants - Other - - - - 0.0% Total Federal Grants 5,006,314 2,072,096 2,860,000 1,828,228 -36.1% 0.6% State Government Grants 2-3241 Financial Institutions Tax 19,381 19,500 16,570 19,500 17.7% 0.0% 2-3242 Gasoline Tax 2,979,706 3,100,000 3,100,000 3,150,000 1.6% 1.0% 2-3243 Motor Vehicle License Fees 487,407 510,000 510,000 510,000 0.0% 0.2% 2-3244 Motor Vehicle Sales Tax 874,138 795,000 795,000 795,000 0.0% 0.2% 4-3250 State Grants - Other 58,300 - - - 0.0% 15-3250 State Grants - Other 155,167 77,602 71,000 80,323 13.1% 0.0% Total State Grants 4,574,098 4,502,102 4,492,570 4,554,823 1.4% 1.4% Other Sources 2-3272 Jackson County Drug Task Force 559,459 535,774 555,494 556,867 0.2% 0.2% 2-3274 Jackson County Dare Program 212,000 218,772 210,000 218,772 4.2% 0.1% 2-3275 Mid Am Reg Council 25,000 - 24,956 25,000 0.2% 0.0% 15-3279 Misc. Grants - Other 25,720 28,371 53,375 6,000 -88.8% 0.0% Total Other Sources 822,179 782,917 843,825 806,639 -4.4% 0.2% Total Grants 10,402,591 7,357,115 8,196,395 7,189,690 -12.3% 2.2% 394
City of Independence, Missouri 2015-16 Operating Budget
Revenue Summary
For the Fiscal Years 2013-14 through 2015-16
2015-16 %Chg. 2015-16 2013-14 Original Current Adopted Adopted % to Total Fund Description Actual Budget Estimate Budget to Curr. Est Budget 2014-15 Charges for Services General Government 2-3302 Planning & Zoning Fees 19,982 10,000 14,240 15,000 5.3% 0.0% 2-3303 Board Of Adjustment Fees 2,700 4,050 2,859 4,050 41.7% 0.0% 2-3304 Sale Of Maps, Books, Plans 1,319 5,000 1,741 5,000 187.2% 0.0% 2-3305 Sale Of Police Reports 30,846 30,000 31,130 30,000 -3.6% 0.0% 2-3306 Sale Of Fire Reports 1,403 1,500 1,224 1,500 22.5% 0.0% 2-3307 Computer Service Charges 300 - 150 - -100.0% 0.0% 2-3309 Transit Rider Fares 177,582 145,000 155,000 150,000 -3.2% 0.0% Health 2-3311 Animal Shelter Fees 2,695 2,000 2,000 2,000 0.0% 0.0% 2-3312 Animal Id Tags 16,145 15,000 12,000 15,000 25.0% 0.0% 2-3313 Health Training Programs 8,005 7,200 11,111 7,900 -28.9% 0.0% Public Safety 2-3316 Reimb. For Police Services 16,540 12,250 19,578 15,500 -20.8% 0.0% 15-3316 Reimb. For Police Services 132,742 79,633 140,000 99,540 -28.9% 0.0% 2-3317 School Resource Officers 452,922 477,385 447,288 477,385 6.7% 0.1% 2-3318 Alarm Charges - Police 4,525 40,000 26,640 40,000 50.2% 0.0% 2-3319 Alarm Charges - Fire 1,650 1,675 3,002 3,000 -0.1% 0.0% Recreation 12-3321 Atheletic Fees 3,607 - - - 0.0% 2-3322 Program Fees 29,937 40,000 29,710 48,000 61.6% 0.0% 12-3322 Program Fees 40,776 50,000 50,000 50,000 0.0% 0.0% 2-3323 Concessions 4,103 4,000 3,559 4,000 12.4% 0.0% 12-3323 Concessions 17,536 32,000 32,000 32,000 0.0% 0.0% 12-3326 Water Park Fees/Memberships 284,911 480,000 480,000 440,000 -8.3% 0.1% 2-3327 Center Fees/Club Memberships 42,957 57,103 47,780 80,935 69.4% 0.0% 12-3327 Center Fees/Club Memberships 12,189 9,000 9,000 6,000 -33.3% 0.0% 2-3329 Facility Rentals 60,997 50,000 49,053 52,000 6.0% 0.0% 12-3329 Facility Rentals 47,343 35,000 35,000 48,000 37.1% 0.0% National Frontier Trails Museum 2-3331 NFTM-Admissions 45,207 46,000 39,564 - -100.0% 0.0% 2-3332 NFTM-Gift Shop 23,398 25,000 - - 0.0% 4-3331 NFTM-Admissions - - - 40,000 Cemetery 2-3341 Sale Of Cemetery Lots 1,050 3,000 7,031 3,000 -57.3% 0.0% 2-3342 Sale Of Monument Bases 2,721 3,000 3,213 3,000 -6.6% 0.0% 2-3343 Grave Opening Charges 34,550 40,000 50,759 40,000 -21.2% 0.0% Central Garage Charges 90-3380 Central Garage Charges 2,128,402 2,389,228 2,350,000 2,310,840 -1.7% 0.7% Other Charges 2-3392 Sale Of Street Signs 795 500 241 500 107.5% 0.0% 2-3393 Special Assessments 188,054 175,000 206,053 180,000 -12.6% 0.1% 2-3396 Sale Of Recycled Material 7,609 14,000 16,405 15,000 -8.6% 0.0% 2-3397 Solid Waste Disp Fees 67,995 78,000 35,136 78,000 122.0% 0.0% 2-3398 Miscellaneous Charges 694,933 750,000 751,151 750,000 -0.2% 0.2% 4-3398 Miscellaneous Charges - - - - 0.0% 11-3449 Misc. Non-Operating Revenue 50,000 - 85,000 - -100.0% 0.0% 15-3398 Miscellaneous Charges 100,135 467,000 120,000 209,000 74.2% 0.1% Total Charges for Services 4,758,561 5,578,524 5,268,618 5,256,150 -0.2% 1.6% Fines and Court Costs 2-3401 Fines & Forfeitures 4,220,172 4,307,430 4,307,430 4,307,430 0.0% 1.3% 2-3402 Court Costs 438,014 403,079 403,079 403,079 0.0% 0.1% 2-3403 Police Training 59,274 61,583 61,583 61,583 0.0% 0.0% 2-3404 Domestic Violence 59,273 61,583 75,847 123,166 62.4% 0.0% 2-3405 Dwi/Drug 13,650 26,702 26,702 26,702 0.0% 0.0% Total Fines & Court Costs 4,790,383 4,860,377 4,874,641 4,921,960 1.0% 1.5% 395
City of Independence, Missouri 2015-16 Operating Budget
Revenue Summary
For the Fiscal Years 2013-14 through 2015-16
2015-16 %Chg. 2015-16 2013-14 Original Current Adopted Adopted % to Total Fund Description Actual Budget Estimate Budget to Curr. Est Budget 2014-15 Interest Income 2-3411 Interest 1,181 500 856 500 -41.6% 0.0% 4-3411 Interest 208 200 85 200 135.3% 0.0% 11-3411 Interest 781 900 600 900 50.0% 0.0% 12-3411 Interest - - - - 0.0% 13-3411 Interest 3,169 3,000 1,750 3,000 71.4% 0.0% 14-3411 Interest 589 300 200 300 50.0% 0.0% 15-3411 Interest - - - - 0.0% 16-3411 Interest 845 900 425 900 111.8% 0.0% 17-3411 Interest 605 800 200 800 300.0% 0.0% 20-3411 Interest 29,439 21,000 12,000 12,000 0.0% 0.0% 30-3411 Interest 6,861 6,000 5,900 5,000 -15.3% 0.0% 40-3411 Interest 3,532 3,500 3,600 3,500 -2.8% 0.0% 90-3411 Interest 246 250 140 250 78.6% 0.0% 92-3411 Interest 1,489 2,000 1,000 2,000 100.0% 0.0% 2-3412 Special Assessments - Interest (691) 400 (677) 400 -159.1% 0.0% 2-3413 Interest - Other 103,259 90,000 90,000 95,000 5.6% 0.0% 91-3413 Interest - Other 4,072 6,000 3,200 6,000 87.5% 0.0% Total Interest Income 155,586 135,750 119,279 130,750 9.6% 0.0% Interfund Charges 2-3421 Interfund Chgs. For Supp. Serv. 3,987,029 4,616,045 4,616,045 4,741,289 2.7% 1.5% 20-3421 Interfund Chgs. For Supp. Serv. 1,348,077 1,560,441 1,560,441 1,484,545 -4.9% 0.5% 40-3421 Interfund Chgs. For Supp. Serv. 1,706,007 1,719,189 1,719,189 1,476,226 -14.1% 0.5% Total Interfund Charges 7,041,113 7,895,675 7,895,675 7,702,060 -2.5% 2.4% Other Revenue 2-3431 Sale Of Land - 1,000 - 1,000 0.0% 2-3432 Sale Of Fixed Assets 50,570 125,000 87,595 125,000 42.7% 0.0% 2-3433 Rents 189,133 181,000 194,394 181,000 -6.9% 0.1% 2-3434 Damage Claims 2,204,630 2,000 8,986 2,000 -77.7% 0.0% 2-3435 Contributions 10,165 10,000 12,320 10,000 -18.8% 0.0% 13-3435 Contributions 18,591 - - - 0.0% 15-3435 Contributions 465,346 - 34,000 - -100.0% 0.0% 2-3439 Cash Over/Short 123 - (62) - -100.0% 0.0% 2-3440 Discounts Taken 67 - 42 - -100.0% 0.0% 2-3449 Misc. Non-Operating Revenue 310,319 200,000 298,907 200,000 -33.1% 0.1% 4-3449 Misc. Non-Operating Revenue 5,915 3,000 28,000 28,000 0.0% 0.0% 12-3449 Misc. Non-Operating Revenue 52 - - - 0.0% 13-3449 Misc. Non-Operating Revenue 10,067 - - - 0.0% 16-3449 Misc. Non-Operating Revenue 103,633 - 47,393 - -100.0% 0.0% 17-3449 Misc. Non-Operating Revenue 14,912 90-3449 Misc. Non-Operating Revenue 2,497 5,000 5,000 5,000 0.0% 0.0% 91-3449 Misc. Non-Operating Revenue 921,061 700,000 700,000 700,000 0.0% 0.2% 92-3449 Misc. Non-Operating Revenue - - - - 0.0% Total Other Revenue 4,307,079 1,227,000 1,416,575 1,252,000 -11.6% 0.4% 396
City of Independence, Missouri
2015-16 Operating Budget
Revenue Summary
For the Fiscal Years 2013-14 through 2015-16
2015-16 %Chg. 2015-16 2013-14 Original Current Adopted Adopted % to Total Fund Description Actual Budget Estimate Budget to Curr. Est Budget 2014-15 Employee Benefit Premiums 91-3461 Premiums 21,858,175 25,872,174 21,803,576 21,803,576 0.0% 6.7% 92-3471 Workers' Comp. Premiums 2,421,043 2,551,500 2,551,500 2,561,000 0.4% 0.8% 92-3472 Reinsurance Reimbursements 81,912 72,000 71,253 72,000 1.0% 0.0% Total Premiums 24,361,130 28,495,674 24,426,329 24,436,576 0.0% 7.5% Utility Operating Revenues 30-3109 Construction Permits, Pub.Works - - - - 0.0% 20-4010 Electric Service Charges 136,744,989 141,836,000 135,375,437 138,580,000 2.4% 42.5% 30-4010 Residential Sewer Charges 11,329,939 11,626,328 11,380,229 12,308,166 8.2% 3.8% 40-4010 Residential Water Charges 13,052,557 13,500,000 13,200,000 14,400,000 9.1% 4.4% 30-4110 Commercial Base Sewer 4,434,651 4,507,086 4,682,280 4,743,125 1.3% 1.5% 40-4110 Commercial Water Charges 3,555,507 4,290,000 3,800,000 4,000,000 5.3% 1.2% 30-4120 Commercial Surcharge 1,320,644 547,100 1,111,000 491,550 -55.8% 0.2% 30-4130 Regulatory Compliance Base 3,191,390 4,786,025 4,792,315 4,792,315 0.0% 1.5% 40-4130 Industrial Sales 769,857 630,000 590,000 800,000 35.6% 0.2% 30-4430 Contract Services 229,946 197,000 250,000 250,000 0.0% 0.1% 40-4400 Public Authority Sales 262,012 280,000 340,000 300,000 -11.8% 0.1% 40-4410 Private Fire Protection 159,329 170,000 170,000 170,000 0.0% 0.1% 40-4420 Public Fire Protection 1,231,475 1,200,000 1,300,000 1,250,000 -3.8% 0.4% 40-4550 Sales for Resale 8,136,297 8,250,000 7,900,000 8,900,000 12.7% 2.7% 30-4570 Intermunicipal Agreements 642,495 600,000 650,000 650,000 0.0% 0.2% 20-4600 Other Operating Revenue 1,877,852 2,022,000 1,988,567 1,884,000 -5.3% 0.6% 30-4600 Other Operating Revenue 231,355 190,000 229,000 229,000 0.0% 0.1% 40-4600 Other Operating Revenue 369,562 380,000 300,000 380,000 26.7% 0.1% 20-4700 Change in Unbilled Revenue (40,386) (109,000) - 322,000 0.1% 30-4700 Change in Unbilled Revenue 90,879 - - - 0.0% 40-4700 Change in Unbilled Revenue 9,027 - - - 0.0% Total Operating Revenue 187,599,378 194,902,539 188,058,828 194,450,156 3.4% 59.6% Utility Other Revenues 20-4900 Other Revenues, Net 231,530 - - - 0.0% 30-4900 Other Revenues, Net - - - - 0.0% 40-3440 Other Revenues, Net 65,748 - - - 0.0% Total Other Revenues 297,278 - - - 0.0% Total Revenues 321,196,021 $ 330,251,231 $ 318,848,695 $ 326,175,794 $ 2.3% 100.0% Summary: Grand Total Revenues 321,196,021 $ 330,251,231 $ 318,848,695 $ 326,175,794 $ Less: Central Garage Fund (2,131,145) (2,394,478) (2,355,140) (2,316,090) Staywell Health Care Fund (22,783,308) (26,578,174) (22,506,776) (22,509,576) Workers' Compensation Fund (2,504,444) (2,625,500) (2,623,753) (2,635,000) Interfund Charges (7,041,113) (7,895,675) (7,895,675) (7,702,060) Net Total Revenues 286,736,012 $ 290,757,404 $ 283,467,351 $ 291,013,068 $ 397
Appropriations
398
2015-16 Operating Budget Appropriations


Utility Operations represent sixty eight percent of the City's total budget. Independence has three utilities: Power and Light, Sanitary Sewer and Water. For the General Fund separately, Public Safety represents the largest category of expenses and accounts for sixty percent of that fund's budget. Public Safety includes Police services ($27.0 million) and Fire services ($17.0 million).
Total operating budget appropriations decreased .4 percent between the two fiscal years representing a decrease of $1.2 million. The largest portion of this decrease occurred in the Other funds due to the retirement of debt service in the Police and Fire Public Safety Sales Tax Funds.
Utility Operations 68% General Government 2% Public Safety 18% Public Works 3% Community Service 5% Other 4% Appropriations Total Appropriations
$187 $8 $49 $8 $13 $11 $187 $8 $49 $9 $13 $10 $- $50 $100 $150 $200 Utility Operations General Government Public Safety Public Works Community Service Other Millions Comparison of Appropriations 2015-16 2014-15 399
- $274,974,418
City of Independence, Missouri
2015-16 Operating Budget
Budget Summary - All Funds
For the Fiscal Years 2013-14, 2014-15 and 2015-16
Actual Original Actual Estimated Amended Expenditures Budget Expenditures Expenditures Budget Fund/Department 2013-14 2014-15 For 9 Months For 3 Months 2014-15 City Manager Adopted 2015-16 General Fund: General Government: City Council 443,252 $ 441,183 $ 325,294 $ 115,889 441,183 $ 453,821 $ City Clerk 416,859 404,718 298,086 107,945 406,031 366,691 City Manager 862,627 934,131 659,036 275,095 934,131 984,378 Technology Services 1,627,925 1,828,880 1,277,567 551,313 1,828,880 1,867,106 Municipal Court 793,317 849,872 620,341 229,531 849,872 836,066 Total General Government 4,143,980 $ 4,458,784 $ 3,180,324 $ 1,279,773 $ 4,460,097 $ 4,508,062 $ National Frontier Trails Museum 312,593 $ 260,907 $ 197,981 $ 62,926 $ 260,907 $ - $ Law Department 677,186 687,741 580,595 107,146 687,741 741,884 Finance Department: Administration 584,061 $ 482,719 $ 371,958 $ 110,761 $ 482,719 $ 383,418 $ Accounting 932,952 951,489 764,748 186,741 951,489 1,009,723 Purchasing 276,760 291,156 218,850 72,306 291,156 289,106 Occupation Licensing 232,891 241,618 178,826 62,792 241,618 286,451 Total Finance Department 2,026,664 $ 1,966,982 $ 1,534,382 $ 432,600 $ 1,966,982 $ 1,968,698 $ Human Resources Department 429,740 $ 454,287 $ 339,554 $ 114,733 $ 454,287 $ 459,444 $ Community Development Department: Administration 264,666 $ 403,222 $ 270,302 $ 132,920 $ 403,222 $ 366,022 $ Neighborhood Services 60,185 56,875 38,824 18,051 56,875 52,317 Comprehensive Planning 170,837 291,035 126,795 164,240 291,035 347,260 Current Planning 187,081 193,554 154,208 39,346 193,554 221,101 Transportation 1,763,856 1,466,935 1,038,182 428,753 1,466,935 1,548,735 Historic Preservation 57,291 75,342 53,915 21,427 75,342 75,356 Building Inspection 582,688 668,423 453,682 214,741 668,423 646,608 Total Planning and Permits 3,086,604 $ 3,155,386 $ 2,135,908 $ 1,019,478 $ 3,155,386 $ 3,257,399 $ 400
City of Independence, Missouri
2015-16 Operating Budget
Budget Summary - All Funds
For the Fiscal Years 2013-14, 2014-15 and 2015-16
Actual Original Actual Estimated Amended City Manager Expenditures Budget Expenditures Expenditures Budget Proposed Fund/Department 2013-14 2014-15 For 9 Months For 3 Months 2014-15 2015-16 General Fund (continued): Police Department: Administration 3,107,383 $ 3,227,209 $ 2,748,880 $ 621,901 $ 3,370,781 $ 3,347,500 $ Police Operations 17,490,634 17,991,552 13,722,448 4,280,104 18,002,552 17,709,003 Police Services 5,809,513 6,008,708 4,473,970 1,534,707 6,008,677 5,978,382 Total Police Department 26,407,530 $ 27,227,469 $ 20,945,298 $ 6,436,712 $ 27,382,010 $ 27,034,885 $ Fire Department: Administration 418,882 $ 636,412 $ 476,205 $ 154,207 $ 630,412 $ 597,236 $ Suppression 15,285,928 15,124,832 11,585,680 3,539,152 15,124,832 15,187,320 Fire Prevention 473,237 573,040 413,551 159,489 573,040 662,644 Maintenance 270,135 327,945 190,540 140,405 330,945 270,025 Training/Emer. Preparedness 195,717 303,933 194,094 112,839 306,933 325,533 Total Fire Department 16,643,899 $ 16,966,162 $ 12,860,070 $ 4,106,092 $ 16,966,162 $ 17,042,758 $ Health Department: Administration 227,119 $ 231,014 $ 196,460 $ 34,554 $ 231,014 $ 237,616 $ Disease Prevention & Control 1,133,867 1,129,921 997,110 132,810 1,129,920 1,206,816 Communicable Disease & Imm. - 147,320 48,810 96,975 145,785 71,707 Environmental Public Health 1,193,658 1,246,063 930,825 316,773 1,247,598 1,134,572 Total Health Department 2,554,644 $ 2,754,318 $ 2,173,204 $ 581,113 $ 2,754,317 $ 2,650,711 $ Public Works: Administration 324,132 $ 348,120 $ 246,582 $ 101,538 $ 348,120 $ 344,903 $ Engineering 437,444 463,836 371,843 81,993 453,836 391,321 Administrative Support 297,629 258,802 220,099 38,703 258,802 284,421 Property Management 679,633 668,825 545,660 143,635 689,295 728,952 Street Maintenance 3,811,406 4,130,446 2,709,690 1,410,286 4,119,976 4,062,470 Total Public Works 5,550,244 $ 5,870,029 $ 4,093,873 $ 1,776,156 $ 5,870,029 $ 5,812,067 $ 401
City of Independence, Missouri
2015-16 Operating Budget
Budget Summary - All Funds
For the Fiscal Years 2013-14, 2014-15
Actual Original Actual Estimated Amended Expenditures Budget Expenditures Expenditures Budget Fund/Department 2013-14 2014-15 For 9 Months For 3 Months 2014-15 City Manager Adopted 2015-16 General Fund (continued): Parks and Recreation: Administration 262,360 $ 249,584 $ 209,564 $ 40,020 $ 249,584 $ 269,540 $ Park Maintenance 660,708 701,276 526,007 181,369 707,376 718,555 Recreation 370,039 504,260 357,979 171,281 529,260 515,287 Cemetery Maintenance 200,907 177,222 86,222 91,000 177,222 131,606 Total Parks and Recreation 1,494,014 $ 1,632,342 $ 1,179,771 $ 483,671 $ 1,663,442 $ 1,634,988 $ Non-Departmental 7,525,445 $ 9,030,295 $ 6,421,580 $ 2,789,944 $ 9,211,524 $ 8,916,027 $ City Council Strategic Goals 265,503 250,000 65,766 347,728 413,494 250,000 Capital Outlay 272,979 374,848 179,369 195,479 374,848 400,000 Total General Fund 71,391,025 $ 75,089,550 $ 55,887,676 $ 19,733,550 $ 75,621,226 $ 74,676,923 $ Tourism Fund: Tourism 1,482,763 $ 1,319,353 $ 1,181,786 $ 137,567 $ 1,319,353 $ 1,356,399 $ National Frontier Trails Museum - 80,775 50,101 30,674 80,775 495,194 Historic Sties Capital Improv. - 150,000 - 150,000 150,000 Total Tourism Fund 1,482,763 $ 1,550,128 $ 1,231,887 $ 318,241 $ 1,550,128 $ 1,851,593 $ Community Development Block Grant Fund: Community Development 392,847 $ 155,416 $ 758,168 $ 94,377 $ 852,545 $ 151,865 $ HOME Program Fund: Community Development 695,891 $ 35,424 $ 290,542 $ 8,897 $ 299,439 $ 30,812 $ Central Garage Fund: Public Works 2,183,317 $ 2,394,478 $ 1,944,694 $ 449,784 $ 2,394,478 $ 2,316,090 $ Staywell Health Care Fund Non-Departmental 24,292,706 $ 26,578,174 $ 16,919,499 $ 9,658,675 $ 26,578,174 $ 22,509,576 $ 402
and 2015-16
City of Independence, Missouri
2015-16 Operating Budget
Budget Summary - All Funds
For the Fiscal Years 2013-14, 2014-15 and 2015-16
Actual Original Actual Estimated Amended Expenditures Budget Expenditures Expenditures Budget Fund/Department 2013-14 2014-15 For 9 Months For 3 Months 2014-15 City Manager Adopted 2015-16 Street Improvements Sales Tax Fund: Non-Departmental 12,049 $ 13,200 $ 7,636 $ 5,564 $ 13,200 $ 13,200 $ Public Works 300,416 278,972 195,416 78,472 273,888 265,323 Debt Service 530,569 529,831 528,592 1,240 529,831 532,694 Total Street Improv. Sales Tax Fund 843,034 $ 822,003 $ 731,644 $ 85,275 $ 816,919 $ 811,217 $ Park Improvements Sales Tax Fund: Non-Departmental 6,025 $ 6,800 $ 4,347 $ 2,453 $ 6,800 $ 7,000 $ Parks and Recreation 2,440,528 2,607,577 2,002,145 605,432 2,607,577 2,579,963 Debt Service - - - -Total Park Improv. Sales Tax Fund 2,446,553 $ 2,614,377 $ 2,006,493 $ 607,884 $ 2,614,377 $ 2,586,963 $ Storm Water Improvements Sales Tax Fund: Water Pollution Control 1,631,411 $ 2,255,288 1,369,439 $ 885,849 $ 2,255,288 $ 2,493,216 $ Police Public Safety Sales Tax Fund: Police 2,417,666 $ 2,891,736 $ 1,510,632 $ 1,381,104 2,891,736 $ 2,087,733 $ Debt Service 515,038 513,863 511,130 2,733 513,863Total Police Sales Tax Fund 2,932,704 $ 3,405,599 $ 2,021,762 $ 1,383,837 $ 3,405,599 $ 2,087,733 $ Fire Public Safety Sales Tax Fund: Fire 1,502,612 $ 1,340,525 $ 825,568 $ 514,957 $ 1,340,525 $ 1,947,275 $ Debt Service 587,891 555,963 552,563 3,401 555,963Total Fire Sales Tax Fund 2,090,503 $ 1,896,488 $ 1,378,131 $ 518,357 $ 1,896,488 $ 1,947,275 $ Grants Fund: Law 16,190 $ 31,735 $ 9,275 $ 40,536 $ 49,811 $ 31,944 $ Community Development 319,536 467,000 390,605 (183,807) 206,798 209,000 Police 1,387,298 391,353 869,289 280,628 1,149,917 404,663 Fire 441,030 352,061 291,423 146,875 438,298 82,808 Health 783,543 432,553 417,830 461,335 879,165 427,229 403
City of Independence, Missouri
2015-16 Operating Budget
Budget Summary - All Funds
For the Fiscal Years 2013-14, 2014-15 and 2015-16
Actual Original Actual Estimated Amended City Manager Expenditures Budget Expenditures Expenditures Budget Proposed Fund/Department 2013-14 2014-15 For 9 Months For 3 Months 2014-15 2015-16 Total Grants Fund 2,947,597 $ 1,674,702 $ 1,978,422 $ 745,567 $ 2,723,989 $ 1,155,644 $ Power and Light Fund: Technology Services Department: Technology Services 125,472 $ 127,700 $ 95,995 $ 31,705 $ 127,700 $ 129,495 $ Power and Light Department: Administration 2,568,055 2,730,617 2,048,751 681,866 2,730,617 2,974,101 Support Services 9,469,730 11,258,297 3,734,115 7,522,672 11,256,787 11,163,712 Production 75,092,162 78,880,287 54,155,293 24,724,994 78,880,287 76,447,389 Distribution 10,611,888 11,307,130 9,910,166 1,439,614 11,349,780 11,846,969 Engineering 4,548,870 4,058,574 2,546,035 1,471,399 4,017,434 4,206,121 System Operations 2,631,179 2,817,399 2,180,479 636,920 2,817,399 3,274,555 Total Power and Light Department 104,921,884 $ 111,052,304 $ 74,574,839 $ 36,477,465 $ 111,052,304 $ 109,912,847 $ Non-Departmental 24,312,833 22,980,015 31,435,252 (8,455,237) 22,980,015 22,501,886 Debt Service 5,149,782 8,944,557 4,022,849 4,921,708 8,944,557 8,946,957 Total Power and Light Fund 134,509,971 $ 143,104,576 $ 110,128,936 $ 32,975,640 $ 143,104,576 $ 141,491,185 $ Sanitary Sewer Fund: Public Works Department: Engineering 88,314 $ 90,848 $ 82,895 $ 7,953 $ 90,848 $ 94,695 $ Water Pollution Control Department: Administration 760,126 $ 969,304 $ 601,851 $ 367,453 $ 969,304 $ 1,124,092 $ Treatment Facilities 8,942,176 9,509,027 6,534,315 2,974,712 9,509,027 9,986,249 Collection System Maintenance 2,570,871 3,455,554 2,090,124 1,365,430 3,455,554 3,488,918 Laboratory Services 220,013 236,687 162,688 73,999 236,687 262,513 Total Water Pollution Control Dept. 12,493,186 $ 14,170,572 $ 9,388,978 $ 4,781,594 $ 14,170,572 $ 14,861,772 $ Non-Departmental 4,363,805 4,650,311 4,812,598 (162,287) 4,650,311 4,758,641 Debt Service 1,744,079 4,626,307 3,423,883 1,202,424 4,626,307 5,923,882 Total Sanitary Sewer Fund 18,689,384 $ 23,538,038 $ 17,708,353 $ 5,829,685 $ 23,538,038 $ 25,638,990 $ 404
City of Independence, Missouri
2015-16 Operating Budget
Budget Summary - All Funds
For the Fiscal Years 2013-14, 2014-15 and 2015-16
Actual Original Actual Estimated Amended Expenditures Budget Expenditures Expenditures Budget Fund/Department 2013-14 2014-15 For 9 Months For 3 Months 2014-15 City Manager Adopted 2015-16 Workers' Compensation Fund Law Department 2,284,510 $ 2,543,334 $ 1,627,306 $ 916,028 $ 2,543,334 $ 2,558,484 $ Water Fund: Finance Accounting 50,369 $ 51,437 $ 38,548 $ 12,889 $ 51,437 $ 51,501 $ Water Department: Administration 1,163,591 1,128,438 3,019,954 (1,891,516) 1,128,438 1,417,712 Customer Service and Accounts 3,103,976 3,363,491 2,440,433 923,058 3,363,491 3,176,965 Production 6,438,402 6,770,161 4,716,970 2,053,191 6,770,161 6,649,792 Transmission and Distribution 3,839,519 4,269,823 2,713,003 1,556,820 4,269,823 4,380,367 Total Water Department 14,545,488 $ 15,531,913 $ 12,890,361 $ 2,641,552 $ 15,531,913 $ 15,624,836 $ Non-Departmental 5,881,752 6,794,159 4,561,397 2,232,762 6,794,159 6,602,387 Debt Service 2,184,807 5,527,338 1,041,369 4,485,969 5,527,338 5,474,338 Total Water Fund 22,662,416 $ 27,904,847 $ 18,531,675 $ 9,373,172 $ 27,904,847 $ 27,753,062 $ Grand Total - All Funds 291,476,632 $ 315,562,422 $ 234,514,627 $ 83,584,818 $ 318,099,445 $ 310,060,628 $ Less: Central Garage Fund (2,183,317) (2,394,478) (1,944,694) (449,784) (2,394,478) (2,316,090) Staywell Health Care Fund (24,292,706) (26,578,174) (16,919,499) (9,658,675) (26,578,174) (22,509,576) Worker's Compensation Fund (2,284,510) (2,543,334) (1,627,306) (916,028) (2,543,334) (2,558,484) Interfund Chgs. for Support Ser. (7,017,798) (7,895,675) 5,702,081 (12,662,330) (6,960,249) (7,702,060) Net Total Budget - All Funds 255,698,301 $ 276,150,761 $ 219,725,208 $ 59,898,002 $ 279,623,210 $ 274,974,418 $ 405
City of Independence, Missouri
2015-16 Operating Budget
Appropriations by Type Summary - All Funds
Personal Percent Other Percent Percent Capital Percent Department Services of Total Services of Total Supplies of Total Outlay/Other of Total Total City Council 419,799 $ 92.5% 29,252 $ 6.4% 4,770 $ 1.1% 0.0% 453,821 $ City Clerk 318,199 86.8% 30,125 8.2% 18,367 5.0% 0.0% 366,691 City Manager 952,768 96.8% 28,150 2.9% 3,460 0.4% 0.0% 984,378 Tourism 692,379 37.4% 967,710 52.3% 41,504 2.2% 150,000 8.1% 1,851,593 Technology Services 1,771,172 88.7% 197,600 9.9% 16,810 0.8% 11,019 0.6% 1,996,601 Municipal Court 795,889 95.2% 32,155 3.8% 8,022 1.0% 0.0% 836,066 Law 803,962 24.1% 2,494,050 74.8% 31,800 1.0% 2,500 0.1% 3,332,312 Finance 1,799,309 89.1% 203,713 10.1% 17,177 0.9% 0.0% 2,020,199 Human Resources 440,705 95.9% 13,046 2.8% 5,693 1.2% 0.0% 459,444 Community Dev. 1,650,905 45.2% 1,978,869 54.2% 17,802 0.5% 1,500 0.0% 3,649,076 Police 25,363,024 85.9% 1,785,179 6.0% 1,066,220 3.6% 1,326,949 4.5% 29,527,281 Fire 16,090,642 84.4% 921,289 4.8% 430,406 2.3% 1,630,504 8.5% 19,072,841 Health 2,317,928 75.3% 678,026 22.0% 81,986 2.7% 0.0% 3,077,940 Water 7,347,490 47.0% 5,769,251 36.9% 2,125,235 13.6% 382,860 2.5% 15,624,836 Public Works 3,995,922 47.1% 1,869,153 22.0% 2,017,578 23.8% 605,522 7.1% 8,488,175 Water Pollution Control 6,717,600 38.7% 8,805,189 50.7% 1,354,014 7.8% 478,185 2.8% 17,354,988 Parks and Recreation 2,621,291 62.2% 1,273,163 30.2% 316,700 7.5% 3,797 0.1% 4,214,951 Power and Light 29,651,723 27.0% 20,465,648 18.6% 58,534,326 53.3% 1,261,150 1.1% 109,912,847 Non-Departmental 9,081,336 13.9% 36,583,190 55.8% 15,965 0.0% 19,878,226 30.3% 65,558,717 Debt Service 0.0% 0.0% 0.0% 20,877,871 100.0% 20,877,871 Capital Outlay 0.0% 0.0% 0.0% 400,000 100.0% 400,000 Totals 112,832,043 $ 36.4% 84,124,758 $ 27.1% 66,107,835 $ 21.3% 47,010,083 $ 15.2% 310,060,628 $ 406
Summary of Operating/Other Transfers and Designations of Fund Balance - All Funds
City of Independence, Missouri 2015-16 Operating Budget
Special HOME Power & Sanitary Grand General Revenue C.D.B.G. Program Light Sewer Water Total Description Fund Funds Fund Fund Fund Fund Fund All Funds 2014-155 DesignationsFor CDBG Programming (594,584) $ (594,584) $ For HOME Program Programming (264,576) (264,576) Total Designations - $ - $ (594,584) $ (264,576) $ - $ - $ - $ (859,160) $ Operating TransfersFrom (To) Falls at Crackerneck TIF (419,716) (722,565) (83,642) (92,006) (72,490) (1,390,419) From (To) Storm Water Fund (10,000) 10,000Total Operating Transfers (429,716) $ (722,565) $ - $ - $ (83,642) $ (82,006) $ (72,490) $ (1,390,419) $ Fund BalanceFrom (To) Fund Balance TargetTotal Fund Balance - $ - $ - $ - $ - $ - $ - $ - $ Net Transfers (429,716) $ (722,565) $ (594,584) $ (264,576) $ (83,642) $ (82,006) $ (72,490) $ (2,249,579) $ 2015-16 2015-16 DesignationsFor CDBG Programming (607,461) $ (607,461) $ For HOME Program Programming (277,309) (277,309) Total Designations - $ - $ (607,461) $ (277,309) $ - $ - $ - $ (884,770) $ Operating TransfersFrom (To) Falls at Crackerneck TIF (1,545,149) (691,083) (83,642) (92,006) (72,490) (2,484,370) From (To) Storm Water Fund (10,000) 10,000Total Operating Transfers (1,555,149) $ (691,083) $ - $ - $ (83,642) $ (82,006) $ (72,490) $ (2,484,370) $ Fund BalanceFrom (To) Fund Balance TargetTotal Fund Balance - $ - $ - $ - $ - $ - $ - $ - $ Net Transfers (1,555,149) $ (691,083) $ (607,461) $ (277,309) $ (83,642) $ (82,006) $ (72,490) $ (3,369,140) $ 407
For the Fiscal Years 2014-15 and 2015-16
Debt Service
408
CITY OF INDEPENDENCE, MISSOURI DEBT SERVICE
FOR THE 2015-16 FISCAL YEAR
Long Term Debt Policies
All long-term indebtedness of the City, other than long-term indebtedness applicable to the City’s Enterprise Funds, is accounted for in the Debt Service Fund. The City’s general longterm debt is secured by the general credit and taxing powers of the City.
The City’s debt limit is set by State Statutes at 20% of the City’s assessed property valuation.
Specific purpose capital lease payments are budgeted in each applicable operating department’s budget whereas City-wide or general purpose capital lease payments are budgeted in Non-Department.
Debt Service
As of March 31, 2015, the City had no outstanding General Obligation Bonds and $358,321,395 outstanding in Revenue Bonds and loans payable for the enterprise funds. Included in the outstanding debt for utility operations was $131,336,483 for Power and Light Operations, $101,153,512 for Sanitary Sewer Operations and $34,794,911 for Water Utility Operations. The Events Center fund has outstanding debt of $91,036,489. The City had a legal debt limit of $256,165,576 as of June 30, 2014 which represents twenty percent of the taxable assessed valuation of the City.
Included in this section are:
1)Debt Service appropriations including amounts for City-wide capital lease obligations.
2)Debt to Maturity Schedules for outstanding debt obligations.
3)Computation of Legal Debt Margin (as of June 30, 2014).
409
City of Independence, Missouri
2015-16 Operating Budget
Capital Lease/Debt Service Requirements - All Funds
Total Debt Service Series Principal Interest Fees Requirements Street Improvements Sales Tax Fund: Streets and Bridges 2009 Series (6371) 460,000 $ 69,694 $ 3,000 $ 532,694 $ Power and Light FundRevenue Bonds 2010 Series B (6238) 1,560,000 $ 950,588 $ 4,000 $ 2,514,588 $ Revenue Bonds 2012 Series A (6239) - 2,631,219 4,000 2,635,219 Revenue Bonds 2012 Series F (6241) 1,835,000 1,958,150 4,000 3,797,150 Total Power and Light Fund 3,395,000 $ 5,539,957 $ 12,000 $ 8,946,957 $ Sanitary Sewer FundRevenue Bonds 2012 Series B (6240) 785,000 $ 1,489,907 $ 5,000 $ 2,279,907 $ Revenue Bonds 2013 Series C (6240) 500,000 2,080,650 5,000 2,585,650 Revenue Bonds 2014 Series C (6240) 250,000 803,325 5,000 1,058,325 Total Sanitary Sewer Fund 1,535,000 $ 4,373,882 $ 15,000 $ 5,923,882 $ Water FundRevenue Bonds 2013 Series D (6352) 4,260,000 $ 1,206,338 $ 8,000 $ 5,474,338 $ Total Water Fund 4,260,000 $ 1,206,338 $ 8,000 $ 5,474,338 $ Grand Total All Funds - Operating Budget 9,650,000 $ 11,189,871 $ 38,000 $ 20,877,871 $ 410
City of Independence, Missouri
2015-16 Operating Budget
Debt Service Requirements - Related Debt Associated with the City of Independence
Total Debt Service Series Principal Interest Fees Requirements Neighborhood Improvement District Debt ServiceNoland Road NID 2004 Series (6311) 75,000 $ 16,538 $ 1,000 $ 92,538 $ Fall Drive NID 2004 Series (6312) 5,000 3,674 1,000 9,674 Total NID Debt Service 80,000 $ 20,212 $ 2,000 $ 102,212 $ Events Center2008 D Series (6250) 250,000 $ 612,147 $ 5,000 $ 867,147 $ 2011 A Series (6250) 110,000 607,807 5,000 722,807 2012 C Series (6250) 370,000 2,899,163 5,000 3,274,163 Total Events Center 730,000 $ 4,119,117 $ 15,000 $ 4,864,117 $ Tax Increment Financing FundsDrumm Farm 2005 B Series (6711) 75,000 $ 18,676 $ 2,000 $ 95,676 $ 2006 Series (6711) 130,000 34,292 2,000 166,292 2007 D Series (6711) 80,000 17,386 2,000 99,386 2008 E Series (6711) 35,000 48,888 2,000 85,888 Total Drumm Farm 320,000 $ 119,242 $ 8,000 $ 447,242 $ Eastland Center 2007 A Series (6712) 1,100,000 $ 494,176 $ 2,500 $ 1,596,676 $ 2008 C Series (6712) 550,000 280,613 2,500 833,113 2012 E Series (6712) 340,000 86,600 2,500 429,100 2014 A Series (6712) 500,000 130,350 2,500 632,850 Total Eastland Center 2,490,000 $ 991,739 $ 10,000 $ 3,491,739 $ Falls at Crackerneck Creek 2006 A&B Series (6718) - $ 2,222,362 $ 5,000 $ 2,227,362 $ 2006 C Series (6718) - 639,500 5,000 644,500 2008 A Series (6718) 925,000 67,760 5,000 997,760 2008 B Series (6718) - 382,668 5,000 387,668 2013 A Series (6718) - 681,026 5,000 686,026 2013 B Series (6718) - 446,944 5,000 451,944 Total Falls at Crackerneck Creek 925,000 $ 4,440,260 $ 30,000 $ 5,395,260 $ Hartman Heritage Center 2007 B Series (6710) 890,000 $ 234,312 $ 3,000 $ 1,127,312 $ 2011 B Series (6710) 395,000 196,556 3,000 594,556 Total Hartman Center 1,285,000 $ 430,868 $ 6,000 $ 1,721,868 $ Centerpoint Medical Center (HCA) 2006 F Series (6722) 205,000 $ 160,638 $ 3,000 $ 368,638 $ 2007 E Series (6722) 720,000 801,420 3,000 1,524,420 2011 C Series (6722) 50,000 2,900 3,000 55,900 2012 D Series (6722) 620,000 378,700 3,000 1,001,700 2014 B Series (6722) 105,000 66,450 3,000 174,450 Total Centerpoint Medical Center 1,700,000 $ 1,410,108 $ 15,000 $ 3,125,108 $ Santa Fe 2015 A Series (6708) 100,000 $ 201,353 $ 3,000 $ 304,353 $ 2015 B Series (6708) 55,000 178,768 3,000 236,768 'Total Santa Fe 155,000 $ 380,121 $ 6,000 $ 541,121 $ Grand Total All Categories 7,685,000 $ 11,911,667 $ 92,000 $ 19,688,667 $ 411
City of Independence, Missouri
Operating Budget
Debt Service Requirements to Maturity - All Bonds
For the fiscal Years ending June 30,
and
Fund Fees and Fees and Year Principal Interest Total Principal Interest Total 2016 1,535,000 4,388,882 5,923,882 3,395,000 5,551,957 8,946,957 2017 1,945,000 4,342,757 6,287,757 3,530,000 5,416,157 8,946,157 2018 2,000,000 4,287,307 6,287,307 3,685,000 5,258,707 8,943,707 2019 2,060,000 4,227,807 6,287,807 3,850,000 5,094,257 8,944,257 2020 2,130,000 4,160,257 6,290,257 4,945,000 4,922,357 9,867,357 2021 2,205,000 4,085,632 6,290,632 4,045,000 4,712,056 8,757,056 2022 2,280,000 4,008,332 6,288,332 4,210,000 4,540,206 8,750,206 2023 2,365,000 3,921,910 6,286,910 4,395,000 4,361,257 8,756,257 2024 2,470,000 3,820,007 6,290,007 4,625,000 4,174,357 8,799,357 2025-37 81,255,000 44,494,089 125,749,089 86,695,000 32,602,999 119,297,999 Total 100,245,000 $ 81,736,980 $ 181,981,980 $ 123,375,000 $ 76,634,310 $ 200,009,310 $ Street Improvements Water Fund Fees and Fees and Year Principal Interest Total Principal Interest Total 2016 460,000 72,694 532,694 4,260,000 1,214,338 5,474,338 2017 475,000 55,154 530,154 3,275,000 1,122,613 4,397,613 2018 495,000 35,741 530,741 1,480,000 1,051,288 2,531,288 2019 515,000 14,266 529,266 1,530,000 1,006,138 2,536,138 2020 - 1,575,000 959,563 2,534,563 2021 - 1,630,000 903,338 2,533,338 2022 - 1,695,000 828,363 2,523,363 2023 1,785,000 741,363 2,526,363 2024 1,880,000 660,938 2,540,938 2025-44 - 14,880,000 2,186,446 17,066,446 Total 1,945,000 $ 177,855 $ 2,122,855 $ 33,990,000 $ 10,674,388 $ 44,664,388 $ 2015-16
412
Sanitary Sewer Fund Power
Light
City of Independence, Missouri
2015-16 Operating Budget
Debt Service Requirements to Maturity - All Bonds
For the fiscal Years ending June 30,
Events Center Fund
Fees and Fees and Year Principal Interest Total Principal Interest Total 2016 75,000 17,538 92,538 5,000 4,674 9,674 2017 75,000 13,600 88,600 6,000 4,399 10,399 2018 80,000 9,663 89,663 6,000 4,069 10,069 2019 85,000 5,463 90,463 6,000 3,739 9,739 2020 - 7,000 3,409 10,409 2021 - 7,000 2,998 9,998 2022 - 7,000 2,586 9,586 2023 8,000 2,175 10,175 2024 - 12,000 1,704 13,704 Total 315,000 $ 46,263 $ 361,263 $ 64,000 $ 29,753 $ 93,753 $ Fees and Year Principal Interest Total 2016 730,000 4,134,117 4,864,117 2017 830,000 4,109,095 4,939,095 2018 965,000 4,078,933 5,043,933 2019 1,055,000 4,037,982 5,092,982 2020 1,210,000 3,991,708 5,201,708 2021 1,370,000 3,938,907 5,308,907 2022 1,540,000 3,878,431 5,418,431 2023 1,705,000 3,810,820 5,515,820 2024 1,870,000 3,742,545 5,612,545 2025-38 79,280,000 35,338,471 114,618,471 Total 90,555,000 $ 71,061,009 $ 161,616,009 $
Noland Road NID Fall Drive NID
413
City of Independence, Missouri
Operating Budget
Capital Lease Payment Requirements to Maturity
For the fiscal Years ending June 30,
Year Eastland Heritage Santa Fe Farm Creek HCA Total 2016 3,481,739 1,715,868 535,121 439,242 5,365,260 3,110,108 14,647,338 2017 3,487,937 1,758,169 526,138 440,130 7,593,460 3,108,443 16,914,277 2018 3,490,839 1,775,232 530,963 440,168 7,310,777 3,122,895 16,670,874 2019 3,487,237 1,814,506 530,563 439,138 7,430,839 3,136,343 16,838,626 2020 3,498,350 2,883,068 529,938 437,412 7,569,427 3,200,644 18,118,839 2021 4,834,544 1,889,868 524,238 440,000 7,693,224 3,193,141 18,575,015 2022 5,452,569 532,938 441,000 7,782,276 3,271,745 17,480,528 2023 530,938 8,507,268 3,275,556 12,313,762 2024 528,838 10,918,263 3,342,130 14,789,231 2025-45 - - 8,307,321 55,376,558 14,686,134 78,370,013 Total 27,733,215 $ 11,836,711 $ 13,076,996 $ 3,077,090 $ 125,547,352 $ 43,447,139 $ 224,718,503 $ IBM
John
Computer Radio Equipment Year (2430-025) (2430-026) (2430-027) Total 2016 21,816 159,794 33,331 214,941 2017 159,794 159,794 2018 159,794 159,794 2019 159,794 159,794 2020 159,794 159,794 2021 159,794 159,794 2022 159,794 159,794 2023 2024-37Total 21,816 $ 1,118,558 $ 33,331 $ - $ - $ - $ 1,173,705 $ 2015-16
414
Hartman Drumm Crackerneck Centerpoint
Series Motorola
Deere
City of Independence, Missouri 2015-16 Operating Budget
Computation of Legal Debt Margin
June 30, 2014
*All Tangible and Taxable Property.
** Article 6, Section 26(b) of the Missouri Constitution permits any county or city, by a vote of four-sevenths of qualified electors voting thereon, to incur an indebtedness for city purposes not to exceed 5 percent of the value of the taxable tangible property therein, as shown by the last assessment.
Article 6, Section 26(c) of the Missouri Constitution permits any county or city, by a vote of four-sevenths of qualified electors voting thereon, to incur additional indebtedness of city purposes not to exceed 5 percent of the value of the taxable tangible property therein as shown by the last assessment.
Article 6, Section 26(d) & (e) of the Missouri Constitution provides that any city may become indebted not exceeding in the aggregate an additional 10 percent of the value of the taxable tangible property for the purpose of acquiring right-of-ways, construction, extending and improving streets and avenues and/or sanitary or storm sewer systems and an additional 10 percent for purchasing or constructing waterworks, electric or other light plants provided the total general obligated indebtedness of the city does not exceed 20 percent of the assessed valuation.
Assessed Value at January 1, 2013: * Jackson County 1,280,793,365 $ 1,280,793,365 Clay County 34,514 34,514 Total Assessed Value 1,280,827,879 $ Constitutional Debt Limit ** 256,165,576 $ (20% of Assessed Value) Total Bonded Debt Revenue Bonds 343,246,570 Subtotal 343,246,570 $ Less: Events Center Bonds (91,157,787) Water Utility Bonds (39,066,307) Electric Utility Bonds (131,497,433) Sewer Utility Bonds (81,071,566) Subtotal 453,477 $ Less: Debt Service Fund Balance (84,667) Total Net Debt Applicable to Limit 368,810 Legal Debt Margin 255,796,766 $
415
Capital Budget
416
CAPITAL BUDGET PROCESS
Introduction
Purpose
The Capital Improvements Program (CIP) is one of the primary documents used to implement the comprehensive plan for the development of the City by providing for the extension and maintenance of infrastructure and major capital projects. The CIP sets forth proposed expenditures for systematically constructing, maintaining, upgrading, and replacing the City’s physical assets. This ongoing maintenance is critical to the continued operation and provision of City services.
The CIP serves as a guide to the new and ongoing capital improvements to public facilities and infrastructure. The CIP outlines a financing schedule of capital improvement projects for a six-year period. In the process of formulating the CIP, needs are assessed, public improvements are prioritized and costs are projected, thereby allowing the City to take maximum advantage of federal, state, and county funds. The CIP is reviewed annually. Each review re-prioritizes projects and evaluates the financial capacity of the City. The process affords flexibility in maintaining and promoting an effective level of service for present and future citizens.
Goals
The goals of the CIP establish a system of procedures and priorities by which to evaluate public improvement projects in terms of public safety, public need, the City’s Comprehensive Plan, project continuity, financial resources, the City Council vision statement, and the strategic goals for the City. The following CIP goals were developed to guide the CIP process.
1. Focus attention on and assist in the implementation of established community goals as outlined in the adopted Comprehensive Plan.
2. Focus attention on and assist in the implementation of the strategic goals established by the City Council.
3. Forecast public facilities and improvements that will be needed in the near future.
4. Anticipate and project financing needs in order to maximize federal, state, and county funds.
5. Balance the needs of future land development areas in the City with the needs of existing developed areas.
417
6.Promote and enhance the economic development of the City of Independence in a timely manner.
7. Balance the need of public improvements and the present financial capability of the City to provide these improvements.
8. Provide improvements in a timely and systematic manner.
9. Allow City departments to establish a methodology and priority system to continue providing efficient and effective services.
10.Provide an opportunity for citizens and interested parties to voice their requests for capital improvement projects.
Categories of Capital Projects
Capital projects are categorized into three areas: Department Capital Expenditures (operating budget), Capital Outlay (operating budget), and Capital Improvement Program (capital budget).
Capital Expenditures
These are items funded within the various operating departments’ budgets and may include purchases for office equipment, small tools and equipment, computer equipment, and mobile equipment over $1,000. This also may include maintenance to existing building and facilities under $25,000 and vehicles for the Police and Fire departments which are funded from the Public Safety Sales Tax operating budget.
Capital Outlay
These items are determined during the budget review process and are funded out of the non-departmental operating budget. This includes all vehicles and rolling stock except for the Police and Fire department vehicles. This also may include major maintenance of buildings and facilities that are greater than $25,000 but less than $50,000.
Capital Improvement Program
These items include improvements to infrastructure assets greater than $50,000 and the purchase of land and land improvements.
418
Project Evaluation
Inclusion in CIP
The process of evaluating projects is designed to identify which projects that demonstrate the greatest benefit to the City and its citizens. Each project submitted for the Annual CIP is carefully evaluated. There are several types of projects that are included in the CIP every year and the evaluation process for these project types often is as different as the projects themselves. Projects that are directly related to the function of a utility are based on long range major maintenance and replacement schedules for capital assets. Enterprise Funds such as the Water, Sewer, and Power & Light Funds are the direct source of funding for these projects. Three funding sources are directly related to projects funded from prior sales tax elections. The priority of these projects generally are based on commitments made as part of the ballot issue and are carefully monitored by resident oversight committees.
Projects were evaluated based on their ability to:
• Support and improve health and safety
• Demonstrate sustainability or long-term worth
• Have an economic benefit
• Provide universal access to citizens
• Improve the quality of the environment
• Improve the City’s image
• Improve the quality of life
• Improve the quality of transportation systems
• Foster community character, identity, and pride
• Maintain and preserve previous investments
Based on these objectives, projects are carefully reviewed and awarded a rating. Some projects benefit many criteria while others only benefit one.
Major Project Presentation
Projects included in this budget document are limited to a list of major projects. This includes all projects that are over $1,000,000 in funding for the current fiscal year, projects that are new to the current fiscal year, and/or the top five projects in project category. A full list and description of all capital projects can be found in the separate CIP document.
419
For Fiscal Year 2015-16, the City proposes projects totaling $27,172,916. These projects are separated into the following categories:
Funding for the Fiscal Year 2015-16 will be derived from the following sources:
Impact of Capital Spending on the Operating Budget
The City is allocating approximately $27 2 million on capital projects for the Fiscal Year 2015-16. The majority of the capital projects are for infrastructure improvements for various neighborhoods and thoroughfares across the City. Virtually all of the capital expenditures planned for Fiscal Year 2015-16 will be accomplished with contract services and will require minimal involvement of City construction forces. Requirements placed on contract administration, legal services and other administrative services related to the infrastructure upgrades will not exceed levels established in previous years, and thus no additional resources have been budgeted to administer these capital projects. Any additional operating budget impacts are identified by project on the following pages.
Category Amount Percent Street & Bridge Improvements $7,323,591 27 0% Community & Public Safety Improvements 1,990,000 7 3% Power & Light System 12,127,550 44 6% Sanitary Sewer System 1,701,775 6 3% Water System 4,030,000 14 8% Total $27,172,916 100%
Source Amount Percent Power and Light Fund $12,127,550 44 6% Sanitary Sewer Fund 1,701,775 6 3% Street Improvements Sales Tax Fund 7,323,591 27 0% Park Improvements Sales Tax Fund 435,000 1 6% Storm Water Sales Tax Fund 1,555,000 5.7% Water Fund 4,030,000 14.8% Total $27,172,916 100%
420
City of Independence, Missouri 2015-16 Operating Budget
Major Capital Project Descriptions
For Fiscal Year 2015-16
Street & Bridge Improvements
2015-16
Mandated by citizen vote on August 7, 2007. This is a yearly program to overlay streets on a city wide basis. This provides smoother streets for travel and reduces City maintenance costs.
No additional operating impact noted.
This project will relocate the intersection by moving Truman Road to the south. The new intersection will have improved sight distances and turn lanes that will address safety issues and future needs of the roadway.
No additional operating impact noted.
Fund
This is a city wide program to install thin concrete overlay on selected intersections. This program was approved as part of the August 7, 2007 street sales tax vote. The next projects include 35th & Sterling Ave. and 24 Hwy & River Blvd. intersections. Operating Impact: No additional operating impact noted.
Source: Street Improvements Sales Tax Fund
This is an ongoing program funded through the Street Sales Tax program. The alleys selected for this construction season are being evaluated at this time.
Operating Impact: No additional operating impact noted. Funding Source: Street Improvements Sales Tax Fund
This is an ongoing program to construct new sidewalks near parks. It is part of the street sales tax program and several project locations were selected prior to the sales tax renewal in 2007. The next Sidewalks to Parks location is near Fairmount Park.
Operating Impact: No additional operating impact noted.
Funding Source: Street Improvements Sales Tax Fund
Other Street & Bridge Improvements Projects not listed above
Overlay Program Project Number: 70111501 Prior Funding - $ FY 2015-16 Funding 5,498,591 $ Total Project Funding 5,498,591 $ Truman Rd. and M-78
Project Number:
Prior Funding 445,000 $ FY 2015-16 Funding 600,000 $ Total Project Funding 1,045,000 $ Concrete Intersection Program Project Number: 70110806 Prior Funding 1,256,000 $ FY 2015-16 Funding 300,000 $ Total Project Funding 1,556,000 $ Alley Rehabilitation Project Number:
Prior Funding 500,000 $ FY 2015-16 Funding 100,000 $ Total Project Funding 600,000 $ Sidewalks to
Parks
Project Number:
Prior Funding 792,700 $ FY 2015-16 Funding 150,000 $ Total Project Funding 942,700 $ 675,000
Highway
70111307
70111103
City
Improvements
70110807
$
Operating Impact:
Funding Source: Street Improvements Sales Tax Fund
Operating Impact:
Funding Source:
Improvements Sales Tax
Street
Funding
421
City of Independence, Missouri 2015-16 Operating Budget
Major Capital Project Descriptions
For Fiscal Year 2015-16
Community and Public Safety Improvements
This improvement project, designed in fiscal year 2014-15 and located in the Rock Creek Watershed will improve drainage in the adjacent residential neighborhood. Past investigations indicate the proposed work will also have significant impact on the sanitary sewer capacity.
No additional operating impact noted.
This project, located in the Rock Creek Watershed will improve residential drainage problems. Locations include 33rd St. & Hardy Ave., Englewood Heights at 24th St., and Linwood Ct. & 31st.
No additional operating impact noted.
Storm Water Improvements Sales Tax Fund
This project replaces the restroom facility at the Santa Fe Tennis Complex and fills cracks, color coats and repaints lines at Beckett park basketball courts, Blackburn Park tennis courts and Santa Fe Park tennis courts. Operating Impact: No additional operating impact noted.
Source: Park Improvements Sales Tax Fund
This project will repaint, add wall treatments, new furniture and replace lobby skylights in the Sermon Center lobby as well as provide funds for general facility and park repairs.
Operating Impact: No additional operating impact noted. Funding Source: Park Improvements Sales Tax Fund
70131504
- $
This project, located in the Adair Watershed will improve residential drainage problems. Locations include S. Drumm Ave. to S. Crane St.
Operating Impact: No additional operating impact noted.
Funding Source: Storm Water Improvements Sales Tax Fund
Other Community & Public Safety Improvements Projects not listed above
Liberty & Stone Project Number: 70131402 Prior Funding 90,000 $ FY 2015-16 Funding 400,000 $ Total Project Funding 490,000 $ Rock Creek Neighborhood
Project Number: 70131501 Prior Funding
$ FY 2015-16 Funding 450,000 $ Total Project Funding 450,000 $ Athletic Fields and Court
Project Number: 9719 Prior Funding 10,758,770 $ FY 2015-16 Funding 175,000 $ Total Project Funding 10,933,770 $ Park Revitalization Project Number: 9970 Prior Funding 4,593,625 $ FY 2015-16 Funding 200,000 $ Total Project Funding 4,793,625 $ Drumm to
Project Number:
Prior Funding
FY 2015-16 Funding 60,000
Total Project Funding 60,000
705,000 $
Projects
-
Renovations
Crane
$
$
Operating Impact:
Funding Source: Storm Water Improvements Sales Tax Fund
Operating Impact:
Funding Source:
Funding
422
City of Independence, Missouri 2015-16 Operating Budget
Major Capital Project Descriptions
For Fiscal Year 2015-16
Power
This project maintains equipment and includes the replacement of the existing 69kV transformers and distribution switchgear including the associated breakers, switches and relay in order to improve reliability of the transmission and distribution systems.
No additional operating impact noted.
Substation L Switchgear Replacement
This project maintains equipment and includes the replacement of the existing distribution switchgear including the associated breakers and relay equipment at Substation L and will improve the reliability of the distribution system.
Operating Impact: No additional operating impact noted.
Funding Source: Power and Light Fund
Substation H Combustion Turbine Hot Gas Path Inspection
This project maintains equipment and includes a major inspection of the hot gas path section and any necessary maintenance items of the two generating units located at Substation H. The efficiency and reliability of the two generating units will be improved.
Operating Impact: No additional operating impact noted.
Funding Source: Power and Light Fund
69 kV Transmission Line & Terminal Improvements
This project includes the design and construction of a new 69 kV transmission line from Substation B to Substation C and associated substation terminal equipment work. Upon installation of the line, reliability of the transmission system will be improved.
Operating Impact: No additional operating impact noted.
Funding Source: Power and Light Fund
Blue Valley 1 & 2 Turbine Inspection/Repair Project Number: 70201502
- $
This project includes a major inspection of the generators and turbines and necessary maintenance items on Units 1 and 2 at the Blue Valley Power Plant. The efficiency and reliability of these two generating units will be improved with this project.
Operating Impact: No additional operating impact noted.
Funding Source: Power and Light Fund
Other Power and Light Improvements Projects not listed above
Improvements Project Number:
Prior Funding 3,800,000 $ FY 2015-16 Funding 1,033,000 $ Total Project Funding 4,833,000 $
and Light System Substation J
70201310
Project Number:
Prior Funding - $ FY 2015-16 Funding 900,000 $ Total Project Funding 900,000 $
70201505
Project Number:
Prior Funding
$ FY 2015-16 Funding 1,300,000 $ Total Project Funding 1,300,000 $
70201501
-
Project Number:
Prior Funding
$ FY 2015-16 Funding 2,469,000 $ Total Project Funding 2,469,000 $
70201506
-
Prior Funding
FY 2015-16 Funding 2,000,000 $ Total Project Funding 2,000,000 $ 4,425,550 $
Operating Impact:
Funding Source:
Power and Light Fund
423
City of Independence, Missouri 2015-16 Operating Budget
Major Capital Project Descriptions
For Fiscal Year 2015-16
This project, located in the Rock Creek Watershed along Truman Rd. between Brookside and Crescent Avenues, will replace approximately 600 ft. of structurally deficient conduit.
This project will protect department facilities by upgrading security components of equipment to implement restricted access, intrusion detection and property surveillance for the responsible safekeeping of personnel and assets.
No additional operating impact noted.
This project provides for a phased compliance with federal SSI regulations designed to reduce particulate, metal, acidic and organic gas emissions from the wastewater treatment plant incinerator. The incinerators scrubber, feed system and operating controls should be upgraded this fiscal year.
Operating Impact: No additional operating impact noted.
Funding Source: Sanitary Sewer Fund
The current billing system has become outdated and difficult to maintain. A new billing system will provide a more user friendly platform and more compatibility with a multitude of modern software packages. This project will be completed in cooperation with Water, Water Pollution Control, Power & Light, Technology Services and the Finance Dept. to determine the best system for everyone's needs.
Operating Impact: Project funds are being secured for the new utility billing system. It is anticipated that there will be minimal operating impact for this project in the 2015-16 fiscal year.
Funding Source: Sanitary Sewer Fund
Other Sanitary Sewer Projects not listed above
Project Number:
Prior Funding
$ FY 2015-16 Funding 200,000 $ Total Project Funding 200,000 $ Security Improvements Project Number:
Prior Funding
$ FY 2015-16 Funding 75,000 $ Total Project Funding 75,000 $ Sewage Sludge Incinerator
Project Number: 70301505 Prior Funding
$ FY 2015-16 Funding 1,200,000 $ Total Project Funding 1,200,000 $ Utility Billing System Replacement Project Number: 70301502 Prior Funding
$ FY 2015-16 Funding 226,775 $ Total Project Funding 226,775 $ -
Sanitary Sewer System Truman Rd. Sanitary Sewer Improvements
70301503
-
70301504
-
Improvements
-
-
$
Impact: Funding
Sanitary Sewer
Operating
Source:
Fund
Operating Impact:
Funding Source: Sanitary Sewer Fund
424
City of Independence, Missouri 2015-16 Operating Budget
Major Capital Project Descriptions
For Fiscal Year 2015-16
This project will involve the necessary improvements of the 2 million gallon steel reservoir located at 35th St. and Weatherford. The existing reservoir was constructed in 1957 and is in need of several major and costly repairs and improvements.
No additional operating impact noted.
The current billing system has become outdated and difficult to maintain. A new billing system will provide a more user friendly platform and more compatibility with a multitude of modern software packages. This project will be completed in cooperation with Water, Water Pollution Control, Power & Light, Technology Services and the Finance Dept. to determine the best system for everyone's needs.
Operating Impact: Project funds are being secured for the new utility billing system. It is anticipated that there will be minimal operating impact for this project in the 2015-16 fiscal year.
Funding Source: Water Fund
The current Utility Customer Service location is often congested with walk-in customers, drive through backups and parking issues. This project will address these issues and help provide more efficient and effective service for customers. The planned improvements would include increased parking, a new drive thru and enhanced security for City staff.
Operating Impact: No additional operating impact noted.
Funding Source: Water Fund
Northern Blvd.. - 28th St. to 31 St.
70401504
This project provides for the replacement and upgrade of a section of water main that has experienced an excessive amount of breaks causing numerous interruptions of service for customers in the area.
Operating Impact: No additional operating impact noted.
Funding Source: Water Fund
70401505
This project is ongoing and funds the installation of additional mains, hydrants, valves and other appurtenances which will in turn provide better fire protection, improve water quality and lessen the impacts from unexpected main breaks and other service interruptions throughout the system.
Operating Impact: No additional operating impact noted.
Funding Source: Water Fund
Other Water Projects not listed above
$
Water System 35th St. Reservoir Project Number:
Prior Funding - $ FY 2015-16 Funding 2,000,000 $ Total Project Funding 2,000,000 $ Utility Billing System Replacement Project Number:
Prior Funding - $ FY 2015-16 Funding 500,000 $ Total Project Funding 500,000 $ Building Improvements Project Number:
Prior Funding
$ FY 2015-16 Funding 500,000 $ Total Project Funding 500,000 $
Project
Prior Funding
FY 2015-16 Funding 350,000
Total Project Funding 350,000
Project
Funding
FY 2015-16 Funding 150,000
Total Project Funding 150,000
530,000
70401501
70401502
70401503
-
Number:
- $
$
$ Distribution System Improvements
Number:
Prior
- $
$
$
Impact:
Funding
Operating
Source: Water Fund
425
Authorized Positions
426
2015-16 Operating Budget Authorized Positions
Positions Authorized by the Table of Organization
The number of full and part time employees (based on full time equivalents - FTE) has increased by 41.04 FTE positions since 2005-06 representing an average annual increase of .4% percent per year. For the General Fund the number of employees decreased by 22.31 FTE positions. During this same period, the number of positions within the Police Department increased by 15.41 FTE positions. Since 2005-06 the number of positions in the Utility Funds has increased by 17.49 FTE.
0 50 100 150 200 250 300 350 400 450 500 200506 200607 200708 200809 200910 201011 201112 201213 201314 201415 201516 Number of Positions (FTE) Fiscal Year Public Safety Other General Fund Utility Funds Other Funds 427
City of Independence, Missouri 2015-16 Operating Budget
Authorized Position Summary - by Department For
Budget Description 2009-10 2010-11 2011-12 2012-13 2013-14 2014-15 2015-16 DepartmentCity Council 10.00 10.00 10.00 10.00 10.00 10.00 10.00 City Clerk 6.00 6.00 6.00 6.00 7.00 7.00 7.00 City Manager 9.50 9.50 7.00 7.00 7.00 7.00 7.00 Tourism 4.41 4.41 4.66 4.66 5.66 8.18 14.18 National Frontier Trails Museum 6.00 6.00 5.75 5.75 5.75 5.00 0.00 Technology Services 22.00 22.00 23.50 23.50 23.50 24.50 25.50 Municipal Court 14.00 14.00 14.00 14.67 14.65 14.65 14.65 Law 8.50 8.00 8.50 8.50 8.50 8.51 8.51 Finance 25.00 25.00 23.50 23.50 23.50 23.00 23.00 Human Resources 7.50 6.50 6.50 6.44 7.44 6.75 6.75 Community Development 30.55 30.05 30.30 30.30 30.30 31.68 31.68 Police 305.40 305.90 302.65 302.91 304.91 303.91 303.91 Fire 174.00 174.00 174.00 174.00 174.00 175.00 175.00 Health 40.60 40.95 43.81 47.85 38.39 35.42 35.69 Water 101.65 101.65 93.65 93.42 92.42 93.42 93.42 Public Works 92.75 93.75 90.65 93.65 94.02 94.02 94.02 Water Pollution Control 83.00 83.00 83.00 83.00 83.00 83.00 86.20 Parks and Recreation 57.44 54.19 50.46 50.90 52.55 53.71 53.71 Power and Light 218.00 222.00 233.00 236.00 238.00 239.00 239.00 Total Authorized Positions 1,216.30 1,216.90 1,210.93 1,222.05 1,220.59 1,223.75 1,229.22 Less: Positions not Funded (19.05) (43.30) (69.82) (89.31) (83.31) (74.19) (76.87) Total Funded Positions 1,197.25 1,173.60 1,141.11 1,132.74 1,137.28 1,149.56 1,152.35 428
the Fiscal Years 2009-10 through 2015-16
City of Independence, Missouri
2015-16 Operating Budget
Authorized/Funded Positions Summary - All Funds
the Fiscal Years 2004-05 through 2015-16 Budget Description 2005-06 2006-07 2007-08 2008-09 2009-10 2010-11 2011-12 2012-13 2013-14 2014-15 2015-16 General FundCity Council 10.00 10.00 10.00 10.00 10.00 10.00 10.00 10.00 10.00 10.00 10.00 City Clerk 6.00 6.00 6.00 6.00 6.00 6.00 6.00 6.00 7.00 7.00 7.00 City Manager 7.50 10.50 10.50 10.50 9.50 9.50 7.00 7.00 7.00 7.00 7.00 Nat'l Frontier Trails Museum 6.00 6.00 6.00 6.00 6.00 6.00 5.25 5.75 5.75 5.00 0.00 Technology Services 20.00 21.00 21.00 21.00 21.00 21.00 22.50 22.00 22.00 23.00 24.00 Municipal Court 13.00 13.00 14.00 14.00 14.00 14.00 14.00 14.67 14.65 14.65 14.65 Law 5.75 6.88 6.88 6.50 6.50 6.00 6.25 6.25 6.25 6.23 6.23 Finance 25.00 25.15 24.15 24.15 24.15 24.15 22.65 22.65 22.65 22.15 22.15 Human Resources 7.50 7.50 7.50 7.50 7.50 6.50 6.50 6.44 7.44 6.75 6.75 Community Development 26.00 25.75 26.05 26.05 27.55 27.05 27.30 27.30 27.30 28.68 28.68 Police 281.50 281.50 283.00 290.40 290.40 292.90 288.65 289.91 291.91 296.91 296.91 Fire 173.25 173.25 173.25 173.25 173.25 173.25 173.25 173.25 169.25 169.75 173.75 Health 34.25 34.25 35.25 35.25 35.25 36.00 35.16 40.20 29.33 28.56 28.56 Public Works 82.00 82.00 82.00 82.00 82.00 83.00 79.90 79.90 80.27 80.27 80.27 Water Pollution Control 5.00 5.00 5.00 5.00 5.00 5.00 0.00 0.00 0.00 0.00 0.00 Parks and Recreation 36.70 35.53 32.65 32.65 33.46 31.71 28.71 29.15 27.85 27.10 27.10 Total Authorized General Fund 739.45 743.31 743.23 750.25 751.56 752.06 733.12 740.47 728.65 733.05 733.05 Less: Positions not Funded (3.50) (3.50) (3.50) (4.50) (18.05) (40.55) (60.05) (79.27) (73.77) (70.27) (69.77) Total Funded General Fund 735.95 739.81 739.73 745.75 733.51 711.51 673.07 661.20 654.88 662.78 663.28 Tourism Fund 4.41 4.41 4.41 4.41 4.41 4.41 4.66 4.66 5.66 8.18 14.18 Less: Positions not Funded - - - - - - - - - - (3.18) Total Funded Tourism Fund 4.41 4.41 4.41 4.41 4.41 4.41 4.66 4.66 5.66 8.18 11.00 Community Dev. Block Grant Act FundCommunity Development 3.00 2.50 2.70 2.70 2.00 2.00 2.00 2.00 2.00 2.00 2.00 Total CDBG Fund 3.00 2.50 2.70 2.70 2.00 2.00 2.00 2.00 2.00 2.00 2.00 HOME Program Fund 1.00 1.00 1.00 1.00 1.00 1.00 1.00 1.00 1.00 1.00 1.00 Street Maintenance Sales Tax Fund 0.00 0.00 0.00 0.00 0.00 0.00 0.00 3.00 3.00 3.00 3.00 Park Improv. Sales Tax Fund 12.59 17.12 25.29 25.29 23.98 22.48 21.75 21.75 24.70 26.61 26.61 Less: Positions not Funded (1.00) (0.50) (0.50) Total Funded Parks Sales Tax 12.59 17.12 25.29 25.29 23.98 21.48 21.75 21.75 24.70 26.11 26.11 Storm Water Sales Tax Fund 8.00 8.00 8.00 8.00 8.00 8.00 13.00 13.00 13.00 13.00 13.00 429
For
City of Independence, Missouri
2015-16 Operating Budget
Authorized/Funded Positions Summary - All Funds
For the Fiscal Years 2004-05 through 2015-16 Budget Description 2005-06 2006-07 2007-08 2008-09 2009-10 2010-11 2011-12 2012-13 2013-14 2014-15 2015-16 Grants Fund Law Department 0.50 0.37 0.37 0.25 0.25 0.25 0.25 0.25 0.25 0.28 0.28 Police 12.00 10.00 14.00 15.00 15.00 13.00 14.00 13.00 13.00 7.00 7.00 Fire 0.75 0.75 0.75 0.75 0.75 0.75 0.75 0.75 4.75 5.25 1.25 Health 6.00 7.70 6.25 7.10 5.35 4.95 8.65 7.65 9.06 6.86 7.13 Total Grants Fund 19.25 18.82 21.37 23.10 21.35 18.95 23.65 21.65 27.06 19.39 15.66 Power and Light FundTechnology Services 1.00 1.00 1.00 1.00 1.00 1.00 1.50 1.50 1.50 1.50 1.50 Power and Light 220.00 220.00 220.00 217.00 218.00 222.00 233.00 236.00 238.00 239.00 239.00 Total Power and Light Fund 221.00 221.00 221.00 218.00 219.00 223.00 234.50 237.50 239.50 240.50 240.50 Less: Positions Not Funded (3.00) Total Funded Power and Light Fund 221.00 221.00 221.00 218.00 219.00 223.00 234.50 237.50 236.50 240.50 240.50 Sanitary Sewer FundPublic Works 1.00 1.00 1.00 1.00 1.00 1.00 1.00 1.00 1.00 1.00 1.00 Water Pollution Control 70.00 70.00 70.00 70.00 70.00 70.00 70.00 70.00 70.00 70.00 73.20 Total Sanitary Sewer Fund 71.00 71.00 71.00 71.00 71.00 71.00 71.00 71.00 71.00 71.00 74.20 Water FundFinance 1.00 0.85 0.85 0.85 0.85 0.85 0.85 0.85 0.85 0.85 0.85 Water 98.48 97.65 98.65 101.65 101.65 101.65 93.65 93.42 92.42 93.42 93.42 Total Authorized Water Fund 99.48 98.50 99.50 102.50 102.50 102.50 94.50 94.27 93.27 94.27 94.27 Less: Positions Not Funded (1.00) (1.00) (1.00) (8.65) (8.92) (5.42) (2.42) (2.42) Total Funded Water Fund 99.48 98.50 99.50 101.50 101.50 101.50 85.85 85.35 87.85 91.85 91.85 Central Garage Fund Total Authorized Central Garage Fund 9.00 10.00 10.00 10.00 9.75 9.75 9.75 9.75 9.75 9.75 9.75 Less: Positions Not Funded (0.75) (1.12) (1.12) (1.12) (1.00) (1.00) Total Funded Water Fund 9.00 10.00 10.00 10.00 9.75 9.00 8.63 8.63 8.63 8.75 8.75 Workers' Compensation Fund 0.00 0.00 0.00 1.75 1.75 1.75 2.00 2.00 2.00 2.00 2.00 Grand Total Authorized - All Funds 1,188.18 1,195.66 1,207.50 1,218.00 1,216.30 1,215.90 1,210.93 1,222.05 1,220.59 1,223.75 1,229.22 Less: Positions not Funded (3.50) (3.50) (3.50) (5.50) (19.05) (43.30) (69.82) (89.31) (83.31) (74.19) (76.87) Grand Total Funded - All Funds 1,184.68 1,192.16 1,204.00 1,212.50 1,197.25 1,172.60 1,141.11 1,132.74 1,137.28 1,149.56 1,152.35 430
City of Independence, Missouri 2015-16 Operating Budget
Authorized Position Changes - All Funds For the Fiscal Years 2014-15 and 2015-16
Total Change Change Changes During for for Fund/Department/Function/Position Title 2014-15 2015-16 2015-16 Comments General Fund City Manager Public Management Intern II (1.00) (1.00) Community Liaison Specialist 1.00 1.00 Department Total - -National Frontiers Trails Museum Museum Administrator Curator (1.00) (1.00) positions transferred to Tourism Museum Operations Manager (1.00) (1.00) Museum Service Assistant (2.00) (2.00) NFTM Director (1.00) (1.00) Department Total - (5.00) (5.00) Technology Services GIS Analyst 1.00 1.00 Senior Network Systems Specialist (1.00) (1.00) Network System Engineer 1.00 1.00 Department Total - 1.00 1.00 Law Asst City Counselor III (1.00) (1.00) Utility Counselor 1.00 1.00 Department Total - -Finance Senior Accountant (1.00) (1.00) Accounting Supervisor 1.00 1.00 Controller (1.00) (1.00) Deputy Finance Director 1.00 1.00 Department Total - -Police Chief of Police Administrative Spec II (1.00) (1.00) Police Professional Standards Asst. 1.00 1.00 Department Total - -Fire Fire Operations Firefighter 4.00 4.00 transferred from Grants Fund Department Total - 4.00 4.00 position reclassified position reclassified position reclassified position reclassified position reclassified position reclassified 431
City of Independence, Missouri
2015-16 Operating Budget
Authorized Position Changes - All Funds For
Total Change Change Changes During for for Fund/Department/Function/Position Title 2014-15 2015-16 2015-16 Comments Health Comm. Disease & Immum. Public Health Prgm Coordinator (1.00) (1.00) Com Dis & Epidemiology Supv (1.00) (1.00) Disease Prevention and Control Public Health Prgm Coordinator 1.00 1.00 Comm. Dis & Epidemiology Supv 1.00 1.00 Department Total - -Parks and Recreation Administration Administrative Spec II (0.50) (0.50) Parks and Recreation Technician 0.50 0.50 Turf Facilities Maintenance Light Equipment Operator 1.00 1.00 transferred from George Owens Nature Park Senior Adult ServicesSeasonal Recreation Worker (0.30) (0.30) Kitchen Aide 0.30 0.30 George Owens Nature Park Light Equipment Operator (1.00) (1.00) transferred to Turf Facilities Maintenance Department Total - -General Fund Total - -Tourism Fund Tourism Leisure Sales & Marketing Manager 1.00 - 1.00 new position Museum Administrator Curator 1.00 1.00 transferred from NFTM Museum Operations Manager 1.00 1.00 transferred from NFTM Museum Service Assistant 2.00 2.00 transferred from NFTM NFTM Director 1.00 1.00 transferred from NFTM Fund Total 1.00 5.00 6.00 Park Improvements Sales Tax Fund Park Maintenance - Security Maintenance Aide (1.00) (1.00) Light Equipment Operator 1.00 1.00 Truman Memorial Building Administrative Spec II (0.50) (0.50) Parks and Recreation Technician 0.50 0.50 Recreation Specialist 1.00 1.00 transferred from Family Recreation Programs Family Recreation Programs Recreation Specialist (1.00) (1.00) transferred to Truman Building Fund Total - -transferred to Disease Prevention and Control transferred from Comm. Disease & Immum. position reclassified position reclassified position reclassified position reclassified 432
the Fiscal Years 2014-15 and 2015-16
City of Independence, Missouri
2015-16 Operating Budget
Authorized Position Changes - All Funds For
Total Change Change Changes During for for Fund/Department/Function/Position Title 2014-15 2015-16 2015-16 Comments Grants Fund Fire Firefighter (4.00) (4.00) transferred to General Fund Health Public Health Nurse 0.27 0.27 adjust funding for part time positions Fund Total - (3.73) (3.73) Power and Light Fund Administration Engineer P&L III (1.00) (1.00) Planning & Rates Analyst 1.00 1.00 Vehicle Maintenance Heavy Equipment Mech 1st Year (1.00) (1.00) Heavy Equipment Mech 2nd Year 1.00 1.00 Production Journeyman Pwr Plant Mech (1.00) (1.00) position deleted Power Plant Operator III (1.00) (1.00) position deleted Engineering Senior Engineer-P&L 1.00 1.00 new position System Operations Energy Mgmt Sys Coord II 1.00 1.00 new position Fund Total 2.00 (2.00)Sanitary Sewer Fund Administration Deputy Director- WPC 1.00 1.00 new position Environmental Compl Mgr. 0.70 0.70 temp/part-time position Treatment Facilities WPC Operations Supervisor 1.00 1.00 new position Collection System Maintenance WPC Collection Sys Supt 0.50 0.50 temp/part-time position Fund Total 3.20 - 3.20 Water Fund Administration & General Engineer III (1.00) (1.00) Engineer II 1.00 1.00 Fund Total - -Grand Total All Funds 6.20 (0.73) 5.47 position reclassified position reclassified position reclassified 433
the Fiscal Years 2014-15 and 2015-16
434
Appendix
City of Independence, Missouri
2015-16 Operating Budget
Demographic Statistics
Date of Organization: 1827 Date of Incorporation: 1849 Date Charter Adopted: December 5, 1961 Form of Government: City Council/City Manager Area: 78 Square Miles Population: 2006 - 115,953 2009 - 114,128 2012 - 117,213 2007 - 116,359 2010 - 121,212 2013 - 117,270 2008 - 109,159 2011 - 116,830 2014 - 117,240 Projected Retail Sales for FY 2014-15 $1,718,395,000 Registered Voters: 63,242 Number of Households: Number of Employees: 1,126 Form of Government: Council/Manager Fire Protection: Communications (served by): Number of Stations 10 Newspapers (daily) 1 No. of Authorized Employees 175 Radio Stations 1 Number of Vehicles 47 TV Stations 0 (cable TV service available) Police Protection: Recreation: Number of Stations 5 Park Acreage 843 No. of Authorized Employees 303.91 Number of Parks 46 Number of Vehicles 191 Community Centers 3 Fitness Centers 2 Education: Athletic Fields 51 Elementary and High 24,304 Water Parks 1 School enrollment Elementary Schools 27 Transportation: Junior High Schools 6 Bus Systems (operated 2 Senior High Schools 7 by KCATA & First Transit) Parochial & Private 5 Taxi Services 3 Pre-School & Kinger- 3 gartens Community Facilities: Teachers 1,535 Hospitals 1 Administrators 107 Beds 221 Colleges 2 Motels/Hotels 18 No. of Rooms 1,797 Bank/Credit Union Fac. 30 Public Works Infrastructure: Paved Streets (miles) 560 Water Mains (miles) 760 Electric Circuits (miles) 869 Water Consumption (daily avg.) 26.86 Electric Consumption (daily avg.) (in millions of gallons) (in Mwh) Sanitary Sewers (miles) 614 54,542 2,868 435
City of Independence, Missouri 2015-16 Operating Budget
Real Estate Tax Rate Per $100 assessed valuation) Real Estate Revenue by Levy Type Actual Current Est. Debt Levy Purpose 2014-15 Debt Levy Purpose 2014-15 General Purposes 0.5026 $ General Purposes 5,057,246 $ Public Health & Recreation 0.2368 Public Health & Recreation 2,382,722 Total 0.7394 $ Total 7,439,968 $ Indep. School District 5.7000 Jackson Co./State of Mo. 1.0464 Metro. Jr. College 0.2369 Indep. Square Special 0.5324 Benefit District Local Option Sales Taxes Current Estimate Budget 2014-15 2015-16 Sales Tax Revenue Amounts: Local Option Sales Tax (General Fund) 17,012,109 $ 17,095,404 $ Street Improvements Sales Tax 7,957,701 7,996,718 Park Improvements Sales Tax 3,978,851 3,998,359 Storm Water Improvements Sales Tax 3,978,851 3,998,359 Police Public Safety Sales Tax 2,126,514 2,136,926 Fire Public Safety Sales Tax 1,989,425 2,002,902 Other Related Sales Tax Rates: Zoo District Tax Rate 0.125 0.125 39th Street Transportation Development District Tax Rate 0.125 0.125 Crackerneck Transportation Development District Tax Rate 1.000 1.000 Mt. Washington Transportation Development District Tax Rate 1.000 1.000 Events Center Community Improvement District Tax Rate 0.750 0.750 State of MO 4.225 Jackson County 1.125 Zoo District 0.125 City of Independence 2.250 Total Sales Tax Collected in Independence (in percent) General Government 1.000 Street Improvements 0.500 Park Improvements 0.250 Storm Water Improvements 0.250 Police Public Safety 0.125 Fire Public Safety 0.125 City of Independence Tax (in percent) 436
Financial Statistics Real Estate Taxes
City of Independence, Missouri 2015-16 Operating Budget Financial
*See the City of Independence Revenue Manual for more information
Noland Road Community Improvement District Tax Rate 0.000 0.750 Transient Guest Tax 6.5% of Gross Daily Rent Cigarette Tax $2.50 per thousand Cigarettes Utility Franchise Fee 9.08% of Gross Receipts (3% for Cable TV) Business License Fee $25.00 Annual Gross Revenue under $25,000; $25.00 plus $0.29 per thousand Annual Gross Revenue over $25,000 (maximum fee $30,000) Motor Vehicle License $4.50 Motorcycles & Motortricycles 5.00 Passenger Cars 6.00 Commercial Vehicles and Recreational Vehicles General Obligation Bonds - $ Revenue Bonds Power and Light 129,241,040 Water 33,375,886 Sanitary Sewer 101,153,512 Events Center 84,160,924 Simon Property Group LP 26,224,136 $ 2.05% Cole EDD Mt. Independence LLC 8,963,343 0.70% Space Center of Kansas City 6,730,787 0.53% Southern Union Company 5,953,893 0.46% Sprint 4,893,443 0.38% AT&T 4,813,889 0.38% Unilever Bestfoods NA 4,737,385 0.37% Mansion Apartment 4,530,213 0.35% Centerpoint Medical Center 4,125,533 0.32% Comcast Cablevision 3,685,525 0.29% Total Assessed Valuation Major Employers Alliant Tech Systems 2,000 3.70% Independence School District 2,000 3.70% Centerpoint Medical Center 1,600 2.96% City of Independence 1,126 2.08% Government Employee 650 1.20% Hospital Association Rosewood Health Center at 400 0.74% the Groves Burd & Fletcher 350 0.65% Jackson County Circuit Court 274 0.51% Mid-Continent Library 220 0.41% Unilever Bestfoods NA 190 0.35% 74,658,147 $
Debt
Fee Structure*
Statistics
Outstanding
as of March 31, 2015
Assessed Valuation No. of Employees % of Total Assessed Valuation Major Taxpayers % of Total Employment 437
ACRONYMS
ADA - Americans with Disabilities Act
AED - Automatic External Defibrillator
ALS - Advance Life Support
APWA - American Public Works Association
BLR - Business and Legal Resources
BLS - Basic Life Support
CAFR - Comprehensive Annual Financial Report
CDBG - Community Development Block Grant
CERT - Community Emergency Response Team
CEU - Continued Education Unit
COAD - Community Organizations Active in Disasters
DARE - Drug Abatement Resistance Education
DBA - Doing Business As
DEA - Drug Enforcement Administration
DEU - Drug Enforcement Unit
DWI - Driving While Intoxicated
EEOP - Equal Employment Opportunity Plan
EMPG - Emergency Management Planning Grant
EMS - Emergency Medical Services
EMT - Emergency Medical Technician
EOC - Emergency Operations Center
438
ACRONYMS
EOD - Explosive Ordinance Disposal Team
EOP - Emergency Operations Plan
FACT - Failure to Appear in Court
FM/HR - Financial Management/Human Resources
FTE - Full time Equivalent
GASB - Governmental Accounting Standards Board
GFOA - Government Finance Officers Association
GIS - Geographic Information Systems
GPS - Global Positioning System
H.I.D.T.A - High Intensity Drug Trafficking Area
HMO - Health Maintenance Organization
HRMA - Human Resources Management Association
ICED - Independence Council for Economic Development
I.D.E.A. - Individual Development and Elevated Action
IPMA-HR - International Public Management Association for Human Resources
JDE - JD Edwards System
KCATA - Kansas City Area Transportation Authority
LCG - Local Coordination Guide
LLC - Limited Liability Corporation
LP - Limited Partnership
MARC - Mid-America Regional Council
439
ACRONYMS
MHz - Megahertz
NFTM - National Frontier Trails Museum
NIMS - National Incident Management System
NRP - National Response Plan
NWCDC - Northwest Community Development Corporation
OPEB - Other Post-Employment Benefits
PLC - Programmable Logic Controllers
P.O.S.T. - Police Officers Standards and Training
PPE - Personal Protective Equipment
PPO - Preferred Provider Organization
RACES - Radio Amateurs Response Team
RFP - Request For Proposal
SCBA - Self Contained Breathing Apparatus
SEMA - State Emergency Management Agency
SRT - Special Response Team
TDD - Transportation Development District
TIF - Tax Increment Financing
USGS - United States Geological Survey
WPC - Water Pollution Control
440
GLOSSARY OF BUDGET AND FINANCE TERMS
Account - A sub-unit of the accounting system used to record the financial activity of similar transactions.
Accounting
System - The total set of records and procedures that are to record, classify, and report information on financial status and operations.
Accrual
Accounting - A basis of accounting in which revenues and expenditures are recorded at the time they are earned or incurred as opposed to when cash is actually received or spent. For example, in accrual accounting, a revenue which was earned between June 1 and June 30, but for which payment was not received until July 10, is recorded as a revenue of June rather than July.
Adopted Budget - Revenues and appropriations approved by the City Council in June for the following fiscal year.
Ad Valorem Tax - A tax levied on the assessed valuation of real property.
Appropriation - An authorization made by the Council that allows the City to incur obligations and to make expenditures of resources for the procurement of goods and services.
Assessed
Valuation - A value that is established for real or personal property for use as a basis for levying property taxes.
Assets - Resources owned or held by the City which have a monetary value.
Balanced An operating budget in which the operating revenues plus beginning Budget - fund balance are equal to, or exceed, operating expenditures.
Beginning/ Unencumbered resources available in a fund from the prior/current Ending Fund year after payment of the prior/current year’s expenses. Not Balance - necessarily cash on hand.
Bonds - Debt instruments representing a promise to pay a specified amount of money at a specified time and at a specified periodic interest rate. Bonds are used to finance major capital projects or adverse judgments.
441
GLOSSARY OF BUDGET AND FINANCE TERMS
Budget
(Capital Improvement) - A Capital Improvement Budget is a separate budget from the operating budget. Items in the Capital Budget are usually construction projects designed to improve the value of the government assets. Examples of capital improvement projects include roads, sewer lines, buildings, recreational facilities and large scale remodeling. The Council receives a separate document that details the Capital Budget costs for the upcoming fiscal year. The Capital Budget is based on a Capital Improvement Program (CIP).
Budget
(Operating) - A plan of financial operation embodying an estimate of proposed expenditures for a given period (a fiscal year) and the proposed means of financing them (revenue estimates). The term is also sometimes used to denote the officially approved expenditure ceilings under which the departments operate.
Capital Major construction, repair of or addition to buildings, parks, streets, Improvement - bridges and other City facilities.
Capital
A multi-year plan for capital expenditures needed to maintain and Improvement expand the public infrastructure. It projects the infrastructure needs Program (CIP) - for a set number of years and is updated annually to reflect the latest priorities, cost estimates, or changing financial strategies.
Capital Outlay - Represents expenditures which result in the acquisition or addition to fixed assets including land, buildings, improvements, machinery or equipment. Most equipment or machinery expenditures are included in the Operating Budget. Capital improvements such as acquisition of land and related construction and engineering fees are generally in the Capital Budget.
City Council - The Mayor and six Council members collectively acting as the legislative and policy making body of the City.
Contingency - A budgetary appropriation set aside for emergencies and expenditures not planned for otherwise.
Debt Service - Debt Service expenditures are the result of bonded indebtedness of the City. Debt Service expenditures include principal, interest, fiscal agent's fees, and bond reserve requirements on the City's outstanding debt.
442
GLOSSARY OF BUDGET AND FINANCE TERMS
Department - A major administrative division of the City that has management responsibility for an operation or a group of related operations within a functional area.
Depreciation - (1) Expiration in the service life of capital assets attributable to wear and tear, deterioration, action of the physical elements, inadequacy or obsolescence. (2) That portion of the cost of a capital asset which is charged as an expense during that particular period.
Designated
Fund Balance- An account used to show that a portion of fund balance was segregated for a specific purpose. The account is not legally restricted and is, therefore, available for general appropriation.
Encumbrances - Obligations in the form of purchase orders, contracts or salary commitments that are chargeable to an appropriation and that an appropriation is restricted. They cease to be encumbrances when paid or when an actual liability is created.
Enterprise Fund - Separate financial accounting used for government operations that are financial and operated in a manner similar to private sector operations. Enterprise funds for the City are Power & Light, Sanitary Sewer and Water.
Estimated
Revenue - The amount of projected revenue to be collected during the fiscal year.
Expenditure - This term refers to the outflow of funds paid or to be paid for an asset obtained or goods and services obtained despite when the expense occurs. This term applies to all funds. Note: An encumbrance is not an expenditure. An encumbrance reserves funds to be expended.
Fiscal Year - The period signifying the beginning and ending period for recording financial transactions. The Charter specifies July 1 to June 30 as the fiscal year.
Fixed Assets - Assets of a long-term character which are intended to be held or used, such as land, buildings, machinery, furniture and other equipment.
Full Time The decimal equivalent of a part-time position converted to a full-time Equivalent (FTE) - basis, i.e., one person working half time would count as 0.5 FTE.
443
GLOSSARY OF BUDGET AND FINANCE TERMS
Fund - An independent fiscal and accounting entity with a self-balancing set of accounts recording cash or other resources with all related liabilities, obligations, reserves, and equities that are segregated to carrying on specific activities or attaining certain objectives.
Fund Balance - The Fund Balance is the excess of a governmental fund's assets over its liabilities. A negative fund balance is a deficit.
General Fund - The largest governmental fund, the General Fund accounts for most of the financial resources of the general government. General Fund revenues include property taxes, licenses and permits, local taxes, service charges, and other types of revenue. This fund usually includes most of the basic operating services, such as fire and police protection, finance, data processing, parks and recreation, public works and general administration.
Goal - A statement of broad direction, purpose, or intent based on the needs of the community.
Governmental
Fund - funds generally used to account for tax-supported activities. There are five different types of governmental funds. The City of Independence’s governmental funds include the general fund, other general purpose funds, special revenue funds, debt service funds, and capital projects funds.
Grant - A contribution of assets (usually cash) by one governmental entity (or other organization) to another to support a particular function. Grants may be classified as either categorical or block depending upon the amount of discretion allowed the grantee.
Interfund Transfer of resources between funds that are not recorded as Transfer - revenues to the fund receiving or expenditures to the fund providing.
Internal Service
Funds - Proprietary funds used to account for the furnishing of goods or services by one department or agency to other departments or agencies on a cost-reimbursement basis; for example, the Central Garage.
Line Item - An individual expenditure category listing in the budget (personal services, commodities, contractual services, etc.)
444
GLOSSARY OF BUDGET AND FINANCE TERMS
Major Fund - A governmental fund or enterprise fund reported as a separate column in the basic fund financial statements. The general fund is always a major fund.
Modified Accrual Under the modified accrual basis of accounting, revenues are Accounting - recognized when susceptible to accrual (when they become both measurable and available). “Measurable” means the amount of the transaction can be determined and “available” means collectible within the current period or soon enough thereafter to be used to pay liabilities of the current period. A one-year availability period is used for revenue recognition for special assessment revenues. Anticipated refunds of such taxes are recorded as liabilities and reduction in revenue when measurable and their validity seems certain. Expenditures are recorded when the related fund liability is incurred except for principal and interest on general long-term debt, which are recorded as fund liabilities when due.
Non- Program costs that do not relate to any one department, but Departmental - represent costs of a general, citywide nature, i.e. debt service.
Object of Expenditure - Expenditure classifications based upon the types or categories of goods and services purchased. Objects of expenditures are:
*100 - Personal Services (salaries and wages);
*200 - Services (utilities, maintenance contracts, travel)
*300 - Supplies;
*400 - Capital (automobiles, trucks, computers)
Objective - A program objective is an operationalized statement of a program goal, containing specific descriptions of desired results. An objective states a result in which the achievement is measurable within a given time frame and cost parameter. Objectives usually contain verbs such as “increase,” “reduce,” or “maintain.”
Ordinance - A formal legislative enactment by the governing board of the City. If it is not in conflict with any higher form of law, such as a State statute or constitutional provision, it has the full force and effect of law within the boundaries of the City to which it applies. The difference between an ordinance and a resolution is that the latter requires less legal formality and has a lower legal status.
445
GLOSSARY OF BUDGET AND FINANCE TERMS
Payment-In-Lieu- An amount charged enterprise operations equivalent to the City Of-Taxes - property taxes that would be due on a plant or equipment if the enterprise operations were “for profit” companies.
Performance Financial ratios and nonfinancial information that identifies efforts, Indicators - and gauges efficiencies and accomplishments of governments in providing services.
Performance Specific quantitative measures of work performed within an activity Measures - or program. Also, a specific quantitative measure of results obtained through a program or activity.
Proposed Proposed level of expenditures/revenue/FTEs as outlined in the Budget - proposed budget document. This is the City Manager’s recommended budget, which will be considered by the City Council for approval.
Proprietary Fund - In governmental accounting, one having profit and loss aspects; therefore it uses the accrual rather than modified accrual accounting method. The two types of proprietary funds are the enterprise fund and the internal service fund.
Reserved Fund
Balance - An account used to show that a portion of a fund's balance is legally restricted for a specific purpose and is, therefore, not available for general appropriation.
Resolution - A special or temporary order of a legislative body: an order of a legislative body requiring less legal formality than an ordinance or statute.
Resources - Total dollars available for appropriations including estimated revenues, fund transfers, and beginning fund balances.
Retained An equity account reflecting the accumulated earnings of an Earnings - enterprise or internal service fund.
Revenue - Funds that the government receives as income. It includes such items as tax payments, fees from specific services, receipts from other governments, fines, forfeitures, grants, shared revenues and interest income.
446
GLOSSARY OF BUDGET AND FINANCE TERMS
Sources - That portion of Revenues and Fund Balance (Resources) that are identified to balance the budget.
Special Property taxes incurred by property owners within a designated area Assessments - for improvements that benefit the area. A majority of the affected property owners must approve the formation of the benefit district.
Special Revenue Fund - A fund used to account for the proceeds of specific revenue sources (other than expendable trusts of major capital projects) that are restricted to expenditure for specified purposes.
Undesignated
Fund Balance - That portion of the fund balance that has neither been restricted nor designated for a specific purpose. The account is available for general appropriation.
User Fees - Fees charged to users of a particular service provided by the City.
Uses - The appropriations and transfer authorizations that create the budget for each Fund.
Working Capital
(Designated) - An account within the fund balance of the General Fund in which a certain amount of resources were set aside for purposes of maintaining a positive cash flow, shortfalls in the revenue projections, and emergencies during the fiscal year.
447
