
2016-17 Adopted Operating Budget
OPERATING BUDGET
City of Independence, Missouri
FOR THE FISCAL YEAR
July 1, 2016 through June 30, 2017
MAYOR
Eileen N. WeirCITY COUNCIL
Karen M. DeLuccie
Chris Whiting
John Perkins
Curt Dougherty
Dr. Scott Roberson
Tom Van Camp
At-Large
At-Large
District #1
District #2
District #3
District #4
CITY MANAGER
John Pinch
The Government Finance Officers Association of the United States and Canada (GFOA) presented a Distinguished Budget Presentation Award to the City of Independence, Missouri for its annual budget for the fiscal year beginning July 1, 2015. In order to receive this award, a governmental unit must publish a budget document that meets program criteria as a policy document, as an operations guide, as a financial plan, and as a communications device.
This award is valid for a period of one year only. We believe our current budget continues to conform to program requirements, and we are submitting it to GFOA to determine its eligibility for another award.
TABLE OF CONTENTS
Guide to Independence’s Budget Document Budget Message .................................................................................................................. i City Vision, Goals and Objectives ...................................................................................... 1 Financial Policies .................................................................................................................3 Budget Procedures & Polices ..............................................................................................6 Budget Calendar ............................................... ..12 Equal Employment Opportunity Plan ................................................................................14 General Fund Financial SummaryBudget Summary .....................................................................................................17 Fund Balance History ..............................................................................................18 Revenue Summary...................................................................................................20 Summary of Appropriations Allocated by Department and Division .....................23 Summary of Appropriations by Type of Expenditure ............................................25 Summary of Operating Transfers/Designations of Fund Balance...........................27 Authorized Positions .............................................................................................. 28 Operating Departments: City Council .............................................29 City Clerk .................................................35 City Manager .........................................................................................................44 Technology Services ..............................................................................................48 Municipal Court ....................................................................................................56 Law .........................................................................................................................61 Finance ..................................................................................................................69 Human Resources ....................................83 Community Development .......................91 Police .......................................................117 Fire ........................................................................................................................157 Health ...................................................................................................................178 Public Works........................................................................................................199 Parks and Recreation ..........................................................................................219 Other AccountsNon-Departmental (All Funds) .............................................................................256 Utility Fund Power and Light Fund Budget Summary ...................................................................................................282 Historical Data and Budgeted Positions Summary ...............................................283 Revenue Summary.................................................................................................284 Rate Survey with Area Utilities ............................................................................285 Power and Light Department .............................................................................286 Debt Service ..........................................................................................................319 Capital Budget ......................................................................................................320
TABLE OF CONTENTS (Continued)
Sanitary Sewer Fund Budget Summary ...................................................................................................322 Historical Data and Budgeted Positions Summary ...............................................323 Revenue Summary.................................................................................................324 Rate Survey with Area Utilities ............................................................................325 Water Pollution Control Department................................................................326 Debt Service ..........................................................................................................345 Capital Budget .......................................................................................................346 Water Fund Budget Summary ...................................................................................................348 Historical Data and Budgeted Positions Summary ...............................................349 Revenue Summary.................................................................................................350 Rate Survey with Area Utilities ............................................................................351 Water Department ..............................................................................................352 Debt Service ..........................................................................................................367 Capital Budget .......................................................................................................368 Other Funds Tourism Fund Budget Summary ..........................................................................369 Street Improvements Sales Tax Fund ..................................................................371 Park Improvements Sales Tax Fund ....................................................................374 Storm Water Improvements Sales Tax Fund .......................................................377 Police Public Safety Sales Tax Fund ...................................................................380 Fire Public Safety Sales Tax Fund .......................................................................382 Grants Fund ..........................................................................................................384 Budget Summary - CDBG, HOME Program, Worker’s Compensation, Central Garage, and Staywell Healthcare Funds ..................385 Revenue Summary - Tourism, CDBG, HOME Program, Worker’s Compensation, Central Garage, Staywell Health Care Funds, and Sales Tax Fund ........................................................................................387 Combined Summary - All Funds Budget Summary ...................................................................................................390 Summary of Sources and Uses by Fund and Fund Type.......................................392 Estimated Revenues ..............................................................................................396 Appropriations .......................................................................................................401 Debt Service ..........................................................................................................404 Capital Budget .......................................................................................................412 Authorized Positions .............................................................................................418 AppendixDemographic Statistics ..........................................................................................423 Financial Statistics .................................................................................................424 Acronyms ..............................................................................................................426 Glossary of Budget and Finance Terms ................................................................429 (Operating departments are shown in bold letters)
July1, 2016
Introduction
This budget complies with section 3.3 (5) of the City charter, which requires that the City Manager advise the City Council on the financial condition and future needs of the City. In accordance with Section 8.2 of the City Charter, I previously submitted a proposed operating budget for the City of Independence, for fiscal year July 1, 2016 through June 30, 2017. A public hearing on the budget was conducted on May 16, 2016 and two additional budget review sessions were conducted by the City Council to review my previously submitted proposed budget. As required by the City Charter, the budget is balanced . The City has again received the GFOA Distinguished Budget Presentation Award. The award is designed to recognize jurisdictions committed to providing the highest quality budget documents, which clearly reflect full disclosure on how the city is utilizing taxpayer money For 30 consecutive years Independence has been recognized for its budget documentation to the citizens of Independence.


Economic Constraints
The adopted budget for fiscal year 2016-17 is balanced, but economic factors continue to be a challenge. Several factors have contributed to a decrease in the City’s revenues. The mild summer and winter weather resulted in a drop in utility revenues; changes in how the cable, internet and telephone industries operate have eroded the revenues received from these providers; and the continued shift to internet shopping by consumers affects the sales tax revenues to the General Fund. Good financial management is crit ical, as the cost of providing services increases and resources are necessary to continue to provide these services.
i 111 EAST MAPLE • PO . BOX 1019 ·INDEPENDENCE,MISSOURI 64051 - 0519 www.ci.independence mo us • (816) 3 2 5 -7000
Honorable Mayor and Members of the City Council
As The Falls at Crackerneck Creek redevelopment project continues its slow growth, the City took advantage of lower interest rates in the marketplace and re-funded some bonds, minimizing the impact of funding the debt service. This re-funding will result in decreased costs to the General Fund should the anticipated tax revenues from the project continue to perform below the required level.
Although City revenues remain fairly flat, the streets sales tax approved by voters to run to December 31, 2019 will continue to fund Public Works' plan to overlay all streets in the City throughout the life of the tax. Priorities are updated each year, and the recentlyapproved $6 million 2016 Street Overlay Contract will improve 55 center-line miles of streets in the next fiscal year.
Independence voters this past fiscal year approved continuation through December 31, 2028 of the 1/8th of one cent sales tax for the Fire Department and the 1/8th of one cent sales tax for the Police Department. This funding will allow vehicles and equipment to remain up to date and capital projects to move forward. Additionally, the much-needed improvements and repairs to the Firing Range at Police Headquarters will be accomplished through the Police Sales Tax.
Energy Efficiency
When the City Council passed Resolution 5933, they decl ared their support for renewable electric energy and identified goals for city programs and policies. The Council set a goal to have 10% of the electric energy provided by the City's electric utility supplied from sources that are not carbon-based by the year 2018.
Renovations have begun on the former Medical Center of Independence doctor's office building as it becomes the administrative headquarters for Independence Utilities, including the Power & Light, Water and Water Pollution Control departments. The project will be Platinum LEED certified, utilizing energy efficient design, recycled building material, alternative fuels and will offer an education center with demonstration abilities. The renovated building will include a customer utility billing service center with drive-through capability.
ii
Economic Development
Economic development efforts have been focused heavily on creating the necessary inventory required to attract and retain quality jobs in Independence. In Fiscal Year 2015-2016 the overall capital investment and job creation in the community held steady. Working with the Ennovation Center, a concept was developed to create a Graduate Center for Food Production and Manufacturing. This project is planned to assist growing food production companies with second stage development, encouraging their continued presence in Independence.
Emphasis was also put on evaluating land and market area for a new industrial park. In addition, the State of Missouri has endorsed Lake City Army Ammunition Plant as a Missouri Certified Site for Development. The Noland Road CID adopted t his past fiscal year has begun planning for improvements along the corridor and innovati ve ways in which to assist various area businesses.
Technology
Technology continues to play an important role for operations of the City. Improvements offer new efficiencies as we join the "What Works Cities" initiative, developing and implementing advancements including the Performance Dashboard and an Open Data Portal. The in-house redesign of the City’s website gained national recognition when it was awarded First Place in the Best of the Web for municipal websites. Additionally, for the thirteenth year, Independence received recognition as one of the most technology-advanced cities in America by being ranked tenth in its population category by the Center for Digital Government. The annual survey recognizes municipalities which successfully incorporate information technology into operations.
The City continues to utilize the latest in technology with implementation of the CityWorks Asset Management System and introduction of a new Utility Billing System scheduled to "go live" in the next fiscal year. Additionally, t his budget includes funding to begin the upgrade of the City’s financial management system software.
iii
Employee Benefits
A major portion of the budget for employee benefits continues t o be the cost of providing health care to employees and retirees. The Stay Well Health & Wellness Center opened for business on January 28, 2015. Utilization of the Health & Wellness Center by covered employees and eligible retirees, combined with a decrease in hi gh cost claims and the stability of the Stay Well Fund balance, has resulted in reduced costs to the Stay Well Fund. The adopted budget reflects no anticipated increases in premium costs for FY 2016-2017.
As a part of the City's adjustment to economic conditions during the last several years, 76.7 FTE positions - representing approximately 6.2% of the to tal authorized positions - have been left unfunded in the proposed budget. Meeting the challenges caused by understaffing is a daily occurrence, but our employees remain dedicated to providing the highest quality service to our citizens.
Budget Review
The budget accounts for all revenues received from the sale of utility services, property taxes, sales taxes (including general sales tax, park, st reet, police, fire and storm water sales taxes), service fees, grants, etc. The total adopted operating and capital budget for the City, including utilities, is $3 23,256,904 which is an increase of $10,028,370 (3.2%) from the 2015-2016 budget. The operating porti on of the total budget increased by $7,976,333 (2.8%).
General Fund
The General Fund is the tax and fee supported portion of the City's budget. At $74,783,776, it is 23.1% of the total budget, and pays for most of the City's operations. Areas not financed by the General Fund include the Power and Light Department, the Water Pollution Control Department, the Water Department and the Tourism Program, which are operated from enterprise funds.
General Fund revenues are projected to be $1,860,628 less than the adopted budget in fiscal year 2015-16. The following table provides a General Fun d revenue comparison for the adopted 2015-16 budget to the r evised 2015-16 budget and the adopted 2016-17 budget.
iv
General Fund Revenue Comparison
Sales taxes are one of the largest components of the City’s General Fund revenue. Sales tax collections are projected to remain relatively flat, due to the economy and redistribution of retail sales due to additional commercial development throughout Eastern Jackson County, reflecting an increase of $177,500 or one percent compared to original projections for the current fiscal year.
General Fund Highlights
A. Undesignated Fund Balance. For fiscal year 2016-2017, the fund balance is projected to be $3,731,934. The projected fund balance meets the requirements of City Policy (Resolution #4948) to maintain an undesignated fund balance for the General Fund equivalent to 5% of revenues.
B. Public Safety. The budget for the Police Department is $2 7,066,600 million. The budget for the Fire Department is $17, 782,425 million. Approximately 60% of the General Fund is designated for these two departments.
C. Employee Benefits. There are no budgeted increases to the funding for health care insurance costs and dental insurance premiums. Costs are anticipated to remain steady throughout the fiscal year.
v
Source Adopted Budget 2015-16 Revised Estimate Adopted Budget 2016-1 7 Property Taxes $ 7,516,500 $ 7,556,184 $ 7,561,000 Sales & Use Taxes 17,570,404 18,196,194 18,352,500 Utility Franchise Fees 11,369,000 8,876,109 9,107,000 PILOTS 18,868,596 18,530,344 19,103,195 Licenses & Permits 3,403,687 3,377,293 3,759,869 Grants & Shared Revenues 5,275,139 5,299,615 5,289,812 Charges for Services 2,020,770 1,954,406 2,002,725 Fines & Court Costs 4,921,960 4,023,000 3,623,000 Interest Income 95,900 96,500 101,500 Interfund Charges 4,741,289 4,741,289 5,073,016 Other Revenue 519,000 463,000 468,000 Total Revenue $76,302,245 $73,113,934 $74,441,617
D. Technology Updates. Approximately $149,700 is included to fund scheduled replacement of electronic equipment such as file servers, microcomputers and printers. Additionally, $120,000 is budgeted to begin the replacement of our Financial Management System. This represents the first (of five) year's purchase payments of the General Fund's portion of the system cost.
Capital Outlay
The adopted 2016-17 budget includes $376,700 for capital outlay from the General Fund. This is a reduction of $23,300 from the c urrent budget.
Storm Water Sales Tax
The budget includes revenues of $4,180,000, an increase of 6.6% compared to last year, from the ¼ of 1% Storm Water Improvement Sales Tax to fund needed storm water improvements. Collections of the current tax began January 1, 2011 and received voter approval on August 3, 2010, to be continued until repealed. The operating and capital budgets propose expenditures of $5,101,625 for the 2016-17 fiscal year. The capital budget of $1,495,000 f unds several projects, including: Storm Water Sales Tax Fund
vi
Department Description Amount Technology Services PC, Monitor and File Server Replacement $149,700 Public Works Vehicles 96,000 Public Works Building Repairs 131,000 Total$376,000
Capital Budget Summary Project Number Project Description Amount 70131504 Drumm to Crane $ 350,000 70131501 Rock Creek Neighborhood Projects 700,000 NEW 19th & Norwood 195,000 NEW Walnut Gardens, RD Mize & Gateway Dr. 170,000 NEW Blue Lawn- E. 31st-E. 32nd- East of Arlington 80,000 Total$1,495,000
Street Improvement Sales Tax
The Street Improvement Sales Tax was initially approved by the voters in August 2002. The current ½ of 1% sales tax collection began January 1, 2009 and received voter approval in August 7, 2007, to be continued through December 31, 2019. The sales tax provides funding for construction, maintenance and repair of streets, bridges, culverts and traffic signals. This budget includes $7,515,537 for several projects, including the following:
Park Improvement Sales Tax
The Parks and Recreation Sales Tax was approved by the voters in August 2002. The sales tax collection began on January 1, 2004 and is of 1%. On August 3, 2010 the Independence voters approved extending the full ¼ of 1% until repealed. Estimated revenues this fiscal year will be $4,180,000. Expenditures will include capital of $315,000 for park revitalization projects. Other expenditures will support the operation of the Truman Memorial Building, the Palmer Senior Center, Adventure Oasis Water Park and the Athletic Complex.
vii
Improvement
Capital Budget Summary Project Number Project Description Amount 70111601 2015-16 Overlay Program $ 5,725,537 70111601 2016-1 7 Overlay Program 900,000 70111103 Alley Rehabilitation 200,000 70111501 39th & Noland 180,000 70111307 78 Highway and Truman 220,000 7011402 Crysler Complete Streets 150,000 70110409 Operation Green Light 40,000 70110807 Sidewalks to Parks Improvements 100,000 Total $7,515,537
Street
Sales Tax Fund
Police Department Public Safety Sales Tax
The Police Department Public Safety Sales Tax was approved by the voters in August 2004. The collection of the 1/8th of 1% sales tax began on January 1, 2005, and will continue through December 31, 2016. On April 5, 2016 voters approved an extension of the sales tax through December 31, 2028. Revenues are projected to be $2,210,000. Expenditures of $2,358,741, which includes funds carried over from the previous year, are recommended. These funds will be used to purchase equipment and services for the department.
Fire Protection Sales Tax
The Fire Protection Sales Tax was passed by voters in August 2004. The Fire Protection Sales Tax funds are dedicated for the purchase, construction, repair, maintenance and reconstruction of Fire Department facilities and equipment, and for Fire Department training. The collection of the 1/4 of 1% sales tax began January 1, 2005, continued through December 31, 2008, when it was reduced to 1/8th of 1% through December 31, 2016. The 1/8th of 1% tax was then extended by a vote of the people through December 31, 2028. Revenues are projected to be $2,100,000.
Sanitary Sewer Fund
The average monthly bill for sanitary sewer service in Independence is the sixth lowest as compared to 12 other communities in the metropolitan area. Sanitary sewer revenues are projected to be $25,453,425, an increase of approximately 2.3%, as compared to the current year. Adopted operating budget expenditures from the fund are $26,817,708. The budget also includes funding of $1,553,000 for capital projects, including:
viii
Sanitary Sewer Fund Capital Budget Summary Project Number Project Description Amount NEW Pacific Avenue Sanitary Main Replacement $ 195,000 NEW Kentucky 1 Pump Station Demolition 60,000 NEW RCTP Facilities Roof, Ceiling & Lighting 608,000 NEW Primary SludgeGrinders & Flowmeter Replacement 90,000 NEW Financial Management System Replacement 600,000 Total $1,553,000
Power & Light Fund
Power & Light total revenues for fiscal year 2016-17 are estimated to be $142,845,176, an increase of 0.4%, as compared to the current year. The adopted operating budget for Power and Light is $145,945,081. The budget also includes funding of $16,390,000 for capital projects, including: Power
Independence water rates are the third lowest, as compared to 14 other communities in the metropolitan area. It is estimated that water revenues will be $32,359,384, an increase of approximately 2. 1%, as compared to the current year. The adopted operating budget is $28,110,679 which includes operating, non-departmental, and debt service costs. The budget also includes funding of $4,350,000 for capital projects, including:
ix
Capital Budget Summary Project Number Project Description Amount NEW BV Boiler Burner Management System Upgrade $ 800,000 NEW BV Generator Hydrogen System Upgrade 450,000 NEW BV Ash Pond Closure 6,000,000 NEW 69 kV Transmission Line Rebuild (Sub E to F) 3,042,000 70201106 Substation Facilities/Equipment Improvements 848,000 NEW Substation I Switchgear& Transformer Replacement 3,650,000 NEW Systems Operations / UPS Upgrade 400,000 NEW Systems Operations Work Area Renovation 600,000 NEW Financial Management System Replacement 600,000 Total $16,390,000
& Light Fund
Water Fund
This budget conforms to Council policies, addresses the community's priorities and places emphasis on the livability of our neighborhoods. Staff looks forward to assisting the City Council with the implementation of the budget over the coming fiscal year.
John Pinch City Manager /lcx Water Fund Capital Budget Summary Project Number Project Description Amount 9749 Main Replacement $ 300,000 9952 Security Upgrades 25,000 70401003 Future Production Wells 100,000 70401301 23rd St Main Replacement 500,000 70401504 Northern Blvd (28th to 31st) 300,000 70401505 Distribution System Improvements 150,000 70401506 Truman Road Booster Station Upgrades 500,000 NEW Filter Backwash 50,000 NEW Plant Discharge Outfall Improvements 75,000 NEW SB Drive Improvements 75,000 NEW Little Blue Pkwy Transmission Main 125,000 NEW Courtney Bend Basin Catwalk 200,000 NEW Fiber Optic Connection to CBP 300,000 NEW Truman Road 12" Main (Yuma to Alexander 550,000 NEW Lime Silo 500,000 NEW Financial Management System Replacement 600,000 Total $4,350,000 Conclusion
Guide to Independence’s Budget Document
Organization of the Budget Document
The budget document is intended as a tool for residents, elected officials, and City staff. The document contains narratives, graphics, and financial data at summary and detailed levels. It represents the culmination of the process of projecting available resources for the upcoming fiscal year and represents the financial plan as to how those resources will be spent. It is intended that this document is both understandable to the average reader and useful as a working document for managing the City's finances.
The document is divided into six main sections . . . . . . the Budget Message, the General Fund operations, the Utility Funds operations, the operations of Other Funds,
A Combined Summary of all funds, and an Appendix
The budget begins with the City Manager's Budget Message. The message provides an overview of the budget document and provides a narrative discussion of other related issues.
The General Fund section represents financial, operating, and employee staffing data for the General Fund. Departmental schedules include: an organization chart, departmental budget summary, and detail appropriation data for each organizational budget level within each department.
The Utility Funds section represents financial, operating, and employee staffing data for the City’s three Utility Funds: Power and Light, Sanitary Sewer, and Water Funds. Departmental schedules include: an organization chart, departmental budget summary, graphical and chart historical data, and detail appropriation data for each organizational budget level within each department.
The Other Funds section represents financial, operating, and employee staffing data for the remaining funds of the City for which an operating budget is prepared. These funds are as follows: Tourism, Community Development Block Grant Act, HOME Program, Street Improvements Sales Tax, Parks and Recreation Sales Tax, Storm Water Improvements Sales
Guide to Independence’s Budget Document
Tax, Police Public Safety Sales Tax, Fire Public Safety Sales Tax, Grants Fund, Central Garage, Staywell Health Care Funds, and Worker’s Compensation Fund. Departmental schedules include: an organization chart, departmental budget summar y, graphical and chart historical data, and detail appropriation data for each organizational budget level within each department.
The Combined Summary section represents consolidated financial, operating, debt service, and employee staffing data across all fund and department lines. While this section provides a City wide perspective of the budget document, spending decisions are made at the individual fund level.
The Appendix section contains the following: budget calendar, demographic statistics, financial statistics, list of acronyms, and glossary of budget and finance terms.
Structure of the City's Finances Funds
The City has thirty separate groups of accounts called funds. Each fund is separately accounted for with its own set of self-balancing accounts. Sixteen of these funds have formal budgets which are included in this budget document. Of the remaining fourteen funds, six are capital project funds and are part of the Capital Budget. The other eight funds are special purpose funds that do not require the use of formal budgets.
The sixteen Operating Budget funds are broken down into four fund classifications. The classifications are listed below along with the individual funds within that category and a description of the purpose for each fund:
General Fund – Represents the primary operating fund for general governmental services. It provides most traditional tax supported municipal services such as police and fire protection.
Special Revenue Funds – Special revenue sources that are restricted in their use. These are listed below:
Tourism Fund - Accounts for the proceeds of the transient guest tax.
Community Development Block Grant Fund – Accounts for the federally funded Community Development Block Grant Act program.
Home Program Fund - Accounts for the Federally Funded Home Program.
Guide to Independence’s Budget Document
Street Improvements Sales Tax Fund - Accounts for the revenues received on the Capital Improvement Sales Tax approved by voters in August, 1998 for street improvement purposes. The tax was renewed in August, 2002 and again in August, 2007.
Parks Improvements Sales Tax Fund - Accounts for the revenues received from the Parks Improvement Sales Tax approved by voters in August, 1998 for parks and recreation improvement purposes and was renewed in August, 2002 and August, 2010. The tax will remain in effect until repealed.
Storm Water Improvements Sales Tax Fund - Accounts for the revenues received from the Storm Water Improvement Sales Tax approved by voters in August, 2000 for storm water improvement purposes. The tax was renewed in August, 2010 and will remain in effect until repealed.
Police Public Safety Sales Tax Fund - Accounts for the revenues received from the Police Public Safety Sales Tax approved by voters in August, 2004 for Police department purposes.
Fire Public Safety Sales Tax Fund - Accounts for the revenues received from the Fire Public Safety Sales Tax approved by voters in August, 2004 for Fire department purposes.
Grants Fund - Accounts for revenues received from Federal and State Grant Funds
Enterprise Funds - Government operations that are accounted for in a manner similar to private sector operations.
Power and Light Fund - Accounts for Power and Light Utility operations.
Sanitary Sewer Fund - Accounts for Sanitary Sewer Utility operations.
Water Fund - Accounts for Water Utility operations.
Internal Service Funds - Funds used to account for the furnishing of goods or services by one department or fund within the City to other City departments and funds.
Central Garage - Accounts for the costs of maintaining a portion of the City's fleet.
Staywell Health Care Fund - Accounts for activities related to the City's self-insured health care plan.
Worker’s Compensation Fund – Accounts for the activities related to the City’s self-funded worker’s compensation plan.
Funds Departments
The City has nineteen operating departments that are responsible for all operations of the City. The budget establishes appropriations for each department to support their operations for the ensuing fiscal year. Each department can potentially be funded out of any one or more of the different fund categories listed earlier.
General Fund Enterprise Funds
Special Revenue Funds
Grants Fund
Internal Service Funds
City Council
City Clerk
City Manager
Technology Services
Municipal Court
Law
Finance
Hum an Resources
Community Developm ent
Police
Fire Health
Public Works
Water
Water Pollution Control
Parks, Recreation & Tourism
Power and Light
Non-Departm ental
In addition to the operating departments, the City also has a non-departmental and debt service category that are accounted for in a manner similar to operating departments. The items included in these two categories are not specifically assignable to any particular department.
Guide to Independence’s
Document
Budget
Funds Departments
Cost Centers
Cost Centers -
Most departments are broken down into multiple cost centers based on the types of services or groups of services provided. These cost centers form the foundation of the organizational structure of the city. As noted earlier, departments can be funded from multiple funds however at the cost center level, all of the activities within a given cost center must be funded from the same fund.
Funds Departments Cost Centers
Object of Expenditures
Object of Expenditures -
Departmental appropriations within a given cost center are broken down into various object of expenditure accounts based on the type of goods or services to which an expenditure relates. Object of expenditure accounts represent such items as salaries, benefits, contractual services, office supplies, etc. Object of expenditure accounts are further grouped into five major class categories: Personal Services, Other Services, Supplies, Capital Outlay, and Debt Service/Other.
Organizational Structure Recap
At the very lowest level, expenditures are record ed at the object of expenditure level within a cost center. The cost center represents the lowest level organizational unit of the city and generally represents a group of common services within a department. The funding for any one cost center is uniquely funded from a single fund. Multiple cost centers make up a Department. Finally, at the very highest level of the financial structure are funds which represent a unique and distinct group of funding sources, many of which are legally restricted for use in a limited manner. Departments can include funding from different funds; however, cost centers within a department must be funded from a specific fund.
Guide to Independence’s Budget Document
The City of Independence Vision Statement
The pride we feel as a community will make Independence a centerpiece for the metropolitan area.
The City of Independence will be a community that provides an exceptional quality of life for residents through a healthy economy that provides jobs and livelihoods for citizens; with well planned, safe and secure neighborhoods; and through excellence in the delivery of public services.
The City of Independence will be a community that takes pride in its history, by maintaining its unique heritage for future residents and for visitors from throughout the world.
The City of Independence will meet the needs of its citizens through fostering citizen participation and involvement in local government; through the establishment of clear policy guidelines; and through a responsive, well-trained, professional City staff.
(reaffirmed by Resolution number 5213 – September 19, 2005)
1
The City of Independence Strategic Goals
Consistent with the Vision Statement, the City Council hereby establishes the following four (4) strategic goals:
1. To cultivate and preserve attractive and desirable neighborhoods by encouraging well-maintained property and architecturally-diverse housing, conducting strategic needs assessments, identifying and allocating prioritized resources, and providing focused services to meet identified needs.
2. To increase operational efficiencies and enhance citizen engagement through implementation and use of advanced technologies.
3. To meet existing and emerging health, safety and welfare needs of residents and businesses by evaluating existing standards and procedures and effectively administering property maintenance compliance, infrastructure construction and repairs, historic preservation and public safety services.
4. To promote a strong local economy with an expanding employment and tax base through focused strategies to redevelop existing business districts, aid in the establishment of new businesses, provide exceptional customer service and aggressively pursue economic development and redevelopment opportunities.
(approved by Resolution number 5879 –January 6, 2014)
2
Financial Policies
A. Fund Balance
1. Fund Balance Target - The City shall maintain an Undesignated Fund Balance level in the General Fund equal to 5% of annual revenues. The purpose for maintaining this reserve fund will be for meeting emergencies arising from: (1) the loss or substantial reduction in actual revenue collections over anticipated amounts; 2) unexpected expenditures due to natural disasters or casualty losses; 3) nonbudgeted expenditures for the satisfaction of court judgments and litigation costs; and, 4) conditions that threaten the loss of life, health or property within the community.
2. Recovery Plan when Fund Balance is below Target - Whenever the General Fund Undesignated Fund Balance account balance falls below the target level of 5% then the City will strive to restore the Undesignated Fund Balance through revenue allocations or expenditure reductions back to the target level over a five (5) year period.
3. Utilization of Funds that Exceed the Fund Balance Target - Any amounts in the General Fund Undesignated Fund Balance account that exceed the target amount may be utilized in the following year's operating budget with the same restrictions identified below for one-time revenues.
B. Revenues
1. Use of One-Time Revenues - One time revenues will be used only for one-time expenditures. The City will avoid using temporary revenues to fund on-going programs and activities.
2. Grant Acceptance and Cost Recovery Analysis - The City shall actively pursue federal, state and other grant opportunities when deemed appropriate. Before accepting any grant the City shall thoroughly consider all implications related to costs associated with complying with the terms of the grant agreement and the ongoing obligations that will be required in connection with the acceptance of the grant. Programs financed with grant monies will be budgeted in separately, and the service program will be adjusted to reflect the level of available funding. In the event of reduced grant funding, City resources may be substituted only after all program priorities and alternatives are considered during the budget process.
3. Revenues Diversification - The City will strive to develop and maintain a diversified and reliable revenue stream so as to avoid becoming overly dependent upon any single source of revenue. Efforts will be directed to optimize existing revenue sources while periodically reviewing potential new revenue sources.
3
City of Independence, Missouri 2016-17 Operating Budget
City of Independence, Missouri 2016-17 Operating Budget
Financial Policies
4. Estimation of Annual Budgeted Revenues - The Finance Department will provide an annual estimate of anticipated revenues using an objective and analytical process. When faced with assumption uncertainties, conservative projections will be utilized.
5. Support Services provided to Funds - The City shall set user fees for each fund at a rate that fully covers direct and indirect costs of providing support services to other funds.
6. Fees and Charges for Services - Fees and charges shall be periodically evaluated and, if necessary, adjusted annually to assure that they cover all direct and indirect costs, unless it is determined full cost recovery would not be in the best interest of the public.
7. Investment of City Funds - Cash and investment programs will be maintained in accordance with State Statutes and the City Charter and will ensure proper controls and safeguards are maintained. City funds will be managed in a prudent and diligent manner with an emphasis on safety of principal, liquidity, and financial return on principal, in that order.
8. Restricted Revenues - Revenues will not be dedicated for specific purposes, unless required by law, generally accepted accounting practices (GAAP), or authorized by the Council. All non-restricted revenues will be deposited in the General Fund and appropriated by the budget process. This will preserve the ability of the City Council to determine the best use of available revenues to meet changing service requirements.
C. Expenditures
1. Employee Staffing Levels - The addition of new positions will only be requested after service needs have been thoroughly examined and it is substantiated that the additional staffing will result in increased revenue, enhanced operating efficiencies, or the achievement of specific objectives approved by the Council. To the extent feasible, personnel cost reductions will be achieved through attrition and reassignment.
2. Service Delivery Analysis - The City will seek to optimize the efficiency and effectiveness of its services to reduce costs and improve service quality. Alternative means of service delivery will be evaluated to ensure that quality services are provided to our residents at the most competitive and economical cost. Department directors, in cooperation with the City Manager's office, will identify all activities that could be provided by another source and review options/alternatives to current service delivery methods. The review of service delivery alternatives and the need for the service will be performed annually or on an "opportunity" basis.
4
City of Independence, Missouri 2016-17 Operating Budget
Financial Policies
3. Capital Outlay (vehicles, equipment, building repairs) for Operations - The City will budget for capital items through the process used to prepare the annual operating budget.
a. The City will prepare and update annually a long-range capital plan for operating capital outlay.
b. The City will strive to fund capital outlay expenditures at a level to maximize service delivery and minimize maintenance costs with the objective of achieving the greatest useful life of the asset.
c. When planning for capital outlay expenditures of any type, each department director must estimate the impact on the City’s operating budget.
D. Other Financing Sources and Uses
1. Lease Purchase Financing - The City will lease purchase high-cost items of equipment only if necessary due to lack of alternative funding options, or if lease rates are less than the rate attained from investment return. In no case shall the City lease purchase equipment items whose useful life is not greater than term of the lease.
5
City of Independence, Missouri 2016-17 Operating Budget Budget Procedures and Policies
Budget Preparation/Control -
The fiscal year of the City shall start on July 1 and end on June 30.
Formal annual operating budgets are used as a control device for the General, Tourism, Community Development, HOME Program, Street Improvements Sales Tax, Park Improvements Sales Tax, Storm Water Improvements Sales Tax, Power and Light, Sanitary Sewer, Water, Stay Well Health Care and Central Garage Funds. Expenditures may not exceed appropriations for any department within each applicable fund. Unexpended operating budget appropriations lapse at year end.
Annual operating budgets are not prepared for Capital Project Funds although budgets are prepared on a life to date project basis.
City Charter, Section 8.2 Budget: Preparation and submission. At least forty-five (45) days before the beginning of the fiscal year, the City Manager shall prepare and submit to the Council a proposed budget for the next fiscal year, which shall contain detailed estimates of anticipated revenues including any resources available from the current fiscal year, and proposed expenditures for the year, and an explanatory message. The budget shall include the general fund and at least all other regular operating funds which are deemed to require formal annual budgeting, and shall be in such form as the City Manager deems desirable or as the Council may require. The total of the proposed expenditures from any fund shall not exceed the total of the anticipated resources thereof. The budget and budget message shall be public records in the office of the City Clerk, and shall be open to public inspection. Copies of the budget; and budget message shall be made for distribution to persons on request.
Prior to June 27, the Council shall adopt the budget. If the Council fails to adopt the budget on or before that date, the budget, as submitted or amended, shall go into effect.
City Charter, Section 8.3 Comparison of anticipation revenues and proposed expenditures with prior years.
(1) In parallel columns opposite the several items of anticipated revenues in the budget, there shall be placed the amount of revenue during the last preceding fiscal year, and the amount of revenue up to the time of preparing the budget plus anticipated revenue for the remainder of the current fiscal year estimated as accurately as may be.
(2) In parallel columns opposite the several items of proposed expenditures in the budget, there shall be placed the amount of each such item actually expended during the last preceding fiscal year, and the amount of each such item actually expended up to the time of preparing the budget plus the expenditures for the remainder of the current fiscal year estimated as accurately as may be.
6
City of Independence, Missouri 2016-17 Operating Budget
Budget Procedures and Policies
City Charter, Section 8.4 Budget: Public hearing The Council shall hold a public hearing on the proposed budget at least one (1) week after a notice of the time of the hearing has been published in a newspaper of general circulation within the City; and an y interested person shall have an opportunity to be heard. The Council may continue the hearing at later meetings without further notice.
City Charter, Section 8.5 Budget: Amendment, adoption, appropriations. The Council may insert, strike out, increase, or decrease items in the budget, and otherwise amend it, but may not increase any estimate of anticipated revenues therein unless the City Manager certifies that, in the City Manager's judgment, the amount estimated will be revenue of the fiscal year. The Council, not later than the twenty-seventh (27th) day of the last month of the fiscal year, shall adopt the budget and make the appropriations for the next fiscal year. If the Council fails to adopt the budget and make the appropriations on or before that day, the budget as submitted or as amended, shall go into effect and be deemed to have been finally adopted by the Council; and the proposed expenditures therein shall become the appropriations for the next fiscal year. The appropriations, when made by the Council by a general appropriation ordinance separate from the budget document, need not be in as great detail as the proposed expenditures in the budget. Appropriations from a fund shall never exceed the anticipated resources thereof in the budget as adopted.
City Charter, Section 8.6 Budget: Transfer of appropriation balances, amendment. After the appropriations are made, and except as the Council by ordinance may provide otherwise, the City Manager may transfer unencumbered appropriation balances or parts thereof from any item of appropriation within a department, office, or agency to any other items of appropriation, including new items within the same department, office, or agency; and upon recommendation by the City Manager, the Council may transfer unencumbered appropriation balances or parts thereof from any item of appropriation , including an item for contingencies, in a fund to any other item of appropriation, including new items, in the fund.
Upon recommendation by the City Manager, the Council by ordinance may also amend the budget as adopted by changing the estimates of anticipated revenues or proposed expenditures of a fund and otherwise; and may increase or decrease the total appropriations from a fund when a change in revenues or conditions justify such action; but total appropriations from any fund shall never exceed the anticipated revenues thereof in the budget as adopted or as amended, as the case may be. The Council shall not increase any estimate of anticipated revenues in the budget unless the City Manager certifies that, in the City Manager's judgment, the amount estimated will be revenue of the fiscal year.
7
City of Independence, Missouri 2016-17 Operating Budget Budget Procedures and Policies
Budget PoliciesFund Types
Governmental Funds - are those through which most governmental functions of the City are financed. The acquisition, use and balances of the City's expendable financial resources and the related liabilities (other than those in proprietary funds) are accounted for through governmental funds. The measurement focus is upon determination of changes in financial position. The following are the City's governmental fund types for which annual operating budgets are prepared:
The General Fund is the principal operating fund of the City and accounts for all financial transactions not accounted for in other funds. The general operating expenditures, fixed charges, and capital improvement costs that are not paid through other funds are financed through revenues received by the General Fund.
Special Revenue Funds (Tourism, Community Development, HOME Program, Street Improvements Sales Tax, Park Improvements Sales Tax, Storm Water Improvements Sales Tax) are used to account for revenues derived from specific taxes, governmental grants or other revenue sources which are designated to finance particular functions or activities of the City.
Proprietary Funds - are used to account for the City's on-going organizations and activities which are similar to those often found in the private sector. The measurement focus is upon determination of net income. The following are the City's proprietary fund types:
Enterprise Funds (Power and Light, Sanitary Sewer, Water) are used to account for operations that are financed and operated in a manner similar to private business enterprises where the intent of the governing body is that the costs (expenses, including depreciation) of providing goods or services to the general public on a continuing basis be financed or recovered primarily through user charges or where the periodic determination of net income or loss is deemed appropriate.
Internal Service Funds (Central Garage/Staywell Health Care Fund) are used to account for the financing of goods or services provided by one department or agency to other departments or agencies of the City on a cost-reimbursement basis.
Basis of Accounting/Measurement Focus for Budgets
Basis of accounting refers to when revenues and expenditures or expenses are recognized in the accounts and recorded in the financial statements. Basis of accounting relates to the timing of the measurements made, regardless of the measurement focus applied. Measurement focus determines what actually is being recorded, not when. The measurement focus for governmental funds is based upon expenditures - decreases in net financial resources. The measurement focus
8
City of Independence, Missouri 2016-17 Operating Budget Budget Procedures and Policies
for proprietary funds is based upon expenses - decreases in net total assets. The principal difference between expenditures and expenses is that with expenditures, the primary concern is the flow of resources, however with expenses; the primary concern is the substance of transactions and events which may not specifically relate to the actual flow of resources.
As already indicated, the basis of accounting relates to when transactions are recorded, not what is actually being recorded. The three different types of accounting basis are 1) Cash, 2) Modified Accrual, and 3) Accrual. The latter two are recognized as Generally Accepted Accounting Principles (GAAP); the Cash basis is not.
The modified accrual basis of accounting is utilized by all governmental fund types and expendable trust funds. Under the modified accrual basis of accounting, revenues are recorded as collected unless susceptible to accrual, i.e., amounts measurable and available to finance the City's operations or of a material amount and not received at the normal time of receipt. Available means collectible within the current period or soon enough thereafter to be used to pay liabilities of the current period. Significant revenues which are considered susceptible to accrual include real estate taxes, sales taxes, utility franchise taxes, interest, and certain State and Federal grants and entitlements. Expenditures, other than interest on long-term debt, are recorded when the liability is incurred.
In applying the susceptible to accrual concept to intergovernmental revenues (i.e. grants), the legal and contractual requirements of the individual program is used as guidance. There are, however, essentially two types of these revenues. In one, monies must be expended on the specific purpose or project before any amounts will be paid to the City; therefore, revenues are recognized based upon the expenditures recorded. In the other, monies are virtually unrestricted as to purposes or expenditures and nearly irrevocable, i.e., revocable only for failure to compl y with prescribed compliance requirements. These resources are reflected as revenues at the time of receipt or earlier if they meet the available and measurable criteria.
Real estate taxes levied and expected to be collected within sixty days after the fiscal year-end are considered available and, therefore, are recognized as revenues.
Licenses and permits, fines and forfeitures, charges for services, and miscellaneous revenues are recorded as revenues when received in cash because they are generally not measurable until actually received.
The accrual basis of accounting is utilized by the proprietary and nonexpendable trust fund types. Under this basis of accounting, revenues are recognized when earned (including unbilled revenue) and expenses are recorded when liabilities are incurred.
Encumbrances
The City's policy is to prepare the annual operating budget on a basis which includes encumbrances as the equivalent of expenditures in order to assure effective budgetary control and accountability and to facilitate effective cash planning and control. Encumbrance
9
City of Independence, Missouri 2016-17 Operating Budget Budget Procedures and Policies
accounting is where purchase orders, contracts, and other commitments for the expenditures of funds are recorded in order to reserve that portion of the applicable appropriation.
Encumbrances outstanding at year-end represent the estimated amount of the expenditures ultimately to result if unperformed contracts in process at year-end are completed. Encumbrances outstanding at year-end are reported in the Comprehensive Annual Financial Report (CAFR) as reservations of fund balances because they do not constitute expenditures or liabilities. Outstanding encumbrances at year-end are re-appropriated in the following fiscal year in order to provide authority to complete these transactions.
Difference between Budget Basis and Financial Reporting Basis
The City’s Comprehensive Annual Financial Report (CAFR) reports on the status of the City’s finances in accordance with the GAAP basis of accounting. In most cases this is also the same basis of accounting as used in preparing the budget. Exceptions to the basis of accounting used for financial reports and in preparing the budget are listed below:
Governmental Fund Types - All governmental fund types use the same basis of accounting for reporting and budgeting with the exception that the budget also recognizes encumbrance accounting. In the CAFR, the “Combined Statement of Revenues, Expenditures and Changes in Fund Balance - All Governmental Fund Types and Expendable Trust Funds” presents revenues and expenditures in accordance with the GAAP basis of accounting. The “Combined Statement of Revenues, Expenditures and Changes in Fund Balance - Budget and Actual (Budget Basis)” in the CAFR presents the same information, however it also includes the recognition of encumbrances. This later statement provides a reconciliation of the presented data to the GAAP basis statement.
Proprietary Fund Types - All proprietary fund types use the same basis of accounting for reporting and budgeting with the exception of “non-cash” expenses and disbursements that affect balance sheet accounts. “Non-cash” expenses are included in the financial reports but not in the budget. An example of this type of expense would be depreciation where an expense is recorded but a cash disbursement does not take place. Balance sheet account disbursements are items that are included in the budget as expenditures, however they do not affect the “Combined Statement of Revenues, Expenses and Changes in Retained Earnings/Fund Balances - All Proprietary Fund Types and Nonexpendable Trust Funds” (i.e. the operating statement) in the CAFR. An example of these types of items would be inventory purchases, debt principal payments, and capitalized labor and material costs.
10
Budget Calendar for 2016-17 Operating Budget
Departments begin entering budget text data
Departments complete cost allocation forms
Central Garage to complete 2016-17 budget projections.
Departments begin reviewing Position Management Projections
Departments begin entering budget financial data
Departments complete reviewing Position Management Projections
All Budget forms (including Departmental Summary, Detail
Wed. January 6
Fri January 8
Fri. January 29
Mon. February 1
Mon. February 1
Wed. February 10
Tues. February 16 Budget Sheets and Detail Program Sheets) due to Budget Office for review
All completed budget forms due to the Budget Office
Fri. February 19 for final review.
Updated 2016-17 Revenue Estimates sent to the City
Fri February 26 Manager by Finance
Estimated Fund Balance Summary based on
Fri. February 26 Department’s requested budgets due to the City Manager from the Budget Office
City Manager Budget reviews with departments
City Council Review of Proposed Council Goals Allocations
Revenue Manual completed by Finance for
Tues March 1-
Fri March 18
Mon. March 28
Mon. May 2 distribution to the City Council
City Manager Proposed Budget submitted to the City
Mon. May 2 Council (must be at least 45 days prior to the beginning of the new fiscal year) a
Publication of Legal Notice on Budget Hearing (must be
Fri. May 6 at least 10 days before the hearing) a
Public Hearing by the City Council on the Proposed
Mon. May 16 Budget a
First reading on the 2016-17 Operating Budget
Mon. June 6 Appropriation Ordinance
11
Public Hearing by the City Council on the Proposed
Mon. May 16 Budget a
First reading on the 2016-17 Operating Budget
Mon. June 6 Appropriation Ordinance
Council adoption of the 2016-17 Operating Budget
Mon. June 20 Appropriation Ordinance. (Must be before June 27 or the proposed budget as amended will become effective.) a
Preparation and public filing in the City Clerk’s
Fri July 1 Office of the Adopted Budget
Receive the Certification of Assessed Valuation from
Fri. July 1 the County Clerk for setting Property Tax Levy Rates
Legal Notice on Public Hearing on the Tax Levy Rate
Fri. July 22 (Must be at least 7 days before the hearing) b
Public Hearing on the Tax Levy Rate and First Reading
Mon. August 1 on the Tax Levy Ordinance b
City Council adoption of the Tax Levy Ordinance (the
Mon. August 15 tax levy rates must be certified to Clay County by September 1, 2016 and Jackson County no later than October 1, 2016) b
GFOA budget review submittal
Footnotes-
a City Charter Requirement
b Tax Levy Requirement under the “Open Window Law”
Fri. August 19
Budget Calendar for 2016-17 Operating Budget - Page 2
12
City of Independence, Missouri 2016-17 Operating Budget
Equal Employment Opportunity Plan
The City of Independence shall take affirmative action to promote and ensure equal employment opportunity for all persons. Recruitment, hiring, promotions, personnel actions, benefits, training and all other terms, conditions and privileges of employment shall be conducted without regard to race, color, religion, sex, national origin, age, disability, or status as a disabled veteran, or veteran of the Vietnam Era. Department directors, supervisors, and City employees involved in the hiring and interviewing process shall base employment decisions on the principles of Equal Employment Opportunity (EEO) and with the intent to further the City’s commitment to those principles.
Directors and supervisors shall take affirmative action to ensure that minority group individuals, females, veterans of the Vietnam Era, disabled veterans, and persons with disabilities are introduced into the work force and that these employees are considered when opportunities for promotion arise.
In addition, the City shall assert leadership in the community and put forth the maximum effort to achieve non-discriminatory, equal employment opportunities throughout the political jurisdiction of the City. Affirmative action will be taken to ensure that equal employment opportunities are available on the basis of merit of the individual and consistent with the City’s goals and timetables for staffing. The City will strive for a workforce diversity in each occupation group which corresponds to the availability of minority and female persons in the appropriate recruitment areas.
Equal Employment Opportunity Goals for 2016-17
1. City Department Directors will promote and ensure equal employment opportunity for all persons without regard to race, color, sex, religion, national origin, ancestry, age, disability, or political affiliation.
2. City Department Directors assure that no discrimination will occur in recruitment, selection, training, advancement, compensation, working conditions, demotion, layoff and termination.
3. City recruitment activity will continue to utilize wide and diverse distribution sources in the metro area, including but not limited to, area colleges, community colleges, churches, Indian centers, Hispanic and black organizations, City’s website which is linked to Facebook and Twitter and area newspapers (as requested).
4. City Department Directors will strive to achieve a workforce in each occupational group which corresponds to the actual availability of qualified minorities and females in the community and surrounding area.
13
City of Independence, Missouri 2015-16 Operating Budget
Equal Employment Opportunity Plan
5. The City’s affirmative goals shall not discriminate against any individual or group of individuals with respect to any employment opportunity for which they are qualified for on the grounds that they are not the beneficiaries of affirmative action themselves, since the City does not sanction the discriminatory treatment of any person.
Recruitment Activity
In preparation for the recruitment activity for 2016, Department Directors have been provided the staffing profile of their departments, effective July 1, 2015. All Departments have a copy of the City’s Affirmative Action Plan and Affirmative Action hiring guideline/goals
14
EEO Calendar Year 2015 Data
The following information is reporting the City’s overall new hire activity for 2015. The report serves as positive evidence that the City is increasing the diversity of its workforce.
Total 2015 Full Time New Hires: 78
Males Race: Male Female Race: Female
58
White – 53
Black – 1
Hispanic – 1
Ameri. Indian – 0
Asian – 3
Unknown - 0
20
White – 16
Black – 3
Hispanic – 1
Ameri. Indian – 0
Asian – 0
Unknown - 0
Total 2015 Full time new hire percentage of minorities: 12%
Black - 5%
Hispanic - 3%
American Indian - 0%
Asian – 4%
Total percentage of females: 26%
Total 2015 Part time New Hires: 4
Males Race: Male Female Race: Female 0
White – 0
Black – 0 Hispanic – 0
Ameri. Indian – 0
Asian - 0
Total percentage of females: 100%
4
White – 4
Black – 0
Hispanic – 0
Ameri. Indian – 0
Asian - 0
Total Workforce data for Calendar Year 2015:
1,095 FT/PT employees
Black – 2%
Hispanic – 3%
American Indian – 1%
Asian – 1%
15
2016-17 Operating Budget General Fund
Source of Budget Dollars
Allocation of Budget Dollars


Property Tax 10.2% Sales Tax 24.7% Utility Taxes 12.2% Interfund Charges 6.8% Intergovernmental 7.1% Licenses & Permits 5.1% PILOTs 25.7% Charges for Services 2.7% Court Fines & Costs 4.9% Other Revenue 0.8%
Police 36.2% Mayor, City Council & City Clerk 1.1% Technology Services 2.3% Health 3.5% Municipal Court 1.1% Finance 2.5% Fire 23.8% Law 1.0% Parks l Recreation l Tourism 2.0% Non‐Departmental 13.3% City Manager 1.2% Human Resources 0.7% Public Works 7.2% Community Development 4.1%
16
Budget Summary - General Fund
For the Fiscal Years 2014-15, 2015-16 and 2016-17
Source of Budget Dollars
Use of Budget Dollars
City of Independence, Missouri 2016-17 Operating Budget
Increase 2015-16%2016-17%(Decrease) 2014-15Originalof AdoptedofOver Last% DescriptionActualBudgetTotalBudgetTotal YearChange 3,591,990 $ 3,741,675 $ 3,877,030 $ 135,355 $
Transfers from Other Funds - $ - $ Other Fund Balance 224,642 - -Components Estimated RevenuesTaxes 35,652,333 $ 36,455,904 $ 47.8%35,020,500 $ 47.0%(1,435,404) $ -3.9% Payments in Lieu of Taxes18,413,389 18,868,596 24.7%19,103,195 25.7%234,599 1.2% Licenses & Permits 3,682,050 3,403,6874.5%3,759,8695.1%356,182 10.5% State & County Shared Rev.5,323,324 5,275,1396.9%5,289,8127.1%14,673 0.3% Charges for Current Services1,863,880 2,020,7702.6%2,002,7252.7%(18,045) -0.9% Fines and Forfeitures 4,652,309 4,921,9606.5%3,623,0004.9%(1,298,960) -26.4% Interfund Charges 4,544,233 4,741,2896.2%5,073,0166.8%331,727 7.0% Other Revenue 661,873 614,9000.8%569,5000.8%(45,400) -7.4% T Total 74,793,391 $ 76,302,245 $ 100.0%74,441,617 $ 99.7%(1,860,628) $ -2.4% Transfer in$ - $ 197,063 $ 0.3%197,063 $ Total Sources75,018,033 $ 76,302,245 $ 74,638,680 $ (1,663,565) $ -2.2%
Operating DepartmentsCity Council 455,766 $ 453,821 $ 0.6%482,118 $ 0.6%28,297 $ 6.2% City Clerk 381,705 366,691 0.5%321,384 0.4%(45,307) -12.4% City Manager 886,592 984,378 1.3%918,674 1.2%(65,704) -6.7% Nat'l Frontier Trails Museum261,914 -0.0% -0.0% Technology Services 1,666,875 1,867,106 2.5%1,748,129 2.3%(118,977) -6.4% Municipal Court 827,283 836,066 1.1%853,290 1.1%17,224 2.1% Law 789,297 741,884 1.0%732,848 1.0%(9,036) -1.2% Finance 1,944,054 1,968,698 2.6%1,846,418 2.5%(122,280) -6.2% Human Resources 450,776 459,444 0.6%491,198 0.7%31,754 6.9% Community Development3,039,100 3,257,399 4.4%3,088,434 4.1%(168,965) -5.2% Police 27,329,756 27,034,885 36.2%27,066,600 36.2%31,715 0.1% Fire 17,214,371 17,042,758 22.8%17,782,425 23.8%739,667 4.3% Health 2,697,307 2,650,711 3.5%2,608,060 3.5%(42,651) -1.6% Public Works 5,616,443 5,812,067 7.8%5,419,548 7.2%(392,519) -6.8% Parks and Recreation 1,585,448 1,634,988 2.2%1,490,728 2.0%(144,260) -8.8% Non-Departmental 8,797,138 8,916,027 11.9%9,357,222 12.5%441,195 4.9% City Council Strategic Goals105,550 250,000 0.3%200,000 0.3%(50,000) -20.0% Capital Outlay 343,177 400,000 0.5%376,700 0.5%(23,300) -5.8% Total 74,392,552 $ 74,676,923 $ 100.0%74,783,776 $ 100.0%106,853 $ 0.1% Transfers Transfers to Other Funds 10,000 10,000 - (10,000) Falls at Crackerneck TIF 465,796 1,545,149 - (1,545,149) -100.0% Total Uses74,868,348 $ 76,232,072 $ 74,783,776 $ (1,448,296) $ -1.9% 3,741,675 $ 3,811,848 $ 3,731,934 $ (79,914) $ -2.1% Beginning Unassigned Fund Balance Ending Undesignated Fund Balance 17
City of
Missouri 2016-17 Operating Budget
Independence,
Fund Balance Summary - General Fund
For the Fiscal Years Ending June 30, 2011 through June 30, 2016
Fund Balance Components
Ten Year Fund Balance Comparison
Actual Actual Actual ActualActualProjected Description6/30/116/30/126/30/136/30/146/30/156/30/16
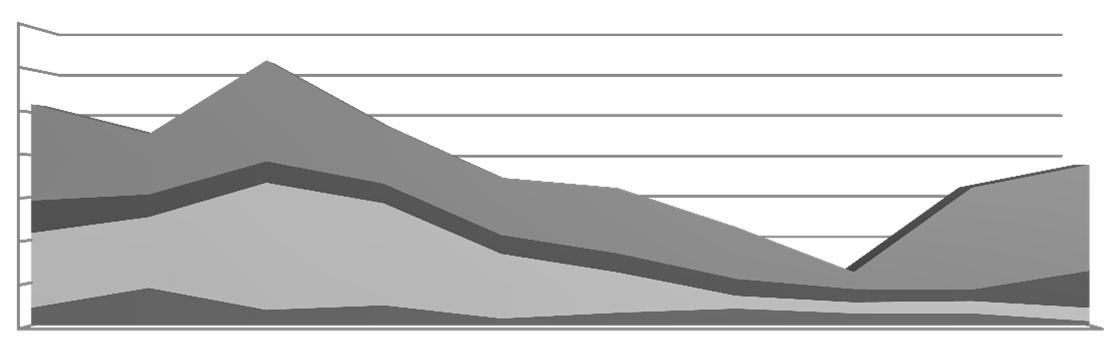
Nonspendable: (Prepaid) - - - $14,141 Restricted: Protested Revenues 24,351 $ 65,702 $ 5,608 $ 29,027 $ 17,915 $ Police Forfeitures 418,205 519,215 411,753 373,872 125,051 Other - - -Total Restricted 442,556 $ 584,917 $ 417,361 $ 402,899 $ 142,966 $ Committed: Capital Projects 120,851 $ 48,581 $ 48,581 $ 46,080 $ - $ City Council Strat. Goals243,646 281,630 218,337 265,278 332,703 Other 1,048,795 123,074 124,481 125,725 138,903 Total Committed 1,413,292 $ 453,285 $ 391,399 $ 437,083 $ Assigned: Encumbrances 667,065 $ 593,561 $ 464,633 $ 398,283 $ 1,300,973 $ Unassigned 2,302,039 1,831,406 600,662 3,591,990 3,741,675 3,877,030 Total Fund Balance4,824,952 $ 3,463,169 $ 1,874,055 $ 4,844,396 $ 5,185,614 $ 3,877,030 $ Fund Balance Target (a)3,749,104 3,587,498 3,577,438 3,640,708 3,739,670 3,655,697 Actual over (under) Target (a)(1,447,065) (1,756,092) (2,976,776) (48,718) 2,005 221,333 (a) based on 5% of Annual Revenues less one-time non-reoccurring items ‐2 3 5 6 8 9 11 2005‐062006‐072007‐082008‐092009‐102010‐112011‐122012‐132013‐142014‐15 Millions
Restricted Committed Assigned Unassigned 18
City of Independence, Missouri
2016-17 Operating Budget
Fund Balance Summary - General Fund
Unassigned Projected Fund Balance for 2016-17
Unassigned Fund Balance at June 30, 2016 (Projected) 3,877,030 $
from Other Fund Balance Components: Proposed Operating Budget (Net Sources and Uses) 2016-17 (145,096)
at Crackerneck Creek
Debt Refinancing Projected Unassigned Fund Balance at June 30, 2017 3,731,934 $ Projected Unassigned Fund Balance Target (5% of Est. Revenues)3,731,934 $ 19
Transfers
Falls
TIF
City of Independence, Missouri
2016-17 Operating Budget
Revenue Summary - General Fund
For the Fiscal Years 2014-15, 2015-16 and 2016-17
2015-162015-162016-17% Chg. 2014-15OriginalCurrent AdoptedCurr Est to Description ActualBudgetEstimateBudget Adopted Taxes Property Taxes Real Estate $7,519,837$7,480,000$7,515,000$7,520,0000.1% R.R. & Other Utility 39,50336,50041,18441,000-0.4% Total Property Taxes $7,559,340$7,516,500$7,556,184$7,561,0000.1% Sales Taxes Local Option Sales Tax $17,695,651$17,095,404$17,750,000$17,927,5001.0% Cigarette Tax 436,414475,000446,194425,000-4.7% Total Sales and Use Taxes $18,132,065$17,570,404$18,196,194$18,352,5000.9% Utility Franchise Fees Water $26,474$27,000$27,000$27,000-Gas 4,286,2364,850,0003,750,0004,000,0006.7% Telephone 4,293,8475,050,0003,680,9263,650,000-0.8% Electricity 527,937585,000529,283530,0000.1% Cable Television 826,435857,000888,900900,0001.2% Total Utility Franchise Fees $9,960,928$11,369,000$8,876,109$9,107,0002.6% Total Taxes $35,652,333$36,455,904$34,628,487$35,020,5001.1% Payments in Lieu of Taxes Power & Light In Lieu of Taxes $13,388,446$13,562,517$13,310,139$13,581,2852.0% Water Service In Lieu of Taxes 2,698,0392,947,9192,890,8063,010,3714.1% Sanitary Sewer In Lieu of Taxes 2,326,9042,358,1602,329,3992,511,5397.8% Total PILOTs $18,413,389$18,868,596$18,530,344$19,103,1953.1% Licenses and Permits Occupation Licenses $1,517,196$1,518,000$1,518,000$1,597,0005.2% Liquor Licenses 112,085111,000106,000107,0000.9% Bld. Trades Licenses and Exams 125,066110,000115,000110,000-4.3% Fin-Other License/Permits 108,200121,000108,079108,6190.5% Building Permits, Com.Develop. 793,285525,000575,000875,00052.2% Construction Permits, Pub.Works 225,391210,000165,000165,000-Nursing Home Permits 6501,000 650 650-Day Care Permits 6,6646,6876,6006,600-Food Handler's Permits 98,42598,00097,00097,000-Massage Therapist Appl 4,7005,0005,0005,000-Other Food Permits 155,184155,000155,000155,000-Ambulance Permits & Licenses 37,50645,00027,00027,000-Plan Reviews - Health Dept. 6,8758,0005,4006,00011.1% Motor Vehicle Licenses 490,825490,000493,564500,0001.3% Total Licenses and Permits $3,682,051$3,403,687$3,377,293$3,759,86911.3% Intergovernmental State Taxes and Fees Financial Institutions Tax $16,523$19,500$21,269$25,00017.5% Gasoline Tax 3,096,4483,150,0003,150,0003,150,000-Motor Vehicle License Fees 500,388510,000510,000515,0001.0% Motor Vehicle Sales Tax 941,558795,000975,000975,000-Total State Grants $4,554,917$4,474,500$4,656,269$4,665,0000.2%
20
Revenue Summary - General Fund
2015-162015-162016-17% Chg. 2014-15OriginalCurrent AdoptedCurr Est to Description ActualBudgetEstimateBudget Adopted City of Independence, Missouri 2016-17 Operating Budget
For the Fiscal Years 2014-15, 2015-16 and 2016-17 Shared Revenue Jackson County Drug Task Force $528,407$556,867$391,964$373,430-4.7% Jackson County Dare Program 215,000218,772226,382226,382-MARC Senior Services 25,00025,00025,00025,000-Total Shared Revenue $768,407$800,639$643,346$624,812-2.9% Total Intergovernmental $5,323,324$5,275,139$5,299,615$5,289,812-0.2% Charges for Services General Government Planning & Zoning Fees$28,177$15,000$15,000$15,000-Board Of Adjustment Fees2,6104,0503,0003,000-Sale Of Maps, Books, Plans2525,000100100-Sale Of Police Reports32,63230,00032,00031,000-3.1% Sale Of Fire Reports1,0051,5001,7001,7502.9% Computer Service Charges300--300300-Transit Rider Fares195,671150,000170,000155,000-8.8% Total $260,647$205,550$222,100$206,150-7.2% Health Animal Shelter Fees $1,745$2,000$295$3001.7% Animal Shelter Services 12,35715,0008,3006,000-27.7% Other Health Programs 9,2147,90010,0009,000-10.0% Total $23,316$24,900$18,595$15,300-17.7% Public Safety Reimb. For Police Services $21,720$15,500$19,900$18,300-8.0% School Resource Officers 440,422477,385467,664491,2255.0% Alarm Charges - Police 23,50140,00032,00032,000-Alarm Charges - Fire 3,2003,0005,7005,700-Total $488,843$535,885$525,264$547,2254.2% Recreation Program Fees $29,716$48,000$33,500$35,1204.8% Concessions 2,4454,000-Center Fees/Club Memberships $47,561$80,935$57,819$58,0000.3% Facility Rentals 60,47352,00053,57556,0004.5% NFTM-Admissions $41,972-Total $182,363$184,935$144,894$149,1202.9% Cemetery Sale Of Cemetery Lots $9,300$3,000$6,300$5,250-16.7% Sale Of Monument Bases 3,2313,0003,9533,000-24.1% Grave Opening Charges 51,90040,00063,80055,000-13.8% Total $64,431$46,000$74,053$63,250-14.6% Other Charges Sale Of Street Signs $134$500$500$500-Special Assessments 186,535180,000180,000180,000-Sale Of Recycled Material 14,17715,0004,00011,180179.5% Solid Waste Disp Fees 8,73578,00085,00080,000-5.9% Miscellaneous Charges 634,894750,000700,000750,0007.1% Total $844,475$1,023,500$969,500$1,021,6805.4% Total Charges for Services $1,864,075$2,020,770$1,954,406$2,002,7252.5% 21
Revenue Summary - General Fund
2015-162015-162016-17% Chg. 2014-15OriginalCurrent AdoptedCurr Est to Description ActualBudgetEstimateBudget Adopted
of Independence,
City
Missouri 2016-17 Operating Budget
the Fiscal Years 2014-15, 2015-16 and 2016-17 Court Fines and Costs Fines & Forfeitures $4,075,778$4,307,430$3,500,000$3,150,000-10.0% Court Costs 417,516403,079370,000334,000-9.7% Police Training 56,30061,58346,60042,000-9.9% Domestic Violence 87,972123,16692,00082,800-10.0% DWI/Drug 14,74326,70214,40014,200-1.4% Total Fines & Court Costs $4,652,309$4,921,960$4,023,000$3,623,000-9.9% Interest Income Interest $999 $500$1,500$1,500-Interest - Other 113,48595,40095,000100,0005.3% Total Interest Income $114,484$95,900$96,500$101,5005.2% Interfund Charges for Support Services$4,544,233$4,741,289$4,741,289$5,073,0167.0% Other Revenue Sale Of Fixed Assets $71,050$125,000$75,000$75,000-Rents 158,426181,000181,000181,000-Damage Claims 14,2742,0002,0002,000-Contributions 9,82210,0005,00010,000100.0% Misc. Non-Operating Revenue 293,816201,000200,000200,000-Total Other Revenue $547,388$519,000$463,000$468,0001.1% Total General Fund Revenues $74,793,586$76,302,245$73,113,934$74,441,6171.8% 22
For
City of Independence, Missouri
2016-17 Operating Budget
Budget Summary - General Fund
For the Fiscal Years 2014-15, 2015-16 and 2016-17
(continued on the next page)
2016-17 2015-162015-16City Manager 2014-15OriginalRevisedProposed Description Actual BudgetBudgetBudget General Government: City Council 455,766 $ 453,821 $ 455,742 $ 482,118 $ City Clerk 381,705 366,691 368,534 321,384 City Manager 886,592 984,378 990,358 918,674 Technology Services 1,666,875 1,867,106 1,881,418 1,748,129 Municipal Court 827,283 836,066 840,835 853,290 Total General Government4,218,221 4,508,062 4,536,887 4,323,595 Law Department 789,297 741,884 748,021 732,848 Finance Department: Administration 472,397 383,418 386,664 270,376 Accounting 940,554 1,009,723 1,014,045 1,011,950 Purchasing 291,469 289,106 291,562 300,240 Occupation Licensing 239,634 286,451 288,445 263,852 Total Finance Department 1,944,054 1,968,698 1,980,716 1,846,418 Human Resources Department 450,776 459,444 486,047 491,198 Community Development Department: Administration 366,463 366,022 369,177 430,016 Neighborhood Services 51,469 52,317 52,910 53,336 Comprehensive Planning 163,824 347,260 348,536 341,148 Current Planning 207,915 221,101 222,972 172,204 Transportation 1,549,420 1,548,735 1,548,735 1,595,735 Historic Preservation 73,865 75,356 75,989 43,643 Building Inspection 626,144 646,608 650,200 452,352 Total Community Development 3,039,100 3,257,399 3,268,519 3,088,434 Police Department: Administration 3,511,112 3,347,500 3,403,916 3,216,536 Police Operations 18,078,064 17,709,003 17,734,869 18,192,794 Police Services 5,740,580 5,978,382 5,995,958 5,657,270 Total Police Department27,329,756 27,034,885 27,134,743 27,066,600
23
City of Independence, Missouri
2016-17 Operating Budget
Budget Summary - General Fund
For the Fiscal Years 2014-15, 2015-16 and 2016-17
2016-17 2015-162015-16City Manager 2014-15OriginalRevisedProposed Description Actual BudgetBudgetBudget Fire Department: Administration 637,262 $ 597,236 $ 600,953 $ 612,458 $ Suppression 15,591,543 15,187,320 15,509,020 15,998,959 Fire Prevention 548,905 662,644 664,022 673,618 Maintenance 233,893 270,025 271,041 192,432 Training/Emer. Preparedness 202,768 325,533 327,263 304,958 Total Fire Department 17,214,371 17,042,758 17,372,299 17,782,425 Health Department: Administration 246,509 237,616 239,416 330,581 Disease Prevention & Control1,106,168 1,206,816 146,659 156,235 Com. Disease & Immunization144,876 71,707 72,281 78,710 Environmental Public Health1,199,754 1,134,572 2,201,413 2,042,534 Total Health Department2,697,307 2,650,711 2,659,769 2,608,060 Public Works: Administration 443,378 $ 344,903 $ 345,645 $ 350,132 $ Engineering 459,851 391,321 396,758 204,553 Administrative Support 293,011 284,421 288,048 349,252 Property Management 745,914 728,952 733,516 723,550 Street Maintenance 3,674,289 4,062,470 4,061,958 3,792,061 Total Public Works 5,616,443 5,812,067 5,825,925 5,419,548 Parks and Recreation: Administration 261,715 $ 269,540 $ 271,434 $ 164,673 $ Park Maintenance 734,065 718,555 721,001 744,519 Recreation 488,666 515,287 516,868 459,506 National Frontier Trails Museum261,914 - -Cemetery Maintenance 101,102 131,606 131,606 122,030 Total Parks and Recreation1,847,462 1,634,988 1,640,909 1,490,728 Non-Departmental 8,797,138 8,916,027 8,730,150 9,357,222 City Council Strategic Goals 105,550 250,000 557,944 200,000 Capital Outlay - Operating 343,177 400,000 400,000 376,700 Total General Fund 74,654,566 $ 74,676,923 $ 75,341,929 $ 74,783,776 $ 24
City of Independence, Missouri 2016-17 Operating Budget
Appropriations by Type Summary - General Fund
For the Fiscal Years 2014-15, 2015-16 and 2016-17
2014-152015-162016-17 ActualBudgetBudget
Personal Services: Full Time Salaries 37,077,650 $ 37,984,082 $ 37,736,641 $ Part Time Salaries 488,955 437,709 465,415 Overtime 1,934,103 1,282,126 1,310,645 Allowances 352,254 362,429 365,882 Benefits: FICA 2,950,890 3,049,660 3,006,009 LAGERS 5,533,967 5,900,196 6,131,695 Health Insurance 7,163,439 6,654,268 6,822,555 Dental Insurance 333,387 362,707 349,354 Life Insurance 74,810 70,029 69,893 Deferred Compensation 15,265 12,265Long Term Disability 32,832 34,848 34,927 Retiree Health Insurance 4,529,147 3,905,139 4,491,379 Total Benefits 20,633,737 $ 19,989,112 $ 20,905,812 $ Other Personal Services 903,938 1,052,337 946,110 Total Personal Services 61,390,637 $ 61,107,795 $ 61,730,505 $ Other Services 9,248,691 9,596,382 9,652,109 Supplies 1,770,138 2,236,760 1,813,635 Capital Outlay - Operating Budget 721,714 881,833 743,724 City Council Strategic Goals 105,550 250,000 200,000 Other 1,155,922 604,153 643,803 Total Expenditures 74,392,652 $ 74,676,923 $ 74,783,776 $
25
City of Independence, Missouri
2016-17 Operating Budget
Appropriations by Type - General Fund
Allocation by Percentage
Capital PersonalOtherOutlay & DescriptionServicesServicesSuppliesOtherTotal Allocation by Amount City Council 448,096 $ 29,252 $ 4,770 $ - $ 482,118 $ City Clerk 275,598 28,218 17,568 - 321,384 City Manager 887,064 28,150 3,460 - 918,674 Technology Services 1,562,371 178,358 7,400 - 1,748,129 Municipal Court 813,113 32,155 8,022 - 853,290 Law 609,048 98,500 25,300 - 732,848 Finance 1,655,327 173,914 17,177 - 1,846,418 Human Resources 482,615 3,252 5,331 - 491,198 Community Development1,275,427 1,800,755 12,252 - 3,088,434 Police 25,148,958 1,292,995 601,647 23,000 27,066,600 Fire 16,830,836 671,003 245,257 35,329 17,782,425 Health 1,865,917 699,709 42,434 - 2,608,060 Public Works 2,940,399 1,413,326 721,799 344,024 5,419,548 Parks and Recreation 1,136,198 256,777 97,753 - 1,490,728 Non-Departmental 5,799,538 2,945,745 3,465 608,474 9,357,222 City Council Strategic Goals - - - 200,000 200,000 Capital Outlay - - - 376,700 376,700 General Fund Total 61,730,505 $ 9,652,109 $ 1,813,635 $ 1,587,527 $ 74,783,776 $
City Council 92.94%6.07%0.99%0.00%100.00% City Clerk 85.75%8.78%5.47%0.00%100.00% City Manager 96.56%3.06%0.38%0.00%100.00% Technology Services 89.37%10.20%0.42%0.00%100.00% Municipal Court95.29%3.77%0.94%0.00%100.00% Law83.11%13.44%3.45%0.00%100.00% Finance89.65%9.42%0.93%0.00%100.00% Human Resources98.25%0.66%1.09%0.00%100.00% Community Development41.30%58.31%0.40%0.00%100.00% Police92.92%4.78%2.22%0.08%100.00% Fire94.65%3.77%1.38%0.20%100.00% Health71.54%26.83%1.63%0.00%100.00% Public Works54.26%26.08%13.32%6.35%100.00% Parks and Recreation76.22%17.22%6.56%0.00%100.00% Non-Departmental61.98%31.48%0.04%6.50%100.00% City Council Strategic Goals0.00%0.00%0.00%0.00%0.00% Capital Outlay0.00%0.00%0.00%100.00%100.00% General Fund Total82.55%12.91%2.43%2.12%100.00% 26
2016-17 Operating Budget
Summary of Operating/Other Transfers and Designations of Fund Balance - General Fund
City of Independence, Missouri
the Fiscal Years 2015-16 and 2016-17 Description Amount 2015-16 Operating Transfers InFrom Other Funds$ Total Operating Transfers In$ Operating Transfers OutTo Falls at Crackerneck Creek TIF(1,545,149) $ To Amortize the Storm Water Fund accumulated deficit(10,000) Total Operating Transfers Out(1,555,149) $ Net Transfers(1,555,149) $
Operating Transfers InFrom Storm Water Fund197,063 $ Total Operating Transfers In197,063 $ Operating Transfers OutTo Amortize the Storm Water Fund accumulated deficit(10,000) Total Operating Transfers Out(10,000) $ Net Transfers187,063 $ 27
For
2016-17
2016-17 Operating Budget
City of Independence, Missouri Authorized Positions Summary - General Fund For the Fiscal Years 2010-11 through 2016-17
Note 1: The above totals are based on full time equivalent positions
Note 2: Changes by department and position between fiscal years 2015-16 and 2016-17 are shown on the following page(s).
Budget Description2010-112011-122012-132013-142014-152015-162016-17 City Council10.00 10.00 10.00 10.00 10.00 10.00 10.00 City Clerk 6.00 6.00 6.00 7.00 7.00 7.00 7.00 City Manager 9.50 7.00 7.00 7.00 7.00 7.00 7.00 National Frontier Trails Museum6.00 5.75 5.75 5.75 5.00 -Technology Services 21.00 22.00 22.00 22.00 23.00 24.00 24.00 Municipal Court 14.00 14.00 14.67 14.65 14.65 14.65 14.65 Law 6.00 6.25 6.25 6.25 6.23 6.23 6.23 Finance 24.15 22.65 22.65 22.65 22.15 22.15 22.15 Human Resources 6.50 6.50 6.44 7.44 6.75 6.75 6.75 Community Development 27.05 27.30 27.30 27.30 28.68 28.68 28.18 Police 292.90 288.65 289.91 291.91 296.91 296.91 295.91 Fire 173.25 173.25 173.25 169.25 169.75 173.75 173.75 Health 36.00 35.16 40.20 29.33 28.56 28.56 29.56 Public Works 83.00 79.90 79.90 80.27 80.27 80.27 80.27 Water Pollution Control 5.00 - - - - -Parks and Recreation 31.71 28.71 29.15 27.85 27.10 27.10 26.52 General Fund Total - Authorized752.06 733.12 740.47 728.65 733.05 733.05 731.97 Less: Positions not Funded(40.55) (60.05) (79.27) (73.77) (70.27) (69.77) (73.11) General Fund Total - Funded711.51 673.07 661.20 654.88 662.78 663.28 658.86
28
Mayor/City Council
Management Analyst Exec. Asst. to City Council Mayor/City Council29
Administrative Specialist III
2016-17Operating Budget City Council

Appropriations by Type: ExpenditureActualOriginalRevisedAdopted Type2014-152015-162015-162016-17 Personal Ser.422,965 $ 419,799 $ 421,720 $ 448,096 $ Other Services26,883 29,252 29,252 29,252 Supplies5,918 4,770 4,770 4,770 Capital Outlay- - -Other - - -Total 455,766 $ 453,821 $ 455,742 $ 482,118 $ Historical Comparison: ActualActualActualActualBudgetBudget 2011-122012-132013-142014-152015-162016-17 Employees: Full Time Equiv. 10.00 10.00 10.00 10.00 10.00 10.00 Amount by Fund: General Fund 374,989 $ 392,093 $ 443,252 $ 455,766 $ 453,821 $ 482,118 $ Total All Funds374,989 $ 392,093 $ 443,252 $ 455,766 $ 453,821 $ 482,118 $ Comparative Ratios: Per Capita 3.21 $ 3.36 $ 3.78 $ 3.89 $ 3.87 $ 4.11 $ Per Household 7.69 $ 8.30 $ 8.98 $ 8.44 $ 8.32 $ 8.84 $ 92.9% 6.1% 1.0%
‐
Personal Ser. Other Services Supplies 0 200 400 600 800 1,000 2011-122012-132013-142014-152015-162016-17 $375 $392 $443 $456$454 $482 Dollars (1,000's) Fiscal Year 30
2016
17 Budget
The City Council is the legislative and governing body of the City, consisting of seven members, including the Mayor, who are elected by the voters within the City. The Council operates with powers granted by the City Charter to enact legislation to protect the public health, safety, and welfare of the City's residents. It also appoints the City Manager, City Management Analyst, City Clerk, and such other personnel as needed to assist the Council in performing its duties. The Council also appoints members to various advisory boards and commissions which provide them with community input and ideas.
Full Time Positions 10.00 10.00 10.00 10.00 Total 10.00 10.00 10.00 10.00 ============================================ 4002City Council 219,454 221,248 221,945 243,658 4003Management Analyst 92,798 88,678 89,337 88,741 4004Mayor's Office 143,514 143,895 144,460 149,719 Total 455,766 453,821 455,742 482,118 ============================================ General Fund 455,766 453,821 455,742 482,118 Total 455,766 453,821 455,742 482,118 ============================================ 31
The Council is the legislative and governing body of the City, consisting of two at-large members and four district members elected by a vote of the people. The City Council functions within the authority authorized by the City Charter. The Council appoints the City Manager, City Clerk, City Management Analyst, and such other personnel as may be needed to assist the Council in undertaking its duties. The Council enacts legislation to protect the health, peace, property, and general welfare of the citizens of the City.
Councilmember 6.00 6.00 6.00 6.00 Exec Assistant to City Council 1.00 1.00 1.00 1.00 Total 7.00 7.00 7.00 7.00 ============================================ Personal Services 211,244 211,578 212,275 233,988 Other Services & Charges 4,820 8,460 8,460 8,460 Supplies 3,390 1,210 1,210 1,210 Capital Outlay 0 0 0 0 Other Expenditures 0 0 0 0 Total 219,454 221,248 221,945 243,658 ============================================ 32
The City Management Analyst is responsible for systematically and continuously examining all works of all departments of the City in order to identify opportunities to reduce costs, increase efficiency, improve program efficiency, improve program effectiveness, and enhance professionalism of the administration of the City through application of modern principles of management or performance auditing.
Management Analyst 1.00 1.00 1.00 1.00 Total 1.00 1.00 1.00 1.00 ============================================ Personal Services 87,793 86,886 87,545 86,949 Other Services & Charges 4,873 1,232 1,232 1,232 Supplies 132 560 560 560 Capital Outlay 0 0 0 0 Other Expenditures 0 0 0 0 Total 92,798 88,678 89,337 88,741 ============================================ 33
The Mayor is the presiding officer of the City Council, elected by the registered voters of the City. The Mayor operates with powers granted by the City Charter to enact legislation to protect the public health, safety, and welfare of the City's residents. The Mayor appoints members to various advisory boards and commissions, and with powers like other council members, appoints the City Manager, City Management Analyst, City Clerk, and such other personnel as needed to assist him/her in the duties of the office.
Mayor 1.00 1.00 1.00 1.00 Admin Spec III, Mayor 1.00 1.00 1.00 1.00 Total 2.00 2.00 2.00 2.00 ============================================ Personal Services 123,928 121,335 121,900 127,159 Other Services & Charges 17,190 19,560 19,560 19,560 Supplies 2,396 3,000 3,000 3,000 Capital Outlay 0 0 0 0 Other Expenditures 0 0 0 0 Total 143,514 143,895 144,460 149,719 ============================================ 34
City Clerk
Copy Center (1) Copy/Records Center Specialist * Assistant City Clerk Records Management Administrative Specialist III Sarah Carnes-Lemp City Clerk (1) Mail Carrier/Copy Center Aide (1) Mail Carrier/Copy Center Operator * Records Analyst35
* Unfunded Position
2016-17Operating Budget City Clerk

Appropriations by Type: ExpenditureActualOriginalRevisedAdopted Type2014-152015-162015-162016-17 Personal Ser.330,534 $ 318,199 $ 320,042 $ 275,598 $ Other Services35,197 30,125 30,125 28,218 Supplies14,351 18,367 18,367 17,568 Capital Outlay1,623 - -Other - - -Total 381,705 $ 366,691 $ 368,534 $ 321,384 $ Historical Comparison: ActualActualActualActualBudgetBudget 2011-122012-132013-142014-152015-162016-17 Employees: Full Time Equiv. 6.00 6.00 7.00 7.00 7.00 7.00 Amount by Fund: General Fund 326,377 $ 385,511 $ 416,859 $ 381,705 $ 366,691 $ 321,384 $ Total All Funds326,377 $ 385,511 $ 416,859 $ 381,705 $ 366,691 $ 321,384 $ Comparative Ratios: Per Capita 2.79 $ 3.30 $ 3.56 $ 3.25 $ 3.13 $ 2.74 $ Per Household 6.70 $ 8.16 $ 8.44 $ 7.07 $ 6.72 $ 5.89 $ 85.8% 8.8% 5.5% 2016‐17 Budget Personal Ser. Other Services Supplies 0 200 400 600 800 1,000 2011-122012-132013-142014-152015-162016-17 $326 $386 $417 $382 $367 $321 Dollars (1,000's) Fiscal Year 36
Maintain journal of Council Proceedings; authenticate and record all ordinances and resolutions; edit and publish the City Code; certify the validity of city documents; attest to signatures on contracts and proclamations; apply the City Seal when appropriate; maintain a Council record indexing system; administer oaths of office; draft ordinances and resolutions; finalize public hearing and invitation to bid notices and submit for publication; process and return bid bonds for Capital Projects; maintain a records management program for the City; operate the in-house printing/scanning/mail processing facility of the City; pick up and deliver mail to the Post Office and inter-office mail to all City facilities; and work with the Jackson County Board of Election Commissioners in the handling of elections for the City.
Full Time Positions 6.00 6.00 6.00 6.00 Part Time Positions 1.00 1.00 1.00 1.00 Total 7.00 7.00 7.00 7.00 ============================================ 4012Clerical Support City Council 166,983 154,033 155,304 164,927 4014Records Management 59,971 60,697 61,269 3,185 4015Copy Center 154,751 151,961 151,961 153,272 Total 381,705 366,691 368,534 321,384 ============================================ General Fund 381,705 366,691 368,534 321,384 Total 381,705 366,691 368,534 321,384 ============================================ 37
Maintain journal of Council Proceedings; authenticate and record all ordinances and resolutions; edit and publish the City Code; certify the validity of city documents; attest to signatures on contracts and proclamations; apply the City Seal when appropriate; maintain a Council record indexing system; administer oaths of office; draft ordinances and resolutions; finalize public hearing and invitation to bid notices and submit for publication; process and return bid bonds for Capital Projects; and work with the Jackson County Board of Election Commissioners in the handling of elections for the City.
*Worked with staff liaisons in providing information for Council consideration to fill expired terms and vacancies on boards and commissions.
*Developed and implemented new process for Council to review applications and recommendations in lieu of the Council Interview Committee.
*Averaged less than one and a half days in providing initial response to requests for records under the Sunshine Law.
*Provided support to Council for an amendment of Council Rules of Procedure.
*With help from the Public Information Officer and Technology Services 2 staff, developed a process and system of notifying listed individuals of upcoming meetings and agendas.
*Provide support to Council in filling board vacancies in a timely manner.
*Work with Public Information Officer to use social media or other 2 methods to more directly inform citizens of opportunities to serve on City boards and commissions.
*Work with City Manager and Department Directors to implement new procedures requiring City boards and commissions staff liaisons to use
Resolutions Passed 96 95 95 95 City Council Meetings 30 30 25 30 Study Sessions 24 17 25 24 Ordinances Passed 187 145 185 165
38
Novus Agenda to form and publish agendas.
City Clerk 1.00 1.00 1.00 1.00 Administrative Spec III 1.00 1.00 1.00 1.00 Total 2.00 2.00 2.00 2.00 ============================================ Personal Services 150,085 137,983 139,254 149,571 Other Services & Charges 14,887 15,950 15,950 15,256 Supplies 388 100 100 100 Capital Outlay 1,623 0 0 0 Other Expenditures 0 0 0 0 Total 166,983 154,033 155,304 164,927 ============================================ 39
Maintain a Records Management program for the City. Determine length of time records are to be retained, which may be transferred to another medium, such as microfilm, and secure departmental and City Council approval for the final disposition (including destruction) of any records that have met the retention period, as identified by the State of Missouri.
*With volunteer assistance, reviewed and designated distribution or retention of records determined to have historical value.
*Worked with departments to increase storage in electronic form versus paper and assist with records management to ensure better compliance with retention guidelines.
*Added contract records to the electronic records management software for more efficient searching and copying.
*With the assistance of Technology Services, begin implementation of electronic forms submission to the City Clerk Department.
*Incorporate processes for electronic records in draft records management plan.
Records Stored- Cubic Feet 3,152 3,232 3,150 3,150
Records Analyst 1.00 1.00 1.00 1.00 Assistant City Clerk 1.00 1.00 1.00 1.00 Total 2.00 2.00 2.00 2.00 ============================================ 40
Personal Services 57,595 57,512 58,084 0 Other Services & Charges 2,272 2,960 2,960 2,960 Supplies 104 225 225 225 Capital Outlay 0 0 0 0 Other Expenditures 0 0 0 0 Total 59,971 60,697 61,269 3,185 ============================================ 41
Maintain in-house copy facility for the City, affix postage to all mail items being sent out by the City, and process utility bills for mailing along with metering outgoing mail; pick up and deliver mail to the Post Office and inter-office mail to all City facilities.
*Monitored new postal regulations and distributed information to City staff regarding new package tracking guidelines.
*Developed a Copy Center equipment/services needs assessment and began developing a five-year plan.
*Continue to add archived records to Laserfiche to allow for more efficient searching and retrieval.
*Continue to monitor new postal regulations that may require electronic mail piece tracking or price increases and work with City staff to comply.
*Work with departments to offer more scanning of records in order to increase their storage of records in electronic form.
*Increase education to City staff about in-house printing and scanning services to reduce costs for projects that may have otherwise been handled offsite.
Printing Impressions (in millions) 1.570 1.500 1.550 1.500 Items Mailed (in millions) 0.960 0.940 0.940 0.940
Copy/Records Center Specialist 1.00 1.00 1.00 1.00 Mail/Copy Center Operator 1.00 1.00 1.00 1.00 Mail Carrier/Copy Center Aide 1.00 1.00 1.00 1.00 Total 3.00 3.00 3.00 3.00 ============================================ 42
Personal Services 122,854 122,704 122,704 126,027 Other Services & Charges 18,038 11,215 11,215 10,002 Supplies 13,859 18,042 18,042 17,243 Capital Outlay 0 0 0 0 Other Expenditures 0 0 0 0 Total 154,751 151,961 151,961 153,272 ============================================ 43
Citizens of Independence
Mayor & City Council
Management Analyst Boards & Commissions City Clerk Municipal Court CITY MANAGER Assistant City Manager Deputy City Manager Public Works Parks/Recreation/Tourism Water Pollution Control Water Department City Counselor Finance Police Fire Power & Light Community Development Health Technology Services Human Resources Public Information Officer Community Liaison Specialist Economic Development Executive Assistant * Admin. Spec. III * Unfunded Position 44
2016-17Operating Budget
City Manager

Appropriations by Type: ExpenditureActualOriginalRevisedAdopted Type2014-152015-162015-162016-17 Personal Ser.854,431 $ 952,768 $ 958,748 $ 887,064 $ Other Services26,319 28,150 28,150 28,150 Supplies2,633 3,460 3,460 3,460 Capital Outlay3,209 - -Other - - -Total 886,592 $ 984,378 $ 990,358 $ 918,674 $ Historical Comparison: ActualActualActualActualBudgetBudget 2011-122012-132013-142014-152015-162016-17 Employees: Full Time Equiv. 7.00 7.00 7.00 7.00 7.00 7.00 Amount by Fund: General Fund 936,770 $ 833,576 $ 862,627 $ 886,592 $ 984,378 $ 918,674 $ Total All Funds936,770 $ 833,576 $ 862,627 $ 886,592 $ 984,378 $ 918,674 $ Comparative Ratios: Per Capita 8.02 $ 7.13 $ 7.36 $ 7.56 $ 8.40 $ 7.84 $ Per Household 19.22 $ 17.65 $ 17.47 $ 16.42 $ 18.05 $ 16.84 $ 96.6% 3.1% 0.4%
‐
Personal Ser. Other Services Supplies 0 250 500 750 1,000 1,250 1,500 2011-122012-132013-142014-152015-162016-17 $937 $834 $863 $887 $984 $919 Dollars (1,000's) Fiscal Year 45
2016
17 Budget
The City Manager is appointed by and serves at the pleasure of the City Council. The City Manager is the administrative head of the City government, executes the laws and ordinances, and administers the government of the City. The City Manager advises the Council of the financial condition and future needs of the City and takes recommendations to those officials. The City Manager prepares and submits the annual budget to the City Council for modification and adoption and is responsible for the administration of the annual budget after its adoption.
Full Time Positions 6.00 6.00 7.00 7.00 Part Time Positions 1.00 1.00 .00 .00 Total 7.00 7.00 7.00 7.00 ============================================ 4021City Manager 886,592 984,378 990,358 918,674 4023Economic Dev/Redevelopment 0 0 0 0 Total 886,592 984,378 990,358 918,674 ============================================ General Fund 886,592 984,378 990,358 918,674 Total 886,592 984,378 990,358 918,674 ============================================ 46
The City Manager is the Chief Administrative Officer of the City government, exercising direction over all municipal operations. The Manager is appointed by the City Council and is responsible to the Council for execution of all Council-directed policies and for the effective and efficient administration of all municipal service programs. The City Manager appoints and supervises department directors, formulates and presents to the City Council such measures or actions considered necessary or proper, presents the Council with a proposed budget each year, and performs such other activities as are prescribed in the City Charter.
Assistant City Manager 1.00 1.00 1.00 1.00 City Manager 1.00 1.00 1.00 1.00 Public Information Officer .00 1.00 1.00 1.00 Community Liaison Specialist .00 .00 1.00 1.00 Deputy City Manager 1.00 1.00 1.00 1.00 Executive Assistant 1.00 1.00 1.00 1.00 Administrative Spec III 1.00 1.00 1.00 1.00 Public Management Intern II 1.00 1.00 .00 .00 Total 6.00 7.00 7.00 7.00 ============================================ Personal Services 854,431 952,768 958,748 887,064 Other Services & Charges 26,319 28,150 28,150 28,150 Supplies 2,633 3,460 3,460 3,460 Capital Outlay 3,209 0 0 0 Other Expenditures 0 0 0 0 Total 886,592 984,378 990,358 918,674 ============================================ 47
Technology Services
Software Engineer(3)
Programmer Analyst * Web Developer/ Administrator Cyber Security Specialist Cyber Security Network Systems Engineer Computer Operations Supervisor Computer Operations * Computer Operator I Computer Operator II Information Technology Systems Manager Applications Programming Administrative Specialist III Mark
Information Technology Director Information Technology Systems Manager Network Operations
(1.5)
Video Production Specialist
Systems Analyst
Baumann
Desktop Support
(2)
Technician
Systems
Systems Administrator * Network Systems Specialist * Programmer Analyst * Network Systems Engineer * Unfunded Position 48
(3) Network
Specialist
2016-17Operating Budget Technology Services

Appropriations by Type: ExpenditureActualOriginalRevisedAdopted Type2014-152015-162015-162016-17 Personal Ser.1,609,029 $ 1,771,172 $ 1,785,484 $ 1,696,126 $ Other Services146,946 197,600 197,584 178,688 Supplies10,126 16,810 16,570 7,400 Capital Outlay9,584 - 256Other 18,890 11,019 11,019Total 1,794,575 $ 1,996,601 $ 2,010,913 $ 1,882,214 $ Historical Comparison: ActualActualActualActualBudgetBudget 2011-122012-132013-142014-152015-162016-17 Employees: Full Time Equiv. 23.50 23.50 23.50 24.50 25.50 25.50 Amount by Fund: General Fund 1,650,858 $ 1,542,233 $ 1,627,925 $ 1,666,875 $ 1,867,106 $ 1,748,129 $ Power and Light Fund116,431 119,161 125,472 127,700 129,495 134,085 Total All Funds1,767,289 $ 1,661,394 $ 1,753,397 $ 1,794,575 $ 1,996,601 $ 1,882,214 $ Comparative Ratios: Per Capita 14.58 $ 14.22 $ 15.01 $ 15.31 $ 17.03 $ 16.05 $ Per Household 32.67 $ 34.09 $ 37.12 $ 36.34 $ 36.99 $ 34.51 $ 90.1% 9.5% 0.4% 2016‐17 Budget Personal Ser. Other Services Supplies 0 500 1,000 1,500 2,000 2,500 2011-122012-132013-142014-152015-162016-17 $1,767 $1,661 $1,753 $1,795 $1,997 $1,882 Dollars (1,000's) Fiscal Year 49
Technology Services provides analysis, programming, and computer processing support services to all City departments. The City's computer facility consists of two midrange computers, a series of Local Area Network file servers, and a communication network of terminals which connect with user departments. Technology Services is also responsible for administering a telephone system consisting of 830 telephone stations, administration of voicemail, and coordinating long distance service with appropriate vendors.
Full Time Positions 23.00 24.00 25.00 25.00 Part Time Positions .50 .50 .50 .50 Total 23.50 24.50 25.50 25.50 ============================================ 4052Technology Services 1,579,155 1,778,102 1,791,404 1,657,340 4053Technology Services P&L 127,700 129,495 129,495 134,085 4057Communications 87,720 89,004 90,014 90,789 Total 1,794,575 1,996,601 2,010,913 1,882,214 ============================================ General Fund 1,666,875 1,867,106 1,881,418 1,748,129 Power and Light Fund 127,700 129,495 129,495 134,085 Total 1,794,575 1,996,601 2,010,913 1,882,214 ============================================ 50
Technology Services provides information technology support to all City departments. This includes support for all hardware and software application systems that reside on the City's IBM mid-range systems, networked file servers, personal computers and mobile devices. Technology Services is also responsible for the City government data communications network, the security of all computer systems and data, and all voice communication systems and services. Our software development staff provides custom application development including the development of the City's Internet and Intranet sites.
*Completed the replication of Cityworks Storage Area Network between 2 the primary datacenter and Disaster Recovery site. *Replaced and expanded the City WiFi operations to numerous City 2 buildings and facilities. *Replaced the 50 MB internet connection with a redundant 1 GB internet 2
in
& light's fiber operations at
cost. *In cooperation with Community Development and Power & Light, 2 installed a new security camera surveillance system at the Transportation Center located at Noland and Truman Roads. *In cooperation with the City Council and City Manager's Office, 2 designed and developed the INsight Independence Performance Dashboard. *Awarded first place in the Center for Digital Government's Best of 2 the Web awards. *Awarded 10th place in the Center for Digital Government's Digital 2 Cities Survey. *Completed the Citizen Action Center integration with the Cityworks 2 Asset Management System. *In cooperation with the Cities Utilities, commenced on the 2 replacement of the City's legacy Utility Billing System with a new Customer Information and Billing System enterprise solution. *Designed and developed a system for the public to use in subscribing 2 to Boards and Commissions Agenda notifications. Computer Workstations 1,000 1,000 1,000 1,000 51
connection
cooperation with Power
a greatly reduced
IBM iSeries On-Line Transactions 23.437 22.009 24.000 24.000 (in millions) Requests for Software Services 481 329 400 250 Completed Help Desk Service Calls 1,954 1,730 2,700 2,400 Web Site Visitors-Internet 2.039 1.474 2.000 0 (in millions) CityNet Visitors - Intranet 226,935 187,878 220,000 220,000 Web Site Users-Internet 0 0 0 515,000 *Continue to maintain life-cycle hardware replacement program that 2 consists of installing replacement personal computers,file servers, storage systems and networking equipment as funded in the capital budget. *Migrate business licensing, liquor licensing and employee permits 2 from the current in-house developed legacy system to the Cityworks Permits, Licensing & Land (PLL) system. *Complete the replacement of the in-house developed legacy Utility 2 Billing System with an enterprise customer information and billing solution built on current industry standard hardware and software technologies which will also provide comprehensive functionality while ensuring excellent customer service to the City's utilities customers. *Continue to develop and maintain a citywide Information Technology 2 (IT) disaster recovery platform and disaster recovery plan that will facilitate recovery of the City's business-critical systems in the event of a natural or man-made disaster. *Expand the City's open data presence on the City's website by 2 increasing the number of data sets available to the public. Information Tech Dir 1.00 1.00 1.00 1.00 Information Tech Sys Mgr 2.00 2.00 2.00 2.00 Software Engineer 1.00 1.00 1.00 1.00 Cyber Security Specialist .50 .50 .50 .50 Network System Engineer .00 1.00 .00 .00 Computer Operations Supvr 1.00 1.00 1.00 1.00 Computer Operator I 1.00 1.00 1.00 1.00 Systems Administrator .00 .00 1.00 1.00 Computer Operator II 1.00 1.00 1.00 1.00 Network System Specialist 3.00 3.00 3.00 3.00 52
Sr Network System Specialist 1.00 1.00 .00 .00 Programmer Analyst 2.00 2.00 2.00 2.00 Systems Analyst 3.00 3.00 3.00 3.00 Network Systems Engineer .00 .00 2.00 2.00 Desktop Support Technician 2.00 2.00 2.00 2.00 Web Developer Administrator 1.00 1.00 1.00 1.00 GIS Analyst .00 .00 .00 .00 Administrative Spec III 1.00 1.00 1.00 1.00 Total 20.50 21.50 22.50 22.50 ============================================ Personal Services 1,398,091 1,558,198 1,571,500 1,475,340 Other Services & Charges 145,983 194,275 194,143 176,800 Supplies 9,152 14,610 14,486 5,200 Capital Outlay 7,039 0 256 0 Other Expenditures 18,890 11,019 11,019 0 Total 1,579,155 1,778,102 1,791,404 1,657,340 ============================================ 53
Staff serving Power & Light provide personal computer and local area network support services to Power & Light staff.
Cyber Security Specialist .50 .50 .50 .50 Network System Specialist 1.00 1.00 1.00 1.00 Total 1.50 1.50 1.50 1.50 ============================================ Personal Services 127,510 128,835 128,835 133,755 Other Services & Charges 190 660 660 330 Supplies 0 0 0 0 Capital Outlay 0 0 0 0 Other Expenditures 0 0 0 0 Total 127,700 129,495 129,495 134,085 ============================================ 54
The Communications Division is responsible for timely dissemination of information on municipal programs and services, using all methods necessary to ensure a well-informed citizenry.
*Began live and on demand streaming of the Planning Commission and TIF 2 Commission meetings on the City's website. *In cooperation with the Public Works Department, completed the City 2 Council Chamber equipment upgrade. *Completed phase 1 of upgrading City 7 equipment from analog to 2 digital. *Oversee City7 programming to keep public informed of high profile 2 issues that impact the community. *Produce live broadcasts of City Council and Planning Commission 2 meetings. *Produce videos to publicize City services, programs and products. 2 Video Production Specialist 1.50 1.50 1.50 1.50 Total 1.50 1.50 1.50 1.50 ============================================ Personal Services 83,428 84,139 85,149 87,031 Other Services & Charges 773 2,665 2,781 1,558 Supplies 974 2,200 2,084 2,200 Capital Outlay 2,545 0 0 0 Other Expenditures 0 0 0 0 Total 87,720 89,004 90,014 90,789 ============================================ 55
Municipal Court
Presiding Judge
Judge
Municipal Court Administrator
(3) Court Clerks(4) Clerk II
(.65) Court Bailiff
(3) Senior Clerks
* Clerk II * Unfunded Position
Municipal Garry Helm56
2016-17Operating Budget Municipal Court
2016‐17 Budget

Appropriations by Type: ExpenditureActualOriginalRevisedAdopted Type2014-152015-162015-162016-17 Personal Ser.794,249 $ 795,889 $ 800,658 $ 813,113 $ Other Services28,759 32,155 32,730 32,155 Supplies4,275 8,022 7,447 8,022 Capital Outlay- - -Other - - -Total 827,283 $ 836,066 $ 840,835 $ 853,290 $ Historical Comparison: ActualActualActualActualBudgetBudget 2011-122012-132013-142014-152015-162016-17 Employees: Full Time Equiv. 14.00 14.67 14.65 14.65 14.65 14.65 Amount by Fund: General Fund 747,759 $ 748,027 $ 793,317 $ 827,283 $ 836,066 $ 853,290 $ Total All Funds747,759 $ 748,027 $ 793,317 $ 827,283 $ 836,066 $ 853,290 $ Comparative Ratios: Per Capita 6.40 $ 6.40 $ 6.77 $ 7.05 $ 7.13 $ 7.28 $ Per Household 15.34 $ 15.84 $ 16.06 $ 15.33 $ 15.33 $ 15.64 $ 95.3% 3.8% 0.9%
Personal Ser. Other Services Supplies 0 300 600 900 1,200 1,500 2011-122012-132013-142014-152015-162016-17 $748 $748 $793 $827 $836 $853 Dollars (1,000's) Fiscal Year 57
The Municipal Court has jurisdiction of cases involving violation of City ordinances; establishes and collects all fines, court costs, and bond money; issues warrants, subpoenas, and orders of commitment; and provides other services as prescribed by the Charter of the City of Independence, Missouri and applicable State Statutes.
Full Time Positions 14.00 14.00 14.00 14.00 Part Time Positions .65 .65 .65 .65 Total 14.65 14.65 14.65 14.65 ============================================ 4090Municipal Court 827,283 836,066 840,835 853,290 Total 827,283 836,066 840,835 853,290 ============================================ General Fund 827,283 836,066 840,835 853,290 Total 827,283 836,066 840,835 853,290 ============================================ 58
The Municipal Court has jurisdiction of cases involving violation of City ordinances; establishes and collects all fines, court costs and bond money; issues warrants, subpoenas, orders of commitment; and provides other services as prescribed by the Charter of the City of Independence, Missouri and applicable State Statutes.
*Purchased a Amrotec X-1 Currency Discriminator machine for incoming 2 cash the court receives. *Senate Bill 5 procedures were created and put into operation in order 2 to stay in compliance. *Supreme Court Rule 37.65 procedures were created and put into 2 operations in order to stay in compliance. *Created a new Show Cause docket for Supreme Court Rule 37.65 2 *Created new policies for Attorneys regarding Senate Bill 5. 2 *Envelope study concluded ordering plain black Ink on them proved 2 to be a substantial savings to the court and City. No. of Cases Disposed by Court 32,880 32,375 31,760 27,764 No. of Cases Disposed at the 12,333 11,197 10,886 10,370 Traffic Violations Bureau No. of Warrants Issued 28,082 27,149 28,966 23,628 No. of Cases Docketed 103,539 105,309 106,128 105,634 No. of Night Court Cases Docketed 642 630 650 634 State Report Compliance 75% 79% 97% 54% Domestic Violence Subpoena 43% 38% 55% 52% Appearance *Store and Maintain court records off-site at Iron Mountain. 2 *Initiate, process and complete another Record Destruction Ordinance 2 in accordance with Court Operating Rule 8.01. *Continue to abide by all State rulings pertaining to Senate Bill 5. 2 *Continue to abide by all State rulings pertaining to Supreme Court 2 Rule 37.65. 59
Municipal Judge 1.00 1.00 1.00 1.00 Presiding Judge 1.00 1.00 1.00 1.00 Municipal Court Admin 1.00 1.00 1.00 1.00 Clerk II 5.00 5.00 5.00 5.00 Court Clerk 3.00 3.00 3.00 3.00 Senior Court Clerk 3.00 3.00 3.00 3.00 Court Bailiff .65 .65 .65 .65 Total 14.65 14.65 14.65 14.65 ============================================ Personal Services 794,249 795,889 800,658 813,113 Other Services & Charges 28,759 32,155 32,730 32,155 Supplies 4,275 8,022 7,447 8,022 Capital Outlay 0 0 0 0 Other Expenditures 0 0 0 0 Total 827,283 836,066 840,835 853,290 ============================================ 60
Workers’ Compensation Legal Services
City Counselor Workers' Comp Coord. (.50) Asst. City Counselor II Law (1) Admin Spec. III Deputy City Counselor City Prosecutor (.50) Asst. City Counselor II (.25) Asst. City Counselor II (Grant Funded) Utility Counselor * (.50) Admin. Spec. II (.50) Admin. Spec. II * Unfunded Position 61
Dayla Bishop Schwartz
2016-17Operating Budget Law

2016‐17 Budget
Historical Comparison:
Appropriations by Type: ExpenditureActualOriginalRevisedAdopted Type2014-152015-162015-162016-17 Personal Ser. 765,630 $ 803,962 $ 810,864 $ 787,417 $ Other Services2,354,216 2,494,050 2,498,853 2,404,350 Supplies 23,262 31,800 31,747 31,800 Capital Outlay 1,007 2,500 2,500 2,500 Other - - -Total 3,144,115 $ 3,332,312 $ 3,343,964 $ 3,226,067 $
ActualActualActualActualBudgetBudget 2011-122012-132013-142014-152015-162016-17 Employees: Full Time Equiv. 8.50 8.50 8.50 8.51 8.51 8.37 Amount by Fund: General Fund 727,684 $ 613,562 $ 677,186 $ 789,297 $ 741,884 $ 732,848 $ Grants 29,913 29,900 16,190 12,352 31,944 18,189 Work Comp Fund1,549,131 3,645,782 2,284,510 2,342,466 2,558,484 2,475,030 Total All Funds2,306,728 $ 4,289,244 $ 2,977,886 $ 3,144,115 $ 3,332,312 $ 3,226,067 $ Comparative Ratios: Per Capita 19.03 $ 36.71 $ 25.49 $ 26.82 $ 28.42 $ 27.52 $ Per Household 42.65 $ 88.00 $ 63.04 $ 63.67 $ 61.73 $ 59.15 $ 24.4% 74.5% 1.0% 0.1%
Personal Ser. Other Services Supplies Capital Outlay 0 1,000 2,000 3,000 4,000 5,000 2011-122012-132013-142014-152015-162016-17 $2,307 $4,289 $2,978 $3,144 $3,332 $3,226 Dollars (1,000's) Fiscal Year 62
Conduct and carry on all civil suits, actions and proceedings; represent the City on all legal matters in which the City is a party or interested; advise the Council, City Manager and all departments, boards, and commissions concerning any legal issues affecting the City's interest; draft or review proposed City ordinances and amendments; prepare or officially approve as to form all contracts, deeds, bonds, and other documents; direct and supervise the future codifications of ordinances; and perform such other legal duties as required.
Full Time Positions 8.00 8.00 8.00 8.00 Part Time Positions .50 .51 .51 .37 Total 8.50 8.51 8.51 8.37 ============================================ 4100Law 789,297 741,884 748,021 732,848 4150Law Dept. Grants 12,352 31,944 37,459 18,189 6592Worker's Compensation 2,342,466 2,558,484 2,558,484 2,475,030 Total 3,144,115 3,332,312 3,343,964 3,226,067 ============================================ General Fund 789,297 741,884 748,021 732,848 Grants 12,352 31,944 37,459 18,189 Worker's Compensation Fund 2,342,466 2,558,484 2,558,484 2,475,030 Total 3,144,115 3,332,312 3,343,964 3,226,067 ============================================ 63
The Workers Compensation Program functions as an internal service provider for City employees. The program ensures that City employees who sustain valid work-related injuries will receive all benefits provided under state statute and City policies. The program will maintain self-funded status as defined by the State of Missouri Department of Insurance and Division of Workers Compensation. The program will provide injured worker benefits through the Workers Compensation Fund, which will be funded by premiums paid by each City department. *Pharmacy Benefit Card created a 41% cost savings for prescription
3
and co-pay demands at pharmacy. *Updated Early Intervention program nurse phone number, reducing 3 response time to provide proper care for injured workers. *Updated Citynet page, employee injury forms to reflect new phone 3
and distributed cards containing updated instructions to all employees. *Provided value added service of job task analyses for job 3 classifications with a history or potential of injury. *Closed 98% of medical-only claims within six months of final medical 3 care.
of
non-litigated indemnity
were closed
12 3
(MMI)
*100% of closed non-denied litigated claims were closed within 24 3
of
medical improvement (MMI), representing
all litigated
at MMI. *Accommodated 95% of doctor restrictions for
injured workers 3
modified
in
areas
home
to
MMI 64
drugs for employees, and ease of use for injured workers, eliminating confusion
number,
*79%
closed
claims
within
months of reaching maximum medical improvement
including 80% involving permanent partial disability, representing 61% of all non-litigated claims at MMI.
months
reaching maximum
32% of
claims
returning
to temporary
duty, including utilizing placement
alternate work
when
department was unable
accommodate work restrictions. Closure of Medical-Only claims within 6 months of
*Timely closure of all workers compensation claims: 3
- Close 95% of all Medical-only claims within six months of final medical care.
- Close 90% of all Non-litigated claims involving permanent partial disability within twelve months of reaching maximum medical improvement (MMI).
- Close 80% of all Litigated claims within twenty-four months of MMI.
3
*Develop job analyses to assist in
workers to 3 regular job duties. Asst City Counselor II .50 .50 .50 .50 Worker's Compensation Coord 1.00 1.00 1.00 1.00 Administrative Spec II .50 .50 .50 .50 Total 2.00 2.00 2.00 2.00 ============================================ Personal Services 153,479 153,934 153,934 160,180 Other Services & Charges 2,185,138 2,395,550 2,395,550 2,305,850 Supplies 2,842 6,500 6,500 6,500 Capital Outlay 1,007 2,500 2,500 2,500 Other Expenditures 0 0 0 0 Total 2,342,466 2,558,484 2,558,484 2,475,030 ============================================ 65
*Accommodate 95% of Returns to work when treating doctor places
injured worker on modified duty.
returning injured
Conduct and carry on all civil suits, actions, and proceedings; represent the City on all legal matters in which the City is a party or interested; advise the Council, City Manager, and all departments, boards, and commissions concerning any legal issues affecting the City's interest; draft or review proposed City ordinances and amendments; prepare or officially approve as to form all contracts, deeds, bonds, and other documents; direct and supervise the future codifications of ordinances; and perform such other legal duties as required.
*Furnished all required legal services to the City Council, the City 3 Manager and all City Departments by prosecuting all cases in Municipal Court; defending and and prosecuting civil lawsuits; drafting and reviewing countracts, ordinances and opinions; attending meetings of the Council, the Planning Commission, the Board of Adjustment and all other required meeting; and providing timely advice when requested. *Continued monthly litigation and damage claim reports to the City 3 Council, the City Manager and City Departments. *Continued development of City-wide communications covering the
3
with
laws.
City Council, Planning Commission and
of
3 meetings as
as other meetings as
City Counselor 1.00 1.00 1.00 1.00 City Prosecutor 1.00 1.00 1.00 1.00 Asst City Counselor III 1.00 1.00 .00 .00 66
3 employee's role in the damage claim process, litigation and Worker's Compensation by employing existing communication channels. *To ensure appropriate legal counsel and representation is provided in 3 a timely manner to enable the City government to meet its goals and objectives. *To protect the City's financial interests through development and 3 review of policies and to participate in decision-making for the purpose of minimizing liabilities. *To review contracts and other documents, as requested, to ensure
compliance
local, state, and federal
*Attend
Board
Adjustment
well
required by the City.
Utility Counselor .00 .00 1.00 1.00 Asst City Counselor II .75 .73 .73 .71 Administrative Spec II .50 .50 .50 .50 Administrative Spec III 1.00 1.00 1.00 1.00 Deputy City Counselor 1.00 1.00 1.00 1.00 Total 6.25 6.23 6.23 6.21 ============================================ Personal Services 599,799 618,084 624,221 609,048 Other Services & Charges 169,078 98,500 98,553 98,500 Supplies 20,420 25,300 25,247 25,300 Capital Outlay 0 0 0 0 Other Expenditures 0 0 0 0 Total 789,297 741,884 748,021 732,848 ============================================ 67
This cost center represents Federal and State grant programs that support the operations of the City's Law Department. See the Law Department cost center (4100) for applicable Accomplishments, Objectives, and Service Delivery Background
Asst City Counselor II .25 .28 .28 .16 Total .25 .28 .28 .16 ============================================ Personal Services 12,352 31,944 32,709 18,189 Other Services & Charges 0 0 4,750 0 Supplies 0 0 0 0 Capital Outlay 0 0 0 0 Other Expenditures 0 0 0 0 Total 12,352 31,944 37,459 18,189 ============================================ 68
Data.
Accounting Supervisor Accounts Receivable Accounts Receivable Spec Payroll Specialist Accounting Supervisor Accounts Payable (2) Accounts Payable Spec Accounting Supervisor Financial Reporting (2) Accountant I * Budget Manager Budget Analyst Purchasing Manager Purchasing (2) Procurement Spec Asst. Procurement Spec * Clerk II Deputy Finance Director * Admin Spec. III Brian Watson Finance Director Risk & Business License Manager Occupation Licensing (2) Business License Compliance Officers Accounts Spec. Finance * Unfunded Position 69
2016-17Operating Budget Finance

Appropriations by Type: ExpenditureActualOriginalRevisedAdopted Type2014-152015-162015-162016-17 Personal Ser.1,827,942 $ 1,799,309 $ 1,811,327 $ 1,708,332 $ Other Services157,608 203,713 204,479 173,914 Supplies9,834 17,177 16,411 17,177 Capital Outlay- - -Other - - -Total 1,995,384 $ 2,020,199 $ 2,032,217 $ 1,899,423 $ Historical Comparison: ActualActualActualActualBudgetBudget 2011-122012-132013-142014-152015-162016-17 Employees: Full Time Equiv. 23.50 23.50 23.50 23.00 23.00 23.00 Amount by Fund: General Fund 1,819,555 $ 1,778,961 $ 2,026,664 $ 1,944,054 $ 1,968,698 $ 1,846,418 $ Water Fund 46,210 50,369 50,369 51,330 51,501 53,005 Total All Funds1,865,765 $ 1,829,330 $ 2,077,033 $ 1,995,384 $ 2,020,199 $ 1,899,423 $ Comparative Ratios: Per Capita 15.97 $ 15.66 $ 17.72 $ 17.02 $ 17.23 $ 16.20 $ Per Household 38.28 $ 38.73 $ 42.06 $ 36.96 $ 37.04 $ 34.82 $ 89.9% 9.2% 0.9% 2016‐17 Budget Personal Ser. Other Services Supplies 0 500 1,000 1,500 2,000 2,500 3,000 2011-122012-132013-142014-152015-162016-17 $1,866 $1,829 $2,077 $1,995 $2,020 $1,899 Dollars (1,000's) Fiscal Year 70
The Finance Department is responsible for the administration of all financial affairs of the City. We maintain accounting systems, approve all disbursements, prepare payrolls, and pre-audit all claims and demands for the City. Finance bills for established revenue sources due to the City, as well as collects and invests all such City funds. Finance prepares the annual financial statements and other financial reports that may be required. Finance, through its Purchasing division, supervises and controls the acquisition of all City goods and services within approved procurement procedures. In addition, Finance processes occupation and liquor licenses through its Business Licensing division.
Full Time Positions 23.00 23.00 23.00 23.00 Part Time Positions .50 .00 .00 .00 Total 23.50 23.00 23.00 23.00 ============================================ 4201Finance Administration 472,397 383,418 386,664 270,376 4210Accounting 940,554 1,009,723 1,014,045 1,011,950 4217City Hall Cashiering 51,330 51,501 51,501 53,005 4240Purchasing 291,469 289,106 291,562 300,240 4260Business Licensing 239,634 286,451 288,445 263,852 Total 1,995,384 2,020,199 2,032,217 1,899,423 ============================================ General Fund 1,944,054 1,968,698 1,980,716 1,846,418 Water Fund 51,330 51,501 51,501 53,005 Total 1,995,384 2,020,199 2,032,217 1,899,423 ============================================ 71
Provides administrative support to the Finance Department. The Finance Department's overall responsibility is for the collection of all amounts due to the City, procurement of goods and services for all City operations, and payment of amounts due to vendors and agents. The department maintains an internal control system for safeguarding all assets, auditing, financial reporting, risk management, and budgeting. The Administration division is directly responsible for budget preparation and monitoring budget results.
*Received the 'Distinguised Budget Presentation Award' from the 4 Government Finance Officers Association for the 30th consecutive year.
General Fund Revenues 75,017,58974,793,39172,721,59774,455,530 Year End Unassigned Fund Balance$3,591,990$3,741,675$2,426,758 Number of budget hold items 1,801 1,969 1,900 1,950 Average number of days per item on 2.28 1.32 1.50 1.50 budget hold Percentage of budget hold items 88.7% 91.5% 92.0% 92.0% released within 2 calendar days *Review all financial service agreements for potential savings. 2 *Review the City's outstanding debt for potential interest savings. 2 *Continue planning for new accounting, payroll and budgeting system. *Audit existing utility franchise fee revenues. Finance Director 1.00 1.00 1.00 1.00 Budget Manager 1.00 1.00 1.00 1.00 Budget Analyst 1.00 1.00 1.00 1.00 72
Administrative Spec III 1.00 1.00 1.00 1.00 Total 4.00 4.00 4.00 4.00 ============================================ Personal Services 460,564 368,480 371,726 255,579 Other Services & Charges 6,033 3,818 4,584 3,677 Supplies 5,800 11,120 10,354 11,120 Capital Outlay 0 0 0 0 Other Expenditures 0 0 0 0 Total 472,397 383,418 386,664 270,376 ============================================ 73
Responsible for maintaining the accounting records for all of the City's operations and the City's Component Units: Tax Increment Financing (TIF), Crackerneck Creek Transportation Development District (TDD), and the Events Center Community Improvement District (CID).The functions encompass the following: development of the Comprehensive Annual Financial report and monthly financial reports; accounts receivable; processing and payment of financial obligations of the City; maintaining records for all City-owned fixed assets; record keeping of grants; investing City funds; payroll and working with the independent auditors.
*Reviewed Governmental Accounting Standards Board (GASB) Statement No. 2 72, Fair Value Measurement and Application, effective for the fiscal year beginning July 1, 2015.
*Reviewed Governmental Accounting Standards Board (GASB) Statement No. 2 73, Accounting and Financial Reporting for Pensions That Are Not Within the Scope of GASB Statement 68, and Amendments to Certain Provisions of GASB Statements 67 and 68, effective for the fiscal year beginning July 1, 2015.
*Reviewed Governmental Accounting Standards Board (GASB) Statement No. 2 76, The Hierarchy of Generally Accepted Accounting Principles for State and Local Governments, effective for the fiscal year beginning July 1, 2015.
*Reviewed Governmental Accounting Standards Board (GASB) Statement No. 2 79, Certain External Investment Pools and Pool Participants, effective for the fiscal year beginning July 1, 2015.
*Received the 'Certificate of Achievement for Excellence in Financial Reporting Award' from the Government Finance Officers Association for the 31st consecutive year.
Payroll Direct Deposits Processed 29,071 28,904 29,500 28,800 Number of Payroll Supplemental 86 100 100 110 Checks Processed Disbursement Checks Processed 11,815 11,085 11,489 11,337 Department Local Checks Processed 404 341 424 337 74
Electronic Payments 833 876 837 844 Percent of Request for Payments 98.98% 98.98% 96.63% 96.81% Paid Within 14 Days Percent of Invoices Paid Within 86.14% 84.15% 82.74% 82.89% 30 Days of Invoice Date Misc. Invoices Issued $4,126,097$4,099,987$4,000,000$4,000,000 Average Rate of Return Earned on .048% .023% .037% .052% Investments and Money Market Average Number of Days to Issue 17 35 20 25 Monthly Financial Report *Review Governmental Accounting Standards Board (GASB) Statement No. 2 74, Financial Reporting for Post-Employment Benefit Plans Other Than Pension Plans, effective with the fiscal year beginning July 1, 2016. *Review Governmental Accounting Standards Board (GASB) Statement No. 2 77, Tax Abatement Disclosures, effective with the fiscal year beginning July 1, 2016. *Review Governmental Accounting Standards Board (GASB) Statement No. 2 78, Pensions Provided Through Certain Multiple-Employer Defined Benefit Pension Plans, effective with the fiscal year beginning July 1, 2016. *Review new features and enhancements in the Financial Management 2 System that will improve our current processes. Accounts Payable Spec 2.00 1.00 1.00 1.00 Accounts Receivable Spec 1.00 1.00 1.00 1.00 Accounts Specialist 1.00 1.00 1.00 1.00 Deputy Finance Director 1.00 1.00 1.00 .00 Accountant I 1.50 2.00 2.00 2.00 Senior Accountant 1.00 1.00 .00 .00 Accounting Supervisor 2.00 2.00 3.00 3.00 Deputy Finance Director .00 .00 .00 1.00 Payroll Specialist 1.00 1.00 1.00 1.00 Total 10.50 10.00 10.00 10.00 ============================================ 75
Personal Services 791,790 856,238 860,560 858,536 Other Services & Charges 145,447 150,070 150,070 149,999 Supplies 3,317 3,415 3,415 3,415 Capital Outlay 0 0 0 0 Other Expenditures 0 0 0 0 Total 940,554 1,009,723 1,014,045 1,011,950 ============================================ 76
Cashiering processes utility payments, sells bus passes, and collects payment for other licenses and permits obtained on the second floor of City Hall. This function also balances all City Hall cash receipts and prepares bank deposits for these receipts and all other General Fund receipts collected at other locations. Provides information to walk-in customers and support to other Finance Department divisions.
*Assisted accounts payable function in processing P-Card transactions. 4
*Learned to merge, print and mail business license and landlord 4 renewal forms.
*Learn to process and post business license payments in CityWorks and 4 iNovah cash receipts system.
*Work with Technology Services to implement an electronic transfer of 4 payment information between CityWorks business licensing system and iNovah, the City's Cash Receipts software.
*Assist in the implementation and testing of the CityWorks business 4 licensing system.
Total Transactions Processed 22,563 20,250 22,750 20,000 Total Dollars Processed (Millions) $18.0 $15.5 $18.0 $15.3 Utility bills as percentage of 27.03% 26.39% 27.25% 26.25% total transactions Utility payments as a percentage of 8.73% 8.06% 8.50% 2.00% dollars processed MGE payments as a percentage of 11.76% 11.62% 11.85% 4.00% transactions processed MGE payments as a percentage of 2.34% 2.59% 2.30% 1.00% dollars processed Bus Passes as a percentage of total 2.43% 2.50% 2.45% 0.75% transactions processed Average cash out of balance amount ($9.10) ($8.00) $1.00 $2.50 Percentage of days when cash 1.66% 0.80% 1.50% 1.25% closing is out of balance
77
Accounts Specialist .85 .85 .85 .85 Total .85 .85 .85 .85 ============================================ Personal Services 51,330 51,501 51,501 53,005 Other Services & Charges 0 0 0 0 Supplies 0 0 0 0 Capital Outlay 0 0 0 0 Other Expenditures 0 0 0 0 Total 51,330 51,501 51,501 53,005 ============================================ 78
The Purchasing Division strives to provide quality service through effective communication and a cooperative working relationship with all departments and vendors, to fulfill the needs of the City for goods and services in a professional, responsive, timely, and cost effective manner, and in accordance with all legal requirements and ethical standards.
*The freight savings program generated a 62% savings over the cost 2 without the program, or $41,418.09. The program is used for incoming and outgoing freight.
*Generated $115,275.75 in revenue from the sale of surplus property. 2
*Contracted with a new provider for P-card Program services, with a 2 projected rebate increase over the previous provider for the coming year.
*A cost avoidance of 26.6% was realized by using competitive 2 purchasing, e.g. bids, RFP's, quotes.
for
for
not requiring
requiring informal bids.
requiring formal bids.
*Complete final implementation of new P-card Program, training, and 2 online statement reconciliation and entry in accounting system.
*Update P-card limits, strategies, policy, and procedures to increase 2 use of P-cards, reduce the number of low dollar purchase orders and increase P-card rebate.
*Increase bid thresholds to enable staff to focus on higher dollar 2
Purchase Orders Issued 2,145 5,453 2,100 5,500 Price Agreements Maintained 357 307 360 310 Request for Proposals processed and 18 21 18 24 administered No. of Days to issue Purch. Orders .5 .5 .5 .5 for Req.
bids. No. of Days to issue Purch. Order 13.46 14.00 14.75 14.00
Req.
No. of Days to issue Purch. Order 34.26 34.00 35.00 35.00
Percentage of minor purchases
96.6% 97.7% 97.0% 98.0%
vs.
Req.
using
P cards
dept. local checks
79
procurements that require more focused staff involvement.
*Reach out to vendors through training, surveys, etc. to increase 2 competition and participation of vendors.
*Provide ongoing training to staff for Purchasing and P-card policies. 2
*Attain professional certification of all Purchasing staff in fiscal 2 year 2016-2017.
Purchasing Manager 1.00 1.00 1.00 1.00 Clerk II 1.00 1.00 1.00 1.00 Asst Procurement Specialist 1.00 1.00 1.00 1.00 Procurement Specialist 2.00 2.00 2.00 2.00 Total 5.00 5.00 5.00 5.00 ============================================ Personal Services 286,288 285,339 287,795 295,089 Other Services & Charges 4,795 2,125 2,125 3,509 Supplies 386 1,642 1,642 1,642 Capital Outlay 0 0 0 0 Other Expenditures 0 0 0 0 Total 291,469 289,106 291,562 300,240 ============================================ 80
The Business Licensing division is responsible for the processing, issuance, and monitoring of business and liquor licenses, certificates of public convenience and necessity, and other licenses and permits authorized in Chapters 2, 5, and 19 of the City Code. This division also evaluates insurance programs that safeguard the City's financial, human resource, and capital assets by transferring the financial impact of actual or potential losses to a third party.
*Worked with Technology Services to develop workflow for each license 4 and permit for inclusion in the CityWorks Business License System.
*Worked with Technology Services to develop work flow for Rental Ready 4 Program.
*Reviewed Jackson County Property Ownership files to identify 4 potential rental property owners.
*Reviewed list of commercial utility accounts to determine if account is licensed or needs to apply for business license or landlord license.
*Reviewed 4 quarters of Missouri Department of Revenue Sales Tax 4 Payment Accounts reports to verify if each account is licensed, needs a business or is exempt from the City's business license requirements.
*Review and update agreement relating to the Police Tow Rotation List. 4
Number of business licenses issued 8,059 8,224 8,125 8,650 Percentage of new business license 11.68% 12.29% 12.25% 13.00% applications processed Renewed business license account as 88.32% 87.81% 87.75% 87.00% percent of licenses issued Percent of businesses renewing 71.75% 67.35% 71.56% 70.00% their account by due date Business license accounts closed 1,347 1,198 1,400 1,350 New liquor license applications 20 17 18 19 processed Council concurs with staff on 100.00% 100.00% 100.00% 100.00% liquor license recommendation 81
Property & Liability insurance cost 0.60% 0.58% 0.75% 0.65% as a percent of operating budget *Work with Technology Service to implement the CityWorks software as 4 the business license system for the City *Work with Technology Services and Community Development to develop 4 and implement the Rental Ready Program as part of the CityWorks landlord license system. *Prepare update to Chapter 5, Article 1 of the City Code. 4 *Work with Technology Services to implement electronic features in 4 CityWorks to automatically print licenses, renewal forms, delinquent renewal forms and associated form letters. Accounts Specialist .15 .15 .15 .15 Risk & Bus Lic Mgr 1.00 1.00 1.00 1.00 Bus Lic Comp Officer 2.00 2.00 2.00 2.00 Total 3.15 3.15 3.15 3.15 ============================================ Personal Services 237,970 237,751 239,745 246,123 Other Services & Charges 1,333 47,700 47,700 16,729 Supplies 331 1,000 1,000 1,000 Capital Outlay 0 0 0 0 Other Expenditures 0 0 0 0 Total 239,634 286,451 288,445 263,852 ============================================ 82
Human Resources
* (.75) Human Resources Technician Debra Craig Human Resources Director Human Resources Analyst Benefits Administrator Human Resources AssistantUnfunded Position
* Employment/Volunteer Services Administrator
*
83
Human Resources Generalist
2016-17Operating Budget

Human Resources
Appropriations by Type: ExpenditureActualOriginalRevisedAdopted Type2014-152015-162015-162016-17 Personal Ser.438,115 $ 440,705 $ 467,308 $ 482,615 $ Other Services8,829 13,046 13,056 3,252 Supplies3,832 5,693 5,683 5,331 Capital Outlay- - -Other - - -Total 450,776 $ 459,444 $ 486,047 $ 491,198 $ Historical Comparison: ActualActualActualActualBudgetBudget 2011-122012-132013-142014-152015-162016-17 Employees: Full Time Equiv. 6.50 6.50 7.44 6.75 6.75 6.75 Amount by Fund: General Fund 429,515 $ 402,913 $ 429,740 $ 450,776 $ 459,444 $ 491,198 $ Total All Funds429,515 $ 402,913 $ 429,740 $ 450,776 $ 459,444 $ 491,198 $ Comparative Ratios: Per Capita 3.68 $ 3.45 $ 3.67 $ 3.84 $ 3.92 $ 4.19 $ Per Household 8.81 $ 8.53 $ 8.70 $ 8.35 $ 8.42 $ 9.01 $ 98.3% 0.7% 1.1% 2016‐17
Personal Ser. Other Services Supplies 0 150 300 450 600 750 2011-122012-132013-142014-152015-162016-17 $430 $403 $430 $451 $459 $491 Dollars (1,000's) Fiscal Year 84
Budget
The Human Resources Department provides a full range of personnel services including employment, compensation, classification, benefits administration, employee & labor relations, and training & development for 1,062 employees as well as assistance with questions or concerns of 864 retirees. Primary responsibility for ensuring compliance with equal employment opportunity, City Charter, and federal, state and local rules and regulations governing employment. Responsible for classification and compensation plans, establishing and administering personnel policies and procedures, Medicare Part D recovery, authorizing payroll, handling the grievance and appeals process, and coordinating and conducting employee and staff development programs. Serves as in-house advisor to departments on employee issues and provides counsel to employees. Provides technical assistance and monitors performance management program; updates and maintains Human Resources and personnel records; contracts for and monitors performance of employee assistance program. Oversees administration of onsite health clinic. Liaison to the Human Relations Commission, Citizens with Disabilities Advisory Board and Personnel Board.
Full Time Positions 6.00 6.00 6.00 6.00 Part Time Positions 1.44 .75 .75 .75 Total 7.44 6.75 6.75 6.75 ============================================ 4300Human Resources 450,776 459,444 486,047 491,198 Total 450,776 459,444 486,047 491,198 ============================================ 85
*Approximately 42% of City staff are currently at regular retirement age, early retirement age, or eligible for retirement within the next five years. The following departments have 50% or more of their employees eligible for early or regular retirement or early or regular retirement within the next five years: Finance, Fire Administration, Human Resources, Law, Power & Light, Tourism and Water.
*Recruiting of qualified personnel with needed skills for public service.
*Retaining staff needed for core services.
General Fund 450,776 459,444 486,047 491,198 Total 450,776 459,444 486,047 491,198 ============================================
86
The Human Resources Department provides a full range of personnel services including employment, compensation, classification, benefits administration, employee & labor relations, and training & development for 1,062 employees as well as assistance with questions or concerns of 864 retirees. Primary responsibility for ensuring compliance with equal employment opportunity, City Charter, and federal, state and local rules and regulations governing employment. Responsible for classification and compensation plans, establishing and administering personnel policies and procedures, Medicare Part D recovery, authorizing payroll, handling the grievance and appeals process, and coordinating and conducting employee and staff development programs. Serves as in-house advisor to departments on employee issues and provides counsel to employees. Provides technical assistance and monitors performance management program; updates and maintains Human Resources and personnel records; contracts for and monitors performance of employee assistance program. Oversees administration of onsite health clinic. Liaison to the Human Relations Commission, Citizens with Disabilities Advisory Board and Personnel Board.
*Administer HealthStat agreement, overseeing the Stay Well Health & Wellness Center, including paying invoices, ordering supplies, attending weekly meetings with Lockton and bi-weekly meetings with HealthStat to discuss administrative issues.
*Conducted benefits open enrollment October 26 - November 6, 2015.
*Twenty-eight department benefit meetings were held for employees and retirees from September 28 through October 9, 2015 with a power point presentation to compliment open enrollment.
*Coordinated the implementation of the vision plan changes effective January 1, 2016 due to the vision coverage being included as part of the health plan.
*Collected $262,970.98 in Medicare D subsidy payments for 2015. An additional amount of $56,333.81 has not yet been collected for 2015 at Cigna's direction, but is being held to account for the Retiree Drug Subsidy 2% mandatory reduction which may cause overpayment at reconciliation time.
*Completed the 2014 Medicare D subsidy reconciliation process resulting in an additional payment of $16,850.54 from the 2014 plan year.
*Coordinated the HealthStat Health Risk Assessment Event for the employees and retirees in 21 different departments during the week of January 25-30, 2016 and distributed communication regarding the Stay Well Health & Wellness Center to all active employees and pre-Medicare retirees including information regarding the Center, health risk assessment scheduling and open house plans.
*A total of 25 New Employee Orientation classes were held in 2015. A
87
new Welcome video was created for New Employee Orientation.
*Produced the Affordable Healthcare Act benefit reporting forms 1095-C and distributed to all full-time employees by the March 31, 2016 deadline.
*Helped coordinate and participated in the fifth annual Eastern Jackson County Municipal Challenge events which included a trivia contest, bowling, 5K, fishing, darts/billiards, one mile kick-off walk, Mayor basketball shootout challenge, football toss, softball throw, hotshot basketball, table tennis, horseshoes, 3-on-3 basketball, disc golf, sand volleyball, kick ball, dodgeball and flag football.
*Assisted 40 employees with the retirement process during 2015.
*Conducted seven Police Officer testing events and four Fire promotional testing events during 2015.
*Updated the Non-Represented and Represented Pay Plans 13 times during 2015.
*Responded to eight claims for unemployment benefits.
*Assisted in coordination of a successful Heritage Festival with the Human Relations Commission.
*Along with committee members, coordinated the annual Take Your Child to Work Day.
*Participated in multiple networking events including the Independence School District Academy Career Expos, Independence School District Academy Teacher Externship, University of Central Missouri Mock Interviews and the University of Central Missouri Spring Career Fair.
*Coordinated Volunteer Breakfast.
Applications processed 7,105 5,478 7,500 6,000 Tests administered (incl typing) 257 139 350 150 New hires 141 115 175 110 Promotions 79 87 100 100 Retirements 47 36 52 50 Training Hours 1,023 692 1,100 700 Surveys/internal & external 25 42 55 55 Job announcements 184 144 200 150 Exit interviews 18 26 20 25 Number of days to fill a position 70 77 75 75 Number of requests for FMLA leave 166 165 200 200 88
*Approximately 42% of City staff are currently at regular retirement age, early retirement age, or eligible for retirement within the next five years. The following departments have 50% or more of their employees eligible for early or regular retirement, or early or regular retirement within the next five years: Finance, Fire Administration,
Law, Power & Light, Tourism and
*Assist
4 *Serve as liaison between Health Stat and the Stay Well Health Plan 4 for administration of the Stay Well Health & Wellness
Human Resources Dir 1.00 1.00 1.00 1.00 Safety & Training Officer 1.00 .00 .00 .00 Human Resources Analyst 1.00 1.00 1.00 1.00 Benefits Administrator 1.00 1.00 1.00 1.00 Employment/Volunteer Svcs Admn 1.00 1.00 1.00 1.00 Human Resources Assistant 1.00 2.00 2.00 1.00 Human Resources Generalist .00 .00 .00 1.00 Human Resources Tech .75 .75 .75 .75 Human Resources Clerk .69 .00 .00 .00 Total 7.44 6.75 6.75 6.75 ============================================ Personal Services 438,115 440,705 467,308 482,615 Other Services & Charges 8,829 13,046 13,056 3,252 Supplies 3,832 5,693 5,683 5,331 Capital Outlay 0 0 0 0 Other Expenditures 0 0 0 0 Total 450,776 459,444 486,047 491,198 ============================================
with negotiations of union work agreements as needed.
Clinic.
Human Resources,
89
Water.
*Recruiting of qualified personnel with needed skills for public service.
*Retaining staff needed for core services.
90
Community Development
Community Development
& Planning Director
Tom ScannellAdmin. Spec. III
Assistant Department Director
*Admin. Spec. II
Economic Development Manager
Economic Development Projects Coord.
Senior Planner
Current Planning
Comprehensive Planning Senior Planner
*Planner Sr. GIS Tech Planner
*Planner
*Zoning Tech.
*Neighborhood Services (.80) Manager
*Neighborhood Srvs. Coord.
(.88) Com. Dev. Program Spec.
Com. Dev. Program Supvr. (CDBG)
Historic Preservation Manager
*Historic Preservation Spec.
(3) Building Inspector(2) Planning & Zoning Tech
*Dangerous Blg. Spec.
*Building Inspections Manager Plans Examiner
*Plans Examiner
*Planning & Zoning Tech
*Building Inspector
Com.
Dev. Program Coord. (HOME) Com. Dev. Program Spec. (CDBG)
*Unfunded Position 91
2016-17Operating Budget Community Development
2016
17 Budget

Appropriations by Type: ExpenditureActualOriginalRevisedAdopted Type2014-152015-162015-162016-17 Personal Ser.1,477,915 $ 1,656,955 $ 1,687,793 $ 1,439,940 $ Other Services2,895,733 2,168,819 2,320,599 2,298,451 Supplies 18,506 17,302 17,802 14,252 Capital Outlay 152,650 216,686 440,416 246,414 Other - - -Total 4,544,804 $ 4,059,762 $ 4,466,610 $ 3,999,057 $ Historical Comparison: ActualActualActualActualBudgetBudget 2011-122012-132013-142014-152015-162016-17 Employees: Full Time Equiv. 30.30 30.30 30.30 30.30 31.68 31.18 Amount by Fund: General Fund 2,429,773 $ 3,017,887 $ 3,086,604 $ 3,039,100 $ 3,257,399 $ 3,088,434 $ Grants Fund30,741 417,705 319,536 729,733 209,000 209,000 Community Dev Block 485,433 281,500 392,847 619,301 346,865 421,902 HOME Fund197,127 67,740 695,891 156,670 246,498 279,721 Total All Funds3,143,074 $ 3,784,832 $ 4,494,878 $ 4,544,804 $ 4,059,762 $ 3,999,057 $ Comparative Ratios: Per Capita 26.90 $ 32.40 $ 38.35 $ 38.76 $ 34.63 $ 34.11 $ Per Household 64.48 $ 80.13 $ 91.02 $ 84.19 $ 74.43 $ 73.32 $ 36.0% 57.5% 0.4% 6.2%
Personal Ser. Other Services Supplies 0 1,500 3,000 4,500 6,000 7,500 2011-122012-132013-142014-152015-162016-17 $3,143 $3,785 $4,495 $4,545 $4,060 $3,999 Dollars (1,000's) Fiscal Year 92
‐
The purpose of the Community Development Department is to enhance the quality of life in Independence by encouraging public involvement in the planning and creation of quality places in which to live, work and play. Through cooperative efforts of its various divisions, the department strives to support the development of safe, livable and sustainable environments by providing great customer service, a business friendly atmosphere and an open minded and knowledgeable staff.
Full Time Positions 29.80 30.80 30.80 30.30 Part Time Positions .50 .88 .88 .88 Total 30.30 31.68 31.68 31.18 ============================================ 4401Administration 366,463 366,022 369,177 430,016 4411Neighborhood Services 51,469 52,317 52,910 53,336 4412Comprehensive Planning 163,824 347,260 348,536 341,148 4413Current Planning 207,915 221,101 222,972 172,204 4414Transportation 1,549,420 1,548,735 1,548,735 1,595,735 4420Historic Preservation 73,865 75,356 75,989 43,643 4431Building Inspection 626,144 646,608 650,200 452,352 4450Comm Development Grants 729,733 209,000 143,993 209,000 6601CDBG Administration 163,013 151,865 151,865 151,902 6604CDBG Housing 456,288 195,000 406,737 270,000 6608Commercial Facade Program 0 0 75,165 0 6802HOME Administration 9,656 30,812 56,580 34,807 6803Single/Multi Family Housing 147,014 215,686 363,751 244,914 Total 4,544,804 4,059,762 4,466,610 3,999,057 ============================================ 93
General Fund 3,039,100 3,257,399 3,268,519 3,088,434 Grants 729,733 209,000 143,993 209,000 Community Dev Block Grant Fund 619,301 346,865 633,767 421,902 HOME Program Fund 156,670 246,498 420,331 279,721 Total 4,544,804 4,059,762 4,466,610 3,999,057 ============================================ Planning Exams and Licenses 125,066 110,000 110,000 0 Building Permits 793,285 525,000 550,000 0 Planning and Zoning Fees 28,177 15,000 15,000 0 Board of Adjustment Fees 2,610 3,000 3,000 0 Transit Rider Fares 195,671 150,000 155,000 0 CDBG Federal Grant 798,319 759,326 759,326 0 HOME Program Grant 256,435 308,121 308,121 0 Total 2,199,563 1,870,447 1,900,447 0 ============================================ 94
Community Development Administration provides support to the department divisions to ensure that residents and customers receive clear concise information and efficient services.
*Completed state TIF Report in accordance with State Statutes. 4
*Completed amendment of Centerpoint Medical Center TIF. 4
*Assisted Independence EDC with development of Graduate Center for 4 Food Production and Manufacturing.
*Created Commercial Vacant Property data base and contacted individual 3,4 property owners to offer assistance from the City where appropriate.
*Served as liaison between City departments and the Independence 4 business community on various development and business recruitment and location projects.
*Collaborated in the City's What Works Cities initiative. 2
*Served as liaison between City and various business organizations1,3,4 such as Independence Square Association, Truman Gateway, Englewood Business Association and 40 Hwy Business Corridor.
*Continue participation in the City's What Works Cities program. 2
*Facilitate customer requests and applications to Planning Commission,1,3,4 Board of Adjustment, Heritage Commission and other boards and commissions.
*Produce easy to understand informational materials regarding planning1,3,4 procedures, preservation programs, development regulations and building codes.
Community Dev & Planning Dir 1.00 1.00 1.00 1.00 Economic Development Manager .00 1.00 1.00 1.00 Administrative Spec II .50 .50 .00 .00 Administrative Spec III 1.00 1.00 .00 1.00 Economic Developmnt Proj Coord 1.00 1.00 1.00 1.00 Total 3.50 4.50 3.00 4.00 ============================================ 95
Personal Services 343,961 357,472 360,627 421,466 Other Services & Charges 11,307 5,900 5,900 5,900 Supplies 5,559 2,650 2,650 2,650 Capital Outlay 5,636 0 0 0 Other Expenditures 0 0 0 0 Total 366,463 366,022 369,177 430,016 ============================================ 96
The Neighborhood Services Division works to improve the quality of life for Independence residents where they live by supporting initiatives that generate reinvestment in the built and social fabric of our neighborhoods. This Division serves as the primary point of contact for residents and community partners seeking City involvement with housing and neighborhood interests. Neighborhood Services has administrative responsibility for the City's federally funded Community Development Block (CDBG), HOME Investment Partnerships Act (HOME) and Neighborhood Stabilization (NSP) Programs; and provides oversight services for State authorized 353 Redevelopment Corporations (Tax Abatement) Plans, and state and federally funded EPA Brownfields redevelopment initiatives.
*Completed substantial rehabilitation and marketed for homeownership 1 six previously foreclosed/abandoned single family homes located in western Independence neighborhoods through the HOME program.
*Acquired two abandoned properties, for redevelopment as homeownership 1,4 opportunities or neighborhood improvement projects in conjunction with planned targeted neighborhood investment in northwest Independence. Completed the sale of 7 NSP/HOME-assisted affordable homeownership opportunities to low and middle income homebuyers.
*Contracted for, and provided regulatory oversight of, $385,000 in 1,4 affordable housing improvements and development projects located in targeted areas of western Independence, and $113,898 in city-wide public service project contracts.
*Participated in more than 28 public meetings, to increase awareness 1,4 of Neighborhood Services programs including residential tax abatement, home repair and other homeowner and investment tax credit programs; and to identify community needs and conduct funding allocation processes.
*Division staff members increased understanding of regulatory changes 1 by completing HUD internet-based and regional office training to insure the city's compliance with federal rules pertaining to NEPA Environmental Review, Federal Labor Standards, and Fair and Housing Assessment Requirements.
*Completed the 2016-2017 Annual Action Plan funding allocation and1,2,3 citizen participation process.
*Completed the Overton Ave. Redevelopment Area Streetscape Enhancement 4 Project in partnership with 12 Blocks West.
*Completed the sale of seven NSP/HOME-assisted affordable 1,4 homeownership to low and middle income homebuyers.
97
*Create 25 full time equivalent permanent job opportunities for low 4 and moderate income residents of Independence through CDBG funded economic development initiatives.
*Provide skilled job training and job placement services to 15 low 4 income residents of Independence in partnership with a Community Based Development Organization and other CDBG program partners.
*Complete rehabilitation and resell for affordable homeownership 1 opporunities of 6 previously vacant/foreclosed/abandoned single family homes located in Independence neighborhoods through the HOME program.
*In partnership with nonprofit affordable housing providers, acquire 1 four abandoned properties through Land Trust or the Missouri Abandoned Properties Act Program for redevelopment as homeownership opportunities or neighborhood improvement.
*Complete minor home repairs, including weatherization improvements, 1 for at least 30 low income homeowners in partnership with CDBG-funded nonprofit partners.
*Host and/or participate in at least 15 community building and 1,4 neighborhood investment projects, including public outreach events, that support the goals and objectives of the City's 2015-2019 Consolidated Plan related to homeless, housing, and community development needs.
*Strengthen the competency of each Neighborhood Services Division 1,4 staff member to deliver exceptional customer service through the completion of one professional certificate program, three or more continuing education courses, or three or more technical training opportunities.
*Increase efficiency in the administration of CDBG, HOME and tax 1,2 abatement programs by utilizing service contracts to carry out
Tax Abatement Applications in - 170 175 173 Process Tax Abatement Awards Issued - 17 20 20 Five Year inspections satisfied - 38 20 65 Federal Housing Funds Contracted - $243,000 $600,000 $270,000 Federal Community Development Funds - $721,913 $400,000 $870,000 Contracted Percent of Contracted Funds - 100% 100% 100% Expended Private Investment Supported - $410,000 $600,000 $290,000 Underutilized Properties returned - 12 10 10 to use
98
regulatory compliance and technical responsibilities, thereby allowing professional staff to focus on development and delivery of neighborhood programs and services.
*Indentify, complete and promote updates, including employment of 2 social media, to Neighborhood Services' Web media in order to improve customer service, enhance citizen engagement and increase operational efficiencies within the tax abatement, housing and community development programs.
*Continue lobbying activity to ensure the continued funding of CDBG and HOME grants.
Comm Develop Prog Spec .50 .88 .88 .88 Neighborhood Services Coord 1.00 1.00 1.00 1.00 Neighborhood Services Manager .80 .80 .80 .80 Total 2.30 2.68 2.68 2.68 ============================================ Personal Services 51,469 52,317 52,910 53,336 Other Services & Charges 0 0 0 0 Supplies 0 0 0 0 Capital Outlay 0 0 0 0 Other Expenditures 0 0 0 0 Total 51,469 52,317 52,910 53,336 ============================================
99
The Comprehensive Planning Division prepares, maintains and upgrades the Comprehensive Plan to guide future development and redevelopment by articulating the community's vision, values and priorities by creating policies related to land use, transportation, economic development and the sustainability of the community. Essential to this division is the city-wide collaboration and data sharing related to mapping and geographical information to improve information access for citizens and city employees.
*Assisted in implementing Cityworks PLL. 2 *Completed 2016-2022 Capital Improvements Program per City Charter.1,3,4 *Managed and updated geographic information and maps for use by public 2 and city staff. *Worked with consultant on the Truman and Winner Road Commercial Node1,3,4 Planning Sustainable Places project. *Started the Comprehensive Plan update. 1,3,4 *Continued implementation of Cityworks PLL. 2 *Complete the 2017-2023 Capital Improvements Program. 1,3,4 *Provide online access to geographic city data for the public. 2 *Work on implementation of the Truman and Winner Road Commercial Node1,3,4 Planning Sustainable Places Plan. *Complete the Comprehensive Plan update. 1,3,4 Asst Dept Director 1.00 1.00 1.00 1.00 Planner 1.00 1.00 1.00 1.00 Senior Planner 1.00 1.00 1.00 1.00 Sr GIS Technician 1.00 1.00 1.00 1.00 Total 4.00 4.00 4.00 4.00 ============================================ 100
Personal Services 146,776 268,817 270,093 262,070 Other Services & Charges 16,956 77,663 77,663 78,298 Supplies 92 780 780 780 Capital Outlay 0 0 0 0 Other Expenditures 0 0 0 0 Total 163,824 347,260 348,536 341,148 ============================================ 101
The Current Planning Division develops, administers and enforces the Unified Development Ordinance to maintain an attractive, safe and functional built environment by maintaining quality neighborhoods, ensuring that development meets the standards set, and educating and enforcing the UDO. The division strives to ensure that all resources of the community are developed and managed consistently in accordance with city policies to promote the highest quality of life for present and future citizens.
*Assisted WPC with compiling development related data for MS4 Annual 3 Report.
*Focused zoning enforcement along major city corridors to improve 1,3 visual aesthetics.
*Modified staff response to parking in grass complaints to improve 1,3 efficiency.
*Completed one proposed amendment to the Unified Development Ordinance1,3,4 (UDO) to reflect city policies and goal.
*Completed five City initiated rezoning's.1,3,4
*Hosted Planning Commissioner training on sustainability in associated 1,3 with the cities of Blue Springs and Lee's Summit.
*Amend the Unified Development Ordinance (UDO) to reflect city 1,3,4 policies and goals.
*Develop and implement a customer service satisfaction survey on 2,4 development process.
*Develop educational initiatives in enforcement of the UDO for 1,3,4 citizens and businesses.
*Continue zoning enforcement along major city corridors to improve 1,3
Development Related Plans Reviewed 57 57 68 65 Ordinance Text Amendment Cases 2 2 3 2 Board of Adjustment Cases 17 17 20 15 Building and Demolition Permits 347 367 350 360 Reviewed Sign Permits Issued 328 276 300 280 Code Violations Inspections 1643 1660 1900 1600
102
visual aesthetics. *Continue identifying areas for City initiated rezoning's.1,3,4 Planner 2.00 2.00 2.00 2.00 Senior Planner 1.00 1.00 1.00 1.00 Zoning Technician 1.00 1.00 1.00 1.00 Administrative Spec II .50 .50 1.00 1.00 Administrative Spec III .00 .00 1.00 .00 Total 4.50 4.50 6.00 5.00 ============================================ Personal Services 205,405 214,551 216,422 165,654 Other Services & Charges 2,486 5,750 5,750 5,750 Supplies 24 800 800 800 Capital Outlay 0 0 0 0 Other Expenditures 0 0 0 0 Total 207,915 221,101 222,972 172,204 ============================================ 103
The purpose of the Transportation function is to provide a rider-focused transit system that provides access to employment, health, educational and social destinations through a fixed route system and paratransit program. The system evolves to meet the needs of the riders and citizens of Independence as well as changes in the regional public transportation system.
*Coordinated with regional transit operators to charge the same base 3,4 fare for local bus service.
*Completed the 1st Amendment to the First Transit Contract to improve 3 operation efficiencies.
*Coordinated with regional transit operators on transit for 3,4 reciprocity to improve reciprocity regarding fares and fare media between transit operators.
Ridership/Inter-City Routes 147,823 146,339 155,000 150,000 Ridership/Intra-City Routes 248,359 292,824 300,000 285,000 Average Daily Ridership - Intra- 809 953 977 928 City Buses (calendar year) *Monitor the system for cost efficiencies and recommend performance 3 and service changes to the City Council Transit Committee. *Participate in the MARC Regional Transit Coordinating Council to 3 address regional transit issues with IndeBus. Other Services & Charges 1,549,420 1,548,735 1,548,735 1,595,735 Supplies 0 0 0 0 Capital Outlay 0 0 0 0 Other Expenditures 0 0 0 0 104
Total 1,549,420 1,548,735 1,548,735 1,595,735 ============================================ 105
The Historic Preservation Division assists in cultivating diverse and sustainable places by encouraging community-wide preservation of our irreplaceable, historic built and natural environments. The division accomplishes this by conducting proactive preservation planning, fostering a positive public presence through active public engagement, promoting recognition of and reinvestment in traditional building stock, and highlighting the city's unique and distinguished legacy by creating and implementing educational tools and heritage tourism materials.
*Continued and expanded Preservation Month activities (May 2016) 1 including preservation awards, local tours, workshops, and lectures. W.Z. Hickman Preservation Awards are presented at the first City Council meeting in May.
Eight workshops, tours and lectures were held highlighting local heritage and historic preservation.
*Coordinated and hosted an Independence-based field session for the 1 International Association for Preservation Technology conference hosted in Kansas City, Missouri
the restoration
historic
3 *Created "Rediscover Independence" webpages highlighting the benefits 2 of relocation and reinvestment within the city's traditional neighborhoods. *Assisted the Parks, Recreation and Tourism Department during its 1 recent restructuring and transition. *Developed online flowcharts showing the Certificate of 2 Appropriateness and historic designation processes. *Fostered partnerships with other city boards and commissions 1 resulting in improved communication and citizen participation. *Participated as a member of the Mid-America Regional Council Active 1 Transportation Programming Committee. *Developed and participated in cross-training with the Independence 1 Heritage Commission and the Liberty Historic District Review Commission. *Updated the historic preservation web site. 2 *Created a smartphone application highlighting historic properties 2 throughout Independence using oral history-style video accounts. *Maintained social media contacts including the City's website, 2 Facebook and Twitter and held year-round public outreach/educational sessions. 106
*Managed
efforts at all city-owned
sites.
Heritage Commission Cases/Reviews 10 14 16 12 Demolition Permits 59 46 56 45 Dangerous Buildings 47 42 59 40 Locally Designated Historic 0 0 1 1 Properties
historic buildings. *Oversee restoration projects at all city-owned sites. 3 *Actively
the synergy between preservation and sustainability 1
*Coordinate
of
city-owned 3 historic site. *Continue to
more public functions in
to better and more 1 actively
the
*Assist with the renewal process of historic site lease agreements. 3 *Build upon and expand annual Preservation Month activities. 1 *Encourage year-round preservation training for staff and Heritage 1 Commissioners and partner with area communities to diffuse costs. *Seek funding sources to bring workshops and guest speakers to educate 1 historic property owners on best practices. *Update Chapter 11 of the City's Comprehensive Plan and submit to the 3 State Historic Preservation Office for comments. *Introduce and encourage sustainability practices for the city's 1 cultural landscapes in all associated planning documents. *Continue to seek out viable funding sources for community-wide 1 historic preservation efforts. Historic Pres Specialist 1.00 1.00 1.00 1.00 107
*Continue to promote cross-training with regional governments and 1 organizations. *Assist and educate historic property owners about the benefits of 1 owning
promote
in all public outreach efforts. *Continue to foster a progressively greater public presence creating 1,2 positive support and interest in preservation efforts throughout the community utilizing outreach tools such as social events and social media.
the assessment
improvements needed at each
attend
order
engage
public.
Historic Pres Manager .00 .00 .00 .00 Historic Pres Manager 1.00 1.00 1.00 .50 Total 2.00 2.00 2.00 1.50 ============================================ Personal Services 68,717 69,056 69,689 38,033 Other Services & Charges 3,935 6,050 6,050 5,360 Supplies 1,213 250 250 250 Capital Outlay 0 0 0 0 Other Expenditures 0 0 0 0 Total 73,865 75,356 75,989 43,643 ============================================ 108
The Building Inspection Division enhances the quality of life in Independence by ensuring that buildings, structures and properties are constructed, utilized and maintained in a manner that reduces the risk to public health, safety, welfare and trust relating to all aspects of the built environment within the City of Independence. The division accomplishes this role through the administration and enforcement of the adopted building codes, ordinances and construction standards.
*Continued to promote Pre-Review and Pre-Construction meetings to 3,4 provide better customer service and a greater understanding of the permitting process.
*Communicated with the public monthly and weekly building permit 2,4 activity reports.
*Collaborated with Planning, Engineering, Fire, Health, Water and1,3,4 developers to ensure permit processing in a timely fashion.
*Administered the Contractor Licensing program, issuing 1007 renewals 3,4 and 238 new licenses.
*Assisted citizens with their construction projects and building code 3,4 questions.
*Assist in the implementation of the CityWorks PLL. 2,4
*Facilitate cross-training between disciplines to increase consistency 2,3 and knowledge base amongst staff for all functions provided by the division.
*Communicate and assist applicants in navigating the development 1,3,4 process from pre-application to occupancy.
*Administer the Contractor Licensing program to ensure that 3,4 contractors are properly licensed to perform work within the community.
No. of Building Inspections 5,888 6,389 7,150 6,100 Number of Bldg. Permits Issued 3,018 3,322 3,600 3,300 Question Survey to Builders on 200 210 200 200 Service
109
Plans Examiner 2.00 2.00 2.00 2.00 Permits and Zoning Technician 3.00 3.00 3.00 3.00 Building Inspector 4.00 4.00 4.00 4.00 Dangerous Building Specialist 1.00 1.00 1.00 1.00 Building Inspections Mgr 1.00 1.00 1.00 1.00 Total 11.00 11.00 11.00 11.00 ============================================ Personal Services 497,031 528,075 531,667 334,868 Other Services & Charges 117,830 107,211 107,211 109,712 Supplies 11,283 11,322 11,322 7,772 Capital Outlay 0 0 0 0 Other Expenditures 0 0 0 0 Total 626,144 646,608 650,200 452,352 ============================================ 110
Grant portion of the Transportation function. These are the funds received for appropriations of the transit system.
Other Services & Charges 729,733 209,000 143,993 209,000 Supplies 0 0 0 0 Capital Outlay 0 0 0 0 Other Expenditures 0 0 0 0 Total 729,733 209,000 143,993 209,000 ============================================ 111
The purpose of the Community Development Block Grant (CDBG) Program is to improve the quality of life of very low, low and moderate income residents living in Independence by providing for the availability, the affordability and the sustainability of suitable living environments, decent housing and economic opportunities. In administering CDBG funding awarded by the U.S. Department of Housing and Urban Development the City works directly with the citizen body to identify and address unmet community needs in the areas of housing, public services, public facility improvements, and economic development. The CDBG program is under the management of the Neighborhood Services Division.
Comm Develop Prog Spec 1.00 1.00 1.00 1.00 Community Dev Programs Supvr 1.00 1.00 1.00 1.00 Total 2.00 2.00 2.00 2.00 ============================================ Personal Services 164,556 135,855 135,855 135,756 Other Services 1,878- 13,510 13,510 13,646 Supplies 335 1,500 1,500 1,500 Capital Outlay 0 1,000 1,000 1,000 Other 0 0 0 0 Total 163,013 151,865 151,865 151,902 ============================================ 112
The purpose of this cost center is to track appropriations of the U.S. Department of Housing and Urban Development Community Development Block Grant (CDBG) funding for housing related programs and projects when directed by the City's Consolidated Plan. Funded activities may include emergency home repair, owner-occupied housing rehabilitation programs, blight removal in residential areas, and neighborhood code compliance initiatives.
Other Services 456,288 195,000 406,737 270,000 Supplies 0 0 0 0 Capital Outlay 0 0 0 0 Other 0 0 0 0 Total 456,288 195,000 406,737 270,000 ============================================ 113
The purpose of this cost center is to track appropriations of the U.S. Department of Housing and Urban Development Community Development Block Grant (CDBG) funding for Commercial Facade Improvements Program (CFIP) when directed by the City's Consolidated Plan. The CFIP provides dollar-for-dollar matching grants for exterior rehabilitation of commercial and mixed-use structures located within targeted redevelopment areas of the City.
Other Services 0 0 0 0 Supplies 0 0 0 0 Capital Outlay 0 0 75,165 0 Other 0 0 0 0 Total 0 0 75,165 0 ============================================ 114
The purpose of the HOME Investment Partnerships Program is to improve quality of life in Independence by addressing the unmet housing needs of very low, low and moderate income persons. In administering HOME funding awarded by the U.S. Department of Housing and Urban Development the City works directly with nonprofit and for-profit partners to increase the availability, the affordability and the sustainability of suitable and decent permanent housing options through the creation and implementation of affordable housing development programs. The HOME Program is under the management of the Neighborhood Services Division.
Comm. Development Prog. Coord. 1.00 1.00 1.00 1.00 Total 1.00 1.00 1.00 1.00 ============================================ Personal Services 0 30,812 50,530 28,757 Other Services 9,656 0 5,050 5,050 Supplies 0 0 500 500 Capital Outlay 0 0 500 500 Other 0 0 0 0 Total 9,656 30,812 56,580 34,807 ============================================ 115
The purpose of this cost center is to track appropriations of U.S. Department of Housing and Urban Development HOME Investment Partnerships Act (HOME) Program funds for eligible single family and multi-family affordable housing development projects when directed by the City's Consolidated Plan. Eligible housing development activities may include single family infill construction for homebuyers or rental, single family substantial rehabilitation for homeowners/buyers or rental, multi-family construction and multi-family renovation.
Other Services 0 0 0 0 Capital Outlay 147,014 215,686 363,751 244,914 Total 147,014 215,686 363,751 244,914 ============================================ 116
Police
Brad Halsey Chief of Police Admin. Specialist III Deputy Chief Field Operations Bureau Deputy ChiefPolice continued 117
Operations Support Bureau
Deputy Chief Operations Support Bureau Administrator Fiscal Management * Police Major Exec. Ofc. Major Support Services Major Administrative Services Detention Supervisor Detention Administrator Detention A Shift (2) Detention officer B Shift (3) Detention officer Detention Supervisor C Shift (2) Detention officer D Shift (3) Detention officer Records Administrator Records A Shift Supervisor B Shift (3) Records Clerks B Shift (4) Desk Clerks (2) Records Tech. (.63) PT Records Clerk Supervisor (3) Records Clerks (4) Desk Clerks C Shift (3) Records Clerks Communications Administrator Emergency Communications Supervisor Telecommunicator II (7) Telecommunicator I (2) Telecommunicator A Shift Emergency Communications Supervisor Telecommunicator II (7) Telecommunicator I (2) Telecommunicator C Shift Emergency Communications Supervisor Telecommunicator II (6) Telecommunicator I Proxy Shift Telecommunicator I Sergeant Training Unit Electronic Fleet Technician Technology Police Technology Coord. Captain Internal Affairs * Police Officer (2) Community Services officer Public Information Officer Grant Project Coord. Volunteers in Police Service Fiscal Tech. II Police Professional Standards Assistant (.63) Inventory Tech * (2) Telecommunicator * Unfunded Position
118
Police continued
Deputy Chief Field Operations Bureau Crime Analyst Lead (2) Crime Analyst II Captain Tactical Operations Captain Special Enforcement Major Special Operations Major Patrol A Watch Captain (2) Sergeant (18) Police officer B Watch Captain (2) Sergeant (18) Police officer C Watch Captain (2) Sergeant (20) Police officer D Watch Captain (2) Sergeant (20) Police officer Admin. Specialist II Police Chaplain Program * Sergeant * Police Officer (2) Hawthorne Police officer Sergeant Special Response Team (6) Police officer (6) Police Officer Canine Unit (4)Police officer Sergeant (2) Indep. Center Police officer (6) Police officer Sergeant Admn. Specialist II School Resource Officer (SRO) (7) SRO Police officer Sergeant (2) SRTO Police officer (Truancy) (2) DARE Police officer Selective Enforcement Unit (SEU) Parking Enforcement Officer Accident Investigation Unit (AIU) (9) Police officer Sergeant Reserve Program * DARE Sergeant Captain North Area of Command Captain South Area of Command Major Criminal Investigations Jackson Co. Drug Task Force Sergeant (3) Police Officer (8) Police officer Drug Enforcement Sergeant (2) DEA Task Force Police officer Crimes Against Persons Sergeant (5) Police officer Property Crimes Sergeant (6) Police Officer Admn. Specialist II Crimes Against Persons Sergeant (5) Police officer FBI Task Force Police Officer HARCFL Police Officer Property Crimes Sergeant Property/ Evidence Clerk Career Criminal Unit Sergeant (4) Police Officer (5) Crime Scene Investigator ATF Task Force Police Officer Latent Print Examiner * (2) Criminalist * (.4) Latent Print Examiner *(.25) Property/ Evidence Clerk * Admn. Specialist II * DARE Police officer * (2) Police officer * Unfunded Position
119
Police continued
2016-17Operating Budget Police

Appropriations by Type: ExpenditureActualOriginalRevisedAdopted Type2014-152015-162015-162016-17 Personal Ser. 25,095,046 $ 24,944,270 $ 24,987,066 $ 25,148,958 $ Other Services 1,756,503 1,785,179 1,785,629 1,762,051 Supplies 903,358 1,066,220 1,074,269 861,759 Capital Outlay 1,279,977 1,288,675 1,337,238 1,611,000 Other 38,273 38,274 38,274 38,273 Total 29,073,157 $ 29,122,618 $ 29,222,476 $ 29,422,041 $ Historical Comparison: ActualActualActualActualBudgetBudget 2011-122012-132013-142014-152015-162016-17 Employees: Full Time Equiv. 288.65 289.91 291.91 296.91 296.91 295.91 Amount by Fund: General Fund 25,126,483 $ 25,839,421 $ 26,407,530 $ 27,329,756 $ 27,034,885 $ 27,066,600 $ Police Public Safety 1,412,354 1,588,295 2,417,666 1,743,401 2,087,733 2,355,441 Total All Funds26,538,837 $ 27,427,716 $ 28,825,196 $ 29,073,157 $ 29,122,618 $ 29,422,041 $ Comparative Ratios: Per Capita 227.16 $ 234.77 $ 245.92 $ 247.92 $ 248.40 $ 250.96 $ Per Household 544.48 $ 580.67 $ 583.71 $ 538.57 $ 533.95 $ 539.44 $ 85.5% 6.0% 2.9% 5.5% 0.1% 2016‐17
Personal Ser. Other Services Supplies Capital Outlay 0 10,000 20,000 30,000 40,000 50,000 2011-122012-132013-142014-152015-162016-17 $26,539 $27,428 $28,825 $29,073 $29,123 $29,422 Dollars (1,000's) Fiscal Year 120
Budget
The Police Department is responsible for providing a wide variety of community oriented services; including the preservation of peace and order, enforcement of the law and ordinances, prevention and suppression of crime, detection and apprehension of violators of all laws and ordinances, incarceration of those sentenced to detention for municipal ordinance convictions or those awaiting formal charges from the state or federal level, and to perform other duties relating to public peace, order, and safety.
Full Time Positions 290.63 295.00 295.00 294.00 Part Time Positions 1.28 1.91 1.91 1.91 Total 291.91 296.91 296.91 295.91 ============================================ 4511Chief of Police 1,812,383 1,653,704 1,667,300 1,698,657 4512Police Grant Expenditures 240,773 225,597 225,597 205,512 4513Training and Equipment 1,106,929 1,468,199 1,468,357 1,312,367 4514Police Forfeiture Expenditures 351,027 0 42,662 0 4532Patrol 8,314,254 7,860,021 7,880,485 7,995,638 4534Investigations 4,726,357 5,139,827 5,143,643 5,352,185 4535Tactical Operations 2,059,130 1,726,333 1,725,983 1,851,710 4536Special Enforcement 2,781,848 2,770,760 2,772,696 2,776,955 4538Drug Abuse Resistance Educ. 196,475 212,062 212,062 216,306 4542Crime Scene 752,575 848,823 849,688 563,094 4543Detention 1,581,016 1,559,636 1,560,385 1,534,058 4544Records 1,305,990 1,299,648 1,301,250 1,321,933 4545Communications 2,100,999 2,270,275 2,284,635 2,238,185 4562Communications (Sales Tax) 299,995 351,944 351,944 313,819 4563Facilities (Sales Tax) 276,296 569,000 569,000 569,500 4564Equipment (Sales Tax) 1,167,110 1,166,789 1,166,789 1,472,122 Total 29,073,157 29,122,618 29,222,476 29,422,041 ============================================ 121
General Fund 27,329,756 27,034,885 27,134,743 27,066,600 Police Public Safety Sales Tax 1,743,401 2,087,733 2,087,733 2,355,441 Total 29,073,157 29,122,618 29,222,476 29,422,041 ============================================ Jackson County Drug Task Force 528,407 556,867 391,964 0 Jackson County DARE Program 215,000 218,772 226,382 0 Police Services Reimbursement 21,720 15,500 19,900 0 Sale of Police Reports 32,632 30,000 32,000 0 School Resource Officers 440,422 477,385 467,664 0 Alarm Charges 23,501 40,000 32,000 0 Total 1,261,682 1,338,524 1,169,910 0 ============================================ 122
The Office of the Chief of Police is responsible for the overall administrative control of the operations and leadership of the department. Personnel assigned to this cost center develop and administer policies, procedures, priorities, mission and other key management of the Police Department. This includes budget processes, fleet management, all inventory control, technology management, internal affairs, public information, training, and the recruitment, selection and hiring of new personnel.
*The New World Mobile reporting system was implemented 3 department-wide so that police reports are completed consistently throughout the department.
*Department-wide New World training was conducted by New World 3 personnel. The training consisted of mobile reporting, property, corrections and records modules.
*The license plate reader vehicle and equipment were received and 3 arrangements were made with factory representatives for implementation. It is anticipated that the license plate reader program will be operational during FY 2016/17.
*Assessment study was completed with an architectural firm for the 3 police headquarters building and other police department properties.
(discontinued Oct. 2014)
*Complete the renovation of the police department indoor firing range. 3
*Implement the StarChase pursuit management technology in two police 3 vehicles. The StarChase system is a less-lethal technology that provides a significant tactical advantage to law enforcement officers in failure-to-yield or high-risk flight situations. Once a vehicle is tagged it enables a dispatcher to track the suspect in real time
Police Officer Applicants 259 202 300 200 Police Officers Hired 22 13 10 6 Civilian Applicants 245 236 350 200 Number of Block Watch Meetings 72 74 85 85 Number of Volunteer Hours 4,282 3,568 4,500 3,600 Number of Parolee Compliance Checks 920 327 0 0
123
using a web-based mapping program. The officer remains on the street, a potentially dangerous pursuit is avoided, and the offender can then be safely apprehended.
Police Chief 1.00 1.00 1.00 1.00 Police Major 2.00 2.00 2.00 2.00 Police Major Executive Officer 1.00 1.00 1.00 1.00 Deputy Chief of Police 2.00 2.00 2.00 2.00 Police Captain 1.00 1.00 1.00 1.00 Fiscal Administrator 1.00 1.00 1.00 1.00 Police Professional Std Assist .00 .00 1.00 1.00 Police Technology Coordinator 1.00 1.00 1.00 1.00 Master Police Officer 1.00 .00 .00 .00 Police Officer 1.00 1.00 1.00 1.00 Police Sergeant 1.00 .00 .00 .00 Crime Analyst Lead .00 1.00 1.00 1.00 Crime Analyst I 1.00 .00 1.00 .00 Crime Analyst I .00 1.00 .00 1.00 Police Grant Project Coord 1.00 1.00 1.00 1.00 Administrative Spec II 1.00 1.00 .00 .00 Administrative Spec III 1.00 1.00 1.00 1.00 Fiscal Technician II 1.00 1.00 1.00 1.00 Inventory Technician .63 .63 .63 .63 Electronics Fleet Technician .00 1.00 1.00 1.00 Total 17.63 17.63 17.63 17.63 ============================================ Personal Services 1,678,588 1,549,165 1,562,761 1,592,274 Other Services & Charges 63,559 85,809 85,809 77,634 Supplies 5,828 6,230 6,230 5,749 Capital Outlay 64,408 12,500 12,500 23,000 Other Expenditures 0 0 0 0 Total 1,812,383 1,653,704 1,667,300 1,698,657 ============================================
*The renovation of the existing police department firing range is a significant issue. The existing range was constructed in 1973 and has undergone several repairs since then. The system is antiquated and has proven to be a safety hazard during this current FY, when an officer was injured from a ricochet. An assessment of the range by a range consultant was performed in 2014 and a stop gap method was implemented at that time. However, the consultant advised that the risk of injury from ricochet may become an issue if a permanent solution for the existing backstop was not sought within a two year time period.
125
Police Department grants are recorded in the Grant Fund under a department description of Police Grants (cost center 4550). Some Police Department grants do not cover the full cost of direct program costs either due to local match requirements or to limitations in the availability of grant funds. This cost center represents the funding gap between the actual cost of the grant programs and the portion of the funding that is available from the granting agency.
Personal Services 240,773 225,597 225,597 205,512 Other Services & Charges 0 0 0 0 Supplies 0 0 0 0 Capital Outlay 0 0 0 0 Other Expenditures 0 0 0 0 Total 240,773 225,597 225,597 205,512 ============================================ 126
This unit coordinates all department training, including mandated Police Officers Standards and Training (P.O.S.T.) certification, federal, state, and city requirements; and coordinates the review and approval of all external training activities. The unit coordinates the department's upkeep of the General Order Standards, as well as manages and supervises the FTO (Field Training Officer) program in the department. A component of the Community Services Unit has been moved to the Administrative Services Division. Two crime prevention / community policing officers are now assigned to the Training Unit of this division, along with a Training Sergeant and Public Information Officer.
*Five new Field Training Officers were added to the training program. 3 Several FTO's attended the one week Kaminsky course which will be the standardized program the police department utilizes. This will provide for more consistency as the Field Training Officers are training new officers.
*The department training records were converted into an electronic
format. This will provide more efficiency for both officers and supervisors to check individual and subordinate training files and records.
*A standardized department-wide in-service schedule was once again
instituted to provide officers with critical training needs as part of their continuing education credits. *The Below One Hundred program was implemented department-wide.
Assistant attended the Missouri Police Chief's State Accreditation training. The process for state accreditation was implemented. *A new training/meeting room as well as a computer lab were
completed in the old records unit. The department has utilized the training room for in-service training and has hosted several training events in which outside agencies have attended. The computer lab was utilized to complete the department-wide New World computer training.
3
3
3
to
and
3
3
In-service Training Hours 6,059 6,720 6,100 6,800 127
This is a program designed to provide awareness to factors that contribute
duty related injuries and fatalities such as seat belt use
driving speed. *The Professional Standards Commander and Professional Standards
*Implement a program to monitor officers' training progress as the 3 department moves towards the POST mandated annual training requirements beginning in 2017. *Develop a standardized firearms instructor program. 3
a recruiting video to utilize for recruiting sessions. 3
an annual field reporting training session into the annual 3 in-service training cycle.
*Transitioning to the new POST training requirements in 2017 will be a significant item due to the fact that officers will be required to accumulate annual training hours as compared to previously having a three year cycle to complete the required training.
Supervisory Training Hours 33 35 100 100
*Implement
Master Police Officer .00 2.00 2.00 1.00 Police Officer .00 1.00 1.00 2.00 Police Sergeant .00 1.00 1.00 1.00 Total .00 4.00 4.00 4.00 ============================================ Personal Services 179,385 316,814 316,814 316,774 Other Services & Charges 427,474 453,330 453,446 494,783 Supplies 500,070 698,055 698,097 500,810 Capital Outlay 0 0 0 0 Other Expenditures 0 0 0 0 Total 1,106,929 1,468,199 1,468,357 1,312,367 ============================================
*Develop
128
*The completed renovation of the firing range will be significant, as it will allow for regular firearms training to occur on-site rather than having officers commute to Lee's Summit to complete training.
129
This cost center serves to provide oversight and management of funds that have been seized or includes net proceeds from the sale of seized assets that were used in the commission of a crime.
Periodically, a federal judge will award part of the seized assets back to the law enforcement agencies that participated in the apprehension and investigation of the criminal activity.
Other Services & Charges 65,910 0 0 0 Supplies 103,814 0 0 0 Capital Outlay 181,303 0 42,662 0 Other Expenditures 0 0 0 0 Total 351,027 0 42,662 0 ============================================ 130
This division is the initial responder for all calls from citizens, and operates 24-hours a day, 365-days per year. The allocation of officers throughout the City in this division is contingent upon workloads and geographical coverage. The patrol division continuously balances the need to respond to calls for service with the need to conduct proactive patrol tactics in an effort to reduce crime and disorder.
*The police department has advanced the CORE initiative by focusing 3 attention on known criminal offenders. The CORE process uses information from the Intelligence Unit to identify individuals in recent crimes. Officers work with the Detention Unit, Prosecutors and Judges to improve law enforcement's response to known offenders for the purpose of reducing crime and disorder.
*Patrol watches have consistently provided shift-level training to 3 train and educate officers. One of the greatest enhancements was the addition of tactical medic kits. Officers received training to apply tourniquets and use other lifesaving equipment. The tourniquets have saved one life so far when a citizen was hit by a train.
*Reduce crime and disorder through intelligence-led policing, 3 target-oriented strategies and advanced communication.
*Use CORE (Crime Overview Response and Evaluation) as a conduit to 3 funnel information to the appropriate division, unit and officer. Officers will be prompted to take ownership of known problems in the community.
*Enhance officers' knowledge, skills and abilities through department 3 and shift-level training.
*Develop a greater understanding and response to emotionally disturbed 3 people.
Officers Crisis Intervention Team 3 5 5 5 (C.I.T.) Certified Chaplain Training Hours 21.5 76 32 40 Chaplain Call-Outs 16 27 20 20 Chaplain Civilian Contacts 940 736 1,000 900
131
Police Major 1.00 1.00 1.00 1.00 Police Captain 4.00 4.00 4.00 4.00 Master Police Officer 35.00 33.00 34.00 36.00 Police Officer 39.00 44.00 43.00 40.00 Police Sergeant 8.00 8.00 8.00 8.00 Administrative Spec II 1.00 1.00 1.00 1.00 Total 88.00 91.00 91.00 90.00 ============================================ Personal Services 8,307,851 7,849,871 7,855,935 7,985,488 Other Services & Charges 771 650 650 650 Supplies 5,632 9,500 17,999 9,500 Capital Outlay 0 0 5,901 0 Other Expenditures 0 0 0 0 Total 8,314,254 7,860,021 7,880,485 7,995,638 ============================================ 132
The Investigations Division is made up of the Criminal Investigations Unit, Drug Enforcement Unit and Career Criminal Unit. The Division focuses on investigations stemming from homicides, sex offenses, burglaries, robberies, cyber crimes, frauds/forgeries, auto thefts, arsons and narcotic violations. Several detectives are assigned to task forces, including the ATF Task Force, DEA Task Force, Jackson County Drug Task Force, FBI Cyber Crimes Task Force, and the FBI Regional Computer Forensics Lab Task Force.
*The Criminal Investigations Unit set up and began conducting video 3 arraignments with the Jackson County Courts. The video link saves detectives and judges time in the courtroom as well as the time necessary to load and transport suspects to the court for traditional arraignments.
*The Criminal Investigations Unit began obtaining search warrants of 3 all types electronically, as well as communicating and transmitting the necessary paperwork electronically to Prosecutors and Judges.
*The Criminal Investigations Unit reorganized the structure of the 3 unit and the way cases are assigned and distributed to the detectives within geographic areas and by types of crimes. This new structure enables supervisors to better assign cases and recognize crime trends to which they are assigned.
*The Drug Enforcement Unit continued to effectively address drug 3 complaints and target CORE offenders. Detectives are working cooperatively with prosecutors and judges towards effective strategies for repeat drug offenders.
*The Career Criminal Unit continued its cooperative relationship 3 between the department and the United States Marshal Service. The unit saw dramatic increases in statistical categories as they effectively participated in the apprehension of numerous homicide suspects, serial armed robbery suspects, home invasion, and aggravated assault suspects. Many of the suspects located and arrested by CCU were federally indicted resulting in substantial sentencing.
Criminal Cases Assigned 2,235 2,480 2,300 2,550 133
Drug Arrests 1,720 1,564 1,650 1,600 Drug Cases Assigned 588 605 600 620 DEU Search Warrants 48 41 55 50 *The Criminal Investigations Unit will continue work with the Jackson 3 County Prosecutor's Office to streamline and improve the video arraignment system from Police Headquarters. *The Criminal Investigations Unit will continue to improve and expand 3 the system for search warrant procurement and execution. *The Drug Enforcement Unit will continue to develop cooperative 3 investigative strategies with the Criminal Investigations Unit to target CORE offenders. *The Drug Enforcement Unit will implement the use of "TruNarc." This 3 equipment can test certain drugs with nearly instantaneous results and will greatly reduce the time between arrest and cases being filed by the Prosecutor's office. *The Career Criminal Unit will continue to work closely with their 3 partnered local and federal agencies to target career and high risk offenders that live or operate within the City of Independence. *The Career Criminal Unit will develop and implement investigative 3 strategies to target Independence chronic CORE offenders. Police Major 1.00 1.00 1.00 1.00 Police Captain 3.00 2.00 2.00 2.00 Property Control Technician 1.25 1.25 1.25 1.25 Master Police Officer 26.00 32.00 31.00 31.00 Police Officer 11.00 6.00 7.00 8.00 Police Sergeant 7.00 7.00 7.00 7.00 Administrative Spec II 2.00 2.00 2.00 2.00 Total 51.25 51.25 51.25 52.25 ============================================ 134
*The Criminal Investigations Unit has been operating without two detective positions due to retirements. Also, the Investigations Unit is short one Sergeant due to another extended military deployment. This Sergeant should be returning sometime within the 2016-17 fiscal year.
*The Drug Enforcement Unit has had to develop new procedures for lab analysis due to the loss of our local lab. New technological advances for testing narcotics, called "TruNarc" has been identified and vetted through the Prosecutor's office. Funding sources are being sought to purchase this new technology, which will expedite the analysis process and lessen the time between apprehension and prosecution.
Personal Services 4,715,294 5,113,127 5,116,939 5,325,485 Other Services & Charges 3,983 16,700 16,704 16,700 Supplies 7,080 10,000 10,000 10,000 Capital Outlay 0 0 0 0 Other Expenditures 0 0 0 0 Total 4,726,357 5,139,827 5,143,643 5,352,185 ============================================
135
The Tactical Operations Division is comprised of four units. The units are Community Services, Canine, Special Weapons and Tactics Team (SWAT), and the Explosive Ordnance Disposal (EOD) Team. This division provides support, coordination, and proactive patrol and enforcement in high-crime and/or violation areas. Officers assigned to this division receive specialized training, which depends on the assigned duties and unit. An explanation of each unit is necessary to understand the scope of responsibilities within this division.
1) The Community Services Unit partners with divisions throughout the department, city, and outside agencies in collaboration to avert and combat crime and abate quality of life issues. 2) The Canine Unit primarily assists the Patrol Division and provides specialized assistance with building, field and narcotic searches. 3) The Special Weapons and Tactics Team focuses on high-crime areas; as well as, assisting other divisions in resolution of difficult police situations outside the standard patrol response using critically developed skills, tactics, and specialized equipment. 4) The Explosive Ordnance Disposal Unit responds to suspicious or confirming packages and devices that could potentially be hazardous. The SWAT and EOD units both received regional designation as participants of the Kansas City Metro Disaster Tactical Response Team. This is an added responsibility of Homeland Security for Weapons of Mass Destruction incidences in Kansas and Missouri. All of these components collaborate to create a safer environment and a better quality of life for the residents and visitors of the city.
*In cooperation with the Independence School District, the K9 Unit
3 conducted two different searches of classrooms during this school year. Class rooms in all high schools and middle schools were searched.
*The Jackson County Drug Task Force and the Independence Police 3 Department coordinated a sweep of the Budget Inn and Sports Stadium Inn motels on August 28, 2015. SWAT, Investigations, K9, JCDTF, Patrol, Health Department, Codes Enforcement, DART and Sugar Creek Police Department all participated in the sweep. Two narcotics search warrants were served by SWAT on two rooms in the motels and then knock-and-talks were conducted on all other rooms. Numerous arrests were made from both motels. The Budget Inn was shut down for a few days after the event due to code violations.
*SWAT and Patrol dedicated substantial directed patrol efforts at 3 numerous local hotels in efforts to prevent crime during the Royals World Series games. No significant issues arose during this time. The department continues to look at crime trends at hotels and will continue to focus efforts on identified issues.
*The K9 Unit acquired two new police canines to replace two aging 3 canines.
136
*Conducted Field Force training for entire police department to 3 improve response to civil disorder incidents. Worked on a regional civil disorder response plan to standardize response plans in the MARC region.
*Conducted Active Shooter training for the Fire Department and Police 3 Department. Worked on a regional active shooter response plan to standardize response plans in the MARC region.
*SWAT will conduct Active Shooter training for the entire Police 3 Department to improve response to active shooter incidents. SWAT will coordinate/conduct active shooter training with the Independence Center staff to include conducting an active shooter exercise.
*The Independence School District has requested the Canine Unit to 3 conduct classroom article searches at least twice a school year. The goal will be to coordinate with the School District to outline a procedure for safely searching classrooms after the students have been escorted to another classroom. The searches will be of students' backpacks, coats, and other items left in the classroom by the students.
Canine Public Demonstrations 11 11 15 12
Police Major 1.00 1.00 1.00 1.00 Police Captain 1.00 1.00 1.00 1.00 Master Police Officer 11.00 10.00 10.00 10.00 Police Officer 4.00 3.00 3.00 3.00 Police Sergeant 3.00 3.00 3.00 3.00 Total 20.00 18.00 18.00 18.00 ============================================ 137
*Two of the three Explosive Ordnance Disposal Unit Technicians resigned. New technicians have been selected and the very lengthy certification process will be ongoing during the 2016-17 fiscal year.
Personal Services 1,996,898 1,683,148 1,683,148 1,808,525 Other Services & Charges 27,448 17,510 17,510 17,510 Supplies 23,784 25,675 25,325 25,675 Capital Outlay 11,000 0 0 0 Other Expenditures 0 0 0 0 Total 2,059,130 1,726,333 1,725,983 1,851,710 ============================================
138
The Special Enforcement Division provides a variety of services to the City and is comprised of three units. The units are School Resource Officers (SRO), Selective Enforcement (SEU), and Accident Investigation (AIU). An explanation of each unit is necessary to understand the scope of responsibilities within this division. 1) The SRO Unit partners with the local school districts with the utilization of the School Resources Officers and addressing truancy issues. 2) The SEU focuses on response to traffic complaints and enforcing traffic laws. 3) The AIU focuses primarily on radar/laser operations, accident reconstruction, photography, and D.W.I. enforcement. In addition, the SEU and AIU help support special events such as, Santa-Cali-Gon and the Halloween Parade. All of the above-styled components and more, collaborate to create and build a safer environment, and a better quality of life for the residents and visitors of the City.
*The Special Enforcement Unit's speed enforcement trailer was replaced 3 this year due to the other one being inoperable.
*The Special Enforcement Unit began utilizing AMR for blood draws and 3 Children's Mercy Hospital for analysis. This new model afforded the Unit the opportunity to expedite the blood draw process and resulted in more total DWI's and a more efficient and timely prosecution with these cases.
*The accident rate in the area from 35th Street to 42nd Street on 3 Noland Road was successfully reduced to the point where it no longer was listed in the top 6 accident locations. The area was not declared an Accident Reduction Zone, but targeted enforcement activities helped in reducing the number of accidents.
*On September 23, 2015, officers assigned to the Special Operations
3 Division, with the assistance of City of Independence Public Works, completed a massive clean-up project at the Special Operations building located at 14609 E. Truman Road. The project consisted of cleaning the parking lot of trash and debris, removing weeds along the fence line, re-aligning and parking crashed vehicles being held for evidence in a designated area, and re-painting parking spaces along the front and rear of the building. Also, with the assistance of an outside vendor, an electrical junction box was moved out into the parking lot, which allowed the move of all trailers utilized by the Division to a central location. The moving of the trailers was also instrumental in aiding with download issues experienced with the L3 video recording system utilized by the department.
139
*The Accident Investigation Unit has the responsibility to investigate
3 fatality accidents when they occur. The goal for the 2016/17 fiscal year will be for all the Accident Investigators to seek and obtain membership in the Midwest Association of Technical Accident Investigators (MATAI). This would provide the Accident Investigators an opportunity to establish farther reaching networking resources than are currently available in the KC Metro area, and assistance with techniques for more technical or complicated crash investigations.
*The Selective Enforcement Unit will track citizen traffic complaints
3 and document the resources utilized to address them. The SEU Sergeant will contact complainants that leave contact information and will ensure that only the necessary manpower needed will be utilized. The new speed enforcement trailer will also be utilized to assist in addressing certain traffic complaints.
*Train officer(s) to be an instructor for high speed motorcycle
3 maneuvers via outside funding through the Heartland Police Motorcycle Association (HPMA). This would allow us to enhance current training and the instructor(s) would train both internally and externally throughout the metro area in accordance with current training practices.
Targeted Selective Enforcement 8 8 8 8 Assignments Vehicular Accidents Reported 2,212 2,185 2,200 2,150 Traffic Summons Issued by Division 20,122 20,844 24,000 22,000 Driving While Intoxicated Arrests 131 277 300 300 Hit and Run Accidents Investigated 412 376 400 350 Alcohol Related Accidents 124 138 150 150
Police Captain 1.00 1.00 1.00 1.00 Master Police Officer 19.00 18.00 18.00 17.00 Police Officer 7.00 8.00 8.00 9.00 Police Sergeant 3.00 3.00 3.00 3.00 Parking Enforcement Off 1.00 1.00 1.00 1.00 140
Administrative Spec II 1.00 1.00 1.00 1.00 Total 32.00 32.00 32.00 32.00 ============================================ Personal Services 2,772,486 2,758,920 2,760,506 2,765,115 Other Services & Charges 4,132 4,020 4,350 4,370 Supplies 5,230 7,820 7,840 7,470 Capital Outlay 0 0 0 0 Other Expenditures 0 0 0 0 Total 2,781,848 2,770,760 2,772,696 2,776,955 ============================================ 141
The Drug Abuse Resistance Education (D.A.R.E.) Unit, within the Special Enforcement Division, provides the DARE Program to elementary and middle school students. The mission and curriculum of the D.A.R.E. Program is to prevent or curtail drug, alcohol, and tobacco usage amongst students. In addition, the D.A.R.E. Program provides positive measures to aid students in decision-making life skills with the emphasis on averting drug usage, and gang and violent activities. The Unit proactively networks, with internal and external agencies, to track registered sex offenders within the City boundaries, and to monitor their proximity to schools and daycares.
*COMBAT requirements for DARE Officers have been met in order to 3 continue instructing children in the elementary and middle schools regarding the dangers of drugs and decision-making life skills.
*Two full-time DARE officers instructed all fifth grade students, and 3 the School Resource Officers instructed all seventh grade students in the Independence School District during the 2015/16 school year.
*Meet COMBAT requirements for DARE officers in order to continue
3 instructing children in the elementary and middle schools regarding the dangers of drugs and decision-making life skills. The DARE Unit is financially supported by Jackson County COMBAT.
*The Independence School District has adopted the ALICE program
3 related to active shooters and intruders in the school. All SROs and DARE officers have been trained in this program. The program was implemented in the fall of 2014. The goal for the 2016/17 fiscal year will be to continue training all the School District employees in this program as well as city employees/departments as requested. A portion of the training includes active shoot actor scenarios.
D.A.R.E. Classes 102 85 100 100 D.A.R.E. Graduates 2,243 2,114 2,400 2,274 D.A.R.E. Schools 28 28 28 28
*In 2015, all SROs and DARE Officers changed their membership from the National School Resource Officers Association, which was an annual membership fee of $40 per officer, to a membership in the Missouri School Resource Officers Association, with an annual membership fee of $25 per officer.
Master Police Officer 2.00 2.00 2.00 2.00 Police Officer 1.00 1.00 1.00 1.00 Police Sergeant 1.00 1.00 1.00 1.00 Total 4.00 4.00 4.00 4.00 ============================================ Personal Services 187,248 200,562 200,562 204,806 Other Services & Charges 0 0 0 0 Supplies 9,227 11,500 11,500 11,500 Capital Outlay 0 0 0 0 Other Expenditures 0 0 0 0 Total 196,475 212,062 212,062 216,306 ============================================
143
This unit is responsible for processing crime scenes to gather evidence and other data to support criminal charges. Technicians conduct forensic examinations to develop information relative to criminal investigations, and latent prints in order to identify criminal defendants. Processing crime scenes assists in the collection and identification of evidence utilized in the prosecution of criminal defendants, which ultimately reduces crime within the community.
*The Independence Crime Lab fulfilled all obligations of the current 3 ASCLD-LAB Legacy accreditation requirements.
*Work areas were designated and equipment segregated for each 3 discipline. Additional crime scene collection areas were constructed at the off-site vehicle processing bay enabling Crime Scene personnel to conduct thorough investigations.
*Equipment was purchased and installed at the vehicle processing bay, 3 which included a vehicle scissor lift, air compressor, storage cabinets, and miscellaneous vehicle tools. The bay has been utilized over the past year for various cases and has proven successful in the immediate gathering of potential evidence.
*Crime Lab personnel (Chemist) certifications were maintained until 3 their respective resignations. Crime Scene and Fingerprint personnel have continued to maintain all required certifications based on the previous ASCLD requirements. Although the department is not pursuing future ASCLD accreditation, the Crime Scene Unit and Fingerprint Unit will continue with current requirements until such time a new accreditation body is identified.
*In the absence of an accrediting body certifying the Crime Scene 3 Unit, it will document in the unit manual all personnel
Crime Scenes Analyzed and Items 783 674 900 800 Processed Drug Items Analyzed 916 954 600 0 Latent Print Items Analyzed 752 1793 700 1500 Digital & Evidence Items 1,396 1016 2,000 1100
144
certifications necessary to remain a viable unit in the Criminal Justice and Judicial systems.
*Crime Scene and Fingerprint personnel will maintain all identified 3 certifications and pass an annual proficiency exam provided through an outside vendor.
*Develop and provide written unit manual documentation of policies 3 and protocols towards efficient methods of transferring evidence to the Missouri State Highway Patrol Crime Lab for evidence processing.
*Identify and provide written unit manual documentation of all 3 equipment that requires periodic calibration through an outside vendor. Once identified, conduct the calibrations as directed per industry standards.
*The Fingerprint Discipline will upgrade the AFIS fingerprint 3 computer system and maintain all protocols for a cohesive union with Missouri State Highway Patrol.
Crime Lab Administrator 1.00 1.00 1.00 .00 Criminalist 2.00 2.00 2.00 2.00 Crime Scene Investigator 5.00 5.00 5.00 5.00 Latent Print Examiner 1.40 1.40 1.40 1.40 Total 9.40 9.40 9.40 8.40 ============================================ Personal Services 728,218 793,058 793,923 526,354 Other Services & Charges 18,554 40,510 40,510 28,755 Supplies 5,803 15,255 15,255 7,985 Capital Outlay 0 0 0 0 Other Expenditures 0 0 0 0 Total 752,575 848,823 849,688 563,094 ============================================ 145
*The Missouri Highway Patrol had initially agreed to fund and staff a satellite lab at IPD. Based upon the agreement the Department planned for the transfer of all lab duties to the Highway Patrol. The Department has now learned that the Highway Patrol will not be moving forward with the satellite lab but will be using the funding to staff and equip additional personnel at other Highway Patrol Lab Facilities. The Highway Patrol has agreed to establish a kiosk at Troop A Headquarters to accept and transfer lab evidence. IPD crime scene personnel will transport evidence to Troop A and will be responsible for logging the evidence. MO Highway Patrol will then transfer the evidence to the various lab locations across the State. The Highway Patrol has committed that the procedure will reduce evidence processing time as well as the travel time for IPD crime scene personnel.
146
The Detention Unit is responsible for processing individuals arrested for violations of City Ordinances, State Statutes, and Federal Laws. This unit houses prisoners on a short-term basis who are held either for investigation of an alleged violation, awaiting arraignment, or held until their bond is posted. Long-term prisoners are transferred and incarcerated at an outside facility that meets the City's specifications. This unit operates 24 hours per day, 7 days per week and 365 days per year. *A one year contract was agreed upon with the Johnson County 3 Missouri Sheriff for off-site prisoner housing.
*A
prisoner housing was
upon
*The video monitoring system in Detention was completed, providing 3 monitoring of the unit from the booking area. *Progress continues with the updating of plumbing fixtures in Detention 3 to complete the capital improvement project. *A new Detention Unit Administrator was selected and appointed. 3 Prisoners Booked and Secured 12,098 11,080 13,500 13,500 *Fill
3
*Secure
off-site
3 Detention Officer 10.00 10.00 10.00 10.00 Detention Administrator 1.00 1.00 1.00 1.00 Detention Supervisor 2.00 2.00 2.00 2.00 Total 13.00 13.00 13.00 13.00 ============================================ 147
contract for additional off-site
agreed
3 with the Andrew County Missouri Sheriff.
existing Shift Supervisor vacancy from existing eligibility
list.
long-term contract for
prisoner housing.
Personal Services 900,070 903,515 904,264 877,937 Other Services & Charges 674,509 648,027 648,027 649,026 Supplies 6,437 8,094 8,094 7,095 Capital Outlay 0 0 0 0 Other Expenditures 0 0 0 0 Total 1,581,016 1,559,636 1,560,385 1,534,058 ============================================ 148
The Records Unit provides customer service at the main lobby information desk at Police Headquarters. They provide customer service to the general public by completing police reports and answering questions. The Records Unit as a whole receives, indexes, disseminates and archives various police reports for the general public. The unit participates in internal and external databases concerning criminal records and warrant information. The unit provides control over receiving and returning warrants, subpoenas, and other pertinent court and jail papers.
*The Records Unit maintained an eligibility list for records and desk 3 personnel.
*The Records Unit continues to go through offsite storage reports 3 to maintain the necessary record retention schedule.
*The Records Unit attended refresher training provided by our Records 3 Management vendor. New policies and procedures were put into place. The front desk personnel were trained on the mobile module within the New World system.
*The Records Unit will continue to go through reports stored off-site 3 in order to maintain the retention schedule.
*The Records Unit will maintain training standards and certifications 3 for MULES and REJIS end users for required personnel. Every user in the department that accesses criminal justice information has to have a certification from the state database.
*The Records Unit will review the approval and merge process for all 3 reports within the department to streamline the process.
Number of Citizen
100,699 99,803 100,000 100,500
Phone Calls
149
*Training will be implemented by the Records Unit pertaining to traffic stop reporting. Officers will be able to electronically submit the form instead of writing it.
*The FBI will be working toward police departments using the MO Incident Based Reporting System (MIBRS) instead of Uniform Crime Reporting (UCR). When this occurs, it will be large project due to every incident needing to be counted and all the current tables in the Records Management System will need to be added. It will also require the Records Unit to report to both UCR and MIBRS at the same time for six months.
Records Unit Clerk 9.63 9.63 9.63 9.63 Police Records & Prop Adm 1.00 1.00 1.00 1.00 Police Desk Clerk 8.00 8.00 8.00 8.00 Police Records Supervisor 2.00 2.00 2.00 2.00 Police Records Technician 2.00 2.00 2.00 2.00 Total 22.63 22.63 22.63 22.63 ============================================ Personal Services 1,298,087 1,291,048 1,292,812 1,313,333 Other Services & Charges 1,323 1,100 1,100 1,100 Supplies 6,580 7,500 7,338 7,500 Capital Outlay 0 0 0 0 Other Expenditures 0 0 0 0 Total 1,305,990 1,299,648 1,301,250 1,321,933 ============================================
150
The Communications Unit receives emergency and non-emergency telephone calls from the public and routes them to the appropriate responder; Fire, Police, AMR, or Animal Control. The unit also responds to various informational requests from the radio traffic received from the Police and Fire Departments. In addition, the unit is responsible for the proper support of various operational needs for all department entities.
*Eligibility lists have been created and filled throughout the year as 3 we continued our effort to increase staffing levels. *Schedule adjustments have been made to reduce overtime from the
Emergency 9-1-1 Calls 196,757 208,499 265,000 265,000 Computer Aided Dispatching (C.A.D.) 151,537 179,193 168,000 168,000 Calls for Service
and
to
to
*Seek out and
for alarm
in 3
with city ordinance requirements
alarms. *The Communications Administrator will identify and
3
in-service
to
and
151
3 previous fiscal year. *Additional training was conducted in Law Enforcement, Public Safety 3 Telecommunicator One, Communications Training Officer, and additional Continuing Education Articles.
*The Emergency Communications Center will continue seeking qualified 3 applicants in pursuit of reaching full staff. Recruitment
Training will be utilized
identify personnel best suited
fill existing vacancies.
pursue outside contracting
billing purposes
accordance
regarding
incorporate
further
training for unit personnel
enhance skill
performance.
*Budget restraints from past years have prohibited the procurement of quality lasting 24/7 chairs. The Communications Unit will need to purchase quality chairs during this next budget year.
Telecommunicator 6.00 6.00 6.00 6.00 Telecommunicator I 21.00 21.00 21.00 21.00 Telecommunicator II 3.00 3.00 3.00 3.00 Emergency Communications Admin 1.00 1.00 1.00 1.00 Emergency Comm Supv 3.00 3.00 3.00 3.00 Total 34.00 34.00 34.00 34.00 ============================================ Personal Services 2,090,148 2,259,445 2,273,805 2,227,355 Other Services & Charges 2,562 2,330 2,330 2,467 Supplies 8,289 8,500 8,500 8,363 Capital Outlay 0 0 0 0 Other Expenditures 0 0 0 0 Total 2,100,999 2,270,275 2,284,635 2,238,185 ============================================
152
This cost center represents Federal and State grant programs that support the operations of the City's Police Department. See the Police Department's cost centers (4511-4545) for applicable Accomplishments, Objectives and Performance Indicators.
Master Police Officer 7.00 5.00 5.00 4.00 Police Officer 3.00 1.00 1.00 1.00 Crime Analyst I 2.00 1.00 1.00 .00 Crime Analyst I .00 .00 .00 1.00 Electronics Fleet Technician 1.00 .00 .00 .00 Total 13.00 7.00 7.00 6.00 ============================================ Personal Services 1,042,507 404,663 874,359 341,491 Other Services & Charges 146,387 0 100,878 0 Supplies 48,187 0 84,576 0 Capital Outlay 27,278 0 20,255 0 Other Expenditures 0 0 0 0 Total 1,264,359 404,663 1,080,068 341,491 ============================================ 153
This cost center serves to provide oversight and management of the revitalization and capital improvement projects planned for the City's Police Department made possible through the August 2004 adoption of a one-eighth cent sales tax increase.
Other Services & Charges 245,702 268,495 268,495 255,546 Supplies 16,020 20,000 20,000 20,000 Capital Outlay 0 25,175 25,175 0 Other Expenditures 38,273 38,274 38,274 38,273 Total 299,995 351,944 351,944 313,819 ============================================ 154
This cost center serves to provide oversight and management of the relocations, renovations and capital improvement projects planned for the City's Police Department made possible through the August 2004 adoption of a one-eighth cent sales tax increase.
Other Services & Charges 77,059 64,000 64,000 64,500 Supplies 7,040 0 0 0 Capital Outlay 192,197 505,000 505,000 505,000 Other Expenditures 0 0 0 0 Total 276,296 569,000 569,000 569,500 ============================================ 155
This cost center serves to provide oversight and management of the replacement and capital improvement projects planned for the City's Police Department made possible through the August 2004 adoption of a one-eighth cent sales tax increase.
Other Services & Charges 143,517 182,698 182,698 149,010 Supplies 192,524 238,091 238,091 240,112 Capital Outlay 831,069 746,000 746,000 1,083,000 Other Expenditures 0 0 0 0 Total 1,167,110 1,166,789 1,166,789 1,472,122 ============================================ 156
*Unfunded Position
John Greene Fire Chief Admin. Specialist III Assistant Fire Chief Training/Professional Development Deputy Chief Operations Battalion Chief Operations “C” Shift Battalion Chief Operations “A” Shift (14) Fire Captain (14) Fire Equip. Operator Battalion Chief Maintenance Battalion Chief Fire Prevention (5) Fire Inspectors Admin Specialist II Emergency Preparedness Mgr. Emergency Preparedness (.50) Admin. Spec II Emergency Preparedness Planner Deputy Chief Administration & Budget Battalion Chief Operations “B” Shift Battalion Chief Emergency Medical Services (23) Firefighters (14) Fire Captain (14) Fire Equip. Operator (23) Firefighters (14) Fire Captain (14) Fire Equip. Operator (23) Firefighters Admin. Specialist III (.50)Admin Specialist II *Fire Apparatus Mechanic 157
Fire
2016-17Operating Budget Fire
2016‐17 Budget

Appropriations by Type: ExpenditureActualOriginalRevisedAdopted Type2014-152015-162015-162016-17 Personal Ser.16,689,834 $ 16,090,642 $ 16,461,168 $ 16,917,896 $ Other Services801,642 921,289 945,683 1,289,410 Supplies304,788 430,406 459,630 396,257 Capital Outlay637,805 1,595,175 1,570,175 1,310,175 Other 587,892 35,329 35,329 35,329 Total 19,021,961 $ 19,072,841 $ 19,471,985 $ 19,949,067 $ Historical Comparison: ActualActualActualActualBudgetBudget 2011-122012-132013-142014-152015-162016-17 Employees: Full Time Equiv. 174.00 174.00 174.00 175.00 175.00 175.00 Amount by Fund: General Fund 16,237,861 $ 15,911,151 $ 16,643,899 $ 17,214,371 $ 17,042,758 $ 17,782,425 $ Grants 326,997 331,843 441,030 412,039 82,808 87,060 Fire Sales Tax 2,099,702 1,898,509 2,090,503 1,395,551 1,947,275 2,079,582 Total All Funds18,664,560 $ 18,141,503 $ 19,175,432 $ 19,021,961 $ 19,072,841 $ 19,949,067 $ Comparative Ratios: Per Capita 159.76 $ 155.28 $ 163.59 $ 162.21 $ 162.68 $ 170.16 $ Per Household 382.93 $ 384.07 $ 388.30 $ 352.38 $ 349.69 $ 365.76 $ 84.8% 6.5% 2.0% 6.6% 0.2%
Personal Ser. Other Services Supplies Capital Outlay 0 5,000 10,000 15,000 20,000 25,000 2011-122012-132013-142014-152015-162016-17 $18,665 $18,142 $19,175 $19,022$19,073 $19,949 Dollars (1,000's) Fiscal Year 158
The primary goal of the Fire Department is to prevent and extinguish fires for the purpose of saving life and property. In addition, the Department serves as a first responder for basic and advanced life support in medical emergencies and as a lead agency in preparation, response, mitigation and recovery from hazardous material releases. The Fire Prevention Division provides construction plan review, public fire education, and fire and life safety code enforcement in commercial occupancies to address the primary Department goal. The Fire Maintenance Division provides support through fleet, facilities, equipment and supply maintenance. The Training/Professional Development Division oversees the training, certification and skill advancement for all Department personnel. The Emergency Preparedness Division coordinates disaster planning, preparedness, response, mitigation and recovery efforts for the City.
Full Time Positions 173.00 175.00 175.00 175.00 Part Time Positions 1.00 .00 .00 .00 Total 174.00 175.00 175.00 175.00 ============================================ 4611Fire Administration 637,262 597,236 600,953 612,458 4621Fire Operations 15,385,355 14,968,953 15,289,526 15,768,192 4622Emergency Medical Services 206,188 218,367 219,494 230,767 4631Fire Prevention 548,905 662,644 664,022 673,618 4641Maintenance 233,893 270,025 271,041 192,432 4650Fire Dept. Grants 412,039 82,808 152,411 87,060 4651Training/Professional Dev. 123,549 188,857 189,220 160,589 4661Emergency Preparedness 79,219 136,676 138,043 144,369 4671Fire Sales Tax Program 1,395,551 1,947,275 1,947,275 2,079,582 Total 19,021,961 19,072,841 19,471,985 19,949,067 ============================================ 159
*The Fire Department will continue to focus on the four priority areas identified in the FY 2014-15 Strategic Planning: professional development of personnel; integration of new technology; maintenance, repair and replacement/upgrading of equipment and facilities; and strategies for improving deployment of resources to improve outcomes.
General Fund 17,214,371 17,042,758 17,372,299 17,782,425 Grants 412,039 82,808 152,411 87,060 Fire Public Safety Sales Tax 1,395,551 1,947,275 1,947,275 2,079,582 Total 19,021,961 19,072,841 19,471,985 19,949,067 ============================================
160
The Administration Division is responsible for the overall management of the Fire Department. The division establishes policy, processes payroll, administers the budget and serves the personnel needs of the Fire Department. This division also ensures that strategic goals and objectives meet the vision and mission of the department.
*Convened Labor/Management committee to examine response issues and 2 to develop options to improve incident responses.
*Provided information and support to the Public Safety Oversight 3 committee for the Fire Safety Sales Tax on a quarterly basis to allow for review and evaluation of the Fire Department Compliance with the stated goals to the voters.
*Convened Labor/Management committee to examine cancer prevention 3 activities that could be instituted by the department.
*Coordinate the support and integration of recommendations made by the 2 Committee for Review of Public Safety Services and the report on deployment/standard of coverage for Fire Department resources based on City Council approval/comment.
*Provide quarterly or as requested information and support to the 3 Public Safety Oversight Committee for the Fire Safety Tax.
*Coordinate the integration of any City Council adopted changes to the 3 contract between the City of Independence, MO and the International Association of Firefighters Local No. 781 throughout all divisions of the Fire Department.
Fire Chief 1.00 1.00 1.00 1.00 Deputy Fire Chief 1.00 1.00 1.00 1.00 Administrative Spec II 1.00 1.00 1.00 1.00 Administrative Spec III 1.00 1.00 1.00 1.00 Total 4.00 4.00 4.00 4.00 ============================================ 161
Personal Services 524,787 452,858 456,575 465,459 Other Services & Charges 100,236 121,216 121,216 122,227 Supplies 12,239 23,162 23,162 24,772 Capital Outlay 0 0 0 0 Other Expenditures 0 0 0 0 Total 637,262 597,236 600,953 612,458 ============================================ 162
The Fire Operations Division serves the emergent needs of the community with response to emergency medical calls, fires, explosions, bomb threats, vehicle accidents, homeland security terrorism, hazardous chemical spills and other emergency calls. The Fire Operations Division assists the community with non-emergent needs by ensuring compliance with fire codes, assisting the Fire Prevention Division in public education and responding to citizen requests for non-emergency services.
*Began reporting response information for public viewing through the 3 City's Insight Dashboard.
*Responded to record number of Incident Responses in calendar year 2 2015. The 20,173 responses were an increase from 17,517 in calendar year 2014; this was a 15% increase in one year's time.
*Collect and correlate pre-incident planning information on 10 target 2 hazards within each fire district and enter into computer-aided dispatch system to allow retrieval during emergency response by personnel through Mobile Data Terminal (MDT) technology.
*Collect data on a quarterly basis and provide corrective actions to 2 ensure response (from time of dispatch until firefighters are on scene) meets national recommendations for fire and EMS response 90% of the time (fire 380 seconds and EMS 360 seconds).
Total Alarms 16,928 18,736 17,500 20,000 Residential Fires 153 152 150 160 Commercial Fires 13 24 20 25 Vehicle Fires 78 72 80 80 Grass/Trash 160 160 220 180 Open Burning 248 202 200 200 Bomb Threat 4 7 5 5 Hazardous Materials 346 400 375 350 Alarm Systems 788 906 850 900 Medical Alarms 10,612 11,545 11,000 11,750 Service Calls, Odors, Carbon 4,526 5,268 5,000 5,500 Monoxide, Other Service
163
*Coordinate with Training/Professional Development Division to conduct 2 two table-top exercises with 100% of Command Staff and 50% of captains to practice model procedures for Incident Command System (ICS).
Fire Captain 42.00 42.00 42.00 42.00 Fire Equipment Operator 42.00 42.00 42.00 42.00 Firefighter 65.00 65.00 69.00 69.00 Assistant Fire Chief 1.00 .00 .00 .00 Battalion Chief 2.00 3.00 3.00 3.00 Deputy Fire Chief 1.00 1.00 1.00 1.00 Total 153.00 153.00 157.00 157.00 ============================================ Personal Services 14,838,003 14,434,903 14,755,476 15,215,915 Other Services & Charges 385,621 335,730 335,730 398,526 Supplies 126,402 162,991 162,991 118,422 Capital Outlay 0 0 0 0 Other Expenditures 35,329 35,329 35,329 35,329 Total 15,385,355 14,968,953 15,289,526 15,768,192 ============================================ 164
The Emergency Medical Services (EMS) and Wellness Division is responsible for the training and operation of emergency medical services and overseeing the Fire Department's Wellness Program. The EMS Program goal is to facilitate the response of firefighters trained to the appropriate level of Emergency Medical Services, providing basic and advanced life support measures to the citizens and visitors of Independence. The Wellness Program goal is to oversee the overall health and wellness of Fire Department personnel.
*Recorded as completed 100% of internet-based Continuing Education 3 Units (CEUs) required by personnel for relicensure as a Paramedic or Emergency Medical Technician (EMT) by the end of FY 2015-16 with 25 personnel renewing their EMT or Paramedic license.
*Provided voluntary Wellness Physicals which included blood work, eye 3 exam, hearing exam, cardiac stress test and a physical examination by a physician with 85 or approximately 50% of eligible personnel participating.
*Reviewed 100% of 14,000 incidents requiring emergency medical
2 assistance for completeness for FY 2015-16. Performed quality control review for 20% of these calls with assistance of the department's Medical Director to identify training, equipment and response needs and to assure compliance with current protocols. *Fire Department personnel saved the lives of 20 civilians while
*Coordinated purchase of six wireless
allow for the
transmission of 12-lead ECGs from the scene of a cardiac event to Centerpoint Medical Center Emergency Department prior to transport of the patient. This allows early recognition of time critical cardiac events and allows the hospital to prepare prior to the patient's arrival.
*Provided 12 hours of skill-based training for continuing education 3 hours that personnel can apply toward their re-licensing.
2
responding on cardiac and trauma related incidents in calendar year 2015.
2
*Coordinated purchase of six new Physio Control LifePak 15 cardiac
monitors with 12-lead Electrocardiogram (ECG) capabilities.
gateways to
2
Total Emergency Medical Services 10,612 11,549 11,000 12,932 (EMS)
165
Calls
*Oversee the replacement of five ECG monitors to include development of 3 bid specifications, purchase of monitors and in-service training of personnel to ensure competency on older monitors as well as replacement monitors. *With
Total Basic Life Support (BLS) 6,683 7,520 6,950 8,404 Calls Total Advanced Life Support (ALS) 3,929 4,273 5,000 5,003 Calls Clinical Saves 28 20 32 30 Emergency Medical Technician (EMT) 5,451 5,800 5,670 6,600 Training Hours Avg Training Hours per Person 76 74 78 80
EMS
Accreditation,
3
high probability medical response data by
2
Review quarterly
equipment placement, Health Department requirement and call
strategies. Assistant Fire Chief 1.00 1.00 1.00 1.00 Total 1.00 1.00 1.00 1.00 ============================================ Personal Services 126,256 127,049 128,176 138,662 Other Services & Charges 45,369 48,836 48,836 50,721 Supplies 34,563 42,482 42,482 41,384 Capital Outlay 0 0 0 0 Other Expenditures 0 0 0 0 Total 206,188 218,367 219,494 230,767 ============================================ 166
newly established
Training Entity
the EMS
Division will offer up to 12 hours of EMS skill training per person. These educational hours will be recognized towards re-licensure requirements. *Collect and analyze
location
and type for each City Council district.
for improving
reduction
The Fire Prevention Division provides for the inspection of new businesses within the City, fire code enforcement, plan reviews, fire safety education, fire investigation and the re-inspection of all violations found during company inspections. The division maintains alarm records and reports and develops statistical data for the annual report.
*Compiled statistical data and completed the Annual Report for 2014. 2
evaluations for the formal pre-kindergarten education
presentations and reviewed the data to identify and address areas of low retention.
*Implemented a process for fire inspectors to scan company inspection 2 data into New World inspection records. *Coordinated the purchase of replacement Public Education instructional 2 materials and tools to address areas of high risk to life safety and property conservation.
*Completed entry of the pre-incident planning of target hazard data in 2 the New World Reporting System to provide access on Mobile Data Terminals (MDTs) in emergency and non-emergency situations. *Reorganized the Santa-Cali-Gon inspection process with the Building 2 Inspection Division for staff efficiency and vendor satisfaction. *Completed fireworks training for all fire inspectors and reorganized 2 the process of fireworks tent inspections.
*Completed
3
Commercial Inspections and 4,375 2,586 4,156 2,650 Reinspections Plan Reviews & Final Construction 566 525 552 575 Inspections Occupational License Inspections 818 839 858 875 & Reinspections Santa-Cali-Gon Inspections 454 442 500 450 Public Education Audience 26,552 12,712 27,000 25,000 Citizen Request 519 244 493 300 Zoning Projects 43 20 50 50 167
*Coordinate replacement and installation of new Mobile Data Terminals 3 for Fire Suppression apparatus. *Coordinate a Public Education program with the Independence Elementary 2 Schools to visit each school once a month and participate with a class to increase fire department awareness and education. *Coordinate and develop a new Juvenile Fire Setter program. 3 *Coordinate a program for educating businesses that continually fail 2 their annual fire inspection. Fire Inspector 5.00 5.00 5.00 5.00 Battalion Chief 1.00 1.00 1.00 1.00 Administrative Spec II 1.00 1.00 1.00 1.00 Total 7.00 7.00 7.00 7.00 ============================================ Personal Services 537,916 643,641 645,019 660,082 Other Services & Charges 4,031 6,323 6,323 7,056 Supplies 6,958 12,680 12,680 6,480 Capital Outlay 0 0 0 0 Other Expenditures 0 0 0 0 Total 548,905 662,644 664,022 673,618 ============================================ 168
The Maintenance Division manages the service, preventative maintenance and replacement programs for all staff vehicles, fire apparatus and equipment. The division manages the maintenance, updating and replacement programs for all fire facilities. The division assumes an active role in training Operations Division personnel in the use, care and maintenance of all new apparatus and equipment.
*Coordinated replacement of
Pumpers
2 *Coordinated purchase of
gear. 2 *Coordinated purchase of
as
of the second
2
radio
*Coordinated purchase of
Gear Washers for Station 3 (10219 E. 2 Winner Rd.) and Station
(202 W. 23rd St.). *Coordinated replacement of one Aerial apparatus for the Operations 2 Division. Preventative Maintenance Completed 85 87 80 80 on Fire Apparatus Preventative Maintenance Completed 35 27 40 25 on Staff Vehicles Self-Contained Breathing Apparatus 30 32 30 45 Repaired Aerial Apparatus Recertification 4 4 4 4 Completed Pumper Apparatus Pump Tests 17 17 17 17 Completed *Supervise development of specifications and Pumper replacement 2 program. *Continue with
for
of mobile and
for Operations Division. *Supervise preparation of specifications and purchase to
of fire attack hand nozzles (replace 20 of 60 hand nozzles). *Supervise implementation and ongoing equipment inventory tracking for 3 Fire Department utilizing new software purchased for this purpose. 169
two
for the Operations Division.
25+ sets of Personal Protective
14 portable radios
part
phase
of portable
replacement.
two
4
purchasing plan
replacement
portable 2 radios
replace one 2 third
Battalion Chief 1.00 1.00 1.00 1.00 Fire Apparatus Mechanic 1.00 1.00 1.00 1.00 Total 2.00 2.00 2.00 2.00 ============================================ Personal Services 107,126 120,628 121,644 107,302 Other Services & Charges 98,100 106,763 106,763 47,646 Supplies 28,667 42,634 42,634 37,484 Capital Outlay 0 0 0 0 Other Expenditures 0 0 0 0 Total 233,893 270,025 271,041 192,432 ============================================ 170
The purpose of this cost center is to track the expenditures from grants received by the Fire Department. Management of this cost center is divided among the administrative personnel in the divisions utilizing the funds made available from various grants and grant programs.
Firefighter 4.00 4.00 .00 .00 Emergency Preparedness Mgr .50 .50 .50 .50 Emergency Preparedness Planner .00 .50 .50 .50 Administrative Spec II .25 .25 .25 .25 Total 4.75 5.25 1.25 1.25 ============================================ Personal Services 410,401 82,808 123,793 87,060 Other Services & Charges 639 0 606- 0 Supplies 999 0 29,224 0 Capital Outlay 0 0 0 0 Other Expenditures 0 0 0 0 Total 412,039 82,808 152,411 87,060 ============================================ 171
The Training/Professional Development Division provides training to Fire Department, City employees and citizens, including firefighting procedures, emergency medical procedures, hazardous materials procedures, Cardio Pulmonary Resuscitation (CPR), emergency response to terrorism and Incident Command. The Safety Program, in cooperation with International Association of Firefighters (IAFF) Local 781, is responsible for accident and injury prevention. The main goal of the division is to provide training which promotes safe, effective and efficient emergency response service to the community.
*Provided opportunity for personnel to attend a total of 3,207 hours of 3 specialized training including ACLS and CPR Recertification, Skills Assessment, Pit Crew Concept for Cardiac Resuscitation, Response
Summer/Winter
*Provided opportunity for
personnel to attend specialized 3 firefighter Hands-On Training outside the department. *Offered classes to enhance personal safety and wellness. 3 *Conducted skills assessment to identify and focus on specific training 3 areas with 105 personnel participating. *Offered Cancer Prevention training to operations personnel utilizing 3 instructor from the Firefighter Cancer Support Network. *Hired and trained eight new recruits to the new contract standards. 3 *Participated in Missouri Gas Energy Annual Fire School specializing in 3 natural gas firefighting with 27 personnel attending. Individual Class Topics 153 153 153 84 Computer-Based Topics 132 71 46 75 Total Combined Training Topics 285 224 199 159 Computer-Based Training Hours 1,147 1,980 1,500 1,500 Total Staff Hours 41,426 39,178 39,600 39,600 Average Hours Training per Person 251 164 240 240 % of 240 Hours Required by ISO 105% 68% 100% 100% *Coordinate and
3
Aerial Operations
and
Operator
career development
Equipment 172
Reporting,
Fire School and Hands-On-Training.
39
conduct four scheduled classes (Basic Fire
Investigation, Fire Report Training,
Course,
Driver
course) for
plan for Fire
those such as Live Fire Drills,
Drills, Calling a Mayday, and SCBA Confidence
a minimum of 10 to 14 hours of hands
training at the facility. *Provide opportunities for "Missouri Division of Fire Safety" courses 3 such as Fire Officer I, Fire Instructor I and Fire Inspector, by hosting at our training facility or working with the Metro Community College to hold at their Blue River Campus. These courses are required for career development to prepare for promotional opportunities.
Operators
Firefighters to
promotional exams. *Coordinate activities necessary to enhance and maintain maximum 3 utilization
E. M-78 Hwy). Activities
Assistant Fire Chief 1.00 1.00 1.00 1.00 Administrative Spec II .50 .50 .50 .50 Total 1.50 1.50 1.50 1.50 ============================================ Personal Services 111,343 145,357 145,720 156,059 Other Services & Charges 8,215 37,621 37,621 169 Supplies 3,991 5,879 5,879 4,361 Capital Outlay 0 0 0 0 Other Expenditures 0 0 0 0 Total 123,549 188,857 189,220 160,589 ============================================ 173
and
prepare for
of the Fire and Safety Training Center (21011
include
R.I.T.
Drills, providing all operations personnel
on
The Emergency Preparedness Division is responsible for supporting the Emergency Management functions for the City of Independence, Missouri. This division provides the core management and administrative functions as defined through the Local Emergency Operations Plan. The division serves as a support during times of disaster for all local, state and federal departments across the spectrum of the emergency management functions, including preparedness, response, prevention and recovery.
The Emergency Preparedness Division manages and administers the Emergency Management Performance Grant (EMPG), Local Emergency Operations Plan, outdoor warning siren system, Independence/Eastern Jackson County Emergency Communications group, Community Emergency Response Team (CERT) program and Independence Citizen Corps. The division is also responsible for the support of planning exercises and training functions to facilitate multi-departmental and agency coordination for operations in response to potential and actual incidents within the City of Independence, Missouri.
*Activated Independence/Eastern Jackson County Emergency Operations 1 Center and Emergency Management Mobile Command Center ten times in FY 2015-16 for severe weather, large events and gatherings throughout the community, residential and commercial fires, hazardous materials incidents, support to Independence Police Department and exercises.
*Coordinated with Jackson County Department of Emergency Preparedness 2 to confirm 10 shelter locations (commercial and faith based organizations) and continue coordinating with American Red Cross, Independence Parks and Recreation Department, SEMA and other organizations to provide shelter management training for over 70 volunteers to establish and manage disaster victim shelter sites throughout the Independence and Eastern Jackson County area. These organizations can shelter up to approximately 7,000 people displaced by any disaster or emergency as well as provide two meals per day for over 18,000 people. This has been an on-going, multi-year initiative spanning the entire metropolitan region.
*Completed a total of 81 training sessions, drills and meetings during 2 FY 2015-16 conducted by volunteers and paid staff associated with Emergency Preparedness Division.
*Provided presentations to 230 citizens through the public education 2 program (comprised of volunteer instructors, presenters and subject matter experts) during FY 2015-16. These presentations were given to civic organizations, government departments and agencies, neighborhood organizations and public events at local, regional, state and federal levels.
*Provided two 40-hour Community Emergency Response Team (CERT) training 2 courses to 30 participants from Independence sponsored by the Independence CERT. To date, over 1,120 citizens from the Independence
174
area have taken this training, many of whom continue to participate in CERT meetings, advanced training sessions and exercises. *Further developed the Emergency Operations Center operations 2 capability through the installation of additional communications equipment, information/visual display technology and other technological improvements.
*Manage and provide grant program oversight for Federal Emergency 2 Management Agency (FEMA) Emergency Management Performance Grant (EMPG) Grant (Grant Year 2016) ensuring adherence to budgeting guidelines, matching funds requirements, exercise participation requirements and documentation submission timelines throughout the Grant Year.
*Provide all-hazards Critical Incident Planning assistance to not less 2 than two City buildings, incorporating all City Departments housed therein.
*Participate in not less than two joint inter-departmental drills or 2 full-scale exercises using select target hazard scenarios involving paid staff and volunteer organizations.
*Conduct not less than two Community Emergency Response Team (CERT) 2
*Recovered $2.42
Public Assistance, for the
damages in July 2015. Emergency Operations Center (EOC) 9 8 10 10 Activations Mobile Command Center Call Outs 10 8 10 8 Mitigation Projects 2 0 1 1 Total Volunteer Training Meetings/ 126 68 140 120 Sessions EOC Management Team Events 23 18 25 22 Community Emergency Response Team 26 15 30 20 (CERT) Events Disaster Animal Response Team 7 8 10 8 (DART) Events Emergency Communications (Amateur 66 20 30 24 Radio) Services (ECS) Events Public Education Program 3 7 15 10 Presentations Volunteer Coordinator Leadership 4 2 15 12 Meetings
million for the City of Independence from Federal 2
storm
175
courses for citizens and returning CERT members per fiscal year and conduct not less than one advanced training for CERT members per fiscal year quarter using grant funds.
Emergency Preparedness Mgr .50 .50 .50 .50 Emergency Preparedness Planner .00 .50 .50 .50 Administrative Spec II .25 .25 .25 .25 Total .75 1.25 1.25 1.25 ============================================ Personal Services 27,928 83,398 84,765 87,357 Other Services & Charges 40,488 43,200 43,200 44,658 Supplies 8,428 10,078 10,078 12,354 Capital Outlay 2,375 0 0 0 Other Expenditures 0 0 0 0 Total 79,219 136,676 138,043 144,369 ============================================ 176
The purpose of this cost center is to budget and track expenditures of Fire Safety Tax funds to ensure compliance with the stated goals of this initiative when passed by voters.
*Purchased six new Physio Control LifePak 15 cardiac monitors with 2 12-lead Electrocardiogram (ECG) capabilities.
*Purchased six wireless gateways to allow for the transmission of 2 12-lead ECGs from the scene of a cardiac event to Centerpoint Medical Center Emergency Department prior to transport of the patient. This allows early recognition of time critical cardiac events and allows the hospital to prepare prior to the patient's arrival.
*Purchased two Pumpers for the Operations Division. 2 *Purchased 25+ sets of Personal Protective gear. 2 *Purchased 14 portable radios as
of the
of
2 radio replacement. *Purchased two Gear Washers for Station 3 (10219 E. Winner Rd.) and 2 Station 4 (202 W. 23rd St.). *Purchased one Aerial apparatus for the Operations Division. 2 *Provide
2
of the Fire Department. Personal Services 6,074 0 0 0 Other Services & Charges 118,943 221,600 246,600 618,407 Supplies 82,541 130,500 130,500 151,000 Capital Outlay 635,430 1,595,175 1,570,175 1,310,175 Other Expenditures 552,563 0 0 0 Total 1,395,551 1,947,275 1,947,275 2,079,582 ============================================ 177
part
second phase
portable
for the purchase, construction, repair, maintenance and
renovation of facilities/equipment and training within the operation
Environ.
(3.1) Admin.
Public Health Manager (Grant Funded)
Disease and Immunization Admin. Specialist III Assistant Health Director Environmental Public Health Administrative
III Andrew Warlen
Health Director Public Health Manager Disease Prevention
Admin. Specialist II Advisory Board of Health
Public Health Specialist Public Health Epidemiologist Public Health Response Planner (1.25) Public Health Nurse Animal Field
Manager Public Health Nurse
Health Manager * Assistant Health Director * Public Health Program Coord. * = Unfunded Positions (6)
* Property Maintenance Officer * Animal Services Officer * Environ. Public Health Spvr. City Funded Grant Funded City Funded Grant Funded City Funded Grant Funded 178
Health (3) Public Health Investigator II (.3) Public Health Investigator II
Public Health Spvr.
Specialist II * (.50) Clerk Typist (Part Time) (.5)
Communicable
Specialist
Public
(.6)
(3.5)
Services
(3) Animal Services Officer Public
Property Maintenance Officer
2016-17Operating Budget Health

Appropriations by Type: ExpenditureActualOriginalRevisedAdopted Type2014-152015-162015-162016-17 Personal Ser.2,363,951 $ 2,318,120 $ 2,574,273 $ 2,344,883 $ Other Services765,118 688,758 849,143 729,890 Supplies97,437 71,254 144,161 57,672 Capital Outlay35,990 - 15,301Other - - -Total 3,262,496 $ 3,078,132 $ 3,582,878 $ 3,132,445 $ Historical Comparison: ActualActualActualActualBudgetBudget 2011-122012-132013-142014-152015-162016-17 Employees: Full Time Equiv. 43.81 47.85 38.39 35.42 35.69 37.67 Amount by Fund: General Fund 2,519,483 $ 2,617,796 $ 2,554,644 $ 2,697,307 $ 2,650,711 $ 2,608,660 $ Grants 702,364 849,927 783,543 565,189 427,421 523,785 Total All Funds3,221,847 $ 3,467,723 $ 3,338,187 $ 3,262,496 $ 3,078,132 $ 3,132,445 $ Comparative Ratios: Per Capita 27.58 $ 29.68 $ 28.48 $ 27.82 $ 26.25 $ 26.72 $ Per Household 66.10 $ 73.41 $ 67.60 $ 60.44 $ 56.44 $ 57.43 $ 74.9% 23.3% 1.8% 2016‐17
Personal Ser. Other Services Supplies 0 1,000 2,000 3,000 4,000 5,000 2011-122012-132013-142014-152015-162016-17 $3,222 $3,468 $3,338 $3,262 $3,078 $3,132 Dollars (1,000's) Fiscal Year 179
Budget
The Health Department is charged by the City Charter to enforce and administer the laws of the State, the provisions of the Charter and Ordinances relating to public health, and environmental health and safety. The department ensures the public's health through activities that protect the public from environmental hazards, prevent injury and disease, and promote healthy behaviors and lifestyles. These goals are accomplished through enforcement of ordinances, health promotion, planning, and surveillance activities. The department also assesses community health needs, mobilizes community resources to meet identified needs, and measures outcome of programs and services.
Full Time Positions 32.00 31.00 31.00 32.00 Part Time Positions 6.39 4.42 4.69 5.67 Total 38.39 35.42 35.69 37.67 ============================================ 4711Health Administration 246,509 237,616 239,416 330,581 4720Disease Prevention & Control 1,106,168 1,206,816 146,659 157,292 4730Communicable Disease & Immun. 144,876 71,707 72,281 78,710 4740Environmental Public Hlth Div 1,199,754 1,134,572 2,201,413 2,042,077 4752Disease Prev. & Cntrl. - Grant 409,694 292,778 597,927 306,166 4753Comm. Disease & Immum. - Grant 124,886 106,329 220,118 184,799 4754Environ. Public Hlth. - Grant 30,609 28,314 105,064 32,820 Total 3,262,496 3,078,132 3,582,878 3,132,445 ============================================ General Fund 2,697,307 2,650,711 2,659,769 2,608,660 Grants 565,189 427,421 923,109 523,785 180
Total 3,262,496 3,078,132 3,582,878 3,132,445 ============================================ Food Handler's Permits 98,425 98,000 97,000 0 Animal Shelter Fees 1,745 2,000 295 0 Food Establishment Permits 155,184 155,000 155,000 0 Other Health Fees and Permits 44,170 51,687 33,600 0 Animal Shelter Services 12,357 15,000 8,300 0 Other Health Programs 9,214 7,900 10,000 0 Total 321,095 329,587 304,195 0 ============================================ 181
Administration is responsible for coordinating agency and community efforts to protect the public's health, prevent disease and injury, and promote healthcare services in order that all Independence residents and visitors may achieve their fullest health potential. The administration of the Health
Health
*Administered the Health Department's operational budget and
3 the City Manager informed of the department's financial standing. *Maintained a highly-trained, highly-motivated, customer-oriented 4 staff to meet the health needs of the community. *Facilitated communication and cooperation in the public health 3
at the
Health and
the
of Health and Senior Services, and participated in numerous conference calls at both the state and national level. *Monitored and assisted the Health Department divisions in 3 accomplishing their stated objectives for FY2015-16 through weekly one-on-one meetings with the individual division managers. *Administer the Health Department's operational budget and keep the 3 City Manager informed of the department's financial standing. *Maintain a highly-trained, highly-motivated, customer-oriented 4 staff to meet the health needs of the community *Facilitate communication and cooperation in the public health field 3
the
and
Impact
and
Assistant Chair
Department of Health and Senior Services, and
numerous conference calls at
the state and national level. *Monitor and assist the Health Department divisions in accomplishing 3 their stated objectives for FY2015-16 through weekly one-on-one meetings with the individual division managers. *Evaluate and improve processes, programs, and interventions 3 182
Department provides support to the department's three direct service divisions in their efforts to accomplish the department's mission and oversees the accreditation process.
kept
field
state and national level by maintaining active membership in the Missouri Association of Local Public Health Agencies (MoALPHA), Missouri Public Health Association's Board of Directors, National Association of County and City Health Officials' (NACCHO), and the Human Impact Partner's Public
Equity Cohort, served as Assistant Chair on
Director's Advisory Council for the Missouri Department
at
state
national level by maintaining active membership in the Missouri Association of Local Public Health Agencies (MoALPHA), Missouri Public Health Association's Board of Directors, National Association of County and City Health Officials' (NACCHO), and the Human
Partner's Public Health
Equity Cohort, serving as
on the Director's Advisory Council for the Missouri
participating in
both
necessary to achieve accreditation for the Health Department.
Public Health Director 1.00 1.00 1.00 1.00 Public Health Manager .00 .00 .00 1.00 Administrative Spec III 1.00 1.00 1.00 1.00 Total 2.00 2.00 2.00 3.00 ============================================ Personal Services 235,058 226,155 227,955 320,860 Other Services & Charges 9,049 9,274 9,274 7,534 Supplies 2,402 2,187 2,187 2,187 Capital Outlay 0 0 0 0 Other Expenditures 0 0 0 0 Total 246,509 237,616 239,416 330,581 ============================================ 183
The Disease Prevention & Control Division staff aims to prevent chronic illnesses by promoting healthy lifestyles. This is achieved by educating and informing the community about various health risks and benefits of making healthy choices.
*On April 30, 2016, approximately 2,000 runners and walkers attended
3 the 5th Annual Independence Park Trot 5K Run/Walk. Several community volunteers and organizations were vital to making the event a great success.
*On July 30, 2015, the Independence Health Department partnered with 3 the Independence School District to host a free Health and Wellness Expo for Independence residents. The event took place at William Chrisman High School where services such as free sports physicals, immunizations and hearing screenings were offered.
*The City of Independence successfully completed the Let's Move!
3 Cities, Towns and Counties (LMCTC) national initiative. As part of this initiative, LMCTC calls upon local elected officials to adopt long-term, sustainable and holistic approaches to supporting healthier kids and families. On September 16, 2015, First Lady Michelle Obama hosted a celebratory event at the White House to honor 52 municipalities across the country, including Independence, that obtained gold medal status in all five goal areas of the LMCTC initiative. The City of Independence received national and local media recognition for its LMCTC achievements.
*The Independence Health Department provided leadership and support 3 to the Social Service Summit Planning Committee for the second annual social service summit.
*Collaborate with other City Departments and local businesses to 3 conduct the 6th Annual Independence Park Trot 5K Run/Walk.
Animal Services Calls 5,946 6,000 Animal Services Summons Issued 907 700 Reported Animal Bites 171 150 Animals Picked Up in the Field by 2,102 1,600 Animal Services Officers
184
*Partner with the Independence School District to host a health and 3 wellness expo to provide free health resources and services to members of the community.
*Engage the community via social media platforms and print media at 2 least once per week to inform and educate citizens about public health issues.
*Collaborate with the Parks and Recreation Department to promote 3 healthy living activities and events in the community.
*Primary leadership for the Social Service Summit has been transferred to two Co-chairs elected by the Social Service Summit
Animal Services Officer .00 4.00 4.00 .00 Animal Field Services Manager .00 1.00 1.00 .00 Public Health Manager .00 .00 .00 1.00 Asst Hlth Dir, Disease Prevent .00 1.00 1.00 1.00 Chronic Dis & Epidemiology Spv .00 .00 1.00 .00 Administrative Spec II .00 1.06 1.06 .00 Administrative Spec III .00 1.00 1.00 1.00 Public Hlth Prgm Coordinator .00 .00 1.00 1.00 Total .00 8.06 10.06 4.00 ============================================ Personal Services 528,461 610,777 136,623 151,113 Other Services & Charges 539,204 570,603 5,992 3,530 Supplies 24,243 25,436 4,044 2,649 Capital Outlay 14,260 0 0 0 Other Expenditures 0 0 0 0 Total 1,106,168 1,206,816 146,659 157,292 ============================================
185
Planning Committee participants. The Co-chairs will provide future leadership and ownership of the annual event. Health Department staff will continue to serve on the planning committee.
186
The Communicable Disease and Immunization staff works to reduce communicable disease rates in our community through patient follow up, education, community collaboration, and vaccination.
*Conducted bi-annual onsite immunization audits at 52 childcare 3 centers and home daycares licensed in Independence. Records were reviewed on more than 4,717 children to assure age-appropriate immunizations were received. After review and education, all records are 100% compliant.
*Initiated and maintained partnerships between public health and the 3 University of Missouri (Kansas City and Columbia), Graceland University, and Research College of Nursing and supported experiences, including internships, for more than 10 nursing and public health students.
*Cases requiring investigation increased 42% compared to the 3 previous year. Specifically, gastrointestinal illnesses significantly increased among children under 18. Despite these increases, follow up of reportable diseases was completed within the required timeframe at least 95% of the time.
*Partner with area universities to support and expand current 3 activities, while promoting public health careers. Host at least five (5) students.
*Conduct two (2) immunization audits at all licensed childcare 3 facilities and home daycares.
*Follow up of reportable diseases is completed within the required 3 timeframe 95% of the time.
*Strengthen relationships with local healthcare providers and 3 improve reporting by contacting each provider at least two (2) times per year and making onsite visits to at least five (5) provider offices.
Communicable Disease Investigations 314 429 350 400 Immunization Record Reviews 4,759 4,706 4,800 4,800
187
*Emerging infectious diseases, such as Ebola, Zika, and avian influenza, as well as diseases that are re-emerging due to a decrease in vaccine coverage, such as Pertussis and measles are impacting public health response across the country.
Public Health Nurse .00 1.00 1.00 1.00 Com Dis & Epidemiology Supv .00 1.00 .00 .00 Public Hlth Prgm Coordinator .00 1.00 .00 .00 Total .00 3.00 1.00 1.00 ============================================ Personal Services 139,058 66,875 67,449 75,570 Other Services & Charges 2,078 2,817 2,827 1,125 Supplies 3,740 2,015 2,005 2,015 Capital Outlay 0 0 0 0 Other Expenditures 0 0 0 0 Total 144,876 71,707 72,281 78,710 ============================================
188
The City of Independence has developed municipal codes to protect the life, health, safety and welfare of its residents. The Property Maintenance Code and the Health and Safety Code set the minimum standards to which properties, facilities and individuals must conform. The Environmental Public Health Division works in partnership with the citizens and businesses of Independence to promote and maintain a safe, healthy and desirable living and working environment.
*Conducted the Neighborhood Code Compliance Program (NCCP) in two 3 areas using a division-wide team approach. *Scanned over 27,000 records allowing paper records to be destroyed 2 while meeting record retention requirements with the electronic copy. *Investigated 100% of all permitted facility complaints within two 3 business days of receipt. *Inspected 100% of all property maintenance complaints within two 3 weeks of receipt. *Provided training to students in Independence high schools on safe 4 food handling techniques. *All staff certifications have been maintained or renewed. 3 *Responded to all reported animal bites within 24 hours. 3 *Hosted two off site clinics that provided low-cost rabies 3 vaccinations and microchipping. Reactive Cases (complaint 5,433 5,674 5,400 5,600 generated) Proactive Cases 1,732 1,449 1,500 1,500 Initial Inspections 6,645 7,123 6,600 7,100 Recheck Inspections 7,088 7,304 7,000 7,300 Properties Deemed Unsafe to Occupy 172 158 150 160 Tickets Issued 938 995 850 900 Neighborhood Code Compliance 4 4 4 0 Program Day Care Facilities Inspections 119 108 110 110 Food Service Inspection 1,553 1,645 1,556 1,683 189
Lodging Inspections 49 49 50 49 Commercial Swimming Pool 86 75 78 75 Inspections Tattoo/Body Piercing Parlor 8 9 8 9 Inspections Soft-serve Inspections/Sample 110 74 71 74 Follow-up Inspections 275 187 275 202 Inspections initiated by Complaints 201 217 200 220 Food Handlers Trained 5,431 5,088 5,400 5,960 Food Managers Trained 637 624 600 704 Animal Services Calls 5,946 5,452 6,000 6,000 Animal Services Summons Issued 907 843 700 700 Reported Animal Bites 171 233 150 230 Animals Picked Up in the Field by 2,102 1,387 1,600 1,400 Animal Services Officers *Conduct initial property maintenance complaint inspections within 3 fourteen calendar days of receipt. *Inspect all permitted establishments in accordance with the 3 frequency determined by City Code and the public health priority assessment. *Expand the use of technology in the Division through enhancements 2 to the inspection process and permitting process. *Respond to all foodborne illness complaints within one business day 3 and all other complaints regarding permitted facilities within two business days. *Maintain staff certifications by providing opportunities to obtain 3 Continuing Education Unit (CEUs). *Work with Technology Services to transition to the new CityWorks 2 System. *Update and revise Chapter 3 of Independence City Code. 3 *Obtain Level II Certification for one Animal Services Officer 3 through the National Animal Control Association (NACA). *Provide low cost animal rabies vaccinations to the public by 3 conducting an on-site rabies vaccination clinic. *Respond to all reported animal bites within 24 hours. 3 Animal Services Officer .00 .00 .00 4.00 Animal Field Services Manager .00 .00 .00 1.00 Environ Public Health Supv 2.00 2.00 2.00 2.00 190
*An aging vehicle fleet is causing increased maintenance costs and increasing time the inspectors are out of service. Eight vehicles are more than 10 years old and are expected to need repairs that will exceed their value.
*Staffing levels for the number of property maintenance officers and animal services officers are below national and regional levels for jurisdictions with similar workloads.
*Staffing levels for public health investigators are below recommended U.S. Food and Drug Administration guidelines.
*Insufficient administrative support staffing has resulted in a significant reduction in efficiency and required field staff to spend additional time in the office delaying field activities.
Clerk Typist II .50 .50 .50 .50 Environmental Health Mgr .00 .00 .00 .00 Assist Hlth Dir, Environmental 1.00 1.00 1.00 1.00 Public Health Inv II 3.70 3.00 3.00 3.00 Administrative Spec II 1.00 1.00 1.00 3.02 Administrative Spec III 1.00 1.00 1.00 .00 Property Maint Officer 7.00 7.00 7.00 7.00 Total 16.20 15.50 15.50 21.52 ============================================ Personal Services 1,068,742 1,017,082 1,497,920 1,318,374 Other Services & Charges 107,985 89,162 653,778 688,120 Supplies 23,027 28,328 49,715 35,583 Capital Outlay 0 0 0 0 Other Expenditures 0 0 0 0 Total 1,199,754 1,134,572 2,201,413 2,042,077 ============================================
191
Federal, state and local grants allow the City to accomplish its overall Health Department mission. Grants especially expand our efforts in emergency preparedness, chronic disease intervention and prevention,and maternal and child health improvement.
*The Health Department was awarded $28,100 for the Public Health 3 Emergency Preparedness Ebola Grant from the Missouri Department of Health and Senior Services. Health departments from Cass County, Clay County, Jackson County, Kansas City, Platte County and Independence all participated in the application and worked together on several capabilities necessary during Ebola and other emerging disease responses.
*A new community garden was constructed at Village Heights Community 3 of Christ. Four raised beds were built to serve the surrounding neighborhood and offer greater access to healthy foods.
*The Independence Health Department was awarded $5,000 dollars from 3 the Missouri Department of Health and Senior Services to work with two local schools to improve their wellness policies and programs. Once the project deliverables are met, each school will receive a stipend of $1500 to continue work toward the improvement of the program.
*The City of Independence Health Department was awarded $145,000 from 3 the United States Department of Agriculture to increase food stamp purchases at the local farmers' market.
*The City of Independence Health Department partnered with the 2 Missouri Mavericks to promote the free "Get Healthy Independence" app used to locate parks, trials, farmers' markets and community gardens in Independence.
*Conduct three emergency response drills to exercise public health 3 emergency response capabilities.
*Host a minimum of two plant and seed distributions to provide low or 3
Nutrition, Physical Activity and 130,000 91,100 150,000 101,700 Tobacco Cessation Outreach (peopl Community Garden Meetings and 490 580 550 640 Classes (participants)
192
no cost plant and seeds to community gardeners.
*Educate local multi-unit housing complex owners and managers on 3 tobacco prevention and the dangers of secondhand smoke.
*Provide education and support to local childcare facilities on 3 childhood obesity prevention.
*Utilize three methods of advertising to promote utilization of food 3 stamps at the Independence Farmers' Market.
*On September 11, 2015, one of the two full-time public health specialists resigned resulting in a vacant position to carry out grant deliverables. Additionally, the second public health specialist requested to work part-time to accommodate her schedule to pursue a
Public Health Educator .00 .00 .00 .00 Public Health Educator PT .00 .50 .50 .50 Public Hlth Epidemiologist .00 1.00 1.00 .00 Public Hlth Response Planner .00 1.00 1.00 1.00 Administrative Spec II .00 .56 .56 .60 Public Hlth Prgm Coordinator .00 .00 .00 .00 Public Health Specialist .00 2.00 2.00 3.00 Total .00 5.06 5.06 5.10 ============================================ 278,972 274,680 403,607 276,585 Other Services & Charges 97,235 5,350 148,069 29,581 Supplies 20,533 12,748 33,016 0 Capital Outlay 12,954 0 13,235 0 Other Expenditures 0 0 0 0 Total 409,694 292,778 597,927 306,166 ============================================
193
physical therapy degree. With the reduction in force and adequate grant funds, health department staff requested an increase in the table of organization (TO) to accommodate three public health specialists to carry out required grant deliverables. With the approval of the TO increase from two to three, two new public health specialists were hired to carry out various grant deliverables related to healthy eating, active living and tobacco reduction.
194
Federal, state, and local grants allow the City to accomplish its overall Health Department mission. Grants especially expand our efforts in communicable disease management, asthma education, and childcare education.
*Provided school based influenza vaccination clinics in the 3 Independence and Fort Osage School District, with an average flu vaccination rate for students of 10% (1,843 immunizations); some schools had a rate as high as 26%. Influenza vaccinations were provided to more than 400 City employees and at multiple off-site clinics throughout the community.
*Through a grant awarded from the Healthcare Foundation of Greater 3 Kansas City, the Health Department provided the Open Airways asthma education program for third through fifth graders in the ISD's elementary schools. The grant also seeks to assure tobacco-free campuses at childcare centers and provide school staff, parent, and community education. Education was provided to more than 200 students; nurse visits and absences related to asthma decreased and knowledge increased among students and adults.
*Awarded funding from the Missouri Department of Health and Senior 3 Services to ensure preparedness during an Ebola and emerging disease response. Along with five surrounding health departments, this funding will assist in improving disease surveillance and response and in creating consistent public health messages.
*Staff has participated in various training including the Missouri 3 Immunization Conference, Bi-State Infectious Disease Conference, Association of Professionals in Infection Control and Epidemiology Annual Conference, and Mid America Immunization Coalition Symposium. Ongoing training promotes competence in job responsibilities and assures that staff is current on recommendations.
Flu Shots Given 343 3,300 2,000 3,000 Childcare Consultation Svc Provided 0 135.5 136 140 (Children & Childcare Providers) 195
*Continue a school based and community based vaccine program in 3 order to expand vaccine coverage and reduce infectious diseases. Nurses will provide at least 2,000 immunizations at a minimum of twenty (20) community or school based clinic sites.
*Ensure proper workforce education for staff to include vaccine 3 administration techniques, communicable disease, disease prevention, and other related training. Staff will attend at least five (5) trainings per year.
*Provide at least ten (10) clock hours to childcare providers in 3 areas of CPR/First Aid, immunizations, safe sleep and the health and safety topics and provide at least twenty (20) health promotion classes to children to promote healthy behaviors.
*Open Airways has been a beneficial program for the children in Independence and a successful partnership with the schools for approximately 19 years. However, funding for this program was
Public Health Nurse .00 1.00 1.27 1.25 Public Health Manager .00 .50 .50 .50 Public Hlth Epidemiologist .00 .00 .00 1.00 Total .00 1.50 1.77 2.75 ============================================ Personal Services 97,867 104,969 196,934 184,799 Other Services & Charges 4,687 820 9,792 0 Supplies 22,332 540 13,392 0 Capital Outlay 0 0 0 0 Other Expenditures 0 0 0 0 Total 124,886 106,329 220,118 184,799 ============================================
196
primarily from grant funds and that grant has expired. Staff will consider alternate means of funding and will be working with the Independence School District to adapt the program.
*Some of the communicable disease staff is relatively new and continued training is needed to ensure the understanding of state and local regulations and procedures. Additionally, current staff has minimal experience in dealing with communicable disease outbreaks and public health emergencies.
197
Federal, state and local grants allow the City to accomplish its overall Health Department mission. Grants especially expand our efforts in environmental issues and child/school health endeavors.
State Licensed Daycare Inspections 66 57 66 60 State Summer Food Service Program 15 22 22 22 Inspections Public Health Inv II .00 .30 .30 .30 Total .00 .30 .30 .30 ============================================ Personal Services 15,793 17,582 43,785 17,582 Other Services & Charges 4,880 10,732 19,411 0 Supplies 1,160 0 39,802 15,238 Capital Outlay 8,776 0 2,066 0 Other Expenditures 0 0 0 0 Total 30,609 28,314 105,064 32,820 ============================================ 198
Tim Gramling Public Works Director Admin. Specialist III Engineering Administrator Administrative Support * Assistant Dept. Director Engineering Engineer III Construction (2) Engineering Administrator Lead Maint. Spvr Street Maintenance *Properties Manager Property Management *(.63) Bldg Mtc. Worker I Maintenance Spvr. Assistant Dept. Director Operations *Program Manager Community Programs Engineer III Development *GIS Tech Admin. Specialist II Engineer III Engineer II Engineer I Engineering Tech III Bldg Mtc. Worker II Bldg Mtc. Worker III (3) Custodian * Engineering Tech III (3) Engineering Tech II *(.75) Recycle Site Operator Streets (2) Maint. Spvr. (4) Heavy Eqmt Operator (2) Asst. Foreman (11) Light Eqmt Operator * Admin Spec III Data Control Clerk (4) Cnstr. Aide Sign Shop (4) Sign & Marking Tech Garage Spvr. Central Garage (2) Auto Mechanic Fleet Parts Inventory Clk (4) Hvy Mechanic (.75) Admin Spec. II *(3) Engineering Administrator * (3) Construction Inspector * Engineering Tech III *Custodian *(2) Bldg Mtc. Worker II *(5.89) Cnstr. Aide *(2) Maint. Spvr *(2) Light Eqmt Operator * (4) Heavy Eqmt Operator * Auto Mechanic *Unfunded Position Engineering Tech III Maint. Spvr. 199
Public Works
2016-17Operating Budget Public Works

Appropriations by Type: ExpenditureActualOriginalRevisedProposed Type2014-152015-162015-162016-17 Personal Ser.3,946,027 $ 3,995,922 $ 4,009,780 $ 3,832,753 $ Other Services1,791,341 1,869,153 1,867,223 2,070,023 Supplies1,595,852 2,017,578 2,017,165 1,526,848 Capital Outlay550,502 605,522 607,865 613,024 Other - - -Total 7,883,722 $ 8,488,175 $ 8,502,033 $ 8,042,648 $ Historical Comparison: ActualActualActualActualBudgetBudget 2011-122012-132013-142014-152015-162016-17 Employees: Full Time Equiv. 90.65 93.65 94.02 94.02 94.02 94.02 Amount by Fund: General Fund 5,126,539 $ 5,398,741 $ 5,550,244 $ 5,616,443 $ 5,812,067 $ 5,419,548 $ Central Garage Fund2,151,050 2,096,696 2,183,317 1,971,061 2,316,090 1,970,467 Street Improv. Sales- 192,166 300,416 205,370 265,323 563,727 Sewer Fund 75,518 54,153 88,314 90,848 94,695 88,906 Total All Funds7,353,107 $ 7,741,756 $ 8,122,291 $ 7,883,722 $ 8,488,175 $ 8,042,648 $ Comparative Ratios: Per Capita 62.94 $ 66.27 $ 69.30 $ 67.23 $ 72.40 $ 68.60 $ Per Household 150.86 $ 163.90 $ 164.48 $ 146.04 $ 155.63 $ 147.46 $ 47.7% 25.7% 19.0% 7.6%
Personal Ser. Other Services Supplies Capital Outlay 0 3,000 6,000 9,000 12,000 15,000 2011-122012-132013-142014-152015-162016-17 $7,353 $7,742 $8,122 $7,884 $8,488 $8,043 Dollars (1,000's) Fiscal Year 200
2016‐17 Budget
Provide professional services for public safety and convenience; design, acquire rights-of-way, administer contracts, review building applications, issue development, construction, blasting, erosion control permits and flood plain management. Maintain records of City-owned property, investigate and review citizen requests, provide inspections for construction of private development, and provide building maintenance and custodial services for most City-owned buildings, as well as manage right-of-way and erosion control of building sites. Maintain approximately 566 miles of streets through patching, surfacing, shoulder operations, snow removal, signs and roadside maintenance. Make repairs to bridges and crossroad storm structures. Maintain a large portion of City vehicles. Manage two recycling centers and operate the Drop-Off Depot program.
Full Time Positions 90.75 89.00 89.00 89.63 Part Time Positions 3.27 5.02 5.02 4.39 Total 94.02 94.02 94.02 94.02 ============================================ 5001Public Works Administration 443,378 344,903 345,645 350,132 5011Public Works Engineering 459,851 391,321 396,758 204,553 5013Public Works - Admin. Support 293,011 284,421 288,048 349,252 5015Property Management 745,914 728,952 733,516 723,550 5030Public Works Engineering-Sewer 90,848 94,695 94,695 88,906 5111Street Maintenance 3,674,289 4,062,470 4,061,958 3,792,061 5112Street Maint.-Sales Tax Funds 205,370 265,323 265,323 563,727 5121Central Garage 1,971,061 2,316,090 2,316,090 1,970,467 Total 7,883,722 8,488,175 8,502,033 8,042,648 ============================================ 201
General Fund 5,616,443 5,812,067 5,825,925 5,419,548 Sanitary Sewer Fund 90,848 94,695 94,695 88,906 Street Improv. Sales Tax Fund 205,370 265,323 265,323 563,727 Central Garage Fund 1,971,061 2,316,090 2,316,090 1,970,467 Total 7,883,722 8,488,175 8,502,033 8,042,648 ============================================ Construction Permits - Public Works 225,391 210,000 165,000 0 Total 225,391 210,000 165,000 0 ============================================ 202
This division provides Public Works services through the supervision and administration of the Public Works Department. This includes support and response to the City Manager and City Council in all areas of Public Works. These areas include real estate, design, construction, inspection, street maintenance, rights-of-way, traffic, fleet maintenance and facility maintenance.
*Managed the easement acquisition and provided construction contract 1 management for Stormwater Sales Tax-funded projects and the Sanitary Sewer Collection System projects. *Managed the Street Sales Tax Program and funded projects. 1 *Continued implementation of the Cityworks asset management system. 1 *Represented the City and Public Works Department with other agencies 1 such as MoDOT, Jackson County, FEMA and the Mid-America Regional Council. Number of employee accidents 7 12 7 7 Project schedules met 95 95 95 95 (%) *Manage the easement acquisition and provide construction contract 1 management for Storm Water Sales Tax-funded projects and the Sanitary Sewer Collection System projects. *Manage the Street Sales Tax Program and funded projects. 1 *Represent the City and Public Works Department with other agencies 1 such as MoDOT, Jackson County, FEMA and the Mid-America Regional Council. *Update design standards and specifications, and department codes. 4 203
*Continuing to provide quality services to the public with reduced resources.
Public Works Director 1.00 1.00 1.00 1.00 Clerk Typist II 1.00 .00 .00 .00 Administrative Spec II .00 1.00 1.00 1.00 Administrative Spec III 1.00 1.00 1.00 1.00 Total 3.00 3.00 3.00 3.00 ============================================ Personal Services 399,930 292,905 295,358 306,183 Other Services & Charges 15,781 30,964 29,253 27,862 Supplies 9,635 21,034 21,034 16,087 Capital Outlay 18,032 0 0 0 Other Expenditures 0 0 0 0 Total 443,378 344,903 345,645 350,132 ============================================
204
This division provides Public Works services through the following work elements: plan review, design, investigations, studies, contract
inspections,
and traffic engineering. *Completed construction management for federally-funded STP 3 transportation projects including 24 Highway Sidewalk Improvements and Truman Road Streetscape Phase II. *Completed construction management for the Street Sales Tax-funded 3 Asphalt Overlay Program, Concrete Overlay Program, and the 24 Highway and Blue Mills Road Intersection Improvements project. *Completed construction management for several Storm Water Sales 3 Tax-funded storm draining projects including Lakeview Farm and 14th & Arlington. *Completed construction management for several Sanitary Sewer Fund 3 projects including Burr Oak West and 33rd Terrace Sanitary Sewer Improvements. *Managed engineering design of several federally-funded transportation 3 projects including Truman and M-78 Intersection Realignment, 39th & Noland Intersection Improvements, Blue Ridge Sidewalks to Nativity School and Crysler Complete Streets Improvements. *Managed engineering design of several storm drainage and sanitary 3 sewer projects including Crackerneck Creek Crossing, 36th & Poplar Storm Drainage, 18th & Evanston Storm Drainage and Burr Oak East Sanitary Sewer. New Street Sales Tax Program 43.0 10.0 65.0 75.0 Completion (%) In-House Design Project Completion 10.0 10.0 10.0 10.0 % of Total Project Value Complete *Construction management of
Street Sales Tax Asphalt Overlay 3
*Construction
and
sanitary sewer
Ridge Sidewalks to Nativity School,
& Noland Intersection Improvements, Truman & M-78 Intersection Realignment, Crackerneck Creek Crossing, 36th & Poplar 205
specifications,
permits
the 2016
Program.
management of several transportation, storm drainage
3
projects including Blue
39th
Storm Drainage Improvements, Drumm & Crane Storm Drainage Improvements and Burr Oak East Sanitary Sewer Improvements. *Engineering design for several transportation, storm drainage and 3 sanitary sewer projects including Noland & Fair Intersection Improvements, Englewood Phase 3 Sidewalk Improvements, Drumm & Crane Storm Drainage Improvements and the 2016 Neighborhood Sanitary Sewer Improvements. *Continue to work with Police Department, MoDOT, MARC and citizens of 3 Independence on traffic safety issues and improvements. *Continue to provide engineering review and construction management 3 services for land development, building permit applications and developer built improvements. Asst Dept Director 1.00 1.00 1.00 1.00 Program Manager 1.00 1.00 1.00 1.00 Engineer I 1.00 1.00 1.00 1.00 Engineering Administrator 4.00 5.00 5.00 5.00 Engineer III 3.00 3.00 3.00 3.00 Contract Manager 1.00 .00 .00 .00 Construction Inspector 3.00 3.00 3.00 3.00 Engineering Tech II 1.00 1.00 1.00 .00 Engineering Tech III 3.00 3.00 3.00 3.00 GIS Technician 1.00 1.00 1.00 1.00 Total 19.00 19.00 19.00 18.00 ============================================ Personal Services 369,183 284,240 290,008 104,821 Other Services & Charges 52,552 82,014 80,029 82,230 Supplies 22,518 25,067 24,654 17,502 Capital Outlay 15,598 0 2,067 0 Other Expenditures 0 0 0 0 Total 459,851 391,321 396,758 204,553 ============================================ 206
*Continuing to provide quality services to the public with reduced resources.
207
The Administrative Support Division is responsible for land acquisition for public improvements, enforcement of Public Works rights-of-way and code provisions,tracking project reimbursements on construction projects, recycling center operations and coordinating solid waste and recycling initiatives for the Department.
*Successfully completed acquisition on over 75 parcels representing 12 1 separate Capital Improvement Projects.
*Continued promotion of recycling and reuse activities through the regional Solid Waste District and Citizen Action Committee. Diversion rates of materials from area landfills increased to over 23%, up from 16% the previous year.
*Created
Acquisition Within Schedule 99.0 95.0 95.0 95.0 (%) Quarterly Haulers Report on 4 4 4 4 Recycling and Solid Waste Monthly Project Reimbursements 100 95 95 95 Within Schedule (%) *Continue
*Coordinate
1
*Continue
1,2
208
*Oversaw the work on streets and right-of-way on over 400 permits and 1 2,700 inspections. *Managed the inspections and reporting for more than 200 erosion 1 control and grading permits. *Completed Phase 1 of the data migration from Cartegraph to 2 Cityworks. *Successfully integrated Action Center Requests with Cityworks and 2 improved communication between residents and City staff.
an online presence for the department to improve social 2 interaction and increase information distribution to residents.
to meet acquisition goals for all public improvement 1 projects and improve communication standards for outside consultants.
project reimbursements for TIF and federal reimbursement
projects to meet a four-week timeframe once reports are generated.
education of residents and businesses, and increase
reporting efforts to capture information regarding solid waste
collection, recycling and diversion of materials from landfills.
*Complete Phase II of the data migration from Cartegraph to Cityworks. 2
*Continuing to provide quality services to the public with reduced resources.
Asst Dept Director 1.00 1.00 1.00 1.00 Engineering Administrator .00 1.00 1.00 1.00 Engineering Tech II 2.00 2.00 2.00 3.00 Engineering Tech III 2.00 1.00 1.00 1.00 Recycling Site Operator .75 .75 .75 .75 Total 5.75 5.75 5.75 6.75 ============================================ Personal Services 288,388 282,896 285,613 347,727 Other Services & Charges 2,200 1,200 2,110 1,200 Supplies 460 325 325 325 Capital Outlay 1,963 0 0 0 Other Expenditures 0 0 0 0 Total 293,011 284,421 288,048 349,252 ============================================
209
The Property Management Division is responsible for maintenance and repair of existing City facilities as well as the design and construction management of new construction projects and remodeling projects. It maintains and upgrades the various facilities of the City in such a manner as to provide the citizens, as well as the employees, a safe, functional, accessible and comfortable environment. These services are provided through the integration of the principles of project management, along with the skilled trades of carpentry, electrical, plumbing, HVAC maintenance and custodial services.
*Completed S2 card access system in City Hall. 1 *Completed remodel of Police locker room and restroom facility. 1 Response to Work Orders Within 70.0 70.0 75.0 75.0 Planned Timeframe (%) Construction Projects Managed 4 2 3 3 *Continue installation of S2 card access system as funds are 1 available. *Continue the expansion of the Cityworks software program with 2 maintenance information for City buildings. *Establish and maintain HVAC, electrical, plumbing and structural 1 systems. Building Maint Worker III 1.00 1.00 1.00 1.00 Building Maintenance Worker II 2.00 2.00 3.00 3.00 Properties Manager 1.00 1.00 1.00 1.00 Maintenance Supervisor 1.00 1.00 1.00 1.00 210
*Continuing to provide quality services to the public with reduced resources.
*Due to staffing vacancies, the majority of plumbing, electrical and carpentry jobs are being performed by contractors.
Custodian 4.00 4.00 4.00 4.00 Building Maint Wk I 1.63 1.63 .63 .63 Total 10.63 10.63 10.63 10.63 ============================================ Personal Services 227,434 341,040 341,757 335,177 Other Services & Charges 446,395 305,622 309,469 306,906 Supplies 72,085 82,290 82,290 81,467 Capital Outlay 0 0 0 0 Other Expenditures 0 0 0 0 Total 745,914 728,952 733,516 723,550 ============================================
211
This cost center accounts for Public Works Engineering costs that are funded out of the Sanitary Sewer Fund. See Public Works Engineering Cost Center 5011 for applicable Accomplishments, Objectives and Performance Indicators.
Engineer II 1.00 1.00 1.00 1.00 Total 1.00 1.00 1.00 1.00 ============================================ Personal Services 90,848 94,695 94,695 88,906 Other Services & Charges 0 0 0 0 Supplies 0 0 0 0 Capital Outlay 0 0 0 0 Other Expenditures 0 0 0 0 Total 90,848 94,695 94,695 88,906 ============================================ 212
Street Maintenance is responsible for maintaining 566 miles of City streets and 38 bridge structures. Maintenance includes crack sealing, overlaying, pothole repairs, large street repairs, road base repairs, sweeping, trash and brush clean up, placement of barricades, roadside mowing (includes contract mowing), removal of dead trees in the right-of-way and on City properties, maintenance of equipment, removal of snow and ice, and the maintenance of sand and salt stockpiles. Signs and markings maintenance includes painting of center and edge lines, crosswalks, school crossing stop bars and turn lanes, City parking lots, installation and maintenance of street name signs, traffic control signs, advisory signs, hazard signs, and installation and maintenance of guardrails. Street Maintenance also coordinates nine Drop-Off Depot events per year and assists with the training for Commercial Drivers' Licenses (CDL).
*Street Sweeping: 1,649.5 miles were swept and 1,669 cubic yards of 3 debris were picked up. In addition, 27 intersections were swept with a Bobcat sweeper. *Drop-Off Depot: Nine successful events were held, serving 6,006 3 vehicles. *Community Service Workers: The community service workers provided 3 1,454 hours of work throughout the year. *Snow Removal: Provided snow removal response for 7 snow events with 3 6.75 inches of snow. *Traffic Signs: Assembled 1,012 traffic signs, installed 121 new 3 traffic signs and posts; serviced 701 signs from federal upgrade program; serviced 390 signs from citizen notifications, assembled and installed 226 non-traffic signs and installed 12 changeable message boards. *Traffic Painting: Painted 47.9 miles of center and edge lines and 660 3 crosswalks and stop bars; 238 transverse markings and 102 parking stalls. *Traffic Barricades: 106 events - placed and recovered 2,402 3 barricades and 155 cones for special events. *Potholes: Responded to 109 pothole hotline requests, 302 service 3 requests and 57 large street repairs, resulting in 3,280 potholes being patched. *Mowing: 44 curb miles mowed every 10 days; 5 facility grounds mowed 3 every 7 days; 77 City-owned lots and green spaces, and 88 lane-miles of roadside are mowed three times per year. *Dangerous Trees: Removed 106 dangerous trees. 3 *Sight Obstructions: Cleared out 74 sight problems. 3 *Created Salt Brine Pre-treatment Program and applied salt brine two 3 times during winter weather events. 213
*Pothole Patching: Provide a safe and smooth driving surface to reduce 3 the possibility of property damage and personal injury by patching within 24 working hours of notification.
*Sweeping: The goal is to provide two shifts for sweeping; sweeping 3 programs are divided into four districts which accounts for 566 miles of streets. As many miles as possible will be swept every year on a 2-week continuous rotating basis from district to district, beginning with requests received, then moving into residential neighborhoods,plus a set schedule that sweeps The Square and major arterial streets. These areas are swept weekly when weather permits and temperatures are above 35 degrees.
*Snow Removal: Provide a safe, effective snow and ice control program 3 for City streets which will enable public use during inclement weather conditions.
*Signage: Provide legible directional signage that allows the public 3 to travel to their destination in a safe manner. The program allows for inspection and replacement of 5,000 signs per year.
*Striping: Road markings of all types are very important in 3 controlling the position of moving traffic. The objective is to paint 50 miles of center and edge lines, 150 crosswalks and 300 stop bars.
*Barricades: To place and recover barricades as needed for such 3 activities as block parties, 5K races, Fourth of July, Halloween Parade, Mayor's Christmas Tree Lighting, Santa-Cali-Gon and other Square and Chamber events. The goal is placement of barricades 24 hours prior to an event and removal within 36 hours of completion of the event.
*Roadside Mowing: Mowing street medians, islands and City-owned 3 properties in a timely manner in order to maintain areas.
*Bridge Maintenance Program: Manage a Bridge Maintenance program for 3
Street Condition 80 75 80 75 (PCI Average) Right-of-Way Maintenance 100 82 100 91 (Service Requests) Sweeping and Median Cleaning 10 65 100 38 (Service Requests) Drainage 8 13 5 23 (Service Requests) Snow Removal 115 80 110 60 (Service Requests) Street Signs Maintained 10.0 11.5 10.0 10.0 (Percentage)
214
the 38 bridge structures in the City utilizing the Cityworks program. *Salt Brine Program: Continue implementation of Salt Brine program 3 during winter weather months.
*Replacing aging equipment.
*Continuing to provide quality services to the public with reduced resources.
Property:
3 *Increase efforts to address
and trash in street right-of-way. 1 Sign & Marking Technician 4.00 4.00 4.00 4.00 Data Control Clerk 1.00 1.00 1.00 1.00 Heavy Equipment Operator 8.00 8.00 8.00 8.00 Light Equipment Operator 13.00 13.00 13.00 13.00 Lead Maintenance Supervisor 1.00 1.00 1.00 1.00 Assistant Foreman 2.00 2.00 2.00 2.00 Maintenance Supervisor 5.00 5.00 5.00 5.00 Construction Aide 6.89 6.89 6.89 6.89 Administrative Spec III 1.00 1.00 1.00 1.00 Total 41.89 41.89 41.89 41.89 ============================================ Personal Services 1,808,928 1,885,928 1,888,131 1,846,491 Other Services & Charges 892,699 1,010,915 1,007,924 995,128 Supplies 594,125 700,091 700,091 606,418 Capital Outlay 378,537 465,536 465,812 344,024 Other Expenditures 0 0 0 0 Total 3,674,289 4,062,470 4,061,958 3,792,061 ============================================
*Massman
Rework property to better fit use needs.
weeds
215
This cost center is funded out of the Street Sales Tax. It provides for staffing, equipment and materials for maintenance operations on the expanded street system. With the construction of Jackson Drive and Little Blue Parkway the lane miles and right-of-way requiring City maintenance have increased. Maintenance will include pavement maintenance, right-of-way mowing and snow plowing. See the Public Works Street Maintenance cost center (5111) for applicable Accomplishments, Objectives and Performance Indicators.
Construction Aide 3.00 3.00 3.00 3.00 Total 3.00 3.00 3.00 3.00 ============================================ Personal Services 87,680 145,323 145,323 113,727 Other Services & Charges 0 0 0 200,000 Supplies 0 0 0 0 Capital Outlay 117,690 120,000 120,000 250,000 Other Expenditures 0 0 0 0 Total 205,370 265,323 265,323 563,727 ============================================ 216
Central Garage is responsible for maintaining the City's fleet comprised of 593 units of rolling stock. It is also responsible for vehicle and equipment acquisition, repair, preventative maintenance, and fuel management for vehicles used in law enforcement, fire suppression and prevention, health, parks, public works, and other government activities. It is also responsible for fabrication and welding requests by all City departments. Central Garage maintains a wide range of automotive parts. It also maintains two fuel sites within the City.
*Aided in the purchase and set up of one box van and one snow plow. 3 *Preventative maintenance on Police and Fire vehicles, light trucks 3 and cars included 437 lube and oil changes, servicing of
transmissions, 135 brake jobs, 315 tire replacements and
shuttles. *Kept inventory parts to a minimum to keep inventory costs down. 1 *Utilized customer satisfaction survey. 1 *Performed 90% of preventative maintenance on equipment before being 1 overdue for service. *Weekly meetings held with employees to discuss customer service, 1 operations, schedules, budgets and work order costs. *One auto and two heavy equipment mechanics attended air brake class. 1 *One mechanic and one supervisor re-certified as ASE Master 1 Technicians. *Added shop computers to aid in diagnosis and repair of City 1 equipment. *Continued to provide Emergency Vehicle Technician training. 1 *Upgraded fuel system and sites. 2 *Reorganized shop, parts area and office. 3 *Purged inventory of outdated parts. 1 Mechanic Hours Billed 90.0 85.0 90.0 85.0 (%) Preventative Maintenance Work 90.0 90.0 90.0 90.0 Orders Completed Within 500 Miles Road Service Calls 180 190 180 190 (Each) 217
146
91
*Maintaining repairs of an aging fleet.
*Integrating Fire Department fleet repair with Central Garage.
*Continuing to provide quality services to the public with reduced resources.
*Maintain billable mechanic rates of 80%. 1 *Continue to provide Emergency Vehicle Technician training. 1 *Upgrade equipment. 1 *Upgrade fleet management software. 2 *Upgrade service vehicle to meet on-site service needs. 1 Heavy Equipment Mechanic 4.00 4.00 4.00 4.00 Auto Mechanic 3.00 3.00 3.00 3.00 Fleet Parts Inventory Clerk 1.00 1.00 1.00 1.00 Administrative Spec II .75 .75 .75 .75 Garage Supervisor 1.00 1.00 1.00 1.00 Total 9.75 9.75 9.75 9.75 ============================================ Personal Services 673,636 668,895 668,895 689,721 Other Services & Charges 381,714 438,438 438,438 456,697 Supplies 897,029 1,188,771 1,188,771 805,049 Capital Outlay 18,682 19,986 19,986 19,000 Other Expenditures 0 0 0 0 Total 1,971,061 2,316,090 2,316,090 1,970,467 ============================================
218
Parks|Recreation|Tourism
Parks|Recreation|Tourism Director
Urfer
Eric
(.5) Admin. Specialist III Turf & Fac. Maint Recreation Program/Fclty. Supervisor Sermon/Truman Mem. Bldg Recreation Program/Fclty. Supervisor Senior Adult Srv./ Palmer Recreation Specialist Sports Admin Security & Insp. (2) Maint. Aide (.50) Parks and Recreation Technician Manager Parks Maint. Admin. Recreation Program/Fclty. Supervisor Sports/Aquatics/Inclusion Recreation Specialist Seasonal Maint. Worker Senior Prgm. Spec. (.61) Admin. Spec II (.7) Nutrition Site Aide Parks Horticulturist
.50 Parks and Recreation Tech. (3.89) Sermon Center Attendant (2.29) Truman Mem. Attendant Recreation Program/Fclty. Supervisor George Owens/Family Prog. Supv. Park Naturalist (.91) Seasonal Maint. Worker (.55) Seasonal Maint Worker (1.45) Center Attendant (1.83) Center Attendant *(.3) Kitchen Aide Manager Tourism Administration (2) Visitor Exp. Specialist Tourism Specialist Museum Admnr/Curator Natnl Frontr Trails Museum Events/Education Program Manager Museum Operations Manager Museum Coord. Museum Attendant (2.88) Season Maint. Worker (2.5) Maint. Mechanics (4) Light Equip. Operator Asst. Foreman Light Equip Operator Asst. Foreman (3) Light Equip. Operator Maint. Aide (2.34) Seasonal Maint. Worker Cemetery Maint. *(.5) Cemetery Sexton (2) Maintenance Aide (.58) Seasonal Maint. Aide (.5) Admin. Specialist III (.5) Historic Preservation Manager (.61) Admin. Specialist II (2) Maint Supv. Historic Sites (2) Maint Aide (.5) Maint. Mechanic Tourism Sales/Services Rep. Tourism Sales and Services *Staff Asst. – Volunteer Coord. *Unfunded Position *Maint. Aide 219
2016-17Operating Budget

Parks|Recreation|Tourism
2016‐17 Budget
Appropriations by Type: ExpenditureActualOriginalRevisedAdopted Type2014-152015-162015-162016-17 Personal Ser.2,958,795 $ 3,313,670 $ 3,319,591 $ 3,502,242 $ Other Services2,422,815 2,240,873 2,235,977 2,318,960 Supplies270,993 358,204 357,354 331,199 Capital Outlay24,600 153,797 161,297 1,000 Other - - -Total 5,677,203 $ 6,066,544 $ 6,074,219 $ 6,153,401 $ Historical Comparison: ActualActualActualActualBudgetBudget 2011-122012-132013-142014-152015-162016-17 Employees: Full Time Equiv. 55.12 55.56 58.21 61.89 67.89 67.74 Amount by Fund: General Fund 2,015,219 $ 1,570,832 $ 1,494,014 $ 1,585,448 $ 1,634,988 $ 1,490,728 $ Tourism1,734,251 1,551,913 1,482,763 1,620,110 1,851,593 1,805,471 Parks Improv. Sales 2,469,920 2,374,601 2,440,528 2,471,645 2,579,963 2,857,202 Total All Funds6,219,390 $ 5,497,346 $ 5,417,305 $ 5,677,203 $ 6,066,544 $ 6,153,401 $ Comparative Ratios: Per Capita 53.23 $ 47.05 $ 46.22 $ 48.41 $ 51.74 $ 52.49 $ Per Household 127.60 $ 116.38 $ 109.70 $ 105.17 $ 111.23 $ 112.82 $ 56.9% 37.7% 5.4% 0.0%
Personal Ser. Other Services Supplies Capital Outlay 0 1,500 3,000 4,500 6,000 7,500 2011-122012-132013-142014-152015-162016-17 $6,219 $5,497 $5,417 $5,677 $6,067 $6,153 Dollars (1,000's) Fiscal Year 220
The Independence Parks, Recreation and Tourism Department strives to provide quality leisure, recreational and educational opportunities for visitors to and residents of Independence by providing quality historic sites; parks; recreation facilities; recreational, historical and educational programs; special events; tour packages; meeting opportunities; and, related services. The Department also works with a number of affiliated Boards, Commissions, associations, organizations, and volunteer groups to promote the City of Independence as an attractive place to visit and reside, attract new and repeat visitors, increase community awareness and bolster participation.
Full Time Positions 34.00 34.00 34.00 45.50 Part Time Positions 18.55 19.71 19.71 22.24 Total 52.55 53.71 53.71 67.74 ============================================ 6001Parks & Rec. Administration 261,715 269,540 271,434 164,673 6011Park Maintenance Admin. 122,409 58,751 59,493 57,205 6012Turf Facilities Maintenance 611,556 659,804 661,508 687,314 6022Senior Adult Services 140,306 143,779 144,760 115,733 6028Roger T. Sermon Community Ctr. 212,816 259,341 259,941 258,794 6029George Owens Nature Park 135,544 112,167 112,167 84,979 6031Cemetery Maintenance 101,102 131,606 131,606 122,030 6041Park Maint. - Security & Insp. 701,433 687,249 687,249 868,160 6042Rec. Fac.-Truman Memorial Bldg 269,622 314,945 314,945 337,550 6043Rec. Fac.-Palmer Sr. Adult Ctr 187,397 214,334 216,088 218,383 6044Family Recreation Programs 199,416 164,853 164,853 215,375 6045Adventure Oasis Water Park 568,649 558,602 558,602 576,706 6046Sports Administration 545,128 639,980 639,980 641,028 6061Tourism Administration 1,025,633 902,005 902,005 848,412 6062Nat'l Frontier Trails Museum 77,806 495,194 495,194 529,062 6063Historic Sites 195,872 172,263 172,263 161,825 221
6064Tourism Sales & Services 320,799 282,131 282,131 266,172 Total 5,677,203 6,066,544 6,074,219 6,153,401 ============================================ General Fund 1,585,448 1,634,988 1,640,909 1,490,728 Parks Improv. Sales Tax Fund 2,471,645 2,579,963 2,581,717 2,857,202 Tourism Fund 1,620,110 1,851,593 1,851,593 1,805,471 Total 5,677,203 6,066,544 6,074,219 6,153,401 ============================================ Program Fees 29,716 48,000 30,576 35,120 Park Concessions 2,445 4,000 0 0 Center Fees/Club Memberships 47,561 80,935 57,819 58,000 Facility Rentals 60,473 52,000 53,575 56,000 Cemetery Charges 64,431 46,000 74,053 63,250 Program Fees - Sales Tax Fund 38,200 50,000 38,480 40,400 Concessions - Sales Tax Fund 47,388 32,000 19,300 20,000 Water Park Fees/Memberships - Sales 308,969 440,000 315,148 321,451 Tax Fund Center Fees/Club Memberships - 8,012 6,000 6,725 5,800 Sales Tax Fund Facility Rentals - Sales Tax Fund 40,480 48,000 26,550 30,500 Transient Guest Taxes 1,618,246 1,800,000 1,831,402 1,810,000 NFTM Center Admissions 41,777 40,000 40,000 40,000 Total 2,307,698 2,646,935 2,493,628 2,480,521 ============================================ 222
Parks, Recreation & Tourism Administration oversees the various divisions within the Parks, Recreation & Tourism Department to promote the City of Independence as a quality place to visit and reside by providing quality historic sites, parks, recreation facilities, tour packages and various types of programs. The Department actively works with various Boards, Commissions and organizations, associations, non-profits and the private sector to further enhance the City's Tourism, Parks, and Recreation systems.
*Coordinated the response to several citywide surveys by directing 2 program expansion, facility enhancements and adjusted hours of operation.
*Oversaw the expansion of citizen driven technology enhancements by 2 making wifi available in two recreation centers, implementing the reach marketing and mobile application, and reintroducing on-line registration for programs and services.
*Directed the completion of
for parks 3 and
*Created and administered the Interim Management Plan for the Tourism 2 Department. *Successfully administered the first full year of the Arena Spectra 4 Venue Management contract. *Coordinate the consolidation of the Parks, Recreation and Tourism 2 Departments *Complete the fundraising for the McCoy Park Inclusive Play Project 3 *Facilitate the management of the first year of the new IBEW contract 4 for Parks and Recreation Parks and Recreation Director 1.00 1.00 1.00 1.00 Parks & Recreation Technician .00 .00 .50 .50 Staff Asst.-Volunteer Coord. .80 .80 .80 .80 Administrative Spec II .50 .50 .00 .00 Administrative Spec III 1.00 1.00 1.00 1.00 Total 3.30 3.30 3.30 3.30 ============================================ 223
several key capital projects
recreation.
Personal Services 255,191 255,536 257,430 152,919 Other Services & Charges 3,880 10,062 10,062 7,812 Supplies 2,086 3,942 3,942 3,942 Capital Outlay 558 0 0 0 Other Expenditures 0 0 0 0 Total 261,715 269,540 271,434 164,673 ============================================ 224
Park Maintenance Division is responsible for daily park maintenance operations. This division schedules work projects, purchases materials, implements repairs, and responds to inquiries from the public and other City-affiliated departments.
*Coordinated the Santa Fe Restroom Renovation Project. 3 *Adjusted the first year of the mowing rotation plan as needed. 1 *Reorganized Park administrative structure. 2 *Consolidated equipment inventory. 2 *Received Tree City USA recognition. 1 Numbers of park sites maintained 46 46 46 46 Number of park acres maintained 843 843 843 843 Number of full-time staff 21.5 21 21 21 supervised *Coordinate the installation of outdoor fitness equipment at Clothier 3 Park. *Coordinate the final phase of development of Overton Park. 3 *Coordinate surplus of green space property to US Army. 4 *Coordinate the third phase of the outdoor sport court repair 3 project. *Revise and implement new employee and work safety program. 3 *Implement first year of new IBEW contract for Parks staff. 4 Parks & Grounds Manager 1.00 .50 .50 .50 Total 1.00 .50 .50 .50 ============================================ 225
Personal Services 42,361 42,376 43,118 43,761 Other Services & Charges 70,702 5,482 5,982 3,150 Supplies 9,346 10,893 10,393 10,294 Capital Outlay 0 0 0 0 Other Expenditures 0 0 0 0 Total 122,409 58,751 59,493 57,205 ============================================ 226
The Turf and Facilities Division is responsible for daily park maintenance operations, including: the care and cleaning of picnic shelters and park restroom facilities, athletic fields and landscape beds, snow removal, and mowing and trimming all City parks and related facilities.
*Completed Davis Park Ballfield renovation project. 3 *Completed landscape enhancements at Polly's Pop Greenspace. 3 *Initiated infield revitalization project for Crysler, Mill Creek, 3 and Santa Fe. *Completed the landscape boulder installation project at various park 1 sites. Number of park sites maintained 46 46 46 46 Number of park acres maintained 843 843 843 843 Number of picnic shelters 17 17 17 17 maintained *Explore the potential of surplusing and/or alternative uses of 4 various greenspaces and underutilized lands. *Enhance park and facility appearance by removing unattended 1 landscaping and obsolete infrastructure. *Implement the first year of historic site in-house maintenance 3 program. Maintenance Aide 2.00 2.00 2.00 2.00 Light Equipment Operator 2.00 2.00 3.00 3.00 Assistant Foreman 1.00 1.00 1.00 1.00 Maintenance Supervisor 2.00 2.00 2.00 2.00 227
Auto Mechanic .50 .50 .50 .00 Parks Horticulturalist 1.00 1.00 1.00 1.00 Seasonal Maintenance Wkr 2.34 2.34 2.34 2.34 Total 10.84 10.84 11.84 11.34 ============================================ Personal Services 500,133 533,194 534,898 541,037 Other Services & Charges 58,422 62,618 62,618 101,788 Supplies 46,901 63,992 63,992 44,489 Capital Outlay 6,100 0 0 0 Other Expenditures 0 0 0 0 Total 611,556 659,804 661,508 687,314 ============================================ 228
This cost center provides ongoing programs for resident senior adults and individuals with disabilities. These programs focus on, but are not limited to, nutritious lunches, nutrition and consumer education, health programs, social integration and assistance with support services.
*Awarded contract to Ottawa Bus Company to secure travel planning and 3 escorting services for the Senior Travel Program, freeing up staff resources to maintain and develop other new programs.
*Added several new programs based on the interest of the participants. 3 New programs included: Pre-lunch Stretching, Coloring is Not Just for Kids, Home I.D. and Personal Security.
*Older Americans Act funding allowed for an increase of meal service 3 to homebound residents. Approximately 50 new clients were added.
*Managed the transition period between retiring Senior Program 3 Specialist and new staff member.
*Eliminate meal waste percentages in the Nutrition Site Program by 3 researching and presenting innovative ways to Mid-America Regional Council Aging Services to reach this objective.
*Continue to enhance Nutrition Site participant experience by 3 adjusting/improving supplemental offerings in response to customer feedback.
*Manage the implementation of the first year of the IBEW contract for 4 represented Recreation staff.
Number of senior
offered 26 27 30 35 Number of on-site meals served 19,161 20,068 20,800 22,000 Number of home bound meals 19,469 19,879 20,300 22,000 Number of nutrition site programs 52 60 60 70 Number of outreach programs 7 3 5 8
trips
229
Nutrition Site Aide .75 .70 .70 .70 Recreation Prog/Fac Supv 1.00 1.00 1.00 .50 Senior's Program Spec 1.00 1.00 1.00 1.00 Seasonal Recreation Wkr .00 .30 .00 .00 Kitchen Aide .00 .00 .30 .30 Total 2.75 3.00 3.00 2.50 ============================================ Personal Services 132,926 132,239 133,220 104,643 Other Services & Charges 2,118 4,540 4,540 4,090 Supplies 5,262 7,000 7,000 7,000 Capital Outlay 0 0 0 0 Other Expenditures 0 0 0 0 Total 140,306 143,779 144,760 115,733 ============================================ 230
The Roger T. Sermon Community Center, through recent renovations has become an affordable and modern option for a variety of services. The center provides: health and physical fitness opportunities; rental options
birthday parties and
as well as
weddings,
cultural arts through theatre performances. *Completed third phase of Sermon Renovation. 3 *Extended facility hours and added early morning programs. 3 *Updated user group agreements. 2 *Added additional custodial hours to meet facility needs. 3 *Installed security cameras in common areas and workout rooms to 3 improve facility management and monitoring. *Installed three television monitors through the Reach Marketing 2 System to promote programs and provide important facility information to visitors to the Sermon Center. *Working with Park Maintenance, Public Works, a contractor and 2 Technology Services, installation of wifi for use by facility members, staff and rental groups was completed. Facility hours of availability to 62 62 78 81 the public/week Number of memberships sold 1,760 1,464 1,950 1,850 Facility programs/events 27 27 27 23 Partner organizations 15 15 15 15 Theatre performances 69 69 69 69 Rentals - Park shelters, Sermon 1,023 3,365 1,700 4,000 Center craft show booths Number of member/guests visits 29,946 38,052 35,000 39,500 *Explore fitness, cultural, wellness opportunities for new class 3 offerings with special emphasis on identifying possibilities for youth programming/companion classes. *Develop plan to increase fitness equipment based on demand. 3 *Provide dual-fitness memberships to the Palmer Center and the Roger 3 T. Sermon Community Center along with consistent pricing structure to enhance user experience. 231
for
business meetings;
*Prepare current members for scheduled membership fee increase. 3 *Manage the implementation of the first year of the new IBEW contract 4 for represented Recreation staff. Recreation Prog/Fac Supv .50 .50 .50 .50 Center Attendant .00 .00 .00 3.89 Center Attendant-SUB 2.97 2.97 2.97 .00 Total 3.47 3.47 3.47 4.39 ============================================ Personal Services 125,741 142,474 143,074 146,247 Other Services & Charges 70,099 97,353 97,353 96,875 Supplies 14,976 15,717 15,717 15,672 Capital Outlay 2,000 3,797 3,797 0 Other Expenditures 0 0 0 0 Total 212,816 259,341 259,941 258,794 ============================================ 232
George Owens Nature Park is an 85 acre park site that features natural areas, restored grasslands, two lakes, an extensive hiking trail system, a nature center with hands-on children activities and exhibits, picnic opportunities and an organized group camp area. Facility staff coordinates the maintenance of the park grounds and provides interpretive activities and programs to the general public, school groups, scouting organizations and other outdoor enthusiasts.
*Create and implement a storm water / water quality program and 3 pollinator program for family engagement in the bio-swales and landscaping surrounding the DeWitt Center.
*Complete service road to trail conversion project for improved park 3 functionality and ADA accessibility. *Implement the first year of the new IBEW contract.
3
*Process in place for
collection for
3
and
for public
3
3
Nature Center hours of availability 5454 5454 Total number of visitors 27,25127,532 29,00029,000 On-site group presentations 3438 5048 Community programs 4247 5250 Park Special Events 3023 3131 Hours of service by volunteers 822773 1,000900
*DeWitt Center native fish aquarium exhibit installed and
operational.
ongoing fish
public display.
*First rotating exhibit identified
scheduled
opening
(Kansas City 300 Million Years Ago by Dr. Richard Gentile of UMKC). *Established introductory severe weather training program with EOC
and George Owens Park Staff. *Increased the scope of outdoor and nature based educational program 3 offerings available to the public and offered these programs at varied times to better meet participant schedules.
233
4
Parks Naturalist 1.00 1.00 1.00 .50 Light Equipment Operator 1.00 1.00 .00 .00 Center Attendant .00 .00 .00 .00 Seasonal Maintenance Wkr .91 .91 .91 .91 Total 2.91 2.91 1.91 1.41 ============================================ Personal Services 104,305 75,717 75,717 51,161 Other Services & Charges 24,646 29,697 29,697 27,913 Supplies 6,593 6,753 6,753 5,905 Capital Outlay 0 0 0 0 Other Expenditures 0 0 0 0 Total 135,544 112,167 112,167 84,979 ============================================ 234
The Cemetery Maintenance Division is responsible for daily maintenance operations at Woodlawn Cemetery, including: routine turf and landscape maintenance, coordinating final arrangement needs and internments, and providing accurate facility records for public viewing.
*Adopted more of a leadership
Memorial Day weekend 2 remembrance event. *Completed the current phase of the base repair and stone realignment 1 project. *Participated in the organization and implementation of (4) 2 historical cemetery tours. Number of cemetery acres maintained 49 49 49 49 Number of funeral services per year 60 75 75 85 *Perform a tree condition audit. 1 *Complete the next phase of the base repair and stone realignment 1 project. *Work with tourism staff to create regular historic cemetery tours. 2 Maintenance Aide 2.00 2.00 2.00 2.00 Cemetery Sexton 1.00 .50 .50 .50 Seasonal Maintenance Wkr .58 .58 .58 .58 Total 3.58 3.08 3.08 3.08 ============================================ 235
role in the
Personal Services 70,540 104,263 104,263 96,430 Other Services & Charges 23,330 12,554 12,554 15,149 Supplies 7,232 14,789 14,789 10,451 Capital Outlay 0 0 0 0 Other Expenditures 0 0 0 0 Total 101,102 131,606 131,606 122,030 ============================================ 236
This work group oversees and manages park revitalization, maintenance and capital improvement projects planned for the City's park system. made possible through the Parks and Recreation Sales Tax. This cost center also houses funds necessary to implement the Department's Park Patrol Program.
*Successfully converted the restroom and concession buildings at the 3 Athletic Complex to year-round facilities.
*Successfully restructured Park Patrol program to maximize efforts in 3 major parks while keeping costs in line with budgeted amounts.
Number of formal reports to Park 6 6 6 6 Sales Tax Oversight Committee Number of Oversight Committee 2 2 2 2 formal reports to City Council *Develop a plan for surveillance cameras in high use parks. 2 *Certify two new pesticide applicators. 1 Maintenance Aide 2.00 3.00 2.00 2.00 Maintenance Mechanic 2.00 2.00 2.00 2.50 Parks & Grounds Manager .00 .50 .50 .50 Light Equipment Operator .00 .00 1.00 1.00 Auto Mechanic .50 .50 .50 .00 Administrative Spec II .00 .00 .00 .61 Total 4.50 6.00 6.00 6.61 ============================================ 237
*Certified two new pesticide applicators. 1
Personal Services 474,973 461,327 461,327 562,126 Other Services & Charges 159,402 148,857 148,857 228,402 Supplies 57,992 77,065 77,065 77,632 Capital Outlay 9,066 0 0 0 Other Expenditures 0 0 0 0 Total 701,433 687,249 687,249 868,160 ============================================ 238
This cost center serves to provide ongoing operation of the City's historic Truman Memorial Building. Truman Memorial Building serves as a community asset capable of hosting a variety of different functions including special events, recreation and fitness programs, and private rental groups. The facility is also home to Veteran's Hall; a museum and interactive video program honoring local veterans.
*Installed a television monitor through the Reach Marketing System to 2 promote programs and provide important facility information to visitors to the Truman Memorial Building. *Working with Park Maintenance, Public Works, a contractor and 2 Technology Services, installation of WiFi for use by staff and rental groups was completed.
*Develop plan to enhance and promote the attractiveness of the 1 facility for various rental opportunities: banquets, weddings, corporate trainings, team building clinics, small business and seminars.
*Identify additional special events to be hosted at the facility by 1 Parks and Recreation and possible partnering groups.
*Work with Tourism staff to include the Truman Memorial Building as a 4 part of the Historical Truman Tour package.
*Manage the implementation of the first year of the new IBEW contract 4 for represented recreation staff.
*Hallways and
3 *VCT
the
3
meeting rooms painted.
floors throughout
facility reconditioned
Number of facility rentals 1,360 1,536 1,400 2,150 Number of hours available each 56 56 56 51 week Number of programs/events 27 27 27 23 Partner organizations 4 4 5 4
239
Recreation Specialist .00 .00 1.00 1.00 Recreation Prog/Fac Supv .50 .50 .50 .50 Parks & Recreation Technician .00 .00 .50 .50 Administrative Spec II .50 .50 .00 .00 Center Attendant .00 .00 .00 2.29 Center Attendant-SUB 1.88 2.29 2.29 .00 Total 2.88 3.29 4.29 4.29 ============================================ Personal Services 129,568 183,045 183,045 188,402 Other Services & Charges 135,049 121,896 121,896 138,873 Supplies 5,005 10,004 10,004 10,275 Capital Outlay 0 0 0 0 Other Expenditures 0 0 0 0 Total 269,622 314,945 314,945 337,550 ============================================ 240
This cost center provides ongoing operation of the Palmer Senior Adult and Nutrition Center. This includes costs associated with, but not limited to, facility staff, contract services, maintenance, utilities, and program development. The Palmer Center provides diverse adult programs and services including a daily meal program, fitness opportunities, education classes, recreational programs, and a wide variety of social needs.
*The Palmer Center Fitness Room was re-configured to add additional 3 cardiovascular equipment (two water rowers), update (two flat screen televisions and new fans), and enhance user experience (sign in table, cubbies, coat rack, trainer's desk).
*Installed two television monitors through the Reach Marketing System 3 to promote programs and provide important facility information to visitors to the Palmer Center.
*Received a $76,000 gift from the George Henry Collings Memorial Fund 3 to maintain and enhance the Center's Information and Referral service program.
*Several new programs were added based on the interest of the 3 participants. Programs included: Breathe in Yoga, SilverSneakers Healthy Holiday Gathering, and a Seven Dimensions of Wellness Fair.
*Implement new minimum age of 60 to provide consistency for the senior 3 age across the department and to prepare for increased need for programs and services by older adults (largest growing segment of our
Number of recreation programs 91 78 75 95 Number of facility reservations 1,819 2,235 1,825 2,350 Number of events by community 5 4 7 7 agencies Number of center visits 45,215 64,950 56,000 68,000 Number of hours available to public 57 57 57 57 Number of fitness center 358 328 250 340 memberships Number of partnerships 43 52 48 65 Number of facility rentals 60 26 80 30
241
population
*Provide dual-fitness memberships to the Palmer Center and the Roger 3 T. Sermon Community Center along with consistent pricing structure to enhance user experience. *Prepare for 5 year renewal of National Senior Center Accreditation. 3 *Develop intergenerational programs to support growth of youth focused 3 programs for the department. *Work with tourism staff to help increase number of senior bus tours 3 coming to Independence. *Manage the implementation of the first year of the IBEW contract 4 for represented Recreation staff. Recreation Prog/Fac Supv .00 .00 .00 .50 Administrative Spec II .61 .61 .61 .61 Center Attendant .00 .00 .00 1.83 Center Attendant-SUB 1.83 1.83 1.83 .00 Total 2.44 2.44 2.44 2.94 ============================================ Personal Services 69,191 59,339 59,339 91,110 Other Services & Charges 104,747 137,495 139,249 109,773 Supplies 13,459 17,500 17,500 17,500 Capital Outlay 0 0 0 0 Other Expenditures 0 0 0 0 Total 187,397 214,334 216,088 218,383 ============================================ 242
due to the baby boomer generation).
This cost center serves to provide ongoing development and implementation of family-oriented recreation programs consistent with the recommendation from the Independence Parks & Recreation and Open Space Master Plan. Funding is provided through the Parks & Recreation Sales Tax Program. Special attention is given to the development of youth and family programs, outdoor programs, festivals and special events.
*Provided support to community partners to offer annual community 3 based programs including: Dia De Nino, EcoFest and Heritage Festival.
*Developed a set of family based programs to coincide with the early 2 summer opening of the George Owens DeWitt Center to promote outdoor education features, indoor exhibits and first rotating exhibit.
*Develop and implement 3 boxed nature programs to offer at a variety 2 of community settings.
*Partner with the National Frontier Trails Museum staff to develop a 1 native landscape plan to depict what early pioneers would have encountered as they embarked on their journey west.
*Assist with the development of the 1st year DeWitt Center program 2 base to focus on family oriented outdoor education.
Number of programs initiated 4948 5454 Program attendance 13,22514,897 14,00015,000 Number of park sites used 3435 3434 number of public presentations 1211 1515 Program partnerships developed 3430 3535 Hours of service by volunteers 677613 700700
243
Recreation Specialist 1.00 1.00 .00 .00 Parks Naturalist .00 .00 .00 .50 Recreation Prog/Fac Supv 1.00 1.00 1.00 1.00 Center Attendant 1.45 1.45 1.45 1.45 Seasonal Maintenance Wkr .55 .55 .55 .55 Total 4.00 4.00 3.00 3.50 ============================================ Personal Services 159,015 116,283 116,283 150,539 Other Services & Charges 24,964 33,170 33,170 49,436 Supplies 14,837 15,400 15,400 15,400 Capital Outlay 600 0 0 0 Other Expenditures 0 0 0 0 Total 199,416 164,853 164,853 215,375 ============================================ 244
This cost center serves to provide ongoing management, support and supervision of the Adventure Oasis Water Park, spray grounds, and development of aquatics-oriented recreation programs, activities and events.
*Modified program offerings based on city wide survey results 2 *Received over a 60% growth in party packages by implementing new 4 marketing strategies focused on groups and families. *Offered inclusive water play days at the McCoy Park Sprayground. 3 *Completed Adventure Oasis revitalization and repair project. 3 Number of organized groups 39 41 45 60 Number of birthday packages sold 178 158 180 200 Number of passes sold 145 177 150 175 Number of punch cards sold 499 492 360 500 Number of scholarships granted 35 37 35 35 Number of programs 51 56 58 60 Number of park visitors 40,712 41,295 55,000 50,000 *Continue to adjust targeted marketing strategies to increase water 4 park visits. *Implement adaptive swimming lessons programs at Adventure Oasis 3 *Implement restructured fee program. 4 *Work with Tourism staff to include the water park in the overall 4 visitor package information. Recreation Prog/Fac Supv 1.00 1.00 1.00 1.00 Total 1.00 1.00 1.00 1.00 ============================================ 245
Personal Services 67,375 75,650 75,650 68,678 Other Services & Charges 482,906 469,652 469,652 494,728 Supplies 18,368 13,300 13,300 13,300 Capital Outlay 0 0 0 0 Other Expenditures 0 0 0 0 Total 568,649 558,602 558,602 576,706 ============================================ 246
Sports Administration supports and funds year-round sports program for Independence residents of all ages and abilities at multiple indoor and outdoor facilities. Additionally, this cost center supports all operational needs associated with the athletic fields located at the Independence Athletic Complex as well as existing athletic fields located at various City park sites. Responsibilities also include maintenance of all non-athletic field open space, facilities, structures and grounds located in the Independence Athletic Complex.
*Initiated the development of an inclusive recreation plan that 3 encompasses our entire department. *Completed Crysler Wall Replacement Project. 3 Number of leagues 14 17 15 16 Number of tournaments 20 18 22 20 Number of camps 7 8 8 8 Number of schools/associations 13 14 14 14 supported *Complete the inclusive recreation plan for the Parks and Recreation 3 department. *Implement 2 additional adaptive sports programs. 3 *Oversee the implementation of the inaugural season of the 2 Independence Veterans Collegiate Baseball Team. Recreation Specialist 1.00 1.00 1.00 1.00 Light Equipment Operator 4.00 4.00 4.00 4.00 247
*Completed ballfield repairs at Mill Creek Park, the Independence 3 Athletic Complex, and Crysler Stadium.
Assistant Foreman 1.00 1.00 1.00 1.00 Seasonal Maintenance Wkr 3.88 3.88 3.88 3.88 Total 9.88 9.88 9.88 9.88 ============================================ Personal Services 380,529 439,848 439,848 435,946 Other Services & Charges 120,089 139,787 139,787 144,148 Supplies 44,510 60,345 60,345 60,934 Capital Outlay 0 0 0 0 Other Expenditures 0 0 0 0 Total 545,128 639,980 639,980 641,028 ============================================ 248
Tourism Administration oversees administrative, marketing and historic preservation activities associated with the Tourism Division of the Parks, Recreation & Tourism Department. The Division actively works with various Boards, Commissions and organizations, associations and private sector to further enhance the City's Tourism and historical assets. *Assisted with the replacement of the Pioneer Woman Statue 1 *Assisted with the development and implementation of the Parks, 2 Recreation and Tourism interim management plan *Incorporated Tourism into the Cityworks program to assist with the 2 care of the historic sites office management. *Assist with the implementation of the Parks, Recreation and Tourism 2 consolidation plan *Develop a capital improvements plan for the historic sites 3 *Facilitate the implementation of the tourism marketing and promotions 4 program *Update the lease agreements for historic sites 3 Historic Pres Manager .00 .00 .00 .50 Tourism Manager .00 .00 .00 1.00 Tourism Specialist .00 .00 .00 1.00 Total .00 .00 .00 2.50 ============================================ Personal Services 1,025,633 902,005 902,005 260,736 Other Services & Charges 0 0 0 585,676 249
Supplies 0 0 0 2,000 Capital Outlay 0 0 0 0 Other Expenditures 0 0 0 0 Total 1,025,633 902,005 902,005 848,412 ============================================ 250
The National Frontier Trails Museum serves both the local community and visitors to Independence by operating a historic museum featuring the westward expansion of the United States and the role Independence played in that development. The museum annually received visitors from throughout the United States and various foreign countries. The museum hosts programs, community gatherings, meetings, and provides rental space for local organizations. In cooperation with the Independence School District, the museum provides special programming to help local school children meet curriculum requirements. The museum has also become a well-known resource to help school teachers through the region earn credits toward their re-certification. In addition, the museum houses the largest public archives and library on the topic of the overland trails. The museum store provides visitors with memorabilia and creates additional revenue for the City. The NFTM is the only museum in the nation certified by the National Park Service to interpret five national historic trails.
*Assisted with the development and implementation of the Parks, 2 Recreation, and Tourism interim management plan. *Coordinated the replacement of the Pioneer Woman Statue. 3 *Partnered with the Oregon-California Trails Association (OCTA) to 2 digitize Mattes collection to increase public access. *Conducted a Teacher Institute for local school teachers to obtain 4 continuing education credits. *Produced the inaugural run of the outdoor play "Frontiers". 4 *Enlarged the number of volunteers by 27% and increased volunteer 4 hours. *Upgraded security system for enhanced public safety. 3 *Created and implemented a new cirriculum-based 8th grade program in 2 collaboration with the Independence School District. *Debuted the Experiential History Program throughout the City to 4 increase tourist attractions and promote longer stays. *Partnered with the Missouri Humanities Council and Friends of NFTM to 4 provide 3 Family Fun Days for the community. *Increased use of technology to improve efficiencies and enhance 2 public service by adding wi-fi capability to the theater and library. *Cultivated a more attractive and well maintained property by 1 repairing, expanding, and adding landscaping to the front patio area. *Assist with the implementation of the Parks, Recreation, and Tourism 2 consolidation plan. *Assist with updating the lease agreement for the NFTM facility and 3 surrounding property. 251
*Implement the second experiential history storyline, "Path to 3 Progress". *Replace the "Westward Fever" exhibit. 3 *Work with the Friends of the NFTM to conduct a membership drive. 2 *Upgrade the fire protection system. 3 *Develop and implement a phased plan to digitize the City's holdings 2 in the Mattes Library. *In order to promote attractive and desirable neighborhoods, the NFTM 1 will increase the landscaping of the museum's grounds. Museum Administrator Curator .00 .00 .00 1.00 Events/Education Prg Mgr .00 .00 .00 1.00 Museum Operations Mgr .00 .00 .00 1.00 Museum Coordinator .00 .00 .00 1.00 Museum Service Assistant .00 .00 .00 1.00 Total .00 .00 .00 5.00 ============================================ Personal Services 77,806 495,194 495,194 342,270 Other Services & Charges 0 0 0 160,387 Supplies 0 0 0 25,405 Capital Outlay 0 0 0 1,000 Other Expenditures 0 0 0 0 Total 77,806 495,194 495,194 529,062 ============================================ 252
The Historic Sites Maintenance cost center is responsible for daily historic site maintenance operations, including mowing and trimming, landscape bed care, snow removal, litter and debris removal and basic repairs and painting for all City-owned historic properties under the direction of the Parks, Recreation and Tourism Department.
*Assist with the
Recreation and Tourism
consolidation plan *Develop and implement
routine care and maintenance
3 historic sites Maintenance Aide .00 .00 .00 2.00 Maintenance Mechanic .00 .00 .00 .50 Total .00 .00 .00 2.50 ============================================ Personal Services 195,872 172,263 172,263 119,565 Other Services & Charges 0 0 0 41,760 Supplies 0 0 0 500 Capital Outlay 0 0 0 0 Other Expenditures 0 0 0 0 Total 195,872 172,263 172,263 161,825 ============================================ 253
implementation of the Parks,
2
a
plan for the
The Tourism Sales and Services cost center is responsible for the daily operations of the Visitor Experience Center, directly and indirectly soliciting, securing and supporting group tours, events, conferences, etc., and training of tourism related volunteers.
implementation of the
*Assisted
*Further integrated and
Experience
for visitors *Partnered with Spectra Entertainment Venue Management, hotels, 4 restaurants, attractions, etc.
conferences and groups to Independence *Assist with the implementation of the Parks, Recreation and Tourism 2 consolidation plan *Develop and implement a revitalized group tour program 4 *Develop and implement an event bid vetting system 4 Convention Services Manager .00 .00 .00 1.00 Visitor Center Attendant .00 .00 .00 2.00 Total .00 .00 .00 3.00 ============================================ Personal Services 320,799 282,131 282,131 146,672 Other Services & Charges 0 0 0 109,000 Supplies 0 0 0 10,500 Capital Outlay 0 0 0 0 Other Expenditures 0 0 0 0 254
with the development and
Parks, 2 Recreation and Tourism interim management plan
refined the Visitor
Center to 4 create stop shop" concept
in an effort to attract various events,
Total 320,799 282,131 282,131 266,172 ============================================ 255
To account for those charges that are not directly chargeable to a specific department or function within each fund. This section includes worker's compensation claims, contingencies, charges for insurance, utilities, postage, telephone, etc.
6502Non-Departmental 8,779,104 8,896,562 8,710,685 9,338,757 6503Capital Outlay 343,177 400,000 400,000 376,700 6504City Council Strategic Goal 105,550 250,000 557,944 200,000 6505Central Services 18,034 19,465 19,465 18,465 6511Non-Departmental 13,985 13,200 13,200 0 6512Non-Departmental 6,992 7,000 7,000 0 6520Non-Departmental 22,387,277 22,501,886 22,512,186 22,806,332 6530Non-Departmental 4,656,521 4,758,641 4,758,641 4,890,428 6540Non Departmental 6,193,309 6,602,387 6,602,387 7,062,907 6591Staywell PPO Plan 22,833,111 21,184,035 21,184,035 23,395,229 6595Staywell Health Center 813,306 1,325,541 1,325,541 1,130,371 Total 66,150,366 65,958,717 66,091,084 69,219,189 ============================================ General Fund 9,245,865 9,566,027 9,688,094 9,933,922 Street Improv. Sales Tax Fund 13,985 13,200 13,200 0 Parks Improv. Sales Tax Fund 6,992 7,000 7,000 0 Power and Light Fund 22,387,277 22,501,886 22,512,186 22,806,332 Sanitary Sewer Fund 4,656,521 4,758,641 4,758,641 4,890,428 Water Fund 6,193,309 6,602,387 6,602,387 7,062,907 Staywell Health Care Fund 23,646,417 22,509,576 22,509,576 24,525,600 Total 66,150,366 65,958,717 66,091,084 69,219,189 ============================================ 256
Represents expenditures of a fund-wide nature that are not directly chargeable to a specific operating department. Includes such items as worker compensation expenditures, postage, telephone, insurance and utility costs.
Personal Services 5,797,305 5,436,117 5,250,240 5,799,538 Other Services & Charges 2,981,799 2,902,640 2,902,640 2,930,745 Supplies 0 0 0 0 Capital Outlay 0 0 0 120,000 Other Expenditures 0 557,805 557,805 488,474 Total 8,779,104 8,896,562 8,710,685 9,338,757 ============================================ 257
Other Services & Charges 9,074 0 0 0 Supplies 0 0 0 0 Capital Outlay 334,103 400,000 400,000 376,700 Other Expenditures 0 0 0 0 Total 343,177 400,000 400,000 376,700 ============================================ 258
Personal Services 18,769 0 0 0 Other Services & Charges 79,203 250,000 250,000 200,000 Supplies 6,663 0 0 0 Capital Outlay 915 0 307,944 0 Other Expenditures 0 0 0 0 Total 105,550 250,000 557,944 200,000 ============================================ 259
Provides funds and accountability of certain common goods purchased for distribution to all City departments. This acts as a revolving fund for the most part. Also used for lease of, maintenance, and supplies for all copy machines which are located in the City Hall building and are in Purchasing's charge.
Other Services & Charges 18,034 16,000 16,000 15,000 Supplies 0 3,465 3,465 3,465 Capital Outlay 0 0 0 0 Other Expenditures 0 0 0 0 Total 18,034 19,465 19,465 18,465 ============================================ 260
This cost center accounts for the amount paid out of the Street Improvements Sales Tax Fund for the Santa Fe TIF. This is the portion of the automotive sales tax reported by dealerships within the Santa Fe TIF district that are transferred to the Santa Fe TIF project as authorized by the Santa Fe TIF agreement.
Other Services & Charges 13,985 13,200 13,200 0 Total 13,985 13,200 13,200 0 ============================================ 261
This cost center accounts for the amount paid out of the Park Improvements Sales Tax Fund for the Santa Fe TIF. This is the portion of the automotive sales tax reported by dealerships within the Santa Fe TIF district that are transferred to the Santa Fe TIF project as authorized by the Santa Fe TIF agreement.
Other Services & Charges 6,992 7,000 7,000 0 Total 6,992 7,000 7,000 0 ============================================ 262
Represents expenditures of a fund-wide nature that are not directly chargeable to a specific operating department. Includes such items as worker compensation expenditures, postage, telephone, insurance and utility costs.
Personal Services 2,757,981 2,523,102 2,523,102 2,770,197 Other Services & Charges 6,178,267 6,129,442 6,129,442 6,169,850 Supplies 0 0 0 0 Capital Outlay 59,186 11,825 11,825 10,000 Other Expenditures 13,391,843 13,837,517 13,847,817 13,856,285 Total 22,387,277 22,501,886 22,512,186 22,806,332 ============================================ 263
Represents expenditures of a fund-wide nature that are not directly chargeable to a specific operating department. Includes such items as worker compensation expenditures, postage, telephone, insurance and utility costs.
Personal Services 497,368 458,607 458,607 514,712 Other Services & Charges 1,823,219 1,899,374 1,899,374 1,788,677 Supplies 0 12,500 12,500 45,500 Capital Outlay 9,030 0 0 0 Other Expenditures 2,326,904 2,388,160 2,388,160 2,541,539 Total 4,656,521 4,758,641 4,758,641 4,890,428 ============================================ 264
Represents expenditures of a fund-wide nature that are not directly chargeable to a specific operating department. Includes such items as worker compensation expenditures, postage, telephone, insurance and utility costs.
Personal Services 712,771 663,510 663,510 729,152 Other Services & Charges 2,773,261 2,855,958 2,855,958 3,188,384 Supplies 0 0 0 0 Capital Outlay 9,238 10,000 10,000 10,000 Other Expenditures 2,698,039 3,072,919 3,072,919 3,135,371 Total 6,193,309 6,602,387 6,602,387 7,062,907 ============================================ 265
This program is used to account for the costs of the city's self funded health care plan.
Other Services & Charges 22,833,111 21,184,035 21,184,035 23,395,229 Total 22,833,111 21,184,035 21,184,035 23,395,229 ============================================ 266
This cost center is used to account for the costs of the city's Stay Well Health and Wellness Center.
Other Services & Charges 644,199 1,325,541 1,325,541 1,117,871 Capital Outlay 35,336 0 0 0 Total 679,535 1,325,541 1,325,541 1,117,871 ============================================ 267
Represents expenditures of a fund-wide nature that are not directly chargeable to a specific operating department. Includes such items as worker compensation expenditures, postage, telephone, insurance and utility costs.
Personal Services 5,797,305 5,436,117 5,250,240 5,799,538 Other Services & Charges 2,981,799 2,902,640 2,902,640 2,930,745 Supplies 0 0 0 0 Capital Outlay 0 0 0 120,000 Other Expenditures 0 557,805 557,805 488,474 Total 8,779,104 8,896,562 8,710,685 9,338,757 ============================================ 268
Other Services & Charges 9,074 0 0 0 Supplies 0 0 0 0 Capital Outlay 334,103 400,000 400,000 376,700 Other Expenditures 0 0 0 0 Total 343,177 400,000 400,000 376,700 ============================================ 269
Personal Services 18,769 0 0 0 Other Services & Charges 79,203 250,000 250,000 200,000 Supplies 6,663 0 0 0 Capital Outlay 915 0 307,944 0 Other Expenditures 0 0 0 0 Total 105,550 250,000 557,944 200,000 ============================================ 270
Provides funds and accountability of certain common goods purchased for distribution to all City departments. This acts as a revolving fund for the most part. Also used for lease of, maintenance, and supplies for all copy machines which are located in the City Hall building and are in Purchasing's charge.
Other Services & Charges 18,034 16,000 16,000 15,000 Supplies 0 3,465 3,465 3,465 Capital Outlay 0 0 0 0 Other Expenditures 0 0 0 0 Total 18,034 19,465 19,465 18,465 ============================================ 271
This cost center accounts for the amount paid out of the Street Improvements Sales Tax Fund for the Santa Fe TIF. This is the portion of the automotive sales tax reported by dealerships within the Santa Fe TIF district that are transferred to the Santa Fe TIF project as authorized by the Santa Fe TIF agreement.
Other Services & Charges 13,985 13,200 13,200 0 Total 13,985 13,200 13,200 0 ============================================ 272
This cost center accounts for the amount paid out of the Park Improvements Sales Tax Fund for the Santa Fe TIF. This is the portion of the automotive sales tax reported by dealerships within the Santa Fe TIF district that are transferred to the Santa Fe TIF project as authorized by the Santa Fe TIF agreement.
Other Services & Charges 6,992 7,000 7,000 0 Total 6,992 7,000 7,000 0 ============================================ 273
Represents expenditures of a fund-wide nature that are not directly chargeable to a specific operating department. Includes such items as worker compensation expenditures, postage, telephone, insurance and utility costs.
Personal Services 2,757,981 2,523,102 2,523,102 2,770,197 Other Services & Charges 6,178,267 6,129,442 6,129,442 6,169,850 Supplies 0 0 0 0 Capital Outlay 59,186 11,825 11,825 10,000 Other Expenditures 13,391,843 13,837,517 13,847,817 13,856,285 Total 22,387,277 22,501,886 22,512,186 22,806,332 ============================================ 274
Represents expenditures of a fund-wide nature that are not directly chargeable to a specific operating department. Includes such items as worker compensation expenditures, postage, telephone, insurance and utility costs.
Personal Services 497,368 458,607 458,607 514,712 Other Services & Charges 1,823,219 1,899,374 1,899,374 1,788,677 Supplies 0 12,500 12,500 45,500 Capital Outlay 9,030 0 0 0 Other Expenditures 2,326,904 2,388,160 2,388,160 2,541,539 Total 4,656,521 4,758,641 4,758,641 4,890,428 ============================================ 275
Represents expenditures of a fund-wide nature that are not directly chargeable to a specific operating department. Includes such items as worker compensation expenditures, postage, telephone, insurance and utility costs.
Personal Services 712,771 663,510 663,510 729,152 Other Services & Charges 2,773,261 2,855,958 2,855,958 3,188,384 Supplies 0 0 0 0 Capital Outlay 9,238 10,000 10,000 10,000 Other Expenditures 2,698,039 3,072,919 3,072,919 3,135,371 Total 6,193,309 6,602,387 6,602,387 7,062,907 ============================================ 276
This program is used to account for the costs of the city's self funded health care plan.
Other Services & Charges 22,833,111 21,184,035 21,184,035 23,395,229 Total 22,833,111 21,184,035 21,184,035 23,395,229 ============================================ 277
The Workers Compensation Program functions as an internal service provider for City employees. The program ensures that City employees who sustain valid work-related injuries will receive all benefits provided under state statute and City policies. The program will maintain self-funded status as defined by the State of Missouri Department of Insurance and Division of Workers Compensation. The program will provide injured worker benefits through the Workers Compensation Fund, which will be funded by premiums paid by each City department. *Pharmacy Benefit Card created a 41% cost savings for prescription
3
and co-pay demands at
*Updated Early Intervention program nurse
number, reducing 3 response time to provide proper care for injured workers. *Updated Citynet page, employee injury forms to reflect new phone 3
and distributed cards containing updated instructions to all employees. *Provided value added service of job task analyses for job 3 classifications with a history or potential of injury. *Closed 98% of medical-only claims within six months of final medical 3 care.
of
non-litigated indemnity
were closed
12 3
(MMI)
*100% of closed non-denied litigated claims were closed within 24 3
of
medical improvement (MMI), representing
litigated
MMI. *Accommodated 95% of doctor restrictions for
injured workers 3
in
to
MMI 278
drugs for employees, and ease of use for injured workers, eliminating confusion
pharmacy.
phone
number,
*79%
closed
claims
within
months of reaching maximum medical improvement
including 80% involving permanent partial disability, representing 61% of all non-litigated claims at MMI.
months
reaching maximum
32% of all
claims at
returning
to temporary modified duty, including utilizing placement
alternate work areas when home department was unable
accommodate work restrictions. Closure of Medical-Only claims within 6 months of
*Timely closure of all workers compensation claims: 3
- Close 95% of all Medical-only claims within six months of final medical care.
- Close 90% of all Non-litigated claims involving permanent partial disability within twelve months of reaching maximum medical improvement (MMI).
- Close 80% of all Litigated claims within twenty-four months of MMI.
3
*Develop job analyses to assist in
to 3 regular
duties. Asst City Counselor II .50 .50 .50 .50 Worker's Compensation Coord 1.00 1.00 1.00 1.00 Administrative Spec II .50 .50 .50 .50 Total 2.00 2.00 2.00 2.00 ============================================ Personal Services 153,479 153,934 153,934 160,180 Other Services & Charges 2,185,138 2,395,550 2,395,550 2,305,850 Supplies 2,842 6,500 6,500 6,500 Capital Outlay 1,007 2,500 2,500 2,500 Other Expenditures 0 0 0 0 Total 2,342,466 2,558,484 2,558,484 2,475,030 ============================================ 279
*Accommodate 95% of Returns to work when treating doctor places
injured worker on modified duty.
returning injured workers
job
This cost center is used to account for the costs of the city's Stay Well Health and Wellness Center.
Other Services & Charges 644,199 1,325,541 1,325,541 1,117,871 Capital Outlay 35,336 0 0 0 Total 679,535 1,325,541 1,325,541 1,117,871 ============================================ 280
2016-17 Operating Budget Power and Light Fund


Electric Service Charges, $135,999,359, 95.2% Other Operating Revenue, $2,239,000, 1.6% Other Revenues, $3,035,000, 2.1% Interfund Charges, $1,571,817, 1.1%
$142,845,176 Capital, $16,390,000 10.1% IP&L Operations, $114,058,507 95% Non-Departmental/ Other, $22,940,417 14.1% Debt Service, $8,946,157 5.5%
$162,335,081 281
Source of Budget Dollars
Allocation of Budget Dollars
City of Independence, Missouri
Source of Budget Dollars
Use of Budget Dollars
Fiscal
2014-15,
2016-17 Increase 2015-16 City Manager % (Decrease) 2014-15 Current Proposed of Over Last % Description Actual Estimate Budget Total Year Change
2016-17 Operating Budget Budget Summary Power and Light Fund For the
Years
2015-16 and 2016-17
Estimated RevenuesOperating Revenues 138,186,898 $ 131,819,453 $ 138,238,359 $ 96.8% 6,418,906 $ 4.9% Interest Income 15,586 36,000 35,000 0.0% (1,000) -2.8% Interfund Charges 1,467,239 1,484,545 1,571,817 1.1% 87,272 5.9% Other Revenues 286,200 3,000,000 3,000,000 - 0.0% Total Estimated Revenues 139,955,923 $ 136,339,998 $ 142,845,176 $ 100.0% 6,505,178 $ 4.8% Total Sources 139,955,923 $ 136,339,998 $ 142,845,176 $ 6,505,178 $ 4.8%
Operating Budget: Technology Services 127,700 $ 129,495 $ 134,085 $ 0.1% 4,590 $ 3.5% Power and Light Dept. 104,186,379 109,902,547 114,058,507 70.2% 4,155,960 3.8% Non-Departmental 22,387,277 22,512,186 22,806,332 14.0% 294,146 1.3% Debt Service 8,944,557 8,946,957 8,946,157 5.5% (800) 0.0% Total Operating Budget 135,645,913 $ 141,491,185 $ 145,945,081 $ 89.8% 4,453,896 $ 3.1% Capital Budget: Capital Projects 3,306,351 $ 13,923,295 16,390,000 10.1% 2,466,705 17.7% Transfers: Falls at Crackerneck Creek TIF 93,433 $ 83,642 99,261 0.1% 15,619 18.7% Total Uses 139,045,697 $ 155,498,122 $ 162,434,342 $ 6,936,220 $ 4.5% $ 910,226 $ (19,158,124) $ (19,589,166) $ (431,042) 2.25% Change in Available Resources 282
City of Independence, Missouri 2016-17 Operating Budget
Historical Data - Power and Light Fund
For the Fiscal Years 2010-11 through 2014-15
Net Income (Loss)
Net Available Resources
through
Employee Staffing (in Full Time Equivalents)
Utility Statistics
Description 2010-11 2011-12 2012-13 2013-14 2014-15 Net Income (Loss) (616,514) $ 1,807,024 $ (2,821,422) $ 339,291 $ (11,439,723) $ Capital Contributions 1,905,706 154,564 585,916 438,026 518,197 Change in Net Assets 1,289,192 $ 1,961,588 $ (2,235,506) $ 777,317 $ (10,921,526) $ Net Available ResourcesTotal Current Assets 46,415,386 $ 60,588,681 $ 72,227,861 $ 84,667,685 $ 87,410,690 $ Less: Inventories (12,939,459) (12,759,050) (12,505,713) (11,442,057) (10,041,133) Prepaid Items (140,101) (281,935) (234,783) (263,869) (252,737) Current Liabilities (12,139,397) (13,849,277) (16,249,323) (14,839,384) (14,950,930) Capital Budget (1,715,415) (2,368,086) (3,270,885) (648,131) (13,923,295) Appropriations Carryover Outstanding (2,715,447) (4,835,350) (3,900,873) (4,944,912) (3,554,647) Encumbrances Net Available Resources 16,765,567 $ 26,494,983 $ 36,066,284 $ 52,529,332 $ 44,687,948 $ Target Working Capital 21,000,000 $ 21,000,000 $ 21,000,000 $ 21,000,000 $ 21,000,000 $
Department: Technology Services 1.50 1.50 1.50 1.50 1.50 Power and Light 222.00 233.00 236.00 238.00 239.00 Total 223.50 234.50 237.50 239.50 240.50 No. of Residential Customers 51,277 51,124 51,150 51,432 51,662 No. of Other Customers 5,181 5,168 5,142 5,117 5,101 Generated Power (MWH) 120,588 271,460 286,682 170,118 219,911 Purchased Power (MWH) 1,129,598 928,803 880,110 968,562 893,552
Source: 2010-11
2014-15 - Comprehensive Annual Financial Report
283
City of Independence, Missouri
2016-17 Operating Budget
Power and Light Fund
2015-16 2015-16 2016-17 %Chg. Acct. 2014-15 Original Current Proposed Curr Est No. Description Actual Budget Estimate Budget to Prop Operating Revenue 20-4010 Electric Service Charges 135,915,878 138,580,000 129,567,939 135,999,359 5.0% 20-4600 Other Operating Revenue 1,816,949 1,884,000 1,929,514 1,917,000 -0.6% 20-4700 Change in Unbilled Revenue 454,072 322,000 322,000 322,000 0.0% Total Operating Revenue 138,186,898 140,786,000 131,819,453 138,238,359 4.9% 20-3421 Interfund Charges 1,467,239 1,484,545 1,484,545 1,571,817 5.9% 20-3411 Interest Income 15,586 12,000 36,000 35,000 -2.8% 20-4900 Other Revenues, Net 286,200 0 3,000,000 3,000,000 0.0% Total Revenues $139,955,923 $142,282,545 $136,339,998 $142,845,176 4.8%
Revenue Summary For the Fiscal Years 2014-15, 2015-16 and 2016-17
284
Comparison of Average Monthly Electric Bills for Electric Service Customers Independence Power & Light Versus Kansas City Power & Light Company, Kansas City Power & Light Company - Greater Missouri Operations, and Board of Public Utilities-Kansas City, KS
NOTES:
(a) IPL rates include Fuel Cost Adjustment of $0.023738 per KWH as based on the weighted average of the actual monthly Fuel Cost Adjustment rates through December 2015.
(b) A Gross Receipts Tax of 9.08 percent is incorporated within IPL's rates. All bill amounts shown for KCPL, KCPL-GMO, & BPU-KC include the City's Franchise Gross Receipts Tax of 9.08 percent.
(c) KCPL costs include applicable DSIM charges of $0.00022/kWh for Residential and $0.00358/kWh for Non-Residential as of February 2016.
(d) KCPL-GMO costs include applicable FAC ($0.00375/kWh Secondary & $0.00368/kWh Primary), DSIM ($0.00311/kWh - Res & $0.00202 - Non-Res), and RESRAM ($0.00094/kWh) charges as of September 2015.
(e) BPU-KC costs include applicable ERC and ESC charges of January 2016.
(f) No sales tax is included in the above bill amounts.
(g) Average customer usages are based on IPL's average customer usage for RS-3, GS-1, & LGS-1 service type for each month from January 2015 through December 2015.
Independence Kansas City Power & Light Co.Kansas City Power & Light Co. - GMOBoard of Public Utilities-Kansas City Power & Light (IPL) (KCPL) (KCPL-GMO) (BPU-KC) Average AveragePercent AveragePercent AveragePercent Type of Service Monthly MonthlyHigher or MonthlyHigher or MonthlyHigher or and RateBill RateBill(Lower)RateBill(Lower)RateBill(Lower) Customer Monthly Usage Code Amount Code Amount than IPL Code Amount than IPL Code Amount than IPL Standard Residential Service Average Customer Usage (Jan 15 - Dec 15) Average Monthly KWH = 759 RS-3111.53 R116.194.18%M0860110.80-0.65% 100102.89-7.75% Low User Average Monthly KWH = 400 RS-361.09 R68.5512.21%M086063.984.73% 10062.281.95% High User Average Monthly KWH = 1,000 RS-3144.90 R143.87-0.71%M0860139.43-3.78% 100131.15-9.49% Small General Service (Commercial) Average Customer Usage (Jan 15 - Dec 15) Average Monthly KWH = 761 (6 KW Demand)GS-1132.51 SGS141.166.53%M0710117.22-11.54%200 ND147.4611.28% Low User Average Monthly KWH = 400 (5 KW Demand)GS-174.26 SGS83.7612.79%M071070.57-4.97%200 ND93.1425.42% High User Average Monthly KWH = 1,000 (9 KW Demand)GS-1170.24 SGS179.095.20%M0710148.07-13.02%200 ND183.377.71% Large General Service (Commercial and Industrial) Average Customer Usage (Jan 15 - Dec 15) Ave. Monthly KWH = 15,960 (50% Load Factor)LGS-12,085.76MGS1,828.39-12.34%M07111,760.18-15.61% 2001,953.92-6.32% Low User Ave. Monthly KWH = 5,000 (40% Load Factor)LGS-1702.19 SGS663.28-5.54%M0711593.58-15.47%200 ND786.4512.00% High User Ave. Monthly KWH = 58,333 (50% Load Factor)LGS-17,423.22MGS6,541.73-11.87%M07205,539.37-25.38% 2006,554.65-11.70% Industrial - Primary Voltage Delivered Service - 13,000 Volts Metered Demand - 500 KW Monthly KWH - 150,000 KWH LP-217,593.20MGS16,777.98-4.63%M073512,656.19-28.06% 25018,828.227.02% Metered Demand - 500 KW Monthly KWH - 250,000 KWH LP-226,204.50LGS22,089.32-15.70%M073517,971.05-31.42% 25023,971.21-8.52% Metered Demand - 1,200 KW Monthly KWH - 360,000 KWH LP-241,294.68MGS40,100.74-2.89%M073530,099.22-27.11% 30044,655.408.14% Metered Demand - 1,200 KW Monthly KWH - 600,000 KWH LP-261,961.80LGS52,838.26-14.72%M073544,854.87-27.61% 30056,787.39-8.35% Metered Demand - 4,000 KW Monthly KWH - 1,200,000 KWH LP-2128,478.60MGS134,287.824.52%M073599,871.32-22.27% 400132,675.983.27% Metered Demand - 4,000 KW Monthly KWH - 2,000,000 KWH LP-2193,651.00LGS176,782.23-8.71%M0735142,390.17-26.47% 400170,256.27-12.08%
285
Power and Light
Power and Light Director
Leon DaggettAdmin. Specialist III Utility Account Administrator – P&L Accounting & Finance Environmental Program Supervisor Deputy Director Document Management Spec Economic Planning & Rates Manager
Support Services Production
Planning & Rates Supervisor Planning & Rates Analyst
Environmental Program Spec
Utility
Transmission & Distribution Engineering System Operations 286
Property Accountant Utility Support Spec.
Support
Manager
Services
Bid AdministratorSecurity Administrator Meter
Supvr Meter Reading Fleet Administrator Vehicle Maintenance
Utility Maint Worker
Tech Customer
Supervisor
Field Service
Warehouse & Stores
Administrator Marketing & Customer Programs Warehouse
(7)
Utility
Power
287
Services
Support
Contract &
Records Clerk Meter Reader
(13) Utility Meter Reader I
(4) Heavy Equip. Mechanic Fleet Control Data
Operations
Utility
Warehouse Superintendent
Customer Programs
Clerk
Utility Field Service Worker Lead Warehouseman (2) Warehouseman
Maint. Worker (2) Energy Application Specialist Asst. Meter Reader Supv
and Light continued
Power and Light continued
Production
Power Production Manager
Division Admin Specialist
(2) Engineer III – PL
Production Ops. Supt
Lab Control Tech
(5) Operations Shift Supervisor
(4) Power Plant Operator III
(5) Power Plant Operator II
(10) Power Plant Operator I
Plant Maint. Supt
Facility Maint. Supr - Mech. Mtce.
Journeyman Mechanic Welder
Machinist/Mechanic
(12) Journeyman PP Mechanics
Performance & Contract Engineer
Utility Data Specialist – P&L
Production Ops. Supt. (NERC)
Safety & Training Specialist
PP Electrical & Electronic Supr
(3) Journeyman Power Plant Electricians
Warehouse Superintendent
(2) Inventory Clerks
PP Instrument Control Supr
(5) Inst./Pneumatic Technicians
Facility Maint. Supr – Fuel Handling
(4) PP Gen. Utility Workers
(3) Utility Maint. Workers
288
Electric Distribution Manger Transmission & Distribution System Protection Engineer (2) T & D Superintendent (9) Crew Leader, Wkg. Inspector/Locator Safety & Training Specialist Utility Support Clerk T & D Superintendent Substation Foreman, Wkg. (2) Substation Lineman (2) Relay Technician (23) Journeyman Lineman (4) Apprentice Lineman (4) Troubleman
Dispatcher Utility Maint. Lead Worker Utility Maint. Worker Tree Trim Supt Arborist – P & L T & D Superintendent Meter Foreman, Wkg.
Journeyman Meterman
Journeyman Lineman
Leader, Wkg. Meter Records Clerk Revenue Protection/ Electrical Inspector Power and Light continued 289
(5)
(3)
(2)
Crew
Power and Light continued
Engineering
Power Engineering Manager
Division Admin Specialist
Systems Program Supervisor
System Program Coord.
Engineering Supervisor
Senior Engineer - PL
(3) Engineer III – PL
Engineer II – P&L
District Engineering Planning Supv
(3) Senior District Planner
District Planner II
Engineering Tech III – P& L
GIS Supervisor – P&L
(4) GIS/CAD Technician
System Operations
System Operations Manager
(2) Energy Management System Coord. II
Cyber Security Coord.
Energy Management System Coord.
P & L Operations Supervisor
Telecommunications Supv
Senior Electronics Tech Energy Markets Coord.
Electric System Operation Engineer
(5) Senior System Operator
(3) Electronics Tech
Telecommunications Coord.
NERC Compliance Supervisor
Reliability Compliance Coord.
CIP/Cyber Security Coord.
NERC Compliance Analyst
290
2016-17Operating Budget Power & Light

Appropriations by Type: ExpenditureActualOriginalRevisedAdopted Type 2014-152015-162015-162016-17 Personal Ser. 28,246,129 $ 29,651,723 $ 29,651,723 $ 31,796,290 $ Other Services18,500,124 20,465,648 20,944,698 19,659,735 Supplies 56,456,000 58,534,326 58,042,626 61,148,482 Capital Outlay 984,126 1,261,150 1,263,500 1,454,000 Other - - -Total 104,186,379 $ 109,912,847 $ 109,902,547 $ 114,058,507 $ Historical Comparison: ActualActualActual ActualBudgetBudget 2011-122012-132013-142014-152015-162016-17 Employees: Full Time Equiv. 233.00 236.00 238.00 239.00 239.00 239.00 Amount by Fund: Power and Light Fund104,229,826 $ 99,672,439 $ 104,921,884 $ 104,186,379 $ 109,912,847 $ 114,058,507 $ Total All Funds104,229,826 $ 99,672,439 $ 104,921,884 $ 104,186,379 $ 109,912,847 $ 114,058,507 $ Comparative Ratios: Per Capita 892.15 $ 853.14 $ 895.14 $ 888.43 $ 937.50 $ 972.86 $ Per Household 2,138.40 $ 2,110.14 $ 2,124.66 $ 1,930.02 $ 2,015.20 $ 2,091.21 $ 27.9% 17.2% 53.6% 1.3% 2016‐17 Budget Personal Ser. Other Services Supplies Capital Outlay 0 30,000 60,000 90,000 120,000 150,000 2011-122012-132013-142014-152015-162016-17 $104,230 $99,672 $104,922 $104,186 $109,913 $114,059 Dollars (1,000's) Fiscal Year 291
Responsible for the overall operation and leadership of the Power & Light Department to ensure reliable and environmentally friendly electric service to the citizens of Independence at the lowest possible cost consistent with sound business practices. *Finalized design features for the new office building to obtain 3 Platinum LEED certification and contracted Burns & McDonnell as the General Contractor for the overall project. *Effectively managed the fuel transition from coal to natural gas at 2 the Blue Valley power plant. *Completed the rate stabilization study. 4 *Completed the permit activities with the Department of Natural 3 Resources to renew the Blue Valley power plant air operating permit, DNR issuance of renewed permit is pending. *Completed tasks as defined in City Council Resolution 5933 regarding 2 renewable energy and certain aspects with the Department's coal-fired generating units. Average Number of Retail Customers 56,474 56,709 56,736 56,929 Total Retail Energy Sales (Mwh) 1,030,251 995,485 1 055,098 1,080,661 Average Retail Sales per Customer 18,243 17,554 18,597 18,983 (Kwh/customer) Total Wholesale Energy Sales (Mwh) 59,754 86,075 63,300 94,051 Total Operating Revenues (in 000's) 138,814 139,078 140,786 146,960 Average Operating Revenue per 2,458 2,452 2,481 2,581 Customer ($/customer) Total System (customer) Peak Load 272,400 276,100 295,600 296,900 (Kw) Annual System Load Factor (%) 45.40 42.56 42.80 43.00 *Complete the renovation project on the office building and 3 effectively manage the transfer of staff to such location. *Begin development of a maintenance plan to preserve the reliable 3 operation and remaining life of the IPL generating assets and minimize costs for operation. *Begin construction of the cap and closure for the Blue Valley ash 3 293
*Implement the Community Solar Program to maximize customer 2 participation. *Provide support and expertise to help successfully implement the new
Utility Billing Enterprise Replacement (UBER) billing system. *Revamp IPL budgeting process to increase efficiencies and accuracy of 2 the process. *Complete Blue Valley water permit renewal process. 3 Utility Property Accountant .00 .00 .00 1.00 Utility Support Specialist .00 .00 .00 1.00 Econ Planning & Rates Manager 1.00 1.00 1.00 1.00 Power & Light Director 1.00 1.00 1.00 1.00 Utility Account Admin - P&L .00 .00 .00 1.00 Planning & Rates Analyst .00 .00 1.00 1.00 Engineer III - PL 1.00 1.00 .00 .00 Deputy Director Power & Light 1.00 1.00 1.00 1.00 Administrative Spec III 1.00 1.00 1.00 1.00 Planning & Rates Supervisor 1.00 1.00 1.00 1.00 Document Mgmt Specialist 1.00 1.00 1.00 1.00 Environmental Prog Supv, IPL 1.00 1.00 1.00 1.00 Environmental Prog Spec, IPL 1.00 1.00 1.00 1.00 Total 9.00 9.00 9.00 12.00 ============================================ Personal Services 1,081,748 1,345,831 1,345,831 1,737,030 Other Services & Charges 1,712,424 1,612,270 2,066,970 1,612,270 Supplies 7,843 11,500 11,500 11,500 Capital Outlay 27,252 4,500 4,500 4,500 294
ponds. *Explore the funding, work load and rate impacts of the proposed 2 Advanced Metering Infrastructure (AMI) and, pending City Council approval to proceed, complete development of the Blue Print to define the detailed requirements, processes and projected funding needed to complete the build out of such a system.
2
Other Expenditures 0 0 0 0 Total 2,829,267 2,974,101 3,428,801 3,365,300 ============================================ 295
Administrative unit of the Support Services Division responsible for customer and energy programs, budgeting/accounting/financial planning and construction contracts oversight. *Successfully utilized 100% of commercial rebate funds. 1 *Completed close-out of Energy Efficiency and Conservation Block 1 Grant. *Implemented a social media website that will provide energy savings 1 tips and practices. *Implemented an outreach campaign that promotes IPL, Home Energy Loan 1 Program (HELP) and Energy Efficiency Programs. Energy Efficiency Rebates Processed 128 119 120 125 Customers on Surge Protection 423 440 440 475 Program Energy Star Rebates 14 4 15 6 Commercial Rebates 9 11 12 12 Energy Efficiency Loans 6 13 25 25 Weatherization Program 0 0 0 10 *Improve the surge protection program by clarifying terms and 2 conditions. *Promote the Home Energy Loan Program to increase number of loans by 1 10%. *Expand the social media website and increase the number of followers 1 to 500. *Promote the low/moderate income weatherization program through 1 social media program and website. *Expand the participation of the web based home audit tool to 500 1 registered participants. 296
Utility Property Accountant 1.00 1.00 1.00 .00 Utility Support Clerk 1.00 1.00 1.00 .00 Utility Support Specialist 1.00 1.00 1.00 .00 Utility Account Admin - P&L 1.00 1.00 1.00 .00 Energy Applications Spec 2.00 2.00 2.00 2.00 Safety & Training Specialist 1.00 .00 .00 .00 Support Services Manager 1.00 .00 .00 .00 Support Services Manager .00 1.00 1.00 1.00 Customer Programs Admin 1.00 1.00 1.00 1.00 Security Administrator 1.00 1.00 1.00 1.00 Contract Compliance Coord 1.00 1.00 .00 .00 Contract & Bid Administrator .00 .00 1.00 1.00 Total 11.00 10.00 10.00 6.00 ============================================ Personal Services 586,189 875,157 875,157 625,217 Other Services & Charges 319,029 601,700 600,700 622,000 Supplies 19,755 13,500 13,500 18,500 Capital Outlay 26,040 57,500 58,500 72,500 Other Expenditures 0 0 0 0 Total 951,013 1,547,857 1,547,857 1,338,217 ============================================ 297
Responsible for ordering, issuing, receiving and maintaining inventory of material and tools for line crews, maintenance personnel or outside contractors. Also responsible for maintenance of IPL Service Center.
*Gravel roads were continuously maintained in the pole yard. 2 Purchase Requisitions Issued 641 521 640 540 Inventory Purchases: Transformers 550 546 287,243 600,000 600,000 Wood Poles 193,199 137,214 250,000 250,000 Street Light Poles 59,197 56,900 50,000 50,000 Wire 390,791 244,840 800,000 800,000 Other 732 662 1,288,533 1,367,500 1,400,000 Totals 1 926 395 2,024,730 3,067,500 3,100,000 *Maintain gravel roads in the pole yard. 2 *Replace the T12 fluorescent lighting in the warehouse area with more 2 efficient LED High Bay lighting fixtures. *Warehouse upgrade to Inventory Management System. Purchase (5) five 2 new scanners, label printer and supplies. Warehouse Clerk 3rd Yr 1.00 1.00 1.00 1.00 Lead Warehouseman 1.00 1.00 1.00 1.00 Util Maint Wkr 2nd 6 Mo 1.00 1.00 1.00 1.00 Warehouseman 4th 6 Mo 2.00 2.00 2.00 2.00 Warehouse Supt 1.00 1.00 1.00 1.00 Total 6.00 6.00 6.00 6.00 ============================================ 298
Personal Services 651,177 631,143 631,143 687,768 Other Services & Charges 197,172 269,800 269,800 362,100 Supplies 2,325,063 3,362,500 2,832,500 3,369,500 Capital Outlay 0 30,000 30,000 80,000 Other Expenditures 0 0 0 0 Total 3,173,412 4,293,443 3,763,443 4,499,368 ============================================ 299
Responsible for procurement, maintenance, accounting and replacement of Power & Light fleet and related facilities. Major objectives include providing a safe fleet, keeping equipment down time to a minimum, and providing related support services as required to Power & Light divisions.
*Procured and implemented new fleet management software program. 2 *Procured and implemented new vehicle diagnostic programs, including 2 technician training. *Updated shop overhead oil service lines to include synthetic motor 2 oil and antifreeze. Fleet Miles Driven 692,358 657,266 700,000 710,000 Fleet Use in Gallons 85,927 81,774 90,000 75,000 Fleet Miles Per Gallon 8.6 8.8 9.0 11.0 Fleet Fuel Cost 275,206 214,265 200,000 170,000 Fleet Maintenance Cost 703,204 812,571 800,000 700,000 Fleet Preventive Maintenance Cost 43,109 36,195 50,000 60,000 Fleet Tire Cost 16,141 13,064 20,000 20,000 Total Fleet Operations Cost 804,541 757,280 900,000 900,000 Fleet Cost Per Mile 1.17 1.15 1.20 1.15 *Procure and implement an additional 20 vehicles to Fuel Master Aims 2 2 Ring technology. *Conduct a study on existing assets of IPL fleet. Outdated/not in use 3 set for disposal. *Procure and implement tire purchasing and repair to be done in-house, 3 State Bid. 300
Fleet Control Data Technician 1.00 1.00 1.00 1.00 Util Maint Wkr 2nd 6 Mo 1.00 1.00 1.00 1.00 Heavy Equipment Mech 1st-Year .00 1.00 .00 .00 Heavy Equipment Mech 2nd-Year .00 .00 1.00 .00 Heavy Equipment Mech 3rd-Year 4.00 3.00 3.00 4.00 Fleet Administrator 1.00 1.00 1.00 1.00 Total 7.00 7.00 7.00 7.00 ============================================ Personal Services 826,685 769,432 769,432 858,100 Other Services & Charges 309,191 318,600 339,600 326,000 Supplies 258,706 370,800 349,800 371,500 Capital Outlay 862,908 864,500 864,500 875,000 Other Expenditures 0 0 0 0 Total 2,257,490 2,323,332 2,323,332 2,430,600 ============================================ 301
The Utility Field Service Division is responsible for turning both electric and water services on and off, field services of delinquent accounts and reading meters for customer transfers.
*The department averaged 7.47 stops per hour for the first six months 2 of the fiscal year. This is an increase of 11.3% from last year.
*The department averaged 93.1% work order completion for the first six 2 months of the fiscal year.
*The Field Service Worker group communicates daily with IPL and Water 3 Meter Shops along with Customer Service personnel to discuss and resolve any work order issues.
*Conducted quarterly
2 Average number of customer contacts 4,839 5,001 4,400 4,800 (visits) completed monthly Average number of stops at customer 6.1 6.6 5.8 6.8 locations per hour per worker *Maintain an average of 6.5 or more stops at customer
per 2 hour per worker for every month of the year. *Maintain an average of 90% work
completion per month. 2
Customer
Shops to 3
customer
*Conduct quarterly training to reduce risk of employee injury. 2 Util Field Service Wkr 3.00 3.00 3.00 3.00 Utility Field Serv Wkr 4.00 4.00 4.00 4.00 Customer Service Supvr I 1.00 .00 .00 .00 302
safety training.
locations
order
*Work jointly with
Service, IPL and Water Meter
develop a better dispatch process to minimize worker backtracking while traveling between
locations.
Customer Operations Supervisor .00 1.00 1.00 1.00 Total 8.00 8.00 8.00 8.00 ============================================ Personal Services 1,032,855 1,012,627 1,012,627 1,050,005 Other Services & Charges 1,652 12,600 12,600 12,600 Supplies 7,896 8,500 8,500 8,500 Capital Outlay 0 0 0 0 Other Expenditures 0 0 0 0 Total 1,042,403 1,033,727 1,033,727 1,071,105 ============================================ 303
Responsible for reading electric watt-hour meters and water consumption meters monthly on scheduled routes.
*More than 99% of all meter routes for the first six months of the 2 fiscal year were read within the allocated time parameter enabling timely issuance of customer bills.
*Averaged 298 meters per month of customer accounts with consecutive 2 estimated meter readings for the first six months of the fiscal year, which did not meet objectives.
*The division has maintained a read rate of 97.3% for the first six 2 months of the fiscal year.
*Conducted quarterly safety training. 2
*Maintain or increase employee productivity so that all meter routes 2 are read within the allotted time parameters to enable the timely issuance of customer bills.
*Maintain an average of 320 or less meters per month having 2 consecutive monthly estimates. Currently IPL is responsible for reading in excess of 108,000 meters per month.
an average read rate of 96.5% or better.
Meter Reads 1,293,976 1,295,462 1,297,626 1,297,715 Rechecks 2,594 3,043 2,919 2,781 Can't Reads 33,825 32,009 33,481 33,543 Service Work Orders Generated 2,280 3,686 2,337 2,195 Actual Read (% of Meters) 97.7% 97.6% 97.6% 97.0%
2 *Conduct
to
2 Meter Records Clerk 1st Yr .00 .00 1.00 .00 304
*Maintain
quarterly training
reduce risk of employee injury.
Meter Records Clerk 2nd Yr .00 .00 .00 1.00 Meter Records Clerk 3rd Yr 1.00 1.00 .00 .00 Utility Meter Reader I 9.00 9.00 9.00 9.00 Utility Meter Reader I 5.00 5.00 5.00 4.00 Meter Reader Specialist 1.00 .00 .00 .00 Assistant Meter Reader Supv .00 1.00 1.00 1.00 Meter Reader Supv 1.00 1.00 1.00 1.00 Total 17.00 17.00 17.00 16.00 ============================================ Personal Services 1,642,932 1,815,753 1,815,753 1,857,997 Other Services & Charges 37,412 45,100 45,100 45,100 Supplies 8,552 14,500 14,500 14,500 Capital Outlay 0 90,000 90,000 90,000 Other Expenditures 0 0 0 0 Total 1,688,896 1,965,353 1,965,353 2,007,597 ============================================ 305
Responsible for the safe and efficient maintenance and operation of all power production equipment (Eleven generating units at five locations). *Installed data historian for Blue Valley and combustion turbine 2 generator units in November 2015. *Upgraded industrial control systems from Windows XP to Windows 7 2 operating system in March 2016. *Developing production division blackout response plan. Ongoing. 2 *Establishing integrated market best practices program to monitor and 2 implement recommendations as needed and justified. Ongoing, including retesting Blue Valley units with natural gas as fuel. *Upgraded combustion turbine generator exciter controls in March 2016. 2 *Developing in-house plant retirement activities plan for Missouri 3 City to a safe and secure status. Implemented "mothballing" activities at Missouri City Power Plant. Working on Security Plan. *Developed production winterization plan to assure unit dependability 2 with updates and upgrades for 2015-16 winter season. *Completed burndown of all coal at Missouri City and Blue Valley Power 3 Plants for compliance with Industrial Boiler MACT regulations and Resolution 5933. *Started construction of closure of Missouri City Ash Pond to be 3 complete by July 2016. *Completed processing/deposit of coal combustion residuals at the Blue 3 Valley Power Plant to change ash pond designation to INACTIVE for reduced closure requirements and future costs. *Completed Combustion Inspection cycle for the H-5 and H-6 Combustion 3 Gas Turbine units. *Completed total dismantle overhaul (1st since installation in 1970s) 3 of both Sub H Natural Gas compressors including foundation replacement on H-6 gas compressor. Net Generation at IP&L Plants (MWh) 91,894 53,762 54,526 63,194 Total Coal Burned (tons) 67,625 34,075 31 788 N/A Total Gas Burned (MCF) 37,021 153,070 33,145 1,161,243 306
*Developing production division blackout response plan. Ongoing with 3 procedure and upgrades implemented in early 2017.
*Establishing integrated market best practices program to monitor and 2 implement recommendations as needed and justified. Ongoing, including retesting Blue Valley units with natural gas as fuel. Analysis of testing results and submittal of new unit market operating criteria by
Total Oil Burned (gallons) 60,400 31,263 14,482 55,692 Starting Reliability N/A N/A 80% 80% Equivalent Availability N/A N/A 85% 85% Forced Outage Rate N/A N/A <10% <10%
*Developing in-house plant retirement activities plan for Missouri 3
a
and
at
City
Security plan to be finalized and implemented by November 2016. *Install replacement of obsolete Hydrogen Systems for Blue Valley unit 3 generators. *Install replacement of obsolete Burner Management systems for Blue 3 Valley unit boilers. *Complete Blue Valley Ash Pond Closure Activities. 3 Utility Data Specialist-P&L 1.00 1.00 1.00 1.00 Division Admin Specialist .00 .00 .00 1.00 Instrument/Pneumatic Tech 5.00 5.00 5.00 5.00 Inventory Clerk 2.00 2.00 2.00 2.00 Lab Control Technician 1.00 1.00 1.00 1.00 Machinist/Mechanic 1.00 1.00 1.00 1.00 Journeyman PowerPlant Electr 3.00 3.00 3.00 3.00 Journeyman Mechanic/Welder 1.00 1.00 1.00 1.00 PP General Utility Wkr 4.00 4.00 4.00 4.00 Journeyman Pwr Plant Mech 13.00 13.00 12.00 12.00 Power Plant Operator I 12.00 12.00 12.00 10.00 Power Plant Operator II 6.00 6.00 6.00 5.00 Power Plant Operator III 6.00 6.00 5.00 4.00 Util Maint Wkr 1st 6 Mo 1.00 .00 .00 .00 Util Maint Wkr 2nd 6 Mo 2.00 3.00 3.00 3.00 Power Production Mgr 1.00 1.00 1.00 1.00 Plant Maint Supt 1.00 1.00 1.00 1.00 Production Operations Supt 2.00 2.00 2.00 2.00 307
August 2016.
City to
safe
secure status. Implemented "mothballing" activities
Missouri
Power Plan.
Engineer II - P&L 2.00 1.00 .00 .00 Safety & Training Specialist .00 1.00 1.00 1.00 Engineer III - PL 1.00 1.00 2.00 2.00 PP Elec/Electronics Supvr 1.00 1.00 1.00 1.00 Facility Maint Supv PL 2.00 2.00 2.00 2.00 Perf & Contract Eng 1.00 1.00 1.00 1.00 Warehouse Supt 1.00 1.00 1.00 1.00 PP Instrument Control Supv 1.00 1.00 1.00 1.00 Administrative Spec III 1.00 1.00 1.00 .00 Operations Shift Supvr 5.00 5.00 5.00 5.00 Total 77.00 77.00 75.00 71.00 ============================================ Personal Services 8,838,498 9,530,760 9,530,760 9,593,099 Other Services & Charges 3,621,470 4,727,050 4,352,050 3,982,675 Supplies 329,804 550,700 550,700 432,700 Capital Outlay 0 16,000 16,000 16,000 Other Expenditures 0 0 0 0 Total 12,789,772 14,824,510 14,449,510 14,024,474 ============================================ 308
This function is used to accumulate costs of power production fuels, purchase power agreements with other utilities and the Southwest Power Pool (SPP) organized markets, including the cost of energy, demand and transmission charges.
*Pursued available wholesale sales activities to capture the economic 2 value of the system.
*Provided the unit cost data to allow the most economical dispatch of 2 IPL's power supply resources on an hourly and daily basis.
*Managed the final disposition of coal supplies at Missouri City and 3 the Blue Valley plants to obtain the maximum value from remaining stockpiles and to minimize the cost of coal pile clean up.
*Continue to update and refine unit cost information to allow the most 2 economical dispatch of IPL's power supply resources on an hourly and daily basis.
*Explore the feasibility of conducting SPP market activities and other 2 energy-market activities with in-house personnel to replace an existing services contract with a market consultant. This is a shared goal with System Operations.
Off-System Energy Costs ($)22,873,56726,832,23224,575,95123,829,342 Off-System Fixed Costs ($)25,148,66723,645,38826,022,46028,594,112 Transmission Services ($) 6,175,999 6,828,701 8,252,588 7,934,976 On-System Production Fuels ($) 5,527,924 3,253,919 2,591,880 3,500,493 Wholesale Power Marketing ($) 180,000 565,792 180,000 360,000 On-System Generation (MWh) 91,894 53,763 54,526 63,194 Off-System Energy (MWh) 1,046,786 1,058,453 1,145,479 1,111,519 Total Energy Supplied (MWh) 1,138,680 1,112,216 1,200,005 1,174,713 Total Cost Per MWh of Supply $/MWh 52.75 54.96 51.35 54.60 Total Cost ($)60,068,07761,126,03261,622,87964,218,923
309
Other Services & Charges 7,230,402 8,019,253 8,019,253 7,941,041 Supplies 53,080,299 53,603,626 53,603,626 56,277,882 Capital Outlay 0 0 0 0 Other Expenditures 0 0 0 0 Total 60,310,701 61,622,879 61,622,879 64,218,923 ============================================ 310
Responsible for the maintenance, repair, and construction of the City's electrical transmission and distribution systems. Division's major responsibilities are electric service, line clearance, electric metering, and substation maintenance and operations. *On track at mid-year to meet the goal of having no more than 13 2 OSHA recordable accidents. *Completed 20% of quadrants toward Tree Trimming Cycle. 3 *Replaced transformer and breakers at Substation J under Phase II of 3 upgrade project, improving distribution system reliability. *Replaced batteries at Substations M and J, ensuring uninterrupted 3 service to both our distribution and transmission systems. *Replaced all but one breaker at Substation A which will be replaced 3 as part of the Substation L switchgear replacement in October 2016. Control panel for Substation B was replaced. Completed Construction Jobs 382 475 250 250 4-KV Conversion Miles Complete .5 0 0 0 Services Installed 66 205 90 95 Rotation of Meters 1,085 1,044 1,400 1,100 Total Number of Trees Trimmed 4,550 6,240 5,200 6,300 OSHA Recordable Accidents 9 13 13 13 Quadrants Trimmed 55 39 20 20 *Complete replacement of breakers and panels at Substation A to 3 improve transmission system reliability. *Complete Substation P distribution feeder additions. 3 *Replace switchgear at Substation L to maintain reliability of 3 distribution system. *Replace 69 kV breakers at Substation M to improve reliability of 3 transmission system. 311
Apprentice Lineman-2nd Yr 3.00 2.00 2.00 4.00 Inspector/Locator 3rd Yr 1.00 1.00 1.00 1.00 Meter Records Clerk 1st Yr 1.00 .00 .00 .00 Meter Records Clerk 2nd Yr .00 1.00 .00 .00 Meter Records Clerk 3rd Yr .00 .00 1.00 1.00 Crew Leader - Working 9.00 9.00 9.00 9.00 Arborist-P&L 1.00 1.00 1.00 1.00 Utility Support Clerk .00 .00 .00 1.00 Utility Data Specialist-P&L 1.00 1.00 1.00 .00 Senior Electronics Tech 1.00 .00 .00 .00 Electronics Technician 2.00 .00 .00 .00 Journeyman Lineman 24.00 25.00 25.00 23.00 Relay Technician .00 2.00 2.00 2.00 Journeyman Meterman 3.00 3.00 3.00 3.00 Meter Foreman, Wkg 1.00 1.00 1.00 1.00 Substation Foreman, Wkg 1.00 1.00 1.00 1.00 Substation Lineman 2.00 2.00 2.00 2.00 Troubleman 4.00 4.00 4.00 4.00 Util Maint Lead Wkr 1.00 1.00 1.00 1.00 Util Maint Wkr 2nd 6 Mo 1.00 1.00 1.00 1.00 Dispatcher 5.00 5.00 5.00 5.00 Electric Distribution Mgr 1.00 1.00 1.00 1.00 Safety & Training Specialist .00 1.00 1.00 1.00 Tree Trimming Supt 1.00 1.00 1.00 1.00 Transmission & Distr Supt 4.00 4.00 4.00 4.00 System Protection Engineer .00 1.00 1.00 1.00 Revenue Protection/ElectInspec .00 .00 .00 1.00 Total 67.00 68.00 68.00 69.00 ============================================ Personal Services 8,636,672 8,679,169 8,679,169 9,488,322 Other Services & Charges 3,246,661 2,857,350 3,237,350 2,857,350 Supplies 271,879 281,950 341,250 289,950 Capital Outlay 24,211 28,500 29,200 28,500 Other Expenditures 0 0 0 0 Total 12,179,423 11,846,969 12,286,969 12,664,122 ============================================ 312
Responsible for the overall engineering of the City's high voltage electrical power system. Major areas of responsibility are: transmission, substation and distribution design, and construction job order and contract development, estimating and administration. *Initiated discussions for the purchase of property for a future 4 Substation in eastern Independence. *Initiated Sub K distribution feeder reroute for future ease of access 4 and reliability. *Initiated Sub P distribution feeder additions. 2 *Completed Sub H distribution feeder upgrades. 3 *Continued capacitor bank automation for power factor improvement. 2 *Completed Substation J Rebuild Project. 3 *Initiated design for the Substation L Switchgear Replacement Project. 3 *Initiated design for the Substation M Breaker Replacement and Line 3 Relay Upgrade Project. *Initiated CityWorks/AUD implementation. 2 *Continued fiber expansion for strategic interconnects. 4 Services Placed Underground 833 0 0 0 Federal Grant Program Services Placed Underground 69 63 75 75 Turnkey Services System Average Outage Time 89.00 18.29 71.20 61.10 (Minutes) System Average Outage Frequency .88 .46 .85 .88 *Complete the purchase of property for a future Substation in eastern 4 Independence. *Complete Sub K distribution feeder reroute for future ease of access 4 and reliability. *Complete Sub P distribution feeder additions. 2 *Complete distribution standard redesign for implementation of new 2 design software. *Continue capacitor bank automation for power factor improvement. 2 *Complete construction of the Substation L Switchgear Replacement 3 313
Project. *Complete the Substation M Breaker Replacement and Line Relay Upgrade 3 Project. *Initiate design for 69 kV Transmission Line Rebuild from Substation E 2 to Substation F. *Initiate design for Substation I Transformer and Switchgear 3 Replacement. *Complete generator step-up transformer replacements at Substation A. 3 *Complete CityWorks/AUD implementation. 2 *Complete Utility Billing System Replacement. 2 *Continue fiber expansion for strategic interconnects. 4 District Planner I 1.00 .00 .00 .00 District Planner II .00 1.00 1.00 1.00 Senior District Planner 3.00 3.00 3.00 3.00 Engineering Tech III-P&L 1.00 1.00 1.00 1.00 Division Admin Specialist .00 .00 .00 1.00 Senior Electronics Tech .00 1.00 1.00 1.00 Electronics Technician .00 2.00 2.00 3.00 Relay Technician 2.00 .00 .00 .00 CAD Operator 3.00 .00 .00 .00 GIS/CAD Technician .00 3.00 3.00 4.00 District Engr Planning Supvr 1.00 1.00 1.00 1.00 Power Engineering Mgr 1.00 1.00 1.00 1.00 Engineer I - PL 1.00 .00 .00 .00 Engineer II - P&L 1.00 1.00 1.00 1.00 Engineer III - PL 2.00 3.00 3.00 3.00 Engineering Supervisor 1.00 1.00 1.00 1.00 Eng Tech Supv - P & L 1.00 .00 .00 .00 GIS Supervisor -P & L .00 1.00 1.00 1.00 System Protection Engineer 1.00 .00 .00 .00 Sr Engineer - PL .00 .00 1.00 1.00 Telecommunications Coordinator .00 .00 .00 1.00 Telecommunications Supervisor 1.00 1.00 1.00 1.00 Administrative Spec III 1.00 1.00 1.00 .00 System Programs Coordinator 1.00 1.00 1.00 1.00 System Programs Supervisor .00 .00 .00 1.00 Total 22.00 22.00 23.00 27.00 ============================================ 314
Personal Services 2,950,192 2,803,721 2,803,721 3,330,265 Other Services & Charges 1,039,515 1,238,450 1,237,800 1,178,674 Supplies 143,799 148,950 148,950 147,450 Capital Outlay 8,190 15,000 15,650 129,500 Other Expenditures 0 0 0 0 Total 4,141,696 4,206,121 4,206,121 4,785,889 ============================================ 315
Responsible for the 24/7 operations of the City's electrical system. Major areas of responsibility include the dispatching of the generation resources, operation of the transmission system, wholesale power purchases and sales, and management of the Departments regulatory reliability compliance efforts in an efficient, cost effective and reliable manner.
*Develop plan for implementation of SCADA/EMS software upgrade to 2 vendors' current release. Implement software upgrade plan maintaining compliance with change management and security procedures.
*Evaluate network security software (log collection), purchase and 3 deploy software to help ensure compliance with North American Electric Reliability Corporation (NERC) Critical Infrastructure Protection (CIP) requirements.
*Enhance System Operations training program including training for 3 Operations Support Personnel.
*Develop automated reports for operating personnel and management to 3 track operational performance in the Southwest Power Pool (SPP) energy market.
*Complete audit mitigation from fall 2014 NERC Critical Infrastructure 3 Protection Audit.
*Transition NERC audit documentation to Power and Light's Sharepoint 2 site and prepare for next NERC audit, summer of 2016.
*Successfully and consistently submit energy offers, until parameters 2 and demand bids using IPL market software to SPP in integrated test environment.
*Perform analysis of current relationship with market agent to 3 include: functions performed, market agent fees, economic analysis
Energy Mgmt System Availability (%) 99.99 99.99 100.00 100.00 Wholesale Power Sales Mwh 56,378 79,670 63,300 94,051 Wholesale Power Revenues ($) 2,254,198 2,168,850 1,649,000 1,575,000 Wholesale Power Rate ($/Mwh) 39.98 26.17 26.05 16.75 System Operator Training CEHs (Hrs) 292 320 320 320 Load Forecasting Error (%) 6.50 4.80 3.25 3.00
316
and implementation plan to transition duties to internal staff. (Settlements, Offer Submissions, Market Reports, etc.) *Hardware replacements for NERC Cyber Security Systems (Virus 2 Protection, Log Collection, Change Management, Patch Management). *Complete audit mitigation from Spring 2016 NERC Operations and 3 Planning Audit. *Prepare for Cyber Infrastructure Protection Audit in Spring 2017. 3 *Perform Cyber Security Vulnerability assessment and mitigate 3 identified vulnerabilities to enhance security of SCADA/EMS and Support System environment. *Perform configuration of energy market software in order to report 2 accurate settlement data for IPL generation and load assets. *Develop automated reports for operating personnel and management to 2 monitor operational performance in the SPP energy market, which would include all Power & Light assets (Dogwood, Iatan 2, NC2, Smoky Hills, IPL operated, etc.) System Operator II 1.00 .00 .00 .00 System Operator III .00 1.00 1.00 .00 Senior System Operator 4.00 4.00 4.00 5.00 System Operations Manager .00 1.00 1.00 1.00 Cyber Security Coordinator 1.00 1.00 1.00 1.00 P&L Operations Supvr 1.00 1.00 1.00 1.00 Electric Sys Ops Engineer 1.00 1.00 1.00 1.00 Electric Sys Oper Manager 1.00 .00 .00 .00 Energy Mgmt Sys Coord 1.00 1.00 1.00 1.00 NERC Compliance Supervisor 1.00 1.00 1.00 1.00 CIP/Cyber Security Coord 1.00 1.00 1.00 1.00 Reliability Compliance Coord 1.00 1.00 1.00 1.00 Energy Mgmt Sys Coord II 1.00 1.00 2.00 2.00 Energy Markets Coordinator .00 1.00 1.00 1.00 NERC Compliance Analyst .00 .00 .00 1.00 Total 14.00 15.00 16.00 17.00 ============================================ 317
Personal Services 1,999,181 2,188,130 2,188,130 2,568,487 Other Services & Charges 785,196 763,475 763,475 719,925 Supplies 2,404 167,800 167,800 206,500 Capital Outlay 35,525 155,150 155,150 158,000 Other Expenditures 0 0 0 0 Total 2,822,306 3,274,555 3,274,555 3,652,912 ============================================ 318
City of Independence, Missouri
2016-17 Operating Budget
Capital Lease/Debt Service Requirements
Power and Light Fund
Total Debt Service Series Principal Interest Fees Requirements Revenue Bonds (Refunding): Revenue Bonds: 2010 Series B (6238) 1,625,000 $ 888,188 $ 4,000 $ 2,517,188 $ Revenue Bonds: 2012 Series A (6239) - 2,631,219 4,000 2,635,219 Revenue Bonds: 2012 Series F (6241) 1,905,000 1,884,750 4,000 3,793,750 Total Power and Light Fund 3,530,000 $ 5,404,157 $ 12,000 $ 8,946,157 $
319
City of Independence, Missouri
2016-17 Operating Budget
Capital Budget Summary
Power and Light Fund
Project Number Project Description Source of Funds Amount Production System new BV Boiler Burner Management System Upgrade Power and Light Fund $ 800,000 new BV Generator Hydrogen System Upgrade Power and Light Fund 450,000 new BV Ash Pond Closure Power and Light Fund 6,000,000 Transportation and Distribution System new 69 kV Transmission Line Rebuild (Sub E to F) Power and Light Fund 3,042,000 70201106 Substation Facilities/Equipment Improvements Power and Light Fund 848,000 new Substation I Switchgear & Transformer Replacement Power and Light Fund 3,650,000 new System Operations/UPS Upgrade Power and Light Fund 400,000 Other Projects new System Operations Work Area Renovation Power and Light Fund 600,000 new New Financial Management System Power and Light Fund 600,000 Total 16,390,000 $
320
2016-17 Operating Budget Sanitary Sewer Fund
Source of Budget Dollars
Allocation of Budget Dollars


Water Pollution Control, $15,550,617 , 54.6% Non-Departmental/ Other, $4,999,614 , 17.6%


Capital Improvements, $1,553,000 , 5.5%
Debt Service, $6,287,757 , 22.1% Public Works, $88,906 , 0.3%
Residential,
$12,075,353 , 52% Commercial, $5,332,839 , 23% Other Revenues, $1,140,500 , 5% Regulatory Compliance, $4,807,573 , 20%
321
Source of Budget Dollars
Use of Budget Dollars
City of Independence, Missouri
2016-17 Operating Budget
2016-17 Increase 2015-16 City Manager % (Decrease) 2014-15 Current Proposed of Over Last % Description Actual Estimate Budget Total Year Change
Budget Summary Sanitary Sewer Fund For the Fiscal Years 2014-15, 2015-16 and 2016-17
Estimated RevenuesOperating Revenues 21,471,299 $ 23,094,824 $ 25,448,425 $ 100.0% 2,353,601 $ 10.2% Interest Income 6,861 5,900 5,000 0.0% (900) -15.3% Other Revenues 0.0% - n/a Total Estimated Revenues 21,478,160 $ 23,100,724 $ 25,453,425 $ 100.0% 2,352,701 $ 10.2% Transfers from Other FundsGeneral Fund - Amort. of 10,000 10,000 10,000 - 0.0% Storm Water Deficit Debt Proceeds 1,400,000 - (1,400,000) Total Sources 21,488,160 $ 24,510,724 $ 25,463,425 $ 952,701 $ 3.9%
Operating Budget: Water Pollution Control 12,422,957 $ 14,865,574 $ 15,550,617 $ 54.6% 685,043 $ 4.6% Public Works 90,848 94,695 88,906 0.3% (5,789) -6.1% Non-Departmental 4,656,521 4,758,641 4,890,428 17.2% 131,787 2.8% Debt Service 4,999,598 5,923,882 6,287,757 22.1% 363,875 6.1% Total Operating Budget 22,169,924 $ 25,642,792 $ 26,817,708 $ 94.2% 1,174,916 $ 4.6% Capital Budget: Capital Projects 12,254,930 $ 14,374,903 $ 1,553,000 $ 5.5% (12,821,903) $ Transfers: Falls at Crackerneck Creek TIF $ 96,902 $ 92,006 $ 109,186 0.4% 17,180 $ n/a Total Uses 34,521,756 $ 40,109,701 $ 28,479,894 $ 100.0% (11,629,807) $ -29.0% $ (13,033,596) $ (15,598,977) $ (3,016,469) $ 12,582,508 -80.66% Change In Available Resources 322
City of Independence, Missouri
2016-17 Operating Budget
Historical Data - Sanitary Sewer Fund
For the Fiscal Years 2010-11 through 2014-15
Net Available Resources
2010-11 through 2014-15 - Comprehensive Annual Financial Report
Utility Statistics
Description 2010-11 2011-12 2012-13 2013-14 2014-15 Net Income (Loss) Net Income (Loss) (742,269) $ 764,972 $ (940,921) $ (287,255) $ (1,347,214) $ Capital Contributions 1,941,161 36,249 32,033 -Change in Net Assets 1,198,892 $ 801,221 $ (908,888) $ (287,255) $ (1,347,214) $
Net Available ResourcesTotal Current Assets 9,387,357 $ 7,217,768 $ 9,883,146 $ 16,632,063 $ 16,448,686 $ Less: Inventories (48,898) (55,221) (57,238) (69,290) (40,851) Restricted Cash and (387,711) (453,786) (471,674) (500,847) (566,732) Investments Current Liabilities (785,452) (2,633,873) (6,049,894) (9,679,748) (4,808,022) Carryover Capital Budget (1,968,000) (265,704) (21,042,497) (13,797,568) Appropriations Carryover Outstanding (147,073) (148,836) (193,557) (303,715) (188,588) Encumbrances Net Available Resources 6,050,223 $ 3,660,348 $ 3,110,783 $ (14,964,034) $ (2,953,075) $ Target Working Capital 2,250,000 $ 2,250,000 $ 2,250,000 $ 2,250,000 $ 2,250,000 $ Source:
Employee
Department: Public Works 1.00 1.00 1.00 1.00 1.00 Water Pollution Control Sanitary Sewer Fund 70.00 70.00 70.00 70.00 70.00 Storm Water Sales Tax 13.00 13.00 13.00 13.00 13.00 Total 84.00 84.00 84.00 84.00 84.00
Staffing (in Full Time Equivalents)
No. of Residential Customers 40,579 40,572 40,588 40,927 41,312 No. of Commercial Cust. 3,483 3,481 3,463 3,418 3,470 Wastewater Treated 2,515 2,261 2,361 2,124 2,558 (million gallons) 323
City of Independence, Missouri 2016-17 Operating Budget Revenue
2015-16 2015-16 2016-17 %Chg. Acct. 2014-15 Original Current Proposed Curr Est No. Description Actual Budget Estimate Budget to Prop Operating Revenue 30-4010 Residential 11,545,538 12,308,166 12,075,353 12,396,814 2.7% 30-4110 Commercial Base 4,587,613 4,743,125 4,752,377 4,924,513 3.6% 30-4120 Commercial Surcharge 1,287,983 491,550 580,462 588,000 1.3% 30-4130 Regulatory Compliance Base 4,793,814 4,792,315 4,807,573 6,410,098 33.3% 30-4430 Contract Services 319,756 250,000 250,000 250,000 0.0% 30-4570 Intermunicipal Agreements 708,441 650,000 650,000 650,000 0.0% 30-4600 Other Operating Revenue 261,084 229,000 229,000 229,000 0.0% 30-4700 Change in Unbilled Revenue 50,513 0 0 0 Total Operating Revenue 23,554,743 $ 23,464,156 $ 23,344,765 $ 25,448,425 $ 9.0% Non-Operating Revenue 30-3411 Interest Income 7,019 5,000 11,500 5,000 -56.5% Total Revenues $23,561,762 $23,469,156 $23,356,265 $25,453,425 9.0%
Sanitary Sewer Fund
Fiscal Years 2014-15, 2015-16 and 2016-17 324
Summary For the
* The average bill is calculated using average water consumption of 550 cubic feet per month. Survey conducted in February, 2016
Average Monthly Utility Bill * Base Rate Volume Charge Belton, Mo. $55.87 $10.25 + $15.33 $1.1219/100 gallons > 1500 rounded winter avg.) Liberty, Mo. $51.73 12.33 + $1 $12.33/1,000 gallons > 1,000 Kansas City, Mo. $50.33 $17.05 $6.05/100 cubic feet Sugar Creek, Mo $38.41 $15.92 + $9 $3.28/1,000 gallons Olathe, Ks. $37.09 $14.76 $4.06/100 cubic feet Kansas City, Ks. $36.36 $16.23 $3.66/100 cubic feet Raytown, Mo. $35.20 $12.78 $7.2/1000 gallons > 1000 Independence, Mo. $35.01 $12.60 + $9 $2.4383/100 cubic feet Lee's Summit, Mo. $33.74 $13.09 $5.02/1,000 gallons Raymore, Mo. $29.00 none $7.05/1,000 gallons Blue Springs, Mo. $22.80 $7.00 $0.384/100 gallons Grandview, Mo. $22.15 $12.47 $3.11/1,000 gallons > 1,000
CITY OF INDEPENDENCE, MISSOURI 2016-17 Operating Budget Average Bill/Rate Comparison - Sanitary Sewer Fund
325
Water Pollution Control
(10) Trt Plant Oper I (4) Trt Plant Oper II Scada Analyst Assistant WPC Plant Supt. Trt Plant Iscin Oper Admin. Specialist II Trt Plant Elect II WPC Collection System Manager Collection Systems Maint. (2) Maintenance Supervisor Storm Water Maint. (3) Equip Oper. II Admin. Specialist III WPC Plant Superintendent Treatment Facilities Admin. Specialist II Dick Champion Water Pollution Control Director Watershed Tech Analyst Storm Water Assistant Department Director (1) Equip Oper. III (2) Equip Oper. III (3) Admin. Spec. II (2) Environmental Tech (2) Equip. Oper II (2.5) WPC Collection Sys. Supt. WPC Opr. Spvr Maint. Supervisor Sanitary Swr Cnstr (6) Coll Sys Oper I Admin. Specialist II Deputy Director (1.70) Environmental Comp. Manager Environmental Comp. Supervisor Pollution Prevention Specialist Utility Accounting Administrator (2) WPC Operations Supervisor Process Operations Facilities Maintenance (3) Trt Plant Maint. Mech. Lab Supervisor Laboratory Services (2) Lab Tech II Facility Maint. Aide Crew Leader (2) Equip Oper III (6) Equip Oper II Maint. Supervisor Closed Circuit Insp. (4) Coll. Sys Tech I Environmental Specialist Surveillance & Analysis Maint. Supervisor Collection Sys Cleaning (2) Coll. Sys Oper II 326
2016-17Operating Budget Water Pollution Control

Appropriations by Type: ExpenditureActualOriginalRevisedAdopted Type2014-152015-162015-162016-17 Personal Ser.5,346,717 $ 6,717,600 $ 6,717,600 $ 6,850,010 $ Other Services7,797,951 8,805,189 8,808,261 9,529,667 Supplies814,463 1,354,014 1,354,744 1,117,382 Capital Outlay193,164 468,185 468,185 956,600 Other - 10,000 10,000 5,700 Total 14,152,295 $ 17,354,988 $ 17,358,790 $ 18,459,359 $ Historical Comparison: Actual Actual ActualActualBudgetBudget 2011-122012-132013-142014-152015-162016-17 Employees: Full Time Equiv. 83.00 83.00 83.00 83.00 86.20 86.20 Amount by Fund: Storm Water Sales Tax1,561,808 $ 1,651,509 $ 1,631,411 $ 1,729,338 $ 2,493,216 $ 2,908,742 $ Sanitary Sewer Fund 11,216,817 11,518,320 12,493,186 12,422,957 14,861,772 15,550,617 Total All Funds12,778,625 $ 13,169,829 $ 14,124,597 $ 14,152,295 $ 17,354,988 $ 18,459,359 $ Comparative Ratios: Per Capita 109.38 $ 112.73 $ 120.50 $ 120.68 $ 148.03 $ 157.45 $ Per Household 262.17 $ 278.82 $ 286.02 $ 262.17 $ 318.19 $ 338.44 $ 37.1% 51.6% 6.1% 5.2% 0.0% 2016‐17 Budget Personal Ser. Other Services Supplies Capital Outlay Other 0 5,000 10,000 15,000 20,000 2011-122012-132013-142014-152015-162016-17 $12,779 $13,170 $14,125 $14,152 $17,355 $18,459 Dollars (1,000's) Fiscal Year 327
Provides administrative support for the funding, construction, operation and maintenance of the City's sanitary and storm sewer collection systems and treatment facilities. Administers purchasing, payroll, billing and regulatory reporting for the Department. Coordinates the activities of divisions for the effective accomplishment of departmental objectives. Develops, maintains and enforces the City's water pollution control policies and regulations.
*Sponsored the 9th annual EcoFest (It's all About Water) to educate 1 the public about the environment.
*Sponsored the 19th annual Household Hazardous Waste Collection Event. 1
*Introduced a F.O.G. (Fats, Oils, and Grease) Program and Committee in 1 collaboration with other City Departments. This program is used to educate the public on the proper disposal of fats, oil and grease to protect public health and the environment.
*Received notification of the 2015 Peak Performance Gold Award from 1 National Association of Clean Water Agencies.
Sanitary Sewer Customers 40,696 40,882 40,775 41,000 (Residential) Sanitary Sewer Customers 3,459 3,460 3,460 3,440 (Commercial) *Administer the Storm Water MS4 and Rock Creek Plant NPDES permits. 1 *Provide administrative support of the City's wastewater 1 treatment
sanitary
systems. *Manage the annual Household Hazardous Waste Mobile Collection Event. 1 *Coordinate the annual EcoFest Event. 1 *Provide administrative support for the Storm Water Sales Tax 1 Oversight Committee. *Monitor and participate in the State and Federal rulemaking process. 1 330
facility, 13 pump stations, over 600 miles of
sewers and 232 miles of storm water sewer
Asst Dept Director 1.00 1.00 1.00 1.00 Water Pollution Cont Dir 1.00 1.00 1.00 1.00 Utility Account Admin 1.00 1.00 1.00 1.00 Environmental Compl Mgr 1.00 1.00 1.70 1.70 Environmental Comp Supv 1.00 1.00 1.00 1.00 Deputy Director - WPC .00 .00 1.00 1.00 Staff Assistant 1.00 .00 .00 .00 Staff Assistant-Contract .00 1.00 1.00 1.00 Pollution Prevention Spec. 1.00 1.00 1.00 1.00 Administrative Spec II 2.00 2.00 2.00 2.00 Total 9.00 9.00 10.70 10.70 ============================================ Personal Services 655,225 977,387 977,387 866,283 Other Services & Charges 63,794 122,605 122,605 122,605 Supplies 10,963 17,000 17,000 17,000 Capital Outlay 1,094 7,100 7,100 7,100 Other Expenditures 0 0 0 0 Total 731,076 1,124,092 1,124,092 1,012,988 ============================================ 331
Provides administration and funding for cooperative sewer services within the contiguous watersheds of adjoining municipalities and the Little Blue Valley Sewer District. Provides administration, public information and funding for the City's participation in the regional Household Hazardous Waste Program.
Treatment Cost per Million Gallons $1,921 $1,562 $1,832 $1,778 Treated Other Services & Charges 5,235,194 5,615,000 5,615,000 6,366,000 Other Expenditures 0 0 0 0 Total 5,235,194 5,615,000 5,615,000 6,366,000 ============================================ 332
Responsible for the operation and maintenance of the Rock Creek Wastewater Treatment Plant and eleven pumping stations throughout the City. Maintains pumps, blowers, boilers and reactors, and operates the physical, chemical and biological processes to clean the wastewater and dispose of the removed solid materials. The division provides monthly reporting of operating conditions in accordance with state and federal water, air and land disposal permits and regulations.
*Staff at the Rock Creek Treatment Plant received the 2015 Peak 1 Performance Gold Award. The National Association of Clean Water Agencies (NACWA) presents the Gold Award to member agency facilities that consistently meet all National Pollutant Discharge Elimination System (NPDES) permit limits during a calendar year. Gold Awards are only presented to facilities with no permit violations for the entire calendar year.
*Completed emissions testing on the treatment plant incinerator 1 mandated by new regulations designed to reduce particulate, metal, acidic and organic gas emissions. Completed modifications to the incinerator stack for final emissions testing. Initiated consultant assisted study of options for future solids disposal.
*Improved security for department facilities by upgrading equipment 1 that will implement restricted access, intrusion detection and property surveillance for the responsible safekeeping of personnel and assets.
*Completed sludge basins cover replacement project. This project 1 includes the installation of a load bearing, corrosion resistant aluminum cover system to provide for personnel safety and assist the odor control process.
*Initiated cross training for Operator II positions to provide for 1 succession planning of the operations workforce. Cross training included training on the advanced solids processes of belt press operation, wet air oxidation operation and the incinerator operation.
*Completed rehabilitation of the #2 sludge dewatering belt press by 1 replacing press rolls and wash boxes. Also, completed redesign and equipment installation to the dewatering process auger system to accommodate solids disposal of dried sludge.
*Completed successful operation of a sophisticated process of holding 1 basins and excess flow pumping stations operation during one of the wettest periods in a 25 year history.
333
*Continue additional rehabilitation of the dewatering process by 1 replacing press rolls and wash boxes of the #1 sludge dewatering belt press. Install new polymer mixer and new polymer pumps for the #1 and #2 sludge dewatering belt presses.
*Complete replacement of the Primary Thickening Basin Gear Box. This 1 project continues the program of replacing large, maintenance intensive gear drive equipment with improved energy and maintenance efficient hydraulic driven gear mechanisms.
*Complete rehabilitation of Bison Park Pump Station pumping and 1 instrument control equipment to eliminate an incompatible communication system and provide cellular communications with the SCADA System at the Rock Creek Treatment Plant.
*Continue additional cross training for Operator II positions to 1 provide for succession planning of the operations workforce. Cross training includes continued training on the advanced solids processes of belt press operation, wet air oxidation operation, and the incinerator operation as well as any new processes that may be implemented.
Wastewater Treated 2124 2558 2243 2341 (Million Gallons) Solids Removal Efficiency (%) 97.55 96.38 95.20 96.96 (85% Required) Oxygen Demand Removal (%) 97.75 95.29 96.14 96.52 (85 % Required) Solids Incinerated 2628 1485 2199 2056 (Dry Tons) Treatment Costs per Million Gallons $1,598 $1,550 $2,089 $1,915 Treated
Treatment Plant Elec II 2.00 1.00 1.00 1.00 Treatment Plnt Incinerator Op 1.00 1.00 1.00 1.00 Treatment Plant Maint Mech 2.00 3.00 3.00 3.00 Treatment Plant Oper I 9.00 9.00 10.00 10.00 Treatment Plant Oper II 5.00 5.00 4.00 4.00 334
WPC Plant Superintendent 1.00 1.00 1.00 1.00 Assistant WPC Plant Superintd 1.00 1.00 1.00 1.00 Scada Analyst 1.00 1.00 1.00 1.00 WPC Operations Supv 1.00 1.00 2.00 2.00 Administrative Spec II 1.00 1.00 1.00 1.00 Total 24.00 24.00 25.00 25.00 ============================================ Personal Services 1,926,856 2,103,609 2,103,609 2,097,319 Other Services & Charges 1,301,330 1,339,490 1,342,112 1,396,190 Supplies 510,866 728,150 729,330 514,750 Capital Outlay 40,936 200,000 200,000 135,500 Other Expenditures 0 0 0 0 Total 3,779,988 4,371,249 4,375,051 4,143,759 ============================================ 335
The Sewer Maintenance Division is responsible for maintaining over 614 miles (3+ million feet) of sanitary sewer pipe and over 14,720 manholes. The maintenance service delivery is both preventive and corrective. Maintenance is chiefly accomplished with the use of high pressure cleaning equipment and sawing. The division's sanitary sewer systems repair crew corrects faulty sewer lines, manholes and also services laterals in easements and right-of-way areas. Surveillance and analysis of the sewer system is accomplished through the use of flow metering and sampling technology, and additional inspection is accomplished with closed circuit TV equipment, tracer dyes and smoke testing.
*The Rehabilitation of deteriorated neighborhood sewer systems by the seamless lining of sewers without excavation of pipe.
*Provided an initial response to our customer inquiries within 24 hours of receipt.
*Performed engineering evaluations and designs on select sanitary sewer projects.
*Followed up Sewer System Evaluation Survey (SSES) Study on various sub-watershed to identify sewer inflow and infiltration.
*Continued capturing data for sanitary infrastructures using Computerized Maintenance Management Software (CMMS).
*Continue the rehabilitation of deteriorated neighborhood sewer systems by the seamless lining of sewers without excavation of pipe.
*Continue to provide an initial response to our customer's inquiries within 24 hours of receipt.
Customer Service Request Responses 564 499 600 600 Dry weather overflows per million 0 ~4.09 0 0 feet of pipe Dry weather basement back-ups per ~1.22 ~0.38 0 0 1,000 customers Sanitary Sewer footage Pressure 1,160,171 628,109 1,100,000 1,100,000 Cleaned Sanitary Sewer Televised footage 39,279 73,965 110,000 110,000
336
*Perform engineering evaluations and designs on select sanitary sewer projects.
*Perform Sewer System Evaluation Survey (SSES) Study on various sub-watersheds to identify sewer inflow and infiltration.
*Continue to work with other agencies and departments to monitor the health of our local environment.
Facilities Maint Aide 1.00 1.00 1.00 1.00 Equipment Operator II 6.00 6.00 6.00 6.00 Equipment Operator III 2.00 2.00 2.00 2.00 WPC Collection Sys Supt 2.00 2.00 2.50 2.50 WPC Collection System Manager 1.00 1.00 1.00 1.00 Environmental Technician 2.00 2.00 2.00 2.00 Collection Sys Operator I 6.00 6.00 6.00 6.00 Collection Sys Operator II 2.00 2.00 2.00 2.00 Collection System Tech I 3.00 3.00 4.00 4.00 Collection System Tech II 1.00 1.00 .00 .00 Environmental Specialist 1.00 1.00 1.00 1.00 Maintenance Supervisor 3.00 3.00 3.00 3.00 Administrative Spec II 3.00 3.00 3.00 3.00 Crew Leader 1.00 1.00 1.00 1.00 Total 34.00 34.00 34.50 34.50 ============================================ Personal Services 1,872,185 2,404,474 2,404,474 2,392,992 Other Services & Charges 432,407 684,077 684,077 555,615 Supplies 179,394 382,782 382,782 370,000 Capital Outlay 6,788 17,585 17,585 448,500 Other Expenditures 0 0 0 0 Total 2,490,774 3,488,918 3,488,918 3,767,107 ============================================ 337
Provides analytical services for the required reporting of pollutant concentrations in the water discharge of the wastewater treatment plant. Performs testing of wastewater and sludge samples for the control and optimization of treatment processes. Performs inspection, sampling and analysis of industrial discharges to determine compliance with National Pretreatment regulations. Conducts water quality investigations of surface water discharges and performs analyses for compliance with water quality and storm water management provisions. Maintains field and laboratory records of sample custody, analytical procedure and quality assurance.
*100% accuracy was achieved in the Environmental Protection Agency's 1 National Quality Assurance Program for Laboratories by correctly analyzing and quantifying pollutants in unknown samples.
*Participated in the on-going stormwater monitoring project with USGS 1 to monitor area creeks and rivers to determine specific pollutant concentrations in the municipal storm water system.
*Developed SOPs for operations during disinfection season to include: 1 proper dosing, basic operation of chlorine analyzers, use of a hand held chlorine meter for daily measurements and proper safety precautions for the chemical building.
*Participate in the USGS stormwater monitoring of the City's creeks 1 and rivers to determine specific pollutant concentrations in the municipal stormwater system. The laboratory will provide analytical services for selected constituents and assist in future planning.
*Participate in the Environmental Protection Agency's National 1 Quality Assurance Program for Laboratories by correctly analyzing and quantifying pollutants in unknown samples.
*Develop in-house testing and sampling SOPs for the determination of 1 nitrate, nitrite, and total Kjeldahl nitrogen in wastewater and
Samples Received 3,471 3,385 3,600 3,600 Treatment Operations Analyses 17,527 18,823 17,500 18,000 Industrial Discharge Analyses 1,702 1,390 1,500 1,500 Quality Assurance Analyses 3,459 3,878 3,500 3,800
338
natural waters.
*Participate in the Missouri Stream Team Program to investigate the 1 health of area streams and as a public outreach for water quality education in the community.
Laboratory Tech II 2.00 2.00 2.00 2.00 Laboratory Supvr 1.00 1.00 1.00 1.00 Total 3.00 3.00 3.00 3.00 ============================================ Personal Services 145,905 202,053 202,053 200,303 Other Services & Charges 12,423 30,600 30,600 30,600 Supplies 12,754 20,360 20,360 20,360 Capital Outlay 14,843 9,500 9,500 9,500 Other Expenditures 0 0 0 0 Total 185,925 262,513 262,513 260,763 ============================================ 339
This function of the division oversees and manages the City's storm water program through funding made possible by the August 2000 adoption, and August 2010 renewal, of a 1/4-cent increase to the City's sales tax. Staff will communicate ongoing progress to the Oversight Committee which will prepare periodic reports to the City Council.
*Administered, coordinated and evaluated engineering consultants design progress on storm drainage improvement (CIP) projects.
*Provided staff, information, and data to the Storm Water Oversight Committee.
*Storm Water Program planned and participated in the 9th annual 1 EcoFest.
*Administer, coordinate and evaluate engineering consultants design progress on storm drainage improvements (CIP) projects.
*Provide staff, information and data to the Storm Water Oversight Committee.
*Plan and participate in the Annual EcoFest Event.
Watershed Technical Analyst 1.00 1.00 1.00 1.00 Administrative Spec II 1.00 .00 .00 .00 Administrative Spec III .00 1.00 1.00 1.00 Total 2.00 2.00 2.00 2.00 ============================================ Personal Services 7,678 133,837 133,837 304,534 Other Services & Charges 115,599 156,900 156,900 129,300 340
Supplies 1,264 8,000 8,000 7,000 Capital Outlay 0 6,000 6,000 3,000 Other Expenditures 0 4,300 4,300 0 Total 124,541 309,037 309,037 443,834 ============================================ 341
The Storm Water Maintenance function is responsible for performing preventative and corrective maintenance to the City's storm water sewer system. The system has approximately 230 miles (1.22 million feet) of storm sewer and approximately 13,700 structures. Maintenance of the system involves the use of construction and repair equipment, high pressure cleaning, and vacuuming technology for the removal of debris. The team assists the department in identifying potential illicit discharges and other environmental code concerns and assists in resolving them. This function is made possible by the August 2000 adoption and August 2010 renewal of the 1/4 cent Storm Water Sales Tax.
*Investigated residents storm water concerns and performed planning and engineering evaluations as needed.
*Provided preemptive routine structure maintenance to city infrastructure prior to weather events.
*Continued to implement and refine the integrated Geographic Information System (GIS) and Computerized Maintenance Management System (CMMS)
*Administered program to rehabilitate targeted neighborhoods' storm sewers to extend the life of the system.
*Continue to investigate residents' storm water concerns and perform planning and engineering evaluations as needed.
*Continue to implement and refine the integrated Geographic Information System (GIS) and Computerized Maintenance Management System (CMMS)
*Continue to inspect, clean and repair storm water infrastructure at a rate consistent with industry standards.
*Continue to work with other agencies and departments to monitor the health of our local environment.
Storm Water Structures Cleaned 4,433 4,618 6,000 6,000 Storm Water Structures Inspected 15,925 8,891 12,000 12,000 Repair & Maintenance Team Uptime ~98% ~95% ~95% ~95%
342
Equipment Operator II 4.00 4.00 4.00 5.00 Equipment Operator III 4.00 4.00 4.00 3.00 Maintenance Supervisor 2.00 2.00 2.00 2.00 WPC Operations Supv 1.00 1.00 1.00 1.00 Total 11.00 11.00 11.00 11.00 ============================================ Personal Services 738,868 896,240 896,240 988,579 Other Services & Charges 291,854 498,817 498,817 571,207 Supplies 97,681 193,997 193,997 184,997 Capital Outlay 129,503 228,000 228,000 353,000 Other Expenditures 0 5,700 5,700 5,700 Total 1,257,906 1,822,754 1,822,754 2,103,483 ============================================ 343
The Storm Water Permit Compliance function is responsible for compliance with the State Operating Permit from the State of Missouri Department of Natural Resources for the Independence Municipal Separate Storm Sewer System (MS4).
Other Services & Charges 345,350 357,700 358,150 358,150 Supplies 1,541 3,725 3,275 3,275 Capital Outlay 0 0 0 0 Other Expenditures 0 0 0 0 Total 346,891 361,425 361,425 361,425 ============================================ 344
City of Independence, Missouri
2016-17 Operating Budget
Debt Service Requirements - Sanitary Sewer Fund
Total Debt Service Series Principal Interest Fees Requirements Revenue Bonds: 2012 Series B (6240) 810,000 $ 1,465,982 $ 5,000 $ 2,280,982 $ 2013 Series C (6240) 670,000 2,065,600 5,000 2,740,600 2014 Series C (6240) 465,000 796,175 5,000 1,266,175 Total Sanitary Sewer Fund 1,945,000 $ 4,327,757 $ 15,000 $ 6,287,757 $ 345
City of Independence, Missouri
2016-17 Operating Budget
Capital Budget Summary - Sanitary Sewer Fund
Project Number Project Description Source of Funds Amount Sanitary Sewer Collection System Projectsnew Pacific Avenue Sanitary Main Replacement Sanitary Sewer Fund 195,000 $ Subtotal 195,000 $ Treatment Plant / Pump Station Projectsnew Kentucky 1 Pump Station Demolition Sanitary Sewer Fund 60,000 new RCTP Facilities Roof, Ceiling & Lighting Sanitary Sewer Fund 608,000 new Primary Sludge Grinders & Flowmeter Replacement Sanitary Sewer Fund 90,000 Subtotal 758,000 $ Othernew Financial Management System Sanitary Sewer Fund 600,000 Subtotal 600,000 $ Fund Total 1,553,000 $ 346
2016-17 Operating Budget Water Fund
Source of Budget Dollars
Allocation of Budget Dollars

Non-Departmental/ Other, $7,201,938 , 22%


Residential Sales,
Commercial
Industrial Sales, $4,590,000
Public Authority
$14,700,000 , 45%
&
, 14%
Sales, $2,040,000 , 6% Sales for Resale, $9,200,000 , 29% Interfund Charges/Other, 1,829,384 , 6%
Capital Improvements, $4,350,000 , 13% Water Department, $16,597,154 , 51%
Debt Service, $4,397,613 , 14%
347
City of Independence, Missouri
2016-17 Operating Budget
Budget Summary Water Fund
For the Fiscal Years 2014-15, 2015-16 and 2016-17
Source of Budget Dollars
Use of Budget Dollars
Increase 2015-16 2016-17 % (Decrease) 2014-15 Current Adopted of Over Last % Description Actual Estimate Budget Total Year Change
Estimated RevenuesOperating Revenues 27,838,244 $ 29,571,000 $ 30,900,000 $ 95.5% 1,329,000 $ 4.5% Interest Income 3,192 8,200 7,950 0.0% (250) -3.0% Interfund Charges 1,808,536 1,476,226 1,451,434 4.5% (24,792) -1.7% Other Revenues 34,963 - - 0.0% - n/a Total Estimated Revenues 29,684,935 $ 31,055,426 $ 32,359,384 $ 100.0% 1,303,958 $ 4.2% Total Sources 29,684,935 $ 31,055,426 $ 32,359,384 $ 1,303,958 $ 4.2%
Operating Budget: Finance 51,330 $ 51,501 $ 53,005 $ 0.2% 1,504 $ 2.9% Water Department 13,972,117 15,624,836 16,597,154 51.0% 972,318 6.2% Non-Departmental 6,193,309 6,602,387 7,062,907 21.7% 460,520 7.0% Debt Service 5,527,338 5,474,338 4,397,613 13.5% (1,076,725) -19.7% Total Operating Budget 25,744,094 $ 27,753,062 $ 28,110,679 $ 86.4% 357,617 $ 1.3% Capital Budget: Capital Projects 2,177,841 $ 4,253,383 $ 4,350,000 $ 13.4% 96,617 $ 2.3% Transfers Out: Falls at Crackerneck Creek TIF 82,281 $ 72,490 $ 86,026 $ 13,536 $ 18.7% Total Uses 28,004,216 $ 32,078,935 $ 32,546,705 $ 100.0% 467,770 $ 1.5% $ 1,680,719 $ (1,023,509) $ (187,321) $ 836,188 81.70% Change in Available Resources 348
City of Independence, Missouri
2016-17 Operating Budget
Historical Data - Water Fund
For the Fiscal Years 2010-11 through 2015-16
Net Available Resources
2010-11 through 2014-15 - Comprehensive Annual Financial Report
Utility Statistics
Description 2010-11 2011-12 2012-13 2013-14 2014-15 Net Income (Loss) Net Income (Loss) 1,094,610 $ 2,400,675 $ 3,024,455 $ 3,397,977 $ 4,538,291 $ Capital Contributions 165,315 931,206 145,178 1,948,485 1,095,209 Change in Net Assets 1,259,925 $ 3,331,881 $ 3,169,633 $ 5,346,462 $ 5,633,500 $
Net Available ResourcesNet Adj. Current Assets 4,906,916 $ 6,864,697 $ 9,843,103 $ 14,390,473 $ 16,370,092 $ Net Adj. Current Liab. (1,151,768) (683,874) (844,354) (1,060,833) (1,102,174) Outstanding Operating Enc. (340,653) (305,073) (293,593) (483,685) (806,277) Unexpended Capital Appn (8,152,553) (5,899,576) (5,187,855) (6,077,000) (4,577,843) Capital Amounts to be 4,991,257 3,080,474 1,161,027 4,833,482 2,177,841 expended past 12 months Less Target Reserve Balance (1,500,000) (1,500,000) (1,500,000) (1,500,000) (1,500,000) Net Available Resources (1,246,801) $ 1,556,648 $ 3,178,328 $ 10,102,437 $ 10,561,639 $ Source:
Employee Staffing (in Full Time Equivalents) Department: Finance 0.85 0.85 0.85 0.85 0.85 Water 101.65 93.65 93.42 92.42 93.42 Total 102.50 94.50 94.27 93.27 94.27
No. of Residential Customers 44,619 44,520 44,501 44,617 44,760 No. of Commercial Cust. 3,102 3,097 3,092 3,099 3,086 No. of Other Customers 472 528 528 537 538 Water Pumped 10,465 10,604 10,715 10,460 9,652 (million gallons) Water Sold 8,997 9,110 9,375 8,959 8,397 (million gallons) 349
City of Independence, Missouri
2016-17 Operating Budget
Revenue Summary - Water Fund
For the Fiscal Years 2014-15 through 2016-17
2015-16 2015-16 2016-17 %Chg. %Chg. Acct. 2014-15 Original Current Adopted Curr Est Orig. to No. Description Actual Budget Estimate Budget to Proj Proj. Water Fund Operating Revenue 40-4010 Residential Sales $13,147,584 $14,400,000 $14,000,000 $14,700,000 5.0% 2.1% 40-4110 Commercial Sales 3,491,458 4,000,000 3,700,000 3,900,000 5.4% -2.5% 40-4130 Industrial Sales 605,223 800,000 650,000 690,000 6.2% -13.8% 40-4400 Public Authority Sales 318,503 300,000 320,000 340,000 6.3% 13.3% 40-4410 Private Fire Protection 179,049 170,000 191,000 200,000 4.7% 17.6% 40-4420 Public Fire Protection 1,373,671 1,250,000 1,500,000 1,500,000 0.0% 20.0% 40-4550 Sales for Resale 8,322,743 8,900,000 8,900,000 9,200,000 3.4% 3.4% 40-4600 Other Operating Revenue 292,705 380,000 310,000 370,000 19.4% -2.6% 40-4700 Change in Unbilled Revenue 107,307 - - - n/a n/a Total Operating Revenue 27,838,244 $ 30,200,000 $ 29,571,000 $ 30,900,000 $ 4.5% 2.3% 40-3421 Interfund Charges 1,808,536 1,476,226 1,476,226 1,451,434 -1.7% -1.7% 40-3411 Interest Income 3,192 3,500 8,200 7,950 -3.0% 127.1% 40-3440 Other Revenues, Net 34,963 - -Total Revenues 29,684,935 $ 31,679,726 $ 31,055,426 $ 32,359,384 $ 4.2% 2.1% 350
City of Independence, Missouri
2016-17 Operating Budget
Typical Home Water Consumption Rate Comparison - Water Fund
* The typical bill is calculated using an average water consumption amount of 5,236 gallons per month (7 ccf)
Note: Survey conducted in February 2016
City Typical Bill* Raytown, MO $53.93 Kansas City, KS $52.12 Harrisonville, MO $49.62 Belton, MO $48.71 Grandview, MO $46.02 Kansas City, MO $45.95 Raymore, MO $35.78 Liberty, MO $32.65 Overland Park, KS $32.52 Lee's Summit, MO $31.75 Blue Springs, MO $30.67 Independence, MO $30.12 Olathe, KS $29.43 Sugar Creek, MO $28.43
351
Dan Montgomery Water Systems Director Support Services Supervisor Account Clerk II Customer Service Manager Customer Service & Accounts Water Production Manager Production Safety and Training Officer Water Distribution/Engineer Manager Transmission & Distribution Water *Assistant Director *Unfunded Position 352
Customer Service Manager Customer Service & Accounts (22) Account Info. Rep. (2) Customer Service Supervisor I Customer Service Customer Service Supervisor I Water Field Services (7) Service Worker Meter Repair Worker Utility Clerk * Unfunded Position Water Production Manager Production Water Operations Supv. Laboratory Supv. (2) Plant Operator “A” Engineer II (2) Plant Operator “D” *Lab Tech (1.50) Lab Tech Fiscal Tech II Production Maint. Supv. (8) Plant Maint. Utility Worker (1.25) Laborer (2) Maint.& Utility Worker Water continued 353
GIS
Distribution/Engineer Manager
& Distribution
Tech Supv. Maint. Supv - Water
Tech III Utility Clerk
Tech II
Const. Equip. Oper.
Pipeworker Maint. Supv. - Water
Leak Repair Worker
Spec. III
Water
Transmission
Engineering
Engineering
Engineering
(4)
(4)
(2)
Admin.
Tech
Laborer Service Worker
Pipeworker
Worker
(5.5)
(2)
Yard
Water Distribution Supv. *Unfunded Position Water continued 354
*(.17) Engineering Tech II
2016-17Operating Budget Water

Appropriations by Type: ExpenditureActualOriginalRevisedAdopted Type2014-152015-162015-162016-17 Personal Ser.6,476,315 $ 7,347,490 $ 7,347,490 $ 7,509,864 $ Other Services5,167,962 5,769,251 5,771,051 6,194,450 Supplies1,825,768 2,125,235 2,125,235 2,321,240 Capital Outlay502,072 382,860 381,060 571,600 Other - - -Total 13,972,117 $ 15,624,836 $ 15,624,836 $ 16,597,154 $ Historical Comparison: Actual Actual ActualActualBudgetBudget 2011-122012-132013-142014-152015-162016-17 Employees: Full Time Equiv. 93.65 93.42 92.42 93.42 93.42 93.42 Amount by Fund: Water Fund 12,610,259 $ 13,704,564 $ 14,545,488 $ 13,972,117 $ 15,624,836 $ 16,597,154 $ Total All Funds12,610,259 $ 13,704,564 $ 14,545,488 $ 13,972,117 $ 15,624,836 $ 16,597,154 $ Comparative Ratios: Per Capita 107.94 $ 117.30 $ 124.09 $ 119.14 $ 133.27 $ 141.57 $ Per Household 258.71 $ 290.14 $ 294.54 $ 258.83 $ 286.47 $ 304.30 $ 45.2% 37.3% 14.0% 3.4% 2016‐17 Budget Personal Ser. Other Services Supplies 0 5,000 10,000 15,000 20,000 2011-122012-132013-142014-152015-162016-17 $12,610 $13,705 $14,545 $13,972 $15,625 $16,597 Dollars (1,000's) Fiscal Year 355
Responsible for the complete operation and monthly reporting of the Water Department. Major areas of responsibilities within Administration are: Fiscal Management, Special Projects, Safety, and Management of the Customer Service, Production, and
and Distribution
*Monitored the City's Backflow Prevention Program to assure the 3,300 3 backflow devices were inspected and working to meet the requirements of the Missouri Department of Natural Resources. *Provided inspection services to assure the water main replaced on 3 23rd Street from Dodgion Avenue to Emery Street was in compliance with all applicable standards and regulations. *Completed the plans and specifications for the main replacement 3 project along Northern Blvd. from 28th Street to 31st Street. Number of customers 48,253 48,384 48,323 48,477 Revenue (Avg. Residential) $24.17 $24.30 $25.24 $27.25 Gallons of water sold (Avg. Res.) 5,380 4,970 5,710 5,290 Percentage of water pumped that was86% 87% 88% 89% sold to customers *Monitor The City's Backflow Prevention Program. 3 *Prepare specifications and provide inspections for water main 3 replacement on Truman Road. (Yuma to Alexander) *Implement CityWorks software program. 2 *Provide inspections for water main replacement on Northern Blvd. 3 (28th Street to Sheley Road). Account Clerk II 1.00 1.00 1.00 1.00 357
Transmission
areas.
Asst Dept Director 1.00 1.00 1.00 1.00 Water Systems Director 1.00 1.00 1.00 1.00 Safety & Training Officer .00 1.00 1.00 1.00 Engineering Tech II 1.00 1.00 1.00 1.00 Engineering Tech II .17 .17 .17 .17 Engineering Tech III 1.00 1.00 1.00 1.00 Engineering Tech Supv 1.00 1.00 1.00 1.00 GIS Technician 1.00 1.00 1.00 1.00 Administrative Spec III 1.00 1.00 1.00 1.00 Support Services Supervisor 1.00 1.00 1.00 1.00 Total 9.17 10.17 10.17 10.17 ============================================ Personal Services 712,835 813,568 813,568 828,162 Other Services & Charges 407,594 506,474 506,474 438,718 Supplies 23,485 25,670 25,670 23,670 Capital Outlay 33,952 72,000 70,200 126,600 Other Expenditures 0 0 0 0 Total 1,177,866 1,417,712 1,415,912 1,417,150 ============================================
358
*Relocation to the Utility Service Center.
The Water Field Service Division is responsible for installing and maintaining meters for over 48,517 customers, inspecting new service installations and the disconnection of existing services, and investigating the high bill complaints.
*Field service workers responded to over 1800 internal and external 3 service calls per month.
*Maintain optimum water meter inventory and meter change outs in 3 response to status of the conditional proposal of the Advanced Metering Infrastructure initiative.
Water taps installed 88 79 90 90 Number of meters replaced 980 1,694 1,800 1,800
Meter Repair Worker - Water 1.00 1.00 1.00 1.00 Service Worker 7.00 7.00 7.00 7.00 Customer Service Supvr I 1.00 .00 .00 .00 Customer Service Field Supv I .00 1.00 1.00 1.00 Utility Clerk 1.00 1.00 1.00 1.00 Total 10.00 10.00 10.00 10.00 ============================================ 359
Personal Services 632,124 872,751 872,751 916,209 Other Services & Charges 1,509 15,300 15,300 10,500 Supplies 9,210 13,100 13,100 16,600 Capital Outlay 91,750 104,000 104,000 131,000 Other Expenditures 0 0 0 0 Total 734,593 1,005,151 1,005,151 1,074,309 ============================================ 360
The Customer Service Division's core functions are initializing utility services and processing payments for sewer, water, electrical services, miscellaneous other City payments, and Missouri Gas and Energy bills. Customer Service handles all phone calls regarding utility questions and all general calls requesting information regarding the City.
*A new Utility Customer Information System (CIS) has been purchased 2 with an implementation date of February 2017.
Average time to answer calls 250 SECS 257 SECS 225 SECS 225 SECS Average percentage of abandoned 23.0% 11.9% 18.0% 18.0% calls
the customer's telephone experience by lessening the average 3
Service
City and Utility
Customer
Billing
2 Account Information Rep 22.00 22.00 22.00 22.00 Customer Service Manager 1.00 1.00 1.00 1.00 Customer Service Supvr 2.00 2.00 2.00 2.00 Total 25.00 25.00 25.00 25.00 ============================================ 361
*Improve
wait time when calling Customer
for
inquiries. *Implement the new
Information and
System.
*Conversion to new customer service information system.
Personal Services 1,340,773 1,447,967 1,447,967 1,393,806 Other Services & Charges 900,201 676,977 678,777 1,002,082 Supplies 26,388 33,470 33,470 28,470 Capital Outlay 15,049 13,400 13,4004,000 Other Expenditures 0 0 0 0 Total 2,282,411 2,171,814 2,173,614 2,428,358 ============================================
362
The Production area is responsible for water treatment, water quality, and pumping from the Courtney Bend Water Treatment Plant. This plant is designed to treat up to 48 million gallons per day. The department is obligated to meet the requirements of the Safe Drinking Water Act and all standards of the Missouri Department of Natural Resources. Test results show that the water quality meets or exceeds all federal and state regulations.
*Analyzed 1,445 bacteriological samples from various locations within 3 the distribution system. 100% of the samples tested negative for coliform bacteria.
*Hosted a program on the importance of keeping the groundwater safe 3 and provided tours of the water treatment facility to Independence School District 5th grade students and their teachers. All nineteen Independence Schools attended the event, with 1,150 students participating.
*In accordance with Federal and State drinking water regulations 3 monitoring was conducted on various aspects of the drinking water. Monitoring and testing of the water is conducted for numerous parameters, some of which are monitored continuously. Water samples confirmed the water quality met or exceeded regulations.
*Collect and analyze 100 distribution system samples per month to 3 determine bacteriological quality. The presence of coliform bacteria in water samples indicates that contamination may have occurred. The Missouri Department of Natural Resources requires that 95% of samples test negative for coliform bacteria.
*Provide an educational program for 5th graders in the Independence 3 School District about groundwater contamination and the importance of keeping the water supply safe.
Millions of gallons pumped 10,460 9,652 10,600 10,000 Average number of distribution 125 122 126 115 samples taken each month Percent of samples testing negative 100 % 100 % 100 % 100 % for coliform bacteria
363
*Maintain the water quality in accordance with all State of Missouri and Federal EPA regulations. Regulations exist on many different parameters of water, from clarity to allowable limits of certain chemicals in water. Our goal is to meet and/or exceed water quality regulations.
Plant Operator "A" 2.00 2.00 2.00 2.00 Plant Operator "D" 2.00 2.00 2.00 2.00 Laborer 1.00 1.00 1.00 1.00 Plant Maintenance Utility Wkr 1.00 .00 1.00 1.00 Plant Maintenance Utility Wkr 7.00 8.00 7.00 7.00 Laborer - temp .25 .25 .25 .25 Water Production Mgr 1.00 1.00 1.00 1.00 Engineer II .00 .00 1.00 1.00 Engineer III 1.00 1.00 .00 .00 Laboratory Supvr 1.00 1.00 1.00 1.00 Laboratory Tech 2.50 2.50 2.50 2.50 Water Operations Supvr 1.00 1.00 1.00 1.00 Fiscal Technician II 1.00 1.00 1.00 1.00 Production Maint Supvr 1.00 1.00 1.00 1.00 Total 21.75 21.75 21.75 21.75 ============================================ Personal Services 1,700,092 1,855,637 1,855,637 1,926,993 Other Services & Charges 2,909,518 3,331,500 3,331,500 3,476,750 Supplies 1,310,149 1,417,995 1,417,995 1,611,000 Capital Outlay 116,518 44,660 44,660 82,000 Other Expenditures 0 0 0 0 Total 6,036,277 6,649,792 6,649,792 7,096,743 ============================================ 364
The Transmission and Distribution Division is responsible for engineering, construction, and maintenance of the transmission and distribution system that conveys water to the customers. Pipeline construction is performed to water department engineering standards that exceed the Missouri Department of Natural Resources requirements. Maintenance is performed on 760 miles of main and more than 4,946 fire hydrants.
and inspect 25% of all public fire hydrants in the 3 distribution system at least once per year.
and implement a valve inspection and maintenance program to improve the reliability of system valves.
the tie-ins
3
Street from Dodgion
*Completed
improvement
3
Main breaks 318 227 325 247 Service lines repaired 56 63 64 75 Fire hydrants tested/inspected 4,391 5,159 4,700 4,900 Fire hydrants painted 1,138 2,346 1,200 2,500 Main breaks per mile of main per .42 .30 .42 .42 year Annual operation/maintenance cost $4,490.01 $4,238.82 $4,500.00 $4,500.00 per mile of main Operations and maintenance cost per $70.63 $66.62 $71.00 $70.00 customer account per year Average response time to reported 60 MIN water main break
*Flush and inspect
hydrant in the
3 365
*Painted over 25% of all public fire hydrants in the distribution 3 system. *Flushed and inspected all public fire hydrants currently installed in 3 the distribution system. *Completed
for the new 12 inch water main installed along
23rd
to Emery Street.
system
projects along Jones Road, Oxford
Avenue, Northern Blvd., Bundschu Road and others to improve the overall reliability, and operation of the distribution system.
*Paint
*Develop
every public fire
distribution
system. Maintenance & Utility Worker .00 1.00 .00 .00 Maintenance & Utility Wkr 2.00 1.00 2.00 2.00 Construction Equip Oper 4.00 4.00 4.00 4.00 Service Worker 1.00 1.00 1.00 1.00 Leak Repair Worker 2.00 2.00 2.00 2.00 Pipe Worker 6.00 6.00 6.00 6.00 Yard Worker 1.00 1.00 1.00 1.00 Laborer 2.00 .00 2.00 1.00 Laborer 3.00 5.00 3.00 4.00 Laborer - temp .50 .50 .50 .50 Water Dist/Eng Mgr 1.00 1.00 1.00 1.00 Maintenance Supervisor-Water 2.00 2.00 2.00 2.00 Water Distribution Supvr 1.00 1.00 1.00 1.00 Utility Clerk - Water 1.00 1.00 1.00 1.00 Total 26.50 26.50 26.50 26.50 ============================================ Personal Services 2,090,491 2,357,567 2,357,567 2,444,694 Other Services & Charges 949,140 1,239,000 1,239,000 1,266,400 Supplies 456,536 635,000 635,000 641,500 Capital Outlay 244,803 148,800 148,800 228,000 Other Expenditures 0 0 0 0 Total 3,740,970 4,380,367 4,380,367 4,580,594 ============================================ 366
City of Independence, Missouri
2016-17 Operating Budget
Capital Lease/Debt Service Requirements - Water Fund
Total Debt Service Series Principal Interest Fees Requirements Revenue Bonds: 2013 Series D (6352) 4,260,000 1,206,338 8,000 5,474,338 Fund Total 4,260,000 $ 1,206,338 $ 8,000 $ 5,474,338 $ 367
City of Independence, Missouri
2016-17 Operating Budget
Capital Budget Summary - Water Fund
Project Number Project Description Source of Funds Amount 9749 Main Replacement Water Fund 300,000 9952 Security Upgrades Water Fund 25,000 70401003 Future Production Wells Water Fund 100,000 70401301 23rd St Main Replacement Water Fund 500,000 70401504 Northern Blvd. (28th to 31st) Water Fund 300,000 70401505 Distribution System Improvements Water Fund 150,000 70401506 Truman Road Booster Station Upgrades Water Fund 500,000 NEW Filter Backwash 50,000 NEW Plant Discharge Outfall Improvements Water Fund 75,000 NEW SB Drive Improvements Water Fund 75,000 NEW Little Blue Pkwy Transmission Main Improvements Water Fund 125,000 NEW Courtney Bend Basin Catwalk Improvements Water Fund 200,000 NEW Fiber Optic Connection to CBP Water Fund 300,000 NEW Truman Road 12" Main (Yuma to Alexander) Water Fund 550,000 NEW Lime Silo Water Fund 500,000 NEW Financial Management System Water Fund 600,000 Fund Total 4,350,000 $ 368
City of Independence, Missouri
2016-17 Operating Budget
Budget Summary - Tourism Fund
Source of Budget Dollars
Use of Budget Dollars
Increase 2015-16 2016-17 % (Decrease) 2014-15 Current City Manager of Over Last % Description Actual Estimate Proposed Total Year Change
For the Fiscal Years 2014-15, 2015-16 and 2016-17
585,689 $ 571,591 $ 614,453 $ 42,862 $ 7.50% Other Fund Balance Components 12,978 $ Estimated RevenuesTransient Guest Taxes 1,616,667 $ 1,831,402 $ 1,810,000 $ 94.0% (21,402) $ -1.2% Interest 94 400 400 0.0% - 0.0% Federal & State Grants - - - 0.0% - n/a Misc. Non-Operating Revenue - 22,653 75,000 3.9% 52,347 231.1% NFTM - Admissions - 40,000 40,000 2.1% - 0.0% Total Estimated Revenues 1,616,761 $ 1,894,455 $ 1,925,400 $ 100.0% 30,945 $ 1.6% Total Sources 2,215,428 $ 2,466,046 $ 2,539,853 $ 73,807 $
Operating Budget: Tourism 1,025,633 $ 902,005 $ 848,412 $ 47.0% (53,593) $ -5.9% Nat'l Frontier Trails Museum 77,806 495,194 529,062 29.3% 33,868 6.8% Historic Sites Capital Improv. 195,872 172,263 161,825 9.0% (10,438) -6.1% Tourism Sales & Services 320,799 282,131 266,172 14.7% (15,959) -5.7% Total Operating Budget 1,620,110 $ 1,851,593 $ 1,805,471 $ 100.0% (46,122) $ -2.5% Total Uses 1,620,110 $ 1,851,593 $ 1,805,471 $ (46,122) $ Changes in Fund Balance Operating Transfer Out 23,727571,591 $ 614,453 $ 734,382 $ 119,929 $ 19.52% Beginning Restricted Fund Balance Ending Restricted Fund Balance 369
City of Independence, Missouri
2016-17 Operating Budget
Fund Balance Summary - Tourism Fund For the Fiscal Years 2010-11 through 2015-16
Fund Balance Components
*based on 25% (3 months) of Annual Revenues (compared to Undesignated Fund Balance)
Source: Audited Annual Financial Statement for actual amounts Estimated based on current year projections
Actual Actual Actual Actual Actual Projected Description 6/30/2011 6/30/2012 6/30/2013 6/30/2014 6/30/2015 6/30/2016
Reserved for: Encumbrances Restricted for: Encumbrances 38,535 $ 38,715 $ 137,562 $ 153,470 $ 121,043 $ - $ Visitor Orientation Center 753,987 503,987 118,037 111,887 -NFTM Complex Development - 168,560 81,060 44,597 -Unprogrammed Tourism Fund Purposes 550,918 198,543 458,140 275,735 450,548 614,453 Total Fund Balance 1,343,440 $ 909,805 $ 794,799 $ 585,689 $ 571,591 $ 614,453 $ Fund Balance Target * 306,867 331,910 360,297 367,190 404,190 481,350 Actual over (under) Target 244,051 (133,367) 97,843 (91,455) 46,358 133,103
370
City of Independence, Missouri
2016-17 Operating Budget
Budget Summary - Street Improvements Sales Tax Fund
For the Fiscal Years 2014-15, 2015-16 and 2016-17
Source of Budget Dollars
Use of Budget Dollars
Note 1) The Street Improvements Sales Tax was approved by Independence voters August 2002 and went into effect on January 1, 2004. The tax was renewed in August 2007 for the time period January 1, 2009 to December 31, 2019 at a rate of 1/2 of one percent of the local option sales tax.
Note 2) The Santa Fe TIF Transfer will, beginning in FY 2016-17, be netted against revenue in the same manner as other TIFs.
2016-17 Increase 2015-16 City Manager % (Decrease) 2014-15 Current Proposed of Over Last % Description Actual Estimate Budget Total Year Change
3,716,655 $ 4,640,110 $ 1,648,967 $ (2,991,143) $ 64.46% Other Fund Balance Components - $ Estimated RevenuesSales Taxes 8,357,101 $ 8,350,000 $ 8,350,000 $ 100.0% - $ 0.0% Interest Income and Other 98,631 83,200 900 0.0% (82,300) -98.9% Total Estimated Revenues 8,455,732 $ 8,433,200 $ 8,350,900 $ 100.0% (82,300) $ -1.0% Transfers in 66,087 $ 1,667 $ - $ (1,667) $ Total Sources 12,238,474 $ 13,074,977 $ 9,999,867 $ (3,075,110) $
Operating Budget Public Works 205,369 $ 265,323 $ 563,727 $ 6.5% 298,404 $ Debt Service 529,841 532,694 530,154 6.2% (2,540) -0.5% Total Operating Budget 735,210 $ 798,017 $ 1,093,881 $ 12.7% 295,864 $ Capital Budget: Overlay Program 5,932,687 $ 5,927,985 $ 6,625,537 $ 77.0% 697,552 $ 11.8% Bridge Improvements 210,170 29,662 - 0.0% (29,662) 0.0% Street Improvements 493,214 2,871,884 750,000 8.7% (2,121,884) Safety Improvements 185,250 1,510,670 140,000 1.6% (1,370,670) 0.0% Total Capital Budget 6,821,321 $ 10,340,201 $ 7,515,537 $ 87.3% (2,824,664) $ Other Financing Sources: Santa Fe TIF 14,485 $ 13,200 $ - $ 0.0% (13,200) $ -100.0% Capital Project Transfers 27,347 $ 274,592 $ - $ Total Uses 7,598,363 $ 11,426,010 $ 8,609,418 $ (2,816,592) $ 4,640,110 $ 1,648,967 $ 1,390,449 (258,518) $ -15.68%
Ending Fund Balance 371
Beginning Fund Balance
City of Independence, Missouri
2016-17 Operating Budget
Fund Balance Summary - Street Improvements Sales Tax Fund
For the Fiscal Years 2010-11 through 2015-16
Fund Balance Components
Source: Audited Annual Financial Statement for actual amounts March 31, 2015 monthly Financial and Operating Report for projected amounts
Actual Actual Actual Actual Actual Projected Description 6/30/2011 6/30/2012 6/30/2013 6/30/2014 6/30/2015 6/30/2016
Restricted for: Encumbrances - $ - $ - $ - $ - $ Other Purposes - - - - -Unprogrammed Street Improv. Sales Tax Fund Purposes 2,491,735 4,567,570 2,846,198 3,716,655 4,640,110 1,648,967 Total Fund Balance 2,491,735 $ 4,567,570 $ 2,846,198 $ 3,716,655 $ 4,640,110 $ 1,648,967 $
372
City of Independence, Missouri
2016-17 Operating Budget
Capital Budget Summary - Street Improvements Sales Tax Fund
Project Number Project Description Source of Funds Amount Street Improvements: Overlay 70111601 2016 Overlay Program Street Improv. Sales Tax 5,725,537 $ new 2017 Overlay Program Street Improv. Sales Tax 900,000 Total Overlay 6,625,537 $ Street Improvements 70111103 Alley Rehabilitation Street Improv. Sales Tax 200,000 70111501 39th & Noland Street Improv. Sales Tax 180,000 70111307 78 Highway and Truman Street Improv. Sales Tax 220,000 70111402 Crysler Complete Streets Street Improv. Sales Tax 150,000 Total Street Improvements 750,000 $ Safety Improvements 70110409 Operation Green Light Street Improv. Sales Tax 40,000 $ 70110807 Sidewalks to City Parks Improvements Street Improv. Sales Tax 100,000 Total Safety Improvements 140,000 $ Fund Total 7,515,537 $ 373
City of Independence, Missouri
2016-17 Operating Budget
Budget Summary - Park Improvements Sales Tax Fund
For the Fiscal Years 2014-15, 2015-16 and 2016-17
Source of Budget Dollars
Beginning Fund Balance
Use of Budget Dollars
Ending Fund Balance
Note 1) The Park Improvements Sales Tax was approved by Independence voters August 2002 and went into effect on January 1, 2004. The tax rate of 1/4 of one percent of local option sales was renewed August 2010 and will be in effect until repealed.
Note 2) The above negative Fund Balance amounts reflect authorized appropriations for multi-year projects where the actual cash disbursement will occur in subsequent fiscal years and will be paid from future sales tax receipts. Staff continually monitors the cash flow on these projects to assure that cash is available at the time needed to pay for project expenses and that the timing for initiating the projects is handled in such a way that projects are not started without a cash flow plan in hand to pay for project expenses as they occur.
2016-17 Increase 2015-16 City Manager % (Decrease) 2014-15 Current Proposed of Over Last % Description Actual Estimate Budget Total Year Change
(4,984,064) $ (4,458,708) $ (3,092,351) $ 1,366,357 $ 30.64% Other Fund Balance Components 33,729 $ Estimated RevenuesSales Taxes 4,178,652 $ 4,180,000 $ 4,180,000 $ 90.7% - $ 0.0% Adventure Oasis Water Park 308,969 315,148 321,451 7.0% 6,303 2.0% Interest Income and Other 151,740 111,055 106,700 2.3% (4,355) -3.9% Total Estimated Revenues 4,639,361 $ 4,606,203 $ 4,608,151 $ 1,948 $ 0.0% Proceeds from Debt Issuance - - $ - $ Capital Project Transfers 45,859 - - $Total Sources (265,115) $ 147,495 $ 1,515,800 $ 1,368,305 $
Operating Budget: 6041-Security & Inspection 701,433 $ 687,249 $ 868,160 $ 27.4% 180,911 $ 26.3% 6042-Truman Memorial Bldg. 269,622 314,945 337,550 10.6% 22,605 7.2% 6043-Palmer Senior Adult 187,397 216,088 218,383 6.9% 2,295 1.1% Center 6044-Family Recreation 199,416 164,853 215,375 6.8% 50,522 30.6% Programs - 0.0% 6045-Adventure Oasis Water 568,649 558,602 576,706 18.2% 18,104 3.2% Park6046 - Sports Complex 545,128 639,980 641,028 20.2% 1,048 0.2% Total Operating Budget 2,471,645 2,581,717 2,857,202 275,485 Debt Service 33,330 - - 0.0% - n/a Total Operating Budget 2,504,975 $ 2,581,717 $ 2,857,202 $ 90.1% 275,485 $ 10.7% Capital Budget: Capital Projects 1,662,611 $ 651,129 $ 315,000 9.9% (336,129) -51.6% Total Capital Budget 1,662,611 $ 651,129 $ 315,000 $ Operating Transfers: Transfers out 26,007 7,000 - 0.0% (7,000) Total Uses 4,193,593 $ 3,239,846 $ 3,172,202 $ 100.0% (67,644) $ -2.1% (4,458,708) $ (3,092,351) $ (1,656,402) $ 1,435,949 $ 46.44%
374
City of Independence, Missouri
2016-17 Operating Budget
Fund Balance Summary - Parks and Recreation Improvements Sales Tax Fund
For the Fiscal Years 2010-11 through 2015-16
Fund Balance Components
Source: Audited Annual Financial Statement for actual amounts
March 31, 2016 monthly Financial and Operating Report for projected amounts
Actual Actual Actual Actual Actual Projected Description 6/30/2011 6/30/2011 6/30/2013 6/30/2014 6/30/2015 6/30/2016
Restricted for: Encumbrances - $ - $ - $ - $ - $ Other Purposes - - - -Unprogrammed Parks Improv. Sales Tax Fund Purposes (5,006,608) (5,793,401) (6,382,130) (4,984,064) (4,458,708) (3,092,351) Total Fund Balance $(5,006,608) $(5,793,401) $(6,382,130) $(4,984,064) $(4,458,708) $(3,092,351)
375
Capital Budget Summary - Park Improv. Sales Tax Fund
City of Independence, Missouri 2016-17 Operating Budget
Project Number Project Description Source of Funds Amount 9970 Park Revitalization Park Improv. Sales Tax 315,000 $ Fund Total 315,000 $ 376
City of Independence, Missouri
2016-17 Operating Budget
Budget Summary - Storm Water Sales Tax Fund
Source of Budget Dollars
Beginning Fund Balance
Use of Budget Dollars
Note 1) The Storm Water Improvements Sales Tax was approved by Independence voters on August 3, 2010 and went into effect on January 1, 2011. The tax rate of 1/4 of one percent of local option sales tax and will be in effect until repealed.
Note 2) The Santa Fe TIF Transfer will, beginning in FY 2016-17, be netted against revenue in the same manner as other TIFs.
2016-17 Increase 2015-16 City Manager % (Decrease) 2014-15 Current Proposed of Over Last % Description Actual Estimate Budget Total Year Change
For the Fiscal Years 2014-15, 2015-16 and 2016-17
8,358,432 $ 7,385,985 $ 2,270,836 $ (5,115,149) $ -69.25% Other Fund Balance Components 99,496 $ Estimated RevenuesSales Taxes 4,178,663 $ 4,180,000 $ 4,180,000 $ 99.9% - $ 0.0% Interest Income and Other 1,674 4,000 4,000 0.1% - 0.0% Total Estimated Revenues 4,180,337 $ 4,184,000 $ 4,184,000 $ 100.0% - $ 0.0% Other Sources Transfers In - 220,338Total Sources 12,638,265 $ 11,790,323 $ 6,454,836 $ (5,335,487) $
Operating Budget: Storm Water Administration 117,548 $ 309,037 $ 450,634 $ 7.0% 141,597 $ 45.8% Storm Water Maintenance 1,257,907 1,822,754 2,103,483 32.6% 280,729 15.4% Storm Water Permit 346,891 361,425 361,425 5.6% - 0.0% Compliance Total Operating Budget 1,722,346 $ 2,493,216 $ 2,915,542 $ 45.2% 422,326 $ 16.9% Capital Budget: Capital Projects 2,795,481 $ 6,335,188 $ 1,495,000 $ 23.2% (4,840,188) $ -76.4% $ Total Capital Budget 2,795,481 $ 6,335,188 $ 1,495,000 $ (4,840,188) $ Operating Transfers: Santa Fe TIF Transfer 6,992 $ 6,800 $ - $ 0.0% (6,800) Falls at Crackerneck Creek 727,461 684,283 494,020 7.7% (190,263) General Fund - - 197,063 3.1% 197,063 Total Transfers 734,453 $ 691,083 $ 691,083 $ - $ Total Uses 5,252,280 $ 9,519,487 $ 5,101,625 $ 100.0% (4,417,862) $ 7,385,985 $ 2,270,836 $ 1,353,211 $ (917,625) $ 40.41%
Ending Fund Balance 377
City of Independence, Missouri
2016-17 Operating Budget
Fund Balance Summary - Stormwater Improvements Sales Tax Fund
For the Fiscal Years 2010-11 through 2015-16
Fund Balance Components
Source: Audited Annual Financial Statement for actual amounts
March 31, 2016 monthly Financial and Operating Report for projected amounts
Actual Actual Actual Actual Actual Projected Description 6/30/2011 6/30/2012 6/30/2013 6/30/2014 6/30/2015 6/30/2016
Restricted for: Encumbrances - $ - $ - $ Emergency ResponseDetention Basin Const.Detention Basin Maint.Unprogrammed Stormwater Improv.Sales Tax Fund Purposes 7,257,027 6,568,453 7,405,051 8,358,432 7,385,985 2,270,836 Total Fund Balance 7,257,027 $ 6,568,453 $ 7,405,051 $ 8,358,432 $ 2,270,836 $
378
City of Independence, Missouri
2016-17 Operating Budget
Capital Budget Summary - Storm Water Sales Tax Fund
Project Number Project Description Source of Funds Amount 70131504 Drumm to Crane Storm Water Sales Tax $ 350,000 70131501 Rock Creek Neighborhood Projects Storm Water Sales Tax 700,000 NEW 19th & Norwood Storm Water Sales Tax 195,000 NEW Walnut Gardens, RD Mize & Gateway Drive Storm Water Sales Tax 170,000 NEW Blue Lawn - E. 31st-E. 32nd - East of Arlington Storm Water Sales Tax 80,000 Fund Total 1,495,000 $ 379
City of Independence, Missouri
2016-17 Operating Budget
Budget Summary - Police Public Safety Sales Tax Fund
For the Fiscal Years 2014-15, 2015-16 and 2016-17
Source of Budget Dollars
Beginning Fund Balance
Use of Budget Dollars
Note 1) The Police Public Safety Sales Tax was approved by Independence voters on August 3, 2004 and went into effect on January 1, 2005. The rate of 1/8 of one percent of local option sales tax will expire on December 31, 2016.
Note 2) The Santa Fe TIF Transfer will, beginning in FY 2016-17, be netted against revenue in the same manner as other TIFs.
2016-17 Increase 2015-16 City Manager % (Decrease) 2014-15 Current Proposed of Over Last % Description Actual Estimate Budget Total Year Change
2,356,260 $ 1,557,817 $ 1,721,447 $ 163,630 $ 10.50% Other Fund Balance Components (817,736) $ Estimated RevenuesSales Taxes 2,211,890 $ 2,210,000 $ 2,210,000 $ 100.0% - $ 0.0% Interest Income and Other 67,298 44,663 600 0.0% (44,063) -98.7% Total Estimated Revenues 2,279,188 $ 2,254,663 $ 2,210,600 $ 100.0% (44,063) $ -2.0% Proceeds from Debt Issue - -Total Sources 3,817,712 $ 3,812,480 $ 3,932,047 $ 119,567 $
Operating Budget: Police Department: Communications 299,995 $ 351,944 $ 313,819 $ 13.3% (38,125) $ -10.8% Facilities 276,294 569,000 569,500 24.1% 500 0.1% Equipment 1,167,112 1,166,789 1,475,422 62.6% 308,633 26.5% Total Police Department 1,743,401 $ 2,087,733 $ 2,358,741 $ 100.0% 271,008 $ Debt Service 511,794 - - 0.0% - n/a Total Operating Budget 2,255,195 $ 2,087,733 $ 2,358,741 $ 100.0% 271,008 $ 13.0% Capital Budget: Capital Projects - - - 0.0%Operating Transfers: Santa Fe TIF - $ 3,300 $ - $ 0.0% (3,300) Capital Project Transfers 4,700 - $ 0.0%Total Uses 2,259,895 $ 2,091,033 $ 2,358,741 $ 100.0% 267,708 $ 1,557,817 $ 1,721,447 $ 1,573,306 $ (148,141) $ -8.61%
Ending Fund Balance 380
City of Independence, Missouri
2016-17 Operating Budget
Fund Balance Summary - Police Public Safety Sales Tax Fund
For the Fiscal Years 2010-11 through 2015-16
Fund Balance Components
Source: Audited Annual Financial Statement for actual amounts March 31, 2016 monthly Financial and Operating Report for projected amounts
Actual Actual Actual Actual Actual Projected Description 6/30/2011 6/30/2012 6/30/2013 6/30/2014 6/30/2015 6/30/2016
Restricted for: Encumbrances - $ - $ - $ - $ - $ Debt Service Unprogrammed Police Sales Tax Fund Purposes 1,967,871 2,161,900 2,317,625 2,356,260 1,557,817 1,721,447 Total Fund Balance 1,967,871 $ 2,161,900 $ 2,317,625 $ 2,356,260 $ 1,557,817 $ 1,721,447 $
381
City of Independence, Missouri
2016-17 Operating Budget
Budget Summary - Fire Public Safety Sales Tax Fund
For the Fiscal Years 2014-15, 2015-16 and 2016-17
Source of Budget Dollars
Beginning Fund Balance
Use of Budget Dollars
Note 1) The Fire Public Safety Sales Tax was approved by Independence voters on August 3, 2004 and went into effect on January 1, 2005. The rate of 1/4 of one percent of local option sales tax dropped to 1/8 of one percent on January 1, 2009 and will expire on December 31, 2016.
2016-17 Increase 2015-16 City Manager % (Decrease) 2014-15 Current Proposed of Over Last % Description Actual Estimate Budget Total Year Change
896,496 $ 1,505,114 $ 1,625,452 $ 120,338 $ 8.00% Estimated RevenuesSales Taxes 2,089,554 $ 2,100,000 $ 2,100,000 $ 100.0% - $ 0.0% Interest Income and Other 220 200 800 0.0% 600 300.0% Total Estimated Revenues 2,089,774 $ 2,100,200 $ 2,100,800 $ 100.0% 600 $ 0.0% Proceeds from Debt IssuanceTotal Sources 2,986,270 $ 3,605,314 $ 3,726,252 $ (3,605,314) $
Operating Budget: Fire Department: Operations 437,147 $ 656,905 $ 962,582 $ 46.2% 305,677 $ 46.5% Vehicles 388,125 1,049,049 670,000 32.2% (379,049) -36.1% Repair Fire Stations 15,764 134,408 300,000 14.4% 165,592 123.2% Tools and Equipment 77,540 135,500 151,000 7.2% 15,500 11.4% Total Fire Department 918,576 $ 1,975,862 $ 2,083,582 $ 100.0% 107,720 $ Debt Service 552,563 - - 0.0% - n/a Total Operating Budget 1,471,139 $ 1,975,862 $ 2,083,582 $ 100.0% 107,720 $ 5.5% Capital Budget: Capital Projects - $ - $ - $ 0.0% - $ n/a Total Capital Budget - $ - $ - $ - $ Operating Transfers: Santa Fe TIF 4,925 4,000 - 0.0% (4,000) -100.0% Capital Project Transfers 5,092 -Total Uses 1,481,156 $ 1,979,862 $ 2,083,582 $ 100.0% 103,720 $ 1,505,114 $ 1,625,452 $ 1,642,670 $ 17,218 $ 1.06%
Note 2) The Santa Fe TIF Transfer will, beginning in FY 2016-17, be netted against revenue in the same manner as other TIFs. Ending Fund Balance 382
City of Independence, Missouri
2016-17 Operating Budget
Fund Balance Summary - Fire Public Safety Sales Tax Fund
For the Fiscal Years 2010-11 through 2015-16
Fund Balance Components
Source: Audited Annual Financial Statement for actual amounts March 31, 2016 monthly Financial and Operating Report for projected amounts
Actual Actual Actual Actual Actual Projected Description 6/30/2011 6/30/2012 6/30/2013 6/30/2014 6/30/2015 6/30/2015
Restricted for: Encumbrances - $ - $ - $ - $ - $ - $ Debt Service Unprogrammed Fire Sales Tax Fund Purposes 810,193 1,846,225 2,323,101 896,496 1,505,114 1,625,452 Total Fund Balance 810,193 $ 1,846,225 $ 2,323,101 $ 896,496 $ 1,505,114 $ 1,625,452 $
383
City of Independence, Missouri
2016-17 Operating Budget
Budget Summary - Grants Fund
For the Fiscal Years 2014-15, 2015-16 and 2016-17
Source of Budget Dollars
Use of Budget Dollars
Note: The listed appropriations are for planning purposes only. Due to varying time frames and the uncertainty of renewal, actual appropriations will be approved by City Council action as each grant is renewed.
2016-17 Increase 2015-16 City Manager % (Decrease) 2014-15 Current Proposed of Over Last % Description Actual Estimate Budget Total Year Change
Other Fund Balance Components 241,198 $ Estimated RevenuesGrants and Shared Revenue 2,172,478 $ 1,872,231 $ 870,985 $ 73.8% (1,001,246) $ -53.5% Charges for Current Services 470,551 448,529 308,540 26.2% (139,989) -31.2% Interest Income and Other 280,540 16,280 - 0.0% (16,280) n/a Total Estimated Revenues 2,923,569 $ 2,337,040 $ 1,179,525 $ 100.0% (1,157,515) $ -49.5% Total Sources 3,164,767 $ 2,337,040 $ 1,179,525 $ (1,157,515) $ -49.5%
Operating Budget: Law Department 12,352 $ 37,459 $ 18,189 $ 1.5% (19,270) $ -51.4% Human Resources 387 $ Community Development 729,733 143,993 209,000 17.7% 65,007 Police Department 1,264,359 1,080,068 341,491 29.0% (738,577) -68.4% Fire Department 440,690 152,411 87,060 7.4% (65,351) -42.9% Health Department 536,537 923,109 523,785 44.4% (399,324) -43.3% Parks and Recreation 180,709 Total Operating Budget 3,164,767 $ 2,337,040 $ 1,179,525 $ 100.0% (1,157,515) $ -49.5% Total Uses 3,164,767 $ 2,337,040 $ 1,179,525 $ 100.0% (1,157,515) $ -49.5% Balance Available - $ - $ - $ - $
384
City of Independence, Missouri 2016-17 Operating Budget
Budget Summary - Other Funds
For the Fiscal Year 2016-17
Source of Budget Dollars
Allocation of Budget Dollars
Note 1) Each of these funds are intended to be "zero balance" funds whereby the total sources and allocations equal each other.
Community Development HOME Worker's Block Grant Program Compensation Description Fund Fund Fund
Estimated RevenuesFederal Grant - CDBG 421,902 $ HOME Program Grant 279,721 $ Worker's Compensation 2,478,700 $ Total Estimated Revenues 421,902 $ 279,721 $ 2,478,700 $ Proceeds from Debt Service - $ - $ - $ Total Sources 421,902 $ 279,721 $ 2,478,700 $
Operating DepartmentsLaw 2,478,700 $ Community Development 151,902 $ 34,807 $ Total Operating Departments 151,902 $ 34,807 $ 2,478,700 $ Grant Authorized Programming Community Dev. Block Grant 270,000 Home Program 244,914 Total Allocations 421,902 $ 279,721 $ 2,478,700 $ Balance Available - $ - $ - $ (see Note 1) (see Note 1) (see Note 1)
Premiums 385
City of Independence, Missouri
2016-17 Operating Budget
Budget Summary - Internal Service Funds
For the Fiscal Year 2016-17
Source of Budget Dollars
Allocation of Budget Dollars
(see Note 1) (see Notes 1 & 2)
Each of these funds are intended to be "zero balance" funds whereby the total sources and allocations equal This Internal Service fund represents activity for the City's self funded employee health insurance program. Because it is operated as an "Insurance" type fund, sometimes it has either a positive or negative Balance Available which represents planned changes.
Staywell Garage Healthcare Description Fund Fund
Central
Estimated RevenuesCentral Garage Charges 1,970,467 $ Staywell Healthcare Premiums 24,533,600 $ Premiums Total Estimated Revenues 1,970,467 $ 24,533,600 $ Total Sources 1,970,467 $ 24,533,600 $
Operating DepartmentsPublic Works 1,970,467 $ Non-Departmental 24,533,600 Total Operating Departments 1,970,467 $ 24,533,600 $ Total Allocations 1,970,467 $ 24,533,600 $
Available
$
$
Balance
-
-
Note 1) Note 2) Pharmacy Benefit 386
2015-16 2015-16 2016-17 %Chg. Acct. 2014-15 Original Current Proposed Curr Est No. Description Actual Budget Estimate Budget to Prop 4-3043 Transient Guest Tax 1,618,246 1,800,000 1,831,402 1,810,000 -1.2% 4-3250 State Grant - Other -37,914 0 0 0 4-3331 NFTM-Admissions 0 40,000 40,000 40,000 4-3411 Interest Income 87 200 400 400 0.0% 4-3449 Misc. Non-Operating Revenue 36,342 28,000 22,653 75,000 231.1% Total Revenues $1,616,761 $1,868,200 $1,894,455 $1,925,400 1.6% 11-3041 Sales Tax 8,357,101 7,996,718 8,350,000 8,350,000 0.0% 11-3411 Interest 631 900 900 900 11-3449 Misc. Non-Operating Revenue 98,000 0 0 0 Total Revenues $8,455,732 $7,997,618 $8,350,900 $8,350,900 0.0% 12-3041 Sales Tax 4,178,652 3,998,359 4,180,000 4,180,000 0.0% 12-3321 Athletic Fees 3,854 0 0 0 12-3322 Program Fees 38,200 50,000 38,480 40,400 5.0% 12-3323 Concessions 47,388 32,000 19,300 20,000 3.6% 12-3326 Water Park Fees/Memberships 308,969 440,000 315,148 321,451 2.0% 12-3327 Center Fees/Club Memberships 8,012 6,000 6,725 5,800 -13.8% 12-3329 Facility Rentals 40,480 48,000 26,550 30,500 14.9% 12-3449 Misc. Non-Operating Revenue 11,651 0 20,000 10,000 -50.0% Total Revenues $4,637,207 $4,574,359 $4,606,203 $4,608,151 0.0% 13-3041 Sales Tax 4,178,663 3,998,359 4,180,000 4,180,000 0.0% 13-3411 Interest 1,673 3,000 4,000 4,000 0.0% Total Revenues $4,180,336 $4,001,359 $4,184,000 $4,184,000 0.0% 16-3041 Sales Tax 2,211,890 2,136,926 2,210,000 2,210,000 0.0% 16-3411 Interest 379 900 600 600 0.0% 16-3449 Misc. Non-Operating Revenue 27,001 0 44,063 0 -100.0% Total Revenues $2,239,269 $2,137,826 $2,254,663 $2,210,600 -2.0% Tourism Fund Storm Water Improvements Sales Tax Fund Police Sales Tax Fund City of Independence, Missouri 2016-17 Operating Budget Revenue Summary For the Fiscal Years 2014-15, 2015-16 and 2016-17 Street Improvements Sales Tax Fund Parks Improvements Sales Tax Fund 387
2015-16 2015-16 2016-17 %Chg. Acct. 2014-15 Original Current Proposed Curr Est No. Description Actual Budget Estimate Budget to Prop City of Independence, Missouri 2016-17 Operating Budget Revenue Summary For the Fiscal Years 2014-15, 2015-16 and 2016-17 17-3041 Sales Tax 2,089,554 2,002,902 2,100,000 2,100,000 0.0% 17-3411 Interest 220 800 800 800 0.0% Total Revenues $2,089,774 $2,003,702 $2,100,800 $2,100,800 0.0% 14-3108 License Tax 103,481 175,000 160,000 100,000 -37.5% 14-3411 Interest 180 300 500 0 -100.0% Total Revenues $103,662 $175,300 $160,500 $100,000 -37.7% 8-3204 Federal Grant - CDBG 798,319 346,865 759,326 421,902 -44.4% Total Revenues $798,319 $346,865 $759,326 $421,902 -44.4% 9-3209 HOME Program Grant 256,435 246,498 308,121 279,721 -9.2% Total Revenues $256,435 $246,498 $308,121 $279,721 -9.2% 15-3210 Emergency Mgmt. Assist. 107,290 82,808 113,632 87,060 -23.4% 15-3211 Public Health Nursing 158,418 215,479 540,321 210,659 -61.0% 15-3219 Other Federal Grants 1,708,394 462,494 2,059,393 573,266 -72.2% 15-3250 Other State Grants 127,648 80,323 63,442 0 -100.0% 15-3279 Other Misc. Grants 70,727 6,000 118,302 0 -100.0% 15-3316 Reimb. For Police Services 141,152 99,540 93,594 99,540 6.4% 15-3398 Miscellaneous Charges 329,398 209,000 313,084 209,000 -33.2% 15-3435 Contributions 206,106 0 23,422 0 -100.0% Total Revenues $2,849,135 $1,155,644 $3,325,190 $1,179,525 -64.5% Grants Fund Fire Sales Tax Fund License Surcharge (Excise Tax) Fund Community Development Block Grant Fund HOME Program Fund 388
2015-16 2015-16 2016-17 %Chg. Acct. 2014-15 Original Current Proposed Curr Est No. Description Actual Budget Estimate Budget to Prop City of Independence, Missouri 2016-17 Operating Budget Revenue Summary For the Fiscal Years 2014-15, 2015-16 and 2016-17 90-3380 Central Garage Charges 1,966,724 2,310,840 2,087,640 1,968,117 -5.7% 90-3411 Interest Income 148 250 350 350 0.0% 90-3449 Misc. Non-Operating Revenue 14,293 5,000 2,000 2,000 0.0% Total Revenues $1,981,165 $2,316,090 $2,089,990 $1,970,467 -5.7% 91-3461 Premiums 24,185,700 21,803,576 22,513,723 23,625,600 4.9% 91-3413 Interest - Other 4,155 6,000 8,000 8,000 0.0% 91-3449 Misc. Non-Operating Revenue 1,402,328 700,000 900,000 900,000 0.0% Total Revenues $25,592,182 $22,509,576 $23,421,723 $24,533,600 4.7% 92-3411 Interest Income 1,090 2,000 2,700 2,700 0.0% 92-3471 Workers Comp Premiums 2,551,500 2,561,000 2,561,000 2,476,000 -3.3% 92-3472 Reinsurance Reimbursements 76,722 72,000 198,886 0 -100.0% Total Revenues $2,629,313 $2,635,000 $2,762,586 $2,478,700 -10.3%
Workers' Compensation
389
Central Garage Fund Staywell
Healthcare
Fund
Fund
2016-17 Operating Budget All Funds Summary
Source of Budget Dollars
Fines and Forfeitures, $3,623,000 , 1%
Services Charges, $2,672,716 , 1%
Payment in Lieu of Taxes, $19,103,195 , 7%
Intergovernmental Revenue, $6,862,420 , 2%
Licenses & Permits, $3,759,869 , 1%
Utility Service Charges, $194,586,784 , 65%
Other Revenue, $12,109,180 , 4%
Taxes, $57,950,500 , 19%
Allocation of Budget Dollars


General Fund, $74,638,680 , 25%


Special Revenue Funds, $25,360,999 , 8%
Water Fund, $32,359,384 , 11%
Sanitary Sewer Fund, $25,453,425 , 8%
Power & Light Fund, $142,845,176 , 48%
390
City of Independence, Missouri
2016-17 Operating Budget
Budget Summary - All Funds
For the Fiscal Years 2014-15, 2015-16 and 2016-17
Source of Budget Dollars
Use of Budget Dollars
2016-17 Increase 2015-16 City Manager % (Decrease) 2014-15 Original Proposed of Over Last % Description Actual Budget Budget Total Year Change
Estimated RevenuesTaxes, excluding PILOTS 58,388,341 $ 58,564,168 $ 57,950,500 $ 19.3% (613,668) $ -1.0% Payment in Lieu of Taxes 18,413,389 $ 18,868,596 $ 19,103,195 $ 6.4% 234,599 1.2% Licenses & Permits 3,682,050 $ 3,403,687 $ 3,759,869 $ 1.3% 356,182 10.5% Grants & Shared Revenue 8,550,557 $ 7,189,690 $ 6,862,420 $ 2.3% (327,270) -4.6% Charges for Current Ser. 2,643,400 $ 2,809,310 $ 2,672,716 $ 0.9% (136,594) -4.9% Fines and Forfeitures 4,652,309 $ 4,921,960 $ 3,623,000 $ 1.2% (1,298,960) -26.4% Utility Service Charges 187,496,441 $ 194,450,156 $ 194,586,784 $ 64.8% 136,628 0.1% Interfund Charges 7,820,008 $ 7,702,060 $ 8,096,267 $ 2.7% 394,207 5.1% Other Revenue 1,609,052 $ 805,500 $ 3,805,850 $ 1.3% 3,000,350 372.5% Total Est. Revenues 293,255,546 $ 300,115,127 $ 300,460,601 $ 100.0% 1,745,474 $ 0.6% Net Transfers In 10,000 $ 207,063 $ 197,063 $ Total Sources 301,525,127 $ 300,667,664 $ 542,537 $ 0.2%
Operating DepartmentsCity Council 455,766 $ 453,821 $ 482,118 $ 0.2% 28,297 $ 6.2% City Clerk 381,705 $ 366,691 $ 321,384 $ 0.1% (45,307) -12.4% Nat'l Front. Trails Museum 261,914 $ - $ - $ 0.0% -Technology Services 1,794,575 $ 1,996,601 $ 1,882,214 $ 0.6% (114,387) -5.7% Municipal Court 827,283 $ 836,066 $ 853,290 $ 0.3% 17,224 2.1% Law 801,649 $ 773,828 $ 751,037 $ 0.3% (22,791) -2.9% City Manager 886,592 $ 984,378 $ 918,674 $ 0.3% (65,704) -6.7% Tourism 1,620,110 $ 1,851,593 $ - $ 0.0% (1,851,593) -100.0% Finance 15,916,171 $ 17,593,534 $ 1,899,423 $ 0.7% (15,694,111) -89.2% Human Resources 451,163 $ 459,444 $ 491,198 $ 0.2% 31,754 6.9% Community Dev. 4,696,706 $ 3,649,076 $ 3,999,057 $ 1.4% 349,981 9.6% Police 30,337,516 $ 29,527,281 $ 29,766,832 $ 10.2% 239,551 0.8% Fire 18,573,637 $ 19,072,841 $ 19,953,067 $ 6.9% 880,226 4.6% Health 3,233,844 $ 3,077,940 $ 3,131,845 $ 1.1% 53,905 1.8% Water 6,193,309 $ 6,602,387 $ 16,597,154 $ 5.7% 9,994,767 151.4% Public Works 5,912,660 $ 6,172,085 $ 6,072,181 $ 2.1% (99,904) -1.6% Water Pollution Contr. 14,145,303 $ 17,354,988 $ 18,466,159 $ 6.4% 1,111,171 6.4% Parks and Recreation 1,766,157 $ 4,214,951 $ 6,153,401 $ 2.1% 1,938,450 46.0% Power and Light 104,186,379 $ 109,912,847 $ 114,058,507 $ 39.2% 4,145,660 3.8% Non-Departmental 41,493,855 $ 43,049,141 $ 44,316,889 $ 15.2% 1,267,748 2.9% Debt Service 16,083,481 $ 20,877,871 $ 20,161,681 $ 6.9% (716,190) -3.4% Capital Outlay 343,177 $ 400,000 $ 376,700 $ 0.1% (23,300) -5.8% Total Departments 270,362,952 $ 289,227,364 $ 290,652,811 $ 100.0% 1,425,447 $ 0.5% Utility/Sales Tax Funds-Cap. Budget 27,172,916 31,618,537 4,445,621 16.4% Net Transfers Out/Designations 3,379,140 985,556 (2,393,584) -70.8% Total Uses 319,779,420 $ 323,256,904 $ 3,477,484 $ 1.1% 391
City of Independence, Missouri
2016-17 Operating Budget
Summary of Sources and Uses by Fund and Fund Type - Combined Total for All Funds
(continued on the next page)
Special Enterprise Funds Internal Grand General Revenue Power & Sanitary Water Service Total Description / Funds Fund Funds Light Fund Sewer Fund Fund Funds All Funds Sources: Estimated Revenues 74,441,617 25,360,999 142,845,176 25,453,425 32,359,384 28,982,767 329,443,368 Proceeds from Debt Issuance
Consolidation AdjustmentsInterfund Charges for Support Ser. (114,461) (3,792,530) (1,475,570) (2,713,706) (8,096,267) Internal Service Fund Chgs (28,982,767) (28,982,767) Transfers InFrom Other Funds / Sources 197,063 10,000 207,063 Total Sources 74,638,680 $ 25,246,538 $ 139,052,646 $ 23,987,855 $ 29,645,678 $ - $ 292,571,397 $ Uses: Operating BudgetsCity Council 482,118 $ 482,118 $ City Clerk 321,384 321,384 City Manager 918,674 918,674 Technology Services 1,748,129 134,085 1,882,214 Municipal Court 853,290 853,290 Law 732,848 18,189 2,478,700 3,229,737 Finance 1,846,418 53,005 1,899,423 Human Resources 491,198 491,198 Community Development 3,088,434 910,623 3,999,057 Police 27,066,600 2,700,232 29,766,832 Fire 17,782,425 2,170,642 19,953,067 Health 2,608,060 523,785 3,131,845 Water 16,597,154 16,597,154 Public Works 5,419,548 563,727 88,906 1,970,467 8,042,648 Water Pollution Control 2,915,542 15,550,617 18,466,159 Parks and Recreation 1,490,728 4,662,673 6,153,401
-
392
City of Independence, Missouri
2016-17 Operating Budget
Summary of Sources and Uses by Fund and Fund Type - Combined Total for All Funds
Special Enterprise Funds Internal Grand General Revenue Power & Sanitary Water Service Total Description / Funds Fund Funds Light Fund Sewer Fund Fund Funds All Funds Operating Budgets (continued)Power and Light 114,058,507 114,058,507 Non-Departmental 9,557,222 - 22,806,332 4,890,428 7,062,907 24,533,600 68,850,489 Debt Service/Lease Purch. 530,154 8,946,157 6,287,757 4,397,613 20,161,681 Capital Outlay 376,700 376,700 Operating Budget Total 74,783,776 $ 14,995,567 $ 145,945,081 $ 26,817,708 $ 28,110,679 $ 28,982,767 $ 319,635,578 $ Consolidation AdjustmentsInterfund Charges for Support Ser. (114,461) (3,792,530) (1,475,570) (2,713,706) (8,096,267) Internal Service Fund Chgs (28,982,767) (28,982,767) Consolidated Operating Budg. 74,783,776 14,881,106 142,152,551 25,342,138 25,396,973 - 282,556,544 Capital Budget 9,325,537 16,390,000 1,553,000 4,350,000 31,618,537 Total Operating/Capital Budg. 74,783,776 $ 24,206,643 $ 158,542,551 $ 26,895,138 $ 29,746,973 $ - $ 314,175,081 $ Transfers OutDesig. for Capital & Grants -To Other Funds - 691,083 99,261 109,186 86,026 985,556 Total Uses 74,783,776 $ 24,897,726 $ 158,641,812 $ 27,004,324 $ 29,832,999 $ - $ 315,160,637 $ 393
City of Independence, Missouri
2016-17 Operating Budget
Summary of Sources and Uses by Fund and Fund Type - Combining Total for Special Revenue Funds
Note1) the combined total for these Funds is included in the calculation of the City-wide total on the previous schedule.
License Total Combined Surcharge CDBG HOME Special Sales Tax Grants Tourism (Excise Tax) Program Program Revenue Description / Fund Funds Fund Fund Fund Fund Fund Funds Sources: Estimated Revenues 21,454,451 1,179,525 1,925,400 100,000 421,902 279,721 25,360,999 Consolidation AdjustmentsInterfund Charges for Support Ser. (44,067) (70,394) (114,461) Transfers InFrom Other FundsTotal Sources 21,410,384 $ 1,179,525 $ 1,855,006 $ 100,000 $ 421,902 $ 279,721 $ 25,246,538 $ Uses: Operating BudgetsLaw 18,189 $ 18,189 $ Community Development 209,000 421,902 279,721 910,623 Police 2,358,741 341,491 2,700,232 Fire 2,083,582 87,060 2,170,642 Health 523,785 523,785 Public Works 563,727 563,727 Water Pollution Control 2,915,542 2,915,542 Parks and Recreation 2,857,202 1,805,471 4,662,673 Non-Departmental -Debt Service 530,154 530,154 Consolidation Adjustments-Interfund Charges for Support Ser. (44,067) (70,394) (114,461) Consolidated Operating Budget 11,264,881 $ 1,179,525 $ 1,735,077 $ - $ 421,902 $ 279,721 $ 14,881,106 $ Capital Budget 9,325,537 9,325,537 Total Operating & Capital Budget 20,590,418 $ 1,179,525 $ 1,735,077 $ - $ 421,902 $ 279,721 $ 24,206,643 $ To Other Funds 691,083 691,083 Total Uses 21,281,501 $ 1,179,525 $ 1,735,077 $ - $ 421,902 $ 279,721 $ 24,897,726 $ Transfers Out-
394
City of Independence, Missouri
2016-17 Operating Budget
Summary of Sources and Uses by Fund and Fund Type - Combining Total for Sales Tax Funds
Note1) the combined total for these Funds is included in the calculation of the Special Revenue Fund total on the previous schedule.
Street Park Storm Water Police Fire Improv. Improv. Improv. Public Safety Public Safety Sales Tax Sales Tax Sales Tax Sales Tax Sales Tax Total Description / Fund Fund Fund Fund Fund Fund All Funds Sources: Beginning Fund Balance 1,648,967 $ (3,092,351) $ 2,270,836 $ 1,721,447 $ 1,625,452 $ 4,174,351 $ Estimated Revenues 8,350,900 4,608,151 4,184,000 2,210,600 2,100,800 21,454,451 Proceeds from Debt IssuanceConsolidation AdjustmentsInterfund Charges for Support Ser. (31,329) (12,738) (44,067) Transfers InFrom Other FundsTotal Sources 9,968,538 $ 1,515,800 $ 6,442,098 $ 3,932,047 $ 3,726,252 $ 25,584,735 $ Uses: Operating BudgetsPolice 2,358,741 $ 2,358,741 $ Fire 2,083,582 2,083,582 Public Works 563,727 563,727 Water Pollution Control 2,915,542 2,915,542 Parks and Recreation 2,857,202 2,857,202 Debt Service 530,154 - - - - 530,154 Consolidation Adjustments-Interfund Charges for Support Ser. (31,329) (12,738) (44,067) Consolidated Operating Budget 1,062,552 $ 2,857,202 $ 2,902,804 $ 2,358,741 $ 2,083,582 $ 11,264,881 $ Capital Budget 7,515,537 315,000 1,495,000 9,325,537 Total Operating & Capital Budget 8,578,089 $ 3,172,202 $ 4,397,804 $ 2,358,741 $ 2,083,582 $ 20,590,418 $ Transfers OutDesig. for Capital & Grant Proj. - $ To Other Funds 691,083 691,083 Ending Fund Balance / Net Assets 1,390,449 $ (1,656,402) $ 1,353,211 $ 1,573,306 $ 1,642,670 $ 4,303,234 $ Total Uses 8,578,089 $ 3,172,202 $ 5,088,887 $ 2,358,741 $ 2,083,582 $ 21,281,501 $
395
Estimated Revenues
396
2016-17 Operating Budget Estimated Revenues
The single largest source of revenue for the City is Utility Service Charges from the City's electric, water and sanitary sewer utilities; comprising two thirds of total revenues. Taxes (Property, Sales and Utility) represent the second largest category, making up twenty-seven percent of total revenue.
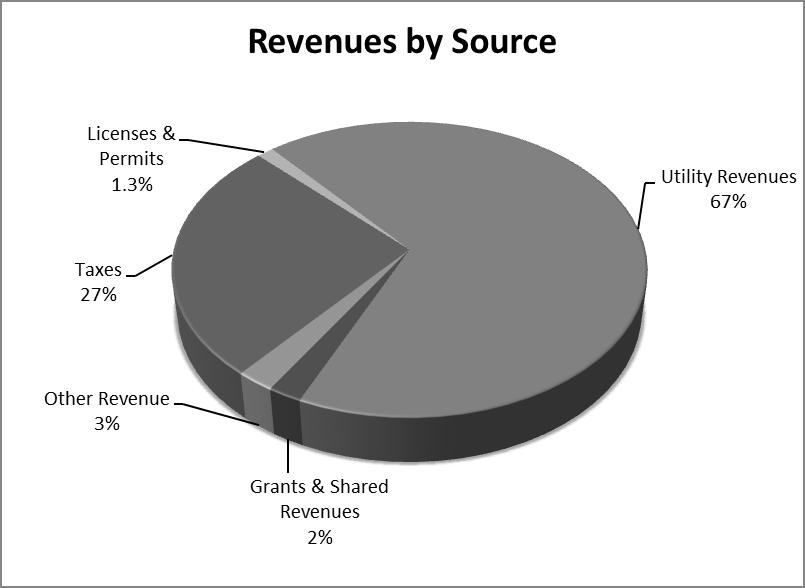
FY 2016-17 Change by Revenue Source
Total revenues are projected to increase in the 2015-16 fiscal year by 0.6% from the 2015-16 Adopted budget. The largest single increase in terms of dollar amount is Utility Revenues, estimated to increase by $3.1 million or 1.6%.
$77.4 $3.4 $194.5 $5.9 $8.2 $77.1 $3.8 $197.6 $6.0 $6.8 $- $25 $50 $75 $100 $125 $150 $175 $200 $225 Taxes Licenses & Permits Utility Revenues Grants & Shared Revenues Other Revenue Millions
2016-17 2015-16 397
City of Independence, Missouri 2016-17
Revenue Overview/Projections
This section provides an overview of the various revenue sources in the City and a discussion of the basis upon which the revenue estimates were made. A separate Revenue Manual is available to provide additional revenue details and a more detailed discussion of the projection basis for all revenue sources within the City.
One of the key components of the City's annual budget process is the estimation of revenues for the ensuing fiscal year. These revenue estimates form the basis upon which appropriations are established which in turn dictate the level of public services that can be provided to the community. The economic environment locally, as well as nationally, creates conditions that affect the receipt of these revenues. Therefore, the City's budget is based on the latest economic forecast available, however it must also be flexible to reflect changes that occur through the year. A continuation of the level of services provided by the City depends on how quickly management recognizes these changes and reacts to adjust for them.
The following chart compares the annual percentage change in total revenues to the percentage change in the Consumer Price Index (CPI) for the local area. Generally, on an overall basis, expenditures have a stronger degree of correlation to inflation based changes than revenues. Therefore, this comparison helps to identify the ability of revenues to adjust to inflation driven demands on the expenditure side.

Comparison of Annual Percentage Change in Total Revenues to Annual Percentage change in the Consumer Price Index
Inflation steadily decreased from 4% in 2012-13 to 1.4% in 2014-15. The average annual growth rate for revenues was 1.4% for the period of 2012-13 to 2014-15. Total Revenues for 2016-17 are estimated to increase by 0.6% compared to a projected consumer price index increase for this area of 0.7%.
0.0% 0.5% 1.0% 1.5% 2.0% 2.5% 3.0% 3.5% 4.0% 2012-13 2013-14 2014-15 2015-16 2016-17 Actual Actual Actual Budget Budget
CPI Revenues 398
City of Independence, Missouri 2016-17
Revenue Overview/Projections
Shown below is a comparison of the actual total revenues by source for the 2012-13 fiscal year through the 2014-15 fiscal year. Also listed are budgeted amounts for the 2015-16 and 2016-17 fiscal years. The component mix of revenues has remained largely unchanged over the listed period of time.
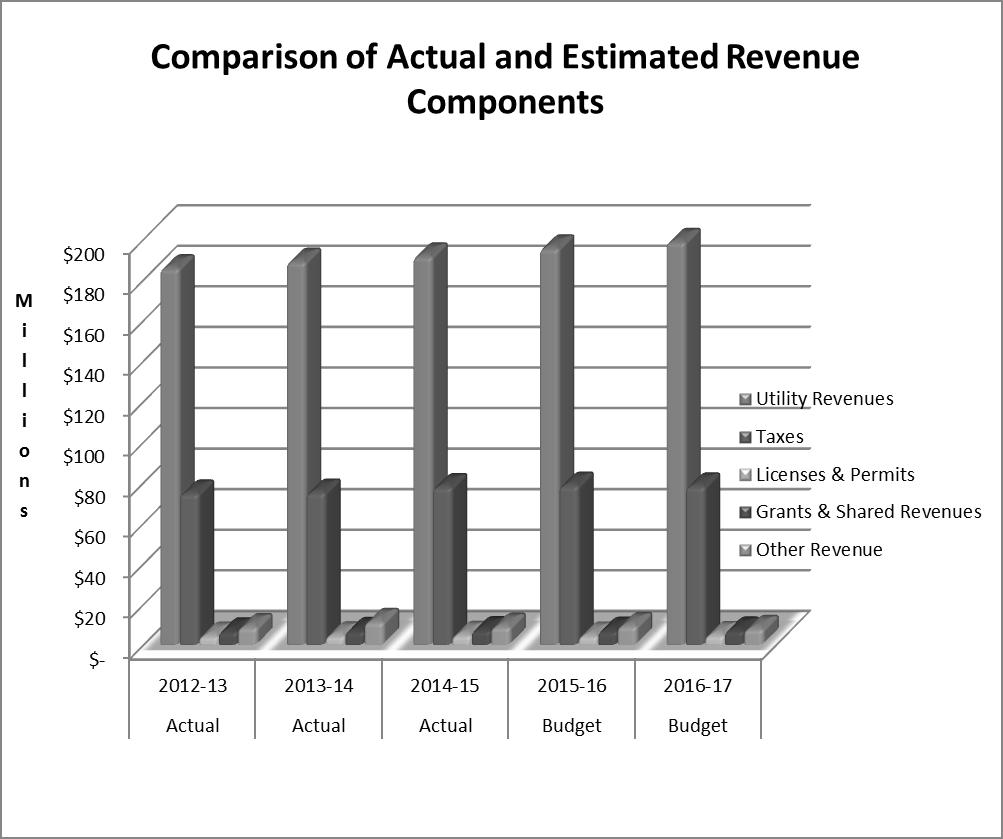
General Fund
Revenue Estimates by Fund
Taxes - taxes comprise 72.7% of the total revenue within the General Fund. Included in this category are Real Estate Taxes, Local Option Sales Taxes, Payments in Lieu of Taxes from the City's three municipally owned utility companies and Utility Franchise Fees from privately owned utility companies. Projections in these categories are based on historical trend analysis with adjustments for projected changes in economic conditions and rate changes, as applicable. For the Payments in Lieu of Taxes and Utility Franchise Fees, the revenue is based on 9.08 percent of the gross receipts collected by each utility.
Grants and Shared Revenue - Grant revenues represent 7 percent of the total revenues in the General Fund. These revenues are largely comprised of the State gasoline and vehicle taxes remunerated back to the City. Revenue for each grant type is based on historical trend analysis as adjusted for projected changes in grant activity.
Other Revenue - Projections for other revenue sources within the General Fund are based primarily on historical trend analysis with adjustments for projected economic and rate changes, as applicable.
399
City of Independence, Missouri 2016-17
Revenue Overview/Projections
Tourism Fund
Transient Guest Tax - The primary source of revenue in the Tourism Fund is Transient Guest Taxes. The tax rate is 6.5% and assessed to Hotel/Motel occupants. Revenue estimates are based on a historical trend analysis with adjustments for projected changes in occupancy rates and the number of available hotel/motel units.
Community Development Block Grant Act Fund
Federal Grant (CDBG) - Revenue in this fund comes directly from the Federal Government. Estimates are based on the latest available information from the Federal Government.
HOME Program Fund
Federal Grant (HOME Program) - Revenue in this fund comes directly from the Federal Government. Estimates are based on the latest available information from the Federal Government.
Enterprise Funds
The City has three enterprise funds: Electric, Sanitary Sewer and Water utilities. Service charge revenue estimates for each utility are based on projected consumption, as determined by historical trends and anticipated changes in service area, which is factored into the rate structure including changes for anticipated rate adjustments, as appropriate.
Central Garage Fund
The City's Central Garage Internal Service Fund's revenue is based on the actual maintenance and fuel charges for the preceding calendar year as adjusted for approved appropriations for the ensuing fiscal year. Estimated revenues in this fund are offset by appropriations for the use of the garage facility in the various operating departments.
For additional revenue details and projection information, refer to the separate Revenue Manual. This document provides detail information regarding each revenue source in the City including authorization, projection parameters, historical data, etc.
400
Appropriations
401
2016-17 Operating Budget Appropriations
Total Appropriations $288,498,549
Utility Operations represent nearly 70% of the City's total operating budget. Independence has three utilities: Power and Light, Sanitary Sewer and Water. Public Safety, or Fire and Police services, represents the largest category of general municipal fund expenditures.
Total operating budget appropriations increased $7.2 million, or 2.5%, from FY 2015-16 to FY 2106-17. Utility Operations increased by $6 million, primarily due to a $4.1 million increase in Power and Light operations. Public Safety increased $0.8 million, or 1.6%; Public Works increased $0.3 million, or 3.5%; and, General Government decreased by $0.3 million, or 4%.
Comparison of Appropriations


Utility Operations 69.6% General Government 2.6% Public Works 3.1% Public Safety 17.1% Community Service 4.0% Other 3.6%
$- $50 $100 $150 $200 $250 Utility Operations General Government Public Works Public Safety Community Service Other $194.9 $7.7 $8.6 $48.6 $13.2 $10.1 $200.9 $7.4 $8.9 $49.4 $13.3 $10.5 Millions
2016-17 2015-16 402
FY 2015-16 to FY 2016-17
Services, $115,746,386 , 36%
Summary
Projects, $31,618,537 , 10%
Debt Service, $20,235,283 , 6%
Services, $60,399,725 , 19% Other Supplies, $67,108,035 , 21% Capital Outlay/Other, $27,167,863 , 8%

Appropriations by Type
Personal Other Capital Debt Capital Department Services Services Supplies Outlay/Other Service Projects Total City Council 448,096 $ 29,252 $ 4,770 $ - $ - $ - $ 482,118 $ City Clerk 275,598 28,218 17,568 - - - 321,384 $ City Manager 887,064 28,150 3,460 - - - 918,674 $ Technology Services 1,696,126 178,688 7,400 - - - 1,882,214 $ Municipal Court 813,113 32,155 8,022 - - - 853,290 $ Law 627,237 98,500 25,300 - - - 751,037 $ Finance 1,708,332 173,914 17,177 - - - 1,899,423 $ Human Resources 482,615 3,252 5,331 - - - 491,198 $ Community Dev. 1,439,940 2,298,451 14,252 246,414 - - 3,999,057 $ Police 25,490,449 1,762,051 861,759 1,611,000 38,273 - 29,763,532 $ Fire 16,917,896 1,289,410 396,257 1,310,175 35,329 - 19,949,067 $ Health 2,344,883 729,890 57,672 - - - 3,132,445 $ Water 7,509,864 6,194,450 2,321,240 571,600 4,397,613 4,350,000 25,344,767 $ Public Works 3,143,032 1,613,326 721,799 613,005 530,154 7,515,537 14,136,853 $ Water Pollution Control 6,850,010 9,529,667 1,117,382 962,300 6,287,757 3,048,000 27,795,116 $ Parks and Recreation 3,502,242 2,318,960 331,199 1,000 - 315,000 6,468,401 $ Power and Light 31,796,290 19,659,735 61,148,482 1,454,000 8,946,157 16,390,000 139,394,664 $ Non-Departmental 9,813,599 14,431,656 48,965 20,398,369 44,692,589 $ Totals 115,746,386 $ 60,399,725 $ 67,108,035 $ 27,167,863 $ 20,235,283 $ 31,618,537 $ 322,275,829 $ Personal
Other
Capital
City of Independence, Missouri 2016-17 Budget 403
- All Funds
Debt Service
404
City of Independence, Missouri
2016-17 Operating Budget
Capital Lease/Debt Service Requirements - All Funds
Total Debt Service Series Principal Interest Fees Requirements Street Improvements Sales Tax Fund: Streets and Bridges 2009 Series G (6371) 475,000 $ 52,154 $ 3,000 $ 530,154 $ Power and Light FundRevenue Bonds 2010 Series B (6238) 1,625,000 $ 888,188 $ 4,000 $ 2,517,188 $ Revenue Bonds 2012 Series A (6239) - 2,631,219 4,000 2,635,219 Revenue Bonds 2012 Series F (6241) 1,905,000 1,884,750 4,000 3,793,750 Total Power and Light Fund 3,530,000 $ 5,404,157 $ 12,000 $ 8,946,157 $ Sanitary Sewer FundRevenue Bonds 2012 Series B (6240) 810,000 $ 1,465,982 $ 5,000 $ 2,280,982 $ Revenue Bonds 2013 Series B (6240) 670,000 $ 2,065,600 $ 5,000 $ 2,740,600 $ Revenue Bonds 2014 Series C (6240) 465,000 $ 796,175 $ 5,000 $ 1,266,175 $ Total Sanitary Sewer Fund 1,945,000 $ 4,327,757 $ 15,000 $ 6,287,757 $ Water FundRevenue Bonds: 2013 Series D (6352) 1,114,613 $ - $ 8,000 $ 1,122,613 $ Grand Total All Funds - Operating Budget 7,064,613 $ 9,784,068 $ 38,000 $ 16,886,681 $ 405
City of Independence, Missouri
2016-17 Operating Budget
Debt Service Requirements - Related Debt Associated with the City of Independence
Total Debt Service Series Principal Interest Fees Requirements Neighborhood Improvement District Debt ServiceNoland Road NID 2004 Series (6311) 75,000 $ 12,600 $ 1,000 $ 88,600 $ Fall Drive NID 2004 Series (6312) 6,000 3,399 1,000 10,399 Total NID Debt Service 81,000 $ 15,999 $ 2,000 $ 98,999 $ Events Center2008 D Series (6250) 260,000 $ 600,975 $ 5,000 $ 865,975 $ 2011 A Series (6250) 110,000 605,057 5,000 720,057 2012 C Series (6250) 460,000 2,888,063 5,000 3,353,063 Total Events Center 830,000 $ 4,094,095 $ 15,000 $ 4,939,095 $ Tax Increment Financing FundsDrumm Farm 2005 B Series (6711) 80,000 $ 15,300 $ 1,500 $ 96,800 $ 2006 Series (6711) 140,000 28,443 1,500 169,943 2007 D Series (6711) 75,000 13,988 1,500 90,488 2008 E Series (6711) 40,000 47,399 1,500 88,899 Total Drumm Farm 335,000 $ 105,130 $ 6,000 $ 446,130 $ Eastland Center 2007 A Series (6712) 1,195,000 $ 439,175 $ 1,500 $ 1,635,675 $ 2008 C Series (6712) 535,000 258,612 1,500 795,112 2012 E Series (6712) 345,000 79,800 1,500 426,300 2014 A Series (6712) 520,000 115,350 1,500 636,850 Total Eastland Center 2,595,000 $ 892,937 $ 6,000 $ 3,493,937 $ Falls at Crackerneck Creek 2006 B Series (6718) - $ 812,337 $ 5,000 $ 817,337 $ 2013 A Series (6718) - 681,026 5,000 686,026 2013 B Series (6718) - 446,944 5,000 451,944 2015 C Series (6718) - 1,770,863 5,000 1,775,863 2015 D Series (6718) - 68,750 5,000 73,750 Total Falls at Crackerneck Creek - $ 3,779,920 $ 25,000 $ 3,804,920 $ Hartman Heritage Center 2007 B Series (6710) 935,000 $ 196,487 $ 3,000 $ 1,134,487 $ 2011 B Series (6710) 440,000 186,682 3,000 629,682 Total Hartman Center 1,375,000 $ 383,169 $ 6,000 $ 1,764,169 $ Centerpoint Medical Center (HCA) 2006 F Series (6722) 210,000 $ 151,925 $ 3,000 $ 364,925 $ 2007 E Series (6722) 760,000 765,418 3,000 1,528,418 2011 C Series (6722) 55,000 1,650 3,000 59,650 2012 D Series (6722) 635,000 360,100 3,000 998,100 2014 E Series (6722) 105,000 64,350 3,000 172,350 Total Centerpoint Medical Center 1,765,000 $ 1,343,443 $ 15,000 $ 3,123,443 $ Santa Fe 2015 A Series (6708) 110,000 $ 188,075 $ 2,000 $ 300,075 $ 2015 B Series (6708) 60,000 $ 168,063 $ 2,000 $ 230,063 $ Grand Total All Categories 7,041,000 $ 10,782,756 $ 77,000 $ 17,900,756 $ 406
CITY OF INDEPENDENCE, MISSOURI DEBT SERVICE
FOR THE 2016-17 FISCAL YEAR
Long Term Debt Policies
All long-term indebtedness of the City, other than long-term indebtedness applicable to the City’s Enterprise Funds, is accounted for in the Debt Service Fund. The City’s general longterm debt is secured by the general credit and tax ing powers of the City.
The City’s debt limit is set by State Statutes at 20% of the City’s assessed propert y valuation.
Specific purpose capital lease payments are budgeted in each applicable operating department’s budget whereas City-wide or general purpose capital lease payments are budgeted in Non-Department.
Debt Service
As of June 30, 2015, the City had no outstanding General Obligation Bonds and $354,386,824 outstanding in Revenue Bonds and loans payable for the enterprise funds. Included in the outstanding debt for utility operations was $128,017,832 for Power and Light Operations, $101,145,156 for Sanitary Sewer Operations and $34,781,113 for Water Utility Operations. The Events Center fund has outstanding debt of $90,442,723. The City had a legal debt limit of $252,710,989 as of June 30, 2015 which represents twenty percent of the taxable assessed valuation of the City.
Included in this section are:
1)Debt Service appropriations including amounts for City-wide capital lease obligations.
2)Debt to Maturity Schedules for outstanding debt obligations.
3)Computation of Legal Debt Margin (as of June 30, 2015).
407
City of Independence, Missouri
2016-17 Operating Budget
Debt Service Requirements to Maturity - All Bonds
For the fiscal Years ending June 30,
Sanitary Sewer FundPower and Light Fund
Fees andFees and YearPrincipalInterestTotal PrincipalInterestTotal 20171,945,0004,342,7576,287,757 3,530,000 5,416,157 8,946,157 20182,000,0004,287,3076,287,307 3,685,000 5,258,707 8,943,707 20192,060,0004,227,8076,287,807 3,850,000 5,094,257 8,944,257 20202,130,0004,160,2576,290,257 4,945,000 4,922,357 9,867,357 20212,205,0004,085,6326,290,632 4,045,000 4,712,056 8,757,056 20222,280,0004,008,3326,288,332 4,210,000 4,540,206 8,750,206 20232,365,0003,921,9106,286,910 4,395,000 4,361,257 8,756,257 20242,470,0003,820,0076,290,007 4,625,000 4,174,357 8,799,357 20252,575,0003,711,6676,286,667 4,720,000 3,989,357 8,709,357 2026-3778,680,00040,782,422119,462,42281,975,000 28,613,642 110,588,642 Total98,710,000 $ 77,348,098 $ 176,058,098 $ 119,980,000 $ 71,082,353 $ 191,062,353 $ Street Improvements Water Fund Fees and Fees and YearPrincipalInterestTotal PrincipalInterestTotal 2017475,000 55,154 530,154 3,275,000 1,122,613 4,397,613 2018495,000 35,741 530,741 1,480,000 1,051,288 2,531,288 2019515,000 14,266 529,266 1,530,000 1,006,138 2,536,138 2020 - 1,575,000 959,563 2,534,563 2021 - 1,630,000 903,338 2,533,338 2022 - 1,695,000 828,363 2,523,363 2023 1,785,000 741,363 2,526,363 2024 1,880,000 660,938 2,540,938 2025 1,950,000 586,138 2,536,138 2026-44 - 12,930,000 1,600,308 14,530,308 Total1,485,000 $ 105,161 $ 1,590,161 $ 29,730,000 $ 9,460,050 $ 39,190,050 $
408
City of Independence, Missouri
2015-16 Operating Budget
Debt Service Requirements to Maturity - All Bonds
For the fiscal Years ending June 30,
Fall Drive NID Fees andFees and YearPrincipalInterestTotalPrincipalInterestTotal 2017830,000 4,109,095 4,939,095 6,000 4,399 10,399 2018965,000 4,078,933 5,043,933 6,000 4,069 10,069 20191,055,000 4,037,982 5,092,982 6,000 3,739 9,739 20201,210,000 3,991,708 5,201,708 7,000 3,409 10,409 20211,370,000 3,938,907 5,308,907 7,000 2,998 9,998 20221,540,000 3,878,431 5,418,431 7,000 2,586 9,586 20231,705,000 3,810,820 5,515,820 8,000 2,175 10,175 20241,870,000 3,742,545 5,612,545 12,000 1,704 13,704 20252,065,000 3,668,121 5,733,121 2026-3877,215,000 31,670,353 108,885,353 Total89,825,000 $ 66,926,895 $ 156,751,895 $ 59,000 $ 25,079 $ 84,079 $ Noland Road NID Fees and YearPrincipalInterestTotal 201775,000 13,600 88,600 201880,000 9,663 89,663 201985,000 5,463 90,463 2020202120222023 2024Total 240,000 $ 28,725 $ 268,725 $
Events Center
409
Fund
City of Independence, Missouri
Capital Lease Payment Requirements to Maturity
For the fiscal Years ending June 30,
HartmanDrummCrackerneckCenterpoint Year EastlandHeritageSanta FeFarmCreekHCA Total 20173,487,937 1,758,169 526,138 440,130 3,779,920 3,108,443 13,100,737 20183,490,839 1,775,232 530,963 440,168 3,779,920 3,122,895 13,140,017 20193,487,237 1,814,506 530,563 439,138 3,779,920 3,136,343 13,187,707 20203,498,350 2,883,068 529,938 437,412 3,829,920 3,200,644 14,379,332 20214,834,544 1,889,868 524,238 440,000 3,827,574 3,193,141 14,709,365 20225,452,569 532,938 441,000 3,825,226 3,271,745 13,523,478 2023 530,938 5,602,880 3,275,556 9,409,374 2024 528,838 10,459,926 3,342,130 14,330,894 2025 531,513 11,299,250 3,350,532 15,181,295 2026-45 - - 7,775,815 93,511,509 11,335,602 112,622,926 Total24,251,476 $ 10,120,843 $ 12,541,882 $ 2,637,848 $ 143,696,041 $ 40,337,031 $ 233,585,121 $ Motorola Radio Year (2430-026) 2017159,794 2018159,794 2019159,794 2020159,794 2021159,794 2022159,794 2023 2024-37 Total958,764 $ 2015-16 Operating Budget 410
City of Independence, Missouri
2016-17 Operating Budget
Computation of Legal Debt Margin
*All Tangible and Taxable Property.
** Article 6, Section 26(b) of the Missouri Constitution permits any county or city, by a vote of four-sevenths of qualified electors voting thereon, to incur an indebtedness for city purposes not to exceed 5 percent of the value of the taxable tangible property therein, as shown by the last assessment.
Article 6, Section 26(c) of the Missouri Constitution permits any county or city, by a vote of four-sevenths of qualified electors voting thereon, to incur additional indebtedness of city purposes not to exceed 5 percent of the value of the taxable tangible property therein as shown by the last assessment.
Article 6, Section 26(d) & (e) of the Missouri Constitution provides that any city may become indebted not exceeding in the aggregate an additional 10 percent of the value of the taxable tangible property for the purpose of acquiring right-of-ways, construction, extending and improving streets and avenues and/or sanitary or storm sewer systems and an additional 10 percent for purchasing or constructing waterworks, electric or other light plants provided the total general obligated indebtedness of the city does not exceed 20 percent of the assessed valuation.
Assessed Value at January 1, 2014: * Jackson County1,264,971,963 $ 1,280,793,365 Clay County34,51434,514 Total Assessed Value1,265,006,477 $ Constitutional Debt Limit **253,001,295 $ (20% of Assessed Value) Total Bonded Debt Revenue Bonds354,386,824 Subtotal 354,386,824 $ Less: Events Center Bonds(90,442,723) Water Utility Bonds(34,781,113) Electric Utility Bonds(128,017,832) Sewer Utility Bonds(101,145,156) Less: Debt Service Fund Balance(88,225) Total Net Debt Applicable to Limit290,306 Legal Debt Margin 252,710,989 $
June 30, 2015
411
Capital Projects
412
City of Independence, Missouri 2016-17 Operating Budget
Capital Budget Process
Purpose
The Capital Improvements Program (CIP) is one of the primary documents used to implement the comprehensive plan for the development of the City by providing for the extension and maintenance of infrastructure and major capital projects. The CIP sets forth proposed expenditures for systematically constructing, maintaining, upgrading, and replacing the City’s physical assets. This ongoing maintenance is critical to the continued operation and provision of City services.
The CIP serves as a guide to the new and ongoing capital improvements to public facilities and infrastructure. The CIP outlines a financing schedule of capital improvement projects for a six-year period. In the process of formulating the CIP, needs are assessed, public improvements are prioritized and costs are projected, thereby allowing the City to take maximum advantage of federal, state, and county funds. The CIP is reviewed annually. Each review re-prioritizes projects and evaluates the financial capacity of the City. The process affords flexibility in maintaining and promoting an effective level of service for present and future citizens.
Goals
The goals of the CIP establish a system of procedures and priorities by which to evaluate public improvement projects in terms of public safety, public need, the City’s Comprehensive Plan, project continuity, financial resources, the City Council vision statement, and the strategic goals for the City. The following CIP goals were developed to guide the CIP process.
1.Focus attention on and assist in the implementation of established community goals as outlined in the adopted Comprehensive Plan.
2.Focus attention on and assist in the implementation of the strategic goals established by the City Council.
3.Forecast public facilities and improvements that will be needed in the near future.
4.Anticipate and project financing needs in order to maximize federal, state, and county funds.
5.Balance the needs of future land development areas in the City with the needs of existing developed areas.
6.Promote and enhance the economic development of the City of Independence in a timely manner.
7.Balance the need of public improvements and the present financial capability of the City to provide these improvements.
8.Provide improvements in a timely and systematic manner.
9.Allow City departments to establish a methodology and priority system to continue providing efficient and effective services.
10.Provide an opportunity for citizens and interested parties to voice their requests for capital improvement projects.
413
City of Independence, Missouri 2016-17 Operating Budget
Capital Budget Process
Categories of Capital Projects
Capital projects are categorized into three areas: Department Capital Expenditures (operating budget), Capital Outlay (operating budget), and Capital Improvement Program (capital budget).
Capital Expenditures
These are items funded within the various operating departments’ budgets and may include purchases for office equipment, small tools and equipment, computer equipment, and mobile equipment over $1,000. This also may include maintenance to existing building and facilities under $25,000 and vehicles for the Police and Fire departments which are funded from the Public Safety Sales Tax operating budget.
Capital Outlay
These items are determined during the budget review process and are funded out of the non-departmental operating budget. This includes all vehicles and rolling stock except for the Police and Fire department vehicles. This also may include major maintenance of buildings and facilities that are greater than $25,000 but less than $50,000.
Capital Improvement Program
These items include improvements to infrastructure assets greater than $50,000 and the purchase of land and land improvements.
Inclusion in CIP
The process of evaluating projects is designed to identify which projects that demonstrate the greatest benefit to the City and its citizens. Each project submitted for the Annual CIP is carefully evaluated. There are several types of projects that are included in the CIP every year and the evaluation process for these project types often is as different as the projects themselves. Projects that are directly related to the function of a utility are based on long range major maintenance and replacement schedules for capital assets. Enterprise Funds such as the Water, Sewer, and Power & Light Funds are the direct source of funding for these projects. Three funding sources are directly related to projects funded from prior sales tax elections. The priority of these projects generally is based on commitments made as part of the ballot issue and are carefully monitored by resident oversight committees.
Projects were evaluated based on their ability to:
Support and improve health, safety and quality of life
Demonstrate sustainability or long-term worth
Have an economic benefit
Improve the quality of the environment
Improve the City’s image
Improve the quality of transportation systems
Foster community character, identity, and pride
Maintain and preserve previous investments
414
City of Independence, Missouri 2016-17 Operating Budget
Capital Budget Process
Based on these objectives, projects are carefully reviewed and awarded a rating. Some projects benefit many criteria while others only benefit one.
Major Project Presentation
Projects included in this budget document are limited to a list of major projects. This includes all projects that are over $1,000,000 in funding for the current fiscal year, projects that are new to the current fiscal year, and/or the top five projects in project category. A full list and description of all capital projects can be found in the separate CIP document.
For Fiscal Year 2016-17, the City proposes projects totaling $31,618,537. These projects are separated into the following categories:
Funding for the Fiscal Year 2016-17 will be derived from the following sources:
Impact of Capital Spending on the Operating Budget
The City is allocating approximately $31.6 million on capital projects for Fiscal Year 2016-17. The majority of the capital projects are for infrastructure improvements for various neighborhoods and thoroughfares across the City. Virtually all of the capital expenditures planned for Fiscal Year 2016-17 will be accomplished with contract services and will require minimal involvement of City construction forces. Requirements placed on contract administration, legal services and other administrative services related to the infrastructure upgrades will not exceed levels established in previous years, and thus no additional resources have been budgeted to administer these capital projects. Any additional operating budget impacts are identified by project on the following pages.
Category Amount Percent Street & Bridge Improvements $7,375,537 23.3% Community & Public Safety Improvements 455,000 1.5% Power & Light System 16,390,000 51.8% Water & Sewer Systems 7,398,000 23.4% Total $31,618,537 100%
Source Amount Percent Power and Light Fund $16,390,000 51.8% Sanitary Sewer Fund 1,553,000 4.9% Street Improvements Sales Tax Fund 7,515,537 23.8% Park Improvements Sales Tax Fund 315,000 1.0% Storm Water Sales Tax Fund 1,495,000 4.7% Water Fund 4,350,000 13.8% Total $31,618,537 100%
415
City of Independence, Missouri 2016-17 Budget
Major Capital Project Descriptions
Street & Bridge Improvements
Pavement cold milling, asphaltic concrete overlay, wedging and patching, portland cement concrete handicap ramps and thermoplastic pavement striping. Mandated by the citizen vote for sales tax on August 7, 2007. This is a yearly program to overlay streets on a city wide basis.
Operating Impact: No additional operating impact noted.
Funding Source: Street Improvements Sales Tax Fund
This project will add a northbound rightturn lane from Noland Road onto 39th Street, improve turning radii at all quadrants of the intersection, add sidewalks and curb ramps, and upgrade traffic signal equipment.
Operating Impact: No additional operating impact noted.
Funding Source: Street Improvements Sales Tax Fund
This project will add pedestrian push buttons, countdown signal heads and ADA sidewalk/ramps at 13 intersections along Crysler Ave from 40 Highway to River Blvd.
Operating Impact: No additional operating impact noted.
Funding Source: Street Improvements Sales Tax Fund
This is an ongoing program funded through the Street Sales Tax program. 10 alley locations were selected for this construction season. Operating
No additional operating impact noted.
Source: Street Improvements Sales Tax Fund
This is an ongoing program to construct new sidewalks near parks. It is part of the street sales tax program and several project locations were selected prior to the sales tax renewal in 2007. Operating Impact: No additional operating impact noted. Funding Source: Street Improvements Sales Tax Fund
Other Street & Bridge Improvements Projects not listed above
Overlay Program Project Number: 70111501 Prior Funding - $ FY 2016-17 Funding 6,625,537 $ Total Project Funding 6,625,537 $ 39th & Noland Project Number: 70111501 Prior Funding 123,878 $ FY 2016-17 Funding 180,000 $ Total Project Funding 303,878 $ Crysler Complete Streets Project Number: 70111402 Prior Funding 200,000 $ FY 2016-17 Funding 150,000 $ Total Project Funding 350,000 $ Alley Rehabilitation Project Number:
Prior Funding 600,000 $ FY 2016-17 Funding 200,000 $ Total Project Funding 800,000 $ Sidewalks to City Parks Improvements Project Number: 70110807 Prior Funding 942,700 $ FY 2016-17 Funding 100,000 $ Total Project Funding 1,042,700 $
2015-16
70111103
260,000 $
Funding
Impact:
416
City of Independence, Missouri
2016-17 Budget
Major Capital Project Descriptions
Community and Public Safety Improvements
Blue Lawn - E 31st to E 32nd - East of Arlington
Project Number: 70131603
This project will address neighborhood wide drainage problems in the Prior Funding vicinity of East 31st to East 32nd streets east of Arlington in the FY 2016-17 Funding 80,000 $ Rock Creek Watershed.
Operating Impact: No additional operating impact noted. Funding Source: Storm Water Improvements Sales Tax Fund
Drumm to Crane
Project Number: 70131504
This project will fund construction of the design initiated in 2015 to address the lack of storm drainage facilities along Drumm Avenue to
60,000 $ Crane in the Adair Creek Watershed. The project will intercept and
350,000 $ convey runoff and discharge flows into the existing 39th & Phelps
$ regional storm water detention basin.
Operating Impact: No additional operating impact noted.
Funding Source: Storm Water Improvements Sales Tax Fund
Norwood & 19th
Project Number: 70131601
Located in the Rock Creek Watershed this project will provide storm
Funding water collection to intercept runoff and convey it to the existing FY 2016-17 Funding 195,000 $ system a block away.
Operating Impact: No additional operating impact noted.
Source: Storm Water Improvements Sales Tax Fund
This project, located in the Rock Creek Watershed will improve residential drainage problems. Locations include 33rd St. & Hardy Ave., Englewood Heights at 24th St., and Linwood Ct. & 31st.
Operating Impact: No additional operating impact noted.
Funding Source: Storm Water Improvements Sales Tax Fund
Walnut Gardens - RD Mize & Gateway Drive
70131602
Located in the Crackerneck Creek Watershed this project will
Funding reroute an existing deteriorating storm system located under homes
2016-17 Funding 170,000 $ and provide both enduring and maintainable infrastructure.
Total Project Funding
Operating Impact: No additional operating impact noted.
Source: Storm Water Improvements Sales Tax Fund
Athletic Fields and Court Renovations Project Number: 9719
Prior Funding 10,758,770 $
This project replaces the restroom facility at the Santa Fe Tennis Complex and fills cracks, color coats and repaints lines at Beckett park basketball courts, Blackburn Park tennis courts and Santa Fe Park tennis courts. Operating Impact: No additional operating impact noted.
Source: Park Improvements Sales Tax Fund
This funding will provide for general facility and park repairs.
Operating Impact: No additional operating impact noted. Funding Source: Park Improvements Sales Tax Fund
Other Community & Public Safety Improvements Projects not listed above
Total Project Funding
Prior
FY
Total Project Funding
Funding
2016-17 Funding
410,000
Total Project Funding Rock Creek
Project Number:
Prior Funding 450,000 $ FY 2016-17 Funding 700,000 $ Total Project Funding 1,150,000 $
Prior
Neighborhood Projects
70131501
Project Number:
Prior
FY
FY
Total
Project
Prior
4,793,625
FY 2016-17 Funding 315,000
Total
705,000
2016-17 Funding 175,000 $
Project Funding 10,933,770 $ Park Revitalization
Number: 9970
Funding
$
$
Project Funding 5,108,625 $
$
Funding
Funding
417
Funding
Major Capital Project Descriptions
Power and Light System
Blue Valley Power Plant Ash Pond Closure
70201513
This project includes engineering and construction necessary for closure of the BV ash ponds in compliance with the Coal Combustion Residual rule that became effective in April, 2015. Ponds are no longer required since coal is no longer used as fuel at this site.
Operating Impact: No additional operating impact noted.
Funding Source: Power and Light Fund
Substation I Switchgear and Transformer Replacement
70201507
This project includes replacement of the existing 69 kV transformers and distribution switchgear including the associated relay equipment in order to improve reliability of the distribution system.
Operating Impact: No additional operating impact noted.
Source: Power and Light Fund
69 kV Transmission Line Rebuild (Substations E to F)
70201603
This project includes design and construction rebuild of an existing 69 kV Transmission line. With the rebuild of the line, reliability of the transmission system will be improved.
Operating Impact: No additional operating impact noted.
Source: Power and Light Fund
Miscellaneous Substation and Transmission Upgrades
70201106
Several upgrades were combined into this single project: transformer and breaker replacements at Substations A and M and a relaying upgrade from Substation A to J.
Impact: No additional operating impact noted.
Source: Power and Light Fund
Blue Valley Boiler Burner Management System Upgrade
70201601
- $
Includes engineering, purchase, installation and commissioning of new Burner Management Systems to replace current obsolete and unsupported Flame Safety Supervisory Systems as required for State certification. Operating Impact: No additional operating impact noted.
Source: Power and Light Fund
Other Power and Light Improvements Projects not listed above
City of Independence, Missouri 2016-17 Budget
Project Number:
Prior Funding 1,500,000 $ FY 2016-17 Funding 6,000,000 $ Total Project Funding 7,500,000 $
Project Number:
Prior Funding 1,615,000 $ FY 2016-17 Funding 3,650,000 $ Total Project Funding 5,265,000 $
Project Number:
Prior Funding - $ FY 2016-17 Funding 3,042,000 $ Total Project Funding 3,042,000 $
Project Number:
Prior Funding 2,374,658 $ FY 2016-17 Funding 848,000 $ Total Project Funding 3,222,658 $
Prior Funding
FY 2016-17 Funding 800,000 $ Total Project Funding 800,000 $ 2,050,000
Project Number:
$
Funding
Funding
Funding
Operating
418
Funding
City of Independence, Missouri
2016-17 Budget
Major Capital Project Descriptions
Sanitary Sewer System
Pacific Avenue Sanitary Main Replacement Project Number: 70301601 Prior Funding - $
This project will replace a section of sanitary sewer main that has heavy buildup severely restricting flow that could result in blockage.
Operating Impact: No additional operating impact noted.
Funding Source: Sanitary Sewer Fund
Kentucky 1 Pump Station Demolition Project Number: 70301602
The old building is below grade and poses a potential liability.
Operating Impact: No additional operating impact noted. Funding Source: Sanitary Sewer Fund
Rock Creek Facilities Roof, Ceiling & Lighting Project Number: 70301603
This project provides roofs for the 40 year old treatment plant, clarifier pumping buildings, garage and main pumping stations. They are tar and gravel construction that must be restored to provide protection of personnel and equipment.
Operating Impact: No additional operating impact noted.
Funding Source: Sanitary Sewer Fund
Primary Sludge Grinders & Flowmeter Replacemen Project Number: 70301604 Prior Funding - $
This project will install a new grinder for shredding debris in the primary sludge line. It will improve handling of removed sludge and flow monitoring necessary to properly account and mix the sludge for efficient dewatering and eventual disposal. Additionally, it will reduce plugging of downstream processes that require significant man hours for dismantling and unplugging piping.
Operating Impact: No additional operating impact noted.
Funding Source: Sanitary Sewer Fund
Other Sanitary Sewer Projects not listed above
$
FY
Total Project Funding
2016-17 Funding 195,000 $
195,000 $
FY 2016-17 Funding 60,000
Total Project Funding 60,000
Prior Funding - $
$
$
Funding
FY 2016-17 Funding 608,000
Total Project Funding 608,000 $
Prior
- $
$
FY 2016-17 Funding 90,000
Total Project Funding 90,000
600,000
$
$
419
City of Independence, Missouri
2016-17 Budget
Major Capital Project Descriptions
Water System
Little Blue Parkway Transmission Main Improvements
A section of ditch line along Little Blue Parkway has erosion occurring over top of where the water main is intalled. This project will provide for erosion control in the affected areas to protect the transmission main.
Operating Impact: No additional operating impact noted.
Funding Source: Water Fund
Fiber Optic Connection to Courtney Bend Plant
Number: 70401606
This project will connect the Courtney Bend Plant with IPL's fiber optic network. This will provide a more reliable and faster network connection.
Operating Impact: No additional operating impact noted. Funding Source: Water Fund
Truman Road 12' main replacement
70401607
This stretch of main on Truman Road between Yuma and Alexander has had several breaks in recent years. The main is located within the roadway and will be relocated outside of paved roadway.
Operating Impact: No additional operating impact noted.
Funding Source: Water Fund
This project is ongoing and funds the installation of additional mains, hydrants, valves and other appurtenances which will in turn provide better fire protection, improve water quality and lessen the impacts from unexpected main breaks and other service interruptions throughout the system.
No additional operating impact noted.
Source: Water Fund
This project will complete the the installation of the second lime slaker and provide a more reliable unit through redundancy by reducing or preventing down times during required maintenance procedures and equipment failures.
Operating Impact: No additional operating impact noted.
Funding Source: Water Fund
Other Water Projects not listed above
2,725,000 $
Project
FY 2016-17 Funding 125,000
Total Project Funding 125,000
Number: 70401604 Prior Funding - $
$
$
Project
Prior Funding
FY 2016-17 Funding 300,000 $ Total Project Funding 300,000 $
- $
Project
Prior Funding
FY 2016-17 Funding 550,000 $ Total Project Funding 550,000 $
Number:
- $
Project Number:
Prior Funding 150,000 $ FY 2016-17 Funding 150,000 $ Total Project Funding 300,000 $ Lime
Additions Project
Prior Funding FY 2016-17 Funding 500,000
Total Project Funding 500,000
Distribution System Improvements
70401505
Silo
Number: 70401608
$
$
Operating Impact:
Funding
420
Authorized Positions
421
2016-17 Operating Budget Authorized Positions
Positions Authorized by the Table of Organization
The number of full and part time employees (based on full time equivalents - FTE) has increased by 20.91 FTE positions since 2007-08 . FTEs in the General Fund decreased by 11.32 positions; non-public safety employees decreased by 24.73 FTEs while Public Safety increased by 13.41 FTE positions. Since 2007-08 the Utility Funds have increased by 17.47 FTEs and Special Revenue Funds have grown by 13.01 FTEs. Finally, the number of positions in the Internal Service Funds have gone up 1.75 FTEs.
0 50 100 150 200 250 300 350 400 450 500 2007-08 2008-09 2009-10 2010-11 2011-12 2012-13 2013-14 2014-15 2015-16 2016-17 Number of Positions (FTE) Fiscal Year
Other
Special
Internal
422
Public Safety
General Fund
Revenue Funds Utility Funds
Service Funds
City of Independence, Missouri 2016-17 Operating Budget
Authorized Position Summary - by Department
For the Fiscal Years 2010-11 through 2016-17
Budget Department 2010-11 2011-12 2012-13 2013-14 2014-15 2015-16 2016-17 City Council 10.00 10.00 10.00 10.00 10.00 10.00 10.00 City Clerk 6.00 6.00 6.00 7.00 7.00 7.00 7.00 City Manager 9.50 7.00 7.00 7.00 7.00 7.00 7.00 Tourism* 4.41 4.66 4.66 5.66 8.18 14.18 0.00 National Frontier Trails Museum* 6.00 5.75 5.75 5.75 5.00 0.00 0.00 Technology Services 22.00 23.50 23.50 23.50 24.50 25.50 25.50 Municipal Court 14.00 14.00 14.67 14.65 14.65 14.65 14.65 Law 8.00 8.50 8.50 8.50 8.51 8.51 8.37 Finance 25.00 23.50 23.50 23.50 23.00 23.00 23.00 Human Resources 6.50 6.50 6.44 7.44 6.75 6.75 6.75 Community Development 30.05 30.30 30.30 30.30 31.68 31.68 31.18 Police 305.90 302.65 302.91 304.91 303.91 303.91 301.91 Fire 174.00 174.00 174.00 174.00 175.00 175.00 175.00 Health 40.95 43.81 47.85 38.39 35.42 35.69 37.67 Water 101.65 93.65 93.42 92.42 93.42 93.42 93.42 Public Works 93.75 90.65 93.65 94.02 94.02 94.02 94.02 Water Pollution Control 83.00 83.00 83.00 83.00 83.00 86.20 86.20 Parks, Recreation & Tourism 54.19 50.46 50.90 52.55 53.71 53.71 67.74 Power and Light 222.00 233.00 236.00 238.00 239.00 239.00 239.00 Total Authorized Positions 1,216.90 1,210.93 1,222.05 1,220.59 1,223.75 1,229.22 1,228.41 Less: Positions not Funded (43.30) (69.82) (89.31) (83.31) (74.19) (76.87) (76.72) Total Funded Positions 1,173.60 1,141.11 1,132.74 1,137.28 1,149.56 1,152.35 1,151.69
423
*Transferred to Parks/Recreation/Tourism
City of Independence, Missouri
2016-17 Operating Budget
Authorized/Funded Positions Summary - All Funds
For the Fiscal Years 2007-08 through 2016-17
Budget Description 2007-08 2008-09 2009-10 2010-11 2011-12 2012-13 2013-14 2014-15 2015-16 2016-17 General FundCity Council 10.00 10.00 10.00 10.00 10.00 10.00 10.00 10.00 10.00 10.00 City Clerk 6.00 6.00 6.00 6.00 6.00 6.00 7.00 7.00 7.00 7.00 City Manager 10.50 10.50 9.50 9.50 7.00 7.00 7.00 7.00 7.00 7.00 Nat'l Frontier Trails Museum 6.00 6.00 6.00 6.00 5.25 5.75 5.75 5.00 -Technology Services 21.00 21.00 21.00 21.00 22.50 22.00 22.00 23.00 24.00 24.00 Municipal Court 14.00 14.00 14.00 14.00 14.00 14.67 14.65 14.65 14.65 14.65 Law 6.88 6.50 6.50 6.00 6.25 6.25 6.25 6.23 6.23 6.21 Finance 24.15 24.15 24.15 24.15 22.65 22.65 22.65 22.15 22.15 22.15 Human Resources 7.50 7.50 7.50 6.50 6.50 6.44 7.44 6.75 6.75 6.75 Community Development 26.05 26.05 27.55 27.05 27.30 27.30 27.30 28.68 28.68 28.18 Police 283.00 290.40 290.40 292.90 288.65 289.91 291.91 296.91 296.91 295.91 Fire 173.25 173.25 173.25 173.25 173.25 173.25 169.25 169.75 173.75 173.75 Health 35.25 35.25 35.25 36.00 35.16 40.20 29.33 28.56 28.56 29.52 Public Works 82.00 82.00 82.00 83.00 79.90 79.90 80.27 80.27 80.27 80.27 Water Pollution Control 5.00 5.00 5.00 5.00 - - - - -Parks and Recreation 32.65 32.65 33.46 31.71 28.71 29.15 27.85 27.10 27.10 26.52 Total Authorized General Fund 743.23 750.25 751.56 752.06 733.12 740.47 728.65 733.05 733.05 731.91 Less: Positions not Funded (3.50) (4.50) (18.05) (40.55) (60.05) (79.27) (73.77) (70.27) (69.77) (82.77) Total Funded General Fund 739.73 745.75 733.51 711.51 673.07 661.20 654.88 662.78 663.28 649.14 Tourism Fund 4.41 4.41 4.41 4.41 4.66 4.66 5.66 8.18 14.18 13.00 Less: Positions not Funded - - - - - - - - (3.18) (3.18) Total Funded Tourism Fund 4.41 4.41 4.41 4.41 4.66 4.66 5.66 8.18 11.00 9.82 Community Dev. Block Grant Act FundCommunity Development 2.70 2.70 2.00 2.00 2.00 2.00 2.00 2.00 2.00 2.00 Total CDBG Fund 2.70 2.70 2.00 2.00 2.00 2.00 2.00 2.00 2.00 2.00 HOME Program Fund 1.00 1.00 1.00 1.00 1.00 1.00 1.00 1.00 1.00 1.00 Street Maintenance Sales Tax Fund 0.00 0.00 0.00 0.00 0.00 3.00 3.00 3.00 3.00 3.00 Park Improv. Sales Tax Fund 25.29 25.29 23.98 22.48 21.75 21.75 24.70 26.61 26.61 28.22 Less: Positions not Funded (1.00) (0.50) (0.50) (0.50) Total Funded Parks Sales Tax 25.29 25.29 23.98 21.48 21.75 21.75 24.70 26.11 26.11 27.72 Storm Water Sales Tax Fund 8.00 8.00 8.00 8.00 13.00 13.00 13.00 13.00 13.00 13.00
424
City of Independence, Missouri
2016-17 Operating Budget
Authorized/Funded Positions Summary - All Funds
Budget Description 2007-08 2008-09 2009-10 2010-11 2011-12 2012-13 2013-14 2014-15 2015-16 2016-17
For the Fiscal Years 2007-08 through 2016-17 Grants Fund Law Department 0.37 0.25 0.25 0.25 0.25 0.25 0.25 0.28 0.28 0.16 Police 14.00 15.00 15.00 13.00 14.00 13.00 13.00 7.00 7.00 6.00 Fire 0.75 0.75 0.75 0.75 0.75 0.75 4.75 5.25 1.25 1.25 Health 6.25 7.10 5.35 4.95 8.65 7.65 9.06 6.86 7.13 8.15 Total Grants Fund 21.37 23.10 21.35 18.95 23.65 21.65 27.06 19.39 15.66 15.56 Power and Light FundTechnology Services 1.00 1.00 1.00 1.00 1.50 1.50 1.50 1.50 1.50 1.50 Power and Light 220.00 217.00 218.00 222.00 233.00 236.00 238.00 239.00 239.00 239.00 Total Power and Light Fund 221.00 218.00 219.00 223.00 234.50 237.50 239.50 240.50 240.50 240.50 Less: Positions Not Funded (3.00) Total Funded Power and Light Fund 221.00 218.00 219.00 223.00 234.50 237.50 236.50 240.50 240.50 240.50 Sanitary Sewer FundPublic Works 1.00 1.00 1.00 1.00 1.00 1.00 1.00 1.00 1.00 1.00 Water Pollution Control 70.00 70.00 70.00 70.00 70.00 70.00 70.00 70.00 73.20 73.20 Total Sanitary Sewer Fund 71.00 71.00 71.00 71.00 71.00 71.00 71.00 71.00 74.20 74.20 Water FundFinance 0.85 0.85 0.85 0.85 0.85 0.85 0.85 0.85 0.85 0.85 Water 98.65 101.65 101.65 101.65 93.65 93.42 92.42 93.42 93.42 93.42 Total Authorized Water Fund 99.50 102.50 102.50 102.50 94.50 94.27 93.27 94.27 94.27 94.27 Less: Positions Not Funded (1.00) (1.00) (1.00) (8.65) (8.92) (5.42) (2.42) (2.42) (2.42) Total Funded Water Fund 99.50 101.50 101.50 101.50 85.85 85.35 87.85 91.85 91.85 91.85 Central Garage Fund Total Authorized Central Garage Fund 10.00 10.00 9.75 9.75 9.75 9.75 9.75 9.75 9.75 9.75 Less: Positions Not Funded (0.75) (1.12) (1.12) (1.12) (1.00) (1.00) (1.00) Total Funded Central Garage Fund Fund 10.00 10.00 9.75 9.00 8.63 8.63 8.63 8.75 8.75 8.75 Workers' Compensation Fund 0.00 1.75 1.75 1.75 2.00 2.00 2.00 2.00 2.00 2.00 Grand Total Authorized - All Funds 1,207.50 1,218.00 1,216.30 1,216.90 1,210.93 1,222.05 1,220.59 1,223.75 1,229.22 1,228.41 Less: Positions not Funded (3.50) (5.50) (19.05) (43.30) (69.82) (89.31) (83.31) (74.19) (73.69) (89.87) Grand Total Funded - All Funds 1,204.00 1,212.50 1,197.25 1,173.60 1,141.11 1,132.74 1,137.28 1,149.56 1,155.53 1,138.54 425
City of Independence, Missouri
2016-17 Operating Budget
Demographic Statistics
Date of Organization: 1827 Date of Incorporation: 1849 Date Charter Adopted: December 5, 1961 Form of Government: City Council/City Manager Area: 78 square miles Population: 2006 - 115,9532011 - 116,830 2007 - 116,3592012 - 117,213 2008 - 109,1592013 - 117,270 2009 - 114,1282014 - 117,240 2010 - 121,2122015 - 117,255 Projected Retail Sales for FY 2016-17 $1,810,858,586 Registered Voters: 64,019 Number of Households: 48,170 Number of Employees: 1,087 Fire Protection: Communications (served by): Number of Stations 10 Newspapers (daily) 1 No. of Authorized Employees 172 Radio Stations 1 Number of Vehicles 45 TV Stations 0 (cable TV service available) Police Protection: Recreation: Number of Stations 4 Park Acreage 843 No. of Authorized Employees 299.91 Number of Parks 46 Number of Vehicles 191 Community Centers 3 Fitness Centers 2 Education: Athletic Fields 44 Elementary and High Water Parks 1 School enrollment 25,076 Elementary Schools 27 Transportation: Junior High Schools 6 Bus Systems (operated 2 Senior High Schools 7 by KCATA & First Transit) Parochial & Private 5 Taxi Services 3 Pre-School & Kingergartens 3 Community Facilities: Teachers 1,649 Hospitals 1 Administrators 135 Beds 221 Colleges 2 Motels/Hotels 18 No. of Rooms 1,797 Bank/Credit Union Fac.30 Paved Streets (miles) 560 Water Mains (miles) 760 Electric Circuits (miles) 888 Water Consumption (daily avg.) Electric Consumption (in millions of gallons)23.82 (daily avg in Mwh) 2,832 Sanitary Sewers (miles) 614 City Infrastructure 426
City of
Missouri 2016-17 Operating Budget
Financial Statistics


Independence,
Real Estate Revenue by Levy Type ApprovedCurrent Est. City Levy Purpose2015 RateCity Levy Purpose2015-16 General Purposes0.4871 $ General Purposes5,108,941 $ Public Health & Recreation0.2294 Public Health & Recreation2,406,059 Total0.7165 $ Total7,515,000 $ Overlapping Jurisdictions Indep. School District 5.9130 Fort Osage School District5.7000 Blue Springs School District5.7286 Kansas City School District4.9599 Jackson Co./State of Mo.1.0338 Metro. Jr. College 0.2343 Independence Square Special Benefit District0.5638 Special Taxing Districts: 39th Street Transportation Development District 0.125% Crackerneck Transportation Development District 0.100% Mt. Washington Transportation Development District 0.100% Events Center Community Improvement District 0.075% Noland Road Community Improvement District 0.075%
Taxes Real Estate Tax Rate (Per $100 assessed valuation) Sales Taxes State of MO 4.225% Jackson County 1.125% Zoo District 0.125% Independe nce 2.25% Base* Sales Tax Rate by Source Total 7.775% *excludes TDD &CID taxes General, 1.00% Streets, 0.50% Parks, 0.25% Storm Water, 0.25% Police, 0.125% Fire, 0.125% City of Independence Sales Tax Total 2.25% 427
Property
*See the City of Independence
City of Independence, Missouri 2016-17 Operating Budget
Financial Statistics
Transient Guest Tax 6.5% of Gross Daily Rent Cigarette Tax $2.50 per thousand Cigarettes Utility Franchise Fee9.08% of Gross Receipts (5% for Cable TV) Business License Fee$25.00 Annual Gross Revenue under $25,000; $25.00 plus $0.29 per thousand Annual Gross Revenue over $25,000 (maximum fee $30,000) Motor Vehicle License 4.50 $ Motorcycles & Motortricycles 5.00 $ Passenger Cars 6.00 $ Commercial & Recreational Vehicles
General Obligation Bonds - $ Revenue Bonds Power and Light 128,017,832 $ Water 34,781,113 $ Sanitary Sewer 101,145,156 $ Events Center 90,442,723 $ Total 354,386,824 $ Assessed Valuation % of Total Assessed Valuation Simon Property Group LP26,030,210 $ 2.06% Cole EDD Mt. Independence LLC 8,963,343 0.71% Space Center of Kansas City 6,730,787 0.53% Southern Union Company 5,953,893 0.47% AT&T 5,105,329 0.40% Sprint 4,758,915 0.38% Mansion Apartment 4,530,213 0.36% Comcast Cablevision 4,251,687 0.34% Walmart 3,869,194 0.31% Centerpoint Medical Center 3,278,403 0.26% Principal Employers Number of Employees % of Total Employment Independence School District2,2003.72% Alliant Tech Systems1,6002.70% Centerpoint Medical Center1,4002.36% City of Independence1,1201.89% Government Employee Hospital Association6501.10% Rosewood Health Center at the Groves4440.75% Burd & Fletcher2740.46% Jackson County Circuit Court2740.46% Cable Dahmer Automotive2710.46% Unilever Bestfoods NA2600.44% Principal Property Taxpayers and Employers Principal Taxpayers Fee Structure* Outstanding Debt as of June 30, 2015 428
Revenue Manual for more information
ACRONYMS
ADA - Americans with Disabilities Act
AED - Automatic External Defibrillator
ALS - Advance Life Support
APWA - American Public Works Association
BLR - Business and Legal Resources
BLS - Basic Life Support
CAFR - Comprehensive Annual Financial Report
CDBG - Community Development Block Grant
CERT - Community Emergency Response Team
CEU - Continued Education Unit
COAD - Community Organizations Active in Disasters
DARE - Drug Abatement Resistance Education
DBA - Doing Business As
DEA - Drug Enforcement Administration
DEU - Drug Enforcement Unit
DWI - Driving While Intoxicated
EEOP - Equal Employment Opportunity Plan
EMPG - Emergency Management Planning Grant
EMS - Emergency Medical Services
EMT - Emergency Medical Technician
EOC - Emergency Operations Center
429
ACRONYMS
EOD - Explosive Ordinance Disposal Team
EOP - Emergency Operations Plan
FACT - Failure to Appear in Court
FM/HR - Financial Management/Human Resources
FTE - Full time Equivalent
GASB - Governmental Accounting Standards Board
GFOA - Government Finance Officers Association
GIS - Geographic Information Systems
GPS - Global Positioning System
H.I.D.T.A - High Intensity Drug Trafficking Area
HMO - Health Maintenance Organization
HRMA - Human Resources Management Association
ICED - Independence Council for Economic Development
I.D.E.A. - Individual Development and Elevated Action
IPMA-HR - International Public Management Association for Human Resources
JDE - JD Edwards System
KCATA - Kansas City Area Transportation Authority
LCG - Local Coordination Guide
LLC - Limited Liability Corporation
LP - Limited Partnership
MARC - Mid-America Regional Council
430
ACRONYMS
MHz - Megahertz
NFTM - National Frontier Trails Museum
NIMS - National Incident Management System
NRP - National Response Plan
NWCDC - Northwest Community Development Corporation
OPEB - Other Post-Employment Benefits
PLC - Programmable Logic Controllers
P.O.S.T. - Police Officers Standards and Training
PPE - Personal Protective Equipment
PPO - Preferred Provider Organization
RACES - Radio Amateurs Response Team
RFP - Request For Proposal
SCBA - Self Contained Breathing Apparatus
SEMA - State Emergency Management Agency
SRT - Special Response Team
TDD - Transportation Development District
TIF - Tax Increment Financing
USGS - United States Geological Survey
WPC - Water Pollution Control
431
GLOSSARY OF BUDGET AND FINANCE TERMS
Account - A sub-unit of the accounting system used to record the financial activity of similar transactions.
Accounting
System - The total set of records and procedures that are to record, classify, and report information on financial status and operations.
Accrual
Accounting - A basis of accounting in which revenues and expenditures are recorded at the time they are earned or incurred as opposed to when cash is actually received or spent. For example, in accrual accounting, a revenue which was earned between June 1 and June 30, but for which payment was not received until July 10, is recorded as a revenue of June rather than July.
Adopted Budget - Revenues and appropriations approved by the City Council in June for the following fiscal year.
Ad Valorem Tax - A tax levied on the assessed valuation of real property.
Appropriation - An authorization made by the Council that allows the City to incur obligations and to make expenditures of resources for the procurement of goods and services.
Assessed
Valuation - A value that is established for real or personal property for use as a basis for levying property taxes.
Assets - Resources owned or held by the City which have a monetary value.
Balanced An operating budget in which the operating revenues plus beginning Budget - fund balance are equal to, or exceed, operating expenditures.
Beginning/ Unencumbered resources available in a fund from the prior/current Ending Fund year after payment of the prior/current year’s expenses. Not Balance - necessarily cash on hand.
Bonds - Debt instruments representing a promise to pay a specified amount of money at a specified time and at a specified periodic interest rate. Bonds are used to finance major capital projects or adverse judgments.
432
GLOSSARY OF BUDGET AND FINANCE TERMS
Budget
(Capital Improvement) - A Capital Improvement Budget is a separate budget from the operating budget. Items in the Capital Budget are usually construction projects designed to improve the value of the government assets. Examples of capital improvement projects include roads, sewer lines, buildings, recreational facilities and large scale remodeling. The Council receives a separate document that details the Capital Budget costs for the upcoming fiscal year. The Capital Budget is based on a Capital Improvement Program (CIP).
Budget
(Operating) - A plan of financial operation embodying an estimate of proposed expenditures for a given period (a fiscal year) and the proposed means of financing them (revenue estimates). The term is also sometimes used to denote the officially approved expenditure ceilings under which the departments operate.
Capital Major construction, repair of or addition to buildings, parks, streets, Improvement - bridges and other City facilities.
Capital
A multi-year plan for capital expenditures needed to maintain and Improvement expand the public infrastructure. It projects the infrastructure needs Program (CIP) - for a set number of years and is updated annually to reflect the latest priorities, cost estimates, or changing financial strategies.
Capital Outlay - Represents expenditures which result in the acquisition or addition to fixed assets including land, buildings, improvements, machinery or equipment. Most equipment or machinery expenditures are included in the Operating Budget. Capital improvements such as acquisition of land and related construction and engineering fees are generally in the Capital Budget.
City Council - The Mayor and six Council members collectively acting as the legislative and policy making body of the City.
Contingency - A budgetary appropriation set aside for emergencies and expenditures not planned for otherwise.
Debt Service - Debt Service expenditures are the result of bonded indebtedness of the City. Debt Service expenditures include principal, interest, fiscal agent's fees, and bond reserve requirements on the City's outstanding debt.
433
GLOSSARY OF BUDGET AND FINANCE TERMS
Department - A major administrative division of the City that has management responsibility for an operation or a group of related operations within a functional area.
Depreciation - (1) Expiration in the service life of capital assets attributable to wear and tear, deterioration, action of the physical elements, inadequacy or obsolescence. (2) That portion of the cost of a capital asset which is charged as an expense during that particular period.
Designated
Fund Balance- An account used to show that a portion of fund balance was segregated for a specific purpose. The account is not legally restricted and is, therefore, available for general appropriation.
Encumbrances - Obligations in the form of purchase orders, contracts or salary commitments that are chargeable to an appropriation and that an appropriation is restricted. They cease to be encumbrances when paid or when an actual liability is created.
Enterprise Fund - Separate financial accounting used for government operations that are financial and operated in a manner similar to private sector operations. Enterprise funds for the City are Power & Light, Sanitary Sewer and Water.
Estimated
Revenue - The amount of projected revenue to be collected during the fiscal year.
Expenditure - This term refers to the outflow of funds paid or to be paid for an asset obtained or goods and services obtained despite when the expense occurs. This term applies to all funds. Note: An encumbrance is not an expenditure. An encumbrance reserves funds to be expended.
Fiscal Year - The period signifying the beginning and ending period for recording financial transactions. The Charter specifies July 1 to June 30 as the fiscal year.
Fixed Assets - Assets of a long-term character which are intended to be held or used, such as land, buildings, machinery, furniture and other equipment.
Full Time The decimal equivalent of a part-time position converted to a full-time Equivalent (FTE) - basis, i.e., one person working half time would count as 0.5 FTE.
434
GLOSSARY OF BUDGET AND FINANCE TERMS
Fund - An independent fiscal and accounting entity with a self-balancing set of accounts recording cash or other resources with all related liabilities, obligations, reserves, and equities that are segregated to carrying on specific activities or attaining certain objectives.
Fund Balance - The Fund Balance is the excess of a governmental fund's assets over its liabilities. A negative fund balance is a deficit.
General Fund - The largest governmental fund, the General Fund accounts for most of the financial resources of the general government. General Fund revenues include property taxes, licenses and permits, local taxes, service charges, and other types of revenue. This fund usually includes most of the basic operating services, such as fire and police protection, finance, data processing, parks and recreation, public works and general administration.
Goal - A statement of broad direction, purpose, or intent based on the needs of the community.
Governmental
Fund - funds generally used to account for tax-supported activities. There are five different types of governmental funds. The City of Independence’s governmental funds include the general fund, other general purpose funds, special revenue funds, debt service funds, and capital projects funds.
Grant - A contribution of assets (usually cash) by one governmental entity (or other organization) to another to support a particular function. Grants may be classified as either categorical or block depending upon the amount of discretion allowed the grantee.
Interfund Transfer of resources between funds that are not recorded as Transfer - revenues to the fund receiving or expenditures to the fund providing.
Internal Service
Funds - Proprietary funds used to account for the furnishing of goods or services by one department or agency to other departments or agencies on a cost-reimbursement basis; for example, the Central Garage.
Line Item - An individual expenditure category listing in the budget (personal services, commodities, contractual services, etc.)
435
GLOSSARY OF BUDGET AND FINANCE TERMS
Major Fund - A governmental fund or enterprise fund reported as a separate column in the basic fund financial statements. The general fund is always a major fund.
Modified Accrual Under the modified accrual basis of accounting, revenues are Accounting - recognized when susceptible to accrual (when they become both measurable and available). “Measurable” means the amount of the transaction can be determined and “available” means collectible within the current period or soon enough thereafter to be used to pay liabilities of the current period. A one-year availability period is used for revenue recognition for special assessment revenues. Anticipated refunds of such taxes are recorded as liabilities and reduction in revenue when measurable and their validity seems certain. Expenditures are recorded when the related fund liability is incurred except for principal and interest on general long-term debt, which are recorded as fund liabilities when due.
Non- Program costs that do not relate to any one department, but Departmental - represent costs of a general, citywide nature, i.e. debt service.
Object of Expenditure - Expenditure classifications based upon the types or categories of goods and services purchased. Objects of expenditures are:
*100 - Personal Services (salaries and wages);
*200 - Services (utilities, maintenance contracts, travel)
*300 - Supplies;
*400 - Capital (automobiles, trucks, computers)
Objective - A program objective is an operationalized statement of a program goal, containing specific descriptions of desired results. An objective states a result in which the achievement is measurable within a given time frame and cost parameter. Objectives usually contain verbs such as “increase,” “reduce,” or “maintain.”
Ordinance - A formal legislative enactment by the governing board of the City. If it is not in conflict with any higher form of law, such as a State statute or constitutional provision, it has the full force and effect of law within the boundaries of the City to which it applies. The difference between an ordinance and a resolution is that the latter requires less legal formality and has a lower legal status.
436
GLOSSARY OF BUDGET AND FINANCE TERMS
Payment-In-Lieu- An amount charged enterprise operations equivalent to the City Of-Taxes - property taxes that would be due on a plant or equipment if the enterprise operations were “for profit” companies.
Performance Financial ratios and nonfinancial information that identifies efforts, Indicators - and gauges efficiencies and accomplishments of governments in providing services.
Performance Specific quantitative measures of work performed within an activity Measures - or program. Also, a specific quantitative measure of results obtained through a program or activity.
Proposed Proposed level of expenditures/revenue/FTEs as outlined in the Budget - proposed budget document. This is the City Manager’s recommended budget, which will be considered by the City Council for approval.
Proprietary Fund - In governmental accounting, one having profit and loss aspects; therefore it uses the accrual rather than modified accrual accounting method. The two types of proprietary funds are the enterprise fund and the internal service fund.
Reserved Fund
Balance - An account used to show that a portion of a fund's balance is legally restricted for a specific purpose and is, therefore, not available for general appropriation.
Resolution - A special or temporary order of a legislative body: an order of a legislative body requiring less legal formality than an ordinance or statute.
Resources - Total dollars available for appropriations including estimated revenues, fund transfers, and beginning fund balances.
Retained An equity account reflecting the accumulated earnings of an Earnings - enterprise or internal service fund.
Revenue - Funds that the government receives as income. It includes such items as tax payments, fees from specific services, receipts from other governments, fines, forfeitures, grants, shared revenues and interest income.
437
GLOSSARY OF BUDGET AND FINANCE TERMS
Sources - That portion of Revenues and Fund Balance (Resources) that are identified to balance the budget.
Special Property taxes incurred by property owners within a designated area Assessments - for improvements that benefit the area. A majority of the affected property owners must approve the formation of the benefit district.
Special Revenue Fund - A fund used to account for the proceeds of specific revenue sources (other than expendable trusts of major capital projects) that are restricted to expenditure for specified purposes.
Undesignated
Fund Balance - That portion of the fund balance that has neither been restricted nor designated for a specific purpose. The account is available for general appropriation.
User Fees - Fees charged to users of a particular service provided by the City.
Uses - The appropriations and transfer authorizations that create the budget for each Fund.
Working Capital
(Designated) - An account within the fund balance of the General Fund in which a certain amount of resources were set aside for purposes of maintaining a positive cash flow, shortfalls in the revenue projections, and emergencies during the fiscal year.
438