Annual Comprehensive Financial Report


SM
June
For the Fiscal Year Ended
30, 2021
CITY OF INDEPENDENCE, MISSOURI ANNUAL COMPREHENSIVE FINANCIAL REPORT
FOR THE FISCAL YEAR ENDED JUNE 30, 2021
Mayor Eileen Weir
City Council
John Perkins
District #1
Brice Stewart District #2
Michael Steinmeyer District #3
Dan Hobart District #4
Karen DeLuccie
At-large
Michael Huff At-large
City Manager
Zachary Walker
Prepared by the Department of Finance and Administration
Bryan Kidney, Director of Finance and Administration
Cindy Gray, Chief Financial Officer
Nancy Cooper, Accounting Supervisor
i
Table of Contents Page Introductory Section: Organizational Chart 1 Letter of Transmittal 2-6 GFOA Certificate of Achievement 7 Financial Section: Independent Auditors’ Report 8-9 Management’s Discussion and Analysis 10-21 Exhibit Basic Financial Statements: Government-wide: Statement of Net Position 1 22 Statement of Activities 2 23 Fund Financial Statements: Governmental Funds: Balance Sheet 3 24 Reconciliation of the Governmental Funds Balance Sheet to the Statement of Net Position 3.1 25 Statement of Revenues, Expenditures, and Changes in Fund Balances 4 26 Reconciliation of the Governmental Funds Statement of Revenues, Expenditures, and Changes in Fund Balances to the Statement of Activities 4.1 27 Proprietary Funds: Statement of Net Position 5 28 Statement of Revenues, Expenses, and Changes in Fund Net Position 6 29 Statement of Cash Flows 7 30 Fiduciary Funds: Statement of Fiduciary Net Position 8 31 Statement of Changes in Fiduciary Net Position 9 32 Notes to Financial Statements 33-90 Required Supplementary Information: Budgetary Comparison Schedule – General Fund 10 91 Budgetary Comparison Reconciliation Schedule – General Fund 10.1 92 Notes to Budgetary Comparison Schedules 93 Schedule of Changes in Total OPEB Liability and Related Ratios 11 94 LAGERS Schedule of Changes in Net Pension Liability and Related Ratios 12 95 LAGERS Schedule of Contributions 13 96
CITY OF INDEPENDENCE, MISSOURI
ii
Table of Contents Exhibit Page Supplementary Information: Combining Balance Sheet – Nonmajor Governmental Funds 14 97 Combining Statement of Revenues, Expenditures, and Changes in Fund Balances – Nonmajor Governmental Funds 15 98 Combining Balance Sheet – Nonmajor Special Revenue Funds 16 99 Combining Statement of Revenues, Expenditures, and Changes in Fund Balances – Nonmajor Special Revenue Funds 17 100 Budgetary Comparison Schedules Tourism Fund 18 101-102 Community Development Block Grant Fund 19 103-104 Rental Rehabilitation Fund 20 105-106 Street Improvement Sales Tax Fund 21 107-108 Park Improvement Sales Tax Fund 22 109-110 Storm Water Sales Tax Fund 23 111-112 Police Public Safety Sales Tax Fund 24 113-114 Fire Protection Sales Tax Fund 25 115-116 Grant Fund 26 117-118 CARES Act Fund 27 119-120 Animal Services Use Tax Fund 28 121-122 Police Use Tax Fund 29 123-124 Health Property Tax Levy Fund 30 125-126 Parks and Recreation Property Tax Levy Fund 31 127-128 Combining Balance Sheet – Nonmajor Sales Tax Fund 32 129 Combining Statement of Revenues, Expenditures, and Changes in Fund Balances – Nonmajor Sales Tax Funds 33 130 Combining Balance Sheet – Nonmajor Capital Projects Funds 34 131 Combining Statement of Revenues, Expenditures, and Changes in Fund Balances (Deficit) – Nonmajor Capital Projects Funds 35 132 Combining Balance Sheet – Component Unit – Tax Increment Financing 36 133-134 Combining Schedule of Revenues, Expenditures, and Changes in Fund Balances (Deficit) – Component Unit – Tax Increment Financing 37 135-136 Combining Statement of Net Position – Internal Service Funds 38 137 Combining Statement of Revenues, Expenses, and Changes in Net Position –Internal Service Funds 39 138 Combining Statement of Cash Flows – Internal Service Funds 40 139 Combining Statement of Fiduciary Funds – Custodial Funds 41 140 Combining Statement of Changes in Fiduciary Net Position – Custodial Funds 42 141 Schedules of Operating Expenses – Power and Light Fund 43 142-143 Schedule of Operating Statistics – Power and Light Fund 44 144 Schedules of Operating Expenses – Water Fund 45 145 Schedule of Operating Statistics – Water Fund 46 146 Schedule of Operating Statistics – Sanitary Sewer Fund 47 147
CITY OF INDEPENDENCE, MISSOURI
iii
Table of Contents Table Page Statistical Data (Unaudited): Net Position by Component 1 149 Changes in Net Position 2 150-151 Fund Balances of Governmental Funds 3 152 Changes in Fund Balances of Governmental Funds 4 153 Sales and Use Tax Revenue 5 154 Sales Tax Rates Direct and Overlapping Governments 6 155 Assessed Value and Estimated Actual Value of Taxable Property 7 156 Property Tax Rates Direct and Overlapping Debt 8 157 Principal Property Taxpayers 9 158 Property Tax Levies and Collections 10 159 Utility Sales by Category 11 160 Utility Rates by Category 12 161 Principal Utility Payers – Power and Light 13 162 Principal Utility Payers – Water 14 163 Principal Utility Payers – Sewer 15 164 Ratios of Outstanding Debt by Type 16 165 Ratios of General Bonded Debt Outstanding 17 166 Direct and Overlapping Governmental Activities Debt 18 167 Legal Debt Margin Information 19 168 Pledged-Revenue Coverage 20 169 Demographic and Economic Statistics 21 170 Principal Employers 22 171 Full-time Equivalents City Government Employees by Function/Program 23 172 Operating Indicators by Function/Program 24 173 Capital Asset Statistics by Function/Program 25 174
CITY OF INDEPENDENCE, MISSOURI

Citizens of Independence

Mayor & City Council
Management Analyst Boards & Commissions City Clerk Municipal Court
Adam Norris
Assistant City Manager
Mark Randall
Police Fire Municipal
Assistant City Manager
Services Public Utilities CommunityDevelopment Finance & Administration
1
Zachary
Walker City Manager Animal Services Parks, Recreation & Tourism
December 17, 2021
Honorable Mayor, Members of the City Council, and Citizens of the City of Independence, Missouri
The Finance Department is pleased to present the Annual Comprehensive Financial Report (ACFR) of the City of Independence, Missouri, for the fiscal year ended June 30, 2021. This report is submitted to you for your review in compliance with the provisions of Article 3, Section 3.34 of the City Charter.
The responsibility for accuracy, completeness and fairness of the data presented, including all disclosures, rests with the City. We believe the report, as presented, is accurate in all material aspects and is presented in a manner designed to fairly set forth the financial position and the results of the City, on a Governmentwide and Fund basis. It is our belief that all disclosures necessary to enable the reader to gain an understanding of the City’s financial activities have been included. To enhance the reader’s understanding of these financial statements, note disclosures have been included as an integral part of this document.
This report was prepared by the City’s Finance Department staff in accordance with generally accepted accounting principles (GAAP), which are uniform minimum standards and guidelines for financial accounting and reporting in the United States. This report is intended to provide sufficient information to permit the assessment of stewardship and accountability and to demonstrate legal compliance.
The City of Independence’s financial statements, as required by the Charter, have been audited. The independent audit was conducted by RubinBrown, LLP. The goal of the independent audit was to provide reasonable assurance that the financial statements of the City of Independence for fiscal year ended June 30, 2021 are free of material misstatement. The independent audit involved examining, on a test basis, evidence supporting the amounts and disclosures in the financial statements; assessing the accounting principles used and significant estimates made by management; and evaluating the overall financial statement presentation. The independent auditor concluded, based upon the audit, that there was a reasonable basis for rendering an unmodified opinion that the City of Independence’s financial statements for the fiscal year ended June 30, 2021, are fairly presented in conformity with GAAP. The independent auditor’s report is presented as the first component of the financial section of this report.
The independent audit of the financial statements of the City of Independence was part of a broader, federally mandated “Single Audit” designed to meet the special needs of Federal grantor agencies. The standards governing Single Audit engagements require the independent auditor to report not only on the fair presentation of the financial statements, but also on the audited government’s internal controls and compliance with legal requirements, with special emphasis on internal controls and compliance with legal requirements involving the administration of federal awards. These reports are available in the City of Independence’s separately issued Single Audit Report.

In fulfilling its responsibilities for reliable financial statements, management depends on the City's system of internal control. This system is designed to provide reasonable assurance that assets are effectively safeguarded and that transactions are executed in accordance with management's authorization and are properly recorded. Because the cost of internal control should not exceed anticipated benefits, the objective is to provide reasonable, rather than absolute, assurance that the financial statements are free of any material misstatements. In addition to the independent audit and the internal control system, the Charter provides that the Council appoint a Management Analyst. The Management Analyst performs such duties as directed by the Council. These duties include the continuous review of all departments, and the preparation of an annual report to the Council concerning the methods and results of the operations of the reviewed departments The Management Analyst position is currently vacant, and these duties have not been performed since the vacancy.
The Audit and Finance Committee, comprised of three members of the Council, acts in an advisory capacity to the Council and reviews financial information for appropriateness, reliability, clarity, timeliness and compliance with generally accepted accounting principles and legal requirements. In addition, this committee reviews the audit functions and adequacy of internal control systems.
GAAP requires that management provide a narrative introduction, overview and analysis to accompany the basic financial statements in the form of Management’s Discussion and Analysis (MD&A). This letter of transmittal is designed to complement the MD&A and should be read in conjunction with it. The City of Independence’s MD&A can be found immediately following the report of the independent auditor.
Profile of the City
Incorporated in 1849, the City of Independence is the county seat of Jackson County and borders on the eastern edge of Kansas City, Missouri. Independence has a rich history as The Queen City of the Trails and former home of Harry S Truman, 33rd President of the United States. Independence is the fifth largest city in Missouri with an estimated population of 116,673.
As the beginning of the Santa Fe, Oregon, and California Trails, the City has 16 heritage attractions including the Harry S. Truman Library and Museum, the Truman Home, Victorian mansions, 1859 Jail and Marshal’s Home, the National Frontier Trails Museum, historic square, and religious sites. Patricia Schultz included several tourism attractions in Independence in her travel book, 1,000 Places to See in the United States and Canada Before You Die.
Its central location in the "Heart of America" offers residents and businesses unique location advantages and means that traveling, shipping, receiving and communications are more economical because of shorter distances to most parts of the country. Situated along major interstate highways (I-70, I-49, I-35, I-29) and rail routes, access to Independence from all parts of the nation, as well as, Canada and Mexico is excellent. The City’s 78 square miles accommodate its residents and numerous businesses with 32 square miles of mixed-use land in eastern Independence available for development.
The City of Independence is home to Lake City Army Ammunition Plant, the largest small-caliber ammunition manufacturing plant in the world. Lake City is one of the largest employers in Independence and encompasses 458 buildings on 3,935 acres. Independence is home to the Harry S Truman Presidential Museum & Library, one of only fourteen in the nation There are six major industrial and business parks in Independence. A large portion of the manufacturing, warehousing and office space is located underground in three separate, sub-surface business parks. This area has over 750 acres of mixed-use business parks with over 32 million square feet of industrial space, underground warehousing, and a cold storage facility with 1.2 million square feet.
3
The City of Independence is organized, as a constitutional charter city under the Missouri statutes utilizing the Council-Manager form of government. In accordance with the charter, the registered voters within the City elect a mayor and six council members to serve four-year terms as representatives on the City Council. An election for four districts is conducted as a unit, while elections for mayor and two atlarge seats are conducted two years later. The Council appoints a City Manager to serve as the chief administrative officer of the City.
The City of Independence provides a comprehensive range of municipal services normally associated with a municipality, including police and fire protection, public works services, public health services, parks and recreation facilities, general administrative services and a trails history museum. The City also provides electric, water, and sanitary sewer services, all of which are accounted for in the financial statements as business-type activities.
In evaluating the City as a reporting entity, management has considered all potential component units. Determination of whether an entity is controlled by, or dependent on, the City is made on the basis of budget adoption, taxing authority, outstanding debt secured by revenues or general obligations of the City, or the City’s obligation to fund any deficit that may occur. As allowed by accounting principles generally accepted in the United States of America, the City has included the Tax Increment Financing Debt Service (TIF), Independence Events Center Management Corporation (IECMC), Cable Dahmer Arena - Spectra Venue Management (formerly known as Global Spectrum), Events Center Community Improvement District (CID) and the Crackerneck Creek Transportation Development District’s (TDD) activities in its financial statements as blended component units.
The annual budget serves as the foundation for the City of Independence’s financial planning and control. The appropriated budget is prepared by fund, function (e.g. public safety), and department (police). Department heads may make transfers of appropriations within their department. Transfers of appropriations between departments, however, require approval of the City Council. Budget-to-actual comparisons for the General and Special Revenue Funds, which are required for each individual governmental fund for which an appropriated annual budget has been adopted, are included in this report.
Purchase orders and contracts are encumbered prior to their release to vendors. Any item, which would result in expenditures in excess of a department’s budget, is not released until alternative sources of payment are made available. Open encumbrances as of June 30, 2021, are reported as committed and assigned fund balance since the City intends to honor the purchase orders and contracts.
Local economy
The City is continuing to experience growth on the eastern side of town. The I-70 interchange has made the Little Blue Parkway the professional business corridor of the 21st Century. This is due to a strong business climate and a history of successful development efforts utilizing Tax Increment Financing (TIF). This area has three million square feet of retail development, two million of which has been built since 1995. The Little Blue Parkway is located in the heart of a fast growing commercial area. This area is home to the Cable Dahmer Centers Arena, formerly known as the Independence Events Center which includes an arena with 5,800 seats for sports with additional seating for concerts and a community ice rink. The Cable Dahmer Arena is home to the Central Hockey League franchise the Kansas City Mavericks and Major Indoor Soccer League the Comets. The Kansas City Mavericks have a signed contract that expires in 2024 and the Comets contract expires April 2022. The Arena opened in November 2009, providing approximately 120 new jobs
4
The following table sets forth average annual unemployment figures for Independence and Jackson County, compared to the State of Missouri.
*Average estimated thru June 2021.
Long-term financial planning
The City of Independence prepares a five-year financial projection of our financial condition, which includes capital outlay projections as well as a six-year Capital Improvements Program (CIP). The CIP includes proposed projects for constructing, maintaining, upgrading, and replacing the City’s physical infrastructures. The budget for fiscal year 2021-22 includes projects totaling an estimated $29.2 million for capital projects. In preparing the capital budget, needs are assessed, public improvements are prioritized and costs are projected. This budget is reviewed annually and projects are re-prioritized and the financial condition of the City is evaluated. Many of the streets improvements, parks improvements and storm water projects are funded by the voter approved street, parks, and storm water sales taxes.
Relevant financial policies
Effective July 1, 2017, the City’s financial policy to maintain an unassigned fund balance level in the General Fund increased from 5.0% to 16.0% of annual revenues. At the close of the 2020-21 fiscal year, the unassigned fund balance in the General Fund was 7.8% of the General Fund revenues and transfers from utility payments in lieu of taxes. This is an increase of 0.7% from the 2019-20 amount of 7.1%.
If the target level of unassigned fund balance is not being met or is unlikely to be met within five years, it is the City’s policy to establish a plan to replenish the unassigned fund balance during the annual budget process. In previous years, the City Manager has not funded vacant positions in an effort to reduce salary and benefit costs, and departments have been asked to reduce expenditures in an effort to reduce costs.
Awards and Acknowledgements
The Government Finance Officers Association of the United States and Canada (GFOA) awarded a Certificate of Achievement for Excellence in Financial Reporting to the City of Independence for its Annual Comprehensive Financial Report for the fiscal year ended June 30, 2020. In order to be awarded a Certificate of Achievement, a governmental unit must publish an easily readable, efficiently organized annual comprehensive financial report, the contents of which conform to program standards. Such reports must satisfy both generally accepted accounting principles and applicable legal requirements.
A Certificate of Achievement is valid for a period of one year only. We believe our current ACFR continues to conform to the Certificate of Achievement Program requirements, and we are submitting it to the GFOA to determine its eligibility for another certificate.
Year City Unemployment Rate Jackson County Unemployment Rate Statewide Unemployment Rate 2021* 8.0% 6.6% 5.1% 2020 8.0% 7.1% 6.1% 2019 4.0% 3.7% 3.3% 2018 4.1% 3.7% 3.2% 2017 4.7% 4.4% 3.8%
Source: MERIC MO Economic Research and Information Center/MO Dept of Economic Development
5
The preparation of this report would not have been possible without the efficient and dedicated services of team members of the Finance and Administration Department. I wish to express my appreciation to all members of the department who assisted and contributed to the preparation of this report, and a special mention to the City’s CFO, Cindy Gray and the dedication of Nancy Cooper, Accounting Supervisor. I also would like to thank the firm of Rubin Brown, LLP for their assistance and patience in the preparation of this annual report.
Respectfully submitted,
 Bryan Kidney Director of Finance and Administration
6


Government Finance Officers Association Certificate of Achievement for Excellence in Financial Reporting Presented to City of Independence Missouri For its Comprehensive Annual Financial Report For the Fiscal Year Ended June 30, 2020 Executive Director/CEO 7
Independent Auditors’ Report
The Honorable Mayor and Members of the City Council City of Independence, Missouri
Report On The Financial Statements
We have audited the accompanying financial statements of the governmental activities, the business-type activities, each major fund and the aggregate remaining fund information of the City of Independence, Missouri (the City), as of and for the year ended June 30, 2021, and the related notes to the financial statements, which collectively comprise the City of Independence, Missouri’s basic financial statements, as listed in the table of contents.

Management’s Responsibility For The Financial Statements
Management is responsible for the preparation and fair presentation of these financial statements in accordance with accounting principles generally accepted in the United States of America; this includes the design, implementation and maintenance of internal control relevant to the preparation and fair presentation of financial statements that are free from material misstatement, whether due to fraud or error.
Auditors’ Responsibility
Our responsibility is to express opinions on these financial statements based on our audit. We did not audit the financial statements of the Cable Dahmer Arena (Arena), which is a blended component unit presented within the Events Center Fund, a major enterprise fund of the City. This activity represents 1.4 percent and 27.2 percent, respectively, of the total assets and total revenues of the major enterprise fund and 0.2 percent and 1.4 percent, respectively, of the total assets and total revenues of the business-type activities. Those statements were audited by other auditors, whose report has been furnished to us, and our opinion, insofar as it relates to the amounts included for the Arena is based solely on the report of the other auditors. We conducted our audit in accordance with auditing standards generally accepted in the United States of America and the standards applicable to financial audits contained in Government Auditing Standards, issued by the Comptroller General of the United States. Those standards require that we plan and perform the audit to obtain reasonable assurance about whether the financial statements are free of material misstatement. The financial statements of the Arena, a blended component unit presented within the Events Center major enterprise fund, were not audited in accordance with Government Auditing Standards.
An audit involves performing procedures to obtain audit evidence about the amounts and disclosures in the financial statements. The procedures selected depend on the auditors’ judgment, including the assessment of the risks of material misstatement of the financial statements, whether due to fraud or error. In making those risk assessments, the auditor considers internal control relevant to the entity’s preparation and fair presentation of the financial statements in order to design audit procedures that are appropriate in the circumstances, but not for the purpose of expressing an opinion on the effectiveness of the entity’s internal control. Accordingly, we express no such opinion. An audit also includes evaluating the appropriateness of accounting policies used and the reasonableness of significant accounting estimates made by management, as well as, evaluating the overall presentation of the financial statements.
We believe that the audit evidence we have obtained is sufficient and appropriate to provide a basis for our audit opinions.
Opinions
In our opinion, based on our audit and the report of other auditors, the financial statements referred to above present fairly, in all material respects, the respective financial position of the governmental activities, the business-type activities, each major fund and the aggregate remaining fund information of the City of Independence, Missouri as of June 30, 2021 and the respective changes in financial position, and where applicable, its cash flows for the year then ended in accordance with accounting principles generally accepted in the United States of America.
Other Matters Required Supplementary Information
Accounting principles generally accepted in the United States of America require that the Management’s Discussion and Analysis, the Budgetary Comparison Schedules, and the Pension and Other Post Employments Benefits information, as listed in the table of contents, be presented to supplement the basic financial statements. Such information, although not a part of the basic financial statements, is required by the Governmental Accounting Standards Board, who considers it to be an essential part of financial reporting for placing the basic financial statements in an appropriate operational, economic or historical context. We have applied certain limited procedures to the required supplementary information in accordance with auditing standards generally accepted in the United States of America, which consisted of inquiries of management about the methods of preparing the information and comparing the information for consistency with management’s responses to our inquiries, the basic financial statements and other knowledge we obtained during our audit of the basic financial statements. We do not express an opinion or provide any assurance on the information because the limited procedures do not provide us with sufficient evidence to express an opinion or provide any assurance.
Other Information
Our audit was conducted for the purpose of forming opinions on the financial statements that collectively comprise the City of Independence, Missouri’s basic financial statements. The introductory section, combining and individual nonmajor fund financial statements and schedules and statistical section are presented for purposes of additional analysis and are not a required part of the basic financial statements.

The combining and individual nonmajor fund financial statements and schedules are the responsibility of management, and were derived from and relate directly to the underlying accounting and other records used to prepare the basic financial statements. Such information has been subjected to the auditing procedures applied in the audit of the basic financial statements and certain additional procedures, including comparing and reconciling such information directly to the underlying accounting and other records used to prepare the basic financial statements or to the basic financial statements themselves, and other additional procedures in accordance with auditing standards generally accepted in the United States of America. In our opinion, the combining and individual nonmajor fund financial statements and schedules are fairly stated, in all material respects, in relation to the basic financial statements as a whole.
The introductory and statistical sections, as listed in the table of contents, have not been subjected to the auditing procedures applied in the audit of the basic financial statements, and accordingly, we do not express an opinion or provide any assurance on them.
Other Reporting Required By Government Auditing Standards
In accordance with Government Auditing Standards, we have also issued our report dated December 17, 2021 on our consideration of the City’s internal control over financial reporting and on our tests of its compliance with certain provisions of laws, regulations, contracts, and grant agreements and other matters. The purpose of that report is to describe the scope of our testing of internal control over financial reporting and compliance and the results of that testing, and not to provide an opinion on internal control over financial reporting or on compliance. That report is an integral part of an audit performed in accordance with Government Auditing Standards in considering the City’s internal control over financial reporting and compliance.
December 17, 2021
Page 9
The Honorable Mayor and Members of the City Council City of Independence, Missouri
CITY OF INDEPENDENCE, MISSOURI Management’s Discussion and Analysis
June 30, 2021
This section of the City of Independence’s Annual Comprehensive Financial Report presents our review of the City’s financial performance during the fiscal year that ended on June 30, 2021. Please read it in conjunction with the transmittal letter at the front of this report and the City’s financial statements, which follow this section.
Financial Highlights
The City’s total net position increased $11.2 million to a total of $378.9 million. The City’s governmental activities had an increase of $13.7 million and the business-type activities had a decrease of $2.5 million The increase in governmental activities is mostly due to the increase in the City’s net pension asset of $11.6 million and decrease to the net pension liability of $55.8 million offset by an increase to the Other Post-Employment Benefits (OPEB) liability of $21.3 million. The governmental funds also issued refunding debt for the Falls at Crackerneck – Bass Pro TIF. The decrease in business-type activities was the result of an increase in the net pension asset of $7.6 million and decrease to the net pension liability of $38.8 million offset by an increase to the OPEB liability of $10.5 million. The Power and Light fund issued a full redemption of their outstanding 2010 B revenue bonds and issued an electric rebate to customers
Sales and use tax revenue increased by $5.0 million or 9.2%. Sales tax revenue made up about $2.5 million of the increase. The remainder of the increase was due to the City’s use tax for on-line sales of goods delivered within the City that went into effect January 1, 2020. The fiscal year ended June 30, 2021 was the first full year for the use tax, and revenues were $4.7 million.
Total charges for services for the City increased $83,531 or 0.04%, with the business-type activities increasing $1.2 million or 0.6% and the governmental funds decreasing by $1.1 million or 6.8%. The increase for the business-type activities is primarily due to Sanitary Sewer’s rate increase. The decrease for the governmental funds is due to the COVID pandemic, with many facilities and activities being shut down during the fiscal year.
Overview of the Financial Statements
This annual report consists of four parts, management’s discussion and analysis, the basic financial statements, required supplementary information, and an optional section that presents combining statements for non-major governmental funds and internal service funds. The basic financial statements include two kinds of statements that present different views of the City:
• The first two statements are government-wide financial statements that provide both long-term and shortterm information about the City’s overall financial status.
• The remaining statements are fund financial statements that focus on individual parts of the City government, reporting the City’s operation in more detail than the government-wide statements:
o The governmental funds statements tell how general government services, like public safety, were financed in the short-term, as well as, what remains for future spending. The focus of these reports is to show the availability of the City to provide governmental services with current resources.
o Proprietary fund statements offer short-term and long-term financial information about the activities the government operates like a business, such as the Power and Light system, Water system, Sanitary Sewer system, and the Cable Dahmer Arena. The focus of these reports is to show the economic resources or value of these systems.
o Fiduciary fund statements provide information about financial relationships for which the City acts solely as a trustee or agent for the benefit of others, to whom the underlying resources belong, such as the Seniors’ Travel Fund, and Flexible Benefit Plan Fund.
10
The financial statements also include notes that provide additional explanatory information to the financial statements. The statements are followed by a section of required supplementary information, which explains and supports the information in the financial statements.
Figure MD-1 shows how the required parts of this annual report are arranged and relate to one another.
In addition to these required elements, we have included a section with combining statements that provide details about our non-major governmental funds and internal service funds, each of which are added together and presented in single columns in the basic financial statements.
Figure MD-2 summarizes the components of the City’s financial statements, including the portion of the City government, which each covers and the types of information each contain. The remainder of this section explains the structure and content of each of the statements.
Figure MD-1
CITY OF INDEPENDENCE, MISSOURI
Required Components of the Annual Financial Report
Management's Discussion and Analysis
Basic Financial Statements Required Supplementary Information
Required financial statements
*
*
assets and liabilities, both financial and capital, and shortterm and long-term
Type of inflow/outflow information All revenues and expenses during year, regardless of when cash is received or paid
Governmentwide Financial S tatements
Fund Financial Statements
Notes to the Financial S tatements Summary Detail
Figure MD-2
CITY OF INDEPENDENCE, MISSOURI
Major Features of the Government-wide and Fund Financial Statements
Fund Statements
* Balance Sheet
* Statement of revenues, expenditures, and changes in fund balances
Only assets expected to be used up and liabilities that come due during the year or soon thereafter, no capital assets included
Revenues for which cash is received during or soon after the end of the year; expenditures when goods or services have been received and payment is due during the year or soon thereafter
* Statement of net position
* Statement of revenues, expenses, and changes in net position
*Statement of cash flows
All assets and liabilities, both financial and capital, and short-term and longterm
All revenues and expenses during year, regardless of when cash is received or paid
* Statement of fiduciary net position
*Statement of changes in fiduciary net position
All assets and liabilities, both shortterm and long-term; the City's funds do not currently contain capital assets, although they can
All revenues and expenses during year, regardless of when cash is received or paid
CITY OF INDEPENDENCE, MISSOURI Management’s Discussion and Analysis June 30, 2021
Government-Wide Statements Governmental Funds Proprietary Funds Fiduciary Funds Scope Entire City government (except fiduciary funds) The activities of the City that are not proprietary or fiduciary, such as police, fire, and parks Activities the City operates similar to private businesses: electric, water, and sanitary sewer Instances in which the City is the trustee or agent for someone else's resources
Statement
net position
of
Accounting basis and measurement focus Accrual accounting and economic resources focus. Modified accrual accounting and current financial resources focus Accrual accounting and economic resources focus Accrual accounting and economic resources focus Type of asset/liability information All
Statement of activities
11
Government-wide Statements
The government-wide statements report information about the City as a whole using accounting methods similar to those used by private-sector companies. The statement of net position includes all of the government’s assets, liabilities, and deferred inflows/outflows of resources. All of the current year’s revenues and expenses are accounted for in the statement of activities regardless of when cash is received or paid.
The two government-wide statements report the City’s net position and how they have changed. The term “net position” refers to the difference between the City’s assets, liabilities, and deferred inflows/outflows of resources and is one way to measure the City’s financial health or position.
• Over time, increases or decreases in the City’s net position are an indicator of whether its financial health is improving or deteriorating, respectively.
• To further assess the overall health of the City, additional non-financial factors such as changes in the City’s property tax base and the condition of the City’s roads should be considered.
The government-wide financial statements of the City can be divided into two categories:
• Governmental activities – Most of the City’s basic services are included here, such as the police, fire, municipal services, and parks departments, as well as, general administration. Property taxes, sales taxes, and state and federal grants finance most of these activities.
• Business-type activities – The City charges fees to customers to help it cover the costs of certain services it provides. The City’s Power and Light, Water, Sanitary Sewer, and Events Center funds are included here.
Fund Financial Statements
The fund financial statements provide more detailed information about the City’s most significant funds, not the City as a whole. Funds are accounting devices that the City uses to keep track of specific sources of funding and spending for particular purposes.
Some funds are required by the City’s Charter, State Statutes, and bond covenants.
The Council establishes other funds to control and manage money for particular purposes or to show that it is properly using certain taxes and grants.
The City has three kinds of funds:
• Governmental funds – Most of the City’s basic services are included in governmental funds, which focus on (1) how cash and other financial assets that can readily be converted to cash flow in and out and (2) the balances left at year-end that are available for spending. Consequently, the governmental fund statements provide a detailed short-term view that helps you determine whether there are more or fewer financial resources that can be spent in the near future to finance the City’s programs. Because this information does not encompass the additional long-term focus of the government-wide statements, we provide additional information at the bottom of the governmental funds statement, or on the subsequent page, that explains the relationship (or differences) between them.
CITY OF INDEPENDENCE, MISSOURI Management’s Discussion and Analysis June 30, 2021
12
CITY OF INDEPENDENCE, MISSOURI Management’s Discussion and Analysis
June 30, 2021
• Proprietary funds – Business operations for which the City charges customers a fee are generally reported in proprietary funds. Proprietary funds, like the government-wide statements, provide both long-term and short-term financial information.
o The City’s enterprise funds are the same as its business-type activities, but provide more detail and additional information, such as cash flows.
o The City uses internal service funds to report activities that provide supplies and services for the City’s other programs and activities. The City has five internal service funds. These are the selffunded Staywell Health Insurance fund, Central Garage fund, Workers’ Compensation fund, Risk Management fund, and the Enterprise Resource Planning fund.
• Fiduciary funds – Periodically, the City may be responsible for other assets that have been given to the City under the terms of a trust agreement initiated by an outside third party. Generally, these funds are limited in use for the benefit of the designated trust beneficiary. The City is responsible for ensuring that the assets reported in these funds are used for their intended purposes. Currently, the City is the trustee, or fiduciary, for the following funds: Vaile Mansion/Anderson Trust Fund, Susie Paxton Block Trust Fund, Seniors’ Travel Fund, and the Flexible Benefit Plan Fund. All of the City’s fiduciary activities are reported in a separate statement of fiduciary net position and a statement of changes in fiduciary net position. We exclude these activities from the City’s government-wide financial statements because the City cannot use these assets to finance its operations.
13
CITY OF INDEPENDENCE, MISSOURI Management’s Discussion and Analysis
June 30, 2021
FINANCIAL ANALYSIS OF THE CITY AS A WHOLE
Net Position
The following Table (MD-1) reflects the condensed Statement of Net Position:
The City’s combined net position increased $11.2 million to $378.9 million from $367.6 million.
Net position of the City’s governmental activities increased 22.1% to $75.9 million. Governmental assets increased $20.6 million and liabilities decreased $29.4 million. Long-term obligations for governmental activities decreased $38.8 million. These changes were mainly due to the actuarial determined LAGERS net pension shifting from a liability to an asset for the fiscal year. This shift was mainly due to changes in assumptions with a change in mortality tables, and also significant increases to net investment income.
Business-type activities assets decreased $24.5 million and liabilities decreased $51.1 million. Long-term obligations for business-type activities decreased $49.2 million. The business-type activities also were affected in the same way by the LAGERS net pension shifting from a liability to an asset, but assets were also affected by the electric rebate of $11.2 million that was provided to customers and Power and Light’s full redemption on the outstanding 2010 B revenue bonds in the amount of $10.6 million.
The City’s total unrestricted net position (deficit) was ($203.1) million. The governmental activities were ($258.1) million with an increase of $13.2 million from the previous year, and business-type activities were $55.0 million with a decrease of $14.1 million from the previous year. The City’s total net investment in capital assets was $532.0 million with an increase of $9.6 million from the previous year.
2021 2020 2021 2020 2021 2020 Current and other assets $ 135,977,540 114,788,776 208,760,039 226,074,689 344,737,579 340,863,465 Capital assets 311,357,999 311,923,717 532,785,540 540,004,484 844,143,539 851,928,201 Total assets 447,335,539 426,712,493 741,545,579 766,079,173 1,188,881,118 1,192,791,666 39,270,287 32,606,802 32,304,874 31,667,785 71,575,161 64,274,587 Long-term obligations 321,441,590 360,221,388 422,780,816 471,958,380 744,222,406 832,179,768 Other liabilities 22,820,173 13,417,591 16,974,309 18,919,546 39,794,482 32,337,137 Total liabilities 344,261,763 373,638,979 439,755,125 490,877,926 784,016,888 864,516,905 66,424,445 23,492,617 31,155,991 1,443,016 97,580,436 24,935,633 Net position 309,489,295 311,168,595 222,514,950 211,224,057 532,004,245 522,392,652 Restricted 24,490,689 22,279,174 25,448,806 25,084,135 49,939,495 47,363,309 Unrestricted (deficit) (258,060,366) (271,260,070) 54,975,581 69,117,824 (203,084,785) (202,142,246) Total net position $ 75,919,618 62,187,699 302,939,337 305,426,016 378,858,955 367,613,715 Total deferred outflows of resources Total deferred inflows of resources Net Position Table MD-1 CITY OF INDEPENDENCE,
Total Net investment in capital assets Governmental Activities Business-Type Activities
MISSOURI
14
CITY OF INDEPENDENCE, MISSOURI Management’s Discussion and Analysis
June 30, 2021
Change In Net Position
The following Table (MD-2) reflects the revenues and expenses from the City’s activities:
Total revenues increased 2.4% or $7.7 million, with business-type activities decreasing 2.3% or $4.8 million, and governmental revenues increasing 11.8% or $12.5 million. These changes are due primarily to the following:
• Of significance is the increase in sales and use tax revenue of 9.2% or $5.0 million. Sales tax was minimally impacted by the COVID pandemic, but continues to be impacted by on-line sales versus brick and mortar retail. During 2020, the City began collecting a use tax for on-line sales of goods delivered within the City. The 2021 fiscal year was the first full year for the use tax revenues.
• Governmental revenues increased primarily under the operating grants and contributions due to funding from the Coronavirus Aid, Relief, and Economic Security Act (CARES) along with other COVID related grants.
• Total charges for services for the City increased $83,531 or 0.04%, with the business-type activities increasing $1.2 million or 0.6% and the governmental funds decreasing by $1.1 million or 6.8%. The increase for the business-type activities is due to Sanitary Sewer’s rate increase and normal fluctuation in
2021 2020 2021 2020 2021 2020 Revenues Program revenues Charges for services $ 15,693,306 16,834,445 199,761,314 198,536,644 215,454,620 215,371,089 Operating grants & contributions 18,379,425 7,851,184 18,379,425 7,851,184 389,936 824,436 151,769 37,799 541,705 862,235 General revenues Property taxes 9,684,246 8,717,634 9,684,246 8,717,634 Sales & use taxes 51,500,218 46,752,729 8,024,737 7,783,055 59,524,955 54,535,784 Intergovernmental activity taxes 13,724,099 13,388,147 13,724,099 13,388,147 Other taxes 7,397,165 7,555,750 7,397,165 7,555,750 Investment income (loss) 572,681 2,897,668 28,950 5,526,440 601,631 8,424,108 Other 1,467,868 1,469,877 (11,126) 901,503 1,456,742 2,371,380 Total revenues 118,808,944 106,291,870 207,955,644 212,785,441 326,764,588 319,077,311 Expenses Administrative Services 8,846,826 11,465,578 8,846,826 11,465,578 Public Safety 60,111,785 68,890,126 60,111,785 68,890,126 Municipal Services 18,666,752 18,966,524 18,666,752 18,966,524 Health Services 2,052,328 691,921 2,052,328 691,921 Culture & Recreation 9,121,110 9,359,426 9,121,110 9,359,426 Community Development 6,019,417 6,729,400 6,019,417 6,729,400 Storm Water 3,764,430 3,929,055 3,764,430 3,929,055 General Government 4,349,995 838,934 4,349,995 838,934 Tax Increment Financing 10,611,180 10,786,336 10,611,180 10,786,336 Interest 778,438 96,297 778,438 96,297 Power and Light 120,251,808 122,805,250 120,251,808 122,805,250 Water 23,866,752 24,940,525 23,866,752 24,940,525 Sanitary Sewer 26,149,731 27,191,672 26,149,731 27,191,672 Events Center 9,732,396 12,178,812 9,732,396 12,178,812 Total expenses 124,322,261 131,753,597 180,000,687 187,116,259 304,322,948 318,869,856 Excess (deficiency) of revenues over expenses before transfers (5,513,317) (25,461,727) 27,954,957 25,669,182 22,441,640 207,455 Transfers - In (Out) 19,245,236 19,181,560 (19,245,236) (19,181,560) Special item - electric rebate (11,196,400) (11,196,400) 13,731,919 (6,280,167) (2,486,679) 6,487,622 11,245,240 207,455 62,187,699 68,467,866 305,426,016 298,938,394 367,613,715 367,406,260 Net position, end of year $ 75,919,618 62,187,699 302,939,337 305,426,016 378,858,955 367,613,715
Governmental Activities Business-Type Activities Net Position Net position, beginning of year as restasted (deficit) Change in net position Capital grants & contributions Total
Table MD-2 CITY OF INDEPENDENCE, MISSOURI
15
CITY OF INDEPENDENCE, MISSOURI Management’s Discussion and Analysis
June 30, 2021
weather for Power and Light and Water. The decrease for the governmental funds is due to the COVID pandemic, with many facilities and activities being shut down during the fiscal year.
• The lower total revenues for the business-type funds were due to the impact of market value changes on investment earnings compared to prior year, and lower charges for services at the Cable Dahmer Arena due to the COVID pandemic
Total expenses decreased 4.6% or $14.5 million, with a decrease to governmental expenses of 5.6% or $7.4 million and a decrease to business-type expenses of 3.8% or $7.1 million The shift in the LAGERS net pension from a liability to an asset resulted in reduction to both governmental and business-type expenses. Also, changes in the business-type expenses are attributed to normal operations; some of the changes are related to the effect of weather on Power and Light and Water sales. The transfers out of the business-type activities to the governmental activities represents the payment in-lieu of taxes that would be paid and received if they operated as private utilities
Revenues
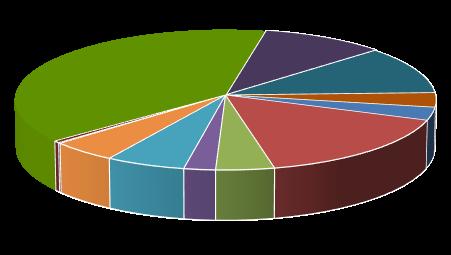
For the fiscal year ending June 30, 2021 revenues totaled $326.8 million. Of this amount charges for services (governmental and business-type) were $215.5 million or 66.0% of the total. Revenue from business-type activities represents $208.0 million or 63.6% of the total City revenues (Figure MD-3).
City of Independence Sources of Revenue for FY 2021 Figure MD -3
Revenues from governmental activities were $118.8 million. Sales and use taxes, the largest governmental category, were $51.5 million or 43.3%. All taxes represent $82.3 million or 69.3% of governmental revenue. Charges for services at $15.7 million were 13.2% of the total. Operating and capital grants were $18.8 million or 15.8% of governmental revenues.
Property Taxes 3% Sales & Use Taxes 16% Intergovernmental Actvities Taxes 4% Franchise Fees 2% Grants & Contributions 6% Charges for Services 5% Interest <1% Other 1% Power and Light 39% Water 10% Sanitary Sewer 11% Events Center 3%
16
CITY OF INDEPENDENCE, MISSOURI Management’s Discussion and Analysis
June 30, 2021
Expenses
For the fiscal year ending June 30, 2021, expenses totaled $304.3 million. Of this amount the Power and Light fund was $120.3 million or 39.5% of the total. Business-type expenses represent $180.0 million or 59.1% of the total City expenses (Figure MD-4).
City of Independence Function Expenses FY 2021
Figure MD - 4
Expenses from governmental activities were $124.3 million. Public safety expenses, the largest governmental category, were $60.1 million or 48.4% of the total. Municipal Services is the next largest category at $18.7 million, which is 15.0% of the total.
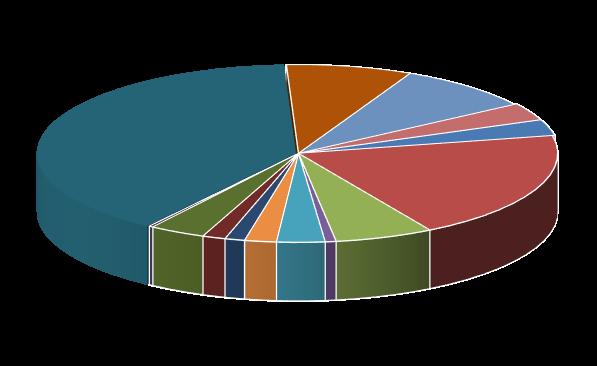
Administrative Services 3% Public Safety 20% Municipal Services 6% Animal Services 1% Culture & Recreation 3% Community Development 2% Storm Water 1% General Government 1% Tax Increment Financing 3% Interest <1% Power and Light 40% Water 8% Sanitary Sewer 9% Events Center 3%
17
CITY OF INDEPENDENCE, MISSOURI Management’s Discussion and Analysis
MD-3
CITY OF INDEPENDENCE, MISSOURI
As noted in Table MD-3 expenses from governmental activities for fiscal year 2021 were $124.3 million. However, the net cost of these services was $89.9 million. The difference represents direct revenues received from charges for services of $15.7 million, operating grants and contributions of $18.4 million, and capital grants and contributions of $389,936. Taxes and other revenues of $84.3 million were collected to cover these net costs. Of significance in the charges for services category there was $5.0 million netted to Administrative Services for interfund charges for support services, $4.4 million netted primarily to Administrative Services and Community Development for licenses and permits, and $2.0 million netted to Public Safety for fines and forfeitures.
Business-type Activities
Revenues of the City’s business-type activities decreased $4.8 million and expenses decreased $7.1 million. This change in revenues is primarily the result of the impact of market value changes on investment earnings compared to prior year, and lower charges for services at the Cable Dahmer Arena due to the COVID pandemic. The change in expenses is primarily the result of the change in the LAGERS net pension valuation that shifted from a liability to an asset for the three utilities, and also much lower expenses at the Cable Dahmer Arena due to the facility being shut down for a portion of the year due to the pandemic.
2021 2020 2021 2020 Administrative Services $ 8,846,826 11,465,578 (4,501,509) 5,024,739 Public Safety 60,111,785 68,890,126 54,469,799 63,470,175 Municipal Services 18,666,752 18,966,524 12,930,759 13,420,989 Health Services 2,052,328 691,921 1,832,330 671,507 Culture & Recreation 9,121,110 9,359,426 7,242,901 8,177,231 Community Development 6,019,417 6,729,400 (484,301) 883,231 Storm Water 3,764,430 3,929,055 3,740,858 3,645,490 General Government and Interest on Long-Term Debt 5,128,433 935,231 5,128,433 935,231 Tax Increment Financing 10,611,180 10,786,336 9,500,324 10,014,939 Total $ 124,322,261 131,753,597 89,859,594 106,243,532
June 30, 2021 Governmental Activities
Table
Total Cost of Services Net Cost of Services Net Cost of Governmental Activities
18
FINANCIAL ANALYSIS OF THE CITY’S FUNDS
As the City completed the year, its governmental funds reported a combined fund balance of $79.3 million. The fund balance of the General Fund increased $199,132, the TIF Debt Service fund decreased $199,128, and the non-major governmental funds increased $2.4 million. The increase for the non-major governmental funds was due to the addition of the Health Property Tax fund and Parks Property Tax fund, and the first full year for the Animal Services Use Tax fund and Police Use Tax fund. The unassigned portion of the General Fund’s fund balance increased $398,848 The General Fund’s fund balance was impacted by several of the financial highlights pointed out earlier, as well as the following:
• Position vacancies continued to be managed by timing when positions are filled and replacing only essential personnel.
• Sales tax revenue continued to reflect the direction of the economy and is affected by retail development in other communities within our primary trade area
• The COVID pandemic has impacted revenues for franchise fees and fines and forfeitures.
The business-type funds reported a combined net position of $308.2 million. The net position of the Power and Light fund decreased $15.8 million, the Water fund increased $6.9 million, the Sewer fund increased $6.1 million and the Events Center fund increased $1.1 million. Net position for the utilities was impacted by Power and Light’s electric rebate and full redemption payment on the 2010 B revenue bonds. The net position for all three utilities was also impacted by the LAGERS net pension change mentioned earlier. The lagging growth in sales tax revenues has impacted the Events Center Community Improvement District sales tax revenues which have been enough to cover the debt service payments, but not the depreciation and miscellaneous expenses for the Events Center fund.
General Fund Budgetary Highlights
Resources available for appropriation decreased $277,991 from the original estimate. Actual revenues and other financing sources at the end of the year were more than projected by $709,411. The largest variances were in the areas of taxes, which were $986,513 above estimated, fines and forfeitures which were $1,618,373 below estimated, other revenues which were $429,406 above estimated, payments in lieu of taxes which were $541,376 below estimated, and operating transfers in from the CARES Act funds which were $808,036 above estimated.
Over the course of the fiscal year, the Council revised the City budget several times. Appropriations were increased $210,462 in the General Fund. These budget amendments generally fall into the following categories:
• Transfer of previously approved salary and benefit appropriations to operating departments where expenditures occur when the actual distribution of the expenditure could not be anticipated at the time that the appropriation was originally approved.
• Increase or decrease appropriations for unanticipated events, including overtime costs, which may arise throughout the fiscal year.
Actual expenditures, including encumbrances, were $75,853 less than the amount appropriated
CITY OF INDEPENDENCE, MISSOURI Management’s Discussion and Analysis June 30, 2021
19
CITY OF INDEPENDENCE, MISSOURI Management’s Discussion and Analysis
June 30, 2021
CAPITAL ASSET AND DEBT ADMINISTRATION
Capital Assets
At the end of fiscal year 2021, the City had invested $844.1 million, net of depreciation, in a broad range of capital assets, including police and fire equipment, buildings, park facilities, and electric, water and sewer systems. Assets decreased $7.8 million or 0.9% during the period, due mostly to depreciation exceeding replacement
The budget for fiscal year 2022 projects the City will spend an additional $29.2 million for capital projects The largest category at $6.5 million is for projects under the Street Improvements Sales Tax Fund.
Additional information regarding capital assets can be found in the ‘Notes to Financial Statements’, Note (6), of this report.
Total Percentage Change 2021 2020 2021 2020 2021 20202020-2021 Land & land imp $ 36,699,708 37,196,347 12,131,928 12,131,928 48,831,636 49,328,275 -1.01% Buildings & Improvements 53,732,110 57,762,613 53,732,110 57,762,613 -6.98% Office furniture & equipment 13,484 19,244 13,484 19,244 -29.93% Computer equipment5,762,251 1,772,568 5,762,251 1,772,568 225.08% Mobile equipment 9,626,718 7,360,114 9,626,718 7,360,114 30.80% Other equipment 4,021,191 2,250,120 9,977,852 12,204,294 13,999,043 14,454,414 -3.15% Infrastructure 177,320,664 182,106,827 459,105,728 473,099,477 636,426,392 655,206,304 -2.87% Construction in progress 24,181,873 23,455,884 51,570,032 42,568,785 75,751,905 66,024,669 14.73% Total $ 311,357,999 311,923,717 532,785,540 540,004,484 844,143,539 851,928,201 -0.91%
Total Governmental Activities Business-Type Activities
Assets
Table MD-4 CITY OF INDEPENDENCE, MISSOURI
Capital
(net of depreciation)
20
Debt Administration
CITY OF INDEPENDENCE, MISSOURI Management’s Discussion and Analysis
June 30, 2021
Outstanding Debt
At the end of fiscal year 2021, the City had a total of $476.3 million of outstanding obligations. This was a decrease of $25.9 from the previous fiscal year. None of the debt is general obligations of the City, and is limited to either an annual appropriation or specific revenue for repayment. Of the total debt, $334.7 million or 70.3% are obligations of the business-type activities.
The City’s credit ratings from Standard & Poor’s (S&P) are A/Stable for Power and Light, AA-/Stable for Water, A+/Stable for Sewer, BBB+/Stable for the Falls at Crackerneck – Bass Pro TIF, and A-/Stable for all other economic development projects
Additional information regarding debt can be found in the ‘Notes to Financial Statements’ section, Note (7), of this report.
Economic Factors
In the last five years the City, as a community, lost 2,174 jobs, with current total employment at 54,885 jobs. Unemployment by mid-2021 was 8.0%; this is higher than Jackson County at 6.6% and higher than the State at 5.1%. Average household income for 2021 is estimated to be $61,449, compared to $77,885 for the State as a whole. Per capita income for 2021 is estimated to be $25,341, compared to $31,756 for the State as a whole.
Contacting the City’s Financial Management
This financial report is designed to provide our citizens, taxpayers, customers, investors and creditors with a general overview of the City’s finances and to demonstrate the City’s accountability for the money it receives Questions concerning this report or requests for additional information should be directed to Bryan Kidney, Director of Finance and Administration, City of Independence, P.O. Box 1019, Independence, MO 64051.
Total Percentage Change 2021 2020 2021 2020 2021 20202020-2021 Loans and bonds payable $ 17,947,500 17,955,000 334,701,955 355,501,259 352,649,455 373,456,259 -5.57% TIF loans payable 121,751,150 127,971,949 121,751,150 127,971,949 -4.86% Capital lease obligations 1,868,704 755,122 1,868,704 755,122 147.47% Neighborhood Improvemt District 26,859 33,802 26,859 33,802 -20.54% Total $ 141,594,213 146,715,873 334,701,955 355,501,259 476,296,168 502,217,132 -5.16%
Governmental Activities Business-type Activities Total
Table MD-5 CITY OF INDEPENDENCE, MISSOURI
21
Exhibit 1
Statement of Net Position June 30, 2021 Governmental Business-Type Activities Activities Total ASSETS & DEFERRED OUTFLOWS Current Assets: Pooled cash and investments $ 63,708,272 126,800,433 190,508,705 Receivables: Taxes 29,649,744 1,302,195 30,951,939 Accounts, net 235,068 16,230,084 16,465,152 Unbilled revenue 11,118,599 11,118,599 Special assessment principal 991,373 79,625 1,070,998 Accrued interest 202,745 223,656 426,401 Other 2,022,050 2,022,050 Internal balances 344,989 (344,989) Due from other governments 3,539,220 185,328 3,724,548 Inventory 196,562 6,567,956 6,764,518 Prepaid items 19,755 443,992 463,747 Restricted cash and investments 5,310,895 5,310,895 Total current assets 98,887,728 169,939,824 268,827,552 Noncurrent Assets: Capital assets: Nondepreciable 56,216,014 63,701,960 119,917,974 Depreciable, net 255,141,985 469,083,580 724,225,565 Net pension asset 11,578,964 7,625,622 19,204,586 Other assets 37,482 37,482 Restricted cash and investments 25,510,848 31,157,111 56,667,959 Total noncurrent assets 348,447,811 571,605,755 920,053,566 Total assets 447,335,539 741,545,579 1,188,881,118 Deferred Outflows of Resources: Deferred charge on refunding 7,694,802 8,102,722 15,797,524 5,465,672 159,924 5,625,596 26,109,813 13,227,900 39,337,713 Deferred environmental and regulatory amounts 9,910,793 9,910,793 Goodwill 903,535 903,535 Total deferred outflows of resources 39,270,287 32,304,874 71,575,161 $ 486,605,826 773,850,453 1,260,456,279 LIABILITIES, DEFERRED INFLOWS & NET POSITION Current Liabilities: Accounts and contracts payable $ 2,106,302 4,232,951 6,339,253 Accrued items 4,156,535 6,583,990 10,740,525 Other current liabilities 1,140,963 591,629 1,732,592 Unearned revenue 11,345,322 689,456 12,034,778 Current portion of long-term obligations 16,178,986 12,525,867 28,704,853 Self-insurance claims payable 3,868,885 3,868,885 Liabilities payable from restricted assets 202,166 4,876,283 5,078,449 Total current liabilities 38,999,159 29,500,176 68,499,335 Noncurrent Liabilities: Noncurrent portion of long-term obligations 142,669,454 329,571,486 472,240,940 Self-insurance claims payable 6,595,458 6,595,458 Total OPEB liability 155,997,692 80,335,900 236,333,592 Advances for construction 347,563 347,563 Total noncurrent liabilities 305,262,604 410,254,949 715,517,553 Total liabilities 344,261,763 439,755,125 784,016,888 Deferred Inflows of Resources: Real estate tax revenue 20,683,174 20,683,174 Pension related amounts 44,698,027 30,662,281 75,360,308 1,043,244 493,710 1,536,954 Total deferred inflows of resources 66,424,445 31,155,991 97,580,436 Net Position: Net investment in capital assets 309,489,295 222,514,950 532,004,245 Restricted for: Public Safety 7,986,233 7,986,233 Municipal Services 2,708,073 2,708,073 Culture and Recreation 2,547,954 2,547,954 Storm Water 10,680,007 10,680,007 Health Services 252,066 252,066 General Government 7,662 7,662 Debt Service 108,335 15,026,941 15,135,276 Worker's Compensation escrow 200,359 200,359 Dogwood SPP escrow 61,500 61,500 Southwest Power Pool collateral 888,363 888,363 Community Improvement District 9,472,002 9,472,002 Unrestricted (deficit) (258,060,366) 54,975,581 (203,084,785) Total net position (deficit) 75,919,618 302,939,337 378,858,955 $ 486,605,826 773,850,453 1,260,456,279 See accompanying notes to financial statements. Primary Government Total liabilities, deferred inflows of resources and net position Pension related amounts Total assets and deferred outflows of resources Other post-employment benefits Other post-employment benefits 22
CITY OF INDEPENDENCE, MISSOURI
See accompanying notes to financial statements.
CITY OF INDEPENDENCE, MISSOURI Statement of Activities
Year ended June 30, 2021
Exhibit 2
Operating Capital Charges for Grants and Grants and Net (Expense) Functions/Programs Expenses Services Contributions Contributions Revenue Primary Government: Governmental activities: Administrative Services $ 8,846,826 6,394,861 6,953,474 4,501,509 Public Safety 60,111,785 2,960,579 2,512,206 169,201 (54,469,799) Municipal Services 18,666,752 484,731 5,051,171 200,091 (12,930,759) Health Services 2,052,328 196,902 23,096 (1,832,330) Culture and Recreation 9,121,110 512,418 1,365,791 (7,242,901) Community Development 6,019,417 4,032,959 2,470,759 484,301 Storm Water 3,764,430 2,928 20,644 (3,740,858) General Government 4,349,995 (4,349,995) Tax Increment Financing 10,611,180 1,110,856 (9,500,324) Interest on long-term debt 778,438 (778,438) Total governmental activities 124,322,261 15,693,306 18,379,425 389,936 (89,859,594) Business-Type Activities: Power and Light 120,251,808 128,548,974 49,809 8,346,975 Water 23,866,752 32,648,354 101,960 8,883,562 Sewer 26,149,731 36,164,808 10,015,077 Events Center 9,732,396 2,399,178 (7,333,218) Total business-type activities 180,000,687 199,761,314 151,769 19,912,396 Total primary government $ 304,322,948 215,454,620 18,379,425 541,705 (69,947,198) Governmental Business-Type Activities Activities Total Changes in Net Position: Net (expense) revenue $ (89,859,594) 19,912,396 (69,947,198) General Revenues: Taxes Property taxes 9,684,246 9,684,246 Sales and use taxes 51,500,218 8,024,737 59,524,955 Intergovernmental activity taxes 13,724,099 13,724,099 Franchise taxes 7,376,564 7,376,564 Financial institutions tax 20,601 20,601 Investment income 572,681 28,950 601,631 Special item - electric rebate (11,196,400) (11,196,400) Miscellaneous 1,467,868 (11,126) 1,456,742 Transfers in (out) 19,245,236 (19,245,236) Total general revenues and transfers 103,591,513 (22,399,075) 81,192,438 Change in net position 13,731,919 (2,486,679) 11,245,240 Net position - beginning 62,187,699 305,426,016 367,613,715 Net position - ending $ 75,919,618 302,939,337 378,858,955
23
CITY OF INDEPENDENCE, MISSOURI
Liabilities, Deferred Inflows of Resources and Fund Balances
deferred inflows
See accompanying notes to financial statements.
Exhibit 3
Governmental Funds June 30, 2021 Nonmajor Total TIF Governmental Governmental Assets General Debt Service Funds Funds Pooled cash and investments $ 2,813,040 18,217,800 38,723,216 59,754,056 Receivables: Taxes 10,099,945 12,456,226 7,093,573 29,649,744 Accounts, net 106,489 68,068 48,640 223,197 Special assessment principal 580,435 410,938 991,373 Accrued interest 17,129 79,755 98,802 195,686 Due from other funds 2,054,491 16,155 2,070,646 Due from other governments 968,651 815,196 1,755,373 3,539,220 Prepaid items 19,755 19,755 Restricted cash and investments 202,166 11,174,732 13,933,591 25,310,489 Total assets $ 16,862,101 42,811,777 62,080,288 121,754,166 Liabilities: Accounts and contracts payable $ 266,024 12,965 1,702,953 1,981,942 Due to other funds 1,919 3,216,461 3,218,380 Accrued items 2,332,060 561,194 2,893,254 Other current liabilities 1,018,650 122,313 1,140,963 Unearned revenue 11,345,322 11,345,322 Liabilities payable from restricted assets: Deposits and court bonds 202,166 202,166 Total liabilities 3,818,900 14,884 16,948,243 20,782,027 Deferred Inflows of Resources: Unavailable revenue - special assessments 580,435 410,938 991,373 Unavailable revenue - real estate taxes 6,142,071 11,794,496 2,746,607 20,683,174 Total deferred inflows of resources 6,722,506 11,794,496 3,157,545 21,674,547 Fund Balances: Nonspendable 19,755 19,755 Restricted 118,750 34,559,641 41,898,946 76,577,337 Committed 16,373 92,421 108,794 Assigned 465,453 465,453 Unassigned (deficit) 5,700,364 (3,557,244) (16,867) 2,126,253 Total fund balance 6,320,695 31,002,397 41,974,500 79,297,592 $ 16,862,101 42,811,777 62,080,288 121,754,166
Balance Sheet
Total
liabilities,
of resources and fund balance
24
June 30, 2021
assets used in governmental activities are not financial resources and therefore are not reported in the funds:
Interest on long-term debt is not accrued in governmental funds but, rather, is recognized as expenditure when due and payable
Receivables not collected within 60 days of year-end are not available soon enough to pay for the current period's expenditures and, therefore, are deferred inflows of resources in the funds
Internal Service Funds are used by management to charge the costs of certain activities to individual funds. The assets and liabilities of the Internal Service Funds are included in the governmental activities in the statement of net position, net of the amount allocated to business-type activities
Long-term liabilities, including bonds payable are not due and payable in the current period and therefore are not reported in the funds
Net pension assets in governmental activities are not financial resources and therefore are not reported in the
Pension related deferred outflows and inflows of resources are not due and payable in the current year and, therefore, are not reported in the governmental funds, as follows:
Exhibit 3.1
CITY OF INDEPENDENCE, MISSOURI Reconciliation of the Governmental Funds Balance Sheet to the Statement of Net Position
Fund balances – total governmental funds $ 79,297,592
Governmental capital assets 661,128,495 Less accumulated depreciation (355,184,349) 305,944,146
Capital
(1,219,200)
991,373
(1,151,087)
Loans payable/NID payable (134,349,500) Capital lease obligations (1,868,704) Compensated absences (17,169,399) Discounts (premiums) (5,376,009) Deferred charge on refunding 7,694,802 Other post-employment benefits (154,032,728) (305,101,538)
funds 10,816,886
Deferred inflows of resources - pension related amounts (43,783,947) Deferred outflows of resources - pension related amounts 5,460,905 Deferred outflows of resources - other post-employment benefits 25,697,411 Deferred inflows of resources - other post-employment benefits (1,032,923) (13,658,554) Net position of governmental activities (Exhibit 1) $ 75,919,618
to financial
25
See accompanying notes
statements.
CITY OF INDEPENDENCE, MISSOURI
Year ended June 30, 2021
See accompanying notes to financial statements.
Exhibit 4
Statement of Revenues, Expenditures, and Changes in Fund Balances Governmental Funds
TIF Nonmajor Total General Debt Service Funds Funds Revenues: Taxes $ 32,439,613 19,298,624 30,445,175 82,183,412 Licenses and permits 4,772,400 4,772,400 Intergovernmental 5,655,410 12,997,600 18,653,010 Charges for services 2,013,571 894,781 2,908,352 Interfund charges for support services 5,035,500 5,035,500 Fines, forfeitures, and court costs 2,152,627 2,152,627 Investment income 86,640 305,985 159,520 552,145 Other 1,319,968 1,212,571 312,011 2,844,550 Total revenues 53,475,729 20,817,180 44,809,087 119,101,996 Expenditures: Current: Administrative Services 8,598,724 23,815 8,622,539 Public Safety 55,311,652 6,911,548 62,223,200 Municipal Services 5,256,263 1,247,519 6,503,782 Health Services 69,009 1,949,663 2,018,672 Culture and Recreation 7,526,753 7,526,753 Community Development 3,902,963 2,040,439 5,943,402 Storm Water 2,174,015 2,174,015 General Government 79 3,386,787 3,386,866 Tax Increment Financing 3,973,105 3,973,105 Capital outlay 1,192,500 12,613,976 13,806,476 Debt service: Principal 150,491 7,922,287 127,937 8,200,715 Interest and fiscal agent fees 15,388 5,458,278 628,979 6,102,645 Debt issuance costs 1,216,641 1,216,641 Total expenditures 74,497,069 18,570,311 38,631,431 131,698,811 Excess (deficiency) of revenues over expenditures (21,021,340) 2,246,869 6,177,656 (12,596,815) Other Financing Sources (Uses): Debt issuance 35,920,000 35,920,000 Capital lease proceeds 1,192,500 185,011 1,377,511 Reoffering premium/original issue discount 4,689,862 4,689,862 Payment to refunded loans escrow agent (43,475,884) (43,475,884) Transfers in – utility payments in lieu of taxes 19,255,236 19,255,236 Transfers in 808,036 4,164,156 1,225,965 6,198,157 Transfers out (35,300) (3,744,131) (5,204,339) (8,983,770) Total other financing sources (uses) 21,220,472 (2,445,997) (3,793,363) 14,981,112 Net change in fund balances 199,132 (199,128) 2,384,293 2,384,297 Fund balances, beginning 6,121,563 31,201,525 39,590,207 76,913,295 Fund balances, ending $ 6,320,695 31,002,397 41,974,500 79,297,592
26
CITY OF INDEPENDENCE, MISSOURI
Reconciliation of the Governmental Funds Statement of Revenues, Expenditures, and Changes in Fund Balances to the Statement of Activities
Year ended June 30, 2021
Amounts reported for governmental activities in the statement of activities are different because:
Governmental funds report capital outlays as expenditures. However, in the statement of activities, the cost of those assets is allocated over their estimated useful lives as depreciation expense. This is the amount by which depreciation exceeded capital outlays in the current period:
The proceeds from the sale of capital assets are reported as other financing sources in the governmental funds. However, the cost of the assets and depreciation is removed from the statement of net position and offset against the proceeds, if any, resulting in a gain (loss) on the sale of capital assets in the statement of activities.
Revenues in the statement of activities that do not provide current financial resources
Bond proceeds provide current financial resources to governmental funds, but issuing debt increases long-term liabilities in the statement of net position. Repayment of bond principal is an expenditure in the governmental funds, but the repayment reduces long-term liabilities in the statement of net position. This is the amount by which proceeds exceeded repayments. Also, governmental funds report the effect of premiums, discounts, and similar items when debt is first issued, whereas these amounts are deferred and amortized in the statement of activities. This amount is the net effect of these differences in the treatment of long-term debt and related items:
Some expenses reported in the statement of activities do not require the use of current financial resources and therefore are not reported as expenditures in the governmental funds:
Internal Service Funds are used by management to charge the costs of certain activities, such as insurance and garage charges, to individual funds. The net expense of the internal service funds is reported with the
Exhibit 4.1
Net change in fund balances – total governmental funds $ 2,384,297
Capital outlay 16,648,912 Depreciation expense (21,222,503) (4,573,591)
Book value of assets disposed (133,699)
are not
funds (119,317)
reported as revenues in the
Proceeds from debt issuance (35,920,000) Reoffering premium/original issue discount (4,689,862) Payment to refunded loans escrow agent 43,475,884 Principal payments 8,200,715 Debt premiums, discounts & deferred refunding amortizations (563,845) Issuance of capital leases (1,377,511) 9,125,381
Compensated absences (280,657) Accrued interest 471,564 Other post-employment benefits (9,066,393) Pension related amount - LAGERS pension expense 14,975,398 6,099,912
948,936 Change in net position of governmental activities (Exhibit 2) $ 13,731,919
financial
27
governmental activities:
See accompanying notes to
statements.
Exhibit 5
Net Position Proprietary Funds June 30, 2021 Enterprise funds Governmental Activities Power and Sanitary Events Internal Service Assets and Deferred Outflows of Resources Light Water Sewer Center Total Funds Current Assets: Pooled cash and investments $ 49,849,263 42,313,512 26,265,638 8,372,020 126,800,433 3,954,216 Receivables: Taxes 1,302,195 1,302,195 Accounts (net of allowance of $1,518,485) 9,382,433 2,934,841 3,323,801 589,009 16,230,084 11,871 Unbilled revenue 7,677,535 1,469,040 1,972,024 11,118,599 Special assessment principal 79,625 79,625 Accrued interest 22,617 130,200 70,839 223,656 7,059 Other 1,760,571 6,200 245,799 9,480 2,022,050 Due from other funds 951,774 3,077,326 951,774 4,980,874 Due from other governments 185,328 185,328 Inventory 5,090,940 1,370,751 104,229 2,036 6,567,956 196,562 Prepaid items 363,122 80,870 443,992 Restricted cash and investments 3,891,999 807,139 611,757 5,310,895 Total current assets 79,255,207 52,109,009 33,545,861 10,355,610 175,265,687 4,169,708 Noncurrent Assets: Capital assets: Nondepreciable 40,369,888 6,887,931 10,647,826 5,796,315 63,701,960 93,979 Depreciable, net 180,883,434 105,032,484 133,220,083 49,947,579 469,083,580 5,319,874 Net pension asset 3,986,842 2,588,324 1,050,456 7,625,622 762,078 Other assets 37,482 37,482 Restricted cash and investments 14,328,468 3,084,314 6,897,363 6,846,966 31,157,111 200,359 Total noncurrent assets 239,568,632 117,630,535 151,815,728 62,590,860 571,605,755 6,376,290 Total assets 318,823,839 169,739,544 185,361,589 72,946,470 746,871,442 10,545,998 Deferred Outflows of Resources: Deferred charge on refunding 1,512,500 752,029 5,838,193 8,102,722 109,817 30,484 19,623 159,924 4,767 8,046,609 2,247,552 2,933,739 13,227,900 412,402 Deferred environmental and regulatory amounts 9,910,793 9,910,793 Goodwill 903,535 903,535 Total deferred outflows of resources 19,579,719 3,030,065 2,953,362 6,741,728 32,304,874 417,169 Total assets & deferred outflows of resources $ 338,403,558 172,769,609 188,314,951 79,688,198 779,176,316 10,963,167 Liabilities, Deferred Inflows of Resources and Net Position Current Liabilities: Accounts and contracts payable $ 2,867,345 404,747 402,087 558,772 4,232,951 124,360 Due to other funds 26,043 26,043 3,807,097 Accrued items 1,139,852 3,471,215 842,231 1,130,692 6,583,990 44,081 Other current liabilities 13,757 538,489 39,383 591,629 Unearned revenue 689,456 689,456 Current portion of long-term obligations 5,997,618 2,232,805 2,645,444 1,650,000 12,525,867 45,550 Self-insurance claims payable 3,868,885 Liabilities payable from restricted assets 3,491,053 773,473 611,757 4,876,283 Total current liabilities 13,495,868 6,895,997 5,040,008 4,094,346 29,526,219 7,889,973 Noncurrent Liabilities: Revenue bonds payable 135,921,183 19,005,030 86,789,604 83,151,138 324,866,955 Compensated absences – long-term 3,185,755 981,461 537,315 4,704,531 39,278 Total OPEB liability 52,415,964 15,417,765 12,502,171 80,335,900 1,964,964 Self-insurance claims payable 6,595,458 Advances for construction 179,765 167,798 347,563 Total noncurrent liabilities 191,702,667 35,572,054 99,829,090 83,151,138 410,254,949 8,599,700 Total liabilities 205,198,535 42,468,051 104,869,098 87,245,484 439,781,168 16,489,673 Deferred Inflows of Resources: Pension related amounts 21,055,334 5,844,654 3,762,293 30,662,281 914,080 318,372 104,708 70,630 493,710 10,321 Total deferred inflows of resources 21,373,706 5,949,362 3,832,923 31,155,991 924,401 Net Position: Net investment in capital assets 82,634,639 94,556,728 61,695,668 (16,372,085) 222,514,950 5,413,853 Restricted for: Debt service/capital outlay 14,328,468 500,000 198,473 15,026,941 Workers compensation escrow 200,359 Dogwood SPP escrow 61,500 61,500 Southwest Power Pool collateral 888,363 888,363 Community Improvement District 9,472,002 9,472,002 Unrestricted 13,918,347 29,295,468 17,917,262 (855,676) 60,275,401 (12,065,119) Total net position (deficit) 111,831,317 124,352,196 79,612,930 (7,557,286) 308,239,157 (6,450,907) $ 338,403,558 172,769,609 188,314,951 79,688,198 10,963,167 Adjustment to reflect the consolidation of internal service fund activities related to enterprise funds (5,299,820) Net position of business-type activities $ 302,939,337 Total liabilities, deferred inflows of resources and net position Pension related amounts Other post-employment benefits Other post-employment benefits 28
CITY OF INDEPENDENCE, MISSOURI Statement of
Exhibit 6
Statement of Revenues, Expenses, and Changes in Fund Net Position Proprietary Funds Year ended June 30, 2021 Enterprise funds Governmental Activities Power and Sanitary Events Internal Service Light Water Sewer Center Total Funds Operating Revenues: Charges for services $ 122,649,509 32,407,039 36,038,239 2,399,178 193,493,965 27,138,046 Miscellaneous 5,899,465 241,315 126,569 6,267,349 317,876 Total operating revenues 128,548,974 32,648,354 36,164,808 2,399,178 199,761,314 27,455,922 Operating Expenses: Personnel services 12,252,265 6,350,078 5,077,998 23,680,341 1,237,410 Other services 21,472,524 7,441,619 12,272,703 543,012 41,729,858 29,156,411 Supplies, materials, and power 58,436,008 1,883,246 898,108 1,234 61,218,596 720,399 Other expenses 7,629,838 5,505,818 3,266 2,999,515 16,138,437 Depreciation and amortization 10,705,174 3,172,568 4,395,223 2,123,277 20,396,242 421,928 Loss on capital asset impairment disposal 5,533,686 5,533,686 Total operating expenses 116,029,495 24,353,329 22,647,298 5,667,038 168,697,160 31,536,148 Operating income (loss) 12,519,479 8,295,025 13,517,510 (3,267,860) 31,064,154 (4,080,226) Nonoperating Revenues (Expenses): Investment income (loss) (363,706) 239,302 68,681 84,673 28,950 20,537 Miscellaneous revenue 1,470,273 2,299,310 68,971 351,691 4,190,245 1,455,025 Interest and amortization expense (5,706,237) (921,521) (4,033,795) (4,065,358) (14,726,911) Sales tax 8,024,737 8,024,737 Total nonoperating revenue (expenses) (4,599,670) 1,617,091 (3,896,143) 4,395,743 (2,482,979) 1,475,562 7,919,809 9,912,116 9,621,367 1,127,883 28,581,175 (2,604,664) Capital contributions 49,809 101,960 151,769 Transfers out – utility payments in lieu of taxes (12,602,965) (3,119,912) (3,532,359) (19,255,236) Transfers in 10,000 10,000 2,775,613 Special item - electric rebate (11,196,400) (11,196,400) Change in net position (15,829,747) 6,894,164 6,099,008 1,127,883 (1,708,692) 170,949 Total net position (deficit): Beginning of the year 127,661,064 117,458,032 73,513,922 (8,685,169) (6,621,856) End of the year $ 111,831,317 124,352,196 79,612,930 (7,557,286) (6,450,907) Adjustment to reflect the consolidation of internal service fund activities related to enterprise funds (777,987) Change in net position of business-type activities $ (2,486,679) See accompanying notes to financial statements. Income (loss) before contributions, transfers, and special item 29
CITY OF INDEPENDENCE, MISSOURI
See accompanying notes to financial statements.
CITY
Exhibit 7
Funds
ended June 30, 2021 Enterprise funds Governmental Activities Power and Sanitary Events Internal Service Light Water Sewer Center Total Funds Cash Flows from Operations: Receipts from customers and others $ 132,478,237 34,526,274 35,417,267 2,670,578 205,092,356 28,908,048 Payments to suppliers (90,073,201) (13,659,566) (12,845,414) (3,355,702) (119,933,883) (29,379,866) Payments to employees (19,394,257) (7,763,619) (5,502,040) (32,659,916) (1,599,444) Payments to other funds (1,050,299) (1,050,299) Net cash provided (used) by operating activities 23,010,779 13,103,089 17,069,813 (1,735,423) 51,448,258 (2,071,262) Cash Flows from Noncapital Financing Activities: Transfers in 10,000 10,000 3,962,790 Transfers out – payments in lieu of taxes (12,602,965) (3,119,912) (3,532,359) (19,255,236) Special item - electric rebate (11,196,400) (11,196,400) Sales tax 8,024,737 8,024,737 Advances (to) from other funds (786,024) (801,457) (951,774) (2,539,255) Net cash provided by (used in) noncapital financing activities (24,585,389) (3,921,369) (4,474,133) 8,024,737 (24,956,154) 3,962,790 Cash Flows from Capital and Related Financing Activities: Acquisition and construction of capital assets (12,112,843) (2,968,038) (3,362,885) (115,449) (18,559,215) (4,563,499) Interest paid on revenue bonds and equipment contracts (6,274,500) (943,645) (4,048,942) (3,676,169) (14,943,256) Proceeds from bond issue 3,812 3,812 Redemption of revenue bonds (14,660,000) (1,630,000) (2,205,000) (1,485,000) (19,980,000) (33,047,343) (5,541,683) (9,616,827) (5,272,806) (53,478,659) (4,563,499) Cash Flows from Investing Activities: Interest on investments (255,256) 219,961 53,368 84,673 102,746 18,027 Net cash provided by investing activities (255,256) 219,961 53,368 84,673 102,746 18,027 Net increase (decrease) in cash and cash equivalents (34,877,209) 3,859,998 3,032,221 1,101,181 (26,883,809) (2,653,944) Cash and cash equivalents at beginning of year 102,946,939 42,344,967 30,742,537 14,117,805 190,152,248 6,808,519 Cash and cash equivalents at end of year $ 68,069,730 46,204,965 33,774,758 15,218,986 163,268,439 4,154,575 Noncash capital and related financing activities: Contributed capital $ 49,809 101,960 151,769 Components of cash and short-term investments at end of fiscal year: Unrestricted assets $ 49,849,263 42,313,512 26,265,638 8,372,020 126,800,433 3,954,216 Restricted assets 18,220,467 3,891,453 7,509,120 6,846,966 36,468,006 200,359 Total pooled cash and investments $ 68,069,730 46,204,965 33,774,758 15,218,986 163,268,439 4,154,575 Reconciliation of operating income (loss) to net cash provided by operating activities: Operating income (loss) $ 12,519,479 8,295,025 13,517,510 (3,267,860) 31,064,154 (4,080,226) Depreciation and amortization 10,705,174 3,172,568 4,395,223 2,123,277 20,396,242 421,928 Loss on capital asset impairment disposal 5,533,686 5,533,686 Miscellaneous revenue 1,470,273 2,299,310 68,971 351,691 4,190,245 1,455,025 Change in assets and liabilities: Accounts receivable 1,798,333 (74,210) (313,276) 22,805 1,433,652 (2,899) Inventory 105,731 (591,647) (24,513) 489 (509,940) (22,279) Prepaid items and other assets (101,352) 133,018 5,570 37,236 Unbilled revenue 1,508,485 (356,006) (517,837) 634,642 Due from other governments (123,114) 22,740 (100,374) Special assessments receivable 15,755 15,755 Net pension asset (3,986,842) (2,588,324) (1,050,456) (7,625,622) (762,078) Other deferred charges 4,583 206,551 (1,228,661) (1,017,527) (143,206) Other receivable (740,467) 14,601 (725,866) Accounts and contracts payable (2,452,263) (259,693) 271,637 292,569 (2,147,750) (39,097) Internal balances (1,050,299) (1,050,299) Accrued and other liabilities (1,685,637) 1,785,281 81,539 (110,569) 70,614 (395,735) Other post-employment benefits & net pension liability (21,837,114) (4,645,563) (1,799,910) (28,282,587) (322,340) Self-insurance claims payable 973,583 Deferred charges 20,411,373 5,674,063 3,627,539 29,712,975 888,036 Unearned revenue (103,096) (103,096) Compensated absences (135,304) 29,976 27,446 (77,882) (41,974) Total adjustments 10,491,300 4,808,064 3,552,303 1,532,437 20,384,104 2,008,964 Net cash provided by (used in) operating activities $ 23,010,779 13,103,089 17,069,813 (1,735,423) 51,448,258 (2,071,262)
OF INDEPENDENCE, MISSOURI Statement of Cash Flows Proprietary
Year
Adjustments to reconcile operating income (loss) to net cash provided (used) by operating activities: Net cash provided by (used in) capital and related financing activities 30
CITY OF INDEPENDENCE, MISSOURI Statement of Fiduciary Net Position
See accompanying notes to financial statements.
Exhibit 8
Fiduciary Funds June 30, 2021 PrivatePurpose Custodial Trust Funds Funds Assets: Pooled cash and investments $ 4,637 230,554 Accrued interest receivable 17 617 Total assets 4,654 231,171 Liabilities: Funds held in escrow 3,750 Total liabilities 3,750 Net Position: Restricted for: Individuals and organizations 904 231,171 Total net position $ 904 231,171
31
CITY OF INDEPENDENCE, MISSOURI
See accompanying notes to financial statements.
Exhibit 9 PrivatePurpose Custodial Trust Funds Funds Additions: Contributions $ 405,575 Interest & gain (loss) on investments (119) 1,798 Total additions (119) 407,373 Deductions: Preservation and maintenance expense 8,472 Benefits paid to participants 434,100 Award distribution 1,000 Total deductions 8,472 435,100 Change in net position (8,591) (27,727) Net position, beginning 9,495 258,898 Net position, ending $ 904 231,171
Statement of Changes in Fiduciary Net Position Fiduciary Funds Year ended June 30, 2021 32
MISSOURI Index to Notes to Financial Statements June 30, 2021 33 (1) Summary of Significant Accounting Policies 35 (a) The Financial Reporting Entity 35 (b) Basis of Presentation ...............................................................................................................................36 (c) Basis of Accounting 37 (d) Accounts Receivable ...............................................................................................................................38 (e) Investments 38 (f) Inventory .................................................................................................................................................38 (g) Prepaid Items 38 (h) Interfund Activity ....................................................................................................................................39 (i) Capital Assets 39 (j) Bond Premiums/Discounts, and Issuance Costs......................................................................................41 (k) Deferred Inflows/Outflows .....................................................................................................................41 (l) Compensated Absences 42 (m) Pensions...................................................................................................................................................42 (n) Fund Balances 42 (o) Net Position .............................................................................................................................................43 (p) Statement of Cash Flows 44 (q) Use of Estimates ......................................................................................................................................44 (r) Implementation of GASB Statement No. 84 44 (s) New Accounting Pronouncements ..........................................................................................................44 (2) Deposits and Investments 46 (3) Tax Revenue 50 (a) Tax Abatements ......................................................................................................................................50 (4) Intergovernmental Revenue and Receivables 53 (5) Interfund Activity ........................................................................................................................................55 (a) Interfund Balances 55 (b) Interfund Charges for Support Services ..................................................................................................55 (c) Payments in Lieu of Taxes 56 (d) Interfund Transfers ..................................................................................................................................56 (6) Capital Assets 57 (7) Long-Term Obligations ...............................................................................................................................63 (a) Governmental Activities 66
CITY OF INDEPENDENCE,
Index to Notes to Financial Statements June 30, 2021 34 (1) Loans Payable 66 (2) Neighborhood Improvement District 66 (3) Capital Lease Obligations ......................................................................................................................67 (4) Blended Component Unit 68 (a) Tax Increment Financing Loans and Developer Obligations ............................................................68 (1) Tax Increment Financing Refunding and Advance Refunding 71 (2) Tax Increment Financing Defeasance of Debt ............................................................................71 (3) Tax Increment Financing Prior Year Defeasance of Debt 71 (b) Bass Pro Lease...................................................................................................................................71 (b) Business-type Activities ..........................................................................................................................73 (1) Revenue Bonds 73 (a) Defeasance of Debt ...........................................................................................................................74 (b) Pledged Revenues 75 (2) Letter of Credit .....................................................................................................................................75 (3) Events Center Bonds 75 (8) Advances for Construction ............................................................................................................................76 (9) Employee Retirement System 76 (10) Post-Employment Health Benefits ..............................................................................................................80 (11) Risk Management........................................................................................................................................84 (12) Commitments and Contingencies 85 (13) Deficits 88 (14) Subsequent Events 88 (15) Fund Balance ...............................................................................................................................................89
CITY OF INDEPENDENCE, MISSOURI
CITY OF INDEPENDENCE, MISSOURI
Notes to Financial Statements
June 30, 2021
(1) Summary of Significant Accounting Policies
The City of Independence, Missouri (the City) was incorporated in 1849 and covers an area of approximately 79 square miles in Jackson County, Missouri. The City is a charter city and operates under the City Council/City Manager form of government. The City Manager is the chief administrative officer of the City. The City provides services to residents in many areas, including law enforcement, fire protection, electrical, water and sewer services, community enrichment and development, recreation and various social services. Elementary, secondary and junior college education services are provided by various school districts, all of which are separate governmental entities.
The accounting and reporting policies of the City conform to accounting principles generally accepted in the United States of America (GAAP) applicable to local governments. The following is a summary of the more significant accounting and reporting policies and practices of the City.
(a) The Financial Reporting Entity
In evaluating how to define the government for financial reporting purposes, management has considered all potential component units. Component units are separate legal entities which are included in the primary government’s financial report. The decision to include a potential component unit in the reporting entity was made by applying the criteria set forth in GAAP. The basic, but not only, criterion for including a potential component unit within the reporting entity is the City’s financial accountability for the potential component unit. An entity is considered a component unit if City officials appoint a voting majority of the component unit’s governing body and the City is able to impose its will upon the component unit. Additionally, if the entity provides specific financial benefits to or imposes specific financial burdens on the City, it may be considered a component unit.
This report includes the financial statements of the City (the primary government) which includes the Independence Events Center Management Corporation (Corporation) and the Cable Dahmer Arena, formerly known as the Independence Events Center managed by Global Spectrum, L.P (Global) as blended component units The Corporation is governed by a 5-member board, of which all are City employees and appointed by the City The Corporation performs management functions for the facility Global manages the daily operations of the Arena on behalf of the City. These component units are reflected in the City’s Events Center fund, a proprietary fund. No separate financial statements are issued by the Corporation. Separate financial statements are issued for the Cable Dahmer Arena
The Events Center Community Improvement District (CID) and Crackerneck Creek Transportation Development District (TDD) are included in the financial statements of the City as blended component units. The TDD and CID account for the taxes that are collected within these districts, and they provide services exclusively for the City as the taxes collected by these districts are utilized to repay outstanding debt The TDD is governed by a 5-member board, appointed by property owners within the district. The City as a property owner appoints three members which are City employees. The CID is governed by a 5member board, of which three are City employees appointed by the City Council. The CID is reported as a blended component unit in the Events Center fund and the TDD is reported as a blended component unit in the TIF Debt Service fund. Financial statements for the TDD and CID may be obtained by writing to the City Clerk, City of Independence, P.O. Box 1019, Independence, MO 64051.
The Tax Increment Financing (TIF) Commission of the City of Independence, Missouri (the Commission) is a blended component unit under the Debt Service Fund category of the City because the outstanding
35
CITY OF INDEPENDENCE, MISSOURI
Notes to Financial Statements
June 30, 2021
debt of the TIF commission is expected to be repaid from payments in lieu of taxes and economic activity taxes collected by the City The Commission is governed by an 11-member board, of which six members are appointed by the City Council. The remaining five members (two from the county, two from the local school district and one from other taxing jurisdictions) are appointed by the respective taxing districts’ boards. Financial transactions of the Commission are processed by the Finance Department of the City on the Commission’s behalf. No separate financial statements are issued by the Commission.
(b) Basis of Presentation
Government-wide Statements. The statement of net position and the statement of activities display information about the City. These statements include the financial activities of the overall government, except for fiduciary activities. Eliminations of internal charges and interfund balances have been made to minimize the double-counting of internal activities. However, interfund activity between governmental and business-type activities has not been eliminated. These statements distinguish between the governmental and business-type activities of the City. Governmental activities generally are financed through taxes, intergovernmental revenues, and other non-exchange transactions. Business-type activities are financed, in whole or in part, by fees charged to external parties.
The statement of activities presents a comparison between direct expenses and program revenues for the different business-type activities of the City and for each function of the City’s governmental activities. Direct expenses are those that are specifically associated with a program or function and, therefore, are clearly identifiable to a particular function. Indirect expense allocations that have been made in the funds have been reversed for the statement of activities. Program revenues include (a) fees, fines, and charges paid by the recipients of goods or services offered by the programs, and (b) grants and contributions that are restricted to meeting the operational or capital requirements of a particular program. Revenues that are not classified as program revenues, including all taxes, are presented as general revenues.
Fund Financial Statements. The fund financial statements provide information about the City’s funds, including its fiduciary funds. Separate statements for each fund category – governmental, proprietary, and fiduciary – are presented. The emphasis of fund financial statements is on major governmental and enterprise funds, each displayed in a separate column. All remaining governmental and enterprise funds are aggregated and reported as non-major funds.
Proprietary fund operating revenues, such as charges for services, result from exchange transactions associated with the principal activity of the fund. Exchange transactions are those in which each party receives and gives up essentially equal values. Non-operating revenues, such as subsidies and investment earnings, result from non-exchange transactions or ancillary activities.
The City reports the following major governmental funds:
General Fund – This is the City’s primary operating fund. It accounts for all financial resources of the general government, except those required to be accounted for in another fund.
Tax Increment Financing Debt Service Fund – This fund is used to account for the financing of redevelopment project expenses through payments in lieu of taxes and economic activity taxes.
36
CITY OF INDEPENDENCE, MISSOURI
Notes to Financial Statements
June 30, 2021
The City reports the following major enterprise funds:
Power and Light Fund – This fund accounts for the acquisition, operation, and maintenance of the City’s power and light utility facilities and services.
Water Fund – This fund accounts for the acquisition, operation, and maintenance of the City’s water utility facilities and services.
Sanitary Sewer Fund – This fund accounts for the acquisition, operation, and maintenance of the City’s sanitary sewer utility facilities and services.
Events Center Fund – This fund accounts for the acquisition and maintenance of the Cable Dahmer Arena, formerly known as the Independence Events Center. This fund also includes the operational activities which are managed by the Corporation, operational activities of Global, and the activity of the Events Center CID.
The City reports the following fund types of non-major funds:
Special Revenue Funds – These funds account for specific revenue sources (other than major capital projects) that are legally restricted or committed to expenditures for specified purposes.
Capital Projects Funds – These funds account for the expenditures and related financing sources of major City projects.
Debt Service Funds – These funds account for the resources accumulated and payments made for principal and interest on long-term general obligation debt of governmental funds.
Internal Service Funds – These funds account for the costs of fleet maintenance, the Staywell Healthcare program, Workers’ Compensation, Risk Management, Enterprise Resource Planning, and other benefits provided to other departments on a cost-reimbursement basis.
Trust Funds – These funds account for monies held in trust by the City for preservation and maintenance of the Vaile Mansion.
Custodial Funds – These funds account for monies held on behalf of the Flexible Benefits Plan for contributions made by employees to the City’s cafeteria plan, monies held for the Susie Paxton Block Distinguished Public Service Award, and monies held for the Seniors Travel Program.
(c) Basis of Accounting
Government-wide, Proprietary, and Private-Purpose Trust Fund Financial Statements. The government-wide, proprietary and private-purpose trust fund financial statements are reported using the economic resources measurement focus and the accrual basis of accounting. Revenues related to exchange transactions are recorded when earned, and expenses are recorded at the time liabilities are incurred, regardless of when the related cash flows take place. Non-exchange transactions, in which the City gives (or receives) value without directly receiving (or giving) equal value in exchange, include property taxes, grants, entitlements and donations. On an accrual basis, revenue from property taxes is recognized in the fiscal year for which the taxes are levied. Revenue from grants, entitlements, and donations is recognized in the fiscal year in which all eligibility requirements have been satisfied.
37
CITY OF INDEPENDENCE, MISSOURI
Notes to Financial Statements
June 30, 2021
Proprietary funds distinguish operating revenues and expenses from non-operating items. Operating revenues and expenses generally result from providing services and producing and delivering goods in connection with a proprietary fund’s principal ongoing operations. Cost reimbursement grants are recorded as unearned revenue when proceeds are received in advance.
Governmental Fund Financial Statements. Governmental funds are reported using the current financial resources measurement focus and the modified accrual basis of accounting. Under this method, revenues are recognized when both measurable and available. The City considers all revenues reported in the governmental funds to be available if the revenues are collected within 60 days after year-end. Property taxes, sales taxes, franchise taxes, licenses and interest are considered to be susceptible to accrual under this definition. Revenue from grants, entitlements, and donations is recognized in the fiscal year in which all eligibility requirements have been satisfied, and is not susceptible to reporting under this definition. Expenditures are recorded when the related fund liability is incurred, except for principal and interest on general long-term debt, claims and judgments and compensated absences, which are recognized as expenditures to the extent they have matured. General capital asset acquisitions are reported as expenditures in governmental funds. Proceeds of general long-term debt and acquisitions under capital lease are reported as other financing sources.
Fiduciary Funds. The accrual basis of accounting is used to present data in the fiduciary fund financial statements.
(d) Accounts Receivable
Accounts receivable result primarily from sales of electricity, water and sewer services accounted for in the Power and Light, Water, and Sanitary Sewer (Enterprise) Funds, respectively. An estimated amount has been recorded for services rendered, but not yet billed, as of the close of the fiscal year. Accounts receivable are expressed net of allowances for doubtful accounts. Allowances for doubtful accounts are based on historical collection trends for the related receivables.
(e) Investments
Investments, other than the external investment pool, are recorded at fair value. The City’s investment in the external investment pool (MOSIP) is not SEC registered and is regulated by the State of Missouri. This external investment pool is reported at amortized cost pursuant to the criteria set forth in GASB Statement No. 79, for the liquid series investments within the pool. The City’s position in the pool is the same as the value of the pool shares.
(f) Inventory
Inventory of the enterprise funds consists of the coal supply and electric, water and sanitary sewer utility materials and is valued at average cost. Inventory of the Internal Service Fund consists of fuel and vehicle and equipment parts and materials and is valued at the lower of cost or market. Inventory of the Events Center consists of merchandise available for sale, valued at lower of cost or market
(g) Prepaid Items
Certain payments to vendors reflecting costs applicable to future accounting periods have been recorded as prepaid items in both the government-wide and fund financial statements, and expenditures are recognized using the consumption method.
38
CITY OF INDEPENDENCE, MISSOURI
Notes to Financial Statements
June 30, 2021
(h) Interfund Activity
The City has the following types of interfund activity:
Loans – amounts provided with a requirement for repayment. Interfund loans are reported as interfund receivables (i.e., due from other funds) in lender funds and interfund payables (i.e. due to other funds) in borrower funds.
Services provided and used – sales and purchases of goods and services between funds for a price approximating their fair value. Interfund services provided and used are reported as revenues in funds providing the good or service and expenditures or expenses in the fund purchasing the good or service. Unpaid amounts are reported as interfund receivables and payables in the fund balance sheets or fund statements of net position
Reimbursements – repayments from the funds responsible for particular expenditures or expenses to the funds that initially paid for them. Reimbursements are reported as expenditures in the reimbursing fund and as a reduction of expenditures in the reimbursed fund.
Transfers – flows of assets (such as cash or goods) without equivalent flows of assets in return and without a requirement for repayment. In governmental funds, transfers are reported as other financing uses in the funds making transfers and as other financing sources in the funds receiving transfers. The payments in lieu of taxes that the enterprise funds pay to the general fund are handled as transfers out for the enterprise funds and transfers in for the General fund.
(i) Capital Assets
Capital assets, which include property, plant, equipment and infrastructure assets (e.g., roads, bridges, drainage systems, and similar items) are reported in the applicable governmental or business-type activities columns in the government-wide financial statements. Capital assets are defined by the City as assets with an initial individual cost of more than $5,000 and an estimated useful life in excess of one year. Capital assets are stated at cost or estimated historical cost. For property acquired from another utility, the difference between the net cost of plant assets recorded by the selling entity and the purchase price is recorded as an acquisition adjustment. Contributions of capital assets received from federal, state, or local sources are recorded as assets and a capital contribution at acquisition value at the time of receipt. Additions, improvements and expenditures that significantly extend the useful life of an asset are capitalized.
39
CITY OF INDEPENDENCE, MISSOURI Notes to Financial Statements
June 30, 2021
Depreciation has been provided over the estimated useful lives using the composite and straight-line methods. Depreciation on utility vehicles and heavy equipment is charged to clearing accounts and redistributed to various operating, construction, and other accounts. The estimated useful lives are as follows:
40
Years Governmental activities: Buildings and improvements 20-40 Improvements other than buildings 20 Roads 20 Bridges 40 Drainage systems 35 Office equipment and furniture 7 Mobile equipment – vehicles 5 Mobile equipment – heavy equipment 10 Fire trucks 15 Other equipment 10 Computer equipment 5 Years Business-type activities: Power and Light Fund: Production plant 25-45 Transmission plant 28-40 Distribution plant 25-40 Transportation equipment 7 General plant 19-40 Machinery and equipment 7-25 Water Fund: Source of supply 15-50 Pumping 20-50 Water treatment 40-50 Transmission and distribution system 20-100 General plant 5-50 Acquisition adjustment 30 Nonutility property 10 Machinery and equipment 5-22 Sanitary Sewer Fund: Equipment 5-25 Sewer system 40-100 Plant 25 Machinery and equipment 5-20 Events Center Fund: Buildings and improvements 20-40 Improvements other than buildings 20 Machinery and equipment 4-20
CITY OF INDEPENDENCE, MISSOURI
Notes to Financial Statements
June 30, 2021
Property, plant, and equipment financed by capital leases are reflected as assets and corresponding liabilities, and the related depreciation expense is provided on the same basis as assets financed with other resources. General capital assets financed by capital leases are reported as capital outlay expenditures and other financing sources in the governmental funds.
(j) Bond Premiums/Discounts, and Issuance Costs
In the government-wide and proprietary fund financial statements, bond premiums and discounts are deferred and amortized over the life of the bonds using a method which approximates the effective interest method. Bonds payable are reported net of the applicable bond premium or discount. Bond issuance costs are expensed in the period in which the debt is issued.
In the fund financial statements, governmental fund types recognize bond premiums and discounts, as well as bond issuance costs, during the period in which the debt is issued. The face amount of debt issued and any related premiums or discounts are reported as other financing sources/uses. Issuance costs, whether or not withheld from the actual debt proceeds received, are reported as debt service expenditures during the year they are incurred
(k) Deferred Inflows/Outflows
In addition to assets, the statement of financial position will sometimes report a separate section for deferred outflows of resources. This separate financial statement element, deferred outflows of resources, represents a consumption of net position that applies to a future period(s) and so will not be recognized as an outflow of resources (expense/ expenditure) until then. The City has five items that qualify for reporting in this category. They are the deferred charge on refunding, deferred pension related amounts, deferred other post-employment benefit (OPEB) amounts, deferred environmental and regulatory amounts, and goodwill reported in the government-wide and the proprietary funds statements of net position. A deferred charge on refunding results from the difference in the carrying value of refunded debt and its reacquisition price. This amount is deferred and amortized over the shorter of the life of the refunded or refunding debt. The pension related deferred outflow consists of the unamortized portion of the net difference between projected and actual earnings on pension plan investments, plan experience, and changes in assumptions The OPEB related deferred outflow consists of the unamortized portion of the net difference between projected and actual experience and changes in assumptions. The deferred environmental and regulatory deferred outflow consists of charges permitted under regulatory basis of accounting for the Power and Light fund. The goodwill related deferred outflow consists of goodwill reported in the Events Center enterprise fund, which will be amortized over the remaining life of the related asset (the Events Center). Goodwill became a deferred outflow of resources under GASB Statement No. 85, Omnibus 2017, which the City implemented in the fiscal year ending June 30, 2018.
In addition to liabilities, the statement of financial position will sometimes report a separate section for deferred inflows of resources. This separate financial statement element, deferred inflows of resources, represents an acquisition of net position that applies to a future period(s) and so will not be recognized as an inflow of resources (revenue) until that time. The City has three types of items that qualify for reporting in this category, unavailable revenue, deferred pension related amounts, and deferred other postemployment benefit (OPEB) amounts. The governmental funds report unavailable revenues from two sources: real estate taxes and special assessments. These amounts are deferred and recognized as an inflow of resources in the period that the amounts become available. The government-wide and the proprietary fund statements of net position report pension related deferred inflows, which consists of the unamortized portion of the difference between expected and actual experience and plan assumptions, OPEB deferred
41
CITY OF INDEPENDENCE, MISSOURI
Notes to Financial Statements
June 30, 2021
inflows, which consist of the unamortized portion of the differences between expected and actual experience, and real estate taxes, which will become an inflow in the year for which they are levied
(l) Compensated Absences
Under the terms of the City’s personnel policy, City employees are granted vacation based upon length of service. Sick leave is granted at the rate of eight hours per month. Sick leave may be accumulated without limitation. Upon separation, compensation for accrued leave for all employees, other than Firefighers, is paid up to the equivalent of six months for sick leave, and a maximum of 400 hours for vacation at the employee’s current rate of pay. Firefighters hired after February 1, 2021 are not eligible to receive sick leave payout upon separation. Firefighters hired on or before February 1, 2021 are eligible to receive sick leave payout between 520 to 1,560 hours based upon different tiers for their hourly per week schedule and years of service.
The liability for compensated absences reported in the government-wide and proprietary fund statements has been calculated using the vesting method, in which leave amounts for both employees who currently are eligible to receive termination payments and other employees who are expected to become eligible in the future to receive such payments upon termination are included. A liability for these amounts is reported in governmental funds only if they have matured, for example, as a result of employee resignations and retirements.
(m) Pensions
The net pension liability, deferred inflows and outflows of resources related to pensions, pension expense, information about the fiduciary net position of the Missouri Local Government Employees Retirement System (LAGERS) and additions to/deductions from LAGERS fiduciary net position have been determined on the same basis as they are reported by LAGERS. For this purpose, benefit payments (including refunds of employee contributions) are recognized when due and payable in accordance with the benefit terms. Investments are reported at fair value.
(n) Fund Balances
In the fund financial statements, governmental funds report the following fund balance classifications: Non-Spendable – consists of amounts that cannot be spent because they are either not in spendable form or legally or contractually required to be maintained intact.
Restricted – consists of amounts where constraints are placed on their use either by (1) external groups such as creditors, grantors, contributors, or laws or regulations of other governments; or (2) law through constitutional provisions or enabling legislation.
Committed – consists of amounts which can only be used for specific purposes pursuant to constraints imposed by formal action (ordinance) of the City Council, which is the highest level of decision-making authority Those committed amounts cannot be used for any other purpose unless the City Council removes or changes the specified amounts by use of the same formal action that it employed to previously commit the funds.
Assigned – consists of amounts which are constrained by City management’s intent for these to be used for a specific purpose but are neither formally restricted by external sources nor committed by City Council action. The City’s Fund Balance Policy authorizes the City Manager to assign amounts
42
CITY OF INDEPENDENCE, MISSOURI
Notes to Financial Statements
June 30, 2021
for a specific purpose in this category. Likewise, the City Manager has the authority to take necessary actions to un-assign amounts in this category. Encumbrances shall be considered as assigned, unless they specifically meet the requirements to be committed or restricted.
Unassigned – consists of the residual fund balance that does not meet the requirements for the nonspendable, restricted, committed, or assigned classifications. The General Fund is the only fund that would report a positive amount in unassigned fund balances. Residual deficit amounts of other governmental funds are reported as unassigned.
The City has a fund balance policy that provides guidance for programs with multiple revenue sources. The policy is to use restricted resources first when an expenditure is incurred for purposes for which both restricted and unrestricted fund balance is available. For purposes of fund balance classification expenditures are to be spent from restricted fund balance first, followed in order by committed fund balance, assigned fund balance and lastly unassigned fund balance.
The City has a minimum Unassigned Fund Balance policy for the General Fund equal to 16% of annual revenues. If the fund balance falls below this target level of 16% then the City will strive to restore the Unassigned Fund Balance through revenue allocations or expenditure reductions back to the target level over a five (5) year period.
Detailed information on the City’s governmental fund balance classifications may be found in Note 15 in the notes to the financial statements.
(o) Net Position
In the government-wide and proprietary fund financial statements, equity is displayed in three components as follows:
Net Investment in Capital Assets – This consists of capital assets, net of accumulated depreciation, less the outstanding balances of any bonds, mortgages, notes, or other borrowings that are attributable to the acquisition, construction or improvement of those assets. Net investment in capital assets excludes unspent debt proceeds of $2,584,314 for Water, $6,897,363 for Sewer and $6,846,965 for the Events Center.
Restricted – This consists of net position that is legally restricted by outside parties or by law through constitutional provisions or enabling legislation. Net position restricted through enabling legislation consists of $2,708,073 for the Street Sales Tax and the License Surcharge; $2,547,954 for the Parks Sales Tax, Parks Property Tax, and Transient Guest Tax; $10,680,007 for Storm Water Sales Tax; $7,986,233 for Police Public Safety Sales Tax, Fire Protection Sales Tax, and Police Use Tax; $252,066 for the Animal Services Use Tax and Health Property Tax; $7,662 for the Independence Square Benefit District; $15,135,276 for debt service; and $9,472,002 for the Events Center Community Improvement District.
Unrestricted – This consists of net position that does not meet the definition of “restricted” or “net investment in capital assets.”
When both restricted and unrestricted resources are available for use, it is generally the City’s policy to use restricted resources first, then unrestricted resources as they are needed.
43
CITY OF INDEPENDENCE, MISSOURI
Notes to Financial Statements
June 30, 2021
(p) Statement of Cash Flows
For purposes of the statement of cash flows, short-term investments held in proprietary funds with a maturity date within three months of the date acquired by the City, are considered cash equivalents.
(q) Use of Estimates
The preparation of financial statements in conformity with GAAP requires management to make estimates and assumptions that affect amounts reported in the financial statements and accompanying notes. Actual results could differ from those estimates.
(r) Implementation of GASB Statement No. 84
The City implemented GASB Statement No. 84, Fiduciary Activities. The objective of this statement is to improve guidance regarding the identification of fiduciary activities, and how those activities should be reported. Implementation of this Statement expanded the reporting of net position to custodial funds and added custodial fund reporting to the Statement of Changes in Fiduciary Net Position (exhibit 9). Reporting also now includes a Combining Statement of Fiduciary Net Position (exhibit 41) and a Combining Statement of Changes in Fiduciary Net Position (exhibit 42). The implementation of GASB Statement No. 84 had no effect on any prior period balances.
(s) New Accounting Pronouncements
The Governmental Accounting Standards Board has issued several statements that are not yet effective and have not yet been implemented by the City. The statements which might impact the City are as follows:
In June 2017, GASB issued Statement No. 87, Leases. The objective of this statement is to better meet the information needs of financial statement users by improving accounting and financial reporting for leases by governments. The City will implement GASB Statement No. 87 with the year ended June 30, 2022
In May 2019, GASB issued Statement No. 91, Conduit Debt Obligations. The objectives of this statement are to provide a single method of reporting conduit debt obligations by issues and eliminate diversity in practice associated with (1) commitments extended by issuers, (2) arrangements associated with conduit debt obligations, and (3) related note disclosures. The City will implement GASB Statement No. 91 with the year ended June 30, 2023
In January 2020, GASB issued Statement No. 92, Omnibus 2020. The objectives of this statement are to enhance comparability in accounting and financial reporting and to improve the consistency of authoritative literature by addressing practice issues that have been identified during implementation and application of certain GASB statements. The City will implement GASB Statement No. 92 with the year ended June 30, 2022
In March 2020, GASB issued Statement No. 93, Replacement of Interbank Offered Rates. Interbank offered rates (IBOR), most notably, the London Interbank Offered Rate (LIBOR). IBOR is expected to cease to exist in its current form at the end of 2021, prompting governments to amend or replace financial instruments. The objective of this statement is to address those and other accounting and financial reporting implication that result from the replacement of an IBOR. The City will implement GASB Statement No. 93 with the year ended June 30, 2022.
In March 2020, GASB issued Statement No. 94, Public-Private and Public-Public Partnerships and Availability Payment Arrangements. The primary objective of this statement is to improve financial
44
CITY OF INDEPENDENCE, MISSOURI
Notes to Financial Statements
June 30, 2021
reporting by addressing issues related to public-private and public-public partnership arrangements (PPPs). The City will implement GASB Statement No. 94 with the year ended June 30, 2023
In May 2020, GASB issued Statement No. 96, Subscription-Based Information Technology Arrangements. The statement provides guidance on the accounting and financial reporting for subscription-based information technology arrangements (SBITAs) for government end users. The City will implement GASB Statement No. 96 with the year ended June 30, 2023.
In June 2020, GASB issued Statement No. 97, Certain Component Unit Criteria, and Accounting and Financial Reporting for Internal Revenue Code Section 457 Deferred Compensation Plans. The primary objectives of this statement are to (1) increase consistency and comparability related to the reporting of fiduciary component units; (2) mitigate costs associated with the reporting of certain defined contribution pension plans, defined contribution other postemployment benefit (OPEB) plans, and other employee benefit plans other than pension or OPEB plans; and (3) enhance the relevance, consistency, and comparability of the accounting and financial reporting for Internal Revenue Code Section 457 deferred compensation plans. Portions of the statement were effective immediately. For the remaining portions, the City will implement GASB Statement No. 97 with the year ended June 30, 2022.
The City’s management has not yet determined the effect, if any, these statements will have on the City’s financial statements.
45
CITY OF INDEPENDENCE, MISSOURI Notes to Financial Statements
June 30, 2021
(2) Deposits and Investments
Fair Value Measurements
Fair value is the price that would be received to sell an asset or paid to transfer a liability in an orderly transaction between market participants at the measurement date. Fair value is a market based measurement, not an entity specific measurement. For some assets and liabilities, observable market transactions or market information might be available; for others, it might not be available. However, the objective of a fair value measurement in both cases is the same, that is, to determine the price at which an orderly transaction to sell the asset or to transfer the liability would take place between the market participants at the measurement date under current market conditions. Fair value is an exit price at the measurement date from the perspective of a market participant that controls the asset or is obligated for the liability. The City categorizes its assets and liabilities measured at fair value within the hierarchy established by generally accepted accounting principles. Assets and liabilities valued at fair value are categorized based on inputs to valuation techniques as follows:
Level 1 input
Quoted prices for identical assets or liabilities in an active market that an entity has the ability to access.
Level 2 input
Quoted prices for similar assets or liabilities in active markets and inputs that are observable for the asset or liability, either directly or indirectly, for substantially the full term of the asset or liability.
Level 3 input – Inputs that are unobservable for the asset or liability which are typically based upon the City’s own assumptions as there is little, if any, related market activity.
Hierarchy – The fair value hierarchy gives the highest priority to Level 1 inputs and the lowest priority to Level 3 inputs.
Inputs – If the fair value of an asset or liability is measured using inputs from more than one level of the fair value hierarchy, the measurement is considered to be based on the lowest priority level input that is significant to the entire measurement.
For the City, the measurement of the fair value of investments was either based on quoted market prices obtained from exchanges, or from independent pricing sources. Where prices are not available from generally recognized sources the securities are priced using a yield-based matrix to arrive at an estimated fair value.
46
–
–
CITY OF INDEPENDENCE, MISSOURI
Notes to Financial Statements
June 30, 2021
The City has no assets reported at fair value on a nonrecurring basis. The securities in the following table are measured at fair value per the disclosure requirements of Governmental Accounting Standards Board (GASB) Statement No. 72.
At June 30, 2021 the carrying values of deposits and investments are summarized as follows:
Deposits and investments of the City are reflected in the government-wide financial statements as follows:
Investment Policy
Missouri state statutes authorize the City, with certain restrictions, to deposit or invest in open accounts, time deposits, U.S. Treasury notes, and certificates of deposit. Statutes also require that collateral pledged must have a fair value equal to 100% of the funds on deposit, less insured amounts. Collateral securities must be held by the City or a disinterested third party and must be of the kind prescribed by state statutes and approved by the State of Missouri.
47
Fair Value Investments measured at fair value: Measurement Investments held in trust (bond reserves): U.S. Treasury Notes $ 7,037,760 Level 1 Federal National Mortgage Association 6,644,269 Level 2 Other investments: Federal National Mortgage Association 28,068,562 Level 2 Federal Home Loan Mortgage Corporation 15,541,253 Level 2 Federal Home Loan Bank 6,112,696 Level 2 Federal Farm Credit Bank 5,202,735 Level 2 U.S. Treasury Notes 59,725,701 Level 1 U.S. Treasury Bond 27,506 Level 1 U.S. Treasury Bill 200,717 Level 1 Investments measured at amortized cost: Money Market - Bond Reserves 41,041,767 N/A Local Government Investment Pool - MOSIP 24,530,611 N/A Total investments 194,133,577 Cash and cash equivalents: Deposits and repurchase obligations 58,568,127 Petty cash 21,046 Total $ 252,722,750
Fiduciary Government-Wide Funds Primary Statement Statement Government of Net Position of Net Position Total Pooled cash and investments $ 190,508,705 235,191 190,743,896 Current restricted cash and investments 5,310,895 5,310,895 Non-current restricted cash and investments 56,667,959 56,667,959 $ 252,487,559 235,191 252,722,750
CITY OF INDEPENDENCE, MISSOURI
Notes to Financial Statements
June 30, 2021
The City maintains a cash and investment pool, which is available for use by most funds. Substantially all excess cash is invested in U.S. Government securities, a local government investment pool, and money market funds. Each fund’s portion of this pool is displayed as pooled cash and investments or in restricted assets. Interest earned on the cash and cash equivalents is allocated to the funds on the basis of average monthly cash and investment balances, and investment interest earned is based on each funds share of the investment balances at the beginning of the fiscal year Only funds with overdrawn balances (cash and investments) are charged for interest. Cash and investments are held separately by some of the City’s funds. Additionally, certain restricted assets, related to bond ordinances and indentures and capital lease certificates, are held in escrow by financial institutions’ trust departments
At June 30, 2021, some funds did reflect a loss under their investment income which is due to required market value adjustments and each fund’s cash position and portion of the investment pool.
Credit Risk/Concentration of Credit Risk
The credit risk for investments is the possibility that the issuer/counterparty to an investment will be unable to fulfill its obligations. It is the City’s policy to limit its investments to Certificates of Deposit and Bonds or other obligations of the United States. The City’s investment policy does not specify maximum or minimum investment concentrations by investment type. The credit rating and concentration of the City’s investment in debt securities are as follows:
Custodial Credit Risk
The custodial credit risk for deposits is the risk that, in the event of the failure of a depository financial institution, the City will not be able to recover deposits or will not be able to recover collateral securities that are in the possession of an outside party. The custodial credit risk for investments is the risk that, in the event of the failure of the counterparty to a transaction, the City will not be able to recover the value of investment or collateral securities that are in the possession of an outside party. The City’s policy is to collateralize the demand deposits and repurchase agreements with securities held by the financial institution’s agent and in the City’s name.
At June 30, 2021, the City’s deposits and repurchase obligations were insured by Federal depository insurance and uninsured deposits and repurchase obligations were fully collateralized by securities held in the City’s name by their financial institution’s agent. The City’s securities were registered and held by the City’s financial institution in the City’s name. Accordingly, management has determined that none of the City’s deposits or investments were exposed to custodial credit risk as of June 30, 2021
48
` Percent of Total Issuer Moody's Credit Rating Investments Federal Home Loan Bank Aaa 3.15% Federal National Mortgage Association Aaa 17.88% Federal Home Loan Mortgage Corporation Aaa 8.01% Federal Farm Credit Bank Aaa 2.68% Local Government Investment Pool - MOSIP AAAm (S & P) N/A
CITY OF INDEPENDENCE, MISSOURI
Notes to Financial Statements
June 30, 2021
Interest Rate Risk
The City’s investment policy does not limit investment maturities as a means of managing its exposure to fair value losses arising from increasing interest rates. The City has elected to use the segmented time distribution method of disclosure for its interest rate risk.
As of June 30, 2021, the City’s investment portfolio had the following investments and maturities:
Truman Heartland Community Foundation
The City has various fund accounts at the Truman Heartland Community Foundation (THCF), where donations are received for special City projects. THCF is a public charity which services communities in and around Eastern Jackson County.
At June 30, 2021 the carrying values of deposits are summarized as follows:
49
6 Months 6 - 12 12 - 24 24 - 36 36 - 48 48 - 60 Over 60 Total or Less Months Months Months Months Months Months Local Government Investment Pool - MOSIP $ 24,530,611 24,530,611 Money Market - Bond Reserves 41,041,767 41,041,767 U.S. Government Securities Federal National Mortgage Association 34,712,831 2,726,000 22,946,861 9,039,970 Federal Home Loan Mortgage Corporation 15,541,253 6,632,670 2,338,584 4,824,772 1,745,227 Federal Home Loan Bank 6,112,696 4,126,899 1,749,632 236,165 Federal Farm Credit Bank Notes 5,202,735 2,335,869 2,866,866 U.S. Treasury Notes 66,763,461 7,037,760 2,550,391 22,339,976 13,375,197 3,923,848 17,536,289 U.S. Treasury Bill 200,717 200,717 U.S. Treasury Bond 27,506 27,506 Total investments $ 194,133,577 72,810,855 4,886,260 35,825,545 41,527,508 19,538,222 19,517,681 27,506 Investment Type
Project Balance Fire Safety Equipment $ 12,049 Sermon Memorial Room 36,234 Sermon/Old Spring Project 36,169 Truman Memorial Building Restoration 1,756 Truman Memorial Walking Trail 15,424 George Owens Nature Park 5,481 Palmer Center Senior Services 17,427 Palmer Senior Center 5,866 Memorial Endowment - Palmer Senior Center 101,852 McCoy Park Inclusive Play 8,166 Animal Shelter Replacement 10,817 Endowment - All Creatures Fund 94,029 Friends of Truman Depot 17,361 Waggoner Memorial 4,757 Pioneer Statue 4,549 $ 371,937
CITY OF INDEPENDENCE, MISSOURI
Notes to Financial Statements
June 30, 2021
(3) Tax Revenue
Tax revenue, including interest and penalties for the year ended June 30, 2021 is as follows:
The City’s real estate tax is levied each November 1 on the assessed value as of the prior January 1 for all real property located in the City. Real estate taxes are due on December 31 following the levy date. On January 1, a lien attaches to all property. Property taxes are recognized as a receivable at the time they become an enforceable legal claim, and revenue is recognized in the year for which the property tax is levied. Jackson County bills and collects all real estate taxes for the City and charges a 1.5% to 1.6% commission on all taxes collected.
Assessed values are established by the Clay and Jackson County assessors, subject to review by the Jackson County Board of Equalization and State Tax Commission. The assessed value for real property, including railroad and utility properties, located in the City as of January 1, 2020, on which the fiscal 2021 levy was based, was $1,562,300,351.
The City is permitted by Missouri state statutes to levy taxes up to $1.00 per $100 of assessed valuation for general governmental services, other than payment of principal and interest on long-term debt, up to $0.40 per $100 of assessed valuation for public health and recreation, and in unlimited amounts for the payment of principal and interest on long-term debt. Property tax levies per $100 assessed valuation for the year ended June 30, 2021 were $0.4535 for the General Fund, $0.2137 for Public Health and Recreation, and $0.5826 for the Independence Square Benefit District Fund.
(a) Tax Abatements Chapter 353
The City approves property tax abatements pursuant and subject to the terms of Missouri Statute 353 (Urban Redevelopment Corporations Law). The purpose of Chapter 353 Tax Abatement is to encourage the redevelopment of blighted areas by providing real property tax abatement.
As of June 30, 2021, the City provides Chapter 353 Tax Abatements through four programs that provide property tax abatement to encourage rehabilitation of properties that improve the safety and health of the home occupants, and help revitalize the redevelopment area. Abatements are obtained through application by the property owner, including inspection by City staff showing proof that improvements were made,
50
Nonmajor TIF Governmental General Debt Service Funds Total Real Estate and Intergovernmental Activity Tax $ 5,884,254 11,402,855 2,758,708 20,045,817 Railroad Utilities Tax 40,127 40,127 Cigarette Tax 408,212 408,212 Transient Guest Tax 1,321,757 1,321,757 Sales Tax 18,295,167 7,895,769 22,069,620 48,260,556 Use Tax 435,288 4,295,090 4,730,378 Franchise Tax 7,376,565 7,376,565 $ 32,439,613 19,298,624 30,445,175 82,183,412
June 30, 2021
and equals 100% of the real estate tax for years 1 through 10, and 50% of the real estate tax for years 11 through 25. The amount of the abatement is deducted from the property owner’s tax bill. Abatements are not given until after the improvements have been made, and so there is no recapture provision. For the fiscal year ending June 30, 2021, the abated tax amounts were as follows:
Chapter 100
The City approves property tax abatements pursuant and subject to the terms of Missouri Statute 100 which authorizes the City to issue Industrial Development Bonds to finance industrial development projects for private corporations, partnerships or individual companies. Under this type of financing, the company passes the title in the real property involved to the City which results in the bond proceeds being tax exempt resulting in a tax abatement for the company. The purpose of Chapter 100 Tax Abatement is to encourage retention and expansion of industrial development projects for the purchase, construction, extension and improvement of warehouses, distribution facilities, research and development facilities, office industries, agricultural processing industries, service facilities that provide interstate commerce, industrial plants and commercial facilities.
As of June 30, 2021, the City provides Chapter 100 Tax Abatements through two programs. Facilities receiving tax abatements under Chapter 100 make payments in lieu of taxes (PILOTS) to the City
The City tax abated under the following Chapter 100 program to Unilever was $93,597.
1 0% Personal property taxes that would otherwise be due on the project equipment
2 5% Personal property taxes that would otherwise be due on the project equipment
3 10% Personal property taxes that would otherwise be due on the project equipment
4 15% Personal property taxes that would otherwise be due on the project equipment
5 20% Personal property taxes that would otherwise be due on the project equipment
CITY OF INDEPENDENCE, MISSOURI Notes to Financial Statements
51
Tax Abatement Program Abated Tax Fairmount Carlisle $ 26,799 Independence Square 22,274 Midtown Truman Road Corridor 41,127 St. Clair Park 324 Total $ 90,524
Years PILOT Percentage Basis
10 20% Real property
11
15 25% Real property
16
1 through
taxes that would otherwise be due on the project improvements
through
taxes that would otherwise be due on the project improvements
through 20 50% Real property taxes that would otherwise be due on the project improvements
CITY OF INDEPENDENCE, MISSOURI
Notes to Financial Statements
June 30, 2021
The City tax abated under the following Chapter 100 program to Ronson Machine and Manufacturing was $2,519
1 through 2 Fixed Real property taxes in amount equal to the taxes due in 2018
3 through 12 25%
Real property taxes in amount equal to the taxes due in 2018 increased in each odd year by 2%, plus 25% of the taxes that would otherwise be due on the project improvements.
2 through 12 25% Personal property taxes that would otherwise be due on the project equipment
Tax Increment Financing
The City utilizes Tax Increment Financing (TIF) for economic development projects pursuant to the terms of Missouri Statute 99.800 through 99.865 (TIF Act). The purpose of TIF projects is to finance improvement within a geographically defined area called a redevelopment project area, which has been found by the City Council to be either a blighted, conservation, or economic development area. TIF projects allow the City to finance certain redevelopment costs from the revenue generated from (1) real estate taxes, measured by the net increase in assessed valuation resulting from redevelopment and (2) a percent of local sales tax revenues generated by new economic activities in the redevelopment area. These real estate taxes and sales tax revenues are allocated to special allocation funds set up for each TIF project. Under GASB Statement No. 77, these types of allocations are considered a tax abatement. For the fiscal year ending June 30, 2021, the City had 21 active TIF projects and abated $1,321,082 in real estate tax and $7,629,157 in sales tax revenue.
52
Years PILOT Percentage Basis
CITY OF INDEPENDENCE, MISSOURI
Notes to Financial Statements
June 30, 2021
(4) Intergovernmental Revenue and Receivables
Intergovernmental revenue during fiscal year 2021 consisted of the following:
53
General Fund Nonmajor Governmental Funds Total Federal Department of Housing & Urban Development $ Community Development Block Grant 1,105,772 1,105,772 Neighborhood Stabilization Program 305 305 Home Investment Partnership 415,963 415,963 Department of the Interior 23,783 23,783 Department of Justice 487,471 487,471 Department of Transportation 1,918,790 1,918,790 Department of Health & Human Services 126,595 126,595 Departments of Treasury 8,020,528 8,020,528 Executive Office of the President 309,491 309,491 Department of Homeland Security 343,421 343,421 Total Federal 12,752,119 12,752,119 State & Local Department of Health & Human Services 14,127 14,127 Department of Public Safety 16,026 16,026 Department of Revenue Motor Vehicle Fuel Tax 3,125,991 3,125,991 Motor Vehicle License 617,050 617,050 Motor Vehicle Sales Tax 1,308,130 1,308,130 Financial Institutions Tax 20,601 20,601 Missouri Highway & Transportation Commission 16,653 16,653 Missouri Division of Tourism 66,250 66,250 Jackson County Anti-Drug Tax 275,028 275,028 Jackson County DARE 308,610 308,610 Mid-America Regional Council 78,512 78,512 Healthcare Foundation of Greater Kansas City 2,006 2,006 Health Forward Foundation 39,917 39,917 Other 11,990 11,990 Total State & Local 5,655,410 245,481 5,900,891 Grand Total $ 5,655,410 12,997,600 18,653,010
CITY OF INDEPENDENCE, MISSOURI
Notes to Financial Statements
June 30, 2021
Amounts due from other governments at June 30, 2021 are as follows:
54
Federal State Local Total General Fund : Department of Revenue $ Motor Vehicle Fuel Tax 536,171 536,171 Motor Vehicle Sales Tax 133,529 133,529 Motor Vehicle License Fees 148,900 148,900 DARE 150,000 150,000 Marketplace Shopping Center Transportation Development Dist 51 51 818,600 150,051 968,651 TIF Debt Service: State Sales Tax 150,582 150,582 County Sales Tax 435,490 435,490 Kansas City Zoo Tax 70,201 70,201 Noland Road Community Improvement District 58,705 58,705 Marketplace Community Improvement District 1,804 1,804 39th St Transportation Development District 98,414 98,414 150,582 664,614 815,196 Nonmajor Governmental Funds: Department of Housing & Urban Development Community Development Block Grant 351,045 351,045 Home Investment Partnership 9,787 9,787 Neighborhood Stabilization Program 115,196 115,196 Department of the Interior 9,087 9,087 Department of Justice 198,732 198,732 Department of Transportation 568,311 568,311 Department of Health & Human Services 12,876 12,876 Department of Homeland Security 269,591 269,591 Executive Office of the President 140,371 140,371 Missouri Department of Health & Senior Services 14,127 14,127 Missouri Division of Tourism 66,250 66,250 1,674,996 80,377 1,755,373 Power and Light Fund: Federal Communications Commission 185,328 185,328 185,328 185,328 Totals $ 1,860,324 1,049,559 814,665 3,724,548
CITY OF INDEPENDENCE, MISSOURI
Notes to Financial Statements
June 30, 2021
(5) Interfund Activity
(a) Interfund Balances
Interfund balances at June 30, 2021, consisted of the following:
Interfund payables and receivables represent loans between funds for operating purposes, short-term negative cash balances and pending reimbursements The Parks Sales Tax Fund owes the Water Fund $2,125,552 for an internal loan for Farmer’s Market construction. The Crackerneck Creek TDD, which is reported as a component unit in the TIF Debt Service category, owes $1,919 to the General Fund for administrative fees. The Events Center CID, which is reported as a component unit in the Event Center Category, owes $26,043 to the General Fund for administrative fees. All other amounts are for short-term loans for negative cash balances at June 30, 2021
(b) Interfund Charges for Support Services
Interfund charges for support services and rent paid to the General Fund during fiscal year 2021 were as follows:
Rent charges, which consist of leased office space, are included in other revenue of the General Fund.
55
Due from Due from Due from Due from Nonmajor TIF Debt Events Internal Governmental Service Center Service Funds Total Due to: Governmental activities: General Fund $ 1,074,754 1,919 26,043 951,775 2,054,491 Nonmajor governmental 16,155 — — — 16,155 Total governmental activities $ 1,090,909 1,919 26,043 951,775 2,070,646 Business-type activities: Power and Light Fund $ — — — 951,774 951,774 Water Fund 2,125,552 — — 951,774 3,077,326 Sanitary Sewer Fund — — — 951,774 951,774 Total business-type activities 2,125,552 — — 2,855,322 4,980,874 Total $ 3,216,461 1,919 26,043 3,807,097 7,051,520
Interfund Charges Rent Nonmajor governmental funds $ 72,162 $ Power and Light Fund 2,579,519 60,726 Sanitary Sewer Fund 1,004,487 23,647 Water Fund 1,379,332 35,367 $ 5,035,500 $ 119,740
CITY OF INDEPENDENCE, MISSOURI
Notes to Financial Statements
June 30, 2021
Interfund charges for customer service support services and telephone operators were paid to the Water Fund during fiscal year 2021, and are included as a credit to Water’s operating expenses as follows:
Interfund charges for meter reading services were paid to the Power and Light Fund during fiscal year 2021, and are included as a credit to Power and Light’s operating expenses as follows:
(c) Payments in Lieu of Taxes
The payments in lieu of taxes of $12,602,965, $3,119,912 and $3,532,359 in fiscal year 2021 by the Power and Light, Water, and Sanitary Sewer (Enterprise) Funds, respectively, to the General Fund approximate franchise taxes and real estate taxes on plant in service. The franchise tax rate, established by City ordinance at 9.08%, is applied to gross billed operating revenues less amounts written off to arrive at the franchise tax due the General Fund. Real estate taxes are charged at a set amount.
(d) Interfund Transfers
Interfund transfers for the year ended June 30, 2021, consisted of the following:
Transfers are for capital projects, general operations and debt service payments. There is a transfer for $1,189,131 between the Events Center CID and TIF Debt Service funds that is eliminated upon consolidation within the financial statements.
56
Power and Light Fund $ 1,767,929 Sanitary Sewer Fund 381,213
2,149,142
$
Sanitary Sewer Fund $ 368,320 Water Fund 1,683,910 $ 2,052,230
Transfer Out Tax Increment Nonmajor General Financing Governmental Total Transfers In: General $ — — 808,036 808,036 Tax Increment Financing — 2,555,000 420,025 2,975,025 Sanitary Sewer Fund 10,000 — — 10,000 Events Center — 1,189,131 — 1,189,131 Internal Service Fund — — 2,775,613 2,775,613 Nonmajor governmental 25,300 — 1,200,665 1,225,965 Total Primary Government $ 35,300 3,744,131 5,204,339 8,983,770
CITY OF INDEPENDENCE, MISSOURI
Notes to Financial Statements
June 30, 2021
(6) Capital Assets
Capital asset activity for the year ended June 30, 2021 is as follows:
57
Balance Balance June 30, 2020 Additions Retirements June 30, 2021 Governmental activities: Nondepreciable capital assets: Land $ 32,034,141 32,034,141 Construction work in progress 23,455,884 9,924,901 (9,198,912) 24,181,873 Total nondepreciable capital assets 55,490,025 9,924,901 (9,198,912) 56,216,014 Depreciable capital assets: Land improvements 10,156,469 10,156,469 Buildings 59,117,469 24,328 59,141,797 Building improvements 19,176,860 24,065 19,200,925 Improvements other than buildings 37,005,798 51,308 37,057,106 Office furniture and equipment 477,415 (33,469) 443,946 Computer equipment 6,163,634 4,628,320 (11,420) 10,780,534 Mobile equipment 26,123,562 4,128,293 (4,533,818) 25,718,037 Other equipment 10,489,562 2,431,197 12,920,759 Infrastructure 424,139,273 9,198,912 433,338,185 Total depreciable capital assets 592,850,042 20,486,423 (4,578,707) 608,757,758 Less accumulated depreciation for: Land improvements (4,994,263) (496,639) (5,490,902) Buildings (21,887,295) (1,450,267) (23,337,562) Building improvements (12,193,445) (883,623) (13,077,068) Improvements other than buildings (23,456,774) (1,796,313) (25,253,087) Office furniture and equipment (458,171) (5,760) 33,469 (430,462) Computer equipment (4,391,066) (638,637) 11,420 (5,018,283) Mobile equipment (18,763,448) (1,727,991) 4,400,119 (16,091,320) Other equipment (8,239,442) (660,126) (8,899,568) Infrastructure (242,032,446) (13,985,075) (256,017,521) Total accumulated depreciation (336,416,350) (21,644,431) 4,445,008 (353,615,773) Total depreciable capital assets, net 256,433,692 (1,158,008) (133,699) 255,141,985 Governmental activities capital assets, net $ 311,923,717 8,766,893 (9,332,611) 311,357,999
CITY OF INDEPENDENCE, MISSOURI
Notes to Financial Statements
June 30, 2021
Depreciation expense was charged to functions as follows:
58
Administrative Services $ 71,893 Public Safety 2,974,911 Municipal Services (Public Works) 13,318,280 Health and Welfare 30,969 Culture and Recreation 2,020,877 Community Development 123,977 Storm Water 1,655,630 General Government 1,025,966 Total 21,222,503 Internal Service Funds: Central Garage 4,852 Enterprise Resource Planning 417,076 Total depreciation expense $ 21,644,431
CITY OF INDEPENDENCE, MISSOURI
Notes to Financial Statements
June 30, 2021
* See page 62 note regarding depreciation.
59 Balance Balance June 30, 2020 Additions Retirements June 30, 2021 Business-type activities: Power and Light Fund: Nondepreciable capital assets: Land $ 3,840,521 3,840,521 Construction in progress 29,967,089 13,372,022 (6,809,744) 36,529,367 Total nondepreciable capital assets 33,807,610 13,372,022 (6,809,744) 40,369,888 Depreciable capital assets: Infrastructure: Production plant 187,457,264 1,888,544 (96,064,903) 93,280,905 Transmission plant 45,815,551 12,873 45,828,424 Distribution plant 184,620,427 3,921,272 188,541,699 General plant 16,505,585 987,055 17,492,640 Other 2,755,568 2,755,568 Total infrastructure 437,154,395 6,809,744 (96,064,903) 347,899,236 Machinery and equipment 29,226,475 29,226,475 Total depreciable capital assets 466,380,870 6,809,744 (96,064,903) 377,125,711 Less accumulated depreciation: Infrastructure (251,568,844) (10,064,112) 90,823,396 (170,809,560) Machinery and equipment (23,290,106) (2,142,611) (25,432,717) * Total accumulated depreciation (274,858,950) (12,206,723) 90,823,396 (196,242,277) Total depreciable capital assets, net 191,521,920 (5,396,979) (5,241,507) 180,883,434 Total power and light capital assets $ 225,329,530 7,975,043 (12,051,251) 221,253,322
CITY OF INDEPENDENCE, MISSOURI
* See page 62 note regarding depreciation.
60 Balance Balance June 30, 2020 Additions Retirements June 30, 2021 Water Fund: Nondepreciable capital assets: $ Land 2,164,901 2,164,901 Construction in progress 4,125,868 2,684,403 (2,087,241) 4,723,030 Total nondepreciable capital assets 6,290,769 2,684,403 (2,087,241) 6,887,931 Depreciable capital assets: Infrastructure: Nonutility property 40,014 40,014 Source of supply 8,303,515 (16,290) 8,287,225 Pumping plant 15,852,763 123,851 (90,902) 15,885,712 Treatment plant 26,044,420 256,065 (237,565) 26,062,920 Transmission plant 97,541,150 1,897,237 (222,748) 99,215,639 General plant 2,131,136 51,505 2,182,641 Other 12,547,766 12,547,766 Total infrastructure 162,460,764 2,328,658 (567,505) 164,221,917 Machinery and equipment 7,639,260 337,017 (149,635) 7,826,642 Total depreciable capital assets 170,100,024 2,665,675 (717,140) 172,048,559 Less accumulated depreciation: Infrastructure (59,085,405) (2,806,510) 553,853 (61,338,062) Machinery and equipment (5,282,403) (545,245) 149,635 (5,678,013) * Total accumulated depreciation (64,367,808) (3,351,755) 703,488 (67,016,075) Total depreciable capital assets, net 105,732,216 (686,080) (13,652) 105,032,484 Total water capital assets $ 112,022,985 1,998,323 (2,100,893) 111,920,415
Notes to Financial Statements June 30, 2021
CITY OF INDEPENDENCE, MISSOURI
Notes to Financial Statements
June 30, 2021
61 Balance Balance June 30, 2020 Additions Retirements June 30, 2021 Sanitary Sewer Fund: Nondepreciable capital assets: Land $ 330,191 330,191 Construction in progress 8,475,828 2,583,193 (741,386) 10,317,635 Total nondepreciable capital assets 8,806,019 2,583,193 (741,386) 10,647,826 Depreciable capital assets: Infrastructure: Nonutility property 46,368 46,368 Collection plant 124,832,298 634,964 (7,717) 125,459,545 Pumping plant 70,098,339 140,473 (11,275) 70,227,537 Treatment plant 13,685,413 (128,618) 13,556,795 General plant 1,264,348 1,264,348 Total infrastructure 209,926,766 775,437 (147,610) 210,554,593 Machinery and equipment 7,251,619 774,298 (97,975) 7,927,942 Total depreciable capital assets 217,178,385 1,549,735 (245,585) 218,482,535 Less accumulated depreciation: Infrastructure (74,881,500) (4,020,766) 18,992 (78,883,274) Machinery and equipment (6,202,657) (390,081) 213,560 (6,379,178) Total accumulated depreciation (81,084,157) (4,410,847) 232,552 (85,262,452) Total depreciable capital assets, net 136,094,228 (2,861,112) (13,033) 133,220,083 Total sewer capital assets 144,900,247 (277,919) (754,419) 143,867,909 Events Center fund: Nondepreciable capital assets: Land $ 5,796,315 5,796,315 Total nondepreciable capital assets 5,796,315 5,796,315 Depreciable capital assets: Infrastructure 66,604,787 60,813 66,665,600 Machinery and equipment 5,604,999 54,636 5,659,635 Total depreciable capital assets 72,209,786 115,449 72,325,235 Less accumulated depreciation: Infrastructure (17,511,486) (1,693,236) (19,204,722) Machinery and equipment (2,742,893) (430,041) (3,172,934) Total accumulated depreciation (20,254,379) (2,123,277) (22,377,656) Total depreciable capital assets, net 51,955,407 (2,007,828) 49,947,579 Total events center capital assets 57,751,722 (2,007,828) 55,743,894 Total business-type activities capital assets $ 540,004,484 7,687,619 (14,906,563) 532,785,540
CITY OF INDEPENDENCE, MISSOURI
Notes to Financial Statements
June 30, 2021
Depreciation expense was charged to functions as follows:
Depreciation expense charged to Power and Light and Water funds may be different than the additions to accumulated depreciation because certain depreciation related to utility vehicles and heavy equipment are charged to clearing accounts and redistributed to various operating, construction, and other capital accounts
As of June 30, 2021 the difference for Power and Light is $1,501,549 and the difference for Water is $179,187
Under accounting practices promulgated in the utility industry by the Federal Energy Regulatory Commission (FERC) and the National Association of Regulatory Utility Commissioners (NARUC), for business-type activities, units retired plus the cost of removal, less salvage, are charged against accumulated depreciation, with no gain or loss recognized. The retirement of these assets can cause the decrease in accumulated depreciation to be higher than the decrease of the capital asset due to the cost of removal.
Depreciation expense charged to Sanitary Sewer was different than the additions to accumulated depreciation due to transfers of fully depreciated assets from the Storm Water Sales Tax fund and adjustment for an asset retirement that was not fully depreciated yet.
Effective June 1, 2020, energy production ceased at the Power and Light fund’s Blue Valley plant. During the fiscal year ended June 30, 2021, the book value of the plant of $5,533,686 was removed and recorded as a loss on capital asset impairment disposal. The capital asset is no longer included in the City’s financial statements.
62
Business-type activities: Power and Light $ 10,705,174 Water 3,172,568 Sanitary Sewer 4,395,223 Events Center 2,123,277 Total business-type activities depreciation expense $ 20,396,242
CITY OF INDEPENDENCE, MISSOURI
Notes to Financial Statements
June 30, 2021
(7) Long-Term Obligations
The State Constitution permits a city, by vote of two-thirds of the voting electorate, to incur general obligation indebtedness for “city purposes,” not to exceed 10% of the assessed value of taxable tangible property. The State Constitution also permits a city, by vote of two-thirds of the voting electorate under a special election or four-sevenths under a general election, to incur additional general obligation indebtedness not exceeding, in the aggregate, an additional 10% of the assessed value of taxable tangible property for the purpose of acquiring rights-of-way, constructing, extending, and improving streets and avenues and/or sanitary or storm sewer systems, and purchasing or constructing waterworks, electric, or other plants, provided that the total general obligation indebtedness of the city does not exceed 20% of the assessed valuation of taxable property. As of June 30, 2021, the City has no general obligation debt outstanding.
The following is a summary of changes in long-term liabilities of the City for the year ended June 30, 2021:
The compensated absences, other post-employment benefit liabilities and pension liabilities attributable to governmental activities will be liquidated primarily by the General Fund. The self-insurance claims liability will be paid from the Staywell Health Care Fund and Workers’ Compensation Fund.
63
Beginning Ending Amount Due Balance Additions Reductions Balance Within One Year Governmental activities: Loans and notes payable: Loans payable $ 17,955,000 7,500 17,947,500 7,500 TIF loans 127,140,000 35,920,000 46,685,000 116,375,000 8,120,000 Capital lease obligations 755,122 1,377,511 263,929 1,868,704 411,859 Neighborhood Improvement District (NID) 34,000 7,000 27,000 7,000 Premium (discount), net 831,751 4,689,865 145,607 5,376,009 Total loans and note payable 146,715,873 41,987,376 47,109,036 141,594,213 8,546,359 Other liabilities: Compensated absences 17,015,544 6,602,338 6,363,655 17,254,227 7,632,627 Total OPEB liability 134,717,986 21,279,706 155,997,692 Self-insurance claims payable 9,894,390 23,783,632 23,213,679 10,464,343 3,868,885 Net pension liability 55,764,737 55,764,737 Total other liabilities 217,392,657 51,665,676 85,342,071 183,716,262 11,501,512 Total Governmental Activities $ 364,108,530 93,653,052 132,451,107 325,310,475 20,047,871
CITY OF INDEPENDENCE, MISSOURI
Notes to Financial Statements
June 30, 2021
The following is a summary of changes in long-term debt of the Proprietary Funds for the year ended June 30, 2021:
64
Amount Due Beginning Ending Within Balance Additions Reductions Balance One Year Business-type activities: Power and Light Fund: Revenue bonds $ 151,150,000 14,660,000 136,490,000 4,210,000 Premium on bonds payable 4,375,681 734,498 3,641,183 Total revenue bonds 155,525,681 15,394,498 140,131,183 4,210,000 Compensated absences 5,108,677 2,199,242 2,334,546 4,973,373 1,787,618 Total OPEB liability 46,352,360 6,063,604 52,415,964 Net pension liability 27,900,718 27,900,718 Total Power and Light Fund 234,887,436 8,262,846 45,629,762 197,520,520 5,997,618 Water Fund: Revenue bonds 21,870,000 1,630,000 20,240,000 1,695,000 Premium on bonds payable 515,224 55,194 460,030 Total revenue bonds 22,385,224 1,685,194 20,700,030 1,695,000 Compensated absences 1,489,290 701,908 671,932 1,519,266 537,805 Total OPEB liability 13,800,129 1,617,636 15,417,765 Net pension liability 6,263,199 6,263,199 Total Water Fund 43,937,842 2,319,544 8,620,325 37,637,061 2,232,805 Sanitary Sewer Fund: Revenue Bonds 90,575,000 2,205,000 88,370,000 2,280,000 Premium on bonds payable 771,417 35,024 736,393 Discount on bonds payable (38,389) (1,600) (36,789) Total revenue bonds 91,308,028 2,238,424 89,069,604 2,280,000 Compensated absences 875,315 411,694 384,250 902,759 365,444 Total OPEB liability 9,654,678 2,847,493 12,502,171 Net pension liability 4,647,403 4,647,403 Total Sanitary Sewer Fund 106,485,424 3,259,187 7,270,077 102,474,534 2,645,444 Events Center Fund: Revenue bonds 86,350,000 1,485,000 84,865,000 1,650,000 Premium on bonds payable 138,037 7,778 130,259 Discount on bonds payable (205,711) (11,590) (194,121) Total Events Center Fund 86,282,326 1,481,188 84,801,138 1,650,000 Total business-type activities $ 471,593,028 13,841,577 63,001,352 422,433,253 12,525,867
CITY OF INDEPENDENCE, MISSOURI
Notes to Financial Statements
June 30, 2021
Debt service requirements on long-term debt with schedules maturities at June 30, 2021 are as follows:
Acceleration Clauses
In the event of the City’s default on debt service payments, all TIF loans and business-type revenue bonds have acceleration clauses If 25% of the bondholders vote to enforce the acceleration clause then the full amounts of the outstanding principal and accrued interest are due immediately
65
Principal Interest Principal Interest Principal Interest Principal Interest 2022 $ 7,500 434,148 7,000 1,586 8,120,000 5,105,025 8,134,500 5,540,759 2023 1,310,000 434,148 8,000 1,175 4,775,000 5,168,237 6,093,000 5,603,560 2024 1,345,000 404,446 12,000 705 6,585,000 4,973,287 7,942,000 5,378,438 2025 1,385,000 369,897 6,655,000 4,632,426 8,040,000 5,002,323 2026 1,420,000 336,380 6,635,000 4,109,577 8,055,000 4,445,957 2027 - 2031 7,270,000 1,148,895 24,270,000 11,842,388 31,540,000 12,991,283 2032 - 2036 5,210,000 319,440 15,410,000 10,623,831 20,620,000 10,943,271 2037 - 2041 12,210,000 7,654,544 12,210,000 7,654,544 2042 - 2046 15,765,000 5,093,981 15,765,000 5,093,981 2047 - 2051 15,950,000 2,163,800 15,950,000 2,163,800 $ 17,947,500 3,447,354 27,000 3,466 116,375,000 61,367,096 134,349,500 64,817,916 Power and Light Water Sewer Events Center Principal Interest Principal Interest Principal Interest Principal Interest Principal Interest 2022 $ 4,210,000 5,773,713 1,695,000 820,363 2,280,000 3,993,331 1,650,000 3,632,906 9,835,000 14,220,313 2023 4,395,000 5,594,763 1,785,000 733,363 2,365,000 3,906,909 1,810,000 3,570,456 10,355,000 13,805,491 2024 4,625,000 5,407,863 1,880,000 652,938 2,470,000 3,805,006 1,970,000 3,507,969 10,945,000 13,373,776 2025 4,120,000 5,222,863 1,950,000 578,138 2,575,000 3,696,666 2,155,000 3,439,956 10,800,000 12,937,623 2026 4,285,000 5,055,263 2,035,000 498,438 2,685,000 3,590,128 2,355,000 3,365,431 11,360,000 12,509,260 2027 - 2031 24,290,000 22,400,202 10,895,000 1,061,869 15,170,000 16,196,900 19,905,000 15,138,944 70,260,000 54,797,915 2032 - 2036 29,925,000 16,503,493 18,935,000 12,426,900 33,030,000 9,712,388 81,890,000 38,642,781 2037 - 2041 32,505,000 8,570,688 24,235,000 7,136,244 21,990,000 1,627,350 78,730,000 17,334,282 2042 - 2046 28,135,000 3,336,100 17,655,000 1,162,238 45,790,000 4,498,338 $ 136,490,000 77,864,948 20,240,000 4,345,109 88,370,000 55,914,322 84,865,000 43,995,400 329,965,000 182,119,779 Total Business-type Activities Governmental Activities Total NID Payable Loans Payable TIF Loans
CITY OF INDEPENDENCE, MISSOURI
Notes to Financial Statements
June 30, 2021
(a) Governmental Activities
(1) Loans Payable
Governmental activities loans payable at June 30, 2021 is comprised of the following:
$67,500 (Osage Parcels 2, 3, 4 and 5) annual installments of $7,500 through 2022; interest at 0.00% - paid from the Tourism fund $ 7,500
$17,940,000 Lease Purchase for Deferred Maitenance, annual installments of $1,220,000 to $1,575,000; interest at 2.420% - paid from the Street Improvements Sales Tax fund
The total loans payable are privately placed.
(2) Neighborhood Improvement District
The Neighborhood Improvement District Bonds constitute a valid and legally binding indebtedness of the City, payable as to both principal and interest from special assessments to be assessed on certain real property within the District which will be benefited by the improvements and, if not so paid, from monies in the Bond Reserve Fund and, to the extent required, from first available moneys in the City’s general fund or other legally available fund. The full faith and credit of the City is irrevocably pledged for the prompt payment, when due, of the principal and interest on the Bonds; provided, however, the City is not obligated nor authorized to levy taxes for the purpose of paying principal of or interest on the Bonds and the taxing power of the City is not pledged to the payment of the Bonds.
Neighborhood Improvement District bonds payable at June 30, 2021 are comprised of the following:
$111,000 Series 2004 (Fall Drive Sanitary Sewer Project) annual installments of $5,000 to $6,000 through 2024; interest at 5.375% to 5.50% - paid from the Debt Service fund $ 27,000
Total Neighborhood Improvement District $ 27,000
66
17,940,000 Total Governmental Activities Loans Payable $ 17,947,500
CITY OF INDEPENDENCE, MISSOURI
Notes to Financial Statements
June 30, 2021
(3) Capital Lease Obligations
Capital leases payable at June 30, 2021 are comprised of the following: Motorola Solutions (radio equipment) semi-annual installments of $56,700 to $78,539 through 2022; interest at 3.4593% - paid from the General Fund with allocations to the Enterprise funds and Storm Water Sales Tax fund
PNC Equipment Finance (fire truck) annual installments of $51,525 to $71,106 through 2026; interest at 3.00% - paid from the Fire Sales Tax fund
Motorola Solutions (radio equipment) annual installments of $158,096 to $178,587 through 2027; interest at 2.48% - paid from the General fund and Police Sales Tax fund with allocations to the Enterprise funds and Storm Water Sales Tax fund
Caterpillar Financial Services (wheel loader) annual installments of $34,830 to $38,053 through 2025; interest at 3.025% - paid from the Street Improvements Sales Tax fund
The net book value of assets acquired under the capital leases described above amounted to $3,496,508 as of June 30, 2021.
The future minimum lease obligations and the net present value of these minimum lease payments as of June 30, 2021 were as follows:
ending June 30:
The capital lease obligations are privately placed.
67
$ 155,742
335,451
1,192,500
185,011 Total Capital Lease Obligations $ 1,868,704
Year
2022 $ 461,127 2023 301,333 2024 301,333 2025 301,333 2026 301,333 2027 187,670 2028 187,670 2,041,799 Less imputed interest (173,095) Present value of minimum lease payments $ 1,868,704
CITY OF INDEPENDENCE, MISSOURI
Notes to Financial Statements
June 30, 2021
(4) Blended Component Unit
(a) Tax Increment Financing Loans and Developer Obligations
The City’s tax increment financing loan (TIF loans) indebtedness is recorded as a liability of the TIF Commission to match revenue streams to the related debt for which they have been pledged. The obligation of the City and the Commission to pay principal and interest on these bonds is limited solely to the tax increment financing (TIF) revenues generated from each project, and in certain instances an annual appropriation pledge from the City.
The City and other taxing districts and governmental entities have pledged a portion of future property tax and sales tax revenues to repay principal and interest of $177.7 million in tax increment financing loans (TIF Loans) issued at various dates beginning in 1999 to finance redevelopment projects within each of the respective TIF plans. The loans are payable solely from the incremental increase in property taxes and sales taxes generated within the TIF plans. TIF revenues were projected to produce sufficient funds to meet debt service requirements over the life of the TIF loans. Should TIF revenues not be sufficient to meet the required debt service obligations, neither the City nor the Commission is obligated to make such loan payments from any other sources of its revenues. However, the City intends to annually appropriate funds sufficient to make all payments required by the bonds for the next fiscal year. During this fiscal year, the City did not use any of the City’s general, sales tax, or proprietary funds to make up deficiencies in loan payments, and management anticipates the same for the next fiscal year.
Developer obligations represent developer project costs that have been certified by the City as eligible for reimbursement from tax increment financing revenues attributable to each respective project. Under tax increment financing plans, the developer may be reimbursed up to the certified cost amount from incremental taxes during a period not to exceed 23 years. TIF revenues were projected to produce sufficient funds to reimburse the developer for certified costs. The developer obligations are limited solely to the amount of incremental taxes received attributable to each respective project; any deficiencies are the sole responsibility of the developer and do not constitute an obligation of the Commission or of the City. For the fiscal year ended June 30, 2019, the City re-evaluated GASB Statement No. 48, Sales and Pledges for Receivables and Future Revenues and Intra-Entity Transfer of Assets and Future Revenues, and determined it was appropriate to remove the reported liability for long-term TIF developer obligations.
Although not recorded as a liability, the outstanding TIF developer obligations at June 30, 2021 were:
68
TIF Project Obligations RSO - Cargo Largo $ 966,462 North Independence 1,688,583 Mount Washington 68,852 Falls at Crackerneck - Bass Pro 5,350,000 Old Landfill - Stone Canyon 8,132,297 Cinema East - Blue Ridge 3,434,682 Trinity 2,947,978 HCA - Centerpoint 358,036 23rd & Noland - Project 2 267,300 Little Blue Parkway 1 1,167,511 Little Blue Parkway 3 1,452,070 Marketplace Shopping Center 1 790,000 Marketplace Shopping Center 2 3,672,682 $ 30,296,453
CITY OF INDEPENDENCE, MISSOURI
Notes to Financial Statements
June 30, 2021
At June 30, 2021, total principal and interest remaining on the loans was $177.7 million and the outstanding developer obligations were $30.3 million. The loans are scheduled to mature at varying amounts through 2051 and the developer obligations are payable to the extent incremental taxes are available for a period not to exceed 23 years.
For the current year, principal and interest paid on TIF loans and developer obligations totaled $15.0 million, excluding refunding transactions. Incremental revenues from the City included $4.7 million in sales taxes and $1.0 million in property taxes. The remaining funds necessary to meet the current year debt service requirements were derived from incremental tax revenues and other sources from other taxing districts and governmental entities, City and developer contributions, cash reserves, and debt trust funds.
69
CITY OF INDEPENDENCE, MISSOURI
Notes to Financial Statements
June 30, 2021
Missouri Development Finance Board Loans Payable
$12,050,000 Series 2012 D (HCA - Centerpoint TIF) annual installments of $575,000 to $1,865,000 through 2027; interest at 3.00% to 4.00%
$3,965,000 Series 2012 E (Eastland Center TIF) annual installments of $310,000 to $805,000 through 2022; interest at 2.00% to 3.00%
Series 2014 A (Eastland Center TIF) annual installments of $500,000 to $1,095,000 through 2022; interest at 3.000%
$2,030,000 Series 2014 B (HCA - Centerpoint TIF) annual installments of $105,000 to $495,000 through 2027; interest at 2.000% to 4.000%
Series 2015 A (Santa Fe TIF) annual installments of $100,000 to $285,000 through 2044; interest at 3.000% to 4.000%
Series 2015 B (Santa Fe TIF) annual installments of $55,000 to $215,000 through 2044; interest at 3.000% to 5.250%
$47,060,000 Series 2015 C (Crackerneck Creek TIF) annual installments of $1,200,000 to $5,670,000 through 2045; interest at 3.000% to 5.000%
Series 2015 D (Crackerneck Creek TIF) annual installments of $1,180,000 to $1,210,000 through 2024; interest at 2.750% to 3.000%
Series 2016 B (HCA - Centerpoint TIF) annual installments of $970,000 to $2,865,000 through 2028; interest at 3.000% to 5.000%
Series 2017 A (Eastland Center TIF) annual installments of $1,820,000 to $2,080,000 through 2022; interest at 5.000%
Series 2021 (Crackerneck Creek TIF) annual installments of $75,000 to $5,485,000 through 2051; interest at 3.000% to 5.000%
Restricted assets held in trust accounts of $11,174,732 consist of funds available for costs related to the redevelopment of the Santa Fe, Eastland Center, Crackerneck Creek and HCA areas.
70
6,175,000
$
805,000 $4,855,000
1,095,000
1,230,000 $5,225,000
4,550,000 $3,545,000
3,150,000
47,060,000 $2,390,000
2,390,000 $17,275,000
11,920,000 $9,725,000
2,080,000 $35,920,000
35,920,000 Total TIF Loans Payable
116,375,000
$
CITY OF INDEPENDENCE, MISSOURI
Notes to Financial Statements
June 30, 2021
(1) Tax Increment Financing Refunding and Advance Refunding
On June 7, 2021, the City entered into a loan payable through the Missouri Development Finance Board of $35,920,000 with an interest rate of 3.00% to 5.00% to refund $14,030,000 of the outstanding Crackerneck Creek TIF project 2006 B series, with interest rates ranging from 5.30% to 6.00% and $10,835,000 of the 2013 B series, with an interest rate of 4.125% and to advance refund $13,905,000 of the 2013 A series, with interest rates ranging from 4.693% to 4.993%. The acquisition of the new refunding loan carried a premium of $4,689,862 and resulted in a deferred charge on refunding of $4,939,820. Both items will be amortized over the life of the bonds. This advance refunding was undertaken to reduce the total debt service payments by $13,167,127 which resulted in an economic gain of $1,694,910.
(2) Tax Increment Financing Defeasance of Debt
On June 23, 2021, the City defeased $415,000 of the outstanding 2016 C Drumm Farm TIF project loans payable, with interest an interest rate of 3.00% by placing funds in an irrevocable trust to provide for all future debt service payments on the loans. Accordingly, the trust account assets and the liability for the defeased loans are not included in the City’s financial statements.
(3) Tax Increment Financing Prior Year Defeasance of Debt
In prior years, the City defeased certain loans payable with the Missouri Development Finance Board by placing the proceeds of refunding TIF loans in an irrevocable trust to provide for all future debt service payments on the old loans. Accordingly, the trust account assets and the liability for the defeased loans are not included in the City’s financial statements. At June 30, 2021, there are no loans payable balances outstanding of previously defeased debt
(b) Bass Pro Lease
On October 18, 2004, the City approved the Crackerneck Creek Tax Increment Financing (TIF) Plan. The Crackerneck Creek TIF Plan provides for the development and construction of a proposed 450,000 square foot commercial retail center. The Crackerneck Creek Project (the Project) is scheduled to include (i) the Bass Pro Store described below, (ii) a minimum of 300,000 square feet of additional retail space and (iii) a hotel. In January 2010, a 55,000 square foot Hobby Lobby opened and in late 2009 a 23,000 square foot Mardel opened. During early 2011, an 8,000 square foot Cheddar’s Restaurant opened. In March 2015, Stoney Creek Hotel & Conference Center opened with 167 guest rooms and 30,000 square feet of conference space. The City and the developer remain in discussions regarding securing additional retail development for the project. However, no additional agreements exist requiring any retailers to open for business in the Crackerneck Creek Redevelopment Area other than Bass Pro.
As part of the Project, the City has entered into the Lease Agreement (as amended from time to time, the “Bass Pro Lease”) with Bass Pro Outdoor World L.L.C. (“Bass Pro”). Pursuant to the Bass Pro Lease the City will own a 150,000 square foot Bass Pro retail store (the “Bass Pro Store”) and will lease the Bass Pro Store to Bass Pro under the terms and conditions as contained in the Bass Pro Lease. Under the Bass Pro Lease, the City was obligated to make $25,000,000 available to Bass Pro. This amount was funded from the proceeds of the Series 2006A Bonds. The Bass Pro Store is located on an approximate 20-acre parcel owned by the City.
The initial term of the Bass Pro Lease is 20 years. Bass Pro has various renewal options under the lease agreement. During the initial 20-year term, Bass Pro is required to pay the City “Percentage Rent” rent
71
CITY OF INDEPENDENCE, MISSOURI
Notes to Financial Statements
June 30, 2021
equal to 2% of “Gross Sales” as defined in the Bass Pro Lease except that the “Minimum Percentage Rent” will not be less than of $1,000,000 during each year of the initial term. During any of the nine one-year renewal options, Bass Pro will pay rent equal to $10 per year provided the TIF bond financing provided by the City in a maximum of $35,000,000 has been paid in full, or until the expiration of the third one-year renewal option (whichever occurs first), Bass Pro shall be obligated to pay $1,000,000 per year to the City. During any of the three five-year renewal options, Bass Pro will pay rent equal to 1% of “Gross Sales” as defined in the lease agreement
A summary of the minimum rental payments due for this operating lease are as follows:
Under the Bass Pro Lease, Bass Pro has the option to purchase the Bass Pro Store at the expiration of the 20-year initial term and at the expiration of any renewal option for a purchase price equal to 90% of the fair market value thereof as determined by an appraisal.
Also under the Lease the City constructed an approximate 15-acre lake and an additional wilderness habitat area of approximately 15 acres. The City park includes a waterfall and presents a unique natural setting. The City also constructed 600 parking spaces adjacent to the Bass Pro Store.
72
Calendar Year Amount 2021 $ 1,000,000 2022 1,000,000 2023 1,000,000 2024 1,000,000 2025 1,000,000 2026 1,000,000 Total $ 6,000,000
CITY OF INDEPENDENCE, MISSOURI
Notes to Financial Statements
June 30, 2021
(b) Business-Type Activities
(1) Revenue Bonds
Revenue bonds payable at June 30, 2021 are comprised of the following individual issues:
and Light Fund:
$55,185,000 Series 2012 A annual installments of $150,000 to $11,900,000 through 2037; interest at 2.00% to 5.00%
2012 F annual installments of $140,000 to $3,630,000 through 2037;
2016 D annual installments of $4,505,000 to $6,060,000 through
$36,240,000 Series 2013 D annual installments of $1,480,000 to $4,260,000 through 2029; interest at 2.00% to 5.00%
Series 2012 B annual installments of $745,000 to $2,220,000 through 2041; interest at 2.00% to 5.00% - subsequent to year end these were refunded on Series 2021 A
$43,800,000 Series 2013 C annual installments of $250,000 to $2,855,000 through 2042; interest at 2.00% to 5.25% - subsequent to year end these were refunded on Series 2021 B
$21,170,000 Series 2014 C annual installments of $250,000 to $6,150,000 through 2043; interest at 2.00% to 5.00%
$11,815,000 Series 2011 A annual installments of $70,000 to $1,585,000 through 2038; interest at 2.00% to 5.50% - subsequent to year end these were refunded on Series 2021 C
$68,945,000 Series 2012 C annual installments of $105,000 to $12,540,000 through 2038; interest at 2.00% to 4.00%
$12,005,000 Series 2016 A annual installments of $400,000 to $710,000 through 2038; interest at 3.00%
73
Power
$ 52,610,000 $52,525,000
interest at 3.00% to 4.00% 36,700,000 $47,180,000
interest
47,180,000 Total Power and Light Fund 136,490,000 Water
20,240,000 Total Water Fund 20,240,000 Sanitary Sewer Fund: $37,035,000
30,430,000
Series
Series
2046;
at 3.375% to 4.00%
Fund:
38,665,000
19,275,000 Total Sanitary Sewer Fund 88,370,000 Events
Center Fund:
10,815,000
64,230,000
9,820,000 Total
84,865,000 Total
$ 329,965,000
Events Center Fund
Revenue Bonds
CITY OF INDEPENDENCE, MISSOURI
Notes to Financial Statements
June 30, 2021
The power and light revenue bond ordinance and the water revenue bond indenture require that the systems be accounted for in separate enterprise funds. They also require that after sufficient current assets have been set aside to operate the systems, all remaining monies held in the funds be segregated and restricted in separate special reserves and accounts in the following sequences:
Account Restriction
Principal and interest
For the monthly accumulation of monies to meet the maturing revenue bond principaland-interest requirements
Depreciation and emergency (water only) For the accumulation of $500,000 to finance emergency repairs and system improvements
Surplus account monies are reflected as unrestricted cash. The above required reserves and other reserves are reported in the accompanying statement of net position as restricted assets as follows:
Various bond ordinances and indentures contain significant limitations and restrictions on annual debt service requirements, maintenance of and flow of monies through various restricted accounts, minimum amounts to be maintained in various sinking funds, and minimum revenue bond coverage. The City is in compliance with all such financial limitations and restrictions
(a) Defeasance of Debt
On March 11, 2021, the City defeased $10,615,000 of the outstanding 2010 B Power and Light revenue bonds, with interest rates of 2.00% to 5.25%, with a full redemption Accordingly, the trust account assets and the liability for the defeased bonds are not included in the City’s financial statements.
74
Power and Sanitary Events Account Light Water Sewer Center Principal and interest $ 14,328,468 Depreciation and emergency 500,000 Bond reserve and project accounts 2,584,314 6,897,363 6,846,966 Total revenue bond reserves 14,328,468 3,084,314 6,897,363 6,846,966 Customer deposits 2,936,892 807,139 611,757 Purchase of Dogwood Plant 61,500 Southwest Power Pool collateral 893,607 Total $ 18,220,467 3,891,453 7,509,120 6,846,966 Enterprise Funds
CITY OF INDEPENDENCE, MISSOURI
Notes to Financial Statements
June 30, 2021
(b) Pledged Revenues
The Power and Light and Water Bonds are secured by a pledge of revenues, net of specified operating expenses to repay revenue bonds issued. The pledged revenue information for June 30, 2021 is as follows:
(2) Letter of Credit
The City maintains a letter of credit for $800,000 with a bank, which serves as collateral for the Power and Light fund to participate in the Southwest Power Pool’s (SPP) Transmission Congestion Rights Markets (TCR). The TCR Market provides financial rights used to hedge against the day-ahead market transmission congestion between two locations. As of June 30, 2021, the City has not utilized the letter of credit.
(3) Events Center Bonds
The Events Center Bonds (Bonds) are secured by a pledge of certain community improvement district sales taxes (CID sales taxes) and related Tax Increment Financing (TIF) revenues generated within the Independence Events Center Community Improvement District (District) boundaries. In addition, the Bonds include an annual appropriation covenant pursuant to which the City agrees to budget and appropriate sufficient funds to meet the scheduled debt service requirements of the Bonds should the CID sales taxes and TIF revenues not be sufficient to do so For the year ended June 30, 2021, District revenues paid to the City for debt service totaled $5,018,054 The remaining debt service amounts of $191,662 were funded from capitalized interest funds that were established at the time the Bonds were
75
Principal Principal Net Available Date Revenue Term of & Interest & Interest Revenues Issued Description Purpose of Debt Pledged Commitment Remaining 2020 - 2021 2020 - 2021 11/2010 Power and Light Leasehold Revenue Bonds Electric System Projects Appropriated Revenues through 2035 $ 544,487 03/2012 Power and Light Revenue Bonds Electric System - Dogwood Appropriated Revenues through 2037 81,415,953 3,630,219 12/2012 Power and Light Leasehold Revenue Bonds - Refunding Electric System Projects Appropriated Revenues through 2037 47,648,800 4,570,350 09/2016 Power and Light Leasehold Revenue Bonds Electric System Projects Appropriated Revenues through 2046 85,290,195 1,789,994 $ 214,354,948 10,535,050 22,440,039 11/2013 Water Revenue BondsRefunding Water System Improvements Appropriated Revenues through 2029 24,585,109 2,525,338 $ 24,585,109 2,525,338 12,550,966 08/2012 Sewer System Revenue Bonds Sewer System Improvements Appropriated Revenues through 2041 47,809,047 2,277,556 09/2013 Sewer System Revenue Bonds Sewer System Improvements Appropriated Revenues through 2042 64,403,744 2,924,500 11/2014 Sewer System Revenue Bonds Sewer System Improvements Appropriated Revenues through 2043 32,071,531 1,073,575 $ 144,284,322 6,275,631 17,589,650
CITY OF INDEPENDENCE, MISSOURI
Notes to Financial Statements
June 30, 2021
issued. Management does not anticipate that any of the City’s general funds will be required to make up any deficiency in payments during the next fiscal year
(8) Advances for Construction
As new developments are constructed, the Power and Light (Enterprise) Fund requires a nonrefundable cash payment from a customer or developer to be paid toward the cost of extending the distribution system, installation of street lights, and other additions or modifications solely for the benefit of the customer or developer. The advances for construction at June 30, 2021, were $179,765.
As new additions to the water distribution system are constructed, the Water (Enterprise) Fund requires the developer or wholesaler to advance the estimated cost of the water main extension or improvement. Upon project completion, any excess of the advance over the project cost is refunded to the developer or wholesaler or vice versa. The advances for construction at June 30, 2021, were $167,798
(9) Employee Retirement System Plan Description
The City’s defined benefit pension plan provides certain retirement, disability and death benefits to plan members and beneficiaries. The City participates in the Missouri Local Government Employees Retirement System (LAGERS). LAGERS is an agent multiple-employer, statewide public employee pension plan established in 1967 and administered in accordance with RSMo. 70.600-70.755. As such, it is LAGERS responsibility to administer the law in accordance with the expressed intent of the General Assembly. The plan is qualified under the Internal Revenue Code Section 401(a) and is tax exempt. The responsibility for the operations and administration of LAGERS is vested in the LAGERS Board of Trustees consisting of seven persons. LAGERS issues a publicly available financial report that includes financial statements and required supplementary information. This report may be obtained by accessing the LAGERS website at www molagers.org.
Benefits Provided
LAGERS provides retirement, death and disability benefits. Benefit provisions are adopted by the governing body of the City, within the options available in the state statutes governing LAGERS. All benefits vest after 5 years of credited service. Employees who retire on or after age 60 (55 for Police and Fire) with 5 or more years of service are entitled to an allowance for life based upon the benefit program information provided below. Employees may retire with an early retirement benefit with a minimum of 5 years of credited service and after attaining age 55 (50 for Police and Fire) and receive a reduced allowance.
Valuation
76
2021
Benefit Multiplier 2.00% Final Average Salary 3 Years Member Contributions 4.00%
CITY OF INDEPENDENCE, MISSOURI
Notes to Financial Statements
June 30, 2021
Benefit terms provide for annual post retirement adjustments to each member’s retirement allowance subsequent to the member’s retirement date. The annual adjustment is based on the increase in the Consumer Price Index and is limited to 4.00% per year.
Employees Covered by Benefit Terms
At June 30, 2021, the following employees were covered by the benefit terms:
Contributions
Effective November 1, 2009, the City’s LAGERS benefit program changed from LT-8(65) to L-6 with employees contributing 4.00% of gross salaries and wages The City is required to contribute amounts at least equal to the actuarially determined rate, as established by LAGERS. The actuarially determined rate is the estimated amount necessary to finance the cost of benefits earned by employees during the year, with an additional amount to finance an unfunded accrued liability. Full-time employees of the City contribute 4.00% of their gross pay to the pension plan. The City contribution rates for the year ending June 30, 2021 were 19 30% (General), 20.50% (Police), and 19 70% (Fire) of annual covered payroll
Net Pension Liability (Asset)
The City’s net pension liability (asset) was measured as of June 30, 2021, and the total pension liability used to calculate the net pension liability (asset) was determined by an actuarial valuation as of February 28, 2021 Standard update procedures were used to roll forward the total pension liability (asset) to June 30, 2021.
Actuarial Assumptions
The total pension liability in the February 28, 2021 actuarial valuation was determined using the following actuarial assumptions, applied to all periods included in the measurement:
Inflation
Salary Increase
Investment rate of return
2 25% price inflation; 2 75% wage inflation
2.75% to 7.15% including wage inflation
7.00%, net of investment expenses
The healthy retiree mortality tables, for post-retirement mortality, were 115% of the PubG-2010 Retiree Mortality Table for males and females. The disabled retiree mortality tables, for post-retirement mortality, were 115% of the PubNS-2010 Disabled Retiree Mortality Table for males and females. The preretirement mortality tables used were 75% of the PubG-2010 Employee Mortality Table for males and females of General groups and 75% of the PubS-2010 Employee Mortality Table for males and females of Police, Fire, and Public Safety groups.
77
Retirees and beneficiaries currently receiving benefits 1,170 Inactive employees entitled to but not yet receiving benefits 226 Active employees 941 2,337
CITY OF INDEPENDENCE, MISSOURI
Notes to Financial Statements
June 30, 2021
Mortality rates for a particular calendar year are determined by applying the MP-2020 mortality improvement scale to the above described tables.
The long-term expected rate of return on pension plan investments was determined using a model method in which the best-estimate ranges of expected future real rates of return (expected returns, net of investment expenses and inflation) are developed for each major asset class. These ranges are combined to produce the long-term expected rate of return by weighting the expected future real rates of return by the target asset allocation percentage and by adding expected inflation. The target allocation and best estimates of arithmetic real rates of return for each major asset class are summarized in the following table:
Target Long-Term Expected
Discount Rate
The discount rate used to measure the total pension liability (asset) is 7.00%. The projection of cash flows used to determine the discount rate assumes that the City and employee contributions will be made at the rates agreed upon for employees and the actuarially determined rates for the City. Based on these assumptions, the pension plan’s fiduciary net position was projected to be available to pay all projected future benefit payments of current active and inactive employees. Therefore, the long-term expected rate of return on pension plan investments was applied to all periods of projected benefit payment to determine the total pension liability.
78
Asset Class Allocation Real Rate of Return Alpha 15.00% 3.67% Equity 35.00% 4.78% Fixed Income 31.00% 1.41% Real Assets 36.00% 3.29% Strategic Assets 8.00% 5.25% Cash/Leverage -25.00% -0.29%
CITY OF INDEPENDENCE, MISSOURI
Notes to Financial Statements
June 30, 2021
Changes in the Net Pension Liability (Asset)
The following table shows the components of the changes in the net pension liability (asset) for the year:
During the year, the net pension shifted from a liability to an asset due to changes in the mortality tables and significant net investment income.
Sensitivity of the Net Pension Liability (Asset) to Changes in the Discount Rate
The following presents the Net Pension Liability (Asset) of the City, calculated using the discount rate of 7.00%, as well as what the employer’s Net Pension Liability (Asset) would be using a discount rate that is one percentage point lower at 6.00% or one percentage point higher at 8.00% than the current rate.
79
Total Pension Plan Fiduciary Net Pension Liability Net Position Liability (Asset) (a) (b) (a) - (b) $ 560,200,441 465,624,384 94,576,057 8,835,703 8,835,703 39,838,559 39,838,559 (2,691,753) (2,691,753) Changes in assumptions (12,909,211) (12,909,211) 14,363,011 (14,363,011) 2,963,990 (2,963,990) 126,631,520 (126,631,520) (30,623,078) (30,623,078) (232,953) 232,953 3,128,373 (3,128,373) Net Changes 2,450,220 116,230,863 (113,780,643) $ 562,650,661 581,855,247 (19,204,586)
Increase (Decrease) Balances at 6/30/2020 Changes for the Year: Service Cost Interest Balances at 6/30/2021 Contributions - Employer Contributions - Employee Net Investment Income Benefit Payments, Including Refunds Administrative Expense Other (Net Transfer)
Difference Between Expected and Actual Experience
1% Decrease Rate Assumption 1% Increase 6.00% 7.00% 8.00% Net Pension Liability (Asset) $ 55,049,945 (19,204,586) (81,092,790)
Single Discount
Current
CITY OF INDEPENDENCE, MISSOURI
Notes to Financial Statements
June 30, 2021
Pension Expense and Deferred Outflows of Resources and Deferred Inflows of Resources Related to Pensions
For the year ended June 30, 2021 the City recognized a reduction to pension expense of $12,577,465. The City reported deferred outflows and inflows of resources related to pensions from the following sources:
Difference between expected & actual plan experience
Changes in assumptions
Difference between expected & actual investment earnings
Amounts reported as deferred outflows and inflows of resources related to pensions will be recognized in pension expense as follows:
Certain deferred inflows and outflows of resources are being amortized over a closed period equal to the average of the expected service lives of all employees as of the beginning of the measurement periods The differences on investment returns are being amortized over a closed 5-year period, beginning at the start of each measurement period
(10) Post-Employment Health Benefits
In addition to the pension benefits described in Note (9), the City provides post-employment healthcare benefits to all retired employees meeting the service criteria for this benefit. From an accrual accounting perspective, the cost of post-employment healthcare benefits, like the cost of pension benefits, generally should be associated with the periods in which the cost occurs, rather than in a future year when it actually will be paid.
80
Deferred Deferred Outflows Inflows of Resources of Resources $ 5,253,457 (4,343,417) 372,139 (10,182,244) (60,834,647) Total $ 5,625,596 (75,360,308)
Ended: 2022 $ (18,544,431) 2023 (14,971,894) 2024 (15,750,938) 2025 (19,833,124) 2026 (531,693) Thereafter (102,632) $ (69,734,712)
Year
CITY OF INDEPENDENCE, MISSOURI
Notes to Financial Statements
June 30, 2021
Plan Description
The City’s defined benefit OPEB plan, a single–employer health care plan provides OPEB for all active and retired employees and their eligible dependents. The plan is administered by the City and the City Council has the authority to establish or amend the plan provisions or contribution requirements at any time. No assets are accumulated in a trust that meets the criteria in paragraph 4 of GASB Statement No. 75. The plan does not issue a stand-alone financial report.
Benefits Provided
The City provides for a continuation of medical, prescription drug, hearing and vision insurance benefits to retired employees who participate in the Missouri Local Government Employees Retirement System (LAGERS). The benefits for pre-Medicare retirees are self-insured by the City, and administered through Cigna (Open Access Plan 1 and 2). The benefits for Medicare retirees are covered under a fully-insured, stand-alone plan.
Contributions
Coverage is available for the lifetime of the retiree and their spouses upon payment of required retiree contribution premiums which includes an adjustment when the retiree becomes eligible to participate in the Medicare program. The City establishes rates based upon an actuarially determined rate. The contribution requirement for plan members is split between the retiree and the City at percentages that are comparable to active City employees, and may be amended at any time by the City Council. For the year ended June 30, 2021, the premiums were split as follows:
The number of participants that either are, or potentially could be, covered by the City’s plan, as of January 1, 2021, which is the effective date of the current OPEB actuarial valuation, is listed below. There have been no significant changes in the number of covered participants or the type of coverage since that date.
81
Retiree City Insurance Plan Premium Premium Open Access Plan 1 20.00% 80.00% Open Access Plan 2 18.00% 82.00% Medicare Stand-Alone Plan 20.00% 80.00%
Participants
Active Employees (not including dependents) 864 Retirees or surviving spouses (not including dependents) 865 Total Participants 1,729
CITY OF INDEPENDENCE, MISSOURI
Changes in the Total OPEB Liability
June 30, 2021
The following table shows the components of the changes in the total OPEB liability for the year:
The change in assumptions & inputs is the result of the change in the discount rate.
The City’s total OPEB liability of $236,333,592 was determined using the following actuarial assumptions and other inputs, applied to all periods included in the measurement, unless otherwise specified: Valuation Date January 1, 2021, rolled forward to June 30, 2021
June 30, 2021
The discount rate was based on the average of the published yields from the S & P Municipal Bond 20 Year High Grade and the Fidelity GO AA-20 Year Indexes
2.00%
3.00%
6.50% decreasing annually until 4.50% is reached
Retirees must contribute a stipulated percentage of the plan premiums to maintain coverage. The monthly contribution rates as of January 1, 2021 served as a starting point for the valuation, and were assumed to increase at the same rate of health care costs in the future. Effective January 1, 2020, the Medicare eligible retirees will be covered under a fully-insured, stand-alone program. Retirees will still be required to contribute a stipulated percentage of the plan premiums to this program.
The mortality rates were based on the Society of Actuaries Pub-2010 Public Retirement Plans Headcount - Weighted General and Public Safety Mortality Tables with Scale MP-2021 Full Generational Improvement
Notes to Financial Statements
82
OPEB Liability Changes Total OPEB Liability - Beginning
year $ 204,525,153 Service Cost 5,402,186 Interest Cost 5,359,428 Changes in Benefit Terms Difference between actual & expected experience 9,050,839 Changes in assumptions & inputs 19,586,986 Employer Contributions (Benefit Payments) (7,591,000) Net Changes 31,808,439 Total OPEB Liability - End of the year $ 236,333,592 Covered payroll 61,410,210 Total OPEB liability as a % of covered payroll 384.84%
of the
Total OPEB Liability
Measurement Date
Discount Rate
Measurement
2.00%
Date
2.60% Year Preceding Measurement Date
Salary
Scale
Actuarial
Inflation
Cost Method Entry Age - Level Percent-of-Pay
Healthcare
Cost Trend Rate
Retiree's Share of Benefit Related Costs
Mortality Rates
CITY OF INDEPENDENCE, MISSOURI
Notes to Financial Statements
June 30, 2021
Sensitivity of the Total OPEB Liability to Changes in the Discount Rate
The following presents the total OPEB liability of the City, calculated using the discount rate of 2 00%, as well as what the total OPEB liability would be using a discount rate that is one percentage point lower at 1 00% or one percentage point higher at 3 00% than the current rate
Current Single Discount
The following presents the total OPEB liability of the City, calculated using the current healthcare cost trend rates as well as what the City’s total OPEB liability would be if it were calculated using a trend rate that is one percentage point lower or one percentage point higher than the current trend rates of 6.50% decreasing annually to 4.50% in 2029.
Current Healthcare Cost Trend Rate
OPEB Expense and Deferred Outflows and Inflows of Resources Related to OPEB
For the year ended June 30, 2021, the City recognized OPEB expense of $20,885,346 At June 30, 2021, the City reported deferred outflows and inflows of resources related to OPEB from the following sources:
Amounts currently reported as deferred outflows and inflows of resources related to OPEB will be recognized in OPEB expense over the average remaining service lives of plan participants (actives and retirees) as follows:
83
1% Decrease Rate Assumption 1% Increase 1.00% 2.00% 3.00% Total OPEB Liability $ 281,167,902 236,333,592 201,489,026
1% Decrease Current 1% Increase 5.50% Trend Rate 6.50% 7.50% Total OPEB Liability $ 197,626,882 236,333,592 287,281,905
Deferred Outflows Deferred Inflows of Resources of Resources Difference between expected and actual experience $ 11,316,819 (1,536,954) Changes in assumptions 28,020,894 Total $ 39,337,713 (1,536,954)
Fiscal Year Ending Amount 2022 $ 10,123,732 2023 9,902,107 2024 8,760,962 2025 6,410,518 2026 2,603,440 $ 37,800,759
CITY OF INDEPENDENCE, MISSOURI
Notes to Financial Statements
June 30, 2021
(11) Risk Management
The City is exposed to various risks of loss related to torts; theft of, damage to, and destruction of assets; errors and omissions; injuries to employees; and natural disasters. As a result, there are a number of claims and/or lawsuits to which the City is a party as a result of certain law enforcement activities, injuries, and various other matters and complaints arising in the ordinary course of City activities. The City is entitled to the defense of sovereign and official immunity against tort action that provides immunity except in two areas -- motor vehicles and dangerous conditions of property of governmental entities. The City carries commercial property, boiler and machinery, liability, and flood insurance, and settlements of covered claims have not exceeded insurance limits for each of the past three fiscal years. The City also carries automobile physical damage with varying deductibles as well as large contactors equipment.
Up until March 31, 2019, the City was a member of the Missouri Public Entity Risk Management Fund (MOPERM), which is a risk pool that provides liability protection to participating Missouri public entities, their officials, and employees. Coverage lines included law enforcement liability, general liability, public official errors and omissions liability, and automobile liability. The City joined MOPERM in 1987. This liability insurance program transfers the risk of liability claims up to the State’s Sovereign Immunity Statute coverage limits. MOPERM has the authority to assess members for any deficiencies of revenues under expenses for any single plan year, and MOPERM had no deficiencies in any of the past three fiscal years.
Beginning April 1, 2019, the City left MOPERM and joined the States Risk Retention Group, which is a member-owned company providing excess liability insurance to cities, counties, school districts, and other public entities across the country. States is a Risk Retention program whereby the City assumed the first $200,000 of each liability occurrence for the 2020-21 policy year. This amount increases to the desired $250,000 deductible per claim for the 2021-22 policy year. The liability limits are $10,000,000 each occurrence/policy aggregate.
The City is self-insured for workers' compensation and purchased excess coverage for workers' compensation claims in excess of $1,500,000 per accident for the 2020-21 policy year In order to maintain this self-insured status for workers compensation, the State of Missouri requires the City to maintain a surety bond in the amount of $2,320,000 and an escrow account in the amount of $200,000. The escrow account of $200,000 is reflected as restricted assets in the Workers' Compensation Fund. Estimated workers' compensation claims incurred but not reported are accrued as liabilities in the City's Workers' Compensation Fund.
The City offers its employees and retirees contributory self-insurance healthcare plans (Staywell Open Access Plan 1, Staywell Open Access Plan 2, and the Post-65 Retiree Medicare Plan). An excess coverage insurance policy covers the portion of specific claims in excess of $275,000 and aggregate claims in excess of $24,325,904 for the open access plan and for the in-network plan. The City’s share of the premiums for this employee and retiree benefit was $16,432,951. For the Staywell Health Care Plan, the premiums paid by the City are recorded as expenditures/expenses of the various funds and premium revenue in the Staywell Health Care (Internal Service) Fund. Incurred but not reported medical, vision, and prescription claims are accrued as a liability in the Internal Service Fund. For the Post-65 Retiree Medicare Plan, the premiums paid by the City are recorded as expenditures/expenses of the various funds and remitted to Cigna.
84
CITY OF INDEPENDENCE, MISSOURI
Notes to Financial Statements
June 30, 2021
Changes in the balances of the workers’ compensation and health care claims liability during the last two years are as follows:
Claims Payable
Workers' Compensation
(12) Commitments and Contingencies
Construction Commitments
At June 30, 2021, the City had commitments of approximately $16.0 million to complete construction contracts. Of this amount, $10.8 million relates to the enterprise funds. The commitments for the governmental funds will be funded through sales tax and grant funding. The commitments for the enterprise funds will be funded through operating revenues and/or bond proceeds.
Purchase/Sales of Capacity and Energy
The City purchases a portion of its power supply needs under seven long-term purchase agreements: a participation power agreement with Omaha Public Power District (OPPD), a participation power agreement with Missouri Joint Municipal Electric Utility Commission (MJMEUC), a renewable energy purchase agreement with Smoky Hills Wind Project II, LLC (Smoky Hills), a renewable energy purchase agreement with Marshall Wind Energy LLC (Marshall Wind), two renewable energy purchase agreements with MCP-Independence LLC (MCP), and a capacity agreement with Oneta Power, LLC.
In January 2004, the City entered into a participation power agreement with OPPD. Under this agreement, the City purchases an 8.33% share (approximately 57 megawatts) of a 682 megawatt coal-fired baseload generating unit at OPPD’s existing Nebraska City power station site (Nebraska City Unit 2). The agreement provides that OPPD is the owner/operator of the unit and OPPD sells the City’s share of the output on a cost-based approach. OPPD issued tax-exempt bonds to pay for the construction of the unit and the City is obligated to pay its proportionate share of the debt service on the bonds, the fixed operation and maintenance costs, the variable operating costs including fuel and renewals and replacements of the unit. The unit began commercial operation on May 1, 2009. The term of the agreement is 40 years from the commercial operation date and can be extended by the City for the life of the proposed unit. The future minimum payments (City’s portion of the debt service) are approximately $126,600,000 through the year 2049. During fiscal year 2021, the delivered cost of capacity and energy under the agreement, including all demand, energy, and debt service was approximately $14,800,000 for 390,633 megawatt-hours of wholesale energy. For fiscal year 2022, the projected costs under the agreement are estimated to be approximately $17,000,000.
85
Staywell 2020 2021 2020 2021 Beginning of year $ 7,701,309 7,845,090 2,195,626 2,049,300 Current year claims and changes in estimates 7,492,773 4,015,936 21,318,990 19,767,696 Claims payments (7,348,992) (3,042,353) (21,465,316) (20,171,326) End of year $ 7,845,090 8,818,673 2,049,300 1,645,670
CITY OF INDEPENDENCE, MISSOURI
Notes to Financial Statements
June 30, 2021
In June 2006, the City entered into a unit power purchase agreement with MJMEUC. Under this agreement, the City purchases a 50% share (approximately 53 megawatts) of MJMEUC’s 106 MW ownership share of the nominal 875 megawatt Iatan 2 coal-fired generating unit located at Kansas City Power & Light Company’s (KCPL) existing power station site in Weston, Missouri. The agreement provides that MJMEUC sells the City’s share of the output on a cost-based approach. MJMEUC issued tax-exempt bonds to pay for its share of the construction of the unit and the City is obligated to pay its share of the debt service on the bonds, the fixed operation and maintenance costs, the variable operating costs including fuel, renewals and replacements of the unit and related administrative costs incurred by MJMEUC. The unit began commercial operations on December 31, 2010. The term of the agreement is 40 years from the commercial operation date and can be extended by the City for the life of the proposed unit. The future minimum payments (City’s portion of the debt service) are approximately $154,000,000 through the year 2038. During fiscal year 2021, the delivered cost of capacity and energy under the agreement, including all demand, energy, and debt service was approximately $19,200,000 for 266,817 megawatt-hours of wholesale energy. For fiscal year 2022, the projected costs under the agreement are estimated to be approximately $20,000,000.
In August 2008, the City entered into a renewable energy purchase agreement with Smoky Hills. Under this agreement, the City purchases a 10.10% share (15 megawatts) of a 148.5 megawatt wind farm generation project located in north-central Kansas. The agreement provides that the City will purchase its share of the energy output of the Smoky Hills project and will pay a flat fixed rate (in dollars per megawatt-hour) for the entire term of the agreement. Energy deliveries from the wind farm began on December 8, 2008 and will continue for a term of 20 years with certain renewal options at the mutual agreement of the parties. During fiscal year 2021, the cost of the energy purchases was approximately $2,000,000 for 39,781 megawatt-hours of wholesale energy. For the fiscal year 2022, the projected costs under the agreement are estimated to be approximately $2,800,000.
In May 2015, the City entered into a renewable energy purchase agreement with Marshall Wind Energy LLC. Under this agreement, the City purchases a 27.78% share (20 megawatts) of a 72 megawatt wind farm generation project located in north central Kansas. The agreement provides that the City will purchase its share of the energy output of the Marshall Wind project and will pay a flat fixed rate (in dollars per megawatt-hour) for the entire term of the agreement. Energy deliveries from the wind farm began on March 22, 2016 and will continue for a term of 20 years with certain renewal options at the mutual agreement of the parties. During fiscal year 2021, the cost of the energy purchases was approximately $2,200,000 for 66,448 megawatt-hours of wholesale energy. For fiscal year 2022, the projected costs under the agreement are estimated to be approximately $2,800,000.
In November 2015, the City entered into a renewable energy purchase agreement with MCP-Independence LLC. Under this agreement, the City purchases power generated from a 3 megawatt AC photovoltaic solar farm located in Independence, Missouri. In July 2017, the City entered into a second renewable energy purchase agreement with MCP-Independence, LLC to expand the solar farm by 8.5 megawatts. Both agreements provides that the City will purchase all energy output of the projects and will pay a flat fixed rate (in dollars per kilowatt-hour) for the entire 25-year term of the agreements. Energy deliveries from the solar farm began on March 15, 2017 and deliveries for the expansion began on June 14, 2018. During fiscal year 2021, the cost of the energy purchased was approximately $1,400,000 for 19,255 megawatthours of wholesale energy. For the fiscal year 2022, the projected costs under the agreement are estimated to be approximately $1,500,000.
86
CITY OF INDEPENDENCE, MISSOURI
Notes to Financial Statements
June 30, 2021
In May 2019, the City entered into an agreement with Oneta Power LLC, for a Capacity Only Power Purchase Agreement for the purchase of 46 megawatts of capacity only from the Oneta Generating Facility for a 10 year term. Oneta Generating Facility is a 1,133 MW natural gas-fired combined cycle plant located in Coweta, Oklahoma. For Delivery Years 1-5, the City shall have the right to increase the Quantity of the Contract Capacity (up to 70 MW total, the ‘Reserved Capacity’) for any remaining years of the Delivery Term. Beginning in Delivery Year 6, in the event Oneta is interested in pursuing a transaction with a third party for any portion of the Reserved Capacity that is not yet committed to the City, Oneta shall give the City advance notice, and the City has the right, exercisable within a specified number of days following the notice, to add such portion of the Reserved Capacity to the Contract Capacity (in lieu of Oneta transacting with a third party for such portion). Any adjustment of Contract Capacity shall not fall below the level of Contract Capacity for the previous Delivery Year. During fiscal year 2021, the cost of the capacity purchased was approximately $1,200,000. For the fiscal year 2022, the projected costs under the agreement are estimated to be approximately $1,200,000.
Dogwood Energy Facility
On April 5, 2012, pursuant to an Asset Purchase Agreement with Dogwood Energy, LLC, the City purchased a 12.3% undivided interest (approximately 75 MW) in the Dogwood Energy Facility – a nominal 610 megawatt natural gas-fired combined cycle generating plant located in Pleasant Hill, Missouri. The facility was originally developed as a joint venture between Aquila, Inc. and Calpine Corporation. The facility (originally named Aries) was placed into commercial operation in two phases: first as a peaking facility during the summer of 2001 and then as a combined cycle plant on February 27, 2002. In addition to the City, Kansas Power Pool (KPP), Missouri Joint Municipal Electric Utility Commission (MJMEUC), the Unified Government of Wyandotte County (KCBPU), and the Kansas Municipal Energy Agency (KMEA) also own 10.3%, 16.4%, 17.0% and 10.1% shares respectively of the Dogwood Energy Facility. Dogwood Energy, LLC maintains the remaining ownership share (33.9%) in the facility.
Each of the owners has entered into certain project agreements that provide for the joint ownership and operation of the Dogwood Facility. Under the project agreements, each of the owners are responsible for their respective share of the fixed operation and maintenance costs, the variable operating costs including fuel, and renewals and replacements of the facility. In addition, the owners share in any revenues from sales of unused capacity and energy in the facility.
The plant had a value of $53,785,771 with $6,049,771 accumulated depreciation, making the net purchase price $47,736,000. An operating reserve account was established in the amount of $430,500 for working capital and $61,500 for SPP credit. Prepaid operating expenses as of June 30, 2021 were $351,348 and depreciation expense for fiscal year end June 30, 2021 was $675,434.
87
CITY OF INDEPENDENCE, MISSOURI
Notes to Financial Statements
June 30, 2021
Litigation
The City is involved in lawsuits arising in the ordinary course of activities, including claims regarding construction contract issues, personal injury and discriminatory personnel practices, property condemnation proceedings, and suits contesting the legality of certain taxes. While other cases may have future financial effect, management, based on advice of counsel, believes that their ultimate outcome will not be material to the basic financial statements.
Contingencies
The outbreak of COVID-19, which has been declared by the World Health Organization to be a public health emergency of international concern, has spread across the globe and is impacting worldwide economic activity. The COVID-19 outbreak poses the risk that the City or its employees, contractors, residents, local businesses, and other partners may be prevented from conducting business activities for an indefinite period of time, including due to shutdowns that may be requested or mandated by governmental authorities.
The City receives significant financial assistance from numerous federal, state, and local governmental agencies in the form of grants. The disbursement of funds received under these programs generally requires compliance with terms and conditions specified in the grant agreements and are subject to audit by the grantor agencies. Any disallowed claims resulting from such audits could become a liability of the General Fund or other applicable funds. However, in the opinion of management, any such disallowed claims will not have a material effect on any of the financial statements of the individual fund types included herein or on the overall financial position of the City at June 30, 2021.
(13) Deficits
The accumulated deficits of $712 in the Community Development Block Grant Fund, $16,155 in the Storm Drainage Fund, $8,345,745 in the Workers’ Compensation Fund, $1,216,312 in the Central Garage Fund, $7,557,286 in the Events Center Fund, $557,617 in the Santa Fe TIF project, $2,999,627 in the Hartman Heritage TIF project, will be eliminated by future revenues or transfers.
(14) Subsequent Events
The City evaluated subsequent events through December 17, 2021, the date the financial statements were available to be issued. There were several items that occurred subsequent to year end.
The City approved a Chapter 353 redevelopment plan for the Cargo Largo project. Effective July 1, 2021 there were several work agreements that changed the current method of accrued leave payouts to employees upon separation.
The City issued the following bonds through the Missouri Development Finance Board.
$24,760,000 Series 2021 A and $41,565,000 Series 2021 B revenue bonds in order to refund Series 2012 B and 2013 C for the Sanitary Sewer Fund.
$9,730,000 Series 2021 C revenue bonds in order to refund Series 2011 A for the Events Center Fund
88
CITY OF INDEPENDENCE, MISSOURI
Notes to Financial Statements
June 30, 2021
(15) Fund Balance
Fund balances at year-end are as follows:
89
General TIF Debt Service Nonmajor Total Fund balances: Nonspendable for: Prepaid items $ 19,755 19,755 Total fund balances nonspendable 19,755 19,755 Restricted for: Protested Revenues 34,710 34,710 Police Equipment 84,040 84,040 Tourism 1,264,928 1,264,928 Independence Square Benefit District 7,662 7,662 Grants 7 7 License Surcharge 1,251,499 1,251,499 Street Sales Tax 19,065,699 19,065,699 Parks Sales Tax 837,314 837,314 Storm Water Sales Tax 10,680,007 10,680,007 Police Sales Tax 2,357,485 2,357,485 Fire Sales Tax 2,112,058 2,112,058 Animal Shelter Use Tax 156,017 156,017 Police Use Tax 3,546,493 3,546,493 Health Property Tax 96,049 96,049 Parks & Recreation Property Tax 416,744 416,744 Debt Service Fund 106,984 106,984 TIF Debt Service 34,559,641 34,559,641 Total fund balances restricted 118,750 34,559,641 41,898,946 76,577,337 Committed for: Domestic Violence 13,233 13,233 Capital Projects 92,421 92,421 Strategic Goals 140 140 Vandalism Reward 3,000 3,000 Total fund balances committed 16,373 92,421 108,794 Assigned for: Cigna Wellness Funds 50,000 — — 50,000 Encumbrances: Mailing & Shipping 40,860 40,860 Communication Services 3,796 3,796 Advertising & Public Notices 2 2 Maintenance 23,716 23,716 Training & Education 5,810 5,810 Professional Services 144,024 144,024 Leases 5,037 5,037 Rental of Equipment 4,164 4,164 Other Services 7,667 7,667 Supplies 17,838 17,838 Tools & Equipment 6,813 6,813 Capital Outlay/Equipment 155,726 155,726 Total fund balances assigned 465,453 465,453 Unassigned 5,700,364 (3,557,244) (16,867) 2,126,253 Total fund balance $ 6,320,695 31,002,397 41,974,500 79,297,592 Governmental Funds
CITY OF INDEPENDENCE, MISSOURI
Notes to Financial Statements
June 30, 2021
The outstanding encumbrances are amounts needed to pay any commitments related to purchase orders and contracts that remain unperformed at year-end Totals above include encumbrances as follows: General Fund $415,453 and Non-Major Funds $4,641,766
90
Required Supplementary Information
CITY OF INDEPENDENCE, MISSOURI Budgetary Comparison Schedule
Exhibit 10
General Fund Year ended June 30, 2021 Actual Variance Budgeted Amounts Amounts with Final Original Final (Budget Basis) Budget Revenues: Taxes $ 31,453,100 31,453,100 32,439,613 986,513 Licenses and permits 4,392,069 4,432,069 4,772,400 340,331 Grants – federal and state 5,262,150 5,262,150 5,655,410 393,260 Charges for services 2,058,050 2,150,529 2,013,571 (136,958) Interfund charges for support services 5,035,500 5,035,500 5,035,500 Fines and forfeitures 3,771,000 3,771,000 2,152,627 (1,618,373) Investment income 175,000 175,000 223,572 48,572 Other revenue 2,493,532 890,562 1,319,968 429,406 Total revenues 54,640,401 53,169,910 53,612,661 442,751 Other Financing Sources: Proceeds from capital leases 1,192,500 1,192,500 Transfers in - utility payments in lieu of taxes 19,796,612 19,796,612 19,255,236 (541,376) Operating transfers in 808,036 808,036 Total other financing sources 19,796,612 20,989,112 21,255,772 266,660 Total revenues and other financing sources 74,437,013 74,159,022 74,868,433 709,411 Expenditures: City Council 680,553 680,553 671,660 8,893 City Clerk 195,240 197,869 212,403 (14,534) City Manager 1,187,339 1,187,339 1,162,545 24,794 Municipal Court 1,207,254 1,207,254 1,086,560 120,694 Law 661,301 661,301 620,975 40,326 Finance 5,295,645 5,315,645 4,930,643 385,002 Community Development 5,637,543 3,984,917 3,864,649 120,268 Police 31,553,037 31,671,746 31,882,701 (210,955) Fire 21,181,684 21,536,011 23,482,679 (1,946,668) Health Services 16,368 94,462 69,383 25,079 Municipal Services 4,775,106 4,868,059 5,193,745 (325,686) COVID Reserve 1,468,971 1,468,971 1,468,971 Debt Service 566,972 566,972 165,879 401,093 Capital Outlay 1,192,500 1,192,500 Total expenditures 74,427,013 74,633,599 74,536,322 97,277 Other Financing Uses: Transfers out 10,000 13,876 35,300 (21,424) Total expenditures and other financing uses 74,437,013 74,647,475 74,571,622 75,853 Excess of revenue and other financing sources over (under) expenditures and Other financing uses $ (488,453) 296,811 785,264 Unassigned fund balance at beginning of year 5,301,516 Cancellation of prior year encumbrances 297,578 Investment market value change (136,932) Change in other fund balance components during the year (58,609) Unassigned fund balance at end of year $ 5,700,364 91
CITY OF INDEPENDENCE, MISSOURI
Budgetary Basis Reconciliation Schedule General Fund
Year ended June 30, 2021
The Statement of Revenues, Expenditures, and Changes in Fund Balances - Governmental Funds does not include encumbrances outstanding at year-end as expenditures because encumbrances are reported as reservations of fund balances in accordance with GAAP for the modified accrual basis of accounting. Adjustments necessary to convert the results of operations under the modified accrual basis to the budget basis are included as reconciling items on the following budget-basis statement:
Exhibit 10.1
General Fund Sources/Inflows of Resources: Actual amounts (budgetary basis) for total revenues from the budgetary comparison schedule $ 74,868,433 Basis differences – budget to GAAP: Investment Market Value Change (136,932) Total revenues as reported on the statement of revenues, expenditures, and changes in fund balances – governmental funds $ 74,731,501 Uses/Outflows of Resources: Actual amounts (budgetary basis) for total expenditures from the budgetary comparison schedule $ 74,536,322 Basis differences – budget to GAAP: Capital lease Outstanding encumbrances at year-end charged to the current year’s budget (341,251) Current year expenditures of encumbrances outstanding at the end of the prior fiscal year 301,998 Total expenditures as reported on the statement of revenues, expenditures, and changes in fund balances – governmental funds (GAAP basis) $ 74,497,069 92
CITY OF INDEPENDENCE, MISSOURI
Notes to Budgetary Comparison Schedules
Year ended June 30, 2021
(1) Budgets and Budgetary Accounting
The City follows these procedures in establishing the budgetary data reflected in the accompanying government-wide financial statements:
• Prior to May 15, the City Manager submits to the City Council a proposed operating budget for the fiscal year commencing the following July 1. The operating budget includes proposed expenditures and the means of financing them.
• Public hearings are conducted to obtain taxpayer comments.
• Prior to June 27, the City Council adopts the budget. If the City Council fails to adopt the budget on or before that date, the budget, as submitted or amended, goes into effect.
• The City Manager is authorized to transfer budgeted amounts between divisions of a department within any fund; however, any revisions that alter the total appropriations within any fund, or that transfer appropriations between departments, must be approved by the City Council. The 2020-2021 budget was amended during the year for transfers and supplemental appropriations. The budget amendments were approved by the City Council.
• Expenditures may not exceed appropriations for any department without City Council approval. Unencumbered appropriations lapse at year-end.
• Formal budgets are used as a control device for most funds; however, there is no requirement to report on the budget. Therefore, the financial statements include a comparison of budget to actual only for the General, Tourism, Community Development Block Grant, Rental Rehabilitation, Street Improvement Sales Tax, Park Improvements Sales Tax, Storm Water Sales Tax, Police Public Safety Sales Tax, Fire Public Safety Sales Tax, Grant, Animal Services Use Tax, and Police Use Tax Funds. Annual operating budgets are not prepared for Capital Projects Funds, although budgets on a project basis are prepared.
The City’s policy is to prepare the annual operating budget on a basis which includes encumbrances as the equivalent of expenditures. The budgetary comparison schedules are prepared on this basis. Certain reclassifications between budgeted revenues and transfers have been made to facilitate the comparison with actual operations.
93
CITY OF INDEPENDENCE, MISSOURI Schedule of Changes in Total OPEB Liability and Related Ratios June 30, 2021
Notes to schedule:
2017-18 was the City's first year implementing GASB Statement No. 75 for the OPEB Liability. This schedule will become a ten year schedule, as information becomes available, in accordance with GASB Statement No. 75 requirements
Changes in assumptions or other inputs reflect the effects of changes in the discount rate each period. The following are the discount rates used in each period:
Exhibit 11 2021 2020 2019 2018 Total OPEB Liability Service cost $ 5,402,186 5,117,074 7,279,911 6,933,082 Interest 5,359,428 5,675,902 9,525,419 9,284,832 Changes in benefit terms (64,032) (117,967,934) Differences between expected and actual experience 9,050,839 (2,415,214) 8,495,479 Changes of assumptions or other inputs 19,586,986 15,655,275 2,890,612 2,548,653 Benefit payments (7,591,000) (7,047,000) (7,979,000) (7,268,000) Net change in total OPEB liability 31,808,439 16,922,005 (97,755,513) 11,498,567 Total OPEB liability beginning 204,525,153 187,603,148 285,358,661 273,860,094 Total OPEB liability ending $ 236,333,592 204,525,153 187,603,148 285,358,661 Covered payroll $ 61,410,210 61,654,203 62,360,911 62,007,715 Total OPEB liability as a percentage of covered payroll 384.84% 331.73% 300.83% 460.20%
2021 - 2.00% 2020 - 2.60% 2019 - 3.00% 2018 - 3.30% 2017 - 3.35%
94
CITY OF INDEPENDENCE, MISSOURI
LAGERS Schedule of Changes in Net Pension Liability and Related Ratios
June 30, 2021
2014-15 was the City's first year implementing GASB 68 for Net Pension Liability. This schedule will become a ten year
Notes to schedule: schedule, as information becomes available, in accordance with GASB Statement No. 68 requirements.
During 2015-16 amounts reported as assumption changes were primarily from changes to the mortality table, as well as salary increases and inflation.
Exhibit 12 2021 2020 2019 2018 2017 2016 2015 Total Pension Liability Service cost $ 8,835,703 8,812,673 8,767,760 8,491,285 8,388,017 8,219,353 8,279,026 Interest on the total pension liability 39,838,559 38,699,404 37,097,513 35,565,355 34,642,794 31,909,765 31,404,337 Difference between expected and actual experience (2,691,753) (1,634,804) 5,293,296 4,958,458 (3,550,230) 4,916,999 (10,375,729) Assumption changes (12,909,211) 17,199,406 Benefit payments, including refunds (30,623,078) (29,744,536) (28,449,283) (27,600,963) (26,039,035) (23,272,216) (21,374,778) Net change in total pension liability 2,450,220 16,132,737 22,709,286 21,414,135 13,441,546 38,973,307 7,932,856 Total pension liability, beginning 560,200,441 544,067,704 521,358,418 499,944,283 486,502,737 447,529,430 439,596,574 Total pension liability, ending $ 562,650,661 560,200,441 544,067,704 521,358,418 499,944,283 486,502,737 447,529,430 Plan Fiduciary Net Position Contributions - employer 14,363,011 13,630,050 13,183,650 12,176,570 11,503,039 10,603,882 9,475,216 Contributions - employee 2,963,990 2,925,479 2,992,581 2,925,232 2,939,278 2,861,145 2,738,899 Pension plan net investment income 126,631,520 6,074,595 29,696,791 50,437,763 46,423,639 (791,625) 7,836,996 Benefit payments, including refunds (30,623,078) (29,744,536) (28,449,283) (27,600,963) (26,039,035) (23,272,216) (21,374,778) Pension plan administrative expense (232,953) (302,539) (271,793) (189,560) (183,539) (181,225) (198,235) Other 3,128,373 (1,027,620) (302,321) 1,122,739 (701,221) 981,004 (5,341,994) Net change in plan fiduciary net position 116,230,863 (8,444,571) 16,849,625 38,871,781 33,942,161 (9,799,035) (6,863,896) Plan fiduciary net position, beginning 465,624,384 474,068,955 457,219,330 418,347,549 384,405,388 394,204,423 401,068,319 Plan fiduciary net position, ending $ 581,855,247 465,624,384 474,068,955 457,219,330 418,347,549 384,405,388 394,204,423 Employer net pension liability $ (19,204,586) 94,576,057 69,998,749 64,139,088 81,596,734 102,097,349 53,325,007 Plan fiduciary net position as a percentage of the total pension liability (City) 103.41% 83.12% 87.13% 87.70% 83.68% 79.01% 88.08% Covered payroll $ 71,711,424 72,175,519 72,252,369 72,279,232 69,006,951 69,847,339 67,691,063 Employer's net pension liability (asset) as a percentage of covered payroll -26.78% 131.04% 96.88% 88.74% 118.24% 146.17% 78.78%
95
determine contribution rates:
CITY OF INDEPENDENCE, MISSOURI
LAGERS Schedule of Contributions
Last Ten Fiscal Years
Actuarially determined contribution rates were calculated as of February 28, 2021 prior to the end of the fiscal year in which contributions are reported.
Cost Method Entry Age Normal and Modified Terminal Funding Amortization Method
A level percentage of payroll amortization method is used to amortize the UAAL over a closed period of years. If the UAAL (excluding the UAAL associated with benefit changes) is negative, then this amount is amortized over the greater of (i) the remaining initial amortization period, or (ii) 15 years.
Remaining Amortization Period Multiple bases from 8 to 18 years.
5-Year smoothed market; 20% corridor.
2.75% wage inflation and 2.25% price inflation.
Increases
2.75% to 7.15%; including wage inflation.
Rate of Return 7.00%, net of investment expenses.
Experience-based table of rates that are specific to the type of eligibility condition. The healthy retiree mortality tables, for post-retirement mortality, were 115% of the PubG - 2010 Retiree Mortality Table for males and females. The disabled retiree mortality tables, for post-retirement mortality, used in evaluating allowances to be paid were 115% of the PubNS - 2010 Disabled Retiree Mortaility Table for males and females. The pre-retirement mortality tables used were 75% of the PubG - 2010 Employee Mortaility Table for males and females of General groups and 75% of the PubS - 2010 Employee Mortaility Table for males and females of Police, Fire, and Public Safety groups. Mortality rates for a particular calendar year are determined by applying the MP - 2020 mortaility improvement scale to the above described tables.
Exhibit 13 2021 2020 2019 2018 2017 2016 2015 2014 2013 2012 Actuarially determined contribution $ 17,173,738 16,275,986 16,251,566 15,008,913 13,142,800 13,185,228 12,190,564 11,568,908 10,954,525 9,708,229 Contributions in relation to the actuarially determined contribution 14,366,820 13,617,154 13,188,017 12,179,890 11,502,124 10,605,761 9,478,268 8,724,944 7,962,390 7,272,736 Contribution deficiency (excess) $ 2,806,918 2,658,832 3,063,549 2,829,023 1,640,676 2,579,467 2,712,296 2,843,964 2,992,135 2,435,493 Covered payroll $ 71,711,424 72,175,519 72,252,369 72,279,232 69,006,951 69,847,339 67,691,063 68,032,518 67,337,696 67,166,990 Contributions as a percentage of covered payroll 20.03% 18.87% 18.25% 16.85% 16.67% 15.18% 14.00% 12.82% 11.82% 10.83% Notes to schedule: Valuation Date Methods and assumptions used to
Actuarial
Asset Valuation Method
Inflation
Salary
Investment
Retirement
Mortality Other
Age
information: None
96
CITY OF INDEPENDENCE, MISSOURI
Nonmajor Governmental Funds Special Revenue Funds
Special Revenue Funds are used to account for specific revenues that are legally restricted to expenditures for particular purposes.
Tourism – This fund is used to account for expenditures for tourism that are financed out of the transient guest tax.
Truman Heartland Community Foundation – This fund is used to account for receipts and expenditures of various donated funds the City holds at the Truman Heartland Community Foundation.
Health Property Tax Levy Fund – This fund is used to account for revenues and expenditures for the Health portion of the City’s property tax.
Parks and Recreation Property Tax Levy Fund – This fund is used to account for revenues and expenditures for the Parks and Recreation portion of the City’s property tax.
Independence Square Benefit District – This fund is used to account for expenditures to improve the City’s downtown business district that are financed by a special property tax levy on those businesses which are benefited.
Community Development Grant Act – This fund is used to account for all projects that are funded by the Federal Community Development Block Grant.
Rental Rehabilitation – This fund is used to account for expenditures to improve rental property within the City that are funded by state and federal grants.
Street Improvement Sales Tax – This fund is used to account for all street projects that are funded by the three-eighths cent street improvement sales tax.
Park Improvement Sales Tax Fund – This fund accounts for all park projects that are funded by the onequarter cent park improvement sales tax.
Storm Water Sales Tax – This fund is used to account for all storm water projects that are funded by the one-fourth cent storm water sales tax.
Police Public Safety Sales Tax – This fund is used to account for receipts and expenditures of the City’s sales tax for police protection services.
Fire Protection Sales Tax – This fund is used to account for receipts and expenditures of the City’s sales tax for fire protection services.
Animal Shelter Use Tax – This fund is used to account for receipts and expenditures of the City’s use tax for animal services.
Police Use Tax – This fund is used to account for receipts and expenditures of the City’s use tax for police services.
License Surcharge – This fund is used to account for street improvements funded by an excise tax that is based on increased traffic flow relating to new development.
Grant Fund – This fund is used to account for expenditures that are funded by grants.
CARES Act Fund – This fund is used to account for expenditures funded from the CARES Act.
CITY OF INDEPENDENCE, MISSOURI
Capital Projects Funds
Capital Project Funds are used to account for the acquisition and construction of major capital facilities other than those financed by the proprietary funds or trust funds.
Street Improvements Fund – This fund is used to account for major street improvement construction projects. Revenues received by this fund come primarily from a sales tax allocation for capital improvements and from federal and state grants and other contributions.
Revolving Public Improvements – This fund, which is legally mandated by City Charter, is used to account for the cost of public works or improvements funded by special assessments.
Building and Other Improvements – This fund is used to account for the acquisition, construction, and improvement of nonproprietary buildings and facilities of the City.
Storm Drainage – This fund is used to account for the acquisition and construction of the City’s infrastructure to control the run-off surface water.
Park Improvements – This fund is used to account for the acquisition and construction of the City’s parkland.
Debt Service Fund
The debt service fund accounts for the resources accumulated and payments made for principal and interest on long-term general obligation debt of governmental funds.
CITY OF INDEPENDENCE, MISSOURI Combining Balance Sheet
Exhibit 14
Nonmajor Governmental Funds June 30, 2021 Special Capital Total Nonmajor Revenue Projects Debt Service Governmental Assets (Exhibit 16) (Exhibit 33) Fund Funds Pooled cash and investments $ 38,367,565 342,713 12,938 38,723,216 Receivables: Taxes 7,093,573 7,093,573 Accounts 48,640 48,640 Special assessment principal and accrued interest 382,202 28,736 410,938 Accrued interest 97,599 1,157 46 98,802 Due from other funds 16,155 16,155 Due from other governments 1,755,373 1,755,373 Restricted cash and investments 13,839,591 94,000 13,933,591 Total assets $ 61,218,496 726,072 135,720 62,080,288 Liabilities: Accounts and contracts payable $ 1,553,144 149,809 1,702,953 Due to other funds 3,200,306 16,155 3,216,461 Accrued items 561,194 561,194 Other current liabilities 121,473 840 122,313 Unearned revenue 11,244,522 100,800 11,345,322 Total liabilities 16,680,639 267,604 16,948,243 Deferred Inflows of Resources: Unavailable revenue - special assessments 382,202 28,736 410,938 Unavailable revenue - real estate taxes 2,746,607 2,746,607 Total deferred inflows of resources 2,746,607 382,202 28,736 3,157,545 Fund Balances: Restricted 41,791,962 106,984 41,898,946 Committed 92,421 92,421 Unassigned (712) (16,155) (16,867) Total fund balances 41,791,250 76,266 106,984 41,974,500 $ 61,218,496 726,072 135,720 62,080,288 Total liabilities, deferred inflows of resources and fund balances Liabilities, Deferred Inflows of Resources and Fund Balances 97
CITY OF INDEPENDENCE, MISSOURI
Combining Statement of Revenues, Expenditures, and Changes in Fund Balances
Nonmajor Governmental Funds
Year ended June 30, 2021
Exhibit 15
Special Capital Total Nonmajor Revenue Projects Debt Service Governmental (Exhibit 17) (Exhibit 34) Fund Funds Revenues: Taxes $ 30,445,175 30,445,175 Intergovernmental 12,889,884 107,716 12,997,600 Charges for services 872,943 9,978 11,860 894,781 Investment income 155,172 3,052 1,296 159,520 Other 306,722 5,289 312,011 Total revenues 44,669,896 126,035 13,156 44,809,087 Expenditures: Current: Administrative Services 23,815 23,815 Public Safety 6,911,548 6,911,548 Municipal Services 1,247,519 1,247,519 Health Services 1,949,663 1,949,663 Culture and Recreation 7,526,753 7,526,753 Community development 2,040,439 2,040,439 Storm Water 2,174,015 2,174,015 General Government 3,386,657 130 3,386,787 Capital outlay 12,306,505 307,471 12,613,976 Debt service: Principal 120,937 7,000 127,937 Interest and fiscal agent fees 626,690 2,289 628,979 Total expenditures 38,314,541 307,471 9,419 38,631,431 Excess (deficiency) of revenues over expenditures 6,355,355 (181,436) 3,737 6,177,656 Other Financing Sources (Uses): Capital lease proceeds 185,011 185,011 Transfers in 532,700 693,265 1,225,965 Transfers out (4,708,231) (496,108) (5,204,339) Total other financing sources (uses) (3,990,520) 197,157 (3,793,363) Net change in fund balances 2,364,835 15,721 3,737 2,384,293 Fund balances, beginning 39,426,415 60,545 103,247 39,590,207 Fund balances, ending $ 41,791,250 76,266 106,984 41,974,500 98
CITY OF INDEPENDENCE, MISSOURI
Exhibit 16
Combining Balance Sheet Nonmajor Special Revenue Funds June 30, 2021 Truman Parks and Heartland Independence Community Combined Sales American Animal Health Recreation Community Square Benefit Development Rental Tax Funds License Cares Resscue Services Police Property Property Assets Tourism Foundation District Grant Act Rehabilitation (Exhibit 31) Surcharge Grants Act Plan Use Tax Use Tax Tax Tax Total Pooled cash and investments $ 1,263,783 371,937 22,385 11,687 20,429,836 1,226,622 10,742,962 163,084 3,567,549 79,151 488,569 38,367,565 Receivables: Taxes 180,000 33,962 4,038,435 909,176 1,932,000 7,093,573 Accounts 1,525 20,495 26,620 48,640 Accrued interest 4,601 73,274 4,382 580 12,722 277 1,763 97,599 Due from other funds 16,155 16,155 Due from other governments 351,045 9,787 76,631 1,307,660 10,250 1,755,373 Restricted assets 13,839,591 13,839,591 Total assets $ 1,449,909 371,937 56,347 351,045 21,474 38,473,922 1,251,499 1,334,280 10,742,962 163,664 3,580,271 988,604 2,432,582 61,218,496 Liabilities and Fund Balances Liabilities: Accounts and contracts payable $ 111,364 22,385 46,773 1,134,773 237,186 319 344 1,553,144 Due to other funds 303,528 2,125,552 771,226 3,200,306 Accrued items 73,617 1,632 152,591 196,245 7,647 33,778 21,738 73,946 561,194 Other current liabilities 1,456 19,835 8,443 91,739 121,473 Unearned revenue 371,937 129,623 10,742,962 11,244,522 Total liabilities 184,981 371,937 22,385 351,757 21,467 3,421,359 1,334,280 10,742,962 7,647 33,778 22,057 166,029 16,680,639 Deferred Inflows of Resources: Unavailable revenue - real estate taxes 26,300 870,498 1,849,809 2,746,607 Total deferred outflows of resources 26,300 870,498 1,849,809 2,746,607 Fund Balances: Restricted 1,264,928 7,662 7 35,052,563 1,251,499 156,017 3,546,493 96,049 416,744 41,791,962 Unassigned (712) (712) Total fund balances (deficits) 1,264,928 7,662 (712) 7 35,052,563 1,251,499 156,017 3,546,493 96,049 416,744 41,791,250 $ 1,449,909 371,937 56,347 351,045 21,474 38,473,922 1,251,499 1,334,280 10,742,962 163,664 3,580,271 988,604 2,432,582 61,218,496 Total liabilities, deferred inflows of resources, and fund balances 99
Exhibit 17
Combining Statement of Revenues, Expenditures, and Changes in Fund Balances Nonmajor Special Revenue Funds Year ended June 30, 2021 Truman Parks and Heartland Independence Community Combined Sales American Animal Health Recreation Community Square Benefit Development Rental Tax Funds License Cares Rescue Services Police Property Property Tourism Foundation District Grant Act Rehabilitation (Exhibit 32) Surcharge Grants Act Plan Use Tax Use Tax Tax Tax Total Revenues: Taxes $ 1,321,757 25,920 22,614,710 750,000 3,000,000 874,492 1,858,296 30,445,175 Intergovernmental 1,105,772 415,963 107,124 4,222,528 6,953,474 85,023 12,889,884 Charges for services 1,447 368,900 196,311 131,856 174,429 872,943 Investment income 95 792 83,874 1,396 2,903 52,618 2,554 10,940 155,172 Other 1,448 164,709 1,239 113,263 26,063 306,722 Total revenues 1,324,747 26,712 1,105,772 415,963 23,339,317 1,396 4,420,078 6,953,474 752,903 3,052,618 1,122,165 2,154,751 44,669,896 Expenditures: Current: Administrative Services 23,815 23,815 Public Safety 4,302,604 2,164,821 444,123 6,911,548 Municipal Services 1,247,519 1,247,519 Health Services 104,828 817,726 1,027,109 1,949,663 Culture and Recreation 1,431,804 3,182,378 1,174,564 1,738,007 7,526,753 Community Development 670,386 415,963 1,985 952,105 2,040,439 Storm Water 2,174,015 2,174,015 General Government 22,805 3,363,852 3,386,657 Capital outlay 39,262 12,267,243 12,306,505 Debt service: Principal 7,500 113,437 120,937 Interest and fiscal agent fees 626,690 626,690 Total expenditures 1,478,566 22,805 670,386 415,963 23,913,886 1,985 4,420,133 3,363,852 817,726 444,123 1,027,109 1,738,007 38,314,541 (153,819) 3,907 435,386 (574,569) (589) (55) 3,589,622 (64,823) 2,608,495 95,056 416,744 6,355,355 Other Financing Sources (Uses): Capital lease proceeds 185,011 185,011 Transfers in 531,652 55 993 532,700 Transfers out (435,386) (652,434) (30,789) (3,589,622) (4,708,231) Total other financing sources (uses) (435,386) 64,229 (30,789) 55 (3,589,622) 993 (3,990,520) Net change in fund balances (153,819) 3,907 (510,340) (31,378) (64,823) 2,608,495 96,049 416,744 2,364,835 Fund balances (deficits), beginning 1,418,747 3,755 (712) 7 35,562,903 1,282,877 220,840 937,998 39,426,415 Fund balances (deficits), ending $ 1,264,928 7,662 (712) 7 35,052,563 1,251,499 156,017 3,546,493 96,049 416,744 41,791,250 Excess (deficiency) of revenues over expenditures 100
CITY OF INDEPENDENCE, MISSOURI
Exhibit 18
Actual Variance Budgeted Amounts Amounts with Final Original Final (Budget Basis) Budget Revenues: Transient guest taxes $ 1,860,354 1,860,354 1,321,757 (538,597) Charges for services 23,944 23,944 1,447 (22,497) Investment income 3,300 3,300 24,461 21,161 Other revenue 15,600 15,600 1,447 (14,153) Total revenues 1,903,198 1,903,198 1,349,112 (554,086) Expenditures: Tourism 1,997,806 2,174,064 1,542,824 631,240 Total expenditures 1,997,806 2,174,064 1,542,824 631,240 Excess of revenues over (under) expenditures $ (94,608) (270,866) (193,712) 77,154 Fund balance at beginning of year 1,418,747 Cancellation of prior year encumbrances 63,214 Investment market value change (24,365) Increase (decrease) in prior year 1,044 encumbrances Fund balance at end of year $ 1,264,928 101
CITY OF INDEPENDENCE, MISSOURI Budgetary Comparison Schedule Tourism Fund Year ended June 30, 2021
CITY OF INDEPENDENCE, MISSOURI
Budgetary Basis Reconciliation Schedule
(1) Encumbrances for supplies and equipment ordered but not received are reported in the year the order is placed for budgetary purposes, but in the year the supplies are received for financial reporting purposes.
Exhibit 18.1
Tourism Fund Year ended June 30, 2021 Tourism Fund Sources/Inflows of Resources: Actual amounts (budgetary basis) for total revenues from the budgetary comparison schedule $ 1,349,112 Basis differences – budget to GAAP: Market value adjustment to investments (24,365) Total revenues as reported on the statement of revenues, expenditures, and changes in fund balances – governmental funds $ 1,324,747 Uses/Outflows of resources: Actual amounts (budgetary basis) for total expenditures from the budgetary comparison schedule $ 1,542,824 Basis differences – budget to GAAP: Outstanding encumbrances at year-end charged to the current year’s budget (1) (120,661) Current year expenditures of encumbrances outstanding at the end of the prior fiscal year (1) 56,403 Total expenditures as reported on the statement of revenues, expenditures, and changes in fund balances – governmental funds $ 1,478,566
102
Excess of revenues over (under) expenditures
INDEPENDENCE, MISSOURI
Exhibit 19 Actual Variance Budgeted Amounts Amounts with Final Original Final (Budget Basis) Budget Revenues: Federal grant - CDBG $ 814,159 1,819,696 1,105,772 (713,924) Total Revenues 814,159 1,819,696 1,105,772 (713,924) Expenditures: CDBG administration 162,830 162,831 155,799 7,032 CDBG expenditures 663,994 770,519 513,090 257,429 Total expenditures 826,824 933,350 668,889 264,461 Other Financing Uses: Transfers out 899,011 435,386 463,625 Total other financing uses 899,011 435,386 463,625 Total expenditures and other uses 826,824 1,832,361 1,104,275 728,086
and other financing uses $ (12,665) (12,665) 1,497 14,162 Fund balance at beginning of year (712) Cancellation of prior year encumbrances 86,292 Increase (decrease) in prior year encumbrances (87,789) Fund balance at end of year $ (712)
Community Development Block Grant Fund Year ended June 30, 2021 103
CITY OF
Budgetary Comparison Schedule
CITY OF INDEPENDENCE, MISSOURI
Budgetary Basis Reconciliation Schedule Community
(1) Encumbrances for supplies and equipment ordered but not received are reported in the year the order is placed for budgetary purposes, but in the year the supplies are received for financial reporting purposes.
Exhibit 19.1
Development
ended June 30, 2021 Community Development Block Grant Sources/Inflows of Resources: Actual amounts (budgetary basis) for total revenues from the budgetary comparison schedule $ 1,105,772 Basis differences – budget to GAAP: None Total revenues as reported on the statement of revenues, expenditures, and changes in fund balances – governmental funds $ 1,105,772 Uses/Outflows of resources: Actual amounts (budgetary basis) for total expenditures from the budgetary comparison schedule $ 668,889 Basis differences – budget to GAAP: Outstanding encumbrances at year-end charged to the current year’s budget (1) (46,688) Current year expenditures of encumbrances outstanding at the end of the prior fiscal year (1) 48,185 Total expenditures as reported on the statement of revenues, expenditures, and changes in fund balances – governmental funds $ 670,386
Block Grant Fund Year
104
CITY OF INDEPENDENCE, MISSOURI Budgetary Comparison Schedule
Exhibit 20 Actual Variance Budgeted Amounts Amounts with Final Original Final (Budget Basis) Budget Revenues: HOME Program grant $ 482,477 1,465,629 415,963 (1,049,666) Total revenues 482,477 1,465,629 415,963 (1,049,666) Expenditures: HOME administration 70,592 184,543 66,236 118,307 Multi-family housing 359,759 645,213 146,119 499,094 Community housing development 102,788 686,535 419,516 267,019 Total expenditures 533,139 1,516,291 631,871 884,420 Excess of revenues over (under) expenditures $ (50,662) (50,662) (215,908) (165,246) Fund balance at beginning of year 7 Cancellation of prior year encumbrances Increase (decrease) in prior year encumbrances 215,908 Fund balance at end of year $ 7
Rental Rehabilitation Year Ended June 30, 2021 105
CITY OF INDEPENDENCE, MISSOURI
Budgetary Basis Reconciliation Schedule
(1) Encumbrances for supplies and equipment ordered but not received are reported in the year the order is placed for budgetary purposes, but in the year the supplies are received for financial reporting purposes.
Exhibit 20.1
Rental Rehabilitation Year ended June 30, 2021 Rental Rehabilitation Sources/Inflows of Resources: Actual amounts (budgetary basis) for total revenues from the budgetary comparison schedule $ 415,963 Basis differences – budget to GAAP: None Total revenues as reported on the statement of revenues, expenditures, and changes in fund balances – governmental funds $ 415,963 Uses/Outflows of resources: Actual amounts (budgetary basis) for total expenditures from the budgetary comparison schedule $ 631,871 Basis differences – budget to GAAP: Outstanding encumbrances at year-end charged to the current year’s budget (1) (276,075) Current year expenditures of encumbrances outstanding at the end of the prior fiscal year (1) 60,167 Total expenditures as reported on the statement of revenues, expenditures, and changes in fund balances – governmental funds $ 415,963
106
CITY OF INDEPENDENCE, MISSOURI
Exhibit 21 Actual Variance Budgeted Amounts Amounts with Final Original Final (Budget Basis) Budget Revenues: Sales taxes $ 8,028,559 8,028,559 8,781,615 753,056 Use taxes 217,644 217,644 Charges for services 7,088 7,088 Intergovernmental revenue 107,124 107,124 Investment income 10,000 10,000 58,438 48,438 Other revenue 24,578 31,973 7,395 Total revenues 8,038,559 8,070,225 9,203,882 1,133,657 Other Financing Sources: Transfers in 501,428 501,428 Issuance of debt 185,011 185,011 Total other financing sources 185,011 686,439 501,428 Total revenues and other financing sources 8,038,559 8,255,236 9,890,321 1,635,085 Expenditures: Street Maintenance 448,175 588,175 370,980 217,195 Capital Outlay 5,453,236 25,603,359 9,530,508 16,072,851 Debt Service 555,951 555,951 555,971 (20) Total expenditures 6,457,362 26,747,485 10,457,459 16,290,026 Other Financing Uses: Transfers out 220,291 (220,291) Total other financing uses 220,291 (220,291) Total expenditures and other financing uses 6,457,362 26,747,485 10,677,750 16,069,735 Excess of revenues and other financing sources over (under) expenditures $ 1,581,197 (18,492,249) (787,429) 17,704,820 Fund balance at beginning of year 21,531,919 Cancellation of prior year encumbrances 43,738 Investment market value change (22,893) Increase (decrease) in prior year encumbrances (1,699,636) Fund balance at end of year $ 19,065,699
Street Improvements Sales Tax Fund Year ended June 30, 2021 107
Budgetary Comparison Schedule
CITY OF INDEPENDENCE, MISSOURI
Budgetary Basis Reconciliation Schedule Street
(1) Encumbrances for supplies and equipment ordered but not received are reported in the year the order is placed for budgetary purposes, but in the year the supplies are received for financial reporting purposes.
Exhibit 21.1
Year ended June 30, 2021 Street Improvements Sales Tax Sources/Inflows of Resources: Actual amounts (budgetary basis) for total revenues from the budgetary comparison schedule $ 9,203,882 Basis differences – budget to GAAP: Investment Market Value Change (22,893) Total revenues as reported on the statement of revenues, expenditures, and changes in fund balances – governmental funds $ 9,180,989 Uses/Outflows of resources: Actual amounts (budgetary basis) for total expenditures from the budgetary comparison schedule $ 10,457,459 Basis differences – budget to GAAP: Outstanding encumbrances at year-end charged to the current year’s budget (1) (2,498,961) Current year expenditures of encumbrances outstanding at the end of the prior 4,154,857 fiscal year (1) Total expenditures as reported on the statement of revenues, expenditures, and changes in fund balances – governmental funds $ 12,113,355
Improvements Sales Tax Fund
108
CITY OF INDEPENDENCE, MISSOURI Budgetary Comparison Schedule
Exhibit 22 Actual Variance Budgeted Amounts Amounts with Final Original Final (Budget Basis) Budget Revenues: Sales taxes $ 4,014,300 4,014,300 4,390,812 376,512 Use taxes 108,822 108,822 Charges for services 348,455 387,201 361,812 (25,389) Investment income 3,000 3,000 24,995 21,995 Other revenue 2,500 2,500 28,007 25,507 Total revenues 4,368,255 4,407,001 4,914,448 507,447 Other Financing Sources: Transfers in 25,300 30,225 4,925 Total other financing sources 25,300 30,225 4,925 Total revenues and other financing sources 4,368,255 4,432,301 4,944,673 512,372 Expenditures: Culture and Recreation 3,640,907 3,640,907 3,329,726 311,181 Capital Outlay 335,000 1,186,118 305,354 880,764 Debt Service 207,214 207,214 56,897 150,317 Total expenditures 4,183,121 5,034,239 3,691,977 1,342,262 Other Financing Uses: Transfers out Total other financing uses Total expenditures and other financing uses 4,183,121 5,034,239 3,691,977 1,342,262 Excess of revenues and other financing sources over (under) expenditures $ 185,134 (601,938) 1,252,696 1,854,634 Fund balance (deficit) at beginning of year (531,424) Cancellation of prior year encumbrances 8,140 Investment market value change (3,550) Increase (decrease) in prior year encumbrances 111,452 Fund balance (deficit) at end of year $ 837,314
Improvements Sales Tax Fund Year ended June 30, 2021 109
Park
CITY OF INDEPENDENCE, MISSOURI
Budgetary Basis Reconciliation Schedule Park
(1) Encumbrances for supplies and equipment ordered but not received are reported in the year the order is placed for budgetary purposes, but in the year the supplies are received for financial reporting purposes.
Exhibit 22.1
Improvements
Year ended June
Park Improvements Sales Tax Sources/Inflows of Resources: Actual amounts (budgetary basis) for total revenues from the budgetary comparison schedule $ 4,914,448 Basis differences – budget to GAAP: Investment Market Value Change (3,550) Total revenues as reported on the statement of revenues, expenditures, and changes in fund balances – governmental funds $ 4,910,898 Uses/Outflows of resources: Actual amounts (budgetary basis) for total expenditures from the budgetary comparison schedule $ 3,691,977 Basis differences – budget to GAAP: Outstanding encumbrances at year-end charged to the current year’s budget (1) (202,548) Current year expenditures of encumbrances outstanding at the end of the prior fiscal year (1) 82,956 Total expenditures as reported on the statement of revenues, expenditures, and changes in fund balances – governmental funds $ 3,572,385
Sales Tax Fund
30, 2021
110
CITY OF INDEPENDENCE, MISSOURI Budgetary Comparison Schedule
Exhibit 23 Actual Variance Budgeted Amounts Amounts with Final Original Final (Budget Basis) Budget Revenues: Sales taxes $ 4,014,317 4,014,317 4,390,812 376,495 Use taxes 108,822 108,822 Investment income 24,500 24,500 170,047 145,547 Other revenue 20,394 20,394 Total revenues 4,038,817 4,038,817 4,690,075 651,258 Expenditures: Storm Water Administration 342,871 342,871 229,644 113,227 Maintenance 2,009,898 1,963,283 1,517,961 445,322 Permit Completion 318,000 318,000 329,100 (11,100) Capital Outlay 1,406,850 4,021,138 913,344 3,107,794 Total expenditures 4,077,619 6,645,292 2,990,049 3,655,243 Excess of revenues over (under) expenditures $ (38,802) (2,606,475) 1,700,026 4,306,501 Fund balance at beginning of year 9,991,197 Cancellation of prior year encumbrances 136,366 Investment market value change (148,958) Increase (decrease) in prior year encumbrances (998,624) Fund balance at end of year $ 10,680,007
Storm Water Sales Tax Fund Year Ended June 30, 2021 111
CITY OF INDEPENDENCE, MISSOURI
Budgetary Basis Reconciliation Schedule
Storm
(1) Encumbrances for supplies and equipment ordered but not received are reported in the year the order is placed for budgetary purposes, but in the year the supplies are received for financial reporting purposes.
Exhibit 23.1
Water
Year ended June 30, 2021 Storm Water Sales Tax Sources/Inflows of Resources: Actual amounts (budgetary basis) for total revenues from the budgetary comparison schedule $ 4,690,075 Basis differences – budget to GAAP: Investment Market Value Change (148,958) Total revenues as reported on the statement of revenues, expenditures, and changes in fund balances – governmental funds $ 4,541,117 Uses/Outflows of resources: Actual amounts (budgetary basis) for total expenditures from the budgetary comparison schedule $ 2,990,049 Basis differences – budget to GAAP: Outstanding encumbrances at year-end charged to the current year’s budget (1) (376,859) Current year expenditures of encumbrances outstanding at the end of the prior fiscal year (1) 1,239,117 Total expenditures as reported on the statement of revenues, expenditures, and changes in fund balances – governmental funds $ 3,852,307
Sales Tax Fund
112
CITY OF INDEPENDENCE, MISSOURI Budgetary Comparison Schedule Police Public Safety Sales Tax Fund Year Ended June 30, 2021
Exhibit 24 Actual Variance Budgeted Amounts Amounts with Final Original Final (Budget Basis) Budget Revenues: Sales taxes $ 2,133,460 2,133,460 2,310,802 177,342 Use taxes 54,901 54,901 Investment income 5,000 5,000 45,039 40,039 Other revenue 75,954 75,954 Total revenues 2,138,460 2,138,460 2,486,696 348,236 Expenditures: Public Safety Communications 602,307 652,980 621,776 31,204 Facilities 99,768 99,768 87,082 12,686 Equipment 2,017,965 1,967,292 1,843,616 123,676 Total expenditures 2,720,040 2,720,040 2,552,474 167,566 Other Financing Uses: Transfers out/capital outlay 1,700 169,233 (167,533) Total other financing uses 1,700 169,233 (167,533) Total expenditures and other financing uses 2,720,040 2,721,740 2,721,707 33 Excess of revenues over (under) expenditures and other financing uses $ (581,580) (583,280) (235,011) 348,269 Fund balance at beginning of year 3,042,874 Cancellation of prior year encumbrances 28,248 Investment market value change (50,070) Increase (decrease) in prior year encumbrances (428,556) Fund balance at end of year $ 2,357,485
113
CITY OF INDEPENDENCE, MISSOURI
Budgetary Basis Reconciliation Schedule
(1) Encumbrances for supplies and equipment ordered but not received are reported in the year the order is placed for budgetary purposes, but in the year the supplies are received for financial reporting purposes.
Exhibit 24.1
Police Public Safety Sales Tax Sources/Inflows of Resources: Actual amounts (budgetary basis) for total revenues from the budgetary comparison schedule $ 2,486,696 Basis differences – budget to GAAP: Investment Market Value Change (50,070) Total revenues as reported on the statement of revenues, expenditures, and changes in fund balances – governmental funds $ 2,436,626 Uses/Outflows of resources: Actual amounts (budgetary basis) for total expenditures from the budgetary comparison schedule $ 2,552,474 Basis differences – budget to GAAP: Outstanding encumbrances at year-end charged to the current year’s budget (1) (80,104) Current year expenditures of encumbrances outstanding at the end of the prior fiscal year (1) 480,412 Total expenditures as reported on the statement of revenues, expenditures, and changes in fund balances – governmental funds $ 2,952,782
Police Public Safety Sales Tax Fund Year ended June 30, 2021
114
INDEPENDENCE, MISSOURI
Exhibit 25 Actual Variance Budgeted Amounts Amounts with Final Original Final (Budget Basis) Budget Revenues: Sales taxes $ 2,007,200 2,007,200 2,195,578 188,378 Use taxes 54,901 54,901 Investment income 5,300 5,300 23,143 17,843 Other revenue 6,302 8,381 2,079 Total revenues 2,012,500 2,018,802 2,282,003 263,201 Expenditures: Public Safety 1,166,900 1,173,202 978,453 194,749 Capital Outlay 1,017,000 1,570,783 398,802 1,171,981 Debt Service 73,236 73,236 73,235 1 Total expenditures 2,257,136 2,817,221 1,450,490 1,366,731 Other Financing Uses: Transfers out/capital outlay 39,450 262,909 (223,459) Total other financing uses 39,450 262,909 (223,459) Total expenditures and other financing uses 2,257,136 2,856,671 1,713,399 1,143,272 Excess of revenues over (under) expenditures and other financing uses $ (244,636) (837,869) 568,604 1,406,473 Fund balance at beginning of year 1,528,337 Cancellation of prior year encumbrances 21,960 Investment market value change (12,316) Increase (decrease) in prior year encumbrances 5,473 Fund balance at end of year $ 2,112,058
Protection Sales Tax Fund Year Ended June 30, 2021 115
CITY OF
Budgetary Comparison Schedule Fire
CITY OF INDEPENDENCE, MISSOURI Budgetary Basis Reconciliation Schedule
(1) Encumbrances for supplies and equipment ordered but not received are reported in the year the order is placed for budgetary purposes, but in the year the supplies are received for financial reporting purposes.
Exhibit 25.1
Protection
Year ended June 30, 2021 Fire Protection Sales Tax Sources/Inflows of Resources: Actual amounts (budgetary basis) for total revenues from the budgetary comparison schedule $ 2,282,003 Basis differences – budget to GAAP: Investment Market Value Change (12,316) Total revenues as reported on the statement of revenues, expenditures, and changes in fund balances – governmental funds $ 2,269,687 Uses/Outflows of resources: Actual amounts (budgetary basis) for total expenditures from the budgetary comparison schedule $ 1,450,490 Basis differences – budget to GAAP: Outstanding encumbrances at year-end charged to the current year’s budget (1) (80,103) Current year expenditures of encumbrances outstanding at the end of the prior fiscal year (1) 52,670 Total expenditures as reported on the statement of revenues, expenditures, and changes in fund balances – governmental funds $ 1,423,057
Fire
Sales Tax Fund
116
CITY OF INDEPENDENCE, MISSOURI Budgetary Comparison Schedule
Exhibit 26 Actual Variance Budgeted Amounts Amounts with Final Original Final (Budget Basis) Budget Revenues: Grants and other shared revenue $ 585,503 7,058,493 4,222,223 (2,836,270) Charges for services 196,311 196,311 Other revenue 32,936 1,544 (31,392) Total revenues 585,503 7,287,740 4,420,078 (2,867,662) Other Financing Sources: Transfers in 55 55 Total other financing sources 55 55 Total revenues and other financing sources 585,503 7,287,740 4,420,133 (2,867,607) Expenditures: Law 33,550 133,035 23,815 109,220 Police 451,346 3,020,473 2,035,496 984,977 Fire 76,367 191,144 415,985 (224,841) Health Services 338,392 92,839 245,553 Animal Services 19,245 11,989 7,256 Community Development 22,240 2,395,923 902,351 1,493,572 Culture and Recreation 300 1,189,528 1,193,314 (3,786) Total expenditures 583,803 7,287,740 4,675,789 2,611,951 Excess of revenues over (under) expenditures $ 1,700 (255,656) (255,656) Fund balance at beginning of year Cancellation of prior year encumbrances 35,716 Increase (decrease) in prior year encumbrances 219,940 Fund balance at end of year $
Grants Fund Year Ended June 30, 2021 117
CITY OF INDEPENDENCE, MISSOURI
Budgetary Basis Reconciliation Schedule Grants Fund
(1) Encumbrances for supplies and equipment ordered but not received are reported in the year the order is placed for budgetary purposes, but in the year the supplies are received for financial reporting purposes.
Exhibit 26.1
ended June 30, 2021 Grants Sources/Inflows of Resources: Actual amounts (budgetary basis) for total revenues from the budgetary comparison schedule $ 4,420,078 Basis differences – budget to GAAP: None Total revenues as reported on the statement of revenues, expenditures, and changes in fund balances – governmental funds $ 4,420,078 Uses/Outflows of resources: Actual amounts (budgetary basis) for total expenditures from the budgetary comparison schedule $ 4,675,789 Basis differences – budget to GAAP: Outstanding encumbrances at year-end charged to the current year’s budget (1) (370,232) Current year expenditures of encumbrances outstanding at the end of the prior fiscal year (1) 114,576 Total expenditures as reported on the statement of revenues, expenditures, and changes in fund balances – governmental funds $ 4,420,133
Year
118
CITY OF INDEPENDENCE, MISSOURI Budgetary Comparison Schedule CARES Act Fund
Year Ended June 30, 2021
Exhibit 27 Actual Variance Budgeted Amounts Amounts with Final Original Final (Budget Basis) Budget Revenues: Grants and other shared revenue $ 6,953,474 6,953,474 Total revenues 6,953,474 6,953,474 Expenditures: CARES Act 4,500,699 3,363,852 1,136,847 Total expenditures 4,500,699 3,363,852 1,136,847 Other financing uses: Transfers out 2,452,775 3,589,622 (1,136,847) Total other financing uses 2,452,775 3,589,622 (1,136,847) Total expenditures and other financing uses 6,953,474 6,953,474 Excess of revenues over (under) expenditures $ Fund balance at beginning of year Cancellation of prior year encumbrances Increase (decrease) in prior year encumbrances Fund balance at end of year $
119
CITY OF INDEPENDENCE, MISSOURI
Budgetary Basis Reconciliation Schedule CARES Act Fund
Basis differences – budget to GAAP: Outstanding encumbrances at year-end charged to the current year’s budget (1) Current year expenditures of encumbrances outstanding at the end of the prior fiscal year (1)
(1) Encumbrances for supplies and equipment ordered but not received are reported in the year the order is placed for budgetary purposes, but in the year the supplies are received for financial reporting purposes.
Exhibit 27.1
Sources/Inflows of Resources: Actual amounts (budgetary basis) for total revenues
budgetary comparison schedule $ 6,953,474 Basis differences – budget to GAAP: None Total revenues as reported on the statement of revenues, expenditures, and changes in fund balances – governmental funds $ 6,953,474 Uses/Outflows of resources: Actual amounts (budgetary basis) for total expenditures from the budgetary comparison schedule $ 3,363,852
Total expenditures
and changes in fund balances – governmental funds $ 3,363,852
Year ended June 30, 2021 CARES Act
from the
as reported on the statement of revenues, expenditures,
120
CITY OF INDEPENDENCE, MISSOURI
Budgetary Comparison Schedule
Exhibit 28 Actual Variance Budgeted Amounts Amounts with Final Original Final (Budget Basis) Budget Revenues: Use taxes $ 750,000 750,000 750,000 Investment income 769 769 Total revenues 750,000 750,000 750,769 769 Expenditures: Animal Services 744,152 820,652 820,620 32 Total expenditures 744,152 820,652 820,620 32 Excess of revenues over (under) expenditures and other financing uses $ 5,848 (70,652) (69,851) 801 Fund balance at beginning of year 220,840 Cancellation of prior year encumbrances Investment market value change 2,134 Increase (decrease) in prior year encumbrances 2,894 Fund balance at end of year $ 156,017
Ended June 30, 2021 121
Animal Services Use Tax Fund Year
CITY OF INDEPENDENCE, MISSOURI Budgetary Basis Reconciliation Schedule
(1) Encumbrances for supplies and equipment ordered but not received are reported in the year the order is placed for budgetary purposes, but in the year the supplies are received for financial reporting purposes.
Exhibit 28.1
ended June 30, 2021 Animal Services Use Tax Sources/Inflows of Resources: Actual amounts (budgetary basis) for total revenues from the budgetary comparison schedule $ 750,769 Basis differences – budget to GAAP: Investment Market Value Change 2,134 Total revenues as reported on the statement of revenues, expenditures, and changes in fund balances – governmental funds $ 752,903 Uses/Outflows of resources: Actual amounts (budgetary basis) for total expenditures from the budgetary comparison schedule $ 820,620 Basis differences – budget to GAAP: Outstanding encumbrances at year-end charged to the current year’s budget (1) (2,894) Current year expenditures of encumbrances outstanding at the end of the prior fiscal year (1) Total expenditures as reported on the statement of revenues, expenditures, and changes in fund balances – governmental funds $ 817,726
Year
122
Animal Services Use Tax Fund
CITY OF
MISSOURI Budgetary Comparison Schedule
INDEPENDENCE,
Police Use Tax Fund
Year Ended June 30, 2021
Exhibit 29 Actual Variance Budgeted Amounts Amounts with Final Original Final (Budget Basis) Budget Revenues: Use taxes $ 750,000 750,000 3,000,000 2,250,000 Investment income 20,161 20,161 Total revenues 750,000 750,000 3,020,161 2,270,161 Expenditures: Public Safety Capital Outlay 750,000 750,000 444,123 305,877 Total expenditures 750,000 750,000 444,123 305,877 Excess of revenues over (under) expenditures and other financing uses $ 2,576,038 2,576,038 Fund balance at beginning of year 937,998 Cancellation of prior year encumbrances Investment market value change 32,457 Increase (decrease) in prior year encumbrances Fund balance at end of year $ 3,546,493
123
CITY OF INDEPENDENCE, MISSOURI Budgetary Basis Reconciliation Schedule
Police Use Tax Fund
Year ended June 30, 2021
Outstanding encumbrances at year-end charged to the current year’s budget (1) Current year expenditures of encumbrances outstanding at the end of the prior fiscal year (1)
(1) Encumbrances for supplies and equipment ordered but not received are reported in the year the order is placed for budgetary purposes, but in the year the supplies are received for financial reporting purposes.
Exhibit 29.1
Police Use Tax Sources/Inflows of Resources: Actual amounts (budgetary basis) for total revenues from the budgetary comparison schedule $ 3,020,161 Basis differences – budget to GAAP: None 32,457 Total revenues as reported on the statement of revenues, expenditures, and changes in fund balances – governmental funds $ 3,052,618 Uses/Outflows of resources: Actual amounts (budgetary basis) for total expenditures from the budgetary comparison schedule $ 444,123 Basis differences – budget to
GAAP:
Total expenditures as reported on the statement of revenues, expenditures, and changes in fund balances – governmental funds $ 444,123
124
CITY OF INDEPENDENCE, MISSOURI
Exhibit 30 Actual Variance Budgeted Amounts Amounts with Final Original Final (Budget Basis) Budget Revenues: Real estate taxes $ 832,000 846,000 874,492 28,492 Charges for services 154,000 154,000 131,856 Investment income 1,536 1,536 Other revenue 113,262 113,262 Total revenues 986,000 1,000,000 1,121,146 143,290 Other Financing Sources: Transfers in 993 993 Total other financing sources 993 993 Total revenues and other financing sources 986,000 1,000,000 1,122,139 144,283 Expenditures: Health Services 70,350 93,527 (23,177) Animal Services 986,000 1,000,000 976,791 23,209 Total expenditures 986,000 1,070,350 1,070,318 32 Excess of revenues over (under) expenditures and other financing uses $ (70,350) 51,821 122,171 Fund balance at beginning of year Cancellation of prior year encumbrances Investment market value change 1,019 Increase (decrease) in prior year encumbrances 43,209 Fund balance at end of year $ 96,049
Budgetary Comparison Schedule Health Property Tax Levy Fund Year Ended June 30, 2021 125
CITY OF INDEPENDENCE, MISSOURI Budgetary Basis Reconciliation Schedule
Year ended June 30, 2021
(1) Encumbrances for supplies and equipment ordered but not received are reported in the year the order is placed for budgetary purposes, but in the year the supplies are received for financial reporting purposes.
Exhibit 30.1
Health
Sources/Inflows of Resources: Actual amounts (budgetary basis) for total revenues from the budgetary comparison schedule $ 1,121,146 Basis differences – budget to GAAP: Investment Market Value Change 1,019 Total revenues as reported on the statement of revenues, expenditures, and changes in fund balances – governmental funds $ 1,122,165 Uses/Outflows of resources: Actual amounts (budgetary basis) for total expenditures from the budgetary comparison schedule $ 1,070,318 Basis differences – budget to GAAP: Outstanding encumbrances at year-end charged to the current year’s budget (1) (43,209) Current year expenditures of encumbrances outstanding at the end of the prior fiscal year (1) Total expenditures as reported on the statement of revenues, expenditures, and changes in fund balances – governmental funds $ 1,027,109
Property Tax Levy
126
Health Property Tax Levy Fund
CITY OF INDEPENDENCE, MISSOURI Budgetary Comparison Schedule
Parks and Recreation Property Tax Levy Fund
Year Ended June 30, 2021
Exhibit 31 Actual Variance Budgeted Amounts Amounts with Final Original Final (Budget Basis) Budget Revenues: Real estate taxes $ 1,794,000 1,823,700 1,858,296 34,596 Charges for services 184,813 184,813 174,429 (10,384) Grants and other shared revenue 30,000 30,000 85,023 55,023 Investment income 4,457 4,457 Other revenue 26,064 26,064 Total revenues 2,008,813 2,038,513 2,148,269 109,756 Expenditures: Culture and Recreation 1,899,830 1,929,530 1,744,163 185,367 Total expenditures 1,899,830 1,929,530 1,744,163 185,367 Excess of Revenues Over (Under) Expenditures and Other Financing Uses $ 108,983 108,983 404,106 295,123 Fund balance at beginning of year Cancellation of prior year encumbrances Investment market value change 6,482 Increase (decrease) in prior year encumbrances 6,156 Fund balance at end of year $ 416,744
127
CITY OF INDEPENDENCE, MISSOURI Budgetary Basis Reconciliation Schedule
Parks and Recreation Property Tax Levy Fund
(1) Encumbrances for supplies and equipment ordered but not received are reported in the year the order is placed for budgetary purposes, but in the year the supplies are received for financial reporting purposes.
Exhibit 31.1
ended
Parks and Recreation PropertyTax Levy Sources/Inflows of Resources: Actual amounts (budgetary basis) for total revenues from the budgetary comparison schedule $ 2,148,269 Basis differences – budget to GAAP: Investment Market Value Change 6,482 Total revenues as reported on the statement of revenues, expenditures, and changes in fund balances – governmental funds $ 2,154,751 Uses/Outflows of resources: Actual amounts (budgetary basis) for total expenditures from the budgetary comparison schedule $ 1,744,163 Basis differences – budget to GAAP: Outstanding encumbrances at year-end charged to the current year’s budget (1) (6,156) Current year expenditures of encumbrances outstanding at the end of the prior fiscal year (1) Total expenditures as reported on the statement of revenues, expenditures, and changes in fund balances – governmental funds $ 1,738,007
Year
June 30, 2021
128
CITY
Exhibit 32
Balance Sheet Nonmajor Sales Tax Funds June 30, 2021 Street Park Police Fire Improvements Improvements Storm Water Public Safety Protection Total Assets Sales Tax Sales Tax Sales Tax Sales Tax Sales Tax (Exhibit 16) Pooled cash and investments $ 4,407,253 2,252,592 9,928,807 2,126,576 1,714,608 20,429,836 Receivables: Taxes 1,614,897 807,448 807,448 404,387 404,255 4,038,435 Accrued interest 15,764 8,325 35,483 7,584 6,118 73,274 Due from other funds 16,155 16,155 Due from other governments 76,631 76,631 Restricted assets 13,839,591 13,839,591 Total assets $ 19,954,136 3,068,365 10,787,893 2,538,547 2,124,981 38,473,922 Liabilities and Fund Balances Liabilities: Accounts and contracts payable $ 881,515 10,958 55,856 181,062 5,382 1,134,773 Due to other funds 2,125,552 2,125,552 Accrued items 3,798 89,222 52,030 7,541 152,591 Other current liabilities 3,124 5,319 8,443 Total liabilities 888,437 2,231,051 107,886 181,062 12,923 3,421,359 Fund Balances: Restricted 19,065,699 837,314 10,680,007 2,357,485 2,112,058 35,052,563 Total fund balances 19,065,699 837,314 10,680,007 2,357,485 2,112,058 35,052,563 $ 19,954,136 3,068,365 10,787,893 2,538,547 2,124,981 38,473,922 Total liabilities and fund balances 129
OF INDEPENDENCE, MISSOURI Combining
CITY OF INDEPENDENCE, MISSOURI
Combining Statement of Revenues, Expenditures, and Changes in Fund Balances Nonmajor Sales Tax Funds
ended June 30, 2021
Exhibit 33
Street Park Police Fire Improvements Improvements Storm Water Public Safety Protection Total Sales Tax Sales Tax Sales Tax Sales Tax Sales Tax (Exhibit 17) Revenues: Taxes $ 8,999,260 4,499,634 4,499,634 2,365,703 2,250,479 22,614,710 Intergovernmental 107,124 107,124 Charges for services 7,088 361,812 368,900 Investment income (loss) 35,544 21,445 21,089 (5,031) 10,827 83,874 Other 31,973 28,007 20,394 75,954 8,381 164,709 Total revenues 9,180,989 4,910,898 4,541,117 2,436,626 2,269,687 23,339,317 Expenditures: Current: Public Safety 2,952,782 1,349,822 4,302,604 Municipal Services 1,247,519 1,247,519 Culture and Recreation 3,182,378 3,182,378 Storm Water 2,174,015 2,174,015 Capital outlay 10,309,885 279,066 1,678,292 12,267,243 Debt service: Principal 52,083 61,354 113,437 Interest and fiscal agent fees 555,951 58,858 11,881 626,690 Total expenditures 12,113,355 3,572,385 3,852,307 2,952,782 1,423,057 23,913,886 Excess (deficiency) of revenues over expenditures (2,932,366) 1,338,513 688,810 (516,156) 846,630 (574,569) Other financing sources (uses): Capital lease proceeds 185,011 185,011 Transfers in 501,427 30,225 531,652 Transfers out (220,292) (169,233) (262,909) (652,434) Total other financing sources (uses) 466,146 30,225 (169,233) (262,909) 64,229 Net change in fund balances (2,466,220) 1,368,738 688,810 (685,389) 583,721 (510,340) Fund balances (deficit), beginning 21,531,919 (531,424) 9,991,197 3,042,874 1,528,337 35,562,903 Fund balances, ending $ 19,065,699 837,314 10,680,007 2,357,485 2,112,058 35,052,563 130
Year
CITY OF INDEPENDENCE, MISSOURI
Exhibit 34
Combining Balance Sheet Nonmajor Capital Projects Funds June 30, 2021 Revolving Buildings Street Public and Other Storm Park Total Assets Improvements Improvements Improvements Drainage Improvements (Exhibit 14) Pooled cash and investments $ 36,908 21,536 252,065 32,204 342,713 Receivables: Special assessment principal and accrued interest 382,202 382,202 Accrued interest 86 77 879 115 1,157 Total assets $ 419,196 21,613 252,944 32,319 726,072 Liabilities and Fund Balances Liabilities: Accounts and contracts payable $ 149,809 149,809 Due to other funds 16,155 16,155 Other current liabilities 840 840 Unearned revenue 100,800 100,800 Total liabilities 250,609 16,155 840 267,604 Deferred Inflows of Resources: Unavailable revenue - special assessments 382,202 382,202 Total deferred inflows of resources 382,202 382,202 Fund Balances (deficit): Committed 36,994 21,613 2,335 31,479 92,421 Unassigned (16,155) (16,155) Total fund balances (deficit) 36,994 21,613 2,335 (16,155) 31,479 76,266 $ 419,196 21,613 252,944 32,319 726,072 Total liabilities, deferred inflows of resources and fund balances 131
CITY OF INDEPENDENCE, MISSOURI
Combining Statement of Revenues, Expenditures, and Changes in Fund Balances (Deficit)
Nonmajor Capital Projects Funds
Year ended June 30, 2021
Exhibit 35
Revolving Buildings Street Public and Other Storm Park Total Improvements Improvements Improvements Drainage Improvements (Exhibit 15) Revenues: Intergovernmental $ 107,716 107,716 Charges for services 9,978 9,978 Investment income (loss) (1,145) 35 4,109 53 3,052 Other 5,289 5,289 Total revenues 116,549 35 9,398 53 126,035 Expenditures: Capital outlay 120,147 187,324 307,471 Total expenditures 120,147 187,324 307,471 Excess (deficiency) of revenues over expenditures (3,598) 35 (177,926) 53 (181,436) Other financing sources: Transfers in 88,514 604,751 693,265 Transfers out (76,083) (420,025) (496,108) Total other financing sources 12,431 184,726 197,157 Net change in fund balances 8,833 35 6,800 53 15,721 Fund balances (deficit), beginning 28,161 21,578 (4,465) (16,155) 31,426 60,545 Fund balances (deficit), ending $ 36,994 21,613 2,335 (16,155) 31,479 76,266 132
CITY OF INDEPENDENCE, MISSOURI Combining Balance Sheet Component
Falls at Midtown RSO - Hartman Drumm Eastland North Mount Crackerneck - Old Landfill - Cinema EastAssets Truman Cargo Largo Santa Fe Heritage Farm Center Independence Washington Bass Pro Stone Canyon Blue Ridge Trinity Pooled cash and investments $ 1,568 441,000 1,571,194 9,757,238 7,731 49,238 4,195,601 7,216 60,996 50,995 Receivables: Taxes 35,910 1,149,066 8,812 2,996,936 31,635 1,737 779,782 643,880 128,860 332,643 Accounts 68,068 Accrued Interest 6 5,604 51,309 176 7,074 Due from other funds 4,629,661 Due from other governments 16,324 28,801 2,237 284,156 1,603 34 248,094 1,298 13,520 12,265 Restricted cash and investments 557,832 896,225 6,342,109 Total assets $ 1,574 1,051,066 1,177,867 1,587,847 18,615,525 40,969 51,185 11,640,728 652,394 203,376 395,903 Liabilities, Deferred Inflows of Resources and Fund Balances Liabilities: Accounts and contracts payable $ 1,500 11,465 Due to other funds 1,573,433 3,056,228 1,919 Total liabilities 1,573,433 3,056,228 1,500 13,384 Deferred Inflows of Resources: Unavailable revenue - real estate taxes 35,250 1,121,266 6,412 2,713,836 29,035 1,737 604,632 642,540 123,060 326,543 Total deferred inflows of resources 35,250 1,121,266 6,412 2,713,836 29,035 1,737 604,632 642,540 123,060 326,543 Fund Balances: Restricted 1,574 1,579,935 15,901,689 11,934 49,448 11,022,712 9,854 80,316 69,360 Unassigned (557,617) (2,999,627) — Total fund balances (deficits) 1,574 (557,617) (2,999,627) 1,579,935 15,901,689 11,934 49,448 11,022,712 9,854 80,316 69,360 $ 1,574 1,051,066 1,177,867 1,587,847 18,615,525 40,969 51,185 11,640,728 652,394 203,376 395,903 Total liabilities, deferred inflows of resources and fund balances
Unit - Tax Increment Financing June 30, 2021 133
Assets Pooled cash and investments $ Receivables: Taxes Accounts Accrued Interest Due from other funds Due from other governments Restricted cash and investments Total assets $ Liabilities, Deferred Inflows of Resources and Fund Balances Liabilities: Accounts and contracts payable $ Due to other funds Total liabilities Deferred Inflows of Resources: Unavailable revenue - real estate taxes Total deferred inflows of resources Fund Balances: Restricted Unassigned Total fund balances (deficits) $ Total liabilities, deferred inflows of resources and fund balances Exhibit 36 HCA - 23rd & Noland 23rd & Noland 23rd & Noland 23rd & Noland Independence Little Blue Little Blue Marketplace Marketplace TIF App Centerpoint Project 1 Project 2 Project 3 Project 4 Square Parkway 1 Parkway 3 Shopping Center 1 Shopping Center 2 Fees Eliminations Total 1,156,656 59,738 20,745 232 842 644,872 52,793 90,931 25,265 22,949 18,217,800 4,784,209 44,236 12,530 13,965 180,114 309,238 659,481 244,207 46,116 52,869 12,456,226 68,068 4,091 74 143 1,433 2,300 6,373 1,172 79,755 (4,629,661) 2,745 8,552 1,311 3,463 43,287 103,751 9,123 28,937 5,695 815,196 3,378,566 11,174,732 9,326,267 112,526 34,660 17,803 225,676 956,410 822,398 345,433 100,318 81,513 (4,629,661) 42,811,777 12,965 (4,629,661) 1,919 (4,629,661) 14,884 4,781,809 39,686 11,400 11,065 152,114 307,838 563,781 237,907 37,516 47,069 11,794,496 4,781,809 39,686 11,400 11,065 152,114 307,838 563,781 237,907 37,516 47,069 11,794,496 4,544,458 72,840 23,260 6,738 73,562 648,572 258,617 107,526 62,802 34,444 34,559,641 (3,557,244) 4,544,458 72,840 23,260 6,738 73,562 648,572 258,617 107,526 62,802 34,444 31,002,397 9,326,267 112,526 34,660 17,803 225,676 956,410 822,398 345,433 100,318 81,513 (4,629,661) 42,811,777 134
CITY OF INDEPENDENCE, MISSOURI
Combining Schedule of Revenues, Expenditures, and Changes in Fund Balances (Deficit) Component Unit - Tax Increment Financing Year ended June 30, 2021
Falls at Midtown RSO - Hartman Drumm Eastland North Mount Crackerneck - Old Landfill - Cinema EastTruman Cargo Largo Santa Fe Heritage Farm Center Independence Washington Bass Pro Stone Canyon Blue Ridge Trinity Revenues: Taxes $ (1,621) 20,014 1,417,766 615,649 5,862,201 48,772 2,009 2,219,455 642,814 263,284 442,493 Investment income (loss) 2 60,847 (1,025) 93,748 460 111 60,236 3,871 18 24 Other 101,717 1,086,380 Total revenues 2 (1,621) 182,578 1,417,766 614,624 5,955,949 49,232 2,120 3,366,071 646,685 263,302 442,517 Expenditures: Tax Increment Financing 14,101 7,898 29,330 19,463 367,980 69,231 60 78,475 640,773 219,098 245,387 Debt service: Principal 190,000 1,815,000 832,287 3,005,000 50,000 Interest and fiscal agent fees 334,237 74,869 24,601 291,650 3,777,571 Debt issuance costs 1,216,641 Total expenditures 14,101 532,135 1,919,199 876,351 3,664,630 69,231 60 5,122,687 640,773 219,098 245,387 Excess (deficiency) of revenues over expenditures 2 (15,722) (349,557) (501,433) (261,727) 2,291,319 (19,999) 2,060 (1,756,616) 5,912 44,204 197,130 Other Financing Sources: Issuance of debt - refunding 35,920,000 Reoffering premium/original issue discount 4,689,862 Payment to refunded loans escrow agent (43,475,884) Transfers in 441,000 108,178 1,451,761 2,114,000 40,808 Transfers out (108,178) (1,031,736) (40,808) Total other financing sources 441,000 420,025 (752,022) Net change in fund balances 2 (15,722) 91,443 (501,433) (261,727) 2,711,344 (19,999) 2,060 (2,508,638) 5,912 44,204 197,130 Fund balances (deficits), beginning 1,572 15,722 (649,060) (2,498,194) 1,841,662 13,190,345 31,933 47,388 13,531,350 3,942 36,112 (127,770) Fund balances (deficits), ending $ 1,574 (557,617) (2,999,627) 1,579,935 15,901,689 11,934 49,448 11,022,712 9,854 80,316 69,360
135
Revenues: Taxes $ Investment income (loss) Other Total revenues Expenditures: Tax Increment Financing Debt service: Principal Interest and fiscal agent fees Debt issuance costs Total expenditures Excess (deficiency) of revenues over expenditures Other Financing Sources: Issuance of debt - refunding Reoffering premium/original issue discount Payment to refunded loans escrow agent Transfers in Transfers out Total other financing sources Net change in fund balances Fund balances (deficits), beginning Fund balances (deficits), ending $ Exhibit 37 HCA - 23rd & Noland 23rd & Noland 23rd & Noland 23rd & Noland Independence Little Blue Little Blue Marketplace Marketplace TIF App Centerpoint Project 1 Project 2 Project 3 Project 4 Square Parkway 1 Parkway 3 Shopping Center 1 Shopping Center 2 Fees Total 4,582,703 91,614 22,374 39,450 384,239 171,814 1,834,457 363,004 150,855 125,278 19,298,624 36,878 20 333 669 6,753 3,964 30,126 8,893 29 28 305,985 24,474 1,212,571 4,619,581 91,634 22,707 40,119 390,992 175,778 1,864,583 371,897 150,884 125,306 24,474 20,817,180 1,697,465 45,758 1,788 769 7,846 84,919 188,699 6,200 118,675 128,890 300 3,973,105 2,030,000 7,922,287 955,350 5,458,278 1,216,641 4,682,815 45,758 1,788 769 7,846 84,919 188,699 6,200 118,675 128,890 300 18,570,311 (63,234) 45,876 20,919 39,350 383,146 90,859 1,675,884 365,697 32,209 (3,584) 24,174 2,246,869 35,920,000 4,689,862 (43,475,884) 8,409 4,164,156 (8,409) (40,000) (401,000) (1,786,000) (328,000) (3,744,131) (40,000) (401,000) (1,786,000) (328,000) (2,445,997) (63,234) 45,876 20,919 (650) (17,854) 90,859 (110,116) 37,697 32,209 (3,584) 24,174 (199,128) 4,607,692 26,964 2,341 7,388 91,416 557,713 368,733 69,829 30,593 38,028 (24,174) 31,201,525 4,544,458 72,840 23,260 6,738 73,562 648,572 258,617 107,526 62,802 34,444 31,002,397 136
CITY OF INDEPENDENCE, MISSOURI
Internal Service Funds
Internal Service Funds are used to account for the financing of goods or services provided by one department or agency to other departments or agencies of the government and to other governmental units on a cost-reimbursement basis.
Central Garage – This fund is used to account for costs of maintenance of the City’s fleet of vehicles and mobile equipment and related charges to other departments.
Staywell Health Care – This fund is used to account for the costs of the City’s self-insured healthcare plan.
Workers’ Compensation – This fund is used to account for the costs of the City’s self-insured Worker’s Compensation claims and administration plan.
Risk Management – This fund is used to account for the costs of the City’s liability insurance and risk management claims.
Enterprise Resource Planning – This fund is used to account for the costs of the City’s Enterprise Resource Planning (ERP) computer system.
MISSOURI
Exhibit 38
Combining Statement of Net Position Internal Service Funds June 30, 2021 Staywell Enterprise Central Health Workers' Risk Resource Total Garage Care Compensation Management Planning (Exhibit 5) Assets: Current Assets: Pooled cash and investments $ 384,573 1,944,983 269,492 1,355,168 3,954,216 Accounts receivable 719 11,152 11,871 Accrued interest receivable 1,400 826 4,833 7,059 Inventory 196,562 196,562 Total current assets 583,254 1,956,135 270,318 1,360,001 4,169,708 Noncurrent Assets: Capital assets: Land 93,979 93,979 Depreciable property, plant, and equipment 295,748 5,955,185 6,250,933 Less accumulated depreciation (263,389) (667,670) (931,059) Net pension asset 260,184 501,894 762,078 Restricted cash and investments 200,359 200,359 Total noncurrent assets 386,522 200,359 5,789,409 6,376,290 Total assets 969,776 1,956,135 470,677 1,360,001 5,789,409 10,545,998 Deferred Outflows of Resources: 2,614 2,153 4,767 253,063 159,339 412,402 Total deferred outflows of resources 255,677 161,492 417,169 $ 1,225,453 1,956,135 470,677 1,360,001 5,950,901 10,963,167 Liabilities: Current Liabilities: Accounts and contracts payable $ 71,460 20,000 8,075 6,090 18,735 124,360 Due to other funds 3,807,097 3,807,097 Accrued liabilities 14,305 960 (10,326) 765 38,377 44,081 Compensated absences – current 45,550 45,550 Self-insurance claims payable 1,645,670 2,223,215 3,868,885 Total current liabilities 131,315 1,666,630 2,220,964 6,855 3,864,209 7,889,973 Noncurrent Liabilities: Compensated absences – long-term 39,278 39,278 Total OPEB liability 1,759,598 205,366 1,964,964 Self-insurance claims payable 6,595,458 6,595,458 Total noncurrent liabilities 1,798,876 6,595,458 205,366 8,599,700 Total liabilities 1,930,191 1,666,630 8,816,422 6,855 4,069,575 16,489,673 Deferred Inflows of Resources: Pension related amounts 501,253 412,827 914,080 10,321 10,321 Total deferred inflows of resources 511,574 412,827 924,401 Net Position: Net Investment in capital assets 126,338 5,287,515 5,413,853 Restricted for: Worker's compensation escrow 200,359 200,359 Unrestricted (1,342,650) 289,505 (8,546,104) 1,353,146 (3,819,016) (12,065,119) Total net position (deficit) (1,216,312) 289,505 (8,345,745) 1,353,146 1,468,499 (6,450,907) $ 1,225,453 1,956,135 470,677 1,360,001 5,950,901 10,963,167 Total assets & deferred outflows of resources Total liabilities, deferred inflows of resources and net position Pension related amounts Other post-employment benefits Other post-employment benefits 137
CITY OF INDEPENDENCE,
CITY OF INDEPENDENCE, MISSOURI
Combining Statement of Revenues, Expenses, and Changes in Net Position
Exhibit 39
Internal Service Funds Year ended June 30, 2021 Staywell Enterprise Central Health Workers' Risk Resource Total Garage Care Compensation Management Planning (Exhibit 6) Operating Revenues: Charges for services $ 1,651,965 17,506,241 3,558,840 2,991,000 1,430,000 27,138,046 Miscellaneous operating 5,830 310,944 1,102 317,876 Total operating revenues 1,657,795 17,817,185 3,559,942 2,991,000 1,430,000 27,455,922 Operating Expenses: Personnel services 594,492 171,600 13,591 13,593 444,134 1,237,410 Other services 430,032 22,082,732 3,450,534 2,224,127 968,986 29,156,411 Supplies 671,325 146 328 48,600 720,399 Depreciation and amortization 4,852 417,076 421,928 Total operating expenses 1,700,701 22,254,478 3,464,125 2,238,048 1,878,796 31,536,148 Operating income (loss) (42,906) (4,437,293) 95,817 752,952 (448,796) (4,080,226) Nonoperating Revenues: Investment income (loss) (1,701) 4,769 5,469 12,000 20,537 Miscellaneous revenue 6,381 1,410,026 38,605 13 1,455,025 Total nonoperating revenue 4,680 1,414,795 44,074 12,013 1,475,562 Income (loss) before transfers (38,226) (3,022,498) 139,891 764,965 (448,796) (2,604,664) Transfers in 2,775,613 2,775,613 Change in net position (38,226) (3,022,498) 139,891 764,965 2,326,817 170,949 Total Net Position: Beginning of the year (deficit) (1,178,086) 3,312,003 (8,485,636) 588,181 (858,318) (6,621,856) End of the year (deficit) $ (1,216,312) 289,505 (8,345,745) 1,353,146 1,468,499 (6,450,907) 138
CITY OF INDEPENDENCE, MISSOURI Combining
Exhibit 40
Statement of Cash Flows Internal Service Funds Year ended June 30, 2021 Internal Service Funds Enterprise Central Staywell Workers' Risk Resource Total Garage Health Care Compensation Management Planning (Exhibit 7) Cash Flows from Operations: Receipts from customers $ 1,664,818 19,217,937 3,604,280 2,991,013 1,430,000 28,908,048 Payments to suppliers (1,073,471) (22,466,508) (2,499,584) (2,338,938) (1,001,365) (29,379,866) Payments to employees (748,562) (170,640) (139,697) (12,828) (527,717) (1,599,444) Net cash provided by (used in) operating activities (157,215) (3,419,211) 964,999 639,247 (99,082) (2,071,262) Cash Flows from Noncapital Financing Activities: Transfers in (out) (699,791) 4,662,581 3,962,790 Net cash provided (used) by noncapital financing activities (699,791) 4,662,581 3,962,790 Cash Flows from Capital and Related Financing Activities: Acquisition and construction of capital assets (4,563,499) (4,563,499) Net cash (used in) capital and related financing activities (4,563,499) (4,563,499) Cash Flows from Investing Activities: Interest on investments (1,114) 4,769 4,643 9,729 18,027 Net cash provided by (used in) investing activities (1,114) 4,769 4,643 9,729 18,027 Net increase (decrease) in cash and cash equivalents (158,329) (3,414,442) 269,851 648,976 (2,653,944) Cash and cash equivalents at beginning of year 542,902 5,359,425 200,000 706,192 6,808,519 Cash and cash equivalents at end of year $ 384,573 1,944,983 469,851 1,355,168 4,154,575 Components of cash and short-term investments at end of fiscal year Unrestricted assets 384,573 1,944,983 269,492 1,355,168 3,954,216 Restricted assets 200,359 200,359 Pooled cash and investments $ 384,573 1,944,983 469,851 1,355,168 4,154,575 Reconciliation of operating income (loss) to net cash provided (used) by operating activities: Operating income (loss) $ (42,906) (4,437,293) 95,817 752,952 (448,796) (4,080,226) Depreciation and amortization 4,852 417,076 421,928 Miscellaneous revenue 6,381 1,410,026 38,605 13 1,455,025 Change in assets and liabilities: Accounts receivable 642 (9,274) 5,733 (2,899) Inventory (22,279) (22,279) Net pension asset (260,184) (501,894) (762,078) Deferred outflows (53,618) 11,996 (101,584) (143,206) Accounts and contracts payable 50,165 20,000 (11,000) (114,483) 16,221 (39,097) Accrued liabilities (16,393) (402,670) (11,633) 765 34,196 (395,735) Other post-employment benefits and net pension liability (268,123) (136,265) 82,048 (322,340) Self-insurance claims payable 973,583 973,583 Compensated absences (41,974) (41,974) Deferred inflows 486,222 (1,837) 403,651 888,036 Total adjustments (114,309) 1,018,082 869,182 (113,705) 349,714 2,008,964 Net cash provided by (used in) operating activities $ (157,215) (3,419,211) 964,999 639,247 (99,082) (2,071,262) Adjustments to reconcile operating income (loss) to net cash provided (used) by operating activities: 139
CITY OF INDEPENDENCE, MISSOURI
Combining Statement of Fiduciary Net Position Custodial Funds
Exhibit 41 Flexible Susie Block Senior Travel Benefit Plan Trust Program Total Assets: Pooled cash and investments $ 169,757 35,198 25,599 230,554 Accrued interest receivable 526 91 617 Total assets 169,757 35,724 25,690 231,171 Restricted for: Individuals and organizations 169,757 35,724 25,690 231,171 Total net position $ 169,757 35,724 25,690 231,171
June 30, 2021 140
CITY OF INDEPENDENCE, MISSOURI
Combining Statement of Changes in Fiduciary Net Position Custodial
Exhibit 42 Flexible Susie Block Senior Travel Benefit Plan Trust Program Total Additions: Contributions $ 405,575 405,575 Interest on investments 413 1,343 42 1,798 Total additions 405,988 1,343 42 407,373 Deductions: Benefits paid to participants 434,100 434,100 Award distribution 1,000 1,000 Total deductions 434,100 1,000 435,100 Change in net position (28,112) 343 42 (27,727) Net position, beginning 197,869 35,381 25,648 258,898 Net position, ending $ 169,757 35,724 25,690 231,171
141
Funds Year ended June 30, 2021
CITY OF INDEPENDENCE, MISSOURI
Schedules of Operating Expenses – Power and Light Fund
Years ended June 30, 2021 and 2020
Exhibit 43
2021 2020 Operations Maintenance Total Operations Maintenance Total Production Fuel: Gas $ 10,227,348 5,638,503 Oil 2,093,241 570,841 Total production fuel 12,320,589 6,209,344 Purchased Power: Purchased energy 19,128,674 18,280,102 Purchased capacity (net) 21,501,774 22,085,730 Border customers 68,071 70,284 Control and dispatching 2,883,033 3,043,130 Total purchased power 43,581,552 43,479,246 Production (Other): Blue Valley Station: Supervision and engineering $ (552) 139,852 139,300 1,373,526 297,486 1,671,011 Steam 11,278 (80,656) (69,378) 947,901 457,104 1,405,006 Electric 874 (26,289) (25,415) 291,704 296,805 588,508 Structures and improvements 6,357 6,357 86,337 86,337 Miscellaneous 193,764 855,763 1,049,527 620,362 679,632 1,299,995 205,363 895,027 1,100,391 3,233,493 1,817,364 5,050,857 Missouri City Station: Steam Structures and improvements Miscellaneous Combustion Turbine Station: Supervision and engineering 1,225,697 803,993 2,029,690 2,390,886 2,390,886 Generation expenses 1,438 869,982 871,420 4,863 817,410 822,273 Structures and improvements 73,933 73,933 Miscellaneous 52,343 478,476 530,819 22,060 22,060 1,279,477 2,226,384 3,505,862 2,417,809 817,410 3,235,219 Total production (other) $ 1,484,841 3,121,412 4,606,253 5,651,302 2,634,774 8,286,076 Transmission and Distribution: Transmission: Supervision and engineering $ 329,008 15,276 344,284 390,844 18,856 409,700 Overhead expenses 171,148 915 172,063 11,130 11,130 Station expenses 5,975 52,488 58,462 7,319 18,288 25,607 Wheeling charges 7,622,979 7,622,979 Underground line expense 7 7 2,203 4,574 6,777 Miscellaneous 7,910,992 128,303 8,039,294 69,396 69,396 Total transmission 8,417,130 196,981 8,614,110 8,034,475 111,114 8,145,589 (Continued) 142
CITY OF INDEPENDENCE, MISSOURI
Exhibit 43
Schedules of Operating Expenses – Power and Light Fund Years ended June 30, 2021 and 2020 2021 2020 Operations Maintenance Total Operations Maintenance Total Distribution: Supervision and engineering $ 262,426 45,828 308,254 789,655 55,049 844,704 Overhead lines 752,903 6,213,760 6,966,663 926,482 4,952,182 5,878,664 Station expenses 169,725 1,296,196 1,465,921 54,981 1,607,976 1,662,957 Street lights and traffic signals 264,656 507,219 771,876 364,072 640,497 1,004,569 Meters 127,371 818,666 946,037 153,372 833,644 987,016 Customer installations 314,388 314,388 127,048 127,048 Underground lines 645,155 1,199,721 1,844,875 429,416 664,829 1,094,245 Dispatching communication 525,672 525,672 468,075 468,075 Line transformers 218,238 218,238 230,030 230,030 Miscellaneous 743,269 314,668 1,057,937 524,969 348,295 873,263 Total distribution 3,805,565 10,614,296 14,419,861 3,838,070 9,332,501 13,170,571 Total transmission and distribution $ 12,222,694 10,811,277 23,033,971 11,872,545 9,443,615 21,316,160 Customer Service: Supervision $ 226,025 179,489 Meter reading 645,070 853,858 Customer records and collections 2,347,769 2,165,522 Provisions for doubtful accounts 44,593 1,151,893 Miscellaneous 211,968 205,331 Total customer service 3,475,425 4,556,093 General and Administrative: Salaries 1,377,449 1,619,931 Office supplies 534,319 376,247 Insurance 1,250 1,595,003 Injuries and damage 746,886 528,700 Employee benefits 7,260,951 10,285,733 Outside services 5,351,469 2,685,130 Miscellaneous 2,441,878 1,503,249 Total general and administrative 17,714,202 18,593,994 Depreciation and amortization 10,441,932 13,276,440 Payroll taxes 855,572 1,154,658 Total operating expenses $ 116,029,495 116,872,011 143
CITY OF INDEPENDENCE, MISSOURI
Schedule of Operating Statistics – Power and Light Fund
Year ended June 30, 2021
Exhibit 44
Number of customers Beginning of year End of year Revenue KWH Sale of Electric Energy: Metered: Residential 54,565 54,700 $ 68,031,413 517,417,424 Small general services 3,051 2,985 3,759,761 22,886,710 General services – space heating 27 23 391,149 771,450 Large general services 1,691 1,663 30,796,545 260,218,790 Large general services – prime voltage 7 8 859,603 8,347,543 Total electric general services 122 112 4,395,615 47,246,989 Schools, churches, and hospitals 222 201 1,024,467 8,092,976 Schools, churches, and hospitals, all electric 2 2 6,429 51,157 Education 70 64 3,179,145 28,380,336 Education, all electric 16 8 328,516 3,727,640 Large power services 5 3 2,354,109 25,910,540 Combined interruptible services 2 2 2,254,470 32,858,200 Sewer pumping 8 5 111,794 966,191 Municipal City Bills 62 32,897 214,904 City traffic signals 63 100 987,936 11,945,769 Wholesale (border customers) 94,030 1,698,443 Wholesale (interchange) 4,945,770 140,233,513 Wholesale (border customers) 59,851 59,938 123,553,650 1,110,968,575 Unmetered: Wholesale (interchange) Private security lighting 1,638 419,524 1,198,503 City Public Street lighting 12,368 3,737,637 14,006 419,524 4,936,140 Change in unbilled revenue (1,508,485) Other operating revenue 6,044,035 EVTC 40,249 Total operating revenue and total energy sales $ 128,548,974 1,115,904,715 Net generation 232,187,477 Wholesale power purchased 931,377,718 Net generation and power purchased 1,163,565,195 Retail energy sales 1,104,651,802 Wholesale (border customers) sales 1,698,443 Power and light usage (building and substations) 1,253,204 Net disposition 1,107,603,449 Transmission and distribution operating losses 55,961,746 144
are presented as a reduction of operating expenses, whereas they are included as miscellaneous revenue in the statement of
CITY OF INDEPENDENCE, MISSOURI
Exhibit 45
Years ended June 30, 2021 and 2020 2021 2020 Operations Maintenance Total Operations Maintenance Total Production: Source of Supply: Supervision and engineering $ 16,552 16,552 Labor and expenses 380,763 1,565 382,328 459,954 5,349 465,303 Structures and improvements 52,312 52,312 28,147 28,147 Miscellaneous 184,094 184,094 437,274 437,274 Total source of supply 380,763 237,971 618,734 476,506 470,770 947,276 Power and Pumping: Supervision and engineering 36,980 36,980 22,215 49,840 72,055 Fuel/power purchased 2,000,352 2,000,352 1,903,713 1,903,713 Labor and expenses 1,026,285 1,026,285 623,143 623,143 Structures and improvements 49,890 49,890 32,528 32,528 Miscellaneous 2,970 2,970 2,698 2,698 Total power and pumping 3,026,637 89,840 3,116,477 2,549,071 85,066 2,634,137 Water Treatment: Supervision and engineering 26,529 11,230 37,759 Chemicals 1,432,845 1,432,845 1,476,816 1,476,816 Labor and expenses 1,879,925 1,879,925 1,282,382 1,282,382 Structures and improvements 873,736 873,736 988,625 988,625 Miscellaneous 348,287 348,287 256,693 256,693 Total water treatment 3,312,770 1,222,023 4,534,793 2,785,727 1,256,548 4,042,275 Total production $ 6,720,170 1,549,834 8,270,004 5,811,304 1,812,384 7,623,688 Transmission and Distribution: Supervision and engineering $ 79,333 18,820 98,153 Storage facilities 18,208 18,208 23,554 23,554 Transmission and distribution lines 1,013,831 1,197,168 2,210,999 1,000,736 1,363,230 2,363,966 Meters 59,134 54,067 113,201 57,828 52,201 110,029 Customer installations 82,812 82,812 82,075 82,075 Services 52,367 52,367 Hydrants 107,403 107,403 15,912 15,912 Miscellaneous 573,628 107,636 681,264 451,017 133,924 584,941 Total transmission and distribution $ 1,747,613 1,518,641 3,266,254 1,694,543 1,584,087 3,278,630 Customer Service: Customer accounting paid and collecting: Supervision $ 344,935 283,155 Meter reading 1,422,068 1,220,667 Customer records 1,019,562 321,079 Provision for uncollectible amounts 71,129 209,242 Total customer accounting paid and collecting 2,857,694 2,034,143 Sales Promotion: Expenses Total customer service 2,857,694 2,034,143 General and Administrative: Salaries 791,677 905,592 Office supplies and expense 394,738 474,805 Injuries and damages 265,803 411,319 Employee benefits 2,427,894 3,230,951 Pension actuarial adjustment (2,240,246) Outside services 2,051,363 1,435,974 Miscellaneous 385,556 408,924 Total general and administrative 4,076,785 6,867,565 Depreciation and amortization 3,172,568 3,159,203 Payroll taxes 388,097 389,298 Other 62,856 34,733 Total operating expenses 22,094,258 23,387,260 Certain
revenues, expenses, and changes
fund net position 2,259,071 1,412,774 $ 24,353,329 24,800,034 145
Schedules of Operating Expenses – Water Fund
amounts
in
CITY OF INDEPENDENCE, MISSOURI
Schedule of Operating Statistics – Water Fund
Year ended June 30, 2021
Exhibit 46
Number of customers Beginning of year End of year Revenue MGS* Sale of Water: Residential 44,628 44,768 $ 13,691,456 2,304,576 Commercial 3,723 3,802 5,695,898 1,144,599 Industrial 6 6 609,886 190,962 Public authority 195 194 216,085 40,837 Resale 14 14 9,968,029 4,792,653 Private fire protection 478 490 183,991 Public fire protection 1,685,690 49,044 49,274 32,051,035 8,473,627 Change in unbilled revenue 356,006 Other operating revenue 241,314 Total operating revenue $ 32,648,354 Thousands of gallons pumped: Courtney Bend Plant 9,820,776 Less total sales 8,473,627 Unaccounted for water 1,347,149 * Thousand gallons sold. 146
CITY OF INDEPENDENCE, MISSOURI
Schedule of Operating Statistics – Sanitary Sewer Fund
Year ended June 30, 2021
Exhibit 47
Number of customers Beginning of year End of year Revenue CCF* Sale of Sanitary Sewer Services: Residential 41,739 42,015 $ 19,705,726 2,351,079 Commercial: Base 3,508 3,469 7,674,458 1,292,115 Surcharge 710,894 Contract waste treatment 341,767 Regulatory Compliance 5,955,820 Intermunicipal agreements: Sugar Creek 967,954 Kansas City 169,323 45,247 45,484 35,525,942 3,643,194 Other operating revenue 121,029 Change in unbilled revenue 517,837 Total operating revenue $ 36,164,808 * Hundred cubic feet. 147
STATISTICAL DATA
The statistical data “relates to the physical, economic, social, and political characteristics of the City.” Its design is to provide “a broader and more complete understanding of the City and its financial affairs than is possible from the financial statements, notes, and supporting schedule presentation in the Financial Section.”
STATISTICAL SECTION
This part of the City of Independence's comprehensive annual financial report presents detailed information as a context for understanding what the information in the financial statements, note disclosures, and required supplementary information says about the City's overall financial health.
Contents
Financial Trends
These schedules contain trend information to help the reader understand how the City's financial performance and well-being have changed over time.
Revenue Capacity
These schedules contain information to help the reader assess the City's most significant local revenue sources.
Debt Capacity
These schedules present information to help the reader assess the affordability of the City's current levels of outstanding debt and the City's ability to issue additional debt in the future
Demographic and Economic Information
These schedules offer demographic and economic indicators to help the reader understand the environment within which the City's financial activities take place.
Operating Information
These schedules contain service and infrastructure data to help the reader understand how the information in the City's financial report relates to the services the City provides and the activities it performs.
Sources: Unless otherwise noted, the information in these schedules is derived from the comprehensive annual financial reports for the relevant year.
Tables
1 - 4
5 - 15
16 - 20
21 - 22
23 - 25
148
City of Independence, Missouri Net Position by Component Last Ten Fiscal Years (accrual basis of accounting)
Note: In 2011 the Events Center LLC was added as a blended component unit under the business-type activities.
Note: In 2012 the Tax Increment Financing funds were added back to the primary government presentation as a blended component unit.
Note: In 2012 the Events Center Community Improvement District was added as a blended component unit under the business-type activities.
Note: In 2012 the Crackerneck Creek Transportation Development District was added as a blended component unit under the governmental activities.
Note: In 2015 the City adopted GASB Statement No. 68, which restated beginning net position. For the years prior to 2015, the amounts in this schedule have not been restated.
Note: In 2018 the City adopted GASB Statement No. 75, which restated beginning net position. For the years prior to 2018, the amounts in this schedule have not been restated.
Note: In 2019 the City implemented significant changes to healthcare coverage by moving retirees into a separate Medicare progam which resulted in a decrease to the City's recorded Other Post Employment Benefits (OPEB) liability, resulting in an increase to net position.
Table 1 2012 2013 2014 2015 2016 2017 2018 2019 2020 2021 Governmental activities Net investment in capital assets $ 334,320,197 336,357,164 333,902,700 334,319,837 330,518,564 325,298,654 324,198,133 319,052,806 311,168,595 309,489,295 Restricted 17,220,970 16,853,297 16,931,671 16,335,599 14,823,334 13,785,094 18,741,314 18,602,877 22,279,174 24,490,689 Unrestricted (219,659,905) (231,199,039) (233,876,307) (255,063,735) (259,618,128) (266,833,068) (378,520,677) (269,187,817) (271,260,070) (258,060,366) Total governmental activities net position $ 131,881,262 122,011,422 116,958,064 95,591,701 85,723,770 72,250,680 (35,581,230) 68,467,866 62,187,699 75,919,618 Business-type activities $ Net investment in capital assets 262,631,937 251,523,417 240,517,938 230,396,460 238,427,241 216,148,308 214,381,085 216,116,969 211,224,057 222,514,950 Restricted 14,629,418 15,545,776 16,288,747 16,587,288 17,608,769 22,390,679 23,202,738 25,007,273 25,084,135 25,448,806 Unrestricted 46,597,826 45,095,514 59,212,898 49,598,827 33,115,833 53,123,997 8,070,332 57,814,152 69,117,824 54,975,581 Total business-type activities net position $ 323,859,181 312,164,707 316,019,583 296,582,575 289,151,843 291,662,984 245,654,155 298,938,394 305,426,016 302,939,337 Primary government Net investment in capital assets $ 596,952,134 587,880,581 574,420,638 564,716,297 568,945,805 541,446,962 538,579,218 535,169,775 522,392,652 532,004,245 Restricted 31,850,388 32,399,073 33,220,418 32,922,887 32,432,103 36,175,773 41,944,052 43,610,150 47,363,309 49,939,495 Unrestricted (173,062,079) (186,103,525) (174,663,409) (205,464,908) (226,502,295) (213,709,071) (370,450,345) (211,373,665) (202,142,246) (203,084,785) Total primary government net position $ 455,740,443 434,176,129 432,977,647 392,174,276 374,875,613 363,913,664 210,072,925 367,406,260 367,613,715 378,858,955
149
Table 2 2012 2013 2014 2015 2016 2017 2018 2019 2020 2021 Expenses Governmental activities: Administrative Services $ 8,344,371 9,225,738 9,096,123 9,348,081 9,054,549 10,060,792 9,787,625 11,766,972 11,465,578 8,846,826 Public Safety 53,836,564 55,139,731 56,859,801 57,226,139 59,265,485 59,583,743 59,355,553 64,741,468 68,890,126 60,111,785 Municipal Services 15,562,839 17,428,294 18,079,671 17,740,128 18,062,959 17,889,269 18,384,360 19,081,925 18,966,524 18,666,752 Health Services 3,575,162 3,810,863 3,622,207 3,672,055 3,597,625 2,690,316 2,190,183 691,921 2,052,328 Culture and Recreation 8,476,301 7,275,087 7,435,735 8,004,845 8,500,729 8,490,201 8,659,305 9,829,225 9,359,426 9,121,110 Community Development 5,128,323 5,318,490 6,316,004 4,876,851 4,694,568 5,913,644 6,364,261 6,866,076 6,729,400 6,019,417 Storm Water 2,765,629 2,862,544 3,000,734 2,917,670 3,381,187 3,734,597 3,722,027 3,854,859 3,929,055 3,764,430 General Government 9,293,399 8,405,914 8,730,105 9,462,575 10,082,656 9,330,488 9,749,366 1,047,083 838,934 4,349,995 Tax Increment Financing 2,992,581 14,281,820 14,273,775 11,531,889 11,319,659 16,156,910 8,756,255 9,743,568 10,786,336 10,611,180 Interest on long-term debt 10,125,399 379,760 252,213 176,912 116,229 108,756 75,246 109,479 96,297 778,438 Total governmental activities expenses 120,100,568 124,128,241 127,666,368 124,957,145 128,075,646 133,958,716 127,044,181 127,040,655 131,753,597 124,322,261 Business-type activities: Power and Light 124,533,699 127,959,254 138,801,854 136,825,933 134,873,700 128,209,073 130,197,969 124,700,820 122,805,250 120,251,808 Water 20,563,502 21,886,576 22,140,775 20,921,367 21,913,607 22,136,019 23,976,929 22,519,143 24,940,525 23,866,752 Sewer 16,157,412 18,900,129 19,015,060 21,822,803 23,512,501 24,420,243 25,605,642 25,728,344 27,191,672 26,149,731 Events Center 12,869,289 13,091,457 10,859,704 11,218,628 11,734,030 12,067,172 12,287,000 13,218,585 12,178,812 9,732,396 Total business-type activities expenses 174,123,902 181,837,416 190,817,393 190,788,731 192,033,838 186,832,507 192,067,540 186,166,892 187,116,259 180,000,687 Total primary government expenses $ 294,224,470 305,965,657 318,483,761 315,745,876 320,109,484 320,791,223 319,111,721 313,207,547 318,869,856 304,322,948 Program Revenues Governmental activities: Charges for services: Administrative Services $ 6,676,240 6,611,432 6,904,917 7,526,268 8,026,010 8,206,822 8,406,360 6,533,752 6,436,938 6,394,861 Public Safety 4,829,421 4,567,625 5,154,144 5,016,016 4,757,394 4,670,892 4,372,243 4,513,453 3,659,764 2,960,579 Municipal Services 398,071 362,732 401,793 391,816 376,062 577,574 537,691 640,034 543,843 484,731 Health Services 817,774 735,708 758,211 659,329 198,147 854,870 744,308 10,688 196,902 Culture and Recreation 871,799 727,220 613,238 689,980 821,976 843,135 913,869 1,264,973 1,017,524 512,418 Community Development 968,438 934,442 1,089,720 1,285,797 1,230,826 2,529,919 2,023,318 4,535,619 4,394,291 4,032,959 General Government 1,012,898 1,037,506 978,491 999,787 1,263,754 1,031,478 1,114,160 1,000,040 771,397 1,110,856 Operating grants and contributions 12,487,041 9,462,570 10,680,433 8,844,808 9,025,480 8,238,425 8,908,557 8,611,746 7,851,184 18,379,425 Capital grants and contributions 14,465,335 3,590,902 3,769,347 1,930,309 575,703 131,098 2,239,697 1,299,857 824,436 389,936 Total governmental activities program revenues 42,527,017 28,030,137 30,350,294 27,344,110 26,275,352 27,084,213 29,260,203 28,399,474 25,510,065 34,462,667 Business-type activities: Charges for services: Power and Light 139,878,341 137,749,295 138,813,984 139,078,098 134,747,475 137,945,902 148,047,728 145,164,378 128,575,740 128,548,974 Water 24,635,637 26,642,646 27,545,623 27,838,244 30,858,398 32,260,796 32,953,246 32,365,391 31,792,837 32,648,354 Sewer 18,233,724 20,231,637 21,471,299 23,545,640 23,743,340 26,029,675 28,812,899 30,171,515 33,354,075 36,164,808 Events Center 8,370,481 4,345,469 3,359,318 4,273,465 4,461,330 4,771,821 5,241,363 5,761,559 4,813,992 2,399,178 Operating grants and contributions 5,000 Capital grants and contributions 1,122,019 763,127 2,386,511 1,613,406 1,425,612 1,322,901 864,452 182,117 37,799 151,769 Total business-type activities program revenues 192,245,202 189,732,174 193,576,735 196,348,853 195,236,155 202,331,095 215,919,688 213,644,960 198,574,443 199,913,083 Total primary government program revenues $ 234,772,219 217,762,311 223,927,029 223,692,963 221,511,507 229,415,308 245,179,891 242,044,434 224,084,508 234,375,750 City of Independence, Missouri Changes in Net Position Last Ten Fiscal Years (accrual basis of accounting) 150
Note: In 2011 the Events Center LLC was added as a blended component unit under the business-type activities.
Note: In 2012 the Tax Increment Financing funds were added back to the primary government presentation as a blended component unit.
Note: In 2012 the Events Center Community Improvement District was added as a blended component unit under the business-type activities.
Note: In 2012 the Crackerneck Creek Transportation Development District was added as a blended component unit under the governmental activities.
Note: In 2015 the City adopted GASB Statement No. 68, which restated beginning net position. For the years prior to 2015, the amounts in this schedule have not been restated.
Note: In 2018 the City adopted GASB Statement No. 75, which restated beginning net position. For the years prior to 2018, the amounts in this schedule have not been restated.
Table 2 2012 2013 2014 2015 2016 2017 2018 2019 2020 2021 City of Independence, Missouri Changes in Net Position Last Ten Fiscal Years (accrual basis of accounting) Net (expense)/revenue Governmental activities $ (77,573,551) (96,098,104) (97,316,074) (97,613,035) (101,800,294) (106,874,503) (97,783,978) (98,641,181) (106,243,532) (89,859,594) Business-type activities 18,121,300 7,894,758 2,759,342 5,560,122 3,202,317 15,498,588 23,852,148 27,478,068 11,458,184 19,912,396 Total primary government net expense $ (59,452,251) (88,203,346) (94,556,732) (92,052,913) (98,597,977) (91,375,915) (73,931,830) (71,163,113) (94,785,348) (69,947,198) General Revenues and Other Changes in Net Position Governmental activities: Taxes Property taxes $ 8,652,704 7,618,559 7,993,199 8,546,600 8,485,768 7,978,323 8,237,760 8,080,629 8,717,634 9,684,246 Sales and use taxes 39,836,686 40,689,725 41,142,183 44,459,358 44,683,858 45,348,299 46,319,963 45,006,244 46,752,729 51,500,218 Intergovernmental activity taxes 9,534,652 9,635,263 10,809,061 8,830,000 10,351,536 10,776,518 11,720,991 12,328,192 13,388,147 13,724,099 Franchise taxes 10,914,940 10,414,823 10,292,488 9,960,928 8,528,741 8,703,530 8,771,667 8,651,580 7,523,346 7,376,564 Financial institutions tax 21,646 15,225 19,381 16,523 21,116 34,130 34,818 18,814 32,404 20,601 Investment earnings 228,812 302,467 302,394 256,159 311,028 130,083 478,931 2,294,796 2,897,668 572,681 Special item - litigation settlement 2,203,430 Special item - OPEB change in benefit terms 72,282,213 Miscellaneous 397,567 1,049,065 695,896 1,960,753 796,842 1,147,386 1,211,700 594,740 1,469,877 1,467,868 Transfers 17,329,950 18,232,349 18,804,684 18,676,005 18,753,474 19,283,144 20,057,532 20,360,728 19,181,560 19,245,236 Total governmental activities 86,916,957 87,957,476 92,262,716 92,706,326 91,932,363 93,401,413 96,833,362 169,617,936 99,963,365 103,591,513 Business-type activities: Sales and use taxes 5,291,682 5,397,059 5,600,076 5,741,439 5,770,850 5,973,582 6,793,078 7,783,055 8,024,737 Investment earnings 28,936 66,215 45,754 32,746 176,436 (35,308) 674,832 5,455,337 5,526,440 28,950 Special item - litigation settlement 12,796,570 Special item - OPEB change in benefit terms 33,603,664 Special item - electric rebate (11,196,400) Miscellaneous 2,212,916 557,965 1,660,835 1,456,086 2,202,550 560,155 665,216 314,820 901,503 (11,126) Transfers (17,329,950) (18,232,349) (18,804,684) (18,676,005) (18,753,474) (19,283,144) (20,057,532) (20,360,728) (19,181,560) (19,245,236) Total business-type activities (15,088,098) (12,316,487) 1,095,534 (11,587,097) (10,633,049) (12,987,447) (12,743,902) 25,806,171 (4,970,562) (22,399,075) Total primary government $ 71,828,859 75,640,989 93,358,250 81,119,229 81,299,314 80,413,966 84,089,460 195,424,107 94,992,803 81,192,438 Changes in Net Position Governmental activities $ 9,343,406 (8,140,628) (5,053,358) (4,906,709) (9,867,931) (13,473,090) (950,616) 70,976,755 (6,280,167) 13,731,919 Business-type activities 3,033,202 (4,421,729) 3,854,876 (6,026,975) (7,430,732) 2,511,141 11,108,246 53,284,239 6,487,622 (2,486,679) Total primary government $ 12,376,608 (12,562,357) (1,198,482) (10,933,684) (17,298,663) (10,961,949) 10,157,630 124,260,994 207,455 11,245,240
151
City of Independence, Missouri Fund Balances of Governmental Funds Last Ten Fiscal Years (modified accrual basis of accounting)
Note: In 2011 GASB 54 was implemented which changes the Fund Balance classifications. 2010 has been restated for the new categories as well.
Note: In 2012 the Tax Increment Financing funds were added back to the primary government presentation as a blended component unit.
Note: In 2012 the Crackerneck Creek Transportation Development District was added as a blended component unit under the governmental activities.
Table 3 2012 2013 2014 2015 2016 2017 2018 2019 2020 2021 General Fund Nonspendable $ 14,141 11,424 19,755 Restricted 584,917 417,361 402,899 142,966 273,164 404,806 395,412 84,386 78,022 118,750 Committed 453,285 391,399 437,083 471,606 348,001 261,700 106,884 30,762 18,105 16,373 Assigned 593,561 464,633 398,283 1,300,973 1,336,086 1,648,808 1,268,521 574,172 723,920 465,453 Unassigned 1,831,406 600,662 3,591,990 3,741,675 3,684,710 5,982,941 7,030,007 6,591,442 5,301,516 5,700,364 $ 3,463,169 1,874,055 4,844,396 5,657,220 5,653,385 8,298,255 8,800,824 7,280,762 6,121,563 6,320,695 All other governmental funds Nonspendable $ 480,253 665 526,245 Restricted 44,378,155 43,513,724 44,679,472 43,356,113 42,864,399 44,066,001 43,085,814 47,556,094 74,562,521 76,458,587 Committed 1,404,187 451,142 204,117 164,507 41,772 30,198 53,981 61,507 81,165 92,421 Unassigned (6,237,737) (6,951,949) (6,167,243) (5,796,859) (2,929,573) (1,482,674) (1,440,718) (1,627,806) (3,851,954) (3,574,111) $ 39,544,605 37,493,170 38,716,346 37,723,761 39,977,263 42,613,525 42,225,322 45,989,795 70,791,732 72,976,897
152
City of Independence, Missouri Changes in Fund Balances of Governmental Funds Last Ten Fiscal Years (modified accrual basis of accounting)
Note: For 2011 the Debt service as a percentage of non-capital expenditures includes the debt service payment for the component unit.
Note: In 2012 the Tax Increment Financing funds were added back to the primary government presentation as a blended component unit.
Note: In 2012 the Crackerneck Creek Transportation Development District was added as a blended component unit under the governmental activities.
Note: In 2019 the Health Department was restructured and remaining functions were moved to other departments. In 2021 the Health Department was restructured as its own department. Animal Services is included in the Health Services category.
Table 4 2012 2013 2014 2015 2016 2017 2018 2019 2020 2021 Revenues Taxes $ 68,437,032 68,799,104 70,380,577 71,412,311 71,815,835 73,168,146 75,673,475 74,694,144 76,307,087 82,183,412 Licenses, fees and permits 3,319,496 3,255,877 3,464,631 3,785,532 3,802,218 5,614,626 4,834,935 4,783,828 5,012,961 4,772,400 Intergovernmental 24,127,728 12,724,286 13,672,530 10,337,589 9,174,995 8,215,395 10,860,762 9,304,404 8,315,029 18,653,010 Charges for services 3,095,040 2,966,943 2,699,813 2,905,601 3,273,899 3,378,711 3,385,145 3,378,423 3,153,527 2,908,352 Interfund charges for support services 3,791,444 3,835,972 3,987,029 4,544,233 4,913,709 4,943,014 5,099,696 5,035,500 5,035,500 5,035,500 Fines, forfeitures, and court costs 4,329,537 4,061,879 4,790,383 4,652,309 4,214,064 3,855,121 3,716,388 3,913,825 2,890,421 2,152,627 Investment earnings 214,584 287,686 259,908 250,763 286,088 93,294 337,709 2,000,253 2,704,945 552,145 Developer contributions 832,549 238,105 250,000 35,000 17,025 Other 2,456,566 2,566,387 2,445,373 2,155,444 2,551,667 2,486,708 2,552,686 2,774,293 2,842,834 2,844,550 Total revenues 110,603,976 98,736,239 101,950,244 100,078,782 100,049,500 101,755,015 106,460,796 105,884,670 106,262,304 119,101,996 Expenditures Administrative Services 7,332,146 6,997,537 7,547,357 7,640,238 7,576,728 7,834,761 8,051,979 10,429,550 8,583,484 8,622,539 Public Safety 45,457,931 46,169,791 49,093,577 49,529,374 50,513,184 49,939,819 52,410,075 59,828,210 61,192,700 62,223,200 Municipal Services 5,191,326 5,645,470 5,899,660 5,386,719 4,693,660 4,791,209 5,495,957 7,470,311 6,484,056 6,503,782 Health Services 3,055,362 3,362,706 3,322,766 3,206,732 3,130,183 2,464,245 2,114,547 537,806 2,018,672 Culture and Recreation 6,205,463 5,694,462 5,747,828 5,793,101 5,888,760 6,013,044 6,163,491 7,508,674 6,625,256 7,526,753 Community Development 4,877,604 5,029,870 6,007,452 4,460,559 4,303,735 5,226,710 5,865,477 6,561,980 6,108,787 5,943,402 Storm Water 1,581,460 1,532,184 1,686,782 1,629,842 1,769,844 2,271,882 2,092,652 2,223,961 2,145,806 2,174,015 General Government 8,343,550 7,461,577 7,688,526 8,622,570 8,921,005 8,543,800 8,968,731 343,456 18,129 3,386,866 Tax Increment Financing 2,992,581 2,578,489 2,886,495 1,290,274 859,000 1,136,583 1,083,430 3,124,874 4,545,677 3,973,105 Capital outlay 24,697,928 15,475,351 12,296,360 14,159,976 13,890,964 11,951,855 15,078,234 12,808,202 10,298,410 13,806,476 Debt Service Principal 12,935,067 12,223,792 7,614,702 8,513,930 6,833,988 8,107,973 8,848,975 7,578,765 7,344,377 8,200,715 Interest 10,283,032 9,505,756 8,844,986 9,243,134 8,541,494 7,214,003 6,899,667 6,123,004 5,856,638 6,102,645 Debt issuance costs 258,358 1,059,129 201,254 240,698 1,156,904 431,670 249,268 1,216,641 Total expenditures 133,211,808 122,736,114 118,837,745 119,717,147 118,079,449 115,927,554 123,322,483 124,000,987 119,741,126 131,698,811 Excess of revenues over (under) expenditures (22,607,832) (23,999,875) (16,887,501) (19,638,365) (18,029,949) (14,172,539) (16,861,687) (18,116,317) (13,478,822) (12,596,815) Other Financing Sources (Uses) Transfers in 8,446,498 9,771,846 2,630,331 2,119,880 2,964,941 2,118,908 7,815,722 3,058,253 8,806,903 6,198,157 Transfers out (8,446,498) (9,560,573) (1,969,709) (1,857,265) (2,726,803) (1,834,435) (7,825,722) (3,068,253) (8,816,902) (8,983,770) Issuance of debt 8,694,700 40,855,000 6,981,126 8,770,000 50,074,897 19,604,504 12,052,210 17,940,000 37,297,511 Premiums/Discounts on debt issued (99,950) (14,334) 74,056 (99,693) (1,168,942) 2,585,491 836,091 4,689,862 Payment to refunded loans escrow agent (6,426,286) (38,713,690) (6,982,279) (7,887,707) (47,379,813) (22,019,468) (15,969,779) (43,475,884) Transfers in - utility payments in lieu of taxes 17,329,950 18,021,077 18,144,063 18,413,389 18,515,336 18,998,671 20,067,531 20,370,728 19,191,559 19,255,236 Total other financing sources 19,498,414 20,359,326 18,877,588 19,458,604 20,279,616 19,453,671 16,976,053 20,360,728 37,121,560 14,981,112 Special items: Litigation settlement 2,203,430 Net change in fund balances $ (3,109,418) (3,640,549) 4,193,517 (179,761) 2,249,667 5,281,132 114,366 2,244,411 23,642,738 2,384,297 Debt service as a percentage of non-capital expenditures 21.55% 20.60% 15.90% 17.45% 15.03% 15.10% 14.94% 12.53% 12.37% 12.43%
153
Table 5 City Sales and Use Tax Revenue: 2012 2013 2014 2015 2016 2017 2018 2019 2020 2021 General Fund $ 16,745,763 16,895,043 17,036,996 18,132,065 18,220,678 17,982,053 18,470,762 17,946,599 18,160,631 19,138,667 Tourism Fund (Transient Guest Tax) 1,219,340 1,356,592 1,468,758 1,618,246 1,954,406 1,994,953 1,956,256 1,967,003 1,554,582 1,321,757 Street Sales Tax Fund 7,640,274 7,730,491 7,767,525 8,357,101 8,399,825 8,329,801 8,540,878 8,258,900 8,323,739 8,999,260 Park Improvements Sales Tax Fund 3,832,077 3,854,506 3,884,655 4,178,652 4,200,128 4,167,642 4,270,461 4,129,442 4,161,885 4,499,634 Storm Water Sales Tax Fund 3,832,155 3,852,030 3,884,641 4,178,663 4,200,147 4,167,558 4,270,479 4,129,446 4,161,887 4,499,634 Police Sales Tax Fund 2,032,892 2,056,547 2,069,621 2,211,890 2,221,976 2,198,883 2,269,600 2,210,139 2,238,572 2,365,703 Fire Sales Tax Fund 1,916,791 1,928,889 1,943,700 2,089,554 2,100,451 2,089,313 2,135,284 2,064,701 2,080,829 2,250,479 TIF Funds (consolidated) 2,617,394 3,015,627 3,086,287 3,693,187 3,386,247 4,418,096 4,406,243 4,300,014 4,398,792 4,675,084 Events Center Community Improvement District 3,506,061 5,291,682 5,397,059 5,600,076 5,741,439 5,770,850 5,973,582 6,793,078 7,783,055 8,024,737 Animal Services Use Tax 750,000 750,000 Police Use Tax 921,812 3,000,000 Total $ 43,342,747 45,981,407 46,539,242 50,059,434 50,425,297 51,119,149 52,293,545 51,799,322 54,535,784 59,524,955 Source: City of Independence City of Independence, Missouri Sales and Use Tax Revenue Last Ten Fiscal Years 154
Note: The rate shown for the Transportation Development District is for the 39th Street corridor only.
Source: Missouri Department of Revenue
Table 6 Direct Sales Tax Rate City of Independence 2012 2013 2014 2015 2016 2017 2018 2019 2020 2021 General Fund 1.000 1.000 1.000 1.000 1.000 1.000 1.000 1.000 1.000 1.000 Street Improvements 0.500 0.500 0.500 0.500 0.500 0.500 0.500 0.500 0.500 0.500 Park Improvements 0.250 0.250 0.250 0.250 0.250 0.250 0.250 0.250 0.250 0.250 Storm Water Improvements 0.250 0.250 0.250 0.250 0.250 0.250 0.250 0.250 0.250 0.250 Police Public Safety 0.125 0.125 0.125 0.125 0.125 0.125 0.125 0.125 0.125 0.125 Fire Public Safety 0.125 0.125 0.125 0.125 0.125 0.125 0.125 0.125 0.125 0.125 Direct Sales Tax Rate City of Independence 2.250 2.250 2.250 2.250 2.250 2.250 2.250 2.250 2.250 2.250 Transportation Development District 0.125 0.125 0.125 0.125 0.125 0.125 0.125 0.125 0.125 0.125 Total Direct Sales Tax Rate 2.375 2.375 2.375 2.375 2.375 2.375 2.375 2.375 2.375 2.375 Total Local Option Sales Tax Rate 2012 2013 2014 2015 2016 2017 2018 2019 2020 2021 State of Missouri 4.000 4.000 4.000 4.000 4.000 4.000 4.000 4.000 4.000 4.000 Missouri State Conservation 0.125 0.125 0.125 0.125 0.125 0.125 0.125 0.125 0.125 0.125 Missouri State Parks and Soil 0.100 0.100 0.100 0.100 0.100 0.100 0.100 0.100 0.100 0.100 Jackson County 1.125 1.125 1.125 1.125 1.125 1.125 1.125 1.125 1.125 1.125 Jackson County - Community Children's Services 0.000 0.000 0.000 0.000 0.000 0.125 0.125 0.125 0.125 0.125 Kansas City Zoo 0.125 0.125 0.125 0.125 0.125 0.125 0.125 0.125 0.125 0.125 City of Independence 2.250 2.250 2.250 2.250 2.250 2.250 2.250 2.250 2.250 2.250 Transportation Development District 0.125 0.125 0.125 0.125 0.125 0.125 0.125 0.125 0.125 0.125 Total Direct and Overlapping Sales Tax Rate 7.850 7.850 7.850 7.850 7.850 7.975 7.975 7.975 7.975 7.975
Rates Direct and Overlapping Governments Last Ten Calendar Years 155
(in percent) City of Independence, Missouri Sales Tax
Real Property
City of Independence, Missouri
Assessed Value and Estimated Actual Value of Taxable Property Last Ten Fiscal Years
Other Property
Note: The assessed value is set at 19% for residential property; 12% for agricultural property; and 32% for commercial property of the estimated fair market value.
Note: The City does not assess taxes on personal property.
Source: Jackson County Assessor's Office and Clay County Assessor's Office.
Table 7 Assessed Fiscal Year Total Taxable Estimated Value as a Ended Residential Agricultural Commercial State Personal Railroads Assessed Total Direct Market Percentage of June 30, Taxing Year Property Property Property Assessed Total Property & Utilities Value Tax Rate Value Actual Value 2012 2011 $ 781,254,601 1,128,703 236,979,066 4,844,455 1,024,206,825 252,082,951 2,943,813 1,279,233,589 0.7236 5,643,175,957 22.67% 2013 2012 779,674,017 1,128,605 235,695,566 4,816,906 1,021,315,094 254,225,408 3,612,882 1,279,153,384 0.7281 5,639,283,894 22.68% 2014 2013 779,683,482 1,138,200 233,988,631 5,106,421 1,019,916,734 257,382,527 3,528,618 1,280,827,879 0.7394 5,644,201,744 22.69% 2015 2014 779,384,690 1,138,682 232,114,740 5,387,691 1,018,025,803 244,122,675 2,857,999 1,265,006,477 0.7393 5,595,741,171 22.61% 2016 2015 814,095,793 1,227,696 242,938,873 5,523,260 1,063,785,622 248,605,246 2,771,990 1,315,162,858 0.7165 5,826,614,435 22.57% 2017 2016 816,156,782 1,240,556 241,685,369 5,480,210 1,064,562,917 259,387,309 2,848,806 1,326,799,032 0.7216 5,866,135,798 22.62% 2018 2017 851,240,599 1,246,527 269,580,035 5,484,957 1,127,552,118 264,036,773 2,657,765 1,394,246,656 0.7031 6,151,388,242 22.67% 2019 2018 855,893,579 1,212,349 261,658,049 5,795,714 1,124,559,691 276,071,272 2,862,628 1,403,493,591 0.7105 6,188,587,536 22.68% 2020 2019 985,433,731 1,153,021 349,795,437 5,608,335 1,341,990,524 269,306,567 2,582,419 1,613,879,510 0.6078 7,123,537,106 22.66% 2021 2020 971,733,748 1,175,693 306,961,846 5,753,808 1,285,625,095 273,664,601 3,010,655 1,562,300,351 0.6672 6,932,645,923 22.54%
156
City of Independence, Missouri Property Tax Rates
Direct and Overlapping Governments
Last Ten Fiscal Years
(rate per $100 assessed value)
City Direct Rates Overlapping Rates
Fiscal Year ending (June 30)
Notes:
Taxes are due November 1, delinquent after December 31. A penalty of 1% per month, up to a maximum of 10% is added for each month of delinquency. Collections are enforced through the attachment and sale of the property. Commercial real property is also assessed an additional "replacement tax" of 1.437 per $100 assessed value.
The General Fund and Public Health & Recreation Fund levy rates are limited by Missouri Statutes to $1.00 and $.40 per $100.00 assessed valuation. There is no limit on the levy rates for General Debt and Interest.
County Tax Breakdown (see note 5):
(4) Three other school districts are in the Jackson County portion of the City of Independence. School tax rates for these districts are:
Table 8 Basic/General Public Health Debt Total Metropolitan Junior Independence School Jackson Taxing Year Rate & Recreation Service Direct College District County State 2012 2011 0.4924 0.2312 0.7236 0.2335 5.580 1.0596 0.030 2013 2012 0.4950 0.2331 0.7281 0.2349 5.670 1.0464 0.030 2014 2013 0.5026 0.2368 0.7394 0.2369 5.700 1.0464 0.030 2015 2014 0.5026 0.2367 0.7393 0.2374 5.700 1.0317 0.030 2016 2015 0.4871 0.2294 0.7165 0.2343 5.913 1.0038 0.030 2017 2016 0.4906 0.2310 0.7216 0.2339 5.913 1.0117 0.030 2018 2017 0.4780 0.2251 0.7031 0.2297 5.801 1.0685 0.030 2019 2018 0.4830 0.2275 0.7105 0.2305 5.801 1.2867 0.030 2020 2019 0.4132 0.1946 0.6078 0.2047 5.498 1.1371 0.030 2021 2020 0.4535 0.2137 0.6672 0.2128 5.538 1.1511 0.030
(1) (2)
Health & Welfare Fund 0.2095 General Fund 0.2123 Road & Bridge Fund 0.0688 Park Fund 0.1204 Mid-Continent Public Library 0.3696 Developmentally Disabled 0.0649 Mental Health 0.1056 Total County 1.1511
(3)
Fort Osage Reorganized #1 6.3700 Blue Springs Reorganized #4 5.7286 Kansas City School District 4.9599
157
Table 9 Total Percentage of Total Total Percentage of Total Assessed Taxable Assessed Assessed Taxable Assessed Taxpayer Value Rank Value Value Rank Value Independence Mall Holding, Inc $ 23,188,203 1 1.48% $ 22,094,332 1 1.73% DT Independence Commons LLC 10,539,362 2 0.67% 8,963,343 2 0.70% Southern Union Company 7,916,961 3 0.51% 5,708,511 5 0.45% Space Center of Kansas City 6,147,078 4 0.39% 6,738,787 4 0.53% Mansion Apartments 5,951,560 5 0.38% 4,032,764 10 0.32% Centerpoint Medical Center 5,642,007 6 0.36% 4,656,394 8 0.36% Unilever Best Foods 5,488,161 7 0.35% 5,685,895 6 0.44% MPM Cornerstone LLC 4,725,927 8 0.30% QuikTrip Corporation 4,228,919 9 0.27% Cole JC Independence MO DST 3,639,213 10 0.23% Comcast Cablevision 5,488,069 7 0.43% Sprint 8,867,595 3 0.69% A T & T 4,430,015 9 0.35% Total $ 77,467,391 4.96% $ 76,665,705 5.99%
County Collection Department 2021 2012 City of Independence, Missouri Principal Property Taxpayers Current Year and Ten Years Ago 158
Source: Jackson
Table 10 Fiscal Year Taxes Levied Percentage Collections in Percentage Ended June 30, Taxing Year for Fiscal Year Amount of Levy Subsequent Years Amount of Levy 2012 2011 $ 7,495,895 $ 6,971,357 93.00% $ 377,000 $ 7,348,357 98.03% 2013 2012 7,402,402 7,065,183 95.44% 322,893 7,388,076 99.81% 2014 2013 7,625,313 7,145,159 93.70% 419,560 7,564,719 99.21% 2015 2014 7,468,109 7,164,660 95.94% 298,727 7,463,388 99.94% 2016 2015 7,633,251 7,182,858 94.10% 311,508 7,494,367 98.18% 2017 2016 7,782,123 7,396,095 95.04% 283,652 7,679,747 98.68% 2018 2017 7,845,114 7,374,105 94.00% 384,117 7,758,222 98.89% 2019 2018 8,058,354 7,589,114 94.18% 266,468 7,855,582 97.48% 2020 2019 7,907,099 7,554,965 95.55% 20,823 7,575,788 95.81% 2021 2020 8,494,418 7,942,736 93.51% 7,942,736 93.51%
City of Independence Collected within Fiscal Year of Levy Total Collections to Date City of Independence, Missouri Property Tax Levies and Collections Last Ten Fiscal Years 159
Source:
Table 11 Sales by Category: 2012 2013 2014 2015 2016 2017 2018 2019 2020 2021 Power and Light: Residential $ 71,334,000 71,667,000 72,259,000 70,622,000 68,081,000 71,368,000 76,223,000 76,873,000 69,507,000 67,426,000 Commercial 58,366,000 56,044,000 56,809,000 58,251,000 54,249,000 55,067,000 56,522,000 52,656,000 48,512,000 47,513,000 Industrial 4,462,000 4,839,000 4,867,000 4,727,000 4,187,000 4,464,000 5,152,000 3,898,000 3,549,000 3,454,000 Sold to Other Utilities 1,909,000 2,380,000 2,254,000 2,369,000 3,298,000 1,751,000 3,088,000 5,780,000 5,620,000 5,040,000 Other 1,644,000 606,000 599,000 493,000 367,000 238,000 302,000 274,000 156,000 104,000 Water: Residential 11,699,971 13,080,814 13,052,557 13,147,584 14,272,445 15,288,208 15,647,744 13,699,721 13,367,035 13,691,456 Commercial 3,325,167 3,847,161 3,555,507 3,491,458 3,759,332 4,135,439 4,477,410 5,515,624 5,664,412 5,695,898 Industrial 479,477 547,930 769,857 605,223 694,902 605,996 583,867 1,265,360 683,790 609,886 Public Authority 256,730 270,391 262,012 318,503 281,902 344,489 300,755 256,247 209,639 216,085 Sold to Other Utilities 7,153,628 7,714,290 8,136,297 8,322,743 9,461,694 9,814,368 9,753,385 9,878,165 9,775,067 9,968,031 Other 1,289,923 1,531,318 1,760,366 1,845,426 1,981,057 2,146,939 2,199,111 2,327,662 2,154,021 2,121,321 Sanitary Sewer: Residential 10,460,524 10,601,887 11,329,939 11,545,538 12,121,229 12,340,133 14,001,286 15,766,174 17,582,711 19,705,726 Commercial 5,099,839 5,288,864 5,755,295 5,875,596 5,402,688 5,903,198 6,221,026 7,080,859 7,567,127 8,385,352 Other 2,628,416 4,340,296 4,295,186 6,073,994 6,148,154 7,865,081 7,889,045 7,846,608 8,097,157 7,555,644 Total $ 180,108,675 182,758,951 185,705,016 187,688,065 184,305,403 191,331,851 202,360,629 203,117,420 192,444,959 191,486,399 Source: City of Independence City of Independence, Missouri Total Utility Sales by Category Last Ten Fiscal Years 160
Table 12 Rates by Category: 2012 2013 2014 2015 2016 2017 2018 2019 2020 2021 Power and Light (per Kwh): $ Residential 0.14 0.14 0.14 0.14 0.14 0.14 0.14 0.14 0.13 0.13 Commercial 0.12 0.12 0.12 0.13 0.12 0.12 0.13 0.12 0.11 0.12 Industrial 0.09 0.09 0.09 0.09 0.08 0.07 0.08 0.07 0.07 0.07 Sold to Other Utilities 0.02 0.03 0.04 0.03 0.02 0.02 0.04 0.03 0.02 0.04 Other 0.15 0.06 0.10 0.12 0.09 0.06 0.08 0.25 0.14 0.53 Water (per 1,000 gallons): Residential 3.91 4.14 4.49 4.89 5.21 5.57 5.76 5.21 6.08 5.94 Commercial 3.59 3.82 4.10 4.44 4.77 5.07 5.36 7.18 5.54 4.98 Industrial 2.25 2.29 2.42 2.75 3.21 3.40 3.19 6.58 3.44 3.19 Public Authority 3.67 3.89 4.16 4.36 4.81 5.05 4.60 3.39 5.56 5.29 Sold to Other Utilities 1.46 1.57 1.69 1.80 1.93 2.05 2.09 2.04 2.09 2.08 Sanitary Sewer (per 100 cubic feet): Residential 3.90 4.16 4.31 4.49 4.89 5.07 5.49 6.55 7.42 8.38 Commercial 3.42 3.09 3.81 3.74 3.55 3.60 4.00 4.98 5.29 6.49 Total $ 22.73 23.39 25.49 26.98 28.81 30.23 30.95 36.56 35.90 37.24
City of Independence
of Independence, Missouri Total Utility Rates by Category Last Ten Fiscal Years 161
Source:
City
Table 13 Total Percentage of Total Total Percentage of Total Utility Customer - Power and Light Sales Rank Sales Sales Rank Sales Unilever (Thomas J. Lipton Co) 2,103,447 1 1.70% 1,910,796 1 1.39% Centerpoint Medical Center 1,782,750 2 1.44% 1,737,519 2 1.26% Burd and Fletcher (5151 Geospace) 1,560,089 3 1.26% 1,635,516 3 1.19% Smart Warehouse/Commercial Distributions Center 911,621 4 0.74% 1,013,584 5 0.74% Simon Property Group LP/Independence Center LLC 708,472 5 0.57% 1,202,329 4 0.87% HCP MOB Centerpoint (Boyer Company) 635,688 6 0.51% 588,966 6 0.43% Costco Wholesale Inc. 437,938 7 0.35% 554,852 7 0.40% Price Chopper (23rd Street) 366,376 8 0.30% 479,608 10 0.35% Hy Vee - Noland Road 358,845 9 0.29% City's Rock Creek Sanitary Sewer Plant 348,422 10 0.28% 542,455 8 0.39% Cable Dahmer Arena (Events Center) 524,711 9 0.38% Total $ 9,213,648 7.46% $ 10,190,336 7.40% Source: City of Independence 2021 2012 City of Independence, Missouri Principal Utility PayersCurrent Year and Nine Years Ago Power and Light 162
Table 14 Total Percentage of Total Total Percentage of Total Utility Customer - Water Sales Rank Sales Sales Rank Sales Lee's Summit $ 5,588,290 1 17.30% $ 4,078,226 1 16.85% Blue Springs 1,327,964 2 4.11% 1,009,940 2 4.17% District #2, Jackson County 620,585 3 1.92% 550,026 3 2.27% District #1, Lafayette County 514,301 4 1.59% 373,828 4 1.54% Oak Grove 422,407 5 1.31% 342,635 5 1.42% Grain Valley 373,059 6 1.15% 266,450 6 1.10% District #15, Jackson County 372,521 7 1.15% 220,381 7 0.91% Audubon (Lafarge) Corporation 290,944 8 0.90% 154,187 9 0.64% Buckner 250,494 9 0.78% 144,765 10 0.60% District #16, Jackson County 216,264 10 0.67% Unilever (Thomas J. Lipton Co) 197,411 8 0.82% Total $ 9,976,829 30.89% $ 7,337,849 30.32%
of Independence 2021 2012 City of Independence,
Principal Utility PayersCurrent Year and
Ago Water 163
Source: City
Missouri
Nine Years
Table 15 Total Percentage of Total Total Percentage of Total Utility Customer - Sewer Sales Rank Sales Sales Rank Sales Unilever (Thomas J. Lipton Co) $ 324,350 1 0.91% $ 839,132 1 4.61% BP/AMOCO 318,145 2 0.89% 229,819 2 1.26% Simon Property Group LP/Independence Center LLC 146,487 3 0.41% 50,604 5 0.28% Centerpoint Medical Center 129,002 4 0.36% 63,035 4 0.35% Highland Park Investors 122,848 5 0.34% 49,169 6 0.27% Independence Housing Authority 86,552 6 0.24% Green Lantern 73,911 7 0.21% Space Center of KC 68,127 8 0.19% YES Companies 66,726 9 0.19% City of Independence, Power & Light 59,374 10 0.17% 118,244 3 0.65% Price Chopper (23rd Street) 18,932 7 0.10% Smart Warehouse/Commercial Distributions Center The Boyer Company 12,848 9 0.07% Bass Pro 15,021 8 0.08% Independence Events Center 10,739 10 0.06% Total $ 1,395,522 3.91% $ 1,407,543 7.74% Source: City of Independence 2021 2012 City of Independence, Missouri Principal Utility PayersCurrent Year and Nine Years Ago Sanitary Sewer 164
City of Independence, Missouri Ratios of Outstanding Debt by Type Last Ten Fiscal Years
Governmental Activities Business-Type
Notes: (1) See Table 21 for personal income and population data.
(2) In 2012 the Tax Increment Financing funds were added back to the primary government presentation as a blended component unit.
Table 16 Neighborhood Capital Certificates of Fiscal Year Loans Payable Improvement District Leases Participation 2012 (2) $ 180,792,033 598,369 1,642,764 2013 171,371,974 528,423 1,407,347 2014 167,681,305 453,477 1,226,414 2015 162,434,005 378,531 1,036,529 2016 159,223,920 298,586 1,484,037 2017 153,301,444 217,640 1,333,212 2018 142,973,315 131,694 1,260,264 2019 135,402,242 40,748 1,009,999 2020 145,926,947 33,804 755,122 2021 139,698,650 26,859 1,868,704 Percentage of Capital Certificates of Total Primary Personal Per Fiscal Year Revenue Bonds Loans Payable Leases Participation Government Income (1) Capita (1) 2012 $ 243,037,399 426,070,565 16.16% $ 3,646.93 2013 296,937,015 470,244,759 17.26% 4,011.88 2014 342,793,093 512,154,289 18.43% 4,368.43 2015 354,386,824 518,235,889 18.75% 4,410.74 2016 344,168,539 505,175,082 17.72% 4,308.35 2017 383,308,356 538,160,652 16.90% 4,598.48 2018 374,751,112 519,116,385 17.24% 4,425.32 2019 365,808,725 502,261,714 14.58% 4,295.59 2020 355,501,259 502,217,132 16.99% 4,304.48 2021 334,701,955 476,296,168 16.11% 4,082.32
Activities
165
City of Independence, Missouri Ratios of General Bonded Debt Outstanding
Last Ten Fiscal Years
General Bonded Debt Outstanding
Notes:
(1) See Table 7 for property value data.
(2) See Table 21 for population data.
Note: The City does not have any General Bonded Debt over the past ten fiscal years. Details regarding the City's outstanding debt can be found in the notes to the financial statements.
Table 17 Percentage of Est. General Less Amounts Actual Taxable Per Fiscal Year Obligation Bonds Available in Debt Service Total Value of Property (1) Capita (2) 2012 $ $ $ 0.00% $ 2013 0.00% 2014 0.00% 2014 0.00% 2015 0.00% 2016 0.00% 2017 0.00% 2018 0.00% 2019 0.00% 2020 0.00% 2021 0.00%
166
City of Independence, Missouri Direct and Overlapping Governmental Activities Debt
As of June 30, 2021
Note: Overlapping governments are those that coincide, at least in part, with the geographic boundaries of the City. This schedule estimates the portion of the outstanding debt of those overlapping governments that is borne by the residents and businesses of Independence. This process recognizes that, when considering the City's ability to issue and repay long-term debt, the entire debt burden borne by the residents and businesses should be taken into account. However, this does not imply that every taxpayer is a resident, and therefore responsible for repaying the debt, of each overlapping government.
Source: The debt outstanding data and applicable percentages are provided by each governmental entity, and is based on the City's percentage of assessed valuation within the school district.
Table 18 Estimated Share Debt Estimated Percentage of Overlapping Governmental Unit Outstanding Applicable Debt Debt repaid with property taxes Independence School District $ 182,615,000 93.62% $ 170,964,163 Fort Osage Reorganized #1 School District 60,940,000 12.50% 7,617,500 Blue Springs Reorganized #4 School District 147,540,000 1.10% 1,622,940 Raytown School District 81,559,817 8.55% 6,973,364 Subtotal, overlapping debt 187,177,967 City direct debt 141,594,213 Total direct and overlapping debt $ 328,772,180
167
City of Independence, Missouri Legal Debt Margin Information Last Ten Fiscal Years
Notes:
(1) - Article 6, Section 26(b) of the Missouri Constitution permits any county or city, by vote of four-sevenths of qualified electors voting thereon, to incur an indebtedness of city purposes not to exceed 5 percent of the value of the taxable tangible property therein, as shown by the last assessment.
(1) - Article 6, Section 26(c) of the Missouri Constitution permits any county or city, by vote of four-sevenths of qualified electors voting thereon, to incur additional indebtedness of city purposes not to exceed 5 percent of the value of the taxable tangible property therein, as shown by the last assessment.
(1) - Article 6, Section 26(d) & (e) of the Missouri Constitution provides that any city may become indebted not exceeding in the aggregate an additional 10 percent of the value of the taxable tangible property for the purpose of acquiring right-of-ways, constructing, extending and improving streets and avenues and/or sanitary or storm sewer systems and an additional 10 percent for purchasing or construction of waterworks, electric or other light plants provided the total general obligated indebtedness of the city does not exceed 20 percent of the assessed valuation.
Table 19 2012 2013 2014 2015 2016 2017 2018 2019 2020 2021 Debt Limit (1) $ 255,846,718 255,830,677 256,165,576 253,001,295 263,032,572 265,359,806 280,698,718 280,698,718 322,775,902 312,460,070 Total net debt applicable to limit 515,768 455,018 368,810 290,306 197,697 118,648 32,474 Legal Debt Margin $ 255,330,950 255,375,659 255,796,766 252,710,989 262,834,875 265,241,158 280,666,244 280,698,718 322,775,902 312,460,070 Total net debt applicable to the limit as a percentage of debt limit 0.202% 0.178% 0.144% 0.115% 0.075% 0.045% 0.012% 0.000% 0.000% 0.000% Legal Debt Margin Calculation for Fiscal Year 2021 Assessed Value $ 1,562,300,351 Debt Limit (20% of assessed value) 312,460,070 General obligation: City-Wide Neighborhood Improvement Districts 26,859 Revenue Bonds 334,701,955 Total Bonded Debt 334,728,814 Less: Electric Utility Bonds 140,131,183 Water Utility Bonds 20,700,030 Sewer Utility Bonds 89,069,604 Events Center Bonds 84,801,138 Debt Service Fund Bonds 26,859 Total net debt applicable to limit Legal debt margin $ 312,460,070
168
City of Independence, Missouri
Pledged-Revenue Coverage
Last Ten Fiscal Years Debt Service
Note: Details regarding the City's outstanding debt can be found in the notes to the financial statements.
Notes:
(1) Operating expenses excludes depreciation, interest expense, amortization, non-operating expenses, OPEB, net pension expense (GASB 68), and payments in lieu of taxes.
(2) Numbers displayed for Power and Light are in accordance with FERC accounting. Numbers displayed for Water are in accordance with NARUC accounting.
Table 20 Fiscal Less: Operating Net Available Year Revenues Expenses (1) Revenue Principal Interest (2) Coverage Power & Light (2) 2012 $ 140,997,371 $ 104,196,848 $ 28,802,270 $ 3,820,000 $ 3,042,435 $ 4.20 2013 138,561,630 100,672,846 36,800,523 4,080,000 6,100,037 3.61 2014 139,621,307 106,187,200 37,888,784 5,015,000 5,853,306 3.49 2015 139,687,551 107,899,251 33,434,107 3,265,000 5,670,556 3.74 2016 135,479,674 110,381,924 25,097,750 3,395,000 5,539,957 2.81 2017 138,833,337 103,916,192 34,917,145 3,530,000 6,607,431 3.44 2018 149,909,406 107,058,654 42,850,752 3,685,000 7,036,700 4.00 2019 149,612,959 102,668,316 46,944,643 3,850,000 6,872,250 4.38 2020 132,767,233 100,302,200 32,465,033 4,945,000 6,700,350 2.79 2021 129,655,541 105,215,502 24,440,039 4,045,000 6,490,050 2.32 Water (2) 2012 $ 26,383,701 $ 15,282,735 $ 11,100,966 $ 2,965,000 $ 2,150,678 $ 2.17 2013 28,165,483 16,255,647 11,909,836 3,180,000 2,003,608 2.30 2014 29,374,518 16,856,321 12,518,197 3,395,000 1,463,831 2.58 2015 29,739,720 16,376,953 13,362,767 4,230,000 1,281,338 2.42 2016 32,783,397 17,560,790 15,222,607 4,260,000 1,206,338 2.78 2017 34,018,812 17,976,941 16,041,871 3,275,000 1,114,613 3.65 2018 34,579,510 20,668,017 13,911,493 1,480,000 1,043,288 5.51 2019 35,021,121 18,862,896 16,158,225 1,530,000 998,138 6.39 2020 34,835,219 20,476,713 14,358,506 1,575,000 951,563 5.68 2021 35,186,966 22,636,000 12,550,966 1,630,000 895,338 4.97 Sanitary Sewer 2012 $ 19,260,332 $ 13,840,938 $ 5,419,394 $ $ $ 2013 20,249,977 13,440,965 6,809,012 1,030,631 2014 21,501,256 14,301,898 7,199,358 745,000 2,740,012 2.07 2015 23,586,443 14,891,692 8,694,751 1,015,000 3,979,597 1.74 2016 24,292,174 15,786,512 8,505,662 1,535,000 4,373,881 1.44 2017 26,286,812 16,173,501 10,113,311 1,945,000 4,327,756 1.61 2018 29,006,929 17,251,859 11,755,070 2,000,000 4,272,308 1.87 2019 30,839,962 17,126,837 13,713,125 2,060,000 4,212,537 2.19 2020 34,488,587 17,742,410 16,746,177 2,130,000 4,145,258 2.67 2021 36,302,460 18,712,810 17,589,650 2,205,000 4,070,631 2.80
169
City of Independence, Missouri Demographic and Economic Statistics
Last Ten Calendar Years
Note: (4) At the time of preparation, the calendar year 2020 statistics were not yet available for population, per capita personal income, or median age. The 2019 statistics have been used for those categories.
Note: (3) The information shown is for calendar years.
Sources: (1) Information provided by U.S. Census Bureau, Mid-America Regional Council or Claritas, Inc.
(2) Information provided by school districts.
Table 21 Personal Income Per Capita Median School Unemployment Calendar Year (3) Population (1) (thousands of dollars) Personal Income (1) Age (1) Enrollment (2) Rate (1) 2011 116,830 2,636,035,290 22,563 38.79 19,505 10.20% 2012 117,213 2,723,795,694 23,238 38.18 24,900 7.10% 2013 117,240 2,778,588,000 23,700 39.60 25,320 6.90% 2014 117,494 2,763,928,856 23,524 41.80 24,304 6.70% 2015 117,255 2,850,820,815 24,313 38.60 25,173 5.60% 2016 117,030 3,183,801,150 27,205 39.30 25,076 5.50% 2017 117,306 3,011,010,408 25,668 37.80 25,158 4.70% 2018 116,925 3,445,545,900 29,468 40.20 25,023 4.10% 2019 116,673 2,956,610,493 25,341 36.80 24,408 4.00% 2020 (4) 116,673 2,956,610,493 25,341 36.80 22,684 8.00%
170
Table 22 Percentage of Percentage of Total City Total City Employer Employees Rank Employment Employees Rank Employment Independence School District 2,297 1 4.19% 2,043 2 3.75% Winchester (Lake City) 1,750 2 3.19% 2,600 1 4.77% Centerpoint Medical Center 1,416 3 2.58% 1,600 3 2.94% City of Independence 1,030 4 1.88% 1,133 4 2.08% Government Employee Health Association 776 5 1.41% 650 5 1.19% Phoenix Home Health 600 6 1.09% Rosewood Health Center at the Groves 444 7 0.81% 400 6 0.73% Unilever 375 8 0.68% 220 10 0.40% Cable Dahmer Automotive 358 9 0.65% Burd & Fletcher 300 10 0.55% 350 7 0.64% Jackson County Circuit Court 274 8 0.50% Mid-Continent Library 248 9 0.46% Total 9,346 17.03% 9,518 17.47%
2021 2012 City of
Principal
Current
171
Source: Independence Council for Economic Development and Mid-America Regional Council.
Independence, Missouri
Employers
Year and Nine Years Ago
Source: City of Independence Budget
Note: During 2015-16 the National Frontiers Trails Museum moved from the General Fund to the Tourism Fund.
Note: During 2018-19 the Health Department was restructured and remaining employees were moved to other departments.
Last Ten Fiscal Years
Note: During 2020-2021, the Health Department was re-established.
Note: Fiscal Year 2020-2021 was the first full fiscal year that the Animal Shelter Use Tax Fund and the Police Use Tax Fund were budgeted and operational for a full fiscal year.
Table 23 2012 2013 2014 2015 2016 2017 2018 2019 2020 2021 Function/Program General Government City Council Office 10.00 10.00 10.00 10.00 10.00 10.00 10.00 10.00 9.00 10.00 City Clerk 6.00 6.00 7.00 7.00 7.00 7.00 5.00 2.00 2.00 2.00 City Manager 7.00 7.00 7.00 7.00 7.00 7.00 7.00 8.80 8.83 7.83 National Frontiers Trails Museum 5.75 5.75 5.75 5.00 Technology Services 22.00 22.00 22.00 23.00 24.00 24.00 19.00 13.48 13.00 11.00 Municipal Court 14.00 14.67 14.65 14.65 14.65 14.65 13.64 13.64 13.64 13.64 Law - General fund 6.25 6.25 6.25 6.23 6.23 6.21 5.71 5.46 2.00 1.50 Law - Grant fund 0.25 0.25 0.25 0.28 0.28 0.16 0.16 0.29 1.00 Finance 22.65 22.65 22.65 22.15 22.15 22.15 16.15 17.41 18.29 15.00 Human Resources 6.50 6.44 7.44 6.75 6.75 6.75 5.00 5.00 5.00 4.00 Public Safety Police - General Fund 274.65 276.91 291.91 296.91 296.91 295.91 281.26 294.36 318.96 292.36 Police - Grant Fund 14.00 13.00 13.00 7.00 7.00 6.00 7.00 7.00 Police - Use Tax Fund 6.00 Fire - General Fund 173.25 173.25 169.25 169.75 173.75 173.75 172.75 175.50 172.50 176.00 Fire - Grant Fund 0.75 0.75 4.75 5.25 1.25 1.25 1.25 1.25 1.00 1.50 Fire - Sales Tax Fund 1.50 1.50 2.00 Municipal Services General Fund 79.90 79.90 80.27 80.27 80.27 80.27 64.00 66.50 63.00 20.45 Street Sales Tax Fund 3.00 3.00 3.00 3.00 3.00 3.00 3.00 3.00 33.00 Health and Welfare General Fund 35.16 40.20 29.33 28.56 28.56 29.52 15.10 Grant Fund 8.65 7.65 9.06 6.86 7.13 8.15 8.40 Health Property Tax Levy 9.00 Animal Shelter Use Tax Fund 15.35 Culture and Recreation General Fund 28.71 30.15 27.85 27.10 27.10 26.52 22.69 27.43 19.45 Tourism Fund 4.66 4.66 5.66 8.18 14.18 13.00 14.25 14.42 16.82 14.96 Park Improvement Sales Tax Fund 21.75 20.75 24.70 26.61 26.61 28.22 29.06 34.31 31.93 31.80 Parks & Recreation Property Tax Levy 24.83 Community Development General Fund 27.30 27.30 27.30 28.68 28.68 28.18 28.50 33.82 31.96 34.25 Community Dev Block Grant Fund 2.00 2.00 2.00 2.00 2.00 2.00 2.00 1.40 1.50 1.30 HOME Program Fund 1.00 1.00 1.00 1.00 1.00 1.00 1.00 0.50 0.42 0.55 Storm Water Water Poll Control - General Fund Storm Water Sales Tax Fund 13.00 13.00 13.00 13.00 13.00 13.00 13.00 15.05 13.95 13.80 Power and Light Finance & Administration - General Fund 1.50 1.50 1.50 1.50 1.50 1.50 1.50 1.50 3.00 Power and Light 233.00 236.00 238.00 239.00 239.00 239.00 228.00 225.00 212.00 173.80 Water Finance - General fund 0.85 0.85 0.85 0.85 0.85 0.85 0.85 0.85 Water 93.65 93.42 92.42 93.42 93.42 93.42 93.40 92.90 90.80 95.74 Sewer Public Works - General fund 1.00 1.00 1.00 1.00 1.00 1.00 Water Pollution Control 70.00 70.00 70.00 70.00 73.20 73.20 73.90 69.45 72.70 63.64 Central Garage Fund 9.75 9.75 9.75 9.75 9.75 9.75 8.00 8.50 8.50 8.50 Worker' Compensation Fund 2.00 2.00 2.00 2.00 2.00 2.00 2.00 2.00 Total 1,196.93 1,209.05 1,220.59 1,223.75 1,229.22 1,228.41 1,152.57 1,152.32 1,131.75 1,087.80
City of Independence, Missouri
Full-time Equivalent City Government Employees by Function/Program
172
City of Independence, Missouri Operating Indicators by Function/Program Last Ten Fiscal Years
Fiscal Year
Source: City of Independence
Note: During 2015-16 the National Frontiers Trails Museum moved from the General Fund to the Tourism Fund.
Note: Police incident calls on the above schedule are lower during 2017-18, due to a computer software upgrade and relocation of the Communications Division. Reporting for this statistic is expected to return to a normal range during 2018-19.
Note: During 2020-2021 the number of public education audience for Fire declined to less than 1,000 due to COVID-19 pandemic restrictions.
Note: During 2020-2021 the number of memberships for the Sermon Center declined due to the COVID-19 pandemic and facility closures.
Note: Attendance to tourist sites and the National Frontier Trails Museum declined during 2020-2021 due to facility closures and restraints as a result of the COVID-19 pandemic.
Table 24 2012 2013 2014 2015 2016 2017 2018 2019 2020 2021 Function/Program Public Safety Police Police Incident Calls 98,282 112,197 90,403 105,840 99,355 147,127 46,024 100,073 91,870 94,609 Traffic Unit Citations Issued 19,977 33,234 40,761 36,864 37,921 27,561 11,761 13,906 8,194 8,530 Fire Total Alarms 16,907 17,126 16,929 18,737 20,175 20,790 21,603 22,214 21,500 23,412 Public Education Audience 19,508 26,099 25,591 14,787 6,692 13,066 34,800 7,895 9,200 1,000 Municipal Services Street Overlay (lane miles) 35 32 39 49 69 110 57 68 61 47 Street Patching Jobs 5,069 4,319 7,718 7,561 4,319 6,067 6,610 11,938 8,556 7,666 Health and Welfare Food Handlers Trained 6,582 5,863 5,187 5,712 4,845 4,407 4,715 3,856 3,017 2,544 Flu Shots Given 422 3,200 2,434 1,741 500 352 304 Animal Control Service Calls 7,499 6,343 6,255 5,452 5,008 4,221 4,105 442 3,811 4,076 Culture and Recreation Park Shelter Reservations 524 579 657 698 652 640 535 581 310 424 Number of Sermon Center Memberships 1,577 1,671 1,332 1,618 2,065 1,840 1,441 1,246 865 517 Community Development Permits Issued 3,177 2,728 3,049 3,155 3,002 3,656 2,509 979 619 718 Tourism Site Attendance 374,525 130,249 293,772 409,320 299,457 292,603 285,823 256,209 214,644 1,758 National Frontiers Trails Museum Number of visitors to museum 14,123 12,932 13,470 13,532 14,645 17,934 18,176 16,418 7,990 Power and Light Average number of monthly customers 56,292 56,297 56,474 56,709 56,908 57,123 57,413 57,897 57,832 57,557 Water Number of customers 48,145 48,121 48,253 48,384 48,615 48,863 48,799 48,841 50,489 49,432 Water main breaks 249 402 318 227 184 199 256 322 208 240 Sewer Number of customers 44,085 44,062 44,166 44,793 44,559 44,755 45,115 44,642 45,316 45,484 Wastewater Treated (Million Gallons) 2,261 2,361 2,124 2,558 3,229 2,603 2,228 3,400 3,290 3,030
173
Table 25 2012 2013 2014 2015 2016 2017 2018 2019 2020 2021 Function/Program Public Safety Police Police stations 3 5 5 5 3 4 5 7 7 7 Vehicles 180 191 191 194 185 200 209 216 208 224 K - 9 Facility 1 1 1 1 1 1 1 1 1 1 Fire Fire Stations 10 10 10 10 10 10 10 10 10 10 Fire Training Facilities 1 1 1 1 1 1 1 1 1 1 Vehicles 45 44 45 46 45 48 48 48 48 46 Municipal Services Total area (square miles) 78 78 78 78 78 78 78 78 78 78 Paved miles 565 560 560 560 578 592 592 592 599 616 Culture and Recreation Park acreage 843 843 887 887 843 827 788 798 798 798 Parks 45 46 42 43 46 44 41 41 41 41 Community Centers 4 3 3 3 3 3 3 3 3 3 Fitness Centers 2 2 3 3 2 2 2 2 2 2 Ball Fields 42 45 44 44 44 41 38 43 43 43 Power and Light Power stations 6 6 6 6 6 5 5 5 3 3 Transmission/Distribution Circuits (miles) 859 853 869 870 888 888 889 889 890 868 Maximum daily use (Mwh) 5,780 5,654 4,818 4,754 4,983 5,166 5,166 5,094 5,042 4,694 Water Water mains (miles) 757 758 759 760 760 761 763 764 764 764 Fire hydrants 4,854 4,875 4,910 4,933 4,950 4,967 5,016 5,042 5,053 5,057 Maximum daily pumpage (millions of gallons) 42 47 40 37 39 36 37 36 34 38 Sewer Number of treatment plants 1 1 1 1 1 1 1 1 1 1 Sewers mains (miles) 614 614 614 614 616 619 619 618 614 614 Maximum daily capacity of treatment (MGD) 16 16 32 32 32 27 32 32 32 32 Source: City of Independence
Fiscal Year 174
City of Independence, Missouri Capital Asset Statistics by Function/Program Last Ten Fiscal
Years

111 East Maple Street P.O. Box 1019 Independence, Missouri 64051-0519 816-325-7000
