newcastle.nsw.gov.au Serving Culturally and Linguistically Diverse (CaLD) communities in the Newcastle region: Harnessing servicedelivery networks Multicultural Neighborhood Services Expo, May 2021 December 2021
Acknowledgment of Awabakal and Worimi Peoples
City of Newcastle (CN) acknowledges the traditional country of the Awabakal and Worimi peoples. We recognise and respect their cultural heritage, beliefs and continuing relationship with the land, and that they are the proud survivors of more than two hundred years of dispossession. CN reiterates its commitment to addressing disadvantages and attaining justice for Aboriginal and Torres Strait Islander peoples of this community.
The City of Newcastle would like to thank all of the sector members who completed the network survey and attended the workshop. The project would not have been possible without your time and effort. Your insights and perspectives have been invaluable. We would also like to acknowledge and thank Northern Settlement Services for their valuable contribution to this project who were consulted in the design of the research and review of findings.
Report prepared by
Dr Jennifer Waterhouse
Dr Robyn Keast
Ms Hannah Murphy
Simone Soeters
City of Newcastle 2 DRAFT Enquiries For information contact Community, Strategy & Innovation Phone 02 49742000 Published by City of Newcastle PO Box 489, Newcastle NSW 2300 Phone 4974 2000 Fax 4974 2222 mail@ncc.nsw.gov.au newcastle.nsw.gov.au © 2021 City of Newcastle
DRAFT Community Land Plan of Management 3 DRAFT Contents About this report 4 Key findings from the project 5 The power of service-delivery networks 8 Project aims 8 Project approach 9 Project findings 12 Who makes up the CaLD service-delivery network? 12 Mapping the CaLD service-delivery network 14 How the CaLD service-delivery network currently operates 21 Key highlights of the social network analysis findings 25 Qualitative findings 27 Building network capacity 28 Building capacity for cooperative relationships in the BCN, GCSN and CCN 28 Measuring overall network effectiveness 31 Conclusion 32 How the GCSN compares to other service-delivery networks? 32 References 35 Appendices 36 Appendix A 36 Appendix B 52 Appendix C 53
City
About this report
This report provides the key findings of a social network analysis project undertaken by the City of Newcastle to help determine how best to support the network of organisations that currently provide services to people of culturally and linguistically diverse (CaLD) backgrounds.
Ultimately, three levels of the CaLD service-delivery network were analysed as part of this project: the core network of 13 service providers whose primary business is to deliver services to CaLD communities – the Core CaLD Network (CCN)
13 36 74
the General CaLD Service Network (GCSN), comprising 36 government and non-government organisations that participated in the research and service Newcastle’s CaLD community
the Broad CaLD Network (BCN), comprising a wider array of organisations (74 in total), including those identified by research participants but that did not participate in the research. This Broad CaLD Network also includes the Core CaLD Network and the General CaLD Service Network mentioned above.
This report provides an overview of the project, the project methodology, composition of the organisations involved in the data collection, key characteristics of the CaLD service-delivery network, qualitative findings, and considerations for individual network members and the network as a whole for informing network effectiveness now and into the future. of Newcastle 4
Key findings from the project
How the network is functioning
The network maps highlight an overall level of connectivity, which is a positive feature for the CaLD sector and a solid indicator of cooperative working relationships.
The sector comprises a mature network that has relationships at a functional level, providing similar but largely not overlapping services, suggesting little duplication, which again is an indicator of an effective network.
Service providers that have CaLD services at the core of their business make up 18% of the BCN and 36% of the GCSN.
Network members are relatively well-connected, having connections with an average of 13–14 organisations out of the total 35 connections possible.
Serving CaLD Communities in the Newcastle Region: Sector Report 5
The network overall has a low to mid-level density, meaning that there is a degree of efficiency in terms of, for example, how fast information travels through the network and how resources are mobilised.
The network is quite decentralised with no single organisation or group of organisations ‘controlling’ or ‘coordinating’ the network; however, there are several organisations that are well-positioned to nurture and maintain the network by sharing information, activating relationships and mobilising resources when required.
The network’s strength comes from network members connecting with each other across all of the different types of exchange relationships studied: information sharing, joint funding, joint projects, joint planning and analysis, referrals and shared resources.
Findings point to a network positioned at the cooperation/coordination level of the inter-organisational relationship continuum, demonstrating the sector’s capacity to work together to achieve both organisational and sectoral goals and outcomes.
The results point to a potential scarcity of resources (e.g., funding, human resources, service placements, etc.), which could impact service delivery, and a stronger preference for coordinated activities in relation to planning and analysis projects by a smaller cohort (reflecting the increased effort needed to maintain these activities).
Workshop participants noted the growing challenges of resource scarcity and increasing service delivery needs; nonetheless, the network data indicate the network has current capacity to mobilise relationships and resources for activities, challenges or opportunities as they emerge. The network maps and measures show that the limited resources the sector has access to are shared well among the network participants. Subject to access to commensurate funding and resources, this finding indicates the network has a good foundation on which to build capacity to meet future demand.
A total of 19 additional organisations were nominated by survey respondents as being part of the broad CaLD service-delivery network, the majority being mainstream community organisations providing services to the whole community. These 19 additional organisations were not on the survey mailing list and therefore did not complete the survey. Two organisations are, however, affiliates of respondent organisations. These organisations span a range of service categories, with the largest group (6 organisations) being community service organisations. Community service organisations included organisations and associations that were funded and unfunded. Four of these six were unfunded, volunteer organisations providing services to particular ethnic or religious groups. While there is a possibility that these organisations may, in reality, be better connected, they appear to be loosely linked to the network and are potentially vulnerable to further isolation if they break from their connecting network member.
Who network members want better access to and why
Network members nominated CaLD-specific service providers as being the most beneficial organisations to interact with, followed by local health providers and state and local government providers with a focus on community development and protection.
Above all other stakeholders, respondents want better access to state and local government organisations. This is followed by better access to other CaLD providers. Accessing these organisations was considered important in strengthening existing services and improving understanding of the needs and priorities of CaLD communities. Planning and funding were especially considered important roles of state and local government organisations.
City of Newcastle 6
Challenges facing the sector
The CaLD service sector faces a number of key issues. In particular, respondents highlighted housing, employment and financial insecurity as particularly pressing issues. In many cases, CaLD services are left ‘filling the gap’ in meeting these needs. Domestic and family abuse was also raised as an issue, along with understaffed and under-resourced community service providers.
City of Newcastle’s role in the CaLD sector
Just under a third of respondents reported working with the City of Newcastle on CaLD community service-delivery activities.
Around half of the respondents reported not working with the City of Newcastle in any capacity.
It was clear that respondents would welcome greater collaboration with and support from the City of Newcastle.
Respondents noted a range of ways in which the City of Newcastle could support the sector, including increased financial resources, in-kind staff support, access to facilities, playing a role in joint planning and project activities, knowledge-sharing and advocacy, and a greater role in facilitating access to employment and raising awareness of domestic and family violence in the community.
Serving CaLD Communities in the Newcastle Region: Sector Report 7
The power of servicedelivery networks
Networks exist in all shapes and forms throughout society, from family and friend networks to networks of organisations that work together to address social issues or provide services to communities [1].
Networks of government and non-government service providers have been found to be particularly important in delivering social services to communities, such as health care, housing and shelter, legal, vocational, education and income support services [1]. These networks are particularly important in delivering integrated and coordinated services across a whole range of individual providers to ensure that clients are able to easily access the full range of services needed. Commonly referred to as ‘service-delivery networks’, ‘service implementation networks’ or ‘public service networks’, these inter-organisational networks have been recognised as a powerful mechanism to deliver human services at the community level [2]. In particular, these types of networks have been recognised for their ability to assist in addressing complex and ‘wicked’ problems that require the coordinated efforts of a range of service providers in order to achieve outcomes that cannot be achieved by any single organisation in isolation [3].
Service-delivery networks offer a range of benefits –both for network members and the communities they serve. For example, networks’ inherent flexibility means they are adept (and faster) at responding to changing community needs and efficient at delivering services to people in need [3] – this can mean being able to quickly adapt to increasing numbers of clients (such as an influx of people in need), negotiating crises such as the COVID-19 pandemic, or responding to policy and funding changes. Service-delivery networks have been identified as playing a key role in ensuring better access to services, reducing unmet need, reducing the cost of service delivery (both to organisations and end users through greater efficiencies), greater access to resources, higher community and client satisfaction, and a better ability to respond to changing community needs [2, 4].
Service-delivery networks are created through enduring, multiple exchange relationships that exist between organisations, groups or individuals [3, 5].
Project aims
Recognising that there is an existing service-delivery network comprising non-government and government organisations focused on meeting the needs of Newcastle’s CaLD community, the City of Newcastle set out to determine how it could better support this particular service-delivery network.
The aims of the project were to: establish a baseline understanding of how the network of organisations are connected – both among the CCN and with the wider network of peripheral and mainstream organisations (the GCSN and BCN)
identify the major issues facing these organisations identify where the City of Newcastle is placed in this network, what role the CaLD sector sees the City of Newcastle currently playing in the service system and what they consider its role needs to be in the future.
To achieve this, the City of Newcastle engaged the services of external consultants to undertake research with the sector.
Why study networks?
“Even when relationships between organizations do exist and lead to collaboration, these relationships are typically reliant on people, rather than being institutionalized, and people come and go. Examining the structure of relationships [networks] can provide additional insights that can be used to diagnose or evaluate and inform interventions or efforts to increase awareness, sharing of information, and the development and institutionalization of collaborative relationships.” (Lemaire & Raab, 2020, p. 162)
City of Newcastle 8
1 ‘Wicked’ problems are defined as those that are largely unstructured and “comprise multiple, overlapping, interconnected subsets of problems that cut across multiple policy domains and levels of government” [3, p. 336].
Project approach
To better understand how Newcastle’s CaLD service-delivery network is currently working together to meet community needs, social network analysis was undertaken.
Social network analysis focuses on the connections and relationships (and the structure of those relationships) that exist between entities, such as people or organisations [3, 6]. Understanding the structure of a network can help to identify opportunities and maximise collaborative efforts to better serve communities or stakeholders [6]. Qualitative research was also undertaken to gain a better understanding of the issues facing the sector and how the City of Newcastle can work to assist service providers to better deliver services in the region.
The first stage of the research involved distributing a network survey. The purpose of a network survey is to identify the relationships that currently exist within a service-delivery network – in this case, the network of organisations providing services to CaLD communities in Newcastle. To achieve this, a list of 50 known service providers was identified and used as the primary list of organisations on the survey. These organisations comprised both government and non-government organisations and spanned a range of categories, providing a full spectrum of services: migrant, refugee and asylum seeker support and settlement; aged care; youth and family services; casework; psychological treatment and support; advocacy and policy work; education and training; family support; and community development programs addressing social isolation and connection. The survey was then distributed to the sector, primarily through the 50 identified organisations.
Organisations completing the survey were asked to nominate organisations on the list that they currently interact/have a relationship with or to nominate organisations that were not on the list. This helped to create a picture of the broader CaLD network involved in delivering services to the CaLD community. In addition to understanding the broader connections between organisations in the network, the research aimed to understand how well the network is integrated in order to identify opportunities to help build network members’ capacity to benefit from these networked arrangements. To do this, a number of proven indicators were used that look specifically at the different types of exchange relationships that occur between network members: sharing information, joint projects, joint funding, joint planning and analysis, shared resources and referrals. These relationship types were chosen based on how relevant they are to the CaLD service-delivery network [1, 6, 7 ]. Table 1 provides an explanation of the different types of exchange relationships investigated. By looking at these exchange types, it is possible to identify the range of different relationships and determine whether there are any strengths or weaknesses [6]. For example, a network might be highly efficient at sharing information but have limited capacity to refer clients through the system. For each of the exchange types, respondents were asked to indicate or nominate organisations they had a connection with. In some cases, respondents were also asked to indicate the strength of the connection (see Table 1).
Serving CaLD Communities in the Newcastle Region: Sector Report 9
Table 1 Exchange relationships investigated
Exchange relationships Respondents were asked to select organisations from the list or to nominate organisations that they…
Information Sharing …share information with (either sending information to other organisations or receiving information from other organisations) regarding CaLD services. Respondents were also asked whether they considered this relationship as being high, moderate or low.*
Examples
For example, data, translated materials on mainstream issues, sector advice, new trends, knowledge, grants and tender information, funding opportunities, policy and practice developments or reports.
Joint Funding … have a joint funding arrangement with. Any type of funding arrangement was applicable.
Joint Planning and Analysis … engage in joint planning and analysis activities with around CaLD services and whether these relationships were high, moderate or low.
Joint Projects … engage in joint project activities with around CaLD services and whether these relationships are high, moderate or low.
Referrals – in/out
… make CaLD client ‘referrals to’ or receive CaLD client ‘referrals from’ (or both).
Share Resources … share resources with to facilitate service delivery to CaLD communities and whether this relationship is high, moderate or low.
*
For example, working together to undertake a needs analysis.
Project examples include Newcastle Harmony Day, Multicultural Youth Group, Refugee Week, and Swimming Programs.
For example, a health service provider referring a client to a housing/ homelessness service or vice versa.
Equipment, facilities, staff, databases, stationery and office space.
High = lots of interaction; moderate = medium interaction; Low = not so much interaction in this area
The survey also collected demographic data on the responding organisations, including whether delivering services to CaLD communities is their core business, information on subsector involvement and area of work focus, and asked a number of qualitative questions aimed at better understanding the issues facing the sector, which organisations the service sector would like better access to and why, and what the City of Newcastle’s role is currently and what respondents believe it should be in the future.
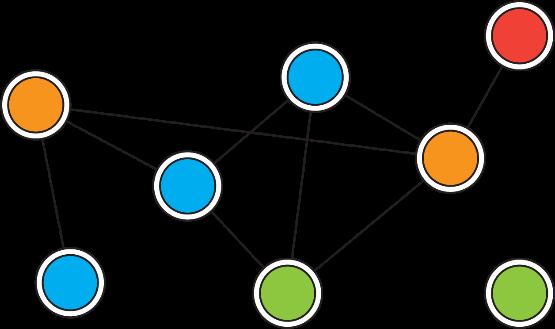
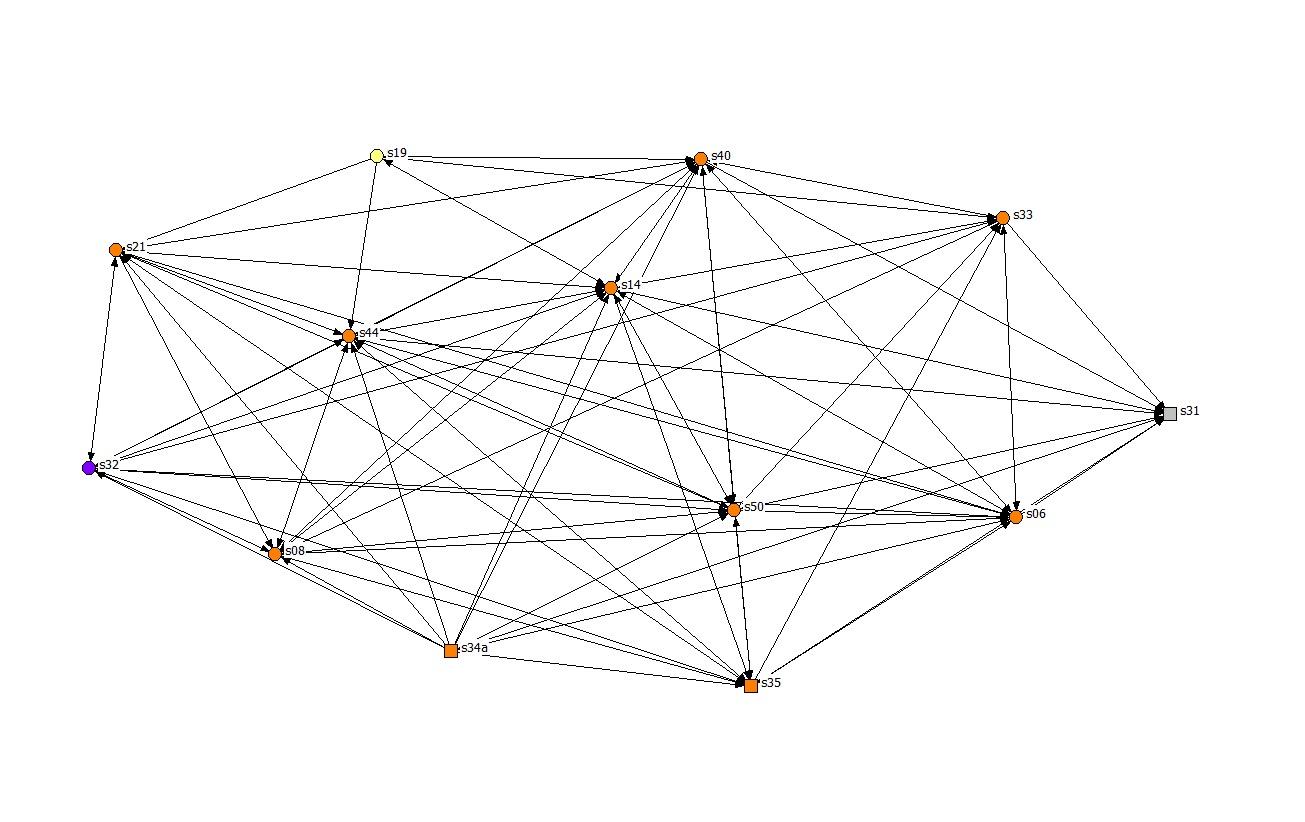
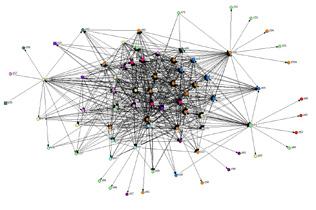
A benefit of social network analysis is its ability to ‘map’ the network being investigated. These maps provide a graphical representation of the network, visually depicting network members as ‘nodes’ (in this project depicted as circles or squares depending on whether an organisation is a non-government or government organisation) connected by ‘ties’ (lines). An example of a basic network map is illustrated in Figure 1. Network maps are useful for identifying connections between network members as well as the network’s overall structure. In this project, over 400 maps were created based on the demographic characteristics as well as according to relationship strength where applicable.
City of Newcastle 10
The patterns of connections and structures of relationships within the CaLD network were analysed using generally accepted social network analysis measures (explained later) [6, 8]. Following the survey analysis, a sensemaking workshop was held with interested stakeholders. The workshop aimed to compare the maps with network members’ experience and knowledge of the network and discuss the desired level of integration and connection within the network. Sensemaking involves practitioners or end users interacting with research findings to enhance the relevance and value to service provision, practice and places. In this project, it engendered a deeper understanding of the nature and structure of the networks and what is going on in the service environment. The aim of the sensemaking workshop was to develop a plausible understanding of the network maps and test the initial interpretations and understandings of the maps and metrics through additional data collection, conversation and action. In particular, the workshop allowed the analysis to be refined or abandoned based on how credible the maps and the associated metrics were to participants. In this report, the workshop findings are incorporated into the project findings.
Serving CaLD Communities in the Newcastle Region: Sector Report 11
Figure 1. Example of a simple network map showing the connections between organisations in a service-delivery network
Project findings
Who makes up the CaLD service-delivery network?
The CaLD service-delivery network comprises the organisations that were included in the network survey list, the responding organisations and organisations nominated by survey respondents as being in their network. As a result, three levels of the network were identified (from broadest to narrowest):
Broad CaLD Network (BCN): including all identified organisations, regardless of whether or not they responded to the network survey (74 organisations).
General CaLD Service Network (GCSN): including only the organisations that responded to the network survey (36 organisations).
Core CaLD Network (CCN): including only those organisations that answered ‘yes’ to the delivery of services to CaLD communities being their core business (13 organisations) when answering the survey.
A total of 36 organisations2 responded to the network survey. Of these organisations, 32 were included in the list of 50 organisations provided in the survey, while the remaining four organisations did not appear on the survey list. These 36 organisations make up the GCSN. Of these respondents, 28 (78%) were non-government organisations (NGOs) and 8 (22%) were government organisations. Just over a third of the respondents (13, 36%) answered ‘Yes’ to CaLD services being their core business – these organisations make up the CCN. Respondents nominated 19 additional organisations as being part of the CaLD service sector, bringing the BCN to a total of 74 organisations.3 All organisations were then categorised into 12 general service subcategories4 for further analysis and mapping purposes. Table 2 provides a summary of the organisations and service providers making up the network, broken down according to their different subcategories.
2 Where responses were received from different parts of an organisation, these were aggregated to produce one single organisational response. Duplicate survey responses were deleted, with the completed/most recent response being used for analysis.
3 Within the 74 organisations, five organisations have multiple business units included (meaning that there was one organisational response but multiple business units represented in the listed or nominated organisations). As such, there are a total of 67 organisations represented in the BCN.
4 The City of Newcastle sought sector advice on the appropriate subcategories.
City of Newcastle 12
Table 2. Network composition
* Note: the CCN comprises organisations that answered ‘yes’ to CaLD services being their core business. All responding and nominated organisations were additionally coded to reflect a general service category. As a result, three organisations in the CCN are further categorised into other general service subcategories (i.e., they are core CaLD but also community development, interpreter and legal services).
The BCN and GCSN members represent all categories (with the exception of Indigenous services in the GCSN) and a range of services encompassing migrant/refugee services, health, trauma, disability, education, housing and homelessness. One key gap, however, is the lack of dedicated men’s services – a point also raised in the sensemaking workshop.
On further analysis, and as expected, the CCN encompasses a range of services dedicated to assisting people from CaLD communities, including health and trauma services, migrant, refugee and asylum seeker services, disability services, community development, interpreter and legal services, with one organisation focusing primarily on women.5
Serving CaLD Communities in the Newcastle Region: Sector Report 13
Breakdown BCN GCSN CCN* Gov 22% 22% 23% NGO 78% 78% 77% CaLD as Core business Yes 18% 36% 100% No 82% 64% 0% Subcategories CaLD 24% 31% 77% Indigenous services 4% 0% 0% Community development 11% 11% 8% Community services 16% 8% 0% Disability 7% 8% 0% Education 8% 8% 0% Government 5% 6% 0% Health 7% 6% 0% Housing/homelessness 5% 3% 0% Interpreter 1% 3% 8% Legal 4% 6% 8% Women 7% 11% 0%
5 These services are not reflected in the subcategories in Table 2 as these relate to organisations’ overall general service subcategory; that is, an organisation in the ‘CaLD’ subcategory may provide services for only women or people with a disability.
Mapping the CaLD servicedelivery network
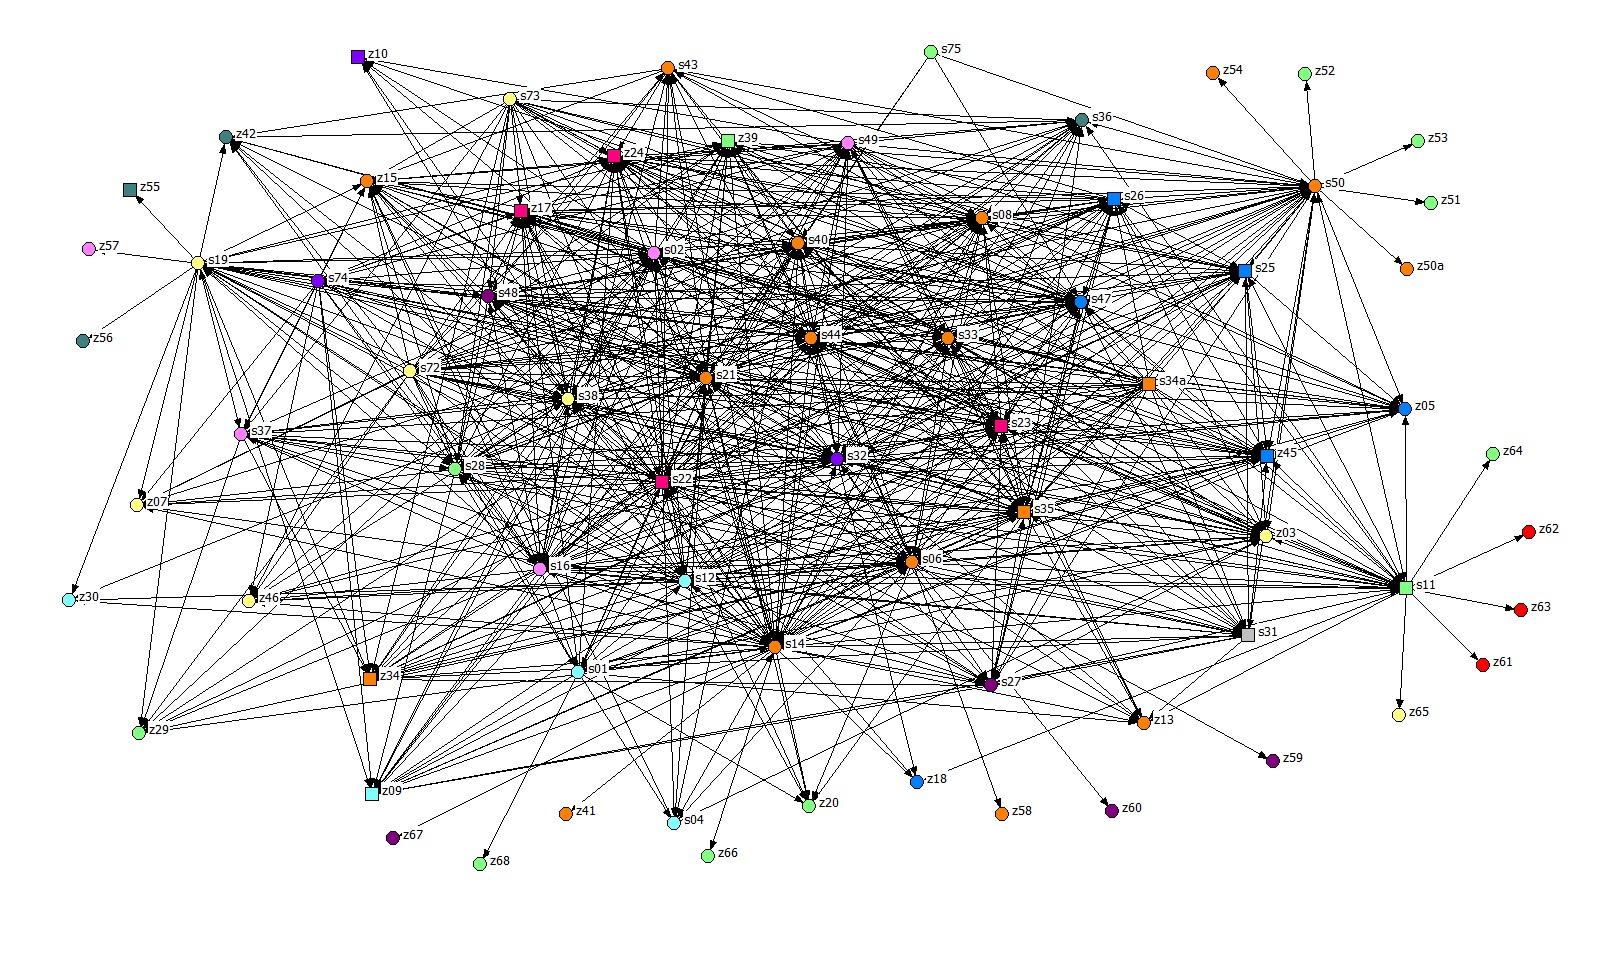
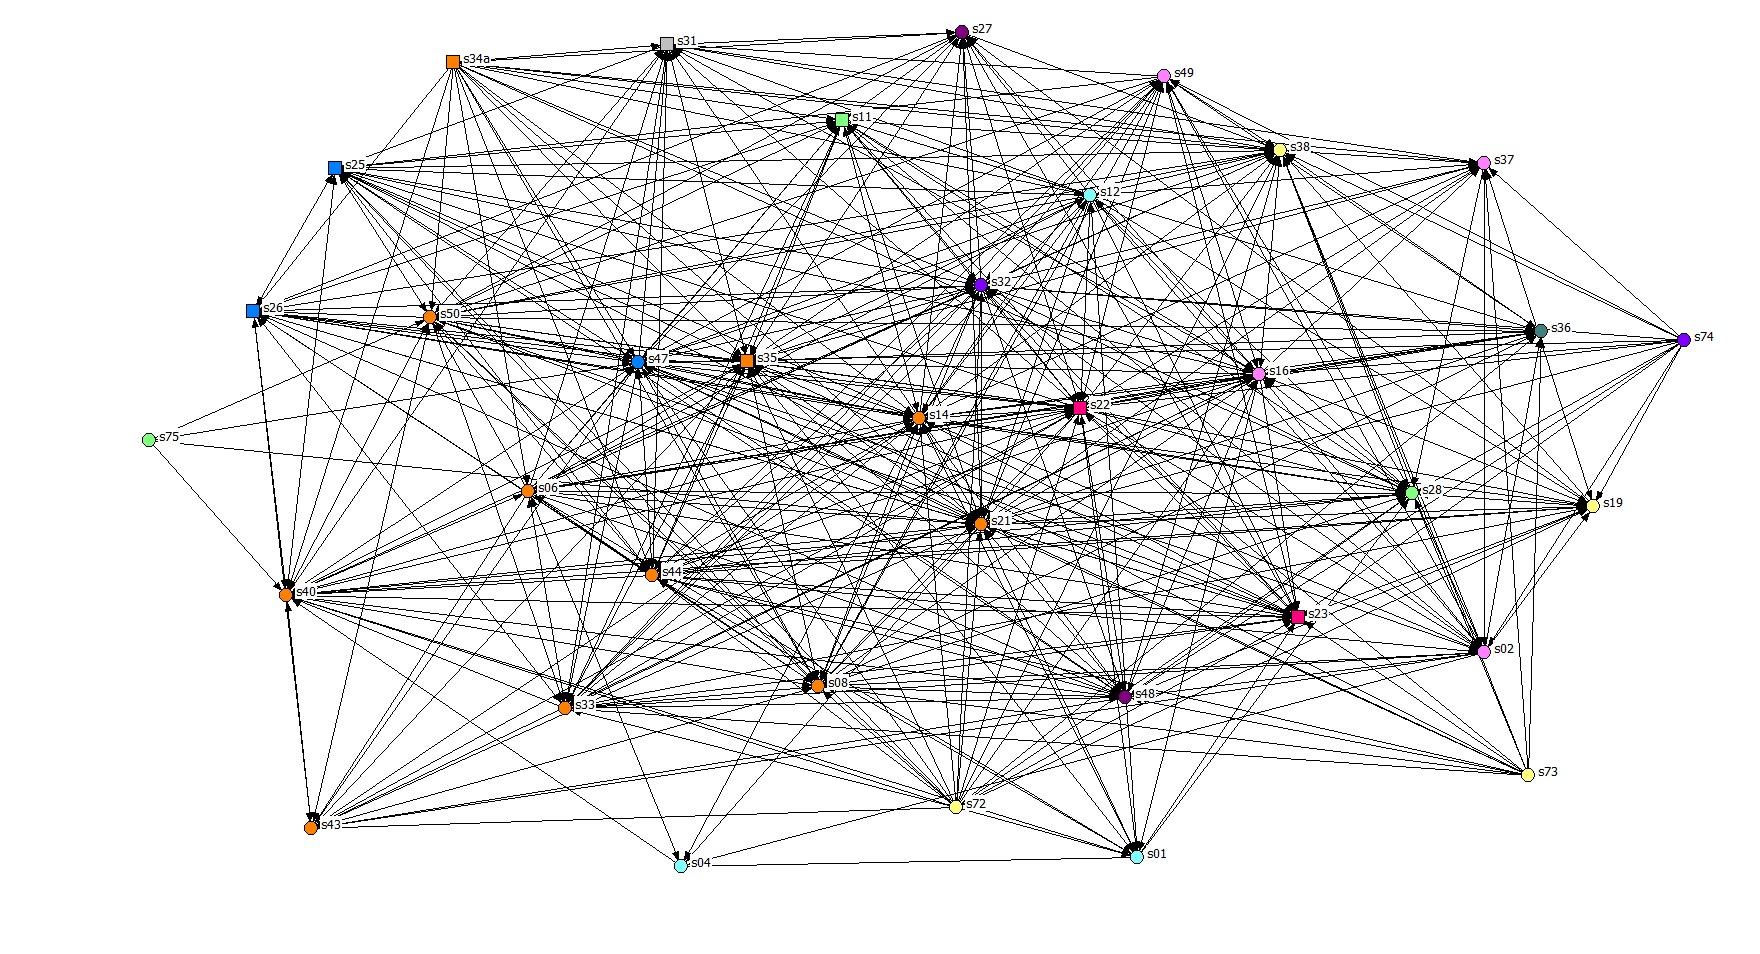
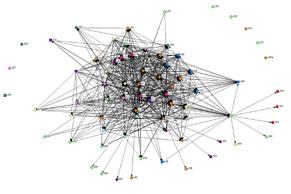
As noted above, network maps are helpful in identifying the structure of a network (e.g., whether the network has many or only a few connections and whether there are identifiable central players) [6]. Maps 1–3 (on pages 11 – 13) illustrate the connections that exist within the BCN, GCSN and the CCN (using the initial survey question asking respondents to select or nominate organisations that they have a connection with regarding CaLD service delivery).
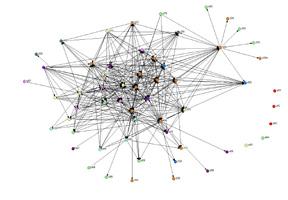
As expected, Maps 1–3 show that the structural patterns (how network members are connected and how many connections there are) and size decrease from the BCN (comprising all 74 organisations) down to the CCN (comprising the 13 service providers who self-identified as CaLD services being their core business). Nonetheless, the maps highlight an overall level of connectivity, which is a positive feature for the CaLD sector and a solid indicator of cooperative working relationships.
Of note are the 19 additional organisations nominated by survey respondents but which were not originally identified as being part of the CaLD sector (seen in Map 1 as the largely peripheral nodes that are linked at the fringes of the network to only a small number of GCSN members). These additional services point to a broader set of services than initially identified as potentially being in the sector. In particular, they may be integral to expanding and enhancing the scale and scope of the services that can be provided. It is important to note, however, that because these organisations did not complete the survey, it is unknown why they sit on the periphery (e.g., due to funding arrangements or their primary focus), and it is possible that they are better connected to the CaLD sector than they appear.
Node colour Subcategory (round = NGO, square = Gov)
Orange CaLD Services
Yellow Community Development Services
Green Community Services
Light Blue Disability Services
Bright Blue Education Services
Bright Pink Government Services
Plum Health Services
Teal Housing/Homelessness Services
Red Indigenous Services
Grey Interpreter Services
Bright Purple Legal Services
Pink Women’s Services
Map legend
S nodes = Organisations that responded to the network survey
Z nodes = Organisations that did not respond to the network survey but appeared on the survey list or were nominated by respondents
Note: Placement of nodes on network maps are randomly generated, and distance does not correlate with the strength of the relationship (i.e., an organisation that appears right next to an organisation on the map can have an equal or stronger relationship with an organisation placed further away on the map). The purpose is to show the connections that exist. Naturally, organisations with fewer connections are more likely to appear on the edges of the network.
City of Newcastle 14 Serving CaLD Communities in the Newcastle Region: Sector Report 15
Map 1. BCN connections
Node colour Subcategory (round = NGO, square = Gov)
Orange CaLD Services
Yellow Community Development Services
Green Community Services
Light Blue Disability Services
Bright Blue Education Services
Bright Pink Government Services
Plum Health Services
Teal Housing/Homelessness Services
Red Indigenous Services
Grey Interpreter Services
Bright Purple Legal Services
Pink Women’s Services
Map legend
S nodes = Organisations that responded to the network survey
Z nodes = Organisations that did not respond to the network survey but appeared on the survey list or were nominated by respondents
Note: Placement of nodes on network maps are randomly generated, and distance does not correlate with the strength of the relationship (i.e., an organisation that appears right next to an organisation on the map can have an equal or stronger relationship with an organisation placed further away on the map). The purpose is to show the connections that exist. Naturally, organisations with fewer connections are more likely to appear on the edges of the network.
City of Newcastle 16 Serving CaLD Communities in the Newcastle Region: Sector Report 17
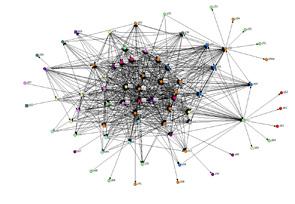
Map 2. GCSN connections
Subcategory (round = NGO, square = Gov)
CaLD Services
Community Development Services
Community Services
Disability Services
Education Services
Government Services
Health Services
Housing/Homelessness Services
Indigenous Services
Interpreter Services
Bright Purple Legal Services
Women’s Services
Organisations that responded to the network
Organisations that did not respond to the network survey but appeared on the survey list or were nominated by respondents
Note: Placement of nodes on network maps are randomly generated, and distance does not correlate with the strength of the relationship (i.e., an organisation that appears right next to an organisation on the map can have an equal or stronger relationship with an organisation placed further away on the map). The purpose is to show the connections that exist. Naturally, organisations with fewer connections are more likely to appear on the edges of the network.
City of Newcastle 18 Serving CaLD Communities in the Newcastle Region: Sector Report 19
However, given these nominated organisations are loosely connected, they are potentially vulnerable to further isolation if they lose contact with their network connector organisation. The potential vulnerability of these peripheral organisations can be seen in Maps 4 and 5, which show what could potentially happen if one government connector is removed from the BCN and if two NGOs are removed from the information sharing BCN, leaving the peripheral organisations with no network connections at all.
When looking at the demographics of these 19 additional organisations (see Table 3), they span a range of general service categories. The largest group (6 organisations) comprises community service organisations and, of these, 67% (4 out of 6) provide services to community members of a specific ethnic heritage or religion. Three Indigenous services are included in the additional 19 organisations and an additional community development organisation also provides services to Indigenous communities. Further investigation is needed to determine whether these services form part of a different service sector (e.g., Aboriginal and Torres Strait Islander service sector) or whether they consider themselves as part of the CaLD service sector. Investigation of strategies and approaches to engage the four unfunded, volunteer organisations that provide services to particular ethnic or religious groups within the CALD sector would also be valuable. The sole government organisation was a health-based organisation.
City of Newcastle 20
organisation
organisation
Connecting
Connecting
Map 4a. BCN – Connections overall
Map 5a. BCN – Information sharing
Map 4b. NGO BCN network – Connections overall
Map 5b. BCN network – Information sharing
Isolated when connector is removed
Connecting organisation
Isolated when connector is removed
Other than the potential vulnerability of the peripherally connected organisations, overall, the maps indicate a well-connected network, with no visible gaps between groups within the network [9]. The maps for all the exchange types are provided in Appendix A.
How the CaLD service-delivery network currently operates
While network maps help to provide an overall picture of a network, how a network operates (such as how integrated it is and whether it is structured around a central network member) can be determined using a range of social network measures based on the survey responses [1, 6]. This project considers the ‘whole network’, which essentially takes a birds-eye view of the entire network, rather than focusing on the network of one particular organisation (referred to as an ‘ego network’) [5, 10, 11]. While focusing on ego networks can be important in understanding each organisation’s role and placement in the network, when looking at the delivery of services as a whole (such as a network’s overall ability to meet the needs of people from CaLD communities), it is more appropriate to take a holistic approach and assess how organisations are integrated and work together at the network level, as network success cannot be attributed to any single organisation [1, 12]. As such, this project primarily focused on the network as a whole.
There are a number of commonly used metrics that are used to understand how networks are structured and integrated [1, 6]. While there is no one ideal network structure, these measures can help in determining how effective a network structure is, taking into consideration the unique context of the network [1, 6, 13, 14]. Table 4 provides an overview of the key measures used in this project, including what these measures indicate and how the GCSN performed in each area.
Overall, the evidence of multiplex ties, functional density and connectivity levels, and a low average path distance suggest that the GCSN is working efficiently and provides a solid foundation from which the CCN can operate now and into the future.
Understanding average path distance – in a network, there can be advantages to ‘being a friend of a friend’ (Scott, 2003)
It is important to note that missing responses in social network surveys have been shown to skew a network’s structural properties [15]. As such, network measures are provided only for the GCSN (see Table 4). The network measure results are also provided in Appendix B.
Serving CaLD Communities in the Newcastle Region: Sector Report 21
Breakdown Percentage (No.) Gov 5% (1) NGO 95% (18) Subcategories CaLD 16% (3) Indigenous services 16% (3) Community development 5% (1) Community services 31.5% (6) Disability 0% Education 0% Government 0% Health 16% (3) Housing/ Homelessness 10.5% (2) Interpreter 0% Legal 0% Women 5% (1)
Table 3. Composition of the additional organisations listed
Table 4. Assessing network measures and their implications for the GCSN
Measure What it measures Implications for networks*
Density Density reflects the general level of integration/ connection in a network [1, 16]. It is the percentage of the maximum possible number of ties in the network (actual number of ties compared to the number of ties possible) [10].
• How dense (well-connected) a network is can impact how resources and information flow through the network [6].
• Density also impacts the time and effort needed to sustain relationships [8] – the more relationships an organisation has, the more time and effort is needed to sustain them, which can sometimes be counterproductive to efficiency.
Exchange type
GCSN metrics Metrics Implications for the GCSN
Centralisation Centralisation looks at how a network’s integration/ cohesion is organised [1]. It considers the extent to which network connections are structured around key players in the network [8]. A score closer to 1 indicates a highly ‘centralised’ network with all actors pointing to one main actor, while a score closer to 0 indicates a network where every organisation is connected but where there is no central organisation (a decentralised network) [17].
• Centralisation is an indicator of the ‘power and control’ structure of a network [1]. Highly centralised networks are coordinated by a single or small group of organisations [1]. While this can have benefits in terms of facilitating the coordination and monitoring of activities [1], it can also lead to bottlenecks, restricting the flow of information and resources [6].
• Whether a highly centralised or decentralised structure is more effective will depend on the exchange purpose and the environmental context [6,7].
IS 38.6%
JF 38.7%
C 34.9% • Between 25.7% (referrals) and 38.7% (joint funding) of possible ties are present in the GCSN, indicating a low to mid-level of density.
JP/A 32.4%
JPr 37.7%
R 25.7%
SR 30.7%
• The findings show that the broader GCSN members engage primarily and most extensively in lower-risk activities, such as shared information, decreasing their interaction as the intensity of effort and/or risk increases.
• This result is consistent with findings in studies of other service systems in that the level of connection for exchange relationships decreases relative to the level of risk and/or intensity of effort required.
C .346
IS .353
JF .353
JP/A .454
JPr .363
R .486
SR .450
• The centralisation measures show a largely decentralised network with no clear, single actor dominating the flow or control of information or resources within the network.
• The nature of the planning task, which requires coordination, likely provides some explanation for the slightly higher centralisation score for this exchange relationship.
City of Newcastle 22
Measure What it measures Implications for networks*
Average Degree This measures the average number of connections that organisations have with each other across the network [17].
Exchange type
• Average degree is useful when comparing networks (such as connections for information sharing as opposed to joint funding) [17] as it helps to identify where there might be low levels of relationships.
GCSN metrics Metrics Implications for the GCSN
C 13.8
IS 13.5
JF 13.5
JP/A 11.3
JPr 13.2
R 9
SR 10.8
• Organisations connect on average to 11–14 other organisations in the network (referrals being the exception at 9 organisations), showing a functional level of connectivity for all relationship exchange types.
• The findings show a slightly lower level of connectivity for referrals and shared resources. The lower density and average degree scores for these key exchanges could potentially be an indication of a level of resource scarcity.
• It is important to note that while the average number of organisations that network members connect to drops slightly for referrals (avg degree = 9), this is not unexpected for this type of exchange.
Closeness (also referred to as ‘average path distance’)
This considers the distance of any one organisation to any other organisation in the network [17].
• An increase in closeness or average distance can increase the time it takes, for example, to disseminate information and resources, or can impact clients’ access to services by making it difficult to refer people to the appropriate services.
When thinking about the benefits of a low average path distance, it helps to remember that in a network, there can be advantages to ‘being a friend of a friend’ [8].
Local centrality (in-degree and out-degree)
Local centrality comprises in-degree and out-degree scores, measuring the number of incoming and outgoing ties an organisation has: Out-degree: the number of connections that an organisation nominates In-degree: the number of times an organisation is nominated by others in the network
• Local centrality indicates how well organisations are connected within their network and is an indicator of which organisations might be ‘in the thick of things’ [8]. Out-degree scores can indicate an organisation’s reach or ‘expansiveness’ in the network [10], while the in-degree score can indicate an organisation’s ‘popularity or prestige’ [10].
• In-degree scores are often considered more reliable measures than the self-reported out-degree measure [17].
C 1.5
IS 1.5
JF 1.5
JP/A 1.6
JPr 1.5
R 1.7
SR 1.6
In-degree and out-degree scores are calculated for each exchange type and organisation and cannot be aggregated for the network. As such, they are not reported individually here.
• Ranging from a low 1.5 to a high of 1.7 steps for any one organisation to reach any other organisation in the network indicates an overall functional pattern of connection across the GCSN network, meaning that an organisation will only need to go through 1–2 organisations before they can connect with an organisation they don’t already have a relationship with.
• As expected, a review of all of the in-degree and out-degree scores for GSCN members span from being low to extremely high, meaning that some members are more connected within the network than others.
Given the differences in size and varied focus of organisations, this is not surprising.
Serving CaLD Communities in the Newcastle Region: Sector Report 23
Measure What it measures Implications for networks*
Bridges (also referred to as ‘betweenness’)
This measure is an organisationallevel measure, looking at network members’ ‘betweenness’ scores (how often they sit between two unconnected network members) [10].
• Organisations with high betweenness scores can be very central to their network, acting as a bridge, broker or gatekeeper between unconnected parts of the network or between network members [8]. These organisations have the potential to influence networks (e.g., control the flow of information or resources, link different groups together) but may also be in stressful positions sitting between organisations with different needs [10].
• When considering the whole network, the number of bridging organisations indicates how well gaps in the network are being bridged by network members [3].
Exchange type
GCSN metrics
Metrics Implications for the GCSN
Betweenness scores are calculated for each exchange type and organisation and cannot be aggregated for the network. As such, they are not reported individually here.
• The GSCN scores consistently indicated a core set of organisations with high betweenness scores that act as bridges across all exchange types.
• While betweenness scores often correlate with in-degree and out-degree scores (indicating organisations that are well-connected in the network), sometimes it is a case of not ‘how many people you know’ but where ‘you are placed’ within the network that is most important [10]. This is the case for some of the bridging organisations in the GSCN.
• The GSCN’s bridging organisations are made up primarily of organisations that provide CaLD services as their core business and span a range of service categories. Some are well-connected in the network, while others are less so, indicating that even though some organisations may not be perceived to be ‘in the thick of it’, they can still be critical to the network.
Multiplexity Multiplexity considers the range and diversity of the exchange relationships that network members have, such as being connected through both information sharing and joint project activities rather than just through one of these alone [5].
• When organisations are connected in more than one way (such as through both referrals and joint projects), their connections are considered to be stronger and more resilient and sustainable [2].
Multiplexity indicates a strong and robust network as it is less vulnerable to impacts caused by a breakdown in one type of organisational relationship [1].
• Multiplexity is a good indicator of network effectiveness as relationships are thought to strengthen (and multiply) if a network is working well and is maintained over time [1].
Multiplexity is assessed by looking at network measures such as density, average degree and closeness across each of the studied relationship exchanges.
• The GCSN network is strengthened by network members connecting with each other across a number of different types of exchange relationships, with networks for information sharing, joint funding, joint projects, joint planning and analysis, referrals and shared resources all showing good connectivity.
* Based on empirical studies looking at a range of inter-organisational networks (see for example [1, 16]).
C = Connection exists; IS = Information sharing; JF = Joint funding; JP/A = Joint planning and analysis; JPr = Joint projects; R = Referrals; SR = Share resources
City of Newcastle 24
Key highlights of the social network analysis findings
The network measures in Table 4 for the general level of connectivity (‘C’ in the Exchange type column) show that network members are relatively well-connected (with an average of 13–14 organisations out of the total 35 connections possible), with the network overall having a low to mid-level density, meaning that there is a degree of efficiency in terms of, for example, how fast information travels through the network and how resources are mobilised.
The network appears to be quite efficient, with organisations taking on average 1.5 steps to reach any other organisation in the network (closeness/average path distance).
The network is relatively decentralised with no single organisation or group of organisations ‘controlling’ or ‘coordinating’ the network; however, there are several organisations that are well-positioned to nurture and maintain the network’s connectivity levels, activate relationships and mobilise resources when required (i.e., ‘bridging’ organisations).
The GCSN (General CaLD Service Network) is strengthened by network members connecting with each other across a number of different types of exchange relationships, with networks for information sharing, joint funding, joint projects, joint planning and analysis, referrals and shared resources all showing good connectivity.
The highlights of the exchange relationship measures include:
Information sharing (considered in general to be a low-risk/low-intensity exchange activity) has a moderate density, meaning members are relatively well-connected for information sharing purposes.
• Shared resources, referrals and joint planning (which require increased effort and are therefore higher in risk) have a slightly lower density score, meaning there is a smaller cohort of organisations that have relationships for shared resources, referrals and joint planning purposes.
Although lower density scores are expected for activities that require higher levels of effort and resources, low density scores for key exchanges such as shared resources and referrals could also indicate resource scarcity – in the case of referrals, for example, this can result in ‘interaction churn’ due to resources being unavailable in the first instance (and possibly subsequent instances), meaning that client movement among service providers increases.
• These findings align the GCSN with most research on integrated services [6]; that is, most interaction occurs around low-risk/low-intensity foundational exchange relationships, especially information sharing, with interaction decreasing as more effort and/or resource input is required. The exception is joint projects and funding, both of which produced slightly higher results. This could reflect a network that has a history of working together around projects and sharing funds to facilitate these services, as noted by participants in the sensemaking workshop.
The GCSN has a number of organisations that have high betweenness scores. Because these organisations essentially sit between numbers of unconnected organisations, as ‘bridging’ organisations, they have the ability to link unconnected organisations in the network, helping to disseminate, for example, information and resources and facilitate referrals. In particular, they have the capacity to be influential in maintaining the GSCN’s ability to meet the needs of clients across a range of service-delivery areas (e.g., by connecting different parts of the network that are otherwise unconnected). The City of Newcastle will consider how it can best support these organisations and the wider network.
Serving CaLD Communities in the Newcastle Region: Sector Report 25
The role of bridging organisations
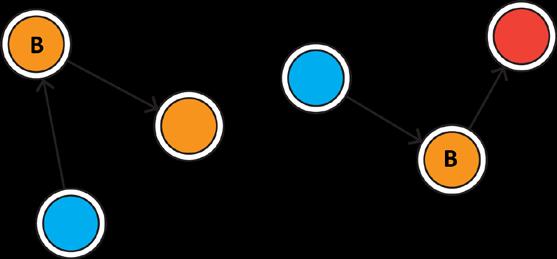
Bridging organisations, sometimes called ‘brokers’ or ‘gatekeepers’, hold advantageous positions in networks as they: control incoming information and/or resources (e.g., new ideas, funding sources, useful information) (often referred to as a ‘gatekeeper’, see Figure 2a) make decisions about whether or not unconnected actors should be linked (referred to as a ‘liaison’ or ‘gap-filler’, see Figure 2b) process information and/or resources within their groups represent their network group externally by playing a boundary-spanning (linking internal network members with external knowledge/information/resource sources) or gap-filling role [18].
2a (left): Filtering information to network members (‘gatekeeper’);
2b (right): Connecting unconnected network organisations (‘liaison’ or ‘gap-filler’)
City of Newcastle 26
Figure 2. Examples of roles played by bridging organisations (denoted by ‘B’)
Qualitative findings
In addition to understanding how the CaLD service-delivery network currently operates, understanding the issues facing service providers and what organisations they would like better access to will also be important in helping the City of Newcastle to identify how it can assist the sector in its servicedelivery efforts.
To achieve this, the following open-ended questions were included in the survey:
Which organisations do you get the most benefit from interacting with? Ranking in order of how important the interactions are to your organisation
Which organisations do you want better access to?
Ranking in order of priority
Please explain how having better access to these organisations would improve your organisation’s ability to deliver services to CaLD communities?
Please tell us what the ‘big’ or most pressing issues are facing the Newcastle region.
How do these issues affect CaLD services in the Newcastle region?
What role does the City of Newcastle Council currently have in supporting your organisation with these issues relating to CaLD service delivery?
What role should/could the City of Newcastle Council have in supporting your organisation with these issues relating to CaLD service delivery?
The responses to the qualitative questions will help the City of Newcastle to focus its activities on areas of high importance to the sector and ensure it is working effectively with the sector to help service-delivery efforts. The key findings from this part of the project are summarised below:
Survey respondents regard CaLD-specific service providers as the most beneficial organisations to interact with, followed by local health providers and state and local government providers with a focus on community development and protection. While not viewed are the most beneficial connections, overall, state and local government organisations were respondents’ highest priority in relation to who they want better access to.
Better access to state and local government organisations followed by other CaLD providers was considered important to strengthen existing services and improve understanding of the needs and priorities of CaLD communities.
Planning and funding were considered important roles of state and local government organisations.
Key issues facing the CaLD sector include housing, employment and financial insecurity. In many cases, CaLD services are left ‘filling the gap’ in meeting these needs. Domestic and family abuse was also raised as an issue, along with understaffed and under-resourced community service providers.
Just under a third of respondents reported working with the City of Newcastle on CaLD community service-delivery activities, while around a half of respondents reported not working with the City of Newcastle in any capacity.
It was clear that respondents would welcome greater collaboration with and support from the City of Newcastle.
Respondents noted a range of ways in which the City of Newcastle could support the sector, including:
• increased financial resources
• in-kind staff support
• access to facilities
• playing a role in joint planning and project activities
knowledge-sharing and advocacy
• playing a greater role in facilitating access to employment
• raising awareness of domestic and family violence.
A detailed overview of qualitative findings can be accessed in Appendix C of this document.
Serving CaLD Communities in the Newcastle Region: Sector Report 27
Building network capacity
Building capacity for cooperative relationships in the BCN, GCSN and CCN
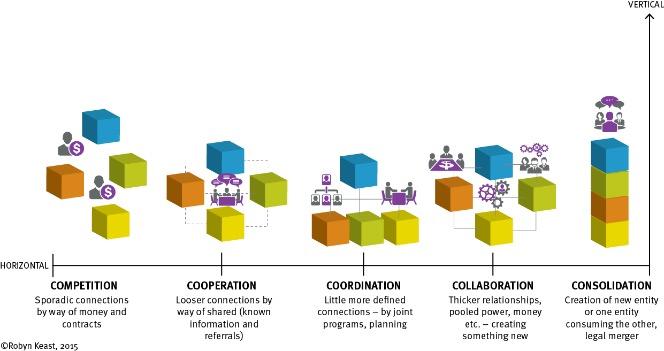
The GCSN maps and network measures reveal a mature network that is connected at a functional level. It is comprised of similar but largely not overlapping services, suggesting little service duplication. Taken together, the network measures point to a network positioned at the cooperation/coordination level of the Inter-Organisational Relationship Continuum (Figure 2), demonstrating a capacity to work together to enhance both organisational and sectoral goals/outcomes.
Each ‘C’ – competition, cooperation, coordination, collaboration and consolidation – all have merits in inter-organisational relationships. Which of the 5Cs should be used will depend on the task at hand. Striving to reach a level that is not needed (such as trying to collaborate when organisations only need to cooperate) will waste resources and will be harder to sustain in the long term.
Connectivity is central to delivering individual and service outcomes, but not everything has to be connected all of the time – it is important to be strategic and deliberate in what types of connections organisations have with each other and how these connections are used. Trying to be connected with everyone all of the time can be costly, time-consuming and hard to sustain.
City of Newcastle 28
Figure 2. The Inter-Organisational Relationship Continuum (the 5Cs Model)
5Cs
The Inter-Organisational Relationship Continuum –The 5Cs of Collaboration
Collaboration remains the gold star approach for people and organisations looking to work together and is a mainstay strategy for social policy and service delivery.
Despite its enduring popularity, collaboration is hard to achieve and even harder to sustain, with between 50% and 75% of such arrangements failing to reach their full potential or failing outright. Given the growing body of knowledge from research and practice about collaboration, including its processes and functions, it is perplexing that we still can’t make it work.
The 5Cs diagram expands the well-known 3Cs framework (cooperation, coordination and collaboration) to take in the full range of inter-organisational relationships, including the book-ending elements of competition and consolidation (mergers and amalgamations) – both of which are increasingly prominent in contemporary social policy formulations and funding regimes. The expanded 5Cs model places competition at the fragmented end of the inter-organisational relations continuum through the 3Cs (which are located in the middle) to conglomeration at the far end, denoting the assembly of components into a single entity.
Source: Keast, R. Integration Terms: Same or Different? In G. Cary. Grassroots to Government: Creating Joined up Working in Australia, Melbourne University Press (MUP), Melbourne 25-46
Serving CaLD Communities in the Newcastle Region: Sector Report 29
Because the GCSN and CCN (and, in turn, the BCN) have the necessary structures and processes in place, they can continue to nurture and build this cooperative/coordinative position to leverage the benefits offered by the network. In particular, relationships that facilitate cooperative action are critical to healthy and successful networks [12]. Moving forward, members of the BCN, GCSN and CCN can evaluate network health by focusing on the processes through which relationships are created [12]. To assist in this process, Table 5 provides a checklist covering key things network members could consider when evaluating network health.
Table 5. Network health checklist
Key area
Relationships and processes
Points to consider
Are there good relations between members?
• What is the trust level?
• Is time spent on members getting to know each other and their problems/limitations?
• Do members feel a strong or weak bond or commitment to each other?
• Are there processes in place to enable these bonds?
Is relationship building (internal and external) an accepted part of the work program?
• Do members communicate openly and frequently?
Do members have a sense of commitment to the collaboration as well as their own organisation? What are the power relations?
• Is power shared, or does it appear to rest with specific members of the collaboration?
Are there mechanisms to resolve conflict?
• Is there a culture of learning?
Participation level
• Do all members participate in the collaboration in terms of decision-making and resource provision?
Are there barriers to participation?
• Are there processes in place to check ‘engagement level’?
• Are people participating as much as they can/wish
Structure and control
Is the way the collaboration is set up appropriate for the aims?
• Is the structure too tight (strangling), too loose (lacks cohesion) or just right (facilitates action)?
• Where/how are most decisions made?
• Democratically or centralised?
• Is there support for the collaboration by key actors outside the collaboration (e.g., parent organisations’ powerful stakeholders & respected people in the community)?
Source: Keast, R. adapted from Church M. et al. (2003). Participation, relationships and dynamic change: New thinking on evaluating the work of international networks. Development Planning Unit, University College London.
City of Newcastle 30
Measuring overall network effectiveness
Research shows that there is no one optimal network structure – the optimal network structure reflects the purpose of the network and the environment within which it operates – that is, it is important to consider whether the network is fit for purpose [13, 14]. Networks have outcomes for the organisations involved, the network itself and the community it services [2,12]. As such, the ongoing effectiveness of a network should be evaluated by looking at three levels [2]:
1. Effectiveness at the community level – is the network making a positive contribution to the community it serves?
2. Effectiveness at the network level – is the network operating efficiently? Often there is a core group of members providing critical services (i.e., the CCN), with a peripheral group of members coming and going as the need arises (i.e., the BCN and GCSN).
3. Effectiveness at the organisational level – recognising that organisations are still primarily self-interested parties, the network must still contribute to organisational priorities and goals. Provan and Milward recommend each network member evaluate this in terms of client outcomes, legitimacy, resource acquisition and cost.
This project has primarily looked at the network level, creating a baseline understanding of the relationships that exist and how they are structured. To gain a better understanding of overall network effectiveness, as noted above, it will be important for all network members – both integral and peripheral – to consider effectiveness at all three levels [2]. As an example of the types of evaluation measures that can be considered, Table 6 provides a list of criteria that BCN, GCSN and CCN members and stakeholders could consider when evaluating the overall effectiveness of the CaLD sector’s networks now and in the future. This checklist can be used in conjunction with the checklist provided in Table 5.
Level of evaluation Criteria
Community level Cost to community
• Building social capital
Public perceptions that problem is being solved
• Changes in the incidence of the problem
Aggregate indicators of client wellbeing
Network level Network membership growth
• Range of services provided
Absence of service duplication organisation
• Relationship strength (multiplexity)
Creation and maintenance of a network administrative organisation
• Integration/coordination of services
• Cost of network maintenance
• Member commitment to network goals
Organisational (network member) level
• Agency survival
• Enhanced legitimacy management
• Resource acquisition
• Cost of services
Service access
• Client outcomes
Minimum conflict for multiprogram agencies across multiple networks
As illustrated by this project, the CCN, GSCN and BCN perform well in a number of the identified network-level measures in Table 6, in particular the range of services provided, the apparent absence of duplication in services and the level of multiplexity across all exchange relationships. Considering some or all of the remaining community-, network- and organisational-level measures will help the sector to maximise network effectiveness, capitalise on the benefits networks can offer and continue to meet the needs of Newcastle’s CaLD communities.
Networks have outcomes for the organisations involved, the network itself and the community it services. As such, the ongoing effectiveness of a network should be evaluated by looking at all three levels: organisation, network and community levels.
Serving CaLD Communities in the Newcastle Region: Sector Report 31
Table 6. Measuring network effectiveness across all three levels (adapted from Provan & Milward, 2001, p. 416
Conclusion
Both the findings from the social network analysis and the qualitative questions will assist the City of Newcastle to better support the CaLD service-delivery network into the future.
In particular, the results have provided a better understanding of how the service-delivery network is currently structured, the strengths of the current structure and how network members can potentially be supported in their service-delivery efforts. In addition, the results have highlighted the challenges facing the sector and the sector’s perceptions of what role the City of Newcastle currently plays and should endeavour to play in the future.
How the GCSN compares to other service-delivery networks?
Although there is no ideal network structure, research shows that there are a number of elements that are important for service-delivery networks in particular [7]. Table 7 presents these key characteristics, how the GCSN measures up against them and offers some potential actions for moving forward. Table 7 takes into account the results of both the network metrics and the sensemaking workshop.
Effective networks will have a small and stable core group of organisations that work together in a coordinated way to provide critical services.
The network will attract peripheral organisations that may come and go as needs arise, offering the network a level of flexibility to meet community demands as the need arises.
The CCN acts as the core of the network, coordinating actions and resources to deliver essential services to CaLD communities.
The wider GCSN and BCN show a wide range of peripheral and more embedded services over and above the CCN.
• Discuss the current situation to ensure the right players are core, and review priorities that result in meeting both individual and collective outcomes.
• Develop and manage an updated organisational list of all BCN members.
• Consider inviting peripheral organisations to networking events (e.g. workshops, regular get-togethers).
• Establish the nature of relationships with peripheral members in terms of the types of exchanges and services provided
• Determine if the current network composition provides the full set of required organisations, services and resources, and, if not, identify relevant organisations, assess the current strength of relationships and develop strategies to enhance connectivity.
The network will provide a broad range of services without high duplication.
The GCSN and BCN show a wide range of services with little – if no – duplication, meaning there is a strong likelihood that clients can access most of the necessary services when needed.
• Develop and manage an updated organisational list of all BCN members.
• Determine if the current network composition provides the full set of required organisations, services and resources, and, if not, identify relevant organisations, assess the current strength of relationships and develop strategies to enhance connectivity.
City of Newcastle 32
network characteristics GCSN How the GCSN performs Possible
Desired
actions
Table 7. Ideal service-delivery networks, the GCSN and possible actions
Desired network characteristics GCSN How the GCSN performs Possible actions
The network should provide both critical and peripheral services.
The BCN appears to significantly meet this criterion with both critical services (e.g., trauma and counselling) and other related but peripheral services (e.g., general health) being provided. An exception is the absence of a dedicated men’s service organisation (however, some organisations do provide men’s services).
• Help build the capacity of organisations within the whole network to encourage wider interaction within the sector, including funding arrangements that incentivise partnerships between large and small service providers.
• While the breadth of services is appropriate, work should continue on building the necessary dedicated men’s services which the sector currently lacks.
The network should have multiplexity (involvement at multiple levels), with organisations connecting across multiple types of relationships. Relationships involving 4-–5 exchange types are considered to be strong, given that the relationship is likely to continue even if one or more links are broken.
The GCSN shows high multiplexity, with good connectivity across all six exchange relationship types from information sharing through to joint planning and analysis (see Appendix 1).
Connections should be strategic and deliberate – trying to be connected with everyone all of the time can be costly, time-consuming and hard to sustain. To maximise effectiveness, organisations can consider:
• Who do you need to establish strong relations with; how strong does the link need to be?
• Where do you already have strong relations?
- How can you use these better?
• Who do you have strong but not productive relations with?
- Should these connections be strengthened or dissolved?
- Are they just habit?
An appropriate level of integration across the network, measured through network metrics (density, average degree, centralisation, closeness).
Most importantly, network connections must be targeted and appropriate for maximum benefit.
The GSCN shows a good level of connectivity, with members connecting on average with 13–14 organisations (out of a total of 36), with the network overall having a low to mid-level density.
The strength of relationships shows a good range of weaker to stronger relationships as expected in an effectively functioning service-delivery network.
• Workshop the purpose of the CaLD and GCSN networks to identify the structure (strength and patterns of connections/exchanges) required to meet this purpose, the relative positions of key organisations, and what actions are required to optimise the networks’ functioning and outcomes.
• Further explore fitness-for-purpose and satisfaction with the current level of relationship reciprocity is recommended, particularly for planning and analysis activities. Mature or larger organisations within the networks, presumably with greater resources and/or spare capacity, could be encouraged and supported to work with and support smaller organisations (who often are resource-poor but innovative and/or provide specialist services) to identify and explore possible joint strategies and resources to facilitate efficient and effective ways to establish and maintain healthy relationships among the network organisations.
Serving CaLD Communities in the Newcastle Region: Sector Report 33
Desired network characteristics
The network must be able to bridge ‘gaps’ in the network, enhancing overall network performance and preventing the network from splintering into distinct clusters
The network must maintain a level of legitimacy, establishing connections with key external stakeholders
GCSN How the GCSN performs Possible actions
The GCSN has a number of bridging organisations that either currently or have the potential to play an influential role in the network by bringing other members together, sharing information or facilitating resource and referral flows
The GCSN shows clear links to external stakeholders not directly involved in delivering services to CaLD communities, such as its ties to City of Newcastle.
• Identify the various unconnected groups within the networks and the relevant broker/ connecting organisations.* With the permission of these organisations, an invitation to participate in further GCSN and CCN network building workshops and initiatives could be extended.
• The network (GSCN and CCN) should continue to identify and maintain links with key external stakeholders through stakeholder engagement activities.
City of Newcastle will continue to identify how it can best support and advocate for the GSCN and CCN within the Newcastle region
Sources: [2,5,12]; *City of Newcastle is in the process of undertaking this work, based on the work carried out as part of this project.
City of Newcastle 34
References
1. Provan, K. G., & Milward, H. B. (1995). A preliminary theory of interorganisational network effectiveness: A comparative study of four community mental health systems. Administrative Science Quarterly, 40(1), 1–33
2. Provan, K. G., & Milward, H. B. (2001). Do networks really work? A framework for evaluating public-sector organizational networks. Public Administration Review, July/August, 61(4), 414–423.
3. Weber, E. P., & Khademian, A. M. (2008). Wicked problems, knowledge challenges, and collaborative capacity builders in network settings. Public Administration Review, March/April, 334–349.
4. Milward, H. B., & Provan, K. G. (2006). A manager’s guide to choosing and using collaborative networks. Networks and Partnership Series. IBM Centre for the Business of Government.
5. Provan, K. G., & Lemaire, R. H. (2012). Core concepts and key ideas for understanding public sector organizational networks: Using research to inform scholarship and practice. Public Administration Review, September/October, 638–648.
6. Lemaire, R., & Raab, J. (2020). Social and dynamic network analysis. In J. Voets et al., (Eds,), Networks and collaboration in the public sector: Essential research approaches, methodologies and analytic tools (pp. 160–188). Taylor Francis.
7. Keast, R., Waterhouse, J., Murphy, G., & Brown, K. (2012). Pulling it all together: Design Considerations for an Integrated Homelessness Services System – Place Based Network Analysis, Department of Families, Housing, Community Services and Indigenous Affairs, Canberra.
8. Scott, J. (2003). Social network analysis: A handbook. SAGE Publications.
9. Labun, A., & Wittek, R. (2014) Structural holes. In R. Alhajj & J. Rokne (Eds), Encyclopedia of social network analysis and mining. Springer, New York, NY. https://doi.org/10.1007/978-1-4614-6170-8_263
10. Prell, C. (2012). Social network analysis: History, theory & methodology. SAGE.
11. Marin, A., & Wellman, B. (2011). Social network analysis: An introduction. In J. Scott & P. J. Carrington (Eds.), The Sage handbook of social network analysis (pp. 11–25). SAGE.
12. Mandell, M. P., & Keast, R. (2008). Evaluating the effectiveness of interorganisational relations through networks: Developing a framework for revised performance measures. Public Management Review, 10(6), 715–731.
13. Cristofoli, D., & Markovic, J. (2016). How to make public networks really work: A qualitative comparative analysis. Public Administration, 94(1), 89–110.
14. Keast, R., Brown, K., & Mandell, M. P. (2007). Getting the right mix: Unpacking integration meanings and strategies. International Public Management Journal, 10(1), 9–33.
15. Huang, F., Zhang, M., & Li, Y. (2019). A comparison study of tie non-response treatments in social network analysis. Frontiers in Psychology, 9.
16. Sandström, A., & Carlsson, L. (2008). The performance of policy networks: The relation between network structure and network performance. The Policy Studies Journal, 36(4), 497–522.
17. Chamberlain, D. (n.d.). Social network research and analysis: Workbook [Unpublished].
18. Fernandez, M., & Gould, R. (1994). The Dilemma of state power: Brokerage and influence in National Health Policy Domains. American Journal of Sociology, 99(6), 1455–1491
Serving CaLD Communities in the Newcastle Region: Sector Report 35
Appendices
Appendix A
Appendix A provides the main maps for all exchange types across all three network levels for Newcastle’s CaLD service-delivery network. The maps are set out in grid form, from the BCN to the CCN, and include the relationship strength maps where applicable. The subcategories referred to in Table A.1 are the general service categories applied to all organisations (responding and nominated) post data collection. The CaLD subcategory therefore includes organisations that did not answer ‘Yes’ to CaLD being their core business. These organisations are included in the BCN and GCSN maps, but not the CCN maps. Three organisations that self-identified as core CaLD are included in all maps (BCN, GCSN and CCN) but are shown in this table under their general service categories.
Map colour Subcategory Notes
Orange CaLD Services (n=18)
This subcategory comprises 18 organisations (Gov: n=3. NGO: n= 15) and contains a mix of respondents and non-respondents. These organisations were categorised as CaLD services as part of the pre-research process. Some organisations in these maps did not nominate CaLD as their core business on the survey, while others that did nominate CaLD as their core business (e.g., s31) are not included in this subcategory. There were multiple connections between these organisations across all variables.
Yellow Community Development Services (n=8)
Green Community Services (n=12)
Light Blue Disability Services (n=5)
Bright Blue Education Services (n=6)
Bright Pink Government Services (n=4)
Plum Health Services (n=5)
Teal Housing/ Homelessness Services (n=4)
Red Indigenous Services (n=3)
Grey Interpreter Services (n=1)
Bright Purple Legal Services (n=3)
Pink Women’s Services (n=5)
This subcategory comprises 8 organisations (all NGOs) and contains a mix of respondents and non-respondents. The organisation z65 (non-respondent) sits consistently outside the network across all maps.
This subcategory comprises 12 organisations (Gov: n=2. NGO: n= 10). This subcategory contains a mix of respondents and non-respondents. There are 2–3 connections across all variables, with the majority of actors sitting outside the subcategory network (the majority being non-respondents).
This subcategory comprises 5 organisations (Gov: n=1. NGO: n= 4) and includes a mix of respondents and non-respondents. With the exception of the overall network, s04 consistently sits outside the network.
This subcategory comprises 6 organisations (Gov: n=3. NGO: n= 3) and contains a mix of respondents and non-respondents. The organisation z18 (non-respondent) consistently sits outside the network.
This subcategory comprises 4 government organisations and includes a mix of respondents and non-respondents. There are connections between the government subcategory, apart from referral purposes (i.e., no referrals between government organisations).
This subcategory comprises 5 organisations (all NGOs) and contains a mix of respondents and non-respondents. There are no connections within the health subcategory across any of the variables.
This subcategory comprises 4 organisations (Gov: n=1. NGO: n= 3), of which 1 is a respondent while 3 are non-respondents. A connection exists between s36 and z42 across all variables. The remaining non-respondents sit outside the network.
This subcategory comprises 3 organisations (all NGOs).These services did not respond to the survey and were nominated by one survey respondent; as such, they show no ties among themselves.
As there is only one organisation in this network, there are no connections to report. This organisation is responded ‘Yes’ to CaLD being its core business. From other network maps, it is clear this organisation has multiple connections with other subcategory actors.
This subcategory comprises 3 organisations (Gov: n=1. NGO: n= 2), with 2 respondents and 1 non-respondent. A connection exists between s74 and s32 and between s32 and z10 across all variables.
This subcategory comprises 5 organisations (all NGOs) and contains 4 respondents and 1 non-respondent (z57), which consistently sits outside the network across all variables. This network acts differently depending on the variable being considered.
Note: Although ‘z nodes’ are sometimes unconnected or sit outside the network, these organisations did not complete the survey and, in reality, may have connections not uncovered by this analysis.
City of Newcastle 36
Table A.1 Guide to BCN, GSCN and CCN maps
Network maps across variables by BCN, GCSN and CCN
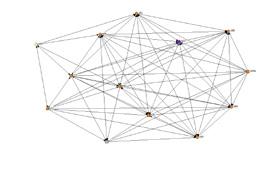
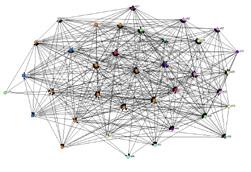
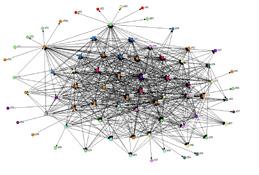
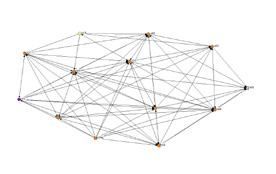
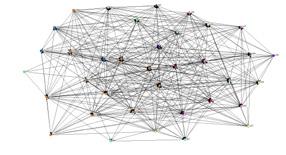
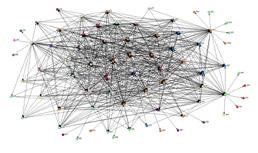
Connections exist
Broad CaLD Network (BCN)
General CaLD Service Network (GCSN)
Core CaLD network (CCN)*
Information sharing
Serving CaLD Communities in the Newcastle Region: Sector Report 37
Broad CaLD Network (BCN)
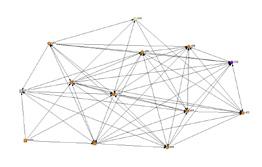
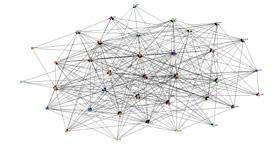
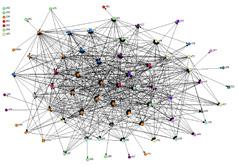

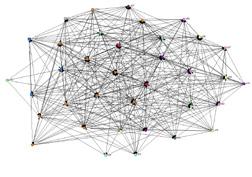
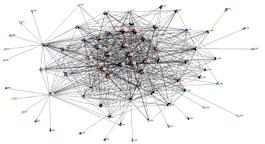
General CaLD Service Network (GCSN)
Core CaLD network (CCN)*
City of Newcastle 38
Joint funding Joint planning & analysis
Broad CaLD Network (BCN)
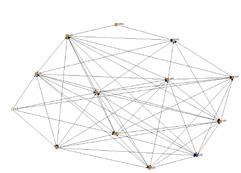
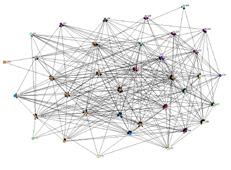
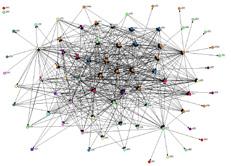
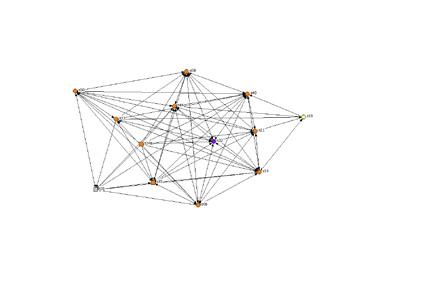
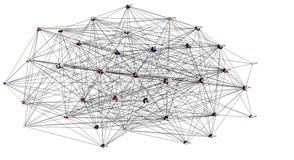
General CaLD Service Network (GCSN)
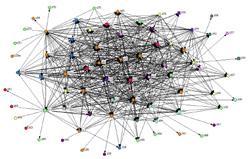
Serving CaLD Communities in the Newcastle Region: Sector Report 39
Joint projects Shared resources
Referral maps for the broad network and respondent network by referrals in, referrals out and referrals both (in and out)
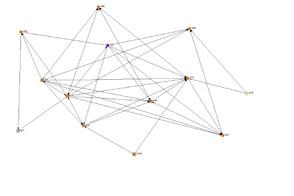
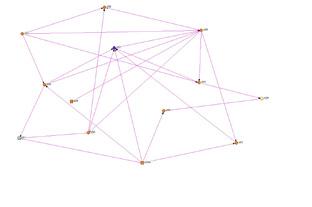
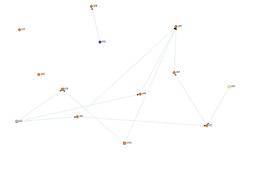
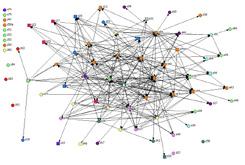
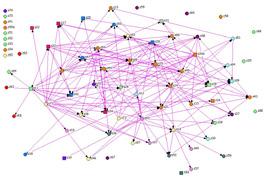
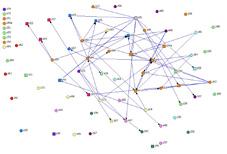
Receiving referrals (In)
Making referrals (Out)
Receiving and making referrals (Both)
City of Newcastle 40 Variable BCN GCSN
Broad and respondent network maps across variables by tie strength (Low, Moderate, High)
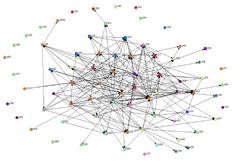
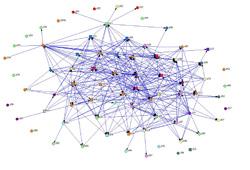
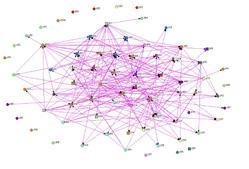
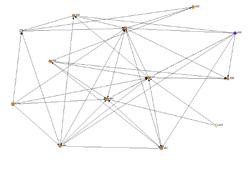
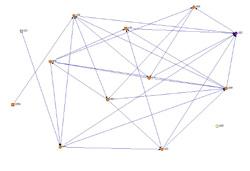
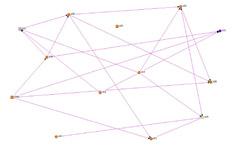
Serving CaLD Communities in the Newcastle Region: Sector Report 41 Variable GCSN BCN Low ties Moderate ties High ties
Shared info
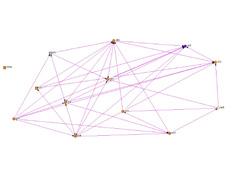
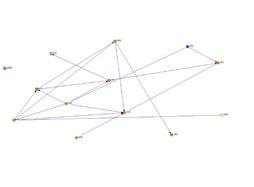
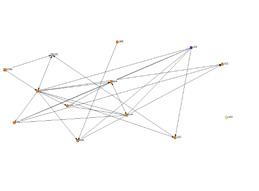
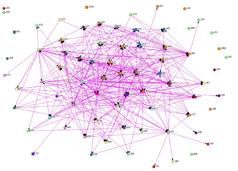
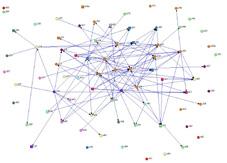
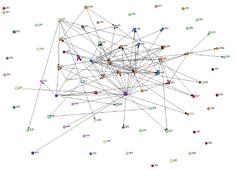
City of Newcastle 42 Variable GCSN BCN Low ties Moderate ties High ties Shared resources
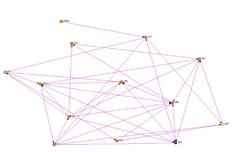
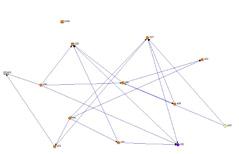
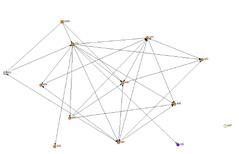
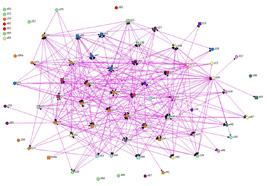
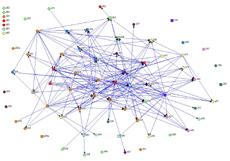
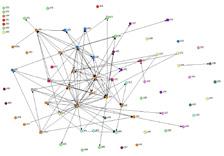
Serving CaLD Communities in the Newcastle Region: Sector Report 43 Variable GCSN BCN Low ties Moderate ties High ties Joint planning & analysis

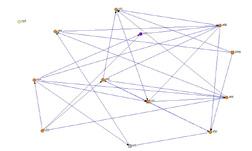
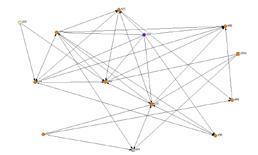
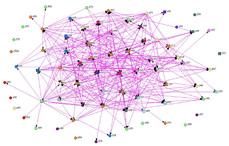
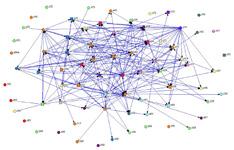
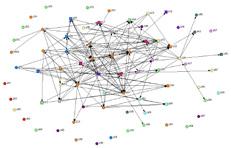
City of Newcastle 44 Variable GCSN BCN Low ties Moderate ties High ties Joint projects
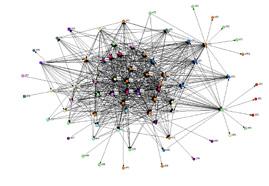
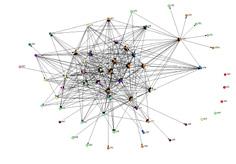
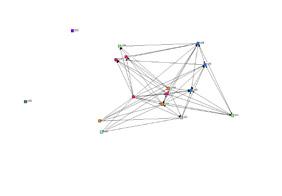
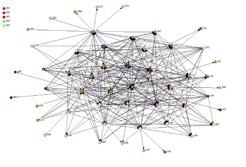
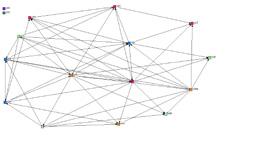
Serving CaLD Communities in the Newcastle Region: Sector Report 45 Variable Relationships overall Shared info BCN NGO network Gov network Network maps across variables by broad network and the NGO and Gov sub-categories
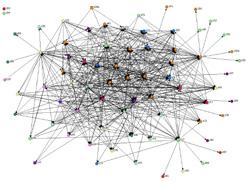
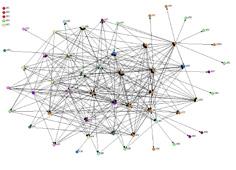
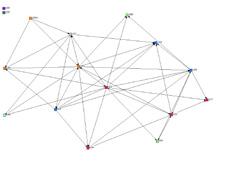
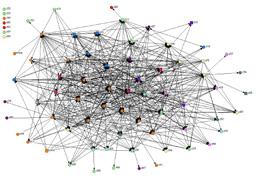
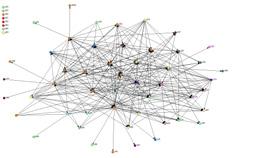
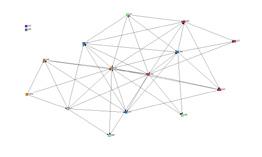
City of Newcastle 46 Variable Shared resources Joint planning/ analysis BCN NGO network Gov network
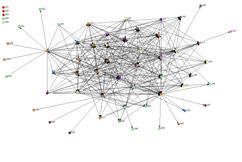
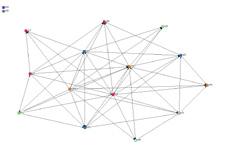
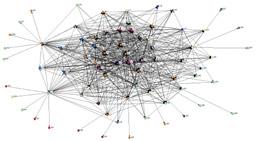
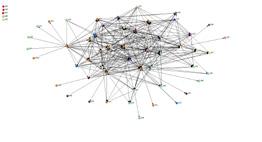
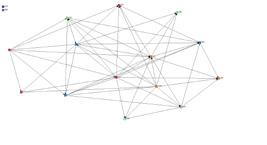
Serving CaLD Communities in the Newcastle Region: Sector Report 47 Variable Joint projects Joint funding BCN NGO network Gov network


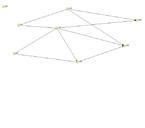
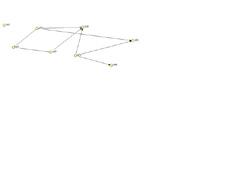


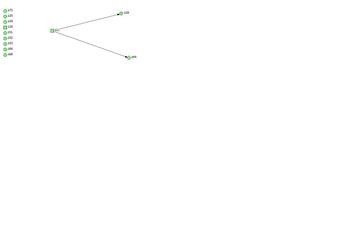


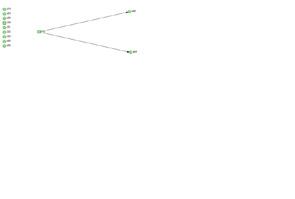


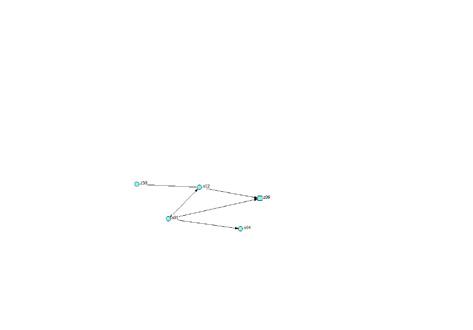

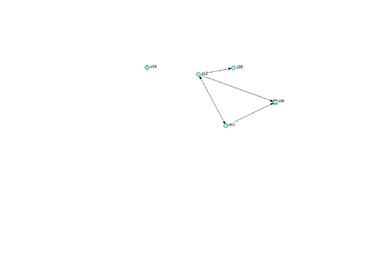

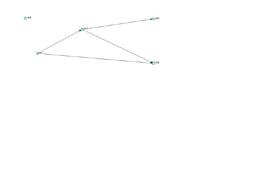


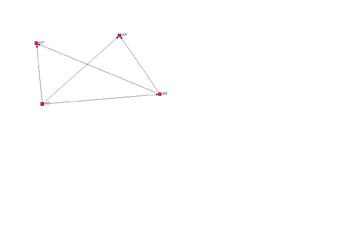


City of Newcastle 48 Serving CaLD Communities in the Newcastle Region: Sector Report 49 Service network maps by subcategory Subcategory Connections exist Shared info Shared resources Joint planning/ analysis Joint projects Joint funding Referrals CaLD Comm. Develop. Edu Gov
* CaLD includes organisations self-identifying as having CaLD as a core focus (i.e., additional organisations are included in the subcategory other than those that answered ‘Yes’ to the question ‘Is providing services to CaLD communities your organisation’s core activity?’)


City of Newcastle 50 Serving CaLD Communities in the Newcastle Region: Sector Report 51 Shared resources Joint planning/ analysis
Appendix B
*Based on the first networking question in the network linkage survey asking participants to nominate which organisations on the list they had connections with (with the option to nominate additional providers).
Explanation of the measures used in Table B.1
Average degree: Indicates the number of connections on average that actors in the network have (e.g., on average, a network organisation will connect with 11 other organisations in relation to joint planning and analysis activities) [17].
Centralisation: Indicates how centralised or decentralised a network is. A score closer to 1 indicates a highly centralised network with all actors pointing to one main actor [17].
Density: This measure indicates how many of the networks possible ties are present in the network (e.g., in the general service network, 39.4% of all possible ties are present in the network) [17].
Average distance (closeness): Average path length along all possible path lengths connecting all actors in a network, i.e., the average number of steps it would take an organisation within the network to reach another organisation in the network, say, for assistance (e.g., the average number of steps it would take for a referred client to receive help). The distance between actors in the network ranges from 1.5–1.7 steps [17].
Mutual relationships: where actor A connects to actor B and actor B connects to actor A; this is considered a mutual or reciprocal relationship [17]. Mutual connections are sometimes regarded as more stable and indicate trust and positive relationships [12].
Asymmetric relationships: where actor A connects to actor B, but actor B does not connect to actor A. Some types of relationships (e.g., advice, referral networks) naturally have a higher number of asymmetric relationships [12].
Null relationships: where there is no relationship between two actors, this is a ‘null relationship’ [17].
City of Newcastle 52
Measure Connection exists* Joint funding Joint plan & analysis Joint projects Referrals Shared resources Sharing info Avg degree 13.806 13.528 11.333 13.194 9 10.750 13.500 Centralisation 0.346 0.353 0.454 0.363 0.486 0.450 0.353 Density 0.394 0.387 0.324 0.377 0.257 0.307 0.386 Avg distance 1.548 1.545 1.595 1.547 1.666 1.641 1.549 Mutual 0.202 0.192 0.162 0.183 0.116 0.154 0.190 Asymmetric 0.386 0.389 0.324 0.389 0.283 0.306 0.390 Null 0.413 0.419 0.514 0.429 0.602 0.540 0.419
Table B.1 Network measures for the GCSN
Appendix C
In addition to understanding how the CaLD service-delivery network currently operates, understanding the issues facing service providers and what organisations they would like better access to will also be important in helping the City of Newcastle to identify how it can assist the sector in its service-delivery efforts. To achieve this, the following open-ended questions were included in the survey:
Which organisations do you get the most benefit from interacting with? Ranking in order of how important the interactions are to your organisation
Which organisations do you want better access to?
Ranking in order of priority
Please explain how having better access to these organisations would improve your organisation’s ability to deliver services to CaLD communities?
Please tell us what the ‘big’ or most pressing issues are facing the Newcastle region.
How do these issues affect CaLD services in the Newcastle region?
What role does the City of Newcastle Council currently have in supporting your organisation with these issues relating to CaLD service delivery?
What role should/could the City of Newcastle Council have in supporting your organisation with these issues relating to CaLD service delivery?
Key Issues
Reflecting the broader national experience housing, employment, and financial insecurity were listed by almost every respondent as the most pressing issues facing the Newcastle region. A lack of affordable housing stock, especially rental properties and crisis accommodation; limited access to meaningful and fairly paid employment, particularly for people from CALD backgrounds and young people; as well as the increasing cost of living and debt were seen as some of the causes of these issues. These challenges affect the CaLD service system as service providers are often left ‘filling the gaps’ with a lot of staff time directed towards supporting clients finding accommodation, employment or accessing support services. Such activities take effort away from core work. Several respondents explained that the demand for casework support is
consistently beyond their capacity, with many organisations under-resourced as it is, and can result in a reduction in the quality and quantity of service delivery. One respondent explained that CaLD families often choose to move to Sydney, Melbourne or elsewhere due to their inability to find affordable housing or semi-skilled employment in the Newcastle region. This is an important issue given that participants at the sensemaking workshop spoke about wanting Newcastle to be seen as a desirable place for migrants to settle. Consistent with the national situation, several respondents also stated domestic and family violence and abuse as being one of the most pressing issues in Newcastle. Two respondents outlined that the existence of gender inequities drive this violence and abuse, with coercive control often remaining unchallenged. The lack of services for men, especially those who are victims of abuse, trauma, violence, or neglect, often serves to perpetuate this vicious cycle. One respondent shared that a trauma recovery and healing centre that provides wrap around services for women, children and men who have experienced trauma, violence and/or abuse was needed in Newcastle. Understanding of domestic and family violence amongst CaLD communities is often limited with a lack of information (e.g., posters, flyers) in language. Support services often do not have access to, or use, interpreters and a lack of women and men’s ‘in language’ support groups further exasperate the issue.
Understaffed and under resourced community service providers were seen by respondents as another key issue facing the Newcastle region. This finding supports this report’s recommendation for CN to play a greater role in advocacy and as an enabler for the sector. Funding instability and inconsistency, as well as the competitive nature of relationships between community service providers due to funding insecurity was resulting in a lack of continuous, quality, and sustainable service provision for community members. Access to long-term funding was seen as a key component in alleviating this challenge. One respondent explained that a lack of stable long-term funding prohibits community development projects which largely see benefits over a longer duration resulting in staff inconsistencies, staff turnover, relationship changes and program changes. This funding instability also affects CALD communities as services provided can suddenly be stopped.
Serving CaLD Communities in the Newcastle Region: Sector Report 53
Another respondent explained that there was no ‘one stop shop’ for services and this was partly due to the fractured way funding is distributed.
Issues that were faced by the broader community included a lack of accessible public transport, particularly for people living with disability, social isolation and mental ill-health (particularly among younger people), elder abuse, gap between mental health care provision and the NDIS (National Disability Insurance Scheme), as well as digital literacy, cyber safety, and access to free and secure internet. Respondents also reported issues that were specific to the CaLD community including: supporting adults and young people in obtaining their drivers licence (as CaLD communities often lack people with their full license); limited knowledge of community services and how they can be accessed; inconsistent access to reliable and truthful information in language; as well as access to low-cost activities such as sport or swimming lessons. Two respondents also stated that a lack of understanding of CaLD communities, the challenges they face and how to work with them in a culturally competent manner (including using interpreters) also led to challenges in community service provision.
Access to Organisations
Not for profit organisations whose core business was working with CaLD communities were perceived as providing the most benefit from interacting with by the 36 survey respondents. The services of those organisations cover a wide array of services including migrant, refugee and asylum seeker support and settlement, aged care, youth and family services, as well as casework, psychological treatment and support, advocacy and policy work, education and training, family support and community development programs addressing social isolation and connection.
Following the CALD specific organisations, local health providers were perceived as being of most benefit to survey respondents, followed by state and local government organisations with a focus on community development and protection.
State and local government organisations were perceived as being of benefit to survey
respondents and were given the highest ranking from survey respondents in regard to wanting better access to them. This suggests that while state and local government organisations are perceived as useful or necessary, access is limited or not currently at the level respondents would prefer. This finding is consistent with findings in other regional areas in that locating specialist services is more difficult and therefore service providers look more to government to fill service voids. Survey respondents also wanted better access to CaLD sector organisations, even though these same organisations were by far perceived as providing the greatest benefit to respondents. This points to the need for protocols and agreements to be in place and the need for a more transparent understanding of what each organisation provides. Following this, respondents also wanted better access to community legal, tertiary education, disability, homelessness and housing, domestic and family violence, as well as wrap around case management and advocacy services. These findings reflect those already noted in the Social Network Analysis that, whilst service provision is in place, providers are likely to be under strain.
It was considered that increased access to the variety of organisations listed would improve the ability of the respondent’s organisations to deliver services to CaLD communities by strengthening the existing services, help to better understand the needs and priorities within those CaLD communities and improve networks to deliver better outcomes. Strengthening existing organisations through improved collaboration, referral pathways and partnerships would enable organisations (both CaLD and non-CaLD specific) to provide community services sooner and more effectively. One respondent outlined that this strengthening occurs through the sharing of resources, funding streams, as well as access to initiatives, volunteer networks, information, community leaders and decision-makers. Another respondent stated that greater collaboration would also support people from CaLD backgrounds who may have additional barriers (i.e., person with a disability) to access NDIS, mainstream and community supports. Although here the word ‘collaboration’ was used, this speaks more to the need for coordination so that services
City of Newcastle 54
that are required intermittently can be readily accessed when needed. Some respondents thought state and local government entities could assist with this strengthening and collaboration by increasing its planning and funding support role. These findings point to a potential and important role for council through information sharing and capability building.
Understanding the needs and priorities of the CALD communities was seen as essential to delivering better services. Sharing stories of families, individuals, and young people in their settlement, along with more knowledge of emerging trends, was perceived by one respondent as an avenue to gain an improved understanding. Council is in a good position to provide such information sharing. Several priority areas included better access to domestic and family violence services, reported by one respondent as prevalent amongst CALD communities, and would assist in building the capacity of the CALD specific sector. Development of more education pathway options, access to specialised employment programs, and specific CALD men’s initiatives in partnership with organisations such as the Men’s Shed were seen as another priority. This finding was highlighted in the SNA in that no organisation currently identifies as being specific to the needs of men. Neighbourhood centres that act as a social hub for community connection and information sharing were also seen as playing an integral role. Traditionally such centres were well funded, however; have suffered constraints in recent times. Another respondent outlined the importance of ensuring services are available in community languages, hence the primacy of accessible and free interpreter services.
Improving networks through collaborative, wrap around services and programs (integrated services) was seen by many respondents as central to improving services. One respondent outlined that more collaboration and referrals with services that are responsive, ensure the clients full understanding (i.e. legal systems and processes) and prioritise the safety and wellbeing of clients would reduce stress and ensure better outcomes for CALD community members. While it was noted by several respondents that access and collaboration already existed in the CALD community services
network, possible improvements were still outlined. One respondent shared that having MOU’s (Memorandums of Understanding) between services to enable wrap around services orchestrated by a case management team would avoid duplication, improve communications, and ensure better outcomes for the CALD families and clients involved.
Current Perceptions and Future Roles for CN
Of the 36 respondents, 11 outlined several ways the City of Newcastle (CN) currently supports their organisations on issues related to CaLD communities service delivery. This included involvement in community activities and events, providing relevant CALD materials in the libraries, acting as a conduit of information, provision of small grants for projects and programs, subsidised tipping of household goods, as well as supporting greater accessibility through the Disability Inclusion Action Plan (DIAP). However, around half the respondents reported that the City of Newcastle did not currently support their organisation in CALD communities service delivery, or they were not aware of such support. It was clear from the majority of respondents that greater collaboration and support were desired.
Respondents provided a variety of suggestions on what the role of CN should or could be in supporting their organisations to deliver services to CALD communities. These included increased program, project and community event support in the form of financial resources (i.e., grants); in-kind staff support for community events and activities; free or low-cost access to community facilities and parks for activities for not for profit organisations and CALD communities, as well as assistance with insurance cover for CALD community groups; translation of local government and other relevant resources for CALD communities; access to community garden creating spaces; provision of in person translators; as well as involvement in Welcome to Newcastle events. Several respondents noted that the City of Newcastle provides regular community grants, which were appreciated, but requested that these grants have shorter pre-requisites and targets which would allow more services to apply.
Serving CaLD Communities in the Newcastle Region: Sector Report 55
Several respondents also stated that CN could become more of a leader in enabling joint project partnerships and opportunities for services to work collaboratively. Mutual projects through active participation, increased transparency and openness would assist in cross promotion of initiatives and synergies. This increased collaboration and improved communication would be welcome within the CALD communities service sector and within the City of Newcastle council as well. For example, CN was recently involved in producing an April food month event brochure, however there was very little representation or promotion of the cultural diversity of the food offerings within Newcastle and therefore support to Newcastle CALD communities. Ideally all directorates within CN would be asking how they can collaborate with the Newcastle CALD communities.
An increased role in planning, advocacy and knowledge sharing in relation to CALD communities in Newcastle was seen as an essential role of the council. Considering the fast-growing demographic of CALD communities in Newcastle, CN has a key role to play in communicating its vision for a welcome, socially inclusive, and equitable city for all through its strategic planning documents and programs. Practical ways to position CN as a more welcoming city and CALD ally include offering information about the councils’ services in community languages through the websites and hardcopy materials. Several respondents found that CN could have a more prominent role in advocating for CALD communities across a range of issues, particularly towards state government for increased funding of local programs. Better engagement and involvement in CALD related issues through the facilitation of forums, think tanks or knowledge platforms (such as this piece of research) were also perceived as necessary and welcome.
Supporting CALD communities in accessing employment was another key role respondents thought CN should be playing. This could be through advocacy for job opportunities, supporting engagement with other employers in the region to promote employment pathways and implement pro-active employment, internship, and work
placement opportunities for CALD communities within the City of Newcastle itself. Some respondents noted that the CN workforce needs to better reflect the diversity of our communities.
Increased coordination of efforts to support CALD communities struggling with domestic and family violence is a CN role that would also support organisations. Funding and support for education and programs ‘in language’ about domestic and family violence, including the development and distribution of information (posters, brochures) ‘in language’ would be very welcome. (Note. CN is currently working with the Domestic Violence Committee to develop such a brochure and produce copies ‘in language’). Another role could be coordinating the setup of a trauma recovery and healing centre where women and men could access quality required services under one roof.
A number of respondents also noted the role CN could play in advocating and supporting access to increased social and affordable housing options for people from CALD background, and all vulnerable communities, particularly in the Western corridor suburbs, while also recognising that housing is not in the direct control of LG.
City of Newcastle 56
Serving CaLD Communities in the Newcastle Region: Sector Report 57
newcastle.nsw.gov.au
