

Clarence Valley Council Resourcing Strategy

July 2024


Enquiries
Published by
Clarence Valley Council
2 Prince Street Grafton
Phone 02 6643 0200
council@clarence.nsw.gov.au www.clarence.nsw.gov.au
© 2024 Clarence Valley Council

Acknowledgment
We acknowledge the Bundjalung, Gumbaynggirr and Yaegl people as the Traditional Owners of the land on which we live and work. We honour the First Nations peoples culture and connection to land, sea and community. We pay our respects to their Elders past, present and emerging.

Resourcing Strategy – July 2024 2
Clarence Valley Council 3 Contents Our Planning Framework.................................................................................................................. 4 Community Engagement Strategy............................................................................................... 5 Community Strategic Plan – THE CLARENCE 2032 5 Delivery Program 6 Operational Plan 6 Our values.................................................................................................................................... 7 Introduction........................................................................................................................................ 8 Long-Term Financial Plan (LTFP) 8 Workforce Management Strategy................................................................................................ 8 Asset Management Planning 9 Reporting ................................................................................................................................... 11 Long Term Financial Plan 12 Workforce Management Strategy .................................................................................................. 39 Asset Management Strategy 58
Our Planning Framework
The IP&R Framework guides the way local government plans, documents and reports its future strategies.
The IP&R Framework begins with the community’s aspirations over a period of least 10 years, which is considered by each newly elected council and is underpinned by a suite of integrated plans that set out a vision and objectives.
The Framework then examines specific actions to achieve those aspirations. It involves a reporting structure to communicate progress to the Council and the community as well as a structured review timeline to ensure the goals and actions are still relevant.
The essential elements of the IP&R Framework are:

Resourcing Strategy – July 2024 4
Community Engagement Strategy
The Community Engagement Strategy is based on social justice principles and details how we engage with our community to prepare the Community Strategic Plan.
Community Strategic Plan – THE CLARENCE 2032
The Community Strategic Plan (CSP) is the overarching document for all plans and policies of the Council. It identifies the community’s aspirations and priorities for the future of the local government area.
The five themes of the CSP:


Society

Creating a place where people are healthy, safe, connected and in harmony with the natural environment to retain and improve the quality of community life.
Infrastructure
Maintaining our diverse infrastructure base to serve the needs of the Clarence.
Economy
Strengthening and diversifying the region’s economic base in a way that complements the environmental and social values of the Clarence.
Environment
Valuing, respecting and actively participating in the care and management of the Clarence’s natural environment for current and future generations.
Leadership
Setting the overall direction and long-term goals for the Clarence in accordance with community aspirations.
Clarence Valley Council 5
Delivery Program
The Delivery Program is the key directional document for the term of the elected council. It is developed by a newly elected council and adopted before the end of June in the year following the election. It is presented as a statement of commitment to the community by outlining the focus the Council intends to contribute towards achieving the long-term aspirational goals of the community, as identified in the Community Strategic Plan.
Operational Plan
Supporting the Delivery Program is an annual Operational Plan prepared by the general manager and staff. The Operational Plan outlines how the commitments of the Delivery Program will be achieved by detailing what the organisation will deliver and where, how delivery will be resourced, what the cost will be, who will be accountable for actions taken and how performance will be measured. It is a document of organisational accountability. The Operational Plan is intrinsically linked to staff performance, with outcomes reflected in individual workplans.
The Clarence Valley Council’s Operational Plan is prepared by the organisation’s leadership team in consultation with coordinators of teams that deliver services and activities.
Resourcing Strategy – July 2024 6
Our values
As part of the community strategic plan, The Clarence 2032, our vision is that the Clarence Valley is a community full of opportunity, ensuring that our communities are connected; service level needs are met local economies are balanced and thriving; we live in harmony with our environment and we continue to strive collectively for a better future. The values underpinning Council’s vision and the workforce delivering this are the STRIVE values. Council aims to support a workplace culture based on these values.
We
STRIVE for our values.

Safety
We have a safety focused workplace culture to ensure the wellbeing of our staff and the community

Teamwork
We work together as one council towards shared goals and for the greater good of the community

Integrity
We behave in a way that is honest, open, and transparent. We will take responsibility for our actions and strive for excellence

Value
We deliver services efficiently, effectively, and in an environmentally and financially sustainable manner
Respect
We are inclusive, treat people with courtesy and fairness, and ensure each individual is valued and heard


Engagement
We engage with our staff and community to inform our decision making, and create awareness of our activities
Clarence Valley Council 7
Introduction
The Resourcing Strategy forecasts Council’s ability to deliver assets and services to the community over the next 10 years in line with the Community Strategic Plan – The Clarence 2032. It comprises of Council’s Long Term Financial Plan, Workforce Management Strategy and Asset Management Planning.
Long-Term Financial Plan (LTFP)
The Long-Term Financial Plan (LTFP) demonstrates how the Council will achieve financial sustainability over the long term.
Our LTFP is used to inform decision-making during the development of our Delivery Program. The Plan covers a ten-year period and includes:
• Planning assumptions used to develop the Plan.
• Projected income and expenditure and balance sheet documents.
• Sensitivity analysis (factors/assumptions most likely to affect the Plan).
• Financial modelling for different scenarios.
• Methods of monitoring financial performance.
We will review our ten-year Financial Plan annually as part of the development of our annual Operational Plan. The review will include:
• An assessment of the previous year’s performance in terms of the accuracy of the projections made in the Plan.
• An answer as to whether the estimates were accurate.
• An answer as to whether the assumptions underpinning the estimates were accurate.
• An explanation of where major differences that emerge between budget estimates and actual expenditure.
Workforce Management Strategy
The Workforce Management Strategy aims to identify current and predicted workforce issues and trends and what will be done to address them.
Our Workforce Management Strategy outlines our commitment to ensuring the Council has the capacity, capability, skills and sustainability within its workforce to deliver positive outcomes for the organisation and ultimately the community by meeting the objectives of the Community Strategic Plan. The Strategy seeks to address major challenges faced by the Council in its endeavours to remain responsive to its community and financially sustainable. The challenges identified include an ageing workforce, workplace health and safety, workforce diversity and leadership, and learning and development needs.
Resourcing Strategy – July 2024 8
Asset Management Planning
Asset management planning is critical to the operation of the Council and its continuing financial sustainability. Clarence Valley Council is the custodian of approximately $2.5B of community assets to support community activity. These assets include roads, water and sewerage services, drains, bridges, footpaths, buildings, floodplain protection structures, sporting facilities, parks and gardens. The Council is responsible for accounting for and managing these assets to ensure they are maintained in a safe/serviceable condition for their specific use by the community. To do this, the Council must determine acceptable maintenance service levels and the long-term cost of maintaining those service levels. It must then ensure that sufficient financial and human resources are provided now, and in the future, to meet those obligations.
In September 2012, the Council appointed Jeff Roorda & Associates to undertake a review of the Council’s asset management systems and processes, with the key objective of identifying areas where changes and improvements can occur. Contractors are engaged to conduct annual desktop revaluations, with full revaluations conducted on a five-year cycle of the Council’s key infrastructure assets, including buildings, roads, water, sewer and other structures. The data from this process has been incorporated into the Council’s various asset management plans (AMPs) and summarised in the AMS.
In 2015, an asset management audit preparedness assessment was performed by the Council’s auditor on behalf of the Office of Local Government. The assessment identified areas for improvement, and an action plan has been implemented to address these.
Asset Management Planning consists of three elements:
Asset Management Policy
The Council’s Asset Management Policy sets the broad framework for undertaking asset management in a structured and coordinated way and addresses the following:
• Establishing goals and objectives for asset management in terms of providing a platform for service delivery.
• Integrating asset management with the Council’s strategic planning.
• Maximising value for money by adopting life cycle costing combined with performance measurements.
• Assigning accountability and responsibility for service delivery.
• Promoting sustainability to protect the needs of future generations.
Asset Management System (AMS)
Each financial year, the Council develops a new AMS; this identifies assets critical to the Council’s operations and outlines the risk management strategies for those assets. It also includes specific actions required to improve asset management capabilities, project resource requirements and timeframes.
The AMS and AMPs have been developed in line with the Council’s 2024/25 to 2033/34 LTFP
The medium-term projected expenditure is $96M per the general fund AMPs per year (average operations and maintenance expenditure plus projected renewals required over 10 years).
Clarence Valley Council 9
The medium-term LTFP budgeted expenditure over the ten-year planning period is $92M per year (average operations and maintenance plus capital renewal budgeted expenditure in the LTFP over 10 years). The financing shortfall is $5M per year, a medium-term (10-year) financing indicator of 93.5%. This scenario is financially sustainable in the long term. The Council will be able to maintain the condition of infrastructure assets in a sustainable fashion. Performing renewals as they are required will stop the deterioration and failure of assets, thereby reducing the levels of risk. Levels of service can be maintained at current levels.
The LTFP Asset Building and Infrastructure Asset Renewal Ratio by Fund indicates that in the General Fund Council will be expending 260.18% of funds on Asset Renewal in comparison to the annual estimated Depreciation. This is higher than the Council’s target range of 90% to 110%, which is attributable to the significant grant funds that have been approved for expenditure in 2022–2023 and 2024–2025. The Water Fund 445.75% which is reflecting the pattern of renewals planned as opposed to how this ratio is calculated which effective measures renewals against depreciation on a straight-line basis. This situation is then also obvious when looking at the Sewer Fund with a percentage for 2024-25 of 123.5%.
The Council has prepared the following AMPs:
Transport AMP, including:
▪ sealed roads
▪ unsealed roads
▪ bridges
▪ drainage
▪ stormwater
▪ traffic infrastructure & furniture
▪ footpaths
▪ cycleways
Buildings AMP, including:
▪ amenity buildings
▪ community halls/centres
▪ depots
▪ sporting facilities
▪ office/administrative buildings and others
Floodplain AMP, including:
▪ levees
▪ pumps and related equipment
▪ drains
▪ off-creek storage (dam)
▪ chlorination plant
▪ fluoridation and stabilisation plant
▪ water pump stations
▪ reticulation and trunk mains
Sewer AMP, including:
▪ sewage treatment plants
▪ sewer pump stations
Transport AMP, including: ▪ rising mains
gravity reticulation
Open Space AMP, including: ▪ sports grounds ▪ parks and playgrounds ▪ lighting
▪ irrigation
▪ ancillary structures
Waste AMP, including:
▪ landfill
▪ waste operations buildings
▪ ancillary structures
▪ stormwater, including stormwater pipelines, junction pits and inlets
Holiday Parks, including:
▪ buildings
▪ other structures
Saleyards, including:
▪ buildings
▪ other structures
Swimming Pools, including:
▪ buildings
▪ other structures
Airports, including: ▪ buildings ▪ runways ▪ other structures
Resourcing Strategy – July 2024 10
▪
Reporting
The Council’s Annual Report on achievements measured against the Delivery Program is prepared by 30 November each year. It includes:
• Assets acquired by the Council during the year.
• Assets held by the Council at the end of the financial year.
• An estimate of the amount of funding required to bring assets up to a satisfactory standard.
• An estimate of the annual expense to maintain assets at that standard.
• The Council’s asset maintenance program for that year.
Clarence Valley Council 11


Clarence Valley Council Long Term Financial Plan 2024/2025 to 2033/2034
Clarence Valley Council 13 Contents Introduction...................................................................................................................................... 14 What Is Financial Sustainability? 15 Estimates, Assumptions and Forecasts....................................................................................... 16 Sensitivity/Risk Analysis................................................................................................................ 20 Attachments..................................................................................................................................... 22 Income Statement – Consolidated ............................................................................................ 22 Balance Sheet – Consolidated 23 Income Statement – General Fund 24 Balance Sheet – General Fund 25 General Fund – Key Financial Performance Indicators............................................................. 26 Income Statement – Water Fund 27 Balance Sheet – Water Fund 28 Water Fund – Key Financial Performance Indicators 29 Income Statement – Sewer Fund.............................................................................................. 30 Balance Sheet – Sewer Fund 31 Sewer Fund – Key Financial Performance Indicators 32 Financial Planning Policy 33
Introduction
The LTFP is prepared in accordance with the provisions of the Local Government Amendment (Planning and Reporting) Act 2009 and the associated Guidelines and Manual.
The LTFP supports the Council’s Community Strategic Plan and Delivery Program. It is a component of the Council’s Resourcing Strategy, in conjunction with the Council’s AMPs and Workforce Management Plan. As these plans evolve, so too will the LTFP, as it is a ‘living’ document and will continue to be reviewed and refined in the future.
The LTFP is a financial projection that quantifies the cost of the Council’s services for the next 10 years, given certain assumptions and estimates. Financial planning over a 10-year timeframe is challenging and relies on a variety of assumptions with differing degrees of certainty. Assumptions will be subject to change during this period and are closely monitored and revised by the Council to reflect the changing circumstances and operational, political, and legislative environments.
The LTFP is a strategic document that will assist and guide the Council in the decisions it needs to make to achieve its corporate financial objective of long-term financial sustainability. The LTFP is not the instrument that determines the services/proposals that should be allocated funds but rather a tool to inform the Council and the community of the impact of proceeding with different courses of action and how these actions impact on the Council’s financial objectives.
This LTFP has been prepared based on an adopted ‘Fit for the Future’ proposal, the Delivery Program, and the 2024/25 Operational Plan and Budget, which form the base year of the LTFP. The LTFP has been Based upon the Financial Statement format and Fit for the Future Indicators by Fund as opposed to the Internal cash based Consolidated Fund estimates.
Long Term Financial Plan 2024/2025 to 2033/2034 14
Issue Revision Date Description Controlled by Approved –Resolution No. Draft 19/04/2022 For Exhibition Nigel Longstaff 07.22.062B Final 28/06/2022 Adopted Nigel Longstaff 07.22.112 Draft 25/04/2023 For Exhibition Nigel Longstaff 07.23.048 Final 27/06/2023 Adopted Nigel Longstaff 07.23 098 Draft 23/04/2023 For Exhibition Nigel Longstaff 07.24.053 Final 25/06/2024 Adopted Nigel Longstaff 07.24.
What Is Financial Sustainability?
TCorp has defined financial sustainability in the following terms:
1. ‘A local government will be financially sustainable over the long term when it is able to generate sufficient funds to provide the levels of service and infrastructure agreed with its community.’
There is a need to achieve at least a break-even general fund operating position on an ongoing basis. The Council has several key financial objectives to achieve financial sustainability, which have been considered during the preparation of the LTFP. These objectives are:
Balanced Budgets
The Council strives to deliver a ‘balanced budget’ (expenditure matching revenues/reserve funding) annually.
Continued Operational and Financial Efficiencies
The Council is committed to the ongoing review of its service provisions to ensure a culture of continuous improvement is maintained and ‘value for money’ is achieved.
Clarence Valley Council 15
Estimates, Assumptions and Forecasts
All LTFPs must be based on a set of assumptions, which generally relate to factors that are most likely to affect the overall outcome of the LTFP. The following assumptions have been considered, discussed, and ultimately used as a basis to forecast the Council’s long-term financial position over the 10-Year Plan.
Planned Assumptions
Assumptions and factors affecting the budget result have been incorporated into the 2024/25 budget and ‘planned’ 10-Year Plan as follows:
Key Assumptions for the 2024/25 Budget and LTFP:
Scenario 1 – Base Case
General rate revenue will be increased by 4 7% as per the determined Rate Peg and assumed at 3% from 2025–26 onwards. 2020–21 saw the completion of the previously approved SRV rate peg increase, which means that the standard rate peg now applies. For the next four years (2024/25 to 2027/28), the estimated yield from the now built-in SRV component of our rate base will be restricted and then subsequently used to improve infrastructure as per the SRV requirements and will now be referenced as the Infrastructure Renewal Value of our rates income stream. The estimated yield in 24/25 is $5.8m
Revenue streams and future service requirements will be adjusted for population growth forecasts where a direct relationship can be determined. Population forecasts will be based on the forecasts specifically determined for the Clarence Valley Council (currently + 0.65% p.a.).
Recurrent operating expenditure for 2024/25 will be based on the actual 2022–23 and estimated 2023-24 Financial Statement results. This position will then be further adjusted for contractual obligations or for expected spend, as informed through discussion with management. From 2025/26 onwards, recurrent operating expenditure generally will be indexed in line with expected inflation.
Recurrent operating revenue for 2024/25 onwards will initially be increased in line with service deliverables and as evidenced through discussion with management. A general indexation rate of 4% for 2024-25 and then 3% pa from 2025-26 onwards. will be applied on all general revenue streams where no other evidence is available to support a specific revenue increase.
Long Term Financial Plan 2024/2025 to 2033/2034 16
Interest and investment income are forecast at a conservative rate of 3 75% for 2024–25, based on the running yield of the Council's investment portfolio (a value average of $125 million per month) for the quarter ended 30 September 2023
Water charges will be indexed by 6% p.a. for 2024-25, 7.5% 2025-26 & 2026-27, 5.5% p.a. for 2027-28 then 3% from 2029/30 onwards.
Sewer charges will be indexed by 4% p.a. for 2024-25 and then 3% p.a. from 2025/26 Onwards.
Domestic waste management charges will be calculated based on the reasonable cost requirements (income funds the operating and maintenance costs associated with providing the service) for the 2024/25 Budget.
Operating grants – The Council has assumed it will continue to receive operating grants in relation to ongoing operations (where evidenced by management) and that these will generally increase annually in line with estimated indexation of 4% each year. Operating grants received for specific project-related purposes have been included in the year the Council anticipates they will be received.
Capital grants – The capital grants applied in the model will be based on the capital grants for 2024/25, as indicated in the updated Capital Works Program. These assumptions have been carried out into later years.
The Financial Assistance Grant value is estimated at $13,644,000, which is an increase of approximately 4%. This assumes the current prepayment arrangements stand; however, it is noted that the actual value and payment will be determined by the Federal Government in late May 2024 The Council has assumed over the 10 years of the LTFP that the ‘in advance’ tap has not been turned off and, therefore, the Council does not have to report a drop in Financial Assistance Grant income.
Tax-equivalent dividends will be based on the maximum allowable rate of $3 per assessment (which equates to approximately $70K from the Water Fund and $80K from the Sewer Fund). These figures will be adjusted by both estimated charge increases, and population increases.
All positions on the adopted organisation structure are to be funded unless otherwise indicated.
Employee wage increases are per the LG Award 2023 to 2026 which is 3.5% for 2024-25 3% for 2025/2026 and then Estimated at 2.5% p.a. for 2026/2027 onwards.
Leave entitlement accruals estimates assume that all positions in the organisation structure will be filled.
Workers’ compensation premiums will be based on 3% of the estimated wages from 2024-25 onwards. The historical Basic Tariff Premium as a percentage on wages is as follows:
• 2010-21 = 2.594%
• 2021-22 = 2.8%
• 2022-23 = 2.37%
Over the last three years claims performance history percentage continues to significantly increase, (Calculated as the Claims Amount divided by the Basic Tariff) this has nearly tripled from a percentage of 3.23% in 2020-21 to a current YTD 9.06% in 2023/24. This will have an impact of higher premiums over the next three years especially if this trend continues and even to a greater extent if the trend worsens. As the smoothing reserve was removed in 2019/20 council will now need to budget for this increase in full.
Clarence Valley Council 17
Council historically receives a Work, Health & Safety rebate this is now called the Safety & Wellbeing Incentive. For 23-24 this is estimated to be up to a maximum of $121,767. Any savings realised will be transferred to the smoothing reserve.
Superannuation – Employees are generally in one of two schemes, which are:
• The Defined Benefits Scheme: calculated as per employee contribution.
• The Super Guarantee Scheme (SG): The Council is legislatively required to contribute 11.5% of the employee's gross wages for 2024/25. The SG rate will then be increased to 12% from July 2025. At this stage no further increases have been suggested by the government.
Electricity expenditure varies by Fund and historically have been up & down from year to year. On that basis an average amount for 24-25 has been determine which will then be indexed 3% from 2526 as follows.
• General Fund $525K
• Water Fund $360K
• Sewer Fund $800K
• Holiday Parks $300K
Due to the current hard insurance market, all insurance will continue to increase higher than by just CPI. Council Insurers are predicting the following conservative percentage increases but the final premiums will not be known until next year.
• Property 7.5%
• Public Liability 7.5%
• Councillors & Officers Liabilities 10%
• Cyber Liability 20%
• Personal Accident & Corporate Travel 5%
• Environmental Liability 7.5%
• Motor Fleet 5% plus any increase in unit numbers
• All other General Insurances 5%
State Emergency Levies historically have been up & down from year to year excluding rebates that were provided in 20-21 & 21-22. On that basis an average amount of $242K for 24-25 has been determine which will then be indexed 3% from 25-26.
Rural Fire Contribution historically have been up & down from year to year excluding rebates that were provided in 20-21 & 21-22. On that basis an average amount of $1,250,000 for 24-25 has been determine which will then be indexed 3% from 25-26.
Surf Life Saving contributions to Minnie and Yamba have not increased in the last 3 years on that basis assume an increase of 10%.
Surf Life Saving Contracts have increased by 2.5% pa for the last 3 years. From 24-25 forecast the increased by the predicted CPI increase. 24-25 4% and then 3% from 25-26.
New Loans: The LTFP has included the General Fund Loan to be taken out in late 2023-24 of $24.7m which is required to part fund the Regional Aquatic Centre and the Yamba Treelands Drive Community Hub renewal & upgrade. The agreed rate being 5.81% on a 15 year term. The LTFP also includes an expected Water Fund Loan in 2025-26 of $50m which has been based upon an estimated interest rate of 6% over 20 years.
Long Term Financial Plan 2024/2025 to 2033/2034 18
Proposed Key Assumptions for the 2023-24 LTFP Scenario 2 – An Optimistic Population increase of 1%
All assumptions listed in Scenario 1 will be applied to a second scenario for the LTFP, except for the population increase which will be estimated at 1%
Capital Expenditure and Service Level Variations for 2024-25 to 2033-34
The LTFP includes the 2024/2025 Capital Expenditure Program, as reported in the 2024/2025 Operational Plan. The capital projects proposed have been determined based on recurrent renewal projects, deferred projects from 2023–24 and additional priority projects identified by section managers.
It is proposed that a future capital works program will be informed by the AMPs, considering levels of renewal expenditure required to meet the ‘Fit for the Future’ performance ratios and in line with the Council's Project Management Framework Projects approved through this process will be prioritised and wherever possible offset by available grant funding.
Clarence Valley Council 19
Sensitivity/Risk Analysis
By their very nature, all LTFPs have risks associated with assumptions and impacts on estimated expenditure and income streams. Some items identified that could potentially impact this plan are:
• AMP updates and Asset Revaluations can change useful life assumptions, depreciation expenses and revised whole-of-life costs.
• The Council’s agreed service level changes.
• Interest rate changes
• Flood events
• Legislative changes
• Pandemics
• Grant funding changes
• Employment costs, changes to rates of pay through the Local Government State Award negotiations.
• Indexing applied to recurrent grant income being lower than anticipated.
• Population growth
• Global economic impacts
• Joint works
In predicting certain income streams such as grants and contributions, asset revaluation adjustments and depreciation movements are very problematic and as such, the estimates for these pose a much higher risk.
In this LTFP, the estimates for grants and contributions have been based on historical averages, excluding anomalies such as major floods or significant programs associated with economic stimuli, including Inflation, recession and pandemics
It is important to point out that operating grants reported in the Income Statement (in accordance with the Financial Statement accounting legislation) includes the Federal Government’s ‘Roads to Recovery’ funding, even though the Council may use this funding for capital expenditure Revenue streams are also recognised when received as opposed to when they are spent.
As the landscape changes each year and the Council’s asset management and other data improves, so too will the LTFP’s projections and outputs to assist strategic decision-making.
The LTFP includes two scenarios to examine the impacts of Rates income on the operating result. Scenario 1 assumes Council will apply the full determined rate peg of 4.7%, while Scenario 2 shows the impact of optimistic increase in population of 1.65%.
A summary of the impact is indicated in the table on previous page
Long Term Financial Plan 2024/2025 to 2033/2034 20
SENSITIVITY ANALYSIS OF INCOME TO POPULATION GROWTH – General Fund Only

It is proposed that future LTFPs will include scenarios showing the impact of different levels of service. The Council is currently commencing a systematic review of all its services. This along with the communities accepted service levels, capacity, and willingness to pay may have a major impact on the current distribution of the budget, infrastructure asset base, asset renewals and asset additions.
Clarence Valley Council 21
Statement – Consolidated

Long Term Financial Plan 2024/2025 to 2033/2034 22 Attachments
Income

Clarence Valley Council 23
Balance Sheet – Consolidated
Income Statement – General Fund

Long Term Financial Plan 2024/2025 to 2033/2034 24
Balance
Sheet – General Fund

Clarence Valley Council 25

Long Term Financial Plan 2024/2025 to 2033/2034 26
Key Financial
General Fund –
Performance Indicators
Income Statement – Water Fund

Clarence Valley Council 27
Balance Sheet – Water Fund

Long Term Financial Plan 2024/2025 to 2033/2034 28

Clarence Valley Council 29
Key Financial
Water Fund –
Performance Indicators

Long Term Financial Plan 2024/2025 to 2033/2034 30
Income Statement – Sewer Fund
Balance Sheet – Sewer Fund

Clarence Valley Council 31
Sewer

Long Term Financial Plan 2024/2025 to 2033/2034 32
Fund – Key Financial Performance Indicators
Financial Planning Policy
Key Financial Indicators (KFI):
KEY FINANCIAL INDICATORS
1. Operational Liquidity (short-term focus)
1.1 Unrestricted Current Ratio – Unrestricted current assets divided by unrestricted current liabilities, as per Note 13 of the Local Government Code of Accounting Practice & Financial Reporting Update 25 – benchmark >1.5:1.
Purpose – This is a measure of the Council’s ability to meet its short-term liabilities with its short-term assets.
1.2 Rates and Annual Charges Outstanding – Rates & annual charges outstanding divided by rates & annual charges collectible, as per Note 13 of the Local Government Code of Accounting Practice & Financial Reporting Update 25 – benchmark <10%.
Purpose – This measure assesses the impact of uncollected rates & annual charges on the Council’s liquidity and the adequacy of the Council’s debt recovery efforts.
1.3 Available Working Funds
Purpose – Similar to the Unrestricted Current Ratio, this is a measure of the Council’s ability to meet short-term financial shocks, whether
COUNCIL’S KFI GOAL
Fund
for the Future’ KFI (General Fund Only)
Clarence Valley Council 33
KEY FINANCIAL INDICATOR TYPE Financial Position Indicator Financial Performance Indicator
‘Fit
>1.5:1 Not Applicable Yes No
<=5% Not Applicable Yes No
General
>$4
Not Applicable Yes No
million Water Fund
they be reductions in anticipated revenues or unplanned additional expenditure (measured in $).
1.4 Cash Expense Cover Ratio – The current year's cash and cash equivalents and all term deposits divided by payments from the cash flow of operating and financing activities, multiplied by 12, as per Note 13 of the Local Government Code of Accounting Practice & Financial Reporting Update 25 – benchmark >3 months.
COUNCIL’S KFI GOAL ‘Fit for the Future’ KFI (General Fund Only)
Purpose – This liquidity ratio indicates the number of months the Council can continue paying for its immediate expenses without additional cash inflow. Consolidated Funds: Minimum >3 months
2.1 Operating Performance Ratio – The total continuing operating revenue, excluding capital grants and contributions less operating expenses, divided by the total continuing operating revenue. The total continuing operating revenue excludes fair value adjustments and reversal of revaluation decrements, net gain/(loss) on sale of assets and the net share of interests in joint ventures & associates, as per Note 13 of the Local Government Code of Accounting Practice & Financial Reporting Update 25 – benchmark >0%.
Purpose – This ratio measures the Council’s achievement of containing operating expenditure within operating revenue. The Council should not be recording recurring operating deficits or funding operating results from capital revenues.
Applicable
Long Term Financial Plan 2024/2025 to 2033/2034 34
KEY FINANCIAL INDICATORS
KEY FINANCIAL INDICATOR TYPE Financial Position Indicator Financial Performance Indicator
>$2
>$2
million Sewer Fund
million
Not
Yes No
2. Fiscal Responsibility (Council elected-term focus)
All
>0%
No Yes
Funds: Minimum
>=0% meet within 5 years i.e. by 2028/29
KEY FINANCIAL INDICATORS
2.2 Own Source Revenue Ratio – The total continuing operating revenue (excluding ALL grants & contributions), divided by the total continuing operating revenue inclusive of all grants and contributions. The total continuing operating revenue excludes fair value adjustments and reversal of revaluation decrements, net gain/(loss) on sale of assets and the net share of interests in joint ventures & associates, as. As per Note 13 of the Local Government Code of Accounting Practice & Financial Reporting Update 25 – benchmark >60%.
Purpose – This ratio measures fiscal flexibility. It is the degree of reliance on external funding sources such as operating grants & contributions. The Council’s financial flexibility improves as its own source revenue increases.
2.3 Debt Service Cover Ratio – Operating result before capital (excludes fair value adjustments and reversal of revaluation decrements, net gain/(loss) on sale of assets, interest expense, depreciation / impairment / amortisation and the net share of interests in joint ventures & associates), divided by principal repayments (from the Statement of Cash Flows) plus borrowing costs (from the Income Statement), as per Note 13 of the Local Government Code of Accounting Practice & Financial Reporting Update 25 – benchmark >2x.
Purpose – This ratio measures the availability of operating cash to service debt including interest, principal and lease payments.
COUNCIL’S KFI GOAL ‘Fit for the Future’ KFI (General Fund Only)
Clarence Valley Council 35
KEY FINANCIAL INDICATOR TYPE Financial Position Indicator Financial Performance Indicator
All Funds: Minimum >60% >60% No Yes
All Funds: Minimum >2x Not Applicable No Yes
2.4 Debt Service Ratio – Cost of debt service (interest expense & principal repayments) divided by total continuing operating revenue (excluding capital grants and contributions).
Purpose – A Council with a low or zero level of debt may incorrectly place the funding burden on current ratepayers when in fact it could be spread across generations, who also benefit from the assets. High levels of debt generally indicate a weakness in financial sustainability and/or poor balance sheet management.
2.5 Real Operating Expenditure Per Capita – Operating expenditure indexed by the Local Government Cost Index, divided by population of the Council area. Per IPART’s ‘Fit for the Future’ (FFTF) requirement, there must be a demonstrated decrease in the ratio over time, i.e. operational savings (net of IP&R supported service improvements) over 5 years
Purpose – Changes in real operating expenditure per capita are considered to assess how effectively the Council:
• can realise natural efficiencies as population increases (through lower average costs of service delivery and representation); and
• can make necessary adjustments to maintain current efficiency if the population is declining (e.g. appropriate reductions in staffing or other costs)
Assuming that service levels remain constant, a decline in real expenditure per capita indicates efficiency improvements (i.e. the same level of output per capita is achieved with reduced expenditure).
COUNCIL’S KFI GOAL ‘Fit for the Future’ KFI (General Fund Only)
General Fund
<12%, Water & Sewer Fund
<=50% (per Council’s Borrowing Policy)
General Fund only –A decline in ratio
>0%<=20%
e savings over 5 years
Long Term Financial Plan 2024/2025 to 2033/2034 36
KEY FINANCIAL INDICATORS
KEY FINANCIAL INDICATOR TYPE Financial Position Indicator Financial Performance Indicator
No Yes
Demonstrat
No Yes
3. Financial Sustainability (Long-term intergenerational focus)
INDICATORS
3.1 Building & Asset Renewal Ratio – Expenditure on building and infrastructure asset renewals divided by depreciation, amortisation & impairment for building and infrastructure assets, as per Special Schedule 7 of the Local Government Code of Accounting Practice & Financial Reporting Update 25 – benchmark >100%.
Purpose – This measure assesses the rate at which building & infrastructure assets are being renewed & upgraded against the rate at which they are depreciating.
3.2 Infrastructure Backlog Ratio – Estimated cost to bring assets to a satisfactory condition, divided by carrying value of infrastructure, building, other structures and depreciable land improvement assets, as per Special Schedule 7 of the Local Government Code of Accounting Practice & Financial Reporting Update 25 – benchmark <2%.
Purpose – This ratio shows what the proportion of the infrastructure backlog is against the total value of the Council’s infrastructure.
3.3 Cost to bring assets to agreed service level – Estimated cost to bring to an agreed level of service set by the Council, divided by gross replacement cost, as per Special Schedule 7 of the Local Government Code of Accounting Practice & Financial Reporting Update 26.
There is no industry benchmark available.
Purpose – To assess the proportion of outstanding renewal works compared to the total suite of assets that the Council has under its care and stewardship.
Clarence Valley Council 37
‘Fit for the Future’ KFI (General Fund Only) KEY FINANCIAL INDICATOR TYPE Financial Position Indicator Financial Performance Indicator
KEY FINANCIAL
COUNCIL’S KFI GOAL
All Funds Minimum > 100% >100% Yes Yes
All Funds Maximum <2% <2% Yes No
All Funds <=4.5% Not Applicable Yes No
3.4 Asset Maintenance Ratio – Actual asset maintenance divided by required asset maintenance, as per Special Schedule 7 of the Local Government Code of Accounting Practice & Financial Reporting Update 25 – benchmark >100%.
Purpose – Compares actual vs required annual asset maintenance. A ratio above 100% indicates that the Council is investing enough funds that year to halt the growth of the infrastructure backlog.
3.5 Asset Sustainability Ratio – Planned capital expenditure on renewing and replacing existing assets (net of proceeds from sale of replaced assets), divided by the optimal level proposed in the Council’s AMP. Local Government Association South Australia Financial Sustainability Information Paper No.9: Financial Indicators – Revised February 2012.
Purpose – Indicates the extent to which existing non-financial assets are being renewed and replaced compared with what is needed to costeffectively maintain service levels. Achievement of the suggested target would mean that the Council was reasonably optimising the timing of capital outlays on the renewal/replacement of assets.
Long Term Financial Plan 2024/2025 to 2033/2034 38 KEY FINANCIAL INDICATORS COUNCIL’S KFI GOAL ‘Fit for the Future’ KFI (General Fund Only) KEY FINANCIAL INDICATOR TYPE Financial Position Indicator Financial Performance Indicator
All Funds: Minimum >100% >100% No Yes
All Funds: Minimum >90%
Not Applicable Yes No
but <110%


2024 – 2028
Clarence Valley Council Workforce Management Strategy
Workforce Management Strategy 2024-2028 40 Contents Purpose ............................................................................................................................................ 41 Workforce Snapshot 42 Workforce Engagement.................................................................................................................. 47 Our Actions and innovations ......................................................................................................... 48 Objectives and actions ................................................................................................................... 56
Purpose
Clarence Valley Council is committed to delivering the community’s longterm priorities and aspirations. A key ingredient to succeeding in delivering positive outcomes for the community is our people.
This Workforce Management Strategy, together with the Asset Management Strategy and Long-Term Financial Plan, forms the Resourcing Strategy which aims to enable Council to fulfil its commitments to the community by providing Council with the capacity, capability, skills, and sustainability within its workforce to deliver positive outcomes in line with Council’s Delivery Program and Community Strategic Plan
This Workforce Management Strategy meets the NSW Local Government’s IP&R requirements. Under this framework it identifies high level issues and themes to guide our people management strategies over the term of the Delivery Program
Workforce Planning and Development
Standards Australia defines workforce planning as a management technique that is used to effectively manage workforce demand and supply. It is the process used to align the needs of an organisation with those of its workforce by identifying current and future staffing requirements.
Workforce planning focuses on retaining existing staff as well as attracting new employees to ensure an organisation has the right number of people, with the right skills, in the right jobs at the right time.
Clarence Valley Council 41
SCOPE ANAL SE FORECAST MONITOR AND EVALUATE IMPLEMENT IDENTIF
Workforce Snapshot


59


Workforce Management Strategy 2024-2028 42
Annual turnover (approx) 14.5% Vacancy rate 11% Budgeted full time equivalent (FTE) 518.75 = 528 staff members Training
Data sourced: 31 March 224
face to face sessions
online enrolments First Nations staff 6.2% 93% of the workforce lives in the Clarence Valley LGA Workforce Female 33.39% Male 64.97% Leadership Female 46% Male 54%
1,063
Employment type
Gender
Trainees and apprentices

Gender diversity in the Clarence Valley Council workforce
Clarence Valley Council 43
33.39% Females 64.97% Males 85%
5%
9%
1%
Full time
Part time
Casual
Diversity
Gender diversity in Senior Leadership
Our leadership team has seen an increase in diversity with an increase in female leaders to 46% from 23% in 2023.
We currently have 14 future leaders enrolled in formal leadership training programs to enable them to develop new skills and take on future career progression opportunities with Council. 57% of participants in our future leaders program are women, 43% are male.
4

5 2 2
Annual staff turn over
Council had 103 new starters in the past 12 months (1 April 2023 to 30 March 2024) with vacancy rates falling from 17% to 11% over the same time frame.
We have a unique opportunity at the moment with a number of new starters and long term employees having the opportunity to share new ideas to innovate, and problem solve using the knowledge and experience that our long term employees provide.
Our turnover rate is 14.5%, below the state average for NSW Regional Local Government areas which was 19.77%. (as reported by LGNSW for 30 June 2023).
Workforce Management Strategy 2024-2028 44
Femal e Mal e
s
e
Manager
Executiv
Tenure – number of staff and years of service
Median length of service 6.20 years, average tenure of 10.11 years
Age Median age of employees 49.5 years, average age of 47.35 years

Clarence Valley Council 45
0 50 100 150 200 15 1 19 15 2 5 45 4 55 5 5 5 16 72 98 142 136 49 0 20 40 0 0 100
Salary
Median Salary

$68,558 PER YEAR EXCLUDING SUPERANNUATION

Average Salary
$75,541 PER YEAR EXCLUDING SUPERANNUATION
Where do your employees live

93% LIVE IN THE CLARENCE VALLEY LGA
Our workforce is growing with Clarence Valley Council continuing to position itself as one of the largest local employers, working towards becoming the employer of choice for our region in the coming years.
Our current break up shows that Council primarily employs full time permanent employees, with a vision to increase the number of trainees and apprentices over the next 12 months to help future proof our workforce and retain corporate knowledge. This is particularly important given the age distribution of our workforce with 35% nearing the retirement age.
Workforce Management Strategy 2024-2028 46
Workforce Engagement
What are doing well?
From Council’s recent staff surveys we have identified what we are doing well, which includes:
• Work and life balance
• Enablement
• Management
• Engagement
• Alignment and involvement
• Teamwork and ownership
Focus areas
• Learning and Development
• Leadership
• Communication
Key
challenges impacting the workforce
• Ageing workforce
• Skills shortages in a competitive and geographically isolated market
• Diversity and inclusion
• Community expectations
• Policy and legislative changes
• Flexibility and the future of work
• AI and keeping up with technology advances
• State and Federal Government and Private Sector employment opportunities and
• hybrid/work form home models they may provide
Clarence Valley Council 47
Our Actions and innovations
My Employee Journey
The My Employee Journey Framework has been developed to address our challenges and improve in our focus areas.
This framework ensures the journey of all our employees is successful, fulfilling and engaging and that good performance is rewarded and celebrated. We have been reviewing all our policies and procedures to ensure they meet the requirement of our workforce in line with the My Employee Journey.
We have updated how we measure our individual performance and propose to fully introduce the performance development plans and the CVC Capability Framework. This will be implemented throughout the whole organisation over the next year. Our workforce will have transparent goals to achieve, and over the next three years, we will continue to ensure our workforce has the skills, capability and engagement to be successful.

Workforce Management Strategy 2024-2028 48
Recruitment Strategy 2022 - 2025
The Clarence Valley Council recruitment strategy and action plan has been developed to help us identify, attract, and hire the best candidates for our workforce.
This plan has been created inline with the IP&R documents including the workforce management strategy, My Employee Journey Framework and the Employee Engagement Survey outcomes. Strategies Include
• An Employee Value Proposition (EVP) that supports brand strength and maximises opportunities to build attractiveness of Council to potential candidates
• Council’s recruitment activities are efficient, simple, support quality decision making and deliver a positive candidate experience.
• Council’s dynamic social media profile and presence supports brand strength and is one of Council’s key and most effective recruitment activities.
Council’s web site supports brand strength and provides potential candidates with an attractive, easy to use, informative tool that improves the likelihood of them applying for positions
• Council’s onboarding process is comprehensive and provides new staff with what they need to be effective and productive as soon as is possible.
• Council has collaborative arrangements in place with educational institutions which promote career opportunities with Council and support student engagement activities with the organisation which enhance the likelihood of selecting Council as a preferred career option.
From July 2024 the new recruitment module in the corporate systems suite will be launched and will enhance seemly service in attraction, recruitment, and selection as well as onboarding.
Clarence Valley Council 49
Leadership Development
Since 2023 Council has been running the LEDA Leadership Development Program. With 9 graduates and 15 currently in the program for 2024.
James’ Story
James, Coordinator Development Services completed the LEDA program in 2013 when he was acting in the coordinator position. James said ‘The structure of the LEDA program included an element of self reflection, and I gained an understanding of my personal traits and characteristics and how this may be perceived by others.
The program highlighted the importance of my own actions and being self aware. The second part of the program focused on how to build a team through motivation and inspiration, manage conflicts and how to communicate effectively.’
James like the small size of the modules which assisted in completing the program in manageable chunks whilst still carrying out other day to day duties. The material was relatable and not overly complex which enabled it to be recalled easily. James said, ‘Completing the program was not a tedious or daunting task and applying it to real circumstances was achievable.
James is grateful for being able to complete the LEDA program when starting as an acting coordinator. James said “I believe that taking part in the LEDA Program assisted in securing a more senior role and facilitating the next step in my career progression within Council”
“I believe that taking part in the LEDA Program assisted in securing a more senior role and facilitating the next step in my career progression within Council “
Workforce Management Strategy 2024-2028 50
Trainee and Apprentice program
In early November 2023, Clarence Valley Council launched its first annual Trainee and Apprentice Program, with an expo and forum, led by the People and Culture Team. The purpose of this program, as part of future proofing our Council, was to attract and retain trainees and apprentices to 8 diverse career paths across all areas of the organisation.
The first phase, attraction, was a huge collaborative effort across all sections of Council as well as multiple external stakeholders, including the United Services Union (including their neon signed truck), the NSW Department of Education, the Country Universities Centre, and a range of community support services.
The second phase of the program was retention. Knowing the current annual drop out rate for trainees and apprentices in NSW being 33%, we implemented a plan to retain our trainees and apprentices by providing
ongoing support through structured mentoring and peer support sessions, some of which include support from external support services in the community.
The program overall resulted the receipt of 107 applications across all opportunities. The average number of applications for trainee and apprentice roles increased from 7 per advertisement in 2022 to an average of 19 in 2023. CVC was successful in attracting candidates to all roles. The first mentoring session was held in mid February 2024.
The community has benefited from knowledge sharing and the increased opportunity for people to have a rewarding career with their local Council. Council has benefitted from developing better relationships with the community, gaining fresh ideas and increased workforce capacity, contributing to improvements in overall wellbeing.
Clarence Valley Council 51
Jess’ Story
Jess, Manager Organisational Development, who is responsible for leading Council’s grow your own Trainee and Apprentice program, started her career at age 17 as a trainee in Corporate Services at neighboring Bellingen Shire Council. She furthered her education by completing a Bachelor of Business and moved into the private sector to gain more diverse experience.
The desire to make a more meaningful contribution to society drew Jess back to Local Government, taking up the opportunity of a Management role with Clarence Valley Council in early 2023.
One of the main driving factors behind the Grow our Own Program was Jess’ own experiences and opportunities provided in the earlier stages of her career, in particular the mentorship and diversity Local Government offers.
“It’s really exciting to now be creating new opportunities for others, just like the one that I was so fortunate to have when I first left school,” she said.

We now look forward to the success stories to come from our own trainees and apprentices in the future.
“It’s really exciting to now be creating new opportunities for others, just like the one that I was so fortunate to have when I first left school”
Workforce Management Strategy 2024-2028 52
Keely’s Story
Moving from a career in the Defence Force to work with Clarence Valley Council has enabled Keely Power-Casson to have everything she wanted in a job.
Keely returned home to Grafton in May 2023 to take on a customer service position with Council, after five years away working in warehousing and distribution for the Australian Army at Townsville.
The new job not only enabled her to be once again surrounded by family – local government had a reputation for providing job security.
Now almost 12 months on, Keely said working for Council had proven to be highly rewarding.
“Having flex time enables me to have a great work-home balance and be there for my young daughter when there are appointments or events at school,” she said.
“Customer service is a great team to be part of, really supportive. And I’m now undertaking further professional development to specialise in answering rates enquiries – it’s a wellstructured training program, and I’m enjoying taking on lots of new knowledge.”
Keely said she had been impressed by initiatives such as the STRIVE awards that recognised outstanding staff achievement, and the Veterans Employment Program introduced

in late 2023 to help attract former armed servicepeople and capitalise on the skills they offered.
She added that it was also reassuring to know she was supported in her role through development of organisational policies and documentation.
“Customer service is a great team to be part of, really supportive. And I’m now undertaking further professional development to specialise in answering rates enquiries –it’s a well-structured training program, and I’m enjoying taking on lots of new knowledge.”
Clarence Valley Council 53
Veterans Employment Program
Clarence Valley Council recognises the unique skill and attributes demonstrated by service personnel in their service to our country. Because of this, Council created its own Veterans Employment Program, launched in December 2023 to help address labour shortages while recognising the transferrable skills and attributes veterans hold to serve our local community.
This program is supported buy the NSW State Government and allows a robust support network for veterans looking to engage in a career outside of the Defence Force.
This program allows Council access to a large candidate pool of highly committed, trained and qualified individuals with strong capabilities at a variety of levels.
Workforce safety and culture
Council implements, monitors and reviews the following workforce actions
•
• Equal Opportunity Plan
• Disability Inclusion Action Plan
• Reconciliation Action Plan (current under review with Reconciliation AU)
• First Nations Employment Strategy
• Safety Strategies and Programs
• Health and Wellbeing plans.
Workforce Management Strategy 2024-2028 54
Health and Wellbeing Expo
Council hosts an annual Health and Wellbeing Expo, which ran across two days at two locations within the Local Government Area providing a high level of accessibility. The expo delivered updates from industry experts across a range of health and
community services and also afforded staff the opportunity to receive health screening in addition to networking with and building stronger working relationships with their teammates.

Our Health and Wellbeing Expo supports the safety culture we are working hard to continuously improve at Clarence Valley Council and drives recent statistics demonstrating Council’s success supporting and promoting safety and wellbeing in the workplace.
Clarence Valley Council 55
Objectives and actions
Objective 1: Full implementation of My Employee Journey to ensure all employees are supported at every stage of their career and that they feel valued and confident to achieve the goals of our community
Full implementation of My Employee Journey December 2024
Full review of all people policies and procedure June 2024
Implement the actions in the recruitment strategy
Develop, implement, and invest in a leadership development framework
Review STRIVE value definitions and what STRIVE values mean in action
Complete an organisation-wide training and capability needs analysis
Ensure a robust training and development plan is published on the intranet prior to the commencement of each financial year
Objective 2: Increase workforce planning capability
June 2025
December 2024
December 2024
March each year
May each year
Create a robust strategic workforce planning process June 2025
Identify critical positions and create a register of critical positions, skills, and qualifications, monitor turnover and create retention, attraction, and succession planning June 2025
Objective 3: Drive Innovation, flexibility, and sustainability in the future workforce
Ensure workplace flexibility and mobility
Implementation of CI Anywhere Recruitment Module and training for Recruitment, Attraction and Selection June 2024
Develop strategies to address workforce sustainability June 2025
Workforce Management Strategy 2024-2028 56
Action Due Date
Action Due Date
Action Due Date
Ongoing
Objective 4: Build a safe, diverse and inclusive culture
Action
Implement, monitor and review the Equal Employment Opportunity Plan and related policies and procedures
Implement, monitor and review the workforceactionsintheDisability Inclusion Action Plan
Implement, monitor and review the workforce actions in the Reconciliation Action Plan; include First Nations People Employment Strategy
Implement, monitor, and review safety strategies and programs
Develop, implement, and review a health and wellness annual plan
Due Date
Annually
Annually
Annually
Annually
Annually
Clarence Valley Council 57


Clarence Valley Council Asset Management Strategy 2024/2025 to 2033/2034
Clarence Valley Council 59 Contents Introduction...................................................................................................................................... 62 Our Assets 62 Asset Conditions............................................................................................................................. 63 Asset Values .................................................................................................................................... 65 Asset Replacement Value 65 Asset Condition Report .................................................................................................................. 65 Asset Management Framework 71 Asset Management Policy 72 Asset Management System (AMS) ........................................................................................... 72 Asset Management Plans (AMPs) 73 AMPs and Strategy Methodology 74 AMP Summaries 76 Transport 76 Bridges 82 Water Facilities 86 Footpaths/Cycleways 90 Water Services 97 Sewerage Services 106 Buildings 115 Open Spaces 124 Waste Management 134 Stormwater 142 Holiday Parks 150 Saleyards 158 Floodplain 166 Swimming Pools 174 Airports 182 The Path Forward .......................................................................................................................... 190 Objectives 190 Critical Assets.......................................................................................................................... 193 Risk Management 193 Where Do We Want to Be? 194 Appendices .................................................................................................................................... 195 Appendix 1 – Asset Management Policy 195 Appendix 2 – The Asset Management Improvement Plan...................................................... 199
Asset Management Strategy 2024/2025 to 2033/2034 60 AMS Document Control Document ID: CVC Asset Management Strategy_2017_2027.docx Rev No Date Revision Details Author Reviewer Approver 1 15/08/2017 Revised 2017–2027 Strategy – Draft 13.052/17 IP&SAC A/Director Corporate Council 2 21/11/2017 Revised 2017–2027 Strategy – Final 13.070/17 IP&SAC A/DC&G Council 3 12/12/2017 Revised 2017–2027 Strategy Version 2 – Draft IP&SAC A/DC&G Council 4 06/02/2018 Revised 2017–2027 Strategy Version 2 – Final IP&SAC A/DC&G Council 5 19/04/2018 Draft financial update IP&SAC DC&G Council 6 29/03/2019 Draft review IP&SAC DC&G Council 7 25/07/2019 Adopted 25/06/2019 IP&SAC DC&G Council 8 07/04/2020 Draft financial update F&ASP DC&G Council 9 23/06/2020 Adopted 23/06/20 F&ASP DC&G Council 10 27/04/2021 Draft Exhibited 6a.21.017 F&ASP DC&G Council 11 22/06/2021 Adopted 6a.21.028 F&ASP DC&G Council 12 26/04/2022 Draft Exhibited 07.22.062A F&ASP DC&G Council 13 28/06/2022 Adopted 07.22.122a F&ASP DC&G Council 14 18/04/2023 Draft Exhibited 07.23.048 F&ASP DC&G Council 15 28/06/2023 Adopted 07.23 098 F&ASP DC&G Council 16 23/04/2024 Draft Exhibited 07.24 053 F&ASP DC&C Council 17 25/06/2024 Adopted 07.24.XX Council

Clarence Valley Council 61
Introduction
This AMS is designed to provide a plan to manage the Council’s physical infrastructure assets, including the establishment of a framework to guide the planning, construction, maintenance, and operation of infrastructure essential for Clarence Valley Council to provide services to the community.
Asset management planning incorporates an asset management policy, AMS and AMPs. These documents provide guidance for improving the Council’s asset management systems and practices. This AMS and associated AMP are aligned with the 30 June 2023 Report on Infrastructure figures and reflect the 2024/25 to 2033/34 LTFP.
Our Assets
Our assets summaries below
Libraries
Gallery & Museums
Sporting fields & facilities
Showgrounds
Roads
Bridges & culverts
Footpaths & cycleways
Kerb & gutter
Parks & reserves
Stormwater
Water supply network
Sewerage service network
Airport & aerodrome
Community halls
Swimming pools
Cemetery
Our assets summaries below
Parking facilities
Saleyard
Holiday parks
Coastal & estuary management
CBD assets
Depots
Waste management
Landfill
Floodplain assets
Stormwater network
Reserves & wetlands
Noxious weed assets
Corporate buildings
Streetscaping
Public amenities
In late 2014, CVC undertook a Council-wide service review primarily to address budgetary shortfalls. The service review provided a framework of all Council services and was linked to the assets. This review has led to asset rationalisation and efficiency savings by eliminating ‘end-of-life’ or underused assets, contributing to the future sustainability of the Council.
Asset Management Strategy 2024/2025 to 2033/2034 62
In 2015, an asset management audit preparedness assessment was performed by the Council’s auditor on behalf of the Office of Local Government. The assessment identified areas for improvement, and an action plan has been implemented to address these
Asset Conditions
Condition assessments for assets are undertaken using the Institute of Public Works Engineering Australasia’s (IPWEA) International Infrastructure Management Manual’s (IIMM) recommended fivepoint scale:
Condition 1 Very good condition – No work required (normal maintenance)
Condition 2 Good condition – Only minor maintenance work required
Condition 3 Fair or moderate condition – Maintenance work required
Condition 4 Poor condition – Renewal/Replacement required
Condition 5 Very poor condition – Urgent renewal/replacement required
The following graph demonstrates that most of the Council’s assets are in good to fair or moderate condition.

Clarence Valley Council 63
To define what condition ratings are acceptable, the Council will take into consideration the following:
• Community views/acceptance
• Establishing asset standards necessary to provide and support desired levels of service now and into the future
• Determining appropriate and sustainable levels of maintenance and renewals/upgrades
• Risk-hazard and risk-reduction requirements
• Management strategies for assets in ‘poor’ condition (ratings 4 and 5) are detailed in each individual AMP. There are considerable costs associated with the renewal and/or upgrade of these assets, although it should be noted that not all will necessarily be required to be renewed. Any assets that should have already been renewed but have not due to funding limitations are deemed as backlog works. Any delay in carrying out these works could result in increased annual operation and maintenance costs as well as increased risks and consequences of failure.
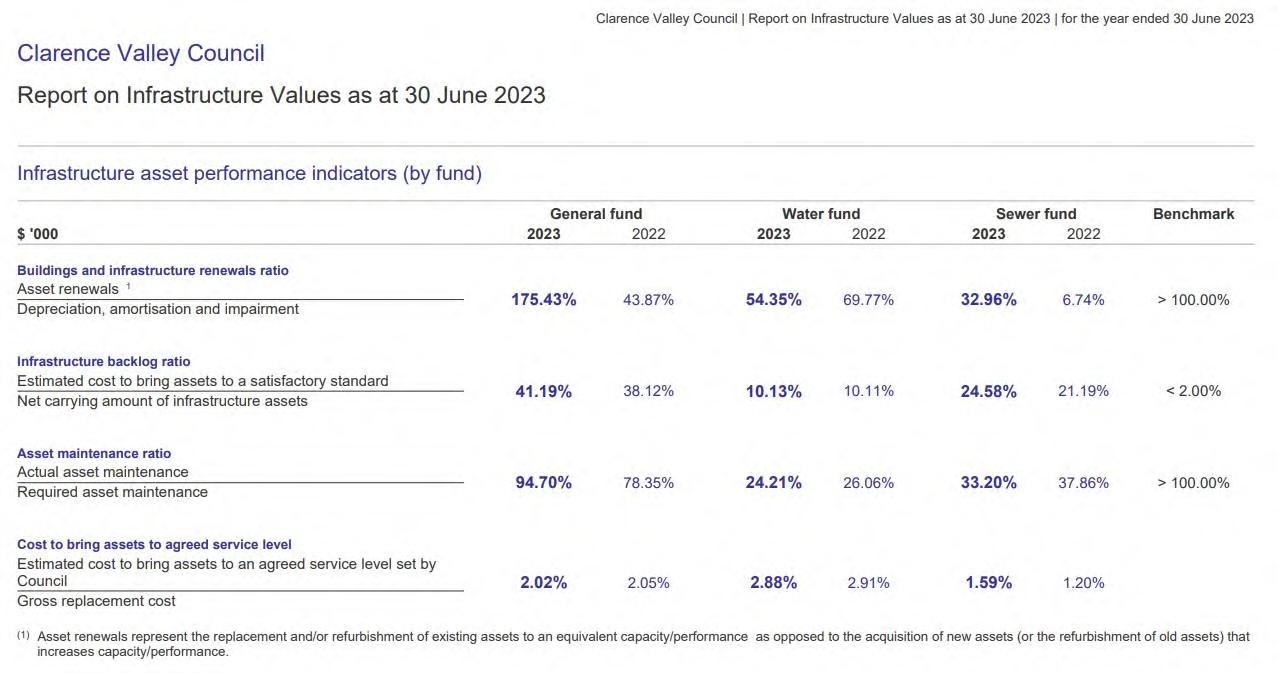
The table below is an extract from the Report on Infrastructure Assets, included in the Special Schedules of the Annual Financial Statements for 2022/23 This indicates that the cost to bring the Council’s infrastructure assets to a satisfactory standard is currently $68.8M.
The Council currently endeavours to maintain its assets at a condition rating between 1 and 3. Any assets rated 4 or 5 will be assessed for risk and managed through a replacement/renewal program or alternatively disposed of. Current conditions scores have been established through previous inspections and revaluation processes. As such, it is imperative that current assigned scores, inspection processes and procedures are reviewed and where necessary adjusted on an annual basis.
Asset Management Strategy 2024/2025 to 2033/2034 64
Asset Group 2022/23 Cost to Bring to Satisfactory 2022/23 Required Annual Maintenance 2022/23 Actual Maintenance 2022/23 Asset Maintenance Gap Buildings $1,612,000 $2,187,000 $1,518,000 ($669,000) Other structures $1,830,000 $462,000 $685,000 $223,000 Roads $16,065,000 $11,484,000 $10,047,000 ($1,437,000) Water supply network $19,402,000 $6,741,000 $1,632,000 ($5,109,000) Sewerage network $6,325,000 $3,967,000 $1,317,000 ($2,650,000) Stormwater drainage $16,704,000 $3,108,000 $3,021,000 ($87,000) Open Space & Facilities $2,889,000 $733,000 $4,305,000 $3,572,0000 Floodplain $3,982,000 $3,350,000 $618,000 ($2,732,000) Total $68,809,000 $32,032,000 $23,143,000 ($8,889,000)
Asset Values
As of 30 June 2023, the estimated replacement value of the Council’s assets is over $3.202B and is represented below by the major asset groups as a percentage of the total asset replacement value:
Asset Replacement Value

Asset Condition Report
The condition state of major infrastructure assets, as reported in the Clarence Valley General Purpose Financial Statement for the year ending 30 June 2023, is included below:
Clarence Valley Council 65
Figure 3: % Asset Replacement Value

Asset Management Strategy 2024/2025 to 2033/2034 66

67
Clarence Valley Council

Asset Management Strategy 2024/2025 to 2033/2034 68

69
Clarence Valley Council
Asset Management Strategy 2024/2025 to 2033/2034 70
Asset Management Framework
The Council has developed an asset management framework that comprises an asset management policy supported by the AMS and individual AMPs.
The Transport AMP has now been further split into individual plans for roads, bridges, and footpaths.
A specific AMP has also been created for water facilities assets.


Clarence Valley Council 71
Figure 4: The Council’s Asset Management Framework
AMS Transport Water Sewer Buildings Open Space Waste Stormwater Other Holiday parks Saleyards Floodplain Swimming pools Airports AMPs
Asset Management Framework Asset Management Policy
Asset Management Policy
The Council’s Asset Management Policy sets the broad direction for all asset management activities, and its aim is to:
‘Strategically provide, maintain, renew and replace an appropriate stock of community infrastructure that is required to support the communities of the Clarence Valley Council; is sustainable across the long term; and is provided at the lowest possible life cycle cost.’
The Council’s adopted Asset Management Policy is attached in Appendix 1.
Asset Management System (AMS)
There is evidence to suggest that historically, little or no analysis was done to understand the cumulative consequences of decisions to build capital infrastructure projects. The construction of infrastructure has been driven by short-term objectives with little consideration given to the recurrent whole-of-life (strategic) impacts of the decisions. This position is constantly changing as the Council’s data-capturing systems and processes improve. More accurate asset data will ensure credible and robust AMPs. This is turn will better inform future strategic planning and the determination of a four-year rolling capital works program.
AMS – Goals
The key goal of this AMS is to ensure that services:
• Provide value for present and future generations of residents and visitors
• Are delivered in the most cost-effective manner
• Are guided by the AMP outputs, the community’s requirements, and the ability to pay.
To develop and maintain a robust/credible AMS, several key elements need to be present, including:
• Sound information and systems
• Comprehensive asset management planning
• Rigour in financial modelling and assumptions
• Accurate workforce planning
• Community involvement in establishing service standards
• Performance management of asset management
Accordingly, the following goals have been identified and prioritised to facilitate a more strategic approach to asset management at Clarence Valley Council in future periods:
Goal 1 – Have a cross-organisational an asset management steering group in place that reports directly to the Executive. This will provide assurance that all asset management activities are consistent with the objectives of the IP&R Framework and are supported by the LTFP. The steering group will also monitor the implementation of the asset management improvement and risk plans for all asset classes.
Asset Management Strategy 2024/2025 to 2033/2034 72
Goal 2 – Consider the ongoing ownership costs (recurrent whole-of-life) of new capital works proposals as part of project scoping, and model these through the Council’s LTFP to identify impacts and risks.
Goal 3 – Undertake a detailed assessment of the resources required to implement this AMS, and ensure it is integrated with the other resourcing strategies so that a program of improvement and milestones can be implemented and performance-managed.
Goal 4 – Identify the maintenance and renewal ‘shortfall’ and any renewal and replacement ‘backlogs’ for all asset groups.
Goal 5 – Develop comprehensive risk management plans for all major asset groups.
Goal 6 – Integrate all knowledge and asset management systems for infrastructure assets.
Goal 7 – Review and maintain AMPs for all major asset groups already developed. These goals have been incorporated into the Asset Management Improvement Plan, detailed in Appendix 2
Asset Management Plans (AMPs)
AMPs are detailed long-term plans that outline the asset activities for each asset category. An AMP has been developed for each major asset category, as illustrated in the Council’s Asset Management Framework diagram.
The Council’s operational AMP contain, as a minimum, the following items:
• The objective or purpose of the asset and its components in providing service/s
• The service levels the Council currently delivers and any future challenges
• Forecasted future demand requirements for service delivery
• A description of the assets and details of the current asset inventory
• Identification of assets critical to the Council in service provision
• Risks associated with assets and their management
• Financial projections for operation, maintenance, renewal, and replacement including any gaps or renewal backlogs
• Assumptions, exclusions and observations on the maturity of data presented
• Maintenance, renewal, and disposal programs
• Key performance measures
• An asset management improvement plan
The Council subscribes to NAMS+, which is an IPWEA initiative for local government to assist in the development of asset management planning. The NAMS+ suite of templates has been used for development of the AMPs as ‘core’ plans, which are practical documents designed to be easily understood and used by asset managers. The level of detail within each individual plan is dependent upon the scope and size of the asset category contained in the plan together with the level of asset data maturity.
An annual review of the individual AMPs is required to ensure they provide a useful and up-to-date management tool and reference document. The review of the AMPs will include changes in objectives, policies, service levels, systems, technologies, and any other relevant amendment, including changes to community expectations.
Clarence Valley Council 73
Over time, the Council will work from ‘core’ asset management towards ‘advanced’ asset management planning, through a cycle of continuous improvement that will support the changing needs of the Council and the community.
A summary of each AMP has been included in this strategy
AMPs and Strategy Methodology
The AMS and AMPs have been developed in line with the Council’s 2024/25 to 2033/34 LTFP. The LTFP has been prepared based on a set of assumptions and the ‘Fit for the Future’ key performance indicator benchmarks.
There are four key indicators for asset management and sustainability utilised in the AMPs and AMS:
1. Asset Sustainability Ratio
Capital Renewal LTFP / Projected Capital Renewal Exp. AMP
2. Long Term – Life Cycle Indicator Life cycle expenditure / life cycle cost
Life cycle costs (or whole-of-life costs) are the average costs that are required to sustain the service levels over the longest asset life. Life cycle costs include operating and maintenance expenditure and asset consumption (depreciation expenses). Life cycle costs can be compared to life cycle expenditure to give an indicator of sustainability in service provision. Life cycle expenditure includes operating and maintenance costs plus capital renewal costs. Life cycle expenditure will vary depending on the timing of asset renewals.
The life cycle costs, and life cycle expenditure comparison highlights any differences between present outlays and the average cost of providing the service over the long term. If the life cycle expenditure is lower than the life cycle cost, there is a ‘life cycle gap,’ and it is most likely that outlays will need to be increased or cuts in services made in the future.
The Asset Sustainability Ratio is the most important indicator and reveals whether projected capital renewal and replacement expenditure can be financed in the LTFP. The Council’s Financial Planning Policy outlines a target range of between 90–110%.
Asset Management Strategy 2024/2025 to 2033/2034 74
Estimated
LTFP Budget Exp. / 10 yr. projected exp.
3. Medium Term – 10-Year Financing Indicator
Term
Financing Indicator LTFP Budget Exp. / 5 yr. projected exp.
4. Short
– 5-Year
The four key indicators are detailed in the following table for the general fund assets only:
The medium-term projected expenditure is also financially sustainable in the long term. The Council will be able to maintain the condition of infrastructure assets in a sustainable fashion. Performing renewals as they are required will stop the deterioration and failure of assets, thereby reducing the levels of risk. Levels of service can be maintained at current levels.
The Asset Sustainability Ratio indicates that the Council will have 100% of the funds required for the optimal renewal and replacement of its assets, which is within the Council’s target range of 90% to 110%. The ratio indicates an optimised budgeted capital expenditure, assisting in minimising the life cycle costs of the assets.
Clarence Valley Council 75
LTFP SUSTAINABILITY
Asset Sustainability Ratio Asset Sustainability Ratio 100% Long Term – Life Cycle Costs Life cycle cost [average 10 years projected ops, maint. exp. and deprn.] $119.6M Life cycle exp [average 10 years LTFP budget ops, maint & capital renewal exp ] $123.9M Life cycle gap [life cycle expenditure – life cycle cost] $4.2M Life cycle indicator [life cycle expenditure / life cycle cost] 103.53% Medium Term – 10-Year Financial Planning Period 10-year ops, maint & renewal proj. exp $129.9M 10-year ops, maint & renewal LTFP Budget exp $123.9M 10-year financing shortfall [10-year proj exp – LTFP Budget exp.(-ve = gap)] ($6.0M)
financing indicator [LTFP Budget exp / 10-year proj exp ] 95.36% Short Term – 5-Year Financial Planning Period year financial planning period 5-year ops, maint & renewal proj. exp $155.7M 5-year ops, maint & renewal LTFP Budget exp $149.5M 5-year financing shortfall [10-year proj exp – LTFP Budget exp ] (-ve = gap) ($6.1M) 5-year financing indicator [LTFP Budget exp / 5-year proj exp ] 96.05%
INDICATORS
10-year
AMP Summaries
Key Data


Asset Management Strategy 2024/2025 to 2033/2034 76
Transport
Budget Implications

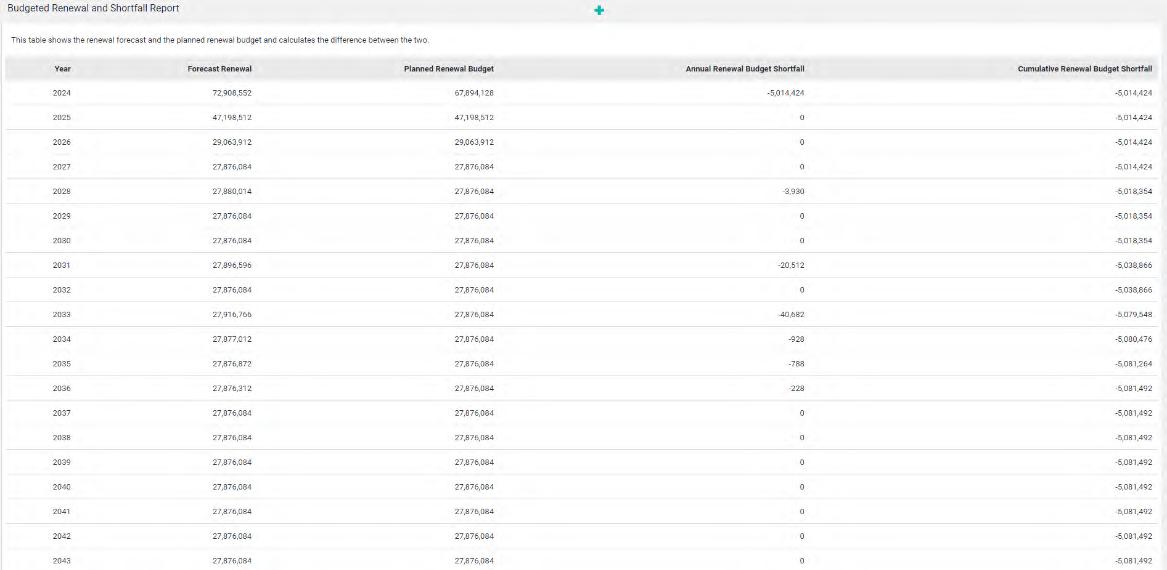
• Consideration should be given to the percentage of the Council’s transport assets, which are currently in average condition. Renewal shortfalls currently indicated will need to be investigated and addressed.
• There is a funding shortfall of $823K on average per year over the life of the 10Year Plan for maintenance, operations, renewals, and upgrade/new assets, totaling $8.23M for the life of the plan.
• Additional grant funding will be sought for programs, especially for capital programs.
• Grant funding where there is no certainty of the grant funding being available has not been included in the assessment.
Maintenance Programs
• Appropriate maintenance programs are implemented to ensure all assets reach their maximum useful life within budgetary constraints
• The Council is implementing a detailed inspection program to identify and rectify defects, especially those that pose a safety issue to motorists, in a timely manner.
Clarence Valley Council 77

Last Condition Survey
• Valuation dated – March 2018, valuation by APV
• Condition assessment undertaken by Clarence Valley Council

Asset Management Strategy 2024/2025 to 2033/2034 78
Clarence Valley Council 79 General Assessment of Condition Transport Condition Rating % of Asset Value 1 Very good condition 45.2 2 Good condition 29.1 3 Fair or moderate condition 22.7 4 Poor condition 2 8 5 Very poor condition 0.2 Critical Risks & Risk Management Detail the critical risks and risk management approach taken. Service or Asset at Risk What Can Happen Risk Rating (VH, H) Risk Treatment Plan Residua l Risk * Sealed Roads Vehicle accident H Increased inspections, minor rehabilitation works and maintenance. Conduct roughness and cracking analysis. L Sealed Roads Reduction on vehicle travel speed from poor condition of roads H Reseal all roads on a 15-year cycle for regional roads and 20year cycle for local roads L Guardrail Guardrail is dangerous to vehicles H Complete guardrail audit, and commence programmed maintenance/ replacement L Quarries Legislation or regulations are not complied with M Create induction document and sign-on register for quarry users L Quarries Unauthorised access leading to Injury or accident in the quarry H Improve signage L Quarries Authorised access leading to injury or accident in the quarry L Create induction document and sign-on register for quarry users L Quarries Illegal dumping of hazardous materials M Gates installed on all quarries L Bus Shelters Community expectation and demand not being met H Confirm which shelters are maintained by the Council and then inspect and clean them monthly L
Main Findings
Note * The residual risk is the risk remaining after the selected risk treatment plan is operational.
• The Council manages approx. 1,468km of sealed roads and 961km of unsealed roads
• The major influences on the road network in future will be the devolved old Pacific Highway as each new section is completed.
• Major emphasis is to increase maintenance levels in the following areas:
o Sealed road resealing
o Sealed road shoulder maintenance
o Unsealed road resurfacing
o Widening regional roads where required to meet current traffic loading
• General focus will be on managing condition 4 and 5 roads and maintaining roads at condition 3 and above.
• Additional data is to be gathered on the unsealed road network to better schedule resurfacing requirements.
• Further investigations to be carried out on the program and requirements to seal currently unsealed roads and options to return very-low traffic sealed roads to unsealed roads
• Council also maintains:
o 16 car parks
o 868 traffic facility items (including traffic medians, pedestrian refuges, kerb blisters, speed humps, school crossings and edging around trees)
o 22 km of guardrail and road fencing
o 306 roadside furniture items (including bus shelters, bollards, seating and bicycle racks)
o 18 Council-owned streetlights (this does not include general streetlights that are not owned by the Council)
o 12,350 signs
• Major emphasis is to implement programs in the following areas:
o Making provision for the remarking of Council car parks.
o Implement a program to replace warning signs over a 15-year period to ensure continued performance.
Asset Management Strategy 2024/2025 to 2033/2034 80 General Assessment of Condition Transport Condition Rating % of Asset Value 1 Very good condition 45.2 2 Good condition 29.1 3 Fair or moderate condition 22.7 4 Poor condition 2 8 5 Very poor condition 0.2 Bus Shelters Failure to inspect and maintain H Confirm which shelters are maintained by the Council and then inspect and clean them monthly L
o Installation of new streetlights.
• General focus will be on managing condition 4 and 5 assets and maintaining assets at condition 3 and above.
Clarence Valley Council 81 General Assessment of Condition Transport Condition Rating % of Asset Value 1 Very good condition 45.2 2 Good condition 29.1 3 Fair or moderate condition 22.7 4 Poor condition 2 8 5 Very poor condition 0.2
Key Data


Asset Management Strategy 2024/2025 to 2033/2034 82 Bridges
Budget Implications
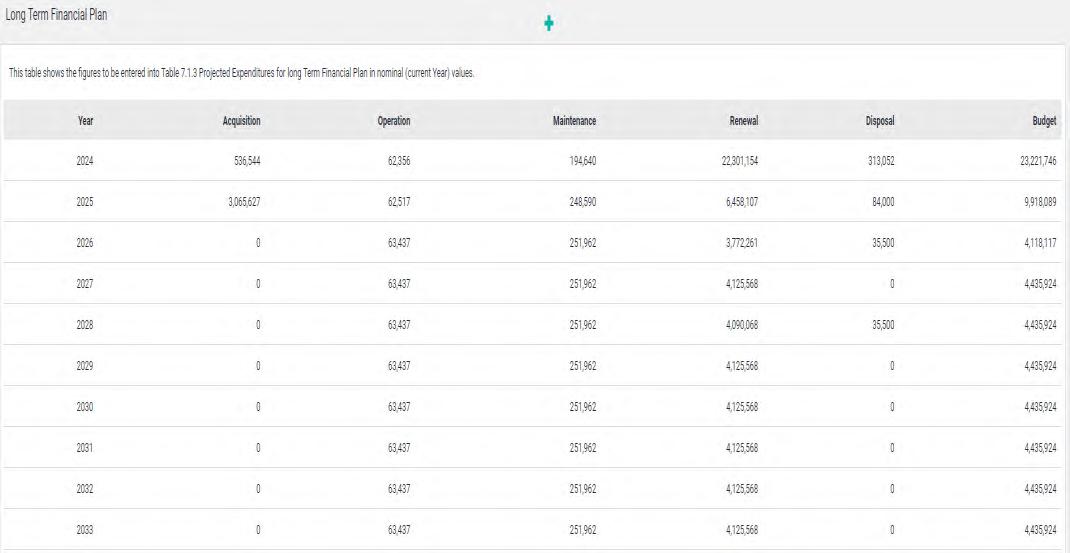

• There is a funding shortfall of $22K on average per year over the life of the 10Year Plan for maintenance, operations, renewals, and upgrade/new assets, totalling $220K for the life of the plan.
• Additional grant funding will be sought for programs, especially for capital programs.
• Grant funding where there is no certainty of the grant funding being available has not been included in the assessment.
Maintenance Programs
• Appropriate maintenance programs are implemented to ensure all assets reach their maximum useful life within budgetary constraints
• The Council is implementing a detailed inspection program to identify and rectify defects, especially those that pose a safety issue to motorists, in a timely manner.
Clarence Valley Council 83

Last Condition Survey
• Valuation dated – March 2018, desktop valuation by APV
• Condition assessment undertaken by Clarence Valley Council
Asset Management Strategy 2024/2025 to 2033/2034 84
1.1% 59.4% 39.6%
Bridges Poor Fair Good
Main Findings
Note * The residual risk is the risk remaining after the selected risk treatment plan is operational.
• The Council has 125 timber bridges (of which 31 has been replaced in 2021–22 & 2022–23) and 157 concrete bridges.
• The deterioration of the timber bridges potentially results in increased maintenance requirements for those bridges.
• Major emphasis is to increase maintenance levels in the following areas:
o Timber bridge maintenance
o Timber bridge replacement
o Recent significant grant funding under the ‘Fixing Country Bridges’ program will, over the next 2 years, result in 32 timber bridges being replaced and upgraded
• General focus will be on managing condition 4 bridges and maintaining bridges at condition 3 and above.
• Additional data is to be gathered on the timber bridges to better schedule maintenance requirements.
Clarence Valley Council 85 General Assessment of Condition Condition Rating % of Asset Value 1 Very good condition 22.3 2 Good condition 17 2 3 Fair or moderate condition 59 4 4 Poor condition 1.1 5 Very poor condition 0.0 Critical Risks & Risk Management Detail the critical risks and risk management approach taken. Service or Asset at Risk What Can Happen Risk Rating (VH, H) Risk Treatment Plan Residua l Risk * Bridges Failure to inspect and maintain H Document and review
conducted,
action taken on risks identified L
inspections
and
Water Facilities
Key Data


Asset Management Strategy 2024/2025 to 2033/2034 86
Budget Implications


• Consideration should be given to the percentage of the Council’s water facilities assets, which are currently in average condition. Renewal shortfalls currently indicated will need to be investigated and addressed.
• There is a funding shortfall of $10K on average per year over the life of the 10Year Plan for maintenance, operations, renewals, and upgrade/new assets, totalling $100K for the life of the plan.
• Additional grant funding will be sought for programs, especially for capital programs.
• Grant funding where there is no certainty of the grant funding being available has not been included in the assessment.
Maintenance Programs
• Appropriate maintenance programs are implemented to ensure all assets reach their maximum useful life within budgetary constraints
• The Council is implementing a detailed inspection program to identify and rectify defects, especially those that pose a safety issue to motorists, in a timely manner.
Clarence Valley Council 87

Last Condition Survey
• Valuation dated – March 2018, desktop valuation by APV
• Condition assessment undertaken by Clarence Valley Council
Water Facilities
Asset Management Strategy 2024/2025 to 2033/2034 88 2.4% 10.8% 86.8%
Poor Fair Good
Main Findings
Boat ramps, wharves and jetties
There is an impact by natural disasters (during and post natural disasters).
M If the road is not already closed, display a closed sign at water facilities during flood events.
Note * The residual risk is the risk remaining after the selected risk treatment plan is operational.
• The Council also maintains:
o 27 wharves/jetties
o 35 boat ramps
• Major emphasis is to implement programs in the following areas:
o Renew water facility components currently at condition rated 4 or 5 over a 4-year period, and implement the programs previously adopted by the Council and those identified in the Clarence River Wharves Development Plan over a 20-year period.
• General focus will be on managing condition 4 and 5 assets and maintaining assets at condition 3 and above.
• Additional data is to be gathered on the condition of water facility assets to better schedule requirements.
Clarence Valley Council 89 General Assessment of Condition Condition Rating % of Asset Value 1 Very good condition 59.4 2 Good condition 27 4 3 Fair or moderate condition 10 8 4 Poor condition 2.4 5 Very poor condition 0 Critical Risks & Risk Management Detail the critical risks and risk management approach taken. Service or Asset at Risk What Can Happen Risk Rating (VH, H) Risk Treatment Plan Residua l Risk *
L
Key Data


Asset Management Strategy 2024/2025 to 2033/2034 90
Footpaths/Cycleways
Budget Implications
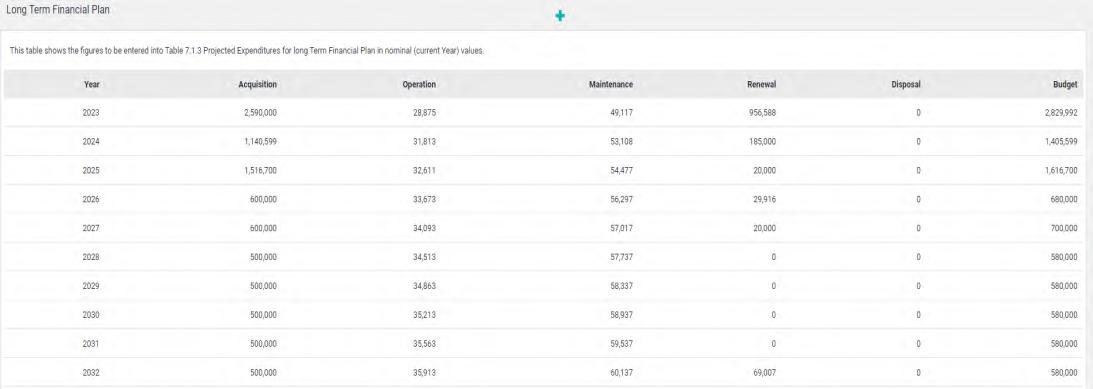

• Consideration should be given to the percentage of the Council’s water facilities assets, which are currently in average condition. Renewal shortfalls currently indicated will need to be investigated and addressed.
• There is a funding shortfall of $100K on average per year over the life of the 10Year Plan for maintenance, operations, renewals and upgrade/new assets, totalling $1m for the life of the plan.
• Additional grant funding will be sought for programs, especially for capital programs.
• Grant funding where there is no certainty of the grant funding being available has not been included in the assessment.
Maintenance Programs
• Appropriate maintenance programs are implemented to ensure all assets reach their maximum useful life within budgetary constraints
• The Council is implementing a detailed inspection program to identify and rectify defects, especially those that pose a safety issue to motorists, in a timely manner.
Clarence Valley Council 91

Last Condition Survey
• Valuation dated – March 2018, desktop valuation by APV
• Condition assessment undertaken by Clarence Valley Council
Footpaths/Cycleways
Asset Management Strategy 2024/2025 to 2033/2034 92
3.2% 36.9% 59.9%
Poor
Fair Good
Main Findings
the critical risks and risk management approach taken.
Footpaths/ Cycleways Injury from trip on footpath M Complete footpath audit, and schedule routine inspections from which regular maintenance can be prioritised.
Note * The residual risk is the risk remaining after the selected risk treatment plan is operational.
• The Council maintains 117km of footpaths/off-road cycleways.
• The Council has pedestrian access mobility plans and bike plans prepared for Grafton, South Grafton, Maclean, Yamba, Iluka, Woombah, Lawrence and Ulmarra. Preparation of plans for the remaining villages and a review of the plan covering Grafton, South Grafton, Maclean, and Yamba are planned for completion in the coming years.
• Major emphasis is to increase maintenance levels in the following areas:
o General footpath maintenance
o Replacement of defective footpath sections
o Continued implementation of the Pedestrian Access and Mobility Plan (PAMP) and bike plans
• General focus will be on managing condition 4 and 5 footpath segments and maintaining footpaths at condition 3 and above.
• Additional detailed data is to be gathered on footpath/cycleway network condition to better schedule maintenance and replacement requirements. This includes measuring the severity of defects so that a more directed maintenance and replacement program can be developed.
• A road safety officer is to be appointed in late 2020–21.
• Further investigations are to be carried out on potential programs and funding options with the Roads and Maritime Service.
Clarence Valley Council 93 General Assessment of Condition Condition Rating % of Asset Value 1 Very good condition 36.0 2 Good condition 23 9 3 Fair or moderate condition 36.9 4 Poor condition 1.8 5 Very poor condition 1 3
Detail
Service or Asset at Risk What Can Happen Risk Rating (VH, H) Risk Treatment Plan Residua l Risk *
Critical Risks & Risk Management
L
Transport
Objective
To manage the Council’s:
• road network in a safe and serviceable condition
• bridges in a safe and serviceable condition
• rural drainage network to ensure that the network operates and allows the free passage of water in a safe manner
• footpath and off-road cycleway network to ensure that it is free of significant defects and meets the community’s walking and cycling needs
• car parks to provide adequate parking opportunities for the community
• traffic facilities to provide increased safety to the public using the road network
• guardrail/safety fencing so that it offers protection to motorists
• roadside furniture to provide additional amenities for pedestrians at required locations
• street lighting to improve safety in car parks and on urban streets
• signs to provide appropriate warning and advice to motorists
• water facilities to provide and enhance the usage of the Council’s natural waterways
• other assets in a safe and serviceable condition
Performance Measures Target
(a) Ensure that maintenance works are undertaken effectively.
(b) Develop detailed forward works programs.
• Review and monitor the inspection system to better target maintenance works to areas required.
• Review and monitor maintenance procedures to ensure effective practices are utilised.
• Implement upgraded maintenance programs.
• Collect detailed data, including updated condition data, on all assets
• Prepare detailed maintenance works programs
• Monitor effectiveness of implemented programs though overall asset condition assessments.
• Seek additional sources of funding for capital works.
• Develop technical standards to assess and prioritise future works.
• Review and update the Transport AMP in line with updated asset data on an annual basis.
(c) Asset management
• Review and update data from the result of the annual desktop revaluation of transport assets for current value.
• Review and update data from the full revaluation of transport assets as per the Non-Current Asset Accounting Procedures
Asset Management Strategy 2024/2025 to 2033/2034 94
(a) Ensure that maintenance works are undertaken effectively
Review and monitor the inspection system to better target maintenance works to areas required.
Review and monitor maintenance procedures to ensure effective practices are utilised.
Implement upgraded maintenance programs.
(b) Develop detailed forward works programs.
Collect detailed data, including updated condition data, on all assets.
Prepare detailed maintenance works programs.
Monitor effectiveness of implemented programs though overall asset condition assessments.
Seek additional sources of funding for capital works.
Clarence Valley Council 95
Activities Who When
2023 2024 2025 2026 2027 2028 2029 2030 2031 2032
MCS 1
Activities Who When
2023 2024 2025 2026 2027 2028 2029 2030 2031 2032
MCS & F&AS P 2
MCS
MCS
MCS
Manager Civil Services
Finance
Asset Strategy Planner
1
2
&
Activities Who When
(c) Asset Management
Develop technical standards to assess and prioritise future works.
Review and update the Transport AMP in line with updated asset data on an annual basis.
Review and update data from the result of the annual desktop revaluation of transport assets for current value.
Review and update data from the full revaluation of transport assets as per the NonCurrent Asset Accounting Procedures.
Asset Management Strategy 2024/2025 to 2033/2034 96
2024 2025 2026 2027 2028 2029 2030 2031 2032 2033
F&ASP

Clarence Valley Council 97
Water Services
Key Data


Asset Management Strategy 2024/2025 to 2033/2034 98
Last Condition Survey

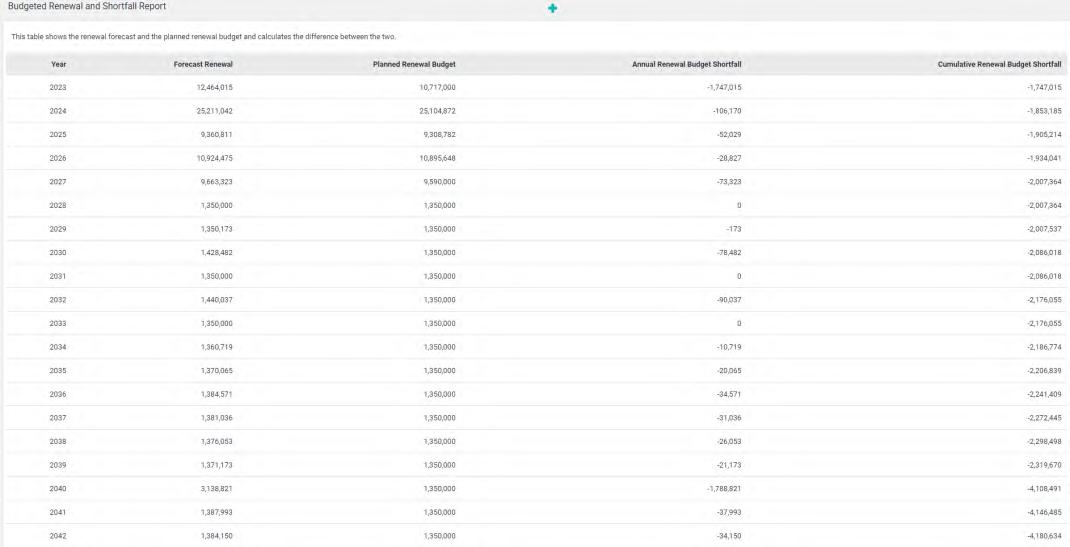
• Valuation dated – March 2018, revaluation by APV
• Condition assessment undertaken by Clarence Valley Council
Clarence Valley Council 99
3.3%5.1% 91.6% 0.0% Water Poor Fair Good Not Rated
Main Findings
Budget Implications
Changing legislative requirements (inc. changes in drinking water quality standards) require the Council to undertake unplanned/ unfunded work
There is a death or injury to staff or public.
Risk assessment completed before task
• Compliance with WH&S legislation
• SWMS/SOP are followed
• Incidents reported for continuous improvement
Note * The residual risk is the risk remaining after the selected risk treatment plan is operational.
• The Council's water supplies are unfiltered. While the water supply generally meets the Australian Drinking Water Guidelines (ADWG) requirements, recommended limits for aesthetic limits are occasionally exceeded. These do not present a health risk. The main complaint is dirty or discoloured water, which is addressed with mains flushing and source management.
• All water supplies are chlorinated and (other than Glenreagh and Coutts) stabilised due to natural soft water.
• As part of the Drinking Water Quality Assurance Management Plan (DWQAMP), additional treatment barriers (inc. filtration) may be required.
• A particular risk to water supply infrastructure is that in several locations, there are water mains that are threatened by riverbank erosion, and there are single pipelines crossing waterways. The forward financial plan proposes to manage these risks.
• There is an inability to upgrade water treatment if regulatory changes require an increased treatment level. The Council could potentially be in breach of the Public Health Act.
• Consideration should be given to the percentage of the Council’s water assets, which are currently in average condition. Renewal shortfalls currently indicated will need to be investigated and addressed.
• There is a shortfall of $524Kp.a which equates to a $5.4M over the life of the 10Year Plan for maintenance, operations, renewals, and upgrade/new assets. The
Asset Management Strategy 2024/2025 to 2033/2034 100 General Assessment of Condition Condition Rating % of Asset Value 1 Very good condition 31 1 2 Good condition 60 5 3 Fair or moderate condition 5 1 4 Poor condition 3.1 5 Very poor condition 0.2
Detail the critical risks
risk management approach taken. Service or Asset at Risk What Can Happen Risk Rating (VH, H) Risk Treatment Plan Residua l Risk * Water Constructio n
Critical Risks & Risk Management
and
H The only possible mitigation is a political approach M Constructio n
–Water
work
H
•
L
Maintenance Programs
Office of Water’s (OoW) Best Practice Management Guidelines require the Council to have a robust 30-year financial model for its water fund. This is monitored and updated each year with the audited financial statements The FINMOD 30-year financial model has indicated that this projected funding can be met under the current pricing path.
• The renewal program in the Water Services AMP, which has been included in the LTFP, is based on the current water supply asset renewal requirements. The AMP has assessed only 3.1% of the assets as being in a ‘poor’ condition. However, a significant proportion of water assets that are currently assessed as being in ‘fair’ or ‘good’ condition are at, or have exceeded, their theoretical life. It is only proposed to schedule replacement of these assets when their condition deteriorates to a ‘poor’ condition, and there is insufficient evidence to enable establishment of a timeframe for this deterioration. Within the next 3 years, further analysis of asset deterioration will be performed. It is proposed that the cash surplus in the water fund be used to establish a water renewal reserve, with the maximum reserve amount to be set as a percentage of the gross replacement cost of the water infrastructure. The percentage is to be determined through the further analysis of asset deterioration. Future unscheduled water asset renewals will be funded from this reserve.
• In addition, a risk identified in the AMS is regulatory change that would mandate an increased level of drinking water treatment. An increase in treatment is not included in the current LTFP but, if required, it is estimated that the capital cost of increased treatment could be up to $85 million (2024/26) The water fund financial modelling has also not included the potential future augmentation of Shannon Creek Dam to 75,000ML, which was foreshadowed in the regional water supply as potentially being required by the year 2046, although current consumption trends indicate that augmentation would not be required within the 30-year life of this LTFP. If this augmentation were to proceed, it is estimated to cost at least $150 million.
• Appropriate maintenance programs are implemented to ensure all assets reach their maximum useful life within budgetary constraints.
• A maintenance management system (MMS) has been implemented, with a particular focus on mechanical and electrical assets. Since the introduction of the MMS, most resources are now committed to preventative maintenance, unplanned and breakdown work.
Clarence Valley Council 101 General Assessment of Condition Condition Rating % of Asset Value 1 Very good condition 31 1 2 Good condition 60 5 3 Fair or moderate condition 5 1 4 Poor condition 3.1 5 Very poor condition 0.2
Water Services
Objective
Provide customers a reliable, high-quality, affordable, and environmentally sustainable water supply, promoting water efficiency and Total Water Cycle Management principles.
Performance Measures Target
(a) Ensure that maintenance works are undertaken effectively.
(b) Develop detailed forward works programs.
(c) Ensure good governance and administrative support for the Council and organisation.
• Manage the drinking water system to minimise environmental impacts
• Review and monitor the inspection system to better target maintenance works to areas required.
• Review and monitor maintenance procedures to ensure effective practices are utilised.
• Implement upgraded maintenance programs.
• Collect detailed data, including updated condition data, on all assets.
• Prepare detailed maintenance works programs.
• Monitor effectiveness of implemented programs though overall asset condition assessments.
• Comply with the OoW’s Best Practice Management Guidelines.
• Review and implement the Strategic Business Plan (SBP) and the Development Servicing Plan (DSP) for water services.
• Water supply is managed in accordance with the DWQAMP.
• Investigate water treatment upgrades for both main and village supplies to improve drinking water quality in accordance with the DWQAMP.
• Drinking water supply meets the ADWG.
• Develop technical standards to assess and prioritise future works (e.g., standards to assess risk-based replacement programs).
(d) Asset Management
• Review and update the Water AMP in line with updated asset data on an annual basis.
• Review and update data from the result of the annual desktop revaluation of water assets for current value
• Review and update data from the full revaluation of water assets as per the NonCurrent Asset Accounting Procedures.
Asset Management Strategy 2024/2025 to 2033/2034 102
Activities Who When
(a) Ensure that maintenance works are undertaken effectively.
3
Manage the drinking water system to minimise environmental impacts.
Review and monitor the inspection system to better target maintenance works to areas required.
Review and monitor maintenance procedures to ensure effective practices are utilised.
Implement upgraded maintenance programs.
Activities Who When
(b) Develop detailed forward works programs.
Collect detailed data, including updated condition data, on all assets.
Prepare detailed maintenance works programs.
Monitor effectiveness of implemented programs though overall asset condition assessments.
&
Manager Water Cycle
Clarence Valley Council 103
2024 2025 2026 2027 2028 2029 2030 2031 2032 2033
MWC
2024 2025 2026 2027 2028 2029 2030 2031 2032 2033
MWC
F&ASP
MWC
MWC 3
(c) Ensure good governance and administrative support for the Council and organisation.
Comply with the OoW’s Best Practice Management Guidelines.
Review and implement the SBP and the DSP for water services.
Water supply is managed in accordance with the DWQAMP.
Investigate water treatment upgrades for both main and village supplies to improve drinking water quality in accordance with the DWQAMP.
Drinking water supply meets the ADWG.
Asset Management Strategy 2024/2025 to 2033/2034 104
Activities Who When
2024 2025 2026 2027 2028 2029 2030 2031 2032 2033
MWC
Activities Who When
(d) Asset Management
Develop technical standards to assess and prioritise future works.
Review and update the water AMP in line with updated asset data on an annual basis.
Review and update data from the result of the annual desktop revaluation of water assets for current value.
Review and update data from the full revaluation of water assets as per the NonCurrent Asset Accounting Procedures.
Clarence Valley Council 105
2024 2025 2026 2027 2028 2029 2030 2031 2032 2033
F&ASP
Sewerage Services

Asset Management Strategy 2024/2025 to 2033/2034 106
Key Data


Clarence Valley Council 107
Last Condition Survey


• Valuation dated – March 2018, revaluation by APV + Annual Indexing
• Condition assessment undertaken by Clarence Valley Council
Asset Management Strategy 2024/2025 to 2033/2034 108
General Assessment of Condition Condition Rating % of Asset Value 1 Very good condition 37 6 2 Good condition 43 0 3 Fair or moderate condition 15.9 4 Poor condition 2.2 5 Very poor condition 1 2
Detail the critical risks and risk management approach taken. 3.4% 15.9% 80.7% Sewer Poor Fair Good
Critical Risks & Risk Management
Main Findings
Note * The residual risk is the risk remaining after the selected risk treatment plan is operational.
• We are currently fully compliant with NSW DPI Water Best Practice Guidelines.
• A particular risk to sewerage infrastructure would be the changing of environmental requirements, which may require unforeseen augmentation in the future
• Significant investigation is required to determine feasible schemes for rural villages.
• There is an inability to upgrade an STP if a regulatory change requires an increased level of treatment. This would potentially place the Council in breach of an environmental protection licence.
• Consideration should be given to the percentage of the Council’s sewerage assets, which are currently in fair or moderate condition.
• There is a shortfall budget over the life of the 10-Year Plan for maintenance, operations, renewals, and upgrade/new assets of $440K pa which equates to $4.4m over the life of the plan. The OoW’s Best Practice Management Council is required to have a robust 30-year financial model for its sewer fund. This is monitored and updated each year when the audited financial statements are completed, The FINMOD 30-year financial model has indicated that this projected funding can be met under the current pricing path.
Budget Implications
• The renewal program in the Sewerage AMP, which has been included in the LTFP, is based on the current sewerage asset renewal requirements. The AMP has assessed only 3.4% of the assets as being in a ‘poor’ condition. However, a significant proportion of sewer assets that are currently assessed as being in ‘fair’ or ‘good’ condition are at, or have exceeded, their theoretical life. It is only proposed to schedule replacement of these assets when their condition deteriorates to a ‘poor’ condition, and there is insufficient evidence to enable establishment of a timeframe for this deterioration. As part of the 2020–21 revaluation, a significant amount of CCTV sampling will be undertaken to assist with future strategic planning. It is proposed that the cash surplus in the sewer fund be used to establish a sewer renewal reserve, with the maximum reserve amount to be set as a percentage of the gross replacement cost of the sewer infrastructure. The percentage is to be determined through the further analysis of asset deterioration. Future unscheduled sewer asset renewals will be funded from this reserve.
• Appropriate maintenance programs are implemented to ensure all assets reach their maximum useful life within budgetary constraints.
Maintenance Programs
• Since the introduction of the MMS, most resources are now committed to preventative maintenance, unplanned and breakdown work.
• Ongoing CCTV inspection of reticulation is undertaken to determine reticulation condition.
Clarence Valley Council 109 General Assessment of Condition Condition Rating % of Asset Value 1 Very good condition 37 6 2 Good condition 43 0 3 Fair or moderate condition 15 9 4 Poor condition 2.2 5 Very poor condition 1 2 Service or Asset at Risk What Can Happen Risk Rating (VH, H) Risk Treatment Plan Residua l Risk * Recycled water manageme nt Water quality does not meet AGWR M Implement critical control points and monitor chlorine residuals M
Asset Management Strategy 2024/2025 to 2033/2034 110
Sewerage Services
Objective Provide high-quality management of sewerage services that is ecologically, socially, and economically sustainable.
Performance Measures Target
• The sewer network is adequately maintained to prevent environmental overflows and offensive odours.
(a) Ensure that maintenance works are undertaken effectively.
(b) Develop detailed forward works programs.
(c) Ensure good governance and administrative support for the Council and organisation.
• Review and monitor the inspection system to better target maintenance works to areas required.
• Review and monitor maintenance procedures to ensure effective practices are utilised.
• Implement upgraded maintenance programs.
• Collect detailed data, including updated condition data, on all assets.
• Prepare detailed maintenance works programs.
• Monitor effectiveness of implemented programs though overall asset condition assessments.
• Comply with the OoW’s Best Practice Management Guidelines.
• Review and implement the SBP and the DSP for sewer services.
• Meet Environmental Protection Licence requirements for environmental release of recycled water and NOW requirements for reuse.
• All trade waste dischargers to have appropriate agreements and be inspected.
• All recycled water end is used to have appropriate agreements and monitoring.
• Develop technical standards to assess and prioritise future works (e.g., standards to assess risk-based replacement programs).
(d) Asset Management
• Review and update the Sewerage AMP in line with updated asset data on an annual basis.
• Review and update data from the result of the annual desktop revaluation of sewerage assets for market/current value
• Review and update data from the full revaluation of sewerage assets as per the Non-Current Asset Accounting Procedures.
Clarence Valley Council 111
Activities Who When
(a) Ensure that maintenance works are undertaken effectively.
The sewer network is adequately maintained to prevent environmental overflows and offensive odours.
Review and monitor the inspection system to better target maintenance works to areas required.
Review and monitor maintenance procedures to ensure effective practices are utilised.
Implement upgraded maintenance programs.
Activities Who When
(b) Develop detailed forward works programs.
Collect detailed data, including updated condition data, on all assets.
Prepare detailed maintenance works programs.
Monitor effectiveness of implemented programs though overall asset condition assessments.
& F&ASP
Asset Management Strategy 2024/2025 to 2033/2034 112
2024 2025 2026 2027 2028 2029 2030 2031 2032 2033
MWC
2024 2025 2026 2027 2028 2029 2030 2031 2032 2033
MWC
MWC
MWC
Activities Who When
(c) Ensure good governance and administrative support for the Council and organisation.
Comply with the NOW Best Practice Management Guidelines.
Review and implement the SBP and the DSP for sewer services.
Meet Environmenta l Protection Licence requirements for environmenta l release of recycled water and the OoW’s requirements for reuse.
All trade waste dischargers to have appropriate agreements and be inspected.
All recycled water end is used to have appropriate agreements and monitoring.
MW C
Clarence Valley Council 113
202 4 202 5 202 6 202 7 202 8 202 9 203 0 203 1 203 2 203 3
Activities Who When
Develop technical standards to assess and prioritise future works.
Review and update the Sewerage AMP in line with updated asset data on an annual basis.
Review and update data from the result of the annual desktop revaluation of sewerage assets for market/current value.
Review and update data from the full revaluation of sewerage assets as per the NonCurrent Asset Accounting Procedures.
Asset Management Strategy 2024/2025 to 2033/2034 114
(d) Asset Management 2024 2025 2026 2027 2028 2029 2030 2031 2032 2033
F&ASP

Clarence Valley Council 115
Buildings
Key Data


Asset Management Strategy 2024/2025 to 2033/2034 116
•
Last Condition Survey


• Valuation dated – March 2018, desktop valuation by APV
• Condition assessment undertaken by Clarence Valley Council
Clarence Valley Council 117
0.8% 35.6% 63.6%
Buildings
Poor Fair Good
deteriorate to a lesser service standard, and there is a higherrisk situation due to maintenance costs increasing from an inadequate renewal program
Asbestos identified in buildings is managed according to the CVC Asbestos Management Protocol and recorded on the Asbestos Risk Register, together with control measures and a completion date for removal.
Continue to improve data.
Maintenance is managed appropriately at an operational level. Future planning improvements can be made by documented service level risks and utilisation of these in establishing future maintenance priorities in the 10-Year LTFP.
Review the usage of groups of buildings such as public halls and recommend outcomes to improve utilisation.
Consideration should be made to ensure sufficient ongoing operation and maintenance funds can be provided to support these additional assets.
Note * The residual risk is the risk remaining after the selected risk treatment plan is operational.
Asset Management Strategy 2024/2025 to 2033/2034 118 General Assessment of Condition Condition Rating % of Asset Value 1 Very good condition 31 9 2 Good condition 31 7 3 Fair or moderate condition 35 6 4 Poor condition 0.6 5 Very poor condition 0.2 Critical Risks & Risk Management Detail the critical risks and risk management approach taken. Service or Asset at Risk What Can Happen Risk Rating (VH, H) Risk Treatment Plan Residua l Risk * All groups across the Building Assets Network Materials containing asbestos within existing buildings are disturbed/broken VH
L All groups across
Building Assets Network Buildings
H
the
M All groups across the Building Assets Network Building underutilised M
L All groups across the Building Assets Network Increasing financial pressure to adequately maintain the building portfolio M
L
Main Findings
• The buildings are classified as either specialised or non-specialised buildings being made up of:
Specialised
o Amenities, cemeteries, community, community halls/centres, depots, parks and reserves, RFS/SES, sheds, sporting.
Non-Specialised
o Community health, cultural, museums, office/administration, public libraries, residential.
• Additional buildings are included in other AMPs such as waste, holiday parks, saleyards and pools.
• The current rationalisation of the Council’s building footprint is to reduce operations and maintenance costs; this will have a major impact during the life of this plan. The need for this arose due to the number of buildings and facilities the Council is still carrying from the amalgamation of former councils.
• The rationalisation of the Council’s buildings has commenced with the sale of a number of properties and the construction of new encompassing facilities.
• Depot rationalisation has been completed.
• The rationalisations of the Council’s administration commenced with the sale and relocation of staff from
o Pound Street,
o MacNaughton Place
o 42 Victoria Street
• Upgrade works of 2 Prince Street have commenced, to be completed by October 2021.
• A review of the Developer Contribution Plan is to be undertaken.
• The focus will be on strategically planning for condition 4–5 buildings and any condition 3 buildings that are likely to move to condition 4 in the next 10 years. Ensure data is available to determine whether the maintenance required to achieve the estimated useful life is achieved.
• Asbestos management plans and their implementation for major buildings will be a key action. It is a priority to manage asbestos and its removal wherever practicable.
• Assets in condition 5 will require demolition and disposal, and some will be replaced and upgraded.
• A review of residential properties has been undertaken with buildings identified for disposal.
• The focus on energy/efficiency is for major facilities to reduce operational costs associated with power use, (e.g. major upgrade of air conditioning systems and installation of solar panels)
• Focus on providing all-accessible access to buildings and facilities due to the changing demographics of an ageing population.
• Consideration should be given to the percentage of the Council’s building assets, which are currently in a fair or moderate condition.
Budget Implications
• There is a funding shortfall of $556k on average per year over the life of the 10Year Plan for maintenance, operations, renewals and upgrades/new assets, totalling $5.5m for the life of the plan.
Clarence Valley Council 119 General Assessment of Condition Condition Rating % of Asset Value 1 Very good condition 31 9 2 Good condition 31 7 3 Fair or moderate condition 35 6 4 Poor condition 0.6 5 Very poor condition 0.2
• Appropriate funding is required to ensure maintenance programs are implemented so that assets reach their end-of-useful life.
• Funding includes a proportion of Clarence Coast Reserve Trust funding for buildings located within the Reserve Trust managed by the Council.
• Grant and community support funding is to be sought wherever possible to assist in making up the funding shortfall when upgraded/new buildings are proposed.
• Other contributions from grants or other sources have been considered in the plan.
• Appropriate maintenance programs are implemented to ensure all assets reach their maximum useful life within budgetary constraints.
• The Council regularly inspects buildings and undertakes maintenance programs to ensure as a priority they are safe.
• Asbestos management safety is a priority for the Council’s renewal, upgrade, and disposal programs.
Asset Management Strategy 2024/2025 to 2033/2034 120 General Assessment of Condition Condition Rating % of Asset Value 1 Very good condition 31 9 2 Good condition 31 7 3 Fair or moderate condition 35 6 4 Poor condition 0.6 5 Very poor condition 0.2
Maintenance Programs
Objective
To provide sustainable buildings that are in a safe and serviceable condition Provide buildings that meet the ongoing needs of the community.
Performance Measures Target
(a) Ensure that maintenance works are undertaken effectively.
(b) Develop detailed forward works programs.
(c) Ensure good governance and administrative support for the Council and organisation.
(d) Asset Management
• Review and monitor the inspection system to better target maintenance works to areas required.
• Review and monitor maintenance procedures to ensure effective practices are utilised.
• Collect detailed data, including updated condition data, on all assets.
• Prepare detailed maintenance, renewal and new/upgraded works programs targeting condition 4 and 5 assets and safety issues aligned to available budgets.
• Monitor effectiveness of implemented programs though overall building asset condition assessments.
• Seek additional sources of funding for capital works.
• Review the property portfolio for the replacement/upgrade/disposal of assets.
• Review the Developer Contributions Plan 2011 to ensure it is appropriate to the new Community Strategic Plan when completed.
• Develop technical standards to assess and prioritise future works.
• Review and update the Buildings AMP in line with updated asset data on an annual basis.
• Review and update data from the result of the annual desktop revaluation of the building portfolio for market/current value
• Review and update data from the full revaluation of the building portfolio as per the Non-Current Asset Accounting Procedures.
Clarence Valley Council 121 Buildings
Activities Who When
(a) Ensure that maintenance works are undertaken effectively.
Review and monitor the inspection system to better target maintenance works to areas required.
Review and monitor maintenance procedures to ensure effective practices are utilised.
Activities Who When
(b) Develop detailed forward works programs.
Collect detailed data, including updated condition data, on all assets.
Prepare detailed maintenance, renewal and new/upgraded works programs targeting condition 4 and 5 assets and safety issues aligned to available budgets.
Monitor effectiveness of implemented programs though overall building asset condition assessments.
Seek additional sources of funding for capital works.
and F&ASP
Asset Management Strategy 2024/2025 to 2033/2034 122
2024 2025 2026 2027 2028 2029 2030 2031 2032 2033
MOS&F 4
2024 2025 2026 2027 2028 2029 2030 2031 2032 2033
MOS&F
MOS&F
MOS&F
MOS&F
Manager Open Spaces & Facilities
4
Activities Who When
(c) Ensure good governance and administrative support for the Council and organisation.
Review the property portfolio for the replacement/upgrad e/disposal of assets.
Review the Developer Contributions Plan 2011 to ensure it is appropriate to the Community Strategic Plan.
Activities Who When
(d) Asset Management
Develop technical standards to assess and prioritise future works.
Review and update the Buildings AMP in line with updated asset data on an annual basis.
Review and update data from the result of the annual desktop revaluation of building portfolio for market/current value.
Review and update data from the full revaluation of the building portfolio as per the NonCurrent Asset Accounting Procedures.
Clarence Valley Council 123
2024 2025 2026 2027 2028 2029 2030 2031 2032 2033
MOS&F
2024 2025 2026 2027 2028 2029 2030 2031 2032 2033
IP&SAC
Open Spaces

Asset Management Strategy 2024/2025 to 2033/2034 124
Key Data


Clarence Valley Council 125
Last Condition Survey


• Valuation dated – March 2018, desktop valuation by APV
• Condition assessment undertaken by Clarence Valley Council
Open Spaces
Asset Management Strategy 2024/2025 to 2033/2034 126
4.6% 49.6% 45.7%
Poor
Fair Good
Clarence Valley Council 127 General Assessment of Condition Condition Rating % of Asset Value 1 Very good condition 23.3 2 Good condition 22 4 3 Moderate condition 49 6 4 Poor condition 3.9 5 Very poor condition 0.7 Critical Risks & Risk Management Detail the critical risks and risk management approach taken. Service or Asset at Risk What Can Happen Risk Rating (VH, H) Risk Treatment Plan Residual Risk * Open Spaces & Facilities The loss of appointment as Crown Lands Manager M Financial management of Crown Land in accordance with Division 3.4 of the Crown Land Management Act 2016 L Sporting Facilities There is injury to users/spectators due to hazards M Improvement of ground conditions; clarification and documentation of responsibilities; establish formal criteria guidelines for closing fields or reducing use. L Sporting Facilities There is injury to users/spectators due to conflicting activities M Undertake a review of use and sporting conflicts; clarification and documentation of use criteria, capacity, and responsibilities L Trees Serious injury to public H Formalise staff checking process; introduce formal inspection and recording system; develop standard processes for actioning faults. L BBQ Burns from BBQs M Formalise staff checking process; introduce formal inspection and recording system; develop standard processes for actioning faults. L Open Spaces Needle stick injury to public H Formalise staff checking process; introduce formal inspection and recording system; develop standard processes for actioning faults. M
Injury due to poor lighting
Open Spaces
Main Findings
Open Spaces
Injury caused by poor fencing, including temporary fencing
from shade cloth occurs
Review and improve floodlighting to comply with standard, document lux level on each lit field or court. Inform parks committees of applicable standards, existing lux levels and what is permissible.
Formalise staff checking process; introduce formal inspection and recording system; develop standard processes for actioning faults.
Develop maintenance plan; upgrade monitoring of key sites.
Secure any egress points onto shade structures
Install harness points to shade structures, which require access by authorised persons.
Note * The residual risk is the risk remaining after the selected risk treatment plan is operational.
• Open Spaces assets include:
o Buildings (canteens, amenities)
o Accessways (access tracks, bridges, cycle ways, footpaths, internal roads & car parks)
o Fencing (bollards, fences, gates) Playgrounds
o Shelters & sheds
o Park structures (BBQs, landscaping, park furniture)
o Utilities (lighting, water tanks, septic tanks)
o Sports structures (grandstands, irrigation, sporting structures)
o Other structures
o Green assets such as sports fields and street trees are not currently valued.
• The Council currently manages:
o 123 parks (~101 ha)
o 25 sports grounds (~209 ha)
o 194 general community uses (~194 ha)
o 69 natural areas (~573 ha)
o 19 areas of cultural significance (~93 ha)
• Asset service hierarchy from Open Spaces Strategic Plan and Generic Plan of Management
o Regional
Asset Management Strategy 2024/2025 to 2033/2034 128 General Assessment of Condition Condition Rating % of Asset Value 1 Very good condition 23.3 2 Good condition 22 4 3 Moderate condition 49 6 4 Poor condition 3.9 5 Very poor condition 0.7
H
L
H
M Open
Irrigation
H
L Open
Facilities Falls
M
Spaces
system malfunction
Spaces &
L
Budget
Implications
Maintenance Programs
District
o Local
• Levels of service have been defined and documented for most of these areas.
• Community surveys conducted revealed the community is satisfied overall with current Open Spaces levels of service.
• Consideration should be given to the percentage of the Council’s Open Spaces assets, which are currently rated condition 3 to 5. Renewal shortfalls will need to be investigated and addressed.
• There is a funding shortfall of $497k on average per year over the life of the 10Year Plan for maintenance, operations, renewals and upgrades/new assets, totalling $5m for the life of the plan.
• Grant and community support funding is to be sought wherever possible to assist in making up the funding shortfall when upgraded/new buildings are proposed.
• Other contributions from grants or other sources have been considered in the plan.
• Appropriate maintenance programs are implemented to ensure all assets reach their maximum useful life within budgetary constraints.
• Develop or review asset inspection programs for the various types of facilities
Clarence Valley Council 129 General Assessment of Condition Condition Rating % of Asset Value 1 Very good condition 23.3 2 Good condition 22 4 3 Moderate condition 49 6 4 Poor condition 3.9 5 Very poor condition 0.7
o
Open Spaces
Objective
To provide high-quality and sustainable sport and recreational opportunities at a safe and functional standard and appropriate appearance that meet our community’s needs.
Performance Measures Target
(a) Ensure that maintenance works are undertaken effectively.
(b) Develop detailed forward works programs.
(c) Ensure good governance and administrative support for the Council and organisation.
• Review and monitor the inspection system to better target maintenance works to areas required.
• Review and monitor maintenance procedures to ensure effective practices are utilised.
• Collect detailed data, including updated condition data, on all assets.
• Prepare detailed maintenance, renewal and new/upgraded works programs targeting condition 4 and 5 assets and safety issues aligned to available budgets.
• Monitor effectiveness of implemented programs though overall Open Spaces asset condition assessments.
• Seek additional sources of funding for capital works.
• Review asset portfolio for replacement/upgrade/disposal of assets, as defined in the Open Spaces Strategic Plan.
• Review the Developer Contributions Plan 2011 to ensure it is appropriate to the new Community Strategic Plan when completed.
• Review and implement the Open Spaces Strategic and Sports Facilities Plan.
• Continue to review fee structure and implement any changes.
• Review contract maintenance agreements.
• Develop technical standards to assess and prioritise future works.
• Review and update the Open Spaces AMP in line with updated asset data on an annual basis.
(d) Asset Management
• Review and update data from the result of the annual desktop revaluation of open spaces portfolio for market/current value.
• Review and update data from the full revaluation of the Open Spaces portfolio as per the Non-Current Asset Accounting Procedures.
(a) Ensure that maintenance works are undertaken effectively.
Review and monitor the inspection system to better target maintenance works to areas required.
Review and monitor maintenance procedures to ensure effective practices are utilised.
Asset Management Strategy 2024/2025 to 2033/2034 130
Who When
Activities
2024 2025 2026 2027 2028 2029 2030 2031 2032 2033
MOS&F
Activities Who When
(b) Develop detailed forward works programs.
Collect detailed data, including updated condition data, on all assets.
Prepare detailed maintenance, renewal and new/upgraded works programs targeting condition 4 and 5 assets and safety issues aligned to available budgets.
Monitor effectiveness of implemented programs though overall Open Spaces asset condition assessments.
Seek additional sources of funding for capital works.
MOS&F and F&ASP 5
Clarence Valley Council 131
2024 2025 2026 2027 2028 2029 2030 2031 2032 2033
MOS&F
MOS&F
MOS&F 5 Finance & Asset Strategy Planner
Activities Who When
(c) Ensure good governance and administrative support for the Council and organisation.
Review asset portfolio for replacement/ upgrade/disposal of assets, as defined in the Open Spaces Strategic Plan.
Review the Developer Contributions Plan 2011 to ensure it is appropriate to the new Community Strategic Plan when completed.
Review contract maintenance agreements.
Asset Management Strategy 2024/2025 to 2033/2034 132
2024 2025 2026 2027 2028 2029 2030 2031 2032 2033
MOS&F
Activities Who When
(d) Asset Management
Develop technical standards to assess and prioritise future works.
Review and update the Open Spaces AMP in line with updated asset data on an annual basis.
Review and update data from the result of the annual desktop revaluation of the open spaces portfolio for market/current value.
Review and update data from the full revaluation of the Open Spaces portfolio as per the Non-Current Asset Accounting Procedures.
Clarence Valley Council 133
2024 2025 2026 2027 2028 2029 2030 2031 2032 2033
F&SAP
Waste Management

Asset Management Strategy 2024/2025 to 2033/2034 134
• Grafton Regional Landfill has approx. 70 years of landfill space remaining at current filling rates

Key Data

Clarence Valley Council 135
• Last Condition Survey
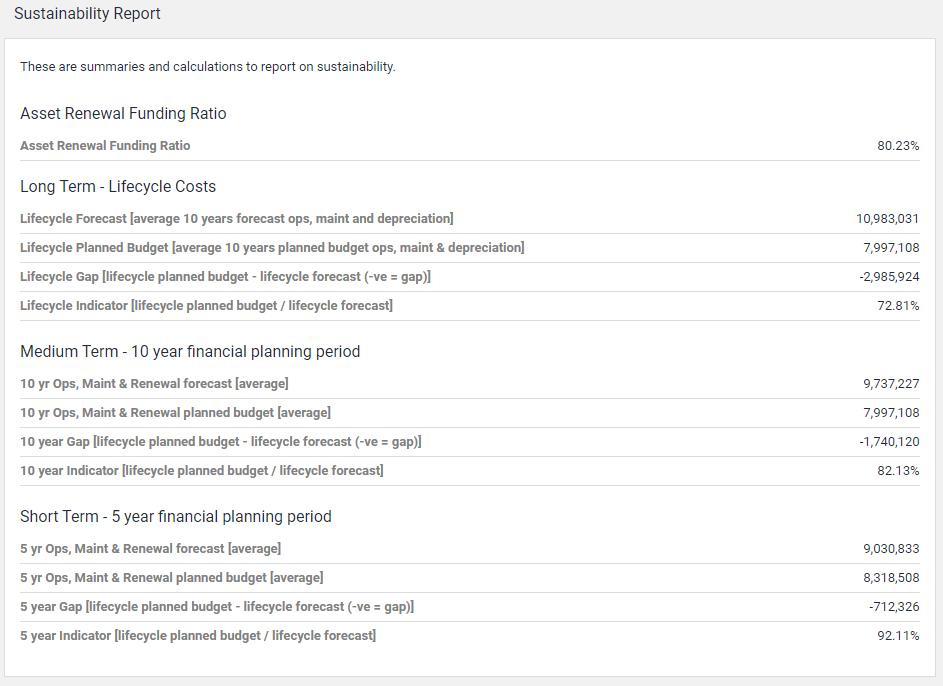


• Valuation dated – March 2018, desktop valuation by APV
• Condition assessment undertaken by Clarence Valley Council
Asset Management Strategy 2024/2025 to 2033/2034 136
Clarence Valley Council 137 General Assessment of Condition Condition Rating % of Asset Value 1 Very good condition 47 2 2 Good condition 14.0 3 Fair or moderate condition 35.7 4 Poor condition 3 1 5 Very poor condition 0.0 Critical Risks & Risk Management Detail the critical risks and risk management approach taken. Service or Asset at Risk What Can Happen Risk Rating (VH, H) Risk Treatment Plan Residual Risk * Waste disposal facilities not adequately maintained Safety concerns for the public and workers at waste facilities M Maintain waste disposal sites, and replace equipment, including safety equipment, when necessary. Train staff in asbestos waste management. Ensure waste staff follow safe work procedures and patrons follow safety procedures. L Waste disposal facilities not adequately supervised Injury at any waste transfer station H Review operation of the site in line with the Waste Management Strategy. H Landfill –Noncompliance with EPA Licence Regulatory action from the EPA at landfill or transfer stations if regulations and M Review and report on the effects of implementing changes in regulations/ legislation L 3.1% 35.7% 61.2% Waste Poor Fair Good
Assess the impact of restrictions, and implement any changes recommended by the Council.
Reinforce public education programs on recycling
Note * The residual risk is the risk remaining after the selected risk treatment plan is operational
• Not all expenditures are captured; with the contracted sites, this expenditure is classified as ‘commercial in confidence’.
Main Findings
Budget
Implications
Maintenance Programs
• Not all waste assets have been captured in this plan; landfill cells are not considered.
• Consideration should be given to the percentage of the Council’s waste assets, which are currently in a fair or moderate condition.
• There is a funding shortfall of $1.8m on average per year over the life of the 10Year Plan for maintenance, operations, renewals and upgrades/new assets, totalling $18m for the life of the plan.
• Domestic waste is self-funding.
• Regional landfill is self-funding.
• Other waste services, which include the network of transfer stations, are funded by a waste management fund.
• Appropriate maintenance programs are implemented to ensure all assets reach their maximum useful life within budgetary constraints.
Asset Management Strategy 2024/2025 to 2033/2034 138 General Assessment of Condition Condition Rating % of Asset Value 1 Very good condition 47 2 2 Good condition 14.0 3 Fair or moderate condition 35.7 4 Poor condition 3 1 5 Very poor condition 0.0 legislation are not complied with Waste Recycling Agencies restricting/limiting recycling materials to processing facilities H
L
Waste Management
Objective
To provide waste management facilities that are cost-effective and meet the community’s expected service level while also complying with environmental and health and safety requirements.
Performance Measures Target
(a) Ensure that maintenance works are undertaken effectively.
(b) Develop detailed forward works programs.
(c) Compliance
• Review and monitor the inspection system to better target maintenance works to areas required.
• Review and monitor maintenance procedures to ensure effective practices are utilised.
• Review and monitor contractor agreements.
• Collect detailed data, including updated condition data, on all assets.
• Develop and implement waste management capital works programs
• Monitor effectiveness of implemented programs though overall asset condition assessments.
• Implement the Solid Waste Management Strategy within the agreed timeframe.
• Implement the annual Waste Education Program.
• Implement the Regional Landfill Environmental Management Plan.
• Comply with Landfill POEO Act Licence.
• Develop technical standards to assess and prioritise future works.
• Review and update the Waste AMP in line with updated asset data on an annual basis.
(d) Asset Management
• Review and update data from the result of the annual desktop revaluation of the waste portfolio for market/current value.
• Review and update data from the full revaluation of waste portfolio as per the Non-Current Asset Accounting Procedures.
Clarence Valley Council 139
Activities Who When
(a) Ensure that maintenance works are undertaken effectively.
Review and monitor the inspection system to better target maintenance works to areas required.
Review and monitor maintenance procedures to ensure effective practices are utilised.
and monitor contractor agreements.
Activities Who When
(b) Develop detailed forward works programs.
Collect detailed data, including updated condition data, on all assets.
Develop and implement waste management capital works programs.
Monitor effectiveness of implemented programs though overall asset condition assessments.
Asset Management Strategy 2024/2025 to 2033/2034 140
2024 2025 2026 2027 2028 2029 2030 2031 2032 2033
MOS&F
Review
2024 2025 2026 2027 2028 2029 2030 2031 2032 2033
MOS&F and F&ASP
MOS&F
MOS&F
Activities Who When
(c) Compliance
Implement the Solid Waste Management Strategy within the agreed timeframe.
Implement the annual Waste Education Program.
Implement the Regional Landfill Environmental Management Plan.
Comply with Landfill POEO Act Licence.
Activities Who When
(d) Asset Management
Develop technical standards to assess and prioritise future works.
Review and update the Waste AMP in line with updated asset data on an annual basis.
Review and update data from the result of the annual desktop revaluation of the waste portfolio for market/current value.
Review and update data from the full revaluation of the waste portfolio as per the NonCurrent Asset Accounting Procedures.
Clarence Valley Council 141
2024 2025 2026 2027 2028 2029 2030 2031 2032 2033
MOS&F
2024 2025 2026 2027 2028 2029 2030 2031 2032 2033
IP&SAC

Asset Management Strategy 2024/2025 to 2033/2034 142
Stormwater
Key Data


Clarence Valley Council 143


Last Condition Survey • Valuation dated – March 2018, desktop valuation by APV Condition assessment undertaken by Clarence Valley Council
Asset Management Strategy 2024/2025 to 2033/2034 144
6.6% 23.6% 69.8% 0.0%
Poor Fair Good Not Rated
Stormwater
Develop/document inspection maintenance process/procedure, inc. inspection forms - Commence an inspection program to enable the prioritisation of
Commence an inspection program to assess its condition and enable the prioritisation of renewal/maintenance work
- Prioritise identified/requested drainage upgrades for future funding programs. - Allocate capital upgrades to existing systems where overflows occur most frequently and with the most impact
- Commence a proactive maintenance/renewal program. - Prioritise any identified maintenance and/or renewal work - Allocate capital upgrades to existing systems where overflows occur most frequently and with the most impact
Clarence Valley Council 145 General Assessment of Condition Condition Rating % of Asset Value 1 Excellent condition 14 8 2 Good condition 55 1 3 Moderate condition 23 6 4 Poor condition 3.3 5 Very poor condition 3.3 Critical Risks & Risk Management Detail the critical risks and risk management approach taken. Service or Asset at Risk What Can Happen Risk Rating (VH, H) Risk Treatment Plan Residual Risk * Stormwater Infrastructur e Failure to inspect assets occurs L -
renewal/maintenance work L Stormwater Infrastructur e Failure to inspect Assets occurs M Engage consultants to inspect the network L Stormwater Infrastructur e Stormwater
M
L Stormwater
e
M
L Stormwater Infrastructur e Drainage
H
L Stormwater Infrastructur e Assets
their usable M
L
asset collapses
Infrastructur
Drainage overflows causing localised flooding
overflows causing localised flooding
reach the end of
- Review asset group useful lives.
sea levels & changes to weather patterns impacting on the capacity of the
Review inspection and maintenance recording procedures, and provide training where required
Main Findings
Note * The residual risk is the risk remaining after the selected risk treatment plan is operational.
• Floods have had an impact on the condition of some of the stormwater network, with pipes becoming separated and disjointed. It is possible that there are sections of pipeline where this has occurred, but which have not yet appeared as a defect on the surface.
• A program to inspect critical sections of the stormwater network through CCTV inspection on an ongoing basis will be implemented to better determine the structural integrity and functioning of the network.
• The general focus will be on managing condition 4 and 5 stormwater segments and maintaining stormwater segments at condition 3 and above.
• The Council maintains 7,066 pipe and box culverts.
• Most of the pipe culverts have been constructed using butt-jointed pipes. Many of these culverts have separated and become disjointed, causing them to not operate correctly and raising concerns over their structural integrity.
• Culvert inspections also identified that many of the culverts, including inlets and outlets, are at least partially blocked, causing them to operate inefficiently.
• The major emphasis is to increase maintenance levels in the following areas:
o Culvert maintenance, clearing culverts on a regular cycle
o Replacing culverts where pipes have separated and become disjointed
• The general focus will be on managing condition 4 culverts and maintaining culverts at condition 3 and above.
• The Council maintains 287 km of kerbs and gutters and 272 km of open drains.
• As part of the assessment, no allowance has been made for the construction of new kerbs and gutters that are not associated with provision of new stormwater drainage. Construction of new kerbs and gutters in this situation will be included in the costs associated with the provision of the stormwater drainage.
Asset Management Strategy 2024/2025 to 2033/2034 146 General Assessment of Condition Condition Rating % of Asset Value 1 Excellent condition 14 8 2 Good condition 55 1 3 Moderate condition 23 6 4 Poor condition 3.3 5 Very poor condition 3.3 life
service/use
Stormwater Infrastructur e Rising
system H Develop a climate change management plan. M Road Culverts Pipe collapse in roadway H Complete culvert audit and commence programmed maintenance on a priority basis L Road Culverts Localised flooding H Complete culvert audit and commence programmed maintenance on a priority basis L
but remain in
-
Budget Implications
Maintenance Programs
• The major emphasis is to increase maintenance levels in the following areas:
o Renewing surface drainage conditions rated 4 or 5 over a 20-year period and not constructing any new kerbs or gutters unless associated with stormwater works.
Additional data is to be gathered on the condition of culverts and other transport assets to better schedule requirements.
• Consideration should be given to the percentage of the Council’s stormwater assets, which are currently in a fair to moderate condition.
• There is a funding shortfall of $989K on average per year over the life of the 10Year Plan for maintenance, operations, renewals and upgrades/new assets, totalling $9.9M for the life of the plan
• Additional grant funding will be sought for programs, especially for capital programs.
• Grant funding where there is no certainty of the grant funding being available has not been included in the assessment.
• Appropriate maintenance programs are implemented to ensure all assets reach their maximum useful life within budgetary constraints.
• The Council is implementing a detailed inspection program to identify and rectify defects, especially those that pose a safety issue, in a timely manner.
Clarence Valley Council 147 General Assessment of Condition Condition Rating % of Asset Value 1 Excellent condition 14 8 2 Good condition 55 1 3 Moderate condition 23 6 4 Poor condition 3.3 5 Very poor condition 3.3
Stormwater
Objective
To manage the stormwater network in a safe and serviceable condition so that the stormwater system operates efficiently under normal rainfall conditions.
Performance Measures Target
(a) Ensure that maintenance works are undertaken effectively.
(b) Develop detailed forward works programs.
• Review and monitor the inspection system to better target maintenance works to areas required.
• Review and monitor maintenance procedures to ensure effective practices are utilised.
• Implement upgraded maintenance programs.
• Collect detailed data, including updated condition data, on all assets.
• Prepare detailed maintenance works programs.
• Monitor effectiveness of implemented programs though overall asset condition assessments.
• Seek additional sources of funding for capital works.
• Develop technical standards to assess and prioritise future works (e.g., standards to assess risk-based replacement programs).
(c) Asset Management
• Review and update the Stormwater AMP in line with updated asset data on an annual basis.
• Review and update data from the result of the annual desktop revaluation of stormwater assets for current value
• Review and update data from the full revaluation of stormwater assets as per the Non-Current Asset Accounting Procedures.
Activities Who When
(a) Ensure that maintenance works are undertaken effectively.
Review and monitor the inspection system to better target maintenance works to areas required.
Review and monitor maintenance procedures to ensure effective practices are utilised.
Implement upgraded maintenance programs.
Asset Management Strategy 2024/2025 to 2033/2034 148
2024 2025 2026 2027 2028 2029 2030 2031 2032 2033
MCS
Activities Who When
(b) Develop detailed forward works programs.
Collect detailed data, including updated condition data, on all assets.
Prepare detailed maintenance works programs.
Monitor effectiveness of implemented programs though overall asset condition assessments.
Seek additional sources of funding for capital works.
& F&A SP
Activities Who When
(c) Asset Management
Develop technical standards to assess and prioritise future works.
Review and update the Stormwater AMP in line with updated asset data on an annual basis.
Review and update data from the result of the annual desktop revaluation of stormwater assets for current value.
Review and update data from the full revaluation of stormwater assets as per the NonCurrent Asset Accounting Procedures.
Clarence Valley Council 149
2024 2025 2026 2027 2028 2029 2030 2031 2032 2033
MCS
MCS
MCS
MCS
2024 2025 2026 2027 2028 2029 2030 2031 2032 2033
IP&SA C
Holiday Parks

Asset Management Strategy 2024/2025 to 2033/2034 150
Key Data


Clarence Valley Council 151
Last Condition Survey


• Valuation dated – March 2018, desktop valuation by APV
• Condition assessment undertaken by Clarence Valley Council
Asset Management Strategy 2024/2025 to 2033/2034 152
2.9% 58.6% 38.5%
Holiday Parks
Poor Fair Good
Main Findings
Continue to improve data. Maintenance is managed appropriately at an operational level.
Future planning improvements can be made by documented service level risks and utilisation of these in establishing future maintenance priorities.
Note * The residual risk is the risk remaining after the selected risk treatment plan is operational.
• Holiday parks managed by the Council are:
o Calypso Holiday Park Yamba
o Iluka Riverside Holiday Park Iluka
o Brooms Head Holiday Park
o Minnie Water Holiday Park
o Wooli Holiday Park
• Staged redevelopment of Calypso Holiday Park and Brooms Head Holiday Park is guided by a business development strategy.
• Update the business development strategy and development plans for Wooli and Minnie Water Holiday Parks.
Clarence Valley Council 153 General Assessment of Condition Condition Rating % of Asset Value 1 Very good condition 3.2 2 Good condition 35.4 3 Fair or moderate condition 58.6 4 Poor condition 2.0 5 Very poor condition 0.8 Critical Risks & Risk Management Detail the critical risks and risk management approach taken. Service or Asset at Risk What Can Happen Risk Rating (VH, H) Risk Treatment Plan Residu al Risk * Holiday Parks The loss of appointment as Crown Land Manager H
M Holiday Parks
higher-risk situation M
Financial management of Crown Land in accordance with Division 3.4 of the Crown Land Management Act 2016
Assets deteriorate to a lesser service standard, and there is a
L
Budget Implications
Maintenance Programs
Holiday Parks
Objective
• Consideration should be given to the percentage of the Council’s holiday park assets, which are currently in a fair or moderate condition.
• There is a funding shortfall of $323K on average per year over the life of the 10Year Plan for maintenance, operations, renewals and upgrades/new assets, totalling $3.23M for the life of the plan
• Funding for holiday parks is sourced from the CCRT6 Fund, not the Council’s general fund.
• A fair or moderate condition may not be sufficient in a competitive environment for certain assets such as amenities; cabins may be required to be maintained in a good to very good condition.
• Appropriate maintenance programs are implemented to ensure all assets reach their maximum useful life within budgetary constraints.
• Maintain a cabin refurbishment program.
To operate the caravan parks in a sustainable manner while returning an adequate return on investment by offering customers a high-quality holiday experience.
Performance Measures Target
(a) Ensure that maintenance works are undertaken effectively.
(b) Develop detailed forward works programs.
(c) Sustainable Operation
• Review and monitor the inspection system to better target maintenance works to areas required
• Review and monitor maintenance procedures to ensure effective practices are utilised.
• Maintain assets to meet customer expectations.
• Collect detailed data, including updated condition data, on all assets.
• Prepare detailed maintenance, renewal and new/upgraded works programs and safety issues aligned to available budgets.
• Monitor effectiveness of implemented programs.
• Oversee the professional management of caravan parks through regular contract reviews.
• Develop and implement Business Development Strategy for all holiday parks.
• Develop and implement an effective marketing strategy for all holiday parks.
• Review and set pricing appropriate to the target market.
• Develop technical standards to assess and prioritise future works.
• Review and update the Holiday Parks AMP in line with updated asset data on an annual basis.
(d) Asset Management
• Review and update data from the result of the annual desktop revaluation of the holiday parks portfolio for market/current value.
• Review and update data from the full revaluation of the holiday parks portfolio as per the Non-Current Asset Accounting Procedures.
Asset Management Strategy 2024/2025 to 2033/2034 154
6
Reserve Trust
Clarence Coast
Activities Who When
(a) Ensure that maintenance works are undertaken effectively.
Review and monitor the inspection system to better target maintenance works to areas required.
Review and monitor maintenance procedures to ensure effective practices are utilised.
Maintain assets to meet customer expectations.
Activities Who When
(b) Develop detailed forward works programs.
Collect detailed data, including updated condition data, on all assets.
Prepare detailed maintenance, renewal and new/upgraded works programs and safety issues aligned to available budgets.
Monitor effectiveness of implemented programs.
and F&ASP
Activities Who When
Oversee
Clarence Valley Council 155
2024 2025 2026 2027 2028 2029 2030 2031 2032 2033
MOS&F
2024 2025 2026 2027 2028 2029 2030 2031 2032 2033
MOS&F
MOS&F
MOS&F
(c) Sustainable Operation 202 4 202 5 202 6 202 7 202 8 202 9 203 0 203 1 203 2 203 3
the professional MOS& F
Activities
managemen t of caravan parks through regular contract reviews.
Develop and implement a business developmen t strategy for all holiday parks.
Develop and implement an effective marketing strategy for all holiday parks.
Review and set pricing appropriate to the target market.
Who When
Activities Who When
(d) Asset Management
Develop technical standards to assess and prioritise future works.
Review and update the Holiday Parks AMP in line with updated asset data on an annual basis.
Review and update data from the result of the annual desktop revaluation of the holiday parks portfolio for market/current value.
Review and update data from the full revaluation of the holiday parks portfolio as per the Non-Current Asset Accounting Procedures
Asset Management Strategy 2024/2025 to 2033/2034 156
2024 2025 2026 2027 2028 2029 2030 2031 2032 2033
F&AS P
Clarence Valley Council 157
Saleyards

Asset Management Strategy 2024/2025 to 2033/2034 158
Key Data


Clarence Valley Council 159
Last Condition Survey
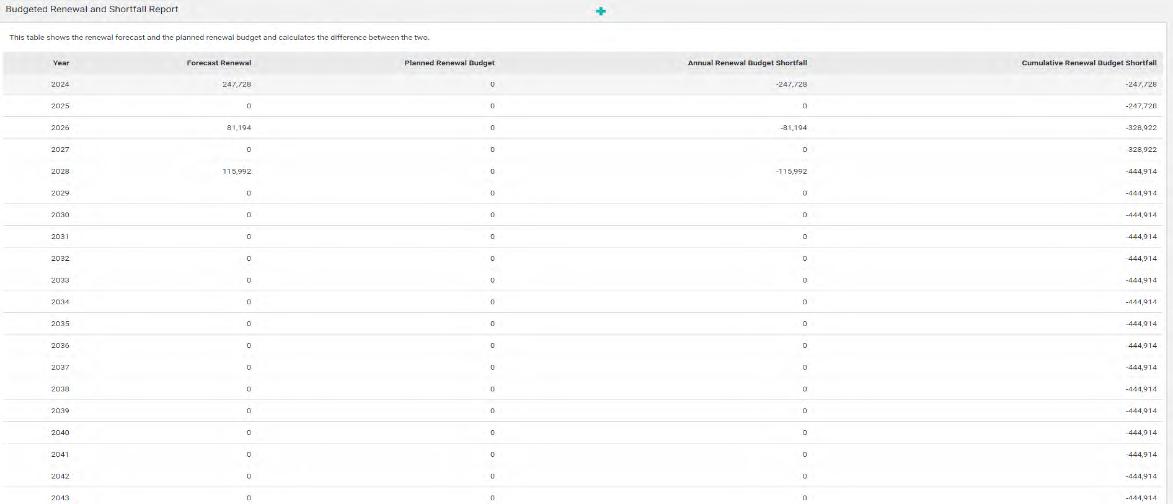
• Valuation dated – March 2018, desktop valuation by APV
• Condition assessment undertaken by Clarence Valley Council
Asset Management Strategy 2024/2025 to 2033/2034 160
General Assessment of Condition Condition Rating % of Asset Value 1 Very good condition 12 2 2 Good condition 6.9 3 Fair or moderate condition 73 9 4 Poor condition 5 7 5 Very poor condition 1 3 Critical Risks & Risk Management Detail the critical risks
risk management approach taken. 7.0% 73.9% 19.1%
Poor Fair Good
and
Saleyards
appropriately at an operational level
planning improvements can be made by documented service level risks and utilisation of these in establishing future maintenance priorities
Main Findings
Note * The residual risk is the risk remaining after the selected risk treatment plan is operational.
• The saleyards are operated by a 355 Committee.
• Overall, yard pens are in moderate to good condition.
• Other structures’ data is unreliable, especially for the treatment plant.
Clarence Valley Council 161 General Assessment of Condition Condition Rating % of Asset Value 1 Very good condition 12 2 2 Good condition 6.9 3 Fair or moderate condition 73 9 4 Poor condition 5.7 5 Very poor condition 1 3 Service or Asset at Risk What Can Happen Risk Rating (VH, H) Risk Treatment Plan Residual Risk * Saleyards There is competition
saleyards
neighbouring local government areas M Monitor other saleyards within the region L Saleyards Fluctuations
H Carefully manage operating
years Seek out
uses/opportunities L Saleyards Assets
M Continue to improve data Maintenance
M Saleyards Regulations and legislation are not complied with M Ensure funding is available for upgrades Implement saleyard management plans L Saleyard Operation s Saleyard income makes the continued operation unsustainable H Work with stakeholders to promote saleyards Improve sale
facilities
to be sustainable) M Loading Ramps Loading ramps do not allow enough separation between workers and animals H Ensure funding is available for upgrades L Treatmen t Ponds Treatment ponds fail to comply with EPA H Fund upgrade to ponds and the treatment plant L
from
in
in market forces –number of head, cents/kilogram impact on operations
costs during lean
alternate
deteriorate to a lesser service standard, and there is a higher-risk situation
is managed
Future
ring
(~45,000 head
Budget Implications
• Major expenditure is required on:
o Renewal and upgrade of the ramps used for loading and unloading of cattle to modern standards.
o An upgrade to the treatment plant.
o Improve customer facilities by providing weather protection for the sale ring.
o Funding for major improvements was secured in 2020–21, and construction will commence in the last quarter.
• Consideration should be given to the percentage of the Council’s saleyard assets, which are currently in a fair to moderate condition.
• There is a funding shortfall of $46K on average per year over the life of the 10Year Plan for maintenance, operations, renewals and upgrades/new assets, totalling $4.6m for the life of the plan.
• The condition profile will change when other structures’ reviews are completed.
• The major future expenditure budget for the effluent management system will be required.
• Appropriate maintenance programs are implemented to ensure all assets reach their maximum useful life within budgetary constraints.
Maintenance Programs
• Develop and/or review asset inspection programs for the saleyards
• Ensure appropriate maintenance programs are implemented to ensure assets reach end-of-useful life.
Asset Management Strategy 2024/2025 to 2033/2034 162 General Assessment of Condition Condition Rating % of Asset Value 1 Very good condition 12 2 2 Good condition 6.9 3 Fair or moderate condition 73 9 4 Poor condition 5.7 5 Very poor condition 1 3
Saleyards
Objective
To continue providing a livestock marketing facility for the agricultural industry in the Clarence Valley and surrounding area.
Performance Measures Target
(a) Ensure that maintenance works are undertaken effectively.
(b) Develop detailed forward works programs.
(c) Sustainable Operation
• Review and monitor the inspection system to better target maintenance works to areas required.
• Review and monitor maintenance procedures to ensure effective practices are utilised.
• Collect detailed data, including updated condition data, on all assets.
• Develop and implement saleyard management capital works programs
• Monitor the effectiveness of implemented programs though overall asset condition assessments.
• Develop and review a business plan for saleyards.
• Seek opportunities to promote saleyards.
• Coordinate WHS with yard users through the Saleyards Advisory Committee.
• Develop technical standards to assess and prioritise future works.
• Review and update the Saleyards AMP in line with updated asset data on an annual basis.
(d) Asset Management
• Review and update data from the result of the annual desktop revaluation of saleyard assets for market/current value.
• Review and update data from the full revaluation of the saleyard portfolio as per the Non-Current Asset Accounting Procedures.
Activities Who When
Clarence Valley Council 163
Ensure that maintenance works are undertaken effectively. 2024 2025 2026 2027 2028 2029 2030 2031 2032 2033 Review and monitor the inspection system to better target maintenance works to areas required. MOS&F Review and monitor maintenance procedures to ensure effective practices are utilised.
(a)
(b) Develop detailed forward works programs.
Collect detailed data, including updated condition data, on all assets.
Develop and implement waste management capital works programs.
Monitor the effectiveness of implemented programs though overall asset condition assessments.
and F&ASP
(c) Sustainable Operation
Develop and review a business plan for saleyards.
Seek opportunities to promote saleyards.
Coordinate WHS with yard users through the Saleyards Advisory Committee.
(d) Asset Management
Develop technical standards to assess and prioritise future works.
Review and update the Saleyards AMP in line with updated asset data on an annual basis.
Review and update data from the
Asset Management Strategy 2024/2025 to 2033/2034 164 Activities Who When
2024 2025 2026 2027 2028 2029 2030 2031 2032 2033
MOS&F
MOS&F
MOS&F Activities Who When
2024 2025 2026 2027 2028 2029 2030 2031 2032 2033
MOS&F
Activities Who When
2024 2025 2026 2027 2028 2029 2030 2031 2032 2033
F&ASP
Activities Who When result of the annual desktop revaluation of saleyard assets for market/current value.
Review and update data from the full revaluation of the saleyard portfolio as per the NonCurrent Asset Accounting Procedures.
Clarence Valley Council 165

Asset Management Strategy 2024/2025 to 2033/2034 166 Floodplain
Key Data


Clarence Valley Council 167
Last Condition Survey


• Valuation dated – March 2018, desktop valuation by APV
• Condition assessment undertaken by Clarence Valley Council
Asset Management Strategy 2024/2025 to 2033/2034 168
1.4% 36.6% 62.1%
Floodplain
Poor Fair Good
Clarence Valley Council 169 General Assessment of Condition Condition Rating % of Asset Value 1 Very good condition 3.3 2 Good condition 58 8 3 Moderate condition 36 6 4 Poor condition 0.7 5 Very poor condition 0.6 Critical Risks & Risk Management Detail the critical risks and risk management approach taken. Service or Asset at Risk What Can Happen Risk Rating (VH, H) Risk Treatment Plan Residual Risk * Levees The levee wall fails H Regular maintenance program Four-yearly condition assessment programs Public works inspections L Floodplain Infrastructure Infrastructure is damaged/ destroyed H Floodplain infrastructure inspected after events to assess damage. M Floodplain Infrastructure Floodplain assets fail due to ageing infrastructure M Regular inspections program M Floodplain Infrastructure Rising sea levels & changes to weather patterns impacting on the capacity of the system. M Develop Climate Change Management Plan M Floodplain Infrastructure Assets reach the end of their usable life but remain in service/use. M Review asset group useful lives M Floodplain Infrastructure Failure to inspect occurs H Develop/document inspection maintenance process/procedure, inc. inspection forms. Commence an inspection program to enable the prioritisation of renewal/maintenance work. L Floodplain Infrastructure Inspection and maintenance are not recorded M Implement the inspection process/procedure Train inspectors on the process/procedure L
Main Findings
Note * The residual risk is the risk remaining after the selected risk treatment plan is operational.
• The Council maintains the following major floodplain assets:
o Levees
o Open drains
o Culvert assets
o Floodgates
o Bridges
o Rock protection
o Farm crossings
• Floods have a major impact on the condition of floodplain assets. In general, the restoration cost of these assets has been excluded from the assessment on the basis that the Council will receive natural disaster relief assistance for damage caused by these events. However, damage will occur to assets from repeated flood events that may not be able to be attributed to single events but will cause the increased deterioration of assets over time. The restoration costs of these assets will ultimately be borne by the Council.
• The major emphasis is to increase maintenance levels in the following areas:
o Rural levee maintenance – increased inspection and maintenance on a 4year cycle.
o Drain maintenance – implementation of an increased spraying program over a 4-month-per-annum period plus mechanical cleaning of drains as and where required on a seven-year cycle.
• The general focus will be on managing condition 4 and 5 floodplain assets and maintaining floodplain assets rated at condition 3 and above.
• Additional detailed data is to be gathered on the floodplain network, especially rural levees, to better determine the extent of the condition of the assets and to schedule maintenance and capital works more effectively. This is also to include crest surveys of the levees.
• Consideration should be given to the percentage of the Council’s floodplain assets, which are currently in fair to moderate condition.
• There is a funding shortfall of $10K on average per year over the life of the 10Year Plan for maintenance, operations, renewals and upgrade/new assets, totalling $1M for the life of the plan.
Budget Implications
Maintenance Programs
• Additional grant funding will be sought for programs, especially for capital programs.
• Where there is no certainty of grant funding being available, it has not been included in the assessment. This is particularly relevant with funding from the Office of Environment and Heritage, which has not been
• included in this assessment. This funding is typically received on a 2:1 basis for approved projects. Successful funding applications under this program therefore have the potential to significantly affect the nominated deficit figure.
• Appropriate maintenance programs are implemented to ensure all assets reach their maximum useful life within budgetary constraints.
Asset Management Strategy 2024/2025 to 2033/2034 170 General Assessment of Condition Condition Rating % of Asset Value 1 Very good condition 3.3 2 Good condition 58 8 3 Moderate condition 36 6 4 Poor condition 0.7 5 Very poor condition 0.6
Main Findings
• The Council maintains the following major floodplain assets:
o Levees
o Open drains
o Culvert assets
o Floodgates
o Bridges
o Rock protection
o Farm crossings
• Floods have a major impact on the condition of floodplain assets. In general, the restoration cost of these assets has been excluded from the assessment on the basis that the Council will receive natural disaster relief assistance for damage caused by these events. However, damage will occur to assets from repeated flood events that may not be able to be attributed to single events but will cause the increased deterioration of assets over time. The restoration costs of these assets will ultimately be borne by the Council.
• The major emphasis is to increase maintenance levels in the following areas:
o Rural levee maintenance – increased inspection and maintenance on a 4year cycle.
o Drain maintenance – implementation of an increased spraying program over a 4-month-per-annum period plus mechanical cleaning of drains as and where required on a seven-year cycle.
• The general focus will be on managing condition 4 and 5 floodplain assets and maintaining floodplain assets rated at condition 3 and above.
• Additional detailed data is to be gathered on the floodplain network, especially rural levees, to better determine the extent of the condition of the assets and to schedule maintenance and capital works more effectively. This is also to include crest surveys of the levees.
• The Council is implementing a detailed inspection program to identify and rectify defects, especially those that pose a safety issue, in a timely manner.
Clarence Valley Council 171
Floodplain
Objective
To provide and maintain floodplain assets that afford protection to urban and rural communities and their assets from flood events.
Performance Measures Target
(a) Ensure that maintenance works are undertaken effectively.
(b) Develop detailed forward works programs.
• Review and monitor the inspection system to better target maintenance works to areas required.
• Review and monitor maintenance procedures to ensure effective practices are utilised.
• Implement upgraded maintenance programs.
• Collect detailed data, including updated condition data, on all assets.
• Prepare detailed maintenance works programs.
• Monitor effectiveness of implemented programs though overall asset condition assessments.
• Seek additional sources of funding for capital works.
• Develop technical standards to assess and prioritise future works (e.g., standards to assess risk-based replacement programs).
(c) Asset Management
• Review and update the Floodplain AMP in line with updated asset data on an annual basis.
• Review and update data from the result of the annual desktop revaluation of floodplain assets for market/current value
• Review and update data from the full revaluation of floodplain assets as per the Non-Current Asset Accounting Procedures.
Activities Who When
(a) Ensure that maintenance works are undertaken effectively.
Review and monitor the inspection system to better target maintenance works to areas required.
Review and monitor maintenance procedures to ensure effective practices are utilised.
Implement upgraded maintenance programs.
Asset Management Strategy 2024/2025 to 2033/2034 172
2024 2025 2026 2027 2028 2029 2030 2031 2032 2033
MCS
(b) Develop detailed forward works programs.
Collect detailed data, including updated condition data, on all assets.
Prepare detailed maintenance works programs.
Monitor the effectiveness of implemented programs though overall asset condition assessments.
Seek additional sources of funding for capital works.
(c) Asset Management
Develop technical standards to assess and prioritise future works.
Review and update the Floodplain AMP in line with updated asset data on an annual basis.
Review and update data from the result of the annual desktop revaluation of floodplain assets for market/current value.
Review and update data from the full revaluation of floodplain assets as per the NonCurrent Asset Accounting Procedures.
Clarence Valley Council 173
Activities Who When
2024 2025 2026 2027 2028 2029 2030 2031 2032 2033
MCS
P
& F&AS
MCS
MCS
MCS
Who When
Activities
2024 2025 2026 2027 2028 2029 2030 2031 2032 2033
F&ASP
Swimming Pools

Asset Management Strategy 2024/2025 to 2033/2034 174
Key Data


Clarence Valley Council 175
Last Condition Survey


• Valuation dated – March 2018, Clarence Valley Council
• Condition assessment undertaken by Clarence Valley Council
Swimming Pools
Asset Management Strategy 2024/2025 to 2033/2034 176
4.9% 82.0% 13.1%
Poor Fair Good
Budgets to be allocated to reflect maintenance of ageing infrastructure. Close and consolidate pools as identified in the Aquatic Facilities Strategy. Actively seek grant funding for upgrade/renewal of pool infrastructure
with grant funding where possible
contracts to comply with Practice Note and Standards, WH&S (lifeguards, first aid, etc.).
Clarence Valley Council 177 General Assessment of Condition Condition Rating % of Asset Value 1 Very good condition 9 5 2 Good condition 3 6 3 Fair or moderate condition 82 0 4 Poor condition 0.9 5 Very poor condition 4 0 Critical Risks & Risk Management Detail the critical risks and risk management approach taken. Service or Asset at Risk What Can Happen Risk Rating (VH, H) Risk Treatment Plan Residua l Risk * Aquatic Facilities Water quality is below standard H Staff at pools required to be qualified and skilled to manage water quality.
M Aquatic Facilities Assets fall into disrepair H Annual inspection schedule
M Aquatic Facilities There is poor accessibility to some pools and amenities M Continue to
L Aquatic Facilities Unable to meet Royal Life Saving standards, regulations, and legislative requirements M Implement
L Grafton Pool Water loss M Investigate the rate of water loss to determine possible cause. Budget for replacement of joint seals L South Grafton Pool Buildings and amenities will continue to deteriorate H Improve ventilation of the facility L Yamba Pool Water loss M Investigate the rate of water loss to determine possible cause L
Engage contractor to repair
improve accessibility
pool
Main Findings
Pool
may not meet required standards
Grafton Pool Dive tower regulations change, preventing recreational use
for replacement of joint
and liaise with RLSSA
Budget Implications
Maintenance Programs
Note * The residual risk is the risk remaining after the selected risk treatment plan is operational.
• The Swimming Pools network comprises of 5 community pool complexes:
o Maclean Olympic Swimming Pool
o Grafton Olympic Pool
o South Grafton Indoor Pool and Boyd–Nattress Complex
o Yamba Community Heated Pool
o Glenreagh Swimming Pool
• Even though 65% are in good condition, all the facilities are quite old.
• Quite a number have major leaks.
• Consideration should be given to the percentage of the Council’s swimming pool assets, which are currently in fair to moderate condition.
• Over a 10-year period, there is an average funding shortfall of $87K for maintenance, operations, renewals, upgrades and new projects at existing pools, totalling $8.7m for the life of the plan.
• Appropriate maintenance programs are implemented to ensure all assets reach their maximum useful life within budgetary constraints.
• Pool contractors are required to carry out maintenance as scheduled.
Asset Management Strategy 2024/2025 to 2033/2034 178 General Assessment of Condition Condition Rating % of Asset Value 1 Very good condition 9 5 2 Good condition 3 6 3 Fair or moderate condition 82 0 4 Poor condition 0.9 5 Very poor condition 4 0 Budget
seals Yamba Pool Site contamination of chemical H Replace/upgrade bunding. L Maclean Pool Accessible access cannot be provided H Continue to improve accessibility
possible L
H Continue to
H
H Monitor industry standards
H Maclean Pool Old asbestos pipes rupture under pressure H Test pipe condition M Grafton Pool Filtration system failure H Monitor equipment and address issues in masterplan M
with grant funding where
Grafton
Waterslide
get annual inspections
Swimming Pools
Objective
Provide high-quality sport and recreation facilities and encourage participation. Ensure access and equity of services to all our residents and maintain infrastructure in an efficient and effective manner.
Performance Measures Target
(a) Ensure that maintenance works are undertaken effectively.
(b) Develop detailed forward works programs.
(c) Ensure good governance and administrative support for the Council and organisation.
(d) Asset Management
• Review and monitor the inspection system to better target maintenance works to areas required.
• Review and monitor maintenance procedures to ensure effective practices are utilised.
• Collect detailed data, including updated condition data, on all assets.
• Prepare detailed maintenance, renewal and new/upgraded works programs targeting condition 4 and 5 assets and safety issues aligned to available budgets.
• Monitor effectiveness of implemented programs by changes in the overall swimming pools asset condition assessments.
• Seek additional sources of funding for capital works.
• Review and implement the Aquatic Facilities Strategy.
• Continue to review fee structure and implement any changes.
• Review and monitor contractor agreements.
• Develop technical standards to assess and prioritise future works.
• Review and update the Swimming Pools AMP in line with updated asset data on an annual basis.
• Review and update data from the result of the annual desktop revaluation of the swimming pools portfolio for market/current value.
• Review and update data from the full revaluation of the swimming pools portfolio as per the Non-Current Asset Accounting Procedures.
Activities Who When
(a) Ensure that maintenance works are undertaken effectively.
Review and monitor the inspection system to better target maintenance works to areas required.
maintenance procedures to ensure effective practices are utilised.
Clarence Valley Council 179
2024 2025 2026 2027 2028 2029 2030 2031 2032 2033
MOS&F Review and monitor
Activities Who When
(b) Develop detailed forward works programs.
Collect detailed data, including updated condition data, on all assets.
Prepare detailed maintenance, renewal and new/upgraded works programs targeting condition 4 and 5 assets and safety issues aligned to available budgets.
Monitor the effectiveness of implemented programs though overall swimming pool asset condition assessments.
and F&AS P
Activities Who When
(c) Ensure good governance and administrative support for the Council and organisation.
Review and implement the Aquatic Facilities Strategy.
Continue to review fee structure and implement any changes.
Review and monitor contractor agreements.
Asset Management Strategy 2024/2025 to 2033/2034 180
2024 2025 2026 2027 2028 2029 2030 2031 2032 2033
MOS&F
MOS&F
MOS&F
2024 2025 2026 2027 2028 2029 2030 2031 2032 2033
MOS&F
Activities Who When
(d) Asset Management
Develop technical standards to assess and prioritise future works.
Review and update the Swimming Pool AMP in line with updated asset data on an annual basis.
Review and update data from the result of the annual desktop revaluation of the swimming pool portfolio for market/current value.
Review and update data from the full revaluation of the swimming pool portfolio as per the Non-Current Asset Accounting Procedures.
Clarence Valley Council 181
2024 2025 2026 2027 2028 2029 2030 2031 2032 2033
F& A S P
Airports

Asset Management Strategy 2024/2025 to 2033/2034 182
Key Data


Clarence Valley Council 183
Last Condition Survey


• Valuation dated – March 2018, desktop valuation by APV
• Condition assessment undertaken by Clarence Valley Council
Airports
Asset Management Strategy 2024/2025 to 2033/2034 184
0.0% 72.5% 27.5%
Poor
Fair Good
Main Findings
Note
• The Council maintains the following major airport assets:
o Buildings
Terminal
o Airport structures
Runway
Apron
o Fencing
o Utilities
Lighting
Water tanks
o Other structures
Internal roads
Car parks
Clarence Valley Council 185 General Assessment of Condition Condition Rating % of Asset Value 1 Very good condition 3 1 2 Good condition 24 4 3 Fair or moderate condition 72 5 4 Poor condition 0.0 5 Very poor condition 0.0 Critical Risks & Risk Management Detail the critical risks and risk management approach taken. Service or Asset at Risk What Can Happen Risk Rating (VH, H) Risk Treatment Plan Residual Risk * Regional Airport Failure of the runway M Significant pavement strengthening and asphalt sealing L Regional Airport –Terminal Building not fully utilised M Seek alternate service providers when necessary. Make passengers as comfortable as possible. L Regional Airport Airline discontinues service and usage of airport M Seek alternate service providers when necessary. L Regional Airport Federal security measures imposed M Review and prioritise security measures imposed.
L Regional Airport –Terminal Customers
airport,
airport usage. H Investigate complaints and determine whether changes need to be made to ensure patronage continues. M
Apply for available funding.
have a bad experience of the
which may impact
selected risk treatment
* The residual risk is the risk remaining after the
plan is operational.
Budget Implications
Maintenance
Programs
• The Council has undertaken significant renewal and upgrade works in recent years, including strengthening and sealing the runway, extending the apron, upgrading the terminal, replacing the runway and apron lighting, replacing the perimeter electric fence, and replacing the generator.
• The general focus will be on managing condition 4 assets and maintaining assets at condition 3 and above.
• Consideration should be given to the percentage of the Council’s airport assets, which are currently in fair or moderate condition.
• There is a balanced budget over the life of the 10-Year Plan for maintenance, operations, renewals, and upgrades/new assets.
• Additional grant funding will be sought for programs, especially for capital programs.
• Appropriate maintenance programs are implemented to ensure all assets reach their maximum useful life within budgetary constraints.
• The Council has a detailed inspection program to identify and rectify defects, especially those that pose a safety issue to aircraft, in a timely manner.
Asset Management Strategy 2024/2025 to 2033/2034 186 General Assessment of Condition Condition Rating % of Asset Value 1 Very good condition 3 1 2 Good condition 24 4 3 Fair or moderate condition 72 5 4 Poor condition 0.0 5 Very poor condition 0.0
Airports
Objective
To provide safe and serviceable regional airport services to the Clarence Valley area, which continually meets and exceeds the CASA operational requirements.
Performance Measures Target
(a) Ensure that maintenance works are undertaken effectively.
(b) Develop detailed forward works programs.
• Review and monitor the inspection system to better target maintenance works to areas required.
• Review and monitor maintenance procedures to ensure effective practices are utilised.
• Implement upgraded maintenance programs.
• Collect detailed data, including updated condition data, on all assets.
• Prepare detailed maintenance works programs.
• Monitor the effectiveness of implemented programs though overall asset condition assessments.
• Seek additional sources of funding for capital works.
• Develop technical standards to assess and prioritise future works (e.g., standards to assess risk-based replacement programs).
(c) Asset Management
• Review and update the Airport AMP in line with updated asset data on an annual basis.
• Review and update data from the result of the annual desktop revaluation of airport assets for market/current value
• Review and update data from the full revaluation of airport assets as per the NonCurrent Asset Accounting Procedures.
Clarence Valley Council 187
(a) Ensure that maintenance works are undertaken effectively.
Review and monitor the inspection system to better target maintenance works to areas required.
Review and monitor maintenance procedures to ensure effective practices are utilised.
Implement upgraded maintenance programs.
Activities Who When
(b) Develop detailed forward works programs.
Collect detailed data, including updated condition data, on all assets.
Prepare detailed maintenance works programs.
Monitor the effectiveness of implemented programs though overall asset condition assessments.
Seek additional sources of funding for capital works.
Asset Management Strategy 2024/2025 to 2033/2034 188
Activities Who When
2024 2025 2026 2027 2028 2029 2030 2031 2032 2033
MCS
2024 2025 2026 2027 2028 2029 2030 2031 2032 2033
MCS & F&AS P 7
MCS
MCS
MCS 7 Infrastructure Planning & Strategic Asset Coordinator
Activities Who When
(c) Asset Management
Develop technical standards to assess and prioritise future works.
Review and update the Airport AMP in line with updated asset data on an annual basis.
Review and update data from the result of the annual desktop revaluation of airport assets for market/current value.
Review and update data from the full revaluation of airport assets as per the NonCurrent Asset Accounting Procedures.
Clarence Valley Council 189
2024 2025 2026 2027 2028 2029 2030 2031 2032 2033
F&ASP
The Path Forward
Objectives
Clarence Valley Council Community Strategic Plan – The Clarence 2032 outlines the following objectives to be achieved through the effective management of the Council’s assets:

Society
Society # Objective
S1 To be part of a proud and inviting community with opportunities to connect and belong.
S2 A community that supports, encourages and celebrates the rich cultural heritage of the Gumbaynggir, Bundjalung and Yaegl people and provides space for active community participation and strong relationships with local Traditional Owners.
S3 A safe and active community where healthy lifestyles and better health outcomes are encouraged and supported with accessible infrastructure for residents of all ages and abilities.
S4 A community in which cultural assets and public art is valued and plays a role in celebrating local arts as well as bringing innovative opportunities to the Valley.
S5 An inclusive community where diversity is respected and Clarence Valley residents, regardless of age or ability, have equal access to quality services, events and opportunities.
S6 Affordable housing and living standards with health, education and employment opportunities that support a resilient community. A community supportive of its young people and their safety, growth and development.
S7 Preservation of the heritage and historic buildings of the area.

I1 A safely maintained transport (road and bridge) network.
I2 Footpaths and cycleways that are interconnected, functional, well maintained and which reach destinations.
I3 Communities that are well serviced with essential infrastructure (including transport services, water and sewage systems and public amenities).
Asset Management Strategy 2024/2025 to 2033/2034 190
Infrastructure Infrastructure Objective
I4 Forward planning for modern, accessible infrastructure upgrades and renewals.
I5 Well-maintained facilities and amenities that serve the needs of a growing residential population and visitors to the area.
I6 Beautification of towns and villages to improve amenities and pride of place.
I7 Passive and active recreational infrastructure that is well planned and well maintained.
I8 Mobile and fixed infrastructure that supports a connected community.
I9 Disaster mitigation planning to reduce the impact of natural disasters on infrastructure.

Economy
Economy Objective
Ec1 An affordable and attractive environment for local business to flourish.
Ec2 Sustainable tourism that benefits the whole of the local government area, without burdening the coast further.
Ec3 Support for the sustainable growth of local industries that are respectful of people’s lifestyles
Ec4 Dispersed and sustainable development ensuring connections to services.
Ec5 Diversification of employment and education, which provide opportunity for young people and families to stay in the area.
Ec6 Major events that drive economic activity in the region and make it a more attractive place for people to live, work and visit.
Ec7 Support for community and business-led innovation that creates a diverse and vibrant community.
Ec8 Adequate telecommunications to service economic growth.
Clarence Valley Council 191

Environment
Environment Objective
E1 To protect and enhance our natural environments, ecosystems, and native flora and fauna.
E2 Encourage sustainable and innovative agricultural processes that preserve what we have.
E3 Promotion of sustainable development that integrates with the environment.
E4 Action that maintains the health of our coastline, waterways and natural environment.
E5 Promotion of sustainable business practices to reduce our region’s ecological footprint.
E6 A community that follows the three Rs of waste: reuse, recycle and reduce.
E7 Celebration and promotion of the diverse natural beauty of the area.
E8 Enhanced maintenance of green space in a way that encourages responsible use.
E9 Opportunities for equal access to enjoy the outdoors.
E10 A community that does not support detrimental mining activities.

Leadership
Leadership Objective
L1 A strong, accountable and representative government that engages broadly with the community in a genuine, respectful and meaningful way.
L2 Representation and advocacy where it counts.
L3 An effective and efficient organisation that operates in a financially responsible and sustainable manner
L4 A high standard of customer service to the community.
L5 An accessible local government with improved responsiveness and transparency in its actions.
L6 Decision-making that is informed by diverse views and broad representation.
L7 A strong relationship between all levels of government and community partnerships to deliver outcomes that benefit residents.
Asset Management Strategy 2024/2025 to 2033/2034 192
Critical Assets
In any asset category, the seriousness of risks associated with those assets can vary, making some assets more critical than others. Critical assets are defined as those that have a high consequence of failure if they do not meet their required level of service, as distinct from those not necessarily having a high probability of failure.
Consequences of critical asset failure typically include impacts on customers, operational impacts, safety impacts and possible environmental impacts. Assets nearing the end of their useful life also pose a risk to the Council to be able to continue the service provided for by those assets.
Infrastructure assets critical to the Council’s service provision include utility networks and services such as water and sewer supply, together with the transport road network. These assets are critical in nature due to the risks associated with the possibility of failure and consequences on service provision to the community. The Council has in place a Business Continuity Policy and individual plans to ensure that in the event of disruption to the Council’s critical services to the community, a strategy is in place to provide for the reinstatement of those services as soon as possible to minimise any disruption to the community.
Risk Management
The individual AMPs have identified risks by considering the following issues:
Risks that may delay, reduce, or prevent service delivery.
• Natural disasters
• External impacts
• Physical failure
• Operational issues
The consequences of asset failure can have implications on the economic, social, environmental and governance areas of the Council, as addressed in the Council’s risk management plan. Those risks identified as ‘catastrophic’ are required to have a risk treatment plan developed to manage the risks associated with that particular asset.
Risks assessed as ‘very high’ or ‘critical’ require prioritised corrective action, and these are detailed in the AMP summaries and collated in Appendix 3.
Clarence Valley Council 193
Where Do We Want to Be?
To have a strong future, the Council needs to demonstrate to its community that it is financially sound, operating efficiently and in a strong position to grow and deliver quality services into the future. This requires the Council to be:
• Sustainable
• Efficient
• Effective in managing infrastructure and delivering services for communities.
• Capable of having the scale and capacity to engage effectively across community, industry and government.
CVC undertook a service review in 2014, which ensured linkages of service provision to assets and resulted in the rationalisation of some assets. An asset management improvement plan was developed from this and past asset management strategies to guide the Council from its then current situation through to the desired situation of sustainability and best practice asset management. The Asset Management Improvement Plan is a living document, meaning it will be updated and changed over time. Refer to Appendix 2
The continual development and enhancement of the Council’s asset management system is an essential part of achieving a sustainable and responsible organisation. As this system develops, so will the accuracy and reliability of the data, enabling improved confidence in associated strategic decision-making. An effective and beneficial asset management system is a continual improvement process, which is a ‘work in progress’ requiring assessment and development for the betterment of the organisation and the community (SOAP – Strategic Organisational Action Plan), reporting and monitoring.
Performance reporting will be undertaken by the Council’s Asset Management Advisory Group, which will strategically guide and oversee asset life cycle management for the Council, ensuring that strategic, financial and operational goals relating to asset management are achieved. This will include a review of the initial findings from the asset management planning process and monitoring and reporting on the achievement of the outcomes in the individual AMPs
The Asset Management Advisory Group currently includes:
• Manager, Civil Services
• Manager, Strategic Infrastructure
• Manager, Open Spaces & Facilities
• Manager, Water Cycle
• Manager, Finance and Systems
• Coordinator of Corporate Systems
• Finance & Asset Strategy Planner
• Infrastructure Asset Planning Supervisor
The members of the group will change over time in line with organisational structure changes and requirements as the Council moves from core to advanced asset management.
It is critical that the Review Group ensures that the Strategic AMPs reflect the operational activities of the Council.
Asset Management Strategy 2024/2025 to 2033/2034 194
Appendices
Appendix 1 – Asset Management Policy
Infrastructure Asset Management
Responsible Manager (Title) Finance & Asset Strategy Planner
Adopted by the Council Date
Minute Number
Community Plan Linkage
5 Leadership
5.1 We will have a strong, accountable and representative government
5.1.6 Ensures decisions reflect the long-term interests of the community and support financial and infrastructural sustainability
Purpose
To set guidelines for implementing consistent asset management processes throughout Clarence Valley Council and that the Council’s asset management system provides a framework within which:
• Infrastructure is reliable and delivered at an agreed level of service that the community has both the capacity – and is prepared – to pay for
• Ensure assets remain at a satisfactory standard and condition by implementing appropriate asset management strategies and financial treatment of those assets.
• Appropriate risk management and mitigation options for all high-risk critical assets are applied.
• An environment is created that appropriately apportions resources and responsibility for overall management of assets.
• Transparent and responsible asset management processes are aligned with best practice and legislative requirements
• A life cycle cost understanding of asset management is created, enabling management of a sustainable asset base.
Clarence Valley Council 195
File Reference Number ECM Version 4.0 Review Due July 2024 Document(s)
V3.0 – 21/07/2015 – 14.132.15 V2.0 – 24/06/2014 – 12.008/14 V1.0 – 16/10/2007 – 09.162/07
This Policy Supersedes
Definitions
Asset – A physical component owned or legally controlled by the Council, which enables services to the community and which has an economic life greater than 12 months where the dollar value can be reliably measured.
Asset Management – The systematic process applied to assets from their planning, acquisition, recording, operation, maintenance, renewal and disposal to ensure that the assets meet the Council’s priorities for service delivery in a sustainable manner.
AMP – Details information about infrastructure assets with actions required to provide an agreed level of service in the most cost-effective manner while outlining associated risks. The plan defines the services to be provided, how the services are provided and what funds are required to provide over the planning period (i.e. the full life cycle costs). The plan will link to an LTFP, which typically considers a 10-year planning period.
AMS – Applies to all infrastructure assets that are critical to the Council’s operations and that outlines risk management strategies for these assets. The AMS will include specific actions required to improve the Council’s asset management capability and projected resource requirements and timeframes. The AMS will balance the resources required in the AMP and funded in the LTFP
Asset Management Steering Committee – Representative cross-organisational management group that reports to the Executive on all asset management matters, including progress with existing plans and any proposed changes.
Best Practice – The applications of best practice processes in asset management, accounting for the costs and systems that are appropriate to meet the required service levels.
Life Cycle Costs – Includes acquisition, operation, maintenance, renewal and disposal costs throughout the projected life of the asset.
Background/Legislative Requirements
The Local Government Act 1993 and the Local Government Amendment (Governance and Planning) Act 2016 place several obligations on councils in relation to asset management.
The IP&R legislation requires that the Council must account for and plan for all existing assets under its ownership and any new assets proposed in its Community Strategic Plan, Delivery Program and associated Resourcing Strategy.
Legislative Requirements
Local Government Act 1993 (NSW)
Related Legislation
Other References
Local Government Amendment (Planning and Reporting) Act 2016
Section 8 of the Act outlines the Council’s responsibilities for accounting and managing public assets
Section 403 of the Act requires the Council to have a resourcing strategy that includes an asset management planning component
IP&R Guidelines for Local Government The Policy was developed in line with the IP&R guidelines and manual
Local Government Code of Accounting Practice and Financial Reporting
Australian Accounting Standards –AASB 116
The accounting standards and code define how our assets are accounted for
Asset Management Strategy 2024/2025 to 2033/2034 196
The Council is responsible for significant community investment in infrastructure assets to support its core business of delivery of services to the community.
Asset management practices impact directly on the core business of the Council, and appropriate asset management is required to deliver the Council’s asset management vision as stated in the Council’s AMS:
‘strategically provide, maintain, renew and replace an appropriate stock of community infrastructure that is required to support the communities of the Clarence Valley Council; is sustainable across the long term; and is provided at the lowest possible life cycle cost.’
Asset management directly relates to the objectives of the Council’s Community Strategic Plan and will ensure that the Council delivers the appropriate levels of service through its assets. This will provide positive impact on:
• Customer and community expectations
• Strategic and corporate goals
• The Council’s LTFP
• The political environment in which the Council operates
• Legislative requirements
The Council must:
• Provide a consistent framework for implementing systematic asset management and appropriate asset management best practice throughout all Council departments.
• Cover a minimum period of 10 years and have a focus on long-term sustainability for the benefit of current and future generations within the AMS and AMPs
• Review the AMS and AMPs annually, and modify as required based on community feedback and community plan objectives.
• Produce an asset management framework that incorporates an AMS and AMPs for each class of Council assets. The asset management framework relies on an up-to-date asset management system, which should incorporate the following information:
Asset registers
Asset condition assessments
Asset maintenance and management systems
Strategic planning capabilities
Predictive modelling
Deterioration modelling
Life cycle costing
• Consider relevant legislative requirements for political, social and economic environments within the asset management process
• Integrate an asset management system with existing planning and operational processes.
• Prioritise and progressively implement asset renewal plans based on the levels of service required and the effectiveness of the current assets to provide those levels of service.
• Apply to all asset classes a systematic and cyclic renewal review to ensure that the assets are managed, valued and depreciated in accordance with appropriate best practice and Australian standards and legislation
Clarence Valley Council 197
Policy Statement
The Council will be transparent in its asset management practice by committing to implementing a systematic asset management framework that ensures assets are planned, created, operated, maintained, renewed and disposed of in accordance with the Council’s priorities of service delivery at the lowest possible life cycle cost.
Roles and Responsibilities
The General Manager has overall responsibility for developing asset management systems, policies and procedures and reporting on the status and effectiveness of asset management to the Council.
The Asset Management Steering Committee reports directly to the Executive. It provides assurance that all asset management activities are consistent with the objectives of the IP&R Framework, which are supported by the LTFP. It also monitors the implementation of the Asset Management Improvement Plan and risk plans for all asset classes.
Managers are responsible for ensuring that people and processes are in place and work together to implement the asset management systems, policies and procedures.
Employees with management or supervisory responsibility are responsible for the management of assets within the area of responsibility as determined under AMPs
Employees will be tasked under implementation plans and will be responsible for the timely completion of those activities contained within those plans and must be familiar with asset management and how it applies to Council activities
Audit and Review
Our financial asset information will be annually audited as part of the external financial audit. The Council’s asset registers will be continually monitored and maintained in line with capitalisation, disposal procedures and specifically adopted position papers.
The Council’s asset management systems are to be reviewed annually to ensure data, modelling and planning are accurate and relevant.
Asset Management Strategy 2024/2025 to 2033/2034 198
Appendix 2 – The Asset Management Improvement Plan (To
Be Reviewed and Updated During 2023–24)
Asset Management Area Priority (As Determined in the Asset Management Gap Analysis)
Asset Identification and Recording (Asset Strategy 2007)
1. Recommendation 12
That the Council develops a funding model that addresses the sustainable renewal of infrastructure and identifies all asset life cycle costs.
AMS 2015
AMS 2015
Future Demand Impacts & s94 Plans
2. Goal 4
Consider the ongoing ownership costs (recurrent whole-of-life) of new capital works proposals as part of project scoping and model into the Council’s LTFP to identify impacts and risks.
3. Goal 7
Undertake a detailed assessment of the resources required to implement this AMS, and ensure it is integrated with the other resourcing strategies so that a program of improvement and milestones can be implemented and performance-managed.
4. Recommendation 2
That the impact of new assets from growth be considered as part of the Council’s 10-year financial plans and life cycle costs in the AMPs
Should be commenced ASAP in conjunction with the development of the single asset register – not using a single register.
Develop a funding model
In conjunction with the preparation of AMPs
No single assets register development –use existing systems. All registers have been centralised with the asset unit.
An integrated asset management system is under development and proposed to go live in the 21/22 financial year.
Develop a funding model in conjunction with AMP review, SS7, & ‘Fit for the Future’
AMPs consider the impacts of ‘whole-of-life costs’ of new capital works and predicts a LTFP
In conjunction with the preparation of AMPs
AMPs consider the impact of budgets and gaps and include new assets – to be represented in LFTP
Clarence Valley Council 199
Associated Recommendation Timeframe Current Status
Asset Management Area Priority
(As Determined in the Asset Management Gap Analysis)
(Asset Strategy 2007)
AMS 2015
AMS 2015
That S94 Plans be reviewed and utilised for infrastructure assets where possible.
5. Goal 3
Identify the maintenance and renewal ‘shortfall’ and any renewal and replacement ‘backlogs’ for all asset groups.
6. Goal 5
Review and update comprehensive risk management plans for all major asset groups.
7. Goal 6
Integrate all knowledge and asset management systems for infrastructure assets.
End of financial year
2021–22
AMS 2015
Asset Data Maintenance (Asset Strategy 2007)
8. Recommendation 6
Develop and implement business processes for planned and unplanned inspections, documenting inspections, the results of inspections, the issuing of action requests and recording of action taken on each action event.
Ongoing – full integration ~ one year
Conducted annually in conjunction with the preparation of The Report on Infrastructure Assets (SS7)
Update required
In planning
All asset data centralised but not integrated. An integrated asset management system is under development and proposed to go live in the 21/22 financial year.
WAM for Fleet & IT assets loaded 2015. Each section uses systems to record requests and actions. A data flow process will be developed as part of the CiA (corporate information) system
Asset Management Strategy 2024/2025 to 2033/2034 200
Associated Recommendation Timeframe Current Status
Asset Data Maintenance (Asset Strategy 2007)
AMPs
(Asset Strategy 2007)
9. Recommendation 9
That a plan for updating of asset data be developed and integrated into existing business processes and work procedures where possible.
10. Recommendation 4
That existing service levels be identified, documented and reviewed to ensure that they are appropriate for currently available resources and are sustainable in the long term.
11. Recommendation 5
AMPs
(Asset Strategy 2007)
AMS 2015
That a performance reporting system for service levels is developed to report on performance against adopted service levels.
In planning
In conjunction with the preparation of AMPs
To be developed in line with ‘as constructed’’ data and data flows/transfers – finance. Info gathering & work group to commence.
Service levels documented in AMPs as ‘what we do now’ & loosely defined.
Community consultation is ongoing and staged for groups of assets.
In conjunction with the preparation of AMPs
Asset Data Maintenance (Asset Strategy 2007)
12. Goal 2
Review and maintain AMPs for all major asset groups already developed.
13. Recommendation 10
That a process for the formal ‘handover’ of new and renewed assets from construction to operational status be developed to ensure that asset capitalisation information is identified and documented as an integral component of the project management process. The process is to include assets constructed by and donated to the Council by developers and others.
15. Recommendation 8
Asset Data Maintenance (Asset Strategy 2007)
That there is greater use of the GIS for operational purposes, including making asset attribute data available to all staff and automating the investigation of asset-related business processes.
AMP Revision Schedule and IP&R Frameworkdriven
Currently use P&R (customer request system), but without predetermined and agreed service levels, it is difficult to monitor.
Some levels of service are provided by contracted service agreements, which are monitored.
Update required
During 2021–22 The contributed asset process started being reviewed in 2020–21. This needs to be completed as soon as possible.
Ongoing
GIS data is currently being updated by each section. With the centralisation of asset registers, some GIS data updates are now being processed by the asset unit. We are currently awaiting an internal audit report on the processes and recommendations.
Clarence Valley Council 201
Enquiries Published by Clarence Valley Council 2 Prince Street Grafton