3 minute read
Table 12: Comparing the four different data sources
For the case study, we analysed both SFI and FactSet cement data sets separately, using the November 2022 version of the WWF BRF tool.38 Following the methodology stated above the scape risk was aggregated to the site level using binning and the 75th percentile method (see Step 2). Site-level risk was further aggregated to company-level risk by weighing each location based on its business importance (see Step 3a).
The results of the analysis show that using asset-level data (the SFI data set) results in slightly higher risk scores on average compared with using corporate-level data. A breakdown of the physical and reputational risk score distribution in Table 14 shows that, while the risk scores of both data sets mostly lie within the 3.0 to 4.0 range, the SFI data set has a higher risk on average. Additionally, a higher percentage of the data set’s market capitalisation is exposed to higher risk using the SFI’s data set. A possible explanation is that the SFI focuses on corporate production facilities which have a higher risk profile than the administrative operating facilities that are more prevalent in company structure data (which results in slightly different industry sector classifications and hence different industry materiality ratings).
Advertisement
Table 14: Physical and reputational risk score distribution for the SFI and FactSet databases, including % total cement portfolio in market cap.
Score SFI Physical risk
FactSet SFI Reputational risk
FactSet
% of companies % of data set market cap
% of companies % of portfolio market cap
% of companies % of data set market cap
% of companies % of portfolio market cap
0.0 – 3.0 0 0 0 0 0 0 0 0 3.1 – 3.4 12.5 17.2 25 41.4 36.4 60 54 92 3.5 – 3.9 87.5 82.8 75 58.6 54.54 36 37 4
4.0 – 5.0 0 0 0 0 9.1 4 9 4
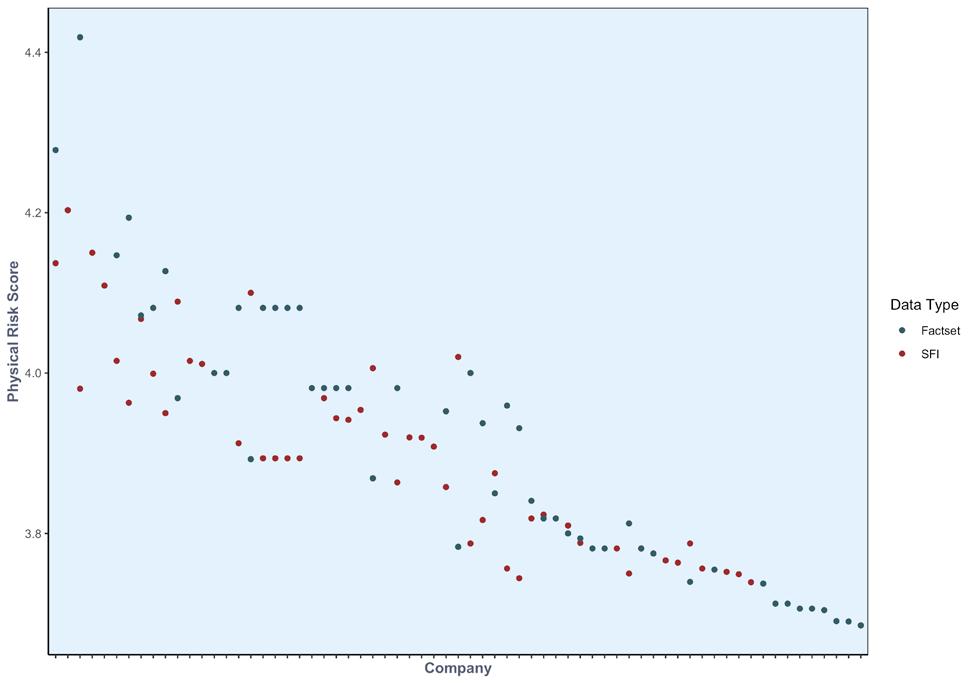
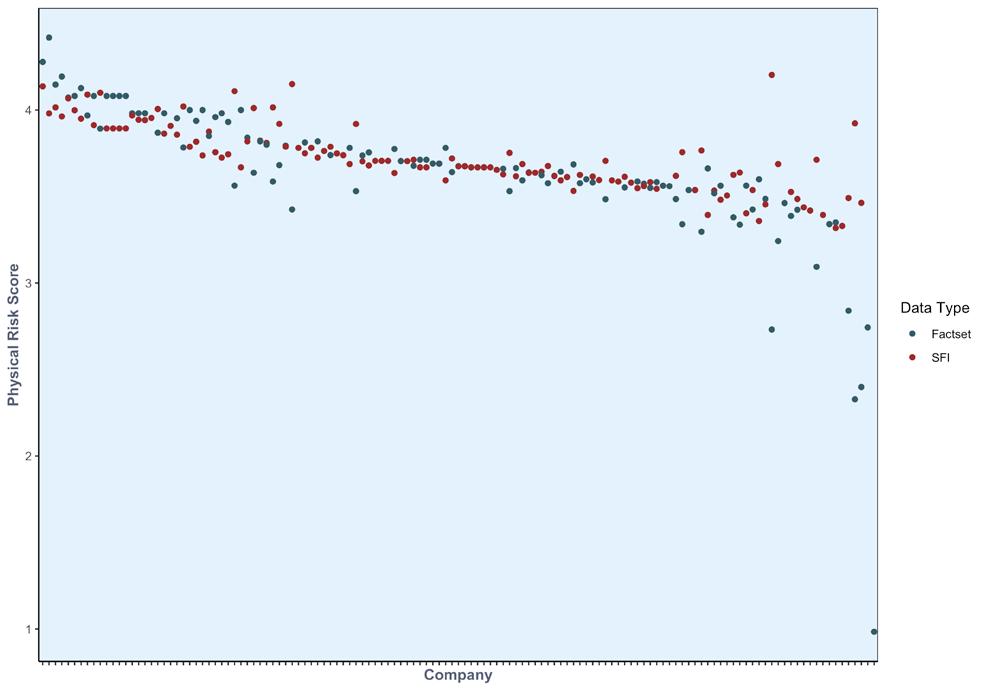
Despite the table above, on a company-by-company analysis there is an insignificant difference between the use of the two data sets. Figure 16 and Figure 17 show a comparison of the physical risk scores from both the FactSet and SFI data sets. Although some variation exists, the vast majorities have a similar level of risk under both data sets. As shown in Table 13, each company had a similar number of sites and, as such, each company would have a similar amount of detail for each analysis. We can observe that the number of sites is particularly important to the risk analysis. The top 50 riskiest companies in the data sets are presented in Figure 16, in which we see consistent divergence between the risk produced by each data set at the top end. This seems to be driven by a difference in locational data, as the number of sites per company for these companies (top 30) differs between data sets (see Table 13). This result is unsurprising, given that the industry classification for both data sets is similar.39 As scape risk is an equal combination of the importance and local integrity of biodiversity and industry materiality (see Step 3), given similar industry classifications, much of the difference in risk is explained by locational attributes. A difference in the number of site locations between data sets will then likely have a noticeable effect on risk result. However, we observe a convergence of risk between the two data sets for those companies with a similar number of sites. This might be an indication that corporate-level data could act as a reasonable proxy for asset-level data when the latter is either not available or the fiduciary resources are not present. As more SFI data becomes available, we will repeat the exercise to validate whether the results presented above remain consistent.
38 The case study is based on WWF BRF data from November 2022. As the underlying data is continuously improved, changes may occur that are not reflected in the case study.
Figure 16: Top 50 highest physical risk scores from FactSet and the SFI cement databases
Figure 17: Physical risk scores from FactSet and the SFI cement databases


