




This white paper is part of a broader discussion on new regulatory efforts in the EU, the UK and beyond to categorise financial products with sustainability characteristics This report focuses on the "transition product" category in public equity markets. Chapter 1 of this report examines existing proposals for transition products and identifies their key characteristicsandpotentialcriteria.Chapter2illustratestheapplicationofthepotential criteria using the MSCI ACWI, slightly extended to include EU mid-cap companies,1 to provide evidence-based feedback to decision makers.
The set of criteria revolved around negative screening (general and climate-specific exclusions) and positive screening (such as focusing on companies with verified targets), and the aim was to balance environmental ambition with practical feasibility. Our findings suggest that, in principle, transition products focused on science-based targets can offer competitive risk-return characteristics. Using this as a baseline criterion, financial institutions (FIs) can pursue more ambitious strategies to select and over- or underweight companies. Caution should be exercised when further criteria significantly restrict the investable universe or impose severe sectoral or geographic biases.
At a political level, our findings bear implications for discussions around establishing a transition product category:
• Regulators should set minimum criteria for key characteristics, serving as entry points for FIs. Within these parameters, FIs can adopt more ambitious strategies, balancing prescriptive and principle-based criteria.
• Investorstewardshipshouldbeanessentialpartof transition products, especially in public equity markets. While this report focused on criteria & guidelines at asset-level to allocate capital, scientific-evidence reveals a significant investor contribution potential for investor stewardship.
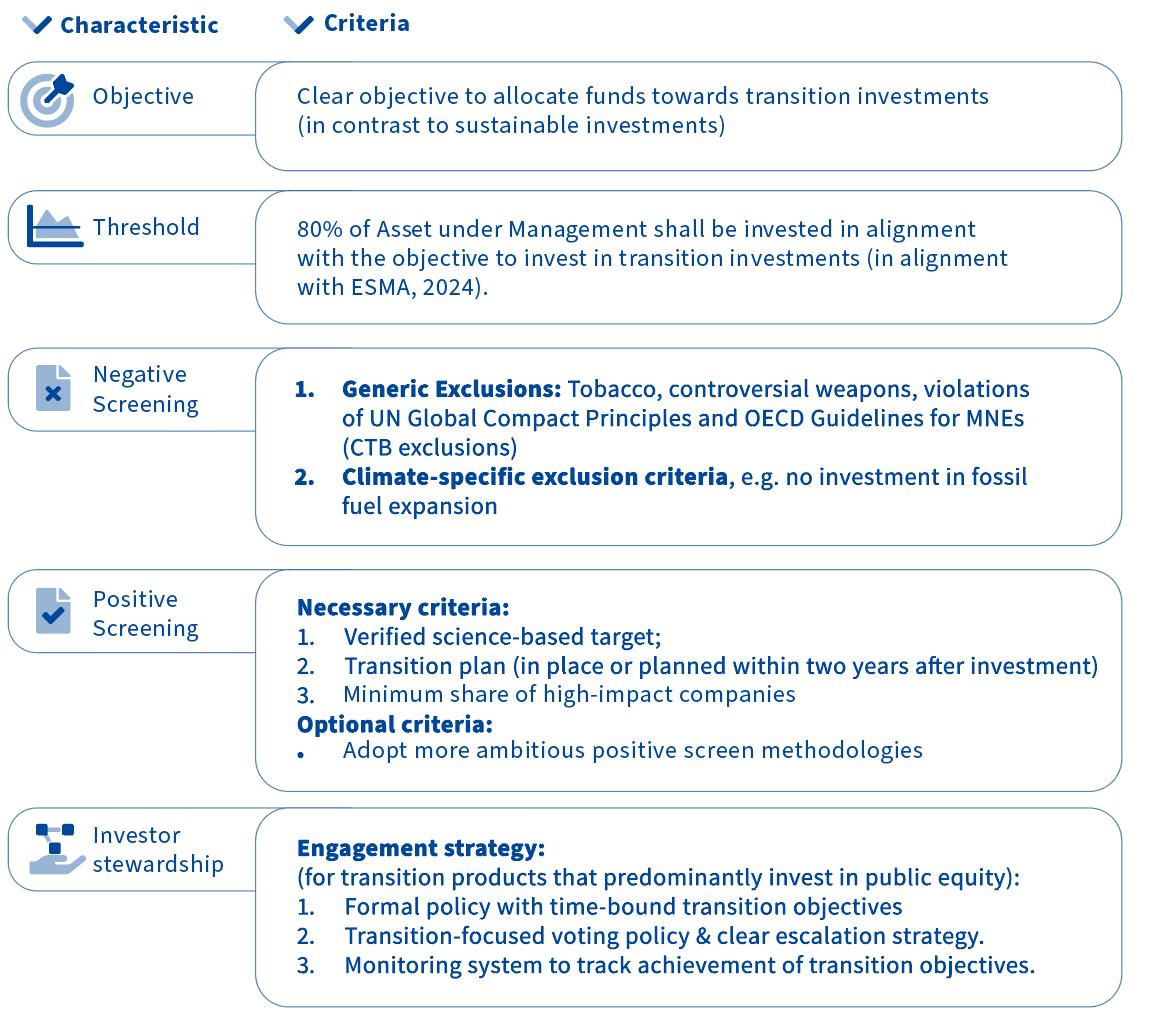
We propose the following minimum criteria for transition products as an input to discussions with market participants and regulators:
1 We have taken the MSCI ACWI constituents (~3000 companies) and expanded the universe to include all listed midcap companies in the EU and UK, resulting in a universe of ~3300 companies. For simplicity, we refer to this sample as ACWI-EU throughout the report.
i

Figure1-Proposedminimumcriteriafortransitionproducts

Thispaperdoesnotintendtoprovidefinalrecommendationsbutrathertoprovidethe basis for discussion, aiming at stimulating further thought and development in the emergingfieldoftransitionfinance.


The development of meaningful sustainability-related financial product categories has gained significant momentum internationally This trend is exemplified by various initiatives across several countries. In the United Kingdom, the Financial Conduct Authority (FCA)proposed fourinvestmentlabels in2023(UKFinancial ConductAuthority, 2023). Similarly, Australia’s recent Sustainable Finance Strategy by the Treasury outlined three different product categories (Australia – Government, Treasury, 2023), and Switzerland plans to introduce developments in 2024, as announced by the Swiss Government's Federal Council (Swiss Government - The Federal Council, 2023) Meanwhile, in the USA, the SEC proposed amendments on ESG Disclosure for Investment Advisers, which include various product categories (U.S. Securities and Exchange Commission, n.d.).
These initiatives have also influenced the European Union. During the latest consultation of the Sustainable Finance Disclosure Regulation (SFDR), which was concluded at the end of 2023, the European Commission considered replacing the existing Article 8 and Article 9 product groups with new categories (European Commission, 2023a). This was due toseveralcritical flawsinthe currentEU framework, suchas the misuse ofthe Article 8 and 9 categories as labels,2 a mismatch with retail investor expectations3 (2 Degree Investing Initiative, 2023; Mangot & Bayer, 2022), and a lack of clarity in differentiating between investor and investee company impact4 (Kölbel et al., 2020). Several of these approaches include product categories for “transition products”, for example the FCA’s “Sustainability Improvers” (UK Financial Conduct Authority, 2023, p. 98) category or the EU Commission’s category of "products with a transition focus" (European Commission, 2023a, p. 33). The ESAs also included a transition product category in their opinion on the assessment of the SFDR (ESAs, 2024).
As demonstrated by these developments, regulators like the FCA or the EU Commission are reacting to discussions about transition finance that have gained momentum in recent years. Several actors, including practitioners, governmental organisations, and academics, have developed different definitions and guidelines on transition finance
2 The market has unofficially adopted SFDR’s Article 8 and 9 categories as labels, leading to subjective classifications like “light green” or “dark green” products.
3 The SFDR has not adequately met retail investor expectations for making a positive impact and aligning with their values, as highlighted in a report by 2 Degrees Investing Initiative (Mangot & Bayer, 2022; 2 Degree Investing Initiative, 2023)
4 The SFDR currently fails to systematically differentiate between investor impact and company impacts, a crucial distinction for understanding real-world investor influence, as detailed in Kölbel et al., 2020.


(Caldecott, 2020; ICMA, 2024; IPSF, 2023). Focusing on transition finance makes sense considering that the investment gap to reach the SDGs is currently estimated to be about four trillion US dollars for developing countries alone (UNCTAD, 2023). A global analysis of current volumes in “Transition” or “Improvers” funds shows that these products only reached approximately 50 billion US dollars in assets under management in July 2023 (Goldman Sachs, 2023).5 Surveys indicate that professional investors are interested in investing in transitioning industries, provided that trust is established through clear methodologies and KPIs (CBI, 2020, Natixis, 2021).
Against this background, this report provides conceptual clarity, especially for regulators to discuss potential implications for a categorisation regime (e.g., for a SFDR review) or labelling regime (similar to the UK FCA). Practitioners can use the implementation guidance, demonstrated against the ACWI-EU, to explore the creation of transition products. This guidance builds on emerging proposals and criteria, including those from the recently published ESMA Guidelines on funds’ names using ESG or sustainabilityrelated terms in UCITS and AIF names (ESMA, 2024). The understanding of transition products is also in line with the definition of transition products proposed by the ESAs (ESAs, 2024). Both conceptual clarity and implementation guidance shall also increase the trust in and uptake of transition products in practice. Consequently, the report focuses on transition products developed and managed by financial market participants rather than financial instruments like use-of-proceeds or sustainability-linked bonds emitted by corporate issuers (issuer or entity-level). Other types of sustainability-related financial product categories are not part of this report and should be analysed in future research (see Figure 2).
Figure2 - Typeofsustainability-relatedproductcategoryfocusedoninthisreport

Source: adopted from Busch & Pruessner (2023)
5 The analysis included funds with “Transition”“Paris-aligned”, “Decarbonisation” and “Improver” in their fund name.


The remainder of the report is structured as follows: Chapter 1 provides the conceptual foundations. Section 1.1 compares and contrasts existing definitions of transition and transition finance while Section 1.2 delves into categorisation attempts of transition products and outlines their main characteristics.6 This section also discusses the role of stewardship for transition products. Chapter 2 provides implementation guidance, illustrating how these concepts can be applied in practice through the analysis of realworld data and the construction of hypothetical portfolios based on the ACWI-EU. Chapter 3 concludes and provides recommendations for minimum criteria for transition products.
6 This report focuses on transition products in public equity markets due to data availability, using MSCI ACWI that has been slightly extended to include all listed mid-cap companies in the EU and UK, resulting in a universe of ~3300 companies as the empirical basis for the analysis in chapter 2. For a discussion of transition products in private markets, further research is needed.


To provide both conceptual clarity and implementation guidance on transition products, a clear definition of “transition” is essential In recent years, international organisations, regulatory bodies, and private actors started discussing the idea of transition finance and provided definitions of the underlying concepts (see Appendix A – Existing Definitions of “Transition” for a non-exhaustive list). Existing definitions of “transition” all commonly refer to the process or the journey of achieving sustainability goals (CBI, 2020; European Commission, 2023a; ICMA, 2024; OECD, 2019). They differ in the sustainabilitythemes that they focus on. Some definitions of “transition” include both environmental and social objectives, usually referring to the SDGs (OECD, 2019), while other definitions are restricted to environmental sustainability goals, including the Paris Agreement, the planetary boundaries framework, and other environmental objectives (CBI, 2020; EU Commission, 2023b).
Definitions of “transition” also differ in the level of analysis. For instance, the International Capital Markets Association (ICMA) identifies three levels: (1) Economywide transitions, (2) sectoral transition and (3) transition of “hard-to-abate” sectors like fossil fuels (ICMA, 2024). The EU’s Platform on Sustainable Finance describes a more granular approach, differentiating the economy as a whole, specific sectors, financial portfolios, companies and concrete economic assets or activities (EU Platform on Sustainable Finance, 2021)
This report uses a broad definition of transition, closely aligned with the one from the OECD, where “transition” refers to the journey towards sustainable development, i.e. the journey to achieving social, economic and environmental goals (OECD, 2019) This definition also encompasses other currently existing definitions, including the narrower interpretation from the European Commission that focuses on the environmental and climate dimensions (European Commission, 2023b; for an overview see Appendix A –Existing Definitions of “Transition”).
Based on this broad understanding of transition, this report refers to transitionfinance as “the provision and use of financial products and services to support counterparties, such as companies, sovereigns, and individuals, realise alignment with environmental and social sustainability.” (Caldecott, 2022, p. 936). Despite the lack of a consensus definition (see Appendix B – Existing Definitions of “Transition Finance” for an overview), this interpretation focuses on the critical role of financial products in supporting social


and environmental transitions at various levels and target actors (counterparties). It also highlights the active role that transition products need to play.7
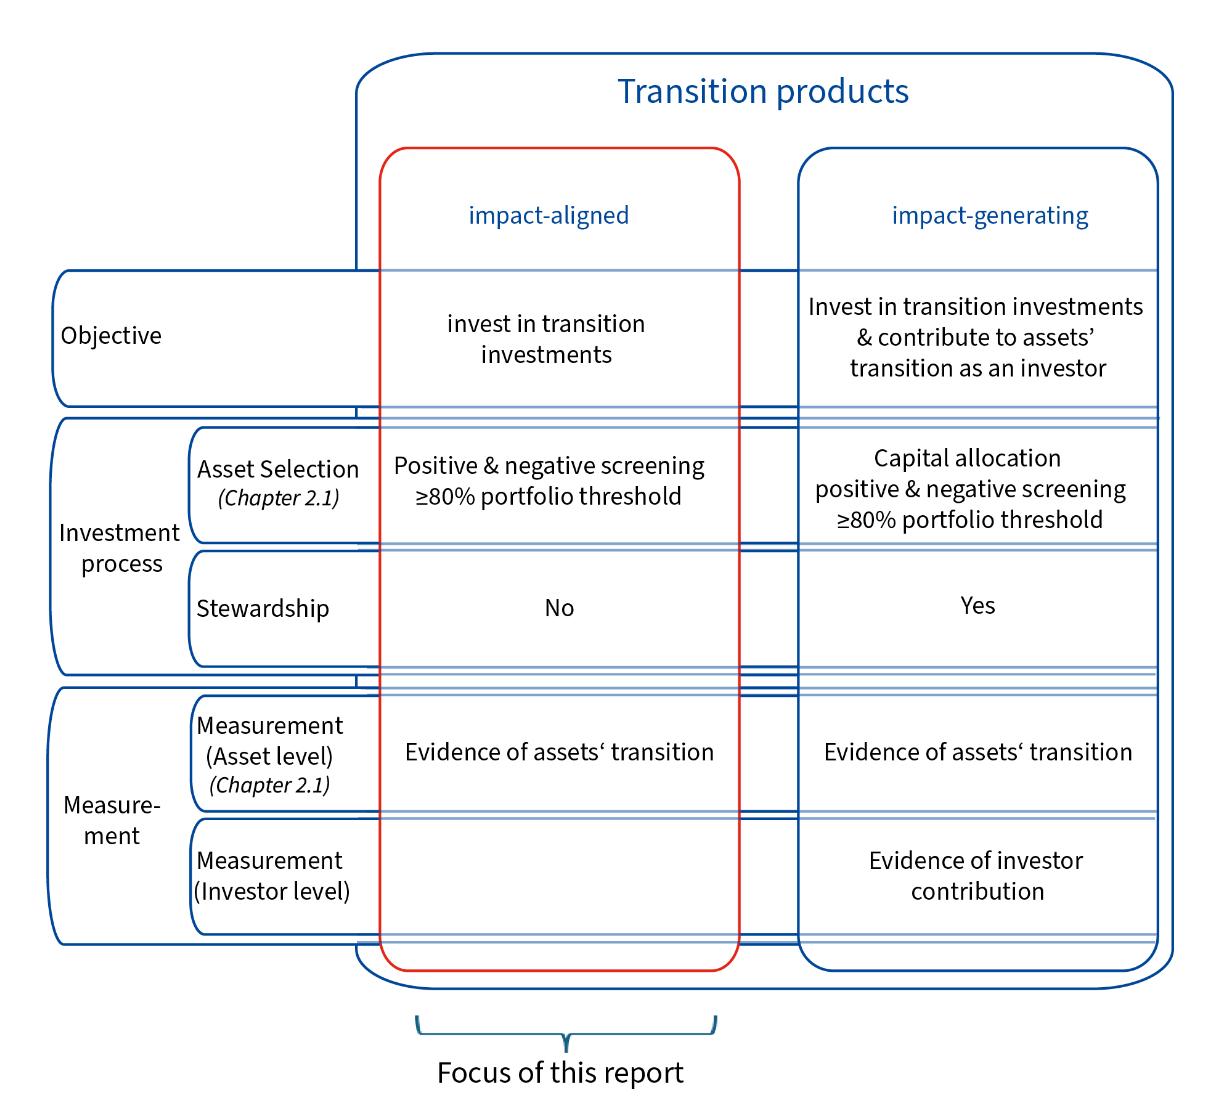
Based on an analysis of existing definitions (see Table 1), we extracted three dimensions to define transition products: (1) the objective, (2) the investment process, and (3) the measurement approach. Table 2 summarises the different characteristics of transition products we arrived at based on the analysis of existing definitions.
We argue that transition products have the objective to positively contribute to sustainability objectives. They do not positively contribute by investing in “sustainable investments” as currently required under SFDR for Article 9 products. Instead, they contribute positively to sustainability objectives by investing in “transition investments”, i.e. investments that have a (rather) negative social or environmental performance which needs to be improved to be in line with sustainability goals. This understanding is in line with the different approaches summarised in Table 1.
To be clear about the difference between “transition investments” and “sustainable investments”, we differentiate two ways for economic activities to positively contribute to sustainability objectives (Busch & Pruessner, 2023):
(1) Positive contribution through a sustainable level of social or environmental performance
(2) Positive contribution through a positive change in social or environmental performance due to undertakings’ activities towards a sustainable level of performance (transition or impact).
Both understandings are taken from the EU’s Sustainable Finance Framework. The first is based on the EU taxonomy and the SFDR. The EU taxonomy and its delegated acts provide detailed technical screening criteria defining the levelofperformance necessary for economic activities to substantially contribute to one or more of the taxonomy’s environmental objectives (European Commission, 2021).8 The SFDR is also referring to positive contributions to sustainability objectives in Article 2(17) when defining
7 Even though transition and transition finance encompass both the environmental and social dimension of sustainable development, this report focuses mainly on environmental and more specifically climate aspects of transition finance due to the complexity of implementing such an approach. Future research is needed to show how transition products can be implemented when focusing on social issues.
8 There are some exceptions where technical screening criteria in the EU taxonomy also refer to a change in social or environmental performance, for example renovations of existing buildings for which one of the two possible substantial contribution criteria is that the renovation „leads to a reduction of primary energy demand (PED) of at least 30 %” (European Commission, 2021, p. 127)


sustainable investments (European Commission, 2020b). The SFDR’s definition of positive contribution to a sustainability objective is not further specified and concrete implementation is left to market participants (European Commission, 2020b; ESMA, 2023a). 9 However, sustainable investments under SFDR are mostly understood as investments that already have a sustainable level of social or environmental performance.
The second understanding, i.e. positive contribution as the positive change in social or environmental performance, is based upon the definition of “impact” provided by the European Sustainability Reporting Standards (ESRS). Annex 2 of the ESRS define impacts as
“The effect the undertaking has or could have on the environment and people, including effects on their human rights, connected with its own operations and upstream and downstream value chain, including through its products and services, as well as through its business relationships. The impacts can be actual or potential, negative or positive, intended or unintended, and reversible or irreversible. They can arise over the short-, medium-, or long-term. Impacts indicate the undertaking’s contribution, negative or positive, to sustainable development.” (European Commission, 2023c) (emphasis added by the authors)
This definition shows that the ESRS understand an undertaking’s social or environmental impacts as its contribution to sustainable development Since social or environmental impacts or effects always entail a change in the performance of a specific social or environmental indicator,10 the ESRS provide the basis for our second understanding of a positive contribution towards sustainability objectives.
The analysis of the two understandings of positive contribution helps to specify the objective of transition products. Their objective is to invest in transition investments, which means to invest in economic activities that positively contribute to a sustainability objective by positively changing their social or environmental performance towards a sustainable level of performance (Busch & Pruessner, 2023). Chapter 2.1 will provide different perspectives on how to operationalise “transition investments”.
The investment process is distinguished between asset selection (positive as well as negative screening) and stewardship. Screening in general can be defined as “Applying rules based on defined criteria that determine whether an investment is permissible”
9 In clarifying the definition of "sustainable investment" under Article 2(17) of the SFDR, the European Commission emphasized that the SFDR does “not prescribe any specific approach to determine the contribution of an investment to environmental or social objectives“ and that “financial market participants must disclose the methodology they have applied” (ESMA, 2023a, p. 127)
10 Kölbel et al. define impact as “change in a specific social or environmental parameter that is caused by an activity” (2020, p. 3) (emphasis added by the authors)


(GlobalSustainableInvestmentAlliance, 2023, p. 3). Screenings canbe appliedbasedon what is permitted (positive screening) or what is not permitted (negative screening) (Global Sustainable Investment Alliance, 2023). Also, the analysis of existing definitions of transition products shows that many include a diversification pocket, which follows the rational that a minor share of the portfolio can be invested more freely for diversificationpurposes(whileensuringalignmentwiththeoverarchingobjective).11 After investing, transition products can use stewardship approaches, using their influence and rights as investors to support positive changes in the social or environmental performance of investees.
Both asset selection (i.e. capital allocation) and stewardship approaches can lead to investor impact or investor contribution (Kölbel et al., 2020). 12 We define investor contribution as the “contribution that the investor makes to enable enterprises (or intermediary investment managers) to achieve impact.” (IMP, 2024). Differentiating whether a transition product aims for investor contribution or not is important to prevent impact-washing according to ESMA (ESMA, 2023b).13 We use Busch & Pruessner’s (2023) approach to differentiate transition products (see Table 2). For public equity markets, investor contribution through capital allocation is difficult to establish, which is why this report’s conclusion recommends implementing investor stewardship, especially for transition products investing in public equity (see Infobox on Investor Stewardship and Engagement below)
Without an investor contribution to the transition of assets, the portfolio’s share of transition investments is considered to be impact-aligned in the sense that the portfolio is invested in assets that transition (positive impact), without evidence of investor contribution. The share of transition investments in the portfolio where the investor contributes to the asset’s transition, e.g. through stewardship, is considered impactgenerating because the transition product supports the transition of the underlying assets.
Transition products also need to measure both the social or environmental performance of underlying assets and their investor contribution in accordance with their
11 For example, the FCA’s labelling regime describes that “70% is however a minimum threshold for investing in assets that directly pursue the objective, acknowledging that the product may also invest in some assets for liquidity, risk or diversification purposes.” (FCA, 2023, p. 100).
12 We use the terms “investor impact” and “investor contribution” interchangeably.
13 ESMA states that “misleading fund impact claims can also stem from a confusion about types of impact targeted by a given fund. It can be argued that there are two main types of impact fund strategies.” (ESMA, 2023b, p. 41). These types of impact are described as “Buying” impact and “Creating” impact (ESMA, 2023), which are closely aligned with the distinction between “impact-aligned” and “impact-generating” (Busch et al., 2024).


sustainability objective.14 Chapter 2.1 therefore specifies how social and environmental performance can be measured at asset level, exemplifying how impact-aligned transition products could be implemented. Chapter 2.2 then shows how different criteria influence the investable universe. The info box on page 11 dives into potential stewardship criteria. Future research is needed to go into detail on how to assess investor contribution diligently.
14 Establishing a causal link between investors’ activities and positive impacts at company level is difficult, especially in public equity markets. With reference to stewardship, the FCA adopted a pragmatic approach stating that “While firms should outline the outcomes they expect to achieve as a result of their stewardship activities, and therefore demonstrate some correlation between the two, we do not expect firms to demonstrate a causal link between those activities and outcomes.” (UK Financial Conduct Authority, 2023, p. 104).


Table1-Overviewofdefinitionsfortransitionproducts
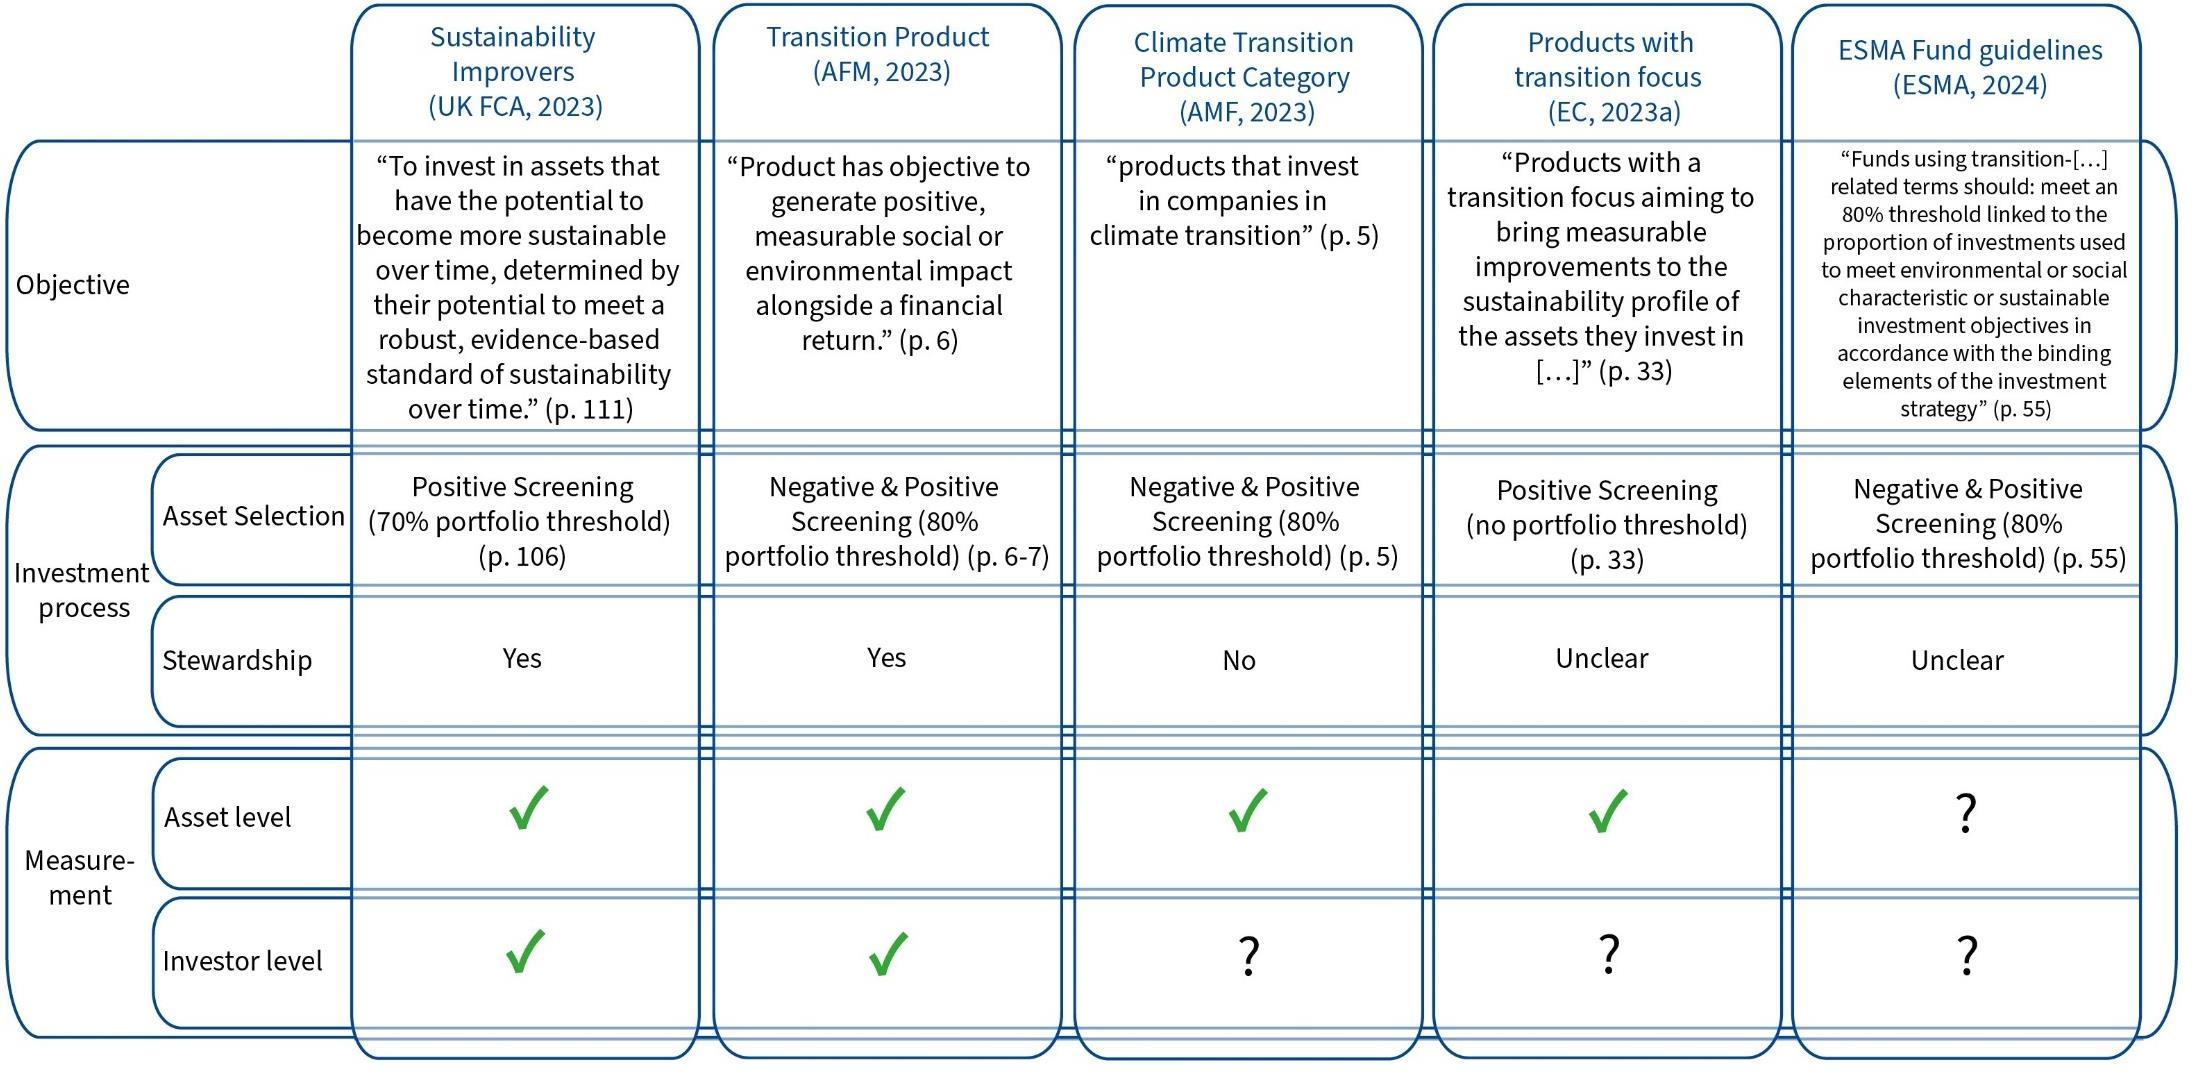


Table2-Definitionoftransitionproducts


In public equity markets, where FIs don’t usually directly finance portfolio companies, compared to credit and loans, investor stewardship is a more effective tool for generating impact than capital allocation. In transition products for public equities, engagement is a crucial component to leverage investor contribution potential (Mangot & Koch, 2023). Simply focusing on asset allocation without incorporating an engagement process misses a significant opportunity to foster real-world change (Mangot, 2023; Zink, 2022). Theoretical models show that in competitive markets, engagement ("voice") is more effective than divestment ("exit") in motivating firms to adopt socially responsible behaviours (Broccardo et al., 2020). Although the general effectiveness of engagement is well-documented, success rates vary. Key factors for successful engagement include:
• Coordinated efforts (Dimson et al., 2023).
• Significant shareholding by the engaging entity (Dyck et al., 2019).
• Prior ESG experience by the engaged company (Kölbel et al, 2020).
• Financial materiality of the engagement topics (Bauer et al., 2022).
• Cultural alignment between the investor and the company (Kölbel et al, 2020; Dimson et al., 2023).
For transition products, determining when investors are credible stewards and what constitutes minimum criteria can be partially addressed by existing documents (see Appendix C - Engagement Guidelines & Expectations) We suggest discussing the overarching engagement strategy, dialogue with portfolio companies, and exercising of voting rights.
Engagement strategy & formal policy refers to the overall strategy of the financial institution. This includes, for example, the incorporation of measurable, time-bound transition objectives; the prioritisation of portfolio companies; the transition-oriented voting policy; as well as a clear escalation strategy which specifies how engagement efforts are intensified if objectives are not met. Another aspect is the contribution to investor coalitions. Furthermore, a monitoring system shall regularly track whether transition objectives are met.
Dialogue refers to regular interactions with portfolio companies (at management level) to promote sustainability objectives. No consensus on the minimum share for dialogue has emerged. Ecolabels, such as the draft EU Ecolabel and Nordic Swan label, promote active dialogue with 5-10% of portfolio companies, with guidance on prioritisation. Open questions remain on how to count dialogues at firm level (vs. product level), or how to measure contributions to investor coalitions.
Voting involves active participation in shareholder voting to endorse sustainability goals. Labels like the Nordic Swan incentivise FIs to vote at AGMs for at least 25/50% of the fund’s holdings (or 70/90% with a proxy voting service). The French ISR label requires 90% voting rights exercised for French companies, and 70% for non-French companies.


This chapter focuses on the practical implementation of transition products, illustrating which criteria are feasible following the concepts and key characteristics outlined in Chapter 1. Chapter 2.1 walks through concrete screeningcriteria that transitionproducts can use to exclude and select issuers, effectively providing different perspectives on how to define and measure “transition investments”. Chapter 2.2 describes the results of implementing these screening approaches for transition products, showing the remaining investable universe and other analysis based on the ACWI-EU constituents.
This subchapter focuses on the measurement at asset level, describing criteria to implement positive and negative screenings for transition products. The UK FCA (2023), for example, states that a transition product’s assets “must be selected with reference to a robust, evidence-based standard”. We use measurements for positive and negative screeningsfromdifferentsourcestargetingtransitioncriteria (seeFigure3).Thesecriteria for positive and negative screening are also used to define minimum criteria for transition products (see Figure 7 in the conclusion).
Subject to the precise criteria, the investable universe shrinks, making it more difficult to build products with reasonable risk-return considerations. To provide evidence-based feedback, we collected relevant data points for the ACWI-EU universe and exemplify different sets of criteria. For the positive screening criteria, forward-looking data on targets has been collected from CDP, SBTI and the Transition Pathway Initiative. EU Taxonomy-alignmentdatawasprovidedbyClarityAI. Thenegativescreeningcriteriawere implementedwithdatafromthe FinancialExclusionTrackerproject,aswellastheGlobal Coal Exit List (GCEL) and Global Oil and Gas Exit List (GOGEL) from Urgewald. The Technical Appendix (Data Description) provides more details on data sources.


Figure3 – Positive&negativescreeningcriteriafortransitionproducts
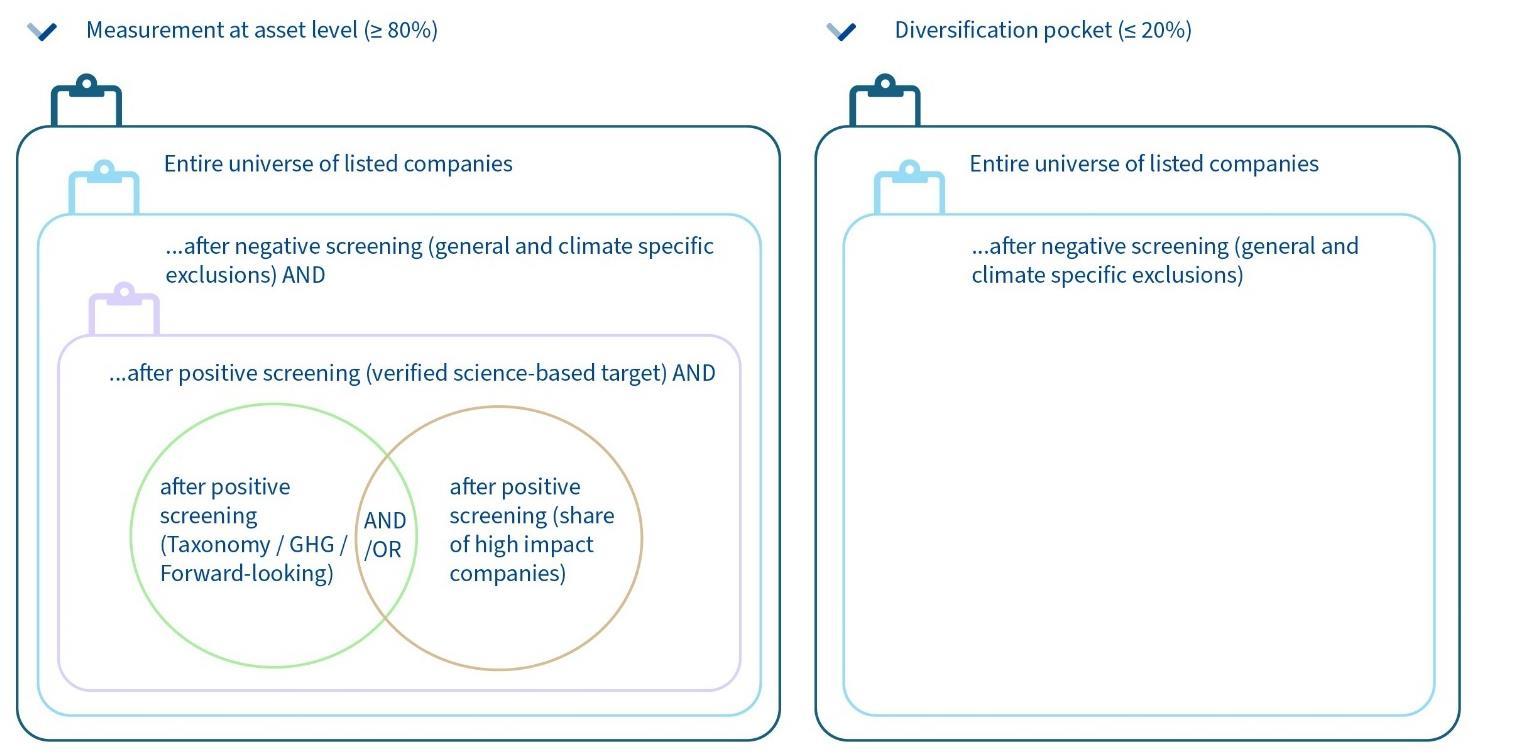
Negative screening: Exclusionscanrefertocategories of products orservices,company practices, or controversies (Global Sustainable Investment Alliance, 2023; Kölbel et al., 2020). After analysing existing sources (see Appendix E – Negative Screening Criteria), we distinguish between general exclusion criteria that apply regardless of the thematic focus, and topic- (here: climate-) specific exclusion criteria to avoid investments in companies that fundamentally contradict the objective of transition products.
General exclusion criteria. Some existing proposals mention general exclusion criteria that shall apply to all product categories (such as AMF France, 2024; see Appendix E –Negative Screening Criteria). We suggest this approach to align with established practices in the sustainable finance field. With “general exclusions” we refer to normbased and product-based approaches, also including social and governance aspects. The very recent ESMA guidelines on fund names (ESMA, 2024) state that EU Climate Transition Benchmark exclusion criteria apply to funds with transition-related terms in their fund names. We use these EU CTB exclusions as general exclusions in the analysis in Chapter 2.2 (see Table 3).
General exclusion criteria (EU CTB exclusions, Art. 12, a-c)


1. Companies involved in any activities related to controversial weapons.
2. Companies involved in the cultivation and production of tobacco.
3. Companies violating the UNGC Principles or OECD Guidelines for Multinational Enterprises (MNEs)
Climate-specific exclusion criteria: Transition products should not categorically exclude high-impact sectors. The recently published ESMA fund guidelines, for example, permit fossil fuel companies to be included in transition-related products (ESMA, 2024). There are intense debates over whether to divest from or engage with the fossil fuel sector15 (Gambetta, 2023; Moreland, 2024). The goal of impact-aligned climate transition productsis to investin high-impact companies thatimprove their performance over time. However,itcanbeargued thatnon-transformableactivities shouldbeexcluded, asthese cannot be positively changed (Busch et al., 2024). These could include always harmful activities identified by the Platform on Sustainable Finance (Platform on Sustainable Finance, 2022). Atanoperationallevel, whenevaluatingcompanies engagedin extremely harmful activities such as fossil fuels, we therefore suggest that a) expansion of extremely harmful activities leads to an exclusion, and b) that companies must demonstrate a credible decarbonisation strategy assessed against a set of criteria. For the fossil fuel sector, we suggest stricter criteria for coal and less stricter criteria for oil
15 Some non-comprehensive impressions from the debate: PFZW (2024), a major Dutch pension fund conducted a twoyear engagement programme targeting the fossil fuel sector. After the two years, only seven fossil fuel companies are retained in their investment portfolio. 310 oil and gas companies have been sold. More insights on the credibility of fossil fuel phase outs can be extracted from Urgewald’s Global Coal Exit List (GCEL): Out of over 1,400 companies on the GCEL, only 71 have announced plans to exit coal. Of these, 41 companies have Paris Agreement-compatible exit dates. The other 30 companies have delayed their exits, with some planning new coal assets. Some companies have exit dates that are 20 years too late. Most companies plan to replace coal assets with new gas-fired power plants. Regarding credibility, several companies have postponed plant closures, including Ni Source (2023 to 2025), Helen Ltd (2024 to 2025), and Onyx Strategic Investment (2022 to 2024). Some, like The AES Corporation, have delayed their entire exit dates. These changes are frequent and not systematically recorded. This highlights the need to evaluate exit plans against a comprehensive list of criteria.


and gas (see Table 4). Further criteria that were not implemented are collected in Appendix F –.
Table4 - Climate-specificexclusioncriteria
Climate-specific exclusion criteria
Fossil fuel companies without credible transition efforts
Oil and Gas1:
• Companies must not invest in expansion as it contradicts the IEA Net Zero Emissions Scenario (IEA, 2021), and creates lock-in effects as oil- and gas infrastructure is intended to last throughout decades.
Coal2:
• Coal companies must meet a stringent set of criteria. We propose the following set of criteria as a starting point:
a. plans to expand coal & related infrastructure must be cancelled,
b. a Paris-aligned exit date must exist (2030 in OECD and EU, 2040 in RoW),
c. coal assets must be closed down and not sold to new owners,
d. companies need to provide a facility-byfacility closure plan,
e. coal power plants must be replaced by renewable resources,
f. Coal plant and mine closures must be accompanied with Just Transition plans,
g. no controversies (Urgewald, n.a. )
1) Free-to-download data is accessible via Urgewald’s Global Oil and Gas Exit List (GOGEL), or also via the CA100+ list for selected companies
2) Sourced from Urgewald’s Global Coal Exit List (GCEL)
Besides negative screenings (exclusions), transition products are expected to implement positive screenings. The UK FCA (2023) refers to a “robust, evidence-based standard” (p. 33) which could comprise forward-looking indicators, references to taxonomy-aligned


KPIs or GHG-related trajectories, among others, to select and over- or underweight companies.
Regarding forward-looking indicators, the Dutch Authority for Financial Markets (AFM) suggestsacredibletransitionplan(withaphase-inoption)asaforward-lookingminimum criterion (AFM, 2023). Another evidence-based forward-looking indicator for positive screenings are science-based targets. Both variables, transition plans and sciencebased targets, are correlated with future GHG-emission reductions. Gehrke, Hessenius and Tietmeyer (2024) find that a transition plan at a company is associated with 7% lower carbon emission, while firms with a science-based target achieve 4% to 15% lower carbon emissions. As science-based targets are currently the more established variable, we only include science-based targets in our analysis in Chapter 2.2 (see Table 5). For more information on the transition plan debate (vs. targets), please see the infobox below.
- Forward-lookingpositivescreenings
Forward-looking positive screenings
Science-Based Target: Companies must have a verified science-based target.
The topic of transition plans has received significant interest in recent years. At the EU level, the disclosure oftransitionplans forclimate change mitigationis part ofthe ESRS E1 standard. This standard requires entities to report on their transition plans, if they exist, and detail their characteristics. Similarly, under the EU’s Corporate Sustainability Due Diligence Directive (CSDDD), entities are required to implement a transition plan. As a result, we can expect a significant increase in the disclosure and implementation of transition plans in the coming years. The elements outlined in the ESRS provide a basic framework that includes core characteristics such as GHG reduction targets, decarbonisation actions, and locked-in emissions.
Looking at forward-looking criteria in the context of transition products, the question arises how complementary information about investee companies’ targets and transition plans are. The science-based target sets the general level of ambition, while the transition plan outlines the strategy to achieve it. In other words, targets are an essential subcomponent of transition plans.
First,weargue that transitionplans shouldnot currently replace science-basedtargets as a forward-looking criterion. Over the past decade, science-based targets have


evolved significantly, and a target validated by the SBTi, for example, has considerable explanatory power (see Gehrke, Hessenius, Tietmeyer, 20-24). As transition plans are still a relatively new topic, there is less clarity about what constitutes a 'science-based' equivalent and about how to secure the credibility of transition plans.
Another approach could be to set criteria for transition products as an and condition: “Companies must have a science-based target and a transition plan.” According to our data collection, after applying exclusion criteria, 794 out of 3227 companies in the ACWI-EU universe have a verified science-based target. However, only 444 companies have both a verified SBT and a transition plan.
With this in mind, and to align with the European regulatory framework, we propose to include transition plans through a phase-in approach. As proposed by AFM Netherlands (2023), investee companies without a credible transition plan should be required to develop one within two years of becoming part of the portfolio.
Besides the forward-lookingindicators mentionedabove, thereare several other relevant measurements for positive screenings of transition products (see Table 6). For example, one of the criteria of EU Paris-aligned Benchmarks (EU PABs) is that issuers of equity securities need to have a reduction in GHG intensity of at least 7% on average per annum to increase their weight in the index (European Commission, 2020c). The analysis in Chapter 2.2. uses this indicator as one potential criterion for positive screening.
Another indicator for positive screening is taxonomy-aligned capital expenditure as a key forward-looking indicator. CapEx is forward-looking in nature and has the advantage of measuring resources already committed rather than future promises that may be withdrawn later. It has been prominently explored by the proposal for EU TaxonomyAligned Benchmarks (EU Platform on Sustainable Finance, 2023), which aims to increase the share of investment in environmentally sustainable capex. Furthermore, CapEx is already used in existing labels for financial products, such as the Nordic Swan Ecolabel or the Austrian Ecolabel (Nordic Swan 2023; Austrian Ecolabel / UZ 49, 2023). It is also part of the draft EU Ecolabel criteria (JRC, 2021).


Table6 - PABtrajectoryandtaxonomy-alignedCapExaspositivescreenings
PAB trajectory and taxonomy-aligned CapEx
1. EU Paris-aligned Benchmark GHG-trajectory:
a. The issuers of the securities have reduced their GHG intensity or, where applicable, their absolute GHG emissions, including Scope 1 and 2 GHG emissions, by an average of at least 7 % per annum for at least three consecutive years (European Commission, 2020c).16
2. Taxonomy-aligned CapEx:
a. Prioritise “companies investing in transition”: Companies whose % total taxonomy-aligned CapEx is higher than the % of taxonomy-aligned green revenues17 (JRC, 2020)
b. Taxonomy-Aligning Benchmarks: [not implemented but see footnote for potential future criteria]1
1) This approach has not been tested in Chapter 2.2 as we did not have access to historical CapEx data. Within the “CapEx securities” portion of a portfolio, which is defined as a proportional CapEx-to-Price ratio >1%, FIs could target an increase of 5% per annum of weighted average Taxonomy-aligned CapEx of the underlying investable universe (EU Platform on Sustainable Finance, 2023).
Another important aspect of transition products is that they invest in sectors or companies that have a high (negative) climate impact and, therefore, a high transition potential. Transition products focusing on the climate transition need to invest in sectors or companies with high GHG emissions. The Autorité des marches financiers (AMF), for example, argues that “a minimum share proportion of investments should be made in high impact climate sectors” (AMF, 2024, p. 5). The Net Zero Investment Framework (NZIF) has provided criteria to define high impact sectors that have high negative impacts from the perspective of the climate transition. In its rules on how to assess the alignment of assets to net-zero pathways, the NZIF defines higher impact companies as “Companies on the Climate Action 100+ focus list; companies in high impact sectors consistent with Transition Pathway Initiative sectors; banks; and real estate” (NZIF, 2021, p. 16). We use this definition for the analysis in Chapter 2.2 (see Table 7) Appendix F –
16 Due to data availability issues, the analysis does not include Scope 3 GHG emissions.
17 This definition has been discussed to define “companies investing in transition” during draft version 3 of the EU Ecolabel. The purpose was to broaden the investable universe.


provides a list of additional indicators that transition products could apply that are not part of the analysis in Chapter 2.2.
Table7-Definitionhighimpactcompanies
High impact companies (NZIF)
1. Companies on the Climate Action 100+ focus list
2. Companies in high impact sectors consistent with the Transition Pathway Initiative sectors18
3. Banks19 or companies in the real estate sector
18 See Net Zero Investment Framework Implementation Guidance, Appendix B for a list of GICS sector codes. (link)
19 Banks are a considered as a high-impact sector because they are crucial to the global economy, supporting investments and financing that drive decarbonization and climate adaptation, making their alignment with net zero goals essential for sustainable growth. See Net Zero Standard for Banks (IIGCC, 2023)
High-level analysis of applying the fund criteria


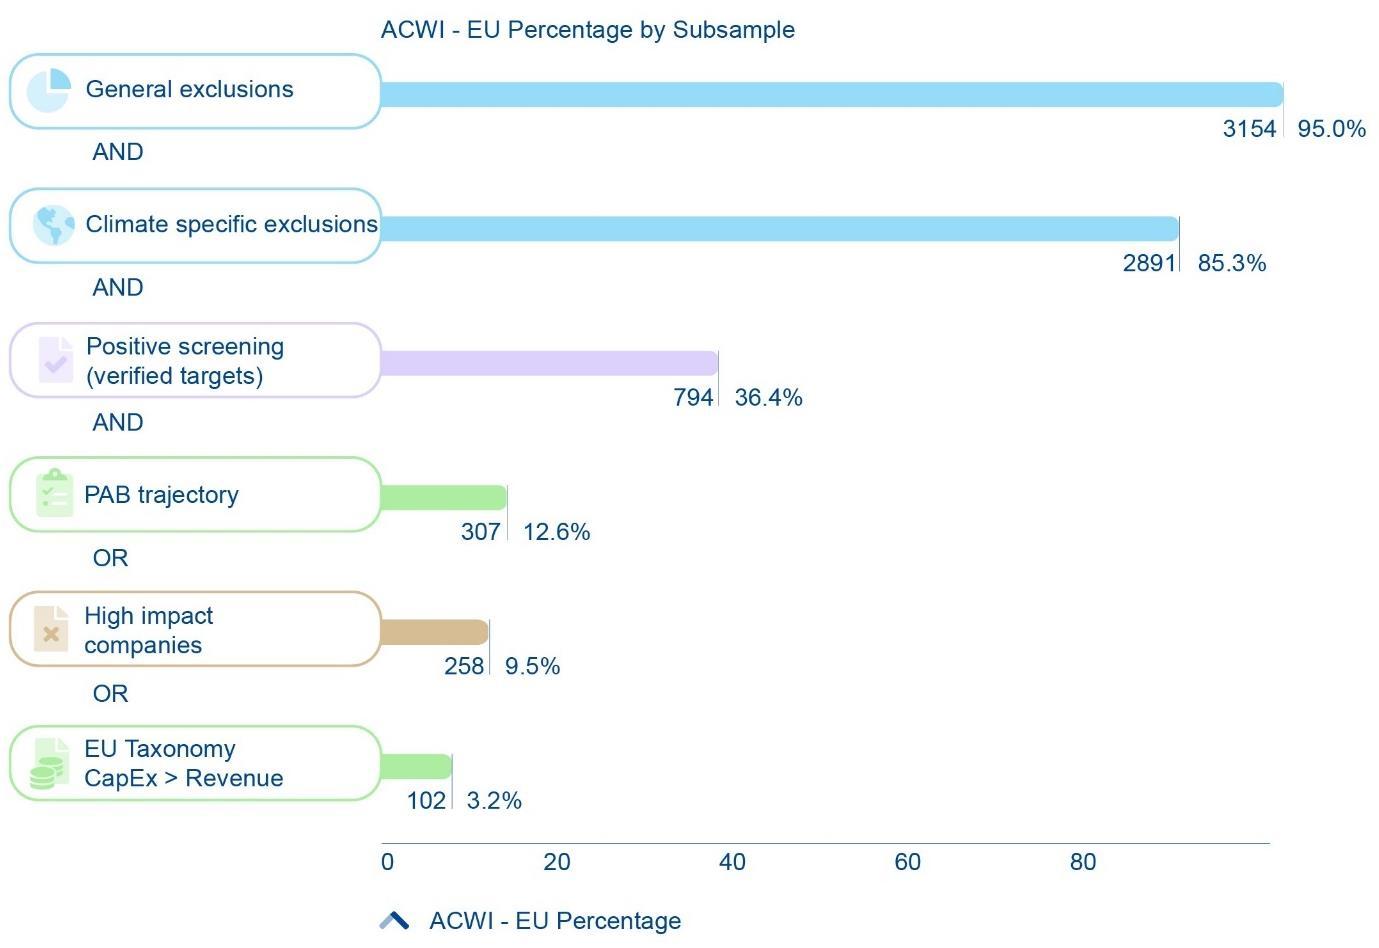
To evaluate the practical implications of the criteria presented in Chapter 2.1, we assess how applying these criteria influences the remaining number of firms in the investable universe, using an extended version of the MSCI ACWI (ACWI-EU20). These calibrations are not intended as final recommendations but rather to encourage evidence-based discussions. The graphic below offers a comprehensive overview of the number of companies and their market-cap weighted percentage relative to the ACWI-EU sample after applying our criteria.
Figure4-RemainingcompaniesinACWI-EU
20 We have taken the MSCI ACWI constituents (~3000 companies) and expanded the universe to include all listed mid-cap companies in the EU and UK, resulting in a universe of ~3300 companies. For simplicity, we refer to this sample as ACWI-EU throughout the report.


The data shows that general and climate-specific exclusions have a relatively minor impact on our sample, resulting in a reduction of approximately 15%. However, setting a strict criterion that companies must have a verified science-based target significantly reduces the investment universe to almost one-third. The remaining universe of 794 companies could form the basis of the ≥80% that must be invested in transition investments 21 . This universe would be larger in absolute numbers if the investable universe is extended beyond the analysed ACWI-EU benchmark.
To build a portfolio from this remaining universe of 794 portfolio companies, fund managers can apply various strategies to select, over- or underweight portfolio companies. Here are some illustrative, non-exclusive approaches:
• To incentivise GHG reductions, companies can be selected (or overweighted) if they meet the PAB trajectory criterion. Applying this filter reduces the sample to 307 companies.
• Engagement activities, for example, can be concentrated on companies with a high climate impact. According to the applied definition, 180 companies qualify (all of them having a verified target)
• Taxonomy-aligned KPIs could be used to identify transitioning companies. For example, only considering companies where EU Taxonomy-aligned CapEx exceeds EU Taxonomy-aligned revenue, as one potential definition of a “transitioning company”, reduces the universe to 102 companies 22 . When taxonomy time-series data becomes available, further criteria can be implemented from the EU Taxonomy-Aligning Benchmark (EU Platform on Sustainable Finance, 2023).
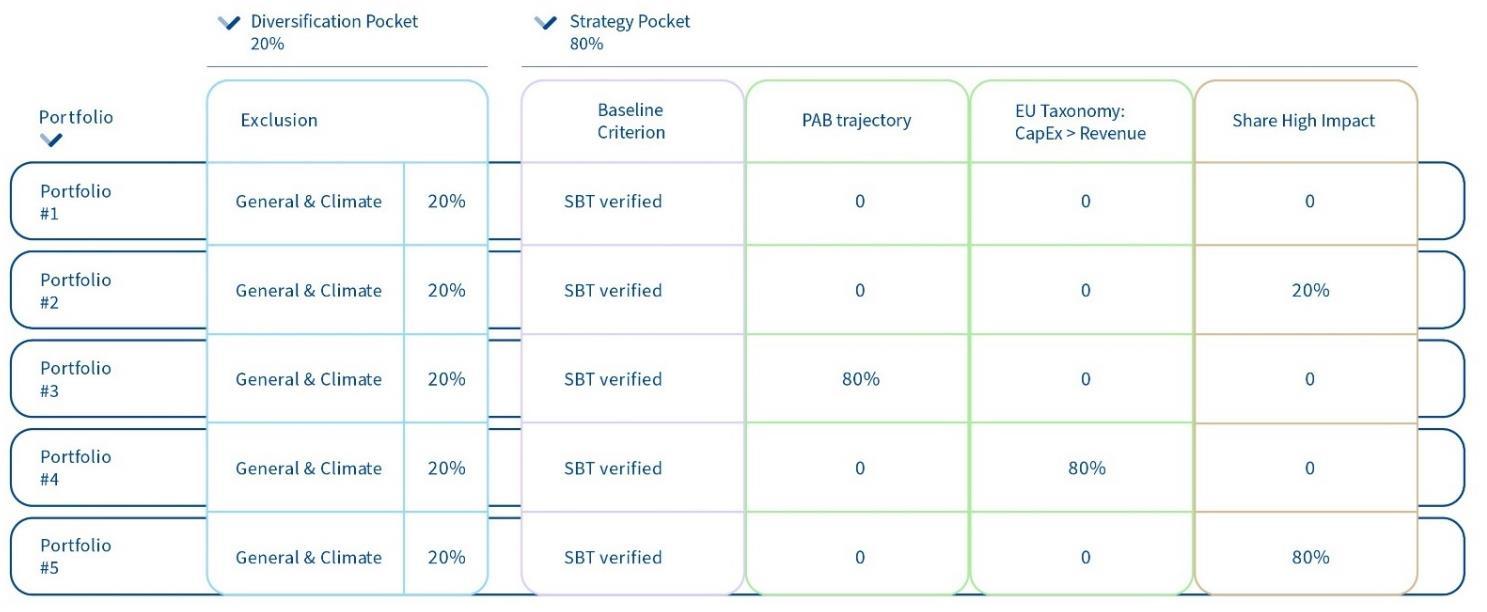
Using the concepts and criteria outlined above, this section constructs exemplary market-cap weighted portfolios to explore risk-return considerations in realistic settings. We define five different portfolios with different combinations of negative and positive screenings. Allcombinationsinclude a diversification pocket, whichportfolio managers can use to allocate capital to companies available in the investable universe after applying the general and climate-specific exclusion criteria (i.e. a sample of 2891 companies). The remaining 'strategy pocket' is allocated to investments that meet the
21 Note also our elaborations in the “Infobox on transition plans” above. Changing the criterion from “companies must have a verified science-based target” to “companies must have an SBT and a transition plan” would reduce this number to 444 companies.
22 The remaining universe is so low because EU Taxonomy-aligned CapEx data was barely available for non-EU companies (Clarity AI data).


baseline criterion of having a science-based target beyond the exclusions (i.e. starting from the remaining universe of 794 companies).
The following formula is applied to derive a portfolio consisting of market-cap weighted companies23 .
Table 8 presents an overview of the applied combinations, following this formula. Portfolio 1 allocates 20% to the diversification pocket, with the remaining 80% invested in non-excluded companies that have a verified science-based target. Portfolio 2 is similar but ensures that at least 20% is invested in companies fulfilling the definition of a high climate impact company (all having a verified target). Portfolios 3 to 5 explore different extremes by following a single asset selection methodology.
Table8 – Portfoliocombinations
This section provides an overview and comparison for the different portfolio configurations, providing an analysis of their cumulative returns (Figure 5) and realised
23 For every firm �� that is part of the diversification pocket (������), the portfolio weight is determined by dividing the market capitalization of firm �� by the sum of the market capitalizations of all ��������companies in the diversification pocket (∑ ��������
��=1 ). The same procedure is repeated for the strategy pocket (����������), which refers to the pocket with the ≥80% threshold. The weights of the diversification and strategy pockets are then multiplied by 0.2 and 0.8 respectively.


annual tracking errors (Figure 6). The interpretations and explanations for the graphics are provided in Table .
Cumulative Returns
Figure5 – Portfolioreturnsovertime
The graph displays the cumulative returns of five different portfolio configurations compared to a benchmark over the period from January 2018 to December 2023 Each portfolio starts at a cumulative return of 100, allowing for a comparative analysis of their performance over time. An interpretation of the graph can be found in Table .
In a first step, we plot the cumulative returns of portfolio 1-5 against the ACWI-EU universe. Note that these developments are potentially influenced by survivorship bias. Survivorshipbiasoccurs whenonlytheentities thathave“survived”untilaparticulardate are considered, ignoring those that have defaulted during the period. Therefore, the returns are likely to contain an upward bias24 On another note, concerns about limited financial returns are likely to be balanced out by the assumption that the investable universe will expand in the future as more firms are expected to set targets and develop transition plans. This is especially true for portfolio 4 that focuses that strongly depends on data availability of taxonomy-aligned revenue and CapEx.
24 We did not find a reasonable way to address survivorship bias, as transition indicators are inherently forwardlooking. Rebalancing the portfolio over did not appear suitable because, for instance, the number of verified sciencebased targets in 2018 was nearly zero. For shorter time periods, such as 2021-2023, we observed similar tracking errors and slightly reduced returns.


In addition to return, another component is the question of the portfolio’s volatility. Volatilities, as measured by the portfolio’s annualised standard deviation, are broadly in line with global benchmarks (see Table 9), ranging from 14.9% and 18.8%.
To gain a better understanding how the portfolio deviates from a global benchmark, we analyse the tracking error. The tracking error measures the deviation (standard error) of a portfolio's returns from its benchmark returns, indicating how closely the portfolio follows the benchmark's performance. A lower tracking error suggests a close alignment with the benchmark, while a higher tracking error indicates greater divergence. Tracking errors help asset managers to assess whether the portfolio is keeping pace with the ups and downs of the overall market.
Note that the tracking errors presented in Figure 6 are not optimised since the portfolios are simply derived from market-cap weights. The tracking-error could therefore be (significantly) lower for an optimised portfolio, see for example Qontigo (2023).
– TrackingErrorofPortfolios

The graph displays the tracking errors for five different portfolio configurations. Note that this is not an optimised portfolio as it simply weights all eligible companies by their market capitalisation. The tracking errors could therefore be significantly lower. The interpretation can be found in Table
Both graphs (Figure 5 – Portfolio returns over time; Figure 6 – Tracking Error;) are interpreted in Table 9 below.
#1 20% 80% verified SBTs
#2 20% 80% verified SBTs with 20% invested in high impact sectors
#3 20% 80% verified SBTs and all fulfilling PAB trajectory criterion
#4 20% 80% verified SBTs and all fulfilling Capex > Revenue
#5 20%
(+11%)
(+20%) 4.7%


verified SBTs and all belonging to high impact sectors
(-17%) 11.1% 17.05% (+1.91%)
This portfolio outperforms the benchmark in terms of returns, with slightly higher volatility. The current tracking error of 3.8% could be optimised and reduced to at least below 3% in a tracking error optimised portfolio.
For a visualisation of the strategy pocket, see Appendix G –Overview Charts With Sectoral and Geographical Distribution.
Lower returns than portfolio 1. The additional constraint of 20% investments in high climate impact companies (with a verified target) increased the tracking error from 3.8 to 4.5.
Above benchmark returns, below benchmark volatility. Tracking error increases with greater deviation from benchmark universe.
For a visualisation of the strategy pocket, see Appendix G –Overview Charts With Sectoral and Geographical Distribution.
This exemplary portfolio has the highest tracking error / deviation from the benchmark due to its significantly reduced universe. Significant underperformance.
For a visualisation of the strategy pocket, see Appendix G –Overview Charts With Sectoral and Geographical Distribution
This portfolio has the highest volatility, probably due to its sectoral bias. Returns are 13% lower than the ACWIEU universe. In terms of return, this portfolio has the highest deviation from the benchmark.
For a visualisation of the strategy pocket, see Appendix G –Overview Charts With Sectoral and Geographical Distribution
Both configurations show competitive risk-return characteristics (although the survivorship bias should be borne in mind). Given that the investable universe is likely to grow over time as more companies commit to setting targets & adopting transition plans, this appears to be a feasible set of criteria.
Despite the reduced universe, volatility is low and returns above the benchmark. The PAB trajectory criterion seems to provide a balanced risk-return profile with occasional outperformance.
Note that the universe is limited (see Appendix G) as we did not have access to EU taxonomy-aligned CapEx data for non-EU companies. Relying on estimates plus future EU taxonomy expansion will widen the scope.
The high-impact only strategy introduces considerable limitations. Note that other high impact metrics could be applied (see Appendix F – Positive Screening).
a) cumulative returns between January 2018-December 2024, comparison to benchmark (=market cap weighted ACWI-EU universe) presented in parentheses
b) annualised tracking error compared to benchmark (=market cap weighted ACWI-EU universe)
c) annualised volatility, measured by standard deviation multiplied by √252 (= number of trading days per year), comparison to benchmark in parentheses


Insummary,theanalysesshowthat portfolios 1and2have a(relatively)stablerisk-return profile that slightly outperforms the benchmark. It is important to understand that these portfolios could still be turned into tracking error optimised (or return optimised) portfolios as an actual fund would contain significantly fewer companies (<100). Portfolios 3 to 5 explored different extremes by following a single asset selection methodology, while portfolios 4 and 5 experienced significant underperformance and deviation from the ACWI-EU benchmark.
The comparison between portfolios 2 (20% high impact) and 5 (80% high impact) suggests that a potential minimum proportion of high-impact companies should not be set too high as volatility and tracking error increase. Note that this observation depends on the definition of what constitutes a high-impact company or sector (see Appendix F).
Overall, the results suggest that transition funds, exemplified by the above criteria, can potentially track and outperform a broad benchmark universe, with similar volatility patterns. Depending on their preferences and philosophies, investors can consider different levels of transition criteria, performance, and risk considerations.
Accompanied by an ambitious engagement strategy that explicitly targets high-impact companies, the investor’s contribution potential can be maximised. We expect to see an increase in the adoption of transition plans and science-based targets as a result of the adoption and implementation of the ESRS E1 transition plan criteria, along with the CSDDD Article 15 on transition plan implementation. We are confident that this can support fund managers to construct more trustworthy transition products.
However, regulators should also keep in mind that if criteria are too restrictive, the universe shrinks significantly, resulting in higher volatility, tracking errors, and lower returns. We therefore suggest setting minimum criteria acting as entry points.
The discussion around transition products is embedded in the discourse and regulatory efforts to establish meaningful product categories for retail and institutional investors. Transition products deserve special attention because they are particularly vulnerable to greenwashing, as they are by definition 'forward looking', promising for example GHG reductions over time. The purpose of this white paper is to structure the debate and provide guardrails around this product category. There is now a window of opportunity, particularly at EU level, with a potential review of the SFDR. Only with ambitious but feasible criteria can we maximise the potential of transition finance products.
At the policy level, we suggest that regulators should set minimum criteria for key characteristics that serve as entry points for financial institutions. Within these parameters, FIs can adopt more ambitious strategies, striking a balance between


prescriptiveandprinciples-basedcriteria.Weproposethefollowingcriteria,derivedfrom a thorough review of existing content. In addition, our data analysis revealed competitive risk-return characteristics for products that implement these characteristics
Figure7Proposedsetofcriteriaforclimate-transitionproducts


This white paper’s analysis is restricted to a public equity universe with a focus on environmental and climate aspects of the transition. We, therefore, recommend further research and discussions on:
• Implementing transition products in other asset classes: e.g. Private equity and debt, real estate, or infrastructure.
• Other sustainability dimensions: While we exemplified the analysis for climate objectives, the next question would be how to transfer the learnings to other environmental dimensions, such as biodiversity. We believe that our extracted key characteristics can help structuring this debate.25 This paper does also not focus on the social dimension of the transition, even though it is an important part of transition efforts (see Chapter 1.1). Future research will need to provide guidance on implementing social transition products.
• Investor contribution: While this report focuses on criteria to measure transition investments, scientific evidence reveals a significant investor contribution potential in public equity markets for investor stewardship. While Figure 7 above outlines core qualitative characteristics, more discussion is needed to agree on how to measure investor contribution and to arrive at quantitative minimum thresholds (such as X% of portfolio companies are covered by active engagement).
Overall, this paper provides important inputs for the ongoing discussions on transition product categories, creating the basis for discussing both potential minimum criteria and concrete implementation. We welcome feedback to these results from all sides in order to increase the uptake and quality of transition products.
25 Example for a potential biodiversity (transition) product category: (1) topic specific exclusions – Identify activities that are extremely harmful to biodiversity (e.g., using DNSH criteria), and exclude expansionists. (2) baseline criterion: Focus on companies that have a science-based land use target, or a biodiversity transition plan.


2 Degree Investing Initiative. (2023). MovingtheBlockersofRetailSustainableFinance. https://2degrees-investing.org/resource/moving-the-blockers-of-retail-sustainablefinance/
AFM Netherlands. (2023). AFM position paper on improving the SFDR. https://www.afm.nl/en/sector/actueel/2023/november/position-paper-SFDR
AMF France. (2024). Towards a review of SFDR. Position paper. https://www.amffrance.org/en/news-publications/amfs-eu-positions/towards-review-sfdr
Australian Government – The Treasury. (2023). Sustainable Finance Strategy (Consultation Paper). https://treasury.gov.au/sites/default/files/2023-11/c2023456756.pdf.
Austrian Ecolabel (2024). Austrian Ecolabel Guideline UZ49 – Sustainable Financial Products. Version 6.0 .https://www.umweltzeichen.at/file/Guideline/UZ%2049/Long/UZ49_R6.0a_Sustainabl e%20Financial%20Products_2024_EN.pdf
Bauer R., Derwall, J. & Tissen, C. (2022). Private Shareholder Engagements on Material ESG Issues. Financial Analysts Journal. https://papers.ssrn.com/sol3/papers.cfm?abstract_id=4171496
Benz, L., Paulus, S., Scherer, J., Syryca, J., & Trück, S. (2021). Investors' carbon risk exposure and their potential for shareholder engagement. Business Strategy and the Environment,30(1), 282-301.
Broccardo, E., Hart, O., and Zingales, L., 2020, "Exit versus Voice," Journal of Political Economy
Busch, T., van Hoorn, V., Stapelfeldt, M. & Pruessner, E. (2022). ClassificationScheme for Sustainable Investments. https://papers.ssrn.com/sol3/papers.cfm?abstract_id=4217864
Busch, T. & Pruessner, E. (2023). PositionPaperonImprovingtheSFDR -Proposalfor financial product categories from a sustainability perspective. https://www.sfrg.org/_files/ugd/c3edbc_95eb023214a84ba3ba3abec582ce4861.pdf
Busch, T. Pruessner, E., Oulton, W., Palinska, A. & Garrault, P. (2024). Methodologyfor Eurosif Market Studies on Sustainability-related Investments. https://www.eurosif.org/wp-content/uploads/2024/02/2024.02.15-Final-ReportEurosif-Classification_2024.pdf


Caldecott, B. (2022). Defining transition finance and embedding it in the post-Covid-19 recovery. Journal of Sustainable Finance & Investment, 12(3), 934-938. https://www.tandfonline.com/doi/full/10.1080/20430795.2020.1813478
Clarity AI & CDP. (2023). Stronger Together - Exploring the EU Taxonomy as a Tool for Transition Planning. https://cdn.cdp.net/cdpproduction/cms/reports/documents/000/007/463/original/2023_EU_Taxonomy_Report. pdf?1701693546
Climate Bonds Initiative (CBI). (2020). Financingcredibletransitions-Howtoensurethe transition label has impact. [White Paper]. https://www.climatebonds.net/files/reports/cbi_fincredtransitions_final.pdf
Climate & Company and University of Kassel. (2023). Review of the SFDR – Remarks on GHG reduction targets and carbon credits. https://issuu.com/climateandcompany/docs/climateandcompany_sfdrpolicybrief-ghg
Dimson, E., Karakas, O. & Li, X. (2023). Coordinated Engagements. EuropeanCorporate Governance Institute – Finance Working Paper No. 721/2021. https://papers.ssrn.com/sol3/Papers.cfm?abstract_id=3209072
Dietz et al. (2021), TPI State of Transition Report 2021, https://www.transitionpathwayinitiative.org/publications/82.pdf?type=Publication
Dyck, A., Lins, K., Roth, L. & Wagner, H. (2019). Do institutional investors drive corporate social responsibility? Internationalevidence.JournalofFinancialEconomics,131(3), 693-714. https://www.sciencedirect.com/science/article/pii/S0304405X18302381
European Supervisory Authorities (ESAs). (2024). JoinESAsOpinionontheassessmentof the Sustainable Finance Disclosure Regulation (SFDR) https://www.esma.europa.eu/sites/default/files/202406/JC_2024_06_Joint_ESAs_Opinion_on_SFDR.pdf
ESMA. (2023a). Consolidatedquestionsandanswers(Q&A)ontheSFDR(Regulation(EU) 2019/2088)andtheSFDRDelegatedRegulation(CommissionDelegatedRegulation(EU) 2022/1288) https://www.esma.europa.eu/sites/default/files/2023-05/JC_2023_18__Consolidated_JC_SFDR_QAs.pdf
ESMA. (2023b). Progress Report on Greenwashing. https://www.esma.europa.eu/sites/default/files/2023-06/ESMA30-16684169272498_Progress_Report_ESMA_response_to_COM_RfI_on_greenwashing_risks.pdf
ESMA. (2023c). ReviewofSFDRDelegatedRegulationregardingPAIandfinancialproduct disclosures. https://www.esma.europa.eu/sites/default/files/202304/JC_2023_09_Joint_consultation_paper_on_review_of_SFDR_Delegated_Regulation.p df


ESMA. (2024). Final Report Guidelines on funds’ names using ESG or sustainabilityrelated terms. https://www.esma.europa.eu/sites/default/files/2024-05/ESMA34-472440_Final_Report_Guidelines_on_funds_names.pdf
EU Platform on Sustainable Finance. (2021). Transition Finance Report. https://finance.ec.europa.eu/document/download/c5e91dc2-7a28-4a30-aae99fd667195d28_en
EU Platform on Sustainable Finance. (2022). The Extended Environmental Taxonomy: Final Report on Taxonomy extension options supporting a sustainable transition. https://finance.ec.europa.eu/system/files/2022-03/220329-sustainable-financeplatform-finance-report-environmental-transition-taxonomy_en.pdf
EU Platform on Sustainable Finance. (2023). Climate Change Taxonomy and the EU Regulatory Response: EU Taxonomy-Aligning Benchmarks (TABs) Report. https://finance.ec.europa.eu/system/files/2023-12/231213-sustainable-financeplatform-draft-report-eu-taxonomy-aligning-benchmarks_en.pdf
European Commission. (2020a). Regulation(EU)2020/852oftheEuropeanParliament and of the Council of 18 June 2020 on the establishment of a framework to facilitate sustainable investment, and amending Regulation (EU) 2019/2088 https://eurlex.europa.eu/legal-content/EN/TXT/?uri=CELEX%3A32020R0852&qid=1702038862056
European Commission. (2020b). Consolidated text: Regulation (EU) 2019/2088 of the EuropeanParliamentandoftheCouncilof27November2019onsustainability‐related disclosures in the financial services sector https://eur-lex.europa.eu/legalcontent/EN/TXT/?uri=CELEX%3A02019R2088-20200712
EuropeanCommission.(2020c). CommissionDelegatedRegulation(EU)2020/1818of17 July2020supplementingRegulation(EU)2016/1011oftheEuropeanParliamentandof theCouncilasregardsminimumstandardsforEUClimateTransitionBenchmarksand EU Paris-aligned Benchmarks https://eur-lex.europa.eu/legalcontent/EN/TXT/?uri=CELEX:32020R1818
European Commission. (2021). Commission Delegated Regulation (EU) 2021/2139. https://eur-lex.europa.eu/legal-content/EN/TXT/PDF/?uri=CELEX:32021R2139
European Commission. (2023a). Targeted Consultation Document Implementation Of The Sustainable Finance Disclosures Regulation - SFDR. https://finance.ec.europa.eu/document/download/99bc25fe-4dd8-4b57-ab37212b5ab05c41_en?filename=2023-sfdr-implementation-targeted-consultationdocument_en.pdf


European Commission. (2023b). Commission Recommendation (EU) 2023/1425 On Facilitating Finance For The Transition To A Sustainable Economy. https://eurlex.europa.eu/legal-content/EN/TXT/PDF/?uri=CELEX:32023H1425
EuropeanCommission.(2023c). CommissionDelegatedRegulation(EU)2023/2772of31 July 2023 supplementing Directive 2013/34/EU of the European Parliament and of the Council as regards sustainability reporting standards. https://eur-lex.europa.eu/legalcontent/EN/TXT/?uri=CELEX%3A32023R2772
Gambetta, G. (2023, August 9). Investorsrampupdemand-sideengagementamid frustrationwithfossilfuelmajors. Responsible Investor. https://www.responsibleinvestor.com/investors-ramp-up-demand-side-engagement-amid-frustration-withfossil-fuel-majors/
Gehrke, Hessenius & Tietmeyer (2024), The Role of Sustainable Management Practices in the Transition of Corporates Towards Net-Zero. WorkingPaper. Available at SSRN: http://dx.doi.org/10.2139/ssrn.4803529
G20. (2022). Indonesia 2022 - G20 Sustainable Finance Working Group. https://g20sfwg.org/wp-content/uploads/2022/10/2022-G20-Sustainable-FinanceReport-2.pdf
GFANZ. (2022). Financial Institution Net-zero Transition Plans Fundamentals, Recommendations, and Guidance. https://assets.bbhub.io/company/sites/63/2022/09/Recommendations-and-Guidanceon-Financial-Institution-Net-zero-Transition-Plans-November-2022.pdf
Global Sustainable Investment Alliance. (2021). GlobalSustainableInvestmentReview 2020. http://www.gsi-alliance.org/wp-content/uploads/2021/08/GSIR-20201.pdf
Global Sustainable Investment Alliance. (2023). DefinitionsforResponsibleInvestment Approaches. https://www.gsi-alliance.org/wp-content/uploads/2023/10/ESGTerminology-Report_Online.pdf
Goldman Sachs. (2023). SFDR,twoyearson-TrendsandAnatomyofArticle8&9funds in 2023. https://www.goldmansachs.com/intelligence/pages/gs-research/sfdr-twoyears-on-trends-and-anatomy-of-article-8-and-9-funds-in-2023/report.pdf
IIGCC. (2023). Net Zero Standard for Banks. https://139838633.fs1.hubspotusercontenteu1.net/hubfs/139838633/Past%20resource%20uploads/IIGCC-Net-Zero-Standardfor-Banks-June-2023.pdf
IIGCC (n.d.) NetZeroStewardshipToolkit. https://139838633.fs1.hubspotusercontenteu1.net/hubfs/139838633/Past%20resource%20uploads/IIGCC%20Net%20Zero%20St ewardship%20Toolkit.pdf


Impact Management Platform (IMP). (2024). Key terms and concepts. https://impactmanagementplatform.org/terms-and-concepts/
International Capital Market Association (ICMA). (2024). TransitionFinanceintheDebt Capital Market. https://www.icmagroup.org/assets/Transition-Finance-in-the-DebtCapital-Market-paper-ICMA-14022024.pdf
International Energy Agency (IEA). (2021). Net Zero by 2050. https://www.iea.org/reports/net-zero-by-2050.
International Platform on Sustainable Finance (IPSF). (2023). Implementing transition finance principles. https://finance.ec.europa.eu/document/download/f332838d-a5da4279-8986-dbb38a212432_en?filename=231204-ipsf-transition-finance-interimreport_en.pdf
JRC. (2020). DevelopmentofEUEcolabelcriteriaforRetailFinancialProducts. Technical Report 3.0. https://susproc.jrc.ec.europa.eu/product-bureau/sites/default/files/202011/Draft%20Technical%20Report%203%20-%20Retail%20financial%20products.pdf
JRC. (2021). DevelopmentofEUEcolabelcriteriaforRetailFinancialProducts. Technical Report 4.0. https://susproc.jrc.ec.europa.eu/product-bureau/sites/default/files/202103/2021.03.05%20-%20EUEL%20financial%20products%20%20Technical%20Report%204%20FINAL.pdf
Kölbel, J. F., Heeb, F. & Busch, T. (2020). Can Sustainable Investing Save the World? Reviewing the Mechanisms of Investor Impact. SageJournals,33(4), 554-574
Mak, W., & Vinelli, A. (2024). NavigatingTransitionFinance:AnActionList. CFA Institute –Research & Policy Center. https://rpc.cfainstitute.org//media/documents/article/industry-research/transition-finance.pdf
Mangot, M. (2023). Mechanism#3:engageandvote. Discussion paper series on investor impact mechanisms. 2 Degree Investing Initiative. https://2degrees-investing.org/wpcontent/uploads/2023/03/Discussion-paper-3-engage-and-vote.pdf
Mangot, M. & Bayer, C. (2022). Whatdoyourclientsactuallywant? 2 Degree Investing Initiative. https://2degrees-investing.org/wp-content/uploads/2022/05/What-do-yourclients-actually-want.pdf
Mangot, M. & Koch, N. (2023). TheImpactPotentialAssessmentFramework(IPAF)for financial products. 2 Degree Investing Initiative. https://2degrees-investing.org/wpcontent/uploads/2023/03/The-Impact-Potential-Assessment-Framework-IPAF-1.pdf
Urgewald. (n.d.). 7 Criteria for a Credible Coal Phase-Out Plan. https://www.coalexit.org/coal-phase-out-plans.


Moreland, J. (2024, February 12). Whyweshouldabandonclimateengagementwithoil andgasfirms. Net Zero Investor. https://www.netzeroinvestor.net/news-and-views/whywe-should-abandon-climate-engagement-with-oil-and-gas-firms
Natixis. (2021). Brown Industries – The transition tightrope. https://gsh.cib.natixis.com/api-websitefeature/files/download/12519/brown_industries_the_transition_tightrope_full_version_ natixis_gsh.pdf
Nordic Ecolabelling. (2021). Nordic Ecolabelling for Investment funds and investment products. https://svanemerket.no/content/uploads/2021/08/101eo_2_0_CD.pdf
NZAOA. (2023). Elevating Asset Manager Net-Zero Engagement Strategies. https://www.unepfi.org/wordpress/wp-content/uploads/2023/11/NZAOA_Engagementexpectations_final.pdf
NZIF. (2021). Implementation Guide. https://139838633.fs1.hubspotusercontenteu1.net/hubfs/139838633/Past%20resource%20uploads/Net_Zero_Investment_Framework_I mplementation%20Guide_Final.pdf
OECD. (2019). Transition Finance 2019. https://www.oecd.org/dac/financingsustainable-development/development-finance-topics/Transition-Finance-MainFindings-2019.pdf
Qontigo. (2023). Tracking Error 101: The Intuition Behing Measurement and Control. https://web.qontigo.com/hubfs/Whitepapers/2023%20Whitepapers/WP_Tracking%20E rror%20101_20230602.pdf
Swiss Government – The Federal Council. (2023, October 25). Furthereffortstoprevent greenwashing [Press Release]. https://www.admin.ch/gov/en/start/documentation/media-releases.msg-id98351.html
U.S. Securities and Exchange Commission. (n.d.). ESG Disclosures for Investment Advisers and Investment Companies [Fact Sheet]. https://www.sec.gov/files/ia-6034fact-sheet.pdf
UK Financial Conduct Authority. (2023). Sustainability Disclosure Requirements (SDR) and investment labels (Policy Statement PS23/16). https://www.fca.org.uk/publication/policy/ps23-16.pdf
United Nations UNCTAD (2023). SDG Investment Trends Monitor. https://unctad.org/system/files/official-document/diaemisc2023d6_en.pdf


Zink, J. (2022). WhichInvestorsSupportTheTransitionTowardsALow-CarbonEconomy? Exit and Voice In Mutual Funds. University of Augsburg. https://papers.ssrn.com/sol3/papers.cfm?abstract_id=4298973


TableA.1- Existing definitions of “transition”
Organisation
OECD
Climate Bond Initiative
Definition
“The 2030 Agenda for Sustainable Development (hereafter, 2030 Agenda) reaffirmed the international community’s commitment “to achieving sustainable development in its three dimensions –economic, social and environmental – in a balanced and integrated manner” (Paragraph 2). Here, we call “transition” the journey towards this goal and the achievement of sustainable development.” (OECD, 2019, p. 8)
“Before going further, it is important to be clear what we mean by ‘transition’. Delivering sustainable development requires clear and agreed transition pathways that have end-goals for all of the environmental and social objectives embedded in the SDGs. These end-goals have to be consistent with planetary boundaries and social and societal objectives like the Paris Agreement for climate change, and also have sufficiently ambitious trajectories. […] our focus is on the transition that entities, activities and assets need to make from today’s high greenhouse gas (GHG) emissions to levels commensurate with meeting the goals of the Paris Agreement. That is a ‘climate mitigation transition’. We start here as this is the focus of most transition-labelled transactions to date, and climate change is integral to achieving many of the SDGs.” (Climate Bond Initiative, 2020, p. 9).
European Commission
“Transition means a transition from current climate and environmental performance levels towards a climate- neutral, climate-resilient and environmentally sustainable economy in a timeframe that allows reaching:
(a) the objective of limiting the global temperature increase to 1,5 °C in line with the Paris Agreement and, for undertakings and activities within the Union, the objective of achieving climate neutrality by 2050 and a 55 % reduction in greenhouse gas
ICMA


emissions by 2030 as established in Regulation (EU) 2021/1119 of the European Parliament and of the Council (26);
(b) the objective of climate change adaptation (27); and
(c) other environmental objectives of the Union, as specified in Regulation (EU) 2020/852 as pollution prevention and control, protection and restoration of biodiversity and ecosystems, sustainable use and protection of marine and fresh-water resources, and the transition to a circular economy.” (European Commission, 2023b, p. 25).
"We believe that there are currently at least three different overlapping definitions in general use for transition finance. These can be differentiated from the wide to the narrow lens of what transition finance is understood to be achieving that we list and illustrate below:
- Economy-wide transition refers to transformation of the entire economy with the objective of meeting the goals of the Paris Agreement but also wider sustainable objectives (e.g. biodiversity or circular economy) embedded in taxonomies, or with reference to the UN SDGs (see for example G20 Sustainable Finance Report).
- Climate transition covers the goals of the Paris Agreement and the target of achieving Net Zero but typically with a narrower sectoral or industry focus especially on the energy and high-emissions sectors (see the OECD Guidance on Transition Finance).
- Hard-to-abate transition emphasises the specific challenges of reducing the emissions of the fossil fuel and hard-to-abate sectors or promoting more sustainable alternatives to their output (see for example Japan’s roadmaps for GHG-intensive industries)." (ICMA, 2024, p. 7)

TableB.1:Existingdefinitionsof “transition finance”
Organisation

Definition
OECD “Transition is the journey to sustainable development, and transition finance the financing of that journey." (OECD, 2019, p. 8)
G20
"Transition finance, as discussed in this report, refers to financial services supporting the whole-of-economy transition, in the context of the Sustainable Development Goals (SDGs), towards lower and net-zero emissions and climate resilience, in a way aligned with the goals of the Paris Agreement." (G20, 2022, p. 5)
European Commission “Transition finance means financing of investments compatible with and contributing to the transition, that avoids lock-ins, including:
(a) investments in portfolios tracking EU climate transition benchmarks and EU Paris-aligned benchmarks (‘EU climate benchmarks’);
(b) investments in Taxonomy-aligned economic activities, including:
transitional economic activities as defined by Article 10(2)ofRegulation (EU) 2020/852for the climate mitigation objective,
Taxonomy-eligible economic activities becoming Taxonomy-aligned in accordance with Article 1(2) of Commission Delegated Regulation (EU) 2021/2178 over a period of maximum 5 (exceptionally 10) years (28);
(c) investments in undertakings or economic activities with a credible transition plan at the level of the undertaking or at activity level;
(d) investments in undertakings or economic activities with credible science-based targets, where proportionate, that are supported by information ensuring integrity,
GFANZ
CFA
Caldecott, 2022


transparency and accountability. (European Commission, 2023b, p. 25).
“Transition finance: Investment, financing, insurance, and related products and services that are necessary to support an orderly, real economy transition to net zero as described by the four key financing strategies that finance or enable 1) entities and activities that develop and scale climate solutions; 2) entities that are already aligned to a 1.5 degrees C pathway; 3) entities committed to transitioning in line with 1.5 degrees C-aligned pathways; or 4) the accelerated managed phaseout of high-emitting physical assets.“ (GFANZ, 2022, p. 19)
"Transition finance is any form of financial support that helps decarbonise high emitting activities or enables the decarbonization of other economic activities." (CFA, 2024, p. 1)
“Transition Finance is the provision and use of financial products and services to support counterparties, such as companies, sovereigns, and individuals, realise alignment with environmental and social sustainability.” (Caldecott, 2022, p. 936).


UK FCA
Publications with explicit suggestions on transition products
FMPs must identify the investor stewardship strategy needed to deliver the sustainability objective. Requirement for an escalation plan-if assets are not demonstrating sufficient process.
AMF France (✓)
(None. Stewardship-related requirements have been removed from this label)
Only mentioned as disclosure requirement. (✓)
Only mentioned as disclosure requirement: Streamlined product disclosures could “consist of a mandatory reporting [...] on the implementation of the financial market participant’s engagement and voting policies towards undertakings invested by the product.
AFM
Netherlands
Engagement strategy is required (how companies are monitored; how voting rights are exercised; how dialogue is conducted); Plus, reporting on exit thresholds and metrics regarding measurement of investor contribution.
EU Ecolabel
Nordic Swan
(No quantitative requirements)
Publications with links / potential implications to transition products
Documented engagement policy required incl. objectives, strategy, methods, monitoring – with close links to EU regulation.
Target of engagement: issuer should reach at least 1 of 3 thresholds (GHG reduction, CapEx alignment, science-based targets); required to publish engagements with then largest holdings
(Engagement with at least 10% of portfolio companies + guidelines on dialogue & prioritization of companies)
(label criteria incentivise FMPs to have dialogue with 5/10% of portfolio companies)
(No minimum requirements but clear guidelines which companies to prioritise, i.e. those with low green revenue and green CapEx)
(Incentives to vote at AGMs for at least 25/50% of the fund’s holdings,70/90% if proxy voting service is used)
French ISR label
Swiss Climate Scores
in annual sustainability report + publish engagement strategy for non-conforming holdings; requires exit when non-conformity is verified
(requires fund to publish ESG engagement report on its website, if applicable on the page dedicated to the UCI; including e.g., number of ESG commitment actions)
(indicator mentioned: % of portfolio currently under active climate engagement)


(engagement strategy with clear objectives, timing, coverage, methodology in line with sustainability objective and escalation plan is required
(requires banks to establish a clear, group-wide position to conduct lobbying activities in line with the goal of limiting warming to 1.5°C)
(no specific requirements, but needs to be included in ESG engagement report if dialogue has been used as engagement tool)
(90% for French companies; 70% non-French companies)
(required to set engagement targets and use KPIs from NZAOA KPI framework)
(no specific requirement, but important tool for engagement strategy)
(Indicator mentioned: % of votes, over the last year, on climate resolutions voted in a manner consistent with the ambition of reaching net zero by 2050)
(no minimum requirement, but can be used to implement engagement strategy and reach sustainability objective)
(important tool of engagement strategy, no specific metrics)
(net zero voting policy required, no specific metrics)
(defines active dialogue as the basis of engagement)
(important tool as part of engagement strategy)
TableD.1-Positivescreeningmethods
UK FCA
(reference authoritative taxonomy relevant to the sustainability objective of the product e.g., EU Taxonomy)
(explicitly mentioned, with reference to the Capex KPI)


Are minimum criteria proposed?
Publications with explicit suggestions on transition products
(“emissions profiles”, e.g., minimum absolute threshold of GHG emissions)
(decarbonisation trajectory of financial products; use of absolute emissions)
(mentioned as an example to select assets: forwardlooking metrics, transition plans, strategies [that demonstrate transition efforts]
(transition plans, in particular aligned with ESRS, minimum share aligned with 1.5C)
(credible transition plans, aligned with CSRD. If no transition plan, companies should have one within the next two years)
Focus on high-impact companies?5
(Implicitly: companies shall have the potential to become more sustainable over time, based on a “robust, evidencebased standard”
(“minimum proportion in highimpact climate sectors”)


1) Reference to an authoritative taxonomy. In particular, taxonomy-aligned CapEx could be used as a KPI (should be dynamic and move upwards over time)
2) e.g. setting a minimum absolute threshold of GHG emissions for assets
3) Companies that have signaled willingness to walk the talk, e.g., via science-based targets and/or transition plans.
4) For example, proposed minimum criteria, regardless of the investment methodology.
5) Does the report mention a focus on high impact companies/sectors?

Negative Screening: General and Climate-Specific Exclusion Criteria

General Exclusions Topic-specific exclusions (exemplified for climate)
Eurosif White Paper
UK FCA
AMF France
Referencing exclusions or normbased screening, focusing on violations against specific norms or values ((e.g., production of tobacco, alcohol, or violation of human rights)
Referencing non-transformable economic activities (EU Platform on Sustainable Finance, 2022)
“Any other assets [outside the >70% chosen by investment methodology] must not conflict with the sustainability objective”
Exclusions common to all categories (controversial weapons, tobacco and companies “that do not follow practices of good governance”)
n/a
EU Climate Transition Benchmark
AFM Netherlands EU Paris Aligned Benchmark Regulation, Art 12 a-c: controversial weapons, tobacco, violation of UN Global Compact or OECD Guidelines for MNEs n/a
Art. 12 d-g: d) >1% coal/lignite; e) >10% oil fuels; f) >50% gaseous fuels; g) >50% GHG intensity of >100 g CO2e/kWh
EU Ecolabel
Various exclusions based on social and governance aspects
Various exclusions based on environmental aspects (e.g., harmful agriculture, or non-certified forestry). The fossil fuel sector is excluded unless certain transition indicators are met.

Source Further Potential Criteria
EU Platform of Sustainable Finance (exemplary list of non-transformable activities)
EU Climate Benchmark Regulation, Art. 12 d-g

• thermal coal mining and peat extraction
• construction of new housing in extreme high-risk flood areas
• and activities that destroy ecosystems with high biodiversity value
• companies that derive 1% or more of their revenues from exploration, mining, extraction, distribution, or refining of hard coal and lignite
• companies that derive 10% or more of their revenues from the exploration, extraction, distribution, or refining of oil fuels
• companies that derive 50% or more of their revenues from the exploration, extraction, manufacturing, or distribution of gaseous fuels
• companies that derive 50% or more of their revenues from electricity generation with a GHG intensity of more than 100g CO2 e/kWh.


Some criteria that were not implemented in the data analysis but are included here.
Source Further Potential Criteria
“Revenue threshold: Company investing in transition” (EU Ecolabel)
It currently generates between 5 and 50% of its total revenue from environmentally sustainable economic activities, and a formal commitment has been made to close down capital assets that would otherwise be excluded under criterion 3.1. (JRC, 2021)
Approach
Based on energy intensity
Based on Transition Pathway Initiative (TPI)
Sectoral lists derived from other ecolabels
Transitional activities according to the EU Taxonomy
Further Potential Criteria to Define High (Negative) Impact Companies
Benz et al. (2020) suggest an industry-based definition of transition sectors, following the Refinitiv Business Classification (TRBC). This approach is similar to NZIF’s approach used in the main text. See Climate & Company and University of Kassel (2023), Annex I, Approach 1.
The Transition Pathway Initiative has thus far identified 16 business sectors on the transition to a low carbon economy across four clusters (Dietz et al., 2021).
The Nordic Swan Label or the draft EU Ecolabel criteria also contain insights on critical sectors. See Climate & Company and University of Kassel (2023), Annex I, Approach 3 & 4 for an overview.
Another idea to identify transition sectors is to look at the economic activities a company engages in. The EU Taxonomy has thus far identified transitional activities for climate change mitigation in the following five sectors: construction and real estate; energy; information and communication; manufacturing; transport. The whole list can be found under the EU Taxonomy Compass
The additional approaches on identifying companies with a high climate impact have been extracted from a previous policy brief (Climate & Company and University of Kassel, 2023).


The following graphs illustrate the characteristics of the different subsamples (or 80% "strategy pockets"). The upper section shows the criteria applied and the remaining subsample within the ACWI-EU universe. The lower section shows the sectoral and geographical distribution in percentage terms (weighted by market capitalisation).
FigureG.1 – Universeafternegativescreeningandverifiedscience-basedtargets(positivescreening)
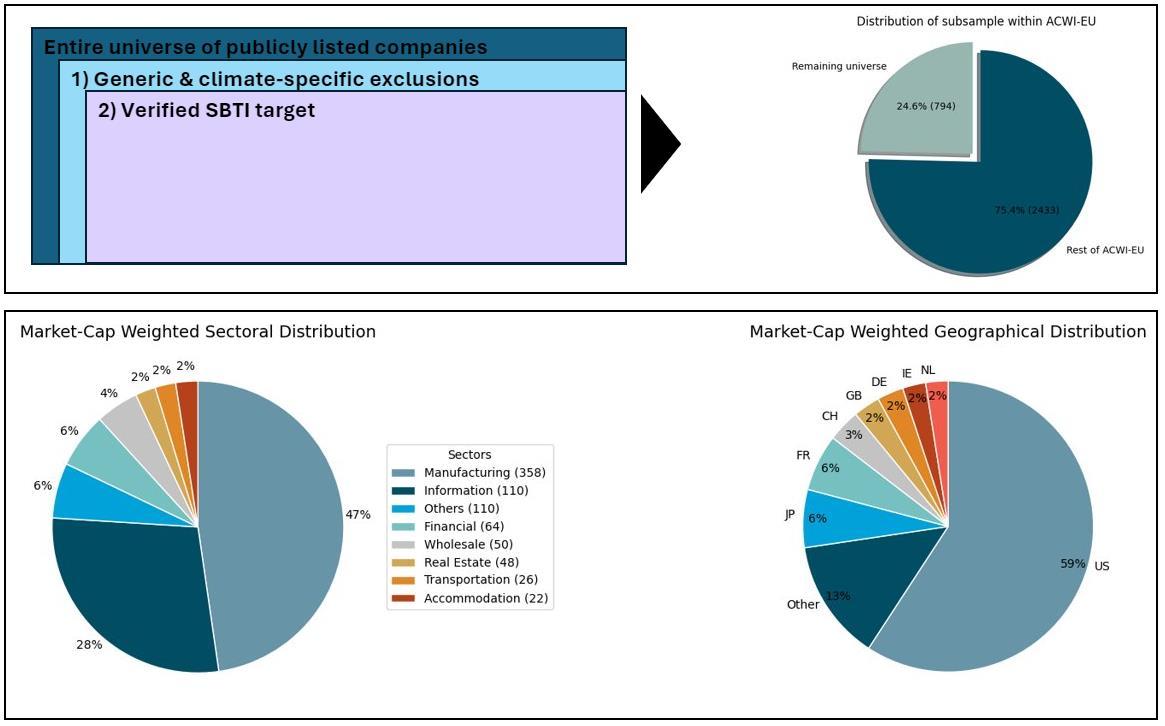
This figure shows the distribution by weighted market cap, sectoral distribution and geographical distribution of the remaining universe after implementation of general exclusions, climatespecific exclusions and positive screening criteria (companies must have a verified sciencebased target).


Remaining distribution after general exclusions, climate-specific exclusion, verified science-based targets, and a zoom-in in high climate impact companies meeting the NZIF definition.
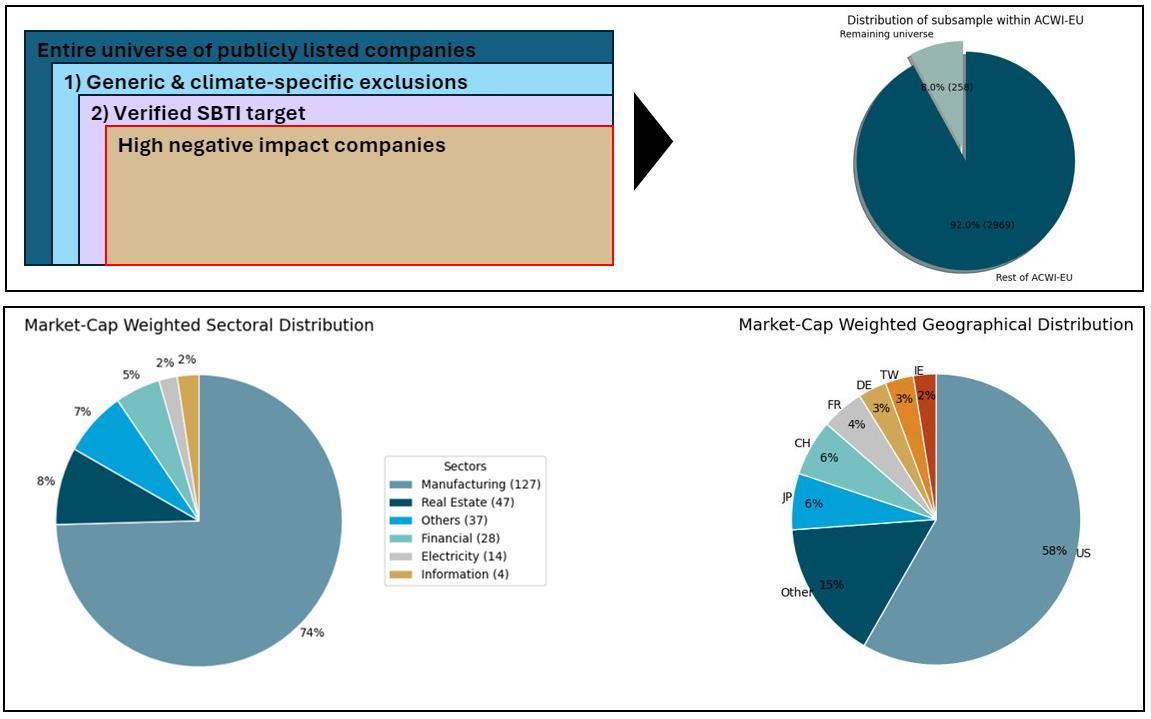


FigureG.3 – Zoom-InPABTrajectoryCriterion
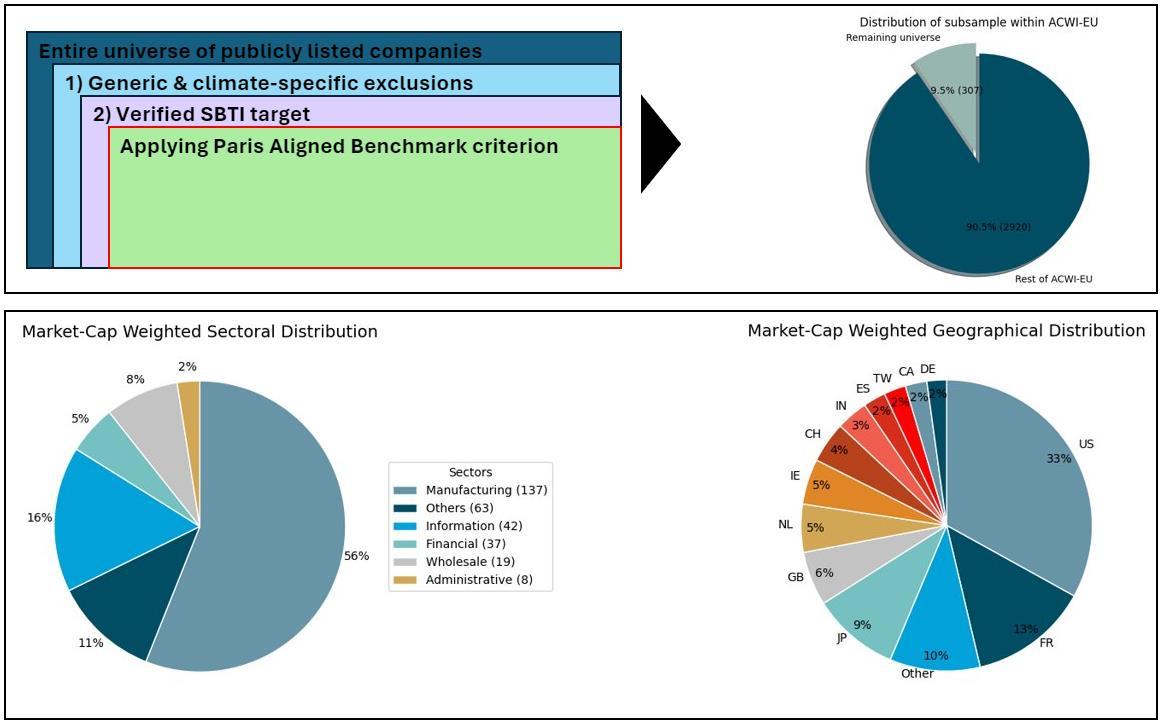


FigureG.4 – Zoom-InTaxonomyKPI(GreenCapex>GreenRevenuetoidentifytransitioncompanies)
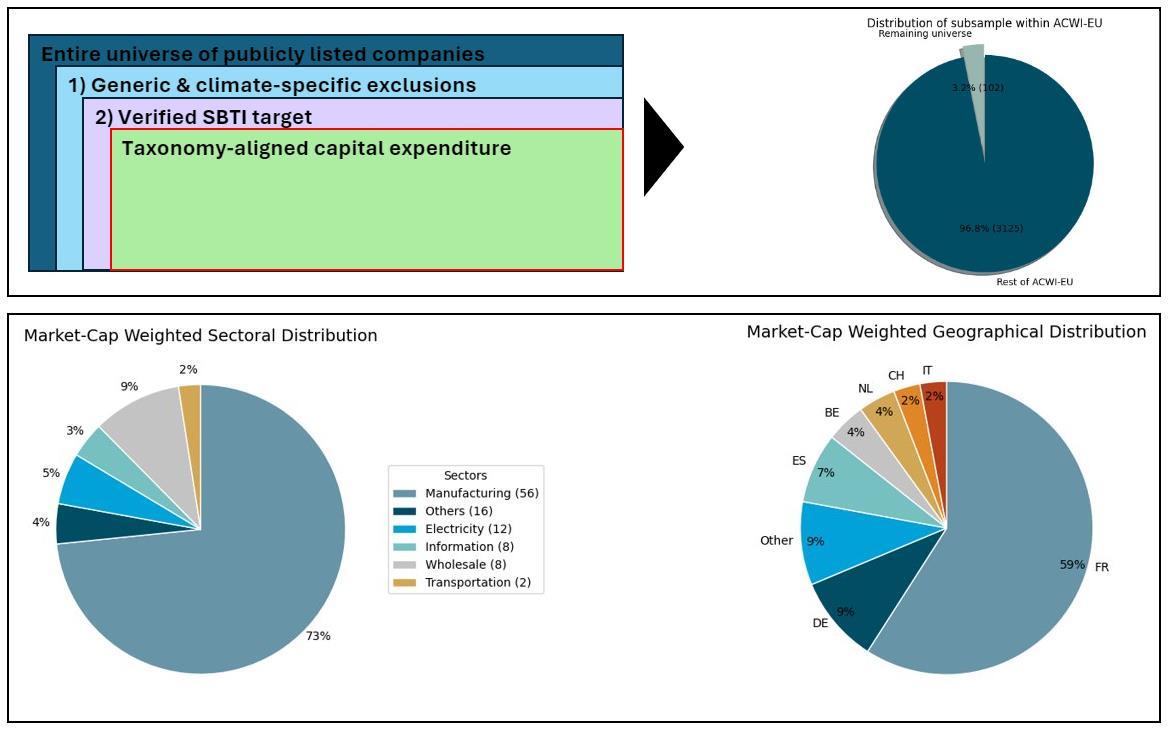
This Annex elaborates in more detail on the data gathering process and respective analytical steps. For the positive screening criteria, forward-looking data on targets has been collected from CDP, SBTi and the Transition Pathway Initiative. EU Taxonomyalignment data was provided by Clarity AI. The negative screening criteria were implementedwithdatafromtheFinancialExclusionTrackerproject,aswellastheGlobal Coal Exit List (GCEL) and Global Oil and Gas Exit List (GOGEL) from Urgewald.
Negative screening: General Exclusion
Negative screening: Climate-specific exclusion
The general exclusion criteria have been implemented using the Financial Exclusion Tracker data (link). Companies excluded by at least five financial institutions for reasons linked to the EU CTB criteria have been excluded from our universe.
Data for these criteria has been gathered from Urgewald’s GCEL and GOGEL lists. For GCEL, a list of 70 companies with an exit date was receivedfrom Urgewald, analysing 7 proposedtransition criteria for coal companies (see Urgewald, n.d.). For GOGEL, expansion variables were extracted from three Excel sheets (“Upstream,” “Midstream Expansion,” and “Gas-Fired Power Expansion”), flagging companies ifany value was above 0 (the vast majority).
Positive screening: Forward-looking criteria
Positive screening: PAB trajectory criterion
Target data has been gathered from: a) CDP’s 2022 questionnaire on climate change which also includes various questions on targets; and b) data retrieved from the Science-Based Target Initiative (which is publicly available).
To evaluate if companies have reduced their GHG intensity by an average of at least 7% per annum for at least three consecutive years, absolute GHG emissions were divided by companies’ enterprise value. The geometric mean of Scope 1 & 2 intensity reductions was calculated for 2020-2022. Scope 3 emissions were not included due to data limitations. Companies with >7% reductions were flagged as fulfilling this criterion.
Positive screening: Taxonomy-aligned KPIs
EU Taxonomy-alignment data was received from Clarity AI. The sum of EU Taxonomy-aligned revenue and CapEx data was defined as the sum of “aligned” and “potentially aligned” revenue and CapEx. Note that EU Taxonomy alignment data on CapEx is scarce for non-EU companies.
CREATEDBY
Climate & Company
Ahornallee 2 | 12623 Berlin www.climateandcompany.com hello@climcom.de
EU Transparency Register: 287394243384-58
Advanced Impact Research (AIR)
Lortzingring 24 | 61118 Bad Vilbel www.air4p.org
AUTHORS
Malte Hessenius, Eric Pruessner, Raphael Tietmeyer, Mayla Wünsche
Version 1.0
ACKNOWLEDGEMENTS
Climate & Company’s work was financed by the Federal Ministry of Education and Research (BMBF, Fördermaßnahme „Klimaschutz und Finanzwirtschaft – KlimFi“) and is part of the joint research project “ClimLabels”. Sub-project 3: Futureoriented indicators and configuration of funds (project id: 01LA2202C) See Climate & Company’s project website (link) for more details.
We would also like to thank the project's advisory board, in particular Jon Gallop (Hanse Merkur Trust AG) and Ulrich Jungbauer (Hanse Merkur Trust AG), Roland Kölsch (F.I.R.S.T. / FNG Siegel) and Nicola Koch (2° Investing Initiative) for valuable input and feedback in recent and earlier discussions. We also thank Dr. Oliver Herrmann (Climate & Company) and Prof. Timo Busch (University of Hamburg) for helpful comments.
We also gratefully acknowledge the provision of EU Taxonomy alignment data from Clarity AI, as well as data on transition plans, targets and GHG emissions from CDP.

