

The Cupola Award is presented to no more than five students whose research papers rank in the top from the papers submitted. Winners receive $500 and their paper published in this journal, CNU’s web based journal for undergraduate research. The top Cupola paper receives the Douglas K. Gordon Cupola Award.
"Research is the essential element of the scholar's craft. It is the means by which scholars pay forward into the fund of human knowledge the debt owed to their predecessors. At its best, research honors the past while enriching the future."
Dr. Richard M. Summerville CNU Provost 1982-1995, 2001-2007Absence of ina-1 alpha integrin tail rescues rho-1 knockdown phenotypes in
C. elegans
Brendan Redler
Sponsoring Professor: Dr. Christopher Meighan
Abstract
Cellular adhesion, migration, and wound healing are all governed by integrin proteins. Integrins are heterodimeric transmembrane receptors for extracellular matrix components such as laminin and fibronectin. Differential expression and activity of integrins is responsible for a number of important events in animals such as wound healing, gastrulation, innervation, and limb formation. A great deal of research has been dedicated to identifying the functions of extracellular integrin domains; however, little research has been conducted to seek the function of intracellular integrin tails. The experiments outlined below attempt to dissect the signaling pathways that link ina-1 and pat-2 integrins to cytoskeletal components and how those pathways regulate integrin function in Caenorhabditis elegans by means of ina-1 and pat-2 intracellular tails. Using a reverse-genetics approach, RNA interference (RNAi) against gene targets selected for their association with integrin function was performed on a host of transgenic C. elegans expressing chimeric ina-1/pat-2 integrins. This approach allows for the identification of proteins whose functions are dependent on ina-1 tails and/or pat-2 tails. I have identified the Rho GTPase, rho-1, as a protein with integrin-linked knockdown phenotypes that are integrin-tail specific. Identification of proteins essential to integrin function and elucidation of their function will open the door for development of tumor management treatments, wound healing treatments, and tissue engineering in coming decades
Introduction
Many important cell and tissue-level processes including cellular adhesion, migration, and wound healing are governed by integrin proteins. Integrins are dimeric transmembrane receptors for extracellular matrix components such as laminin and fibronectin (1-7). Differential expression of integrins is responsible for a number of developmental events in animals such as mammalian gastrulation, and innervation and limb formation in the western clawed frog, Xenopus laevis (8). Every integrin is composed of two chains, an alpha and a beta chain, that dimerize and are embedded in the cell membrane (Figure 1). Each integrin heterodimer has an extracellular component and an intracellular component to allow for signaling from the outsidein, signaling from the inside-out, and so that the integrins can attach to structural cellular components, known as the cytoskeleton(1-7). Migration, adhesion, wound healing, etc. utilize integrins as a way to perform mechanical work on the outside environment; the extracellular integrin components link the cytoskeleton to the cell’s substrate known as the extracellular matrix and provide traction. However, integrins likely do not attach directly to the cytoskeleton and instead rely on a number of linker, scaffolding, and other auxiliary proteins to attach to the cytoskeleton (1-11). These auxiliary proteins that interact with integrins can serve a number of functions. They can serve as a direct intermediate between the integrin and the cytoskeleton; they could serve only to hold other proteins in place that are necessary for integrin function; they could catalyze reactions that activate integrins’ extracellular domains; they could even be involved in signaling from the inside of the cell to surrounding cells via integrins. The identity and function of all the proteins generally involved in integrin complexes is not known (2). Fortunately, the nematode, Caenorhabditis elegans, is an excellent model organism to study integrin function and signaling. C. elegans has only two alpha integrins and one beta integrin so that it can form only two different working integrin proteins (Figure 1) (2,11). The two C.
elegans integrins are known as pat-2 and ina-1. Prior research has shown that elimination of suspected integrin-complex proteins causes phenotypes that are dependent on specific interactions with intracellular alpha integrin tails. This means that ina-1 and pat-2 signaling pathways are separated by binding specificity of their auxiliary proteins to their respective intracellular tails (2)
Experimental Methods
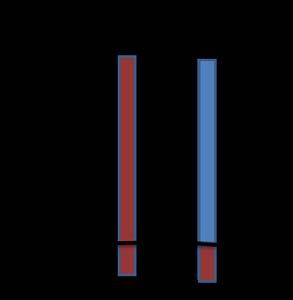
In order to study the roles that different proteins play in integrin function, a transgenic worm line with chimeric integrins was created. The transgenic worms express normal pat-2 integrin and in lieu of normal ina-1 integrin, they express a chimeric protein composed of the ina-1 extracellular and transmembrane domain and a pat-2 intracellular tail (Figure 2). The result is a worm line that

expresses only pat-2 integrin tails and so phenotypes caused by integrin malfunction can be attributed to the effect of interaction of select proteins with the pat-2 tail (2).
Proteins are shown embedded in a membrane (black). On the left (red) is the wild type pat-2 composed of pat-2 extracellular and cytoplasmic domains. On the right (blue and red) is the chimeric integrin composed of ina-1 extracellular domains and pat-2 cytoplasmic tails. Note that only pat-2 tails are present in this organism.
I used a common reverse-genetics technique known as RNA interference (RNAi) to determine which proteins are responsible for normal integrin function as a result of pat-2 tail interaction (Figure 3)(2). RNAi is based on two phenomena: the central dogma of biology, and a viral defense response. The central dogma of biology dictates that DNA stores genetic information which is translated into mRNA which is then transcribed to make proteins that effect cell behavior and function. In order to study genes and their associated proteins, a scientist need only to get rid of the protein and see what processes are damaged. According to the central dogma, the only ways to do this are by interfering with the genetic code (DNA), the mRNA intermediate, or the protein itself. RNAi, as the name hints, targets the mRNA intermediate. Pathogenic viral RNA is often double-stranded, while native mRNA is single-stranded (dsRNA). C. elegans have
a viral defense response wherein upon encountering dsRNA, the dsRNA is degraded to singlestranded RNA and is cut in several places so as to make it useless. In RNAi experiments, dsRNA that corresponds to a native protein is artificially introduced into the organism to invoke the defense response; the cells begin degrading their own mRNA for that protein and so none is made. The end result is that the protein for which the dsRNA coded is no longer expressed in the worms treated with RNAi without affecting the organism’s genome.
Figure 3. RNA interference by ingestion in
as compared with the normal course of the central dogma of biology. In the normal process of gene expression (a), a gene in the worm in transcribed to mRNA and a protein is made from the mRNA code. In RNAi experiments (b), the gene of interest is inserted into bacteria that will produce dsRNA, those bacteria are fed to worms that normally express the gene of interest where an RNAi response is initiated; with the RNAi response initiated there can be no protein translation because the mRNA that codes for the protein is degraded to an unusable state.
C. elegans work especially well as model organisms for studying integrin function because of their transparent body and diagnostic phenotype for integrin malfunction. C.
organ development is based almost entirely on the migration of the distal tip cell (DTC) of the worms’ gonad arms. Wherever the DTC migrates during development, the gonad arm forms behind in the same path. DTC migration is controlled almost entirely by integrin function, so disrupting integrin function leads to DTC migration defects and therefore gonad arm defects. A normal gonad arm is U-shaped (Figure 4-a) and each worm’s two gonad arms should be relatively symmetrical. A gonad arm that has extra bends, no bends, or improper length is considered a “defective” phenotype (Figure 4-b,d). Thus, by interfering with proteins likely to interact with integrin proteins and monitoring the occurrence of DTC migration defects, one can correlate protein presence/absence to integrin function. Several other phenotypes associated with integrin defects were also observed, including body degradation, oocyte accumulation, and proximal gonad arm growth/defects (Figure 4c) By performing RNAi in transgenic organisms with ina-1 and ina-1/pat-2 chimeric proteins against proteins suspected to be involved in integrin function, nine different genes were eliminated as possible integrin tail-specific proteins: pat-4, pat-6, pxl-1, epi-1, mig-2, rac 2/3, cle-1, src-1, src-2 and one gene, rho-1, was identified as having integrin tail-specific activity or regulation.
Figure 4. Wild type phenotype and three different integrin defect phenotypes in an N2 background. Yellow arrows denote gonad arm path, arrow head denotes the distal tip cell or the direction of the distal tip cell if it is not visible. a) N2 animal with no RNAi treatment; b) N2 animal with rho-1 RNAi treatment, note the crossed gonad arm; c) Proximal gonad arm of N2 animal treated with rho-1 RNAi, note large accumulation of oocytes and misshapen gonad arm (red arrows) as compared with (a); d) N2 animal treated with rho-1 RNAi, note the misshaped gonad arm and the open spaces and bubbles (black arrows).
The three worm lines used in these experiments were: N2 (wild type), 1/2V (worms with chimeric integrin expression) , and 1V (worms with a rescue from a null ina-1 phenotype). The N2 worms are ‘normal’ in every way and have been unaltered genetically or otherwise; these will serve as a control and as a comparison for RNAi effects to the other lines. The 1/2 worms
have had the normal ina-1 gene deleted and it has been replaced by the chimeric integrin protein discussed in the literature review/introduction consisting of an ina-1 extracellular component and a pat-2 intracellular component (tail); it is important to note that these worms express no ina-1 tail so all intracellular interactions with integrins must take place via pat-2 tail interactions (Figure 5)
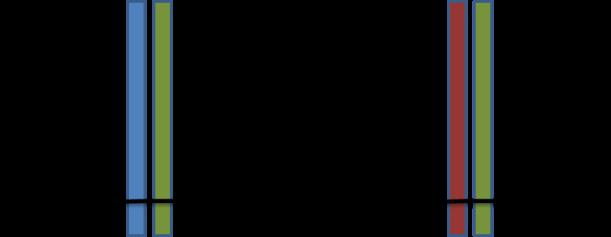
the cytoskeleton by unknown proteins. N2 & 1V worms
(a) express ina-1 (blue) and pat-2 (pink) integrins. 1/2 worms (b) express normal pat-2, and the chimeric protein ina-1 with a pat-2 tail. Question mark boxes represent the proteins that link the integrins to the cytoskeleton and are the focus of this set of experiments. (*β chains omitted for clarity)
Finally, as a control for the complicated transgenesis procedure used to create the 1/2 chimeric line, the 1V line which has undergone the same transgenesis process as the 1/2 line to rescue a null pat-2 phenotype; as a result this line expresses normal ina-1 and normal pat-2. The 1V line should have the same phenotype changes as the N2 line because it has the normal complement of integrin proteins.
Introducing the double stranded RNA (dsRNA) into the worms for RNAi experiments is extraordinarily simple. Bacteria that are able to produce dsRNA corresponding to each gene of interest have been obtained and are maintained frozen at -80°C. A bacterial strain is selected and a small amount is unfrozen and cultured to produce enough bacterial stock for the experiment. The bacteria are then plated in petri dishes on Isopropyl β-D-1-thiogalactopyranoside (IPTG) agar which forces production of dsRNA. Worm eggs from the selected worm line are then introduced onto the prepared RNAi bacteria plates. The worms then ingest the bacteria and the dsRNA contained within is taken into their cells where the viral defense response is initiated. The viral defense response causes any corresponding mRNA in the worm to be degraded, thus causing the worm to cease production of that protein. As another control, each RNAi experiment targeting a gene of interest was accompanied by an RNAi trial using an empty vector RNAi target containing no gene of interest.
RNAi experiments were assayed via microscopy with 400x magnification to observe defects. Defects are counted among a sample of 15 worms from each RNAi trial. Untreated N2 worms should have no defects. Untreated 1/2 worms have been shown to produce approximately 30% defective gonad arms. Untreated 1V worms should also produce approximately 30% defective gonad arms. The ratios of defective to normal gonad arms for each trial are then determined and will serve as the primary data.
Results & Discussion
The rho GTPase, rho-1, was identified as a protein with function that is dependent on α-integrin tail identity. In extensive trials with N2, 1V, and 1/2V lines, knockdown of rho-1 by RNAi causes severe body degradation, oocyte defects, and inability to lay eggs in C. elegans if the ina-
1 cytoplasmic tail is present (N2 and 1V lines). Preliminary rho-1 RNAi experiments using worms that express only the ina-1 tail also follow this trend. This suggests that the rho-1 pathway has a function that is dependent on the presence of the ina-1 and/or pat-2 tail.
Phenotype Interpretation
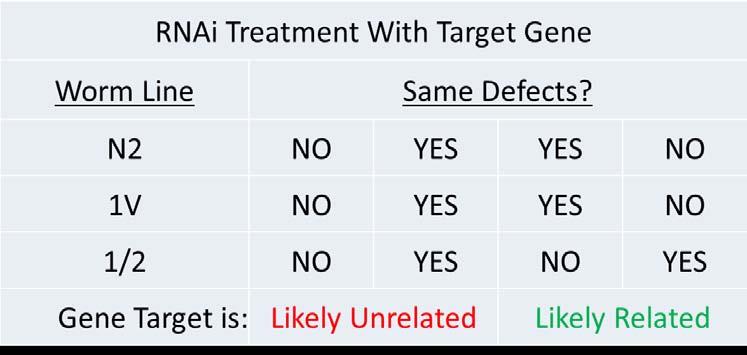
After the three C. elegans lines (N2, 1V, and 1/2) are treated with RNAi, phenotypes were evaluated using light microscopes with Nomarsky optics at 100x-400x. Each gonad arm was scored as either defective or not defective and an average percentage of defects was determined for each line. If the two control lines show the same phenotype(s) or percentage of defect phenotypes and the chimeric 1/2 line showed a different phenotype(s) then the RNAi target was determined to have integrin tail specificity (Table 1). Typical phenotypes are outlined in Figure 4.
If control lines (N2, 1V) show the same defects or lack of defects and the experimental line (1/2) shows a different phenotype, then the protein knocked down by RNAi likely has some dependence on integrin tail identity.
Figure
Yellow arrow indicates path of gonad arm which is consistent with wild type phenotypes. Black arrows indicate oocyte defects and proximal gonad arm abnormalities. Note that this animal is very close to wild type (Figure 4-a) and defects are minimal.
Rho-1 RNAi Treatment Causes Moderate to Severe Defects In All Animals Expressing ina-1 Tails.
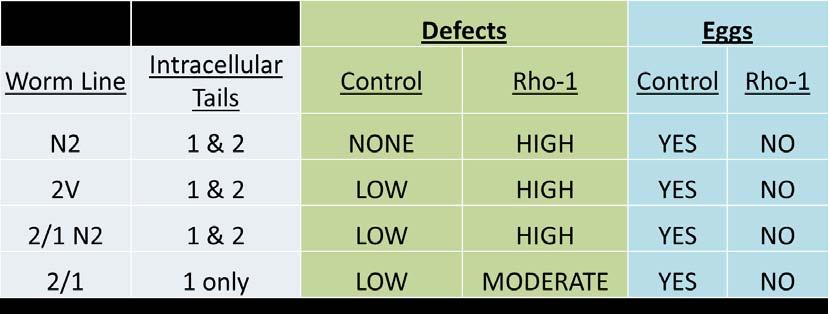
Exposure to rho-1 RNAi caused DTC migration defects (Table 2) and inability to lay eggs (Table 3) in N2 and 1V animals. By contrast, the 1/2 animals treated with rho-1 RNAi were rescued from the defective phenotypes and saw both reduced DTC migration issues and ability to lay viable eggs (Tables 2,3; Figure 6). Exposure of animals expressing solely ina-1 tails (2/1 animals; Table 4) and various combinations of chimeric protein with wild type protein to rho-1 RNAi also resulted in DTC migration and other morphology defects. This data, shown in Table 4, is the product of only one set of trials with the listed C. elegans lines and more trials are in progress to generate more statistically significant data.
Next steps for this research will include RNAi treatment for both rac and rho proteins at the same time to probe the possibility of crosstalk and push/pull signaling from a rac signaling pathway because rac and rho often work in opposition to regulate related processes. Direct-binding assays in vitro need to be conducted to determine if there is a direct chemical interaction between the integrin tails and rho-1. Additionally, fluorescent staining, transgenesis of fluorescent rho-1 constructs, and in situ hybridization need to be completed in order to establish co-localization (if any) of rho-1 with integrin proteins in vivo.
Table 2. Rho-1 knockdown byRNAi treatment causes gonad arm defects in control (N2 and 1V) animals; absence of ina-1 tail rescues gonad arm defects in 1/2V animals. Numbers reported under ‘Defects’ and ‘Normal’ are individual gonad arms (i.e. 28 under Normal for N2 indicates that there were 28 normal gonad arms counted). Change is reported as the difference between percent defects in empty vector RNAi treatment and rho-1 RNAi treatment. Note an increase in defects for N2 and 1V (red) and a decrease in defects for 1/2 (green) after rho-1 treatment.
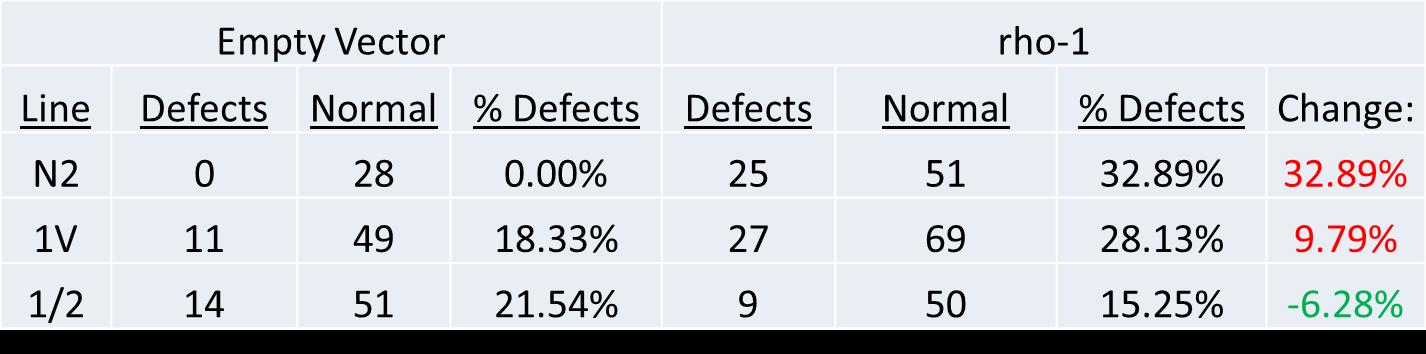
Table 3. Rho-1knockdown by RNAi treatment causes egg-laying defects in control (N2 and 1V) animals; absence of ina-1 tail rescues egg-laying defects in 1/2V animals. In control experiments (empty vector RNAi) all animals lay eggs and have viable progeny regardless of integrin tail composition. Rho-1 RNAi treatment causes inability to lay eggs in N2 and 1V animals. Absence of ina-1 tails in 1/2 animals rescues egg-laying defects and 1/2
Table 4. Rho-1 RNAi treatment causes gonad arm and egg-laying defects in worms expressing ina-1 tail. This table displays preliminary data treating 2V, 2/1 N2, and 2/1 animals with rho-1 RNAi. Note that all of these animals express ina-1 tails and all have defects both in gonad arms and egg-laying.
Conclusions
Rho-1 has been identified as a protein in the integrin signaling pathway with activity or regulation that is dependent on integrin tail identity. Further studies will elaborate on these findings and determine the exact nature of rho-1’s function in integrin signaling in C. elegans. Because so little is known about how integrin tails act to affect changes in integrin signaling, the identification of rho-1 as a protein with integrin tail-dependent function lays down a framework for investigation into intracellular integrin signaling. Elucidation of integrin signaling pathways made possible by this work will aid in development of tumor control treatments, tissue engineering, basic developmental biology, and any of the myriad biological processes in which integrin proteins are involved.
Acknowledgements
All necessary equipment, supplies, and guidance have been graciously provided by Dr. Christopher Meighan of Christopher Newport University, who also generated the C. elegans transgenic lines containing chimeric integrins used in this research.
References
1) Calderwood, D. A.; Yan, B.; de Pereda, J. M.; Alvarez, G. B.; Fujioka, Y.; Liddington, R. C.; Ginsberg, M. H. The Phosphotyrosine Binding-like Domain of Talin Activates Integrins. 2002. J. Bio.l Chem. 277, 21749-21758.
2) Cram, E. J.; Clark, S. G.; Schwarzbauer, J. E. Talin loss-of-function uncovers roles in cell contractility and migration in C. elegans. 2003. J. Cell Sci. 116, 3871-3878.
3) Tanentzafp, G.; Brown, N. H. An interaction between integrin and the talin FERM domain mediates integrin activation but not linkage to the citoskeleton. 2006. Nat. Cell Biol. 8, 601-606.
4) Whittaker, C. A.; DiSimone, D. W. Integrin α subunit mRNAs are differentially expressed in early Xenopus embryos. 1993. Development. 117, 1239-1249.
5) Reynolds L. E.; Conti, F. J.; Silva, R.; Robinson, S. D.; Iyer, V.; Rudling, R.; Cross, B.; Nye, E.; Hart, I. R.; Dipersio, C. M.; Hodivala-Dilke, K. M. α3β1 integrin–controlled Smad7 regulates reepithelialization during wound healing in mice. 2008. J. Clin. Invest 118, 965-974
6) Margadant, C.; Sonneburg, A. Integrin–TGF-β crosstalk in fibrosis, cancer and wound healing. 2010. EMBO Reports. 11, 97-105.
7) Schultz, G. S.; Wysocki, A. Interactions between extracellular matrix and growth factors in wound healing. 2009. Wound Repair and Regeneration. 17, 153-162.
8) Abu-Daya, A.; Nishimoto, S.; Fairclough, L.; Mohun, T. J.; Logan, M. P. O.; Zimmerman, L. B. The secreted integin ligand nephronectin is necessary for forelimb formation in Xenopus tropicalis. 2011. Dev. Biol. 349, 204-212.
9) Lallier, T. E.; Whittaker, C. A.; DeSimone, D. W. Integrin α6 expression is required for early nervous system development in Xenopus laevis. 1996. Development. 122, 25392554.
10) Kragtorp, K. A.; Miller, J. R. Regulation of somitogenesis by Ena/VASP proteins and FAK during Xenopus development. 2005. Development. 133, 685-695.
11) Wegener, K. L. Partridge, A. W.; Han, J.; Pickford, A. R.; Liddington, R. C.; Ginsberg, M. H.; Campbell, I. D. Structural Basis of Integrin Activation by Talin. 2007. Cell. 128, 171-182.
Brendan Redler is a recent graduate of Christopher Newport University in May of 2012 with a double major in Biology and Chemistry. He strives to further his own knowledge and understanding of the natural world and to instill in others his passion for scientific research. During his time at CNU, Brendan has collaborated extensively with the Molecular Biology & Chemistry faculty on a number of successful projects in which he identified red tide algal species in local estuaries, developed a cost-effective Stark spectrometer, developed a cost-effective and robust bat monitoring system that is currently being commercialized for use by government agencies, and identified a protein integral to the function of integrin signaling pathways. Additionally, Brendan has presented his research at national and regional conferences, as well as CNU’s own Paidea conference. In his senior year, Brendan served as president of the CNU chapter of BBB, the national biological honor society. Brendan recently accepted an award as Christopher Newport University’s top graduating chemistry major of 2012 by the American Chemical Society. Beginning in August of 2012, Brendan will attend Carnegie Mellon University in Pittsburgh, PA to pursue a PhD in biology. Brendan thanks all of the faculty and staff who have helped him achieve so much during his time at CNU, especially his research mentors: Dr. Gwynne Brown, Dr. Tim Smith, Dr. Rick Sherwin, and Dr. Christopher Meighan.
Use of a Global Climate Model to Predict Coral Development
Matthew WareSponsoring Professor: Dr. J. Keith Moore
Abstract:
The Community Earth System Model (CESM/CCSM) was utilized to simulate the environmental conditions in the Eastern Equatorial Pacific basin under the RCP8.5 scenario, with an emphasis on the Galapagos Archipelago, to predict future coral development in the region by the year 2100. Bleaching thresholds for both spatial scales were developed from monthly sea surface temperature (SST) climatologies created from the AVHRR Pathfinder v5.0 nighttime dataset, spanning the years 1985-2006, and were applied to the CESM/CCSM results. By the end of the century, coral development in the Eastern Equatorial Pacific will be significantly threatened, especially in the Galapagos Archipelago. Simulated conditions surpassed the bleaching threshold by 1.5°C in Galapagos and 1.4°C for the larger Eastern Equatorial Pacific. Projected pH decreases of ~0.4 units in both regions will also present a significant additional stressor.
Introduction
Coral reefs are among the most biodiverse and socioeconomically important ecosystems on Earth. They cover only a tiny fraction of the Earth’s surface (just 0.1-0.5% of the ocean floor) but account for services estimated at $375 trillion worldwide (Lough & van Oppen, 2009). This figure includes food production, eco-tourism, extractive industries like mining and the aquarium trade, and coastal protection from storms or strong wave action. These sensitive habitats vary extensively in both scale and diversity based on local conditions.
This large socioeconomic value lends incredible importance to predicting coral development under different environmental stressors. Long-term global climate models provide the opportunity to track changes in abiotic factors related to coral growth. This application is still in its infancy, but holds a tremendous amount of promise for coral reef managers and policymakers at all government levels. In this study, the Community Earth System Model (CESM/CCSM) is applied to the Eastern Equatorial Pacific basin in an attempt to predict coral development by the year 2100.
The Galapagos Archipelago, and the larger Eastern Equatorial Pacific basin, represents a difficult region for coral development (Glynn and Wellington, 1983). Cold, CO2-and nutrientrich water bathes the archipelago as part of the Peru Current for half the year, while the other half of the year experiences warm, nutrient-poor water from the Panama Current. To complicate this pattern, El Niño-La Niña events block upwelling off the South American coast about once every ten years, resulting in significant die-offs across the food web. It has already been observed that corals in this region display reduced calcification due to these difficult conditions (Manzello et al., 2008).
Methods
Two areas of interest were defined and represent two different spatial scales – one around the Galapagos Archipelago and the other around the larger Eastern Equatorial Pacific. The coordinates for these regions can be found in Table 1. Regional sea surface temperature (SST) climatologies were developed from the AVHRR Pathfinder v5.0 nighttime data from 1985
2006 retrieved from the US NODC and GHRSST (Casey et al., 2010). The satellite observations were verified with in situ observations recorded by the Charles Darwin Research Station (CDRS) located at Puerto Ayora in the Galapagos Islands. The CDRS data record extends back to December 31, 1964 and is recorded once daily. In both datasets, monthly averages were used to better correspond with the multi-decadal timescale of the climatology and with the heating statistics explained below.
Galapagos
NE Corner = 2°46'6.89"N, 86°44'53.06"W
SE Corner = 3°25'39.75"S, 86°44'53.06"W
SW Corner = 3°25'39.75" S, 96°14'24.93"W
NW Corner = 2°46'6.89"N, 96°14'24.93"W
Eastern Equatorial
NE Corner = 12°55'11.80" N, 85°54'47.21" W
Pacific SE Corner = 12°55'11.61"S, 75°24'36.67"W
C2 = 8°13'4.07"N, 81°15'17.68"W
SW Corner = 12°55'11.61"S, 113°43'49.76"W
C3 = 9°24'15.55"N, 79°6'5.73"W
NW Corner = 12°55'11.80"N, 113°43'49.76"W
C4 = 6°53'57.98"N, 76°4'9.72"W
Using the methods developed by Liu et al. (2006) for the NOAA Coral Reef Watch program and the Degree Heating Month (DHM) statistic calculated in Barton and Casey (2005), heating statistics were calculated from the developed AVHRR Pathfinder climatology, including bleaching threshold, SST Anomaly, and DHM. The calculated bleaching thresholds were established as 1°C above the climatological maximum.
Using the Community Earth System Model (CESM/CCSM), climatic simulations for both areas of interest were produced out to the year 2100 using the RCP8.5 scenario. The
CESM/CCSM is a coupled carbon/climate model, and can achieve a spatial resolution of ~0.25° in the tropics. This model is capable of simulating numerous variables, such as SST, pH, salinity, CO2 flux, net primary production, among others. Decadal average SST projections were compared to the established bleaching thresholds determined by the developed climatology. The coral predictions assume no future adaptations in thermal tolerance. Decadal average pH projections were also analyzed, since ocean acidification may serve as an additional climatic stressor.
Results
The AVHRR Pathfinder v5.0 nighttime SST and CDRS SST data demonstrated good agreement, with a correlation of 0.962 for the years 1985 – 2006. The climatological maximum identified for Galapagos was 26.7°C, while the Eastern Equatorial Pacific was 27.0°C. The Galapagos maximum occurred in March, while the Eastern Equatorial Pacific occurred in April. The bleaching thresholds corresponded to an SST of 27.7°C for Galapagos and 28.0°C for the Eastern Equatorial Pacific. Bleaching is expected when the observed SST surpasses the above thresholds. DHMs accumulate as long as the observed SST remains above the climatological maximum, and correlate to bleaching intensity. Mild bleaching occurs at ~1 DHM, while severe bleaching and mild mortality occurs at ~2 DHM (Barton and Casey, 2005)
The predicted past bleaching events in both areas of interest correspond well to observed bleaching documented in the literature, especially the 1997-1998 El Niño-La Niña (Figure 1). At its peak, this El Niño-La Niña event produced a DHM of 14.4 °C-month. This heat stress
resulted in an average of 26% coral mortality in the Galapagos Archipelago, with some localized pockets reaching as high as 55% (Glynn et al., 2001; Glynn, 2000). The Eastern Equatorial Pacific in general reached 8.7 °C-month at the peak of the event. The South American mainland exhibited a greater range of responses to this thermal stress – some regions were untouched while others had almost 99% mortality (Glynn, 2000).
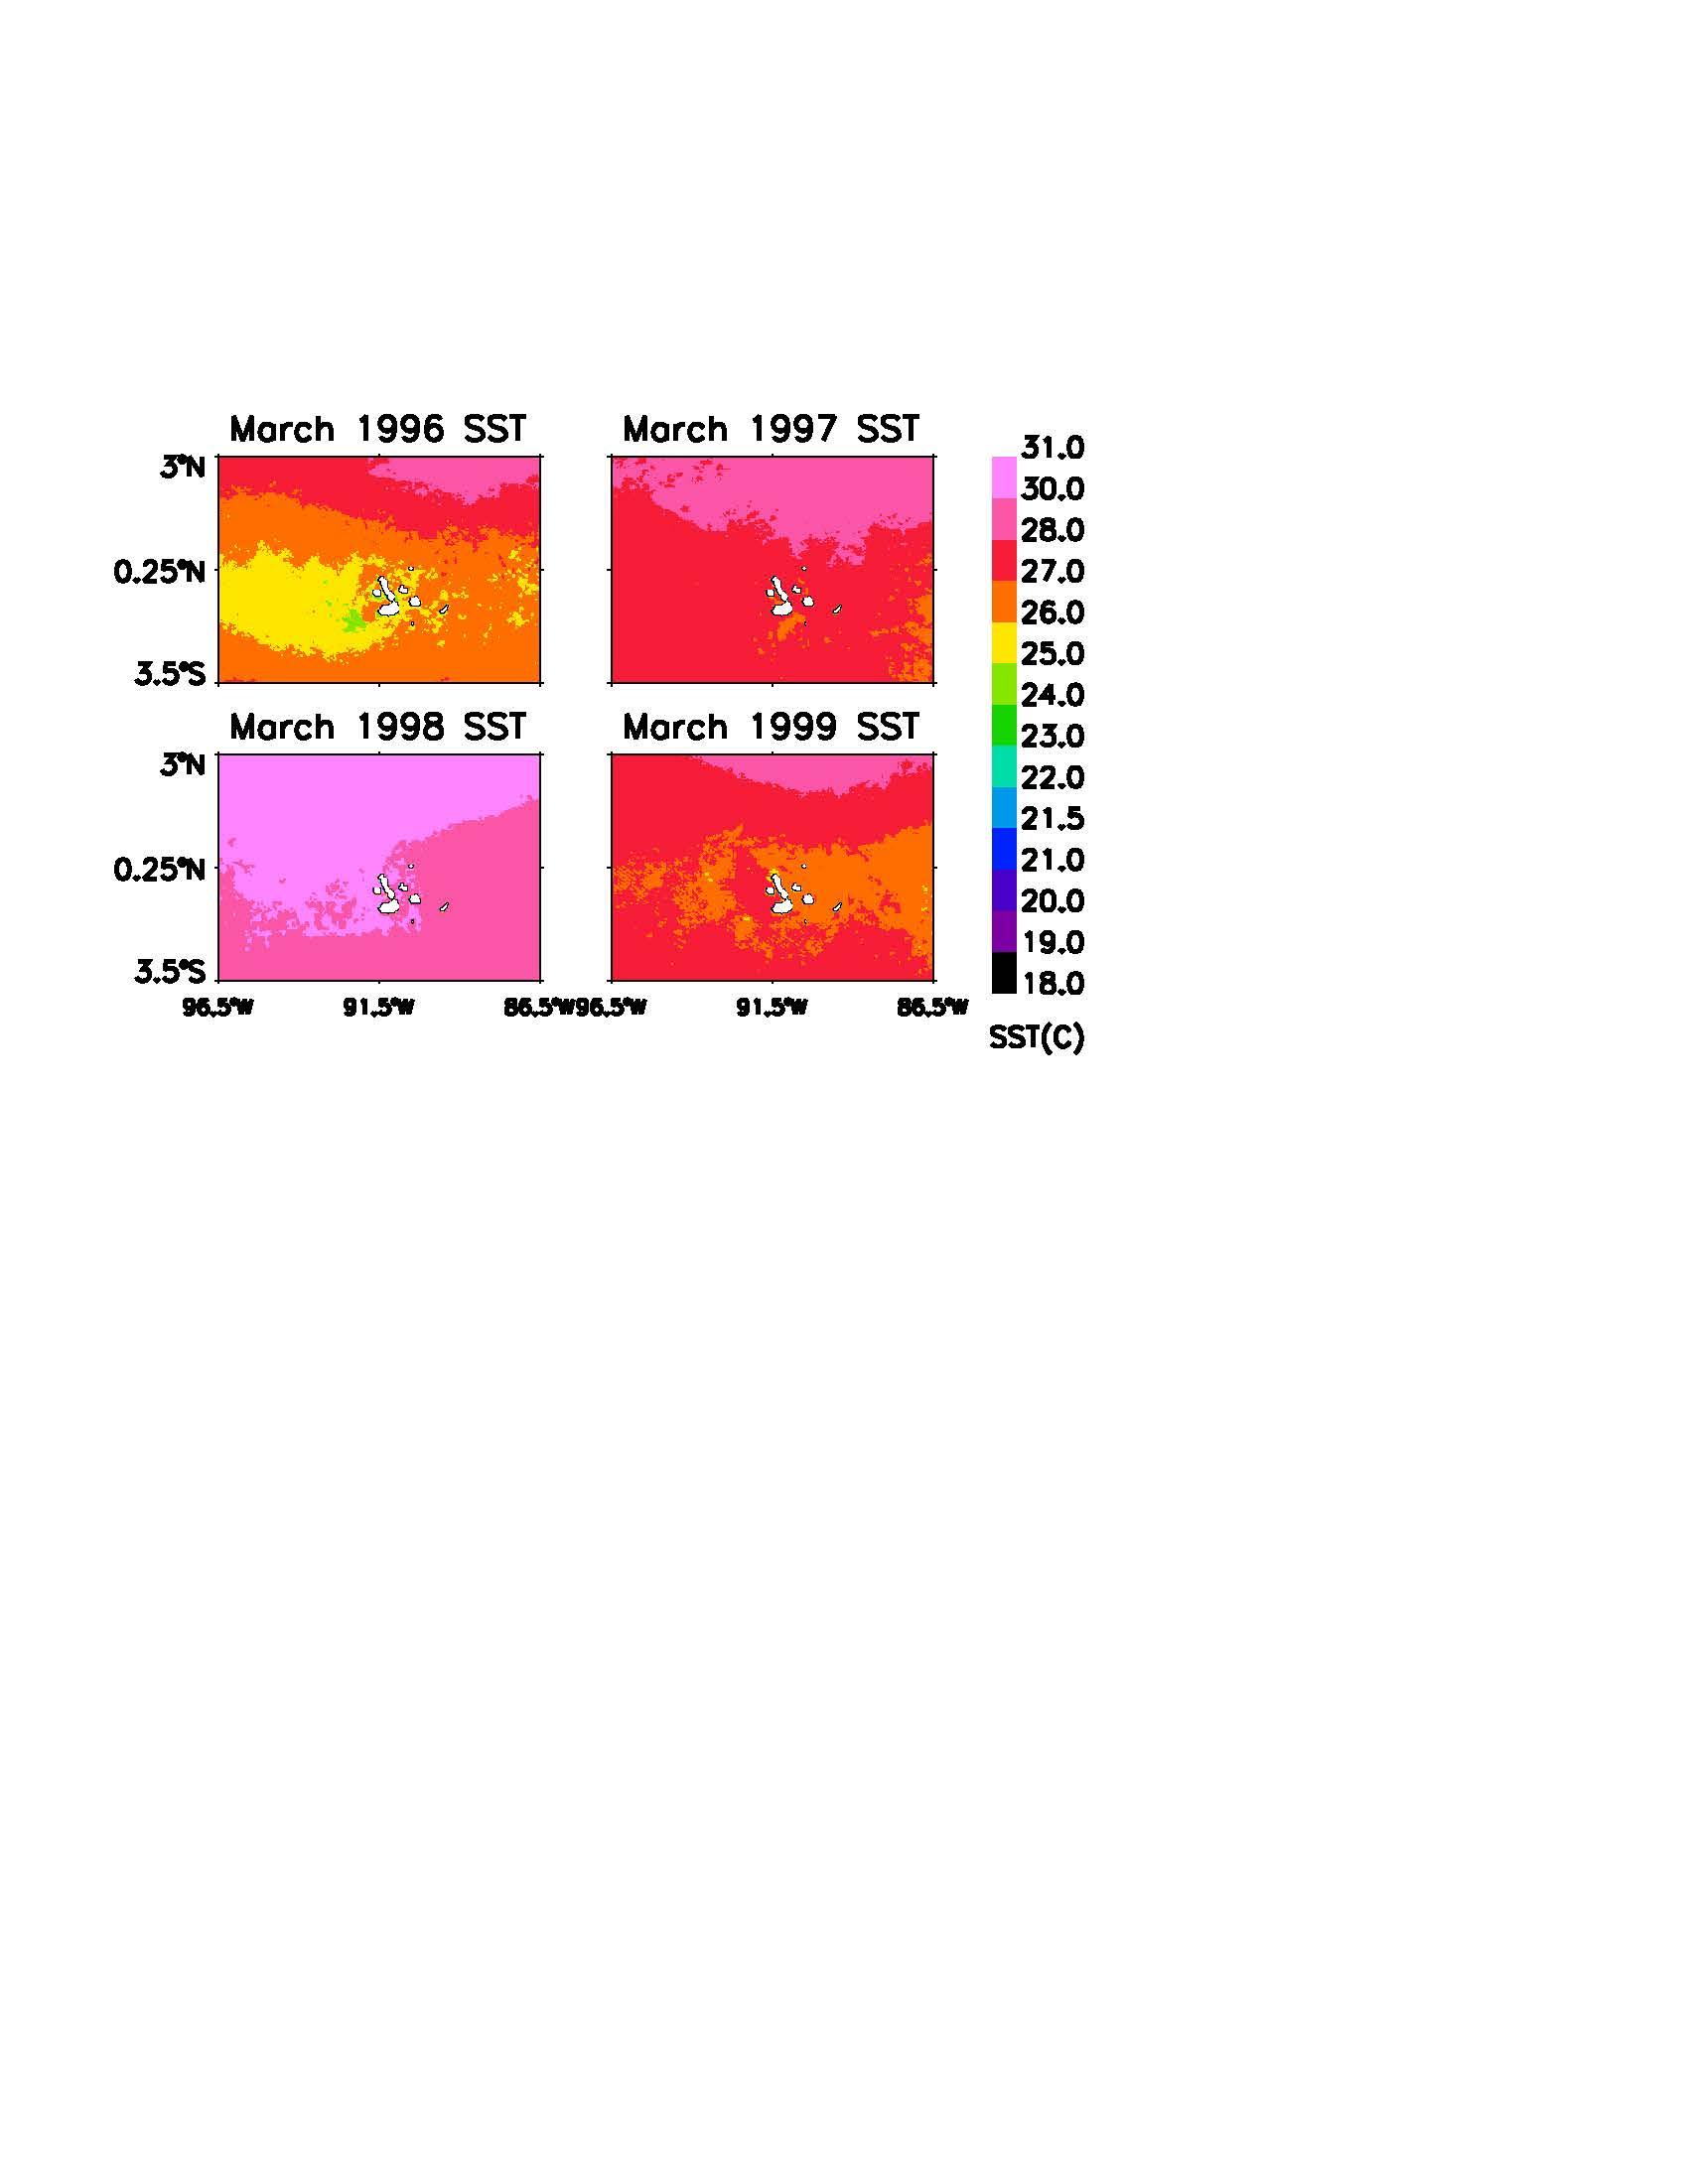
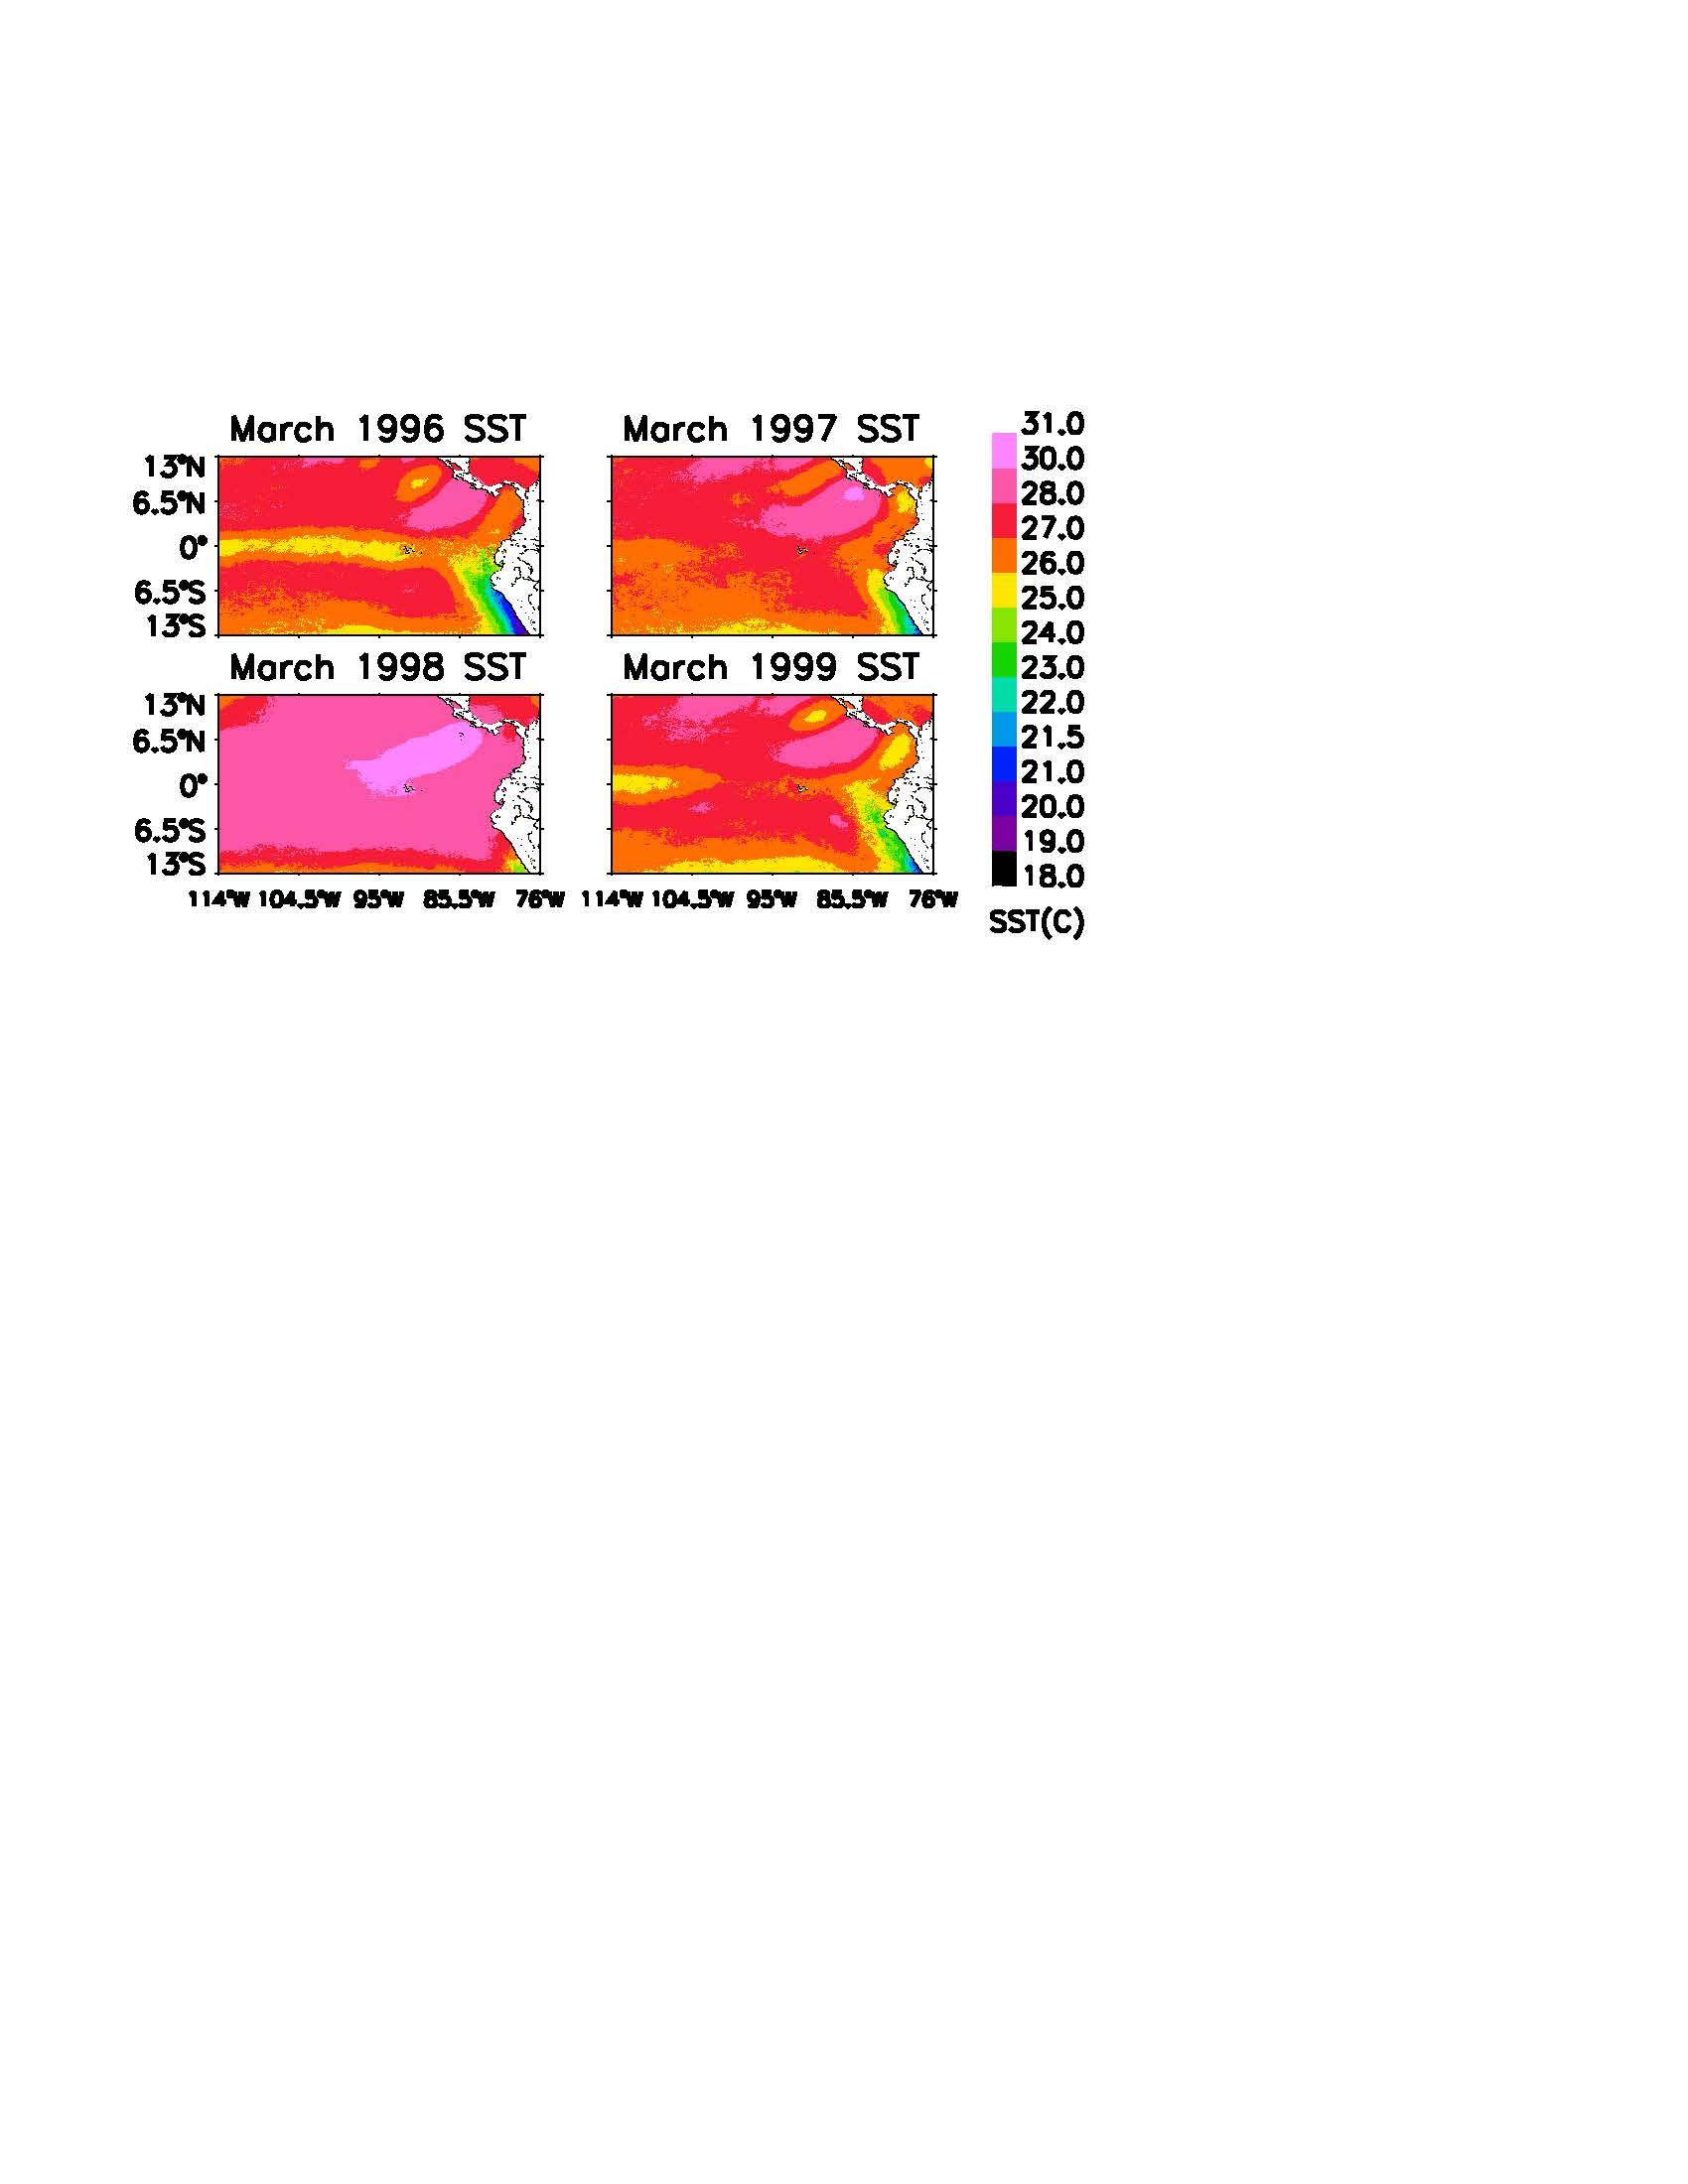
The spatial distribution of SST during the 1997-1998 El Niño-La Niña is shown in Figures 2 and 3. The years 1996 and 1999 show typical heat flow around the Eastern Equatorial Pacific basin and the Galapagos Archipelago. The September images demonstrate the dominant flow of the Peru Current for half of the year, while the March images display the warmer Panama Current. Note that not only are the warm season temperatures higher, but there is a significant lack of cold water upwelling for the remainder of the year.
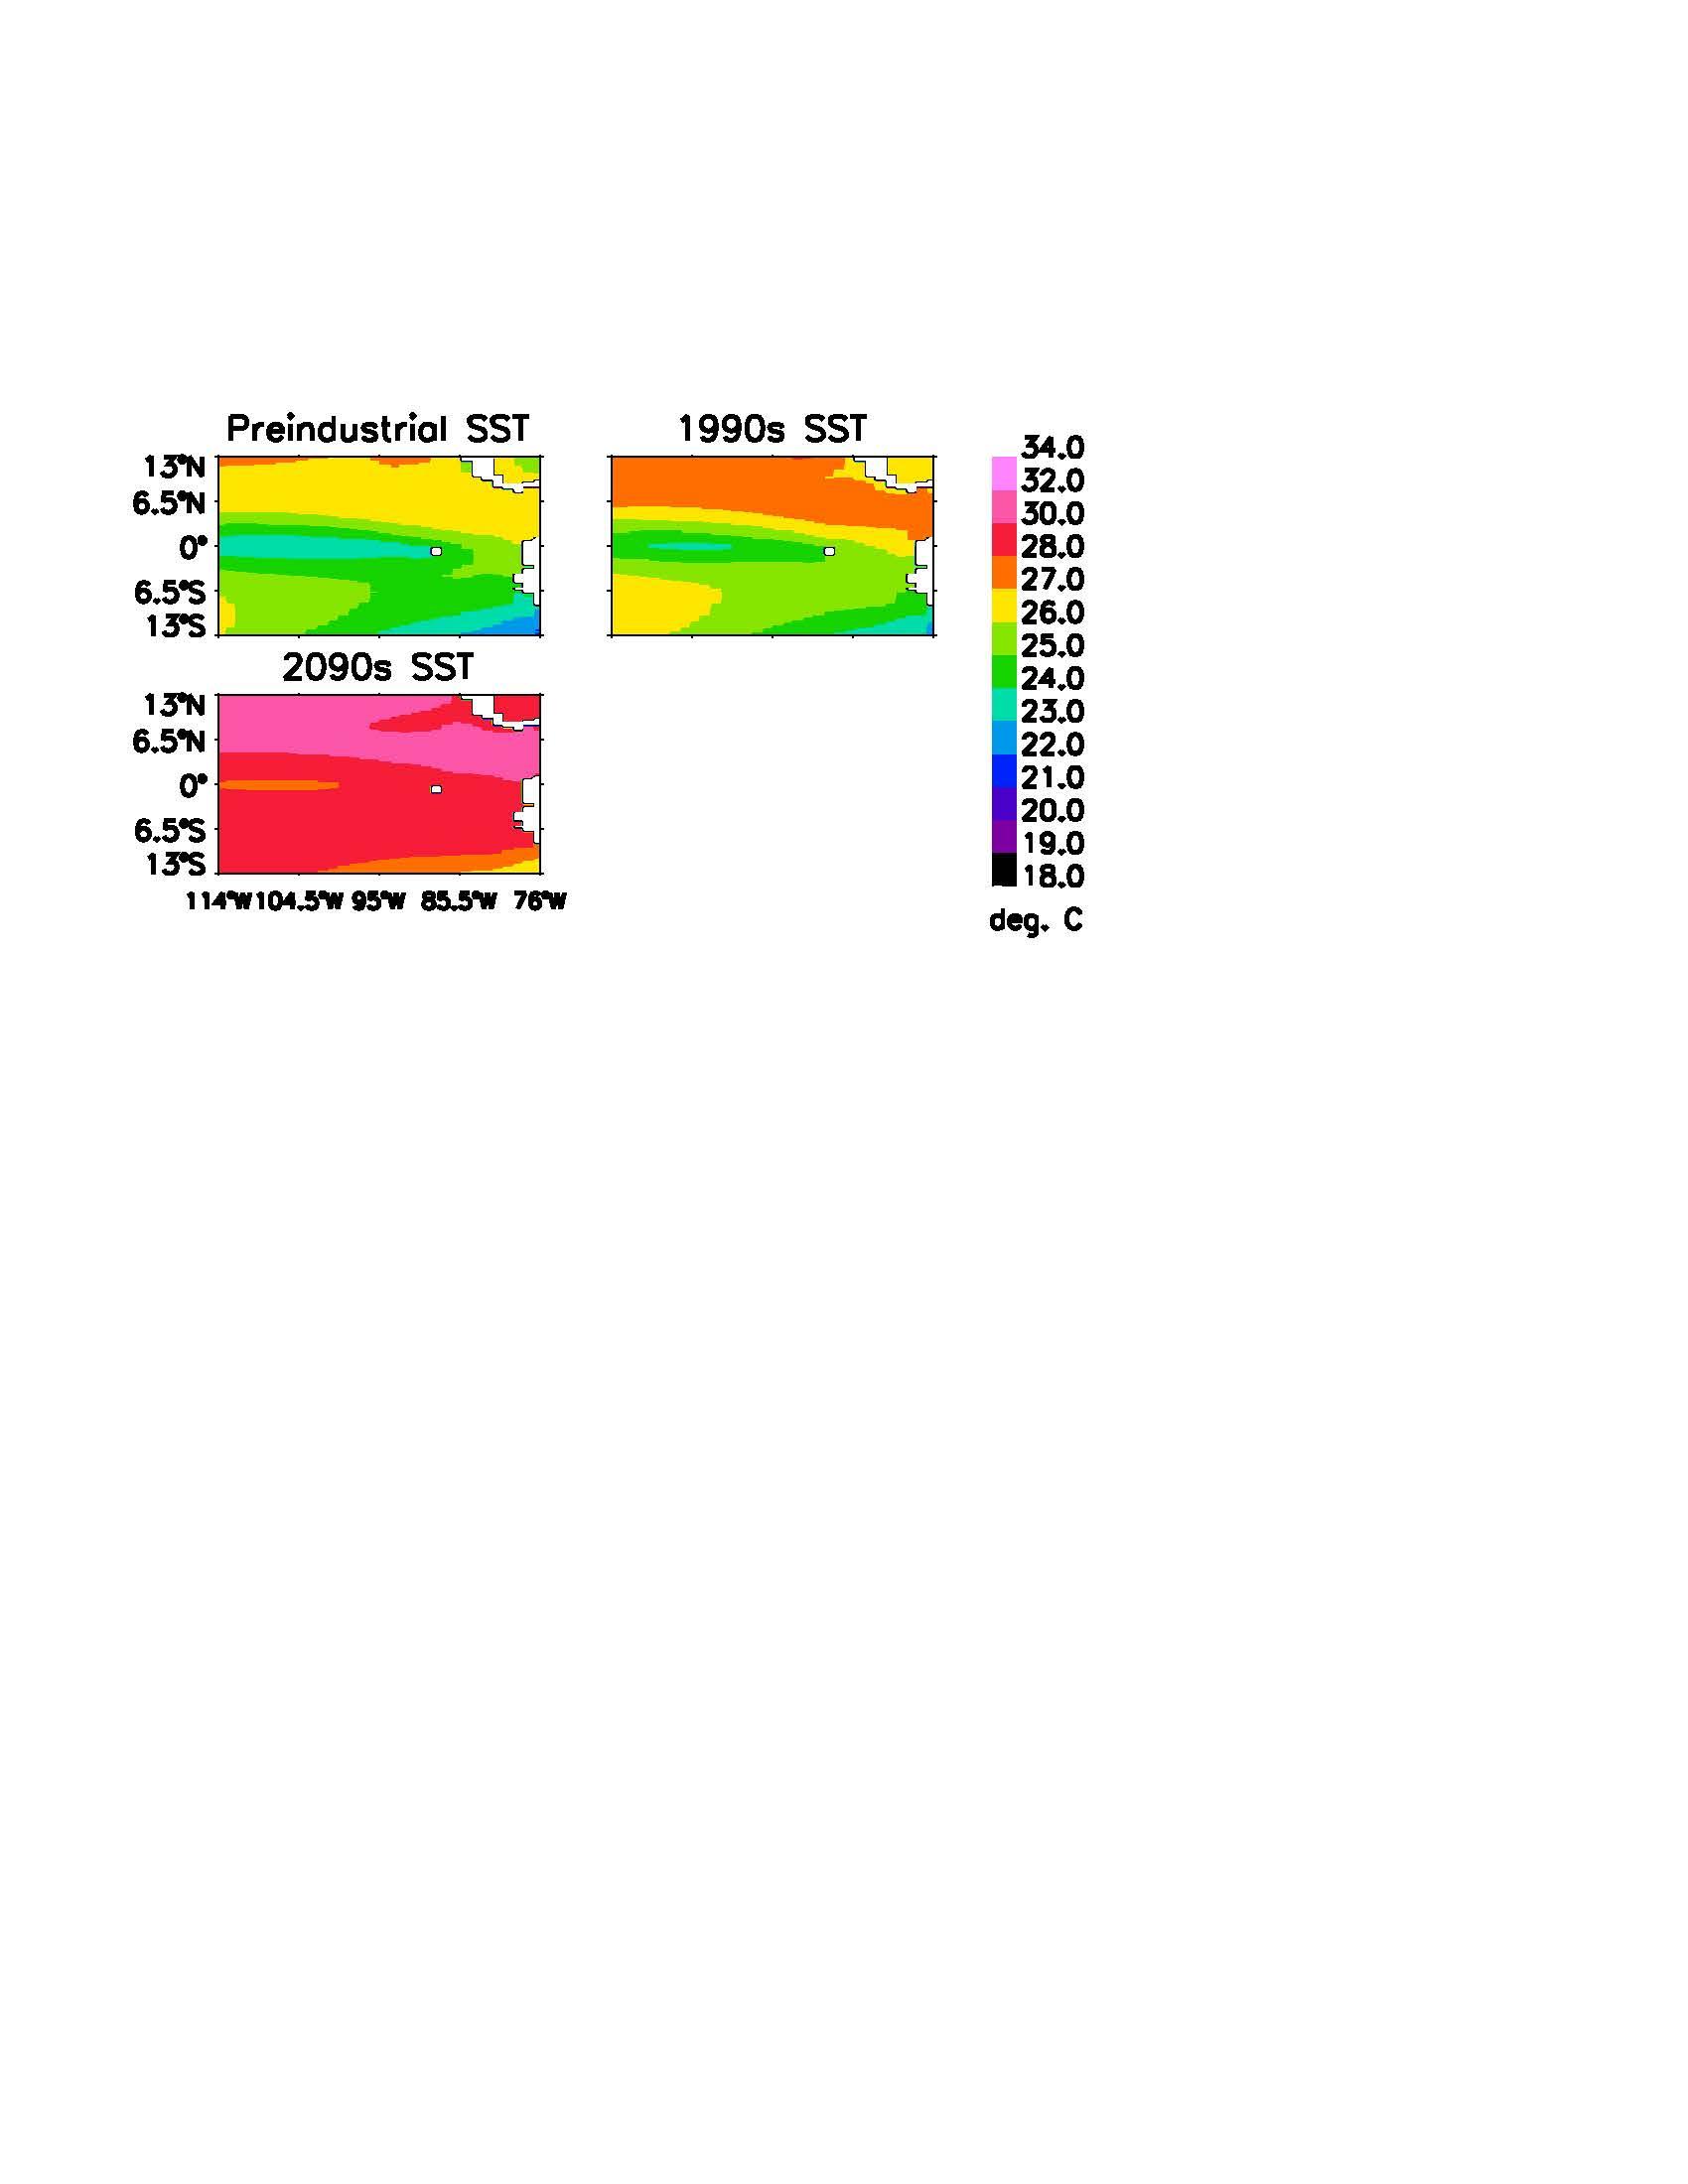
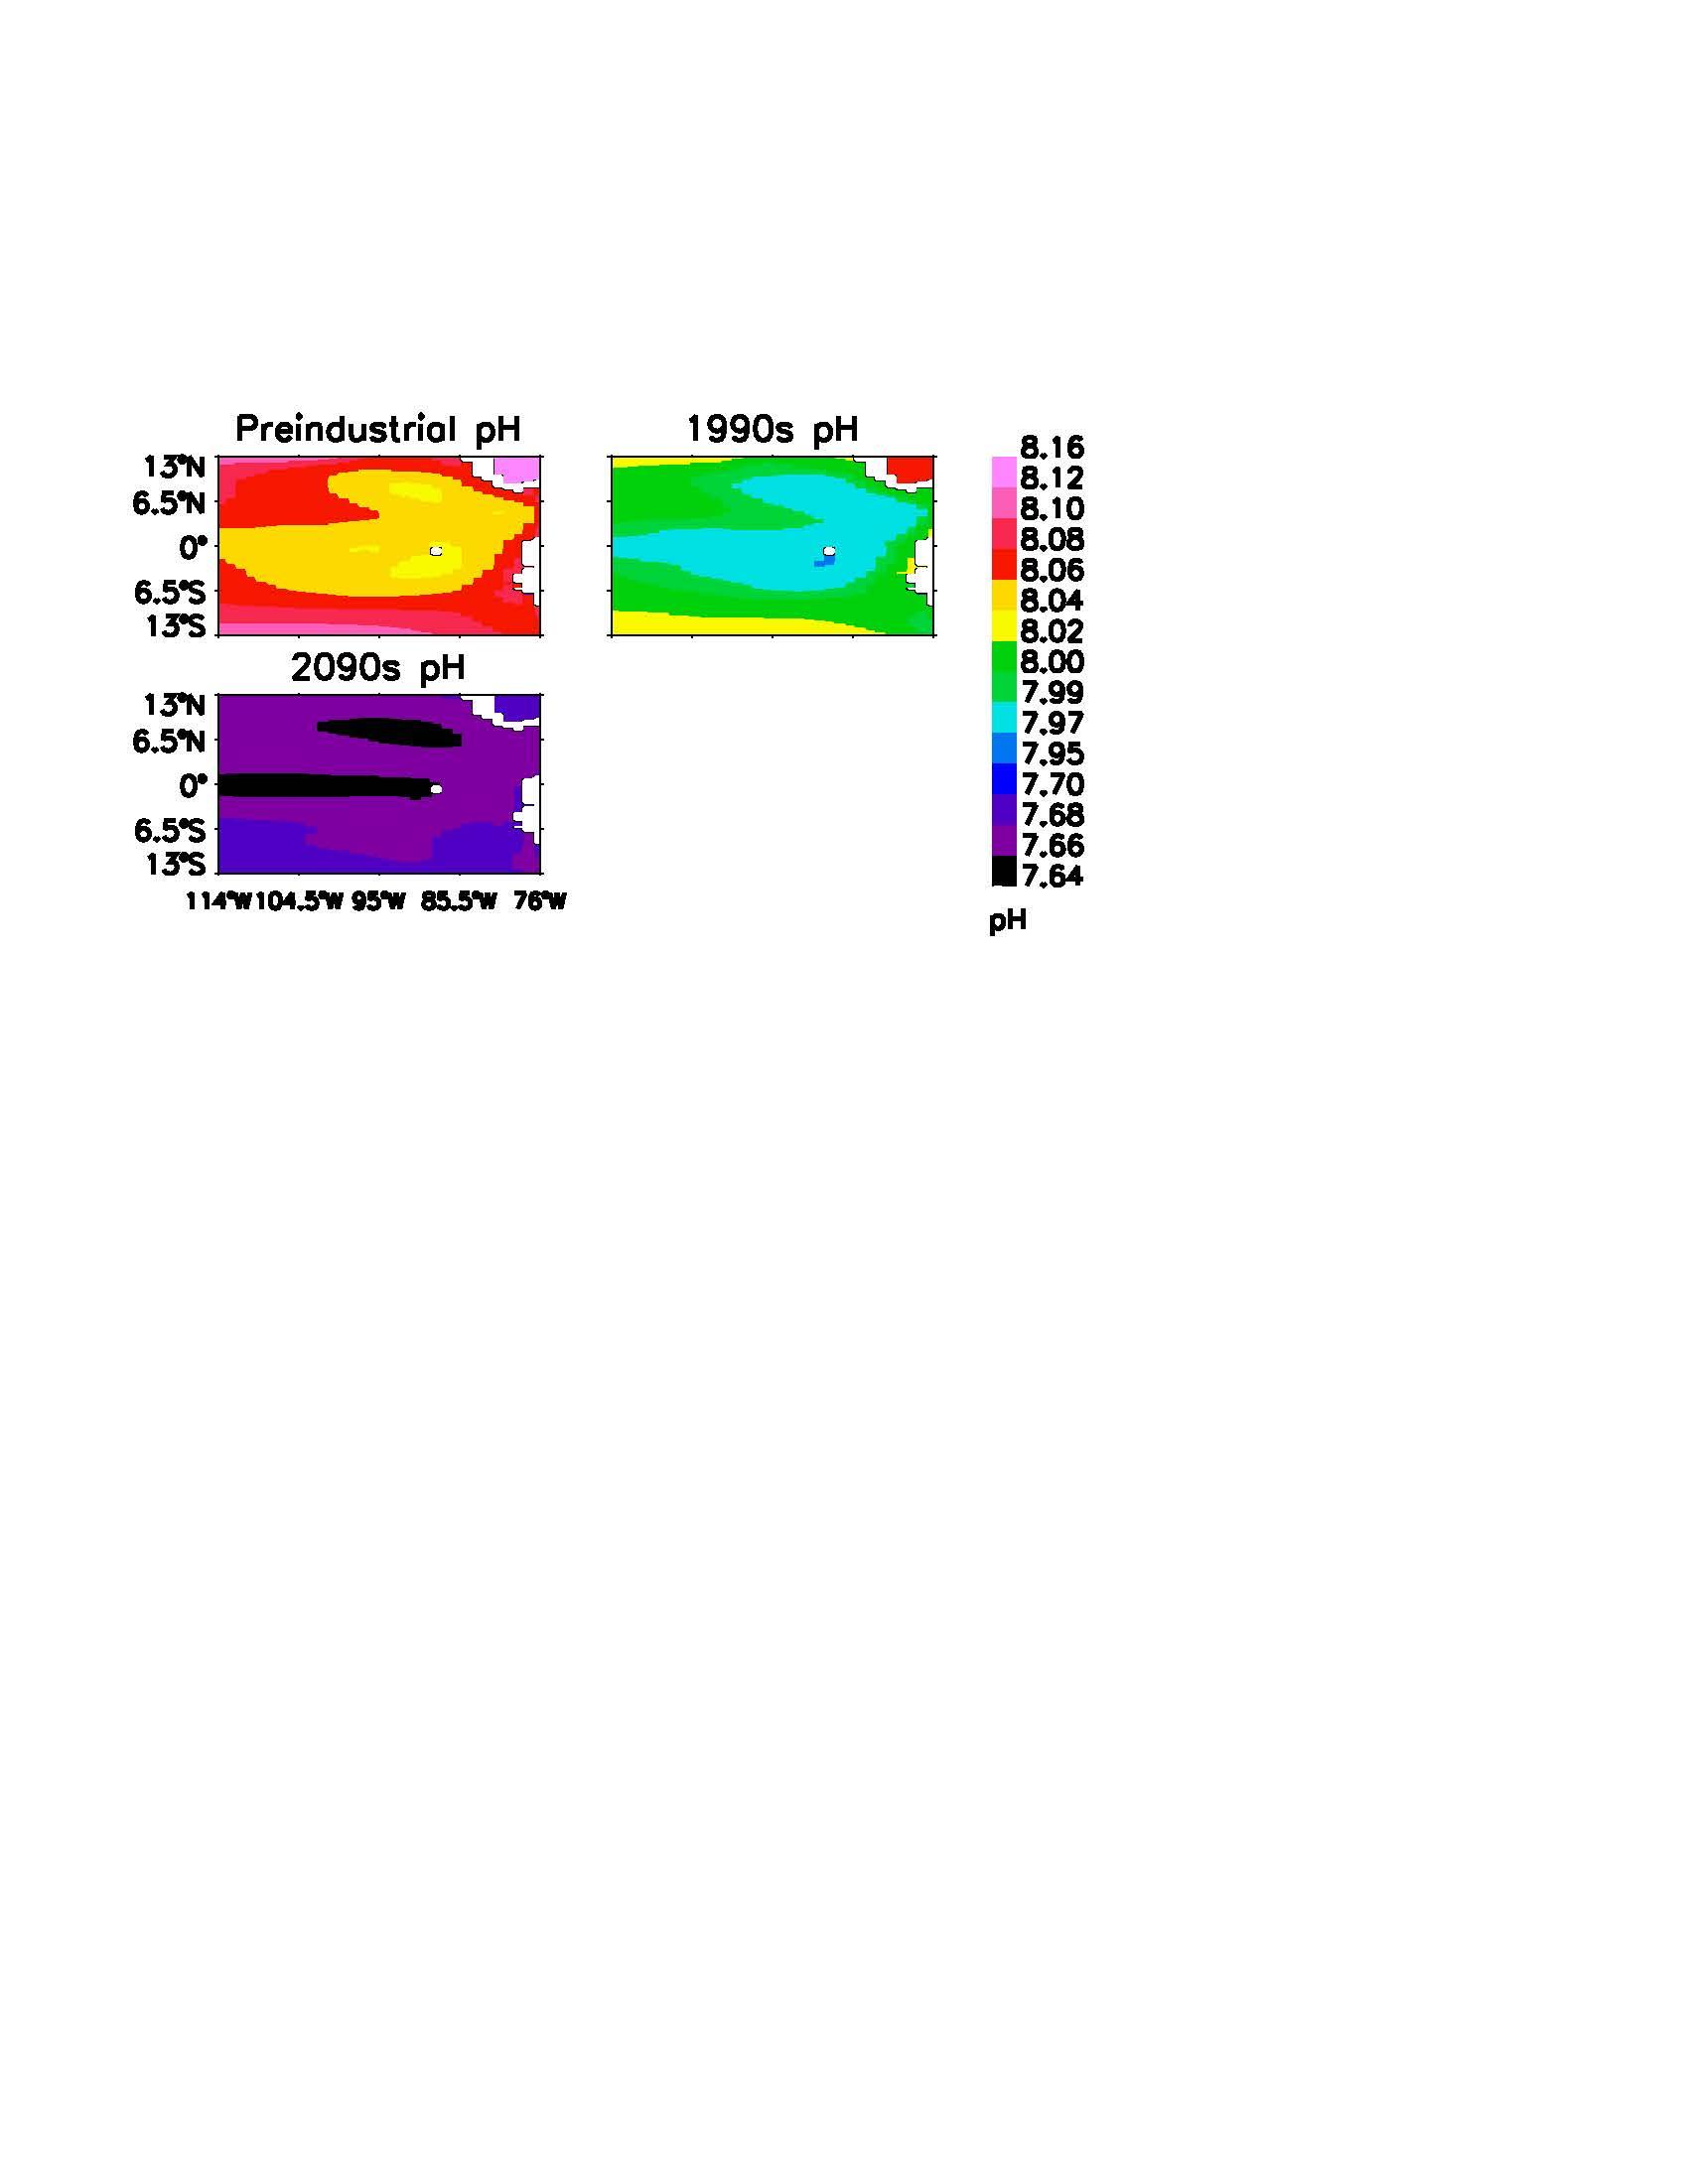
The CESM/CCSM model output was combined into decadal averages to demonstrate overall trends, which are displayed in Figures 4 and 5. The preindustrial period was demonstrated by the years 1880-1889. Note the slight warming in SST and mild decrease in pH in the century between the preindustrial period and the 1990s. The CESM/CCSM matched well with the observed 1990s conditions, with a correlation of 0.88 in Galapagos and 0.83in the Eastern Equatorial Pacific. Under the RCP8.5 scenario, the Eastern Equatorial Pacific basin is projected to warm by 4°C, with a slightly higher 4.5°C in the Galapagos Archipelago. The simulated pH decrease was 0.4 units for the Eastern Equatorial Pacific as well as for Galapagos.
Data for several of the other variables described in the CESM/CCSM model are shown in Table
The 29.2°C average SST in Galapagos projected for the 2090s is 1.5°C above the current bleaching threshold. The 29.4°C average SST for the Eastern Equatorial Pacific surpasses the current bleaching threshold by 1.4°C. For both regions, the waters demonstrate a pH decrease to ~7.7 units and the CO2 flux between the ocean and atmosphere represent just 25% and 6% of the preindustrial levels, in Galapagos and the Eastern Equatorial Pacific respectively.
Discussion
Under these simulated conditions, further coral development in the Eastern Equatorial Pacific is unlikely. The projected temperatures are well above the current bleaching thresholds, and assuming no thermal adaptations, the corals will not be able to reestablish their symbiotic relationship with the zooxanthellae. Net calcification is also likely to decrease under these more
acidic conditions and an ecosystem shift toward a macroalgae-dominated benthos is probable (Hoegh-Guldberg et al., 2007).
The future climate under the RCP8.5 scenario is remarkably similar to the conditions experienced during the 1997-1998 El Niño-La Niña. This provides a solid experiential basis for the challenges that will be faced by corals in the future. The 1997-1998 event lasted for about 1.5 years and caused a wide range in the amount of bleaching and mortality in the Eastern Equatorial Pacific basin (Glynn et al., 2001; Glynn, 2000). The projected climate has these conditions lasting for a decade.
The application of long-term, global climate models in this context is obviously purely theoretical and is still in its infancy. As such, there are numerous assumptions that have yet to be fully tested. In terms of the climate model, there are several different models and dozens of emissions scenarios available, each with their own biases. The results presented in this paper are from a single climate model under a single emissions scenario. The scenario chosen, RCP8.5, is a high emission, worse-case scenario. Additional testing with other models and scenarios is required to provide better statistical weight to these results. The spatial resolution of these largescale models needs to be further refined as well if they are to provide better information regarding these relatively small ecosystems.
From the biological perspective, the thermal adaptability of corals is hotly debated. It has been observed that corals from different regions of the globe have different thermal tolerances to match their typical environmental conditions (Baker et al., 2004). There is also a large body of evidence that corals can shift their algal-symbiont combinations following bleaching events to increase their bleaching threshold (Baker, 2003; Brown et al., 2002; Grimsditch and Salm,
2006). But there is significant evidence that corals may show tremendous selectivity and that low-thermal tolerance combinations have some advantages, such as improved nutrient efficiency (Hoegh-Guldberg et al., 2002; Goulet, 2006). The exact impact of ocean acidification on the degree of calcification is also inconclusively determined (Sale, 2011; Buddemeier, Kleypas & Aronson, 2004; Chauvin, Denis & Cuet, 2011).
The application of climate models for prediction of long-term coral development has the potential to be a useful tool to help guide scientific exploration and socioeconomic policy due to the high economic value of these ecosystems. More work is required to better refine both the biological and climate assumptions utilized in the execution of this study. The methods used in this study can also be applied to other coral-rich regions, such as northern Australia, the Red Sea, and the Caribbean, to provide an initial simulation of future abiotic stressors.
Acknowledgements: I would like to thank Dr. J. Keith Moore for his assistance with the CESM/CCSM, as well as the University of California, Irvine in coordination with the NSF REU program for providing funding and additional resources for this project.
Works Cited
Baker, A. C., C.J. Starger, T. R. McClanahan, and P.W. Glynn. (2004). Corals’ adaptive response to climate change. Nature, 430, 741.
Barton, A.D., and K.S. Casey (2005). Climatological context for large-scale coral bleaching. Coral Reefs, 24, 536-554.
Brown, B. E., C.A. Downs, R.P. Dunne, and S.W. Gibb. (2002). Exploring the basis of thermotolerance in the reef coral Goniastrea aspera. Marine Ecology Progress Series, 242, 119-129.
Buddemeier, R. W., J.A. Kleypas, and R. B. Aronson. (2004). Coral Reefs & Global Climate Change: potential contributions of climate change to stresses on coral reef ecosystems (pp. 1-56). Arlington.
Casey, K.S., T.B. Brandon, P. Cornillon, and R. Evans (2010). "The Past, Present and Future of the AVHRR Pathfinder SST Program", in Oceanography from Space: Revisited, eds. V. Barale, J.F.R. Gower, and L. Alberotanza, Springer.
Chauvin, A., V. Denis, and P. Cuet. (2011). Is the response of coral calcification to seawater acidification related to nutrient loading? Coral Reefs, 1-13.
Glynn, P. W. (2000). Effects of the 1997-98 El Niño-Southern Oscillation on Eastern Pacific corals and coral reefs: An overview. Proceedings of the 9th International Coral Reef Symposium (Vol. 2, pp. 1169-1174). Bali.
Glynn, P. W., J.L Mate, A.C. Baker, and M.O. Calderon. (2001). Coral Bleaching and Mortality in Panama and Ecuador During the 1997-1998 El Nino-Southern Oscillation Event: Spatial/Temporal Patterns and Comparisons with the 1982-1983 Event. Bulletin of Marine Science, 69, 79-109.
Glynn, P. W., and G.M. Wellington. (1983). Corals and Coral Reefs of the Galápagos Islands. Berkeley, University of California Press.
Goulet, T. L. (2006). Most corals may not change their symbionts. Marine Ecology Progress Series, 321, 1-7.
Grimsditch, G. D., and R.V. Salm. (2006). Coral Reef Resilience and Resistance to Bleaching (pp. 1-56). Gland.
Hoegh-Guldberg, O., R.J. Jones, S. Ward, and W.K. Loh. (2002). Is coral bleaching really adaptive? Nature, 415, 601-602.
Hoegh-Guldberg, O., P.J. Mumby, A. J. Hooten, R.S. Steneck, P. Greenfield, E. Gomez, C. D. Harvell, et al. (2007). Coral reefs under rapid climate change and ocean acidification. Science, 318, 1737-42.
Liu, G., A.E. Strong, W.J. Skirving, and L.F. Arzayus. (2006). Overview of NOAA Coral Reef Watch Program’s Near-Real- Time Satellite Global Coral Bleaching Monitoring Activities. Proceedings of the 10th International Coral Reef Symposium (Vol. 1793, pp. 1783-1793).
Lough, J. M., and M.J.H van Oppen. (2009). Introduction: Coral Bleaching – Patterns, Processes, Causes and Consequences. In M.J.H. van Oppen & J.M. Lough (eds.), Coral Bleaching – Patterns, Processes, Causes and Consequences (1-4). Berlin, SpringerVerlag.
Manzello, D. P., J.A. Kleypas., D.A. Budd, C.M. Eakin, P.W. Glynn, and C. Langdon. (2008). Poorly cemented coral reefs of the eastern tropical Pacific: possible insights into reef development in a high-CO2 world. Proceedings of the National Academy of Sciences, 105, 10450-5.
Sale, P. (2011). Our Dying Planet: an Ecologist’s View of the Crisis We Face. Berkeley, University of California Press.
Personal Biography
Matthew Ware is a soon-to-be graduate of Christopher Newport University with a B.S. in Biology, and minors in Leadership Studies and Chemistry. He is currently pursuing admission to the M.S. in Marine Biology program at the University of North Carolina at Wilmington to study under Dr. Michael McCartney. He has traveled extensively for this study and related projects, which has included the Galapagos Islands, southern California, the Bahamas, and Salt Lake City, UT. He plans to continue refining this project as he advances with his academic and professional career.