Mitigating Urban Heat Island Effect Through Climate-Sensitive Urban Design
Neighborhood scale climate change adaptation strategies
UCL | MSc Urban Design & City Planning | September 2022
 by Colter Sonneville
Introduction Abstract Context statement Contribution to practice Methodology Justification of research topic Research questions Literature review UHI causes & consequences UHI mitigation Urban morphology Street orientation Cool islands Trees and vegetation Cool materials Water Case studies & massing frameworks Case studies overview Algeria Morocco Donnybrook Quarter Two urban massing frameworks A. Shadow Umbrella B. Medina shade canyon Toolkit Street orientation and length (wind) Street orientation (solar) Deep urban canyon Downhill cooling Park cool islands Tree canopies Cool pavements Cool roof Green roof Site selection Site overview Site selection justification Intervention Conclusions References Literature references Figures/ Image references 1 5 11 21 32 38 49 53
01 02 03 04 05 06 07 08
Table of Contents
ABSTRACT
Exposure to excessive heat is responsible for thousands of deaths and emergency room visits annually in the United States. Due to climate change, Texas cities have been warming faster than the rest of the world. Within 25 years, the number of 100 F days is expected to double. Cities are even more vulnerable than the countryside due to the Urban Heat Island (UHI) effect. (Bielson-Gammon 2021)
Adapting cities to this new climate reality is critical to ensure the vitality of public spaces and the health of urban dwellers. This major research project (MRP) evaluates the most effective means to reduce UHI at a neighborhood scale in a humid subtropical context. The MRP presents two massing frameworks and nine toolkit items that can be used by architects and urban designers to lower the air temperature and improve human thermal comfort.
CONTEXT STATEMENT
The Urban Heat Island (UHI) refers to the observation of higher urban daytime and nighttime temperatures in cities compared to surrounding suburban and rural areas. UHI is present in cities around the world, regardless of climate. Heat islands form because man-made materials such as roofs and roads absorb energy from the sun and continue to radiate energy after sunset. Other factors, such as reduced tree coverage, slower wind speeds in urban canyons, and anthropogenic heat sources (vehicles and air conditioning units, etc) also contribute to increased temperatures (Lenholzer 2015, Howard 1818)
The phenomenon has been observed and well documented worldwide. UHI increases air temperatures during the day, and reduces the diurnal cooling pattern at night, leading to higher overall temperatures and less opportunity for thermal comfort relief. (Howard, 1818) There is a consensus in the academic literature that there are three main strategies for mitigating UHI. These strategies include: manipulating urban geometries, increasing trees & vegetation cover, and increasing albedo (cool roofs, etc) (Gartland 2008, Lai 2019, Santamouris 2017). Austin, Texas frequently records summer temperatures that are dangerously hot (in excess of 100° F / 38°C). Climate change is predicted to make Austin and other Texas cities increasingly hotter. It appears that Texas is warming faster (0.61° F per decade) than the global average (.36° F per decade). Within the next 25 years the frequency and intensity of dangerously hot days is projected to increase significantly (Nielson-Gammon 2021).
In wealthy countries, cities in hot climates usually rely on air conditioned buildings and traversing long distances for everyday tasks in air conditioned vehicles. This built environment is especially vulnerable to climate change. During an unusually severe winter storm in 2021, the Texas electric grid came within 5 minutes of a complete collapse that would have taken months to repair (Fanning 2021). Adapting cities to be more resilient and sustainable is the urgent task of designers and policy makers.
01 | Introduction 1
CONTRIBUTION TO PRACTICE
By synthesizing climate-sensitive design principles and tailoring them to the humid subtropical climate of Austin, the project will give designers a UHI mitigation toolkit plus two distinct massing framework morphologies. The toolkit and massing frameworks are broadly applicable to all American cities and in many international contexts where UHI is a growing concern.
Since other Texan cities, such as Houston, Dallas, and San Antonio have similar climates, it is likely that the toolkit will be broadly applicable to the state of Texas, where 84% of its 28 million residents live in urban areas.
The project is timely because Austin city officials have recognized the need for a comprehensive overhaul of its land development code (LDC). An 8 year effort to re-write the code became stalled in the court system in 2020. A fresh effort to re-write the LDC is inevitable. That rewrite is an opportunity to implement UHI mitigation strategies.

The site selected for intervention (Rosewood Courts) is also relevant and timely. It is located in an area with low tree canopy coverage and higher than average ground temperatures (Hoffman 2020). It also ranks highly on the Heat Priority Index (HPI), which combines heat exposure and socioeconomic vulnerability into a single metric, and is therefore the most at risk from extreme heat (McCall 2021).
The site selected is in the preliminary stage of a redevelopment plan and the agency is seeking public comment. This MRP could ensure that UHI mitigation principles are incorporated into the redevelopment.
01 | Introduction 2
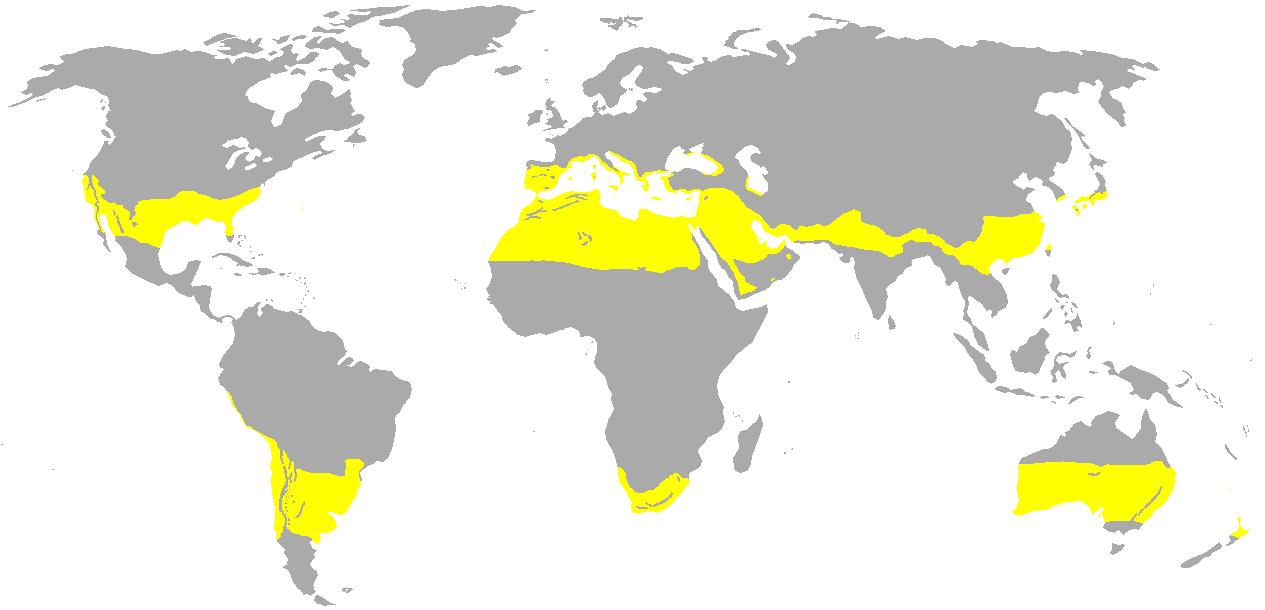
Figure 2. Subtropical climate zones (Koppen climate classification) are found around the world . City of Austin is starred.
01 | Introduction 3
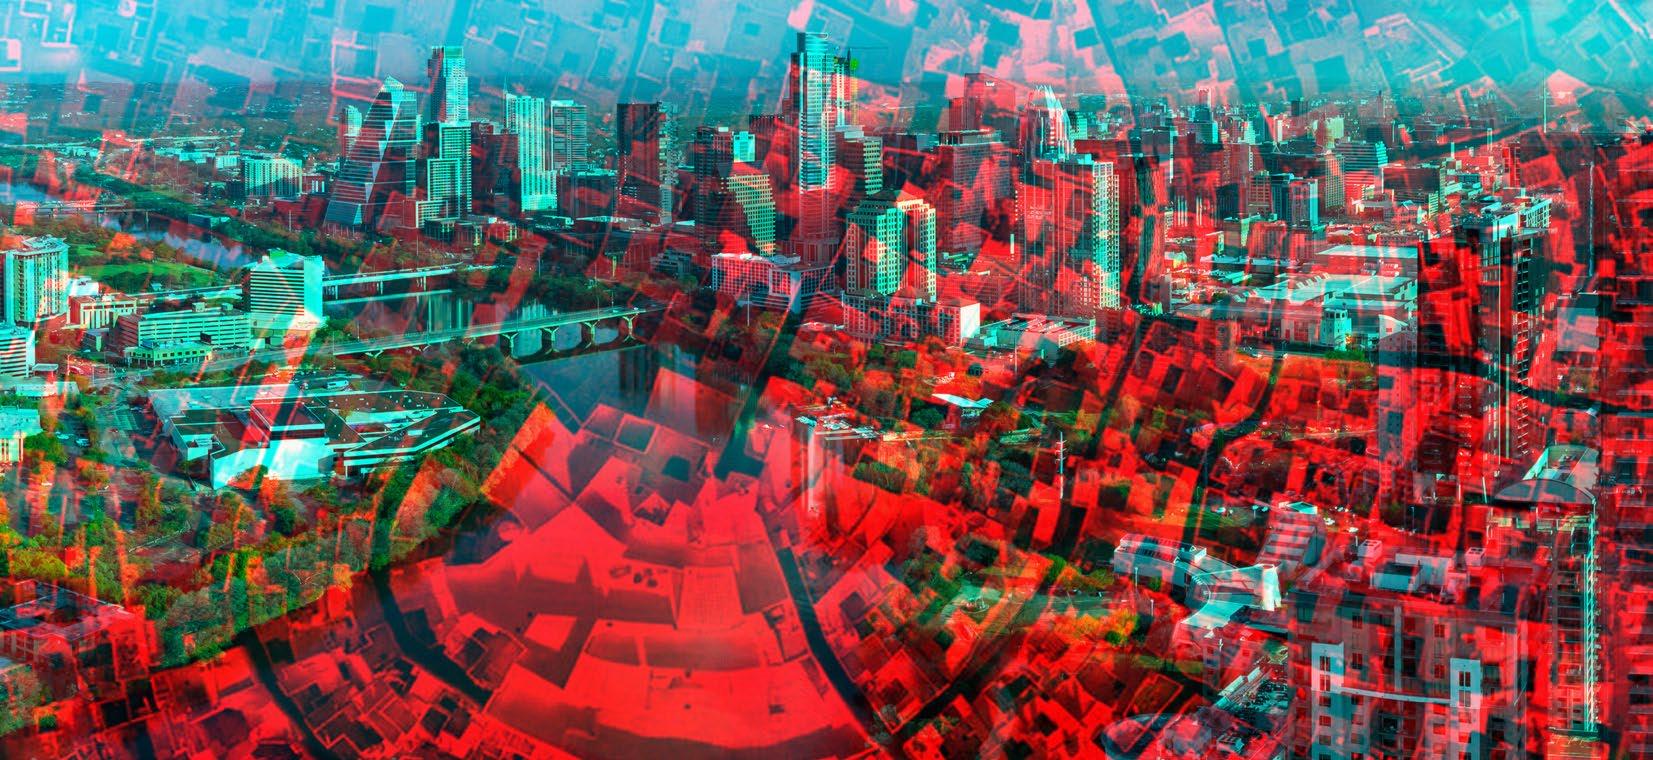
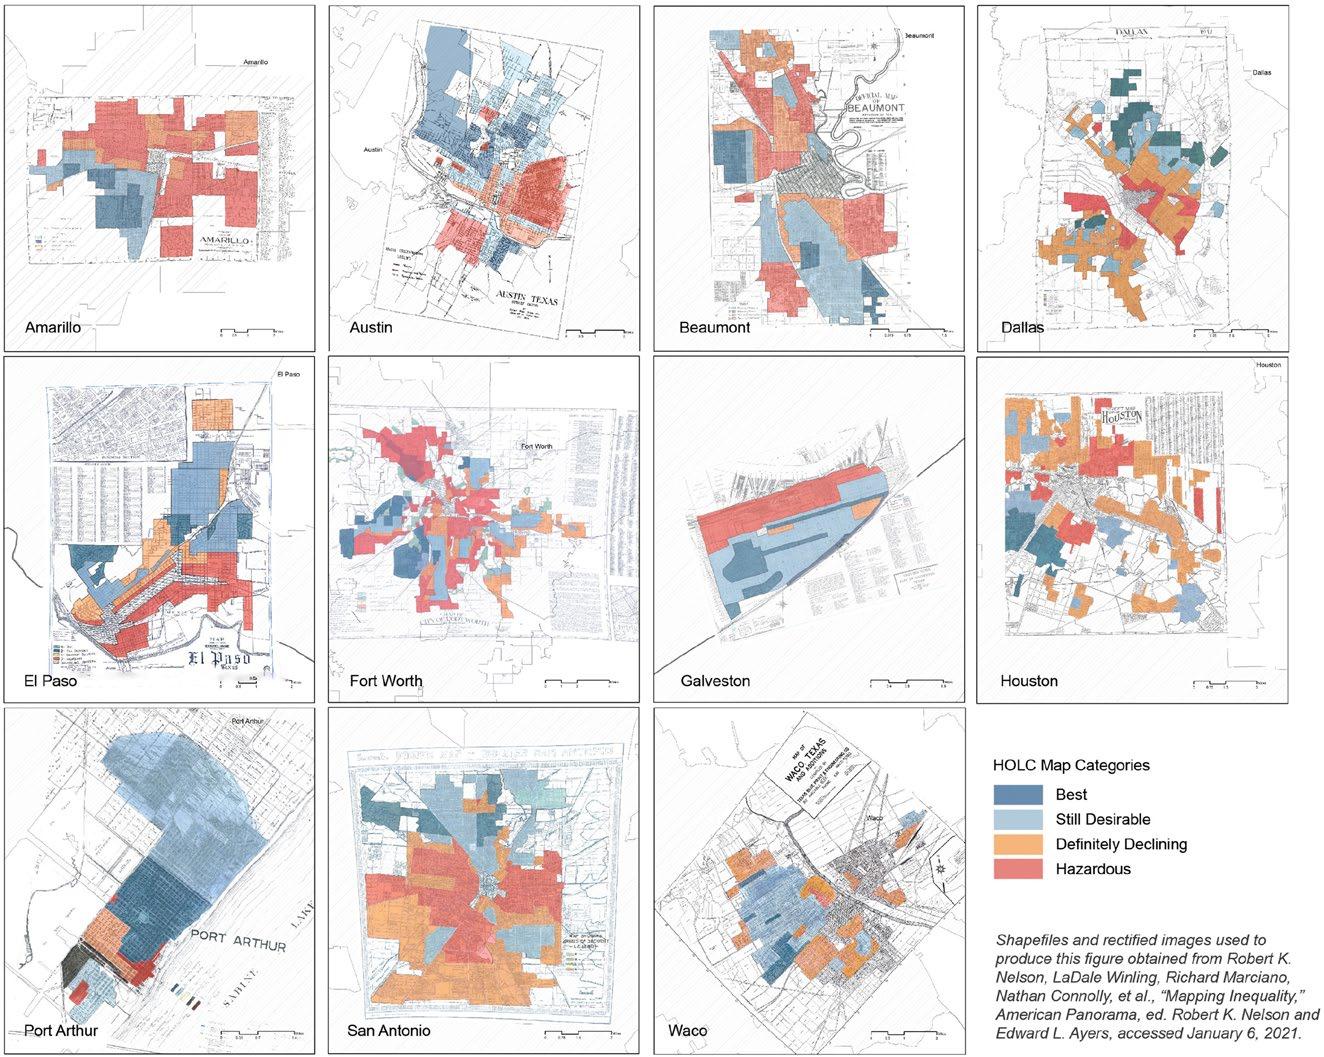
Figure 1. Texas cities with areas designated as “dangerous” (redlined)
JUSTIFICATION OF RESEARCH TOPIC
The world’s population has been rapidly urbanizing over the past few decades. Many of the fastest growing urban population centers are in hot tropical or subtropical climate zones. Texas is a US state that is quickly urbanizing. In the last decade, its cities have grown by 18% while its rural population has grown only 1% (Fanning, 2021)
Disadvantaged and minority communities are more likely to have lower tree canopy tree coverage and heat-absorbing infrastructure such as oversized parking lots and highways (Hoffman 2020). Therefore, residents have a higher burden of heat-related health risks. Tailoring climate sensitive design solutions to the neighborhood scale will help reverse place-based disparities in vulnerable communities.
RESEARCH QUESTIONS

How can designers deploy the most effective UHI mitigation strategies?
How can UHI mitigation tools be adapted to Austin’s climate and built environment?
01 | Introduction 5
1. Urban heat island causes & consequences
A review of contemporary academic literature was conducted to ascertain the causes, and remedies, for urban heat island effects (UHI). There are multiple reasons attributable to UHI. First is surface albedo of man-made materials, such as concrete and roofing shingles. These materials absorb the sun’s thermal energy much more readily than vegetation. They also radiate that heat long after the sun sets (Garland 2008).
Second is evapotranspiration, building materials are impermeable and watertight, so moisture is not available to dissipate the sun’s heat. Third is anthropogenic heat sources, such as gasoline powered engines and hot exhaust from air conditioning units (Garland 2008).
UHI has serious consequences, especially for a rapidly urbanizing planet that is facing increasingly extreme temperatures in the coming decades. According to Lai (2019), “UHI worsens a city’s thermal environment, increases, building cooling loads, and reduces the thermal comfort of open spaces. In addition, during the summer, a combination of global warming and UHIs is likely to result in increased heat-related mortality.”
2. UHI mitigation
To help city dwellers adapt to the effects of UHI, a number of mitigation strategies have been proposed for the built environment. According to Wong (2013), three are within the scope of urban planning
and effect surface temperatures on a local scale: urban morphology, green spaces and trees, and materials. These mitigation strategies can be applied to the project design phase at an urban design/ planning scale, and are practical and plausible ways to influence urban climatology on a neighborhood scale.
Lai (2019) also examined the most effective methods to reduce air temperature and increase physiologically equivalent temperature (PET) in summer. Of the three mitigating strategies reviewed, he found that changing urban morphology had the highest benefit yield.
3. Urban morphology
Though modifying urban morphology yields the most effective passive cooling, it has also been acknowledged that the extent to which the urban morphology can be changed are often limited ( Lai 2019), especially in the context of urban infill development.
When studying urban thermal environments, urban morphology is typically quantified with its own nomenclature.
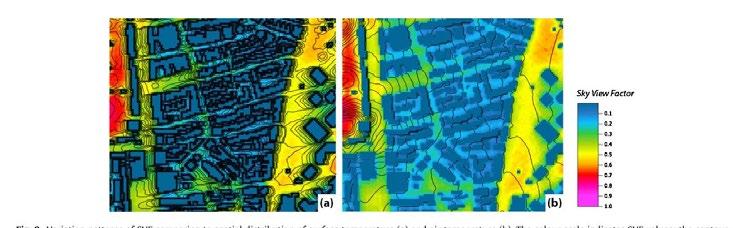
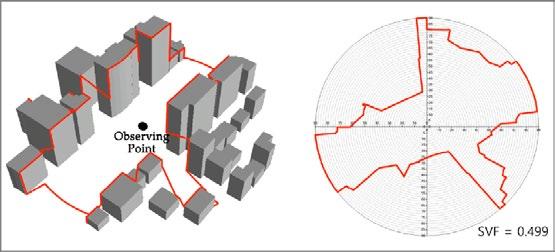
Sky-view factor (SVF) for irregular spaces such as courtyards and plazas. This number can range from zero to infinity, and represents how much sky is exposed to any given point. Buildings, trees, and shade structures can all reduce the SVF, and therefore limit the solar long wave radiation that can strike the ground or vertical surfaces.
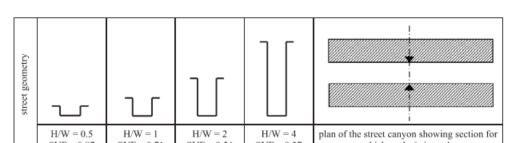
Height-to-width ratio (H/W, also urban canyon) is typically used for the ratio of building heights to street widths. A high H/W value signifies a deep canyon. Studies have confirmed that when a deep canyon is compared with a shallow one, the deeper canon will have more cooler temperatures. A wide range of H/W have been studied and tested, but there is no consensus about which ratio is ideal for a particular climate or latitude. Oke (1981) concluded that 0.4 was an appropriate ratio for mid-latitude cities. However, other researchers use the same ratio as an example of a poorly performing neighbor-
02 | Literature review 7
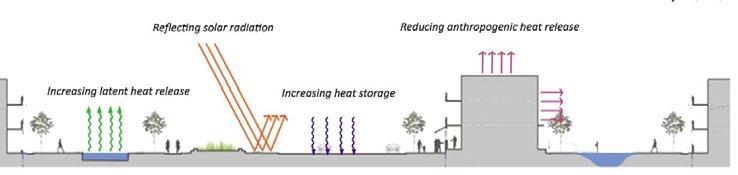
Figure 3. Typical cooling mechanisms to mitigate UHI effects
hood in Riyadh (Bakarman 2015).
This finding seems problematic. Austin’s residential housing typologies commonly have a H/W 0.4, due to wide residential streets and front yard setbacks. But this H/W seems to offer very little shading.
The definition of “mid latitude” isn’t very practical for practitioners. Mid-latitude cities include both Miami and Anchorage, Alaska. Finding the “ideal” ratio for a humid subtropical city with very hot summers is not readily found in the literature, and designers need to pick a ratio that offers UHI reduction benefits while also being context appropriate.
A comparison of old (narrow canyon) and modern (wide canyon) street typologies in Fez, Morocco found summer temperature difference as high as 10 Kelvin during the hottest days of the year (E. Johansson 2006). The study showed “that a compact urban form with very deep street canyons gives a good protection during the long hot summer period as such design results in lower temperatures and provides shade for pedestrians during the warmest part of the
day”. Such a configuration also requires less power consumption for cooling and allows for more efficient land use (E. Johansson 2006).
There are drawbacks to deep canyons, however. They have reduced access for emergency vehicles, congestion, reduced sunlight for dwellings (especially in winter), and overcrowding.
Johansson (2006) recommends that hot subtropical cities that also experience cold temperatures, like Austin, should have a mix of canyon like streets for summer temperature reduction, while also allowing for an urban design mix of wider streets or open civic spaces that allow for solar warmth in the mild winter months.
4. Street orientation
Researchers have concluded that streets oriented parallel to the prevalent wind direction is an affective strategy to reduce urban air temperatures.
Ng (2009) suggests a maximum angle of 30° between the street and flow orientation to achieve optimum wind circulation.
However it should be noted that facilitating maximum wind speed is not universally desirable. Urban climatologists in northern European cities actually attempt to limit wind circulation to make winter more comfortable (Lenholzer 2015).
Wind data from Austin’s airport reveal a consistent wind pattern that changes little with the seasons. During the hottest months (July and August), wind direction is oriented to the south and SSE. Austin’s street grid is variable, and some streets are roughly oriented in this
02 | Literature review 8
Figure 6. Height-to-width ratios, aka “urban canyons”, useful for uniform building heights
Figure 5. An example of how to calculate SVF from an observation point. Useful for irregular urban fabric configurations.
Figure 4. Higher sky view factor values indicate higher surface temperatures.
direction. Since Austin’s summer and winter winds generally come from the South, streets oriented parallel will achieve cooler temperatures in the summer, but may also be less comfortable on an (infrequent) cold winter day.
Separate from street orientation to prevailing winds is street orientation for optimum solar exposure. There can be conflict between the two. Researchers have studied the thermal street environment produced by N-S and E-W oriented streets and concluded that N-S streets facilitate the lowest temperatures. Whereas E-W streets should be avoided if possible (Ali-Tourdert 2005).
A study of traditional street fabric in Fez, Morocco determined that N-S oriented streets with a H/W ratio higher than 0.8 can produce comfortable conditions. But if the ratio is skewed too far for height, sunlight cannot penetrate (Johansson 2006).
Some researchers (Ali-Tourdert 2005, Johanson 2006) have noted that E-W oriented streets can also provide a great deal of comfort, especially on the south side (in the northern hemisphere). However, a study in Tunisia found that E-W streets were the least comfortable (high heat stress), and could be as much as 8 degrees warmer than N-S streets (Achour-Younsi 2015).
Its clear that orientation has a dramatic effect on thermal comfort and should be taken into account, along with the climactic context, such as prevailing coastal winds.
5. Cool islands
There are also opportunities for combining urban morphology and the location of green space and parks to take advantage of evapotranspiration of trees. Placing settlements on the leeward side of natural spaces can accentuate the cooling effect of wind and contribute to natural cooling (Smith 2008). This is referred to be researchers as “park cool islands”. A Canadian study found that ‘a plume of cool air’, up to 6 degrees cooler, can be measured up to 100 meters on the
leeward side of a neighborhood park (Lenzholzer 2015).
6. Trees and vegetation
Increasing urban greenery is considered the second most important strategies for reducing UHI. It is considered the most popular (Santamouris 2017) and lowest cost method and has a number of other advantages, such as being low tech and requiring little in the way of planning or design.
Large tree covered areas are an effective way to prevent the absorption of thermal heat by pavements and buildings. In addition, they increase the relative humidity (RH) of the air and provide additional thermal cooling through evapotranspiration (Gartland 2008).
In an arid environment, the increase in RH is welcome but in an already hot and humid climate, the additional humidity is not beneficial. However, “it can be assumed that the benefits of lower temperatures outweigh any negative effects of higher humidity” (Gartland 2008).
The cooling benefits can be significant, even on a local scale. Studies have found that tree groves were 5 C (9F) cooler than in nearby open terrain. In Dallas, tree shaded areas were found to be 11 degrees F cooler than their unshaded counterparts (Kelbaugh 2019).
Tree species are not equally effective for cooling. Trees with large and dense crowns appear to be the most effective (Saaroni 2018). Street trees in particular have been demonstrated as highly effective in lowering ambient temperatures and promoting thermal human comfort. However, dense canopies can reduce wind speeds and air circulation. This wind shielding is useful for blocking cold winter winds, but is not advantageous if cool summer breezes are obstructed. Where cold winter winds are an issue, evergreen trees would perform best (Saaroni 2018).
Tan (2016) found that there is an optimal spatial arrangement for
02 | Literature review 9
tree planting in high density sub-tropical cities. Small parks in high SVF areas significantly lower localized air temperatures. He also found that in high density residential areas, trees should be planted along wind paths to cool neighborhoods. This has implications for design practitioners who spatially arrange streetscapes and public tree planting.
7. Cool materials
Roofing covers about 20% of urban areas, and are responsible for the highest temperatures of land satellite thermal imagery. In the USA there are several common roofing materials, but the majority absorb 75% or more of the sun’s energy, and can be classified as ‘hot roofing’. Studies of roofing materials in the USA have shown that they frequently reach 65-90° C (150-190° F). Most of this heat absorption is due to the low reflectance and high albedo of mainstream roofing material (Gartland 2008).
However, newer high-albedo roofing materials are designed to reflect solar energy, thereby lowering the latent heat of roofs (Gartland 2008).
Paving material typically covers 25-50% of urban areas and is a major contributor to UHI. Its is the second hottest feature of the urban landscape, after roofs. Paving in the USA typically consist of either concrete or asphalt. Asphalt reaches 65°C (150°F) during summer, and concrete pavement is comparatively cooler, staying below 50°C (120°F) even in the most extreme conditions. Unfortunately asphalt has the dominant market share in the USA, due to lower installation costs and ease of installation. Though data isn’t available for Austin, 71% of minor arterial roads are paved in asphalt in the USA (Gartland 2008).
A large scale study of reflective pavements in Athens revealed significant reductions of peak ambient air temperatures during the summer, improving micro-climactic conditions and human thermal
comfort. Temperature readings were conducted before and after cool pavements were installed, showing that surface temperatures were up 12°C lower than the “legacy” pavements. (Santamouris 2012) Though such pavements have a higher cost per square meter, they are an efficient mitigation tool to reduce UHI. Such efforts are especially effective when retrofitting or refurbishing urban areas with elevated UHI.
8. Water
While water has also been shown to reduce ambient air temperatures, it has been excluded from this MRP because the literature is focused on small areas (i.e. fountains) that are more of landscape intervention than urban design.
Water body interventions on the neighborhood scale were found to be ineffective or even counterproductive due to an increase in relative humidity (Lai 2019).
02 | Literature review 10
CASE STUDIES OVERVIEW
Inspiration from building typologies in the western and non-western world.
The literature review findings triggered a series of more in-depth investigations into how best to mitigate UHI. In this section, we explore real-world and theoretical urban forms found in academic literature.
The study of urban fabric from subtropical cities around the world dovetailed into discovering two overarching massing strategy frameworks. One from a traditional Arab-muslim urban perspective, and one from a western contemporary perspective. Both mitigate UHI effectively.
case studies


non-western urban fabric
• Algerian street canyons
• Street typologies of Fez
western urban fabric
• Donnybrook Quarter
• Shadow umbrella theory

Urban massing frameworks
• Shadow umbrella
• Medina shade canyon
03 | Case studies & massing frameworks 12
ALGERIAN STREET CANYONS & ORIENTATION
Fazia, Ali-Toudert. Numerical study on the effects of aspect ratio and orientation of an urban street canyon on outdoor thermal comfort in hot and dry climate
Case study summary
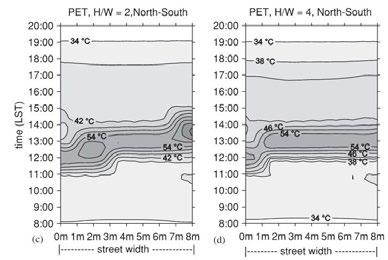
This Study looks at physiologically equivalent temperature (PET) and its distribution at the street level in typical small city in Algeria. The authors modeled PET of various H/W ratios and solar orientations for a typical summer day. The authors concluded that extreme heat stress is correlated with the aspect ratio (H/W) and street orientation of the urban morphology. The study offers a number of built environment design solutions to lower the temperature and increase the thermal comfort of pedestrians in dense urban environments.
Location:

Ghardaia, Algeria
Application to design


1. It is difficult to mitigate heat stress on streets oriented E-W. Therefore, E-W streets should be avoided or made as narrow as practical
2. PET is strongly correlated with aspect ratio and street orientation
3. Wide streets (H/W = 0.5) are highly stressful to PET. Narrow streets (H/W=2.0) combined with a N-S orientation are ideal for PET
4. Diagonal streets offer the best comfort, while also allowing a good degree of sun exposure in the winter, compared to N-S streets
5. Ghardaia has an arid climate. Humidity less than 35% in summer. All findings may not be fully transferable to Austin’s hot humid climate
03 | Case studies & massing frameworks 13
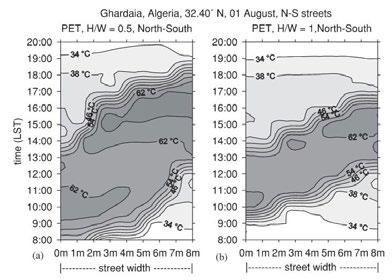
Figure 7. Aerial view of Ghardaia. Note the narrow streets, with various orientation, interrupted by an open plaza.
Figure 8. PET distribution in the city. Note the highest temperatures are correspond to low H/W ratio (on left side).
THE STREET CANYON TYPOLOGIES OF FEZ
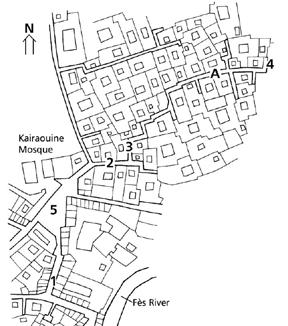
Johansson, Erik. Influence of urban geometry on outdoor thermal comfort in a hot dry climate: A study of Fez, Morocco
Case study summary
Fez is an extremely compact city with buildings two to four stories high. Streets are exceptionally narrow, and cars are limited to distributor roads. The researchers made continuous temperature measurements during the hot summer months and cool winter months. Looking at both traditional medieval urban geometry (medina) with a high H/W ratio and newer streets (nouvelle ville) with a low H/W ratio, they found urban heat island differences of up to 10 C.
Location:
Fez, Morocco
Application to design
1. A compact form with very deep canyons offers best thermal comfort in the summer, but less thermal comfort in winter
2. The deepest canyons offer comfortable summer temperatures, but at the expense of sunlight and air circulation
3. A climate-conscious urban design should offer wider streets and open spaces which function as sun relief in the winter. Use of deciduous shade trees in open spaces has a multi-season benefit: shade in summer and sunlight in winter
4. Need simple climate-sensitive tools for planners, architects
03 | Case studies & massing frameworks 14
Figure 9. Fez new city
Figure 10. Fez new city study area
Figure 11. Fez old city study area
Figure 12. Fez old city
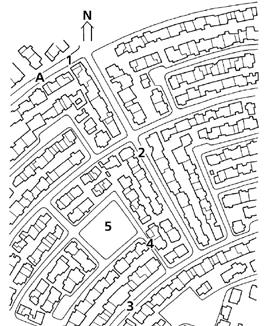
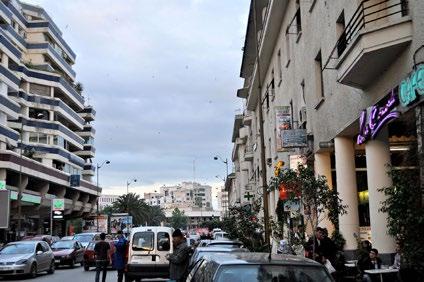
DONNYBROOK QUARTER
Peter Barber Architects
Case study summary
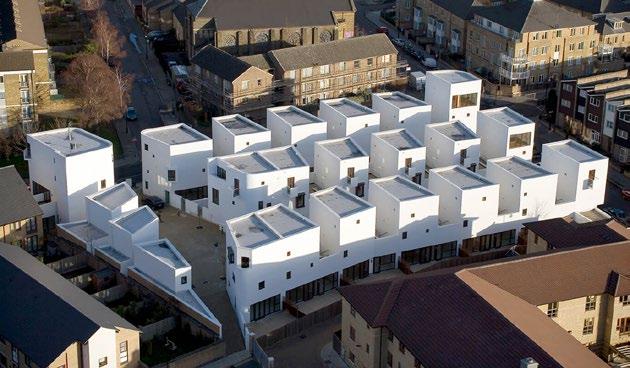
An AIA and RIBA award-winning housing project in London’s east end, Donnybrook Quarter varies between 2-3 stories, similar to the medina. Its described as a “low-rise, high-density street based city” by the architect, Peter Barber. The interior streets have an intimate scale of 22’ width and 2-3 stories in height, roughly similar proportions to those found in the medina.
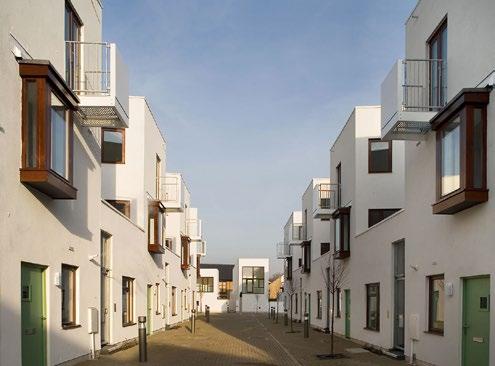
Location: London, England
The H/W ratio of 1.0 is rarely found in Austin and is thermally superior to the H/W 0.4 found throughout Austin’s residential districts. Unlike the medina, it offers small private backyards and rooftop terraces at each unit. Units appear to have abundant sunlight, which is a problem in the medinas studied for this MRP. Its a compelling example of a housing typology that has arab-muslim urban fabric characteristics, while also being thoroughly western and contemporary in its context and execution.
14
Application to design
1. H/W ratio of 1.0 can be achieved in the western context and is acceptable to housing consumers
2. A compromise between eastern and western built environment characteristics
03 | Case studies & massing frameworks 15
Figure 13 Figure
Formation of two urban massing frameworks
Focusing my research on places with similar climactic conditions made it clear that there were examples of climate-conscious urban massing from other cultural perspectives that mitigate UHI.
1. The traditional building typologies of the Arab-Muslim world that still function today in Morocco, Tunisia, Algeria, and Saudi Arabia. This typology I termed Medina Shade Canyon, after the Medinas of Fez, a UNESCO World Heritage Site. Fez has some of the best preserved traditional building typologies of the Arab-Muslim world.
2. Shadow Umbrella is A hypothetical climate-conscious massing model. A more western development style mixed-height concept, its goal is to “mitigate the negative impacts of tropical urban climate... by use of a shadow umbrella, or sun avoidance scheme”.
Both urban massing frameworks are tested in this MRP to determine which is more suitable to our intervention area, and the American context at large.
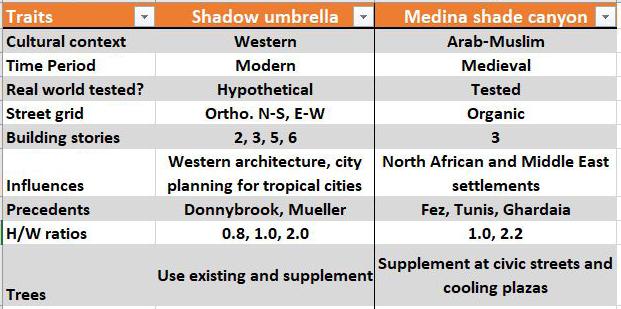
Framework Comparison
03 | Case studies & massing frameworks 16
“A framework sets out, in words and graphics, the intentions, principles and actions to guide and changes in the public realm in a particular place”
-Victoria State Government
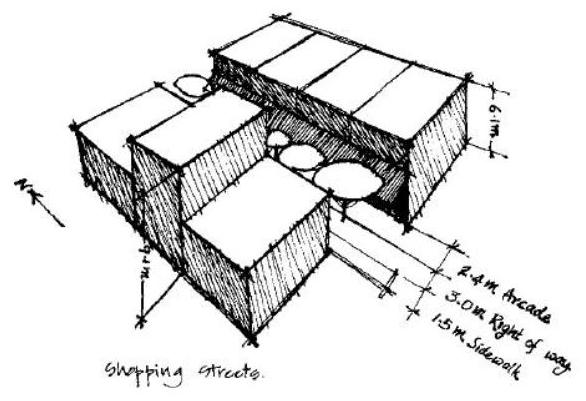
URBAN MASSING FRAMEWORK A - SHADOW UMBRELLA
Origins
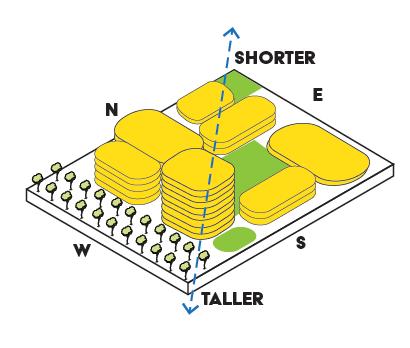
This “hypothetical urban mass model for thermal comfort in the equatorial tropical outdoors”, was pioneered by architect R. Emmanuel (1995 2005) while a professor of architecture at the University of Moratuwa in Sri Lanka, and he tweaked over the course of his career. It responds to the need for UHI mitigation in tropical climates. Since surfaces that receive southern and western sun exposure are heated the most, this model aims for radiation reduction in outdoor spaces during the day, by using urban massing scales and complimenting the massing with a zone of trees at the exposed western flank. Emmanuel’s research is an inspirational foundation for research-led design.
Characteristics
1. Buildings will be tall on the west and south
2. Buildings on the east will be smallest
3. Leave a wide margin on western side to plant trees that provide additional shading
4. NE and SW corners, and center of the block, can be left open

Issues
The author appears to have made a few typos. The text in the body of the document conflict with the diagrams. For example, mixing up “north” and “taller” and “shorter”. The diagram on this page represents my best attempt to accurately synthesize the written text and diagrams contained in the Emmanuel’s literature. This model is designed for tropical climates. The climate of our intervention is sub-tropical.
03 | Case studies & massing frameworks 17
URBAN MASSING FRAMEWORK A - SHADOW UMBRELLA
03 | Case studies & massing frameworks 18
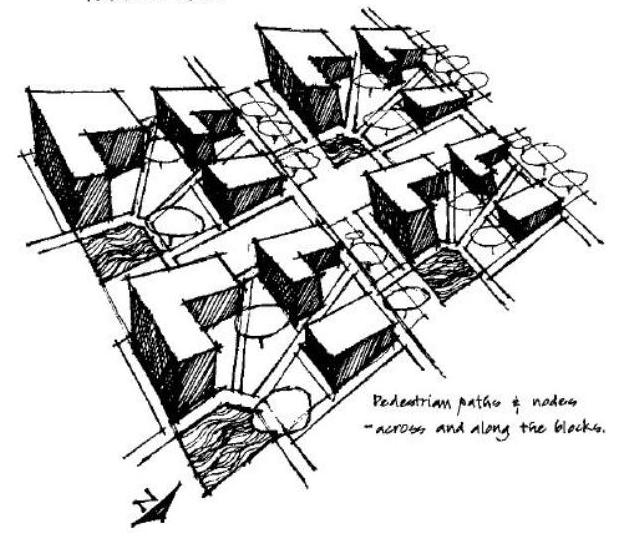
Figure 15. Composite “shadow umbrella”
Figure 16. Pedestrian paths
Figure 17. Shopping streets
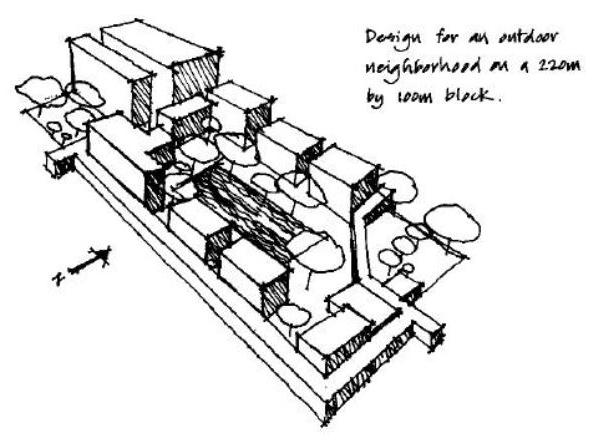
URBAN MASSING FRAMEWORK B - MEDINA SHADE CANYON
Origins
This massing framework is inspired by traditional historic core neighborhoods found in North African and Middle Eastern cities (Fez, Tunis, Riyadh). Researchers have found these dense three story buildings with courtyards and very narrow streets have excellent microclimates and mitigate UHI (Ali Tourdert 2005, Johansson 2006, Yahia 2018)
Characteristics
1. Extremely compact
Note: Medina is Arabic for Islamic city
2. Two to four stories high, inward looking with a courtyard at the center of buildings
3. Very narrow streets and high H/W ratio
4. Irregular street network, which increases mutual shading by buildings
Improvements
Because this project is research-led design, I have taken the traditional morphology characteristics above and updated it with principles recommended by Johannson (2006). These additional principles enhance livability.
1. Wider civic streets for additional sunlight and access
2. Sun & tree cooling plazas. These multi-seasonal spaces would be placed at regular intervals to allow sunlight and warmth in winter, while also providing tree-shaded open spaces for pedestrians in the summer months
03 | Case studies & massing frameworks 19
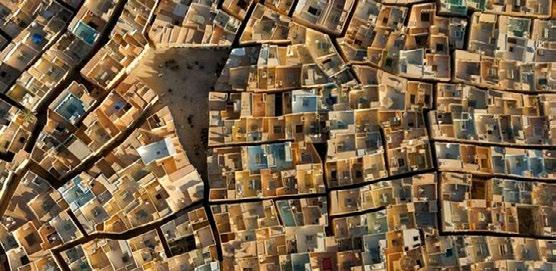
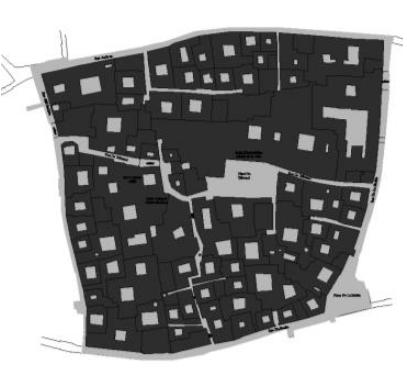
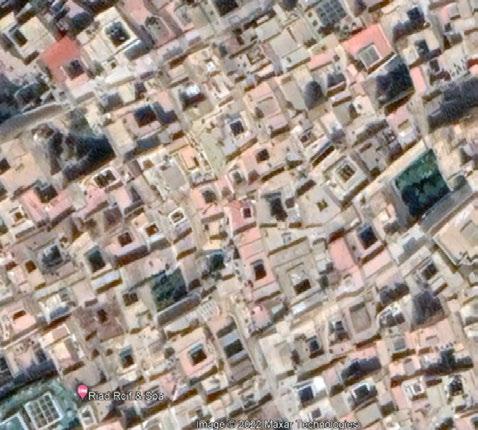
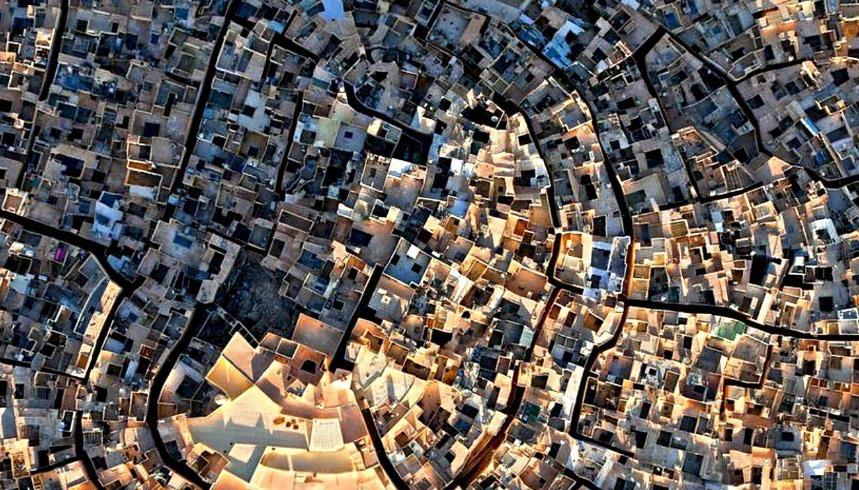
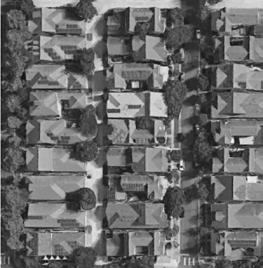
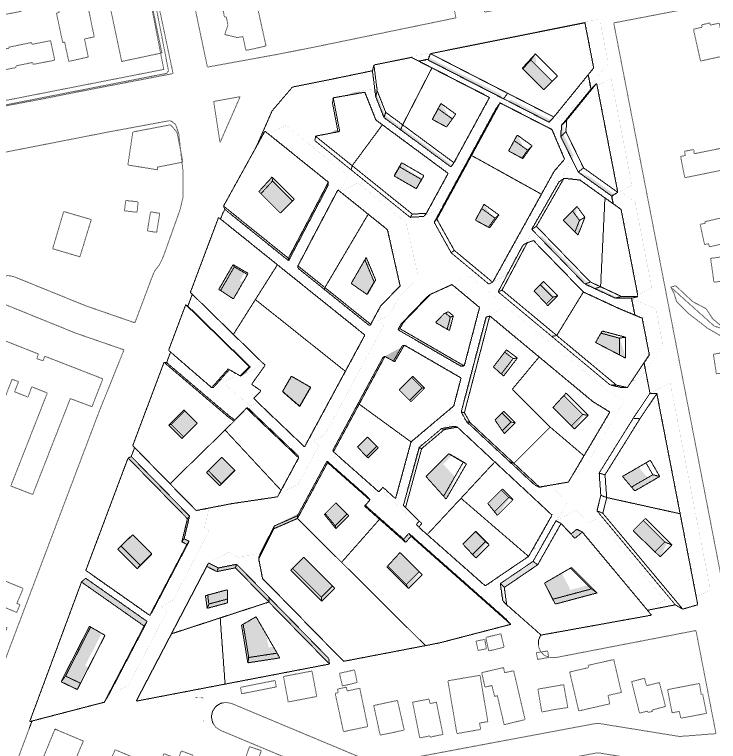
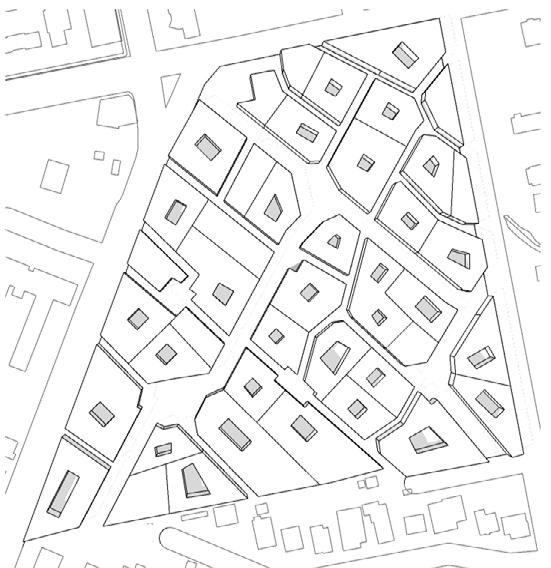
Figure 18. Aerial view of a typical North African shade canyon, with a fine street pattern mesh and very narrow streets/ paths
Figure 19. Figure ground of buildings, courtyards, public lanes, and plazas in the Fez medina. It is considered one of the conserved towns of the Arab-Muslim world
URBAN MASSING FRAMEWORK B - MEDINA SHADE CANYON
03 | Case studies & massing frameworks 20
Figure 20. The fortified city of Beni Isguen, Algeria. Constructed in the 10th century. It is highly adapted to the desert climate. The city has been described in its’ UNESCO inscription as a “traditional human habitat... designed for community living... and is a source of inspiration for today’s urban planners”.
TOOLKIT MECHANISMS
Which design mechanisms are proven to reduce UHI?
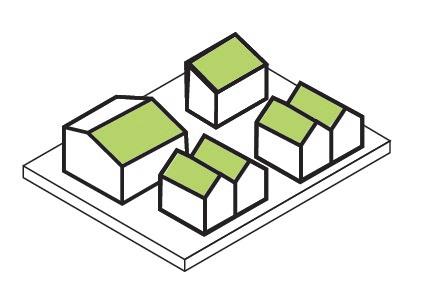
The literature review determined that three mechanisms reduce ambient air temperatures and UHI - urban form, materials, and trees & vegetation. Some of the tools are made up of overlapping mechanisms, as shown here.
URBAN FORM
Street orientation (wind)


Street length (wind)
Street orientation (solar)
Deep urban
canyon
Materials
Cool pavements
Cool roof
Downhill cooling
Park cool islands
Green roof
Tree canopies
TREES & vegetation
04 | Toolkit 22
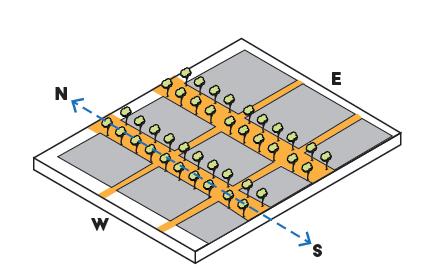
STREET ORIENTATION & LENGTH (WIND)


Notes
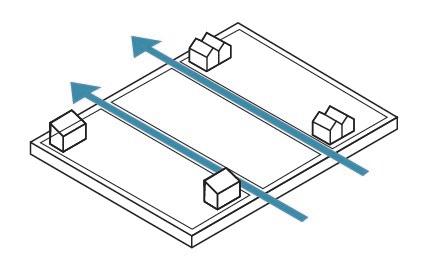
Wind speed, and the UHI mitigation benefits of air circulation, is effected by street length and orientation. Studies have shown that longer streets have higher wind velocities and conversely, shorter streets have lower velocities. Higher wind velocities lower the mean radiant temperature of the street (Yahia 2018)
Another way to capitalize on longer streets is the street’s orientation towards the prevailing summer winds. This tool is forgiving to urban designers, studies have shown that streets can vary up to 30 degrees in their orientation towards winds and still effectively channel the wind (Yahia 2018).
Limitations
This toolkit can only be used when planning new development patterns. Since new development circulation patterns will often be influenced by external urban morphology conditions, orienting streets toward the wind isn’t always feasible.
04 | Toolkit 23
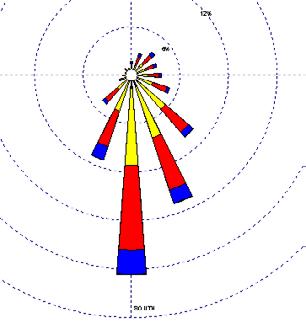
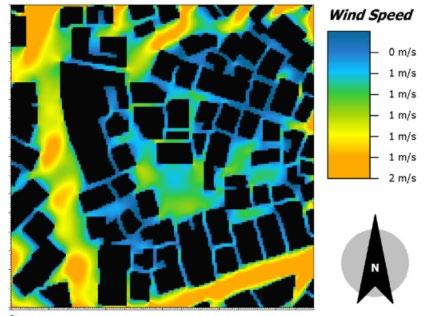
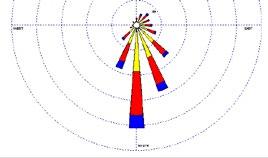
Figure 21. Longer streets have higher wind velocities (orange).
Figure 22. A wind rose, showing historical wind direction and speed during any given month.
URBAN FORM
Notes
Academic research has revealed important principles for designers to consider to consider when laying out new streets that mitigate UHI.
1. Streets oriented North-South have the least amount of solar exposure, since the sun moves in an arc from east to west. Building heights will typically shade a N-S street in the morning and afternoon.
2. Streets oriented East-West are subject to more intense solar exposure. In theory, they should be eliminated where possible. Alternately, they should be much narrower (ie pedestrian oriented) than N-S.
3. The north side of a N-S street is the hottest of all.
4. Some researchers argue that diagonal streets (SE-NW) offer the better solar performance than N-S, while also maintaining good winter solar exposure during winter months in subtropical climates.
(Bakarman 2015) (Younsi 2015) (Ali-Toudert 2006) (Johansson 2005)
Limitations
Most researchers present an argument for N-S streets. Others argue diagonal streets perform better if winter warmth and sunlight is desired. Designers must pick one!
04 | Toolkit 24
URBAN FORM
STREET ORIENTATION (SOLAR)
Notes
Urban geometry strongly influences the land surface temperature of cities. Finding the optimum H/W ratio is challenging. Studies in the subtropics have indicated that a H/w ratio of 2.0 or more, combined with a N-S street orientation, provides a comfortable environment (Ali-Toudert 2006)
Wide streets (H/w 0.5) are thermally stressful, and if such streets are planned shading devices such street trees and, architecture features such as galleries should be used. (Ali-Toudert 2006)
Limitations
While a deep urban canyon H/W ratio is beneficial for reducing radiant temperatures and mitigating, there are drawbacks. These include reduced emergency access, limited vehicle access for commercial activities, and poor thermal comfort in winter, when sunlight penetration is limited.
Thermal comfort through passive means is difficult to achieve in hot regions, but improvements can be made.
04 | Toolkit 25
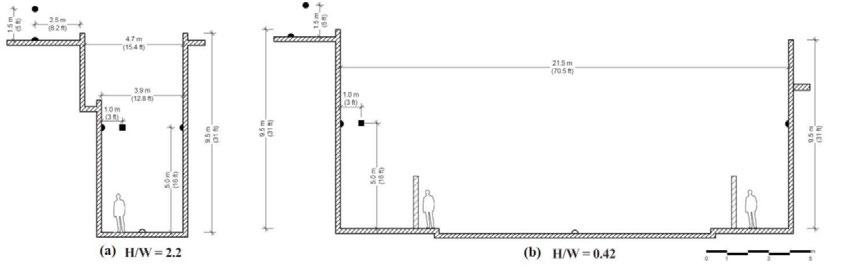
URBAN FORM DEEP URBAN CANYON
Figure 23. From Fez, an example of a deep urban canyon on the left and a shallow urban canyon on the right.
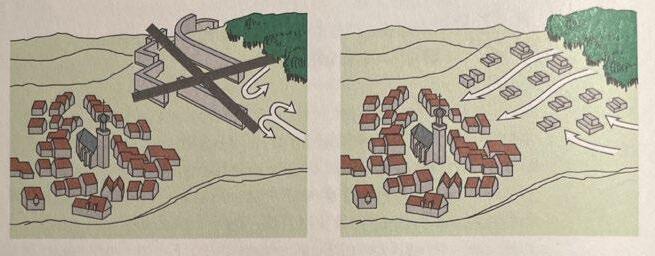
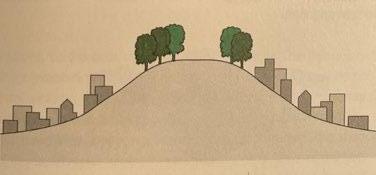
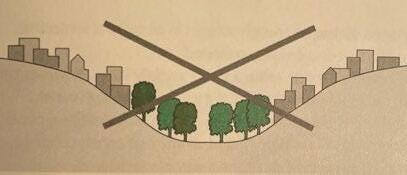
DOWNHILL COOLING
Notes
Plan development to exploit tree cover and topography. Since cold air flows downward from higher elevations, city planners should protect hilltop tree cover (or plant more of it). Then facilitate its “plume of cool air” to sink into settlements by ensuring that there are no obstructions. Since these airflows have a low velocity, they are easily blocked by walls and even hedgerows (Lenzholzer 2015)
Limitations
The typology of green space effects the cooling effect. Open green surfaces such as fields and meadows with a large sky view factor are more effective than dense forest because they cool down more quickly at night (Lenzholzer 2015)
URBAN FORM trees
04 | Toolkit 26
Figure 24. To facilitate downhill cooling, the route should be barrier-free.
Figure 25. It is preferable to retain a forest on a hill rather than in a valley.
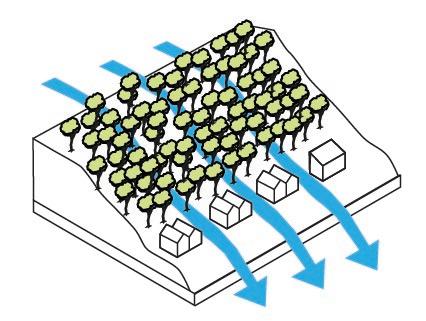
Notes
This is a hybrid of urban form and trees & vegetation toolkit mechanisms. Its proposed by Lenholzer (2015), but there are no citations given. She states that several studies have noted a cooling effect of up to 6 C for large scale green infrastructure such as parks and forest preserves (Lenzholzer 2015). She states that many cities have such green space, but it is the positioning of the space in relationship to settlements that is the key to this tool. Light winds can carry a “plume of cool air” from green spaces into the leeward side of adjacent streets.
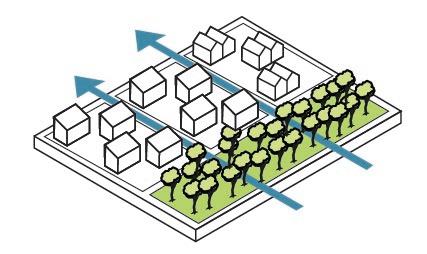
Distributing several small parks throughout a district instead of one large park is also more beneficial then building one large one (Lenholzer 2015)
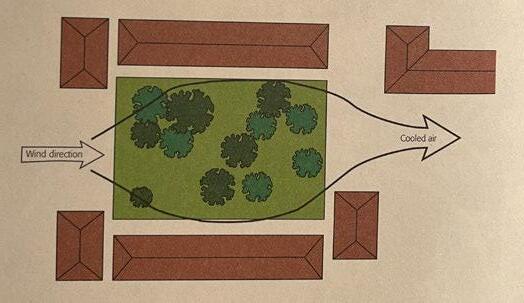
Limitations
Cool islands mostly benefit the residents on the leeward side of prevailing winds. There is an opportunity for planners to intentionally locate communities with more vulnerable populations in these leeward areas.
URBAN FORM trees
04 | Toolkit 27
Figure 26. Cooled air
PARK COOL ISLANDS
TREE CANOPIES
Notes
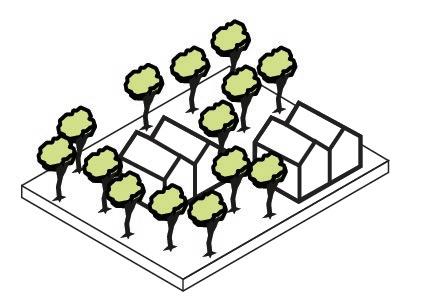
It has noted in the literature that tree canopy is an important mitigation tool because they absorb solar radiation that would otherwise heat artificial surfaces such as concrete. Many local governments have implemented policies that protect the largest and oldest trees, which typically offer broad canopy coverage. In addition, new trees should be planted wherever possible.
It appears that such policies lead to a notable reduction in land surface temperatures during summer months. In short, preserving the greatest extent of tree canopy when designing a development is advantageous to mitigating UHI at the neighborhood scale. The difference can be as much as 7.1 C (Sung 2013)
04 | Toolkit 28
trees
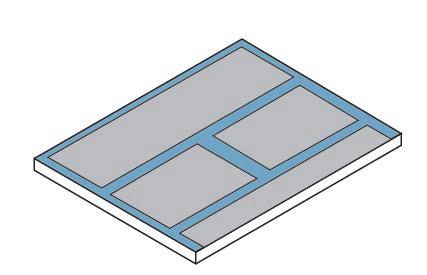
COOL PAVEMENTS
Notes
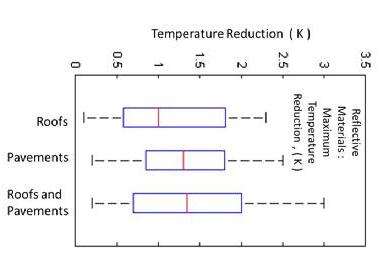
Though there are few large urban scale studies that test UHI reduction, the material is promising, especially considering that cities are approximately 30% pavements. Studies have shown that cool pavements can be up to 7.5 C cooler than standard black asphalt (Kyriakodis 2018)
Limitations
Cool pavements, such as streets and sidewalks, have pigments that are very effective when first installed. However, over time the material becomes darker with use and wear and tear. Aging substantially reduces the mitigation potential of cool asphalt materials, by as much as 50% (Kyriakodis 2018). Care must be taken to choose colors and pigments that don’t create undesirable levels of glare.
04 | Toolkit 29
materials
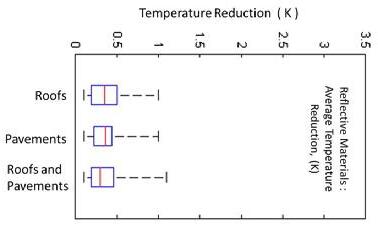
Figure 27. The average temperature reduction of cool pavements is roughly equivalent to cool roofs.
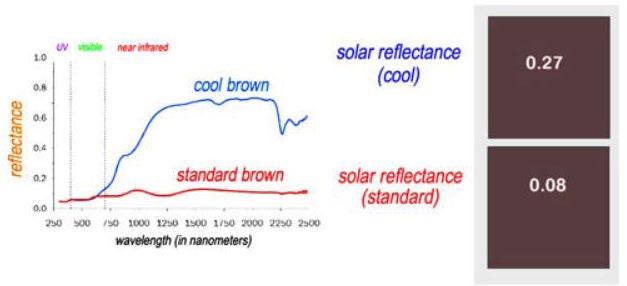
Notes
Cool roofing can apply to multiple roofing materials, such as clay tiles, metal panels, and wood shake. Simply applying a different pigment of the same color to a standard roofing product can significantly change the albedo/ reflectance.
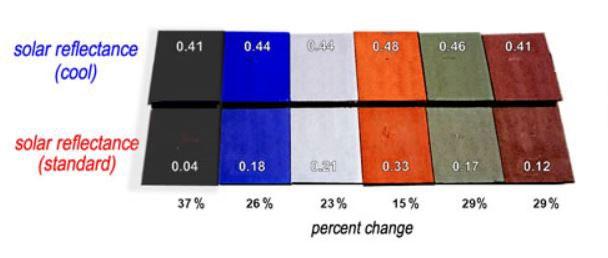
Limitations
The taller the building, the less UHI mitigation a cool roof has. It appears that the majority of the benefits go to building occupants, less so to the public realm (Gartland 2008).
04 | Toolkit 30
materials
Figure 28. Changing the pigment of a color substantially improves reflectance
COOL ROOF
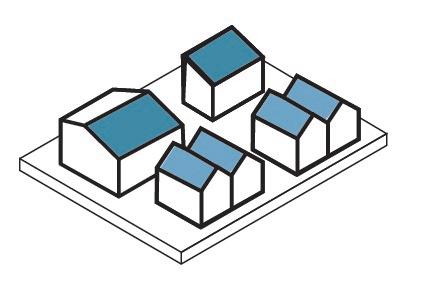
GREEN ROOF
Limitations
There are many types of green roof systems, which usually contain a shallow planting media, irrigation (in most climates), and plant material that ranges from groundcovers to trees. The cooling potential is affected by the type of vegetation and also the soil saturation (Santamouris 2017).
Compared to trees, green roofs have a relatively weak cooling performance and require more frequent maintenance. Also, the benefits are primarily for the building’s occupants, which benefit from lower energy consumption. The cooler air may not benefit the street level (Gartland 2008).

Notes
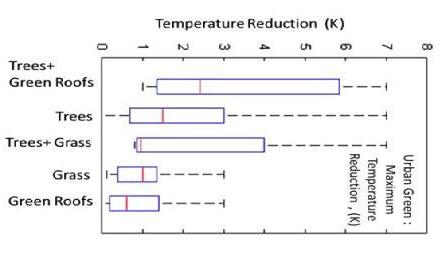
According to a comprehensive study of multiple UHI reduction systems (Santamouris 2017), it appears that the combination of trees with green roofs presents the best UHI mitigation potential.
04 | Toolkit 31
materials
Figure 29. The temperature reduction potential of green roofs is limited, but combined with other techniques, its reduction potential is enhanced.
Site selection overview
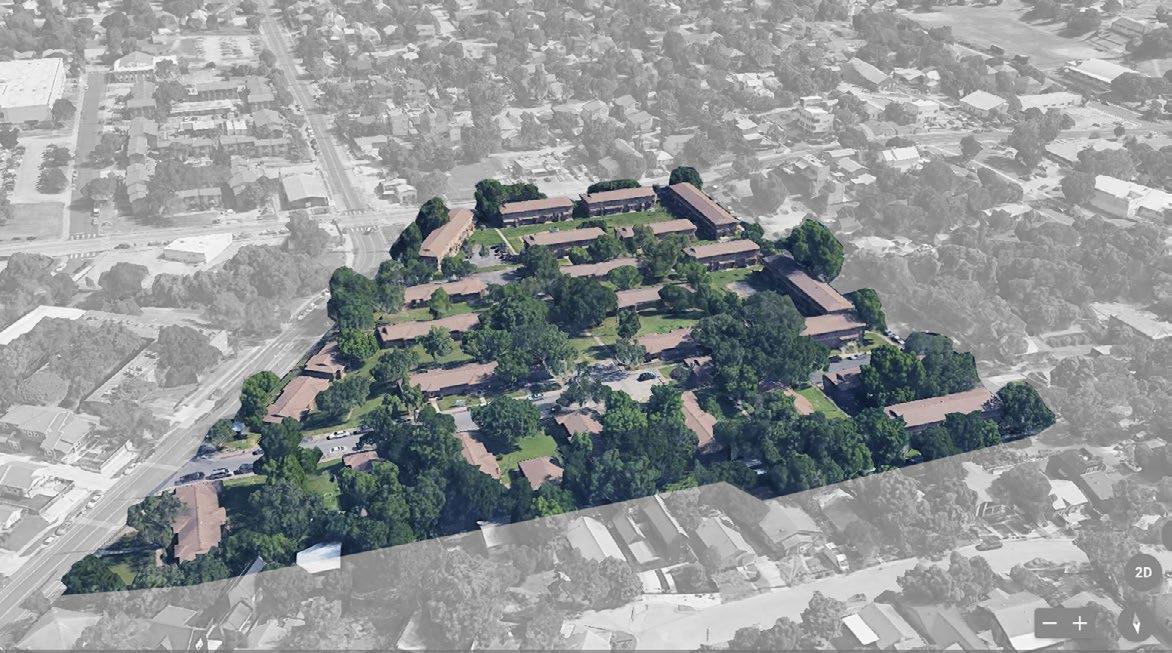
Rosewood Courts, a public housing project on Austin’s east side, was selected to test the massing frameworks and toolkit. The following pages justify the selection of Rosewood Courts as the intervention area.

RosewoodC o stru ChalmersCo stru santa ritaco stru City-owned public housing legend Redlined district City-owned public housing legend Redlined district Intervention
05 | Site selection 33 HWY I-35 DOWNTOWN AUSTIN 7THST 12TH ST CESARCHAVEZST CHICON ST URBAN FABRIC CONTEXT
a r e a
Rosewood Courts today
DENSE FORESTED HILLTOP ACTIVE FRONTAGE RETAIL CORNER
PARKING LOTS (QTY: 3) LARGE TREES (QTY: 65 +)
12TH ST
EXISTING APARTMENTS (QTY: 124 UNITS)
DEAD END STREET
TOTAL AREA: 8.34 ACRES
CHICONST
06 | Intervention 34
the prevalence of high canopy cover reflects distributions of wealthier neighborhoods in west Austin while lower canopy cover percentages reflect distributions of less affluent neighborhoods in east Austin. Studies show a positive relationship between income and the demand for trees as rich communities have larger budgets and larger private lot sizes for trees to grow (Zhu & Zhang, 2008).
Figure 2.3 | Historic Tree Canopy Cover


Therefore,


City of Austin, 2006
City of Austin, 2010
INTERVENTION AREA
Austin Tree Canopy Map (Right) | Austin’s tree canopy varies across the city. The map at right shows a clear distinction between east and west Austin with greater tree canopy cover occurring west of IH35 in the Edwards Plateau region, and lower tree canopy cover occurring east of IH35 in the Blackland Prairie region. Intuitively, many areas adjacent to or near water features show high tree canopy percentages.
Open space, single family, and undeveloped lands contain the highest distribution of tree canopy cover in the city. In open space park areas, the amount of land covered by tree canopy (37,705 acres) is substantial—roughly 50 times the size of Central Park in NYC.
Figure 30


Credit: City of Austin, Urban Forestry Program
INTERVENTION AREA


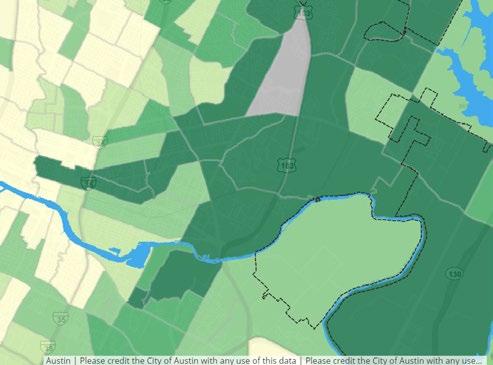
The site, and its immediate surroundings, have an elevated land surface temperature (urban heat island), compared to other residential areas east of downtown Austin.
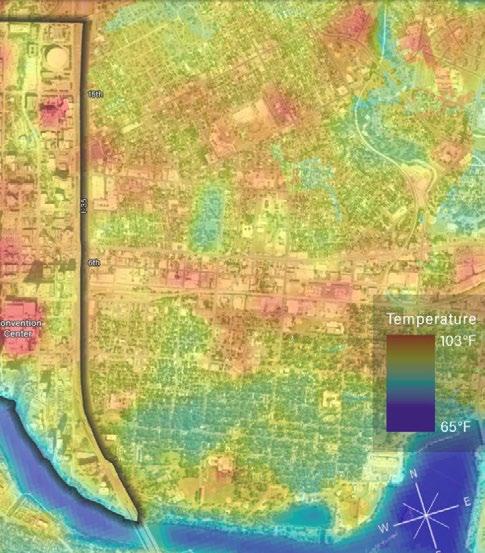
Because of this elevated UHI, it is justifiable to focus UHI mitigation efforts when urban infill opportunities arise in this area.

05 | Site selection 35
tree canopy existing heat island
Per the City of Austin’s Urban Forestry Department, this neighborhood has a lower than average tree canopy coverage. Austin’s average canopy coverage is 31%. The “east side” neighborhood, which we have selected, is below average
remediation of the tree canopy coverage in this area is a high priority for urban designers.
44 45 Figure 2.4 | Percent Tree Canopy Cover in Austin, 2006 6 03 Miles ¨ ¨ ¨ a 2 ! West Lake Hills ! ¨ H ! Edwards Plateau Blackland Prairie N Roads Water % Tree Canopy Cover 0% 1% 15% 16% - 30% 31% 45% 46% 60% 61% 75% 76% 90% 91% 100% Map Key Counties Travis Williamson CaldwellBastrop Hays Rollingwood
majority
44,148
consistent with the natural and cultural
Central Texas,
the domination of agricultural practices resulting in fewer trees, occurring in far east Austin. Additionally,
Chapter 2: State of Austin’s Urban Forest
canopy coverage at 165,595 acres while the Blackland Prairie region to the east contains only
acres of tree canopy cover. This pattern is
histories of
and reflects
Year % Tree Canopy
1977 39%
1982 37% Crownover,
1990 34% Crownover,
1996 34%
2006 31%
2010 ...%
Cover Source
Rodgers & Harris, 1983
1991
1991
American Forests, 1996
DRAFT
31
Figure
housing discrimination
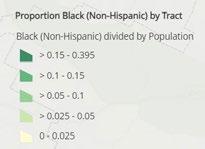
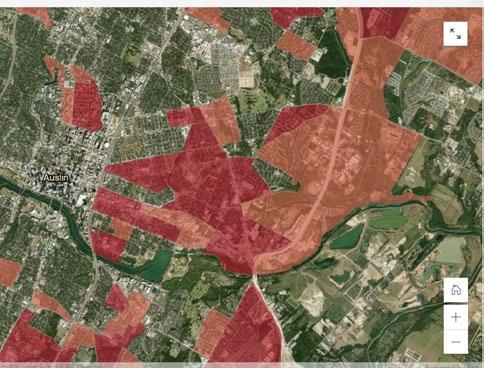
Urban areas that were subject to historical patterns of discriminatory mortgage lending (“redlining”) still carry an elevated burden today, decades after such policies officially ended. Studies have described neighborhoods targeted for discriminatory mortgage policies are “landscapes of thermal inequity”.
Nearly all have elevated surface temperatures compared to their non-redlined neighbors. The disparities were found to be as much as 7° C. (Hoffman, et al 2020).
Climate change resiliency studies have evaluated Austin neighborhoods to determine where residents might be most vulnerable to the impacts of climate change and elevated temperatures.
The Heat Priority Index (HPI) combines all variables into a single metric. Areas highlighted here are in the top 20%. These are areas where Austin should focus its efforts to mitigate extreme heat (McCall 2021).
High social Vulnerability
05 | Site selection 36
Figure 32
INTERVENTION AREA
Figure 33
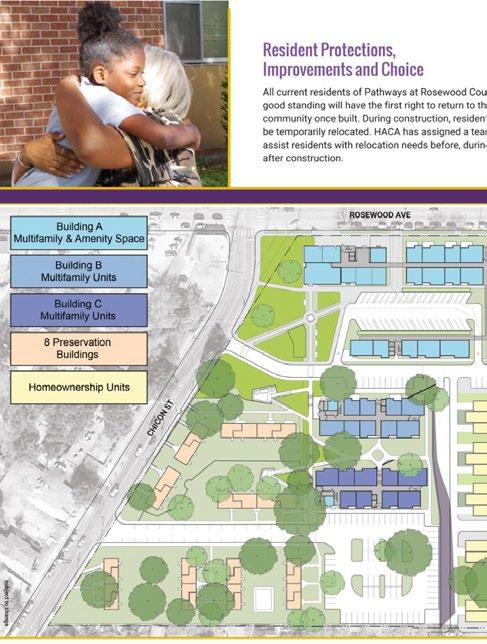
public housing
Rosewood Courts was chosen because it is scheduled for redevelopment and is currently undergoing a public comment period. Since much of the surrounding neighborhood is rapidly gentrifying, the MRP’s UHI mitigation efforts are focused on public housing estates, which have a population that is more likely to be at risk of heat related illness according to Hoffman (2020).
05 | Site selection 37
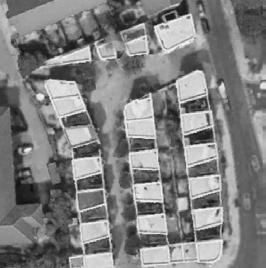
Figure 34. The proposal for Rosewood Courts redevelopment
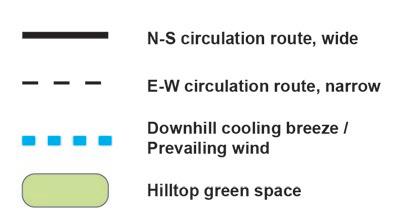
Site features relevant to UHI mitigation
Rosewood Courts in the UHI mitigation context
The site has advantages when it comes to applying the UHI mitigation toolkit. Approximately 25% of the site is tree canopy coverage, which is advantageous for shading impervious surfaces.
Unsurprisingly, the site’s existing road network and building layout isn’t oriented towards facilitating wind circulation. This was probably not a high priority in the 1930s when the site was planned.
The combination of Forested hilltop with Prevailing winds and slope on this site creates a Park Cool Island (see toolkit).
Tree coverage
The site have a moderate amount of existing tree canopy coverage. Most are long-lived hardwood species such as pecan and live oak. However, the coverage is unequally distributed.
Forested hilltop
The site slopes downhill from north to south. The slope continues upwards into the adjacent single family homes. The highest concentration of tree canopy coverage is also found at the highest elevation.
Prevailing winds


According to weather data collected by the National Weather Service, Austin’s winds are primarily from the south during the summer months. Average wind speed is 3.8 m/s.
06 | Intervention 39
CHICON ST
ST HAMILTONAVE 12TH ST Wind rose, ABIA Elevation profile Low point High point High point 541’ Avg. slope 5.8% Low point 498’
POQUITO
MASSING FRAMEWORK: SHADOW UMBRELLA
Conceptual program
Principles applied to site

At this step, we attempt to incorporate as many urban fabric principles as possible, in alignment with the massing framework. Within this overarching strategy, every toolbox element can be applied (wind orientation, solar orientation, etc), but many cannot be visually summarized at this preliminary stage.
06 | Intervention 40
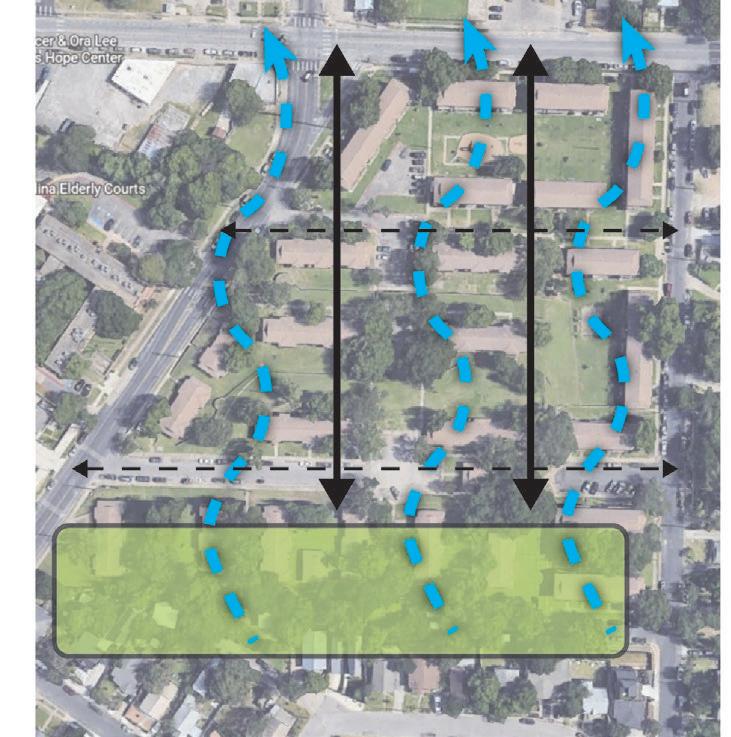
MASSING FRAMEWORK: SHADOW UMBRELLA Principles applied to site
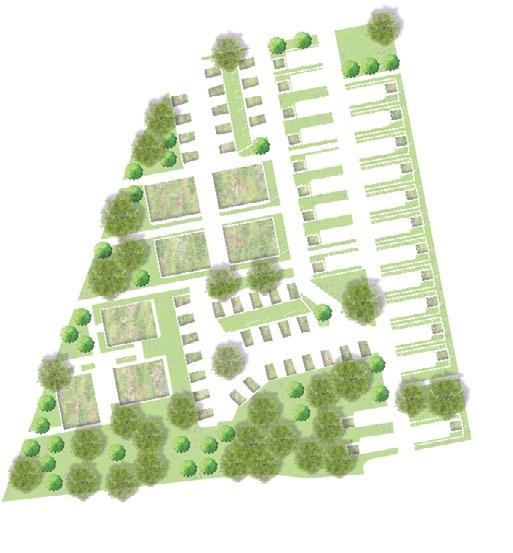
Concept
Applying the principles of the shadow umbrella massing, we arrive at a framework for built form and height. A tree buffer is located at the western edge, which already has many trees. The interior is left open as a court.
There are challenges in the application. “Short, medium, tall” building heights are not defined by the author. Character and size of open spaces is also not clear. Incorporating existing trees is difficult at this scale.
Next, we refine our concept bubble diagram. In this stage, we look at interior road and path circulation options. After taking a closer look at the precedents (following page) and space required, we merge and adjust some typologies to make the plan more feasible.
06 | Intervention 41 Refined concept SHORT OPEN OPEN MEDIUM MEDIUM TALL TALLEST CHICON ST 12TH ST
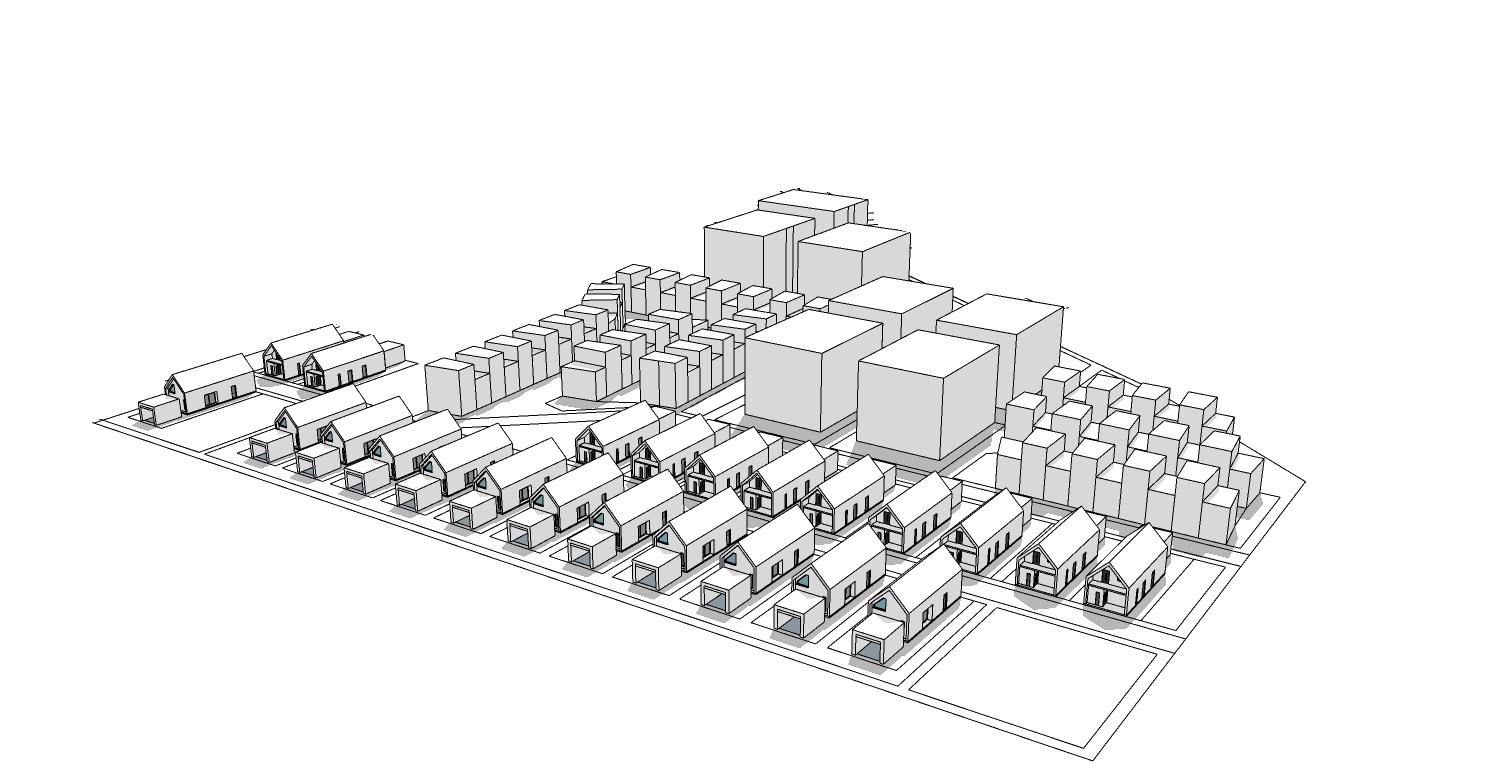
MASSING FRAMEWORK: SHADOW UMBRELLA Refinement
In this stage we continue our refinement of the physical form of the tall, medium, and short typologies. We also capture the tree massing located on the hilltop at the south of the site.
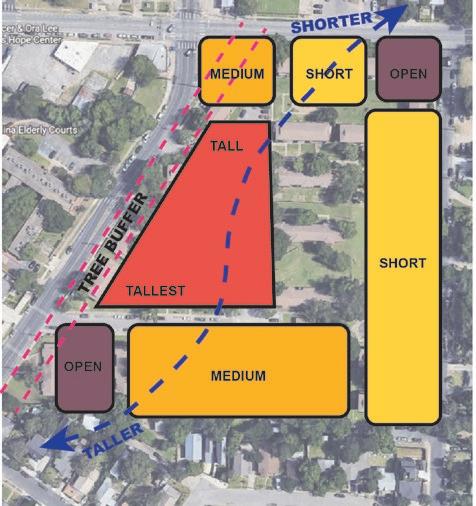
SHORT

Typology Precedents
These small (by American standards) cottages are 2 stories and include a garage which can be used as an ad ditional dwelling unit. This typology can be readily found in Austin’s Mueller development, a new urban development in a former airport. The streets are quite narrow for new construction in the USA, about 20’ wide. This building typology is culturally familiar in the Austin context.
TALL (est)
This umbrella typology is inspired by London’s Donny brook Quarter. The low-rise (2-3 story) high-density residential quarter is spatially organized around intimately proportioned streets and small plazas, and has proportions similar to traditional Arab-Muslim cities. This typology is unusually compact in the Austin context, but it does allow for vehicular access.
This fairly generic 5-6 stories tower typology is in spired by numerous public housing estates in Europe. This typology is fairly common in the Austin context, though there is often a lot of surface of underground parking associated with it.
06 | Intervention 42
MEDIUM
SHORT OPEN OPEN MEDIUM MEDIUM TALL TALLEST CHICON ST 12TH ST H/w 0.8 Short 20’ 25’ 30’ 30’ Medium H/w 1.0 25’ 50’ Tall H/w 2.0 30’ 60’ Tallest H/w 2.0 Sun Umbrella H/w Typologies Medina H/w Typologies
URBAN FORM
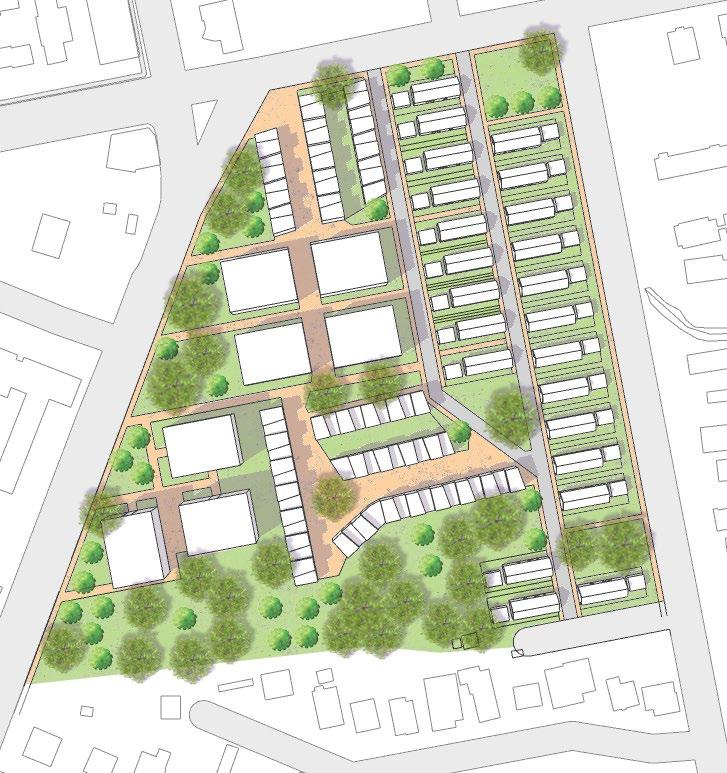
Cool pavement (roof terraces)
Cool pavement (roads)
Cool pavement (walks)
Tree canopy. Most existing trees preserved
East-west oriented paths are narrow to reduce solar exposure
Additional trees at western edge for solar protection
Urban canyon. H/W 0.8 min
North-south oriented streets are cooler. No East-West streets
Long street segments for wind orientation
Streets aligned with summer wind direction (south)
Green roof
Green roof at tall & medium buildings
Toolkit Breakdown
New trees to fill canopy gaps
Downhill cooling/ Park cooling islands preserved and enhanced
trees & vegetation
Green roof at single family home garages
Cool roof at single family home
materials
06 | Intervention 43
MASSING FRAMEWORK: SHADOW UMBRELLA
Plan view with all toolkit mechanisms applied
Note: Roof materials not shown in plan view for clarity. Refer to toolkit breakdown page.
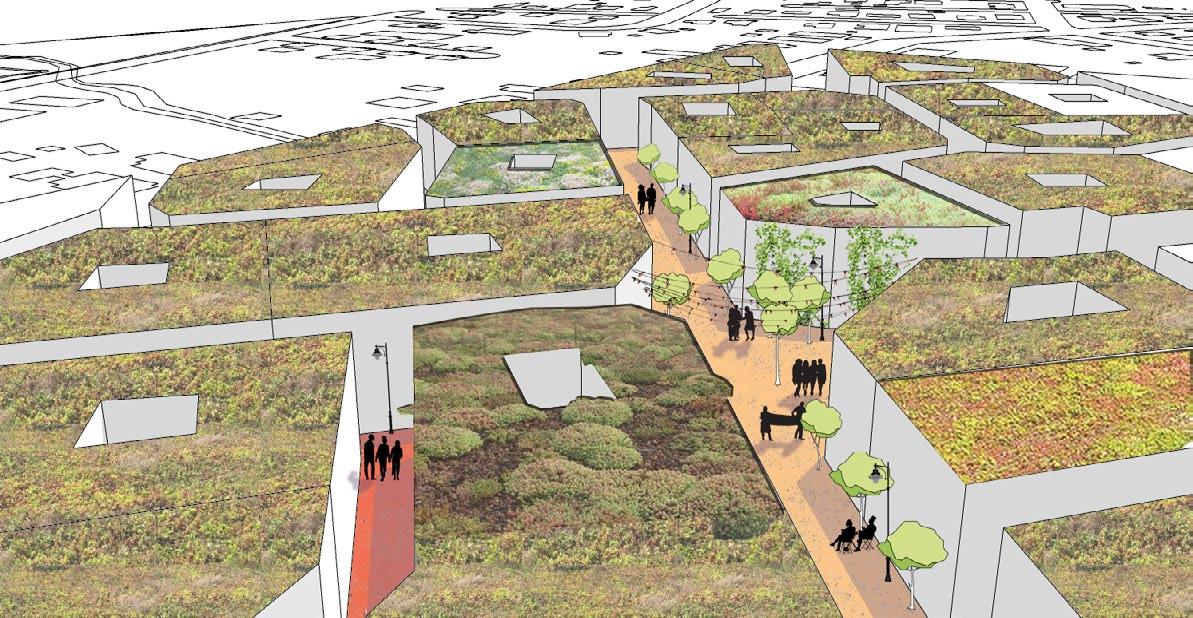
Perspective view of medium typology
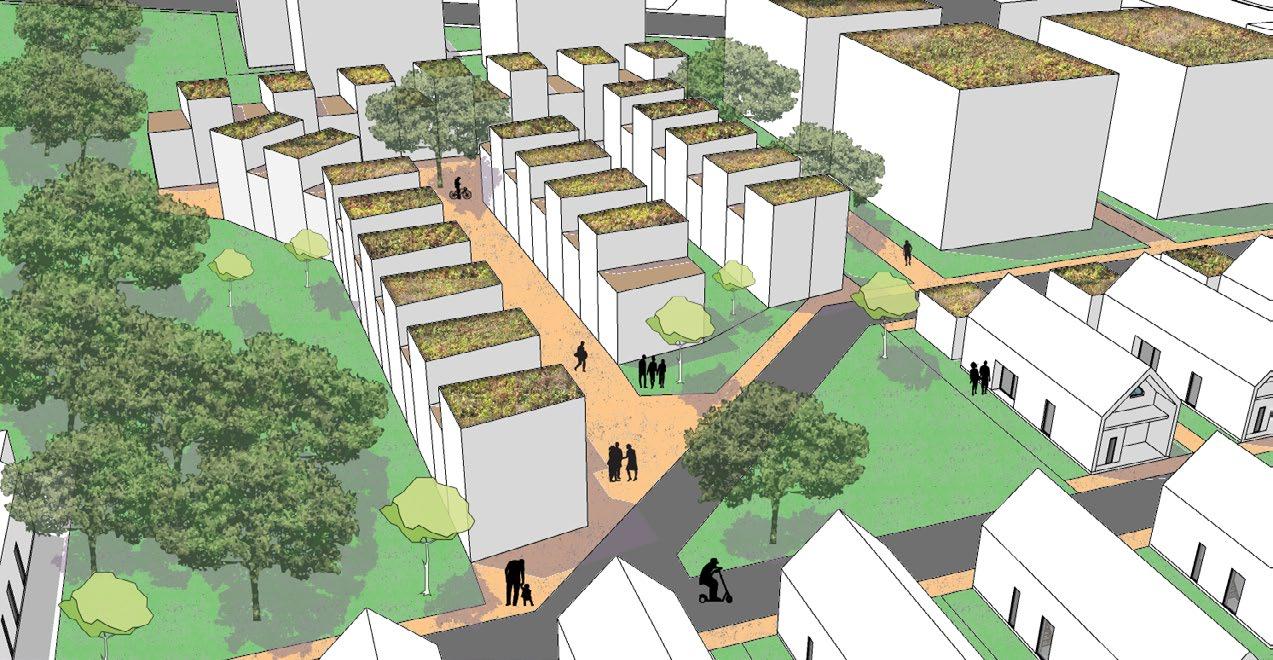
06 | Intervention 44
0 100’
MASSING FRAMEWORK: MEDINA SHADE CANYON

Applying the concept
Principles applied to site
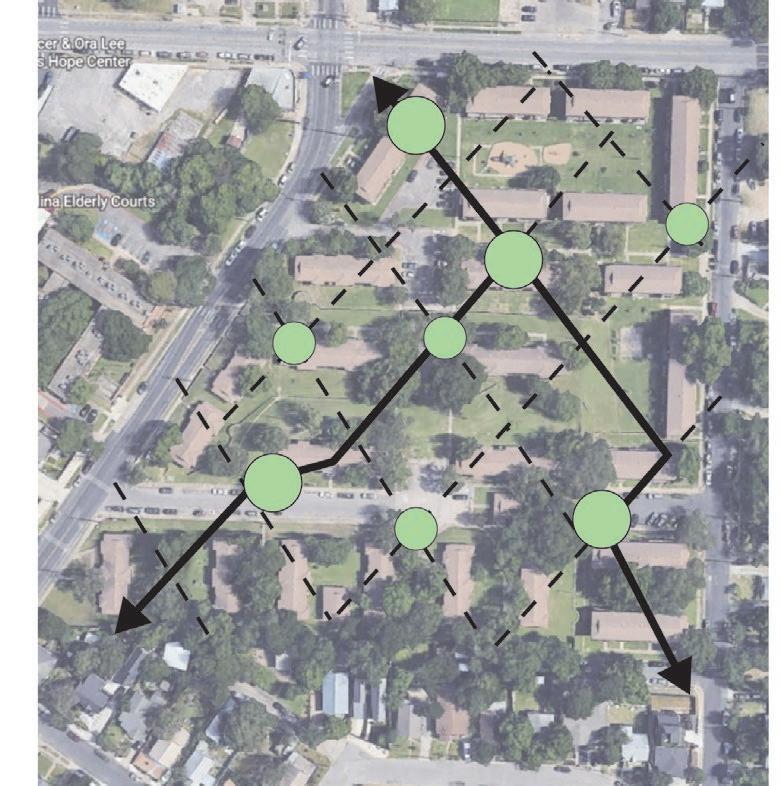
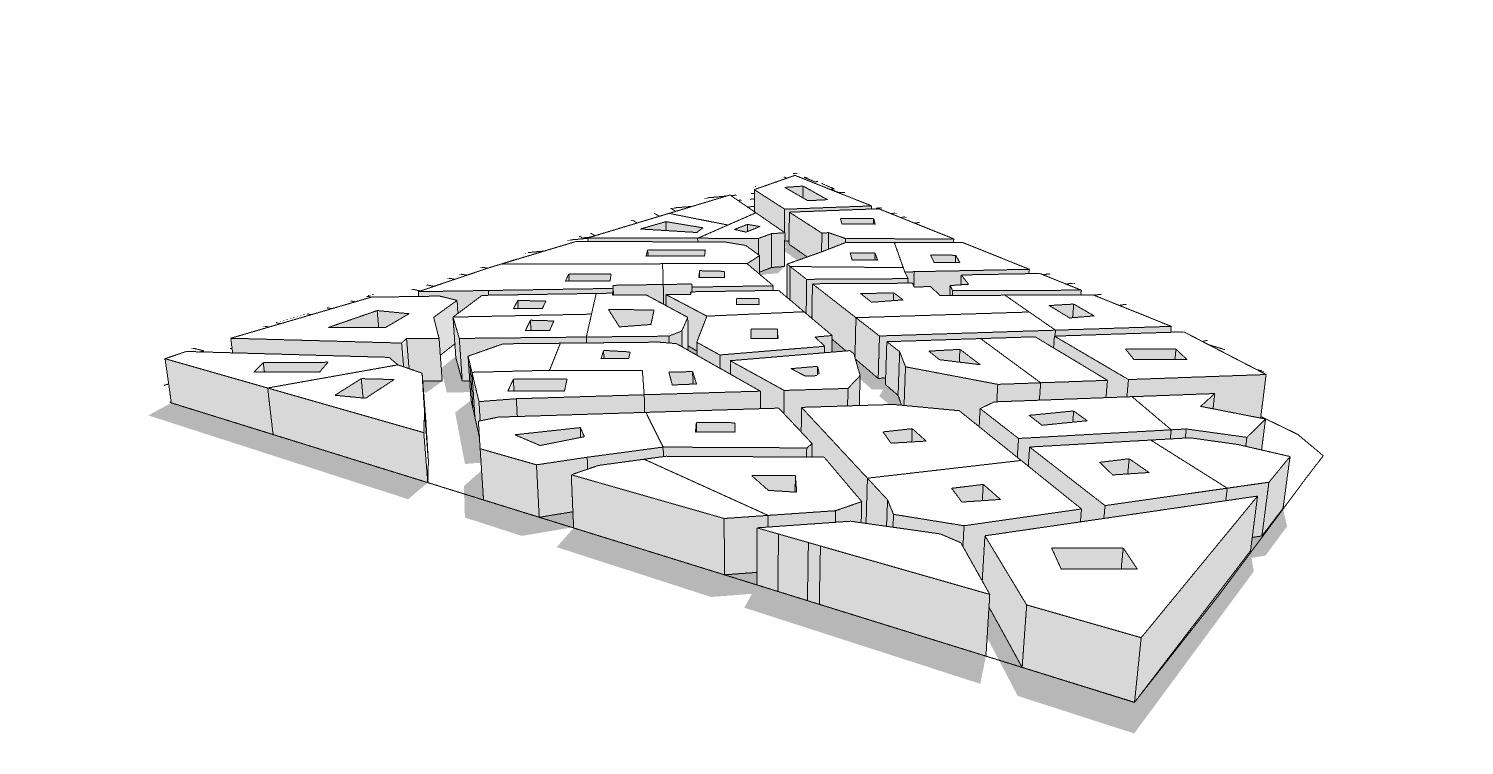
Framework application for intervention area
Using the diagonal street principles, we apply a grid at roughly equal intervals. The next step is choosing which streets on this grid will be the more generously sized civic sunlight streets. One civic street leads to the NW corner of the site, which has adjacent active frontage and retail facilities. Using this anchor as a starting point, the civic sunlight streets permeate through the rest of the development and into each diagonal corner. It is inferred that everything in between will be courtyard oriented homes in a traditional Arab-Muslim settlement pattern.
Challenges
Applying an organic and ancient massing framework is challenging because of the site’s surrounding low density suburban development pattern. Connecting proposed pathways to existing streets outside of our design area was abandoned due to the coarse grained fabric of the neighborhood (relative to the shade canyon).
There are no standard block sizes or home sizes in the Arab-Muslim settlement precedents. And the literature review and case studies didn’t reveal how to best apply this typology to a western construction context.
06 | Intervention 45
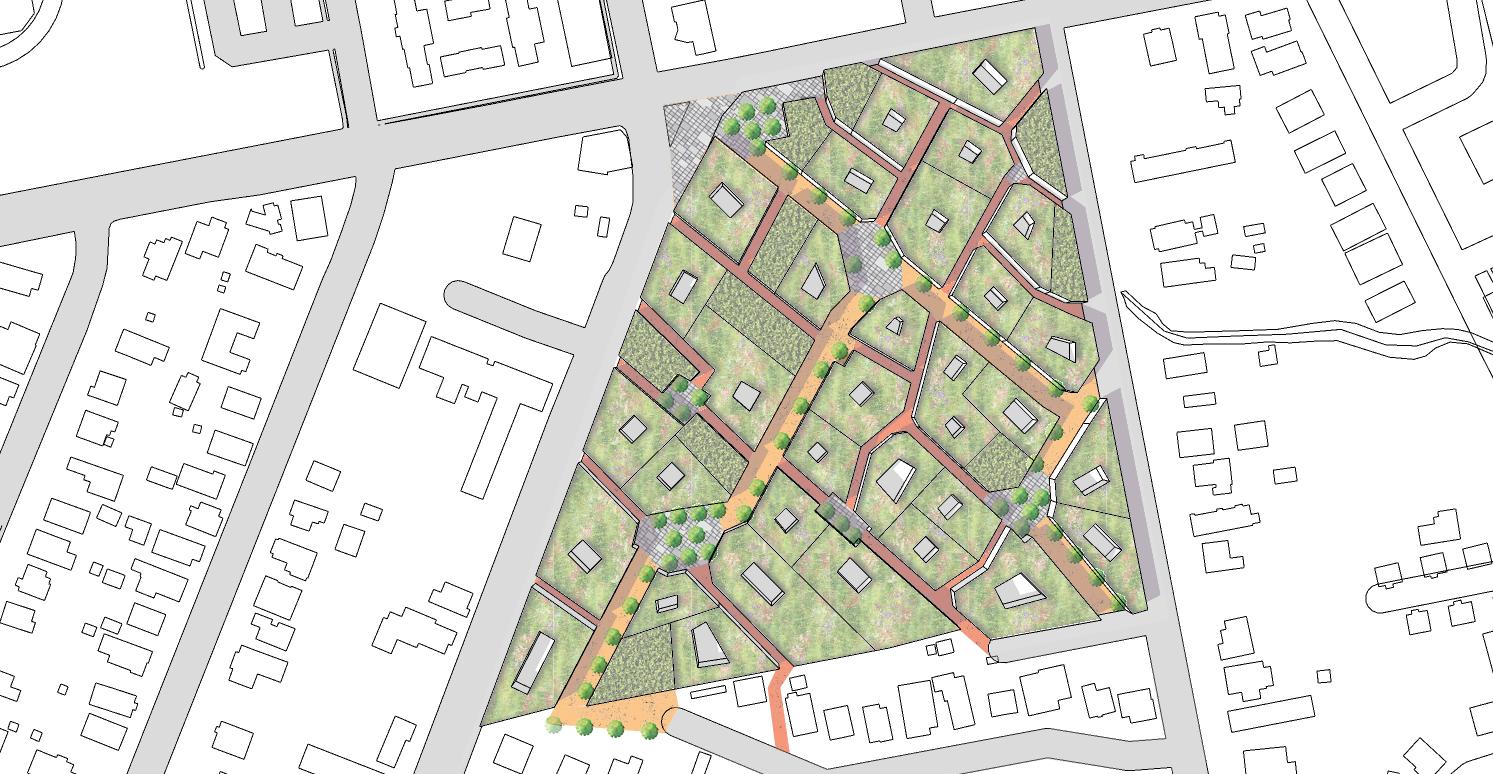
MASSING FRAMEWORK: MEDINA SHADE CANYON
Refined concept
Refinement of the framework network of civic streets, narrow streets, sun plazas, and diagonal organic street arrangement. Residential three story courtyard buildings have been added to the street grid.
06 | Intervention 46
Civic streets Narrow canyon streets Sun plaza H/w 0.8 Short 20’ 25’ 30’ 30’ Medium H/w 1.0 H/w 2.2 Narrow 30’ 12.8’ H/w 1.0 Civic 30’ 30’ 25’ 50’ Tall H/w 2.0 30’ 60’ Tallest H/w 2.0
Sun Umbrella H/w Typologies Medina H/w Typologies Refinement
Diagonal street grid for mutual solar shading
Narrow street. H/W 2.2
Civic street. H/W 1.0
Green roof at all buildings
URBAN FORM
Long street length (civic) facilitates wind velocity
Streets aligned within 30 degrees of summer wind direction (south)
Sun plazas with deciduous trees. Allows light in winter. Provides shade in summer Toolkit Breakdown
materials
trees & vegetation
Standard pavement at narrow canyon streets (less solar radiation)
Cool pavements at civic streets
Cool pavements at sun plazas (more solar radiation)
Note: cool roof not used. Interchangeable with green roof
06 | Intervention 47
MASSING FRAMEWORK: MEDINA SHADE CANYON
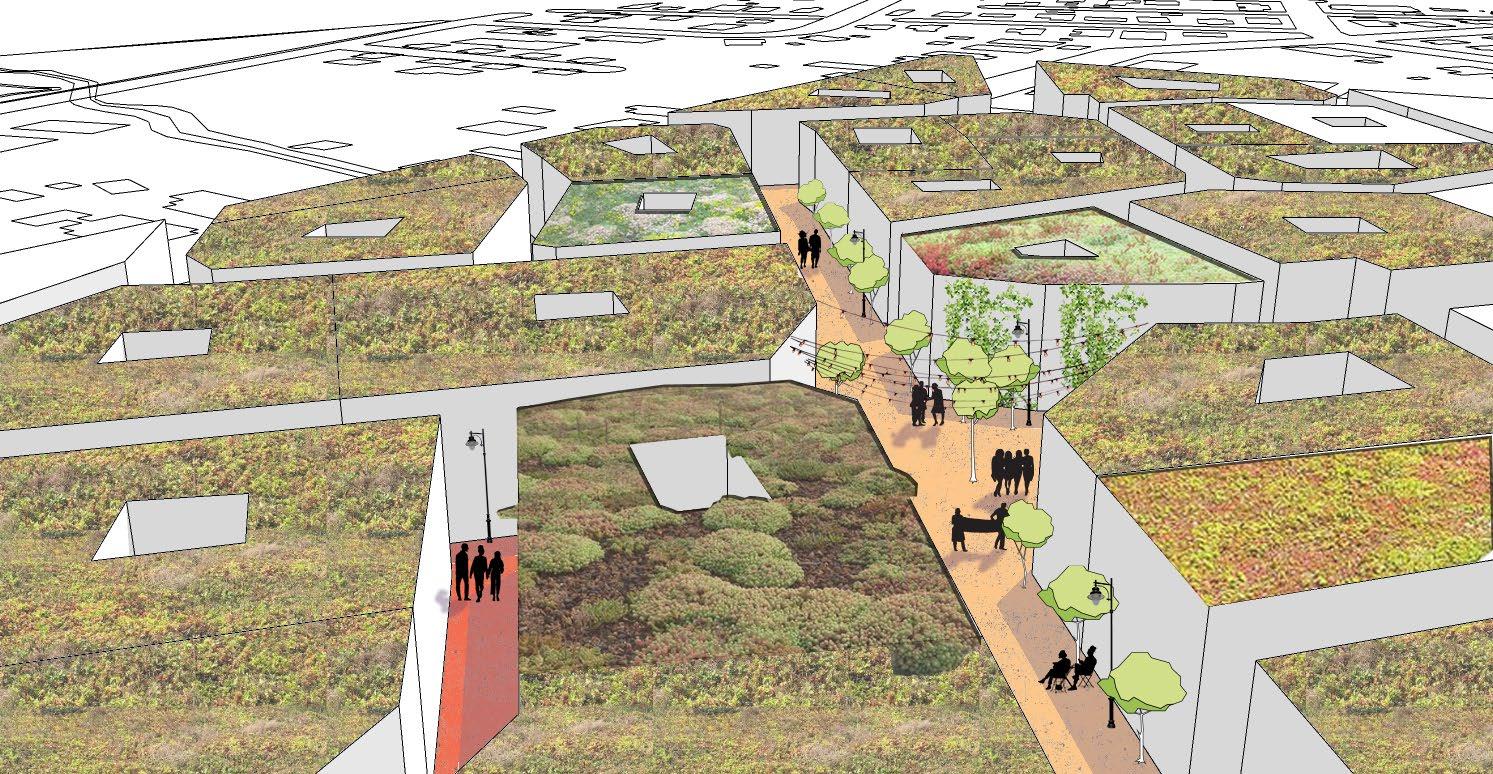
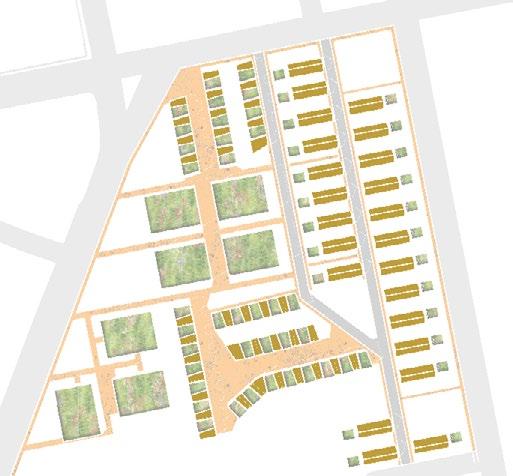
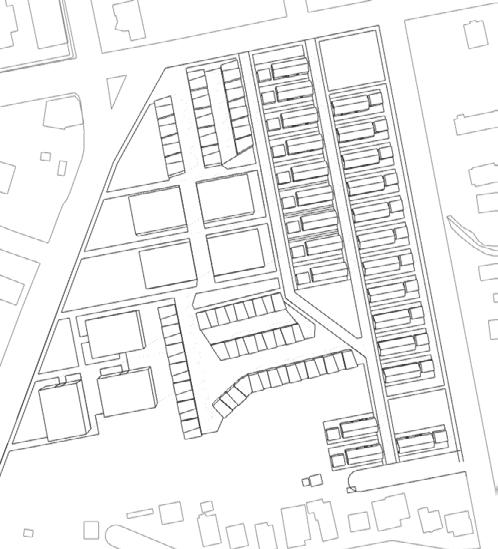
Framework with all toolkit components
Perspective view of civic street
06 | Intervention 48
0 100’
Conclusions
In summary, this research-led MRP devised two morphological massing frameworks to mitigate UHI at a neighborhood scale. Then, we added nine toolkit components, derived from academic literature, to each framework.
Though the two morphological approaches would certainly mitigate the urban heat island effect, they could not be more different.
Shadow umbrella appears similar to a mixed-use infill development that could take place in nearly any American city. Since many developments of this scale offer a mix of building height, it is sensible to arrange buildings and open space in such a way as to shade each other and shade common areas from the hottest part of the mid-day and western sun.
It appears to be fairly compliant with building codes, modern construction techniques and fire/ emergency/ delivery access.
Medina shade canyon reminds us that there is much to be learned from pre-industrial non-western cities in hot climates. Coping with extreme climates can be handled
Shadow umbrella
Medina shade canyon
without over reliance on air conditioning and vehicle dependency.
Shade umbrella has more flexibility for preserving existing tree can opy coverage. Medina shade canyon is more rigid in its urban fabric, and every existing tree was removed. Both offer opportunities for new tree planting, but the space available for such canopy growth in the later is limited.
When tested in our Austin context, it does seem glaringly out of place compared to the adjacent freestanding single family homes and pri vate yards. In a vehicle dependent society like the United States, it would find little acceptance. By western standards, the streets are very narrow and are unlikely to be permitted under current zoning codes. The wider civic streets and sun plazas mitigate the density to some extent, but overall, this building morphology would be difficult to accept in the 21st century. Therefore, shade umbrella is the pre ferred option to mitigate UHI.
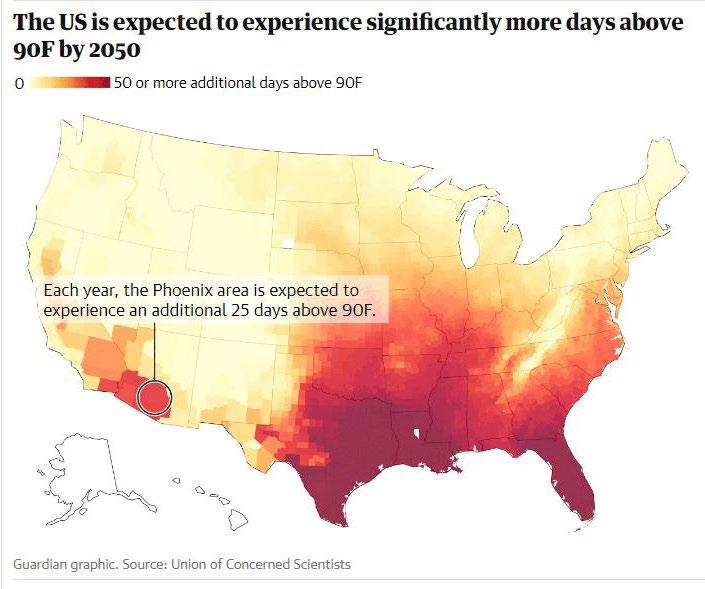
Implementation
Implementing the mechanisms of UHI reduction is complex, and is often not a high priority. However the city of Phoenix, which has seen heat related deaths increase 60%, has recently appointed its first “heat czar”. Part of the office’s responsibility is finding long term solutions to cool the city. Strategies include increasing tree cover from 11% to 25%, but applying many of the recommendations of this report to an existing city with a sprawling suburban morphology is challenging (Lakhani 2022). City planning departments could imple ment much of the urban form policy, such as preferring streets that are oriented towards the wind and narrower if exposed to E-W. Other items, like cool pavements and green roofs, are more expensive than conventional options. In a free market economy that is already bur dened with a housing crises, mandating added costs will be a tough pill to swallow. Government agencies should create programs that subsidize such measures in areas where temperatures are predict ed to dangerously rise over the coming years.

07 | Conclusions 51
Performance
Its difficult to judge the air temperature reduction potential of the two massing scenarios without running sophisticated simulations that are beyond the scope of this MRP. The medina morphology has performed very well in reducing street level air temperature in real-world scenarios in North Africa and the Middle East. The shade umbrella is hypothetical and untested, but the solar shielding concept is likely make outdoor spaces in hot climates cooler and more comfortable, especially in the afternoon and evening hours. In addition, it is likely to reduce energy consumption because building facades will receive less solar radiation in the summer.
Transferability
Shade umbrella is only applicable to the northern hemisphere. However, mirroring the umbrella concept would make it suitable for the southern hemisphere. It has broad applicability to many regions of the world with a sub-tropical or tropical climate. The shade umbrella, and all nine toolkit components are similarly universal and could be applied to many development contexts that wish to reduce UHI at a neighborhood scale. In fact, its easy imagine these components being triggered as required, as applicable, for all urban developments over a certain size, such as two acres. Planning and development approval authorities in hot cities should consider adapting such a policy.
Further research
It would be ideal to model and test each of these frameworks and determine the extent of air temperature reduction during day and night. Sadly, that is beyond the scope of this MRP. But perhaps future researchers will continue to push the boundaries of how the three toolkit mechanisms can deliver cooler, more comfortable, and healthier cities to help mitigate dangerously hot temperatures.
07 | Conclusions 52
Figure 35. Regions of the USA that could benefit from targeted UHI mitigation subsidies. Austin is starred.
LITERATURE REFERENCES
Achour-Younsi, Safa; Kharrat, Fakher (2015) ‘Outdoor thermal comfort: Impact of the geometry of an urban street canyon in a Mediterranean subtropical climate – Case study Tunis, Tunisia’, Urban Planning and Architecture Design for Sustainable Development, UPADSD 14
Ali-Tourdert, Fazia (2005) ‘Numerical study on the effects of the aspect ratio and orientation of an urban street canyon on outdoor thermal comfort in hot and dry climate’, Building and Environment, 41, p94-108
Bakarman, Mohammad; Chang Jay (2015) ‘The influence of height/width ratio on urban heat island in hot-arid climates’, Procedia Engineering, 118, p101–108
Emmanuel, Rohinton (1995) ‘A hypothetical ‘shadow umbrella’ for thermal comfort enhancement in the equatorial urban outdoors’, Architectural Science Review vol. 36 p173-184
Emmanuel, Rohinton (2005) An urban approach to climate sensitive design: strategies for the tropics, Spoon Press, New York
Gartland, Lisa (2008) Heat Islands, Understanding and Mitigating in Urban Areas. Earthscan, London
Howard, L. (1818) The Climate of London Deduced from Meteorological Observations, W. Phillips, London
Hoffman JS, Shandas V, Pendleton N (2020) ‘The effects of historical housing policies on resident exposure to intra-urban heat: A study of 108 US urban areas’, Climate 8(1): 12.
Fanning, 2021. https://www.texasstandard.org/stories/with-growing-diversity-and-urbanization-is-texas-the-new-california/
Johansson, Erik (2006) ‘Influence of urban geometry on outdoor thermal comfort in a hot dry climate: A study of Fez, Morocco’, Building and Environment 41: p1326-1338
Kelbaugh, Doug (2019) The Urban Fix. Resilient cities in the war against climate change, heat islands and overpopulation. Routledge. New York and London
Kyriakodis, G (2018), ‘Using reflective pavements to mitigate urban heat island in warm climates - Results from a large scale urban mitigation project’, Urban Climate vol. 24
Lakhani, Nina (2022), ‘America’s hottest city is nearly unlivable in summer. Can cooling technologies save it?’ The Guardian. Available at: https:// www.theguardian.com/us-news/2022/jan/27/phoenix-arizona-hottest-city-cooling-technologies (Accessed 01 September 2022)
08| References 54
Lenzholzer, Sanda (2015), Weather in the city. How design shapes the urban climate, Naio010 Publishers. Rotterdam.
Lai, D. Et al; (2019), ‘A review of mitigating strategies to improve the thermal environment and thermal comfort in urban outdoor spaces’, Science of the Total Environment 661: p337-353
McCall, Margaret. 2021. NASA. Accessed 8/27/2022 at https://storymaps.arcgis.com/stories/e30fff1e57ce48ddb66571247a396be2
Oke, T.R. (1981), ‘Canyon geometry and the nocturnal heat island. Comparison of scale model and field observations’, Journal of Climatology 1, 237–254.
Reidmiller, David R., et al. (2017), Impacts, risks, and adaptation in the United States: Fourth national climate assessment, volume II
Saaroni, H., et al. (2018), ‘Urban Green Infrastructure as a tool for urban heat mitigation: Survey of research methodologies and findings across different climatic regions’ Urban Climate 24: p94–110
Santamouris, M. (2017) ‘Passive and active cooling for the outdoor built environment – Analysis and assessment of the cooling potential of mitigation technologies using performance data from 220 large scale projects’, Solar Energy. Volume 154. p14-33
Smith, Claire; Levermore, Geoff (2008), ‘Designing urban spaces and buildings to improve sustainability and quality of life in a warmer world’ Energy Policy 36
Sung, Chan (2013), ‘Mitigating surface urban heat island by a tree protection policy: a case study of the Woodlands, Texas, USA’, Urban Forestry & Urban Greening 12. p474-480
Tan, Zheng; Kalun Lau, Kevin; Ng, Edward (2016), ‘Urban tree design approaches for mitigating daytime urban heat island effects in a high density urban environment’, Energy and Buildings 114. p 265-274
Nielson-Gammon, John; Holman S; Buley A, Jorgensen, S (2021), Assessment of Historic and Future Trends of Extreme Weather in Texas, 19002036. Texas A&M University. Office of the Texas State Climatologist
Yahia, et al (2018), ‘Effects of urban design on microclimate and thermal comfort outdoors in warm-humid Dar es Salaam, Tanzania’, International Journal of Biometeorology 62: 373-385
Wong, NH; Jusuf S (2013), ‘Outdoor mean radiant temperature estimation in the tropical urban environment’, Landscape Urban Planning: 127. p118-129
08| References 55
