LUXURY HOMES INDEX
2022 | VOL 6


INQUIRIES: inquiries@casothebys.com 212.658.1404 DATA WAS COMPILED BY THE SOTHEBY’S CONCIERGE AUCTIONS TEAM FROM MULTIPLE LISTING SERVICES (MLS) AND PUBLIC PROPERTY RECORDS.
CONTENTS 04 Introduction: Luxury Homes Index 34 Chapter 2: Days On Market 74 Chapter 4: Top Sales 104 About: Sotheby’s Concierge Auctions 14 Chapter 1: Final Sale Price 54 Chapter 3: Percent of List Price 96 Chapter 5: Annual Change
INTRODUCTION: LUXURY HOMES INDEX


5 | LUXURY HOMES INDEX
THE BIG QUESTION
How long will it take for my luxury property to sell? The answer is simple: Create competition out of the gates, or prepare for a long listing period and lower your price expectation.


The Index
The sixth edition of the Sotheby’s Concierge Auctions Luxury Homes Index analyzes the 10 highest property sales in 56 top luxury markets across the United States to determine the impact that the number of days a high-end property is on the market has on its final sale price. In this edition, Sotheby’s Concierge Auctions’ research shows that even with the highest of luxury sales continuing to take longer to sell than the rest of the real estate market at large, either selling quickly and achieving a higher percentage of original list price or lingering on the market and ultimately selling at a significant discount, they are following similar trends, selling more quickly and achieving higher prices than in prior years.
7 | LUXURY HOMES INDEX
THE LUXURY LANDSCAPE
The real estate market is hotter than ever, and the highend is no exception. The longer a home takes to sell, the more skeptical buyers become about its value.
Luxury properties are difficult to value and sell. The buyer pool is small and often spread over a large geographic range. Moreover, price has little bearing on demand, and multiple buyers don’t always arrive at once. Price reductions undermine the value of a property and may cause buyers to sit back and wait, hoping that the price will drop again.

Individual luxury real estate markets are subject to variables that may be independent of the national real estate landscape. The number of competitive properties listed, the absorption rate in the specific market, seasonality, and local economic factors can all help determine how quickly a property will sell.
The Result?
It can take time for a luxury property seller to find the right buyer. There is a point of inflection where real estate turns from necessary to discretionary. Similar to other luxury consumption, once an item has been enjoyed and highly customized to its owner, it may be worth significantly less to the buyer. High-end real estate acts the same way—plus, it is static in location.
9 | LUXURY HOMES INDEX
THE COST OF DAYS ON MARKET
Days On Market are expensive and directly correlate with perceived value.


Our research continues to indicate that the largest factor in determining the final sale price of a luxury property is the number of days that it has been on the market.
Every day a luxury property is marketed for sale, it depreciates in value. When a property has been on the market for a prolonged period of time, not only does it suffer from negative perception, but there is an inherent cost associated with the accumulated days. This is especially true in markets with a high level of second homes.
Information about your property’s history is more readily available than ever. Buyers can clearly see the full history of a property, including total Days On Market; any time it has been de-listed and re-listed; price reductions; and every listing agent hired. A home that has been on the market for a significant amount of time and has seen multiple price reductions will often sell for a fraction of the original list price.
11 | LUXURY HOMES INDEX
0 % VALUE ACHIEVED DAYS ON MARKET 365+ 100 RETAIL MARKET DANGER ZONE WHOLESALE
INDEX MARKETS


Aspen
Atlanta
Beverly Hills
Boca Raton
Boston
Brentwood
Broward County
Cape Cod
Chicago
Dallas
Denver
Duval/St Johns
Fairfax
Fairfield County
Greenwich
Hamptons
Holmby/Bel Air
Houston
Kauai
Kona
Lake Tahoe
Las Vegas
Malibu
Martha’s Vineyard
Maui
Miami
Nantucket
Naples
Nashville
New Hampshire
New York
Morristown/Essex
Oahu
Orange County
Pacific Palisades
Palm Beach
Palo Alto
Park City
Philadelphia
Phoenix
Rancho Santa Fe
Rhode Island
San Diego
San Francisco
Santa Barbara
Sarasota
Seattle
Sonoma
Sun Valley
Tampa
Telluride
Vail
Vermont
Vero Beach
Westchester
Westlake Village
13 | LUXURY HOMES INDEX
CHAPTER 1: FINAL SALE PRICE


15 | LUXURY HOMES INDEX
2021 | FINAL SALE PRICE
The average price of top sales in the 56 luxury markets evaluated in 2021 was $20,298,593. This is a 34% increase from $15,145,856 in 2020.
2015 2016 2017 2018 2019 2020 202 1 AVERAGE SALE PRICE $21M $19M $16M $13M $10M
Hot vs Cold
The top sales in Palm Beach, FL achieved the highest average Sale Price of all 56 markets at $63,734,255, followed by the Hamptons, NY at $63,550,000 and Boca Raton, FL at $58,063,500—all three have seen a staggering nearly triple increase since 2019. By contrast, the lowest average Sale Prices achieved were in Philadelphia, PA at $4,409,900, and Morristown/Essex, NJ at $4,787,800. Both topped the list for lowest prices last year as well.
Top Ten Highest Top Ten Lowest
17 | LUXURY HOMES INDEX 1 Palm Beach, FL 2 Hamptons, NY 3 Boca Raton, FL 4 New York, NY 5 Holmby/Bel Air, CA 6 Beverly Hills, CA 7 Miami, FL 8 Aspen, CO 9 Lake Tahoe (CA/NV) 10 Brentwood, CA 1 Philadelphia, PA 2 Morristown/Essex, NJ 3 Boston, MA 4 Denver, CO 5 New Hampshire 6 Atlanta, GA 7 Westlake Village, CA 8 Chicago, IL 9 Houston, TX 10 Duval + St. Johns, FL
PALM BEACH, FL
Highest average sale price achieved of all markets, jumping to $64M in 2021, a nearly 155% increase since 2019.
Palm Beach, FL topped the list for highest average sale price achieved across all 56 markets in 2021, jumping $23 million-plus in 2020, from $25,031,345 in 2019 to $49,521,953, and another $15 million in 2021, to $63,734,255. This is a nearly 155% increase since 2019 and is the market’s highest average sale price achieved in seven consecutive years.

 SALE PRICE: HOT
19 | LUXURY HOMES INDEX 2015 2016 2017 2018 2019 2020 202 1 AVERAGE SALE PRICE $60M $50M $40M $30M $20M
NEW YORK, NY
Average Sale Price is fourth highest of all markets; Over 2x more than the average despite seeing a nearly 24% decrease in 2021.

SALE PRICE: HOT
After remaining steady for the past two years, the average Sale Price in New York, NY declined 23.86% from $65,561,281 in 2020 to $49,917,000 in 2021, nearing 2018 averages. Despite this decline, the market’s top sales are still achieving average final sale prices that are nearly double than the average of all 56 luxury U.S. markets analyzed.

21 | LUXURY HOMES INDEX 2018 2019 2020 202 1 AVERAGE SALE PRICE $60M $50M $40M $30M $20M
LAKE
TAHOE (CA/NV)
Average Sale Price has increased more than 3x since 2019.
SALE PRICE: HOT
Top sales in Lake Tahoe (NV/CA) in 2021 achieved the highest average Sale Price ever for the since 2018, at $35,130,000. This is a $15,000,000 increase YOY from 2020, with average sale prices on the steady rise from the market’s lowest in 2019.

23 | LUXURY HOMES INDEX 2018 2019 2020 202 1 AVERAGE SALE PRICE $50M $40M $30M $20M $10M
HOLMBY/BEL AIR, CA
Average Sale Price rose nearly 57% in 2021 after a near all-time low in 2020.
The average Sale Price for the top sales in Holmby/Bel Air, CA increased 52.55% in 2021, from $27,470,000 in 2020 to $41,907,175 after a 56.55% drop that same year—making it the fifth top market for highest average Sale Price. Ranking seven and eight are Aspen and Miami, which also saw similar increases in 2021.

SALE PRICE: HOT
25 | LUXURY HOMES INDEX 2015 2016 2017 2018 2019 2020 202 1 AVERAGE SALE PRICE $60M $50M $40M $30M $20M
PHILADELPHIA, PA
Average Sale Price is the lowest of all markets, despite having increased nearly 117% in 2021.

SALE PRICE: COLD
Top sales in Philadelphia, PA remained at the top of the lowest average Sale Price list achieved in 2021, at $4,409,900, bringing the market back to more normalized pricing akin to that of 20172019. However, YOY this is a 116.85% increase from $2,033,600 in 2020.

27 | LUXURY HOMES INDEX 2017 2018 2019 2020 202 1 AVERAGE SALE PRICE $6M $5M $4M $3M $2M
MORRISTOWN/ESSEX, NJ
After a decrease to the market’s lowest in three years in 2020, Morristown/ Essex, NJ saw an increase of nearly 90% in 2021; highest average Sale Price in four years.
SALE PRICE: COLD
Despite ranking the second lowest of all 56 luxury markets analyzed for Sale Price achieved in 2021, the average Sale Price of the top sales in Northern New Jersey’s market of Morristown/ Essex rose 89.24% in 2021, from $2,530,000 in 2020 to $4,787,800 in 2021, marking the market’s highest average Sale Price in four consecutive years. Total Days On Market has been on the steady decline, with top sales selling more quickly each year, from 692 in 2018, to 174 in 2021.

29 | LUXURY HOMES INDEX 2018 2019 2020 202 1 AVERAGE SALE PRICE $6M $5M $4M $3M $2M
BOSTON, MA
Average Sale Price has been steadily decreasing since 2019, with a 53% decline to $5,579,000.
Top sales in Boston, MA saw prices nearing the lowest average Sale Price in four years, declining from an all-time high of $11,944,692 in 2019 to $5,579,000 in 2021. The market saw a 45.63% decrease in average Sale Price from 2020 to 2021 alone, back to 2015–2018 levels.
 SALE PRICE: COLD
31 | LUXURY HOMES INDEX 2015 2016 2017 2018 2019 2020 202 1 AVERAGE SALE PRICE $14M $11M $8M $5M $2M
WESTLAKE VILLAGE, CA
Ranking the seventh lowest of all 56 markets, average Sale Price sees 192.32% increase from 2019, its highest in the last six consecutive years.
SALE PRICE: COLD
The average Sale Price of the top sales in Westlake Village, CA continues to steadily rise after a 107.97% jump in 2020, from $2,397,170, which was the lowest the market has seen in the last six consecutive years and the largest drop of all 56 markets analyzed—to its highest ever, at $7,007,500, despite being ranked the seventh lowest in 2021.

33 | LUXURY HOMES INDEX 2015 2016 2017 2018 2019 2020 202 1 AVERAGE SALE PRICE $14M $11M $8M $5M $2M
CHAPTER 2: DAYS ON MARKET

35 | LUXURY HOMES INDEX
2021 | DAYS ON MARKET
The average Days On Market for the 56 markets evaluated in 2021 was 349 days, a 29.4% decrease from the 491 days in 2020.
2015 2016 2017 2018 2019 2020 202 1 AVERAGE DAYS ON MARKET 1,000 750 500 250 0 180 DOM Market with average DOM >180 Market with average DOM ≤180 All markets
Just over half of the top sales evaluated in 2021 were on the market more than 180 days. The average for the 49% properties listed for 180 days or less was only 83 days, on par with the last four consecutive years. By comparison, for the 51% listed more than 180 days, average Days On Market jumped nearly 650%, to an average of 614 days total.
Hot vs Cold
The lowest average Days On Market were in New Hampshire and Duval and St. Johns Counties, FL at 104 days and 133 days, respectively. By contrast, the highest were in Dallas, TX and Vero Beach, FL at 880 and 779 days.
Top Ten Highest Top Ten Lowest
37 | LUXURY HOMES INDEX
NY
Orange County, CA
Beverly Hills, CA
Fairfield County, CT 9 Nantucket, MA 10 Holmby Hills/Bel Air, CA 1 New Hampshire 2 Duval + St. Johns, FL 3 Palo Alto, CA 4 Brentwood, CA 5 Santa Barbara, CA 6 Pacific Palisades, CA 7 Lake Tahoe, CA 8 Philadelphia, PA 9 Morristown/Essex, NJ 10 Chicago, IL
1 Dallas, TX 2 Vero Beach, FL 3 Park City, UT 4 Westchester County,
5 Miami, FL 6
7
8
DALLAS, TX
Average Days On Market is highest of all other markets, skyrocketing since 2019 with a 177% increase.
DAYS ON MARKET: HOT
In 2021, the top sales in Dallas, TX were on the market an average of 880 days, the highest of all 56 luxury U.S. markets analyzed. The market has seen a rapid increase of Days On Market, spiking 177.603% over the last two years from a 317-day low in 2019. While the percent of original list price achieved is also declining during this same time, final sale price continues to rise.


39 | LUXURY HOMES INDEX 2015 2016 2017 2018 2019 2020 202 1 AVERAGE DAYS ON MARKET 800 600 400 200 0
MIAMI, FL
At nearly two years to sell, average Days On Market rises 38% in 2021—the market’s highest in seven years.
DAYS ON MARKET: HOT
Top sales in Miami saw an increase in average Days On Market of 38% in 2021, to 681 days, it’s highest in seven consecutive years, from its lowest in 2019, at 429 days. Despite taking longer to sell, top sales are achieving higher prices, with averages steadily increasing during this same time period, from a low of $14,998,960 in 2016 to $38,775,000 in 2021.
41 | LUXURY HOMES INDEX 2015 2016 2017 2018 2019 2020 202 1 AVERAGE DAYS ON MARKET 800 600 400 200 0
ORANGE COUNTY, CA
Average Days On Market see seven-year peak, but prices achieved for top sales are highest since 2015.
DAYS ON MARKET: HOT
Average Days On Market have been increasing in Orange County, CA for the past two consecutive years, after an all-time low in 2019 of 333 days. Properties listed over 180 days have seen a sharp increase in average Days On Market with a 92.4% jump in 2021 from 2020, while average Sales Prices in 2021 for the market’s top sales were the highest since 2015 at over $29 million.
43 | LUXURY HOMES INDEX 2015 2016 2017 2018 2019 2020 202 1 AVERAGE DAYS ON MARKET 800 600 400 200 0
SONOMA COUNTY, CA
Average Days On Market increases nearly 5x in 2021 after an all-time low in 2020.
DAYS ON MARKET: HOT
Average Days On Market for top sales in Sonoma, CA skyrocketed to 525 days in 2021 following the lowest in seven years in 2020, at just 86 days. The market had continually seen a rapid decrease of Days On Market beginning in 2017, but is now on the rise with a 510.465% increase in 2021, while total sale price and percent of original list price remain steady.

45 | LUXURY HOMES INDEX 2015 2016 2017 2018 2019 2020 202 1 AVERAGE DAYS ON MARKET 800 600 400 200 0
NEW HAMPSHIRE
At just over three months to sell, average Days On Market is lowest of all other markets, dropping 89% since 2018.
DAYS ON MARKET: COLD
In 2021, the top sales in New Hampshire were on the market an average of only 104 days, making it the lowest of all 56 luxury U.S. markets analyzed, despite achieving the highest percent of Sale Price. Properties on the market for over 180 days sold over four times more quickly in 2021 than in 2018, while average Days On Market continued to steadily decrease.
47 | LUXURY HOMES INDEX 2018 2019 2020 202 1 AVERAGE DAYS ON MARKET 1000 750 500 250 0
DUVAL + ST. JOHNS, FL
Ranking the second lowest of all markets, average Days On Market has been steadily dropping since 2019; 2021 is market’s lowest average since 2018.
DAYS ON MARKET: COLD
Duval & St Johns Counties, FL saw a dramatic drop in average Days On Market in 2021, decreasing by more than half of 2020’s averages. The market ranks the second lowest for Days On Market of all 56 luxury markets analyzed, with top sales taking an average of just 133 days to sell. This is 64.8% less time than in 2020 and is the market’s lowest in four consecutive years.


49 | LUXURY HOMES INDEX 2018 2019 2020 202 1 AVERAGE DAYS ON MARKET 800 600 400 200 0
SANTA BARBARA, CA
Properties on the market for over 180 days are selling four times faster; increased numbers are normalizing after a 2020 market spike.
DAYS ON MARKET: COLD
After seeing a sharp increase in Days On Market in 2020, Santa Barbara, California seems to be normalizing, with 2021 sales averaging just 149 days—down 76.2% from 627. Properties on the market for over 180 days sold more quickly in 2021 in the last four consecutive years, nearly four times the rate of that in 2020 alone.

51 | LUXURY HOMES INDEX 2018 2019 2020 202 1 AVERAGE DAYS ON MARKET 800 600 400 200 0
CHICAGO, IL
Properties are taking less than six months to sell, a dramatic decrease in average Days On Market after a steady rise for three consecutive years.
DAYS ON MARKET: COLD
Average Days On Market for properties over 180 days dramatically decreased in Chicago in 2021, seeing 63% decrease from 868 in 2020 to just 320 days after steadily rising over the past three years.

53 | LUXURY HOMES INDEX 2017 2018 2019 2020 202 1 AVERAGE DAYS ON MARKET 800 600 400 200 0
CHAPTER 3: PERCENT OF LIST PRICE


55 | LUXURY HOMES INDEX
2021 | % OF LIST PRICE
The average percent of Original List Price achieved for the 56 luxury U.S. markets evaluated in 2021 was 88.8%.
2015 2016 2017 2018 2019 2020 202 1 AVERAGE % OLP TO SP 100% 90% 80% 70% 60% Market with average DOM >180 Market with average DOM ≤180 All markets
Of these, the properties that sold within 180 days achieved 94.06% of their Original List Price. By contrast, those that took longer than 180 days to sell achieved just 80.6%. This over 13% difference can be substantial when dealing with multi-million dollar properties and does not include carry costs, property taxes, or other expenditures of both time and money.
Hot vs Cold
The lowest average percent of Original List Price achieved for top sales in 2020 were in the Hamptons, NY, at 62.95%, followed by Beverly Hills, CA, at 69.06%. Conversely, properties in Nantucket, MA achieved over asking price and the highest percent of Original List Price, at 116.61%, followed by Vermont at 97.51%.
Top Ten Highest Top Ten Lowest
57 | LUXURY HOMES INDEX
2
Lake
4 Sonoma
CA 5 Hamptons, NY 6 Denver, CO 7 Sun Valley, ID 8 Palo Alto, CA 9 Vail, CO 10 Telluride, CO
2
3 Malibu,
4 Broward County, FL 5 Fairfield County, CT 6 San Diego County, CA 7 Westchester County, NY 8 San Francisco County, CA 9 Tampa, FL 10 Atlanta, GA
1 New Hampshire
Aspen, CO 3
Tahoe, CA/NV
County,
1 Beverly Hills, CA
Dallas, TX
CA
ASPEN, CO
At 100%, top sales achieved the second-highest percent of Original List Price of all other markets, rising 16% in 2021.
In 2021, the top sales in Aspen, CO garnered 100.18% of their Original List Price, on average. As overall average Sale Prices continued to increase, those properties listed over 180 days saw the biggest jump in percent of Original List Price achieved, from 80% in 2020 to 102% in 2021, while average Days On Market for these same sales dropped more than half, from 1,124 to just 487.
 % OLP: HOT
59 | LUXURY HOMES INDEX 2015 2016 2017 2018 2019 2020 202 1 100% 75% 50% 25% 0% AVERAGE % OF LIST PRICE
HAMPTONS, NY

After remaining fairly steady for the past three years, top sales jumped 32% in 2021.
The top sales in the Hamptons, NY achieved 95.07% of their Original List Price in 2021, the highest percentage in the past three consecutive years, following a sharp increase from just 63% in 2020.
 % OLP: HOT
61 | LUXURY HOMES INDEX 2018 2019 2020 202 1 AVERAGE % OF LIST PRICE 100% 75% 50% 25% 0%
DENVER, CO
Top sales achieved 94.6% of Original List Price, holding steady for the last five consecutive years.
Denver, CO’s top sales continue to hold steady at 95% of their Original List Price. For the last five consecutive years, the market has remained fairly consistent.

 % OLP: HOT
63 | LUXURY HOMES INDEX 2017 2018 2019 2020 202 1 AVERAGE % OF LIST PRICE 100% 75% 50% 25% 0%
VAIL, CO
Days On Market trending downward, with top sales achieving the highest Sale Prices in the last seven consecutive years at 93.38% of their original asking price.
Rounding out the hot mountain markets, the top sales in Vail jumped from 86% in 2020 to 93.38% of Original List Price achieved in 2021. As seen in other mountain markets, final sales prices continue to increase and Days On Market continue to decrease.

% OLP: HOT
65 | LUXURY HOMES INDEX 2015 2016 2017 2018 2019 2020 202 1 100% 75% 50% 25% 0% AVERAGE % OF LIST PRICE
BEVERLY HILLS, CA
Top sales achieved just 70% of their original asking price in 2021, the lowest of all of the 56 markets analyzed.
Just slightly above its lowest average in the past six consecutive years (in 2020), the top sales in Beverly Hills, CA achieved just 70.32% of Original List Price—the lowest of all 56 luxury markets analyzed. The market continues to top the lowest percent of Original List Price list, after dropping 11% since 2018.

 % OLP: COLD
67 | LUXURY HOMES INDEX 2015 2016 2017 2018 2019 2020 202 1 100% 75% 50% 25% 0% AVERAGE % OF LIST PRICE
MALIBU, CA
Malibu sees a steady decline since 2019, with top sales achieving just 78% of Original List Price.
The top sales in Malibu, CA achieved just 78.03% of their Original List Price in 2021, the lowest percentage in the past two consecutive years, following a steady decline since 2019.

 % OLP: COLD
69 | LUXURY HOMES INDEX 2015 2016 2017 2018 2019 2020 202 1 100% 75% 50% 25% 0% AVERAGE % OF LIST PRICE
FAIRFIELD COUNTY, CT
Top sales achieved just 80% of Original List Price, a nearly 10% drop after a 25% increase in 2020.
After a sharp spike in the market from 2019-2020, the average percentage of Original List Price achieved for the top sales in Fairfield County, CT decreased by nearly 10% in 2021 to just 80.53%. Morever, top sales took an avearge of six months longer to sell in 2021 than in 2020, the longest in the past three consecutive years.

 % OLP: COLD
71 | LUXURY HOMES INDEX 2017 2018 2019 2020 202 1 AVERAGE % OF LIST PRICE 100% 75% 50% 25% 0%
SAN FRANCISCO, CA
Steady decline since 2019; Top sales achieved just 84% of Original List Price, the market’s lowest in the pasts six years.
Top sales in San Francisco, CA achieved just 83.51% of their Original List Price in 2021, the lowest in six consecutive years. Average Days On Market also continues to increase, from just 78 days in 2017 to 375 in 2021.

 % OLP: COLD
73 | LUXURY HOMES INDEX AVERAGE % OF LIST PRICE 2015 2016 2017 2018 2019 2020 202 1 100% 75% 50% 25% 0%
CHAPTER 4: TOP SALES
75 | LUXURY HOMES INDEX

Highest Priced Sales in Top U.S. Luxury Markets 2015-2021 TOP SALES
West
Aspen
Beverly Hills
Brentwood
Denver
Holmby/Bel Air
Lake Tahoe
Las Vegas
Malibu
Orange County
Pacific Palisades
Palo Alto
Park City
Phoenix
Rancho Santa Fe
San Diego
San Francisco
Santa Barbara
Seattle
Sonoma
Sun Valley
Telluride
Vail
Westlake Village
Hawaii
Kauai
Kona
Maui
Oahu
North
Boston
Cape Cod
Chicago
Fairfield County
Greenwich
Hamptons
Martha’s Vineyard
Morristown/Essex
Nantucket
New Hampshire
New York
Philadelphia
Rhode Island
Vermont
Westchester
South
Atlanta
Boca Raton
Broward County
Dallas
Duval/St Johns
Fairfax
Houston
Miami Naples
Nashville
Palm Beach
Sarasota
Tampa
Vero Beach
77 | LUXURY HOMES INDEX
Top Sales: Highest Priced Sales in 56 U.S. Luxury Markets
Phoenix Beverly Hills Brentwood Holmby Hills + Bel Air Lake Tahoe Malibu Orange County Pacific Palisades Palo Alto Rancho Santa Fe San Diego County San Francisco County Santa Barbara Sonoma County Westlake Village Aspen Denver Telluride Vail Sun Valley Las Vegas Park City Seattle WEST MARKET AVERAGE $15,035,000 $40,530,000 $31,120,350 $41,907,175 $35,130,000 $26,264,615 $29,166,848 $20,146,567 $27,325,000 $14,762,000 $19,867,000 $18,855,000 $20,634,828 $8,604,500 $7,007,500 $38,474,500 $5,875,000 $18,541,696 $21,281,250 $9,423,500 $12,579,000 $14,604,650 $18,567,600 $21,552,330 468 607 147 530 161 300 647 158 143 490 443 375 149 525 413 410 268 249 260 263 278 764 209 359 57% 20% 75% 57% 86% 40% 50% 60% 75% 67% 36% 56% 80% 67% 33% 17% 38% 57% 50% 75% 67% 20% 50% 53.61% 43% 80% 25% 43% 14% 60% 50% 40% 25% 33% 64% 44% 20% 33% 67% 83% 62% 43% 50% 25% 33% 80% 50% 46.39% 85 47 78 63 57 107 86 75 49 66 54 61 76 72 75 29 63 91 111 82 65 14 77 69 979 747 352 1,154 781 428 1,349 283 425 1,479 638 768 440 1,432 582 487 392 461 409 806 702 856 341 708 89.04% 88.42% 90.1% 84.55% 93.89% 81.39% 90.78% 92.33% 98.32% 94.46% 94.7% 96.42% 91.55% 107.05% 92.22% 93.13% 100.08% 94.47% 90.06% 94.61% 93.21% 98.43% 88.98% 92.96% 84.28% 65.8% 77.83% 84.29% 115.45% 75.8% 85.01% 84.17% 78.79% 67.37% 76.06% 67.38% 84.93% 76.47% 85.59% 101.59% 91.32% 91.12% 96.7% 91.41% 89.26% 90.34% 87.56% 84.72% AZ CA CA CA CA CA CA CA CA CA CA CA CA CA CA CO CO CO CO ID NV UT WA
ST MARKET WEST UNDER 180 DAYS OVER 180 DAYS AVG SALE PRICE AVG DOM % OF SALES AVG DOM AVG DOM AVG SP/OLP AVG SP/OLP % OF SALES
2021
79 | LUXURY HOMES INDEX Kauai Kona Maui Oahu HAWAII MARKET AVERAGE Fairfield County Greenwich Chicago Boston Cape Cod Martha’s Vineyard Nantucket New Hampshire Morristown + Essex Hamptons New York Westchester County Philadelphia Rhode Island Vermont NORTH MARKET AVERAGE $22,919,900 $23,478,200 $21,960,000 $11,257,050 $19,903,788 $14,630,000 $21,578,800 $7,080,000 $5,579,000 $12,175,000 $14,118,438 $23,338,500 $5,959,345 $4,787,800 $63,550,000 $49,917,000 $10,015,000 $4,409,900 $16,986,164 $8,192,332 $17,487,819 243 270 235 352 275 577 357 176 181 277 221 533 104 174 198 N/A 687 165 256 N/A 300 20% 20% 70% 40% 37.5% 50% 38% 67% 80% 50% 50% 0% 78% 50% 67% N/A 30% 60% 62% N/A 52.46% 80% 80% 30% 60% 62.5% 50% 62% 33% 20% 50% 50% 100% 22% 50% 33% N/A 70% 40% 38% N/A 47.54% 67 143 87 86 96 1 135 103 71 106 127 N/A 55 114 126 N/A 106 100 88 N/A 94 287 301 581 530 425 1,152 491 320 620 449 315 533 278 235 341 N/A 936 263 451 N/A 491 86.95% 80.93% 93.99% 104.23% 91.53% 98.25% 95.49% 92.2% 93.74% 85.03% 94.18% N/A 104.27% 96.92% 97.16% N/A 100% 93.87% 90.68% N/A 95.15% 90.04% 91.18% 77.27% 82.66% 85.29% 62.81% 80.86% 85.47% 87.24% 91.68% 85.02% 88.85% 90.04% 88.17% 90.91% N/A 75.6% 91.44% 76.16% N/A 84.17% HI HI HI HI CT CT IL MA MA MA MA NH NJ NY NY NY PA RI VT ST MARKET HAWAII NORTH UNDER 180 DAYS UNDER 180 DAYS OVER 180 DAYS OVER 180 DAYS AVG SALE PRICE AVG DOM % OF SALES AVG DOM AVG DOM AVG SP/OLP AVG SP/OLP % OF SALES
2021
Top Sales: Continued
Fewer than 10 sales were used for some markets because public data was incomplete. †
Tahoe: Combined NV and CA
HIGHEST LOWEST
Beach Broward County
St. Johns Counties Miami Naples Palm Beach (Proper) Sarasota + Manatee Counties Tampa Vero Beach Atlanta Nashville Dallas Houston Fairfax SOUTH MARKET AVERAGE OVERALL MARKET AVERAGE $58,063,500 $19,363,500 $8,140,816 $38,775,000 $22,404,750 $63,734,255 $11,380,725 $12,646,620 $12,876,300 $6,753,053 $13,781,000 $11,025,000 $8,040,800 $12,099,901 $21,363,230 $20,298,593 195 389 133 681 283 296 305 513 779 362 204 880 255 308 399 349 33% 45% 70% 44% 25% 44% 75% 25% 43% 38% 60% 20% 50% 33% 43.21% 49.44% 67% 55% 30% 56% 75% 56% 25% 75% 57% 62% 40% 80% 50% 67% 56.79% 50.56% 88 116 58 61 126 113 70 37 80 116 159 91 94 67 91 83 248 571 307 1,177 335 442 1,010 672 1,303 510 272 1,077 415 429 626 614 90.26% 87.82% 95.38% 96.8% 97.33% 88.57% 89.76% 100% 102.11% 85.62% 93.46% 94.73% 94.17% 91.57% 93.4% 93.47% 90.63% 73.23% 83.83% 78.28% 89.73% 95.81% 78.45% 78.78% 72.64% 83.35% 81.27% 72.16% 91.13% 90.35% 82.83% 84.14% FL FL FL FL FL FL FL FL FL GA TN TX TX VA
Boca RatonDelray BeachHighland
Duval +
ST MARKET SOUTH UNDER 180 DAYS OVER 180 DAYS AVG SALE PRICE AVG DOM % OF SALES AVG DOM AVG DOM AVG SP/OLP AVG SP/OLP % OF SALES
Lake
ST MARKET WEST UNDER 180 DAYS OVER 180 DAYS
AZ CA CA CA CA CA CA CA CA CA CA CA CA CA CA CO CO CO CO ID NV UT WA
2020 712 415 288 508 400 644 433 374 207 533 589 173 627 86 547 787 119 270 658 525 542 379 329 441
AVG SALE PRICE AVG DOM % OF SALES AVG DOM AVG DOM AVG SP/OLP AVG SP/OLP % OF SALES Phoenix Beverly Hills Brentwood Holmby Hills + Bel Air Lake Tahoe Malibu Orange County Pacific Palisades Palo Alto Rancho Santa Fe San Diego County San Francisco County Santa Barbara Sonoma County Westlake Village Aspen Denver Telluride Vail Sun Valley Las Vegas Park City Seattle WEST MARKET AVERAGE
33% 10% 11% 20% 43% 40% 44% 33% 67% 40% 30% 71% 67% 86% 50% 33% 86% 67% 11% 50% 12% 25% 50% 42.57%
37 153 107 107 28 78 97 104 66 67 116 75 62 52 42 115 94 84 47 82 23 84 47 77
96.57% 94.23% 91.86% 91.87% 97.08% 88.02% 92.27% 95% 89.84% 91.22% 92.74% 92.54% 88.87% 93.36% 99.45% 92.46% 93.17% 93.76% 91.67% 95.76% 94.87% 89.59% 94.84% 93.09%
67% 90% 89% 80% 57% 60% 56% 67% 33% 60% 70% 29% 33% 14% 50% 67% 14% 33% 89% 50% 88% 75% 50% 57.43%
937 444 379 608 678 1,022 701 508 489 844 792 416 1,756 294 1,051 1,124 268 643 735 968 616 478 612 711
85.28% 66.26% 71.45% 67.44% 92.28% 74.81% 81.13% 77.3% 67.4% 67.82% 68.34% 72.72% 77.84% 88.3% 59.53% 80.18% 94.05% 86.38% 84.83% 90.81% 77.28% 98.69% 77.39% 78.59%
81 | LUXURY HOMES INDEX
Top Sales: Highest Priced Sales in 56 U.S. Luxury Markets $13,412,500 $33,685,000 $21,766,550 $27,470,000 $20,125,000 $19,671,800 $25,126,800 $12,037,031 $12,338,000 $11,743,750 $20,100,000 $17,458,000 $29,728,325 $6,747,900 $6,108,300 $27,892,964 $4,721,900 $8,343,875 $19,495,000 $5,448,300 $9,029,500 $12,800,000 $19,686,300 $16,736,382
ST MARKET HAWAII NORTH
HI HI HI HI CT CT IL MA MA MA MA NH NJ NY NY NY PA RI VT
2020 1,081 638 773 447 735 377 611 768 379 332 784 420 260 283 887 N/A 618 267 762 249 500
Kauai Kona Maui Oahu HAWAII MARKET AVERAGE Fairfield County Greenwich Chicago Boston Cape Cod Martha’s Vineyard Nantucket New Hampshire Morristown + Essex Hamptons New York Westchester County Philadelphia Rhode Island Vermont NORTH MARKET AVERAGE
AVG SALE PRICE AVG DOM % OF SALES AVG DOM AVG DOM AVG SP/OLP AVG SP/OLP % OF SALES
UNDER 180 DAYS UNDER 180 DAYS
0% 12% 0% 14% 6.5% 56% 17% 12% 25% 50% 0% 20% 50% 50% 0% N/A 30% 44% 12% 50% 29.71%
N/A 111 N/A 49 80 85 169 67 29 103 N/A 69 56 92 N/A N/A 87 72 31 121 82
N/A 97.28% N/A 93.47% 95.38% 93.78% 87.51% 98.91% 85.46% 94.32% N/A 86.71% 95.98% 81.69% N/A N/A 97.19% 100.53% 98.74% 98.99% 93.41%
100% 88% 100% 86% 93.5% 44% 83% 88% 75% 50% 100% 80% 50% 50% 100% N/A 70% 56% 88% 57% 72.6%
OVER 180 DAYS OVER 180 DAYS
1,081 713 773 496 767 741 699 868 496 560 784 508 464 475 887 N/A 845 424 866 377 642
72.26% 81.86% 84.98% 92.87% 82.99% 85.24% 73.35% 75.34% 83.48% 86.17% 74.38% 124.08% 77.4% 82.45% 60.03% N/A 75.99% 94.08% 73.2% 96.02% 82.94%
Top Sales: Continued $14,480,700 $8,400,191 $12,722,554 $8,078,500 $10,920,486 $10,267,500 $18,761,000 $5,811,786 $10,263,000 $10,447,778 $10,639,500 $18,032,500 $6,147,083 $2,530,000 $41,635,573 $65,561,281 $7,108,500 $2,033,600 $9,797,700 $7,253,736 $15,086,036
Boca RatonDelray BeachHighland Beach
Broward County
Duval + St. Johns Counties
Miami
Naples
Palm Beach (Proper)
Sarasota + Manatee Counties Tampa Vero
Fewer than 10 sales were used for some markets because public data was incomplete. † Lake Tahoe: Combined NV and CA
83 | LUXURY HOMES INDEX $15,828,600 $15,250,685 $6,964,200 $27,265,000 $14,845,000 $48,294,758 $10,522,500 $7,765,980 $7,630,000 $9,664,000 $6,372,500 $8,192,380 $7,080,250 $7,582,813 $13,804,190 $15,145,856 534 382 378 493 639 546 522 425 698 639 399 546 289 430 494 491 14% 30% 30% 20% 20% 67% 20% 50% 12% 40% 50% 10% 50% 25% 31.29% 33.8% 86% 70% 70% 80% 80% 33% 80% 50% 88% 60% 50% 90% 50% 75% 68.71% 66.79% 7 63 98 72 116 172 109 54 19 116 68 118 85 63 83 80 622 519 498 598 770 1,293 625 796 795 987 731 593 493 552 705 696 92.94% 68.2% 95.97% 85.72% 96.76% 85.86% 90.33% 90.83% 93.75% 98.68% 96.36% 93.35% 92.88% 99.8% 91.53% 92.83% 92.6% 74.75% 79.06% 74.69% 80.59% 95.76% 79.65% 72.82% 72.49% 81.55% 83.12% 81.68% 85.53% 84.74% 81.36% 80.72%
Beach Atlanta Nashville Dallas Houston Fairfax SOUTH MARKET AVERAGE OVERALL MARKET AVERAGE FL FL FL FL FL FL FL FL FL GA TN TX TX VA ST MARKET SOUTH UNDER 180 DAYS OVER 180 DAYS AVG SALE PRICE AVG DOM % OF SALES AVG DOM AVG DOM AVG SP/OLP AVG SP/OLP % OF SALES HIGHEST LOWEST
Top Sales: Highest Priced Sales in 56 U.S. Luxury Markets
$11,333,000 $31,689,958 $20,359,089 $63,225,000 $10,354,500 $26,252,000 $25,246,500 $11,937,367 $9,537,500 $7,543,967 $15,010,000 $15,370,000 $17,335,000 $9,309,500 $2,397,170 $18,829,500 $6,322,349 $6,647,450 $14,697,400 $5,536,300 $6,940,075 $11,906,208 $10,720,500 $15,586,971 340 372 173 269 390 315 333 247 184 335 366 182 281 162 168 535 522 584 285 488 463 850 205 350 50% 30% 78% 33% 33% 40% 44% 30% 75% 30% 33% 70% 50% 60% 70% 25% 14% 0% 44% 40% 10% 20% 60% 40.83% 50% 70% 22% 67% 67% 60% 56% 70% 25% 70% 67% 30% 50% 40% 30% 75% 86% 100% 56% 60% 90% 80% 40% 59.17% 111 121 84 61 48 74 104 90 75 112 64 61 58 103 67 137 100 N/A 39 84 89 74 40 82 569 479 485 373 562 475 516 315 511 430 518 425 505 250 401 668 593 584 482 757 505 1,043 454 517 87.44% 87.59% 90.69% 87.84% 97.77% 93.08% 80.76% 96.6% 88.21% 95.19% 88.68% 96.56% 95.02% 98.75% 96.56% 91.69% 87.60% N/A 90.42% 97.18% 78.13% 92.24% 95.66% 91.53% 84.67% 77.08% 76.36% 73.62% 89.57% 80.73% 70.41% 79.83% 80.22% 77.66% 76.73% 79.77% 72.94% 88.46% 81.70% 82.27% 83.01% 87.34% 86.61% 86.18% 68.61% 96.43% 79.63% 80.86%
2019 ST MARKET WEST UNDER 180 DAYS OVER 180 DAYS AVG SALE PRICE AVG DOM % OF SALES AVG DOM AVG DOM AVG SP/OLP AVG SP/OLP % OF SALES Phoenix Beverly Hills Brentwood Holmby Hills + Bel Air Lake Tahoe Malibu Orange County Pacific Palisades Palo Alto Rancho Santa Fe San Diego County San Francisco County Santa Barbara Sonoma County Westlake Village Aspen Denver Telluride Vail Sun Valley Las Vegas Park City Seattle WEST MARKET AVERAGE AZ CA CA CA CA CA CA CA CA CA CA CA CA CA CA CO CO CO CO ID NV UT WA
85 | LUXURY HOMES INDEX $6,694,542 $13,067,000 $10,776,214 $10,956,681 $10,373,609 $5,077,443 $18,179,000 $4,978,367 $11,944,692 $10,250,000 $13,803,350 $13,380,335 $4,407,525 $4,105,000 $25,804,398 $65,371,204 $6,218,540 $4,495,180 $6,951,000 $2,792,100 $13,183,876 603 568 922 560 663 538 615 468 259 921 553 406 545 445 847 1,218 358 244 474 455 556 0% 57% 0% 33% 22.5% 11% 17% 30% 33% 20% 12% 17% 40% 20% 0% N/A 30% 44% 44% 43% 25.79% 100% 43% 100% 67% 77.5% 89% 83% 70% 67% 80% 88% 83% 60% 80% 100% N/A 70% 56% 56% 57% 74.21% N/A 145 N/A 60 102 45 61 81 89 127 135 104 103 120 N/A N/A 88 84 136 134 101 603 709 922 811 761 600 726 633 344 1,119 612 466 840 526 847 N/A 474 372 744 696 643 N/A 88.16% N/A 90.74% 89.45% 120.54% 94.18% 96.29% 100.87% 95.01% 89.66% 97% 95.39% 95.32% N/A N/A 88.65% 87.95% 89.31% 95.92% 95.85% 81.46% 86.93% 85.85% 91.77% 86.5% 58.4% 73.78% 79.3% 88.14% 76.71% 69.51% 84.39% 76% 78.44% 72.61% N/A 77.43% 89.05% 110.1% 68.9% 78.77% Kauai Kona Maui Oahu HAWAII MARKET AVERAGE Fairfield County Greenwich Chicago Boston Cape Cod Martha’s Vineyard Nantucket New Hampshire Morristown + Essex Hamptons New York Westchester County Philadelphia Rhode Island Vermont NORTH MARKET AVERAGE HI HI HI HI CT CT IL MA MA MA MA NH NJ NY NY NY PA RI VT ST MARKET HAWAII NORTH UNDER 180 DAYS UNDER 180 DAYS OVER 180 DAYS OVER 180 DAYS AVG SALE PRICE AVG DOM % OF SALES AVG DOM AVG DOM AVG SP/OLP AVG SP/OLP % OF SALES
Top Sales:
Fewer than 10 sales were used for some markets because public data was incomplete. † Lake Tahoe: Combined NV and CA
$12,813,300 $10,896,503 $5,630,200 $23,938,500 $19,715,000 $25,031,345 $8,517,500 $4,868,500 $5,922,000 $6,971,526 $7,185,000 $7,251,000 $5,835,400 $6,072,771 $10,760,610 $13,364,312 542 490 408 429 477 703 724 227 1,190 394 464 317 367 405 510 468 30% 20% 44% 22% 33% 0% 25% 63% 10% 30% 33% 40% 50% 40% 31.43% 33.27% 70% 80% 56% 78% 67% 100% 75% 38% 90% 70% 67% 60% 50% 60% 68.64% 66.75% 94 114 33 109 80 N/A 69 96 167 74 37 73 71 43 82 87 734 584 708 521 676 703 942 445 1,304 531 677 480 663 646 687 610 92.96% 84.93% 96.85% 66.85% 94.03% N/A 95.44% 93.88% 84.62% 95.5% 92.35% 92.02% 87.88% 101.66% 90.69% 92.35% 96% 73.29% 78.13% 76.75% 82.07% 70.73% 65.94% 73.84% 64.57% 82.78% 81.32% 81.45% 88.79% 84.11% 78.56% 80.15%
Naples
Atlanta Nashville Dallas Houston Fairfax SOUTH MARKET AVERAGE OVERALL MARKET AVERAGE FL FL FL FL FL FL FL FL FL GA TN TX TX VA ST MARKET SOUTH UNDER 180 DAYS OVER 180 DAYS AVG SALE PRICE AVG DOM % OF SALES AVG DOM AVG DOM AVG SP/OLP AVG SP/OLP % OF SALES HIGHEST LOWEST
Continued 2019 Boca RatonDelray BeachHighland Beach Broward County Duval + St. Johns Counties Miami
Palm Beach (Proper) Sarasota + Manatee Counties Tampa Vero Beach
Top Sales: Highest Priced Sales in 56 U.S. Luxury Markets
87 | LUXURY HOMES INDEX
$9,177,500 $22,852,600 $18,585,175 $27,227,250 $21,021,054 $21,042,500 $26,294,500 $15,398,567 $12,313,000 $8,866,296 $16,684,500 $15,880,000 $12,403,745 $6,301,250 $5,317,500 $16,596,574 $6,190,883 $6,027,550 $14,934,000 $6,161,790 $8,050,000 $8,011,750 $13,353,450 $13,856,149 720 361 163 226 541 490 528 395 86 660 787 116 589 244 282 400 201 804 559 705 1,133 449 466 474 22% 50% 60% 60% 44% 30% 30% 50% 90% 50% 20% 89% 10% 60% 60% 50% 70% 30% 33% 0% 20% 30% 50% 43.83% 78% 50% 40% 40% 56% 70% 70% 50% 10% 50% 80% 11% 90% 40% 40% 50% 30% 70% 67% 100% 80% 70% 50% 56.17% 84 79 94 72 123 137 112 77 80 70 55 92 92 91 72 83 57 91 69 N/A 92 84 66 85 902 586 268 458 791 642 706 712 217 1,250 970 281 645 473 597 717 537 1,110 804 705 1,263 606 866 700 98.28% 87.09% 93% 88.95% 93.23% 80.73% 94.87% 96.65% 94.44% 86.33% 95.86% 89.6% 88.02% 95.69% 94.37% 93.42% 80.01% 84.47% 90.53% N/A 123.81% 91.39% 96.32% 92.59% 63.65% 73.37% 77.6% 74.12% 78.15% 75.96% 76.84% 81.62% 94.14% 70.8% 78.18% 65.17% 78.74% 81.29% 81.8% 77.64% 81.85% 76.27% 85.03% 91.35% 59.62% 86.27% 81.33% 77.86% ST MARKET WEST UNDER 180 DAYS OVER 180 DAYS AVG SALE PRICE AVG DOM % OF SALES AVG DOM AVG DOM AVG SP/OLP AVG SP/OLP % OF SALES Phoenix Beverly Hills Brentwood Holmby Hills + Bel Air Lake Tahoe Malibu Orange County Pacific Palisades Palo Alto Rancho Santa Fe San Diego County San Francisco County Santa Barbara Sonoma County Westlake Village Aspen Denver Telluride Vail Sun Valley Las Vegas Park City Seattle WEST MARKET AVERAGE AZ CA CA CA CA CA CA CA CA CA CA CA CA CA CA CO CO CO CO ID NV UT WA
2018
ST MARKET HAWAII NORTH
HI HI HI HI CT CT IL MA MA MA MA NH NJ NY NY NY PA RI VT
2018 640 290 674 981 646 702 679 245 303 663 572 438 1,054 692 707 426 343 411 639 560 562
Kauai Kona Maui Oahu HAWAII MARKET AVERAGE Fairfield County Greenwich Chicago Boston Cape Cod Martha’s Vineyard Nantucket New Hampshire Morristown + Essex Hamptons New York Westchester County Philadelphia Rhode Island Vermont NORTH MARKET AVERAGE
AVG SALE PRICE AVG DOM % OF SALES AVG DOM AVG DOM AVG SP/OLP AVG SP/OLP % OF SALES
UNDER 180 DAYS UNDER 180 DAYS
10% 60% 20% 22% 28% 20% 40% 60% 50% 20% 57% 22% 20% 22% 14% N/A 50% 30% 25% 40% 33.57%
1 39 122 52 54 123 129 75 60 138 56 136 170 74 167 N/A 138 110 153 87 115
96% 93.49% 96.97% 97.22% 95.92% 96.07% 84.13% 87.78% 100% 89.89% 88.29% 100% 95.52% 84.05% 87.44% N/A 105.47% 98.19% 66.58% 95.49% 91.35%
90% 40% 80% 78% 72% 80% 60% 40% 50% 80% 43% 78% 80% 78% 86% N/A 50% 70% 75% 60% 66.43%
OVER 180 DAYS OVER 180 DAYS
711 478 812 1,246 812 846 862 457 400 795 1,088 481 1,164 868 797 N/A 547 540 801 876 752
78% 87.2% 79.18% 79.05% 80.86% 67.78% 79.17% 83.15% 85.87% 83.6% 69% 88.13% 72.68% 69.34% 60.65% N/A 84.32% 80.18% 75.03% 66.36% 76.09%
Top Sales: Continued $14,232,940 $11,430,800 $11,957,500 $16,434,675 $13,513,979 $3,556,000 $12,842,500 $8,066,363 $4,572,914 $10,070,000 $9,407,185 $9,441,000 $3,942,873 $4,343,100 $24,556,612 $41,470,830 $13,340,000 $4,692,500 $5,554,400 $3,593,500 $10,629,985
Boca RatonDelray BeachHighland Beach
Broward County
Duval + St. Johns Counties Miami Naples
Palm Beach (Proper) Sarasota + Manatee Counties
Fewer than 10 sales were used for some markets because public data was incomplete. † Lake Tahoe: Combined NV and CA
89 | LUXURY HOMES INDEX $13,094,116 $8,971,462 $5,087,500 $20,540,000 $18,026,362 $25,673,308 $6,141,500 $6,199,900 $6,009,750 $5,745,500 $4,642,399 $13,842,712 $6,423,156 $11,670,000 $10,861,976 $12,219,014 657 605 344 502 534 575 1,109 445 337 473 425 641 275 369 521 516 22% 20% 80% 22% 33% 10% 40% 40% 44% 20% 60% 30% 70% 0% 35.07% 37.84% 78% 80% 20% 78% 67% 90% 60% 60% 56% 80% 40% 70% 30% 100% 64.93% 62.16% 139 41 104 67 99 155 78 61 55 80 90 79 124 N/A 90 92 806 746 1,186 627 752 621 1,796 638 562 571 950 881 626 369 795 746 81.76% 79.77% 92.99% 65.51% 94.85% 80.79% 89.5% 91.33% 78.77% 97.21% 92.91% 91.7% 90.38% N/A 86.73% 91.96% 82.59% 82.37% 81.32% 71.54% 83.48% 72.72% 76.14% 78.45% 88.07% 80.01% 82.60% 63.18% 85.06% 79.32% 79.06% 77.93%
Beach Atlanta Nashville Dallas Houston Fairfax SOUTH MARKET AVERAGE OVERALL MARKET AVERAGE FL FL FL FL FL FL FL FL FL GA TN TX TX VA ST MARKET SOUTH UNDER 180 DAYS OVER 180 DAYS AVG SALE PRICE AVG DOM % OF SALES AVG DOM AVG DOM AVG SP/OLP AVG SP/OLP % OF SALES HIGHEST
Tampa Vero
LOWEST
Top Sales: Highest Priced Sales in 40 U.S. Luxury Markets
Phoenix Beverly Hills Brentwood Holmby Hills + Bel Air Malibu Orange County Pacific Palisades Palo Alto Rancho Santa Fe San Diego County San Francisco County Sonoma County Westlake Village Aspen Denver Telluride Vail Las Vegas Park City Seattle WEST MARKET AVERAGE $6,212,650 $24,352,500 $15,200,000 $24,418,500 $19,120,095 $20,981,200 $15,199,500 $9,796,900 $6,585,000 $4,499,700 $12,892,500 $5,923,150 $5,347,400 $21,991,100 $5,152,500 $4,802,182 $12,466,000 $4,938,900 $9,630,300 $11,516,850 $12,051,346 632 347 154 251 480 589 398 180 481 614 78 408 597 630 371 563 472 379 1,039 398 453 10% 30% 80% 20% 30% 20% 30% 60% 10% 10% 100% 40% 30% 10% 40% 33% 20% 30% 0% 40% 32.15% 90% 70% 20% 80% 70% 80% 70% 40% 90% 90% 0% 60% 70% 90% 60% 67% 80% 70% 100% 60% 67.85% 6 139 114 73 89 102 77 63 151 137 55 64 126 77 67 64 79 52 N/A 60 84 701 436 317 296 647 711 536 355 518 667 N/A 581 732 692 573 812 570 520 1,039 567 593 97.01% 79.81% 85.5% 79.84% 96.2% 93.99% 99.59% 95.63% 85.62% 92.87% 100.13% 93.71% 83.18% 98.18% 93.16% 93.82% 100% 94.35% N/A 96.35% 92.58% 80.4% 74.8% 72.83% 70.47% 75.36% 71.93% 79.32% 92.17% 73.66% 68.09% N/A 72.38% 66.2% 85.42% 86.83% 87.08% 80.09% 77.98% 84.51% 79.42% 77.84% AZ CA CA CA CA CA CA CA CA CA CA CA CA CO CO CO CO NV UT WA ST MARKET WEST UNDER 180 DAYS OVER 180 DAYS AVG SALE PRICE AVG DOM % OF SALES AVG DOM AVG DOM AVG SP/OLP AVG SP/OLP % OF SALES
2017
Fewer than 10 sales were used for some markets because public data was incomplete. †
HIGHEST LOWEST
91 | LUXURY HOMES INDEX Kauai Kona Maui Oahu HAWAII MARKET AVERAGE Fairfield County Greenwich Chicago Boston Cape Cod Westchester County Philadelphia NORTH MARKET AVERAGE Miami Naples Palm Beach (Proper) Tampa Vero Beach Atlanta Nashville Dallas Houston SOUTH MARKET AVERAGE OVERALL MARKET AVERAGE $7,887,000 $11,650,000 $10,985,000 $8,082,800 $9,651,200 $7,573,500 $16,629,200 $6,555,800 $5,861,000 $9,840,900 $8,701,335 $4,958,977 $8,588,673 $22,871,100 $14,045,000 $28,362,528 $5,698,925 $6,222,600 $5,557,582 $5,312,364 $8,459,500 $8,503,500 $11,670,344 $11,119,638 357 315 698 737 527 757 478 322 241 982 798 771 621 608 410 476 457 926 953 1,062 416 395 634 530 50% 30% 10% 20% 27.5% 40% 30% 30% 50% 20% 30% 0% 28.57% 0% 20% 20% 40% 20% 10% 40% 20% 40% 23.33% 29.08% 50% 70% 90% 80% 72.5% 60% 70% 70% 50% 80% 70% 100% 71.43% 100% 80% 80% 60% 80% 90% 60% 80% 60% 76.67% 70.93% 102 66 30 60 64.5 48 91 44 90 87 80 N/A 73 N/A 79 128 64 169 133 97 121 77 109 85 612 422 773 906 678 1,229 644 441 392 1,206 1,106 771 827 608 493 563 719 1,115 1,044 1,704 490 606 816 695 83.99% 94.91% 100% 95% 93.48% 95.97% 88.14% 96.78% 95.35% 103.13% 100.89% N/A 96.71% N/A 79.63% 82.54% 94.3% 86.14% 91% 94.11% 81.54% 95.9% 88.15% 92.39% 74.95% 76.56% 74.92% 71.39% 74.46% 72.08% 68.58% 90.33% 84.12% 75.26% 62.3% 77.48% 75.74% 68.1% 73.08% 69.78% 76.55% 65.4% 64.53% 72.4% 79.96% 66.03% 70.65% 75.45% HI HI HI HI CT CT IL MA MA NY PA FL FL FL FL FL GA TN TX TX HAWAII UNDER 180 DAYS OVER 180 DAYS ST MARKET AVG SALE PRICE AVG DOM % OF SALES AVG DOM AVG DOM AVG SP/OLP AVG SP/OLP % OF SALES SOUTH NORTH UNDER 180 DAYS UNDER 180 DAYS OVER 180 DAYS OVER 180 DAYS
Lake Tahoe: Combined NV and CA
ST MARKET WEST UNDER 180 DAYS OVER 180 DAYS
AZ CA CA CA CA CA CA CA CA CA CA CA CO CO CO NV WA
2016 $7,393,000 $19,730,000 $12,349,600 $32,741,600 $17,205,400 $19,182,258 $12,779,406 $6,215,000 $14,544,250 $14,011,111 $10,320,700 $4,543,650 $13,774,000 $5,963,750 $7,867,388 $5,262,000 $7,744,743 $12,448,697
AVG SALE PRICE AVG DOM % OF SALES AVG DOM AVG DOM AVG SP/OLP AVG SP/OLP % OF SALES
690 417 345 860 489 525 256 434 372 355 811 572 383 1,057 702 398 569 543
20% 60% 50% 10% 30% 20% 50% 40% 60% 60% 20% 30% 60% 20% 30% 40% 50% 38.24%
97 106 87 1 81 132 85 95 49 76 85 77 122 76 85 150 78 87
85.26% 92.75% 95.34% 100% 94.51% 82.52% 89.49% 91.99% 110.66% 88.88% 87.42% 95.56% 92.58% 97.98% 84.64% 91.82% 94.31% 92.69%
80% 40% 50% 90% 70% 80% 50% 60% 40% 40% 80% 70% 40% 80% 70% 60% 50% 61.76%
838 805 603 955 664 623 427 661 856 705 992 784 645 1,303 967 564 1,060 791
83.51% 67.08% 79.24% 76.02% 85.28% 72.15% 78.59% 72.88% 79.33% 84.94% 70.2% 81.25% 83.51% 77.59% 80.16% 73.4% 90.15% 78.55%
Top Sales: Highest Priced Sales in 27 U.S. Luxury Markets Phoenix Beverly Hills Brentwood Holmby Hills + Bel Air Malibu Orange County Pacific Palisades Rancho Santa Fe San Francisco County San Diego County Sonoma County Westlake Village Aspen Telluride Vail Las Vegas Seattle WEST MARKET AVERAGE
Fewer than 10 sales were used for some markets because public data was incomplete. † Lake Tahoe: Combined NV and CA
93 | LUXURY HOMES INDEX $10,472,000 $8,076,969 $9,274,485 $11,447,888 $5,108,000 $8,277,944 $14,998,960 $24,894,801 $6,412,000 $5,832,800 $3,388,400 $8,090,200 $10,602,860 $11,494,440 438 428 433 665 287 476 552 451 807 532 585 724 609 545 20% 20% 20% 22% 40% 31% 40% 50% 20% 40% 40% 10% 33.33% 35.26% 80% 80% 80% 78% 60% 69% 60% 50% 80% 60% 60% 90% 66.67% 64.74% 41 64 53 131 99 115 66 76 97 115 47 63 77 84 537 520 529 818 413 616 794 827 984 811 944 797 860 774 100% 89.59% 94.8% 96.67% 95.75% 96.21% 85.22% 91.17% 95.34% 90.71% 97.82% 98.16% 93.07% 93.19% 71.95% 78.79% 75.37% 66.11% 85.57% 75.84% 64.64% 84.24% 72.75% 69.64% 87.15% 74.62% 75.51% 77.43% Maui Oahu HAWAII MARKET AVERAGE Greenwich Boston NORTH MARKET AVERAGE HI HI CT MA Miami Palm Beach (Proper) Vero Beach Atlanta Nashville Dallas SOUTH MARKET AVERAGE OVERALL MARKET AVERAGE FL FL FL GA TN TX HAWAII NORTH SOUTH UNDER 180 DAYS UNDER 180 DAYS OVER 180 DAYS OVER 180 DAYS UNDER 180 DAYS OVER 180 DAYS ST MARKET AVG SALE PRICE AVG DOM % OF SALES AVG DOM AVG DOM AVG SP/OLP AVG SP/OLP % OF SALES HIGHEST LOWEST
ST MARKET WEST UNDER 180 DAYS OVER 180 DAYS
AZ CA CA CA CA CA CA CA CA CA CA CA CO CO CO NV WA
2015 $7,344,769 $25,117,000 $13,381,166 $24,536,155 $14,862,222 $16,730,489 $12,383,946 $7,525,500 $12,032,000 $16,082,500 $10,814,800 $5,685,944 $22,450,981 $6,137,195 $11,609,250 $6,081,000 $8,552,500 $13,019,260
AVG SALE PRICE AVG DOM % OF SALES AVG DOM AVG DOM AVG SP/OLP AVG SP/OLP % OF SALES
604 188 173 683 577 435 494 1,155 852 579 432 875 857 1,085 735 606 739 651
20% 80% 60% 30% 33% 30% 40% 40% 20% 60% 60% 30% 33% 30% 30% 70% 50% 42.12%
69 86 82 123 57 129 86 115 114 62 106 124 170 89 39 103 84 96
88.45% 87.85% 94.67% 83.4% 95.32% 72.31% 94.69% 93.25% 91.37% 92.12% 93.71% 93.37% 86.41% 92.53% 84.13% 87.40% 95.07% 89.77%
80% 20% 40% 70% 67% 70% 60% 60% 80% 40% 40% 70% 67% 70% 70% 30% 50% 57.88%
738 598 310 922 837 478 767 1,675 1,037 1,353 922 1,197 972 1,370 909 1,778 1,395 1,015
82.69% 63.97% 84.53% 76.23% 78.68% 78.32% 76.75% 62.89% 71.93% 71.63% 71.91% 70.98% 76.06% 80.91% 88.08% 53.43% 73.27% 74.25%
Top Sales: Highest Priced Sales in 27 U.S. Luxury Markets Phoenix Beverly Hills Brentwood Holmby Hills + Bel Air Malibu Orange County Pacific Palisades Rancho Santa Fe San Diego County San Francisco County Sonoma County Westlake Village Aspen Telluride Vail Las Vegas Seattle WEST MARKET AVERAGE
Fewer than 10 sales were used for some markets because public data was incomplete. † Lake Tahoe: Combined NV and CA
95 | LUXURY HOMES INDEX NORTH SOUTH UNDER 180 DAYS UNDER 180 DAYS OVER 180 DAYS OVER 180 DAYS $10,899,500 $12,037,600 $11,468,550 $9,976,667 $8,244,500 $9,110,584 $20,820,011 $22,415,410 $7,241,375 $4,248,160 $3,662,400 $9,122,222 $11,251,596 $12,222,047 522 293 408 940 412 676 559 428 571 467 852 479 559 615 40% 50% 45% 0% 60% 30% 33% 30% 30% 50% 30% 44% 36.17% 40.11% 60% 50% 55% 100% 40% 70% 67% 70% 70% 50% 70% 56% 63.83% 59.89% 113 88 101 N/A 76 76 61 122 112 106 53 150 101 97 795 499 647 940 917 929 725 513 767 828 1,194 742 795 933 91.38% 88.92% 90.15% N/A 92.81% 92.81% 89.91% 88.91% 85.75% 90.58% 98.33% 80.67% 89.03% 89.74% 81.99% 69.05% 75.52% 80.96% 85.53% 83.25% 77.63% 84.88% 76.85% 78.39% 71.63% 82.78% 78.69% 76% Maui Oahu HAWAII MARKET AVERAGE Greenwich Boston NORTH MARKET AVERAGE HI HI CT MA Miami Palm Beach (Proper) Vero Beach Atlanta Nashville Dallas SOUTH MARKET AVERAGE OVERALL MARKET AVERAGE FL FL FL GA TN TX ST MARKET HAWAII UNDER 180 DAYS OVER 180 DAYS AVG SALE PRICE AVG DOM % OF SALES AVG DOM AVG DOM AVG SP/OLP AVG SP/OLP % OF SALES HIGHEST LOWEST
CHAPTER 5: ANNUAL CHANGE

97 | LUXURY HOMES INDEX
2015-2021
Annual Change: Highest Priced Sales in U.S. Luxury Markets
Phoenix Beverly Hills Brentwood Holmby Hills + Bel Air Lake Tahoe Malibu Orange County Pacific Palisades Palo Alto Rancho Santa Fe San Diego County San Francisco County Santa Barbara Sonoma County Westlake Village Aspen Denver Telluride Vail Sun Valley Las Vegas Park City Seattle WEST MARKET AVERAGE 0.66% -21.45% -7.71% 33.44% N/A 15.77% 14.65% 3.19% N/A -17.41% 16.45% -9.56% N/A -4.57% -20.09% -38.65% N/A -2.83% -32.23% N/A -13.47% N/A -9.44% -5.49% -15.97% 23.43% 23.08% -25.42% N/A 11.13% 9.38% 18.94% N/A 5.95% -67.65% -11.36% N/A -42.61% 17.69% 59.66% N/A -19.48% 58.45% N/A -6.14% N/A 48.71% 5.16% 18.3% 6.3% 6.9% -56.6% 94.4% -25.1% -0.5% 0.8% 29.4% 55.7% 33.9% 13.6% 71.5% -27.5% 154.8% 48.1% -25.3% 25.5% 32.6% -1.6% 30.1% 7.5% 83.6% 25.06% 47.72% -6.16% 22.27% 11.5% N/A 10.05% 25.32% 1.31% 25.68% 34.64% 270.79% 23.17% N/A 6.38% -0.56% -24.53% 20.15% 25.52% 19.8% N/A 62.99% -16.81% 15.95% 28.76% 12.1% 20.3% 43% 52.6% 74.6% 33.5% 16.1% 67.4% 121.5% 25.7% -1.2% 8% -30.6% 27.5% 14.7% 37.9% 24.4% 122.2% 9.2% 73% 39.3% 14.1% -5.7% 34.77% 23.49% 38.67% 9.54% 132.21% -50.74% 24.76% -3.99% -22.48% -22.54% -14.91% -10.04% -3.21% 39.76% 47.74% -54.92% 13.45% 2.12% 10.28% -1.58% -10.15% -10.15% 48.61% -19.72% 7.23% 104.7% 61.4% 132.6% 70.8% N/A 76.7% 74.3% 62.7% N/A 96.2% 65.1% 17.2% N/A -20.3% 23.2% 71.4% N/A 202.1% 83.3% N/A 106.9% N/A 117.1% 79.14% AZ CA CA CA CA CA CA CA CA CA CA CA CA CA CA CO CO CO CO ID NV UT WA ST MARKET WEST % CHANGE AVERAGE SALE PRICE 2015–2016 2016–2017 2017–2018 2020–2021 2018–2019 2015–2021 2019–2020
99 | LUXURY HOMES INDEX Phoenix Beverly Hills Brentwood Holmby Hills + Bel Air Lake Tahoe Malibu Orange County Pacific Palisades Palo Alto Rancho Santa Fe San Diego County San Francisco County Santa Barbara Sonoma County Westlake Village Aspen Denver Telluride Vail Sun Valley Las Vegas Park City Seattle WEST MARKET AVERAGE 14.24% 121.81% 99.42% 25.92% N/A -15.25% 20.69% -48.18% N/A -62.42% -58.33% -35.75% N/A 87.73% -34.63% -55.31% N/A -2.58% -4.49% N/A -34.32% N/A -23% -0.26% -8.41% -16.79% -55.36% -70.81% N/A -1.84% 12.19% 55.47% N/A 10.83% 72.96% -79.03% N/A -49.69% 4.37% 64.49% N/A -46.74% -32.76% N/A -4.77% N/A -30.05% -10.35% 109.4% 11.6% 66.5% 88.8% 2.6% 104.4% 30% 51.4% 12.5% 59.1% 60.9% -4.95% 123.1% -46.9% 225.6% 47.1% -77.2% -53.8% 130.9% 7.6% 17.1% -55.4% 60.5% 42.21% 13.92% 4.03% 5.84% -9.84% N/A 2.08% -10.36% -0.75% -47.22% 37.21% 28.19% 48.72% N/A -40.2% -52.76% -36.51% -45.85% 42.81% 18.46% N/A 198.94% -56.76% 17.09% 5.85% -34.27% 46.2% -49.1% 4.4% -59.9% -53.4% 49.5% -52.9% -30.9% -8.1% -24.7% 116.9% -76.3% 510.5% -24.5% -47.9% 125.21% -7.7% -60.5% -49.9% -48.71% 101.58% -36.4% 12.57% -52.83% 3.05% 6.13% 19.03% -27.91% -35.71% -36.99% -37.33% 93.68% -49.24% -53.46% 56.9% -52.29% -33.61% -40.43% 33.75% 159.97% -27.35% -49.05% -30.83% -59.14% 89.07% -55.96% -7.85% -22.52% 222.87% -15.3% -22.3% N/A -48% 48.74% -68% N/A -57.58% -48% -35.23% N/A 21.5% -52.8% -52.16% N/A -77.05% -64.6% N/A -54.2% N/A -71.1% -23.28% AZ CA CA CA CA CA CA CA CA CA CA CA CA CA CA CO CO CO CO ID NV UT WA ST MARKET WEST % CHANGE AVERAGE DAYS ON MARKET 2015–2016 2016–2017 2017–2018 2020–2021 2018–2019 2015–2021 2019–2020
2015-2021
NORTH % CHANGE AVERAGE SALE PRICE Kauai Kona Maui Oahu HAWAII MARKET AVERAGE Fairfield County Greenwich Chicago Boston Cape Cod Martha’s Vineyard Nantucket New Hampshire Morristown + Essex Hamptons New York Westchester County Philadelphia Rhode Island Vermont NORTH MARKET AVERAGE N/A N/A -3.92% -32.9% -18.41% N/A 14.75% N/A -38.04% N/A N/A N/A N/A N/A N/A N/A N/A N/A N/A N/A -11.65% N/A N/A 4.9% 0.07% 2.49% N/A 45.26% N/A 14.74% N/A N/A N/A N/A N/A N/A N/A N/A N/A N/A N/A 30% 116.3% -35.7% 18.1% -26.3% 18.1% 102.2% 3.2% 16.7% -14.1% 1.9% -22.9% 34.8% 39.5% -38.4% 61.4% 0.3% 14.3% -54.8% 41% 159.8% 22.99% 80.46% -1.88% 8.85% 103.33% 47.69% -53.05% -22.77% 23.04% -21.98% 2.33% N/A N/A N/A N/A N/A N/A 53.31% -5.37% N/A N/A -3.5% 58.3% 179.5% 72.6% 39.3% 87.43% 42.5% 15% 21.8% -45.6% 16.5% 32.7% 29.4% -3.1% 89.2% 52.6% -23.9% 40.9% 116.9% 73.4% 12.9% 31.41% -52.96% 14.31% -9.88% -33.33% -20.47% 42.79% 41.55% -38.28% 161.21% 1.79% 46.73% 41.73% 11.78% -5.48% 5.08% 57.63% -53.38% -4.21% 25.14% -22.3% 20.79% N/A N/A 101.5% -6.5% 47.5% N/A 116.3% N/A -32.3% N/A N/A N/A N/A N/A N/A N/A N/A N/A N/A N/A 42% HI HI HI HI CT CT IL MA MA MA MA NH NJ NY NY NY PA RI VT HAWAII % CHANGE AVERAGE SALE PRICE
Annual Change: Continued ST MARKET 2015–2016 2016–2017 2017–2018 2020–2021 2018–2019 2015–2021 2019–2020
101 | LUXURY HOMES INDEX Kauai Kona Maui Oahu HAWAII MARKET AVERAGE Fairfield County Greenwich Chicago Boston Cape Cod Martha’s Vineyard Nantucket New Hampshire Morristown + Essex Hamptons New York Westchester County Philadelphia Rhode Island Vermont NORTH MARKET AVERAGE HI HI HI HI CT CT IL MA MA MA MA NH NJ NY NY NY PA RI VT NORTH % CHANGE AVERAGE DAYS ON MARKET N/A N/A -16.09% 46.08% 15% N/A -29.26% N/A -30.34% N/A N/A N/A N/A N/A N/A N/A N/A N/A N/A N/A -29.8% N/A N/A 59.36% 72.2% 65.78% N/A -28.12% N/A -16.03% N/A N/A N/A N/A N/A N/A N/A N/A N/A N/A N/A -22.08% 79.3% 12.32% -16.2% -20.18% 13.81% -29.93% -0.7% 64.1% 46.3% -64% 41.8% 3.4% -52.29% -36.4% 4.7% N/A 72.6% 9.4% 60.8% -45.3% 5.32% 79.19% -7.94% -3.47% 33.05% 25.21% -7.27% 42.05% -23.91% 25.73% -32.47% N/A N/A N/A N/A N/A N/A -57.06% -46.69% N/A N/A -14.23% -77.52% -57.68% -69.6% -21.25% -56.51% 53.05% -41.5% -77.1% -52.3% -16.4% -71.8% 26.8% -60% -38.4% -77.7% N/A 11.2% -38.2% -66.4% -5.6% -32.45% -5.8% 95.86% 36.87% -42.86% 21.02% -23.36% -9.43 91.02% -14.52% 38.83% -3.32% -7.31% -48.29% -35.71% 19.82% 185.98% 4.37% -40.72% -25.80% -18.79% -54.72% N/A N/A -55% 20.1% -17.45% N/A -62% N/A -56.1% N/A N/A N/A N/A N/A N/A N/A N/A N/A N/A N/A -59.05% HAWAII % CHANGE AVERAGE DAYS ON MARKET ST MARKET 2015–2016 2016–2017 2017–2018 2020–2021 2018–2019 2015–2021 2019–2020
2015-2021
% CHANGE AVERAGE SALE PRICE
RatonDelrayBeachHighlandBeach Broward County Duval + St. Johns Counties Miami Naples Palm Beach (Proper) Sarasota + Manatee Counties Tampa Vero Beach Atlanta Nashville Dallas Houston Fairfax SOUTH MARKET AVERAGE OVERALL MARKET AVERAGE N/A N/A N/A -27.96% N/A 11.06% N/A N/A -11.45% 37.30% -7.48% -11.31% N/A N/A -1.64% -5.63% N/A N/A N/A 52.48% N/A 13.93% N/A N/A 3.28% -4.72% 56.78% 4.56% N/A N/A 21.05% 9.62% 23.5% 40% 23.7% 13.9% -24.7% 97.84% 23.5% 59.5% 28.8% 38.6% -11.3% 13% 21.3% 24.9% 26.61% 24.4% N/A N/A N/A -10.19% 28.35% -9.48% N/A 8.79% -9.25% 3.38% -12.61% 63.64% -24.46% N/A 4.24% 19.49% 266.8% 27% 16.9% 42.2% 50.9% 28.7% 8.2% 62.8% 68.8% -30.1% 116.3% 34.6% 13.6% 59.6% 54.74% 42.62% -2.14% 21.46% 10.67% 16.55% 9.37% -2.5% 38.69% -21.47% -1.46% 21.34% 54.77% -47.62% -9.15% -47.96% 2.9% 7.8% N/A N/A N/A 86.2% N/A 184.3% N/A N/A 77.8% 59% 276.3% 20.9% N/A N/A 117.42% 82.55% FL FL FL FL FL FL FL FL FL GA TN TX TX VA
Boca
SOUTH
Annual Change: Continued ST MARKET 2015–2016 2016–2017 2017–2018 2020–2021 2018–2019 2015–2021 2019–2020
Boca RatonDelray BeachHighland Beach
Duval + St. Johns
103 | LUXURY HOMES INDEX
Broward County
Counties
Naples
Beach
Counties Tampa Vero Beach Atlanta Nashville Dallas Houston Fairfax SOUTH MARKET AVERAGE OVERALL MARKET AVERAGE N/A N/A N/A -1.25% N/A 13.89% N/A N/A 41.33% 13.92% -31.34% 51.15% N/A N/A 14.62% 1.99% N/A N/A N/A 10.14% N/A 5.54% N/A N/A 14.75% 79.14% 81.54% -42.54% N/A N/A 24.76% 2.22% -1.5% -22% -7.4% 14.9% 34% -22.3% -27.9% 87.2% -41.3% 62.2% -14% 72.2% -21.3% 6.2% 8.5% 22.17% N/A N/A N/A -17.38% 30.67% 20.71% N/A -2.63% -63.64% -50.37% -55.56% 54.09% -30.3% N/A -12.71% 0.1% -63.5% 1.8% -64.9% 38.1% -55.8% 71.9% -41.6% 20.71% 11.5% -43.3% -48.87% 61.1% -11.9% -28.37% -10.94% -9.9% -17.51% -19.05% 18.6% -14.53% -10.71% 22.33% -34.71% -48.99% 253.5% -16.72% -1.69% -50.55% 33.61% 9.71% 8.81% -14.18% N/A N/A N/A 21.82% N/A -25.3% N/A N/A 36.43% -22.4% -76.1% 83.6% N/A N/A 3.01% -19.65% FL FL FL FL FL FL FL FL FL GA TN TX TX VA SOUTH
CHANGE AVERAGE DAYS ON MARKET ST MARKET 2015–2016 2016–2017 2017–2018 2020–2021 2018–2019 2015–2021 2019–2020
Miami
Palm
(Proper) Sarasota + Manatee
%
ABOUT SOTHEBY’S CONCIERGE AUCTIONS

105 | LUXURY HOMES INDEX
The World Leader
Sotheby’s Concierge Auctions is the largest luxury real estate auction marketplace in the world with 90%+ market share and one of the most comprehensive databases of highnet-worth property connoisseurs on the planet.
We’re Here to Help
We understand the traditional real estate model has limitations. And, we’re here to help. We match sellers of one-of-a-kind properties with the world’s most capable buyers via a stateof-the-art digital marketing, property preview, and bidding platform. Every single day.

107 | LUXURY HOMES INDEX
From Outsiders to Insiders To Innovators to Leaders
Our origin story began when CEO Laura Brady met President Chad Roffers back in 2004. Building on Chad’s experience in Silicon Valley and Laura’s time in corporate retail at Neiman Marcus, as a top-producing luxury real estate agent and broker, they came together to create a more efficient method for buying and selling the world’s finest homes.

In November 2021, Concierge Auctions was acquired by Sotheby’s, the world’s premier destination for fine art and luxury goods, and Anywhere Real Estate, Inc (NYSE: HOUS)., the largest full-service residential real estate services company in the United States, holding a joint 80 percent ownership stake.
Now Sotheby’s Concierge Auctions, the firm continues to operate independently, partnering with real estate agents affiliated with many of the industry’s leading brokerages to host luxury auctions for clients.
109 | LUXURY HOMES INDEX
Sell in 30 Days
We add unmatched exponential reach, speed, and certainty. In short, we help sellers accomplish in as little as 30 days what can otherwise take years.
Browse & Bid: 24/7
We know every luxury home and select only the best. One of every 20, to be exact. The result? Buyers have direct access to incredible deals on the world’s finest properties.
Earn Your Commission
Born out of the luxury real estate industry, we are an additional agent tool for high-end listings. In fact, we have never auctioned a property without a listing agent.


Key for Key
Every business has a responsibility to make a positive impact on the world. Our Key For Key® giving model guarantees for every home we sell, we build a home for a family in need. We believe in the empowerment and financial stability that comes with homeownership and its impact for generations.
111 | LUXURY HOMES INDEX
SOLD AT AUCTION
California
7695 Lahontan Drive — 22
Lake Tahoe, CA
Sold at Auction, Sale Pending
Stella Nova — 24
1400 Linda Flora Drive
Los Angeles, CA
Sold for $23.52M
Vista Ridge — 32
1087 Vista Ridge
Westlake Village, CA
Sold for $4.18M
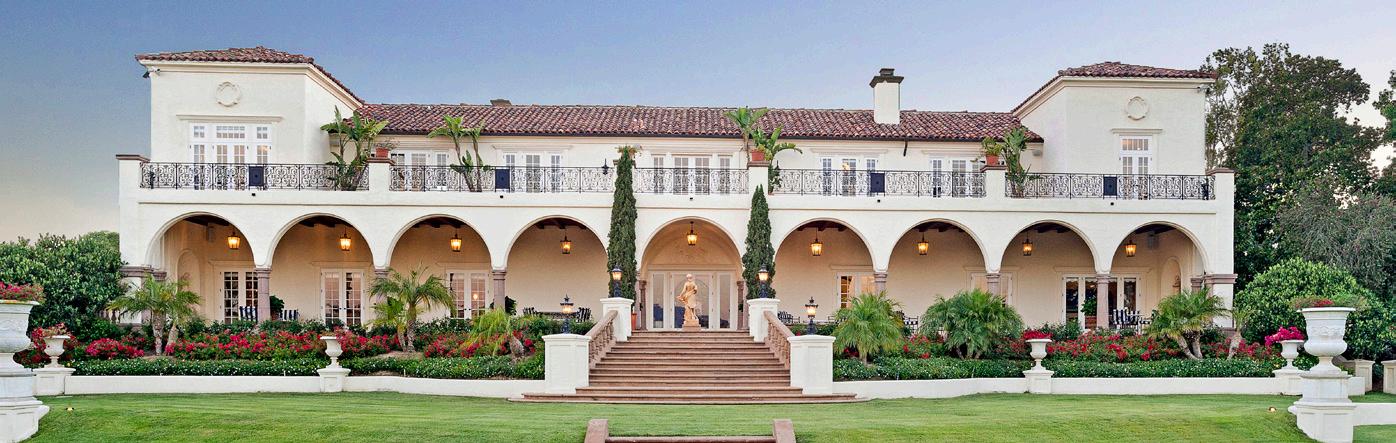
Villa Firenze — 34
67 Beverly Park Court
Beverly Hills, CA
Sold, Listed for $160M
121 Milford Drive — 42
Newport Beach, CA
Sold for $10M
Noci Healdsburg — 44
2836 Dry Creek Road
Sonoma County, CA
Sold for $3.752M
Deer Lodge — 50
6284 San Marcos Pass Road
Santa Barbara, CA
Sold, Listed for $14M
El Milagro — 57
5425 Los Mirlitos Street
Sold for $14.3M
535 Haynes Avenue — 66
Beverly Hills, CA
Sold for $7M
21900 Briarbluff — 68, 76 Malibu, CA
Sold for $3.905M
Ritz-Carlton Penthouse — 72, 107
690 Market Street, #2401
San Francisco, CA
Sold for $5.628M
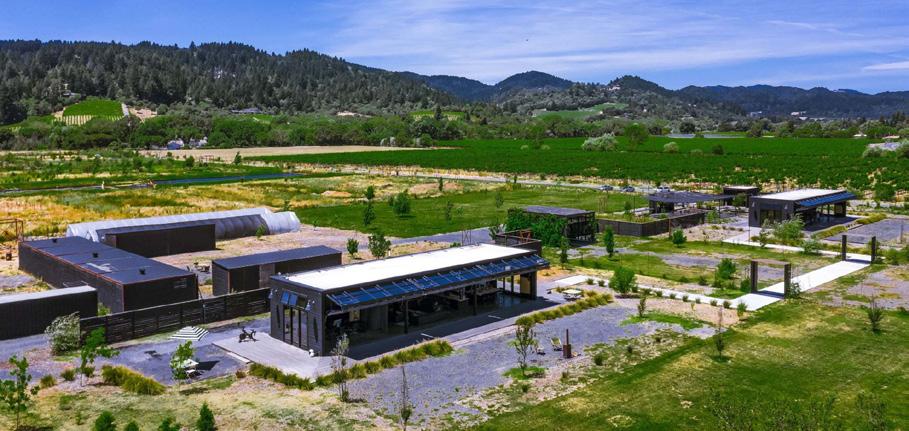
Anselmo Vineyard — 76
28740 Inwood Road
Inwood Valley, CA
Sold for $9.13M
Colorado
Pa Gomo — 9
680 Hawn Lane
Telluride, CO
Sold for $13.2M
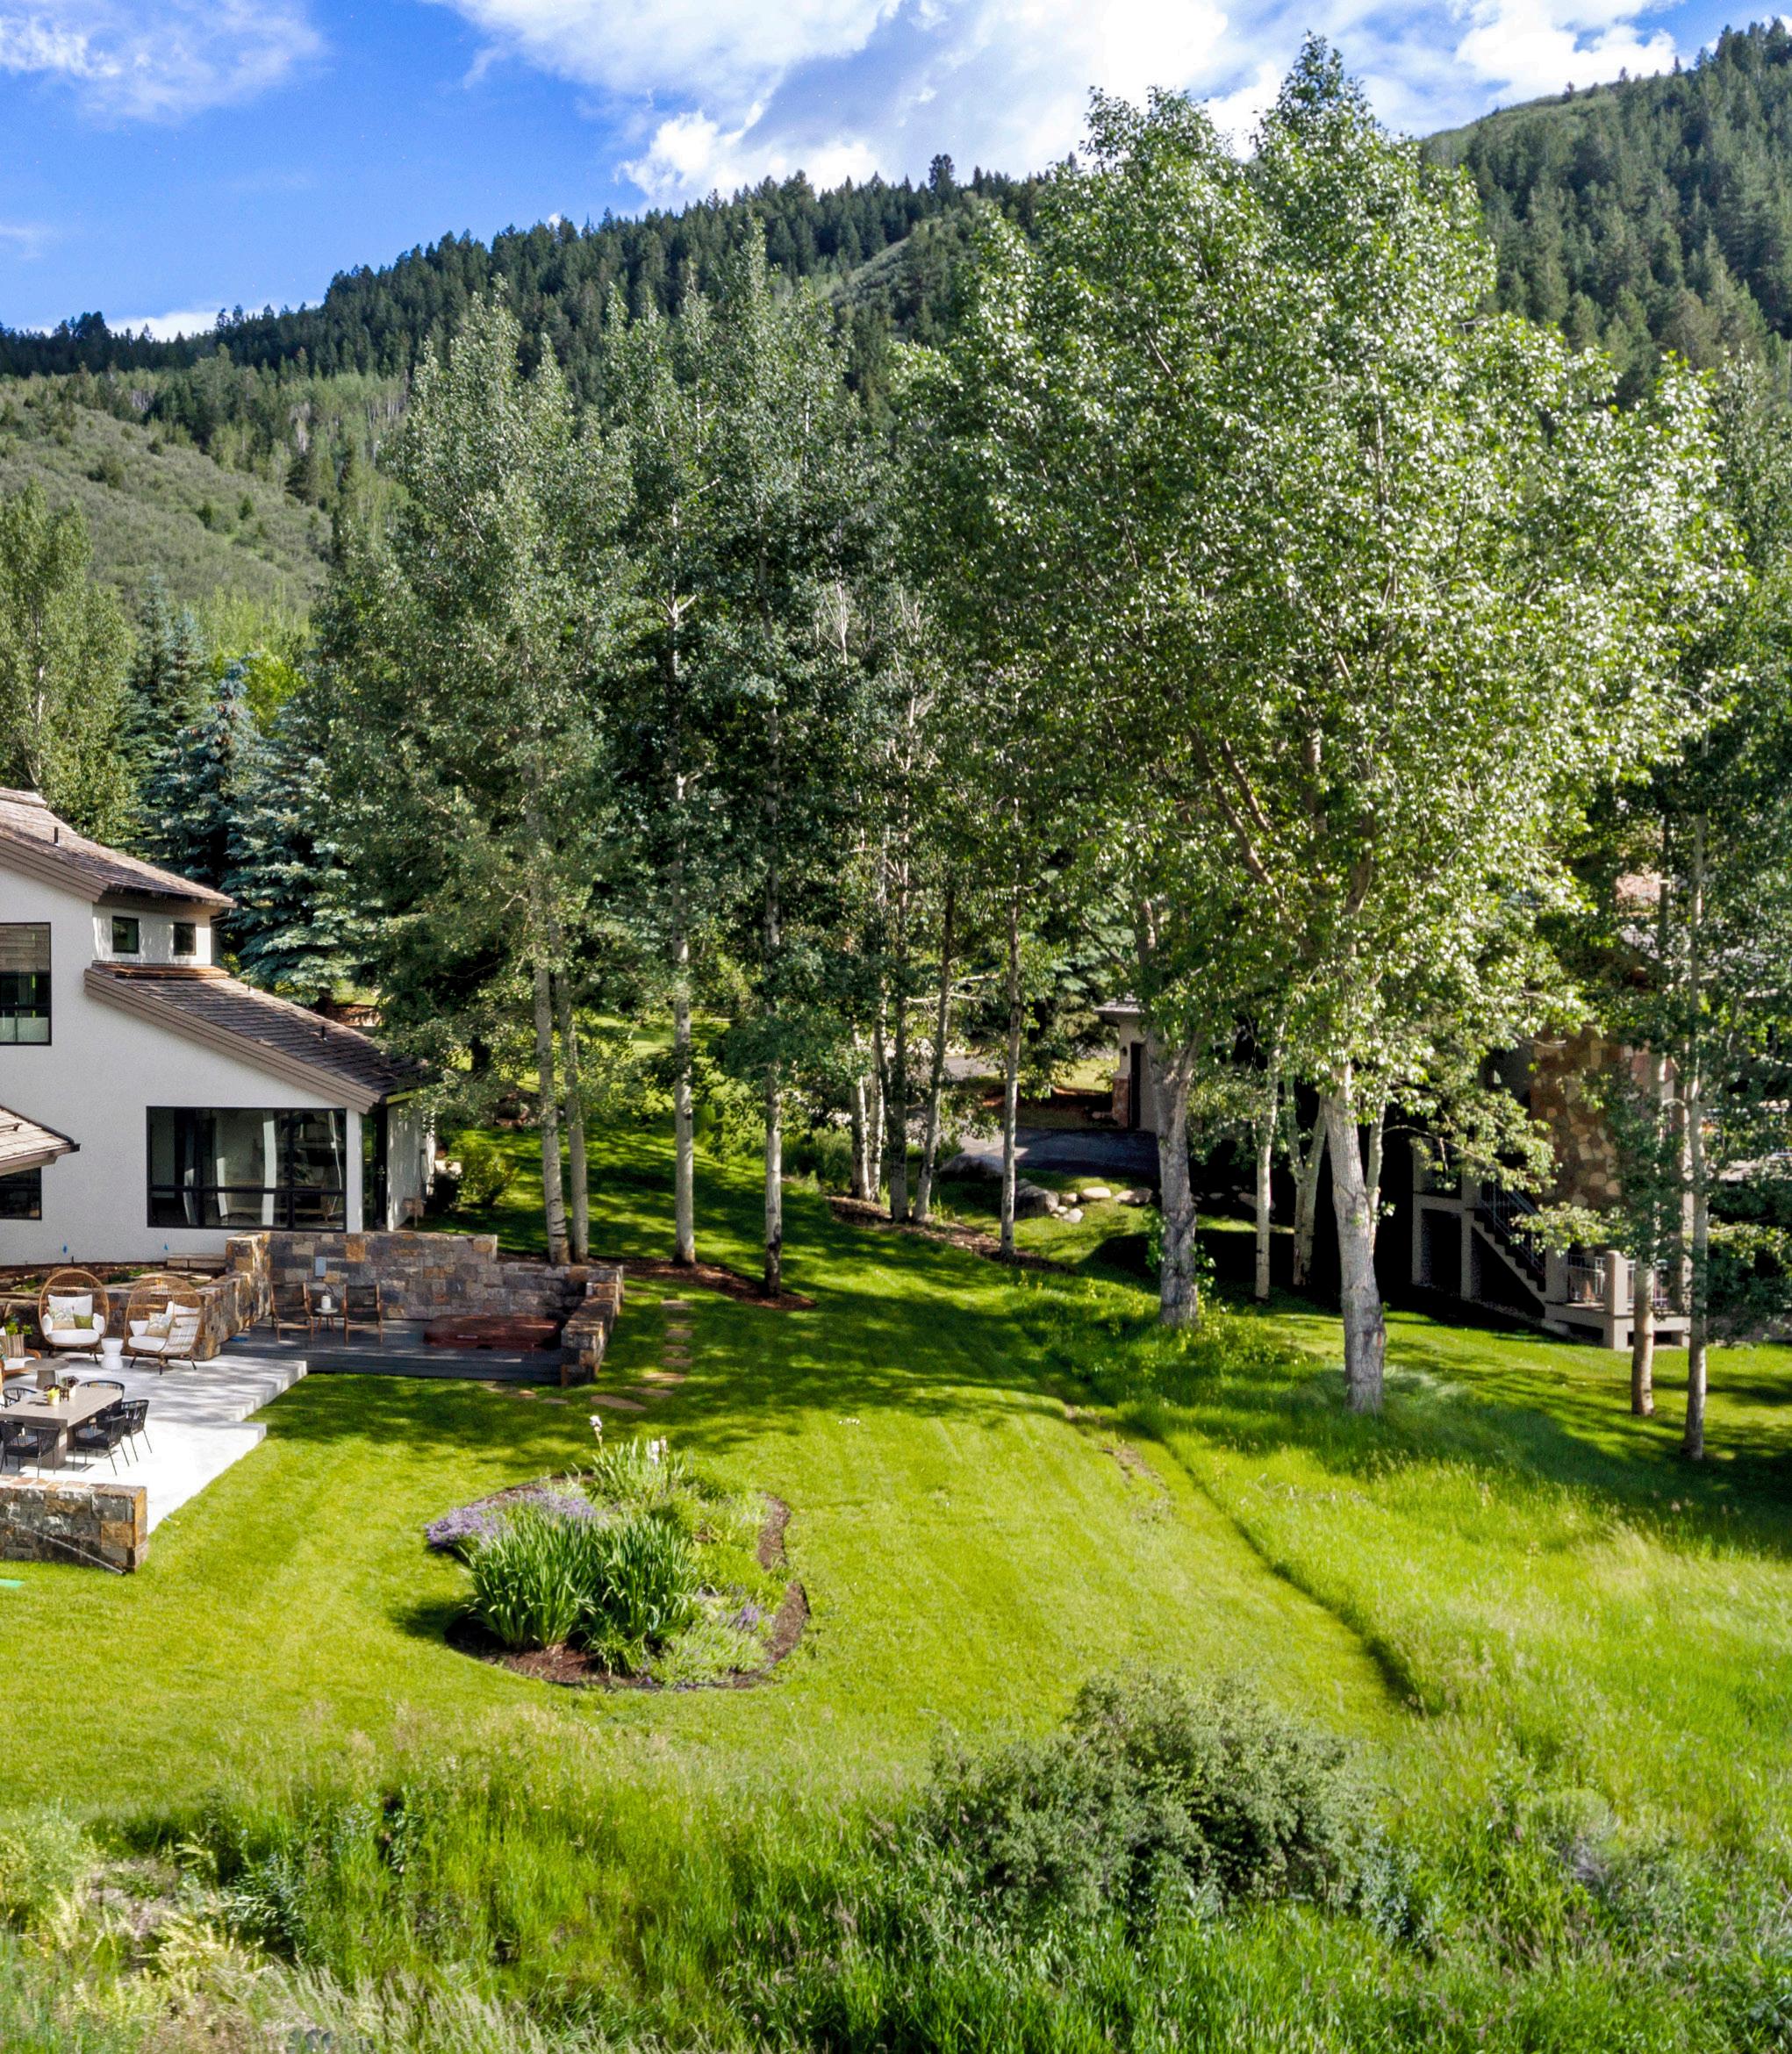
350 Eagle Park Drive — 14, Cover Aspen, CO
Sold for $21.5M
1055 Stage Road — 10, 12 Aspen, CO
Sold, Listed for $18.4M
322 & 324 East Bleeker Street — 58 Aspen, CO
Sold for $16.8M
Circle R Ranch — 62
3448 Woody Creek Road Aspen, CO
Sold for $16.8M
Domaine des Vaches Perdues — 64
318 Kicking Horse Trail
Club at Cordillera, Vail, CO
Sold for $5.264M
144 Castle Peak Gate — 74
Vail Valley, CO
Sold for $3.248M
Connecticut
405 North Cedar Road — 70
Fairfield County, CT
Sold for $1.232M
Florida
Playa Vista Isle — 7
935 & 939 Playa Vista Isle Hillsboro Beach, FL
Sold, Listed for $159M
41 Arvida Parkway — 8, 106 Miami, FL
Sold, Listed for $68M
2930 Hurlingham Drive — 18 Wellington, FL
Sold for $7.476M
Villa Peacock — 40 2131 South Bayshore Drive
Miami, FL
Sold for $6.6M
3940 Alhambra Drive West — 48
Jacksonville, FL
Sold, Listed for $6.995M
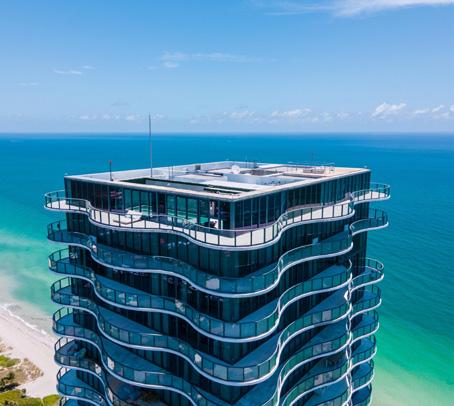
The Regalia Penthouse — 76, 104, 110 19575 Collins Avenue, #43
Miami, FL
Sold at Auction, Sale Pending
Georgia
1950 Lower Birmingham Road — 76
Atlanta Area, GA
Sold for $9.25M
Hawaii
Ola Pua Gardens — 37
Kauai, HI
Sold, Listed for $6.5M
Kona-Kohala Residence by Cher — 37
71-101 Lau Eki Place
Kailua-Kona, HI
Sold, Listed for $8.72M
Hale Ohia Kai — 108
77-230 Ke Alohi Kai Place
Kailua-Kona, HI
Sold for $2.805M
69-3916 Lanikeha Place — 111
Big Island, HI
Sold for $6.608M
Illinois
1S415 Sunnybrook Road — 52
Near Chicago, IL
Sold for $1.814M
Massachusetts
Henderson House — 30
Boston Area, MA
Sold for $5.6M
New Hampshire
Wild Horse Farm — 46
251 Kearsarge Mountain Road
Wilmot, NH
Sold for $2.475M
New Jersey
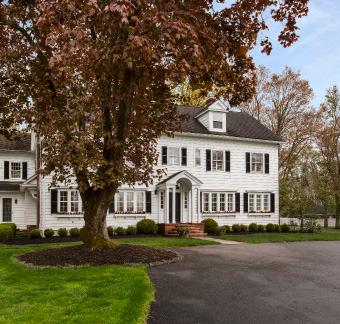
Tusculum Historic Estate — 28
166 Cherry Hill Road
Princeton, NJ
Sold for $5.5M
233 Carter Road — 76
Princeton, NJ
Sold for $1.6M
New York
The Kleeberg Residence — 20
3 Riverside Drive
New York, NY
Sold for $15.8M
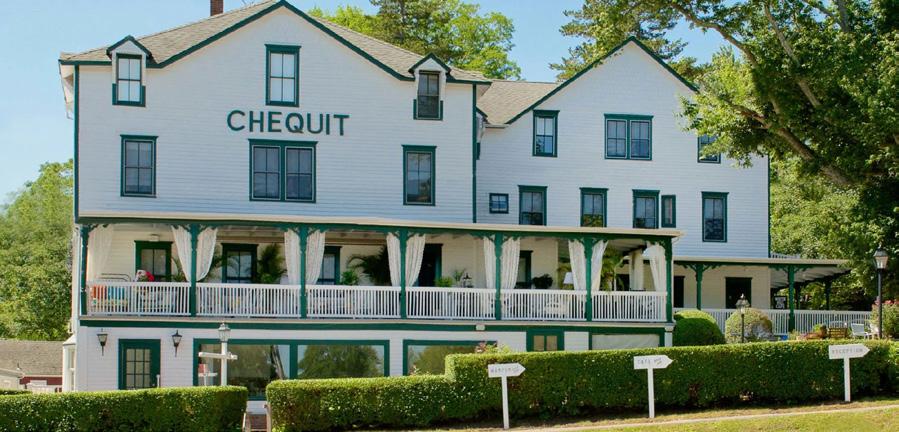
The Chequit Inn — 60 23 Grand Avenue
The Hamptons, NY Sold for $3.36M
Oregon
Nestucca Sea Ranch — 109
41900 Horizon View
Central Coast, OR
Sold, Listed for $7.998M
Pennsylvania
Arbor Hill — 26
7111 Sheaff Lane
Philadelphia Area, PA
Sold, Listed for $12M
Texas
Casa Belle Vista — 2
3816 Turtle Creek Drive
Dallas, TX
Sold, Listed for $8.9M
Walnut Place — 38 10000 Hollow Way Road
Dallas, TX
Sold for $38.9M
Utah
The Monastery — 5
8597 North Mandan Road
Sundance, UT
Sold for $5.04M
212 White Pine Canyon Road — 12
Park City, UT
Sold, Listed for $14.5M
Wyoming
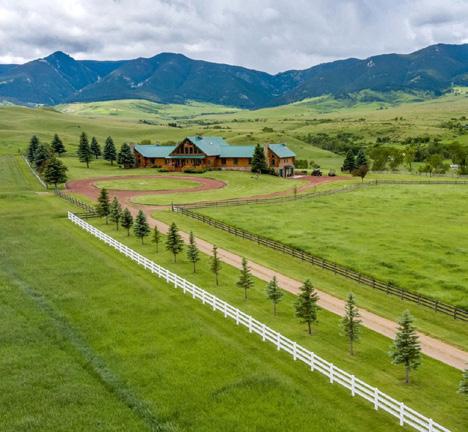
3500 West Highway 22 — 12, 97, Cover Jackson Hole, WY
Sold, Listed for $35M
Holy Cow Ranch — 76
43 Rapid Creek Road
Sheridan, WY
Sold, Listed for $23.5M
inquiries@casothebys.com | 212.658.1404
Concierge Auctions, LLC, dba Sotheby’s Concierge Auctions, is an auctioneer. Sotheby’s Concierge Auctions’ principal address is 650 Madison Avenue, New York, NY 10022, and its phone number is (212) 202-2940. If required, Sotheby’s Concierge Auctions (or its representative) is registered, licensed and/or bonded in the state where the property to be auctioned is located. Sotheby’s Concierge Auctions (in certain jurisdictions) and certain Sotheby’s Concierge Auctions subsidiaries, employees, and representatives may possess real estate broker or salesperson licenses in various jurisdictions and may, in some circumstances, perform functions that may be deemed brokerage services, neither Sotheby’s Concierge Auctions nor its agents, employees, and affiliates are acting as a broker in any capacity for any party in connection with this auction. Bidders must seek brokerage services or advice from their own real estate agents or professional advisers. Our brokerage licenses are held solely for compliance purposes to further our auctioneering services. Sotheby’s Concierge Auctions, the Listing Agent, the seller of the property and their respective agents, employees, and affiliates do not represent, warrant, or guarantee the accuracy or completeness of any information and shall have no liability for errors or omissions under any circumstances in this or any other property listings or advertising, promotional or publicity statements, and materials. This is not meant as a solicitation for listings or an offer to sell real property. Cooperating brokers are encouraged to participate as set forth in Sotheby’s Concierge Auctions bidder terms and conditions.