
8 minute read
FURTHER RECOMMENDATIONS | 86


Before treatment (2015) Post treatment (2016)

Knotweed before and after treatment on the South Fork Skykomish River (2015 and 2016).
A Look at Watershed-Scale Knotweed Management
King County Noxious Weeds Control Program
The mission of the Noxious Weed Control Program is to provide benefits to the environment, recreation, public health and economic resources of King County by preventing and minimizing harmful impacts of noxious weeds.
The King County Noxious Weed Control Program in Washington State has a multi-year grant-funded approach to knotweed management within target watersheds. It consolidates management and monitoring into Cooperative Weed Management Areas that are multi-jurisdictional projects on public, private and tribal lands. The program works with the Port of Seattle and all 39 cities and towns within King County to achieve comprehensive coordinated noxious weed control across all local jurisdictions.
In 2019, the program surveyed for knotweed on 105 river miles and has reduced the net area of knotweed on rivers by 73 percent since 2015, from 16.4 to 4.5 acres (net acres means the area covered if the knotweed plants were all combined in one place instead of spread out over 154 acres). Private landowners who own riparian areas are key to the success of the project. They can voluntarily give permission for their land to be included in the program. This approach has been effective in starting knotweed management high in the watershed then working downstream to limit the vegetative spread of the plant into treated areas.


Infestations by Property Types Percent of sites in each category
The success of the program occurs by treating private properties since they make up half of the sites in the watershed with infestations (King County Noxious Weed Control Program).
APPENDIX A: MAP DATA SOURCES
This report relies on spatial data from a variety of sources, documented on the following pages. Data layers were often clipped, combined, or processed to display their current information.

Mohawk Trail Woodlands Partnership Geographic Area
Highlights where the 21 towns within the geographic focus of the MTWP and the two main watersheds, the Hoosic River and Deerfield River, intersect. Data layers and sources include:
MassGIS Bureau of Geographic Information: • Natural Resource Conservation Services (NRCS)
Hydrologic Unit Code (HUC) Basins (8, 10, 12) • Municipalities Pages: 6, 35

Six-town Focus Area and Deerfield River Watershed
Shows the six-towns on which this report focuses on related to their position in the Deerfield River watershed. Data layers and sources include:
MassGIS Bureau of Geographic Information: • NRCS HUC Basins (8, 10, 12) • Municipalities Page: 8

Agricultural Land Use
Shows agricultural land use, specifically cultivated land, pasture/hay, and grassland. Data layers and sources include:
MassGIS Bureau of Geographic Information: • Massachusetts Department of Environmental
Protection (MassDEP) Hydrography (1:25,000) • Municipalities • World Hillshade
NOAA: Data Access Viewer • Land Cover 2016
ESRI Living Atlas: • Light Gray Canvas Base (WGS84) Pages: 21, 85


Land Ownership
Indicates various types of land ownership within the sixtown focus area. Data layers and sources include:
MassGIS Bureau of Geographic Information: • MassDEP Hydrography (1:25,000) • Municipalities • Property Tax Parcels • Protected and Recreational Open Space ESRI Living Atlas: • Light Gray Canvas Base (WGS84) Page: 24
1830 Forest Cover
This map shows historic forest cover in the 1830s. Data layers and sources include:
MassGIS Bureau of Geographic Information: • MassDEP Hydrography (1:25,000) • World Hillshade
Harvard Forest (Foster, D. and Motzkin, G.) • 1830 Map of Land Cover and Cultural Features in
Massachusetts
Page: 18
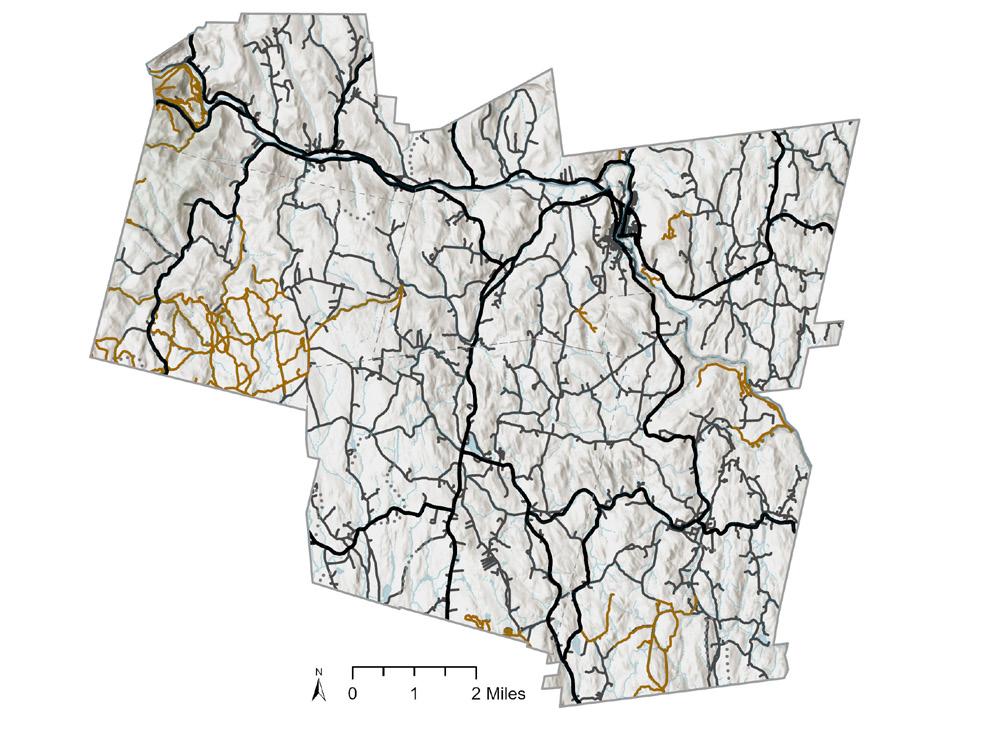
Current Roads
This map shows the major and minor roads, and trails in the six-towns. Data layers and sources include: MassGIS Bureau of Geographic Information: • MassDEP Hydrography (1:25,000) • Massachusetts Department of Transportation (MassDOT) Major Roads • Department of Conservation and Recreation (DCR)
Roads & Trails • Tracks and Trails (2001) • Census 2010 Tiger Roads • World Hillshade
ESRI Living Atlas: • Light Gray Canvas Base (WGS84) Page: 23


Deerfield Watershed
Sub HUC 12 watersheds and impaired rivers. Data layers and sources include:
MassGIS Bureau of Geographic Information: • MassDEP Hydrography (1:25,000) • DEP 2018 Integrated List Rivers layer from
MassDEP 2018/2020 Integrated List of Waters (305(b)/303(d)) • NRCS HUC 12
Pages: 35
Stream Order
Showing steep, high-order streams to low-order (4th - 6th order) streams. Data layers and sources include: MassGIS Bureau of Geographic Information: • World Hillshade
Stream Crossings Explorer: • Stream Order
Pages: 37
Channel Erosion Vulnerability
Potential vulnerability for banks to erode due to flow velocity, grade and surficial geology. Data layers and sources include:
MassGIS Bureau of Geographic Information: • NRCS HUC Basins (8, 10, 12)
MassDOT: • Stream Channel Erosion Vulnerability (Unpublished) Pages: 39


Dams and Culverts
Data layers and sources include:
MassGIS Bureau of Geographic Information: • Dams, sorted by Hazard Code Stream Crossing Explorer: • Crossings, sorted by max_rof Pages: 40
Fish Passage Barriers
Shows barriers for fish to migrate upstream highlihgting moderate to severe barriers. Data layers and sources include:
This dataset is the consensus anadromous fish prioritization of in-stream barriers from the North Atlantic Aquatic Connectivity Collaborative’s Northeast Aquatic Connectivity project: • Fish Passage Barriers
Pages: 42
Forest Cover
This map shows the forest cover on the Deerfield River watershed. Data layers and sources include:
ESRI, ArcGIS Map Service • World Imagery • WorldElevation3D/Terrain3D/ImageServer Page: 27


Soil Drainage
This map shows the soil drainage in the six-towns. Data layers and sources include:
MassGIS Bureau of Geographic Information: • MassDEP Hydrography (1:25,000) • Soils SSURGO-Certified NRCS • Top 20 Soil Drainage Class ESRI Living Atlas: • Light Gray Canvas Base (WGS84) Page: 20
Prime Farmland Soils and Soil Drainage
This map shows prime farmland soils layered on top of the drainage map. Data layers and sources include:
MassGIS Bureau of Geographic Information: • MassDEP Hydrography (1:25,000) • Soils SSURGO-Certified NRCS • Prime Farmland Soils • Top 20 Soil Drainage Class • World Hillshade
ESRI Living Atlas: • Light Gray Canvas Base (WGS84) Page: 20
Impervious Surfaces
This map shows the impervious surfaces in the six-towns. Data layers and sources include:
MassGIS Bureau of Geographic Information: • MassDEP Hydrography (1:25,000) NOAA: Data Access Viewer • Land Cover 2016
ESRI Living Atlas: • Light Gray Canvas Base (WGS84) Page: 22
APPENDIX B: LAND COVER DEFINITIONS
The following land cover categories were used to prioritize plantable parcels in the site selection toolkit. Definitions are included verbatim from the Coastal Change Analysis Program’s High-Resolution Land Cover Classification Scheme.
Highest Priority
Developed, Open Space
Contains areas with a mixture of some constructed materials, but mostly managed grasses or low-lying vegetation planted in developed areas for recreation, erosion control, or aesthetic purposes. These areas are maintained by human activity such as fertilization and irrigation, are distinguished by enhanced biomass productivity, and can be recognized through vegetative indices based on spectral characteristics. Constructed surfaces account for less than 20 percent of total land cover.
Medium Priority
Pasture/Hay
Contains areas of grasses, legumes, or grass-legume mixtures planted for livestock grazing or the production of seed or hay crops, typically on a perennial cycle and not tilled. Pasture/hay vegetation accounts for greater than 20 percent of total vegetation.
Cultivated Crops
Contains areas intensely managed for the production of annual crops. Crop vegetation accounts for greater than 20 percent of total vegetation. This class also includes all land being actively tilled.
Grassland/Herbaceous
Contains areas dominated by grammanoid or herbaceous vegetation, generally greater than 80 percent of total vegetation. These areas are not subject to intensive management such as tilling but can be utilized for grazing.
Low Priority
Scrub/Shrub
Contains areas dominated by shrubs less than 5 meters tall with shrub canopy typically greater than 20 percent of total vegetation. This class includes tree shrubs, young trees in an early successional stage, or trees stunted from environmental conditions.
Palustrine Scrub/Shrub Wetland
Includes tidal and nontidal wetlands dominated by woody vegetation less than 5 meters in height, and all such wetlands that occur in tidal areas in which salinity due to ocean-derived salts is below 0.05 percent (0.5 ppt). Total vegetation coverage is greater than 20 percent. Species present could be true shrubs, young trees and shrubs, or trees that are small or stunted due to environmental conditions.
Palustrine Emergent Wetland (Persistent)
Includes tidal and nontidal wetlands dominated by persistent emergent vascular plants, emergent mosses or lichens, and all such wetlands that occur in tidal areas in which salinity due to ocean-derived salts is below 0.05 percent (0.5 ppt). Total vegetation cover is greater than 80 percent. Plants generally remain standing until the next growing season.
Estuarine Scrub/Shrub Wetland
Includes tidal wetlands dominated by woody vegetation less than 5 meters in height, and all such wetlands that occur in tidal areas in which salinity due to ocean-derived salts is equal to or greater than 0.05 percent (0.5 ppt). Total vegetation coverage is greater than 20 percent.


