
Phoenix, AZ Multifamily Forecast Report • Employment, 3rd best performing Top 10 Large Metro in September (BLS) • Rents continued to rise +9.9% to $1,682 • Occupancy remains above long-term average at 95.8% • Deliveries of +/-12,000 expected by end of 2022 • Average Sales PPU increased +7% to $315,858 KEY TAKEAWAYS 2022 3
Overall, from May 2020 to September 2022, Phoenix moved up a notch to #2 (from #3) of the large metros with 136% of total jobs added/recouped. Over-the-month readings increased +0.9% or 21,700 jobs with year-over-year readings showing a +4.1% increase or 92,300 jobs. Phoenix’s nonfarm payroll jobs total as of September 2022 is 2,323,100 and not only has Phoenix recovered the losses stemming from Covid
89,600.
New York -1,896,400 1,771,100 93% Los Angeles -1,054,200 969,500 92% Chicago -607,400 664,600 109% DFW -426,800 717,900 168% Houston -359,400 452,800 126% Washington D.C. -390,100 358,500 92% Philadelphia -480,500 493,100 103% Atlanta -390,400 517,300 133% Miami -451,600 505,200 112% Phoenix -252,200 341,800 136%
Nonfarm Employment Losses Mar’20-Apr’20 Gains May’20-Sep’22 % Recouped Total U.S. Nonfarm (millions) -22,362 22,857 102% Top 10 Largest MSAs by Population
TOP 10 MSA’s SOURCE: BLS, CES, Colliers Research KEY METRICS & EMPLOYMENT OCCUPANCY PERFORMANCE 95.8% Y F AVERAGE RENT $1,676 Y F TRADE OUT (new) 11.5% Y F TRADE OUT (renewal) 13.7% COMPLETED (recent) CONSTRUCTION 2,752 PLANNED 29,426 Y UNDER (construction) 37,351 TO STABILIZATION 19 Y F Y F AVG SALES PPU SALES $315,858 SALES VOLUME $2.39B Y F Y Y - Year-over-year | F - Forecast F Y F Y F F
but has exceeded those losses by +4.0% or
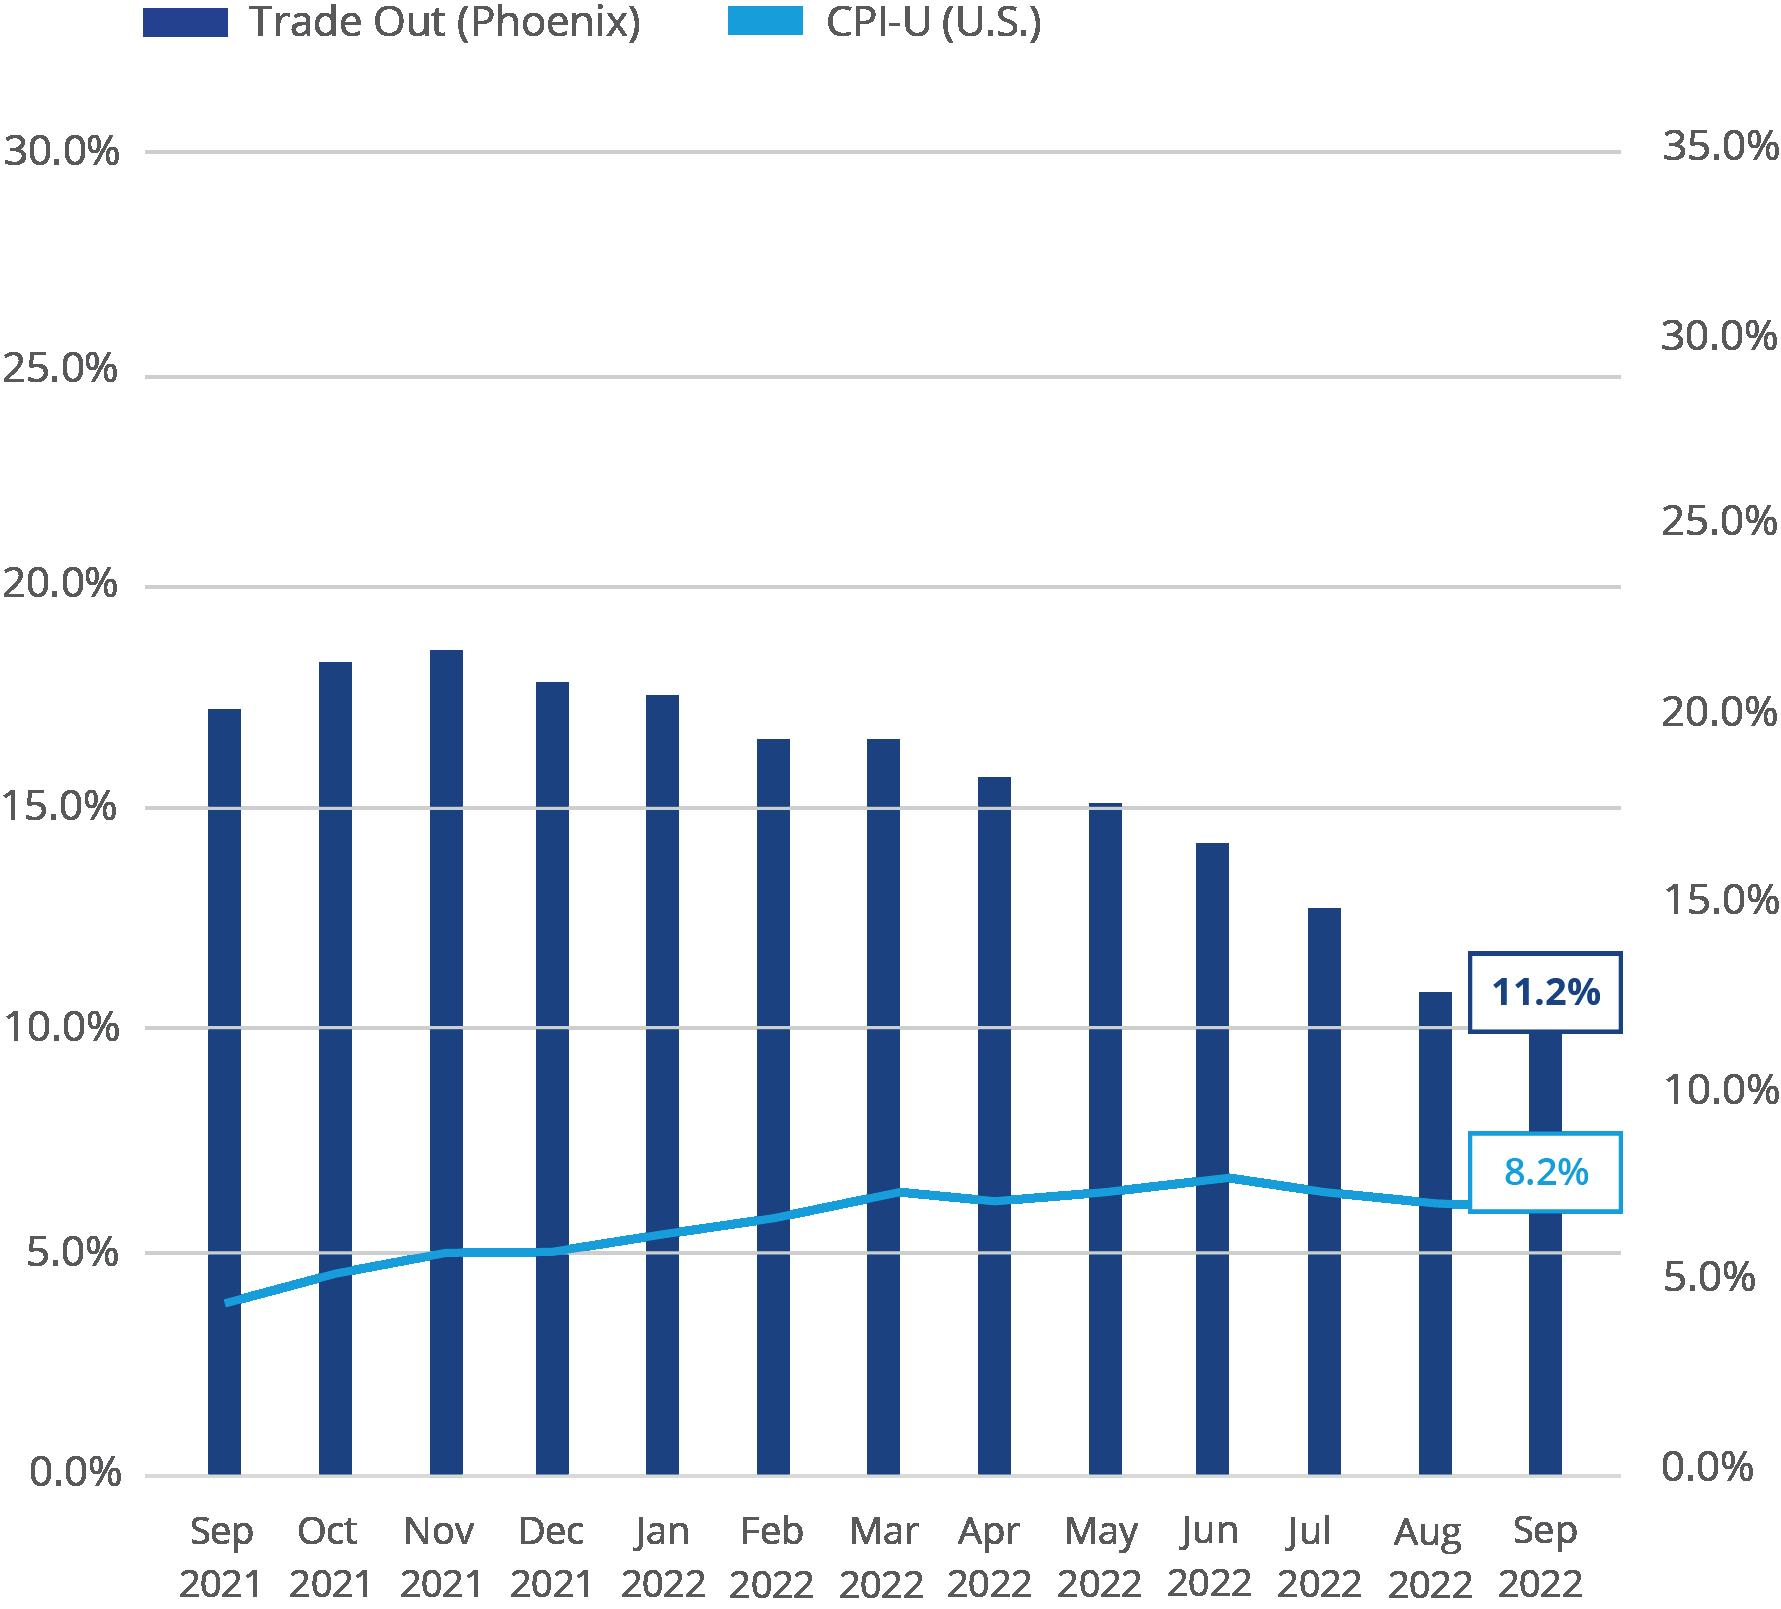
INFLATION VS. TRADE OUT
Inflation
For the U.S., since the beginning of the year, y/y Trade Outs have averaged +8.3%. For metros across the Sun Belt, Phoenix in this instance, that number is higher with an average of +10.8%. Trade Outs in Phoenix had been steadily rising from the Pandemic induced low of +2.8% in June 2020 and peaked in November 2021 at +21.2%. Phoenix’s current trade out rate, as of September 2022, is +11.2% and 40bps above the 10.8% average since 2019.
Trade Out
Trade-Out measures what rents sign for compared to the previous lease for the same unit (new or renewal) and is a primary rubric for assessing current pricing. One of the main characteristics of multifamily real estate, as opposed to office, retail or industrial, is that the time between new/renewal of leases typically occurs every year. As such, multifamily operators have a greater ability to adjust to changing market conditions on a more ‘real time’ basis. While real time adjustments from shorter leases can hurt in a rapidly deflating, or over-built, markets; in a high-to-hyper-inflationary environment that’s marked by low supply, such as the one we are in, has allowed multifamily operators to generally stay ahead of the inflationary effects on money.
INFLATION 8.2% Y F TRADE OUT (renewal) 13.7% TRADE OUT (new) 11.5% Y F Y F
Inflation (CPI-U) v Trade Out (%) | Sep 2021 - Sep 2022
RENT/OCCUPANCY
Average rent for Greater Phoenix continued its upward slope rising +9.9% year-over year to $1,682 and up over-the-quarter by +0.4%.
Occupancy for the region was 95.8% or 160 bps lower year-over-year. This marks the 9th consecutive quarter occupancy has been above the 5-Year Moving Average of 95.4%, and 43rd consecutive quarter above the 20-Year Moving Average of 91.6%.
From the beginning of the year, over-the-quarter rent growth has averaged +1.7% for Greater Phoenix as a whole. Class A has averaged +1.4%, Class B at +1.5%, and Class C at +5.7%. Asking rents in Class A buildings increased +9.6% year-over-year to an average of $1,986, which is $304 higher than the market average. Class B and C properties witnessed +9.2% (to $1,663) and +23.1% (to $1,408) year-over-year rent increases respectively.
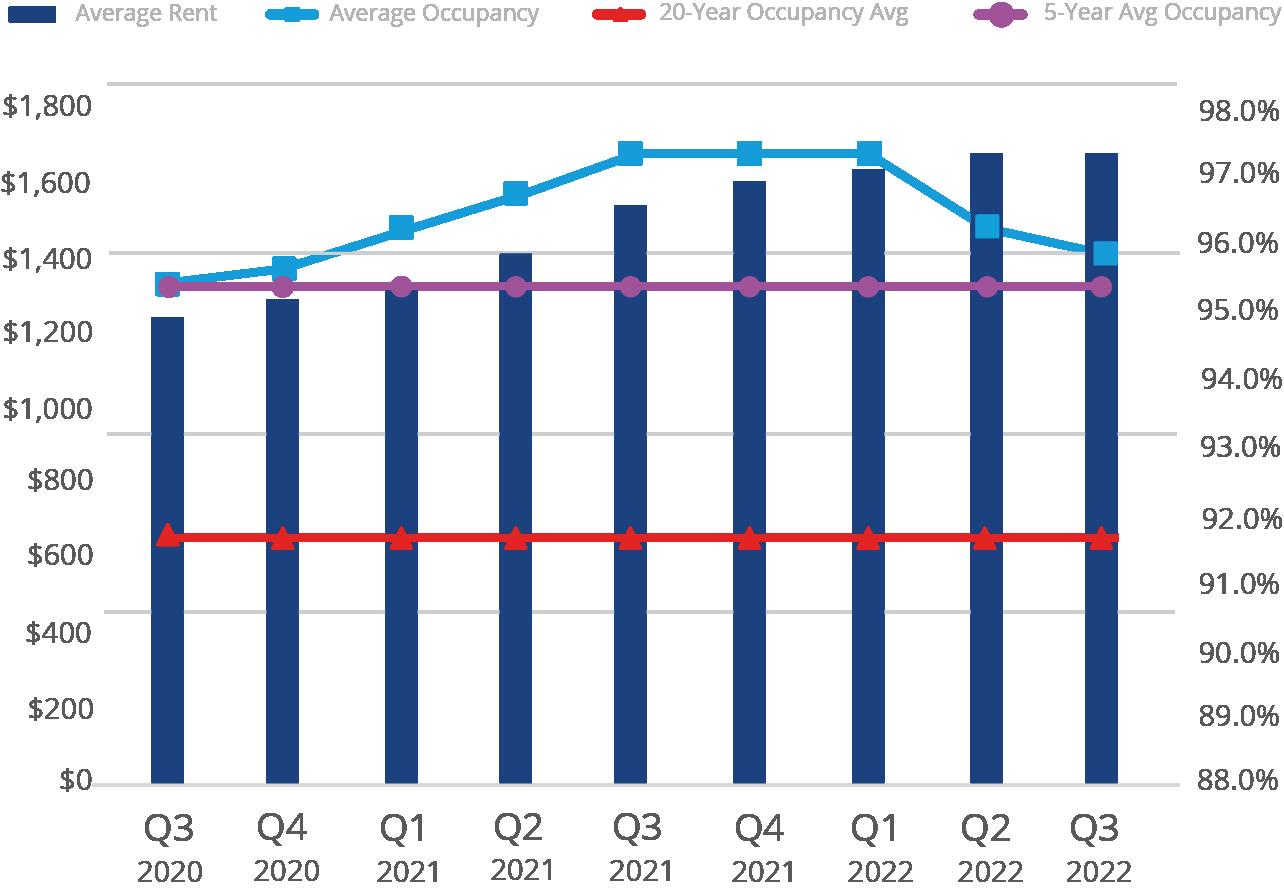
RENT CLASS A $1,986 OCCUPANCY 94.5% Y F Y F RENT CLASS B $1,663 OCCUPANCY 94.5% Y F Y RENT CLASS C $1,408 OCCUPANCY 94.8% Y F Y F RENT BTR-SFR $2,312 OCCUPANCY 96.0% Y F Y F
Average Rent/Occupancy Trailing 24 Months (Now Includes BTR-SFR)
F
(50+, Market Rate & BTR-SFR)
343,489
Total Inventory as of Q3 2022
4.1%
Inventory Change Est. 2022
PRE-LEASE ABSORPTION
Pre-lease absorption rates ended Q3 with an average of 12 units per property per month. Based on the average number of units under construction per property and assuming 90% occupancy for stabilization; current delivery-to-stabilization period is 19-months and within the target 18-to-24month stabilization rubric used by developers.
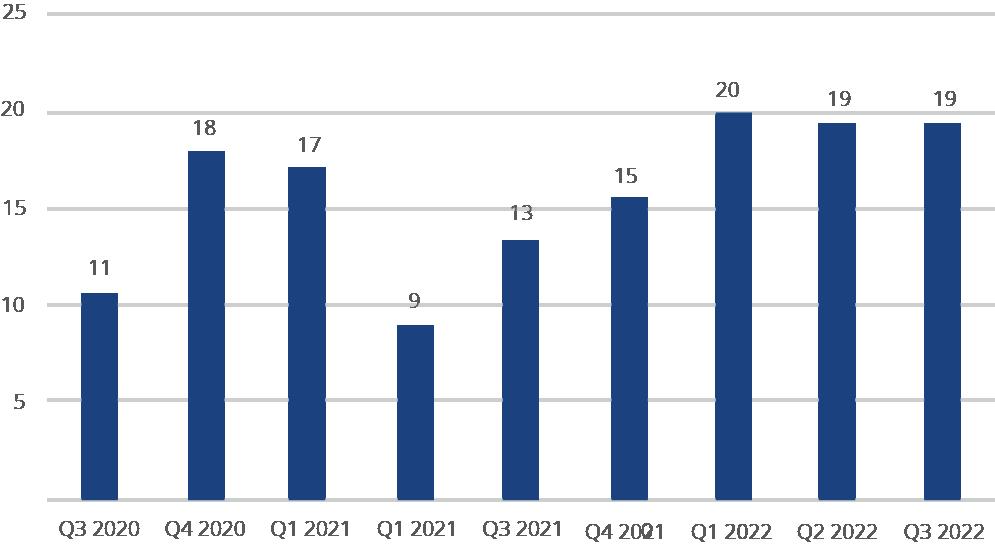
Phoenix MSA | Months-to-Stabilization
CONSTRUCTION
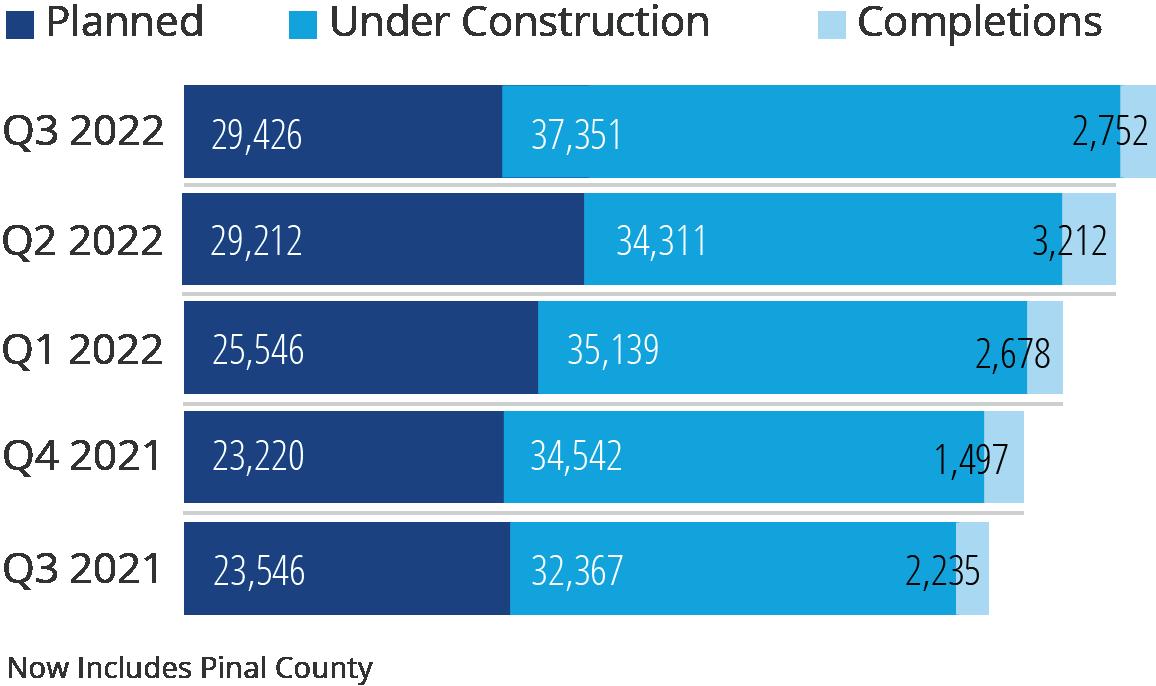
Planned Development continued to increase rising +25% year-over-year to 29,426 units but lower then Q3 2020’s high of 31,458. Actual projects under construction increased +15.4% in over-the-year readings to its current 37,351-unit amount. Despite elevated construction deliveries, occupancy remains significantly elevated at 95.8% which is 420 bps above the 20Year Average. Assuming all 12,000 units that are projected to be completed by end of 2022 were delivered vacant, occupancy would still be above Phoenix’s 20-year occupancy average.
Multifamily Construction (50+)
 SOURCE: Colliers Research
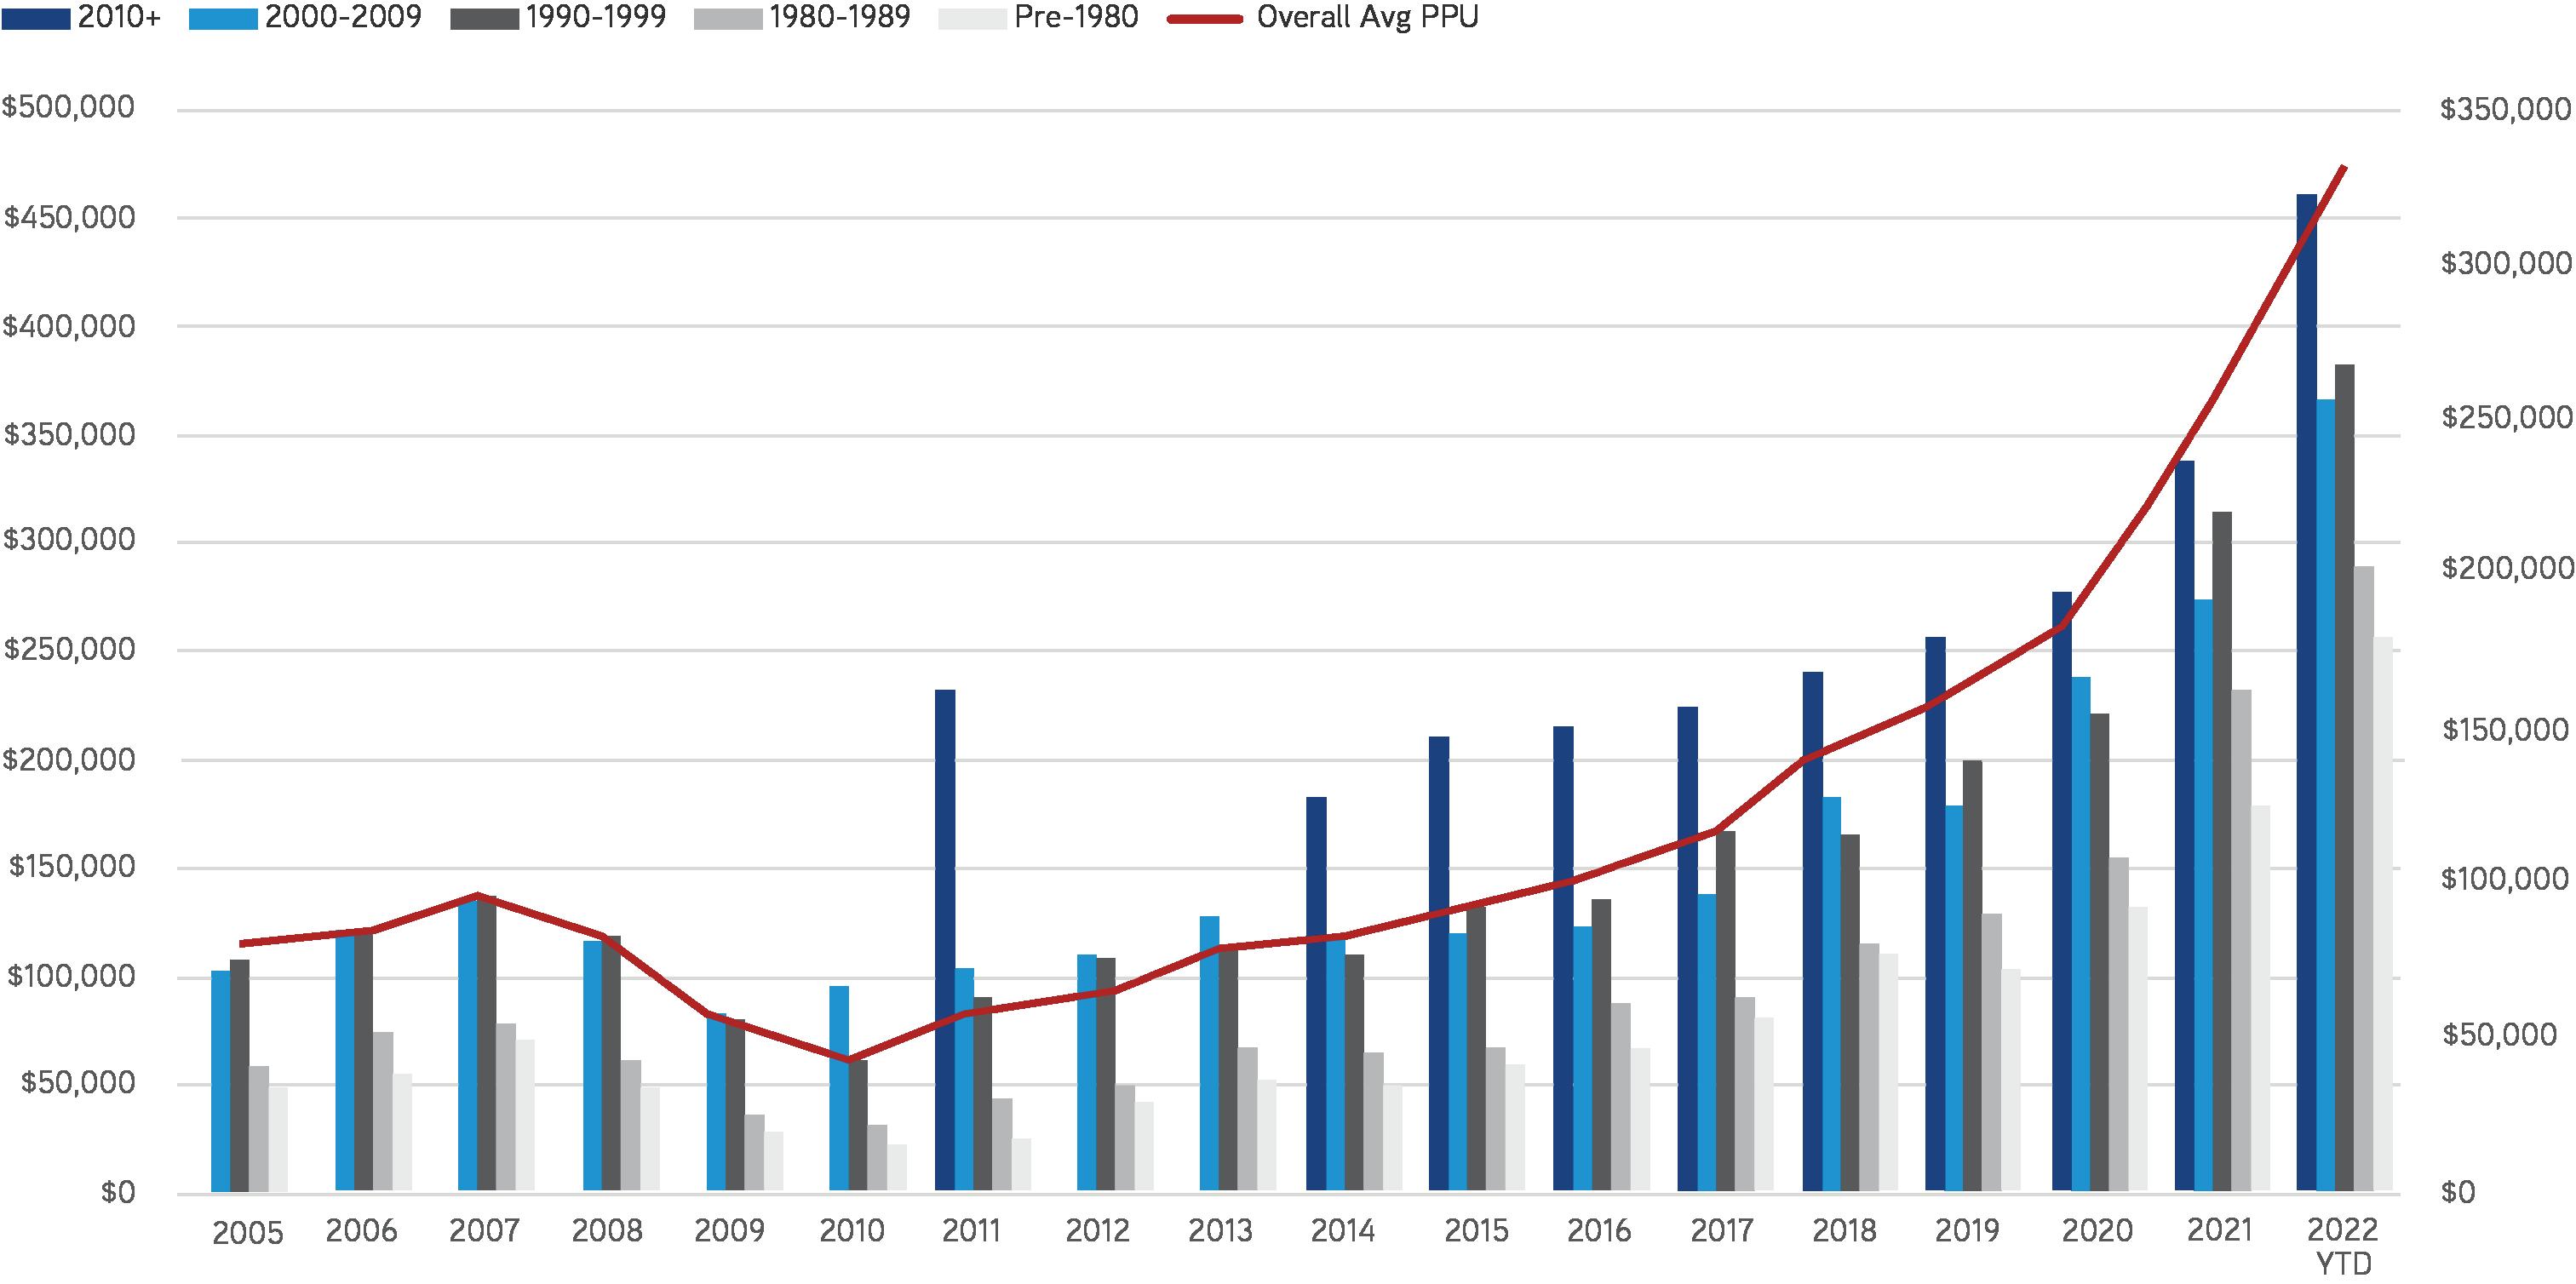
Market Rate, Non-Student/Senior, Q3 Only Property Sold $/Unit Closed Built Skywater at Town Lake $160,000,000 $487,805 07/01/22 2015 Capri on Camelback $143,000,000 $257,194 08/17/22 1970 Azul at Spectrum $138,221,000 $383,947 09/15/22 2007 TOP 3 DEALS Q3 2022 | Summary of Multifamily Sales (100+ Units) Transactions 33 Sales (down 37% year-over-year) Total Sales Volume $2,392,625,000(down 37% year-over-year) Average Price/Unit $315,858 (up7% year-over-year) INVESTMENT SALES (100+) Phoenix MSA (100+) | Avg. Price Per Unit by Vintage 10Y TREASURY 3.83% Y F FREDDIE MAC PMMS 6.70% 30-YR FRM Y F
PERMITS, MF & SFR
Total housing permits for August 2022 came in at 3,257 with trailing 12-months at 48,706. As a reminder, Phoenix is still considerably lower than last cycle’s peak total housing permits of 68,402 units. Trailing 12-month multifamily permit totals are 16,871 and have been trending 15,000+ since November 2021. Current deliveries have been hovering around 10,000 new units since February 2020. We estimate that approx. 80% of permits are delivered in traditional space with a lag, which puts annual deliveries increasing to around 12,000 heading into 2023. If inventory increases to 12,000 new units added to supply, that will still be below our needed demand based on population growth.
OUTLOOK – ON RATES, “TRILEMMAS” & PIVOTS
Total US Nonfarm payrolls increased by 263,000 in September, compared with the Dow Jones estimate of 275,000. The unemployment rate dropped, slightly, to 3.5% as the labor force participation edged lower. US nonfarm employment now exceeds pre-Covid employment by 0.3% or 495,000. The Greater Sun Belt region, including Phoenix, has generally recovered faster than the rest of the country with Phoenix, #2 of the largest metros, along with DFW (#1), Atlanta (#2), Houston (#4) and Miami (#5).
Nationally capital markets, in response to rising rates particularly in construction debt, have witnessed significant lender pullback. If sustained, higher rates should mean more renters, or perhaps, renters for longer. While job growth and recession worries have increased; regions, particularly those in the Sun Belt
Southeast, have and are continuing to benefit from increased reshoring and Foreign Direct Investment (FDI) activity. As such regionalized job creation and net domestic migration should continue to serve as a market tailwind.
Nonetheless, all eyes are now firmly affixed on the Federal Reserve and what its next steps will be. Blackrock CEO, Laurence Fink, has stated his firm’s expectation is that Powell will announce another 75bps hike followed by two smaller ones before a pause around 4.75% which is in line with the market that’s pricing in a terminal rate of +/-4.74% in May 2023.
2000 2001 2002 2003 2004 2005 2006 2007 2008 2009 2010 2011 2012 2013 2014 2015 2016 2017 2018 2019 2020 2021 2022
0 SFR MF
80,000 70,000 60,000 50,000 40,000 30,000 20,000 10,000
Permits SFR vs MF | 2000 - Q203 2022
T-12 SF PERMITS 31,875 Y F T-12 MF PERMITS 16,871 Y F
Thomas M. Brophy, National Director of Research & Analytics Thomas.Brophy@colliers.com +1 602 222 5057 Colliers | Arizona 2390 E Camelback Rd. Ste. 100, Phoenix, AZ 85016 +1 602 222 5000 colliers.com/arizona Copyright © 2022 Colliers International. The information contained herein has been obtained from sources deemed reliable. While every reasonable effort has been made to ensure its accuracy, we cannot guarantee it. No responsibility is assumed for any inaccuracies. Readers are encouraged to consult their professional advisors prior to acting on any of the material contained in this report.
