
Multifamily
Employment, rose
y/y
Rents rose
$1,186
Occupancy was
Construction currently
units
Average Sales PPU increased
$196,367
TAKEAWAYS 2022 3
Tucson, AZ
Forecast Report •
+1.9%
•
+12.8% to
•
94.8% •
1,004
•
4.1% to
KEY
Overall, from May 2020 to September 2022, Tucson recouped 86% of total jobs lost due to the pandemic. Tucson registered a 2,200 increase, or +0.6% m/m, year-overyear Tucson witnessed a +1.9% increase. Total nonfarm payroll jobs as of September 2022 is 391,100 which is only 1.6%, or 6,400 jobs, off pre-Pandemic employment of 397,500 in February 2020. If the current recovery holds, employment normalization should be achieved by end of 2022.
Nonfarm Employment Losses Mar’20-Apr’20 Gains May’20-Sep’22 % Recouped Total U.S. Nonfarm (millions) -22,362
102% Arizona
Mexico
Texas
DFW
San Antonio
129% Austin
MSA EMPLOYMENT COMPARISON SOURCE: BLS, CES, Colliers Research KEY METRICS & EMPLOYMENT OCCUPANCY PERFORMANCE 94.8% Y F AVERAGE RENT $1,182 Y F TRADE OUT (new) 13.2% F TRADE OUT (renewal) 10.6% Y COMPLETED (recent) CONSTRUCTION 292 PLANNED 2,104 Y UNDER (construction) 1,004 TO STABILIZATION 16mo F AVG SALES PPU SALES $196,367 SALES VOLUME $432.4M F F Y - Year-over-year | F - Forecast F Y F Y Y Y F Y Y F
21,857
Phoenix -252,200 341,800 136% Tucson* -45,900 39,500 86% New
Albuquerque -49,200 47,000 96%
Houston -359,400 452,800 126%
-426,800 717,900 168%
-131,300 168,900
-137,100 242,400 177%
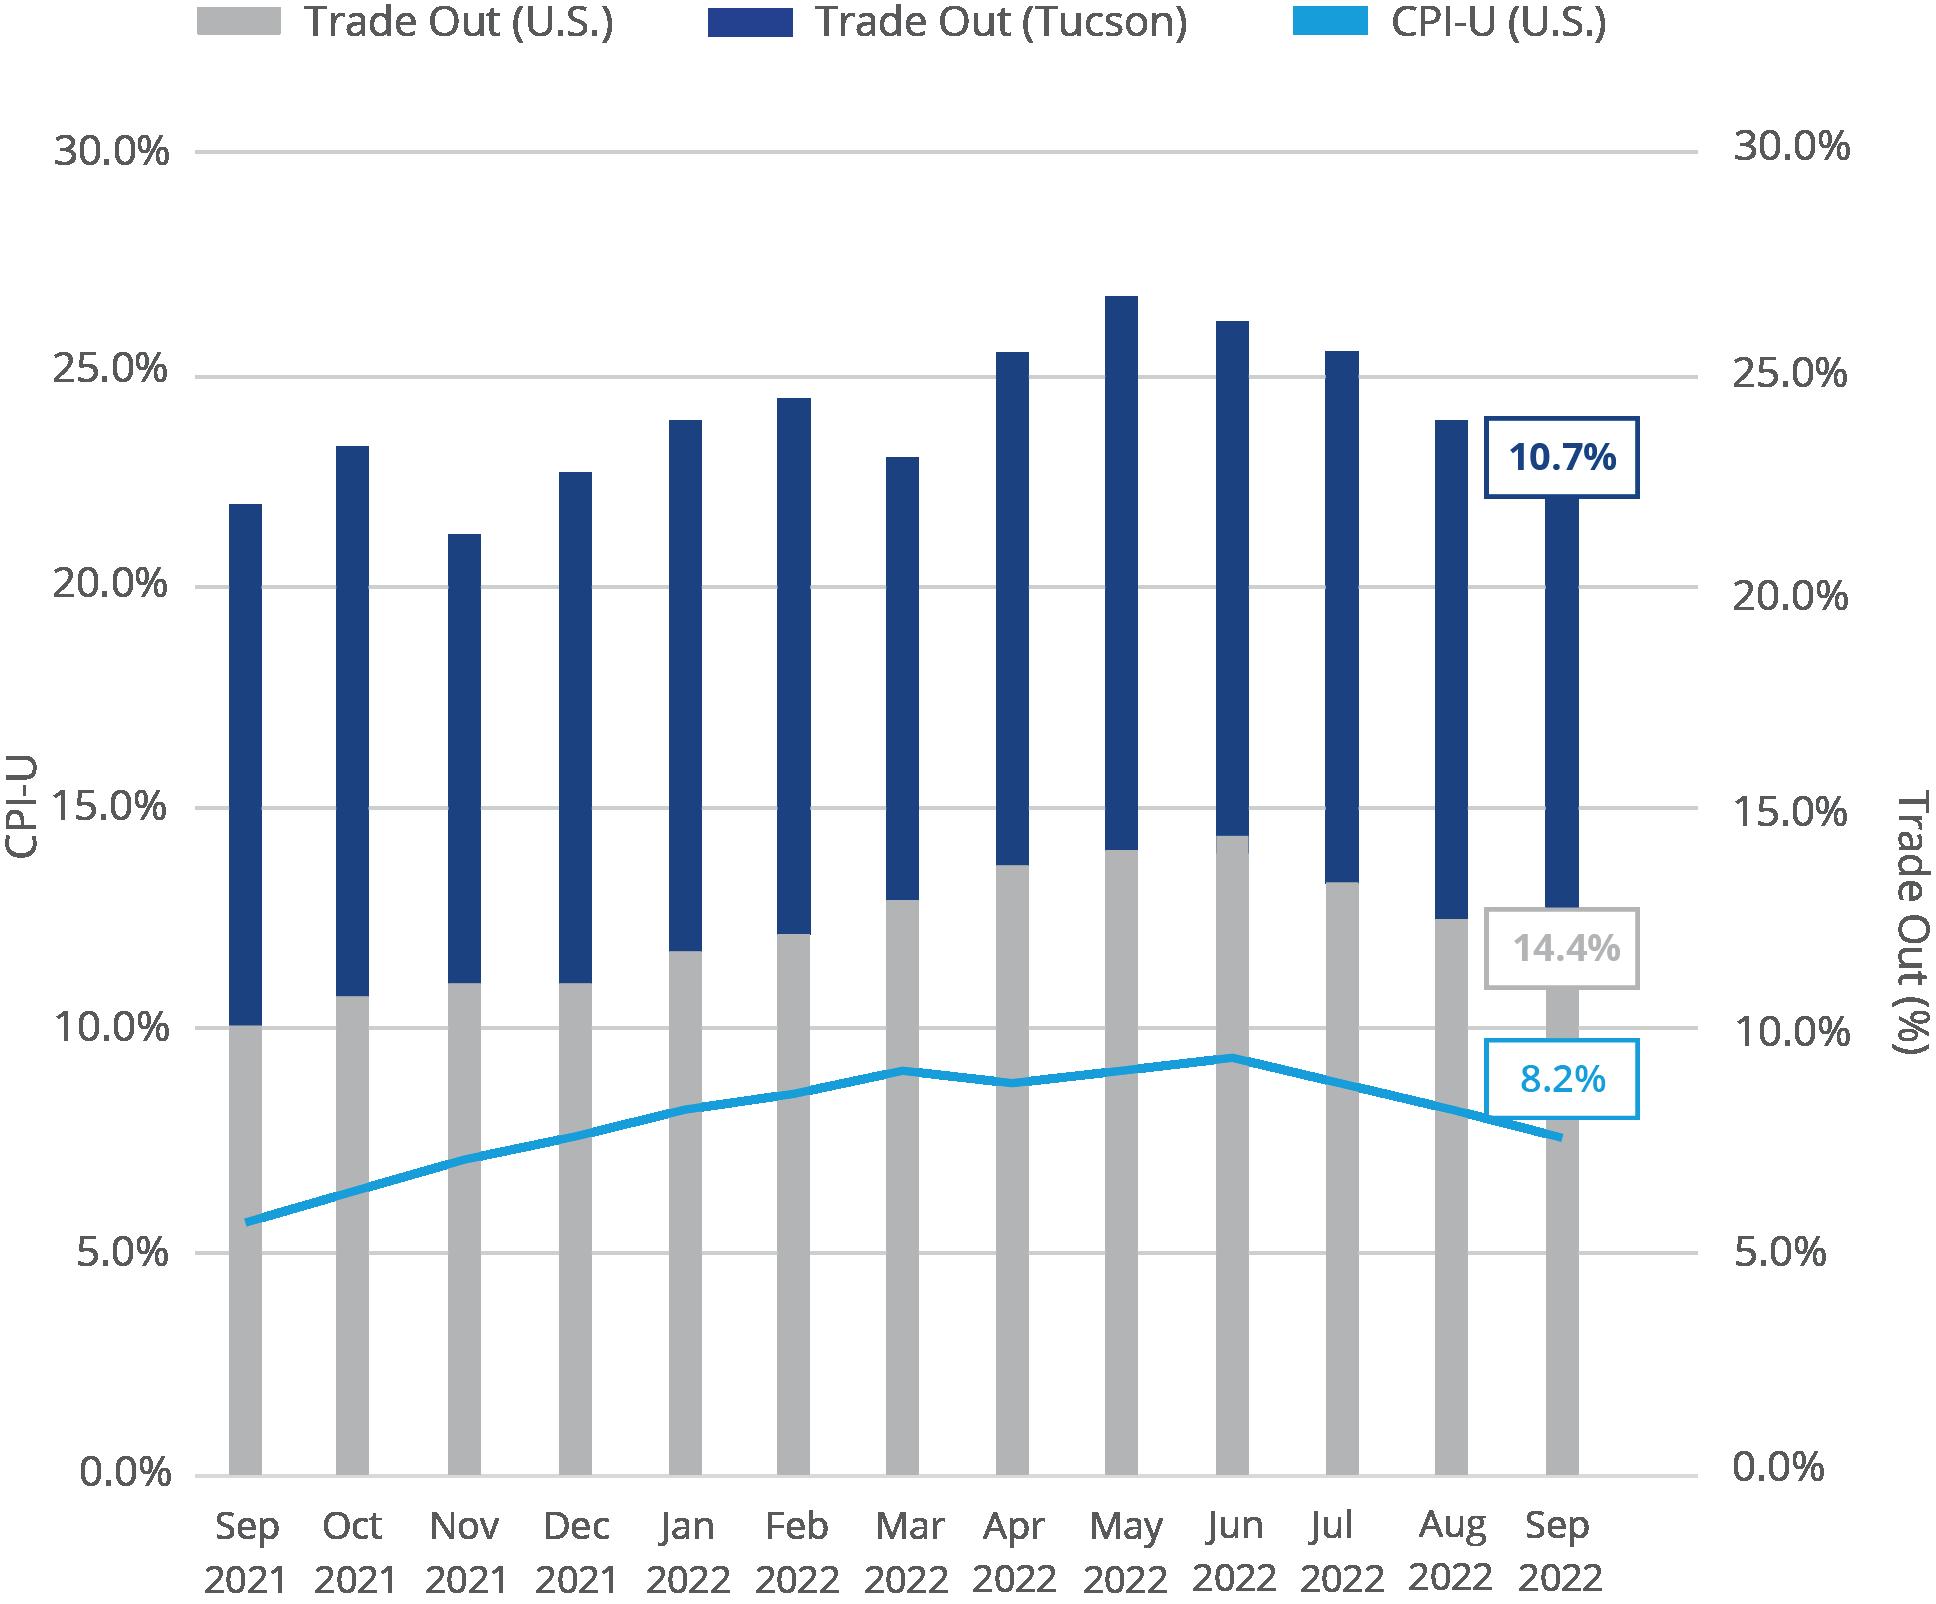
INFLATION V TRADE OUT
Inflation
Decreased 10 bps to an annualized rate of 8.2% as of September. Core CPI, or all items less food and energy, has been up for 28 straight months, increasing to 6.6% or 30bps higher than August readings.
Trade Out
For Tucson, Trade Outs have averaged 11.6% which is 330 bps higher than the average inflation rate.
Inflation (CPI-U) v Trade Out (%) | Sep 2021 - Sep 2022
INFLATION 8.2% Y F TRADE OUT
10.6% Y TRADE OUT
13.2% F
(renewal)
(new)
Y F
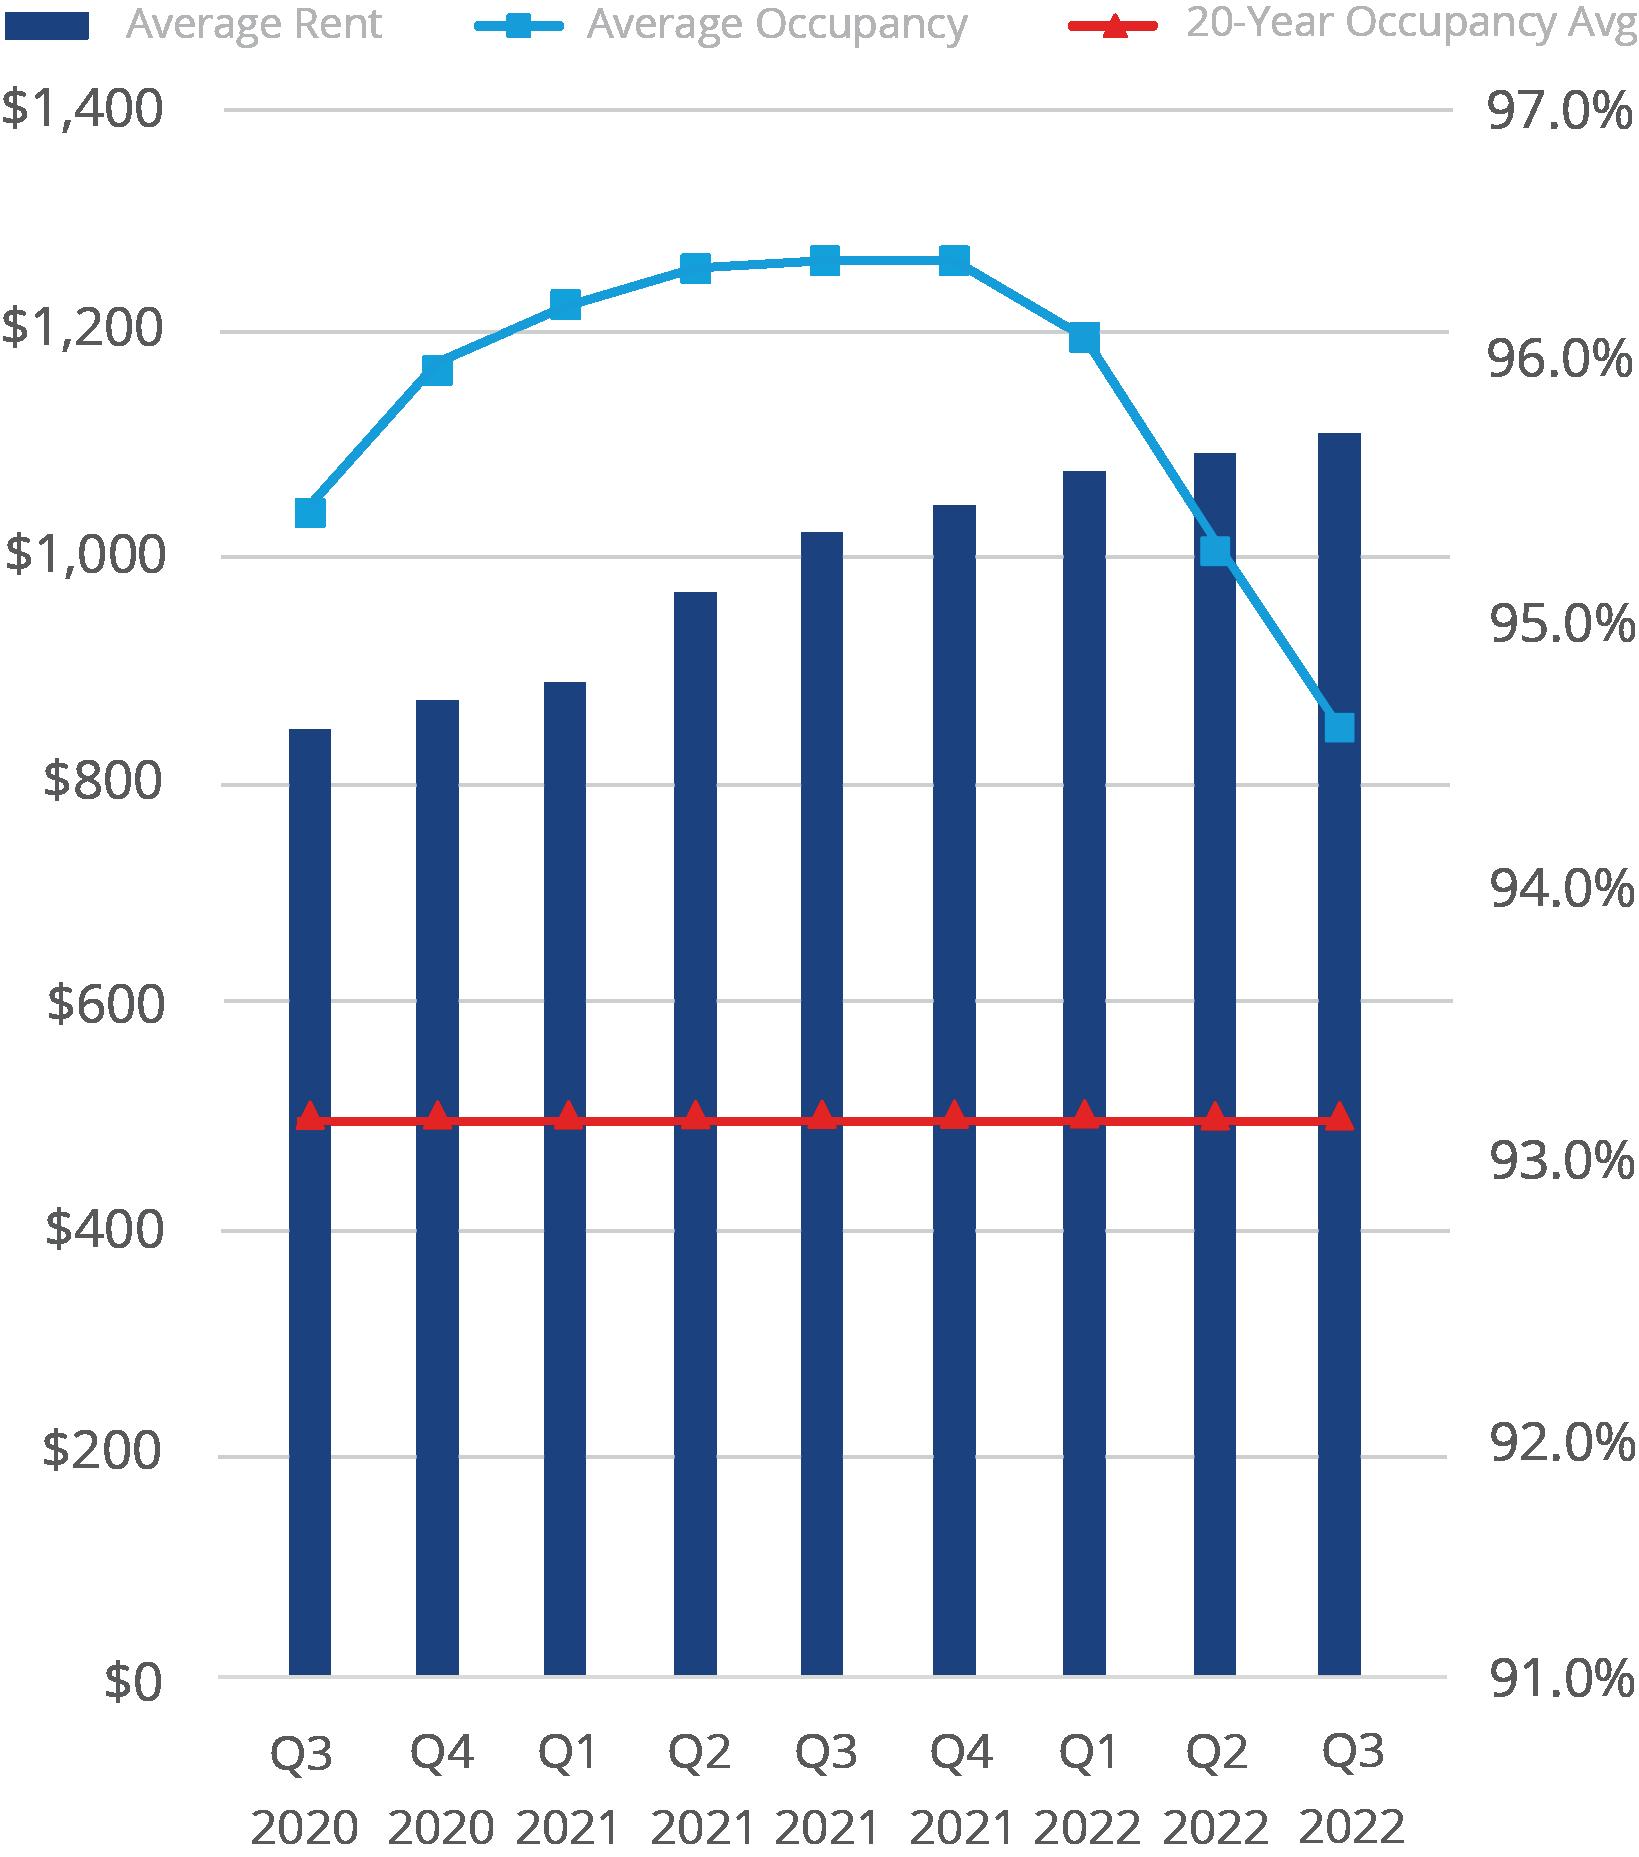
RENT/OCCUPANCY
Average rent for Greater Tucson was up 12.8% year-over year to $1,186 and up over-the-quarter by 2.1%. Occupancy for the region was 94.8% or 170 bps lower year-over-year. This marks the 27th consecutive quarter occupancy has been above the long-term occupancy average of 93.2%. Since 2018, over-the-quarter rent growth has averaged 2.6% for Tucson as a whole.
Class A has averaged 2.6%, Class B at 2.5%, and Class C at 2.3%. Asking rents in Class A buildings increased 12.0% year-over-year to an average of $1,477, which is $291 higher than the market average. Class B and C properties witnessed 14.7% (to $1,146) and 17.1% (to $943) yearover-year rent increases respectively with neither contracting over-thequarter.
Average Rent/Occupancy Q3 2020 - YTD RENT CLASS A $1,477 OCCUPANCY 94.3% Y F Y F RENT CLASS B $1,146 OCCUPANCY 94.6% Y F Y RENT CLASS C $943 OCCUPANCY 95.1% Y F Y F RENT BTR-SFR $2,058 OCCUPANCY 93.0% Y F Y F
F
PRE-LEASE ABSORPTION
Pre-lease absorption rates ended Q3 2022 with an average of 19 units per property per month.

Based on the average number of units under construction per property, which is 251, and assuming 90% occupancy for stabilization; current delivery-to-stabilization period is 16-months and is still below the 18-to-24-month stabilization rubric used by developers.
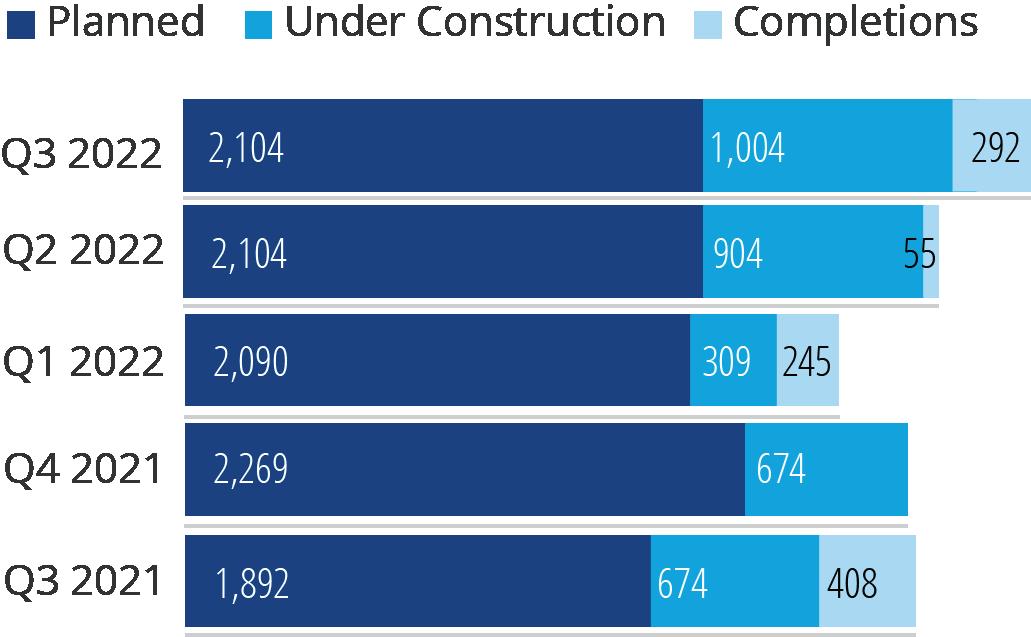
CONSTRUCTION & ABSORPTION
Planned Development increased 11% year-over-year to 2,104 units. Actual projects under construction increased 49% in over-the-year readings to its current 1,004-units. Occupancy was 94.8% which is 160 bps above the long-term average of 93.2%. Assuming all 1,000 units that are projected to be completed by end of 2023 were delivered vacant, occupancy would still be higher than the long-term average.
Tucson MSA | Months-to-Stabilization
Multifamily Construction (50+)
Total Inventory as of Q3
SOURCE: Colliers Research
2022 66,280 Inventory Change Est. 2022 1.1%
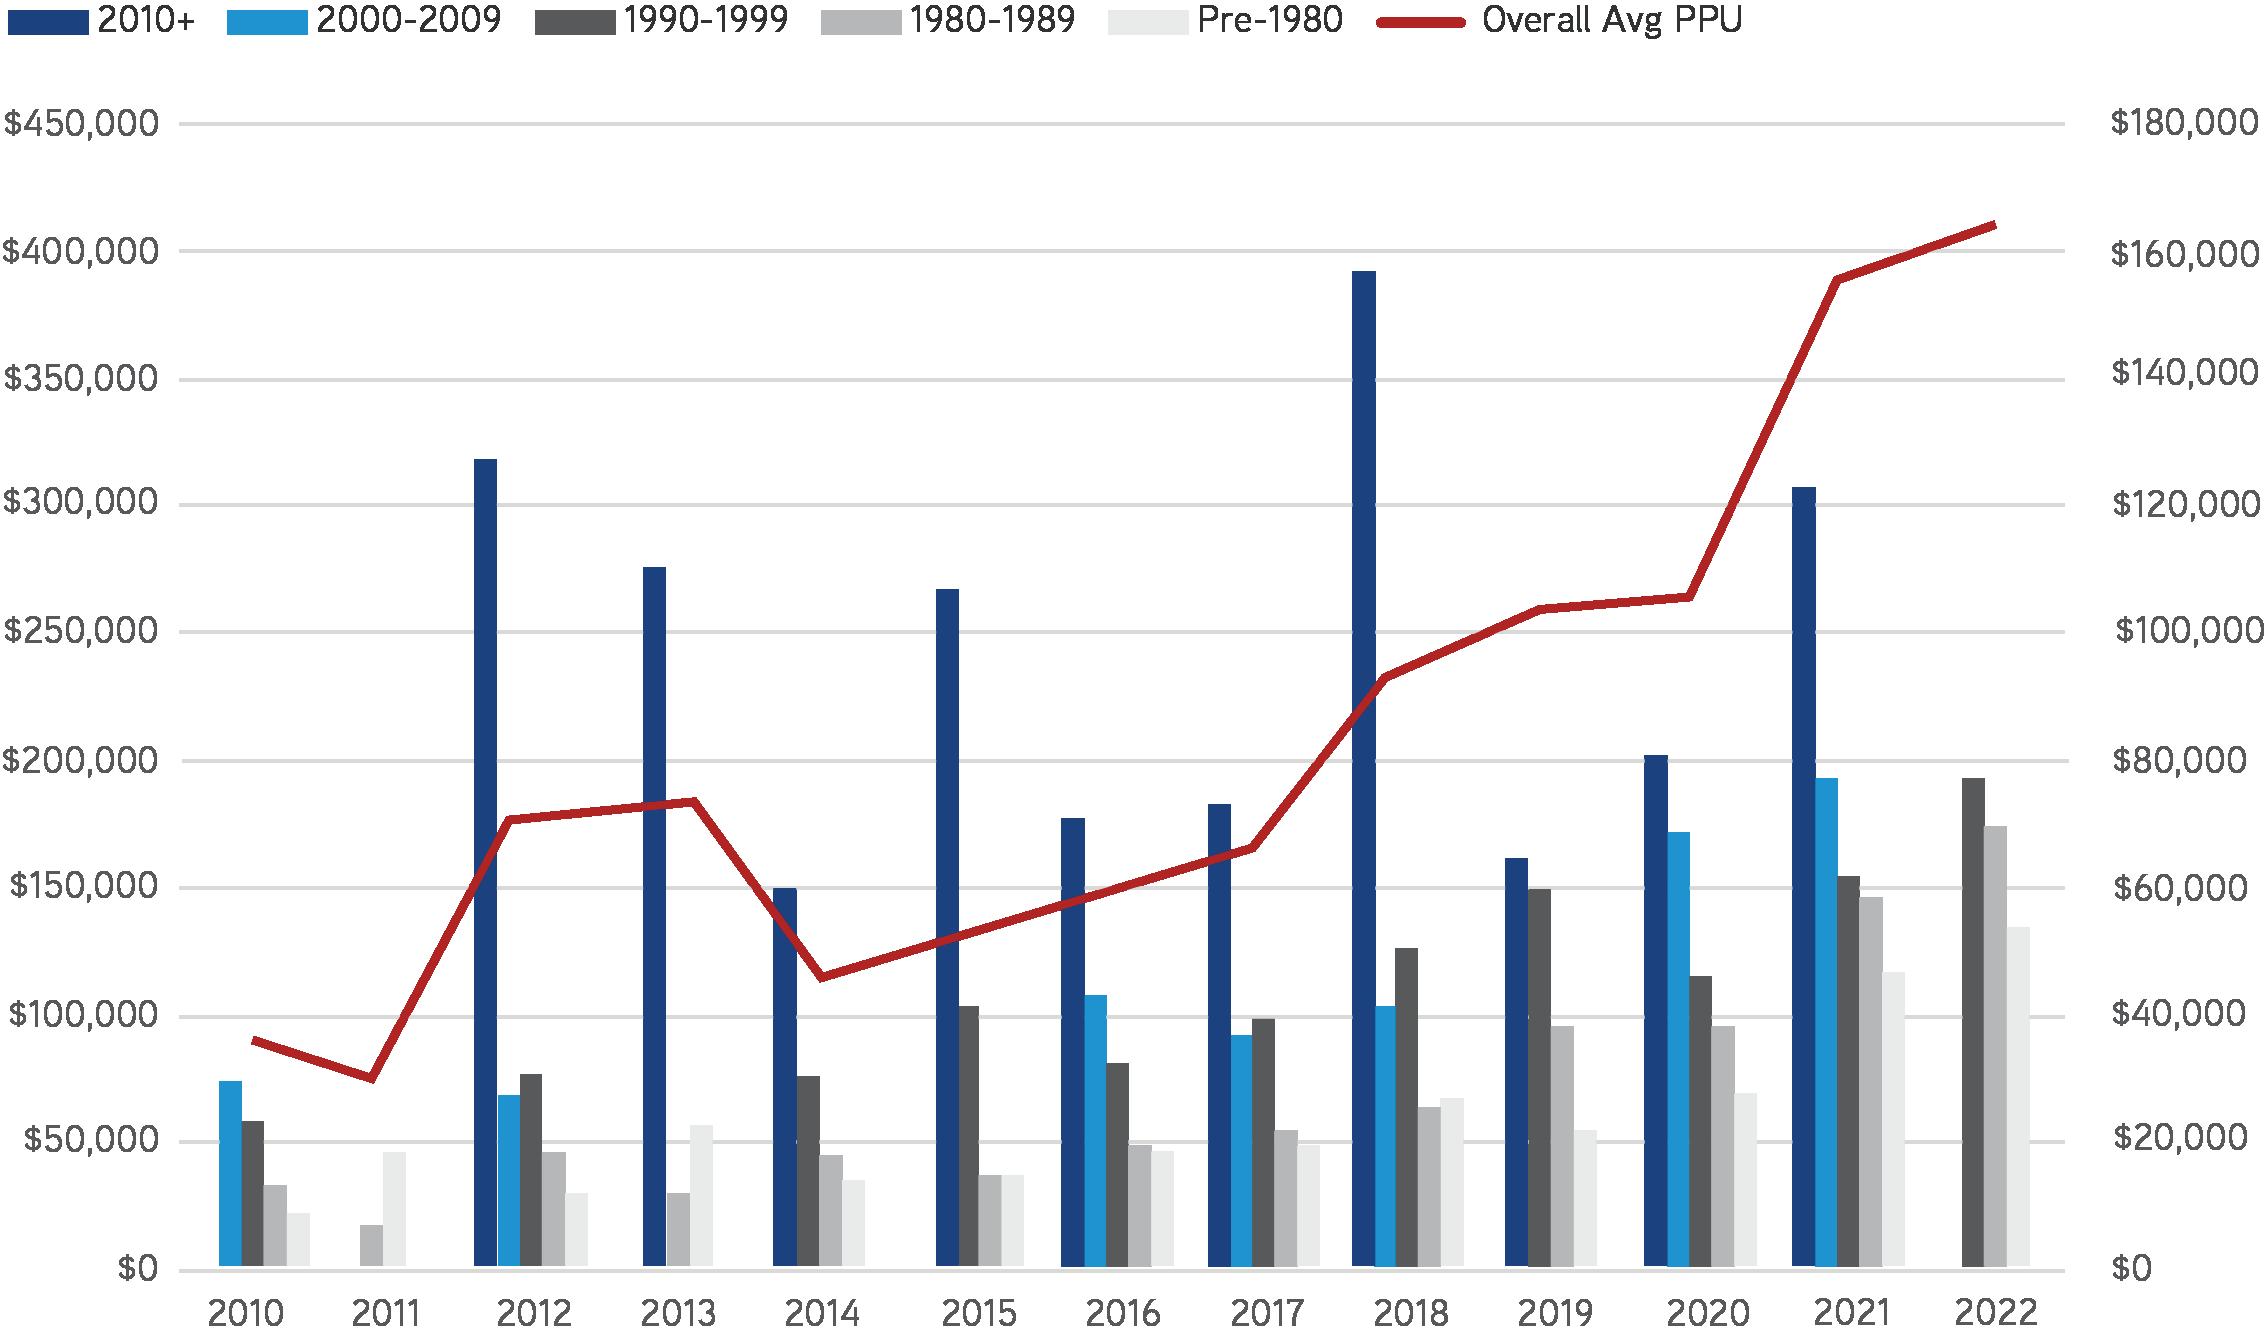
Market Rate, Non-Student/Senior, Q3 Only Property Sold $/Unit Closed Built Hilands $178,000,000 $215,496 07/01/22 1986 Mission Antigua $59,000,000 $237,903 07/21/22 1988 Peaks at Reddington $53,900,000 $179,070 07/15/22 1980 TOP 3 DEALS Q3 2022 | Summary of Multifamily Sales (100+ Units) Transactions 7 sales (up 17% year-over-year) Total Sales Volume $432,400,000 (up 74% year-over-year) Average Price/Unit $196,367 (up 4% year-over-year) INVESTMENT SALES (100+) Tucson MSA (100+) | Avg. Price Per Unit by Vintage 10Y TREASURY 3.83% Y F FREDDIE MAC PMMS 6.70% 30-YR FRM Y F
PERMITS, MF & SFR
Combined Trailing 12-month permit levels, which includes both single family and multifamily permits, decreased 8.7% over-the-quarter to 5,982. Despite generally increasing permit levels, total permits for 2021 were 6,039 or 47% below the previous market peak of 11,323 units in 2005. Projected 2022 permits counts are expected to be approximately 6,000.
OUTLOOK – ON RATES, “TRILEMMAS” & PIVOTS
Total US Nonfarm payrolls increased by 263,000 in September, compared with the Dow Jones estimate of 275,000. The unemployment rate dropped, slightly, to 3.5% as the labor force participation edged lower. US nonfarm employment now exceeds pre-Covid employment by 0.3% or 495,000. While the Greater Sun Belt region has generally recovered faster than the rest of the country, Tucson is still 1.6% below prePandemic employment levels.
Nationally capital markets, in response to rising rates particularly in construction debt, have witnessed significant lender pullback. If sustained, higher rates should mean more renters, or perhaps, renters for longer.
While job growth and recession worries have increased; regions, particularly those in the Sun Belt/ Southeast, have and are continuing to benefit from increased reshoring and Foreign Direct Investment (FDI) activity. As such regionalized job creation and net domestic migration should continue to serve as a market tailwind.
Nonetheless, all eyes are now firmly affixed on the Federal Reserve and what its next steps will be.
Blackrock CEO, Laurence Fink, has stated his firm’s expectation is that Powell will announce another 75bps hike followed by two smaller ones before a pause around 4.75% which is in line with the market that’s pricing in a terminal rate of +/-4.74% in May 2023.
2000 2001 2002 2003 2004 2005 2006 2007 2008 2009 2010 2011 2012 2013 2014 2015 2016 2017 2018 2019 2020 2021 2022*
Permits SFR vs MF | 2000 - Q2 2022
12,000 10,000 8,000 6,000 4,000 2,000 0
T-12 SF PERMITS 5,794 Y F T-12 MF PERMITS 1,689 Y F SFR MF
Thomas M. Brophy, National Director of Research & Analytics Thomas.Brophy@colliers.com +1 602 222 5057 Colliers | Arizona 2390 E Camelback Rd. Ste. 100, Phoenix, AZ 85016 +1 602 222 5000 colliers.com/arizona Copyright © 2022 Colliers International. The information contained herein has been obtained from sources deemed reliable. While every reasonable effort has been made to ensure its accuracy, we cannot guarantee it. No responsibility is assumed for any inaccuracies. Readers are encouraged to consult their professional advisors prior to acting on any of the material contained in this report.
