

Community Health Needs Assessment
A collaboration between Spectrum Health Lakeland and the Berrien County Health Department
2019-2021
Published May 2020 Published September 2020
spectrumhealthlakeland.org | 1 Contents Acknowledgements 3 Introduction 5 Methodology 15 Mortality/Life Expectancy 21 Community Voice: Mental Health and Obesity 35 Economy 49 Health Care 61 Food Environment 71 Physical Environment 79 Recreation Environment 91 Social Cohesion 101 Appendix A 113 Appendix B 123 Appendix C 129 Appendix D 133 Appendix E 141 Appendix F 157 Appendix G 159 Appendix H 163 Appendix I 165
2 | 2019 - 2021 Community Health Needs Assessment
Acknowledgements
As a health care system, Spectrum Health Lakeland recognizes that the health of a community is not just about responding to illness but creating a space for wellness. The 2019 CHNA sought the voices of community residents and used their feedback to be the guide for this document. We thank the almost 2,000 Berrien County community members who took the time to tell us about the resources for and barriers to their optimal health in this area. We would also like to thank the numerous local, regional, and national organizations whose databases provided us with invaluable information on the state of health in our community. Our hope is that this document will provide all of the stakeholders in this community with a deeper understanding of the social drivers of health and how we all play a role in creating a community where optimal health is achievable for everyone.


spectrumhealthlakeland.org | 3
4 | 2019 - 2021 Community Health Needs Assessment

Introduction
6 | 2019 - 2021 Community Health Needs Assessment
Introduction
The Community Health Needs Assessment (CHNA), required under the Patient Protection and Affordable Care Act of 2010, is an appraisal of the health status of a community. It is required of every hospital in the U.S. that enjoys tax-exempt status and is intended to ensure that they have information needed to provide community benefits that meet the health needs of the communities they serve. CHNAs must be conducted every three years, and acted upon through an associated Implementation Strategy.1,2
Per the legislation, this CHNA contains descriptions of: (i) the community served and how it was determined; (ii) the processes and methods used to conduct the CHNA; (iii) how input was received from people who represent the broad interests of the community; (iv) the process and criteria used to identify and prioritize the community’s health needs; (v) the resources that address the significant health needs identified through the CHNA; and (vi) the impact of the Implementation Strategy (IS) undertaken to address the health needs identified in the 2016 CHNA.
The CHNA Project Team executed the CHNA in accordance with six principles that were informed by ACA requirements and Spectrum Health Lakeland’s (Lakeland) organizational commitment to advance population health. These principles are inclusive input, community voice, transparent communication, authentic collaboration, health equity, and the influential role of social determinants of health.
Throughout the document, two images are used to provide additional information to the reader.
The light bulb is used to highlight connections among various social determinants of health or to provide greater detail about a priority health need.
The media player provides insights into health needs, resources, and ideas for health improvement provided by community youth.
spectrumhealthlakeland.org | 7
About Spectrum Health Lakeland
Lakeland is headquartered in Berrien County, Michigan (see figure 1.1 for a map depicting the zip codes in Lakeland’s service area). It also has facilities and serves patients in the adjacent counties of Van Buren and Cass. Roughly 237,000 people are estimated to reside in Lakeland’s service area.

Zip codes within the Lakeland service area.
Lakeland provides medical services at 49 locations including three hospitals, a center for outpatient services, a regional cancer center, rehabilitation centers, two long-term care residences, home care and hospice services, and 34 affiliate physician practice locations. With more than 4,000 professionals, including 490 primary and specialty care physicians and other licensed providers, Lakeland is the largest employer in Berrien County.
Since the last CHNA conducted in 2016, effective October 1, 2019, Lakeland has become a division of Spectrum Health, which is headquartered in Grand Rapids, Michigan.
In June 2019, Spectrum Health unveiled a new mission, vision, values, and strategic priorities. The values of compassion, collaboration, curiosity, and courage serve as the guide for the new direction. The mission and/or vision are pursued through five strategic priorities: (i) to reimagine the personalized experience, (ii) cultivate breakthrough talent and culture, (iii) think and act digitally, (iv) build and partner innovatively, and (v) drive value. This CHNA and its associated Implementation Strategy addresses these strategic priorities.
8 | 2019 - 2021 Community Health Needs Assessment
Figure 1.1
Introduction
Introduction
Meeting the CHNA Requirements
Who conducted the CHNA? This CHNA was conducted by Lakeland’s Population Health team – a multidisciplinary group of professionals in the fields of education, evaluation, healthcare, mental health, nutrition, public health, social work, and urban planning.3 Key external partners in the execution of the CHNA included the Berrien County Health Department, Andrews University, Western Michigan University, and the Southwest Michigan Planning Commission. Other organizations including K-12 schools, local businesses and municipalities, and community organizations, provided valuable input into the CHNA by providing data, documents, and other resources.
The Community Served. Lakeland serves all of Berrien County, and parts of Van Buren and Cass Counties – all located in the southwest corner of Michigan. The service area was determined by the location of Lakeland’s facilities and locations of patients’ places of residence. This CHNA focuses only on the health needs of Berrien County. Table 1.1 provides a snapshot of Berrien County’s demographics.4
Population Health Team MISSION
To intentionally foster an environment where optimal health is achievable for everyone.
VISION
A thriving, resilient and socially cohesive community.
Table 1.1 Berrien County Demographics
spectrumhealthlakeland.org | 9
Michigan Berrien Population 9,925,568 154,948 Education (High School Graduate & Beyond) 25+ Years 90.2% 89.5% Poverty 15.6% 17.2% Unemployment 7.4% 7.3% Median Age 39.6 42 Median Individual Income $30,416 $28,446 Median Household Income $52,668 $47,132 Caucasian 78.7% 78.4% African American 13.8% 14.7% Asian 2.9% 2% American Indian 0.5% 0.3% Hispanic 4.9% 5.2% Uninsured 7.2% 8.7% Overall Health Ranking N/A 59/83 (3rd quartile)
Introduction
Processes and Methods. The CHNA was informed by data collected through multiple methods. Primary source data (firsthand information collected directly from community members) was collected through surveys, Photovoice, and interviews, with a focus on gathering input from neighborhoods experiencing the poorest health outcomes (i.e., highest mortality rates and lowest life expectancy).5
Additional information (secondary data) was gathered through scientific literature, policy briefs, and other organizational documents. Government datasets (e.g., employment, income, agriculture, housing, transportation, healthcare resources, civil engagement, and recreation) were also utilized.
Community and Stakeholder Input. The survey was administered in electronic and paper formats to government bodies, local businesses, K-12 schools, higher education institutions, and non-profit and other community organizations. Input was solicited from stakeholders who were diverse by age, ethnicity, gender identity, language proficiency, literacy level, profession, sexual orientation, and socioeconomic status. To ensure input was received from community members faced with literacy challenges and language barriers, survey questions were administered verbally (i.e., interviews) and translated into Spanish. Survey responses were received from nearly 2,000 people. Photovoice was used to capture responses to the survey questions from more than 100 area youth.
While gathering community input, efforts were made to ensure that the demographics of respondents reflected the demographics of Berrien County. Moreover, the CHNA team oversampled in geographic areas with the highest death rates and lowest life expectancies. Thus, the team was able to ensure input from the medically underserved, low-income, and minority populations, and from individuals and organizations who serve or represent the interests of these populations.
Data was also collected through reviews of documents published by the Berrien County Health Department, the Berrien County Mental Health Authority (Riverwood Center), the Southwest Michigan Planning Commission, and other bodies with specialized knowledge, information, and expertise relevant to the health needs of the community.
Impact of the Implementation Strategy for the 2016 Community Health Needs Assessment
Figure 1.3 reveals that in the 2016 Community Health Needs Assessment the residents of Lakeland’s service area identified the following priority health needs: mental health, obesity, diabetes, cardiovascular conditions, provider availability, cost of care, health education and information, the food environment, and health behaviors.6
To address these priority health needs, the Population Health team executed an Implementation Strategy (IS) that laid out three major objectives:
1. Build trust between Lakeland and the community it serves
2. Increase the capacity of Lakeland and the community it serves to improve population health
3. Improve knowledge, attitudes, and behaviors of Lakeland and the community it serves to improve population health
10 | 2019 - 2021 Community Health Needs Assessment
Mental Health Obesity Diabetes Heart Conditions Health Behaviors Food Provider Availability Health Education & Info Cost of Care
Figure 1.3 2016 Community Health Needs Assessment - Priority
Health
Needs
Introduction
Eleven programs were developed to address the priority health needs. They fell into four categories: (i) Mental Wellbeing, (ii) Nutrition Education & Access, (iii) K-12 Health Education, and (iv) Community Health Education. The evaluation of the 2016 Implementation Strategy results yielded the following findings:
• Pre-and post-tests, surveys, and interviews showed decisively that the programs’ curriculum and distribution made a strong, positive impact on many of the participants’ health-related knowledge, attitudes, and behaviors. The activities were highly effective.
• More than 4,000 individuals participated in Lakeland’s IS activities. Nearly half of those people lived or worked in a targeted census tract (i.e., tracts experiencing high rates of death).
• Some programs cast a wide net for a short period of time (e.g., CPR classes), while others targeted a smaller group over a longer time period (e.g., Prescription for Health, Harbor Towers). This mix of programmatic offerings is a strength and should continue. However, programs with a wider range of participants could work to provide more targeted programming for populations in target areas, while programs with a narrower scope could focus on increasing capacity. These changes have begun to take place as evidenced by changes to the CPR and Babysitting courses, and the expansion of Elite Barbershop and Harbor Towers activities to additional similar locations within the target areas.
• On multiple occasions, participants in one program activity learned about, and subsequently, participated in another Lakeland activity. This fostered a more robust and holistic picture of health for those individuals.
• There is room for improvement with individuals’ trust in Lakeland. The findings of a mystery shopping exercise demonstrated that some individuals were treated differently at Lakeland based on their race. Moreover, surveys demonstrated that those living in Benton Harbor and Niles were less likely to have trust in Lakeland. Interviews with physicians revealed that some staff make inappropriate comments about patients “behind the scenes,” which perpetuates and serves to justify patient and community feelings of mistrust.
For a more detailed summary of the Evaluation Results, see Appendix A.
Framing the 2019 CHNA
To ensure clarity of terms used throughout this document, definitions of some key concepts are provided below. These concepts informed the data collection and analytic processes, as well as the prioritization of health needs.
Health: “Health is a state of complete physical, mental, and social wellbeing, and not merely the absence of disease or infirmity”.7 According to this definition put forth by the World Health Organization, health is more than the physical state of the human body. It also refers to psychological and emotional wellbeing, and the capacity to engage in productive interpersonal and communal interactions. Often used interchangeably, health and health care are not the same.
Health Care: Health care is the organized provision of medical services that help to ensure the maintenance or improvement of health. Health care comprises the prevention, diagnosis, and treatment of disease, illness, injury, and other physical and mental conditions.
Population Health: Population health is defined as the “health outcomes of a group of individuals, including the distribution of such outcomes within the group.”7 Typically, these groups are defined geographically (i.e., nation, state, county, city, zip code, census tract, or neighborhood), but they may also be defined in terms of a shared social identity such as physical or mental ability, age, gender identity, income, race or ethnicity, religion, or sexual orientation. These groups may include individuals with or without established access to health care.
spectrumhealthlakeland.org | 11
Introduction
Social Determinants of Health: Social determinants of health (SDoH) are defined as the conditions in which people are born, live, learn, work, play, and age: the quality of food, education, housing, transportation access, availability of employment, recreational and cultural opportunities, environmental exposures, and sense of safety and security.8 The distribution of SDoH shape a community’s access to nutritious foods, structurally sound homes, state-of-the-art education, living wage jobs, opportunities for physical activity and social interactions, clean air and water, and safe neighborhoods – all of which are critical to good health.
Health Equity: By referencing “…the distribution of such (health) outcomes within the group…”, the definition of population health evokes the concept of health equity, which is defined as the absence of systematic disparities in health between and within groups. Health equity means that all people – regardless of racial, gender or class identity; sexual orientation; physical or mental ability; residential location; or national origin and other social identifiers – are able to achieve their highest level of health.
Achieving health equity requires leveling the playing field by allocating SDoH so that everyone has access to the specific resources and opportunities needed to achieve optimal health. Often, achieving health equity necessitates that some communities (or members) receive more resources, opportunities, and support than others due to the cumulative effects of historical and/or structural limitations on their access to SDoH. Achieving health equity also calls for reducing exposure to stigma and discrimination which underlie the unfair distribution of SDoH which, in turn, leads to heath inequities.
Figure 1.4
Equity and Equality are not the same.
Equity—depicted on the right—means that communities get precisely what they need to attain optimal health.
Equality—depicted on the left side— means that all communities get the same resources, which entrenches existing inequities.

Achieving health equity is important for moral, financial/operational, economic, legal, and social reasons.
• First morally, it is simply “the right thing to do.” In a wealthy nation such as the United States, health inequities should not exist.
• Health equity is critical to the financial and operational imperatives of health systems as they shift from volume to value-based care.9 By ensuring that everyone achieves an optimal level of wellbeing, health equity can help reduce the financial costs borne by health systems as they care for the underinsured and uninsured who often require uncompensated care. In addition to lowering health systems’ global cost of care, achieving health equity can help enhance quality of care and, therefore, patient satisfaction.
• Health equity is critical to regional economic growth. Ensuring everyone in a community is physically, mentally, and socially healthy helps to ensure a productive and engaged workforce, which is essential for a thriving economy. Additionally, because Lakeland is the largest employer and a major purchaser in Berrien County, achieving health equity can help reduce its risk for poor financial and operational outcomes, and ensure that Lakeland contributes to regional economic growth.
• The spirit of the Affordable Care Act (ACA) – reflected in provisions, such as Medicaid expansion, protections for pre-existing conditions, regulation of nondiscrimination policies, and mandatory CHNAs for nonprofit hospitals—aims to increase health equity.10, 11
12 | 2019 - 2021 Community Health Needs Assessment
• Achieving health equity is important because it cultivates a sense of belonging and unified identity which fosters the social cohesion necessary for thriving and socially sustainable communities.
• Finally, as the demographic makeup of the nation continues to shift, and racial, ethnic, and other disadvantaged groups continue to grow as a percentage of the national population, their health will increasingly shape the overall health, and, as a consequence, the social and economic wellbeing, of the nation.
More on the Social Determinants of Health (SDoH)
Increasingly epidemiological, medical, and social science research indicates that social factors are more influential than medical factors in shaping health outcomes. In fact, studies suggest that up to 90 percent of health outcomes are determined by social factors.12 According to recent research, deaths and major diseases like heart attacks, cerebrovascular disease, and some cancers are attributable to SDoH. For instance, in 2000, approximately 245,000 deaths in the United States were attributed to low education; 176,000 to racial segregation; 162,000 to low social support; 133,000 to individual-level poverty; 119,000 to income inequality; and 39,000 to area-level poverty.13
The significance of social drivers in shaping health is evident in Berrien County. In terms of clinical care (i.e., preventable hospital stays and access to and quality of care), Berrien County ranks 30th among Michigan’s 83 counties, meaning that only 29 counties achieve a higher ranking. However, Berrien’s health outcomes (i.e., length and quality of life) rank 59th, meaning that 58 of the state’s 83 counties rank better than Berrien. The disconnect between the county’s relatively high clinical care ranking and low health outcomes ranking suggests that there are other factors determining health – specifically, the county’s social, economic, and environmental conditions. Due to the vital role they play in shaping health, SDoH are a major focus of this CHNA.
The SDoH impact health outcomes in at least two ways. First, the distribution of SDoH influences health behaviors by determining the amount and type of health-enhancing opportunities and resources made available. For example, maintaining an exercise routine and a healthy diet (health behavior) is easier for individuals who live in communities that are safe and walkable and have good access to full-service grocery stores (social determinants). Alternatively, it is difficult to take prescribed medication (health behavior) if it is unaffordable due to unemployment or employment that does not pay a living wage or provide health insurance (social determinants). Similarly, it is hard to manage stress in a healthy manner (health behavior) when living in conditions of chronic poverty and in neighborhoods with easy access to alcohol, tobacco, and other drugs (social determinants). It is easier to manage stress when there is easy access to parks and green space (social determinants).
Second, the SDoH impact health through the distribution of psychosocial stressors that not only impact health behaviors (as discussed in the preceding section), but also have neurobiological effects which are associated with health outcomes. Exposure to psychosocial stressors (e.g., chronic poverty, food insecurity, discrimination, social isolation, incarceration, violence, and other sources of trauma) have been linked to dysregulation of the central nervous system; an increase in bodily inflammation and a decrease in immune system functions. These changes are implicated in a wide range of poor health outcomes such as hypertension, diabetes, cancer, autoimmune disorders, obesity, anxiety, depression, and early mortality.
There is also growing evidence to suggest that psychosocial stressors may produce health impacts that are passed on to subsequent generations through changes in gene expression. The science behind these observations linking social stressors to health has important implications for health equity as some groups are exposed to more health-depleting psychosocial stressors than others, with implications not only for the present but for future generations, as well.
spectrumhealthlakeland.org | 13
Introduction
Introduction
It is important to note that there are complex interactions among the social determinants of health. For example, children experiencing limited educational opportunity may have few employment opportunities as adults and, therefore, low income. Their low income will likely reduce their access to what is needed for good health including health care, nutritious food, secure housing, and safe recreational places. Moreover, their low income is also likely to increase the emotional hardship and psychological distress they endure, which can, in turn, stimulate unhealthy coping mechanisms such as substance misuse, sedentary lifestyle, and poor eating habits as well as physiological and biological effects – all of which contribute to poor health.
Underlying and giving shape to the social determinants of health are structural determinants of health. Structural determinants are intangible phenomena such as societal and cultural norms, attributes, values and beliefs; laws and public policy of all types (e.g., housing, social welfare, economic, fiscal, environmental, transportation, criminal justice and agricultural); and governance structures (i.e., organizational frameworks that establish the direction and coordinate the management, oversight, and activities of decision-making bodies). These structures shape the distribution of power, money, and resources which, in turn, shape the distribution of SDoH and, thereby, structure the risk for poor health.
A Final Note: Health disparities are not the same as health inequities. Health disparities are differences in the prevalence of illness or disease within and among populations. Health inequities are a subset of health disparities. They are socially driven, thus they are avoidable, unfair, and unjust. An example of a health disparity is the genetically-determined lower birthweights of female babies relative to male babies. An example of a health inequity is the socially-determined difference in birth weights between black and white babies. In Berrien County, for instance, 13% of black babies are born with a low birthweight compared to 6% of white babies. This is an inequity because the difference is a reflection of social factors such as higher percentage of black babies born into poverty and the persistent experiences of racial discrimination faced by their mothers over the life course, both of which research has shown to be causally linked to low birthweight babies.
1 Throughout the document, two images are used to provide additional information to the reader. The Light Bulb is used to highlight connections among various social determinants of health or to provide greater detail about a priority health need. The Camera provides insights into health needs, resources and ideas for health improvement provided by community youth.
2 Community benefits are programs and services administered by not-for-profit hospitals. They are designed to improve community health by responding to community-identified needs, with a specific focus on the needs of the medically underserved. Community Benefit reporting is required for hospitals to maintain their tax-exempt status.
3 In July 2018, Lakeland’s department of Community Health and Wellness formally changed its name to Population Health. Embracing the definition of Population Health put forth by Kindig & Stoddart (2003) and used by the Population Health Roundtable of the National Academy of Sciences, i.e.,“... the health outcomes of a group of individuals, including the distribution of such outcomes within the group,” the department also created a new mission and vision.
Kindig, D., & Stoddart, G. (2003). What is population health? American Journal of Public Health, 93 (3), 380-383. Retrieved from https://www.who.int/ social_determinants/sdh_definition/en/
4 U.S. Census Bureau (2017). Selected Characteristics Of The Native And Foreign-Born Populations, Table S0501: 2013-2017 American Community Survey 5-Year estimates. Retrieved from https://data.census.gov/cedsci/table?q=berrien%20county,%20michigan&g=0500000US26021&hide Preview=false&tid=ACSST5Y2016.S0501&layer=VT_2018_050_00_PY_D1&cid=DP05_0001E&vintage=2016
5 Photovoice is the use of photographic images and narrative to articulate community needs.
6 In figure 1.3, the blue bubbles represent the relative importance of the health conditions that were identified in the 2016 CHNA as priority health issues. The orange bubbles represent the relative importance of health system-related priority health issues. And the green bubbles represent the relative importance of the social determinants of health.
7 Constitution of the World Health Organization. (1946). American Journal of Public Health and the Nations Health, 36(11), 1315–1323. doi: 10.2105/ajph.36.11.1315
8 Braveman, P. (2003). Defining equity in health. Journal of Epidemiology & Community Health, 57(4), 254-258. doi:10.1136/jech.57.4.254
9 Volume-based care refers to payment models in which providers (e.g., physicians) are paid based on the number of patients they see. Value-based care refers to payment models in which providers are paid based on patients’ health outcomes.
10 Evidence suggests that when the entirety of the ACA was instituted, economic and racial inequities in insurance coverage were narrowed.
11 Henry J. Kaiser Family Foundation. (2013) Summary of the Affordable Care Act. (2013). Health Reform. Retrieved from https://www.kff.org/ health-reform/fact-sheet/summary-of-the-affordable-care-act/
12 Park, H., Roubal, A. M., Jovaag, A., Gennuso, K. P., & Catlin, B. B. (2015). Relative Contributions of a Set of Health Factors to Selected Health Outcomes. American Journal of Preventive Medicine, 49(6), 961–969. doi: 10.1016/j.amepre.2015.07.016
13 Galea, S., Tracy, M., Hoggatt, K. J., Dimaggio, C., & Karpati, A. (2011). Estimated Deaths Attributable to Social Factors in the United States. American Journal of Public Health, 101(8), 1456–1465. doi: 10.2105/ajph.2010.300086
14 | 2019 - 2021 Community Health Needs Assessment


Methodology
16 | 2019 - 2021 Community Health Needs Assessment
Methodology
The data that informs this CHNA was collected using surveys, Photovoice, and interviews (i.e., primary data). In addition, information was also gathered from sources such as scientific, peer-reviewed literature, whitepapers and policy briefs, and government agency dataset (i.e. secondary data). All data was collected and analyzed between September 1, 2018 and May 30, 2019.
Primary Data
Surveys: Electronic and paper format surveys were administered with the help of local and regional government bodies, businesses, K-12 schools, universities, and community organizations. Input was solicited from stakeholders who were diverse by age, ethnicity, gender identity, language proficiency, literacy levels, profession, race, sexual orientation, and socioeconomic status.
To ensure input was received from community members who faced literacy or language barriers, survey questions were also administered in interview formats and translated into Spanish. Nearly 2,000 people completed the survey. To capture the perspectives of area youth, more than 100 students participated in Photovoice—a method that involves the use of photographic images and narrative to articulate community needs.
All of the methods were intentionally participatory and transparent in an effort to encourage the exchange of ideas and perspectives, capture authentic community voices, and sow the seeds for collective ownership of the CHNA. New relationships were developed to build trust and reach groups that would not have otherwise been included. For instance, the survey was administered in Spanish to patients by staff of the Federally Qualified Health Center (Inter Care) and in the waiting room of a local tire company to reach men, who were relatively underrepresented among survey respondents.
The following prompts were administered in surveys, Photovoice, and interviews:
• Prompt 1: What are some things in your community that help you to be healthy?
• Prompt 2: What are some things in your community that make it hard to be healthy?
• Prompt 3: What are the biggest health issues in your community?
• Prompt 4: How would you improve the health in your community?
• Prompt 5: When I experience hard or stressful times, these are the ways I help myself feel better/relaxed/calmer.
Individuals were asked to respond to these prompts in the context of the community they felt most comfortable speaking about – where they live, go to school, recreate, work, or worship.
The first four prompts were similar to those used in the 2016 CHNA. To reduce the possibility of repeat responses and to gather as much new information as possible, respondents were asked a screening question on whether they participated in the 2016 CHNA (For full survey instrument, see Appendix B). Those who answered, “Yes” (13%), skipped questions 1-4; and those who answered, “No” (48%) or “I’m not sure” (39%) proceeded to respond to prompt 1.
Prompt 1 was used to gather input on community resources and assets that support or promote health. Prompts 2 and 3 established what residents perceived to be the most pressing health needs in their community, and underlying issues that cause or contribute to those needs. The responses to these two prompts were used to identify the CHNA’s priority health needs. In prompt 4, respondents were asked to identify potential solutions for the health needs of their community. Respondents were also prompted to share specific activities that they and/or people they know engage in to cope with adversity. The results of the survey provide a balanced perspective on what health needs and assets exist, as well as ideas and aspirations for improvement in community health.
spectrumhealthlakeland.org | 17
Methodology
Interviews: Upon request, the survey was administered in an interview format as a member of the CHNA project team transcribed responses. Additionally, a small group interview was conducted with students from the Bridge Academy in Benton Harbor. The interviewees responded to the survey verbally. Subsequently, they addressed their identified priority health needs in their Photovoice projects. The students also spent time reflecting on how their priority health needs came to be, how the community might address their concerns, and their hopes for the future.
Photovoice: To ensure that the voices of youth were reflected in the CHNA, 109 high school students throughout Berrien County participated in Photovoice – a participatory, action-research method in which photography and narrative were used to provide insight into community health needs and assets. In addition to gathering input for the CHNA, the Photovoice projects helped students develop a better understanding of their community; reflect on its strengths and concerns; better understand the economic, social, and political forces that impact community health; and consider how to influence policy makers to improve the health of their community.
There were three Photovoice project locations:
1. Niles New Tech Entrepreneurial Academy at Niles High School (60 tenth grade students)
2. Berrien County Mathematics and Science Center (30 ninth grade students attending schools throughout Berrien County1)
3. Bridge Academy of Benton Harbor (19 students between the ages of 16 and 21)
Prior to participation, students signed a release form. If they were under the age of 18, a parent or guardian signed on their behalf. Students were instructed on the purpose of the CHNA and Photovoice process. Many students used their own devices. However, digital cameras were made available for others, as needed. Each student took photos and reflected on them, individually or in small groups, selecting the photo(s) they felt best reflected their answers to the survey questions and prompt.
Students wrote narratives describing their photos and explained their responses to the survey. The students of Niles New Tech Entrepreneurial Academy formally presented their findings to a panel of community leaders. Students of the Berrien County Mathematics and Science Center and the Bridge Academy showcased their findings in a gallery walk at their respective locations, where community members were invited to view and discuss their work.
Secondary Data
Literature Review: A review of literature in the fields of public and population health, criminal justice, housing, education, transportation, faith and spirituality, civic engagement, and the medical, social, and environmental sciences were leveraged to understand the local environmental factors that shape health. Sources included policy briefs, whitepapers, and publications from federal government agencies such as the U.S. Department of Health and Human Services (e.g. Agency for Toxic Substances and Disease Registry, National Center for Injury Prevention, the Centers for Medicare and Medicaid Services, Food and Drug Administration, Health Resources and Services Administration, the National Institutes of Health, Substance Abuse and Mental Health Services Administration). Other government sources included federal agencies such as the Census Bureau, the Department of Justice, the Department of Transportation, and the Department of Housing and Urban Development. State agency sources included the Michigan Departments of Health and Human Services, Education, Transportation, and Corrections. The project team also reviewed literature produced by county and other municipal authorities (e.g., master plans, crime reports).
Non-governmental sources of literature included (not exclusively) the Robert Wood Johnson Foundation, the Institute for Healthcare Improvement, and the American Hospital Association. Information was also gathered from national, local, and regional news outlets (e.g., Kaiser Health News, Modern Healthcare). The project team also used literature produced by university research bodies such as the Department of Population Health Sciences at the University of Wisconsin School of Medicine and Public Policy, and Think Tanks such as the Center on Budget and Policy Priorities, Urban Institute, the Pew Research Center, and the Economic Policy Institute.
18 | 2019 - 2021 Community Health Needs Assessment
Methodology
Other Documents and Databases:
Collaborating organizations (refer to Table 2.1 for full collaborators list) also provided additional information and data. For instance, the Southwest Michigan Planning Commission provided park and trail data, and the Berrien County Health Department provided mortality rates and information pertaining to the food environment. Tertiary and supporting documentation, such as local newspapers (e.g., Herald Palladium reports on the Berrien County Trial Court) were used to support findings of the literature reviews.
Data from state and national surveys including the Michigan Behavioral Risk Factor Survey (BRFS) and the American Community Survey (ACS) were used throughout the document. They provided basic demographic information as well as data on community conditions (e.g., ages of housing structures, household incomes, vehicle ownership, and insurance status) and health care access and outcomes.
Government data on employment, wages, and other economic indicators was retrieved from the U.S. Bureau of Labor Statistics, the Federal Reserve, and the Organization for Economic Cooperation and Development. Other sources such as the U.S. Department of Agriculture, the Michigan Department of Licensing and Regulatory Affairs, and the Centers for Disease Control and Prevention (CDC) provided essential data for assessing the food environment. Datasets from the CDC and the U.S. Environmental Protection Agency were used to assess the physical environment (e.g., water, air, and land quality).
Table 2.1 Community Collaborators
Interviews, Photovoice, and Surveys Collaborators
2nd Chance Ministries
A & J Hardware Store - Baroda
Andrews University
Benton Harbor Housing Commission
Benton Harbor Police Department
Benton Harbor Soup Kitchen
Benton Harbor Township
Housing Authority
Berrien County Health Department - BH
Berrien County Health Department - Niles
Berrien County Sheriff Department
Berrien County Trail Court
Berrien RESA
Blossom Acres
Blue Water Solutions
Boys & Girls Club
Cares HIV
Coloma High School
Consortium for Community Development
Dial-A-Ride
Discount Tire
Ebenezer Baptist Church
Elite Barbershop - Benton Harbor
Emergency Shelter
Ferry Street Resource Center - Niles
First Congregational Church
Women’s Thursday Group
Foster Grandparenting Program Area Agent on Aging
Harbor Packaging
Harbor Towers
Health Department Clinic - Niles
Herald Palladium
InterCare
Lake Michigan College
Lakeland Care
Michigan State University Extension
MI-Journey
Niles - Buchanan YMCA
Niles Community Schools
New Tech Center
Niles Community Schools
Special Education
Niles District Library
Niles High School
Niles Middle School
North Berrien Senior Center
Orchards Mall
Overflow Church
River Springs Estates/Trailer Park
River Terrace High Rise Apartments
Riverwood Center
Salvation Army (Men’s Shelter)
Sandbar Grill
Shaw’s Barbershop
Spectrum Health Lakeland
Center for Outpatient Services
Spectrum Health Lakeland - Obstetrics
Spectrum Health Lakeland
Parish & Senior Center Nurses
Spectrum Health Lakeland
Scheduling - Meadowbrook
Spectrum Health Lakeland
Transport & EVS
St. Joseph Lincoln Senior Center
The OutCenter
Trinity Lutheran - Berrien Springs
Van Buren ISD
Watervliet Public Schools
Women’s Health Council
YMCA of Southwest Michigan
1 Students attending the Berrien County Mathematics and Science Center were enrolled in the following schools: Berrien Springs High School, Buchanan High School, Coloma High School, Countryside Academy, Edwardsburg High School, homeschool, Niles High School, and Watervliet High School.
spectrumhealthlakeland.org | 19
20 | 2019 - 2021 Community Health Needs Assessment

Mortality/Life Expectancy
22 | 2019 - 2021 Community Health Needs Assessment
Mortality/Life Expectancy
High Level Findings
• Life expectancy varies by as much as 19 years across Berrien County.
• The top three causes of death in Berrien County are heart disease, cancer, and cerebrovascular diseases.
• There are significant black/white death rate disparities (a measure of the difference in death rates between two groups).1, 2
Like the 2016 CHNA, the 2019 CHNA presents age-adjusted mortality (or death) rates for all 48 census tracts in Berrien County.3 Whereas the previous CHNA presented mortality rates for one year (2013), this CHNA presents a five-year analysis (2012-2016) of mortality rates at the census tract level for greater accuracy.4 Disease-specific death rates according to sex, race and ethnicity at the county level are also presented. In addition, this CHNA presents life expectancy at the census tract level.5
Life Expectancy at Birth
State and National Trends. Life expectancy at birth (life expectancy) is a measure of the number of years that a newborn is expected to live given current mortality rates. It is commonly used to examine mortality patterns and allows for comparison between populations, which can highlight inequities in health outcomes.
Figure 3.1 shows that life expectancy varies by place of residence, sex, and year of birth. In the United States, females born in 2016 have a life expectancy that is five years greater than males. However, the average life expectancy in Michigan is one year less (0.9) than that of the United States. This difference in average life expectancy between Michigan and the United States (U.S.) has been increasing since 1990.
Life Expectancy at Birth by Sex and Race, Michigan Residents, 1980-2016
Figure 3.1 Life Expectancy at Birth by Sex for Michigan and United States Residents, from 1990-2016
spectrumhealthlakeland.org | 23
77.6 80.9 72.3 76.3 71 76.1 63.6 69.9 1980 1985 1990 1995 2000 2005 2010 2015
White Female Black Female White Male Black Male
Mortality/Life Expectancy
Over the last century, life expectancy rates in the U.S. and Michigan have trended upward. However, in recent years, there has been a decrease in life expectancy at both the national and state level, particularly for males. Nationally, male life expectancy steadily decreased from 76.5 years in 2014 to 76.1 in 2017.6,7 In Michigan, male life expectancy dropped from 75.7 in 2010 to 75.4 in 2017.8 One explanation for this trend is an increase in “deaths of despair” (i.e., suicide, opioid overdoses, and cirrhosis of the liver).9 This explanation, however, overlooks the fact that the U.S. has experienced a decline in life expectancy relative to peer nations since the 1980s.10 This decline is driven in part by factors such as wage stagnation.11
Berrien County. The average life expectancy in Berrien County is 77.3 years.12 However, life expectancy varies considerably throughout the county.
Life expectancy in Lincoln Township and Berrien Springs is approximately 86 years, while in Benton Harbor and Benton Township, life expectancy is approximately 67 years. This life expectancy gap occurs between places separated by as little as 15 miles. (For more information on life expectancy and death rates by census tract, see Appendix C).
Figure 3.2 shows the geographic clustering of census tracts with low life expectancies. The darker green tracts have the lowest life expectancies. Apart from one census tract in Niles, the tracts with low life expectancies (i.e., under the age of 72) are in Benton Township and Benton Harbor.


24 | 2019 - 2021 Community Health Needs Assessment
Figure 3.2 Life Expectancy by Census Tract. Data from NVSS 2010-2015
Mortality/Life Expectancy
Age-Adjusted Mortality13
Between the years of 2007 and 2016, the age-adjusted mortality rate in Berrien County (815.6) was higher than that of the state of Michigan (795.1). The Age-Adjusted Mortality Rate table in Appendix C shows that there are significant regional variations in death rates. The county’s highest death rate is in Benton Township (1598.6), and the lowest is in Shoreham (525.9). Figure 3.3 shows that there is a geographic clustering of high death rate census tracts located in and around the city of Benton Harbor. There is one census tract in Niles that has a high death rate.


spectrumhealthlakeland.org | 25
Figure 3.3 Age-Adjusted Mortality Rate per 100,000 by Census Tract, 2012-2016
Additionally, there are significant variations in death rates among races and ethnic groups as shows in figure 3.4. For instance, the death rate for blacks (1037.7) was higher than for whites (782.9). Hispanics had a lower death rate than non-Hispanics (503.3 compared to 815.1, respectively).14
2007 - 2016 Age-Adjusted Mortality Rate per 100,000 Population due to any cause of death for the United States, Michigan, and Berrien County
Figure 3.4 Age-Adjusted Mortality Rate per 100,000 population due to any cause of death for the United States, Michigan and Berrien County, from 2007-2016 .15
26 | 2019 - 2021 Community Health Needs Assessment
886.2 740.1 544.1 760.43 983.3 765 644.3 789.39 1037.7 815.6 503.3 815.1 0 200 400 600 800 1000 1200 Black White Hispanic Non- Hispanic US MI Berrien
Mortality/Life Expectancy
Mortality/Life Expectancy
From a population health perspective, death rate disparity is an important indicator to track over time. For the purpose of this report, death rate disparity refers to the difference in the death rates between black and white individuals.
Table 3.1 shows that the death rate disparity in Berrien County is 32.5%. This means that the black death rate is 32.5% higher than the white death rate. The death rate disparity is even greater for age-adjusted premature mortality (death prior to the age of 75): the black premature death rate is 66.4% higher than the white death rate.
Disaggregating the death rates by sex reveals a 38.2% death rate disparity for black and white males, and a 29.2% death rate disparity for black and white females.
Table 3.1 Age-Adjusted Mortality Rates and Death Rate Disparity between black and white populations for any cause of death.
Death rate disparity relative to whites is = (black rate minus white rate) divided by white rate times 100
† Statistically significant difference between black and white populations.
*** Rate has been suppressed or is unreliable due to a small number of deaths.
§ Infant Mortality Rates are expressed as per 1,000 population.
spectrumhealthlakeland.org | 27
Age AAMR AAPMR <1 1 to 4 5 to 14 15 to 24 25 to 34 35 to 44 45 to 54 55 to 64 65 to 74 75 to 84 85+ White 782.9 354.3 5.7§ 42.1 13.5 81.6 127.9 172.1 422 892.6 1955.2 4970.6 14655.4 Black Male 1255.1 726.2 16.4§ *** *** 139.8 236.4 417 987.4 1863.3 3598.1 7160.9 16389.5 White Female 679.1 278.6 5.1§ *** *** 48.1 86.3 139.5 313 712.2 1595.7 4480.8 13972.6 Male Death Rate Disparity % 38.2† 67.6† 163.4† *** *** 23.7 39.9 103.7† 85.8† 72.4† 52.6† 27† 2.3 Black 1037.7 589.5 15.4§ *** *** 91.9 185.4 334.4 824.7 1539.6 2866.5 5669.8 14878.3 White Male 908.3 433.2 6.2§ *** *** 113 169 204.7 531.4 1080.5 2357.7 5639.6 16022.2 Black Female 877.7 479.2 14.2§ *** *** *** 144.2 266.9 691.1 1267.8 2320.8 4655.7 14114.1 Death Rate Disparity % 32.5† 66.4† 170.4† *** *** 12.6 45.0 94.3† 95.4† 72.5† 46.6† 14.1† 1.5 Female Death Rate Disparity % 29.2† 72.0† 178.0† *** *** *** 67.1† 91.3† 120.8† 78.0† 45.4† 3.9 1.0
Mortality/Life Expectancy
The Age-Adjusted Mortality Rate table in Appendix C and Figure 3.5 show that the death rate disparity between blacks and whites varies among age groups. The highest death rate disparity is for children under the age of one year (i.e., infants). Death rate for white infants is 5.7 (per 1,000) compared to 15.4 (per 1,000) for black infants, resulting in a disparity of 170.4%.
Among adults, the greatest disparity lies in the age ranges of 35-44, 45-54, and 55-64. In these age groups, the black death rate is respectively 94.3%, 95.4%, and 72.5% greater than the rate in whites.
For males, the greatest death rate disparity is in the 35-44 age group (103.7%) with more than double the rate for white males. For females, the greatest death rate disparity is within the 45-54 age group (120.8%), well more than double the rate for white females.
The data shows that blacks in Berrien County are dying at twice the rate of whites during primary earning years (35-54). This has significant implications for generational wealth and community-level income generation and wealth creation which impact essential health determinants, such as education, food, housing, transportation, and health care.
Death Rate Disparity (%)
28 | 2019 - 2021 Community Health Needs Assessment
20 40 60 80 100 120 140 15 to 24 25 to 34 35 to 44 45 to 54 55 to 64 65 to 74 75 to 84 85+
Figure 3.5 Death Rate Disparity among Age Groups and Sex, Berrien County, from 2007-2016.
Male and Female Male Female
Mortality/Life Expectancy
Causes of Death
Table 3.2 Top five causes of death in Berrien County, from 2007-2016.
2007-2016 Age-Adjusted Mortality Rate per 100,000 Population for Selected Leading Causes of Death for the United States, Michigan, and Berrien County 2007 - 2016 Age-Adjusted Mortality Rate per 100,000 Population for Selected Leading Causes of Death for the United States, Michigan, and Berrien County
Figure 3.6 Disease specific death rates in the United States, Michigan, and Berrien County for the combined black and white population, from 2007-2016.
In Berrien County, the leading causes of death are heart disease, cancer, cerebrovascular disease (e.g., stroke), chronic lower respiratory disease, Alzheimer’s disease and accidents.15
Figure 3.6 shows that, between 2007 to 2016, the rate of death due to heart disease in Berrien County was lower than the Michigan rate but higher than the U.S. rate. The county’s cancer death rate was comparable to the Michigan rate, but higher than the U.S. rate. Berrien County’s stroke death rate was higher than both the state and national rates.
spectrumhealthlakeland.org | 29 179.8 170.5 39.5 206.6 177.9 39.5 190.6 182.3 54.2 0 50 100 150 200 250 Heart Disease Cancer Cerebrovascular Diseases (e.g. Stroke)
Rk 1 2 3 4 5 White Female Cancer 151.4 Heart Disease 149.3 Cerebrovascular Disease 54.5 Chronic Lower Respiratory Diseases 45.3 Alzheimer’s 32.4 White Male Heart Disease 229.7 Cancer 206.9 Accidents 61 Chronic Lower Respiratory Diseases 57.8 Cerebrovascular Disease 47 Hispanic (All Races) Cancer 107.1 Heart Disease 80.6 Accidents 37.2 No Data No Data Non-Hispanic (All Races) Heart Disease 190.99 Cancer 182.17 Cerebrovascular Disease 54.36 Chronic Lower Respiratory Diseases 48.9 Accidents 45.3 Black Female Cancer 201.6 Heart Disease 201.6 Cerebrovascular Disease 66.9 Diabetes 57.7 Alzheimer’s 31.9 Black Male Cancer 301.3 Heart Disease 274.2 Cerebrovascular Disease 75.4 Diabetes 71.8 Accidents 60.4
Mortality/Life Expectancy
Heart Disease
2007 - 2016 Age-Adjusted Mortality Rate per 100,000 Population due to Heart Disease for the United States, Michigan, and Berrien County
2007-2016 Age-Adjusted Mortality Rate per 100,000 Population due to Heart Disease for the United States, Michigan, and Berrien County
Figure 3.7 Heart Disease Death Rates for the combined Sex and Race population in the United States, Michigan, and Berrien County, from 2007-2016.
Table 3.3 Heart Disease death rate disparity for the combined Sex and Race population in Berrien County, from 2007-2016. Death rate disparity relative to whites is = (black rate minus white rate) divided by white rate x 100 † Statistically significant difference between black and white populations.
In Berrien County:
• The death rate due to heart disease is lower than the rate for the state of Michigan, but higher than the U.S rate (see figure 3.6).
• White females have the lowest heart disease death rate and black males have the highest. This disparity in death rates is also evident at the state and national levels.
• The black/white death rate disparity for heart disease is 25.1% (i.e., the black heart disease death rate is 25.1% higher than that for whites).
• The black/white death rate disparity for heart disease among females (35%) is greater than the black/white death rate disparity for males (19.4%).
• For premature deaths due to heart disease, the black/white death rate disparity is 92.6%.
• The premature black/white death rate disparity due to heart disease for males is 64.2%. For females, it is 158.6%.
30 | 2019 - 2021 Community Health Needs Assessment 138.2 179.8 219.2 273.5 156.5 233.1 244.6 353.2 149.3 201.6 229.7 274.2 0 50 100 150 200 250 300 350 400 White Female Black Female White Male Black Male
Death Rate Premature Death Rate White 184.4 59.8 Black Male 274.2 136.2 White Female 149.3 38.2 Male Death Rate Disparity % 19.4† 64.23† Black 230.8 115.2 White Male 229.7 82.9 Black Female 201.6 98.8 Death Rate Disparity % 25.1† 92.6† Female Death Rate Disparity % 35.0† 158.6†
Mortality/Life Expectancy
2007-2016 Age-Adjusted Mortality Rate per 100,000 Population due to Cancer for the United States, Michigan, and Berrien County
2007 - 2016 Age-Adjusted Mortality Rate per 100,000 Population due to Cancer for the United States, Michigan, and Berrien County
Figure 3.8 Cancer Death Rates for the combined Sex and Race population in the United States, Michigan, and Berrien County 2007-2016.
Table 3.4 Cancer death rate disparity for the combined Sex and Race population in Berrien County, 2007-2016. Death rate disparity relative to whites is = (black rate minus white rate) divided by white rate x 100 † Statistically significant difference between black and white populations.
In Berrien County:
• The cancer death rate was comparable to the Michigan rate, but higher than the U.S rate.
• Black males have the highest cancer death rate, and white females have the lowest.
• White cancer death rates are comparable to state and national rates. However, black cancer death rates were higher than the national average.
• The black/white death rate disparity due to cancer is 38.5%. The black/white female disparity is 33.2% and the black/white male disparity is 45.6%.
• The premature cancer death rate disparity in Berrien County is 47.6%. The female premature death rate disparity is 39.3%, and the
is
spectrumhealthlakeland.org | 31 Cancer
male death rate disparity
59.2%. 143.1 162 200.7 248.2 150 179.2 206.6 258.7 151.4 201.6 206.9 301.3 0 50 100 150 200 250 300 350 400 White Female Black Female White Male Black Male
Death Rate Premature Death Rate White 175.1 101.2 Black Male 301.3 182.8 White Female 151.4 88.6 Male Death Rate Disparity % 45.6† 59.2† Black 242.5 149.4 White Male 206.9 114.8 Black Female 201.6 123.4 Death Rate Disparity % 38.5† 47.6† Female Death Rate Disparity % 33.2† 39.3†
Mortality/Life Expectancy
Cerebrovascular Disease
2007-2016 Age-Adjusted Mortality Rate per 100,000 Population due to Cerebrovascular Diseases for the United States, Michigan, and Berrien County
2007 - 2016 Age-Adjusted Mortality Rate per 100,000 Population due to Cerebrovascular Diseases for the United States, Michigan, and Berrien County
Figure 3.9 Cerebrovascular Disease Death Rates for the combined Sex and Race population in the United States, Michigan, and Berrien County, from 2007-2016.
Table 3.5 Cerebrovascular Disease death rate disparity for the combined Sex and Race population in Berrien County, 2007-2016.
Death rate disparity relative to whites is = (black rate minus white rate) divided by white rate x 100 † Statistically significant difference between black and white populations.
In Berrien County:
• The death rate due to cerebrovascular disease is higher than the Michigan and the U.S. rates (see figure 3.6).
• The cerebrovascular disease death rate for blacks is higher than the rate for whites, and highest for black males.
• The cerebrovascular death rate disparity in Berrien County is 36.7%. The black/white male disparity is 60.4%.
• The premature black/white death rate disparity is 145.5%. The female death rate disparity is 133%, and male death rate disparity is 158.5%.
32 | 2019 - 2021 Community Health Needs Assessment
Death Rate Premature Death Rate White 52.1 11 Black Male 75.4 30.5 White Female 54.5 10.3 Male Death Rate Disparity % 60.4† 158.5† Black 71.2 27 White Male 47 11.8 Black Female 66.9 24 Death Rate Disparity % 36.7† 145.5† Female Death Rate Disparity % 22.8 133.0†
36.7 48.4 36.9 57.3 37.3 47.9 37.6 57.2 54.5 66.9 47 75.4 0 20 40 60 80 100 120 White Female Black Female White Male Black Male
Mortality/Life Expectancy
2007-2016
Hispanic Age-Adjusted Mortality Due to Cancer and Heart Disease
Age-Adjusted Mortality Rate per 100,000 Hispanic Population for the United States, Michigan, and Berrien County
2007 - 2016 Age-Adjusted Mortality Rate per 100,000 Hispanic Population for the United States, Michigan, and Berrien County
Figure 3.10 Cancer and Heart Disease Death Rates for the Hispanic population compared to Non-Hispanics in the United States, Michigan, and Berrien County 2007-2016.
In Berrien County:
• Compared to non-Hispanics, Hispanic individuals in Berrien County have lower death rates due to cancer (107.1 vs. 182.17) and heart disease (80.6 vs. 190.99). These lower death rates mirror differences at the state and national levels, as well.
• As seen in Figure 3.10, the heart disease death rate for the Hispanic population in Berrien County is lower than the state rate but is not significantly different than the national rate.
• The Hispanic cancer death rate is not significantly different from the state or national death rate.
Limitations
The priority health conditions identified in the CHNA were obesity and mental health. However, data on mortality related to these conditions is not available at the local level. In order to ensure a sufficient sample size within sub-groups (i.e., ethnicity, race, and sex), data was aggregated to create 10-year estimates. However, this prevents analysis of trends over time. Additionally, due to small population sizes, analysis of Hispanic death rates was limited. Likewise, analysis of racial groups (besides blacks and whites) was not technically feasible due to small population sizes.
spectrumhealthlakeland.org | 33
115.7 171.5 125.7 179.93 134 177.08 149.9 205.43 107.1 182.17 80.6 190.99 0 50 100 150 200 250 Cancer (Hispanic) Cancer (Non-Hispanic) Heart Disease (Hispanic) Heart Disease (Non-Hispanic)
Mortality/Life Expectancy
1 Disparity (%) = (black rate minus white rate) divided by white rate times 100.
2 Klein, R, Huang, D., & National Center for Health Statistics Centers for Disease Control and Prevention. (2010). 3 Census Tracts are small, relatively permanent statistical subdivisions of a county with an average population of 4,000 individuals. Defining and measuring disparities, inequities, and ... Retrieved from https://www.cdc.gov/nchs/ppt/nchs2010/41_klein.pdf
3 Census Tracts are small, relatively permanent statistical subdivisions of a county with an average population of 4,000 individuals.
4 Age-adjusted mortality rate is a death rate that controls for the effects of differences in population age distributions. This controls for the influence that different population age distributions might have on health event rates. All age-adjusted mortality rates presented in this document are expressed as per 100,000 population (i.e., the number of individuals who would have died if the population for a given area were 100,000).
5 Statistical significance of data obtained through CDC WONDER was determined using the methodology outlined in the CDC’s report on racial disparities in age-specific mortality and in the National Vital Statistics Report.
6 Center for Disease Control and Prevention. (2018). Health, United States, 2017 – Data Finder. Retrieved from https://www.cdc.gov/nchs/hus/contents2017.htm#Figure_020.
7 Arias, E., Xu, J., & Division of Vital Statistics. (2019). United States Life Tables, 2017. National Vital Statistics Reports , 68(7). Retrieved from https://www.cdc.gov/nchs/data/nvsr/nvsr68/nvsr68_07-508.pdf
8 Michigan Department of Community Health. (2019). Life Expectancy at Birth by Sex Michigan and United States Residents, 1901-2018. Retrieved from https://www.mdch.state.mi.us/osr/deaths/lifeUSMI.asp
9 In a November 2018 statement, Robert R. Redfield, Director of the Centers for Disease Prevention and Control, indicated that the national trend of declines in life expectancy was largely driven by deaths from drug overdose and suicide
10 Muennig, P. A., Reynolds, M., Fink, D. S., Zafari, Z., & Geronimus, A. T. (2018). America’s Declining Well-Being, Health, and Life Expectancy: Not Just a White Problem. American Journal of Public Health, 108(12), 1626–1631. doi: 10.2105/ajph.2018.304585
11 Mishel. L,.(2015). Causes of Wage Stagnation. Retrieved from https://epi.org/publication/causes-of-wage-stagnation/
12 University of Wisconsin Population Health Institute (2019). County health rankings & roadmaps 2019. Retrieved from https://www.county healthrankings.org/app/michigan/2019/measure/outcomes/147/dat.
13 Mortality rates are calculated per 100,000. Of the 74 census tracts in Cass, Van Buren, and Berrien County, the 18 census tracts with the highest mortality rates were in Berrien County, and the census tract with the highest rate of 1598.6 is in Benton Township. Additionally, seven out of the 19 census tracts with the lowest mortality rates in the three-county area were in Berrien County, and the census tract with lowest death rate of 525.9 is in Shoreham.
14 For death rate calculations, black refers to Hispanic and non-Hispanic black or African American individuals, white refers to Hispanic and non-Hispanic whites. Hispanic and non-Hispanic counts include all races (American Indian or Alaskan Native, Asian/Pacific Islander, Black or African American, and White).
The significantly lower death rate for Hispanics merits further investigation. Some reasons could be: an overestimate of the Hispanic population (i.e., the denominator is potentially lower than the census count that this death rate is based on); the ethnicity documented on death certificates may be incorrectly determined by the coroner; a larger percentage of the Hispanic population may be first generation (with health habits associated with higher life expectancy).
15 Michigan Department of Community Health. (2019). Michigan Mortality Statistics, 2007-2016. Retrieved from https://www.mdch.state.mi.us/osr/index.asp?Id=4
34 | 2019 - 2021 Community Health Needs Assessment
Community
Voice: Mental Health and Obesity

36 | 2019 - 2021 Community Health Needs Assessment
Community Voice: Mental Health and Obesity
High Level Findings
1. Mental health concerns and obesity are the priority health needs. These findings mirror those of the 2016 CHNA.
2. Community members overwhelmingly view social and environmental factors, such as food, recreational, and physical environments; social supports and cohesion; and faith-based and spiritual practices, to be key factors that influence health.
3. The food and recreational environments, better health care resources and increased social support/cohesion were areas that respondents believed could be improved to promote better health in the community.
To determine the priority health needs resulting from the CHNA, the project team conducted a thematic analysis1 of the data gathered from surveys, interviews, and Photovoice projects.2 The analysis also highlighted the community’s perspective on current and desired resources, assets, and hopes for the future. The findings suggest that community members remain concerned about the mental wellness and environmental factors that contribute to excess weight and increase the risk for negative health outcomes.
Table 4.1 CHNA Respondent Age Range
Demographics of Respondents
The project team gathered surveys, interviews, and Photovoice data from nearly 2,000 community members. According to the American Community Survey (ACS), the median age of Berrien County residents is 42 years. The ACS reports that 51.1% of the Berrien County population is female and 48.9% is male.3 In comparison, the respondents across the three (3) methods of this survey had a median age of 45-59 years. Unlike the ACS, which asks for sex (female and male), the project team asked respondents for their identified gender. A majority of the respondents identified as female (73.49%) with 24.25% identifying as male, 0.38% as transgender, 0.38% a gender identity not listed, and 1.51% preferred not to identify.
spectrumhealthlakeland.org | 37
Number of Respondents Percentage of Respondents Under 18 98 5% 18-29 210 11% 30-44 385 21% 45-59 536 29% 60+ 629 34%
Community Voice: Mental Health and Obesity
Table 4.2 provides a breakdown of gender and racial/ethnic identities of CHNA respondents. In each racial/ethnic category, individuals who identified as female represented the majority of respondents including those who chose not to identify their race/ethnicity. It is worth noting that 20 respondents chose to neither identify their race/ethnicity or gender.
Table 4.2 CHNA Respondent Race/Ethnicity and Gender Identity Comparison
Location of Respondents
Respondents had the option to provide their address. Of the 1,891 respondents, 1,285 reported a city of residence. Most survey respondents who provided a city address reported living in Benton Harbor (31%), St. Joseph (17%), and Niles (16%).
38 | 2019 - 2021 Community Health Needs Assessment
White or Caucasian 945 258 6 6 0 Black or African American 308 145 1 2 1 Hispanic or Latino 28 12 0 0 1 Asian or Asian American 11 2 0 0 0 American Indian or Alaskan Native 9 3 0 0 0 Native Hawaiian or Pacific Islander 1 0 0 0 0 Option not listed 20 13 0 0 5 I choose not to identify 37 14 0 20 0 Female Male Transgender I choose not to identify Option not listed
Community Voice: Mental Health and Obesity
Priority Health Needs
The question “what are the biggest health issues in your community?” was used to determine the priority health needs. The question “what in your community makes it hard to be healthy?” was used to help the project team understand the circumstances (or environmental circumstances) that may be contributing to those needs.
What are the biggest health issues in your community?

According to Figure 4.1, survey respondents most frequently cited mental health concerns as the biggest health issue. Participants spoke about anxiety, depression, stress related to work and school, substance misuse, and other untreated mental illness concerns. Within these responses, the largest concerns focused on high levels of stress and access to or use of alcohol, tobacco, and other drugs (ATOD). For example, one resident responded with “Adolescent mental health and ease of access to illicit drugs (meth, heroin, cocaine)” as the biggest health issues. Another respondent noted, “I think mental health is the biggest issue in our community. Because of it, the local economy isn’t increasing, people are depressed and start bad habits, and we can’t really come together as a community.”


Youth who responded to this same question through Photovoice echoed that mental health is the biggest health issue. Students mentioned that the stress they experience comes from many places, such as school, extracurricular activities, lack of sleep, peer relationships, parents, and social media. Their responses also referenced a lack of accessible resources both in school and in the community.
spectrumhealthlakeland.org | 39
Figure 4.1 Combined responses to “What are the biggest health issues in your community?”
Figure 4.2 Photo taken by student at BCMSC
Obesity 18% Heart Disease 5% Food Environment 5% Access to Health Care 6% Mental Health 25% Diabetes 7%
Figure 4.3 Taken by student at Niles New Tech
Community Voice: Mental Health and Obesity
During the group interview with Bridge Academy Photovoice participants explained the bi-directional relationship between mental health and health behaviors. One example given was people using substances “to ease the mind when they don’t feel safe or have other activities.” Another noted that “if there aren’t youth activities, then how do kids…take out their emotions?”
The second most frequently cited health concern among the survey respondents was obesity. It should be noted that obesity is the term used by the community in surveys, Photovoice projects, and interviews conducted by the project team. However, the concept of obesity is complex. Obesity results from behaviors influenced by environmental conditions.This was recognized by respondents who noted the connection between excess weight and social determinants of health, such as access to food and recreational environments. Also, the focus on obesity as a primary indicator of health has many unintended consequences, such as low self-esteem and unhealthy cycles of weight loss.
P: What are the biggest health issues in your community?
We don’t have a place to go to get help. And we don’t want to talk about it because that makes us different. Broken. Others might be going through the same stuff, but we only see the happy faces people put on for school or on social media.
‘‘ ’’
–10th grade female student from Niles
P: What are the biggest health issues in your community?
Probably people dealing with maintaining healthy weight which leads to issues with diabetes, hypertension, heart disease, etc. Also, for many people in this community the biggest health issue is poverty.
–30 - 44 y.o., black, female
As depicted in Figure 4.4, aside from the top priority health need surrounding mental health, Photovoice participants had a different take on the needs of their community. As opposed to specific health conditions, they reported environmental factors they believed to be negatively impacting health. Their remaining top needs included concerns about public safety, the physical environment, health resources, and diminished social supports/cohesion. For instance, students made a connection between public safety and environmental factors such as having abandoned houses and buildings, a lack of street lighting, and the prevalence of drugs and violence.
Though these did not rise to the level of being a priority health need across the various data collection methods, it is worth noting that these issues are of concern to youth.
Figure 4.4 Photovoice responses to “What are the biggest health issues in your community?”
40 | 2019 - 2021 Community Health Needs Assessment 4% 37% 1% 3% 3% 4% 7% 1% 7% 10% 7% 6% 4% 6% Obesity Mental Health Diabetes Access to Healthcare Economic Conditions Food Environment Physical Environment Transportation Health Resources Public Safety Social Support/Cohesion Physical Infrastructure Housing Other Social Support/Cohesion 7% Mental Health 37% Public Safety 10% Health Resources 7% Physical Environment 7%
’’
‘‘
Community Voice: Mental Health and Obesity
What are some things in your community that make it hard to be healthy?
Figure 4.5 Combined responses to “What are some things in your community that make it hard to be healthy.”
According to Figure 4.5, the most frequent response for what makes it hard to be healthy, both among survey respondents as well as students who participated in Photovoice, was the food environment. Participants referenced the prevalence of unhealthy food options while experiencing a lack of healthy and affordable options. Within these responses, the largest concerns focused on having increased access to unhealthy fast food and restaurants, healthy food being too expensive and having a lack of access to grocery stores. For example, one resident responded “...food that is not good for you is more accessible and cheaper.”
P: What are some things in your community that make it hard to be healthy?
Everybody knows what you’re supposed to do to be healthy but if you don’t have a healthy choice, it’s not really a choice. People have to eat something.
-9th grade male BCMSC
Another noted, “...we don’t have an actual grocery store, so if you are in a bind for something quick to eat, you can choose to eat packaged food or eat at one of our ‘restaurants’ that don’t have the best options.”
Additionally, survey respondents noted the double-burden of having limited access to recreational opportunities and healthy foods. For example, a black female respondent replied, “Not many known biking or hiking trails. Plus, gym memberships are so expensive. Lastly, the availability of “unhealthy fast foods,” make it hard to be healthy, and the biggest health issue in the community is “obesity.”
spectrumhealthlakeland.org | 41
Food Environment 28% Physical Environment Mental Health 12% 8% 7% Social Support/Cohesion 7% Physical Environment Mental Health Recreation Social Support/Cohesion Physical Infrastructure Transportation Don’t know or no answer Public Safety Housing Behaviors Faith-Based Social Support/Cohesion 7% Food Environment 28% Health Care Resources 7% Physical Environment 12% Mental Health 12% Recreation 8%
‘‘ ’’
Community Voice: Mental Health and Obesity

For survey respondents and Photovoice participants,the second most frequently cited challenge was the physical environment. Responses referenced a multitude of concerns including weather, air, and water quality, litter, pollution, abandoned houses, and buildings and old factories. “The overwhelming amount of litter;” “The cracked sidewalks, litter and the abandoned buildings;” and “Pollution” are some examples of common community responses to this prompt. A 10th grade male student from Niles re responded that, “We have so many abandoned buildings… and when people come to our high school, they drive by them. How does that make our community look? I’m embarrassed. Like we don’t care enough to take care of our own community.” Another male student from Benton Harbor’s Bridge Academy stated, “There’s boarded up houses on every street. This kinda shocks some people but this is normal to me.”
The third most frequent response, for both survey respondents and Photovoice participants, was mental health related challenges or access to mental health specific resources. Participants discussed themes of work- or school-related stress, ease of access to and/or use of alcohol, tobacco, and other drugs (ATOD), and a lack of mental health resources. One respondent mentioned that, “mental health services are few and expensive.” A 9th grade female student from the Berrien County Math & Science Center (BCMSC) noted that, “many people are affected by poor mental health, but the sad truth is that most people are unable to identify what they’re dealing with, how to manage it, or how to get the help they need.”
For both survey respondents and Photovoice participants, the fourth most frequent response was the recreational environment. Within these responses, the largest concerns focused on the lack of outdoor recreational spaces such as walking, running, or biking trails. It was also noted that there is a lack of access to affordable gym memberships. One participant stated, “All wellness/recreation program[s] are provided by centers for profit, Y, South Shore, RAC, etc. Minimal community-based wellness/recreational opportunities.”
P: What are some things in your community that make it hard to be healthy?
Expense of healthy foods, not enough time in the day to maintain self-care and poor integration of multiple disciplines in health care. Sometimes to address one diagnosis I have to see three separate physicians which all may give a different diagnosis which may all be related, no one talks to each other across disciplines.
–30 - 44 y.o., white, female
Other issues such as lack of health care resources and poor social cohesion were listed as health issues. However, they did not rise to the level of a priority health need. It should be noted that while these issues individually did not meet the criteria for being a priority health need, there is increasing literature that supports the importance of improving the social environment to improve the overall health and wellbeing of communities.
Obesity and mental health were the top priority health needs in the 2016 CHNA. The persistence of these priority health needs is indicative of the slow changes in the social environments which shape health.
42 | 2019 - 2021 Community Health Needs Assessment
Figure 4.6 Photo taken by student at Bridge Academy
‘‘ ’’
Community Voice: Mental Health and Obesity
Priority Health Resources
In addition to understanding the priority health needs and the barriers to achieving optimal health, the project team sought to understand the community’s strengths and assets as they pertain to health. To learn more, the CHNA survey featured the prompt, “What in your community helps you to be healthy?” Additionally, respondents were prompted to supply the common coping skills they and those around them use to deal with hard and stressful times. These ideas will be leveraged and further explored in the Implementation Strategy.
What in your community helps you to be healthy?
Figure 4.7 Survey responses to “ What are some things in your community that help you to be healthy?”
According to Figure 4.7 and 4.9, the most frequent response among both survey respondents and Photovoice participants was the recreational environment. Respondents referred to the current availability and need for more parks and trails – places like the YMCA of Southwest Michigan, the Benton Harbor Boys and Girls Club Teen Center, and extracurricular activities such as school-based sports.

spectrumhealthlakeland.org | 43
Recreation Opportunities 46% Healthcare Resources 14% Food Environment 13% Recreation Opportunities Healthcare Resources Food Environment Social Support/Community Connection Faith Based Activities/Institutions Physical Environment Education Don’t know or no answer Physical Infrastructure Economic Factors Other Public Safety Health Behaviors Transportation Housing Social Service Health Care Resources 14% Recreation Opportunities 46% Food Environment 13%
Figure 4.8 Photo taken by student at Bridge Academy
Community Voice: Mental Health and Obesity
Social Support/Community Connection 23%
4.9 Photovoice responses to “ What are some things in your community that help you to be healthy?”
Ironically, the recreational environment was the top response to both prompts “what makes it hard to be healthy” and “what makes it easy to be healthy.” This apparent contradiction results from the fact that some elements of the recreational environment promote good health (e.g., parks and trails) and other elements of the recreational environment (e.g., cost of membership and lack of choices) are not supportive of good health. For example, a 9th grade female student at BCMSC stated, “We have some amazing walking trails, but I know other communities aren’t as lucky as ours.”
Another 10th grade male Niles student mentioned, “Yeah, the Riverwalk and skate park are great, but they can be dangerous. There’s drug dealers that like to hang out in those areas.” During the group interview, students from the Bridge Academy, while agreeing that the Boys and Girls Club Teen Center was a great resource, also said there is a need for more locations to accommodate more youth and provide more choices.
P: What are some things in your community that help you to be healthy?
Walking trails, community physical health events that also introduce the importance of healthy nutrition, and introduction to the importance of mental health and what may lead to mental health challenges.
–18 - 29 y.o., black male
P: What are the biggest health issues in your community?
Mental and physical health seems to be the biggest issue.
–18 - 29 y.o., black male
The second most frequently cited response from survey respondents was health care resources. Community members mentioned having access to doctors, hospitals, and other health care facilities and wellness centers, as well as the availability of social services and health programming.
44 | 2019 - 2021 Community Health Needs Assessment
‘‘ ’’
‘‘
’’
Recreation Opportunities 39% Social Support/Community Connection 23% Food Environment 12% Education 7% Recreation Opportunities Social Support/Community Connection Food Environment Education Healthcare Resources Other Public Safety Mental Health Support Faith Based Activities/Institutions Physical Environment Education 7% Recreation Opportunities 39% Food Environment 12%
Figure
Community Voice: Mental Health and Obesity
The second most frequently cited response from Photovoice participants was social support and/or social cohesion. Students spoke about organizations within their community, as well as the importance of their families and friends.
A 10th grade student group from Niles expressed that a healthy community is one that “feels happy, spreads love, feels safe, and one where everyone knows their neighbors.”
P: How would you improve the health of your community?
I would improve the health in my community by raising awareness and providing more education in those areas.
‘‘ ’’
–18 - 29 y.o., black male
A transgender female student at the Bridge Academy in Benton Harbor stated that The OutCenter is “a place of acceptance and pride. A shining beacon of what a community and united humanity should be.” Students in the group interview reiterated their need for more adult mentors, inclusive spaces, and opportunities to “just be kids.”

The third most frequently cited response to “what makes it easy to be healthy” for both survey respondents and Photovoice participants was the food environment. A community member stated that it is helpful “living in a community with many farms and fresh fruits and vegetables...” Another commented that “large rural areas provide access to fresh air, exercise and local produce.” Similar to the recreational environment, survey and Photovoice responses both cited food environment as being both a challenge and a resource. Responses indicated that if they had access to healthier options, or if fresh and/or healthier options were affordable and of better quality, it would help them be healthy.
4.10
Figure 4.11 Survey Responses to “Ways community members feel better/relax/destress”.
spectrumhealthlakeland.org | 45 Social Support/Cohesion Recreation Read Read Book 7% 7% 4% 3% 3% Engage in creativity/creative arts Social Support/Cohesion Recreation Faith Based Listen to Music ATOD Sleep Take a Nap Play Video Games Computer and Phone Games Go to the Beach Cook Bake Go for Drive Ride Cry Do Puzzle Games Take Vacation Travel Make a plan Focus on what matters/ It temporary and let go Get Massage Spa Day Cup of Tea Coffee Work Around the House don't know None Senior center Think positvely Take medication Listening Laugh Find another job Divorce Engage in Creativity/Creative Arts 3% Sleep/Take a Nap 3% ATOD 3% Listen to Music 4% Netflix/Watch TV/Movie 7% Med/Yoga 7% Read/Read a Book 7% Faith Based 13% Recreation 15% Social Support/Cohesion 20%
Figure
Photo taken by student at Bridge Academy
Community Voice: Mental Health and Obesity
The project team sought to understand not only the health challenges of the community, but also how community members coped with difficult times. As depicted in Figure 4.11, responses to this prompt varied widely, but social supports and activities that promote social cohesion were the most frequent. This was followed closely by recreational and faith-based or spiritual practices. One respondent captured all of these by saying “Bible reading, prayer, walks outdoors, drive down to the lake, talking with a friend, acknowledging what is stressful and grieving the loss.” Among responses related to social support/social cohesion, 667 of the responses referred to talking with a family member, friend, or spouse. Other forms of social support included volunteering and helping others. Many respondents were candid and made comments such as, “A beer and my hot tub helps;”“I EAT, can’t control myself;” and “Drink alcohol at first [then] talk to family.” The variety of responses can be attributed to people using a variety of ways to relieve stress that are not solely based on “right and wrong” or “healthy versus unhealthy,” but on what is available and effective for them.

Youth who participated in the Photovoice project also identified social supports and activities that build social cohesion as their preferred ways of handling hard or stressful times. They also referenced listening to music and other activities related to the arts as ways to relieve stress. During the group interview, when asked about relieving stress youth said, “Music helps you relax and calm down. Daydreaming and going to Lala land to take you somewhere else-flip another page.”
Like the larger, public survey results, the students were candid when they described what strategies they use.
For example, one female student stated, “When I’m super-duper stressed, I’ll go smoke some weed.” When asked to elaborate on how that activity helps her during hard times she went on to say, “When you smoke some weed it takes you to a whole different world and it makes you calm. It can be a good thing if you put it to good use: [inspiring] music, writing, thinking.”
How would you improve the health of your community?
P: When I experience hard or stressful times, these are the ways I help myself feel better/relax/calm down:
I go to sleep. I use some cannabis. I take a Xanax. I talk to a friend or a sister. I may drink some wine. I cry. Crying is a release. It helps.
–60+, white female
Figure 4.13 Survey responses to “ How would you improve the health of your community?”
46 | 2019 - 2021 Community Health Needs Assessment Recreation 12% Healthcare Resources 12% Healthcare Access 12% Social Support/Cohesion 10% Education 8% Mental Health 6% Mental Health 6% Recreation 19% Education 8% Food Environment 12% Social Support/Cohesion 10% Health Care Resources 12% Health Care Access 12%
‘‘ ’’
Figure 4.12 Photo taken by student at Bridge Academy
Community Voice: Mental Health and Obesity
In addition to identifying community assets and resources, respondents provided ideas and suggestions to improve the health of their community. These aspirations will inform the Implementation Strategy including its key activities and essential partnerships.
Among survey respondents, the most frequent theme for improving community health was recreational opportunities/environment. Responses mentioned improving access and expanding options. Specific examples included increasing the number of walking, running, and biking trails; gaining access to affordable gym memberships; and having more community exercise opportunities (both indoors and outdoors).
According to Figure 4.14, the most frequently cited response from Photovoice participants related to aspects of the physical environment. Within these responses, students mentioned repurposing abandoned buildings and houses; recycling initiatives; having more garbage and recycling bins available and serviced throughout the community; and volunteer opportunities for cleaning up litter and helping neighbors.
The second most frequently cited idea for improvement from survey respondents featured suggestions related to the food environment. Participants mentioned the desire for more affordable, high-quality, and healthy foods in stores and restaurants. To improve the health of their community, respondents would like to see “better options for going out to eat,” and residents be “provid[ed] access to affordable fresh food year round, especially to areas not near ‘major’ grocery stores.”
Alternatively, the second most frequently cited idea among Photovoice respondents was physical infrastructure. Students referenced fixing roads, sidewalks, and increasing lighting while drawing the connections between these environmental factors and their potential impact on health. For example, a common theme from students attending the New Tech Entrepreneurial Academy in Niles was the usability of sidewalks. They discussed wanting opportunities to safely exercise. For example, they expressed concern that poorly maintained sidewalks could result in injury leading to medical care and the associated cost.

spectrumhealthlakeland.org | 47 Recreation Environment 16% Food Environment 10% Social Support/Cohesion 8% Physical Infrastructure 21% Physical Environment 26% Physical Environment 26% Recreation Environment 16% Physical Infrastructure 21% Food Environment 10% Social Support/Cohesion 8%
Figure 4.14 Photovoice responses to “ How would you improve the health of your community?”
Figure 4.15 Photo taken by student at Niles New Tech
Community Voice: Mental Health and Obesity
Among survey respondents, the third most frequently cited ideas for improvement included health care resources and access to care. Survey respondents suggested having more health promotion education available in the community. Ideas regarding improved access to care included free or low-cost health care, medication and screenings and treatments; increasing the quantity, quality, and type of care providers; mobile clinics; and better insurance coverage.
Alternatively, Photovoice respondents suggested improvements to the recreational environment. Like the survey respondents, students suggested a greater variety of and more affordable options for recreational activities/facilities. A 9th grade male BCMSC student stated, “I wish my school offered intramural sports. If you get cut from the team, it’s over. You can exercise and play individual sports, but you lose the chance to play on a team.” Another 10th grade female student noted that, “I think one of the things that would help is advertising. There’s a lot that goes on, but people just don’t know about it.”
The fourth most frequently cited idea from survey respondents for improvement included promoting social support and cohesion. Over 75% of these responses indicated a need for more social services and outreach programs within their community. For example: “Offer volunteering opportunities on the news, radio and paper;” and/or “Community awareness, involvement, and action.” Additional responses relayed themes of connection. For example, “People need to care about each other” and “Everyone needs to feel wanted and loved.”
P: How would you improve the health of your community?
Maybe a few “town-wide” gatherings (or weekly gathering, think “farm market!”) to share recipes and do/show/join a group of those doing various things like trying to beat step goals or just stretching daily. Little things that add up to a lot! :) We need more CO-mmunity happening and to help one another.
–18 - 29 y.o., white, female
Photovoice respondents cited food environment. Similar to survey respondents, students would like healthy, affordable, and fresh foods available to them both at school and in the community. A male student at the Bridge Academy stated, “When you eat that greasy, fatty food, you just don’t feel good. But that’s what’s cheap. And it’s everywhere.” Another 9th grade female student from BCMSC recommended, “adding water stations throughout the school. We can’t bring bottles with liquids to school and the water in the fountains tastes nasty.”
Limitations
This portion of the CHNA was limited by the low number of male respondents and/or participants. Though the ACS reports that 51.1% of the county is female, the survey respondents for this project disproportionately identified as female (73.49%).
Another limitation related to reach. Despite Lakeland’s service area including Van Buren and Cass counties, a significant number of populations in those areas could not be reached.
In the literature review that follows, there will be continued exploration of how the social determinants of health (SDoH) impact the health of Berrien County residents. Some of these SDoH, such as social cohesion; physical, food, and recreational environments; and access to health care and resources were specifically named by respondents as being key factors that both positively and negatively impact the health of their community. Other SDoH, such as transportation, education, housing, public safety, and economic conditions were also examined in relation to their impacts on the health of the community. Within the CHNA, these SDoH will be addressed in order of importance (according to survey and Photovoice responses).
1 Thematic analysis is a method for identifying, analyzing, organizing, describing, and reporting themes found within a data set. Braun, V., & Clarke, V. (2006). Using thematic analysis in psychology, Qualitative Research in Psychology, 3:2, 77-101. DOI: 10.1191/1478088706qp063oa
2 A health need is significant based on all the facts and circumstances present in the community it serves. Any criteria to prioritize the significant health needs it identifies, including, but not limited to the: burden, scope, severity, or urgency of the health need; the estimated feasibility and effectiveness of possible interventions; the health disparities associated with the need; or importance the community places on addressing the need.
3 U.S. Census Bureau (2017). Selected Characteristics Of The Native And Foreign-Born Populations, Table S0501: 2013-2017 American Community Survey 5-Year estimates. Retrieved from https://data.census.gov/cedsci/table?q=berrien%20county,%20michigan&g=0500000US26021&tid=ACSST5Y2016. S0501&hidePreview=false
48 | 2019 - 2021 Community Health Needs Assessment
‘‘ ’’

Economy
50 | 2019 - 2021 Community Health Needs Assessment
Economy
High-level Findings
• Since 2004, fewer jobs in Berrien County offer a livable income.
• Despite employment, many individuals in Berrien County live in poverty.
• Many single parent households live below the poverty line, particularly single mothers.
Introduction
Economic factors, such as income, wealth, poverty, and employment play a key role in determining health outcomes. There are several pathways by which economic factors may either positively or negatively influence health. First, adverse economic conditions such as unemployment and low income are associated with high levels of stress. Stress is associated with poor health outcomes such as heart disease, diabetes, obesity, mental illness, breast cancer and low birthweight babies.1 Stress is also associated with the adoption of health harming behaviors such as poor dietary choices, smoking, alcohol and substance misuse, limited physical activity, and limited use of preventive medical care.2
Economic factors play a crucial role and could affect personal nutrition status and health. Economic decision factors such as food price and income do influence people’s food choices. Moreover, food costs are a barrier to healthier food choices for low-income families.
Second, economic factors affect health by shaping access to resources essential to health. Respondents to the 2019 CHNA frequently commented on the lack of affordable health care, insurance, nutritious foods, exercise opportunities, transportation, and housing. While few respondents explicitly stated that the economy was a top health concern, this concern was implicit in responses indicating that health promoting resources are unaffordable (i.e., if wages were higher, individuals could afford nutritious foods).
A third pathway by which economic factors impact health is through cumulative effects that accrue over a lifetime. Studies have shown that financial hardship endured over a lifetime can have effects on physical and cognitive functioning, psychological well-being, diabetes, and mortality.3,4 Moreover, evidence indicates that there are critical periods of life (e.g., during gestation and from birth to age 5) when economic adversity and its material and psychosocial consequences can have particularly powerful effects on health.5
Economic Conditions and Health
P: What are the biggest health issues in your community?
‘‘ ’’
I feel a lot of employers do not pay a living wage making it hard for people to have their own transportation and afford basic necessities such as healthy food.
–18 - 29 y.o., black male
According to the Small City Economic Dynamism Index, the Niles-Benton Harbor region is classified as a low economic dynamism region (i.e., limited economic growth and development). Economic Dynamism is assessed by measuring changes in indicators associated with local economic development.6 Specifically, changes in economic measures such as median household income, employment, poverty, and income inequality provide information on regional economic health.
In figure 5.1, the association between income and life expectancy is displayed. With few exceptions, census tracts with a low median income also have lower life expectancy. For example, the census tract with the lowest average life expectancy (67.6 years) was also one of the census tracts with the lowest median incomes ($19,387). Conversely, the two census tracts with the highest life expectancies had median incomes of $36,493 and $69,732.
spectrumhealthlakeland.org | 51
Economy
Median Household Income vs. Life Expectancy
Figure 5.1 Scatterplot showing Median Household income in relation to Life expectancy, From 2012 to 20167
Unemployment
The number of jobs in Berrien County decreased during the Great Recession, but in recent years has returned to approximately prerecession levels. Likewise, the unemployment rate has also improved, decreasing from 12.7% at the height of the recession in 2009 to 4.8% in 2017. However, unemployment rates vary widely within the county. For example, in Benton Harbor and Benton Township, there are four census tracts where over 20% (21.8 to 29.5%) of the population are unemployed (i.e., jobless, looking for a job, and available for work). In St. Joseph, Shoreham, Lincoln, and Lake Charter Township, this rate is 3% or lower.8
Individuals with steady employment tend to report better physical and mental health and lower stress and anxiety than do the recently unemployed. In figure 5.2, the association between unemployment and death rates is presented. Generally, census tracts with a low unemployment rate are also census tracts with low death rates.
Unemployment Rate vs. Age Adjusted Mortality Rate
Figure 5.2 Scatterplot showing Age-Adjusted Mortality Rate data in relation to Unemployment Rate in Berrien County, From 2012 to 2016
52 | 2019 - 2021 Community Health Needs Assessment
0 10000 20000 30000 40000 50000 60000 70000 80000 90000 100000 0 20 40 60 80 100 Median Household Income Life Expectancy
0 200 400 600 800 1000 1200 1400 1600 1800 0.00 5.00 10.00 15.00 20.00 25.00 30.00 35.00 Age Adjusted Mortality Rate Unemployment Rate
Economy
Employment and Wages
Since the recession, industries that have traditionally been associated with higher wages, such as manufacturing and construction, offer fewer jobs. Conversely, jobs have increased in industries associated with lower wages such as leisure and hospitality (see figure 5.3 and table 5.1 for employment trends).
The shift in employment towards the service sector likely indicates a decrease in the average annual wage for individuals in Berrien County.9
Between 2004 and 2017, the manufacturing industry in the region lost 2,213 jobs (a 14% decrease), which represents the greatest total number of jobs lost in any industry during that period. Meanwhile, the number of jobs in the leisure and hospitality industry has increased. Between 2004 and 2017 employment rose from 5,987 to 7,320, an increase of 22%.
2004 to 20177
spectrumhealthlakeland.org | 53
Figure 5.3 Trends in Employment by Privately Owned Industries in Berrien County, from
0 2000 4000 6000 8000 10000 12000 14000 16000 18000 Jan-04 May-04 Sep-04 Jan-05 May-05 Sep-05 Jan-06 May-06 Sep-06 Jan-07 May-07 Sep-07 Jan-08 May-08 Sep-08 Jan-09 May-09 Sep-09 Jan-10 May-10 Sep-10 Jan-11 May-11 Sep-11 Jan-12 May-12 Sep-12 Jan-13 May-13 Sep-13 Jan-14 May-14 Sep-14 Jan-15 May-15 Sep-15 Jan-16 May-16 Sep-16 Jan-17 May-17 Sep-17
Natural Resources and Mining Construction Manufacturing Trade, Transportation, and Utilities Information Financial Activities Professional and Buisness Services Education and Health Services Leisure and Hospitality Other Services
Employment Trends, Berrien County
Economy

Out of the industries represented in the private sector, only the manufacturing, construction and financial activities sectors have an average annual wage that is livable for a family of one adult and one child.10 All three industries have experienced job losses since 2004.
While some individuals may work part-time by choice, over 10% of leisure and hospitality industry employees nationally worked part-time involuntarily in 2015 (i.e., they would work full time if possible).11 Thus, several part-time jobs would be necessary in order to earn a livable income, which is the “earnings necessary to meet a family’s basic needs while also maintaining self-sufficiency.”8 In the Niles-Benton Harbor metro region during 2017, this amount was $22,449 for a single adult and $46,934 for one adult and one child (see table 5.2 for a breakdown of annual expenses and additional living wage estimates for varying family sizes and work situations). Part-time employees are significantly less likely to have access to benefits such as paid leave, health insurance, and retirement funds which are imperative for maintaining good health. Employee benefits allow workers to afford medical care, take time to recover from illness and maintain their quality of life as they age. Adults with health insurance are more likely to seek care than are those who are uninsured, and part-time workers are more likely to suffer financially in the event of illness. Due to the shift in the regional labor market, these benefits are becoming less available.
The leisure and hospitality industry is the lowest paying industry, paying an average annual wage of $16,569, likely reflective of the fact that the average weekly hours worked by employees in this industry is 26.1 hours.
54 | 2019 - 2021 Community Health Needs Assessment
Table 5.1 Job losses and gains in Berrien County, from 2004-20177
Economy

Table 5.2 Typical Expenses for Families in the Niles-Benton Harbor Metro Area, 201712
However, even when working 40 hours a week, the average annual income for the third largest occupation in the Niles-Benton Harbor metro area (i.e., food preparation and serving related occupations), pays less than a living wage for one adult. Four out of the top five occupations provide an average annual wage that is lower than the wage necessary to support one adult and child. These occupations include office and administrative support occupations (9,950 jobs with an average hourly wage of $15.06), production occupations (8,150 jobs with an average hourly wage of $15.63), food preparation and serving related occupations (7,190 jobs with an average hourly wage of $9.51), sales and related occupations (5,780 jobs with an average hourly wage of $11.79) (see figure 5.4 for information on wages for all major occupation groups).

spectrumhealthlakeland.org | 55
Occupation and Average Annual Wage, Assuming Fulltime Status, Niles-Benton Harbor Metro Area, 2017
Median Income and Poverty Implications
In 2016, the industry responsible for the greatest number of jobs and the highest average annual wage (i.e., manufacturing), employed a significantly greater number of men compared to women (see figure 5.5 for data on all major industries). The sector with the greatest female employment is the education and health services industry, and while this industry has a relatively high average annual wage, it is still below what is considered a living wage for an adult with a child. This could partially explain why an estimated 6.9% of employed men and 11.9% of employed women live below the federal poverty level in Berrien County.14
56 | 2019 - 2021 Community Health Needs Assessment
Figure 5.4 Employment and Average Annual Wage, Niles-Benton Harbor Metro Area, 201713
$$10,000 $20,000 $30,000 $40,000 $50,000 $60,000 $70,000 $80,000 $90,000 $100,000 0
4,000 6,000 8,000 10,000 12,000 Average Annual Wage Number of Jobs
Economy
2,000
Jobs Living Wage for One Adult Living Wage for One Adult and One Child Average Annual Income
2012-2016 Industry by Sex, Public and Private Sectors Combined
Figure 5.5 Industry by Sex, Public and Private Sectors Combined, from 2012-201615
In Berrien County, women are primarily employed in office and administration occupations and sales occupations. Both of these occupations pay less than a living wage for a child and adult (see figure 5.6 for information on all major occupation categories). Conversely, men are primarily employed in production occupations and management occupations, both of which pay a higher wage than the occupations predominantly occupied by women. However, production occupations are the top employer of men in the county and the average annual income for this occupation is below a living wage for an adult with a child.16
spectrumhealthlakeland.org | 57
0 2000 4000 6000 8000 10000 12000 14000
Male Female
Economy
Economy
Figure 5.6 Employment and Average Annual Income by Occupation, Niles-Benton Harbor Metro Area, 2017 11
Considering the impact of income on childhood development, the large number of single parents living in the region makes the lack of well-paying jobs concerning. Over one-third of family households (households comprised of at least one adult and related child) are headed by a single parent, and a considerable proportion of single parent households live below the poverty line, particularly single mothers. An estimated 24% of single father households and 48.3% of single mother households are in poverty. Additionally, poverty disproportionately affects black and Hispanic children; 54% of black children and 40% of Hispanic children live in poverty compared to 16% of white children.17
The percent of the employed white and black populations working in each industry is similar; however, there is a difference in the median earning for white and black workers. From 2012 to 2016, on average, black workers earned half of what white workers earned ($15,408 versus $30,859). These differences remain for full time workers. White females working full time earned on average $36,968 and black females earned $24,690. Black males working full time earned $29,031 compared to white males who earned $50,570 on average.
58 | 2019 - 2021 Community Health Needs Assessment
$$10,000 $20,000 $30,000 $40,000 $50,000 $60,000 $70,000 $80,000 $90,000 $100,000 0 1000 2000 3000 4000 5000 6000 7000 8000 9000 10000 Average Annual Wage Number of Employees Sex by Occupation, Occupation Average Annual Income, and Living
Female Estimate Male Estimate Median Annual Income living wage living wage $46, 934 $ 22,449
Wages
Economy
Income Inequality
Income inequality refers to an unfair distribution of income within a population. According to a 2018 report by the Economic Policy Institute, Michigan ranks 15 out of the 50 states in terms of income inequality (as measured by comparing the average income of the top 1% and the average income of the bottom 99%).18 Put another way, only 14 states have a more inequitable distribution of income than Michigan. The report also notes that Berrien County ranks 278 in terms of income inequality among the nation’s 3,061 counties; that is, income is more inequitably distributed in Berrien County than in 90 percent of all counties in the United States. Using another measure of income inequality – the Gini Coefficient, Berrien County is found to have one of the highest rates of income inequality in Michigan, ranking 77 out of 83 counties.
P: What are some things in your community that make it hard to be healthy?
The lack of opportunities for meaningful employment for a part of our population leads to depression and substance abuse.
–60+ y.o., white male
P: How would you improve the health of your community?
The health of our community will improve when everyone can get a job that allows him/her to support himself and his family. If you are struggling to survive, there is very little incentive to go to the gym to work out.
–60+ y.o., white male
Documented effects of income inequality include increased risk of self-rated poor health and increased cardiovascular disease risks.19 Income inequality is also independently associated with higher health care expenditures and more health care use, with increases in both potentially discretionary procedures and in potentially preventable admissions and with higher rates of hospitalizations for ambulatory care-sensitive conditions.20
Income inequality can also accentuate differences in social class and status and serve as a social stressor, which has adverse health effects. Income inequality is particularly harmful to the health of lower income people.21
Limitations
Average annual income by occupation and industry is only available at the national level making comparing the average wage between industries difficult (e.g., not all workers in the construction industry make over $50,000 a year). Additionally, the various data sources used in this chapter (e.g., American Community Survey and the Current Employment Statistics Survey) did not use the same collection methods resulting in slightly different estimates depending on the data source.
Communities with greater income inequality can experience a loss of social connectedness, as well as decreases in trust, social support, and a sense of community for all residents.
1American Heart Association News. (2014). Stress and Heart Health. Retrieved from https://www.heart.org/en/healthy-living/healthy-lifestyle/ stress-management/stress-and-heart-health
2Egerter, S., Braveman, P., & Barclay, C. (2019). Stress and Health. Retrieved from https://www.rwjf.org/en/library/research/2011/03/how-social-factorsshape-health.html
3Kahn, J. R., & Pearlin, L. I. (2006). Financial Strain over the Life Course and Health among Older Adults. Journal of Health and Social Behavior, 47(1), 17–31. doi: 10.1177/002214650604700102
4Luo, Y., & Waite, L. J. (2005). The Impact of Childhood and Adult SES on Physical, Mental, and Cognitive Well-Being in Later Life. The Journals of Gerontology: Series B, 60(2). doi: 10.1093/geronb/60.2.s93
5Currie, J., & Stabile, M. (2002). Socioeconomic Status and Health: Why is the Relationship Stronger for Older Children? doi: 10.3386/w9098
spectrumhealthlakeland.org | 59
‘‘
’’
‘‘ ’’
Economy
6 Federal Reserve Bank of Atlanta. (2019). Small City Economic Dynamism Index Version 3. Retrieved from https://www.frbatlanta.org/-/media/ documents/community-development/data/small-city-economic-dynamism/small-city-economic-dynamism-index_data-table.pdf
7 U.S. Census Bureau (2016). Income In The Past 12 Months (S1901), 2012-2016 American Community Survey 5-year estimates. Retrieved from https:// data.census.gov/cedsci/table?q=%20income&tid=ACSST5Y2016.S1901&t=Income%20%28Households,%20Families,%20Individuals%29&vintage= 2018&hidePreview=true&y=2016&g=0500000US26021.140000
8 U.S. Census Bureau (2016). Employment Status(S2301), 2012-2016 American Community Survey 5-year estimates. Retrieved from https://data. census.gov/cedsci/table?tid=ACSST5Y2018.S2301&g=0500000US26021.140000&vintage=2018&t=Employment%20and%20Labor%20Force%20 Status&hidePreview=false&layer=VT_2018_140_00_PY_D1&cid=S2301_C01_001E
9 U.S. Bureau of Labor Statistics (2017). Quarterly Census of Employment and Wages database, 2004- 2017 Trends in Employment by Privately Owned Industries in Berrien County. Retrieved from https://data.bls.gov/PDQWeb/en
10Glasmeier, A. (2004). Living Wage calculator. Retrieved from https://livingwage.mit.edu/pages/about 11Golden, L. (2016). Still falling short on hours and pay: Part-time work becoming new normal. Retrieved from https://www.epi.org/publication/stillfalling-short-on-hours-and-pay-part-time-work-becoming-new-normal/?_sm_au_=iHVPrFTqDpjV07HQ1jQ8kKQ3M1G31
12Living Wage calculator. (2020). Living Wage Calculation for Niles-Benton Harbor, MI. Retrieved from https://livingwage.mit.edu/metros/35660
13U.S. Bureau of Labor Statistics. (2018). Niles-Benton Harbor, MI - May 2017 OES Metropolitan and Nonmetropolitan Area Occupational Employment and Wage Estimates. Retrieved from https://www.bls.gov/oes/2017/may/oes_35660.htm
14U.S. Census Bureau (2016). Poverty Status In The Past 12 Months (S1701), 2012-2016 American Community Survey 5-year estimates. Retrieved from https://data.census.gov/cedsci/table?g=0500000US26021.140000&tid=ACSST5Y2016.S1701&t=Income%20and%20Poverty&hidePreview= false&vintage=2018&layer=VT_2018_140_00_PY_D1&cid=S1701_C01_001E
15U.S. Census Bureau (2016). Sex By Industry For The Civilian Employed Population 16 Years And Over (C24030), 2012-2016 American Community Survey 5-year estimates. Retrieved from https://data.census.gov/cedsci/table?q=C24030%3A%20SEX%20BY%20INDUSTRY%20FOR%20THE%20 CIVILIAN%20EMPLOYED%20POPULATION%2016%20YEARS%20AND%20OVER&url=https%3A%2F%2Ffactfinder.census.gov%2Ffaces%2Fnav%2Fjs f%2Fpages%2Findex.xhtml&tid=ACSDT1Y2018.C24030&g=0500000US26021&hidePreview=true
16U.S. Census Bureau (2016). Occupation By Sex For The Civilian Employed Population 16 Years And Over (S2401), 2012-2016 American Community Survey 5-year estimates. Retrieved from https://data.census.gov/cedsci/table?q=S2401&tid=ACSST5Y2016.S2401&g=0500000US26021&hidePre view=true&vintage=2018&layer=VT_2018_050_00_PY_D1&cid=S2401_C01_001E
17University of Wisconsin Population Health Institute (2019). County health rankings & roadmaps 2019. Retrieved from https://www.county healthrankings.org/app/michigan/2019/measure/outcomes/147/dat.
18Sommeiller, E., & Price, M. (2018). The new gilded age: Income inequality in the U.S. by state, metropolitan area, and county. Retrieved from https:// www.epi.org/publication/the-new-gilded-age-income-inequality-in-the-u-s-by-state-metropolitan-area-and-county/
19Adjaye-Gbewonyo, K., Kawachi, I., Subramanian, S. V., & Avendano, M. (2018). Income inequality and cardiovascular disease risk factors in a highly unequal country: a fixed-effects analysis from South Africa. International Journal for Equity in Health, 17(1). doi: 10.1186/s12939-018-0741-0
20López, D. B., Loehrer, A. P., & Chang, D. C. (2016). Impact of Income Inequality on the Nations Health. Journal of the American College of Surgeons, 223(4), 587–594. doi: 10.1016/j.jamcollsurg.2016.07.005
21Thoma, M. (2015, March 6). How inequality harms health -- and the economy. Retrieved from https://www.cbsnews.com/news/inequality-is-badfor-health-and-bad-for-the-economy/
60 | 2019 - 2021 Community Health Needs Assessment

Health Care
62 | 2019 - 2021 Community Health Needs Assessment
Health Care
High-Level Findings
• In Berrien County there are shortages of health care providers for primary, dental, and mental health care.
• Increasing costs of health care insurance limits access to health care resources.
• The quality of health care is high in some categories and very competitive with national benchmarks. However other categories require improvement.
Introduction
Health care resources include care providers, such as physicians, nurses, and lab technicians; public and private insurance; facilities such as pharmacies, clinics, and hospitals; health education; and many other services and facilities that provide medical care and information to individuals and communities. The findings of the CHNA indicate that many Berrien County residents have limited access to health care resources. This is largely due to challenges related to the availability of care, the affordability of care, and the quality of care that is provided. The survey results highlighted common themes such as limited access to mental health care and affordable substance abuse treatment; long wait times for specialty care; not enough family practices; and too few opportunities for health education.1
Availability of Care
P: What in your community makes it hard to be healthy?
Extremely lacking in mental health services in our community. Riverwood availability is almost non-existent. If you call for an appointment, you will probably have to wait 30 days to get one.
–60+ y.o., male, undisclosed race
The Health Resources and Services Administration (HRSA) of the U.S. Department of Health and Human Services designates some populations and geographic areas as Health Professional Shortage Areas (HPSA). HPSAs have shortages of primary, dental, and/or mental health care. Berrien County has five primary care HPSAs, five dental care HPSAs, and five mental health care HPSAs. Additionally, Berrien has been designated by the state to be a low-income population HPSA for primary and dental care, and a high needs HPSA for mental health care.2

HRSA also designates Medically Underserved Areas and Populations (MUA/P) which have shortages of primary care providers, high infant mortality, high poverty, or a high elderly population.3 In addition to its federal designation as an MUA, Berrien County has been designated by the state of Michigan as primary care MUA.2,4 The county has two primary care MUAs: Benton Harbor City and Chikaming Township.
The results of the 2018-2019 Behavioral Risk Factor Survey (BRFS) show that 18.8% of Berrien County adults do not have a personal doctor or health care provider. According to the County Health Rankings, the ratio of the Berrien County population to primary care physicians increased between 2010 and 2017 from 1,215:1 to 1,307:1. This means that over the seven year period, the number of county residents served by one physician increased, leading to a reduced availability of primary care providers. Moreover, in 2017, the availability of primary care physicians in the county was more limited than the state average of 1,280:1.5
During the same period, the ratio of dental care providers fell from 2,036:1 to 1,732:1, suggesting an increase in the availability of providers. However, in 2017, the dental care ratio remained considerably higher than the state average of 1,340:1.5
spectrumhealthlakeland.org | 63
‘‘ ’’
Figure 6.1 Taken by male student at Bridge Academy
Health Care
In 2019, the ratio of the population to mental health care providers in Berrien was 450:1 compared to a state average of 370:1, suggesting that the availability of mental health care in the county is considerably more limited when compared to the rest of the state.5
P: What are the biggest health issues in your community?
Lack of doctors in various specialties as well as primary doctors and distances one must travel in order to receive care.
–60+ y.o., white, female
National shortages in key health care professions play a role in limiting the availability of health care professionals. Other significant factors limiting availability in Lakeland’s service area include skill limitations of the local labor market; difficulty attracting diverse talent to a rural community; uncompetitive pay when compared to larger and urban markets; and a lack of opportunities for job mobility.
Availability of care is also determined by the location of services and facilities. Figure 6.2 shows the location of medical facilities. Most facilities are in areas where a high percentage of households have vehicle access. There are relatively few facilities in areas with low vehicle access, such as Benton Harbor and Benton Heights. There is a public transportation system in Berrien County, comprised of four distinct services but it is fractured and, according to survey responses, does not operate effectively.


64 | 2019 - 2021 Community Health Needs Assessment
‘‘ ’’
Figure 6.2 Map of medical facilities and areas with low vehicle access
Health Care
Affordability of Care
Many factors impact the affordability of health care. Cost of care is a major factor. The results of the 2018-2019 Behavioral Risk Factor Survey (BRFS) suggest that 13.7% of Berrien County residents, compared to 11.7% statewide, did not see a doctor due to high cost.6
Table 6.1 shows that the cost of health care in the county increased each year between 2012 and 2016 and declined in 2017 and 2018. However, from 2012 – 2018, health care costs in Berrien remained below the state average, according to the 2020 County Health Ranking.
Table 6.1 Access to Care: Cost of Care: Based on Price-adjusted Medicare Reimbursements, Parts A & B, per enrollee5
Without health care insurance, the cost of health care exceeds the capacity of many Berrien residents, forcing them to go without needed care and increasing the risk of illness, disability, and even death. Even with insurance, the out-of-pocket costs of care, such as deductibles, coinsurance, and copayments, can be so burdensome as to discourage some people from seeking care when needed. Research shows that adults who are uninsured are over three times more likely than insured adults to say they have not had a visit about their own health to a doctor or other health professional’s office or clinic in the past 12 months. They are less likely to receive recommended screening tests such as blood pressure, cholesterol, colon, blood sugar screenings; and pap smears or mammograms (among women). They are more likely to delay or neglect prescription drugs. Because they are less likely to receive needed follow-up screenings when compared to the insured, they are more likely to be diagnosed at later stages of diseases, including cancer, and have higher mortality rates. As seen in figure 6.3, the uninsured also have higher mortality rates because when hospitalized, they receive fewer diagnostic and therapeutic services than those with insurance.7
P: What in your community makes it hard to be healthy?
Outrageous prices for everything. Not affordable even with insurance. Have to choose between medical care and basic needs.
–60+ y.o., white, male
Age Adjusted Mortality Rate vs. Uninsured
Figure 6.3 Scatterplot showing Age-Adjusted Mortality Rate data in relation to Uninsured Rate in Berrien County, From 2014 to 2018
spectrumhealthlakeland.org | 65
‘‘ ’’ Avg Health Care Cost 2012 2013 2014 2015 2016 2017 2018 Berrien County $8,893 $9,100 $9,452 $8,790 $9,019 $8,895 $8,790 0 200 400 600 800 1000 1200 1400 1600 1800 0 5 10 15 20 25 Age Adjusted Mortality Rate Percent Uninsured
Health Care
Health insurance is provided by both public and private bodies. Roughly 41% of the county’s population is covered by some form of public or government-provided insurance including Medicare (21.3%), Medicaid (23.2%), and/or Military/Veterans Administration (2.5%). About 67% of the Berrien population is covered by some form of private insurance such as employer-sponsored (54.1%), direct purchase (15.7%), and military health (1.3%).8,9,10
P: What in your community makes it hard to be healthy?
Cost of health insurance premiums, health providers no longer accepting insurance for some services, people will tend to do without medications if cost is too high.
–45 - 59 y.o., white, female
The costs of both public and private insurance have increased in recent years. Average annual premiums and out-of-pockets costs have increased at rates that have outpaced the growth of worker wages.11 Similarly, Medicare premiums, deductibles, and coinsurance costs have also increased.12 Even with health care insurance, access to care may be restricted by coverage limitations on medications, procedures, and care providers. Coverage may be partial, or it may be completely unavailable.
According to recent census data, about 92% of Berrien County residents are insured, slightly lower than the insured rate for the state of Michigan which is 94%. Women in the county are slightly more likely to be insured than men (93% vs. 91%). Whites are insured at higher rates than blacks and Hispanics (93%, 90%, and 79% respectively). Roughly 97% of people with a college degree are insured compared to 85% of those with less than a high school diploma. Among those with annual earnings of less than $25,000, about 88.9% are insured compared to 96% of those with earnings that exceed $100,000. Among age groups, people between the ages of 26 and 34 have the lowest rate of insurance (85%), and people over the age of 75 have the highest rate (100%).13
People with more education are more likely to have some form of health insurance.
Among Michigan’s 83 counties, only about one third have higher rates of uninsured people than Berrien County. According to most recent census estimates, 7.8% of Berrien residents are uninsured. Men are more likely to be uninsured than women (9% vs. 6.7%). The rate of uninsured blacks is about 10.3%, compared to 7.1% of whites, and 21.2% for Hispanics. The uninsured rate is higher for people with less than a high school diploma (14.7%) compared to people with a college degree (4.1%). Among the employed, the uninsured rate is 10.3% compared to 24.4% among the unemployed.13
Quality of Care
Access to health care resources is also impacted by the quality of care provided. Quality health care is effective, safe, efficient, patient-centered, equitable, and timely. Quality measures are used to assess health care processes and outcomes, patient perceptions of care and organizational structure, and/or systems that determine the ability to provide high-quality health care and/or that relate to one or more quality goals for health care. The quality of care is increasingly important as the health care system moves towards value-based reimbursement models.

66 | 2019 - 2021 Community Health Needs Assessment
’’
‘‘
Figure 6.3 Taken by male student at Bridge Academy
Health Care
According to the County Health Rankings, Berrien ranked 29 out of 83 counties (the top 3rd) in terms of the quality of clinical care – a significant improvement over the ranking of 53 in 2015. One of the key measures of clinical quality is preventable hospitalizations. Between 2012 and 2017, preventable hospitalizations, a standard measure of the quality of care, declined from 5,057/100,000 to 3,761/100,000. During that same period, the rate has remained well below state and national averages. However, the impressive figures mask significant disparities, which is a key quality indicator. The rate of preventable hospital stays for whites is 3,501/100,000 compared to 6,880/100,000 for blacks.5
Each year, Spectrum Health Lakeland (SHL) issues a State of Quality report that summarizes the health system’s performance in four key areas: readmissions, mortality, patient satisfaction, and complications (infections & patient safety indicators). Some notable achievements include hospital readmission rates in the top quartile, improving mortality rates, and historical successes in patient satisfaction. However, there are opportunities for improvement.
Hospital readmissions are tracked in six health conditions: heart attack, heart failure, chronic obstructive pulmonary disease (COPD), pneumonia, and hip and knee replacement. Between July 2015 and June 2018, Lakeland Medical Center, Saint Joseph achieved hospital readmission rates that were in the top performance quartile, performing better than 75% of all hospitals nationwide. While heart attack readmissions increased between July 2018 and June 2019, readmission rates for heart attacks between 2012 and 2019 decreased from 25% to 13%. In fiscal year 2020, SHL became one of less than 10% of hospitals nationwide to avoid financial penalties for readmissions by the Centers for Medicaid and Medicare Services of the US. Department of Health and Human Service (CMS). A collaborative approach between hospital and ambulatory services has resulted in a three‐year run of top quartile performance. The average percentile rank of these programs for the last three years has been 84th, 93rd, and 89th.14
SHL tracks mortality rates across five health conditions: heart attack, heart failure, chronic obstructive pulmonary disease (COPD), pneumonia, and stroke. The mortality rate for heart attacks at SHL ranked in the bottom performing decile between 2013 through 2016. After a slight favorable increase, the health system’s heart attack mortality rate increased in 2019 and is poised to land in the bottom decile in 2021.15
In June 2018, the 30‐day mortality rate for all patients was 5.1% lower than the preceding six years. The inpatient, in‐house mortality rate was 1.63%, the second lowest in the preceding six years. Historically, the mortality rates for heart failure and pneumonia are higher than average. Heart attack, stroke, and COPD all have lower than average mortality rates. In 2018, the COPD death rate was the lowest since mortality data started being collected at the 53rd percentile. The stroke mortality rate is in the top performing decile and is projected to stay in that category for the foreseeable future. Heart failure and pneumonia both suffer worse than average rates of mortality. Both sit in the bottom quartile of performance.15
The Hospital Consumer Assessment of Healthcare Providers and Systems (HCAHPS) survey is used to measure patient experience. There are three categories of patient experience: overall hospital rating and likelihood to recommend; nurse and physician communication; and responsiveness and care transitions. In 2014, the overall hospital rating was high; 76% of the survey respondents rated SHL at least 9 out of 10. In 2015, 2016, and 2017, they gave the hospital high ratings – 74%, 73%, and 73%, respectively. In 2018 and 2019, SHL ranked below the 50th percentile in patient satisfaction.16
To assess nurse and physician communication, patients are asked three questions:
1. How often did your nurses/doctors treat you with courtesy and respect?
2. How often did nurses/doctors listen to you carefully?
3. How often did nurses/doctors explain things in a way you could understand?
Significantly, nurse and physician communication correlate with patients’ overall rating of the hospital. Both nurse and physician scores have dropped significantly in recent years, down to the 3rd decile, though the nurse scores rebounded slightly in 2018. In 2019, both nurse and physician scores dipped to historical lows.16
spectrumhealthlakeland.org | 67
Health Care
In recent years, care transitions and responsiveness have been slightly better than average but are projected to be below the 50th percentile in 2020. To assess responsiveness and care transitions, patients are asked five questions, the answers to which correlate with patients’ likelihood to recommend scores.
The questions are:
1. How often did you get help soon after pressing your call light?
2. When you needed it, did you get help with a bedpan/to the bathroom?
3. Staff took my preferences and those of my family or caregiver into account in deciding what my health care needs would be when I left.
4. When I left, I had a good understanding of the things I was responsible for in managing my health.
5. When I left, I clearly understood the purpose for taking each of my medications.
These surveys are a direct line of feedback from patients and families which inform initiatives within the system to improve quality of care.16
Complications fall into two categories: Hospital Acquired Infections (HAI) and Patient Safety Indicators (PSI). Due to national improvements in HAI and PSI rates, and recent declines in SHL performance, SHL’s overall ratings are at risk for poor performance. Among the five HAI categories, three are rated in the bottom quartile. On the other hand, for the fifth year in a row, SHL avoided CMS penalties for HAI. Among the five PSI measures, two are rated in the top performing quartile, one is rated at 50%, and two are rated in the bottom quartile.17
Officials at SHL note dissatisfaction with average and underperforming quality outcomes. Some of the efforts to improve the quality of care include eliminating HAIs, reducing readmissions by strengthening clinical collaborations, improving the patient experience, and improving health by helping patients better manage and live with diabetes and hypertension. Other actions include SHL’s involvement in a Blue Cross Blue Shield of Michigan’s Collaborative (including other hospital systems, health care providers, and patients) focused on improving patient care; monthly Clinical Quality Scans to benchmark complication, mortality, and readmission rates with state and national hospitals and mine opportunities for quality improvement; and prioritizing team member safety, to ensure that the Zero Harm mindset extends beyond the patient to team member experience.18
Limitations
This chapter has several limitations. First, SHL’s State of Quality reports aggregate data that obscures disparities that, if highlighted, provide opportunities for significant quality improvements. For instance, while Berrien County’s clinical outcomes are competitive with other counties, the significant racial disparity in preventable hospitalizations provides insight into the kinds of interventions the health system might undertake to further improve clinical rankings. The lack of disaggregated data begs a series of unanswered, but critical, questions such as what other disparities exist, what have been recent trends, and how do they compare to national data. Going forward, it will be important to disaggregate the data to determine best where and how to intervene to improve quality outcomes.
Second, localized quality benchmark data that is adjusted for the socio-economic conditions (e.g., poverty) is difficult to find. Therefore, SHL’s quality data is benchmarked against federal quality measures which are based on claims data for the nation’s Medicare beneficiaries.19 While not ideal, federal benchmarks provide useful metrics against which to compare SHL’s quality outcomes to that of other health systems nationwide.
68 | 2019 - 2021 Community Health Needs Assessment
Health Care
It is important to note that SHL serves a larger proportion of “dual eligible” patients than most hospitals, meaning it serves a high percentage of people who are eligible for both Medicaid and Medicare – a higher percentage of people over the age of 65 and a higher percentage of low-income people. Both advanced age and poverty pose widely acknowledged challenges to quality outcomes. Nevertheless, when compared to its peers nationwide, SHL frequently achieves above average quality scores.
Finally, this chapter has merely touched on the challenges of availability, affordability, and quality of health care, which are among the priority needs highlighted by community members. It presents only a small snapshot of the health care resources landscape of Berrien County. A more comprehensive discussion would include, for instance, a deeper dive into how and why social factors such as health literacy, education levels, income, transportation, and the location decisions of health care providers impact the availability of health care; the impact on the cost of care resulting from the immense, complex, and ever changing nature of the insurance industry; and disaggregation of quality data to better discover where opportunities for improvement lie.
1 Health education is defined as any combination of learning experiences designed to help individuals and communities improve their health, by increasing their knowledge or influencing their attitudes.
2 Bureau of Health Workforce, Health Resources and Services Adminstration (HRSA), U.S. Department of Health & Human Services. (2020). Designated Health Professional Shortage Area (HPSA) Statistics. Retrieved from https://data.hrsa.gov/tools/shortage-area/hpsa-find
3 MUAs and MUPs are determined by the HRSA by measuring 4 variables: (1) ratio of PCPs per 1000 population, (2) infant mortality rate, (3) percentage of the population below the poverty level, and (4) percentage of the population age 65 or over. In a given area or population, each of these variables is measured and then converted to a weighted value using conversion tables. Morelli V. An Introduction to Primary Care in Underserved Populations: Definitions, Scope, and Challenges. Primary Care. 2017 Mar;44(1):1-9. DOI: 10.1016/j.pop.2016.09.002.
4 Governor’s Designated Secretary Certified Shortage Areas for Rural Health Clinics are areas that a state Governor or designee designates as having a shortage according to the state-established shortage plan for the establishment of a Rural Health Clinic.
5 University of Wisconsin Population Health Institute (2020). County health rankings & roadmaps 2020. Retrieved from https://www.county healthrankings.org/app/michigan/2020/rankings/berrien/county/outcomes/overall/snapshot
6 Berrien County Health Department. (2020). 2018-2019 Berrien County Behavioral Risk Factor Surveillance Survey. Retrieved from https://berriencounty.org/ArchiveCenter/ViewFile/Item/528.
7 Garfield, R., Orega, K., & Demico, A. (2019). The Uninsured and the ACA: A Primer – Key Facts about ... Retrieved from https://www.kff.org/uninsured/ report/the-uninsured-and-the-aca-a-primer-key-facts-about-health-insurance-and-the-uninsured-amidst-changes-to-the-affordable-care-act/
8 The percentage of people who have private and public health insurance exceed 100% because some individuals have both public (e.g., Medicare) and private (e.g., direct purchase) insurance.
9 U.S. Census Bureau (2018). Public Health Insurance Coverage By Type And Selected Characteristics (S2704), 2014-2018 American Community Survey 5-year estimates. Retrieved from https://data.census.gov/cedsci/table?q=health%20insurance%20coverage%20in%20Berrien%20County,%20Michigan &g=0500000US26021&tid=ACSST5Y2018.S2704&vintage=2018&t=Health%20Insurance&layer=VT_2018_050_00_PY_D1&cid=S2704_C01_001E 10U.S. Census Bureau (2018). Private Health Insurance Coverage By Type And Selected Characteristics (S2703), 2014-2018 American Community Survey 5-year estimates. Retrieved from https://data.census.gov/cedsci/table?q=S2703%3A%20PRIVATE%20HEALTH%20INSURANCE%20COVERAGE %20BY%20TYPE%20AND%20SELECTED%20CHARACTERISTICS&g=0500000US26021&tid=ACSST5Y2018.S2703&layer=VT_2018_050_00_PY_ D1&cid=S2704_C01_001E&vintage=2018&hidePreview=true
11Claxton, D., Rae, M., Damico, A., Young, G., & Mcdermott, D. (2019). 2019 Employer Health Benefits Survey - Summary of Findings. Retrieved from https://www.kff.org/report-section/ehbs-2019-summary-offindings/ 12Centers for Medicare & Medicaid Services. (2019). 2019 Annual Report Of The Boards Of Trustees Of The Federal Hospital Insurance And Federal Supplementary Medical Insurance Trust Funds Communication. Retrieved from https://www.cms.gov/Research-Statistics-Data-and-Systems/ Statistics-Trends-and-Reports/ReportsTrustFunds/Downloads/TR2019.pdf
13U.S. Census Bureau (2018). Selected Characteristics Of Health Insurance Coverage In The United (S2701), 2014-2018 American Community Survey 5-year estimates. Retrieved from https://data.census.gov/cedsci/table?q=S2701%3A%20SELECTED%20CHARACTERISTICS%20OF%20HEALTH%20 INSURANCE%20COVERAGE%20IN%20THE%20UNITED%20STATES&hidePreview=true&tid=ACSST5Y2018.S2701&g=0400000US26
14Spectrum Health Lakeland. (2019). State of Quality report: CMS’ Hospital Readmission Reduction Program. St Joseph, Michigan: Getty, M., Kendall, T. 15Spectrum Health Lakeland. (2019). State of Quality report: CMS’ 30 Day Mortality Metrics. St Joseph, Michigan: Getty, M., Kendall, T. 16Spectrum Health Lakeland. (2019). State of Quality report: The Patient’s Experience Matters. St Joseph, Michigan: Getty, M., Kendall, T. 17Spectrum Health Lakeland. State of Quality report: Hospital Acquired Infections and Patient Safety Indicators. St Joseph, Michigan: Getty, M., Kendall, T. 18Spectrum Health Lakeland. State of Quality report: State of Quality Report Executive Summary. St Joseph, Michigan: Getty, M., Kendall, T.
spectrumhealthlakeland.org | 69
Name
Lakeland Medical Center, St. Joseph
Lakeland Hospital Watervliet
Lakeland Hospital Niles
Orchard Grove Nursing & Rehabilitation Center
Royalton Manor, LLC
Coventry House Inn
Pine Ridge - Rehabilitation & Nursing Center
West Woods of Bridgman
Riveridge Rehabilitation & Healthcare
Chalet of Niles, LLC
West Woods of Niles
Intercare Community Health Network
Mercy Family Medical Center Intercare
Intercare Women’s Health Center
Solis Memorial Health Center
Niles Community Health Center
Cassopolis Family Clinic
Niles Community Health Center Dental Clinic
Battle Creek VAMC
Spectrum Health Lakeland (Behavioral Health Unit)
Berrien County Mental Health Authority (Riverwood Center)
Harbortown Treatment Center, PLLC
Sacred Heart/Serenity Hills
Community Healing Centers
Berrien County Health Department
Berrien County Health Department
Berrien County Health Department
Facility Type
Hospital
400
Nursing Facility
Nursing Facility
Nursing Facility
Nursing Facility
Nursing Facility
Nursing Facility
Nursing Facility
Nursing Facility
Community Health Center (federally funded)
Community Health Center
Community Health Center (federally funded)
Community Health Center
Community Health Center
Community Health Center (federally funded)
Community Health Center (federally funded)
Community Health Center
Mental Health
Treatment Facility
Mental Health
Treatment Facility
Mental Health Treatment
Facility/Drug and Alcohol
Facility
Drug & Alcohol Treatment Facility
Drug & Alcohol Treatment Facility
Drug & Alcohol
Treatment Facility
Clinic/Community Health
Clinic/Community Health
Clinic/Community Health
Table 6.2 Health Care Resources in Berrien County
288 Peace Blvd.
Lorraine Path 4368 Cleveland Ave.
Red Arrow Hwy. 1333
70 | 2019 - 2021 Community Health Needs Assessment
Hospital Hospital
Treatment
Address 1234 Napier Ave.
Medical
31 N. St.
Ave. 1358 E. Empire
Park Dr.
Joseph
Ave.
9935
911 S. 3rd St. 1211 Stateline Rd. 870 Colfax Ave. 800 M-139 1485 M-139 796 M-139 6270 W. Main St. 24 N. Joseph Ave., Ste. G 60 N. St. Joseph Ave. 122 Grant St. 115 E. Main St. 1234 Napier Ave. 1485 S. M-139 1022 E. Main St. 6418 Deans Hill Rd. 1225 S. 11th St. 2149 E. Napier Ave. 1205 Front St. 21 N. Elm St., #6 City St. Joseph Watervliet Niles Benton Harbor St. Joseph St. Joseph Stevensville Bridgman Niles Niles Niles Benton Harbor Benton Harbor Benton Harbor Benton Harbor Eau Claire Niles Niles Niles Benton Harbor St. Joseph Benton Harbor Benton Harbor Berrien Center Niles Benton Harbor Niles Three Oaks Phone 269.983.8300 269.463.3111 269.683.5510 269.925.0033 269.556.9050 269.428.1111 269.983.6501 269.465.3017 269.684.1111 269.684.4320 269.684.2810 269.605.1277 616.927.5400 269.427.7937 269.427.7937 239.487.4267 269.445.3874 269.262.4364 269.934.9123 269.983.8316 269.925.0585 269.926.0015 (ext. 110) 269.815.5500 269.684.7741
Health
3905
Wells St.
269.926.7121 269.684.2800 269.756.2008
Care
Center

Food Environment
72 | 2019 - 2021 Community Health Needs Assessment
Food Environment
High-Level Findings
• Eating patterns are influenced by a combination of individual factors (e.g., income) and environmental conditions (e.g., location of healthy food stores).
• In Berrien County, all access-burdened census tracts where people have low income, low vehicle access, and live far from a grocery store are located in Benton Harbor, Benton Township, Niles, and Niles Township.
• In locations where residents are both access-burdened and utilize SNAP benefits at high rates, the closest SNAP authorized stores are convenience stores. These stores sell food that is generally of lesser quality for higher prices than supermarkets.
Health, Behavior, and the Food Environment
Decades of research has established that diets rich in fruits, vegetables, whole grains, and lean protein with moderate amounts of dairy are associated with lower rates of obesity, diabetes, heart disease, and certain types of cancer.1 More recently, research has also indicated that lacking access to nutritious foods (i.e., food insecurity) is associated with anxiety,2 suicidal ideation,3 and “mental disorders.”4
The importance of a nutritious diet is also highlighted by the United Nations Human Rights Council, which states that food is a human right.5 Elements of the “right to food” include:
1. Availability: Food is available for purchase or it is possible to produce, gather, or hunt for food. For example, there are fish available to purchase at the grocery store.
2. Accessibility: Individuals are physically and economically able to acquire food. For example, grocery stores are within a feasible distance and the product for sale is affordable.
In response to the prompt “What makes it hard to be healthy?” the most frequent themes referred to the food environment. Concerns centered around the number of fast food restaurants, limited access to fresh foods, and the cost of healthier food options.
To improve health, respondents overwhelmingly suggested more affordable healthy food options in local stores and restaurants.
3. Adequacy: Food meets individual nutritional and cultural needs. For example, fish may be available and accessible but would not be adequate for a strict vegetarian. Additionally, the fish may not be of high nutritional quality (e.g., breaded and deep-fried) and thus not adequate for all fish-eating individuals.
4. Sustainability: Food will be accessible in the future as well as the present. For example, fish may be available, accessible, and adequate at this time, but current fishing practices may not protect future fish populations.
There are many successful programs aimed at changing eating patterns through education. However, for long-term behavioral shifts, it is also important to ensure that these programs happen in environments where food is available, accessible, adequate, and sustainable. This requires addressing the barriers present in the food and nutrition environment.
spectrumhealthlakeland.org | 73
Food Environment
Policy Variables
Government and Industry Policy
Community Nutrition Environments
• Type and location of food outlets (stores, restaurants)
• Accessibility (hours of operation, drive thru)
Figure 7.1 Model of Community Nutrition Environments6
Figure 7.1 demonstrates that behaviors such as eating patterns are driven by:
1. Policy variables: For example, the U.S. government subsidizes crops (e.g., corn and soy) which influences the price consumers pay for food.
2. Environmental variables: For example, the types of stores (e.g., large supermarkets vs. convenience stores) is associated with the availability of healthy foods. Additionally, store hours of operation dictate the accessibility of that food (e.g., stores open 9 a.m. to 5 p.m. are not accessible for individuals working during that period).
3) Individual variables: For example, personal income determines if an individual can afford the food available. Social support like friends and family impacts eating patterns.
Therefore, in order to influence eating patterns, a full understanding of contextual information (e.g., the socio-demographic makeup of communities) and environmental barriers and supports is required.
Availability of Healthy Food
Unhealthy food environments (i.e., places with large numbers of fast-food restaurants, convenience stores, and general stores) are associated with childhood sugar-sweetened beverage consumption,6 less healthy eating patterns,7 and obesity.8 Additionally, foods purchased from places like convenience stores are more expensive (up to 10-54% more costly) and are of a poorer quality than in supermarkets or grocery stores.9,10
P: What are the biggest health issues in your community? I feel a lot of employers do not pay a living wage making it hard for people to have their own transportation and afford basic necessities such as healthy food.
- 29 y.o., white, female
74 | 2019 - 2021 Community Health Needs Assessment
‘‘ ’’
–18
Environment:
•
•
information Home Work School Other
Organizational Nutrition Environments Consumer Nutrition
Information Environment (Media, Advertising) Perceived Nutrition Environments Psychosocial Factors Socio-demographics Eating Patterns • Available healthy options
Price, promotion, placement
Nutrition
Environmental Variables Individual Variables Behavior
Food Environment
The healthfulness of the food environment can be measured with the Modified Retail Food Environment Index (mRFEI).11,12 The mRFEI illustrates the relative amount of healthy food stores (i.e., large supermarkets, larger grocery stores, supercenters, and produce stores) compared to less healthy food retailers (i.e., fast food restaurants, small grocery stores, and convenience stores) within a census tract or a half-mile of its boundary. In Berrien County, scores range from 0 (i.e., no healthy food retailers) to 50 (i.e., equal number of healthy and less healthy food retailers).
Figure 7.2 shows that, in many census tracts in Berrien County, the number of less healthy food retailers outweighs the number of healthy food stores. The census tracts with the highest mRFEI scores (i.e., healthier food environments) are in the Bertrand, Niles, Pipestone, and Three Oaks Townships. However, these locations also contain few food retailers, some of which are seasonal in nature (e.g., produce markets).


About one third (31.25%) of Berrien’s census tracts contain no healthy food retail locations. These tracts include two in the city of Benton Harbor; two in Benton, St. Joseph, and Lincoln Townships; one in the cities of Buchanan and southern Niles; and one in Weesaw, Buchanan, Baroda, and Oronoko Townships.13
Accessibility of Healthy Food
“Food desert” is a term used to describe low-income communities with limited access to healthy food. Whereas the mRFEI is helpful in understanding the proportion of healthy and less healthy food retailers in a census tract, this measure factors in the distance a resident must travel to a store selling healthy food, median income, and neighborhood vehicle access. Therefore, some locations identified as having a good balance of healthy and less healthy food retail locations may also be a food desert if there is a large population of low-income residents who live farther than a half-mile from a healthy food store.

spectrumhealthlakeland.org | 75
Figure 7.3 Taken by student at Niles New Tech Center
Figure 7.2 Modified Retail Food Environment Index
Food Environment
Figure 7.4 shows the location of food deserts in Berrien County. These are where a significant portion of the population is low income and is at least a half-mile (for urban census tracts) or 10 miles (for rural census tracts) from the nearest supermarket (shown in blue). Also shown are census tracts where many residents are access-burdened; they live more than a half-mile from the nearest supermarket and do not have access to a vehicle.
Fifteen (31.25%) census tracts are located in the cities of Benton Harbor and Niles, and the Townships of Benton, Oronoko, and Niles are considered food deserts. Additionally, ten census tracts in the cities of Benton Harbor and Niles and the Townships of Benton and Niles are access-burdened.
Research suggests access-burdened households spend roughly the same percentage of their food budget at supermarkets and large grocery stores as those households with enough access. However, households with lower access make fewer trips to these stores, which could influence the types of foods purchased (i.e., more inclined to buy shelf-stable foods, which are often higher in sodium).
Access and Affordability


In Benton Harbor, Niles, and Benton Township there are five census tracts where more than 20% of households do not have vehicle access. All five of these census tracts are food deserts.
P: What are the biggest health issues in your community?
Some people do not have access to well-stocked grocery stores. There are liquor stores that advertise as grocers, but they don’t sell healthy foods or fresh produce. There needs to be a healthy alternative in the “food desert” areas of the community. –18 - 29 y.o., white, female
One indicator of healthy food accessibility is the presence of supermarkets accepting food assistance benefits.14 In Berrien County, there are 30 supermarkets and grocery stores that accept Supplemental Nutrition Assistance Program (SNAP) and/or Women, Infants and Children (WIC) benefits, with almost 23% of these stores located in just one census tract.15,16 Only two supermarkets that accept food assistance benefits are located in access-burdened neighborhoods.17
Figure 7.5 depicts the percent of the population per census tract that utilizes SNAP benefits. Census tracts with the highest rate of SNAP utilization (29.1 - 63.9% of the population) are located in Benton Harbor, Benton Township, and Niles. Participation in SNAP is associated with reduced rates of food insecurity.18
76 | 2019 - 2021 Community Health Needs Assessment
Figure 7.4 Food deserts in Berrien County
‘‘ ’’
Food Environment

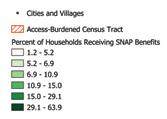
About 15.5% of all households in Berrien County pay more than 30% of their income to housing, the amount at which a household will begin sacrificing other needs like health care and food to pay rent.
However, due to continued policy changes, families are increasingly at risk for decreased SNAP benefits, thus increasing risk for food insecurity. Additionally, families who experience an increase in income may experience a “benefits cliff,” where the loss of benefits exceeds the increase in income. This reduces accessibility to healthy food despite the apparent increase in spending power.
Food accessibility is particularly precarious in Benton Harbor and Benton Township, where five out of seven census tracts with a high percentage of households receiving SNAP benefits are also access-burdened.
Accessible Foods and Exposure to Harmful Advertising

Preliminary analysis suggests that there is a high density of convenience stores and small grocery stores that sell alcohol and accept food assistance in the most access-burdened census tracts in Berrien County (i.e. the most accessible stores in these census tracts also sell alcohol). Additionally, convenience stores and small grocery stores have a high degree of interior and exterior alcohol advertising.19 The existing literature shows that there is an association between exposure to alcohol messaging and alcohol consumption among youth.20,21 Youth respondents to Photovoice expressed concern over the accessibility of alcohol, tobacco, and other drugs (ATOD).
P : What are the biggest health issues in your community?
There’s so much drug use. Alcohol, cigarettes, vaping, weed, whatever. It’s everywhere. I think a lot of adults would be shocked to know how easy it is for us to get it.
–9th grade, male, BCMSC
Community input and existing data suggest that additional research is needed to determine the location and density of alcohol messaging and childhood exposure in the county.
spectrumhealthlakeland.org | 77
Figure 7.5 Percentage of the population per census tract that utilizes SNAP
‘‘ ’’
Figure 7.6 Taken by student at Bridge Academy
Food Environment
Limitations
There was a lack of data on several key components of the food environment. Although the relative healthfulness of foods for sale is often estimated based on the type of store they are sold at, this can be misleading. Currently, information is not available on the local consumer environment (e.g., the quality and affordability of foods sold in small supermarkets and grocery stores). Additionally, information on the local food media environment (e.g., store advertising, billboards, and school proximity to advertisements for unhealthy foods and ATOD) and organizational environments (e.g., the food environment of schools and workplaces) was lacking.
1 U.S. Department of Agriculture. (2015). Dietary Guidelines for Americans (8th edition). Retrieved from: https://www.dietaryguidelines.gov/sites/ default/files/2019-05/2015-2020_Dietary_Guidelines.pdf
2 Food Research & Action Center. (2017). Hunger & Health: Impact of Poverty, Food Insecurity, and Poor Nutrition. Retrieved from http://frac.org/wp-content/uploads/hunger-health-impact-poverty-food-insecurity-health-well-being.pdf
3 Davison, K. M., Marshall-Fabien, G. L., & Tecson, A. (2015). Association of moderate and severe food insecurity with suicidal ideation in adults: national survey data from three Canadian provinces. Social Psychiatry and Psychiatric Epidemiology, 50(6), 963–972. doi: 10.1007/s00127-015-1018-1
4 Burke, M. P., Martini, L. H., Çayır, E., Hartline-Grafton, H. L., & Meade, R. L. (2016). Severity of Household Food Insecurity Is Positively Associated with Mental Disorders among Children and Adolescents in the United States. The Journal of Nutrition, 146(10), 2019–2026. Retrieved from https://doi.org/10.3945/jn.116.232298
5 Office of the United Nations High Commissioner for Human Rights. (2019). The Right to Adequate Food, 2010, OHCHR Fact Sheet No. 34. Retrieved from https://www.ohchr.org/EN/Issues/ESCR/Pages/Food.aspx.
6 Shareck, M., Lewis, D., Smith, N. R., Clary, C., & Cummins, S. (2018). Associations between home and school neighborhood food environments and adolescents’ fast-food and sugar-sweetened beverage intakes: findings from the Olympic Regeneration in East London (ORiEL) Study. Public Health Nutrition, 21(15), 2842–2851. Retrieved from https://doi.org/10.1017/S1368980018001477
7 Hulst, A. V., Barnett, T. A., Gauvin, L., Daniel, M., Kestens, Y., Bird, M., … Lambert, M. (2012). Associations Between Children’s Diets and Features of Their Residential and School Neighbourhood Food Environments. Canadian Journal of Public Health, 103(S3), 48-54. Retrieved from https://www.ncbi.nlm.nih.gov/pubmed/23618089
8 Chen, H.-J., & Wang, Y. (2016). Changes in the Neighborhood Food Store Environment and Childrens Body Mass Index at Peripuberty in the United States. Journal of Adolescent Health, 58(1), 111–118. Retrieved from https://doi.org/10.1016/j.jadohealth.2015.09.012
9 Gosliner, W., Brown, D. M., Sun, B. C., Woodward-Lopez, G., & Crawford, P. B. (2018). Availability, quality and price of produce in low-income neighborhood food stores in California raise equity issues - CORRIGENDUM. Public Health Nutrition, 22(1), 184–185. Retrieved from https://doi.org/10.1017/S1368980018000058
10 Gosliner, W., Brown, D. M., Sun, B. C., Woodward-Lopez, G., & Crawford, P. B. (2018). Availability, quality and price of produce in low-income neighborhood food stores in California raise equity issues - CORRIGENDUM. Public Health Nutrition, 22(1), 184–185.
Retrieved from https://doi.org/10.1017/s1368980018002823
11Classification of the mRFEI used the same methodology as CDC’s original maps: 0 (no healthy food retailers), 0.1–5 (fewer less healthy food retailers), 5.1–10, 10.1–37.5, and 37.6–100 (more healthy food retailers).
12 mRFEI = 100 x (# of Healthy Food Retailers) / (# of Healthy Food Retailers + # of Less Healthy Food Retailers).
13 When the mRFEI was calculated, two census tracts in Lincoln Township did not have a healthy food store. However, since then a Meijer has been constructed.
14 Ploeg, M. V., Larimore, E., & Wilde, P. (2017). The influence of food store access on grocery shopping and food spending. Retrieved from https://www.ers.usda.gov/webdocs/publications/85442/eib-180.pdf?v=0
16 Store addresses were provided by the Berrien County Health department. Store type was determined using the North American Industry Classification System codes supplemented with store website information.
17 Census tract 21 in Benton Township.
18 One is a small supermarket (which typically stock fewer healthy options) and the other is a Walmart which is located more than ½ mile from many individuals in the census tract.
19 Gundersen, C., Kreider, B., & Pepper, J. V. (2017). Partial Identification Methods for Evaluating Food Assistance Programs: A Case Study of the Causal Impact of SNAP on Food Insecurity. American Journal of Agricultural Economics, 99(4), 875–893. Retrieved from https://doi.org/10.1093/ajae/aax026
20 Centers for Disease Control and Prevention. (2003). Point-of-purchase alcohol marketing and promotion by store type--United States, 2000-2001. Retrieved from https://www.cdc.gov/mmwr/preview/mmwrhtml/mm5214a4.htm
21 Hurtz, S. Q., Henriksen, L., Wang, Y., Feighery, E. C., & Fortmann, S. P. (2006). The Relationship Between Exposure To Alcohol Advertising In Stores, Owning Alcohol Promotional Items, And Adolescent Alcohol Use. Alcohol and Alcoholism, 42(2), 143–149. Retrieved from https://doi.org/10.1093/alcalc/agl119
22 Jernigan, D., Noel, J., Landon, J., Thornton, N., & Lobstein, T. (2016). Alcohol marketing and youth alcohol consumption: a systematic review of l ongitudinal studies published since 2008. Addiction, 112, 7–20. Retrieved from https://doi.org/10.1111/add.13591
78 | 2019 - 2021 Community Health Needs Assessment
Physical Environment


80 | 2019 - 2021 Community Health Needs Assessment
Physical Environment
High-level Findings
• The greatest number of potentially polluted facilities/sources in Berrien County are located in areas where vulnerable populations live.
• In 2018 and 2019, Berrien had high levels of ozone, but this has improved recently. This is mostly due to emissions from outside of Berrien County.
• Most drinking water violations in Berrien County were related to problems with reporting and monitoring (i.e., failure to conduct regular monitoring of drinking water quality, or to submit monitoring results in a timely fashion).
• Of the locations with older homes, Benton Harbor, Galien Township, Niles Township, and Three Oaks census tracts had the greatest percentage of children living below the poverty level, indicating higher risk for lead poisoning.
Introduction
The physical environment can be thought of as the natural and built environment. Individually, the quality of these environments contributes to health. For example, clean river waters provide drinking water, and opportunities for recreation and sidewalks provide a form of active transportation. However the interactions between these environments (e.g., as a result of urban planning) can also influence health.1 For example, decisions regarding the location and maintenance of infrastructure (i.e., the built environment) can contribute to the pollution of the air, water, and soil (i.e., natural environment).
Locations of Potential Sources of Pollution
When discussing the physical environment, survey respondents viewed water quality concerns, air pollutants, trash/litter and abandoned homes and factories as being issues that negatively impacted the health of the community. Some of the suggested solutions included repurposing old factories, creating affordable housing out of abandoned homes, and community cleaning efforts.

Community members frequently mentioned litter, pollution, and air and water quality as conditions which make it hard for them to be healthy. Although there is a lack of data available on litter in Berrien County, information is available on the location of facilities commonly associated with pollution. Individuals living next to contaminated locations and other sources of hazardous waste have a higher risk for negative health outcomes, such as childhood cancers, chronic respiratory symptoms, asthma hospitalizations, adverse pregnancy outcomes, and infant mortality.2,3,4
Brownfields and Superfund sites are two types of locations which may contain pollutants and “might need to be cleaned up, are being cleaned up, or have been cleaned up.”5 Locally, there are 29 brownfield sites, 19 of which are in Benton Harbor. In Buchanan there are six sites (see Table 8.1).6 However, further analysis on this data is needed to determine the status of each location (i.e., which locations are clean or in the process of being cleaned). Additionally, only locations which have received a brownfield grant are considered brownfields. Therefore, analyzing only brownfield sites does not fully represent all potentially polluted locations.
spectrumhealthlakeland.org | 81
Figure 8.1 Taken by 10th grade student at Niles New Tech Center
Physical Environment
Other potentially polluted locations include active Superfund sites. These are locations where activities (e.g., site assessment, waste removal, remedial actions) are being planned or conducted under the Superfund program. In Berrien County, there are a total of 20 Superfund sites, three of which are on the national priorities list (NPL). The NPL is a list of facilities that are considered the highest priority and “warrant further investigation to assess the nature and extent of public health and environmental risks associated with a release of hazardous substances, pollutants, or contaminants.”7 Benton Harbor has the greatest number of active Superfund sites in the county with 1 NPL site and 7 non NPL sites.
Research indicates low income and/or minority communities are more likely to live in communities located near sources of pollution, thus increasing the chance of exposure.8,9,10 Locally, the greatest number of brownfield and Superfund sites are located in areas where vulnerable populations live.11 This is significant, as vulnerable individuals may be more susceptible to adverse outcomes when they have reduced access to care, lack resources (e.g., language or education) that would help them avoid exposure, or are at vulnerable life stages.12


82 | 2019 - 2021 Community Health Needs Assessment
Figure 8.2 Map displaying the location of potential sources of pollution and the locations where vulnerable populations live13
Brownfield Superfund Superfund (National Priorities List) Total 19 7 1 27 2 2 6 1 1 8 1 1 1 1 1 1 2 1 1 1 1 1 1 2 1 1 1 1 2 2 29 17 3 49 BentonHarborBridgman Buchanan Coloma EauClaire NewBuffaloNiles Sawyer St.Joseph Stevensville UnionPier Watervliet Total
Table 8.1 Count of Brownfield and Superfund sites by city
Physical Environment
A proxy indicator for potential exposure to hazardous waste is proximity to facilities that generate large quantities of hazardous waste or treat, store, or dispose of hazardous waste.14,15 This is represented with the proximity score.16 Locally, those most vulnerable to the effects of pollution live closest to potential pollution sources. Of the 28 areas with a high proximity score, 21 of these locations are in Benton Harbor or Benton Township, and one is in Niles (see Figure 8.4 and appendix D for full details).17

Proximity and Vulnerable population
y = 0.0393x + 0.1285 R² = 0.5284
8.3 Scatterplot showing relationship between Proximity and Vulnerable population, 2019


Figure 8.4 Map displaying the location of hazardous waste facilities and the locations where vulnerable populations live18
spectrumhealthlakeland.org | 83
Figure
0% 10% 20% 30% 40% 50% 60% 0.00 2.00 4.00 6.00 8.00 10.00 12.00
Physical Environment
Proximity to Pollution or Contaminants
Environmental Water Quality
The EPA’s wastewater discharge indicator helps users to identify areas where there may be potential health impacts of toxic discharges to water.19 People may be exposed to the discharged pollutants through swimming in downstream waters or through drinking water if contaminants are not removed by drinking water utilities.19 Compared to state rates, the census tracts with the greatest estimated toxic releases were those bordering the St. Joseph River, particularly to the north of Niles.
Current information is limited on the impact of these emissions on local waterways. However, some information on what’s being done to restore and protect local waters is available through the “How’s My Waterway” website.20 For example, the most recent river quality assessment for the St. Joseph River near Niles is from 2016. At that time the river was designated as impaired (i.e., limited ability to support fishing and recreation due to contamination) with E. coli and PCB. Probable sources contributing to impairment are agriculture and other sources outside state jurisdiction or borders (E. coli) and atmospheric deposition (PCB).21,22
Drinking Water

In 2018, about 75% of the population in Michigan received water from Public Water Systems (PWS).23 These systems have standards in place for water safety and quality and systems that exceed these standards are required to immediately notify the public, correct the problem, and provide a safe alternate source of drinking water in the interim if necessary.24 In 2018, 88.5% of water quality violations in the county were related to monitoring and reporting (i.e., failure to conduct regular monitoring of drinking water quality or to submit monitoring results in a timely fashion).25 There were few health-based violations in 2018, all of which have been addressed.
Since 2018, there have been 33 water systems in Michigan which have had lead levels above the action level (i.e., the level above which a response is required).26 Two of these water systems were in Berrien County (i.e., the city of Benton Harbor and the Village of Eau Claire).27 Exceeding the action level requires water systems to act to minimize exposure to lead in drinking water, including water quality parameter monitoring, corrosion control treatment, source water monitoring/treatment, public education, and lead service line replacement.26 Information regarding city and township response to exceeding the action level for lead can be found on the Berrien County Health Department website.
The 25% of Michigan residents who do not receive their drinking water from public water systems get their water from small water supplies like private wells. While the Michigan Department of Environment, Great Lakes, and Energy investigates well water contamination, and oversees remedial activities where groundwater contamination has affected private drinking water, owners of private wells are responsible for testing.26 It is recommended that owners have their wells tested once a year.
84 | 2019 - 2021 Community Health Needs Assessment
Figure 8.5 Taken by 10th grade student at Niles New Tech Center
Physical Environment
Air Quality
Air pollutants such as fine particulate matter, ozone, and nitrogen oxides have been associated with a wide variety of health conditions such as cardiovascular disease, negative birth outcomes, and pulmonary disease.28,29 In order to monitor the presence of air pollutants, the EPA has established standards for six common air pollutants that can be harmful to health and the environment.30 In 2018 and 2019, ground level ozone in Berrien County exceeded this standard.31,32 Ground level ozone exposure can trigger chest pain, coughing, throat irritation, and airway inflammation and is of particular concern to the elderly, children, and those with pre-existing conditions such as bronchitis, emphysema, and asthma.33 Most emissions contributing to ground level ozone are from major urban areas in the Lake Michigan area (e.g., Chicago, Gary, and Milwaukee) and from other source areas in the eastern U.S.34 In shoreline counties, the contribution of ozone forming emissions from sources in Michigan is negligible.
TRI facilities (i.e. facilities listed in the Toxic Releases Inventory), are additional sources of pollution. These are typically larger facilities involved in manufacturing, metal mining, electric power generation, chemical manufacturing, and hazardous waste treatment.35 The EPA provides a screening tool called the Risk-Screening Environmental Indicator (RSEI) score to assist the public with identifying situations where hazardous releases into the air or water may affect human health.36 A RSEI Score is a value that accounts for the amount and type of chemicals released and the size and location of the exposed population. RSEI Scores are useful for making comparisons and ranking facilities, industry, or geographic areas.37
In 2018, Berrien County had the 17th highest RESI Score in Michigan (see figure 8.6 below). Aside from an increase in emissions from 2012 to 2014, this score has been relatively stable since 2007. Most of the RSEI Scores (over 99%) are attributable to air releases rather than releases made to water.38
These and other sources of pollution are reflected in the National Air Toxics Assessment (NATA), including vehicle emissions, agriculture, construction, wood burning, and waste disposal.40 Based on this information, risk estimates for cancer and respiratory hazards in Berrien County were determined.
spectrumhealthlakeland.org | 85
Figure 8.6 Top 20 Risk-Screening Environmental Indicator (RSEI) Score Counties in Michigan, 201839
0 200000 400000 600000 800000 1000000 1200000 1400000 1600000 1800000 2000000
2018 RSEI Score
2018 RSEI Score
Physical Environment
According to the NATA, the risk of someone in Berrien County developing cancer from these pollutants is 22.05 per 1 million population.39 In other words, if there were 1 million people living in Berrien County, the estimated number of residents who would develop cancer would be about 22. This is slightly lower than the estimated cancer risk for the state of Michigan (23.8 per 1 million).
Recent research suggests that environmental noise such as traffic noise may be associated with depression and anxiety.
At a sub county level, one census tract in St. Joseph (census tract 10) has a high cancer risk compared to the state (31.56 per 1 million). However, due to limitations in the data, sub county estimates should be viewed as a starting point for investigation. Local level air monitoring and more detailed modeling are needed to determine local level risk.40
NATA data suggests that air toxins are unlikely to cause respiratory conditions at the county or state level. Locations with a hazard index of 1 or lower means that air toxins are unlikely to cause adverse noncancer health effects over a lifetime of exposure. Berrien County and Michigan both have a hazard index far below this level (0.26 and 0.29, respectively). However, this data does not reflect risk at a more local level. Further research is needed to assess the respiratory risk associated with living in close proximity to sources of hazardous emissions, such high traffic roads.41
The Local Built Environment
The second most frequently cited idea “How would you improve the health of your community?” among Photovoice respondents was physical infrastructure. Respondents frequently mentioned removing or improving old and abandoned houses, buildings, and factories. There is a lack of data available on the number of abandoned homes; however, information on the age of the existing housing stock can indicate locations in the community that are at risk for some of the negative health effects of aging infrastructure, such as lead poisoning from leaded paint. This is particularly true for lower value old homes.42 Lead exposure, especially in children, can cause irreversible IQ reduction and attention-span reductions. Young children suffering from lead poisoning can experience learning, behavior, and health problems. Adults exposed to excessive lead can suffer from high blood pressure, kidney damage, and fertility problems.43
P: What are the biggest health issues in your community?
The biggest health issue in our community to me is probably drugs and depression (mental health). These can take place and be caused by a number of situations, but part of it may be not having enough involvement with nature in our everyday lives, and having so many open unregulated areas that let crime walk right in like the abandoned buildings and the unsupervised parts of riverfront park.
‘‘ ’’
–Under 18, white, female
As seen in Table 8.2, Benton Harbor, Niles, St. Joseph, Three Oaks, Galien, Buchanan, and Weesaw Township have the highest percentage of housing built pre 1940.44,45 Of these locations, Benton Harbor, Galien Township, Niles Township, and Three Oaks census tracts had the greatest percentage of children living below the poverty level, indicating higher risk for lead poisoning.41
86 | 2019 - 2021 Community Health Needs Assessment
Physical Environment
Table 8.2 Pre-1940 housing and percent of children living below the poverty level by census tract. See appendix D for a complete table46
Sidewalks and Lighting
Photovoice participants also suggested that adding or improving sidewalks and increasing lighting would help to improve health in the community. Research indicates that sidewalks are important opportunities for physical activity and increase community mobility. Locations with no sidewalks are more than twice as likely to have pedestrian/motor vehicle crashes than sites where sidewalks exist. Additionally, inadequate lighting is associated with an increased risk of injury.47 However, there is limited information on the location and condition of sidewalks in Berrien County.
Limitations
The primary limitation of this report is the lack of data on specific concerns identified by the community. For example, community members identified abandoned housing, sidewalk conditions, the presence of litter and limited street lighting as concerns. However, data on these topics is not regularly collected in all communities. Additionally, due to the difficulty and expense of collecting environmental data, many data sources used in this report are several years old, are based on models, or are updated irregularly. It should be noted that this report can only relay information on contaminants and locations which are monitored by the EPA and other government organizations. As such, contaminantes of emerging concern (i.e., pharmaceuticals and personal care products) and locations which have not been assessed (or received funding to assess) for pollution by the EPA are not represented.
1 Coutts, C. (2010). Public Health Ecology. Journal of Environmental Health. Retrieved from http://purl.flvc.org/fsu/fd/FSU_migr_durp_faculty_publications-0006
2 Ding, E. (2006). Brownfield Remediation for Urban Health: A Systematic Review and Case Assessment of Baltimore, Maryland. Journal of Young Investigators. Retrieved from https://www.jyi.org/2006- february/2017/10/10/brownfield-remediation-for-urban-health-a-systematicreview-and-case-assessment-ofbaltimore-maryland
spectrumhealthlakeland.org | 87 City/Township Geography Percent housing units Percent below poverty level, built pre 1940s under 5 years old Benton Harbor Census Tract 5 68% 30.2 Niles Census Tract 207 47% 0 St. Joseph Census Tract 8 45% 8.3 Benton Harbor Census Tract 6 34% 67.9 Three Oaks Census Tract 114 34% 21.5 Galien Township Census Tract 115 30% 46.7 Benton Harbor Census Tract 3 28% 93.9 Benton Harbor Census Tract 4 27% 79.1 Niles Township Census Tract 112 25% 23.9 Buchanan Census Tract 202 24% 0 Weesaw Township Census Tract 116 24% 0
Physical Environment
3 Brender, J. D., Maantay, J. A., & Chakraborty, J. (2011). Residential Proximity to Environmental Hazards and Adverse Health Outcomes. American Journal of Public Health, 101(S1). doi: 10.2105/ajph.2011.30018
4 Fazzo, L., Minichilli, F., Santoro, M., Ceccarini, A., Seta, M. D., Bianchi, F., … Martuzzi, M. (2017). Hazardous waste and health impact: a systematic review of the scientific literature. Environmental Health, 16(1). doi: 10.1186/s12940-017-0311-8
5 U.S. Environmental Protection Agency. (2020). CIMC - About the Data. Retrieved from https://www.epa.gov/cleanups/cimc-about-data#background
6 Brownfields are defined as real properties, the expansion, redevelopment, or reuse of which may be complicated by the presence or potential presence of a hazardous substance, pollutant, or contaminant. EPA assesses these sites to clean them up, prevent more contamination and make plans for re use.
7 National Achieves and Records Administration. (2018). National Priorities List. Retrieved from https://www.federalregister.gov/documents/2018/01/18/2018-00623/national-priorities-list
8 Zou, B., Peng, F., Wan, N., Mamady, K., & Wilson, G. J. (2014). Spatial Cluster Detection of Air Pollution Exposure Inequities across the United States. PLoS ONE, 9(3). doi: 10.1371/journal.pone.0091917
9 Hipp, J. R., & Lakon, C. M. (2010). Social disparities in health: Disproportionate toxicity proximity in minority communities over a decade. Health & Place, 16(4), 674–683. doi: 10.1016/j.healthplace.2010.02.005
10 Gray, S. C., Edwards, S. E., & Miranda, M. L. (2013). Race, socioeconomic status, and air pollution exposure in North Carolina. Environmental Research, 126, 152–158. doi: 10.1016/j.envres.2013.06.005
11 For this analysis, vulnerable communities are census block groups where a large percentage of the population are low income, linguistically isolated, have less than a high school education, are under the age of five or older than 64, and are a race other than white alone and/or list their ethnicity as Hispanic or Latino.
12 U.S. Environmental Protection Agency. (2019). EJSCREEN Technical Documentation. Retrieved from https://www.epa.gov/sites/production/ files/2017-09/documents/2017_ejscreen_technical_document.pdf
13 All vulnerable population data used to create maps are from 2019: https://www.epa.gov/ejscreen/downloadejscreen-data
14 Large quantity generators create large amounts of waste that can be stored in containers, tanks, drip pads, and containment buildings for up to 90 days. After 90 days waste is treated, stored or disposed of at an approved facility. 15 U.S. Environmental Protection Agency, (1996). Hazardous Waste Requirements for Large Quantity. Retrieved from https://www.epa.gov/sites/production/files/2015-01/documents/lqgpdf.pdf
16 The proximity score represents the relative magnitude of the proximity of the population within a block group to facilities or waste sites surrounding it. A block group with more facilities closer to the block group’s residential population will have a higher score than a block group where facilities are further away.
17 For the purposes of this report, a location (i.e., census block group) is considered to have a high proximity score if the score is higher than 80% percent of other locations in the U.S. In other words, proximity scores in the 80th percentile or greater are considered high scores.
18 U.S. Environmental Protection Agency. (2019). RCRAInfo. Retrieved from https://enviro.epa.gov/facts/rcrainfo/search.html
19 U.S. Environmental Protection Agency. (2019). Technical Documentation for EJSCREEN. Retrieved from https://www.epa.gov/sites/production/ files/2017-09/documents/2017_ejscreen_technical_document.pdf
20 U.S. Environmental Protection Agency. (2019). About How’s My Waterway. Retrieved from https://mywaterway.epa.gov/
21 U.S. Environmental Protection Agency. (2016). Waterbody Quality Assessment Report. Retrieved from https://ofmpub.epa.gov/waters10/attains waterbody.control?p_au_id=MI040500012210- 01&p_list_id=MI040500012210-01&p_cycle=2016
22 It should be noted that E. Coli and PCB are monitored and removed from municipal water sources.
23 Michigan Department of Health and Human Services. (2020). Drinking Water. Retrieved from https://www.michigan.gov/mdhhs/0,5885,7-339-71548_54783_54784_78428_78429_78434---,00.html
24 Michigan Department of Environment, Great Lakes, and Energy Drinking Water and Environmental Health Division. (2015). Annual Report on Michigan Public Water System Violations 2015. Retrieved from https://www.michigan.gov/documents/deq/2_MI_2015_ACR_Overview_ Document_531285_7.pdf
25 U.S. Environmental Protection Agency. (2020). Water Systems Search Results. Retrieved from https://ofmpub.epa.gov/apex/sdw/f?p=108:103:::NO:RP::
26 In 2018, Michigan revised the Lead and Copper rule to require more comprehensive sampling methods. For a full list of changes, please visit: http://graham.umich.edu/media/files/Lead-and-Copper-Rule-Info-Brochure-11x17- Tabloid-042319.pdf
27 Michigan Department of Energy. (2020). Public Water Supply 90th Percentiles: Michigan: Open Data: Michigan: Open Data. Retrieved from https://data.michigan.gov/Environment/Public-Water-Supply-90th-Percentiles/39ya9txc
28 Ha, S., Hu, H., Roussos-Ross, D., Haidong, K., Roth, J., & Xu, X. (2014). The effects of air pollution on adverse birth outcomes. Environmental Research, 134, 198–204. doi: 10.1016/j.envres.2014.08.002
29 Goldsmith, J. (1968). Effects of Air Pollution on Human Health. Air Pollution and Its Effects, 547–615. doi: 10.1016/b978-0-12-666551-2.50021-2
30 National Ambient Air Quality Standards are set for ground-level ozone, particulate matter, carbon monoxide, lead, sulfur dioxide, and nitrogen dioxide.
31 U.S. Environmental Protection Agency. (2020). Michigan Nonattainment/Maintenance Status for Each County by Year for All Criteria Pollutants. Retrieved from https://www3.epa.gov/airquality/greenbook/anayo_mi.html
32 Designated as marginal attainment. However, the State of Michigan, through the Department of Environment, Great Lakes, and Energy (EGLE), has filed for Berrien to be predesignated as in attainment due to improved air quality from 2017 to 2019. From more information visit https://www.michigan.gov/documents/egle/aqd-aqe-sipBerrien_County_Redesignation_Request_680643_7.pdf.
33 U.S. Environmental Protection Agency. (2020). Ground-level Ozone Pollution. Retrieved from https://www.epa.gov/ground-level-ozonepollution/ground-level-ozone-basics#:~:text=
88 | 2019 - 2021 Community Health Needs Assessment
Physical Environment
34 Studies are ongoing to determine sources and patterns. See the Lake Michigan Ozone Study for details as they emerge. https://www.michigan.gov/documents/deq/deq-aqd-air-aqe-ozone-EPA-WMichigan-report2008_272757_7.pdf
35 U.S. Environmental Protection Agency. (2020). What is the Toxics Release Inventory? Retrieved from https://www.epa.gov/toxics-release-inventory-tri-program/what-toxics-release-inventory
36 In this case, releases are TRI only and does not account for other industry releases (see NATA)
37 U.S. Environmental Protection Agency. (2019). How RSEI Should Be Used. Retrieved from https://www.epa.gov/rsei/how-rsei-should-be-used
38 The remaining 0.04 is attributable to transfers to publicly owned treatment works (i.e., sewage treatment plant).
39 U.S. Environmental Protection Agency. (2019). EPA’s Risk-Screening Environmental Indicators (RSEI) model, Version 2.3.8. Retrieved from https://edap.epa.gov/public/extensions/EasyRSEI/EasyRSEI.html
40 U.S. Environmental Protection Agency. (2019). 2014 NATA: Technical Support Document. Retrieved from https://www.epa.gov/national-air-toxics-assessment/2014-nata-technical-support-document
41 Clark, C., Crumpler, C., & Notley, H. (2020). Evidence for Environmental Noise Effects on Health for the United Kingdom Policy Context: A Systematic Review of the Effects of Environmental Noise on Mental Health, Wellbeing, Quality of Life, Cancer, Dementia, Birth, Reproductive Outcomes, and Cognition. International Journal of Environmental Research and Public Health, 17(2), 393. doi: 10.3390/ijerph17020393
42 Kim, D. Y., Staley, F., Curtis, G., & Buchanan, S. (2002). Relation Between Housing Age, Housing Value, and Childhood Blood Lead Levels in Children in Jefferson County, Ky. American Journal of Public Health, 92(5), 769– 772. doi: 10.2105/ajph.92.5.769
43 U.S. Centers for Disease Control and Prevention. (2016). Blood Lead Levels in Children Aged less than 5, 2007–2013. Morbidity and Mortality Weekly Report. https://www. cdc.gov/mmwr/volumes/63/wr/mm6355a6.htm
44 The largest decrease in lead dust levels are seen between housing built prior to 1940 and after 1940.
45 Clark, C., Crumpler, C., & Notley, H. (2020). Evidence for Environmental Noise Effects on Health for the United Kingdom Policy Context: A Systematic Review of the Effects of Environmental Noise on Mental Health, Wellbeing, Quality of Life, Cancer, Dementia, Birth, Reproductive Outcomes, and Cognition. International Journal of Environmental Research and Public Health, 17(2), 393. doi: 10.3390/ijerph17020393
46 U.S. Census Bureau (2016). Selected Housing Characteristics (DP04), 2012-2016 American Community Survey 5-year estimates. Retrieved from https:// data.census.gov/cedsci/table?q=housing%20characteristics&tid=ACSDP1Y2018.DP04&t=Housing&g=0400 000US26_0500000US26021.140000
47 U.S. Department of Transportation Federal Highway Administration. (2002). An Analysis of Factors Contributing to “Walking Along ... Retrieved from http://www.pedbikeinfo.org/cms/downloads/WalkingAlongRoadways_Study_Guidelines.pdf
spectrumhealthlakeland.org | 89
90 | 2019 - 2021 Community Health Needs Assessment
Recreation Environment

92 | 2019 - 2021 Community Health Needs Assessment
Recreation Environment
High-Level Findings
• Townships with the least park access also have the most restricted access parkland (i.e., membership or entrance fees are required).
• Approximately 24% of the urban population does not live within walking distance to a mini park (i.e., a park that is 5 acres or less); 11% do not live within a walking distance of parks larger than 5 acres.
P: What in your community makes it easy to be healthy?
We have some amazing walking trails but I know other communities aren’t as lucky as ours.
‘‘ ’’
–Female student, BCMSC
• Trails in Berrien County provide additional exercise options; however, they are generally located in areas where access to recreation resources is not an issue.
Introduction
The health effects of physical activity are well documented, with research consistently finding associations between exercise and reduced risk of mortality from cardiovascular disease.1 Research has also shown that exercise can result in improved bone health, reduced cancer risk, improved cognitive function, reduced fall-related injuries for older adults, and reduced risk of excessive weight gain, gestational diabetes, and postpartum depression.1 More recently, evidence has also indicated the possible connection between exercise and a reduced risk of anxiety and depression, improved sleep, and improved quality of life.2
However, despite the well-known benefits of exercise, in 2014 an estimated 32.9% of Berrien County adults did not engage in leisure time physical activity.3 In Michigan and the United States, fewer adults did not engage in leisure time physical activity (25.5% and 22.6%, respectively).4 While individual level factors such as physical ability influence exercise habits, these habits are also a product of the interaction between a person and the environment.5 Specifically, individuals are influenced by the following:
1. Social/cultural environment: Exercise is encouraged through social supports and a culture of active living. For example in a supportive environment friends and co-workers regularly take walking breaks and invite others to join them.
2. Built environment: The physical infrastructure required for exercise and active living is present. For example, sidewalks are available and accessible for walking breaks.
3. Policy environment: Budgets, zoning, and development codes, school physical activity policy, and building and road design standards ensure the creation and maintenance of a supportive social/cultural and built environment. For example, sufficient tax revenue to devote to maintaining safe sidewalks.5

The connection between the built recreation environment and health was highlighted in the 2019 CHNA survey and Photovoice project results. A frequent response to the prompt, “What in your community helps you to be healthy?” was the presence of parks, trails, and indoor recreation opportunities such as the Boys and Girls Club and the Niles-Buchanan YMCA. However, respondents also expressed the need to increase the availability and quality of outdoor spaces such parks, trails, and affordable indoor facilities (e.g., gyms). Respondents recognized that some communities have a multitude of diverse recreation opportunities, but this is not the experience of all Berrien County residents. Research indicates that recreational opportunities are often inequitably distributed. Generally, higher income, majority white communities have greater access to parkland and have higher quality parks than low-income and minority communities.6
spectrumhealthlakeland.org | 93
Figure 9.1 Photo by 9th grade student at BCMSC
Recreation Environment
To understand the relative accessibility of recreational opportunities in the county, the proximity and quantity of parks, park acreage, trails, and recreation facilities were analyzed. Due to the impact that cost has on accessibility, this report focuses on parks and trails that are open to the public and free of charge.7,8
Park Quantity, Park Size, and Accessibility
Assessing the number of residents per park is one way that a community can determine if available parks are adequate for the number of people living within a municipality.9,10 Generally, a lower number of residents per park implies a greater degree of accessibility. An additional measure of park quantity and accessibility is the number of park acres per 1,000 population, an important indicator of potential crowding issues. Generally, higher acreage implies a lower risk of crowding (i.e., too many people for the available space) and greater degree of accessibility due to increased availability of space for recreation. It should be noted that the National Recreation and Park Association does not set standards for measures of quantity, as there is no one standard that “encompasses the uniqueness found in every community across the country.”11 For this report, scores (i.e., residents per park and acres per 1,000 population) for municipalities will be compared to the average score of like municipalities (e.g., urban municipalities are compared to the average for all urban municipalities).
P: What are some things in your community that make it hard to be healthy?
Gyms, walking trails, lakes (glorified ponds), are all in wealthier communities. Access to libraries, safe exercise locations, farmers markets for fresh produce are not accessible to my home patients from their neighborhood without access to a car. And if you don’t have reliable transportation, which is rarer in a poorer community, you don’t have access to the benefits. Even road conditions are terrible in poorer neighborhoods, which if you have an older car makes it even harder.
‘‘ ’’
–30 - 44 y.o., white, female
Out of the 30 townships and cities in Berrien County, only one (Bainbridge Township) did not have access to a park. The cities of Benton Harbor, Niles, St. Joseph, Coloma, New Buffalo, and Watervliet, as well as Watervliet Township, have more parks than average; however, these parks are likely smaller than average. These parks may experience a high degree of crowding, which limits their usability for socializing and recreation. Benton, Royalton, Lincoln, Hagar, Lake, and Bertrand Townships as well as the city of Bridgman have fewer parks for the population size; however, the parks are relatively large. This indicates that park acreage is likely concentrated to a few large parks, potentially reducing resident proximity to a park. Moreover, a lack of proximity is particularly burdensome for individuals without a vehicle. Oronoko, Coloma, Bainbridge, Pipestone, Baroda, Galien, and Sodus Townships have relatively fewer and smaller than average parks, indicating the least degree of access in the county.
Income and Access
In parts of Benton Township, almost half of homes do not have a vehicle.
Approximately 23% of the population in this area is not within walking distance to a park.
Some municipalities contain large amounts of recreational land which is restricted access due to entrance or membership fees. This provides additional access to a subset of individuals (e.g., those able to pay entrance fees) while leaving low income residents with comparatively fewer options. In particular, Oronoko and Pipestone Townships have the lowest amount of park access in the county and also have the largest share of restricted access park space. Table 9.1displays the number of people per park, the number of park acres per 1,000 people, and the percentage of park acres which is restricted access for each municipality in Berrien County.
94 | 2019 - 2021 Community Health Needs Assessment
Recreation Environment
Urban Municipality
People
Rural Municipalities
People
Table 9.1 Park access by urban and rural municipalities in Berrien County
spectrumhealthlakeland.org | 95
per Open access park % of park acres, % of park acres, open park acres per 1,000 open access restricted access Median 1,071 18.5 52.8% 47.2% Oronoko Township #2,281 $2.6 $9.8% #90.2% Benton Township #2,072 20.5 $29.1% #70.9% City of Buchanan 242 29.2 $44.9% #55.1% City of Benton Harbor 497 $13.8 $49.0% #51.0% City of Niles 493 $10 $50.9% #49.1% Coloma Township #1,242 $9.6 52.8% 47.2% Niles Township 1,071 18.5 55.1% 44.9% Royalton Township #1,589 21.3 54.8% 45.2% St. Joseph Township 705 34.3 75.9% 24.1% City of St. Joseph 377 $17.8 79.5% 20.5% Lincoln Township #1,457 82.1 97.3% 2.7%
per Open access park % of park acres, % of park acres, open park acres per 1,000 open access restricted access Median 592 38.8 68.8% 31.2% Bainbridge Township #No parks $0 NA NA Pipestone Township #1,168 $2.2 $0.7% #99.3% Watervliet Township 346 $6.7 $16.1% #83.9% City of Coloma 334 $2.5 $22.8% #77.2% Buchanan Township 585 78.8 $28.4% #71.6% Hagar Township #724 38.8 $30.4% #69.6% New Buffalo Township 148 196.1 $56.0% #44.0% Lake Township #741 437 $57.4% #42.6% Three Oaks Township 221 117.1 $64.4% #35.6% Bertrand Township #655 76.7 $64.8% #35.2% Berrien Township #631 50.3 72.9% 27.1% Chikaming Township 155 284 82.3% 17.7% City of Bridgman #599 161 88.1% 11.9% City of New Buffalo 117 $11.8 94.5% 5.5% Weesaw Township 370 151.9 96.4% 3.6% Baroda Township #919 $12.1 100.0% 0.0% City of Watervliet 250 $32.3 100.0% 0.0% Galien Township #730 $14.1 100.0% 0.0% Sodus Township #798 $6.5 100.0% 0.0%
median and unfavorable, $=Below the median and unfavorable, NA= Not Applicable
#=Above the
Recreation Environment
Park Proximity, Park Size, and Recreational and Social Needs

Living in close proximity to parks is associated with park use, physical activity, and mental wellness.12,13 These benefits exist regardless of the size of a park. However, the type of activity a park is best suited for is determined by its size. For example, mini parks (i.e., parks up to 5 acres in size) serve specific recreational needs (e.g., child play) and provide space for social gatherings (e.g., picnics). Neighborhood and community parks (i.e., parks larger than 5 acres) serve broader social and recreational needs and provide space for activities such as sports and jogging.14
Portions of the urban population do not live within walking distance to a park.15 Notably, 68% of the population in census tract 213 (Berrien Springs) does not live within walking distance of a park, indicating a lack of access. A further 43% of the population in census tract 212 (Niles Township) does not have access. Additionally, 15% of the population in census tract 21 and 23% in census tract 22 (Benton Township) does not have access to parks.
Approximately a quarter (24%) of the urban population in the county does not live within walking distance to a mini park. Most notably, residents of Benton, Lincoln, Niles, and St. Joseph Townships do not have access to mini parks. Eleven percent of the urban population does not live within walking distance of a neighborhood or larger park, including residents living in census tracts in Benton, Coloma, Niles, and St. Joseph Townships, the city of Niles, and Berrien Springs. Conversely, it is estimated that all individuals living in the cities of Benton Harbor, Bridgeman, Buchanan, and St. Joseph have access to mini and larger parks (See Table 9.2 for the percent of the population living outside of walking distance to a park for each urban census tract in Berrien County).
P: What are some things in your community that help you to be healthy?
‘‘ ’’
Parks that you can either walk to or that you can get to quickly and take walks.
–30 - 44 y.o., black, female
96 | 2019 - 2021 Community Health Needs Assessment
Figure 9.2 Photo by 9th grade student at BCMSC
Recreation Environment
Table 9.2 Percent of residents without access to parks by city, township, or village
spectrumhealthlakeland.org | 97
% without access % without access to a neighborhood City/Township/Village Tract Name to a mini park or community park Benton Township 23 0% 0% Benton Township 20 100% 0% Benton Township 22 23% 23% Benton Township 21 15% 43% City of Benton Harbor 3 0% 0% City of Benton Harbor 5 0% 0% City of Benton Harbor 6 0% 0% City of Benton Harbor 4 0% 0% City of Bridgman 111 0% 0% City of Buchanan 202 0% 0% City of Niles 205 0% 0% City of Niles 207 0% 0% City of Niles 209 0% 16% City of Niles 206 0% 29% City of St. Joseph 8 0% 0% City of St. Joseph 10 0% 0% City of St. Joseph 11 0% 0% Coloma Township 102 0% 27% Lincoln Township 14 38% 0% Lincoln Township 15 44% 0% Lincoln Township 16 100% 0% Lincoln Township 17 100% 0% Niles Township 211 100% 0% Niles Township 210 0% 0% Niles Township 212 43% 100% Berrien Springs 213 68% 68% St. Joseph Township 9 0% 0% St. Joseph Township 13 100% 0% St. Joseph Township 7 0% 28%
Recreation Environment
Access to Other Recreation Resources
P: What in your community make it hard to be healthy?
Things in our community that makes it hard to be healthy are fast food, dangerous parks, expensive gym memberships, broken sidewalks/running/biking areas.
–Under 18 y.o., white, male
Much of the research linking the recreation environment to health assesses population proximity to parks. However, community input indicated that other resources for physical activity (e.g., gyms and other recreation facilities) were also important for health. Analysis suggests that over 49,000 individuals living in urban census tracts do not live within walking distance of a recreation facility.16 Residents of Benton Township have the least access with an estimated 88% of the population outside of walking distance. A lack of recreation facilities within walking distance, combined with the lack of transportation, further complicates access to recreational resources (see Figure 9.3 to view available recreation resources and vehicle ownership rate by census tract).


’’
98 | 2019 - 2021 Community Health Needs Assessment
‘‘
Figure 9.3 Parks and Recreation facilities in Berrien County and resident access
Recreation Environment
In addition to parks and gyms, survey respondents also indicated a need for trails.17 Trails can serve as a form of active transportation to schools and places of work. Additionally, research shows that the presence of trails in parks is associated with increased park use and physical activity.18 At the time of analysis, there were more than 32 miles of trails within the county (see Table 9.3 for the number of trail miles by township and city). These trails provide additional recreation options in locations with lower than average park acreage (e.g., Benton Harbor). However, these trails are typically located within walking distance of existing parks, which may help to increase park use but does not necessarily improve recreation access (i.e., trails do not typically increase the number of people who are within walking distance to a recreation resource). Additionally, trails are primarily concentrated in urban municipalities, where residents are generally closer to parks and recreation resources than residents of rural municipalities. Trails are not necessarily accessible to all residents due to real and perceived barriers. For example, the municipality with the most trail miles in the county is the City of Benton Harbor. However, these trails are almost exclusively located in the Harbor Shores Golf Course, which may prevent use due to fear of injury from golf balls or from a lack of knowledge that the trails are for public use.
P: How would you improve the health of your community?
‘‘ ’’
Create community sport leagues for adults, make a trail system that is actually a decent length and connected well, the harbor shores trails are basically [unusable] during golf season, encourage bike riding with more bike lanes, make local road running races with monetary prizes from entrance fees.
–18 - 29 y.o.,white, male
Municipality Trail Miles
City of Benton Harbor 7.066
City of St. Joseph 6.424
City of Buchanan 4.790
Niles Township
Limitations/Future Research
CHNA respondents indicated that components of park quality were of concern, particularly the conditions of sidewalks and roads, the lack of adequate lighting, and the perceived safety of existing exercise resources. However, there is a lack of data available regarding park quality. While many parks and recreation plans include information on amenities and the condition of park equipment, many do not. There is also a lack of information available on the condition and safety of sidewalks, roadside shoulders, and bike lanes for pedestrians.
Respondents also indicated concerns over the affordability of recreation resources. However, parks and recreation plans were inconsistent in providing information on the cost of usage and other access restrictions. Information on other non-traditional recreation resources such as schools, cemeteries, and privately-owned public spaces are not consistently mentioned in recreation plans and will need further research.
Lastly, respondents mentioned a lack of advertisement. Further research is needed to determine areas where additional signage could be located to increase utilization (e.g., non-motorized trail heads) and where advertising can promote community use of local parks (e.g., advertising free parking passes).
P: What are the biggest health issues in your community?
It’s not very safe. The roads, sidewalks, even the lights. A kid got hit walking to school last year because the street lights are terrible and it’s dark when we walk to school.
–10th grade, male student, Niles New Tech
spectrumhealthlakeland.org | 99
4.403 City of Niles 2.438 Benton Township 2.24 St. Joseph Township 2.179 Lincoln Township 1.738 Coloma Township 0.63 Watervliet Township 0.376 Buchanan Township 0.333 Grand Total 32.617
Table 9.3 Trail miles by municipality in Berrien County
‘‘ ’’
Recreation Environment
1 U.S. Department of Health and Human Services. (2019). Physical Activity Guidelines for Americans 2nd edition. Retrieved from https://health.gov/sites/default/files/2019-10/PAG_ExecutiveSummary.pdf
2 Motta, R. W. (2010). The Role of Exercise in Reducing Childhood and Adolescent PTSD, Anxiety, & Depression. PsycEXTRA Dataset. doi: 10.1037/e573582011-004
3 Berrien County Health Department. (2020). 2018-2019 Berrien County Behavioral Risk Factor Surveillance Survey. Retrieved from http://www.berriencounty.org/ArchiveCenter/ViewFile/Item/528
4 Fussman C. (2015). Health Risk Behaviors within the State of Michigan: 2014 Behavioral Risk Factor Survey, 28th Annual Report. Retrieved from https://www.michigan.gov/documents/mdch/2014_MiBRFS_Annual_Report_Final_Web_504843_7.pdf
5 Sallis, J. F., Cervero, R. B., Ascher, W., Henderson, K. A., Kraft, M. K., & Kerr, J. (2006). An Ecological Approach To Creating Active Living Communities. Annual Review of Public Health, 27(1), 297–322. doi: 10.1146/annurev.publhealth.27.021405.102100
6 Rigolon, A. (2016). A complex landscape of inequity in access to urban parks: A literature review. Landscape and Urban Planning, 153, 160–169. doi: 10.1016/j.landurbplan.2016.05.017
7 Harvard Chan University (2019). Environmental Barriers to Activity. Obesity Prevention Source. Retrieved from https://www.hsph.harvard.edu/obesity-prevention-source/obesity-causes/physical-activity-environment/
8 Excluded from analysis are locations identified by the Southwest Michigan Planning Commission (SWMPC) as closed, limited, or restricted access. Private parks, athletic facilities or fields, sports facilities, golf courses, and education centers were also excluded unless otherwise stated as open to the public. All parks and recreation data were provided by the SWMPC and include recreational options that are owned and operated by non-governmental organizations (i.e., the Sarett Nature Center) as well as local, county, and state governmental bodies.
9 Residents per park equals the municipal population divided by the number of parks within, or intersecting, municipality boarders.
10 This analysis includes parks that overlap municipality boundaries. For example, the Boyle Lake State Wildlife Area is divided between Weesaw and Buchanan Townships and counts as a park in each municipality. The park acres within Weesaw Township are counted toward the total acreage for Weesaw Township and the acers within Buchanan Township are counted toward the Buchanan Township total.
11 May, M. (2019). NRPA Park Metrics Replaces NRPA Areas and Facilities Standards. Retrieved from https://www.nrpa.org/parks-recreation-magazine/2019/november/nrpa-park-metrics-replaces-outdated-nrpa-areas-and-facilities-standards/
12 Sturm, R., & Cohen, D. (2014). Proximity to urban parks and mental health. The journal of mental health policy and economics, 17(1), 19–24. https://www.ncbi.nlm.nih.gov/pmc/articles/PMC4049158/
13 Kaczynski, A. T., Besenyi, G. M., Stanis, S. A. W., Koohsari, M. J., Oestman, K. B., Bergstrom, R., … Reis, R. S. (2014). Are park proximity and park features related to park use and park-based physical activity among adults? Variations by multiple socio-demographic characteristics. International Journal of Behavioral Nutrition and Physical Activity, 11(1). doi: 10.1186/s12966-014-0146-4
14 Nicholls, S. (2001). Measuring the accessibility and equity of public parks: a case study using GIS. Managing Leisure, 6(4), 201–219. doi: 10.1080/13606710110084651
15 In this analysis, walking distance is approximately a 6-minute walk, or 1/3 of a mile. If a resident lives more than 1/3 of a mile from a park, they lack access. Urban population refers to residents of urban census tracts.
16 Analysis used Standard Industry Classification (SIC) codes from Hoover’s database to identify recreation facilities in Berrien County. Included in this analysis were a wide variety of facilities including gyms, community centers, dance studios and pools. Facilities with the following Standard Industry Classification (SIC) codes were included: 799101, 799102, 799103, 799106, 799107, 799108, 799109, 799110, 799111, 799112, 799201, 799701, 799702, 799703, 799704, 799707, 799711, 799717, 799723, 799901, 799908, 799958, 799969, 799971, 799984, or 799998. Excluded from this analysis were “civic organizations” and “amusement and recreation services, not elsewhere classified”.
17This analysis includes trail data from the SWMPC and from the Sarett Nature Center website.
18Zhang, R., Wulff, H., Duan, Y., & Wagner, P. (2019). Associations between the physical environment and park-based physical activity: A systematic review. Journal of Sport and Health Science, 8(5), 412–421. doi: 10.1016/j.jshs.2018.11.002
100 | 2019 - 2021 Community Health Needs Assessment
Social Cohesion


102 | 2019 - 2021 Community Health Needs Assessment
Social Cohesion
High-Level Findings
• Social cohesion is positively associated with many social determinants of health.
• The relationship between social cohesion and many of the social determinants is not immediate and often indirect.
• Social cohesion may also have negative effects by causing “in-group” vs. “out-group” dynamics.
• There are many levers that can be used to enhance social cohesion.
Introduction
There is no single definition of social cohesion.1 However, for the purposes of this CHNA, social cohesion is defined as the connectedness or “bonds” that hold members of a community together. Members of socially cohesive communities have strong interpersonal relationships, dense social networks, and high levels of mutual trust and cooperation.
They adhere to a shared system of values, beliefs, and norms. Principles of solidarity, belonging, inclusion, and the pursuit of collective wellbeing are central to socially cohesive communities.2,3
Social cohesion was the number one theme in response to the prompt “When I experience hard or stressful times, these are the ways I help myself feel better/relax/calm down.” Participants named various ways they connect with families, friends, spiritual leaders and others during hard or stressful times.
Social Cohesion and Its Relationship to Health and Health Behaviors
Research suggests that social cohesion is associated with many health benefits. It is positively associated with mental health, physical health, and a wide range of health behaviors.4,5

Social Cohesion on Mental Health
Satisfying relationships with family, friends, neighbors, and other community members are associated with greater happiness and lower risk of dementia.6 Having a person or people in one’s life who can be relied on for practical support is associated with a calmer nervous system, healthier brain, and reduced emotional and physical pain.7 Social connections are associated with lower stress levels which is causally linked to reduced risks for cardiovascular, gastrointestinal, endocrine, and immune system problems.8 Neighborhood social cohesion is associated with better adolescent behavioral health.9
Social Cohesion and Physical Health
Higher levels of neighborhood social cohesion are associated with lower blood sugar levels,10 Type 2 Diabetes,11 inflammatory biomarkers,12 hypertension,13 and risk of being overweight or obese.14 Perceptions of neighborhood social cohesion also correlate with reduced risks of heart attack,15 stroke,16 stroke mortality,17 and sexually transmitted diseases.18 Trust, a key indicator of social cohesion, is associated with reduced mortality.19 (For Lakeland’s Trust and Relationships Summary, see Appendix E).
spectrumhealthlakeland.org | 103
Figure 10.1 Photo taken by student at Bridge Academy
Social Cohesion
Lack
of Social Cohesion (i.e., social isolation) on Health
Chronically isolated individuals are more likely to develop inflammation-related diseases20 and are at greater risk factor for poor cognitive performance, cognitive decline, poor executive functioning, negativity, depressive thoughts, and heightened sensitivity to social threats.21 Lack of social ties are also associated with increased risk of infections, mental illness, cardiovascular and respiratory conditions, and early mortality.22,23,24 Disconnection from mainstream society, such as residential segregation, is associated with many poor health effects among African Americans such as mortality,25 cardiovascular disease and hypertension,26 cognitive decline,27 pre-term and low weight births,28 and late-stage breast and lung cancers.29,30
Social Cohesion and Health Behavior
Social cohesion is also associated with many health behaviors such as medication adherence,31 smoking,32 physical activity,33,34 sleep,35 and preventive health care such as vaccinations, cholesterol tests, mammograms, and Pap smears.36 Community cohesion is also associated with lower risk for substance use,37 better diet, and exercise habits.38 Living in less socially cohesive neighborhoods is associated with increased smoking and more sedentary lifestyle.39
Social
Cohesion and Its Relationship to the Social Determinants of
Health
The residents of low-income communities that have low levels of social cohesion are more likely to be food insecure.
Social cohesion is associated with many social (and environmental) factors known to determine health and health behaviors, including those identified as needs in this CHNA (i.e., the food, recreational, and physical environments; and health care resources). In subsequent sections of this chapter, the discussion will focus on the associations between social cohesion and the following social determinants: transportation, housing, the physical environment, the recreational environment, economic conditions, and faith-based and spiritual practices.
Transportation
Transportation infrastructure, such as roads, sidewalks, paths, bridges, rail, airports, waterways, and harbors, has significant impacts on community social cohesion. Depending on factors like design, location, maintenance, modal mix, and cost of use, transportation infrastructure can promote (or discourage) social cohesion by making it easier (or harder) for people to connect and to build relationships with one another. For instance, communities where residents often travel by foot, bike, or public transit are more cohesive than auto dependent communities.40 In fact, auto dependency has a negative effect on activities that build cohesion, such as visiting friends, participating in community sports and cultural activities, and engaging in civic and political activities.41
People in communities where physical activity, such as walking or biking, serves as a mode of transportation exhibit more social cohesion community, and better mental health.
Residents of Berrien County are highly auto dependent. The public transit system is fragmented and provides limited service. Moreover, other aspects of the regional transport infrastructure, such as the bridges between the cities of St. Joseph and Benton Harbor, undermine social cohesion by contributing to community severance42 – i.e., physical and psychological barriers that limit the development of social networks among communities.
P : What are some things in your community that make it hard to be healthy?
Lack of complete bike paths/sidewalks to connect neighborhoods and other living/playing areas. We’re bound by cars for safe transportation.
–30 - 44 y.o., black, female
104 | 2019 - 2021 Community Health Needs Assessment
‘‘ ’’
Social Cohesion
Together, these three factors – high auto dependence, poor public transport, and infrastructure that contributes to community severance – challenge the development of social cohesion across Berrien County. This is manifest, for instance, by the limited relationships between north and south county residents, and between the residents of Benton Harbor and St. Joseph.
Housing
Residential stability impacts community social cohesion.
P: How would you improve the health of your community?
Greater connectivity with sidewalks and bike paths that link neighborhoods and downtown St. Joe. Benton Harbor desperately needs more sidewalks, public transportation, and better grocery options.
–30 - 44 y.o., black, female
The less frequently community members change residences, the more time and opportunity they have to build stable relationships of trust and reciprocity, and, therefore, social cohesion with their neighbors. Residential stability also increases likelihood that people will participate in civic groups, neighborhood associations,43 and local elections (e.g., voter turnout) – all of which are positively associated with social cohesion. Figure 10.2 shows that across subdivisions in Berrien County, the higher the level of residential stability, the higher the rate of voter turnout.44,45
Voter Turnout in Relation to Year Householder Moved into Occupied Housing Units % of Household Moved into Occupied Housing Units - Moved 2010-2014
figure10.2
Figure 10.2 Scatterplot showing Voter Turnout Rate in relation to Year Householder moved into Occupied Housing Units From 2010 to 2014
Social cohesion is also impacted by homeownership. Compared to renters, homeowners are less inclined to move (due to higher costs of moving) and, therefore, have longer community tenure which is associated with greater social cohesion. They are also more inclined to be civically and socially engaged (e.g., friendship formation, voting, and neighborhood associations) which are also associated with higher levels of social cohesion.46
In Berrien County, the average rate of owner-occupied housing (a proxy for home ownership) is about 69% compared to 70% state average.44 Neighborhoods in Benton Harbor have the lowest rates of owner-occupied housing and the lowest rates of voter turnout (see Appendix F for Voter Turnout and associated social determinants by municipality).47 Communities with high rates of owner-occupied housing, such as St. Joseph Charter, Lincoln Charter, and Chikaming have some of the highest rates of voter turnout.
spectrumhealthlakeland.org | 105
‘‘ ’’
0 10 20 30 40 50 60 70 0 10 20 30 40 50 Axis Title
Voter
Rate
Turnout
Social Cohesion
Figure 10.3 Scatterplot showing relationship between Voter Turnout Rate and Owner-Occupied Housing
Figure 10.3 shows that there is a positive association between the percentage of owner-occupied housing in a census tract and the rate of voter turnout, suggesting that those tracts with high rates of home ownership also experience higher levels of social cohesion. Residential segregation reduces opportunities to build cohesion.48 Berrien County is highly segregated along racial lines. The dissimilarity index – a measure for segregation – for Berrien County is 70%, meaning that for each census tract to have a black-white racial composition that reflects the composition of the entire county, 70% of people would have to move to another tract. Only five counties in Michigan (Ionia, Muskegon, Montcalm, Wayne, and Gratiot) are more segregated than Berrien. (See Dissimilarity Index in Appendix G).

10.4
Physical Environment
P: How would you improve the health of your community?
Increase home ownership to instill pride and create a better tax base, increase access to healthy food, fix the sidewalks, decrease racial segregation. –45 - 59 y.o., white, female
Social cohesion is also impacted by a community’s physical environment, including the condition of its housing and other structures, sidewalks and streets; the quality of its air, water, and soil; and its weather. For instance, well-maintained sidewalks and streets that are walkable and bikeable help promote social cohesion by providing opportunities for people to connect with one another and to engage in social and civic activities. 49,50 For information on bikeable and walkable communities, see Appendix H.
106 | 2019 - 2021 Community Health Needs Assessment
‘‘ ’’
Voter
% of Owner Occupied
Voter Turnout Rate 0 10 20 30 40 50 60 70 0 20 40 60 80 100 figure
Figure
Photo by 10th grade student at Niles New Tech
Turnout and Owner Occupancy
Housing
10.3
Social Cohesion

Recreation Environment
“Street-scale” features of the physical environment such as street furniture,51 traffic calming,52 street crossing aids,53 public squares, and green infrastructure54 enhance social cohesion by fostering social interaction, creating opportunities to build community trust and creating a shared sense of community identity.55 Weather and air quality have been shown to impact people’s levels of outdoor activities and, consequently, opportunities for and levels of social interactions and cohesion.56
Higher rates of social cohesion are associated with rich recreational environments, such as places where there are many usable parks, trails, beaches, waterways, and playgrounds available for sports and other leisure activities.57 Activities, such as organized sports teams, walking and running groups, chess and other game clubs, and playgroups, help build cohesion.58,59 Additionally, sports and leisure activities have been shown to help reduce crime and other anti-social behaviors that erode community trust, collaboration, and mutual support.60 They have also been shown to build community pride and sense of belonging and to provide participants with opportunities to develop collective problem-solving and negotiation skills which are essential for building social cohesion.61,62
Aspects of the physical environment, such as street lighting, help foster social cohesion by enhancing perceptions of safety, thereby encouraging people to trust, bond, and cooperate with one another.

P: What in your community helps you to be healthy?
‘‘ ’’
The Teen Center gives us a safe place. Play basketball, get help with homework, hang out with friends. It’s like the only place we have though. –18 - 29 y.o., black male
Economic Conditions
Moreover, research shows that people who engage in sporting activities are more likely to engage in civic activities that build cohesion.63 Cultural activities, such as festivals and parades, are also associated with community cohesion64 Through their recreational and leisure programming, local organizations such as the Benton Harbor Boys and Girls Clubs and the YMCA of Southwest Michigan positively affect social cohesion by providing opportunities for social interaction and network development.
Social cohesion is profoundly impacted by income inequality, i.e., large income gaps between high and low wage earners. Income inequality can drive social wedges between people of different economic statuses. And, to the extent that economic status correlates with racial and ethnic identity, income inequality can result in social disconnections among racial and ethnic groups. In addition to contributing to a lack of social cohesion, income inequality can lead to a lack of trust, social supports, and a sense of community – all of which are critical to social cohesion. Income inequality is particularly harmful to the health of lower income people.65
spectrumhealthlakeland.org | 107
Figure 10.5 Photo by student at Bridge Academy
Figure 10.6 Photo by student at Bridge Academy
Social Cohesion
Michigan ranks 15 out of the 50 states in terms of income inequality.66 In other words, only 14 states in the U.S. have income distributions that are more unequal than Michigan. In addition, Berrien County ranks 278 in terms of income inequality among the nation’s 3061 counties. Put another way, income is more inequitably distributed in Berrien County than it is in 90 percent of all counties in the United States. Only six Michigan counties have higher rates of income inequality than Berrien.67 Data from the Federal Reserve indicates that income distribution in Berrien County has worsened since 2010. That year, the ratio of the income of the top 20% compared to the income of the bottom 80% was 14.32. By 2017, the ratio had increased to 15.36.68
Living in high‐poverty areas can increase the likelihood that residents will build social cohesion. Low income people who lack formal healthcare, for instance, have been shown to depend on neighbors for medications and medical supplies.
Employment is also associated with social cohesion. Being employed provides access to social networks, such as colleagues and friends, and also helps people develop collaboration and conflict resolution skills, which are necessary to build social cohesion.69 Jobs that provide opportunities for empowerment, self-determination and voice are associated with key aspects of social cohesion, such as trust and participation in civic life.70
In contrast, being unemployed narrows opportunities to build cohesion. Job loss or lack of access to jobs is also associated with lower levels of trust and civic engagement. Joblessness can lead to hopelessness, alienation, and frustration that can breed anti-social behavior, which undermines community cohesion.
Figure 10.7 shows that as the rate of unemployment decreases voter turnout – a measure of social cohesion – increases.71
108 | 2019 - 2021 Community Health Needs Assessment
Figure 10.7 Scatterplot showing relationship between Voter Turnout and Unemployment rate
Unemployment Rate Voter Turnout Rate 0 10 20 30 40 50 60 70 0 5 10 15 20 25 figure 10.6
Voter Turnout in Relation to Unemployment Rate
Social Cohesion
Education
Education contributes to social cohesion by socializing young people and providing students with knowledge and skills required to foster social cohesion. For instance, education provides students with knowledge and understanding about social norms, values, and behaviors required for effective interpersonal interaction. Education also provides students with skills needed to form relationships, collaborate, and negotiate with others and establish the trusting social networks that are critical for social cohesion. By teaching the “social rules of the game,” education lays the groundwork for social cohesion. Education may also undermine cohesion by conveying norms, values, and beliefs that drive wedges between people and groups through policies and practices that create social and other types of inequities among different groups of students (e.g., racial minorities, children with physical or cognitive limitations, or language differences).
Religion
Organized religion, religious affiliation, and religiosity (i.e., the internalization of religious doctrine) build social networks and social supports which contribute to social cohesion.72,73,74,75 They contribute to social cohesion by creating conditions that lead to the establishment of mutual trust, shared values and beliefs, and accepted norms such as reciprocity and volunteerism.76,77 Organized religion, religious affiliation, and religiosity are also sources of formal and informal social control (i.e., rules and standards that lead to conformity in norms, values, behaviors, and expectations) which are also critical for social cohesion.78
P: What are some things in your community that help you to be healthy?
Church can be a big impact for the community. I didn’t know which way to go. Going to church opened my eyes to something greater than my heartache and pain. It can be a hospital for the sick souls.
–Male student, Bridge Academy
Organized religion, religious affiliation, and religiosity can also breed cohesion that leads to the social exclusion and marginalization of “out-groups” based on attributes such as race, ethnicity, gender, sexuality, and national origin. Networks of religious-based trust and shared norms, values, and beliefs can also fuel deep and sometimes violent societal divisions (e.g., inter-religious conflict between Protestants and Catholics, Muslims and Hindus, Jews and Christians).79
Organized religion, religious affiliation, and religiosity can enhance in-group favoritism (i.e., favoritism toward people of the same religious group), and has been shown to be positively associated with a willingness to discriminate on the basis of non-religious social identities. Research has found that the degree of in-group and out-group cohesion varies by denomination.80
Appendix I shows that, in 2010, roughly half of the population in Berrien County participated in organized religion. A significant majority were Protestants followed by Catholics.
Research shows that social cohesion is critical to community health. Therefore, future research should focus on developing processes for building, measuring, and tracking cohesion within and across Berrien County neighborhoods.
Limitations
There is no universal definition of the concept of social cohesion and the tools and processes by which to measure are varied and contested. Moreover, much of the literature on social cohesion is based on non-U.S. populations.
Additionally, there is limited recent data on organized religion, religious affiliation, and religiosity – key inputs to social cohesion – in Berrien County.
spectrumhealthlakeland.org | 109
‘‘ ’’
Social Cohesion
1 Generally, social cohesion is understood to be a protective factor that promotes good health and good health behaviors. However, it can have a less positive side by driving social wedges among groups that create divisions and social isolation and promoting and normalizing behaviors that do not promote good health. In this chapter, we focus more on the health promoting aspects of social cohesion.
2 Social cohesion overlaps and is often used interchangeably with term social capital. While they are related, social cohesion typically refers to group closeness, solidarity, connectedness and commitment to a body of shared values, beliefs and norms. Social capital refers to trust, reciprocity, mutual aid, social support and other social assets, resources or networks. Social capital is a measure or indicator of social cohesion.
3 Inclusion Health is a concept that is gaining currency. It refers to the idea that people and communities that are socially excluded (i.e., are not connected to the societal mainstream) suffer worse health and higher rates of mortality, and that creating inclusive societies is central to improving population health.
4 Gordeev, V. S., & Egan, M. (2015). Social cohesion, neighborhood resilience, and health: evidence from New Deal for Communities program. The Lancet, 386. doi: 10.1016/s0140-6736(15)00877-6
5 Chuang, Y., Chuang, K. & Yang, T. (2013). Social cohesion matters in health. Int J Equity Health. 12, 87. doi:10.1186/1475-9276-12-87.
6 Kingsbury, M., Clayborne, Z., Colman, I., & Kirkbride, J. B. (2019). The protective effect of neighbourhood social cohesion on adolescent mental health following stressful life events. Psychological Medicine, 1–8. doi: 10.1017/s0033291719001235
7 Ruiz, M. A. (2018). Trust and mortality in the contemporary United States. Journal of Epidemiology and Community Health, 73(4), 285–286. doi: 10.1136/jech-2018-211602
8 Harvard Health Publishing. (2010). The health benefits of strong relationships. Retrieved from https://www.health.harvard.edu/newsletter_article/the-health-benefits-of-strong-relationships
9 Henderson, H., Child, S., Moore, S., Moore, J. B., & Kaczynski, A. T. (2016). The Influence of Neighborhood Aesthetics, Safety, and Social Cohesion on Perceived Stress in Disadvantaged Communities. American Journal of Community Psychology, 58(1-2), 80–88. doi: 10.1002/ajcp.12081
10 Neergheen, V. L., Topel, M., Dyke, M. E. V., Sullivan, S., Pemu, P. E., Gibbons, G. H., … Lewis, T. T. (2019). Neighborhood social cohesion is associated with lower levels of interleukin-6 in African American women. Brain, Behavior, and Immunity, 76, 28–36. doi: 10.1016/j.bbi.2018.10.008
11 Gebreab, S. Y., Hickson, D. A., Sims, M., Wyatt, S. B., Davis, S. K., Correa, A., & Diez-Roux, A. V. (2017). Neighborhood social and physical environments and type 2 diabetes mellitus in African Americans: The Jackson Heart Study. Health & Place, 43, 128–137. doi: 10.1016/j.healthplace.2016.12.001
12 Smalls, B. L., Gregory, C. M., Zoller, J. S., & Egede, L. E. (2015). Assessing the relationship between neighborhood factors and diabetes related health outcomes and self-care behaviors. BMC Health Services Research, 15(1). doi: 10.1186/s12913-015-1086-7
13 Lagisetty, P. A., Wen, M., Choi, H., Heisler, M., Kanaya, A. M., & Kandula, N. R. (2015). Neighborhood Social Cohesion and Prevalence of Hypertension and Diabetes in a South Asian Population. Journal of Immigrant and Minority Health, 18(6), 1309–1316. doi: 10.1007/s10903-015-0308-8
14 Carter, M. A., & Dubois, L. (2010). Neighbourhoods and child adiposity: A critical appraisal of the literature. Health & Place, 16(3), 616–628. doi: 10.1016/j.healthplace.2009.12.012
15 Kim, E. S., Hawes, A. M., & Smith, J. (2014). Perceived neighborhood social cohesion and myocardial infarction. Journal of Epidemiology and Community Health, 68(11), 1020–1026. doi: 10.1136/jech-2014-204009
16 Kim, E. S., Park, N., & Peterson, C. (2013). Perceived neighborhood social cohesion and stroke. Social Science & Medicine, 97, 49–55. doi: 10.1016/j.socscimed.2013.08.001
17 Clark, C. J., Guo, H., Lunos, S., Aggarwal, N. T., Beck, T., Evans, D. A., … Everson-Rose, S. A. (2011). Neighborhood Cohesion Is Associated With Reduced Risk of Stroke Mortality. Stroke, 42(5), 1212–1217. doi: 10.1161/strokeaha.110.609164
18 Ellen, J. M., Jennings, J. M., Meyers, T., Chung, S.-E., & Taylor, R. (2004). Perceived Social Cohesion and Prevalence of Sexually Transmitted Diseases. Sexually Transmitted Diseases, 31(2), 117–122. doi: 10.1097/01.olq.0000110467.64222.61
19 Harvard Health Publishing. (2010). The health benefits of strong relationships. Retrieved from https://www.health.harvard.edu/newsletter_article/the-health-benefits-of-strong-relationships
20 Cole, S. W. (2014). Human Social Genomics. PLoS Genetics, 10(8). doi: 10.1371/journal.pgen.1004601
21 Cacioppo, J. T., & Hawkley, L. C. (2009). Perceived social isolation and cognition. Trends in Cognitive Sciences, 13(10), 447–454. doi: 10.1016/j.tics.2009.06.005
22 Morse, E. A. (2015). Neighborhood-Level Racial/Ethnic Residential Segregation and Incident Cardiovascular Disease: The Multi-Ethnic Study of Atherosclerosis. The Journal of Emergency Medicine, 49(1), 120. doi: 10.1016/j.jemermed.2015.05.020
23 Sudano, J. J., Perzynski, A., Wong, D. W., Colabianchi, N., & Litaker, D. (2013). Neighborhood racial residential segregation and changes in health or death among older adults. Health & Place, 19, 80–88. doi: 10.1016/j.healthplace.2012.09.015
24 Holt-Lunstad J, Smith TB, Layton JB (2010) Social Relationships and Mortality Risk: A Meta-analytic Review. PLoS Med 7(7): e1000316. https://doi.org/10.1371/journal.pmed.1000316.
25 Yang, T.-C., & Matthews, S. A. (2015). Death by Segregation: Does the Dimension of Racial Segregation Matter? Plos One, 10(9). doi: 10.1371/journal.pone.0138489
26 Kershaw, K. N., Robinson, W. R., Gordon-Larsen, P., Hicken, M. T., Goff, D. C., Carnethon, M. R., … Roux, A. V. D. (2017). Association of Changes in Neighborhood-Level Racial Residential Segregation With Changes in Blood Pressure Among Black Adults. JAMA Internal Medicine, 177(7), 996. doi: 10.1001/jamainternmed.2017.1226
27 Kovalchik, S. A., Slaughter, M. E., Miles, J., Friedman, E. M., & Shih, R. A. (2015). Neighbourhood racial/ethnic composition and segregation and trajectories of cognitive decline among US older adults. Journal of Epidemiology and Community Health, 69(10), 978–984. doi: 10.1136/jech-2015-205600
110 | 2019 - 2021 Community Health Needs Assessment
Social Cohesion
28 Mehra, R., Boyd, L. M., & Ickovics, J. R. (2017). Racial residential segregation and adverse birth outcomes: A systematic review and meta-analysis. Social Science & Medicine, 191, 237–250. doi: 10.1016/j.socscimed.2017.09.018
29 Pruitt, S. L., Lee, S. J. C., Tiro, J. A., Xuan, L., Ruiz, J. M., & Inrig, S. (2015). Residential racial segregation and mortality among black, white, and Hispanic urban breast cancer patients in Texas, 1995 to 2009. Cancer, 121(11), 1845–1855. doi: 10.1002/cncr.29282 13
30 Landrine, H., Corral, I., Lee, J. G. L., Efird, J. T., Hall, M. B., & Bess, J. J. (2016). Residential Segregation and Racial Cancer Disparities: A Systematic Review. Journal of Racial and Ethnic Health Disparities, 4(6), 1195–1205. doi: 10.1007/s40615-016-0326-9
31 Reitzel, L. R., Kendzor, D. E., Castro, Y., Cao, Y., Businelle, M. S., Mazas, C. A., … Wetter, D. W. (2012). The Relation between Social Cohesion and Smoking Cessation among Black Smokers, and the Potential Role of Psychosocial Mediators. Annals of Behavioral Medicine, 45(2), 249–257. doi: 10.1007/s12160-012-9438-6
32 Reitzel, L. R., Kendzor, D. E., Castro, Y., Cao, Y., Businelle, M. S., Mazas, C. A., … Wetter, D. W. (2012). The Relation between Social Cohesion and Smoking Cessation among Black Smokers, and the Potential Role of Psychosocial Mediators. Annals of Behavioral Medicine, 45(2), 249–257. doi: 10.1007/s12160-012-9438-6
33 Shelton, R. C., Mcneill, L. H., Puleo, E., Wolin, K. Y., Emmons, K. M., & Bennett, G. G. (2011). The Association Between Social Factors and Physical Activity Among Low-Income Adults Living in Public Housing. American Journal of Public Health, 101(11), 2102–2110. doi: 10.2105/ajph.2010.196030
34 Cradock, A. L., Kawachi, I., Colditz, G. A., Gortmaker, S. L., & Buka, S. L. (2009). Neighborhood social cohesion and youth participation in physical activity in Chicago. Social Science & Medicine, 68(3), 427–435. doi: 10.1016/j.socscimed.2008.10.028
35 Hale, L., James, S., Xiao, Q., Billings, M. E., & Johnson, D. A. (2019). Neighborhood factors associated with sleep health. Sleep and Health, 77–84. doi: 10.1016/b978-0-12-815373-4.00007-1
36 Kim, E. S., & Kawachi, I. (2017). Perceived Neighborhood Social Cohesion and Preventive Healthcare Use. American Journal of Preventive Medicine, 53(2). doi: 10.1016/j.amepre.2017.01.007
37 Echeverría, S., Diez-Roux, A. V., Shea, S., Borrell, L. N., & Jackson, S. (2008). Associations of neighborhood problems and neighborhood social cohesion with mental health and health behaviors: The Multi-Ethnic Study of Atherosclerosis. Health & Place, 14(4), 853–865. doi: 10.1016/j.healthplace.2008.01.004
38 American Heart Association News. (2019). Can social connection aid heart health in African-American community? Retrieved from https://www.heart.org/en/news/2019/03/06/can-social-connection-aid-heart-health-inafrican-american-community
39 Echeverría, S., Diez-Roux, A. V., Shea, S., Borrell, L. N., & Jackson, S. (2008). Associations of neighborhood problems and neighborhood social cohesion with mental health and health behaviors: The Multi-Ethnic Study of Atherosclerosis. Health & Place, 14(4), 853–865. doi: 10.1016/j.healthplace.2008.01.004
40 Litman, T. (2018). Community Cohesion As A Transport Planning Objective. Retrieved from https://www.vtpi.org/cohesion.pdf
41 Ma, L., Kent, J., & Mulley, C. (2018). Transport disadvantage, social exclusion, and subjective wellbeing: The role of the neighborhood environment—evidence from Sydney, Australia. Journal of Transport and Land Use, 11(1). doi: 10.5198/jtlu.2018.1008
42 Boniface, S., Scantlebury, R., Watkins, S., & Mindell, J. (2015). Health implications of transport: Evidence of effects of transport on social interactions. Journal of Transport & Health, 2(3), 441–446. doi: 10.1016/j.jth.2015.05.005
43 Rohe, M., & R, W. (2013). Reexamining the Social Benefits of Homeownership after the Housing Crisis. Retrieved from https://www.jchs.harvard.edu/sites/default/files/hbtl-04.pdf
44 U.S. Census Bureau (2016). Selected Housing Characteristics (DP04), 2012-2016 American Community Survey 5-year estimates. Retrieved from https://data.census.gov/cedsci/table?tid=ACSDP5Y2016.DP04&t=Housing%3AHousing%20Units&layer=VT_2018 _050_00_PY_ D1&g=0500000US26021,26021.060000&vintage=2016
45 The data that is used in this chapter is at the municipal level vs. census tract level.
46 Rohe , W., & linblad, M. (2013). Reexamining the Social Benefits of Homeownership after the ... Retrieved from https://www.jchs.harvard.edu/sites/default/files/hbtl-04.pdf
47 Voting is a form of civic engagement, which is a form of social capital. Social capital is an indicator or leisure of social cohesion. Civic engagement, such as voting, is a form of social capital which is an indicator of social cohesion.
48 Transit-oriented developments may reinforce decades-old processes of residential segregation, gentrification, and displacement of low-income residents and communities of color. Careful consideration of zoning, neighborhood design, and affordability is vital to mitigating the impacts of transit-induced gentrification, a socioeconomic byproduct of transit-oriented development whereby the provision of transit service “upscales” nearby neighborhood(s) and displaces existing community members with more affluent and often White residents.
49 Levasseur, M., Généreux, M., Bruneau, J.-F., Vanasse, A., Chabot, É., Beaulac, C., & Bédard, M.-M. (2015). Importance of proximity to resources, social support, transportation and neighborhood security for mobility and 14 social participation in older adults: results from a scoping study. BMC Public Health, 15(1). doi: 10.1186/s12889- 015-1824-0
50 Leyden, K. M. (2003). Social Capital and the Built Environment: The Importance of Walkable Neighborhoods. American Journal of Public Health, 93(9), 1546–1551. doi: 10.2105/ajph.93.9.1546
51 Small-scale features – generally in a fixed location – including bike racks, benches, bus shelters, and signs, which are both functional and create a sense of place
52 Physical interventions in street design, including traffic circles and roundabouts, neck downs, center island narrowing’s, chicanes, speed bumps, and textured surfaces, among others, that can reduce speeds and traffic volumes, improving the experience and safety of users of nonmotorized transportation.
53 Marked and unmarked crosswalks, pedestrian signals.
54 Green infrastructure features at the neighborhood or site scale, including greenways, rain gardens, riparian buffers, bioswales, pervious pavement, and green streets.
spectrumhealthlakeland.org | 111
Social Cohesion
55 Braun, L., & Read, A. (2015). Benefits of Street-Scale Features for Walking and Biking. Retrieved from http://dbedt.hawaii.gov/hcda/files/2016/03/20160302-Bikeshare-Exhibit-B.pdf
56 Horanont, T., Phithakkitnukoon, S., Leong, T. W., Sekimoto, Y., & Shibasaki, R. (2013). Weather Effects on the Patterns of Peoples Everyday Activities: A Study Using GPS Traces of Mobile Phone Users. PLoS ONE, 8(12). doi: 10.1371/journal.pone.0081153
57 Cradock, A. L., Kawachi, I., Colditz, G. A., Gortmaker, S. L., & Buka, S. L. (2009). Neighborhood social cohesion and youth participation in physical activity in Chicago. Social Science & Medicine, 68(3), 427–435. doi: 10.1016/j.socscimed.2008.10.028
58 Teams can also undermine social cohesion by creating strong, sometimes antagonist and violent, divisions among people and communities.
59 Nathan, S., Kemp, L., Bunde-Birouste, A., Mackenzie, J., Evers, C., & Shwe, T. A. (2013). “We wouldn’t of made friends if we didn’t come to Football United”:the impacts of a football program on young people’s peer, prosocial and cross-cultural relationships. BMC Public Health, 13(1). doi: 10.1186/1471-2458-13-399
60 Street Games. (2009). Sport and Community Cohesion Case Study No.1. Retrieved from https://www.funding4sport.co.uk/wp-content/uploads/2013/08/1.Casestudysport.pdf
61 Sports have also been the source of team-driven social divisions, as well. Examples include fans (sometimes violent) displays of racism, nationalism, and regionalism in European and Latin American football (soccer), and in American baseball, football, and basketball exhibited in both professional and amateur leagues.
62 Jeannotte, M. S. (2003). Singing alone? The contribution of cultural capital to social cohesion and sustainable communities. International Journal of Cultural Policy, 9(1), 35–49. doi: 10.1080/1028663032000089507
63 Brinkley, A., Mcdermott, H., & Munir, F. (2016). What benefits does team sport hold for the workplace? A systematic review. Journal of Sports Sciences, 35(2), 136–148. doi: 10.1080/02640414.2016.1158852
64 Izumi, B. T., Schulz, A. J., Mentz, G., Israel, B. A., Sand, S. L., Reyes, A. G., … Diaz, G. (2015). Leader Behaviors, Group Cohesion, and Participation in a Walking Group Program. American Journal of Preventive Medicine, 49(1), 41–49. doi: 10.1016/j.amepre.2015.01.019
65 Thoma, M. (2015). How inequality harms health -- and the economy. Retrieved from https://www.cbsnews.com/news/inequality-is-bad-for-health-and-bad-for-the-economy/
66 Income inequality as measured by a comparison of the average income of the top 1% and the average income of the bottom 99%.
67 Federal Reserve Bank of St. Louis. (2018). Income Inequality, Annual: Michigan. Retrieved from https://fred.stlouisfed.org/release/tables?rid=414&eid=302538&od=#
68 Geographical Economic Data. (2018). 2018 Income Inequality by County (Ratio). Retrieved from https://geofred.stlouisfed.org/map/?th=pubugn&cc=5&rc=false&im=fractile&sb&lng=- 85.619&lat=42.666&zm=8&sl&sv&sti=150201&rt= county&at=Not Seasonally Adjusted, Annual, Ratio&fq=Annual&am=Average&un=lin&dt=2017-01-01
69 Not all jobs have positive effects on social cohesion. For instance, jobs that involve arbitrary schedule changes and nighttime work complicate efforts to build relationships and social networks. They can also disrupt relationships with family, friends and other community members.
70 Kawachi, I., & Kennedy, B. P. (1997). Socioeconomic determinants of health : Health and social cohesion: why care about income inequality? Bmj, 314(7086), 1037–1037. doi: 10.1136/bmj.314.7086.1037
71 U.S. Census Bureau (2016). Employment Status(S2301), 2012-2016 American Community Survey 5-year estimates. Retrieved from https://data.census.gov/cedsci/table?tid=ACSST5Y2016.S2301&vintage=2016&t=Employment%20and%20Labor%1520Force%20 Status&hidePreview=false&layer=VT_2018_140_00_PY_D1&cid=S2301_C01_001E&g=0500000US 26021.060000
72 Riele, S., & schmeets, H. (2010). A decline of social cohesion in the Netherlands ... Retrieved from https://www.researchgate.net/publication/ 265525496_A_decline_of_social_cohesion_in_the_Netherlands_Participat ion_and_trust_1997-2010
73 Traunmuller, R. (2010). Moral Communities? Religion as a Source of Social Trust in a Multilevel Analysis of 97 German Regions. European Sociological Review, 27(3), 346–363. doi: 10.1093/esr/jcq011
74 Maselko, J., Hughes, C., & Cheney, R. (2011). Religious social capital: Its measurement and utility in the study of the social determinants of health. Social Science & Medicine, 73(5), 759–767. doi: 10.1016/j.socscimed.2011.06.019
75 Traunmuller, R. (2010). Moral Communities? Religion as a Source of Social Trust in a Multilevel Analysis of 97 German Regions. European Sociological Review, 27(3), 346–363. doi: 10.1093/esr/jcq011
76 Berggren, N., & Bjørnskov, C. (2011). Is the importance of religion in daily life related to social trust? Crosscountry and cross-state comparisons. Journal of Economic Behavior & Organization, 80(3), 459–480. doi: 10.1016/j.jebo.2011.05.002
77 Healthy People. (2020). Social Cohesion. Retrieved from https://www.healthypeople.gov/2020/topicsobjectives/topic/social-determinants-health/ interventions-resources/social-cohesion#
78 King, P. E., & Furrow, J. L. (2004). Religion as a Resource for Positive Youth Development: Religion, Social Capital, and Moral Outcomes. Developmental Psychology, 40(5), 703–713. doi: 10.1037/0012-1649.40.5.703
79 Maselko, J., Huges, C, & Cheney R. (2011). Religious social capital: Its measurement and utility in the study of the social determinants of health. Social Science & Medicine 73(5): 759–767. doi: 10.1016/j.socscimed.2011.06.019
80 Allen, R. (2010). The bonding and bridging roles of religious institutions for refugees in a non-gateway context. Ethnic and Racial Studies, 33(6), 1049–1068. doi: 10.1080/01419870903118130
112 | 2019 - 2021 Community Health Needs Assessment
Appendix A
2017-2019 Implementation Strategy
To evaluate the Implementation Strategy (IS) for the 2016 Community Health Needs Assessment conducted by Lakeland, the Population Health team hired external evaluators, iEval. They assisted in the development, execution, and administration of assessment instruments and in the analysis of the assessment results.
Summary of High-Level Findings
• Pre- and post-tests, surveys, and interviews showed decisively that the programs’ curriculum and delivery made a strong, positive impact on many of the participants’ health-related knowledge, attitudes, and behaviors. The activities were highly effective.
• More than 4,000 individuals participated in Lakeland’s Implementation Strategy activities. Nearly half of those individuals lived or worked in a targeted census tract (i.e., tracts experiencing high rates of age-adjusted mortality).
• Some programs cast a wider net for a shorter period of time (e.g., CPR classes), while others targeted a smaller group over a longer time period (e.g., Prescription for Health, Harbor Towers). This mix of programmatic offerings is a strength and should continue. However, programs with a wider range of participants could work to provide more targeted programming for populations in target areas, while programs with a narrower scope could focus on increasing capacity. These changes have begun to take place as evidenced by changes to the CPR and Babysitting courses, and the expansion of Elite Barbershop and Harbor Towers activities to additional similar locations within target areas.
• On multiple occasions, participants in one program activity learned about, and subsequently participated in, another Lakeland activity, fostering a more robust, exhaustive, and holistic picture of health for those individuals.
• There is room for improvement with individuals’ trust in Lakeland. The findings of a mystery shopping exercise demonstrated that some individuals were treated differently at Lakeland based on their race. Moreover, surveys demonstrated that those living in Benton Harbor and Niles were less likely to have trust in Lakeland. Interviews with physicians revealed that some staff make inappropriate comments about patients “behind the scenes,” which perpetuates and serves to justify patient and community feelings of mistrust.
Full Evaluation Findings
The IS laid out three major objectives: build trust between Lakeland and the community; increase the capacity of Lakeland and the community to improve health; and improve knowledge, attitudes, and behaviors required to improve population health. Twelve programs were undertaken to help accomplish these objectives. The programs fell into four categories of activities: (I) Mental Wellbeing; (II) Nutrition Education & Access; (III) K-12 Health Education; and (IV) Community Health Education. Qualitative and quantitative methods were used to inform formative and summative evaluations the programs. In the sections below, key summative findings are presented.
Category I: Mental Wellbeing
Program 1: Adult Mental Health First Aid (AMHFA). AMHFA provides participants with information and skills required to recognize and address early signs and symptoms of mental distress and illness in adults. Evaluation data was collected from January 2017 through August 2019. Table 1 shows the total number of program participants, average class size, number of organizations that received training, and the percentages of attendees that either had their class held in a target area or that lived in or worked in targeted areas (i.e., census tracts with high rates of age-adjusted mortality).
spectrumhealthlakeland.org | 113
Appendix A
Pre- and post-tests indicated that the course was effective with 100% of participants passing the post-test in 2017. The data also showed that the program helped to de-stigmatize mental illness as demonstrated in participants’ shifts in understanding, attitudes, perspectives, and opinions.
Despite its success in conveying new knowledge and skills, the program was challenged by low class attendance, and frequent “no-shows” by registrants led to numerous class cancellations. Major barriers to participation, especially among people and organizations that lived in or served the high needs targeted areas, included challenges posed by lack of transportation and bad weather.
Based on these observations, AMHFA might be more appropriate for classes in which instructors provide onsite trainings at organizations that serve people who live in high needs areas. Such a shift (from instructors seeking to train people that reside in high needs areas) is likely to help increase attendance and better address the mental health needs of people who live in or serve high needs areas.
Three questions merit attention as the future of this program is considered:
1. How can the participants in AMHFA see its connection to Lakeland?
2. Are there ways to make Lakeland’s involvement in the AMHFA program clearer to the participants?
3. How can AMHFA be used to advance organizational policy and practice changes that support mental health?
Program 2: Youth Mental Health First Aid (YMHFA). YMHFA provides participants who regularly interact with youth with the information and skills required to recognize and address early signs and symptoms of mental distress and illness in young children and adolescents.
Evaluation data was collected from January 2017 through August 2019. Table 2 shows the total number of program participants, average class size, number of organizations that received training, and the percentages of attendees that either had their class held in a target area or that lived in or worked in targeted areas (i.e., census tracts with high rates of age-adjusted mortality).
114 | 2019 - 2021 Community Health Needs Assessment
Table 1. Adult Mental Health First Aid Metrics
Table 2. Youth Mental Health First Aid Metrics
Recorded total # of participants 198 Avg attendance per class 6-7 Recorded total # of organizations trained 43 % of attendees from classes held in target areas 36.3% % of attendees that work or live in target area 41.9% Recorded total # of participants 515 Avg attendance per class 12-13 Recorded total # of organizations trained 81 % of attendees from classes held in target areas 24.4% % of attendees that work or live in target area 49%
Appendix A
Pre and post-tests suggest that the class was highly effective in teaching about youth mental health. Internal discussions around the benefits/drawbacks of mandating attendance at MHFA activities should continue. More thought should go toward strategies to increase capacity and engagement of community members to do this work.
In 2017, one objective was to conduct five YMHFA trainings. Instead, a total of 16 trainings were held, demonstrating Lakeland’s significant capacity. That year, in the 11 classes where data was collected, there was a more than 50% improvement in pre/post-test scores and a roughly 70% increase in knowledge about risk factors for mental illness. While YMHFA reached more people than AMHFA (more than 2.5 times more), YMHFA had fewer attendees from the target areas (i.e., target area percentages of 36.3% for adults vs. 24.4% for youth). That said, this activity did see larger participation numbers, often among more vital and relevant community groups.
Program 3: Incite Insight. This was a three-week theater performance arts program for middle and high school students designed to explore themes related to mental health, including key definitions, stigma, and the importance of support.
This program faced numerous challenges. Most significant were administrative turbulence in the schools and resistance from teachers to let their students attend the program. Both contributed to inconsistent student attendance. Despite efforts to shore up the program with additional Lakeland staff and student volunteers from Andrews University, the decision was made to disband the program. The school’s administrative turbulence combined with the very high needs of its students exceeded Lakeland’s capacity to adequately execute the program. This was a difficult decision given its success in generating trust among the students in the program staff.
Category II: Nutrition Education & Access
Program 4: Prescription for Health (PFH). PFH aimed to provide access to nutritious foods and nutrition information to individuals with low food access and individuals who either have, or are at increased risk of developing, a chronic disease. Evaluation data was collected during each of the three summers (2017-2019) the program was administered.
PFH participants showed increased positive attitudes toward the affordability and value of fruits and vegetables, and they also demonstrated an increased frequency with which they consumed vegetables. They utilized 91% of their tokens in exchange for food at the Benton Harbor Farmers Market in 2018 and 83% of their tokens in 2019.
The program had a slow start due to the challenges of identifying and enrolling program participants. While this challenge was eventually overcome, in the future, the barriers to finding eligible participants (e.g., inconsistent referral processes) must be addressed.
Generally, PFH participants’ attendance at farmers’ markets was regular and their health outcomes were positive. However, there were mixed results in regards to participants’ perceptions of the affordability of fruits and vegetables and their confidence in cooking. Some results were positive, and others were not.
spectrumhealthlakeland.org | 115
Table 3. Prescription for Health Metrics
Recorded total # of participants 93 Avg attendance per session 16-17 Recorded total # of sessions 37 % of participants living in target area 95.5%
Appendix A
Program 5: Community Kitchen Club (CKC). CKC is a community-directed cooking and nutrition education program that serves English and Spanish-speaking community residents. It was administered from January 2017 through August 2019.
CKC had modest but consistent participation (just under 10 unique individuals) for each class. In 2017, roughly 91% of participants said they were planning meals with more vegetables. All participants indicated that they were eating two or more servings of vegetables at dinner.
Among other recorded benefits, participants reported strong satisfaction with the program, better confidence in cooking with certain ingredients, and improved trust in Lakeland. They also experienced increased social cohesion; the last class in 2018 started their own mental health support group.
While many of the program participants were economically disadvantaged and had limited English proficiency, many did not live in the targeted high needs areas. Future versions of this programs should more explicitly focus on meeting the needs of residents in the high needs’ areas.
Category III: K-12 Health Education
Program 6: Coordinated School Health (CSH). CSH is an integrated set of planned and sequential school-affiliated strategies, activities, and services that promote optimal physical, emotional, social, and educational development of students. Evaluation data was collected from January 2018 through August 2019.
Note: School-Based CPR totals were counted under the Community CPR data table
Table 5. K-12 Health Education Metrics
In school districts throughout Berrien County, Cardiopulmonary Resuscitation (CPR) certification was provided for all 9th grade students, and YMHFA and CPR training were provided to staff.
Supported by the Population Health team, the Niles Community School Board approved a new sex education curriculum for the middle and high schools. The PH team members subsequently forged a new relationship with Watervliet Public Schools. This was an important “win” as previous relationship and Watervliet is a region with some significant health needs.
Other accomplishments of the CSH program included a successful $100,000 grant request to build a fitness center at Lardner Middle School, increased trust in Lakeland, and the Van Buren Intermediate School District’s adoption of the Michigan Model for Health curriculum.
116 | 2019 - 2021 Community Health Needs Assessment
Table 4. Community Kitchen Club Metrics
Recorded total # of participants 70 Avg # of unique attendees per month 7 Recorded total # of sessions 43 % of participants living in target area 21% Recorded total # of participants 308 Avg # of attendees per session 14 Recorded total # of sessions 22 % attending school in target area 76.3%
CSH activities encountered some challenges as well such as turbulent school administrations, particularly with Benton Harbor Area Schools, and to a lesser extent with River Valley School District Schools, which made collaboration difficult. Other challenges included organizational silos and the need to create a strategy that appeals to multiple, non-school stakeholders, such as law enforcement, that impact health.
Category IV: Community Health Education
Program 7: Elite Barbershop. This program used Elite Barbershop as a venue for providing health services and information to bridge the gap between health care and community residents, especially underserved African American and Hispanic men. Evaluation data was collected between January 2017 through August 2019.
Elite Barbershop’s health screenings and speaker presentations led to immediate health and lifestyle changes for a number of patrons. In 2017, the average number of participants reached per month ranged between 6 and 58. Most program participants lived in the targeted areas. Interviews conducted with the shop’s patrons found that many began drinking more water, eating healthier foods, being more physically active, and giving more care to medications and health behaviors. The barbers also demonstrated increased trust of the Lakeland team members who administered the program. This program was one of the most successful of the IS.
One challenge was the problem of “no-shows” by scheduled guest presenters.
Program 8: Community Food Network (CFN). This program involved Lakeland team members providing health education and information and preventative health screenings at a community food co-op that serves low income people who live in a targeted, high needs area. Evaluation data was collected between January 2017 through August 2019.
Table
Community Food Network Metrics
CFN activities were well attended and trust increased as evidenced by one CFN member who defended Lakeland against community misconceptions. In general, attitudes toward Lakeland took a noticeable shift for the better among program participants.
Pre- and post-tests would be helpful in empirically determining the effectiveness of the program. Reflection on the program in late 2018 showed that cohesion, trust, and capacity were all increased at CFN, with numerous success stories. Grant funding was received to “help the program evolve to whatever kind of issues the group wants to address,” but structure is still needed.
spectrumhealthlakeland.org | 117
Table 6. Elite Barbershop Metrics
7.
Recorded total # of unduplicated participants 330 Avg # of unique attendees per month 6-7 Recorded total # of sessions 49 % living in target area 47% Recorded total # of participants 103 Avg # of attendees per session 16-17 Recorded total # of sessions 75 % living in target area 75.6%
Appendix A
Program 9: Harbor Towers. This program provides residents of Harbor Towers, an independent housing facility for people with low income or physical disabilities, with resources to manage their emotional, mental, and physical health. Evaluation data was collected between January 2017 through August 2019.
Harbor Towers’ support groups and on-site health clinic staffed by a Lakeland team member averaged just under 50 participants per month. There were numerous successes at Harbor Towers, but among the most significant are increased social cohesion and collective efficacy among its residents; increased trust in Lakeland team members; and increased use of preventive care. In interviews, Harbor Towers residents indicated that they had developed care and compassion for one another that was not previously there. One of the major successes born out of increased cohesion and efficacy was the residents’ increased capacity for self-advocacy to the Michigan Department of Civil Rights when their tenant rights were not being adhered to by the Benton Harbor Housing Commission. Harbor Towers residents indicated that there were noticeable improvements in their lives that could be attributed to help from Lakeland team members. As of the closing months of 2019, many Harbor Towers residents that were highly involved in the Lakeland programming have moved into better quality housing.
There were also notable challenges. The management at Harbor Towers have been strongly resistant to Lakeland staff working to address social determinants of health such as housing, transportation and public safety. Despite their resistance, Lakeland was able to help residents resolve heat and water issues, and challenges related to public safety and transportation. In 2019, the tension between Lakeland team members and the management of Harbor Towers escalated with discussions taking place regarding the sustainability of the program. The sources of the tension are many but are fundamentally rooted in two issues: the overwork of the building management and their perception that housing is not something that Lakeland should concern itself with. There is a fundamental lack of understanding of housing as a health determinant. Another challenge was the distrust and fear that Lakeland’s medical residents (who provide medical advice as part of the program) exhibited when visiting Harbor Towers.
Program 10: Community Health Screenings (CHS). The Community Health Screenings are free preventative health screening programs offered for adults at community sites. Evaluation data was collected between January 2017 through August 2019.
9. Community Health Screenings Metrics
118 | 2019 - 2021 Community Health Needs Assessment
Table 8. Harbor Towers Metrics
Appendix
Recorded # of unique participants 107 Avg attendance per month 49 Recorded total # of sessions 119 % living in target area 100% Recorded total # of participants 489 Avg # attendees per session 9-10 Recorded total # of sessions 52 % living in target area 16.5%
Table
A
Appendix A
One consistent challenge for this program was access to people who live in the targeted, high needs areas. Only 16.8% of those served in this program lived in a targeted area. Nevertheless, there were instances of individuals being inspired to get needed medical help due to these free screenings. Interviews indicated that, particularly among low-income individuals, there was a perceived “lack of respect” from Lakeland. Interviews also indicated significant behavior changes around diet, exercise, and health literacy.
Program 11: Community CPR1 (CCPR). This program provides community participants with information and skills to aid a choking adult, child, or infant. Evaluation data was collected between January 2017 through August 2019.
School-based CPR2 (SCPR). This program provides school-based participants (e.g., teachers, students, etc.) with information and skills to aid a choking adult, child or infant. Evaluation data was collected between January 2017 through August 2019.
Finding locations and groups within the targeted, high needs areas was a major challenge for the CCPR classes, although nearly 67% of SCPR classes occurred in the targeted, high needs areas. Moreover, the costs associated with this program were prohibitive. In general, most participants indicated they acquired knowledge and skills that they previously did not have, and nearly all successfully received certification.
CPR instructors cited challenges such as high cost of certification, logistical challenges (e.g., facility cleanliness, access to DVD, cancellations, transport of equipment, and the lack of time to serve as a CPR instructor), and difficulty coaching participants whose performance was not satisfactory. The free CPR training and certification has demonstrably improved perceptions of Lakeland within area schools and organizations.
spectrumhealthlakeland.org | 119
Table 10. Community CPR Metrics
Table 11. School CPR Metrics
Recorded total # of participants 408 Avg # attendees per class 11-12 Recorded total # of classes 36 % living in target area 29.3% Recorded total # of participants 1,159 Avg # attendees per class 40 Recorded total # of classes 29 % of participants at schools in target area 66.9%
Program 12: Babysitting with Confidence (BWC). This program provided participants with the knowledge and skills required to care for small children. Evaluation data was collected between March 2017 through August 2019.
Table 12. Babysitting with Confidence Metrics
BWC classes averaged around 20 participants, with a few outliers. Parents were happy with the class content and appreciated their children’s acquisition of knowledge and skills required for babysitting. By class completion, participants showed high levels of new knowledge in all areas (e.g., feeding and clothing children, engaging in and supervising their activities, providing minor first aid). Pre-test knowledge baselines were between 20-40%. Post-tests showed improvement in more than 90% knowledge domains such as safe sleep, play, and feeding, and appropriate responses to a variety of childcare scenarios. This course has been discontinued due to shrinking demand, other alternatives being readily available, and its lack of alignment to community identified health needs.
Overall Outputs: 2017-2019
120 | 2019 - 2021 Community Health Needs Assessment Recorded total # of participants 198 515 93 70 308 330 103 107 489 408 1,159 393 4,173 (total) Avg # attendees per session 6-7 12-13 16-17 7 per month 14 6-7 16-17 49 per month 9-10 11-12 40 32-33 7 (average) Recorded total # of sessions 43 orgs trained 81 orgs trained 37 43 22 49 75 119 52 36 29 12 598 (total) % of attendees working or living in target area 41.9% 49.0% 95.5% 21.0% 76.3% 47% 75.6% 100% 16.5% 29.3% --31.5% 44.4% (average) Program AMHFA YMHFA PFH CKC CSH Elite CFN HT CHS CCPR SCPR BWC Overall % of attendees from classes in target area 36.3% 24.4% --66.9% 52.0% (average)
Appendix
Recorded total # of participants 393 Avg # attendees per class 32-33 Recorded total # of classes 12 % living in target area 31.5%
A
Appendix A
Trust in Lakeland
One salient and consistent theme to emerge from the Community Health Needs Assessment is the lack of trust of the community in Lakeland. In 2017, a baseline trust survey was conducted among participants in various program activities: CFN, CPR, Harbor Towers, AMHFA, YMHFA, and PFH. The survey found that between 82% and 88% of respondents had trust in Lakeland on various measures in the survey. The lowest level of trust was in respondents “trusting their health care to Lakeland” (82%). Respondents from Benton Harbor and Niles had statistically significantly less trust in Lakeland than respondents from Berrien Springs, St. Joseph, Stevensville, or Watervliet. Younger respondents were more likely to trust Lakeland as well. One feature of this baseline survey is that data collection occurred at IS program activities, meaning that the sample is likely predisposed toward trusting Lakeland, since they had decided to partake in a Lakeland activity.
One year later, a mystery shopping analysis was conducted. Eight observers, of varied demographics, assessed their experiences at five Lakeland facilities. They assessed their experiences at front desks and in hallways, the cafe, and the emergency waiting room. The purpose of the analysis was to determine whether people of different demographics had disparate experiences at Lakeland. This observational research was coupled with in-depth interviews with two physicians to better understand clinicians’ perspectives on trust.
Overall, the Lakeland atmosphere at all five locations was positive and friendly, and only a handful of less-than-friendly interactions suggested race as an underlying factor. The mystery shopping analysis indicated that there were differences between how white and black individuals were greeted at a front desk (15 total interactions observed); specifically, black individuals were less likely to be treated courteously or receive eye contact at the front desk, and they also tended to wait longer to be helped. In the hallways (16 instances to observe), white individuals were more likely to be treated in a friendly manner when compared to blacks. In the café, the shoppers observed 22 interactions, noting that around three out of every four interactions were pleasant or friendly. Staff appeared to exhibit “caution” when serving some black visitors. In the waiting room, shoppers observed 29 interactions, and found that over 90% of the greetings by staff were friendly with no differences between race.
Interviews with physicians revealed that there is a history of mistrust between Lakeland and the community, specifically among the older segment of the population. Older Lakeland staff members perpetuate the mistrust “when they make comments about patients and they don’t understand their situations.” The interviewees also said that trust is solidified very early in the interaction, possibly even before a physician is seen, although that doesn’t diminish their role in maintaining trust. The interviewees noted that comments are made “behind the scenes” that are inappropriate, but outwardly the staff are attentive and caring. Four key recommendations emerged from the observational study:
1. Increase opportunities for Lakeland staff to interact with community members, representing Lakeland as medical experts, in comfortable community settings such as barbershops/beauty salons, and community organizations. This would provide opportunities similar to that afforded to medical residents, enabling nurses, physicians, and other clinical and administrative staff to better understand the issues and needs faced by the community that Lakeland serves.
2. Expand outreach work into communities served by Lakeland to continue efforts to build trust and shift community perceptions of the health system. This should be coupled with an emphasis on continuing to offer high quality customer service. Lakeland employees should remember that negative experiences often linger in the minds of patients and the community well past the time of the actual encounter.
3. Provide better training to front desk staff on how to greet community members as they enter the building, ensuring they understand that the patient/visitor is the priority, and a friendly greeting goes a long way in building trust.
4. Develop a process for internal staff to use the observation protocol (“mystery shopping” experiences) on a regular basis. Having staff observe from a more objective perspective, with specific things in mind to watch for during the observation, may help increase their sensitivity to and awareness of actions they can take in their work or departments.
1 These two programs’ data are separated because the data was collected separately. However, the programs are similar, so they are best reported together.
1 There were over 5,400 farmers market attendees across 2018 and 2019 with over 1,000 non-PFH visitors to the Lakeland booth at the markets. In 2017, the Lakeland booth engaged with, on average, 20% of the total number of market shoppers.
spectrumhealthlakeland.org | 121
122 | 2019 - 2021 Community Health Needs Assessment
Appendix B
Community Health Needs Assessment
Thank you for taking the time to complete the 2019 Community Health Needs Assessment. As a resident of Berrien, Cass, or Van Buren County your input is invaluable to helping not just Spectrum Health Lakeland, but other community organizations better understand the strengths and needs of our local population. This survey will ask questions about the health of your community, how you are able to recover from stressful situations, and how you feel about your neighborhood.
Please note: the information you provide in this survey will not be used to identify you in any way. If you have any questions about how your information will be used, or need assistance completing the survey you may call the Population Health team at 1.866.260.7544 or email us at chna@lakelandhealth.org.
Q1 Do you live in Berrien, Cass, or Van Buren County?
o Yes (1)
o No (2)
Q2 Did you participate in the 2016 Community Health Needs Assessment?
o Yes (1)
o No (2)
o I’m not sure (3)
The following questions are about the health of your community:
• When thinking about your community think about the places you live, work, and play.
• As for health, think about all types of health: physical, mental, social, emotional, and spiritual.
Q3 What are some things in your community that help you to be healthy?
spectrumhealthlakeland.org | 123
Appendix B
Q4 What are some things in your community that make it hard to be healthy?
Q5 What are the biggest health issues in your community?
Q6 How would you improve the health in your community?
124 | 2019 - 2021 Community Health Needs Assessment
Appendix B
Q7 Please rate your agreement with the following statements about your ability to recover from challenging or stressful situations. Please mark only one choice for each statement; statements with multiple or written in responses cannot be used.
Strongly Somewhat Somewhat Strongly agree (1) agree (2) Neutral (3) disagree (4) disagree (5)
I tend to bounce back quickly after hard times. (1)
I have a hard time making it through stressful events. (2)
It does not take me long to recover from a stressful event. (3)
It is hard for me to snap back when something bad happens. (4)
I usually come through difficult times with little trouble. (5)
I tend to take a long time to get over setbacks in my life. (6)
Q9 When I experience hard or stressful times, these are the ways I help myself feel better/relax/calm down: This can be any person, place, thing, or activity: Some people talk to a family member, smoke cigarettes, read a book, or watch television. Please list as many as you can.
spectrumhealthlakeland.org | 125
Appendix B
Q10 How strongly do you agree or disagree with the following statements about your neighborhood (where you live) (Please mark only one choice for each statement; statements with multiple or written in responses cannot be used):
Strongly Somewhat Neither agree Somewhat Strongly agree (6) Agree (7) agree (8) nor disagree (9) disagree (10) disagree (11)
This is a close-knit neighborhood. (1)
People in this neighborhood can be trusted. (2)
People around here are willing to help their neighbors. (3)
People in this neighborhood do not share the same values. (4)
People in this neighborhood generally do not get along with each other. (5)
Q16 Would you say it is very likely, likely, unlikely, or very unlikely that your neighbor could be counted on to intervene or do something if... (Please mark only one choice for each question; questions with multiple or written in responses cannot be used):
Children were skipping school and hanging out in the neighborhood? (1)
Children were spray-painting graffiti on something in the neighborhood? (2)
Children were showing disrespect to an adult? (3)
A fight broke out in front of their house? (4)
The fire station closest to their home was threatened with budget cuts? (5)
126 | 2019 - 2021 Community Health Needs Assessment
Very Likely (1) Likely (2) Unlikely (3) Very Unlikely (4)
Appendix B
To finish the survey please complete the following demographic information. While every question is optional, we encourage you to answer them all as completely as possible. As a reminder, information shared will not be used to identify you in any way. Instead, information provided will help us to better understand the specific strengths and needs of our community. If you have any questions about how your information will be used you can contact the Population Health team at Spectrum Health Lakeland at 1.866.260.7544 or chna@lakelandhealth.org.
Q8 What is your age range?
o Under 18 (1)
o 18-29 (2)
o 30-44 (3)
o 45-59 (4)
o 60+ (5)
Q12 What is your identified gender?
o Female (1)
o Male (2)
o Transgender (4)
o Option Not Listed: (6)
o I choose not to identify (7)
Q13 What race/ethnicity best describes you?
o White or Caucasian (1)
o Black or African American (2)
o Hispanic or Latino (3)
o Asian or Asian American (4)
o American Indian or Alaskan Native (5)
o Native Hawaiian or other Pacific Islander (6)
o Option not listed: (7)
o I choose not to identify (8)
spectrumhealthlakeland.org | 127
Appendix B
Q14 Please provide your full home address.
Providing your address will help us to better understand the specific needs and strengths of our community. If you would not like to provide your full address please leave all boxes blank.
Address (6)
Address 2 (7)
City (8)
Postal code (10)
Q15 What is the nearest intersection (cross-streets) to your home?
Intersection/cross-streets (1)
o I would not like to provide any address/location information (2)
128 | 2019 - 2021 Community Health Needs Assessment
Life Expectancy in Berrien County
Tract 21
Tract 23
Tract 22 69
Tract 5
Tract 3
Tract 205
Tract 4
Tract 20
Tract 6
Tract 116
Tract 211
Tract 212
Tract 114
Tract 201
Tract 207
Tract 115
Tract 104
Tract 202
Tract 103
Tract 25
Tract 111
Tract 210
Tract 102
Tract 209
Tract 7
Tract 204
Tract 206
Tract 24
Tract 101
Tract 113
Tract 214
Tract 10
Benton Township
Benton Township
Benton Township
City of Benton Harbor
City of Benton Harbor
City of Niles
City of Benton Harbor
Benton Township
City of Benton Harbor
Weesaw Township
Niles Township
Niles Township
Three Oaks Township Three Oaks
Buchanan Township
City of Niles
Galien Township Galien
Bainbridge Township
City of Buchanan
Watervliet Township
Benton Township
City of Bridgman
Niles Township
Coloma Township
City of Niles
St. Joseph Township
Niles Township
City of Niles
Benton Township
Hagar Township
City of New Buffalo Michiana and Grand Beach
Oronoko Township Berrien Springs
City of St. Joseph
spectrumhealthlakeland.org | 129 Appendix C
Tract Life Expectancy City
Census
/Township Village(s)
67.6
67.7
69.6
69.9
70.5
71.2
71.9
72.4
73.1
73.3
74.5
74.9
75.2
75.2
75.6
76
76
76.3
76.3
77.1
77.2
77.5
77.8
78.2
78.4
78.4
78.5
78.6
78.7
78.7
78.8
Life Expectancy in Berrien County (continued)
Census Tract
Tract 105
Tract 203
Tract 9
Tract 106
Tract 110
Tract 18
Tract 14
Tract 17
Tract 112
Tract 11
Tract 15
Tract 8
Tract 13
Tract 16
Tract 213 86.7
Tract 19 No Data
Pipestone Township Eau Claire
Bertrand Township
St. Joseph Township
Berrien Township Eau Claire
Baroda Township Baroda
Royalton Township
Lincoln Township Stevensville
Lincoln Township Stevensville
Chikaming Township
City of St. Joseph
Lincoln Township Stevensville
City of St. Joseph
St. Joseph Township Shoreham
Lincoln Township Stevensville
Oronoko Township Berrien Springs
Sodus Township
Age Adjusted Mortality Rate in Berrien County
Tract 21
Tract 4
Tract 207
Tract 5
Tract 6
Tract 3
Tract 22
Tract 23
Tract 14
City of Benton Harbor
City of Niles
City of Benton Harbor
City of Benton Harbor
City of Benton Harbor
Township
Township
Township Stevensville
Tract 205 1,161.77 City of Niles
Tract
Tract 20
Tract 24
130 | 2019 - 2021 Community Health Needs Assessment
Life Expectancy City
Village(s)
/Township
78.8
78.8
78.8
78.9
79.3
79.5
79.9
80.3
81.2
81.7
81.9
81.9
83.1
86.2
Tract Mortality Rate City/Township Village(s)
Age-Adjusted Census
1,598.62
Benton Township
1,566.85
1,526.70
1,455.90
1,453.30
1,421.52
1,413.66 Benton
1,383.83 Benton
1,192.15 Lincoln
211 1,147.76 Niles Township
1,087.11
Benton Township
1,076.38
Benton Township
Appendix C
Appendix C
Tract 102 1,043.95
Tract 111 1,036.79
Tract 114 1,026.59
Tract 105 1,025.95
Tract 204 997.93
Tract 103
Tract 18
974.25
959.94
Tract 202 948.41
Tract 110 943.79
Tract 206 943.16
Tract 106 921.45
Tract 7 911.40
Tract 212 901.26
Tract 210 899.40
Tract 115 891.03
Tract 104 887.73
Tract 116 868.07
Tract 25
858.58
Tract 101 854.53
Tract 209 838.48
Tract 214 808.38
Tract 8 788.34
Tract 19 785.95
Tract 10 780.76
Tract 15 758.27
Tract 203 757.48
Tract 201 741.15
Tract 17 737.75
Tract 11 703.99
Tract 112
Tract 213 660.55
Tract 9 608.54
Tract 113 607.59
Tract 16 549.56
Tract 13 525.92
Coloma Township
City of Bridgman
Three Oaks Township Three Oaks
Pipestone Township Eau Claire
Niles Township
Watervliet Township
Royalton Township
City of Buchanan
Baroda Township Baroda
City of Niles
Berrien Township Eau Claire
St. Joseph Township
Niles Township
Niles Township
Galien Township Galien
Bainbridge Township
Weesaw Township
Benton Township
Hagar Township
City of Niles
Oronoko Township Berrien Springs
City of St. Joseph
Sodus Township Fairplain
City of St. Joseph
Lincoln Township Stevensville
Bertrand Township
Buchanan Township
Lincoln Township Stevensville
City of St. Joseph
Chikaming Township
Oronoko Township Berrien Springs
St. Joseph Township
City of New Buffalo Michiana and Grand Beach
Lincoln Township Stevensville
St. Joseph Township Shoreham
spectrumhealthlakeland.org | 131
Age-Adjusted
Tract Mortality Rate
Census
City/Township Village(s)
671.88
132 | 2019 - 2021 Community Health Needs Assessment
Proximity Score and Percent of Vulnerable Population by Census Tract
spectrumhealthlakeland.org | 133 Census Tract Block Group Township/City Proximity Score % Vulnerable Population 21 2 Benton Township 10.21 27% 21 1 Benton Township 7.19 39% 22 3 Benton Township 5.63 42% 21 3 Benton Township 4.65 31% 22 2 Benton Township 4.48 47% 6 1 City of Benton Harbor 4.38 35% 3 2 City of Benton Harbor 4.03 36% 3 1 City of Benton Harbor 4.01 34% 5 1 City of Benton Harbor 3.61 37% 20 1 Benton Township 3.54 31% 4 1 City of Benton Harbor 3.39 41% 22 1 Benton Township 3.29 35% 6 2 City of Benton Harbor 3.19 31% 24 2 Benton Township 2.97 18% 20 2 Benton Township 2.89 27% 209 1 City of Niles 2.87 23% 23 1 Benton Township 2.82 31% 20 3 Benton Township 2.77 22% 4 2 City of Benton Harbor 2.71 36% 23 2 Benton Township 2.60 34% 6 3 City of Benton Harbor 2.40 23% 19 1 Sodus Township 2.28 15% 9 1 St. Joseph Township 2.23 17% 7 1 St. Joseph Township 2.11 17% 7 2 St. Joseph Township 2.08 17% 207 2 City of Niles 2.01 23% 25 2 Benton Township 1.89 26% 7 3 St. Joseph Township 1.79 16% 10 2 City of St. Joseph 1.65 8% 10 1 City of St. Joseph 1.57 8% 209 3 City of Niles 1.22 9% 8 3 City of St. Joseph 1.22 9% 8 1 City of St. Joseph 1.22 14%
Appendix D
Appendix D
134 | 2019 - 2021 Community Health Needs Assessment
Score
Percent
Census Tract Block Group Township/City Proximity Score % Vulnerable Population 209 4 City of Niles 1.22 17% 207 3 City of Niles 1.21 17% 209 2 City of Niles 1.19 22% 207 1 City of Niles 1.13 20% 8 2 City of St. Joseph 1.08 12% 206 4 City of Niles 1.06 13% 205 1 City of Niles 1.03 25% 210 2 Niles Township 1.03 19% 205 3 City of Niles 1.01 30% 205 2 City of Niles 0.96 20% 25 1 Benton Township 0.95 15% 9 2 St. Joseph Township 0.95 12% 210 1 Niles Township 0.92 14% 206 3 City of Niles 0.88 15% 206 2 City of Niles 0.75 14% 206 1 City of Niles 0.68 18% 18 1 Royalton Township 0.60 6% 24 1 Benton Township 0.59 16% 101 4 Hagar Township 0.48 13% 11 1 City of St. Joseph 0.48 10% 18 3 Royalton Township 0.47 10% 210 3 Niles Township 0.45 20% 210 4 Niles Township 0.44 17% 111 2 City of Bridgman 0.42 13% 102 4 Coloma Township 0.41 7% 101 1 Hagar Township 0.40 13% 111 1 City of Bridgman 0.38 12% 211 1 Niles Township 0.37 9% 13 1 St. Joseph Township 0.37 14% 11 2 City of St. Joseph 0.35 7% 102 6 Coloma Township 0.34 13% 102 7 Coloma Township 0.33 12%
Proximity
and
of Vulnerable Population by Census Tract
Appendix D
spectrumhealthlakeland.org | 135
Census Tract Block Group Township/City Proximity Score % Vulnerable Population 13 2 St. Joseph Township 0.33 8% 204 3 Niles Township 0.32 9% 18 2 Royalton Township 0.32 11% 19 2 Sodus Township 0.28 12% 15 2 Lincoln Township 0.28 11% 203 2 Bertrand Township 0.27 10% 102 5 Coloma Township 0.27 13% 212 1 Niles Township 0.26 16% 17 3 Lincoln Township 0.26 7% 101 3 Hagar Township 0.26 11% 204 2 Niles Township 0.23 10% 17 1 Lincoln Township 0.23 12% 110 1 Baroda Township 0.23 11% 14 2 Lincoln Township 0.22 13% 102 3 Coloma Township 0.22 11% 14 1 Lincoln Township 0.21 9% 211 2 Niles Township 0.20 18% 15 1 Lincoln Township 0.20 10% 212 2 Niles Township 0.19 16% 204 1 Niles Township 0.19 15% 101 2 Hagar Township 0.19 9% 14 3 Lincoln Township 0.18 11% 111 3 City of Bridgman 0.18 11% 110 2 Baroda Township 0.18 8% 102 2 Coloma Township 0.17 14% 16 1 Lincoln Township 0.17 8% 104 1 Bainbridge Township 0.16 9% 103 2 Watervliet Township 0.16 21% 103 3 Watervliet Township 0.15 15% 17 2 Lincoln Township 0.15 15% 103 1 Watervliet Township 0.15 12% 110 3 Baroda Township 0.15 15%
Proximity Score and Percent of Vulnerable Population by Census Tract
136 | 2019 - 2021 Community Health Needs Assessment
Census Tract Block Group Township/City Proximity Score % Vulnerable Population 203 1 Bertrand Township 0.14 10% 102 1 Coloma Township 0.14 11% 105 2 Pipestone Township 0.14 16% 104 3 Bainbridge Township 0.14 15% 202 3 City of Buchanan 0.12 17% 103 4 Watervliet Township 0.12 19% 103 5 Watervliet Township 0.12 11% 202 2 City of Buchanan 0.12 14% 202 4 City of Buchanan 0.11 10% 106 2 Berrien Township 0.11 15% 202 5 City of Buchanan 0.11 7% 113 5 City of New Buffalo 0.11 12% 202 1 City of Buchanan 0.10 9% 214 1 Oronoko Township 0.10 14% 115 2 Galien Township 0.10 13% 202 6 City of Buchanan 0.10 19% 201 3 Buchanan Township 0.10 13% 112 1 Niles Township 0.09 13% 105 1 Pipestone Township 0.09 19% 213 1 Oronoko Township 0.09 20% 104 2 Bainbridge Township 0.09 15% 106 3 Berrien Township 0.09 13% 113 4 City of New Buffalo 0.09 14% 116 1 Weesaw Township 0.09 14% 213 2 Oronoko Township 0.09 26% 115 1 Galien Township 0.08 12% 213 3 Oronoko Township 0.08 22% 201 2 Buchanan Township 0.08 10% 106 1 Berrien Township 0.08 16% 214 5 Oronoko Township 0.08 16% 112 2 Niles Township 0.08 13% 214 2 Oronoko Township 0.08 23%
Appendix D
Pre-1940 Housing and Percent of Children Living Below the Poverty Level by Census Tract
spectrumhealthlakeland.org | 137 Census Tract Block Group Township/City Proximity Score % Vulnerable Population 116 2 Weesaw Township 0.08 10% 213 4 Oronoko Township 0.08 19% 113 6 City of New Buffalo 0.08 13% 201 1 Buchanan Township 0.07 13% 214 3 Oronoko Township 0.07 19% 214 4 Oronoko Township 0.07 24% 113 3 City of New Buffalo 0.07 15% 112 4 Niles Township 0.07 11% 114 1 Three Oaks Township 0.07 9% 113 2 City of New Buffalo 0.07 13% 114 3 Three Oaks Township 0.06 15% 114 2 Three Oaks Township 0.06 11% 113 1 City of New Buffalo 0.06 12% 112 3 Niles Township 0.06 15% Appendix
D
Geography Census Tract 5 Census Tract 207 Census Tract 8 Census Tract 6 Census Tract 114 Census Tract 115 Census Tract 3 Census Tract 4 Census Tract 112 Census Tract 202 % housing units built between 1940-1959 17.4% 26.2% 18.3% 40.7% 21.3% 20.5% 34.5% 10.6% 24.0% 19.6% % below federal poverty level 38.4 4.9 5.9 51.6 6.2 1 4.3 15.3 4.7 35.8 % below poverty level, under 5 years old 30.2 0 8.3 67.9 21.5 46.7 93.9 79.1 23.9 0 City/Township Benton Harbor Niles St. Joseph Benton Harbor Three Oaks Benton Harbor Benton Harbor % housing units built between pre 1960s 85.7% 73.0% 63.8% 74.8% 55.1% 50.9% 62.9% 37.5% 48.7% 44.1% % housing units built pre 1940s 68% 47% 45% 34% 34% 30% 28% 27% 25% 24%
Appendix D
City/Township
Benton Harbor Niles
Niles Township St. Joseph St. Joseph Twp.
Geography
Census Tract 116
Census Tract 209
Census Tract 205
Census Tract 103
Census Tract 19
Census Tract 105
Census Tract 211
Census Tract 104
Census Tract 206
Census Tract 106
Census Tract 214
Census Tract 22
Census Tract 113
Census Tract 101
Census Tract 10
Census Tract 7
Census Tract 25
Census Tract 201
Census Tract 203
Census Tract 110
Census Tract 21
Census Tract 102
Census Tract 204
Census Tract 111
Census Tract 24
Census Tract 18
Census Tract 210
Census Tract 17
Census Tract 20
Census Tract 213
Census Tract 15
138 | 2019 - 2021 Community Health Needs Assessment
% housing units built between 1940-1959 24.4% 52.1% 27.3% 26.4% 20.9% 18.7% 48.7% 19.1% 23.9% 16.2% 25.7% 21.4% 18.6% 36.0% 63.5% 45.7% 25.1% 19.1% 20.3% 18.3% 22.3% 30.4% 20.3% 20.7% 41.9% 10.8% 27.3% 9.2% 29.6% 11.9% 16.9% % below federal poverty level 21.7 39.5 5 7.9 14.2 17.7 11.8 8.9 28.2 9.3 56.7 11.5 10.1 6.2 58.6 3.8 14 15.8 11.9 6.7 17 10.5 7.5 7.6 7.2 28.9 12.8 12.3 6.2 24.9 21.5 % below poverty level, under 5 years old 0 65.3 50.4 32 3.1 31.6 10.5 19.4 22.8 16.1 57.9 50.2 0 34.4 4.1 3 52.3 49 20.4 2.8 58.4 26.2 6.6 19.5 38.8 16 18.9 2.1 10.6 52.1 9.4
% housing units built between pre 1960s 48.0% 74.2% 49.2% 48.1% 40.4% 37.7% 67.4% 37.1% 41.6% 33.6% 42.3% 37.9% 34.5% 51.7% 79.1% 61.0% 40.5% 34.1% 34.8% 31.9% 33.6% 41.7% 31.0% 31.1% 52.2% 21.1% 37.3% 17.8% 37.3% 19.6% 24.2% % housing units built pre 1940s 24% 22% 22% 22% 20% 19% 19% 18% 18% 17% 17% 16% 16% 16% 16% 15% 15% 15% 14% 14% 11% 11% 11% 10% 10% 10% 10% 9% 8% 8% 7%
Appendix D
City/Township
Geography
Census Tract 212
Census Tract 14
Census Tract 11
Census Tract 16
Census Tract 13
Census Tract 9
Census Tract 23
spectrumhealthlakeland.org | 139
% housing units built between 1940-1959 34.4% 9.2% 22.7% 13.1% 13.8% 14.8% 41.6% % below federal poverty level 17.4 20.9 38.3 24.1 20.7 21 57.6 % below poverty level, under 5 years old 33.8 12.6 4.1 4.2 0 0 86.1
St.
% housing units built between pre 1960s 40.1% 12.9% 26.3% 16.7% 17.4% 18.0% 43.0% % housing units built pre 1940s 6% 4% 4% 4% 4% 3% 1%
Joseph Twp.
140 | 2019 - 2021 Community Health Needs Assessment
Trust and Relationships Summary
September 2018
Prepared by: Wendy L. Tackett, Ph.D. Kristin Everett, Ph.D. Corey Smith, Ph.D.Overview
Over the past two years, the external evaluation team, iEval, in partnership with the Population Health department at Lakeland, have identified trust as a primary concern. There are two types of trust in a medical setting: institutional trust and interpersonal trust. The Population Health team has been focused on building interpersonal trust with community residents and organizations in hopes that it would transfer to the institution.1 However, the interpersonal connections made while patients are visiting Lakeland also have a critical impact on their perception of institutional health.
To further examine the interpersonal connections made with patients (and visitors) while at Lakeland, the evaluation team, along with other trained observers, conducted observations of interactions at five Lakeland locations in four different settings. Additionally, two Lakeland medical providers were interviewed for their perceptions on the relationships and trust within Lakeland and between Lakeland staff and visitors/patients.
Key Findings
Overall, the atmosphere within the five locations2 the evaluation team conducted observations at was pleasant. There were several key findings and recommendations based on type of observation.
• Front desk: The level of professionalism of the greeters at each location varied, and it was unclear who were volunteers or staff. It should be made clear to greeters that their primary focus should be on the visitors, not on their own personal conversations. What kind of training is currently given to staff? Are they encouraged to say hi but only directly engage if asked questions? It may be more inviting if they greet and offer assistance to all who pause nearby.
• Hallway: Lakeland staff were pleasant in the hallways, often smiling as they walked by the observers. It was noted that Lakeland staff in lab coats or business attire less frequently smiled or acknowledged anyone in the halls, while nurses, CNAs, and other staff were friendly.
• Café: In all café and cafeteria observation times, the majority of people within those locations were Lakeland staff members. The cafeteria at the St. Joseph location is difficult to find, with even the greeters giving inaccurate directions to get there. Better signage, which may be part of the renovation, would be helpful.
• Waiting room: The waiting rooms, both in the emergency room and other locations, were positive places with warm, helpful staff interactions with patients and visitors. All locations were fairly quiet in the emergency room during observation times with the exception of Watervliet, which had approximately 20 people waiting at one point during the observation.
spectrumhealthlakeland.org | 141
Appendix E
Appendix E
There were several key differences and recommendations based on the race of the observer and patient/visitor.
• Front desk: There was more wait time, less friendly greetings, and less direct eye contact with the African American observers compared to the white observer.3 Training on how to greet visitors would make that initial experience more positive for all.
• Hallway: There were some small differences in the direct interaction by staff (e.g., offers of help, a vocal greeting) based on race, with white observers having more engagement than African American observers. The African American observers also felt a less welcoming atmosphere in the hallways in general, but there were definitely examples of extreme helpfulness (i.e., for two different African American observers, a Lakeland staff member asked if they could help them and personally walked them to their requested destination).
• Café: While the majority of staff/visitor interactions were positive, four out of the five less than pleasant interactions were with African American visitors.
• Waiting room: There were no differences in treatment of visitors/patients based on race.
Literature Review
What is trust?
One group of researchers who study trust within the medical field define trust as “the patient’s expectation that his or her best interests will be kept in mind at all times by those caring for them.” 4 A patient has expectations for how they will be treated: with professionalism and care. Those expectations of behavior open up a patient, allowing them to trust the medical professional and to visit a provider voluntarily.
Trust is voluntary; patients do not have to trust their medical providers or institutions. In the literature, trust is also defined as “a voluntary action based on expectations of how someone will behave in relation to yourself in the future.5”
Certain behaviors have been identified as forming trust in the medical setting. Those behaviors are:
• Technical competence – Does the provider know what they are doing and relay their knowledge to the patient?
• Openness – Is the provider willing and able to share information in a personable manner?
• Impartial concern – Does the provider show concern for the patient, no matter the context of the visit?
• Reliability – Can the patient get information and service from the provider in a consistent, dependable way?
Types of trust
Many different types of trust exist in the medical setting. Trust is most often talked about in two ways: interpersonal trust and institutional trust. Institutional trust includes the health care system and trust in insurers. Patients can have trust in one and not the other (e.g., they trust the system, but they do not trust insurers). Some research has identified additional types of trust: 1) trust in the competence of the physician’s care and 2) trust coming from formal and informal health sources.
• Interpersonal:
o Trust in one’s own personal physician2,6
• Institutional:
o Trust in the health care system2,7
o Trust in the insurers2,4,8
• Trust in the competence of the physician’s care3
• Trust in formal and informal health sources. This includes getting health information from friends, family, churches, etc. This highlights the significance of other sources of health information, especially in African American communities.3
• Distrust is not necessarily the absence of trust. Distrust may be defined as “having anxious or pessimistic views of motivation and expected results.9
142 | 2019 - 2021 Community Health Needs Assessment
Appendix E
Outcomes related to lack of patient trust
Trust impacts patients on many levels. Lower trust in the health care system puts people at greater risk for negative outcomes. Research has identified the following as potential outcomes related to lack of trust:
• Less doctor-patient interaction3
• Reduced routine medical care4
• Poor clinical relationships, fewer long term relationships with providers3,4
• Reduced adherence to recommendations and medications3,4
• Worse self-reported health3
• Reduced utilization of health care services3
• Delay in seeking care10
• Higher rates of changing physicians and seeking second opinions2
• Decreased patient satisfaction2
Factors affecting patient trust in health care providers
Many factors have been identified as affecting patient trust in health care providers. Bringing awareness of these may help providers understand the patient’s perspective and what may be influencing their trust with the provider.
• Perception of the provider’s competence/ability
• Informal information sources (friends, family, church)
• Integrity of the institution
• Personal experience with racism. Patients who have experienced racism will bring that experience with them, which has been shown to impact their trust in their provider.
• Knowledge of the history of racism in the health care system4
• Belief in conspiracies, stemming from mistrust in institutions
• Trust that the physician would not encourage the respondent to participate in research not in the patient’s best interest. This is related to the Tuskegee Syphilis study.
• The provider protects confidentiality and privacy
• The provider shares knowledge in a way that is understandable
• The patient believes that the physician wants to do good to the patient (benevolence)
Factors affecting health professional staff trust in patients/the community
Providers and staff also need to trust patients. Research has identified some of the reasons providers may have less trust in patients.
• Provider has suspicion of ulterior motives/feigning symptoms (e.g., trying to get pain medication)
• Providers find it more difficult to trust patients with surprising or unusual symptoms
• Patient describes vague and unobservable symptoms; providers are more likely to trust patients who present observable symptoms
• The level of respect and honesty the patient shows the provider
• The patient is not competent in making informed decisions
• The patient does not follow directions
spectrumhealthlakeland.org | 143
Appendix E
What research says about race and trust in a health care setting
• In one study, black respondents were less likely than white respondents to trust their physician and more likely to trust their health care plan; there was no statistically significant difference in trust in hospitals.4 The greater trust in the health care plan may come from the anonymity a patient has in large health care plan, where they are rarely seen face to face, as opposed to seeing a physician in an office.
• Black respondents were more likely to express concerns about personal privacy and the occurrence of harmful experiments in hospitals.4
• Black respondents reported significantly more trust than did whites in health information sources like family, friends, and church or religious leaders, reflecting the importance of informal social networks, faith communities, and extended family for blacks.4
• In a study measuring physicians’ trust in patients, it was found clinicians had a higher level of trust with white patients compared to non-white patients, despite similar levels of illicit drug use and opioid analgesic misuse. The authors determined this finding may reflect unconscious stereotypes by primary care providers.11
Research-based solutions to build trust
Trust Repair Mechanism
Sense-making
Assumptions
A shared understanding or accepted account of the trust violation is required for effective trust repair
Practical Examples
Investigations, public inquiries, explanations, & accounts
Relational
Trust repair requires social rituals and symbolic acts to resolve negative emotions caused by the violation and re-establishing the social order in the relationship
Regulation & Controls
Ethical Culture
Transparency
Transference
(Bachmann, Gillespie, and Priem 2015)
Trust repair requires formal rules and controls to constrain untrustworthy behavior and hence prevent a future trust violation
Trust repair requires informal cultural controls to constrain untrustworthy behavior and promote trustworthy behavior, and hence prevent a future trust violation
Transparency sharing relevant information about organizational decision processes and functioning with stakeholders helps restore trust
Trust repair can be facilitated by transferring trust from a credible party to the discredited party
Explanations, apologies, punishment, penance, compensation, redistribution of power, and resetting expectations
Regulation, laws, organizational rules, policies, controls, contracts, codes of conduct, sanctions, and incentives
Cultural reforms, induction and socialization, professional training, leadership, and role modeling
Corporate reporting, external audits, public inquiries, and whistleblower protection
Certifications, memberships, affiliations, awards, and endorsements
144 | 2019 - 2021 Community Health Needs Assessment
Appendix E
Strategies from health care organizations
In 2010, representatives from health care organizations gathered in Austin, TX to discuss using social media to build greater trust. The following were deemed the strongest ideas health care organizations could use to build trust and credibility.12 Although the original intent was to build trust through social media, these ideas can be used in a more general way when thinking about building trust.
1. Listen to and implement ideas from the community. Although listening is important, the crux of this item is action. Trust is built when people see action as a result of the community’s participation. This shows the community that the health care organization did listen to them and it made an impact.
2. Have shared value on good health. Patients may see the goal of the health care organization to offer more medication or deliver “efficient” care. A patient’s priority is to get and stay healthy. Building trust requires aligning the patient’s and the systems goals and clearly communicating how those goals align, to the community. Focusing on prevention is a way to align the patient and system goals.
3. Answer your patient’s or customer’s concerns directly. The original intent of this idea was through a social media lens; using social media tools to listen to people’s thoughts and concerns and developing strategies for responding to them. This idea can also be thought of in more broad terms, highlighting the importance of listening and answering concerns with patients throughout programming.
4. Aggregate or curate useful information. Many consumers have access to much information. In the health care space, the difficulty lies in finding reliable sources to gain information. The health care system can create resources to share with people, which demonstrates commitment to their needs, and in turn, builds trust.
5. Serve as a resource or guide for the community. The organization should utilize the experts (physicians, staff, etc.) within the system to share information used in marketing and communications. Introducing the experts through marketing materials connects patients and customers with the organization and to the people in it.
6. Set expectations on what you do and why. Transparency is key. Patients and the community may assume policies or practices are based on financial or legal reasons, but there may be more behind the story. Sharing the motivation for the policies and practices, especially those that go beyond financial reasons, may help build trust.
7. Focus on setting a clear mission for employees. Defining a clear mission and vision is crucial. All employees need to understand that vision and work towards it together. A consistent message from all staff to the public establishes a belief in the organization, because it is clear what the group stands for.
8. Communicate the human results and outcomes. Large organizations often focus on the financial metrics. Tracking, evaluating, and reporting the impact of the efforts of the organization in human measures can help inspire belief and trust.
9. Recognize both sides of the issue or data. Presenting data in a balanced way helps people to believe there is not a bias from the organization. People tend to believe reports and data provided by health care organizations, especially related to pharma, are biased towards the organization. Balanced presentation of the data can help relieve those fears and build trust.
10. Build trusted long-term relationships. This suggestion was specifically about building up the trust of a group of people online, those who interact with the health care organization’s social media presence and those that are considered “influencers” online. As the relationships with these groups strengthen, they will learn more about the real philosophy and thinking behind the organizations. They will also serve as advocates for the organization, especially online.
spectrumhealthlakeland.org | 145
Appendix E
Methodology
Observations
Guiding question: How are Lakeland staff treating patients differently?
Explanation: Mystery shopping is when a person goes to an organization to access services a regular customer would but with the purpose of evaluating the “shopping” experience. For example, a mystery shopper may be tasked with recording how long it takes before an employee at clothing store asks them if they need any help or what temperature the chicken was when served at a restaurant. Mystery shopping experiences are useful for collecting information on how patients experience Lakeland. However, because posing as a patient or observing patient-staff interactions during medical services may be deemed unethical or a possible HIPAA violation, the evaluation team only observed interactions from afar.
Purpose: iEval has begun to develop a base of evidence for mistrust in Lakeland among community members, and there seems to be a growing understanding that much of this mistrust stems from interactions that the community has in Lakeland facilities as well as broken promises/commitments. The purpose of this approach is to better understand the day-to-day interactions between Lakeland staff and the patients they serve.
Where: Observations at five locations: Lakeland Medical Center, St. Joseph; Lakeland Hospital Niles; Lakeland Hospital Watervliet; Center for Outpatient Services (COPS); Marie Yeager Cancer Center
Process: Observations were conducted in person for a period of 2-4 hours at each location, with the St. Joseph hospital location having visits on three separate days. Observations occurred on July 19, August 15, August 16, and August 21. All visits occurred during the day but varied the time of day (i.e., morning, mid-day, afternoon). Eight different mystery shoppers observed on these dates: five African American and three white, four males and four females.
Mystery shoppers were dressed as regular community members – no name tag, no business attire, no clipboard or computer, etc. Records of the observations were made using Google Forms on each observer’s phone, so it would not stand out and just look like observers were texting.
Observations were conducted around four elements: front desk interaction, walking the hallways, sitting in the cafe, and sitting in the emergency room or waiting room. The front desk experience required direct interaction, with the observer specifically asking for directions somewhere. The rest of the observations required observations with some tertiary interaction (e.g., smiles, greetings). The full protocol used for the observations can be found in Appendix A.
Interviews
Guiding question: What are the root causes of the perceived lack of trust or the actual lack of trust that medical providers and staff have in patients?
Purpose: Because the iEval team was not able to observe any physician/patient interactions or nurse/patient interactions, interviewing several key staff on their perceptions was deemed an acceptable alternative. The purpose of this approach is to better understand the front-line staff perspectives on trust.
Process: Two interviews were conducted, one with a family physician and one with an emergency room physician, both from Lakeland. The family physician was interviewed over the phone for approximately 30 minutes and the emergency room physician was interviewed in person for approximately one hour. The full protocol for interviews can be found in Appendix B.
146 | 2019 - 2021 Community Health Needs Assessment
Findings: Observations
The findings are reported by type of interaction or observation, disaggregated by the race of the observer when appropriate.
Front Desk Interactions
At the five locations, there were 15 different interactions recorded at a front desk, which could be at the primary facility entrance or the emergency room entrance.
Greetings: All four front desk interactions with white observers began with a friendly greeting from the employees/volunteers,13 while seven out of the 11 interactions with the African American observers were deemed friendly. The other four greetings with African American observers were bored/apathetic (2), unfriendly (1), and pleasant yet bothered (1).
“I was greeted immediately after walking in. The front desk employee (or volunteer) seemed preoccupied with something he was doing. He did ask me if I needed help. I did not receive a smile or felt like it was his pleasure to help me.”
~Black observer, Niles
Eye Contact: All four interactions with white observers noted direct eye contact from the Lakeland staff/volunteers. Eight of the 11 interactions with the African American observers involved direct eye contact, while two interactions had the staff/volunteer avoiding direct eye contact and one interaction had the staff/volunteer pre-occupied so not looking at the observer.
“They were friendly and personable. There was a desk for nurses in the waiting room, and these nurses seemed to have a rapport with some of the patients, calling out to them to say hi or check in on them.”
~White observer, Cancer Center
Wait Time: Of the 15 interactions, only nine interactions involved any wait time, the observers in the other five interactions were helped immediately as they approached the desk. All three interactions with white observers that involved wait time were less than one minute. Four interactions with African American observers involved wait time of less than one minute, one had wait time of 6-10 minutes, and one observer was not helped after waiting near the desk for 15 minutes.
“There was a line. I was third in line, and she (staff/volunteer) seemed irritated because her staff friend was waiting to continue their conversation.”
~Black observer, St. Joseph
“Upon entering, I lingered within clear view of two of the three front desk women. Both were looking down at their desktops. One looked up but then walked away from the area and out of sight. She did not speak, ask if I needed anything, or acknowledge my presence. The other woman looked up and asked if I needed anything. She was pleasant and provided clear directions to the cafeteria. She ended with a smile.
~Black observer, Niles
spectrumhealthlakeland.org | 147
Appendix E
Clear Directions: When the observers asked for directions from the front desk staff/volunteer, nine out of 11 of the directions were clear and accurate. Two sets of directions given were somewhat clear, resulting in inaccurate directions that did not get the observer where they asked to go. There were no differences among racial lines for the inaccurate directions, as it happened to one white observer and one African American observer.
“The emergency room front desk staff were very helpful and quickly got me directions.”
~Black observer, St. Joseph
“Two friendly older ladies greeted me and gave me directions, but they did not give clear directions about the location of the cafeteria. They stumbled a bit.”
~White observer, Watervliet
Hallway Interactions
At the three hospital locations and COPS, there were 16 different timeframes that observers walked the hallways, recording how many Lakeland staff they passed and what type of interactions they had.
Number of Interactions: During the hallway walks, the observers walked by an average of 6 staff members, ranging from 1 to 18 staff per stroll.
“Positive and welcoming. One African American staff walked me to my destination and joked with me along the way.”
~Black observer, St. Joseph
Smiles: 69% of the staff the observers passed while walking smiled at them, with a higher percentage smiling at white observers (75%) than African American observers (67%).
Direct Interaction: 39% of the staff the observers passed while walking spoke to them (e.g., a general greeting, an offer of help), with a higher percentage speaking to white observers (44%) than African American observers (38%).
Friendliness: Observers felt the majority of the staff they passed in the halls seemed friendly (69%), which aligns exactly with people smiling at the observers. All three hallway walks by white observers were deemed friendly overall while only 61% of the walks by African American observers were deemed friendly overall. The remaining walks that African American observers took gave the overall feeling that staff were distracted (e.g., tired, engaged in conversation with a coworker, looking away) and did not take the time to create a welcoming atmosphere.
“Both people asked me if I needed help and gave me clear directions on how to get to where I asked about. One walked me to the vending machine area since the cafeteria was closed, and then came back about a minute later to let me know that even though the cafeteria was closed, I could knock on the door and buy a sandwich.”
~White observer, Watervliet
“I did not see a lot of staff during my walk. The first person I came in contact with was very helpful. He actually showed me to the café and gave me a brief rundown of where everything was in the café. He was extremely helpful and seemed genuinely interested in making sure I was taken care of.”
~Black observer, St. Joseph
148 | 2019 - 2021 Community Health Needs Assessment
Appendix E
Appendix E
Cafe Observations
At the three hospital locations and COPS, there were 22 different observations of interactions in the café or cafeteria between Lakeland staff and visitors/patients.
Visitor Demographics: There were observations of interactions with male visitors/patients (8) and female visitors/patients (14), African American visitors/patients (13), and white visitors/patients (9)14, and different age groups, using best guesses: less than 25 years old (6), 25-49 years old (10), 50-74 years old (5), and 75 years or older (1).
“African American visitor had a meal pass for one meal but had two meals on tray. Staff member explained she needed to pay for second meal. She didn’t have any money. Staff was very friendly and gave her meal for free.”
~White observer, St. Joseph
Greetings: The majority of the greetings by Lakeland staff to visitors were friendly (77%). The five greetings that were not friendly were: cautious to an African American visitor (3), bored/bothered to a white visitor (1), and unfriendly to an African American visitor (1).
“Staff pleasantly engaged with visitors upon entering and generally at their exit, if within speaking range.”
~Black observer, Niles
Staff Disposition: Aligned with the type of greeting received, the overall staff disposition was pleasant (73%). Other general dispositions of Lakeland staff members included unengaged/disinterested (3), agitated/anxious (2), and unfriendly (1). The only difference by race of the visitors was that both interactions from the staff member that seemed agitated/anxious was with African American visitors, but note that it was the same staff member with this behavior so it may have been something external that was causing the anxiety.
“Overall very pleasant. There was a worker in training. Ordering food took a while, but everyone was kind.”
~Black observer, COPS
Visitor Disposition: Because the disposition of the visitor also affects the interaction, the general disposition of visitors was noted. 77% of the visitors were pleasant, with two visitors being unengaged (African American), one visitor being agitated/anxious (white), one visitor being distressed (African American), and one visitor being unfriendly (African American). However, there were no clear patterns between staff greetings and visitor disposition, but there was one incident where the staff behavior dramatically changed to match that of the visitor.
“The cafeteria staff were very helpful. They greeted the person (African American male) and made light jokes while helping him select food.”
~Black observer, St. Joseph
“Very little eye contact and almost rude interaction between visitor (African American female) and staff. The staff member was previously kind, yet during this interaction, the staff matched the visitor’s attitude.”
~Black observer, St. Joseph
spectrumhealthlakeland.org | 149
Waiting Room Observations
At the five locations, there were 29 different observations of interactions in an emergency room or waiting room between Lakeland staff and visitors/patients. Overall, the waiting rooms were the most positive environment the observers witnessed during each visit, regardless of race, gender, or age.
Visitor Demographics: There were observations of interactions with male visitors/patients (13) and female visitors/patients (16); African American visitors/patients (10), Asian visitors/patients (1), Latino/a visitors/patients (2), and white visitors/patients (16)15; and different age groups, using best guesses: less than 25 years old (5), 25-49 years old (9), 50-74 years old (11), and 75 years or older (4).
“The staff were warm and friendly, going as far as to help the patient (African American male) dial numbers on the phone so he could contact his transportation home.”
~Black observer, St. Joseph
Greetings: The majority of the greetings by Lakeland staff to visitors were friendly (93%). The two greetings that were not friendly were: not observed with an African American visitor (1) and bored/apathetic to a white visitor (1).
“It was good. It seemed appropriate for a cancer center. There was a recognition of the struggle the patient is going through, sort of a connection.”
~White observer, Cancer Center
Service Time: All visitors were helped in a timely fashion.
Staff Disposition: All of the staff had very pleasant dispositions except for one staff member at COPS who was unfriendly towards a white visitor.16
Visitor Disposition: Because the disposition of the visitor also affects the interaction, the general disposition of visitors was noted. 72% of the visitors were pleasant, with three visitors being anxious, two in pain, and three showing no emotion. The other dispositions were across all racial groups, and there were no connections between race and staff greetings or staff disposition.
“Staff engaged patient with warm greetings and light banter. Appeared to be familiar with one patient (African American male) in particular, making connections and humorous chastising after patient got medical advice and caregiver instructions. Patient had wide smile.16
~Black observer, Niles
Waiting Room Atmosphere: 100% of the waiting rooms and emergency rooms were calm and orderly. The waiting room at the Cancer Center was especially supportive.
“The staff were helpful to each person they encountered in the waiting area. They all were very professional, engaging, and attentive to the needs of everyone coming in.”
~Black observer, Watervliet
150 | 2019 - 2021 Community Health Needs Assessment
Appendix E
Findings: Interviews
Some key takeaways from the two interviews with physicians are shared below. On some issues, their perspectives varied quite a bit because of the location of services, the different populations each of them sees, and who they are working with within Lakeland.
Fair Treatment: Historically there are issues of mistrust between the community and Lakeland, and that segment of the population – while getting older – hold on to their memories. Some of the older physicians, nurses, and administrators help perpetuate that mistrust when they make comments about patients and they don’t understand their situations. The new current medical residents are proactively doing outreach in the community at places like Elite Barbershop in Benton Harbor and the Community Food Network in Benton Heights to build understandings of the populations they are serving.
Often, by the time a patient gets past the first interactions in a medical facility and actually sees a physician, whether for inpatient or outpatient services, they have already made the decision to trust the medical professionals. The point at which the patient makes that decision is often in the first greetings they receive at the medical facility or during the first interactions with the nurses. However, physicians have a responsibility to treat patients with respect to help improve the overall perceptions of the organization.
Emergency room physicians, specifically, often feel that another medical professional may never treat this patient again, so this is the one opportunity to elevate their care. The ER physicians and residents look at the patients who are most needy and go out of their way to shepherd the patients into outpatient follow-up.
Faith in Patients: The general feeling from the two interviews is that patients do not make unreasonable demands or typically manipulate the visit for a secondary gain. While the patients often do have a difficult time understanding the care needed or managing their own condition, the physicians put that ownership on themselves (to better explain care) and society (for not being proactive in creating solutions to systemic issues of care).
Staff Perceptions of Patients: The perspective is that staff are very attentive and caring with patients when interacting with them, but there are comments made behind the scenes that are inappropriate. While those comments are not made knowingly in front of patients, they should still not be tolerated. Offering more experiences, such as having residents and nurses work in person at Elite Barbershop or the Niles program, can help staff better understand the context of the patients’ lives.
Patient Perception of Lakeland: Patients seem to have a more positive perception of Lakeland in Niles than Lakeland in St. Joseph, feeling it is more family-oriented and less impersonal. Many community members have shared that they would rather drive to Kalamazoo or South Bend instead of going to St. Joseph, but those are the potential patients with the means (e.g., transportation, financial) to make those kinds of choices.
“We’ve gone through Bring Your Heart to Work and other rah-rah programs, but it really comes down to everyone is an ambassador to the health system you work in and you need to remember that every day.”
spectrumhealthlakeland.org | 151
Appendix E
Suggestions for Improvements: As previously mentioned, the physicians feel very strongly that the health care professionals should have experience putting themselves in the place of the patient, trying to understand as much as possible about the position they are in and have empathy for that. The medical professionals need to remember their other important medical roles, in addition to medical care, which include support, guidance, teaching, and elevating personal situations. If medical staff aren’t able to spend time in community settings, then they need to make it a priority during the appointment to learn more about the patient, so they can personalize the care and instructions as much as possible.
“If medical professionals can relate to the patients outside of the medical care, they can better relate solutions to their lives. We need to be less problem-focused and more broad in our focus of care because then we’ll be more effective. If you can relate the job people do to their health, it’ll have more of an impact.”
Conclusion
Overall, the atmosphere at all five locations was positive and friendly. While there were some differences in interactions based on race, there were also instances of excellence regardless of race. It is imperative that medical staff take the time to better understand the community they are serving.
It should be noted that there was diversity within the staff at St. Joseph, the Cancer Center, and COPS, while the staff at Niles and Watervliet were mostly white. Aligning with that, however, was the fact that most of the visitors/patients in Niles and Watervliet were also white.
The findings and recommendations in this report may be useful to the leadership teams at Lakeland as they work towards more inclusive, equitable facilities and care.
Recommendations:
• Expand the opportunities for Lakeland staff to interact with community members, representing Lakeland as medical experts, in comfortable community settings such as Elite Barbershop, Niles YMCA, and Community Food Network. Providing similar opportunities that the medical residents have for nurses, physicians, etc. would help open their minds to understanding the issues that community members face.
• Continuing the outreach work into communities served by Lakeland is important for rebuilding trust and shifting perceptions of Lakeland. This should be coupled with an emphasis on continuing to offer high quality customer service. Employees should remember that a negative experience can linger in community members’ minds, and may be what is remembered when patients or other community members leave a Lakeland facility.
• Provide better training to front desk staff on how to greet community members as they enter the building, ensuring they understand that the patient/visitor is the first priority and a friendly greeting goes a long way in building trust.
• Develop a process for internal staff to use the observation protocol (“mystery shopping” experiences) in a regular basis. By having staff observe from a more objective perspective, with specific things in mind to watch for during the observation, it may help educate them on things they can change in their own work or in their own department.
References
Anderson LA, Dedrick RF. Development of the Trust in Physician scale: a measure to assess interpersonal trust in patient-physician relationships. Psychol Rep. 1990 Dec;67(3 Pt 2):1091-100.
Bachmann, Reinhard, Nicole Gillespie, and Richard Priem. 2015. “Repairing Trust in Organizations and Institutions: Toward a Conceptual Framework.” Organization Studies 36 (9): 1123–42. doi:10.1177/0170840615599334.
152 | 2019 - 2021 Community Health Needs Assessment
Appendix E
Barnard, David. 2016. “Vulnerability and Trustworthiness: Polestars of Professionalism in Healthcare.” Cambridge Quarterly of Healthcare Ethics 25 (2): 288–300. doi:10.1017/S0963180115000596.
Bhargava, R. 2010. SXSH: 10 Ways for Healthcare Organizations to Build Trust. Retrieved from http://www.rohitbhargava.com/2010/03/sxsh-10-ways-for-healthcare-organizations-to-buildtrust.html.
Bova, Carol, Paulette Seymour Route, Kristopher Fennie, Walter Ettinger, Gertrude W. Manchester, and Bruce Weinstein. 2012. “Measuring Patient-Provider Trust in a Primary Care Population: Refinement of the Health Care Relationship Trust Scale.” Research in Nursing and Health 35 (4): 397–408. doi:10.1002/nur.21484.
Govier T. Distrust as a practical problem. J Soc Philos. 1992;23(1):52–63.
Moskowitz, D., Thom, D.H., Guzman, D., Penko, J., Miaskowski, C., and Kushel, M. (2011). Is primary care providers’ trust in socially marginalized patients affected by race? Journal of General Internal Medicine, 26,8. https://doi.org/10.1007/ s11606-011-1672-2
Schwei, Rebecca J., Kelley Kadunc, Anthony L. Nguyen, and Elizabeth A. Jacobs. 2014. “Impact of Sociodemographic Factors and Previous Interactions with the Health Care System on Institutional Trust in Three Racial/ ethnic Groups.” Patient Education and Counseling 96 (3). Elsevier Ireland Ltd: 333–38. doi:10.1016/j.pec.2014.06.003.
Stegner, E. 2015, Nov 15. Building Trust with Your Healthcare Brand. Retrieved from https://medicomhealth.com/building-trust-with-your-healthcare-brand/
1 See other evaluation reports provided to Population Health related to this.
2 Three Lakeland hospitals (Niles, St. Joseph, Watervliet), the Marie Yeager Cancer Center, and the Center for Outpatient Services
3 However, there were also more front desk interactions made by the African American observers, so the White observers may have experienced the same if there were more interactions.
4 Schwei et al. 2014
5 Gilson 2003
6 Musa et al. 2009
7 Boulware et al. 2003
8 Hall et al. 2002
9 Govier, T. 1992
10Kyung et al. 2010
11Moskowitz, D., et. al., 2011
12Bhargava, R. 2010
13It wasn’t always immediately obvious if the front desk staff were employees or volunteers.
14The evaluation team did not record the race of the Lakeland staff members.
15The evaluation team did not record the race of the Lakeland staff members.
16The visitor had come to COPS to get a shot but was told they did not do that there. The visitor did not understand, and the Lakeland staff member became agitated and was unfriendly in helping the visitor understand.
spectrumhealthlakeland.org | 153
Appendix E
Appendix A: Mystery Shopping Guidelines
1. FRONT DESK – please pick one of the following options to do
*Note: there may be more than one point of entry and more than one help desk. Please do this at each help desk near a point of entry.
Option 1: Indirect interaction
Stand near, but not directly in front of, the help desk and look around like you’re looking for something. When someone does speak with you, just let them know that you’re just waiting for someone. Wait there a few more minutes, then meander to your next observation, pausing somewhere to type in your notes. Please make note of the following:
• How long you had to wait until someone asked if they could help you
• What type of greeting you were given (friendly, cautious, bored, etc.)
• Level of eye contact (direct, evasive, etc.)
• Overall feelings based on brief interaction
Option 2: Direct interaction
Walk directly up to the front desk to ask for help. Ask how to get to a specific location (e.g., cafeteria to meet a friend if in one of the hospitals or COPS, the waiting room to meet a friend if at the Cancer Center). Go on and follow the directions that were given to you and go to the place you asked about, which is where you can type your notes. Please make note of the following:
• What type of greeting you were given (friendly, cautious, bored, etc.)
• Level of eye contact (direct, evasive, etc.)
• Clarity of directions
• Competence in providing accurate information
• Was there any offer of additional help?
• Overall feelings based on brief interaction
2. HALLWAYS (plan for a 10-15 minute walk TWICE at each hospital, may be shorter at COPS because could seem awkward to wander around that long)
• Walk at a slow place like you’re looking for something
• Pay attention, only go where the public are allowed – do not go into any private or restricted areas. This is not about testing hospital security
• Keep in mind some place to ask directions for if a staff member asks if they can help you (e.g., emergency room, cafeteria to meet a friend, birthing center)
• Please make note of the following:
º Number of staff members who walk by you (How many made eye contact? How many smiled? How many asked if they could help you?)
º Quality of interaction (eye contact, friendliness, clarity of directions, offer of additional help)
º Overall feelings based on experience walking the halls
154 | 2019 - 2021 Community Health Needs Assessment
Appendix E
3. CAFÉ (plan for 30-60 minutes)
• Be careful not to be intrusive on patient privacy – you’re observing from afar
• This observation does not involve any interaction on your part, you are casually observing the interactions between Lakeland staff and patients/families.
• Most likely interaction will be seen at the cash register or in the line, so position yourself sitting somewhere that you can see/hear what is happening there.
• You may have a book to look up from, be busy on your phone, drinking coffee, eating lunch, etc. Make it look like you belong at the café/cafeteria for the timeframe you are there observing.
• Please make note of the following:
º Type of greeting (friendly, cautious, bored, etc.)
º General disposition of visitors/patients & staff, as well as description of patient with whom staff member is interacting (only make notes if there is something memorable – very friendly or very unfriendly behaviors by staff or patients; you do not have to record every interaction)
º Overall feelings based on interactions you have seen between staff and visitors/patients
4. Emergency Room / Waiting Room (plan for 30-60 minutes, may be broken up in to 3 shorter stays for 20 minutes)
• Be careful not to be intrusive on patient privacy – you’re observing from afar
• This observation does not involve any interaction on your part, you are casually observing the interactions between Lakeland staff and patients/families
• You may have a book to look up from, be busy on your phone, drinking coffee, etc.
• Make it look like you are just waiting for someone for the timeframe you are there observing. If anyone asks you what you are doing, just say that you are waiting for a friend
• You primarily will be observing the staff/patient interaction at the registration desk and when nurses come to get patients
• Please make note of the following:
º Length of time before patient is helped
º Type of greeting (friendly, cautious, bored, etc.)
º General disposition of visitors/patients & staff, as well as description of patient with whom staff member is interacting (only make notes if there is something memorable – very friendly or very unfriendly behaviors by staff or patients; you do not have to record every interaction)
º General description of the feel in the emergency/waiting room area (calm, frantic, stressful, etc.)
º Overall feelings based on interactions you have seen between staff and visitors/patients
spectrumhealthlakeland.org | 155
Appendix E
Appendix E
Appendix B: Interview Protocol
My name is [name], and I’m an external evaluator with iEval, who has been helping the Population Health team over the past two years with evaluation. The evaluation work in that department has identified trust as a factor undermining Lakeland’s impact on Population Health and how Lakeland can effectively help patients. We wanted to interview some key front-line staff within Lakeland to gather perspectives on trust. Anything you share with me today is confidential and will only be known to the evaluation team. We will be reporting themes across all of the interviews we conduct without attributing anything to individual person.
1. What is your role within Lakeland and what are the primary locations at which you work?
2. As mentioned, we have found that trust is an issue. In surveys we did with community members, 18% of them said they would not trust their health care to Lakeland and 16% said they do not trust they will be treated fairly at Lakeland. Do you believe all community members are treated fairly when they come to Lakeland for medical services? (please explain)
3. Thinking about the patients you typically see, what percentage of patients do you think will….(follow up on each with “What type of patient falls into the XX% that will not do that specific action?”)
a. tell you about all medications and treatments he or she is using?
b. understand what you tell him/her?
c. be actively involved in managing his/her condition/problem?
d. not make unreasonable demands?
e. not manipulate the office visit for secondary gain (e.g., for inappropriate disability certification or prescription of controlled substances?)
4. Do you feel there are many people who use the ER as their primary source of medical care? If so, why do you think that is?
5. What have you heard employees say about the patients who come to Lakeland? (can be both positive and negative, don’t probe – just let people say what they will)
a. What do you think Lakeland could do to help improve the perceptions and trust that Lakeland employees have in community residents?
6. What have you heard patients say about Lakeland? (can be both positive and negative, don’t probe – just let people say what they will)
a. What do you think Lakeland could do to help improve the trust that community members have in Lakeland as their health home?
7. What other suggestions do you have that could help improve Lakeland’s image in the community or relationships with the patients?
156 | 2019 - 2021 Community Health Needs Assessment
Voter Turnout and Associated Social Determinants by Municipality
Buchanan
Chikaming
Coloma
Coloma
spectrumhealthlakeland.org | 157 Appendix F 6.5 7 11 23 4.4 8 4 7.3 8.7 4.7 8.4 7.8 5.5 8.7 1.9 4.7 5.9 6.8 9.5 8.3 6.6 8.4 3.6 4.6 4.6 11.5 7 6.9 12.4 7.2 63.7 60.1 36.7 28.4 50.1 57.4 59.8 46 47.9 62.4 51.2 49.6 50.9 55.2 60.9 63.4 51.8 57.7 37.2 48.1 51.3 50.9 63.4 60 62.2 50.8 50 45.9 47.1 50.2 Bainbridge Township Baroda Township
Charter Township
Harbor City
Township
Township
City
Benton
Benton
Berrien
Bertrand
Bridgman
City
Township
Buchanan
Township
City
Charter Township
Township Hagar Township Lake Charter Township Lincoln Charter Township New Buffalo City New Buffalo Township Niles City Niles Township Oronoko Charter Township Pipestone Township Royalton Township St. Joseph City St. Joseph Charter Township Sodus Township Three Oaks Township Watervliet City Watervliet Township Weesaw Township 19.4 24.2 30.2 45.8 21.2 18.9 24.7 34.2 22.8 16.8 31.7 22.8 19.7 17.6 17.8 25.4 30.4 18.2 35.4 29.9 35.9 17.8 21.7 39.4 21.4 15.9 26 30.2 22.1 16.2 81.2 83.8 54.2 32.2 85.1 89.3 72 54.8 90 92.3 68 72 79.6 77.8 81.6 79.6 71.5 81.8 54 75.9 55.5 81.4 86.6 56.7 86.9 85.4 72.8 64.7 85.8 83.4
Galien
Owner-Occupied Housing Units %, Year Householder Moved into UnitOccupied Housing UnitsMoved in 2010 to 2014 Voter Turnout Rate Unemployment Rate Geography
%
158 | 2019 - 2021 Community Health Needs Assessment
Dissimilarity Index for all Counties in Michigan
Estimate; Total: Geography
Grand Traverse County
Mecosta County
Clinton
Isabella County
Ingham County
Bay County
Ottawa County
Macomb County
Monroe County
Cass County
Kalamazoo County
Van Buren County
St. Joseph County
Washtenaw County
Calhoun County
Kent County
Midland County
Jackson County
St. Clair County
Marquette County
Allegan County
Lenawee County
Oakland County
Saginaw County
Eaton County
Genesee County
Chippewa County
Lapeer County
Branch County
Estimate; Total: White alone
Estimate; Total: Black or African American alone
Moderately Segregated
Moderately Segregated
Moderately Segregated
Moderately Segregated
Moderately Segregated
Moderately Segregated
Moderately Segregated
Moderately Segregated
Moderately Segregated
Moderately Segregated
Moderately Segregated
Moderately Segregated
Moderately Segregated
Moderately Segregated
Moderately Segregated
Moderately Segregated
Moderately Segregated
Moderately Segregated
Moderately Segregated
Moderately Segregated
Highly Segregated
Highly Segregated
Highly Segregated
Highly Segregated
Highly Segregated
Highly Segregated
Highly Segregated
Highly Segregated
Highly Segregated
spectrumhealthlakeland.org | 159
90715 43259 77245 70574 284559 106107 276583 859703 149945 51795 258605 75216 60923 358082 134691 629352 83559 159483 160069 67418 113666 98673 1235215 195201 108544 413090 38330 88310 43603
Appendix G
1158 1140 1173 1755 31804 1586 4001 91582 3489 2486 28060 2552 1537 42970 14563 60729 1216 13659 3416 1109 1625 2891 170742 36154 6718 83620 2564 1094 1004 85831 40303 72543 62445 214036 100361 249851 711089 142076 45880 210867 65599 55797 264906 110966 508965 78157 139499 149831 62911 107300 91338 937568 146532 94521 309146 27370 84523 41096
Dissimilarity classification
40% 40% 42% 42% 45% 45% 46% 47% 48% 48% 49% 49% 55% 55% 55% 57% 58% 60% 60% 60% 61% 62% 63% 63% 67% 67% 67% 69% 70% % of
the population needed to relocate to achieve Integration
Berrien County
Ionia County
Muskegon County
Montcalm County
Wayne County
Gratiot County
Ontonagon County
Keweenaw County
Iron County
Wexford County
Benzie County
Dickinson County
Alpena County
Emmet County
Shiawassee County
Huron County
Missaukee County
Mason County
Sanilac County
Menominee
Crawford County
Schoolcraft County
Osceola County
Arenac County
Otsego County
Antrim County
Iosco County
Luce County Hillsdale
Dissimilarity Index for all Counties in Michigan
160 | 2019 - 2021 Community Health Needs Assessment
155134 64126 172148 62922 1767593 41676 6165 2195 11393 32829 17462 25889 28929 33091 68800 32021 15032 28755 41761 23568 13840 8186 23172 15327 24198 23215 25373 6451 46024
Appendix G
22985 2392 23604 1261 694872 2367 17 20 63 222 75 140 172 220 293 125 86 251 233 65 70 48 218 76 114 79 178 482 286 121439 58465 138915 59322 940071 38051 5928 2161 10938 31552 16756 25007 28013 30628 66636 31183 14558 27466 40382 22286 13314 7118 22365 14803 23231 22263 24405 5131 44692
County
Total: White alone Estimate; Total: Black or African American alone Dissimilarity classification
Total: Geography 70% 71% 72% 74% 79% 80% 15% 15% 17% 22% 28% 29% 30% 31% 31% 32% 32% 32% 32% 32% 33% 33% 34% 34% 36% 36% 37% 38% 39% % of the population needed to relocate to achieve Integration Highly Segregated Highly Segregated Highly Segregated Highly Segregated Highly Segregated Highly Segregated Well Integrated Well Integrated Well Integrated Well Integrated Well Integrated Well Integrated Not Classifiable Not Classifiable Not Classifiable Not Classifiable Not Classifiable Not Classifiable Not Classifiable Not Classifiable Not Classifiable Not Classifiable Not Classifiable Not Classifiable Not Classifiable Not Classifiable Not Classifiable Not Classifiable Not Classifiable
Estimate;
Estimate;
Presque Isle County
Montmorency County
Kalkaska County
Tuscola County
Livingston County
Newaygo County
Barry County
Charlevoix
Leelanau County
Ogemaw County
Houghton County
Cheboygan
Lake County
Alcona County
Oceana County
Clare County
Baraga County
Gladwin County
Mackinac County
Delta County
Oscoda County Gogebic County
County
Dissimilarity Index for all Counties in Michigan
spectrumhealthlakeland.org | 161
12955 9317 17259 54014 185841 47957 59316 26172 21764 21103 36565 25579 11415 10461 26152 30608 8612 25367 10998 36570 8374 15650 24465 9396 23900
Appendix G
Manistee
Alger County Roscommon County 67 23 117 666 921 650 365 91 109 64 282 188 827 26 305 156 1567 88 241 91 49 708 698 688 48 12585 9038 16612 52121 179295 45028 57126 24866 20191 20439 34184 23858 9983 10184 24906 29520 6341 24704 8227 34406 8093 14164 22401 8032 23137
Total: White alone Estimate; Total: Black or African American alone Dissimilarity classification
Total:
39% 40% 41% 43% 44% 44% 45% 45% 45% 46% 47% 47% 47% 51% 51% 52% 53% 53% 53% 59% 60% 61% 64% 69% 77% % of the population needed to relocate to achieve
Not Classifiable Not Classifiable Not Classifiable Not Classifiable Not Classifiable Not Classifiable Not Classifiable Not Classifiable Not Classifiable Not Classifiable Not Classifiable Not Classifiable
Estimate;
Estimate;
Geography
Integration
Not Classifiable Not Classifiable Not Classifiable Not Classifiable Not Classifiable Not Classifiable Not Classifiable Not Classifiable Not Classifiable Not Classifiable Not Classifiable Not Classifiable Not Classifiable
162 | 2019 - 2021 Community Health Needs Assessment
Bikeable and Walkable Communities in Berrien County
City of Benton Harbor
City of Bridgman
City of Buchanan
City of Coloma
City of New Buffalo
City of Niles
City of St. Joseph
City of Watervliet
Coloma Township
Village of Baroda
Village of Berrien Springs
Village of Eau Claire
Village of Galien
Village of Grand Beach
Village of Michiana
Village of Stevensville
Village of Three Oaks
Very Walkable
Car-Dependent
Very Walkable
Somewhat Walkable
Somewhat Walkable
Very Walkable
Car-Dependent
Somewhat Walkable
Car-Dependent
Car-Dependent
Very Walkable
Car-Dependent
Car-Dependent
Car-Dependent
Car-Dependent
Car-Dependent
Somewhat Walkable
spectrumhealthlakeland.org | 163
Appendix H
74 46 78 54 66 83 44 50 0 34 71 41 18 0 1 45 59
49 49 54 40 67 73 44 44 14 41 74 32 39 22 24 NA 54
Bike Score Walk Score Location
Bikeable Somewhat Bikeable Bikeable
Bikeable Bikeable Very Bikeable Somewhat Bikeable
Bikeable
Bikeable
Bikeable Very
Bikeable
Bikeable
Bikeable
Bikeable
Somewhat
Somewhat
Somewhat
Somewhat
Somewhat
Bikeable Somewhat
Somewhat
Somewhat
Somewhat
NA Bikeable
164 | 2019 - 2021 Community Health Needs Assessment
Participation in Organized Religion in Berrien County
spectrumhealthlakeland.org | 165
22.7 11 0 0.2 2 6.4 0.9 3.9 0 0 0 47.1 Protestant Catholic Baha’i Jewish Muslim SDA Christian other (including Mormon) Pentecostal Jehovah’s Witness Hindu Sikh TOTALS 46.8 23.4 0.1 0.3 4.2 13.6 1.9 8.4 0 0 0 98.7 # of Congregations % of Total Population Group 155 11 1 1 2 23 7 40 6 1 1 248 % of Total Adherents
Appendix I

1234 Napier Avenue St. Joseph, MI 49085 spectrumhealthlakeland.org