3 minute read
TAKING STOCK
What does your woodland consist of? How much timber can sustainably be taken out? Are there too few or too many trees impacting ecological health?
These crucial questions have, in the past, been answered by long-winded analogue techniques for inventory, namely battered DBH callipers and a 20m tape measure that’s been dragged through brambles so many times it now measures 21m.
We’ve been interested in digital inven- tory for a few years now and have watched as it has become increasingly led by remote sensing and modelling. However, we find ourselves needing data from complex systems such as continuous cover (CCF), agroforestry and urban forestry systems that can only be derived accurately from within the forest itself.
When it comes to looking at quality rather than volume or uses for individual stems, we need to measure actual trees and if we are interested in changes to forest ecological conditions, having replicable geolocated plots for regular detailed assessments has huge advantages over whole-forest assessments.
We are also a small business, so spending thousands on specialist technology and data isn’t realistic, especially as we are all already carrying advanced sensing equipment in our pockets every day within our smartphones.
What do we want to measure?
Our needs are as variable as the types of systems we get called in to investigate:
• At the Architectural Association’s forest campus Hooke Park, we are working on a long-term strategic plan. The forester there has a unique and exceptional knowledge of the forest from decades of management; however, there is no full inventory, no place to start to look at future silviculture for timber and ecology.
• In Lesnes Abbey Woods, a suburban woodland in London the management intention is very different. With a rich history of management, high visitor pressure, and poor access there is a need to be highly focussed on which trees can come out and how best to maximise the value of them. It’s not necessarily knowing about total volumes, but about knowing species against diameter classes.
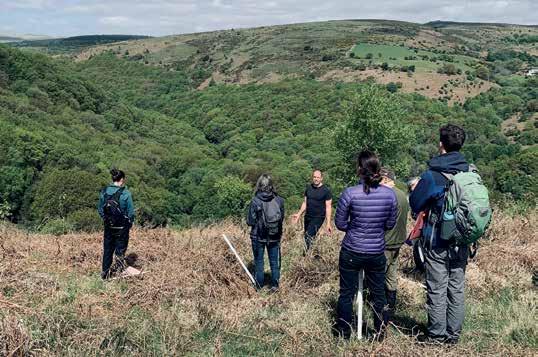
• In the unique estuarine oak woodlands of Devon the need for inventory isn’t about volumes but rather stem, canopy and understory condition. Here, tree-based inventory needs to mesh with ecological condition assessment where boundaries are blurred for instance between stem form for timber use and stem condition for trees approaching veteran status.
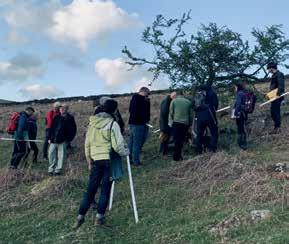
• Up on Dartmoor, our data gathering needs shift again. In an environment where you can walk half a day and only stumble upon one twisted hawthorn, geolocation for return surveying is vital, as is reliance on citizen science to cover large areas assessing individual tree health.
These are the modern worlds of inventory for us. Once unusual silvicultural systems that are rapidly becoming part of everyday forestry.
How do we measure?
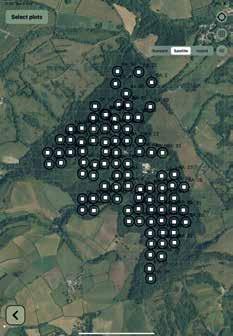
We first generate a sampling plan that is woodland rather than process focussed. We lay out an adaptable digital grid. If a stand is completely uniform, we can save time and money by sampling less intensively. If it is a complex riparian zone or CCF stand, we can choose to sample more intensely.

Using digital tools, we can easily alter sampling intervals or plot sizes as appropriate. With digital geolocation, we can return to plots, ensuring increased replicability and accurate monitoring of change over time and even increase frequency of plots if needed.
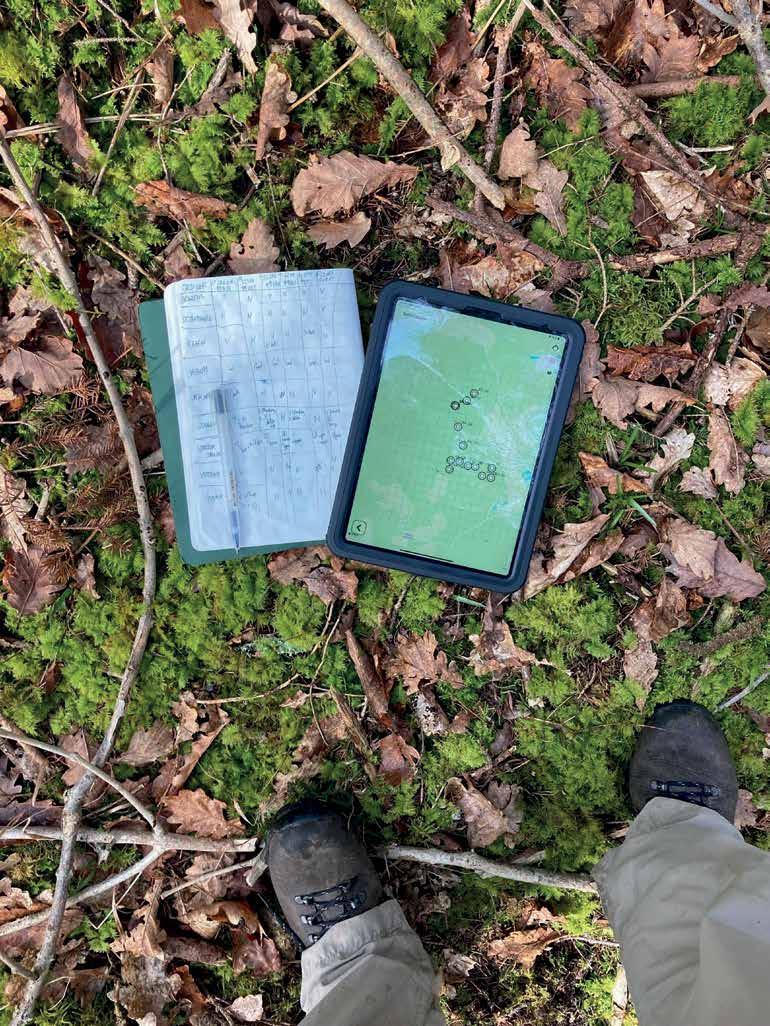
Our main tool for “normal” forest inventory is currently the Arboreal Forest app. Working best on iPhones and iPads with lidar capability, the app allows us to get everything needed for timber and stem assessment.
At each sample point Arboreal Forest allows us to set a centre point, and a radius for the sample plot. At each tree in the plot, we determine species, and the phone takes an accurate diameter. Venturing outside the plot radius, you are swiftly notified - no hung-up tapes in brambles. The app records height measurements and area results are given instantly as volume, stems/ha, basal area, and carbon stocks. The data can then all be downloaded back at the office.
It has transformed how we undertake inventory operations. It isn’t perfect, but then using a DBH tape is prone to mistakes and shortcuts too. It is many times cheaper than dedicated forest survey equipment and much faster than analogue inventory. Our feeling is that we get increased accuracy because of the number of plots and the larger areas we are now able to survey in the same amount of time.
Outside of the traditional forest we are surveying tree health in remote parts of Dartmoor with volunteers of mixed tech- continued on p36 continued from p35 nological ability. In this setting we are using the GIS Cloud app and have been able to collect data in dispersed woodpasture at pace.


We build the survey questions into the free app and volunteers download it onto their smartphone. Arriving at a tree a rapid health assessment is undertaken, a photograph snapped, and the app captures the location. This is repeated for each tree found and data, including images, are securely stored until the device is connected to the internet again.
Our next step with GIS Cloud is to use it in urban forestry. It has the ability to engage and involve people outside of forestry in tree health, simultaneously educate, and collect accurate geotagged data quickly.
Where does this all go next?
We are hoping to start work to integrate more apps and platforms into our work. Ideally, we foresee woodland management platforms linked by APIs (the bits that different bits of software use talk to each other in a vaguely intelligible way) within the next few years. The hope is that these that allow data collection from forest monitoring to be combined with digital mapping such as myForest


