2017 ANNUAL REPORT

1 Contents General information 2 Report from the Chair of Council 3 Meetings of Council 6 Vice-Chancellor’s Report on Management and Administration 11 Performance Assessment Report 16 Report on Corporate Governance 22 Council Statement on Sustainability 39 Report of the Audit and Risk Oversight Committee 41 Report on Internal Administrative/ Operational Structures and Controls 45 Report on Assessment of Risk Exposure and Risk Management 47 Report of the Chairperson of the Institutional Forum 49 Senate Report for 2017 51 Report on Transformation 67 Annual Financial Review 69 Statement of Responsibility for the Financial Statements 73 Approval of the Financial Statements 73 Report of the Independent Auditors 74 Statement of Financial Position 81 Statement of Comprehensive Income 82 Statement of Changes in Funds 84 Statement of Cash Flows 85 Notes to the Annual Financial Statements 87
General information
REGISTERED ADDRESS
PO Box 1906
BELLVILLE 7535
Tel: (021) 959 6911
BANKERS
ABSA
STANDARD BANK
AUDITORS
External Auditors
(Annual Financial Statements)
KPMG Inc.
1 Mediterranean Road
Foreshore
CAPE TOWN 8000
Tel: (021) 408 7000
Fax: (021) 408 7100
ATTORNEYS
Cliffe Dekker Hofmeyr Inc
11 Buitengracht Street
CAPE TOWN 8001
Tel: (021) 405 6066
Fax: (021) 405 6149
Adriaans Incorporated
16th Floor
2 Long Street
CAPE TOWN 8001
Tel: (021) 801 5240
Bradley Conradie
The Gatehouse – G04
Century Way
CAPE TOWN 7441
Tel: (021) 418 2196
Bisset Boehmke McBlain
4th Floor, 45 Buitengracht Street
CAPE TOWN
8001
Tel: (021) 441 9800
PHYSICAL ADDRESS
Administration Building
Symphony Road
BELLVILLE SOUTH 7530
WEBSITE ADDRESS
www.cput.ac.za
(Agreed Upon Procedures)
Ernst & Young Incorporated
35 Lower Long Road
CAPE TOWN 8000
Tel: (021) 443 0200
Fax: (021) 443-1462
Internal Auditors
NEXIA SAB&T Chartered
Accountants Incorporated
PO Box 12544 N1 City
Goodwood 7463
SAB&T House
Cnr Birmingham & Canterbury Road, N1 City
Goodwood 7460
Tel: (021) 596 5400
Fax: (021) 595 1024
Fairbridges Wertheim Becker
16th Floor, South Tower
Heerengracht Street
CAPE TOWN
8001
Tel: (021) 405 7300
Walkers
15th Floor Plein Park
Plein Street
CAPE TOWN 8001
Tel: (021) 464 1400
Fax: (021) 462 2256
Minde Shapiro Smith
Tyger Valley Office Park
Building No. 2
cnr Willie van Schoor and Old Oak Roads
TYGER VALLEY 7536
Tel: (021) 918 9037
Fax: (021) 918 9090
Norton Rose Fulbright
Norton Rose House
10th Floor
8 Riebeeck Street
CAPE TOWN 8001
Tel: (021) 405 1308
Fax: (021) 405 5515
Gunstons Block F, The Terraces
Steenberg Office Park
TOKAI 7945
Tel: (021) 702 7763
Riley Attorneys
212 Rosmead Avenue
Wynberg
CAPE TOWN 8001
Tel: (021) 797 7116
Fax: (021) 462 2256
2 A NNUAL R EPORT 2017
Report of the Chairperson of Council
Notable milestones saw the election of Honourable Thandi Modise, the Chairperson of the National Council of Provinces (NCOP) in Parliament, as the Chancellor of the University and her subsequent installation in September 2017. Hers marks the first appointment of a woman Chancellor of CPUT.
It is with a deep sense of gratitude and honour that I table this 2016/17 annual report.
This Annual Report is intended to provide pertinent information on the core business of the University, including the key strategic areas, as follows:
1. Teaching and Learning (refer to the Senate Report)
2. Research Excellence (refer to the Senate Report)
3. Fiscal Discipline (refer to the Annual Financial Review)
In so doing, it is imperative to first reflect on the contextual reality which has plagued the Cape Peninsula University of Technology (CPUT) and the higher education landscape in general.
The year 2017 was the third year in a row that the University experienced unprecedented student protests. In the years 2015 and 2016 the higher education sector as a whole, was adversely affected by students and workers’ protests, however in CPUT these were accompanied by violence that saw damages to property and threats to human life.
The Council and management, stood together during this turbulent period. The Council was compelled to intervene and continuously engaged with all relevant stakeholders to find a lasting solution and peace in the University. This culminated in the Council endorsing the establishment of a Rapid Response Task Team (RRTT) comprising of various stakeholders, including representatives from management, workers and students and was led by the Vice-Chancellor. The RRTT was intended to be a progressive establishment to find amicable and lasting solutions to the myriad of grievances raised by students and outsourced workers.
By early 2017 most of the critical resolutions of the RRTT were implemented. Most notably, the insourcing of workers. It was for that reason that the Council decided to request management to disband the RRTT as it also showed signs of unintended consequences for the Institution.
It must be mentioned that due to the number of student protests, the Council had convened a total of eleven (11) committees of Council, which number exceeded the total of four (4) legislated meetings and two (2) strategic planning sessions per year.
3
“ ”
All the meetings quorated and started on time, including the special meetings called at short notice. Almost all these meetings, in particular the special meetings, were specifically convened to deal with the #feesmustfall student and insourced workers’ protests. This demonstrated the commitment by Council in discharging their fiduciary responsibility of governing the University and in ensuring sustainability and continuity of education and learning in the Institutions.
Administrative and governance setback scenarios were however experienced, both at the Council and management level.
At the management level, the Vice Chancellor, Dr Nevhutalu was put on special leave since October 2016, with the appointment of Dr John Volmink as acting Vice-Chancellor. It was at the end of July 2017 that the Council realised that Dr Nevhutalu’s matter was taking longer than envisaged and that six (6) months had lapsed with Dr Volmink acting. Due to that consideration, the Council decided to appoint one of the Deputy Vice-Chancellors (DVCs), Dr Chris Nhlapo as the acting Vice Chancellor. The appointment of Dr Nhlapo was also motivated by the fact the interviews of witnesses that may have included the DVCs during the disciplinary hearing of the VC, were concluded, and therefore no interference was envisaged.
When the disciplinary case of Dr Nevhutalu dragged nonstop, this became detrimental to the administration as it created uncertainty amongst University stakeholders. He resigned at the end of September 2017 after being found guilty of misconduct. He tendered his resignation before the sanction was announced by the Chairperson of the Disciplinary Committee. The Council subsequently confirmed Dr Nhlapo as the acting VC until the position is filled.
It must be reported that the University is currently in the process of filling the position of a Vice Chancellor and the successful candidate is expected to assume duties by 01 September 2018 and at the latest, beginning March 2019.
At Council level, the former chairperson of Council, Mr Mbulelo Bikwani resigned in March 2017. Mr Bikwani has served as Chairperson of Council for a period of six (6) years and six (6) months, which was half way to the end of the second term. After his resignation, the Deputy Chairperson, Mr Thato Molaolwa was appointed as interim chairperson pending the substantive appointment of a Council Chairperson. The Council Meeting of June 2017, appointed Ms Nogolide Nojozi as Chairperson of Council for the remainder of the term, which expires on 31 August 2018.
Council also lost the services of one of the most committed and diligent members of Council, Ms Ruth Benjamin-Swales, who had served as the Deputy Chairperson of Council, Chair of the Finance Committee and Chair of the Audit and Risk Oversight Committee, albeit at different times, during her full tenure as Council member, when her term of office came to an end in December 2017.
Regardless of the challenges mentioned above, there are notable milestones that saw the CPUT gaining momentum in 2017.
One of these, was the election of Honourable Thandi Modise, the Chairperson of the National Council of Provinces (NCOP) in Parliament, as the Chancellor of the University and her subsequent installation in September 2017 was an occasion that was graced by the former Minister of Higher Education and Training, Dr Blade Nzimande, who delivered a keynote address. Hers marks the first appointment of a woman Chancellor of CPUT.
In the year 2017, CPUT also prides itself by having conferred Honorary Doctoral Degrees to two distinguished women activists, viz. Dr Mildred Lesiea, in the field of Public Management and Dr Marlene Le Roux, in the field of Education. Both women were bestowed
4 A NNUAL R EPORT 2017
“ ”
We recognize the support of staff and the non-protesting students, who used every platform available, to condemn the acts of violence, intimidation and harassment. Through their resilience, unwavering support and commitment, the University was able to fulfill all its academic activities.
their Doctoral degrees based on their indefatigable record of service to their respective communities.
Some of the key highlights included the following:
1. Pertinent decisions and resolutions on the provision of essential services to the student, in particular the maintenance of residences and improvement of student life on campus.
2. Far-reaching resolutions on labour matters, including being one of the few Universities to take a decision to insource workers in cleaning, security and gardens and grounds and toppingup their salaries.
3. The investment in upgrading the capital infrastructure of the University as well as to deal with the aftermath of the violence and destruction of property; sourcing of service-providers to secure the University property, staff and student.
4. Council has requested management to pursue a ‘wellness and conflict management education campaign’ that seeks to strengthen the working relations to “reclaim the soul and ‘brand CPUT’.
5. The University succeeded in finishing the year on the highest note by conducting the first ever summer graduation ceremony in December 2017, where more than 5000 graduates received their degrees, diplomas and certificates.
6. The unqualified Audit Report received by the CPUT during the financial year 2017 is one indicator of good and clean governance.
It is worth mentioning that in an endeavor to find sustainable healing solutions, to revive the relationship between the various structures within the University grossly affected by the violent protests, Council decided to set up a ‘Commission of Inquiry’ to be headed by a retired Judge. One of its mandated tasks is to come up with set recommendations on improvement of stakeholder management and relations. The ‘Yekiso Commission’ headed by Judge Yekiso has since been appointed. We are very optimistic that indeed this will bring permanent solutions to heal CPUT.
Part of the successes of 2017 are owed to the commendable support received from the Department of Higher Education and Training, in particular from the former Minister, Dr Blade Nzimande.
We also recognize the support of the majority of staff and the non-protesting students, who used every platform available, to condemn the acts of violence,
intimidation and harassment. Through their resilience, unwavering support and commitment, the University was able to fulfill all its academic activities.
Council expresses immense gratitude to the current acting Vice-Chancellor, Dr Chris Nhlapo, who took the reigns during height of the most vicious student protests, which gained momentum, particularly during his first few months in the acting position. He remains committed to his duties and continues to bring lasting and genuine peace to the University, and of course through the support of his executive management team, staff and students. We congratulate the Acting VC and his team on these efforts.
The Secretariat team under the leadership of the Registrar, has once again played its significant role by providing the secretarial and administrative support to Council and its committees. Their diligence ensured Council’s compliance to the statutes that govern the Institution at all times.
Finally, my sincere and profound gratitude goes to my fellow Council Members for their commitment, due diligence and perseverance, even during the most trying times. The Council’s diversity was its formidable strength. I sincerely thank these men and women for their resilience in dealing with matters in the best interest of the University, exercising independent judgment and making decisions without fear or favour.
Thank you.
NoGolIDE NojozI (MS) Chairperson of CPUT Council
5
A NNUAL R EPORT 2017
2017 MEETING DATES FOR COUNCIL AND COUNCIL COMMITTEES
6
COMMITTEES Time Jan Feb Mar Apr May Jun Jul Aug Sep Oct Nov Dec Selection Committee for Senior Appointments 10:00 26 20 10 17 22 23 Governance and Ethics 14:00 03 21 21 29 Human Resources 14:00 03 21 21 SP_07 SP_13 29 03 Physical Planning 10:00 10 05 04 06 Finance 13:00 10 SP_22 05 SP_28 04 24 IT Governance 10:00 17 26 11 02 Audit and Risk Oversight 13:00 17 26 11 10 Joint Audit and Risk Oversight and Finance 13:00 19 Student Services 14:00 24 24 03 03 Executive Committee 14:00 17 09 SP_18 18 SP_21 SP_17 10 Remuneration 12:00 17 Honorary Degree Award 14:00 20 23 Council 09:00 17:00 WS_20 SP_13 01 WS_23 24 SP_26 02 SP_03 SP_23 WS_24 25
2017 LIST OF COUNCIL MEMBERS INCLUDING MEETING ATTENDANCE
7
MEETINGS Council WS Council Sp Council EXCO Sp EXCO Audit and Risk Oversight Joint Audit and Finance Human Resources Sp Human Resources Physical Planning Finance Sp Finance Remuneration IT Governance Senate Governance and Ethics Student Services Quality Assurance and Risk Honorary Degree Award SSCSA Institutional Forum Council Member Council Committees ExCO Members Mr M Bikwani Chairperson of Council 1 Ms N Nojozi Finance Human Resources Governance and Ethics Chairperson of Council 2 3 4 2 3 1 4 1 2 3 Mr T Molaolwa Finance Institutional Forum Honorary Doctoral Award Search and Selection Deputy Chairperson of Council 4 1 3 2 2 1 1 6 Mr C Roos Governance and Ethics Remuneration Honorary Degree Award Chairperson: Governance and Ethics 3 3 3 2 3 1 3 2 Mr C Blair Remuneration Audit and Risk Oversight Human Resources Search and Selection Chairperson: Remuneration 4 2 1 2 1 3 1 4 1 1 Mr M Magida Human Resources Remuneration Search and Selection Chairperson: Human Resources 4 2 4 3 2 3 2 2 Ms x Limberg Student Services Physical Planning Search and Selection Chairperson: Student Services 1 1 2 1 1 1 1 Mr B Hadebe Physical Planning Human Resources Student Services Search and Selection Chairperson: Physical Planning 4 2 4 3 3 4 1 3 2 4 Ms N Dhevcharran IT Governance Audit and Risk Oversight Chairperson: IT Governance 4 2 1 2 3 3 1 4
2017 LIST OF COUNCIL MEMBERS INCLUDING MEETING ATTENDANCE
A NNUAL R EPORT 2017 8 MEETINGS Council WS Council Sp Council EXCO Sp EXCO Audit and Risk Oversight Joint Audit and Finance Human Resources Sp Human Resources Physical Planning Finance Sp Finance Remuneration IT Governance Senate Governance and Ethics Student Services Quality Assurance and Risk Honorary Degree Award SSCSA Institutional Forum Council Member Council Committees ExCO Members Mr K Patel Audit and Risk Oversight Finance Search and Selection Chairperson: Audit and Risk Oversight 4 2 1 4 1 Mr Z Fihlani Finance Chairperson: Finance 2 2 1 1 Dr J Volmink Ex-officio member on all Committees except AROC and Remuneration Acting ViceChancellor 2 2 1 1 2 1 1 2 1 2 1 1 2 Dr NS Nhlapo Governance and Ethics Audit and Risk Oversight Search and Selection Ex-officio member on all Committees except AROC and Remuneration 4 4 3 2 2 2 2 2 1 1 1 1 1 4 Ms R BenjaminSwales Audit and Risk Oversight Finance Search and Selection 3 1 2 1 4 1 3 2 Mr C Abner IT Governance Student Services 4 3 2 3 Prof H Ballard Human Resources Governance and Ethics Physical Planning 4 4 3 4 2 2 3 Mr I Higgins Finance Governance and Ethics 2 2 1 3 2 2 Mr C Kruger Physical Planning Student Services Senate Search and Selection 4 1 3 2 4
2017 LIST OF COUNCIL MEMBERS INCLUDING MEETING ATTENDANCE
9 MEETINGS Council WS Council Sp Council EXCO Sp EXCO Audit and Risk Oversight Joint Audit and Finance Human Resources Sp Human Resources Physical Planning Finance Sp Finance Remuneration IT Governance Senate Governance and Ethics Student Services Quality Assurance and Risk Honorary Degree Award SSCSA Institutional Forum Council Member Council Committees ExCO Members Ms B Mbomvu Audit and Risk Oversight Remuneration IT Governance Search and Selection 2 3 2 1 2 2 Mr MB Ngqentsu Quality Assurance and Risk Management Institutional Forum Human Resources 3 3 4 4 2 2 Ms A Pinn Human Resources 3 1 3 3 2 Mr S Ngxiza Honorary Degree Award Institutional Forum 3 2 3 1 2 Ms M Sadeck Finance Search and Selection 2 1 1 2 5 Prof A Staak Student Services Audit and Risk Oversight Search and Selection 4 4 3 4 Prof J Kioko 4 3 3 Prof D Burger 3 1 2 Mr P Mncamase Finance Governance and Ethics Student Services Institutional Forum Search and Selection SRC 4 2 3 1 3 1 1 Ms M Madikizela Physical Planning Student Services Institutional Forum SRC 4 3 4 1 1 2
MEMBERS OF COUNCIL JANUARY - DECEMBER 2017
Executive Management – 3 Members
Dr AP Nevhutalu
Vice-Chancellor
(resigned with effect from 28 September 2017)
Prof j Volmink
Acting Vice-Chancellor
(appointed with effect from 31 October 2016 to 31 July 2017)
Dr NS Nhlapo
Acting Vice-Chancellor effective from 01 August 2017 until the position is filled
Prof AP Staak
Deputy Vice-Chancellor: Teaching and Learning
Executive Management in attendance
Mr N Ntsababa
Registrar and Secretary of Council
Prof l Fourie
Deputy Vice-Chancellor: Knowledge, Information and Technology Services
Mr P du Plessis
Executive Director: Finance
Ms C Motale
Executive Director: Student Affairs
Ms S Sibanda
Executive Director: Infrastructure Development and Facilities Management
Dr o Mkhabela
Executive Director: Office of the Vice-Chancellor
(resigned with effect from 31 October 2017
Ministerial Appointees
Mr MB Ngqentsu
Prof j Volmink
(resigned with effect from 31 August 2017)
Ms N Nojozi
Chairperson of Council
(appointed with effect from 24 June 2017)
Mr C Kruger
Mr S Ngxiza
(appointed with effect from 02 February 2017}
MS N NojozI
Chairperson of Council
MR N NTSABABA Registrar
Council Appointees
Ms N Dhevcharran
Mr M Bikwani
(resigned with effect from 13 March 2017)
Mr z Fihlani
Mr K Patel
Mr C Blair
Ms R Benjamin-Swales
(term ended 31 December 2017)
Ms B Mbomvu
Mr I Higgins
City of Cape Town Appointee
Councillor X limberg
Donor Representative
Mr M Magida
Provincial Government Appointee
Mr C Roos
Senate Representatives
Prof j Kioko
Prof D Burger
(appointed with effect from 01 November 2017)
Academic Employee Representatives
Ms M Sadeck
(resigned with effect from 29 September 2017)
Prof H Ballard
Non-Academic Employee Representatives
Ms A Pinn
Mr C Abner
SRC Representatives
Mr P Mncamase
Ms M Madikizela
Convocation Representatives
Mr TV Molaolwa
Mr B Hadebe
10 A NNUAL R EPORT 2017
Vice-Chancellor’s Report on Management and Administration
The Institution acknowledges the loyal, dedicated and committed staff who, despite being victimized and in some cases harangued by protesters, have managed to end the 2017 year on time and without incident.
HIGHLIGHTS FOR 2017
The 2017 academic year was very challenging for CPUT due to the rolling protests. However, there were a number of positive highlights that included, but not limited to, the following:
December Graduation
Our inaugural summer graduation ceremonies were well attended and over 5 220 degrees and diplomas were awarded. These 5 220 graduates from six faculties were capped at 12 ceremonies, which included the conferring of 49 Masters and 10 Doctoral degrees over four days.
Graduation is a major highlight in an academic year and we were very pleased with such a big number of our students and their achievements that concluded 2017.
Installation of the Chancellor
The Hon. Thandi Modise was installed as the new Chancellor of Cape Peninsula University of Technology (CPUT) on the 14th September 2017. The Council and Convocation of CPUT were unanimous in accepting the
instalment of the National Council of Provinces (NCOP) Chairperson, Ms Thandi Modise, as the new and the first black female Chancellor of our University. She takes over the reins as the second Chancellor of CPUT from its inaugural Chancellor, Mr Trevor Manuel, our former Finance Minister. Mr Manuel held this position for two consecutive terms.
South Africa: CPUT Builds SA Space Satellite
The ZACube-2 mission is an initiative funded by the Department of Science and Technology (DST), the South African National Space Agency (SANSA), the National Research Foundation (NRF) and the Cape Peninsula University of Technology. Most of 2017 was spent on commissioning Zacube 2 for the send-off and launch in 2018.
Our technology partners include the CSIR, Stone Three, Stellenbosch University (CubeSpace), Astrofica, Luvhone, Etse, Spaceteq and Clyde Space. CPUT is playing a key role in Operation Phakisa. Operation Phakisa is an initiative of the South African government aimed at implementing priority programmes better, faster and more effectively.
11
The Satellite Programme has produced more than 60 postgraduate students to support the space industry and ultimately national imperatives like Operation Phakisa.
Research Report
I am pleased to report on the evaluation of the 2016 universities’ research output. The report indicates an upsurge in the number of units awarded to CPUT for subsidyearning research outputs in accredited journals, books, and conference proceedings published in 2016. CPUT is among the 11 Institutions whose 70-79% of their publications are in international indices. These indicators provided us with global exposure.
CPUT’s research output units for 2016 as per the DHET audit report received in December 2017 were 215.97 with an additional 8.91 that will be awarded with the 2017 units, an increase of 12.31 compared to the previous year. Our research output per capita increased to 0.27. For 2017 we have submitted a total of 264.83 output units which are currently undergoing auditing processes. Academic staff with doctoral qualifications increased from 24.9% in 2016 to 25.5% in 2017 with 49.2% of staff with Masters qualifications.
During 2017 CPUT was granted 11 NRF ratings of which 4 were upgrades, 3 were ratings retained and 4 were new additional ratings.
CPUT made 3 submissions for SARChI Chairs of which 1 was successful. CPUT recently received confirmation of the SARChI-NRF Research Chair in Cardiometabolic health.
Sports and recreation
CPUT performed very well in the Varsity Shield, and for the first year of participation they performed well and the entire community rallied behind our boys.
GENERAL OVERVIEW OF 2017
The 2017 year has not been without its challenges but I am pleased to report that significant inroads have been made in curbing the devastating effects of the #FeeMustFall protests which cast a shadow over the Institution for the years 2015 and 2016. The Institution acknowledges the loyal, dedicated and committed
staff who, despite being victimized and in some cases harangued by protesters, have managed to end the 2017 year on time and without incident. Inventive learning modules have been one positive outcome of the challenges presented by the protests. Lecturers who have excelled at keeping the academic project afloat are working with our Educational Technology Unit in the Centre for Innovation in Educational Technology
to share their best practice with the wider University community. An accelerated approach to online learning is also being emphasized
The academic year got off to a slow start as a result of catch up classes and delayed assessments. In March protests once again flared up when protesters demanded an extension to the registration period and raised residence grievances. A task team of management and residence staff worked intensely on the issues and the majority of students who were submitted for consideration for residence places were eventually placed after a thorough evaluation.
In July the Institution shut down for four days when issues related to insourcing saw violent and potentially dangerous damage to Institutional property, including the torching of an office in the Multipurpose Hall. The violence escalated a month later when the Institution suspended four student leaders. The disciplinary hearings for these four were held off campus and each hearing was met with significant police presence and protesting supporters. The hearing was eventually concluded in October and the external Chairperson’s sanction was suspended expulsions for all four - effectively meaning they could complete their studies provided they did not participate in any further disruptions.
In September 2017 one of the more heart-breaking casualties of the protest action was the torching of the 130 year old St Marks Anglican Church, which
12
NNUAL
A
R EPORT 2017
CPUT is among the 11 Institutions whose 70-79% of their publications are in international indices. These indicators provided us with global exposure.
is situated on the locale of the Cape Town campus. Executive Management along with the Chair of Council and the President of Convocation immediately engaged with the church elders. While tragic, the incident has assisted in forging closer bonds with the church and other religious Institutions in the vicinity, including the Zeenatul Islam Mosque and the Moravian Church. This has seen the Institution, with the backing of these religious leaders, agitate for stronger security in the greater District Six area. CPUT has also committed to educating our students about the District Six history. Stricter access control measures across campuses are implemented.
A much tougher stance on the incessant propaganda targeting the Institution is also taken. A press conference was hosted by Executive Management in October to clarify a host of misinformation on topics like private security and allegations of leadership instabilities. The event was well attended and covered by all major media houses. Regular communication from the Acting Vice-Chancellor’s desk also keep staff and students informed.
The annual Spring Graduation series was also a highlight of the month of September and in addition to this a mammoth December Graduation series also took place for the first time in CPUT’s history. Graduations are a momentous occasion on the CPUT calendar and is an endorsement of the excellent job being done by staff and students. They remain a symbol of long standing traditions and lift the spirits of all, whether they are directly involved or not. It goes without saying that the sanctity of our graduations is one which must be protected at all costs.
VC MATTER, SENIOR APPOINTMENTS AND HUMAN CAPITAL REVIEW
The 2017 year commenced with Dr John Volmink at the helm. Dr Volmink was asked to step off the Council in October 2016 and assume the role of Acting Vice-Chancellor while the disciplinary hearing of the then Vice-Chancellor Dr Prins Nevhutalu continued. Dr Volmink remained in the position until July 2017. Prof Marshall Sheldon was seconded to the role as Acting Deputy Vice-Chancellor: Research, Innovation and Partnerships and continues to act in that capacity.
My top priority after assuming the role of Acting Vice-Chancellor was to bring an immediate end
to protests and ensure the academic programme continued undisturbed. One of the measures included communicating regularly with staff and students, reaffirming the Institution’s stance that Executive Management will not engage on any platform with unregistered students, strengthening Institutional governance and ensuring a smooth transition in the complex Student Affairs portfolio following the retirement of the Dean Ms Cora Motale.
Sticking to these resolutions saw the 2017 academic year end on schedule with all assessments taking place within the normal period. As previously mentioned the inaugural December graduation was able to take place without incident and private security was significantly minimised. This could not have been possible without the enduring support of the management team and Council. The wealth of their Institutional knowledge and unwavering support has helped lessen the enormous load. For this I am very grateful.
The insourcing project has stabilized after initial issues with benefit demands. Dealing with the complex matter of the 900 additional insourced staff members remains a challenge but the Human Capital Department is confident that a resolution to this will be reached imminently.
ENROLMENT FIGURES
Student Enrolment figures for 2017 were slightly more than target as an actual 34 702 students enrolled when a target of 33 631 was forecast. A target of 9 315 for First Time Entering Undergraduate students was anticipated with an actual amount of 7 186 actually enrolled.
FEE FREE HIGHER EDUCATION
Ex-President Jacob Zuma’s announcement of Fee Free Higher Education in December 2017 did not see a flood of late applications and walk-ins as many expected. CPUT’s Financial Aid office has embarked on a marketing campaign to make students aware of appropriately applying for the grants available to them. This has proved to be a challenging exercise since many students are reluctant to sign the appropriate loan agreement forms. Making more students aware of the benefits of applying on time remains an ongoing exercise.
13
FINANCES OF THE UNIVERSITY
The finances of the University have been seriously challenged in 2017 and this has resulted in the University having to give serious consideration to all of its structures going forward. Specific focus has been placed on the reconstruction of the salary bill as the largest expense and the specific components thereof.
Clarity on the impact of Fee-Free Higher Education has resulted in a significant improvement in the financial position of the Institution at the end of 2017.
There are also cost containment measure put into place, including a serious focus on advancement and third stream income.
TEACHING AND LEARNING
The overriding academic goal for teaching and learning for the 2017 academic year remained the improvement of student success and throughput rates. In pursuit of this goal extensive use was made of the Teaching Development Grant (TDG) to fund a variety of initiative like the further studies of staff members as well as student support interventions like the appointment of tutors, mentors and teaching assistants. In student support a specific focus was placed on lecturers supporting these tutors to optimize the impact of tutorial sessions.
The status of teaching was enhanced primarily through Distinguished Teacher Awards that were introduced in almost every academic department at the University. This was supported by award ceremonies in the faculties and at the annual Research in Teaching and Learning conference organized by Fundani CHED. Some faculties organized Teaching and Learning seminars to share best practices in teaching and learning.
TDG funding was also used to appoint retention officers in each faculty to provide further support for at risk students.
The second phase of the Quality Enhancement Project also took place in 2017. The focus of the second phase of the project (QEP2) was on curriculum renewal and transformation, and a number of workshops on “decolonization of curricula” was organized in the faculties.
NEW HEQSF ALIGNED QUALIFICATIONS ADDED
During 2017 most faculties received CHE accreditation and SAQA registration for the introduction of new HEQSF aligned UG and PG qualifications. In addition, as at the end of 2017 the following qualifications were submitted to DHET for PQM clearance and subsequently submitted to CHE for accreditation clearance waiting to be finalised:
(i) 1 Higher Certificate;
(ii) 1 Advanced certificate;
(iii) 2 Postgraduate Certificates;
(iv) 1 Diploma;
(v) 21 Advanced Diplomas; and
(vi) 5 Bachelor Degrees.
These qualifications have been earmarked by the Institution as pivotal qualifications to ensure a progression route for students into postgraduate qualifications at the Institution. Some of the qualifications earmarked for submission to CHE in March 2018 also include Master’s degrees in engineering in niche research areas of the Institution which have been developed in collaboration with international higher education partners and related organisations. For example, the Master of Engineering in Satellite Systems and Applications was developed in partnership with French South African Institute of Technology (F’SATI) and other higher education partners in the Southern African region and the Master of Engineering in Electrical Engineering in Smart Grid was developed through the Erasmus+K2 DAMOC project.
RESEARCH, TECHNOLOGY AND INNOVATION
In July 2017, Dr Nhlapo became the acting ViceChancellor and was replaced with Prof Sheldon as the Acting DVC: Research, Technology, Innovation and Partnerships. At the end of 2017 the position of Director Strategic Initiatives and Partnerships was filled, which will now allow the Institution to focus on its strategic initiatives and regional, national, and international partnerships in line with the new DHET Policy Framework for Internationalisation of Higher Education.
CPUT supported its staff for international conference attendance to the value of R1 746 197; a total of 9 research exchange programmes were
14 A NNUAL R EPORT 2017
awarded to the value of R353 918; research running cost support was provided to the value of R1 570 292 mainly to emerging researchers; Prestigious Projects to the value of R3 million; and Postdoctoral fellows were supported to the value of R480 000. In
CONCLUSION
Rebuilding the physical and psychological soul of CPUT needs our focus now. Attention needs to be given to developing useful third stream revenue generation techniques. With this said, the Infrastructure, Development and Facilities Management department has an important role to play. Our buildings have always been popular venue hire options and with continued maintenance and easy booking processes this can be capitalised on more. One’s work environment has a key role to play in staff and student morale and the maintenance of our buildings, new and old, which have been ravaged by protests must remain a priority so that all are proud to call CPUT their employer and University of choice.
total the CPUT support to Research Technology and Innovation amounted to R13 582 722. Successful external research grants from the NRF to the value of R29 298 992 was obtained and research/postgraduate studies funding from external agencies amounted to a total of R61 408 930.
In terms of Commercialisation and Innovation
CPUT registered its own fully owned holding company namely Aonyx Holdings. Aonyx Holdings will hold equity in all of the CPUT spin-offs, startups, and commercialisation vehicles. Amaya Space, a new spin-off company, was created in December 2017. Amaya Space (Pty) Ltd is the first truly transformed space company, by Africans for Africans. This spin-off company is directed at commercialising CPUT’s technology related to nanosatellites. In addition, CPUT received its first ever TIA Technology Development Fund (TDF) grant in 2017 for the waste water reactor project.
The South African Government represented by DHET and DST identified CPUT as the Host Institution for the Pan African University Space Science Institute (PAUSSI). On 2 September 2017 Council gave in- principal approval for CPUT to Host PAUSSI. DHET and DST are currently in the process of finalising the Host Country and Host Institution agreements.
As we rebuild the actual buildings much must also be done in transforming the Institution’s brand in the public and business mind. This can be achieved by consistently marketing our successes and sharing the positive news that surrounds the staff and students of CPUT.
Working on internal relationships also requires much work. The filling of key vacancies should alleviate some of the frustration being felt by staff.
All of the above requires the commitment of all CPUT stakeholders, the University is already in an upward trajectory and we must maintain the course.
DR CHRIS NHlAPo Acting Vice-Chancellor
15
As we rebuild the actual buildings much must also be done in transforming the Institution’s brand in the public and business mind. This can be achieved by consistently marketing our successes and sharing the positive news that surrounds the staff and students of CPUT.
Performance Assessment Report
This performance assessment report for CPUT has been framed around and prepared in relation to the University’s Annual Performance Plan (APP) for 2017, as submitted to the Department of Higher Education & Training (DHET) in March 2017 in accordance with the requirements of the Regulations for Reporting by Public Higher Education Institutions.
The DHET’s Implementation Manual for Reporting by Public Higher Education Institutions notes that the University’s performance assessment report should refer to “the key performance indicators and targets as stated in the Annual Performance Plan” (Government Gazette, No 37726, 9 June 2014).
The 2017 figures contained in this report are drawn from the University’s HEMIS (Higher Education Management Information System) data source and are as at 20th March 2018. The HEMIS submission to DHET is the official record of the University’s data.

The following four sections, each containing a table with various key performance indicators (KPI) presenting targets and the actuals, reflect the performance of the University in meeting the academic performance targets set for 2017, as reflected in the Annual Performance Plan.
ACCESS
This performance indicator relates to the total number of unduplicated students enrolled for formal qualifications in a particular year. The student headcount enrolments are set in the university
16 A NNUAL R EPORT 2017
enrolment plan for (i) First-Time Entering Students in Undergraduate programmes, which are students enrolled for the first time at a higher education institution for an undergraduate programme; (ii) Foundation programmes, which are, students enrolled for the first time in foundation programmes;
(iii) Total headcount for Undergraduate and (iv) Total headcount for Postgraduate.
The Access performance indicator also provides a perspective of the University per Major Field of Study and student demographic profile, in terms of gender and population groups. Perhaps, it is worth mentioning that this indicator does not provide an exhaustive list of measures to assess University performance in its endeavor to increase access to education, but just some of the important measures.
The student population at CPUT, in terms of the total student headcount enrolments, is sitting at 34,702 during the reporting year of 2017. This represents an increase in our total enrolments compared to the past three years. The student enrolments during the 2017 academic year has exceeded the target of 33,631 headcounts set for the reporting period, as reflected on the 2017 Annual Performance Plan and the Student Enrolment Plan for 2014-2019. This represents a headcount excess of 1,071 or 3.2% above the set target, which is the opposite of the past three years where the target has been consistently not met.
It has been reported previously that the University’s main problems with regard to not meeting its targets are related to infrastructure development and HEQSF alignment of programmes, therefore, the revision of 2017 – 2019 enrolment targets to set more realistic targets given these challenges has yielded positive outcomes. This review of the enrolment plan was done in anticipation that the University will therefore be able to meet its targets from 2017 onwards, which is what has been confirmed for the current reporting year.
Although the University have met its overall enrolment targets for 2017, the sudden drop in first-
17
Calendar year 2014 2015 2016 2017 Performance Indicator Target Actual Target Actual Target Actual Target Actual A. Access (Enrolments) Student Headcount Totals 33 781 33 186 35 343 32 674 36 555 34 455 33 631 34 702 Foundation First-time Entering 1 290 1 141 1 295 1 211 1 295 1 297 1 158 1 075 First-time Entering Undergraduate 8 701 7 595 9 285 7 343 9 829 7 980 9 315 7 186 Headcount Total UG 31 592 31 233 32 491 30 757 33 255 32 346 31 938 32 426 Headcount Total PG 1 575 1 831 2 258 1 783 2 786 2 006 1 601 2 136 Enrolments by major fields of study 33 781 33 186 35 343 32 674 36 555 34 455 33 631 34 702 SET 16 008 16 329 17 185 15 920 17 911 16 213 16 179 16 227 BUS/MAN 10 275 10 944 10 522 11 147 10 762 11 549 10 605 11 552 EDUCATION 3 674 2 424 3 876 2 324 3 997 3 661 2 699 4 025 OTHER HUM 3 659 3 490 3 627 3 264 3 736 3 032 3 723 2 897 Demographic Profile % Female students 54% 54.2% 54% 54.1% 55% 54.6% 55% 55.0% % African students 56% 59.1% 56% 60.4% 55% 62.7% 59% 65.0% % Coloured students 28% 27.2% 28% 26.8% 29% 26.2% 28% 25.6% % Indian students 1% 1.2% 1% 1.1% 1% 1.0% 1% 0.9% % White students 14% 12.5% 14% 11.7% 15% 10.0% 12% 8.6%
time entering undergraduate students from 7,980 in 2016 to 7,186 in 2017 poses a serious challenge for the University moving forward, in terms of meeting its future targets. This indicates a shortfall of entire 2,129 or 22.9% below target for the current reporting year of 2017, as the target was set at 9,315 for 2017. The Extended Curriculum Programmes (ECP) or foundation programmes also experienced a shortfall of 7.2% during this period.
However, the University have met its targets for total undergraduate and total postgraduate enrolments for the reporting period.
For the 2017 reporting year, the University appears to have met all its targets set by the Major Fields of Study except for Other Humanities, where it fell short reaching only 2,897 instead of the set target of 3,723. It is also important to highlight that the overall objective of the University, in terms of its enrolment plan, is to grow SET (Science, Engineering, and Technology). This by implication means, due to the growing overall enrolment numbers going to 2019, the growth in the Faculty of Business and Management Sciences shall be capped. While this faculty has made serious strides to curb its growth, the demand on the other hand remains high, partly due to admission requirements in their programmes being less demanding than those for SET programmes.
It is therefore evident that while the total enrolments for SET in 2017 were well within the target set, the Business/Management field of study continued to exceed its target by entire 8.9% to reach
11,552 instead of the set target of 10,605.
Lastly, in terms of the students’ demographic profile, the proportion of female students has slightly gone up from that of the previous reporting year to reach the planned target of 55%. This is a great achievement and consistent performance given that the gender target was also achieved during the 2016 reporting year.
In terms of population groups, there is a continuing steady growth in the proportion of African students reaching 65% in 2017, while the proportion of Coloured, Indian and White students continues to decline.
SUCCESS
This performance indicator at the primary reflects on the number of students who successfully completed the requirements to be awarded an under- or a postgraduate qualification in a particular academic year. The output measure performance indicator is also monitored against the various scarce skills areas as identified by the Department of Higher Education and Training. At the secondary, the degree credit success rate (or pass rate) in this indicator measures the progression of students towards completion of a qualification, hence it takes into consideration the workload of a student in measuring student success. The degree credit success measure applies and can be monitored at the end of each semester or an academic year, therefore, it measures student progression at each level that a student is supposed to pass towards completion of a qualification.
18
NNUAL
A
R EPORT 2017
Calendar year 2014 2015 2016 2017 Key Performance Indicator Target Actual Target Actual Target Actual Target Actual
Success Total Graduates 7 559 8 227 8 051 8 342 8 637 8 483 8 090 9 116 Undergraduates UG 7 194 7 796 7 547 7 949 8 011 8 060 7 744 8 739 Postgraduates PG 365 431 504 393 626 423 346 377 Overall Degree Credit Success 79% 79.2% 79% 81.0% 79% 78.9% 81% 78.0% Degree Credit Success UG 79% 79.7% 79% 81.6% 79% 79.5% 82% 78.9% Degree Credit Success PG 54% 62.9% 60% 62.6% 64% 57.7% 54% 50.5% Success Rate by Fields of Study SET 76% 76.8% 76% 79.5% 76% 76.7% 80% 75.9% BUS/MAN 80% 76.8% 80% 78.3% 80% 76.2% 77% 75.0%
B.
The student protests that started in 2015 under the banner of the #FeesMustFall student movement continued through even after the #FeesMustFall movement was over, seeing them lasting until 2017 with some elements of criminality. These student protests shook the higher education sector as whole throughout the country having seriously disrupted year-end teaching, learning and assessments. The dedication of our academic and administrative staff and their will to see these years through in the best interest of our students as future leaders of our society, made CPUT to prevail under these very difficult circumstances.
It is our understanding that some of our students particularly those who were at the completion stages of their qualifications were not deterred by these protests, although they were all affected. The total number of graduates of 9,116 in 2017 is an attestation to this claim, making the University to exceed its target of 8,090 by 1,026 graduates or entire 12.7%. The under- and post-graduate graduates have also been exceeded, each reaching 8,739 and 377, respectively. It is therefore clear that the University have met and even exceeded its set graduates target.
It is the success rate (degree credit success) that shows immediate negative reaction to these protest actions by students, showing a decline from 81% in 2015 to 78.9% in 2016 and further down to 78% in 2017. For under- and post-graduate students, the University fell short to meet its set targets by 3.1% and 3.5%, respectively. Finally, none of the major fields of study have reached their set target, although the Education and Other Humanities success rates are high sitting at 91.2% and 81%, respectively. A conclusion can therefore be drawn, that, the University have not met its set success rate targets, in fact, the
trend from all perspectives in the success rates shows a decline.
Lastly, in as far as the output of undergraduate students is concerned in the scarce skills areas, it is in Engineering and Teacher Education that the University have exceeded its targets by 11.2% and 17.7%, respectively. On the other hand, Life and Physical Sciences; Animal Sciences; and Human Health have not met their targets.
EFFICIENCY
The efficiency performance indicator relates to what the University puts in place in terms of human resources to support efforts of excellence in the academic project. Firstly, it reflects on the headcount of instructional/research staff which are commonly referred to as the academic staff of the University, that are at the employ of the University to serve the academic project. All University staff are appointed either on a permanent or a temporary basis. Therefore, the headcount of the permanent academic staff include all academic staff appointed on a permanent basis who were in service for any period during the year from 1 January to 31 December.
This indicator further looks into the ratio of permanent instructional/research staff as FTE against students to give an indication of a number of students against an academic staff member. The proportion of permanent academic staff whose highest qualification are a Master’s degree or a Doctoral degree is also indicated in this indicator. Lastly, academic staff undergoing staff development through NGap are also indicated in this indicator.
19
Calendar year 2014 2015 2016 2017 Key Performance Indicator Target Actual Target Actual Target Actual Target Actual EDUCATION 86% 92.8% 86% 92.6% 86% 92.3% 94% 91.2% OTHER HUM 83% 82.5% 83% 83.7% 83% 81.7% 84% 81.0% Undergraduate Output by Scarce Skills Engineering 1 292 1 356 1 366 1 301 1 680 1 292 1 272 1 415 Life and PhysicalSciences 426 522 439 506 434 450 444 441 Animal Sciences 14 3 15 2 15 1 2 1 Human helath 658 689 721 686 750 628 684 633 Teacher Education 651 718 693 705 707 791 734 864
The number of permanently employed academic staff during the reporting period of 2017 is sitting at 843, which has not really increased from the 842 staff members of 2016. The 2017 number of permanently employed academics is falling short to meet the set target by 12 staff members, which is a shortfall of 1.4%.
The proportion of permanently employed academic staff with doctoral qualifications continues to grow, from 20.0% in 2014 to 24.9% in 2016 and 25.5% in 2017, however this growth is still below the target of 31.0% for 2017.
The growth on the proportion of permanent academic staff with Masters to 49.2% in 2017 indicates that there is a greater opportunity for the University to further grow the proportion of staff with doctoral qualification to the desired targets moving forward. The University have therefore exceeded its target on the permanently employed academic staff with Masters by 7.2% in 2017. The growth in both staff with Masters
and Doctoral qualifications is a clear indication that there are efforts that are being exerted to improve staff qualifications across the board, meaning that, there is a huge decline in the proportion of staff with qualifications below Masters.
Lastly, the full-time equivalent (FTE) ratio of students to staff is slightly off target by only 0.2 and is reported to be at 23.6 for the current reporting year of 2017 instead of the required target of 23.4.
RESEARCH OUTPUT
This indicator reflects part of the research outputs of the University, viz. the approved publication units generated by journal articles, books or book chapters, and conference proceedings. Excluded from this indicator are research units generated by the research component of the master’s and doctoral degrees that the University awards to students.
20 A NNUAL R EPORT 2017 Calendar year 2014 2015 2016 2017 Key Performance Indicator Target Actual Target Actual Target Actual Target Actual D. Research Report Publication Units 146 172 151 213 155 238 262 265.39 Publication Units per Permanent Instr./Res. Staff 0.19 0.22 0.19 0.26 0.19 0.26 0.31 0.31 Masters Graduates (Research only) 109 121 122 137 149 166 150 93 Doctoral Graduates 14 17 16 19 19 17 19 17
Calendar year 2014 2015 2016 2017 Key Performance Indicator Target Actual Target Actual Target Actual Target Actual C. Efficiency Instructional/ Research Professional Staff Headcount of Permanent Instr./Res. Staff 785 774 813 807 835 842 855 843 FTE Permanent Instr./Res. Staff 1 003 1 013 1 039 1 063 1 068 1 086 1 093 1 095 % Staff with Doctoral Degrees 14% 20.0% 14% 23.2% 14% 24.9% 31% 25.5% % Staff with Masters Degrees 44% 48.1% 44% 47.8% 44% 47.7% 42% 49.2% Number of nGap Staff 6 4 4 4 7 FTE Ratio of Students to Staff 24.8% 24.2% 24.8% 22.9% 24.8% 23.7% 23.4% 23.6%
The final audited University figures for research publication units as pertaining to journal articles, are available at the time of writing this report unlike in previous years. These publication units are as submitted to the DHET. The presented publication units figure of 265.39 for 2017 also comprise of 25.78 units generated from journals published in 2016 that were not submitted and subsequently claimed from DHET during 2016. This total is also made up of 206.77 units generated from journal articles and 58.62 units generated from books, book chapters and conference proceedings of which the latter has not been tested through an audit.
The presented 2017 publication units figure is above the 2016 research publication units by 27.39 units. Although, the 2017 research publication units have increased from that of 2016, they are also above the set target by 1.3%. With all that mentioned, it is however important to also note that the 2017 target set by the University for itself is much higher compared to the targets set for the previous years, which the University has managed to exceed once again.
Perhaps, the publication units per permanent academic staff may also provide a different, a better perspective and probably a more stable performance indicator at this stage given these high variations on the research publication units targets due to the mid-term review. These are currently sitting at 0.31 for 2017 reporting year, up from 0.28 in 2016. The target for 2017 was set at 0.31 for this performance indicator, meaning that, no matter what perspective one looks at this indicator, the University has met its research publication units target for the current reporting year.
Finally, the research Masters and Doctoral graduates both fell short to reach the target by 38.0% and 10.5%, respectively. The Master’s graduates are sitting at 93 instead of the targeted 150 graduates and Doctoral at 17 instead of 19 graduates.
SUMMARY
It is therefore the conclusion of our performance assessment on access performance measure that the overall headcount enrolment targets for the reporting year were met, in fact, it was exceeded by 3.2%. However, the enrolment target for first-time entering
undergraduate students was not met, the Institution fell short by 2 129 students which translates to 22.9% below target.
On the success performance measure, CPUT has exceeded its graduate targets by 12.7% which translates to 1 026 graduates. This is also the case for both undergraduate and postgraduate programmes where graduate targets were exceeded by 12.8% and 9.0%, respectively. The degree credit success targets on the other hand have not been met, the Institution was 3.6% below the target.
On efficiency performance measure, the headcount of Instructional/Research Professional Staff has currently fallen short from target by 12 headcounts. While the percentage of staff with Doctoral Degrees is at 25.5% instead of 31% target, the percentage of staff with Masters Degrees is currently sitting at 49.2% beyond the 42% target.
Finally, on the research output measure, the Institution has reached its target on the research publication units sitting at 265.39 as against the target of 262 and also the target of 0.31 for publication units per Permanent Instr./Res. Staff has been reached. The Institution has, however, not reached the graduates target for Masters and Doctoral qualifications.
NoGolIDE NojozI (MS) Chairperson of CPUT Council
DR CHRIS NHlAPo Acting Vice-Chancellor
21
Report on Corporate Governance
1 INTRoDUCTIoN
The Cape Peninsula University of Technology Council and Management are guided by the following Strategic Plan 2020 Vision, Mission, Strategic Aims and Shared Values:
Vision
To be at the heart of technology education and innovation in Africa.
Mission
• We will build a University that is highly efficient, sustainable and environmentally conscious
• We will be known for the high quality of its teaching and learning and the relevance of our curriculum
• We will strive to create a vibrant, enabling and well resourced living and learning environment for its students
• We will enhance and develop the quality and effectiveness of its research and knowledge production
Strategic aims
Strategic Aims
Sustainability and Efficiency
Curriculum
Teaching and Learning
Student Experience
Research and Innovation
Values
Ubuntu
Mutual Respect
Equity
Innovation
Accountability
Excellence and Efficiency
2 STATEMENT oN CoRPoRATE GoVERNANCE
The following statement is made to assist readers of the audited financial statements to gain an understanding of the governance procedures applied by the Council of the Cape Peninsula University of Technology (CPUT) (hereinafter referred as “the University).
The University is firmly guided by the Higher Education Act, Act 101 of 1997 (as amended), supplemented by its Statute, in governing the University as well as application of governance principles, protocols and practices. The Council has also embraced and adopted King IV Corporate Governance principles and applied the principles contained in the King III Report towards the year under review. The University also took cognizant of the new Higher Education Amendment Act that has far reaching implication for future governance, management and administration of Universities.
22 A NNUAL R EPORT 2017
The University is committed to the principles of ethical and effective leadership, sustainable development, effective control and stakeholder inclusivity and responsiveness, as advocated in the King IV Report. During the period under review, the Council adopted and consistently emphasized the application of the Code of Conduct for Council and Committee members, the Policy on Conflict of Interest for Council members as well as the Council Charter.
The application of and compliance with the Higher Education Act, Statute and King IV recommendation and principles is monitored by the Audit and Risk Oversight Committee of Council. The application and compliance with the Code of Conduct for Council and Committee members, the Policy on Conflict of Interest for Council members as well as the Council Charter is monitored by the Governance and Ethics Committee of Council.
efficiently. In areas where there is a deficiency of the requisite skills and competencies, Council has, through the Governance and Ethics Committee, appointed external people to serve on relevant Committees without being Members of Council. The principles of stakeholder inclusivity is provided through the internal membership, which comprises staff and student of the University and ensure that the needs, expectations and perspectives of the all the stakeholders are considered in decision-making process at the governance level.
4 CoUNCIl AND CoMMITTEES oF CoUNCIl
The Council of the Cape Peninsula University of Technology (CPUT), is established in terms of, and its functions prescribed in Section 27 of the Higher Education Act, Act 101 of 1997 (as amended) supplemented by Section 17 of the CPUT Statute (gazette on 17 May 2010, No. 33202.
During the period under review, the former chairperson of Council, Mr Mbulelo Bikwani resigned in March 2017 after serving as Chairperson of Council for a period of six (6) years and six (6) months. The Deputy Chairperson, Mr Thato Molaolwa, was appointed as interim chairperson pending the substantive appointment of a Council Chairperson. At the Council meeting in June 2017, Council appointed Ms Nogolide Nojozi as Chairperson of Council for the remainder of the term, which expires on 31 August 2018.
The strength of the current Council has been its diversity of membership in respect of backgrounds, culture, gender, expertise, skills and competencies. Council appointed members to various Council Committees based on their area of expertise and competencies relative to the Terms of Reference of a particular Committee of Council, which ensured that the CPUT has the requisite expertise to run a complex Institution
The Council is guided by the above legislations and is directed by the University Strategic Plan (Vision 2020) as well as the Annual Performance Plan in its governance function. The Chairperson of Council helps the Council to focus on its mission and strategic objectives through four quarterly ordinary Council meetings, supplemented by at least two Council Strategic Planning Sessions each year. The first Strategic Planning Session normally scheduled in June of each year considers the mid-term performance review and consideration of the budget, linked to the strategic objectives, for the following year. The end of the year Strategic Planning Session considers the final performance assessment and approval of the performance plan for the following year. In these Strategic Planning Sessions, the core business of the University, that is, teaching, learning and community engagement, is placed at the forefront of the Council agenda,
The Senior Management under the leadership of the Vice-Chancellor oversees the everyday running of the University and reports and accounts to the Council on the University operations. There is a clear separation of roles between the Chairperson of Council and the Chief Executive Officer, the Vice-Chancellor, which is expressly indicated in the Council Charter as well as in the Code of Conduct for Council and Members of the Council. The Council Task Team Report, endorsed by Council in 2016, on the relationship between the Chairperson of Council and Vice-Chancellor as well as on the diverse and complementary roles and responsibility of the two officials is also used a point of reference by Council.
23
3 CoUNCIl
As promulgated in the Sections 27 (6) and Section 18 (2) of the Higher Education Act, Act, Act 101 of 1997 (as amended) and the CPUT Statute, respectively, 60% of Council are neither employees nor students of the University. Therefore the majority (60%) of Council members are external and the rest is made of executive managers and internal constituencies as contemplated in above mentioned legislations.
Although the Council comprises representatives who are elected, designated or appointed from various external and internal structures, it operates as a unitary structure, and not a constituency based one. The demographics of South Africa, including gender, youth and disability were considered in relation to the composition of the Council, as prescribed in the Policy on Appointment of Council members. The composition of the Council reflects the responsibilities that are vested in the Council and the duty that it has to discharge and perform as representative body of the interests of the University’s stakeholders and relevant external stakeholders.
The Council is authorised by the CPUT Statute to establish committees, in which Council members play an important role, to assist it in the execution of its duties, powers and authorities. The Council delegates to each of the committees established, such authority as is required to enable such committees to fulfil their respective functions. The Council meets four times a year, and received quarterly reports, recommendations and advise on various issues from the following standing Committees of Council:
Each of these Council Committee is chaired by an external member of Council. In constituting the new Committees, the Council ensured that the majority of members who serve on these Committees are members who are neither employee nor students of the University. All the committees were fully constituted with the terms of reference that are reviewed annually. The list of Council and Council committee meetings, including the composition of each committee, length of service of each member as well as their respective attendance at those meetings is attached on page 6 of the Report.
During the year under review, Council set a record of meeting eleven (11) times as follows:
i) Four (4) Council regular meeting, as prescribed in the Act and CPUT Statute
ii) Four (4) special Council meetings
iii) Three (3) Strategic Planning Session.
All the above meetings and strategic planning sessions were quorate and held on time, Council members lost their leave days from their place of employment and for some, critical time for their businesses, in order to attend to the University business. The majority of these meeting, particularly the special meeting, were specifically convened to deal with the remnants of the previous year’s #feesmustfall student protest as well as the student and insource workers protest, which started at the beginning of the third quarter during the year under review. The attendance rate showed the commitment and pledge to the University business and their stewardship. Council members were not paid for this extraordinary commitment besides the stipend that covers incidental expenses. The University, through the Council intervention, was able to conduct and finalise its academic activities every year.
The following are some of the strategic matters that we considered by the Council, specifically at the Special Council meetings:
a) The nomination, election and appointment of Honourable Thandi Modise as the Chancellor of the University, becoming the second and the first female Chancellor.
b) The immediate implementation of the Council decision on insourcing of workers and issuing of contracts to insourced workers.
24 A NNUAL R EPORT 2017
1) Executive Committee of Council, 2) Governance and Ethics Committee 3) Audit and Risk Oversight Committee 4) Finance Committee 5) Human Resources Committee 6) Physical Planning Committee 7) Student Services Committee 8) IT Governance Committee 9) Search and Selection Committee for Senior Appointments 10) Remuneration Committee.
c) The consideration of the final Council Task Team Report on the disciplinary case of former Vice-Chancellor, Dr Nevhutalu’s and sourcing of the legal opinion based on the outcomes of the disciplinary case.
d) The appointment of the acting ViceChancellor to temporary fill the vacant position as a result of the resignation of the former Vice-Chancellor, Dr Nevhutalu.
e) The approval of the terms of reference of the Commission of Inquiry to investigate the allegations of the breakdown in the relationship between the University structures.
f) The decision for the University to steps-up its communication machinery by proactively countering all the false narrative propagated by the protesting students, as well as rogue and criminal elements who were acting against the University management and Council during protests during the last quarter of the year;
g) The decision for the Management to expedite the implementation of the joint cooperation between CPUT, City of Cape Town and Provincial Law enforcements urgencies to root out the rogue and criminal elements within the University.
h) The extension of the term of office of SRC since the SRC elections could not be held during the year under review due to student and insourced workers’ protest.
i) Non-disclosure of the Conflict of Interest by one of the Council members, establishment of the Code of Conduct Committee to deal with the matter and the subsequent sanctioning of the member based on the recommendation of the Committee.
j) The development of a Student Service Charter to serve as a reminder of the oath taken to serve as student leaders
k) The review and amendment of the SRC Constitution, particularly on reshufflement and disbandment of the SRC based on the established criteria.
The Council had to deal with leadership and management matters that had the potential of affecting the functioning of Council as well as proper management and administration of the University by appointing interim executive management members in critical and crucial
position until the positions were substantively filled, such as the acting Deputy Vice-Chancellor: Research, Innovation, Technology and Partnerships (RITP) as well as the acting Dean: Faculty of Engineering.
The information below provides an outline of the roles and responsibilities of each Committee of Council as well as the matters dealt with and discharged by each committee during the year under review:
4.1 The Executive Committee of Council (EXCo)
This Committee of Council consists of the Chairperson of Council, Deputy Chairperson of Council, Chairpersons of all Committees of Council and the Vice-Chancellor. The mandate of the Committee is to:
a) Conduct such matters, generally deemed to be of an urgent nature, as is necessary between meetings of Council, and conduct such specific matters, and with such authority, as is delegated to it by the Council.
b) Consider and make recommendations on any aspect of standing resolutions of the Council and of the Statute and Regulations of the University (existing and new), and on such other matters referred to it by the Council or the Vice-Chancellor.
c) Review and set agendas (annual work plan) for Council meetings and for annual Council Planning Sessions in consultation with executive management.
d) Propose the Council annual business plan, including setting annual objectives and targets in consultation with executive management for submission to Council for approval.
e) Identify priority issues consistent with the business plan and Council resolutions.
f) Receive and review on a quarterly basis progress against agreed Institutional objectives and targets.
g) Review with executive management any corporate legal action (other than normal operational legal action),
25
any significant litigation, claim or contingency which could have a material effect on the going concern of the University, and bring such matters to the immediate attention of the Council.
h) Plan and develop the ViceChancellor’s annual contract based on the mutually agreed goals approved by the Council in the ViceChancellor’s annual objectives and the expectations set out in the ViceChancellor’s job description.
i) Review the performance of the ViceChancellor on behalf of the Council. The final results of the evaluation shall be documented by the Chair and acknowledged by the Vice-Chancellor and the Council.
During the year under review, considered and recommended to Council the following matters:
(i) The submission a written report to Council via EXCO on the status and progress made by the Rapid Response Task Team (RRTT), set up by Council based on the recommendation from Management to implement of the Management and Stakeholder agreement, on the implementation of the resolution as well as to ascertain whether the RRTT operated within its mandate as well as non-compliance matters. The above report was never submitted during the period under review and until the former acting Vice-Chancellor, Dr Volmink, stepped down from his acting position and resigned as a member of Council.
(ii) The monitoring of the activities towards the installation of the new Chancellor, Honourable Thandi Modise, and the planning of the farewell function for the former Chancellor, Mr Trevor Manuel.
(iii) The consideration and approval of the Mid-term Report on the 2016 Annual Performance Plan, on behalf of Council, and the ratification thereof at the next regular Council meeting.
(iv) The consideration and approval of the 2017 Annual Performance Plan, on behalf of Council and the ratification thereof at the next regular Council meeting.
(v) The extension of the contract of the former acting VC, Dr Volmink, on a month-to-month basis, until the disciplinary process against the former VC, Dr Nevhutalu, was concluded.
(vi) The proposal that the re-naming ceremony of the Cape Town Campus to District Six Campus be held on the Heritage Day, that is, 24 September 2017 at the Cape Town Campus. However, the event was postponed to 2018 due to a number of factors, the main being the difficulties experienced during the third quarter of 2017.
Besides the above matters, EXCO on behalf of Council extensively and adequately dealt with and finalised the termination of services of the former acting Vice-Chancellor, which was based on mutual agreement and discussions as well as the handover from the previous to the new acting Vice-Chancellor that assumed the acting duties with effect from 01 August 2018. EXCO also on behalf of Council dealt with the correspondence from the Minister of Higher Education and Training on the issue of the appointment of Dr Volmink as the acting Vice-Chancellor while serving on Council as Ministerial Appointee as well as the request for a progress report and detailed explanation of the disciplinary case against the former Vice-Chancellor. EXCO, through the Chairperson of Council provided the necessary explanation and progress report on case against the former VC.
4.2 Physical Planning Committee
The main responsibility of the Committee is to consider recommendations from management on Institutional infrastructural development plan and the development of a campus master plan as well as the following:
(i) Policy and procedure formulation
(ii) Accommodation Planning
26 A NNUAL R EPORT 2017
(iii) Project Planning
(iv) Service Level statements
(v) Property Investment Strategy
(vi) Funding Proposals for infrastructure development
The Committee and made the recommendations to Council on the following matters via the Finance Committee of Council:
a) The setting aside of reinstate areas that were damaged during 2016 #feesmustfall protests, subject to the reimbursement by the Insurance Company.
b) The provision of funds for CPUT contribution to the specific DHET funded project.
c) The development of a Security Implementation Plan to ensure that the Security Access Control was implemented according to priorities and necessary oversight.
d) The implementation of a CCTV and access control system across the CPUT owned residence with the first phase being piloted at the Bellville Campus.
e) The set aside funds for the completion of the Chemical Engineering Building Phase 2 at the Bellville Campus.
4.3 Finance Committee
In the previous year, the Committee had a difficult time of ensuring that a break-even budget for the following year (2017) was presented to Council for approval. During the year under review, the Committee, based on the resolution of Council in 2016, revisited the 2016 budget and recommended to Council a revised 2017 budget. However, during the year under review, the Committee subsequently submitted a budget with a deficit to Council for approval of the year under review.
Once again, based on the government announcement on the capping of 2018 fee increases to 8%, the Committee recommended an 8% fee increases for 2017 out of 15% that was required for a break-even budget. Council, based on the
Committee recommendations, mandated management to come up with a plan on cost-saving measures to ensure the long term sustainability of the University and optimal provision of quality services.
The Committee considered and made recommendations to Council on the following matters:
i) Committee recommended for an amount of R4 million to reinstate areas that were damaged during 2016 #feesmustfall protests, subject to the reimbursement by the Insurance Company.
ii) The provision of CPUT contribution of an amount of R27,5 million for the following DHET projects:
a) New Engineering Building - R 13 million
b) Security Access Control - R 10.5 million
c) Maintenance Backlog - R 4 million
iii) The development of a Security Implementation Plan to ensure that the Security Access Control was implemented according to priorities and necessary oversight.
iv) The recommended amount of R 11 482 689 for implementation of a CCTV and access control system across the CPUT owned residence with the first phase being piloted at the Bellville Campus.
v) The recommendation of the Committee for the payment of the special security expenditure amount of R 77 million subject to a memorandum explaining in detail the expenditure items submitted to Council members.
vi) The Committee recommendation to set aside an amount of R35 633 253 for the completion of the Chemical Engineering Building Phase 2 at the Bellville Campus.
vii) The staff and Transport tender
viii) The leases for student residences
ix) The Incorporation of the WCCN into CPUT, subject to the Executive Management continuing the engagements and negotiations with the Western Cape Government and progress report in relation to infrastructural maintenance and leasing of buildings.
27
The Committee further ensured that acceptable accounting systems were adhered to through the design and use of appropriate Policies.
4.4 Audit and Risk oversight Committee
The Audit Committee and Risk Oversight Committee is chaired by an independent member of Council who is neither an employee nor a student of the University. The Committee has a minimum of five Council members. Council, through the Governance and Ethics Committee, appointed three independent external members with the requisite skills, experience and qualifications to serve on the Audit and Risk Oversight Committees of Council. The Committee has the following specific responsibilities:
a) Internal Audit
The Committee is responsible for overseeing of internal audit, and in particular, the Committee must:
i. be responsible for the oversight of the appointment, performance assessment and/or dismissal of the internal audit service provider;
ii. review and approve the annual internal audit plan and audit charter;
iii. receive feedback on the outcomes of internal audits that have been performed;
iv. be informed on the risk management and corporate governance practices as assessed by internal audit;
v. ensure that the internal audit service is subject to an independent quality assurance review every five years and complies with the Institute of Internal Auditors’ International Professional Practices’ Framework;
vi. ensure that there is a formal process of follow-up of significant findings and that Internal Audit reports on non-implementation of agreed management actions or delays in implementing remedial actions;
vii. review and resolve significant differences between management and internal audit;
viii. obtain assurance on the independence of the internal audit service;
ix. review the internal audit service budget on an annual basis
x. recommend the appointment of internal and external auditors to Council and subsequently to the Auditor-General’s Office for confirmation of the appointment.
b) External Audit
The Committee is responsible for recommending the appointment of the external auditor and to oversee the external audit process and in this regard, the Committee must:
i. oversee the external auditor for appointment process by management as aligned with the practical implementation of the Public Audit Act;
ii. approve the terms of engagement and remuneration for the external audit engagement;
iii. monitor and report on the independence of the external auditor in the annual financial statements;
iv. define a policy for non-audit services provided by the external auditor;
v. approve the contracts for nonaudit services to be rendered by the external auditor;
vi. ensure that there is a process for the audit committee to be informed of any Reportable Irregularities (as identified in the Auditing Profession Act, 2005) identified and reported by the external auditor; and
vii. review the quality and effectiveness of the external audit process.
c) Risk Management oversight and Internal Controls
The Committee is an integral component of the risk management process and specifically the
28 A NNUAL R EPORT 2017
Committee must:
i. Oversee the development and annual review of a policy and plan for risk management to recommend for approval to Council.
ii. Monitor implementation of the policy and plan for risk management taking place by means of risk management systems and processes.
iii. Make recommendations to Council concerning the levels of tolerance and appetite and monitoring that risks are managed within the levels of tolerance and appetite as approved by Council.
iv. Oversee that the risk management plan is widely disseminated throughout the University and integrated in the day-to-day activities of CPUT.
v. Ensure that risk management assessments are performed on a continuous basis.
vi. Ensure that frameworks and methodologies are implemented to increase the possibility of anticipating unpredictable risks.
vii. Ensure that management considers and implements appropriate risk responses.
viii. Ensure that continuous risk monitoring by management takes place.
ix. Liaise closely with the internal auditors and management to exchange information relevant to risk.
x. Express the Committee’s formal opinion to Council on the effectiveness of the system and process of risk management.
xi. Review reporting concerning risk management that is to be included in the annual report for it being timely, comprehensive and relevant.
xii. Oversee financial reporting risks, internal financial controls, fraud risks as it relates to financial reporting and general IT risks.
xiii. Ensure that a combined
assurance model is applied to provide a coordinated approach to all assurance activities to address all the significant risks facing CPUT and to monitor the relationship between the various internal & external assurance providers.
d) IT Governance
i. The Committee must ensure that the IT risks are adequately addressed and receive appropriate assurance on controls and to consider the impact of IT in relation to financial reporting and on significant operational activities.
ii. The risks that CPUT faces by virtue of its use of IT, as well as the associated controls used to mitigate those risks, should be assessed and clearly placed in an organizational-wide risk management framework. This framework should be periodically reviewed and a discipline of continuous auditing must be considered to provide assurance on these controls to provide greater coverage and efficiency.
e) Fraud and litigation
i. The Committee receives reports on matters of fraud and the results of forensic investigations into cases of fraud. It will also consider management’s actions in dealing with these cases of fraud and receive assurance from management with regard to the compliance with relevant legislation regarding the incidents of fraud and actions to recover monies and assets.
ii. The Committee will also receive feedback on CPUT’s fraud risk profile.
iii. Management will also provide feedback on areas of litigation that pose a risk to CPUT in terms of financial impact and/or reputational consequences.
29
f) Compliance with Laws and Regulations
i. Management will provide AROC with regular updates on CPUT’s compliance with laws and regulations.
ii. Independent assurance will be provided by the internal and external auditors based on their annual audit coverage plans.
The Committee worked closely with the Finance Committee to jointly recommend the 2015 Annual Report, Financial Statements and the Auditors’ Reports to Council. Its monitoring responsibility was mainly executed through the work of Internal and External Auditors made up of practitioners from independent and accredited auditing companies. The Internal and External Auditors have unrestricted access to the Committee and attend all the meetings of the Committee, which are held at least four times a year. The ViceChancellor attend all meetings as an observer. Executive members of management as well as the Director: Internal Audit also attend all the meetings of the Committee in advisory capacity in order to respond to pertinent questions on their respective areas of responsibilities in respect of auditing findings and risk matters. The Office of the AuditorGeneral has a representative who also attends the Committee meetings on regular basis.
During the year under review, the Committee considered the reports of Internal Auditors as per the approved Annual Internal Audit Plan and submitted firm recommendations to Council on the effectiveness of the University’s internal control and procedures for identification, assessment and reporting of risks. The Committee considered and approved the following matters during the year under review:
i) the three (3) Year Audit Coverage Plan and the 2017 Internal Audit Plan.
ii) the appointment of NEXIA SAB&T as the Internal Audit Service Provider for a period of three (3) years.
iii) the Final Draft of the Annual Report for the year ending 31 December 2016 for signing and submission to the DHET, as recommended by the Committee.
iv) the 2016 Going Concern Assumption principle be applied, with the amendment in the increase of the Provision for doubtful debts by R29.5 million.
v) the External Audit Strategy and Plan for the year ending 31 December 2017, subject to the assurance that its quality standards would not be compromised.
vi) The Project Plan on appointment of the external auditors; a process to be finalised at the beginning of 2018.
vii) The revised internal audit charter and the committee’s terms of reference.
4.5 Human Resources Committee
This Committee monitored and evaluated the implementation of the HR strategy, policies, practices and systems that guide Institutional employment practices in line with national labour relations laws. Once again the Committee operated under difficult circumstances during the year under review, particularly due to leadership at executive management level. The executive manager, Mr Monde Mondi, who was appointed the previous following a rigorous human resources, assumed duties in January 2017, but lasted only for a period of two weeks before he resigned from the position in the same month. Once again, Council, on the recommendation of the Committee and the acting Vice-Chancellor, formally appointed Dr Octavia Mkhabela, the Executive Director: Office of the VC, as acting line manager. Dr Mkhabela also resigned from the University during the last quarter of the year after being on extended leave, particularly during the height of the insourced workers strike and student protest that was particularly related to insourced workers’ matters. The University appointed Ms Ncediwe Qomoyi who was
30 A NNUAL R EPORT 2017
appointed as acting executive manager and greatly assisted the University to deal with insource workers matters as well as the implementation of the Council decision on these matter.
The following are the revised terms of reference following the workshop of the committee that was convened the previous year to reflect on its roles and responsibility, including the fresh mandate from Council:
To consider recommendations and reports from the executive management team and submit items for approval to Council on the following matters:
a) Human Capital (HC) Strategy and organisational structure
i) Review and monitor the development and implementation of the Human Capital Strategy.
ii) Ensures that the Human Capital Strategy is in line with the vision, mission and core values of the University.
iii) Review and monitor the development of an appropriate organisational structure to implement the HC strategic objectives.
b) Human Capital Policies, Procedures and Practices
i) Review and monitor the development and implementation of Human Capital policies and procedures.
ii) Ensure that the HC policies and procedures are regularly reviewed to keep abreast of the developments in the human resources environment.
c) Talent Management at senior management level
i) Review and monitor the organisational structure at senior management level
ii) Consider policies, procedures and principles for selection and retention of senior management.
iii) Review and monitor the development and implementation of succession plans for senior management.
iv) Review recruitment, retention and
termination policies and procedures for senior management.
v) Review the Vice-Chancellor’s recommendations on confirmation of probations, acting appointments, retention, transfers and termination of service of senior management.
vi) Review and recommend to Council any material terms of employment, severance or settlement arrangement and any changes to contractual agreements and provision for members of senior management.
d) leadership development
i) Oversee and monitor the development of induction, orientation and training programme for senior management.
ii) Oversee and monitor continuous leadership and professional development for senior management.
iii) Recommend policies and practices for performance evaluation of senior management.
iv) Review and monitor the practices used to evaluate senior management members.
v) Annually review and recommend to Council the VC’s performance management plan.
vi) Annually review and approve VC’s performance appraisal results of all senior management members and recommend remedial action, where necessary, to Council.
e) Human Capital Administration
i) Consider and monitor the Appointments/Resignations/ Dismissals/Retirements trends of regular basis
ii) Monitor the development and implementation of overall Performance Management, rewards and recognitions policies, procedures and practices
iii) Provides mandate for annual general increase negotiations based on the Institutional budget and parameters set by Council.
iv) Provide oversight on Medical aid scheme and contributions.
31
v) Review and monitor Retirement funds, group life and contributions;
vi) Consider recommendation on changes to post levels and salary ranges;
vii) Funding proposals;
viii) Equity profile and transformation;
ix) Staff learning and development;
x) Safety and Health; and
xi) Labour Relations.
f) Delegated authority and accountability
The Committee has such delegated powers, authority, duties and functions as contained in these Terms of Reference or as specifically delegated by the Council. The following functions are delegated to the Committee by Council:
i) Salary increases for general staff (Grades 5 – 18) based on the mandate and parameters set by Council.
ii) Deviation from the Policy on Retention of scare/critical skills.
iii) Job Evaluation Results for senior management positions.
iv) Senior management appointments of less or equal to 1 year.
v) Freezing/Unfreezing of senior management positions.
vi) VC’s Performance Plan (goals, objectives and performance targets).
vii) Review and approval of senior management job profiles.
viii) Review the appointment of human resources services providers/ consultants.
Despite, the challenges experienced by the Committee and with the vital support of the acting Executive Director: HR and acting ViceChancellor, the Committee considered and either recommended to Council or approved the following matters:
(i) The 2017 salary agreement with the Unions for the general staff.
(ii) The engagement external team to support and assist in the analysis and regularization of conditions of service for insourced workers as well as flagging of potential risk areas.
(iii) The appointment of a high level human resource experts for a limited period to turnaround the Human Capital Department as well as assist with organizational design of the Human Capital Department, the senior management and capacitation of human capital staff.
(iv) The project plan for the rolling out of the performance management system to middle and junior management levels (5 to 8).
(v) The renewal or extension of contracts for senior management whose contracts were coming to an end.
(vi) The development and implementation of the 360 degree performance management system for all senior management members
(vii) The moderation of the senior management performance management results and the restructuring of Key Performance Areas and Key Performance Indicators of senior management.
(viii) The Policy on Reengagement of senior management upon expiry of the fixed term of contracts.
4.6 Governance and Ethics Committee
The Governance and Ethics Committee of Council discharged its responsibility in line with its mandate by recommending to Council the adoption of the King IV Report on Corporate Governance as best practice and guiding document on implementation of the relevant governance principle. The Committee played a key role in ensuring that ethical leadership was appropriate exercised particularly as Council and senior management levels to set the tone from the top. Besides its normal functions, the Committee considered a number of issues that were referred, including the following:
(i) The filling of vacancies on Council and Council committees and reallocation of members to various committees based on their skills and expertise;
(ii) The roles and responsibilities of a Chair of Council in respect of chairing Council committee, based on a benchmark report and
32 A NNUAL R EPORT 2017
recommendations from the King IV Report on Corporate Governance.
(iii) The reconfiguration of the Search and Selection Committee for Senior Appointments, including the chairing of the committee as well as inclusion of integrity tests and appointment of ethics experts to serve on the Search and Selection Committee.
(iv) The Policy on Payment of Honoraria to Council members not be amended to the prevailing University financial conditions. However, the decision was overturned by Council and the Policy was amended.
(v) The Project Plan and deliverables on reconstitution of Council since the term of office of the current Council would expire at the end of August 2018.
(vi) The appointment of one of the executive management members Ethics Champion, based on the recommendation from management on drive the establishment of ethics management systems and processes in the University.
(vii) The Project Plan on the Review of the Statute.
(viii) The Project Plan on the evaluation of Council and its Committees.
(ix) The establishment and approval of the Code of Conduct Committee for Council members and its terms of reference.
The Committee monitored the attendance of meetings of Council and Council Committees and made recommendations to Council on corrective measures to be taken where there are concerns. The Committee further monitored the committee workload of Members and advised Council on means of achieving as far as practicable and feasible, an even workload for all Council Members.
Besides the above, the Committee is set, as the per Council mandate, to play a critical and proactive oversight, monitoring role and ensuring that the Institution’s ethics is managed effectively (as recommended in principle 1.3 on the King
Report III on Governance for South Africa, 2009), including –
a) leadership demonstrating support for ethics throughout the Institution;
b) a strategy for managing ethics that is informed by the negative and positive ethics risks the Institution faces;
c) ethical standards are articulated in a code of ethics and supporting ethics policies;
d) structures, systems and processes are in place to ensure that Council, management, employees, students and supply chains are familiar with and adhere to the Institution’s ethical standards;
e) ethics performance is included in the scope of internal audit and reported on in the Institution’s integrated annual report;
f) ethics is imbedded in the organisational culture.
The Committee further interrogated its role and mandate and the linkages and integration with other Institutional structures dealing with matters of ethics, particularly in the academic component. The Committee deal
4.7 Remuneration Committee
The Remuneration Committee was established by Council to:
i. Oversee the setting and administering of remuneration at senior management levels in the University;
ii. Oversee the establishment and implementation of a remuneration policy that will promote the achievement of Institutional strategic objectives and encourage individual performance at senior management levels;
iii. Make recommendations to the Council on all senior management remuneration levels and annual increments in accordance with Institutional affordability;
iv. Review the outcomes of the implementation of the remuneration policy for whether the set objectives are being achieved;
v. Ensure the development and implementation of a performance
33
management system for senior management, and to ensure that the principles of this system are applied annually;
vi. Consider the results of the evaluation of the performance of the ViceChancellor and other senior managers in determining remuneration;
vii. Select an appropriate comparative group of higher education Institutions when comparing remuneration levels for senior management;
viii. Make recommendations to Council on the payment of honoraria and other incidental expenses to external members of Council;
ix. Oversee the preparation and recommending to the Council of the remuneration report, to be included in the annual report, for whether it: -
a) is accurate, complete and transparent;
b) provides a clear explanation of how the remuneration policy has been implemented, including use of appropriate benchmarks; and
c) Provides full disclosure of each individual executive managers and external Council member’s remuneration.
x. Oversee the annual review of the remuneration policy.
The Committee recommended to Council the rolling out of the performance management system for senior management levels and determined for Council the approval of the salary packages of senior management. The Committee considered the Remchannel and PwC Reports to determine the salary increases for senior management for the year under review, in line with the Institutional budget and affordability. During the year under review, the Committee was able to determine the salary increases for senior management as early as possible. The Committee’s recommendation that the Executives on Levels 1 – 4 be given flexibility to join either the National Tertiary Retirement Fund (NTRF) or the current CPUT Retirement Fund (CPUTRF) was considered and approved by Council.
4.8 Search and Selection Committee for Senior Appointments
The Committee was established to deal with Appointments of Senior Management, which is the function of Council. Council reconfigured the composition of the Committee to ensure inclusivity and representivity. The Committee is comprised of the Chairperson of Council, Deputy Chairperson of Council, Chairperson of the HR Committee, two external members of Council, one representative from Senate, one representative from the Institutional Forum, one representative from the Student Representative Council, one representative from the Convocation, Vice-Chancellor and two members of management as full members as well as representatives from each labour union as observers. During the year under review, Council approved the addition of a Convocation Representative as full member of the Committee, as one of the statutory structures of the University.
The Committee considered and recommended to Council the appointment of staff on the following positions:
a) Prof Paul Green as a Dean of the Faculty of Business and Management Sciences
b) Prof Marshall Sheldon as the Dean for the Faculty of Engineering; and
c) Ms Amanda Glaeser as a Resident Human Capital Consultant for a period of 18 months.
The Committee further recommended a number of procedures to further streamline, improve and refine the appointment process.
4.9 Student Services Committee
The Council established the Student Services Committee chaired by one of the external members of Council to:
a) to advise on policy in respect of student services within the University.
b) ensure provision of non-academic services to students that create an environment conducive for student success.
34 A NNUAL R EPORT 2017
c) promote a safe, conducive and academically stimulating life and learning environment that encourages personal development and student satisfaction
The Committee is comprised of Council, management and SRC members and meets four times a year. During the year under review, the Committee considered and recommended the following matters to Council, which were subsequently approved:
i) The Proposed Rules on Pardons Process of Students.
ii) The amnesty rules and process be dealt with by the Committee once firm proposals were received from the Management, based on the consultation with the SRC.
iii) The Project Plan and timelines for the SRC elections in 2018. The Committee experienced some challenges due to instability of the SRC leadership due to contestation of position and attempts to reshuffle certain positions within the SRC. There Student Affairs leadership could not provide the direction, control and management on some of the pertinent student affairs matters, which led to the Committee being involved in operational matters in order to address the recurring challenges that were not able to be addressed at executive management level.
4.10 IT Governance Committee
Council applied the recommendations of the King III Report by establishing the IT Governance Committee of Council to:
a) To support the Council in the governance of the University by ensuring that the strategic asset of IT and its related risks and constraints are well governed and controlled to ensure that IT supports the strategic objectives of the organization;
b) To consider the leadership and organisational structures and processes ensuring that the IT sustains and extends the University’s strategies and objectives; and
c) To assist Council in their governance role by ensuring that the University has implemented an effective IT governance framework to enable the organisation to deliver value from IT, whilst optimising cost and managing risk.
During the year under review, the Committee considered and recommendations on the Business Continuity Strategy and Plan, particularly following the #feesmustfall student protest. The Committee considered various mechanisms and strategies to optimize the utilization of IT during the University shutdown as a results of the student protest. The Committee further considered the following matters:
(i) Follow-up on Internal Audit findings
(ii) Disaster Recovery Plans and Business Continuity measures
(iii) Report on the Review of the current ERP system
(iv) The Policies on In-House Patch Management as well as the Anti-Virus Policy and Procedure
(v) IT Human Resources Strategic Plan
The Committee had a close working relationship with and reported on its activities, particularly on risk element to the Audit and Risk Oversight Committee. However, the Committee experienced some difficulties toward the end of the year with regard to the submission of pertinent information for decision making purposes. This was due to the non-availability of the CTS leadership since the former Senior Director, Mr Paul Tennant, had passed away after a long illness and the Deputy Vice-Chancellor, Prof Louis Fourie was on extended sick leave. The matter was elevated to the executive management and Council for consideration.
5 STATEMENT oF CoNFlICT MANAGEMENT
Council had not mandated any specific Committee to deal with conflict management and resolution within the University as was the case in previous years. Council had decided
35
to source external independent mediators or arbitrators, through a Council approved process, whenever there was a need to resolve any dispute or manage conflict that threatens the governance, management and operations of the University as well as to manage and resolve disputes arising within the University in a constructive, transparent, fair and effective way for all involved. All matters referred to the Council for consideration must have gone through the internal due processes and channels and should be group-specific matters, that is, not individual cases. The decision or resolutions of the Committee would be final and would be tabled at Council for information in a summary form.
During the year under review, the student protests was resolved based on the engagement of external mediators who were sourced based on the resolution of Council. During the #FeesMustFall student protest, there was serious damage to the University and personal property and equipment. Many academic days were lost due to the student protest action. Despite the Council having met a number of demands from the students, the student protest action continued unabated. This resulted in the shutdown and closure of the University and postponement of the examination from October/ November to December 2016 and January the following year. Once again, the University incurred exorbitant costs on security measures in an attempt to protect the University property as well as students and staff.
6 CoDE oF CoNDUCT FoR CoUNCIl AND MEMBERS oF CoUNCIl
In September 2011, the Council approved the revised Code of Conduct for Council and Members of Council to guide itself in its workings as well as the conduct of individual Council Members as they carry out their duties.
The purpose of the Code is not intended to inhibit the actions of a Member of Council, but to ensure that where there is a conflict between any such actions and the best interests of the University, the interests of the University will take precedence. The purpose of this Code is to provide a Member of Council with a set of
principles as to what is regarded as appropriate conduct by a Council Member in performing his/ her functions and duties.
This Code should be seen as a means of ensuring self-regulation by a Member of Council and as an instrument for taking action with regard to inappropriate conduct on the part of a Member of Council.
In exercising their powers and performing their functions, Council Members must at all times:
i. serve the interests of the University and its staff, students and the public at large with the highest degree of integrity, objectivity, equity, fairness and ethically as befitting persons appointed to such office;
ii. enhance the public image of the University as well as interpret the community to the University;
iii. support the Vice-Chancellor in his or her fulfillment of objectives and policies of the Council.
The following are some of the fundamental principles covered in the Code:
6.1 The principle of democratic governance
A Member of Council must act in a manner, which is respectful of and in accordance with the principle of democratic governance. Council should also create an environment that encourages the participation of all Members of Council.
6.2 The principle of accountability
Members of Council are directly accountable to one another as Council for the performance of their functions and duties and indirectly, through Council, to the staff and students of the University and to the public at large. Council is accountable and responsible for the performance and affairs of the University
6.3 The principle of transparency
Council accepts that it is accountable to those it serves. It is important to inform its Stakeholders of its decisions timely. A Member of Council is expected to perform his/her functions and duties in a manner
36 A NNUAL R EPORT 2017
that reflects the highest ethical conduct, which encompasses integrity, honesty and openness. Decisions made should be objective and without undue influences.
6.4 The principle of respect for the rights of others
A member of Council must respect the rights of others.
6.5 The principle of objectivity
A member of Council must perform their functions and duties fairly and not allow prejudice, bias or the influence of others to override their objectivity. Any actual or potential conflict of interest must be avoided, but must also be seen to be avoided.
6.6 The principle of cooperative governance
Council commits itself to the notion of cooperative governance, which is defined as “a social contract in which diverse parties agree to suspend particular interests in the interest of reconstruction and development.” Council must work with other University structures and in doing so accepts the spirit of academic freedom.
6.7 The principle of collective responsibility
A member of Council is collectively responsible for resolutions of Council and must abide by such resolutions. A member representing Council in another University structure must represent resolutions of Council in that structure in the best possible manner.
6.8 The principle of fiduciary responsibility
A member is appointed to Council to serve both the interests of the University and the public. On acceptance of the office, a member of Council becomes a trustee for the benefit of the University and the public they serve, which gives rise to an obligation on their part to fulfill their responsibilities solely with the purpose of promoting the best interests of the University and the public.
Fiduciary duties of a member of Council entail, inter alia, the duty:
1.3.8.1 to Act:
• In the best interest of the University by exercising reasonable care, skill and diligence in the conduct of their responsibilities
• Legally, honestly and within their powers
1.3.8.2 To refrain from misusing information.
1.3.8.3 Not to act in a manner that creates a conflict between duty and personal interest.
1.3.8.4 As a member of Council who acquires special knowledge or information by virtue of a confidential or fiduciary relationship with another is not free to exploit that knowledge or information for their own personal benefit. The broader principle is inherent in the nature of the fiduciary relationship that prohibits a Member of Council from extracting secret profits from their position of trust.
6.9 The principle of independence and integrity
A member of Council undertakes at all times to apply their mind to the matters before them in an open and independent manner with integrity and without undue influence, fear or favour.
6.10 The principle of confidentiality
A member undertakes to honour at all times the trust and confidence bestowed upon them. They undertake not to disclose inappropriately and without authority deliberations or decisions of Council in a manner that will be detrimental to the University.
As per previous Council decision, it is the responsibility of the Chairperson of Council and the Vice-Chancellor to communicate to the University community, matters of Council, including decisions taken after each meeting.
37
6.11 The principle of respect for the privacy of the personal affairs of members of Council

Council respects the privacy of the personal affairs of a member of Council. Notwithstanding above-mentioned, a member of Council should at all times conduct themselves in a manner that will not be prejudicial to the best interests of the University.
Council has approved a Conflict of Interest Policy that applied to all Council and Council Committee Members and regulates the declaration of Conflict of Interest by Council Members concerning potential and real conflicts of interest in the conduct of the affairs of the University.
38 A NNUAL R EPORT 2017
MS NoGolIDE NojozI Chairperson of Council
MR N NTSABABA Registrar
7 CoNFlICT oF INTEREST: PolICY, PRINCIPlES AND RUlES APPlICATIoN To CoUNCIl MEMBERS
Council Statement on Sustainability
The effect of the zero fee increase in 2016 and the 8% fee increase in 2017 has resulted in the University’s financial sustainability ratio deteriorating further.
The sustainability of CPUT is dependent on both national and Institutional political, economic, social and technological factors. This is a recurring trend that will remain with us in the future.
At the national level, the funding formula has not kept pace with the increased costs of providing higher education services. The Higher Education sector is affected by international cost drivers such as journals, equipment, IT systems and the exchange rate, which push academic inflation beyond the domestic inflation rate. Revised funding models are being considered, but these will not necessarily improve the funding position going forward. Alternative and creative ways of funding in the future need to be developed with the aim of creating self-sustainability by individual Universities.
The Higher Education sector has come through an extremely challenging period from 2015 to date. This has now culminated in the announcement on 16 December 2017 by the then President of a ‘free education funding structure for first time entering students with family income of R350 000 or less’.
The effect of the zero fee increase in 2016 and the 8% fee increase in 2017 has resulted in the University’s financial sustainability ratio deteriorating further. Relief from the increase was provided to all students with family incomes of less than R600 000 per annum. This intervention was not as successful as it had been hoped.
Added to the challenge of a zero% increase in tuition fees was the national call for insourcing of services that were currently outsourced. This has the potential to negatively affect the financial sustainability of CPUT if handled recklessly and has had to be managed very carefully over a lengthy period.
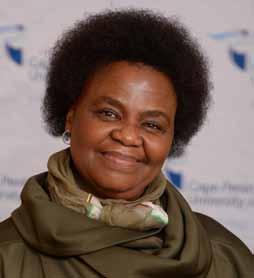
The University must conclude the consolidation of its faculties on particular campuses by 2020 to avoid the current rental commitments and additional staff costs related to the incomplete consolidation. Funding has been made available and processes have commenced to address shortcomings.
The current cost of administrative staff, being both support services and faculty, comprises about 48% of the salary bill. This cost needs to be controlled to become less than 45% of the salary cost and the employment of academic personnel, who will have a positive effect on the success rates, should
39
be prioritised. All of the above are being addressed through the cost containment initiative implemented in late 2017.
The demand for access to CPUT by prospective students has been looking good throughout the years. This has been evident during the past five years and is supported by the number of applications received from first-year and first-choice applications. These applications have been fluctuating between 33,000 and 35,000 during the past five years, with a total of 35,010 applications received for the 2017 academic year (compared with 34,168 in 2016). However, applications alone do not mean anything, in that, they cannot be used as a measure for sustainability. It is only once these applications convert to admissions and thereafter to enrolments, that they matter. Therefore, the total number of student enrolled during the 2017 academic year was 34,702 which is a slight increase from the 34, 455 enrolments in 2016
Due to the disruption of the 2015, 2016 and 2017 academic years caused by the #FeesMustFall movement, the overall pass rate (the degree credit success rate), started to dip from an all-time high over a five-year period of 81% to 78.9% in 2016 and 78.04% in 2017.
The recurriculation of CPUT academic programmes as a result of a national project to align all qualifications according to the new Higher Education Qualifications Sub-framework (HEQSF) has continued in 2017 and has reached its point of maturity. This process was not without its challenges, most notable is the slow rate at which these new qualifications programmes were approved by the Council for Higher Education (CHE)
The last year in which new intakes may be taken into the non-HEQSF aligned qualifications is 2019. Thereafter, the articulation from undergraduate to Masters programmes will drastically change for Diploma students. Instead of articulating directly from a one-year BTech degree to a Masters degree, a student will be required to complete a one-year Advanced Diploma and another one-year Postgraduate Diploma. The implication is that with the new qualifications a student will be delayed by the entire year to get to enroll for a Master’s degree and the associated subsidies at different levels of study will have further implications to the University. Furthermore, the curriculation of Postgraduate
Diplomas for professional qualifications (e.g. Engineering programmes) that require approval of professional bodies is a major challenge and is not possible in the time allocated, given that there is currently no standard in place for evaluation of these PG Diplomas by professional bodies.
The sustainability of CPUT is dependent on the participation and involvement of all of its constituencies. We are all responsible and liable for the future sustainability of the University and this is not achievable without the long-term partnerships with the community and city.
CPUT’s tuition fees have remained amongst the lowest in the country and yet the Institution operates in the same sector and in the Western Cape where the costs are high. For the Institution to be sustainable, the issue of fees will have to be considered very seriously in future in the absence of a radical change to the level of government funding. This includes a reconsideration of a transport and other levies to enable the University to continue to provide services for students, so that this can be self-funding and not subsidised by Council Controlled Funds.
MS NoGolIDE NojozI Chairperson of Council
40 A NNUAL R EPORT 2017
Report of the Audit and Risk Oversight Committee
The Cape Peninsula University of Technology’s (CPUT) Audit and Risk Oversight Committee (AROC) of Council has a specific mandate and its terms of reference specify that members of the committee must be independent of the University. The Committee is chaired by an external member of Council. The terms of reference have been approved by the Council.
The Committee has an independent role and is accountable to Council. The Committee does not assume the functions of management, which remain the responsibility of the Vice-Chancellor, Deputy ViceChancellors, Executive Managers and other members of Senior Management.
COMPOSITION AND ATTENDANCE
The Committee currently has 8 members, four external Council members and four additional members, all independent of the University.
The members of the AROC have a variety of skills, ranging from business, auditing, legal, governance, Information Technology, risk management and financial services.
Meetings are held at least 4 times a year and are attended by the external and internal auditors and appropriate members of the executive management of CPUT.
Arising out of each AROC meeting is a Chairman’s report to Council indicating matters requiring Council attention for noting, approval or action.
The Audit and Risk oversight Committee have the following objectives:
• to ensure that the interests of all stakeholders are properly protected in relation to financial reporting and internal control;
• to provide Council with an independent assessment of the University’s financial position and accounting affairs, with the objective of providing further assurance of the quality and reliability of the financial information used by Council and contained in the documents approved by Council for issue on behalf of CPUT;
• to keep under review the effectiveness of CPUT’s internal control policies and procedures for the identification, assessment and reporting of risks;
• to ensure that CPUT has implemented an effective policy and plan for risk management that will enhance the University’s ability to achieve its strategic objectives; and
• to ensure the CPUT’s disclosure regarding risk is comprehensive, timely, and relevant.
41
* Members of Council
** Independent members – not in the employ of CPUT
SUMMARY OF MAIN ACTIVITIES
The Audit and Risk Committee complied with key aspects of its mandate:
INTERNAL AUDIT
The Internal Audit Director developed a Risk based Internal audit plan for the year ending 31 December 2017 in consultation with the Acting Vice – Chancellor, Executive Management, the co-sourced Internal auditors and the external auditors to agree on the proposed areas of coverage and to avoid possible duplication of activities. The plan was based on significant risks and Internal audit universe of the University.
NEXIA SAB&T was appointed on 26 April 2017 as the new co-sourced Internal auditors for a period of 3 years to execute the approved audit projects under the guidance and supervision of the Internal Audit Director.
The 2017 Internal audit plan was fully completed, and the Internal audit findings and recommendations were reported to management and AROC. The following serves as a summary of the audit assignments completed for the period under review:
• Institutional Records Management
• Student application, Evaluation/ Admission & Registration Audit (All faculties)
• Institutional Planning
• Network Security Management
• Institutional Governance
• Marketing and Communications – Call Centre Operations
• Ethics Management
• Physical Security
• Occupational Health and Safety
Follow up audits were conducted in the following areas:
• Residence Management
• Human Capital
• Revenue and Debt management
• Contract Management
• Policy Development
• Short Course Management
• Library Asset Management
• Budgets and Forecasting
• Research, Technology, Innovation and Partnerships Internal Control Review
• IT Change management review
• IT Incident and Problem management
• IT Student administration
• IT Access Management
• IT Infrastructure
• IT Governance
In general, the University’s performance in respect of the resolution of findings previously reported has been satisfactory except for a lack of progress made in Human Capital and Residence Management.
42 A NNUAL
2017 Audit and Risk Oversight Committee member Date of meetings 17/02/2017 26/05/2017 11/08/2017 10/11/2017
(Chair) * Present Present Present Present
(Mr)
Present Present Present Present
Present Apology Present Present
Apology Present Present Present
Dhevcharran
Present Present Present Apology
Apology Present Present Present
Present Present Present Apology
Present Present Present Present
R EPORT
R Benjamin-Swales (Ms)
K Patel
*
C Blair (Mr) *
O Bailey (Mr) **
N
(Ms)*
R Lebethe (Ms) **
R Bredenkamp (Mr) **
N Mphuthi (Ms) **
EXTERNAL AUDIT
KPMG was appointed in 2013 to fulfill the external audit function at CPUT. Their appointment is renewed annually after review and evaluation by AROC and before commencement of the audit by obtaining approval from the Auditor General in terms of the Public Audit Act.
AROC’s review of the external audit function included the following activities:
• Quarterly tracking of the implementation of action plans for previous MPL’s raised;
• October 2017 discussion of KPMG’s audit plan, strategy and budget for the audit of CPUT for the year ending 31 December 2017.
• Reviewed KPMG audit planning documentation for the audit of CPUT for the year ending 31 December 2017 (‘2017 Audit’);
• Monitored timetable of audit activity to ensure that CPUT meet deadline dates for finalisation of 2017 Annual Financial Statements and submission to DHET.
• Reviewed the draft Annual Financial Statements and Annual Reports at a joint meeting of Finance and Audit committee on 11 May 2018 and AROC on 25 May 2018 to consider the Annual Financial Statements and Annual Reports for recommendation to and approval by Council.
Final Management letter Points (MlPs) – Audit for the year ended 31 December 2017
The audited MLPs were submitted in May 2018 by KPMG. External auditors’ recommendations have been discussed with relevant departments and the management responses received by KPMG have been incorporated in their full report.
Summary of findings – 31 December 2017
The table below shows the findings per risk grade as compared to the prior year’s external audit findings.
The AROC has ensured that appropriate management attention was obtained, to ensure that items raised in the management letter, are addressed. AROC requires written progress reports at each quarterly AROC meeting.
RISK MANAGEMENT AND INTERNAL CONTROLS
The Committee reviewed and recommended the following reports in this Annual Report to Council for approval:
• Report on Internal Administrative / Operational Structures and Controls; and
• Report on assessment of risk exposure and risk management
The 2017 Strategic Risk register was reviewed, updated and recommended to Council for approval. Emerging risk areas were considered by AROC during the financial year and mitigating controls were implemented by management to reduce the risk exposure to the University.
Annual Performance Self – assessment
An annual self-assessment was completed, and the results were presented to Council. An action plan was developed during the year to address areas of improvement identified during the assessment.
43 Risk Grade Number of findings (2017) Number of findings (2016) Significant deficiency 2 2 Control deficiency 9 5 Other matter 18 16 Predetermined objectives Significant deficiency 4 3 Control deficiency - 1 Other matter 3 0
CONCLUSION
AROC complied with its terms of reference and is satisfied that the CPUT has continued to maintain and manage internal control systems effectively in a manner that ensures the achievement of Institutional objectives and operational goals. This was obtained by means of a risk management process, combined assurance approach, as well as the identification of corrective actions and enhancements to internal processes and controls.
The Audit & Risk Oversight Committee therefore recommend the 2017 Annual Report to Council for approval.
 MS N NojozI Chairperson Council
MR K PATEl Chairperson Audit & Risk Oversight Committee (AROC)
MS N NojozI Chairperson Council
MR K PATEl Chairperson Audit & Risk Oversight Committee (AROC)
44 A NNUAL R EPORT 2017
Report on Internal Administrative/ Operational Structures and Controls
SYSTEMS OF INTERNAL CONTROLS AND PROCESSES
The Cape Peninsula University of Technology (CPUT) maintains a system of internal control in order to provide reasonable assurance regarding the achievement of effectiveness and efficiency of operations, the reliability of financial reporting and overall compliance with relevant laws and regulations, the prevention of loss of resources and assets, and also to reduce legal liability.
Particular attention is given to financial reporting and the safeguarding of assets against the unauthorised acquisition, use or disposal of such assets. The internal control system is designed to provide reasonable assurance to the University and the Council regarding an operational environment that promotes the safeguarding of the University’s assets and the preparation and communication of reliable financial and other kinds of relevant information.
Internal control objectives include measures to ensure completeness, accuracy and proper authorisation in relation to documented organisational structures setting out the segregation of responsibilities, as well as established policies and procedures, including a code of ethics. Appropriate internal control practices are maintained in that all policies and procedures are documented and administered by the Records Management Office.
To further strengthen the internal control environment, certain policies have been reviewed and updated and standard operating procedures have been developed based on recommendations made by Internal audit and external audit during the year. A standard operating procedure for reporting on Predetermined Objectives of the University have been developed and communicated during the financial year. Management
have further initiated workshops to consider the Protection of Personal Information Act (POPI) and is in the process of reviewing the Statute of the University.
KNOWLEDGE AND INFORMATION TECHNOLOGY
CPUT applies modern information systems such as virtualization, storage redundancy and managed backup applications in key central data centres. The development and implementation of these information systems is performed in accordance with defined and documented standards to achieve efficiency, effectiveness, reliability and security. Accepted standards are applied to protect privacy and ensure control over all data, including disaster recovery and “back up” procedures. Password controls are strictly maintained with users required to change their passwords frequently. There are regular internal audit reviews to ensure that there are no clashes in user access rights and that the basic internal control concept of division of duties is maintained. Systems are designed to promote ease of access for all users and the systems are sufficiently integrated to minimise duplication of effort and ensure minimum manual intervention and reconciliation procedures. The development, maintenance and operation of all systems are under the control of competently trained staff.
In utilising electronic technology to conduct transactions with staff and third parties, control aspects receive scrutiny and procedures are designed and implemented to minimize the risk of fraud or error. The Institution is continuously striving to improve on its operations to achieve the necessary efficiency, effectiveness, reliability and security.
Nexia SAB&T performed an Internal Network
45
Vulnerability Assessment during September 2017. The scope of the assessment was to review the adequacy and effectiveness of network security relating to the threat and vulnerability management program within the Information and Communication Technology (ICT) Division of the CPUT. Based on the assessment it was recommended that management must assess and update the current patch management process within CPUT, that a vulnerability assessment program should be developed, appropriately funded and be implemented to continuously assess, identify and mitigate against any other forms of vulnerabilities that are located on the internal network and that a comprehensive security monitoring program and incident response process is established.
The Information Technology and Governance Committee provided additional oversight in terms of the implementation of the IT Strategy and the control environment was further strengthened by the development of the IT Charter aligned to the principles of KING IV.
INTERNAL AUDIT
Internal audit monitored the adequacy and effectiveness of the internal control systems through the approved 2017 Risk based Internal Audit Coverage plan. Internal audit conducted reviews on Institutional Records Management, Student application, evaluation/ admission and registration, Institutional planning, Ethics Management, Institutional Governance, Call center operations, Network security maintenance, Physical security and Occupational health and safety during the financial year. Internal audits’ findings and recommendations were reported to management and the Council via the Audit and Risk Committee.
Internal Audit also conducted follow up reviews to verify the implementation of agreed management action plans. Based on the total number of internal findings followed up to date, 49% has been fully addressed, 25% has been partially addressed and 26% not addressed. Corrective actions are being taken by management to address control deficiencies and other opportunities for improving systems.
INTERNAL CONTROL SYSTEMS
There are inherent limitations to the effectiveness of any system of internal control, including the
possibility of human error and the circumvention of controls. Accordingly, even an effective internal control system can only provide reasonable assurance with respect to the reporting of financial information and the safeguarding of assets. Furthermore, the effectiveness of an internal control system can change with circumstances. In instances where it is detected that internal control systems have failed, it should be determined whether further investigation is required.
STATEMENT OF ASSESSMENT OF INTERNAL CONTROLS
The Cape Peninsula University of Technology has assessed its internal controls as at 31 December 2017 in relation to the criteria for effective internal control over financial reporting as described above. Reports to the audit and risk oversight committee by both internal and external auditors indicate that there are some outstanding items of controls deemed to be inadequate or ineffective. These matters were reported to management for action. The student unrest and protests during 2017 has impacted on the time in resolving certain of these outstanding matters.
STATEMENT BY AUDIT AND RISK OVERSIGHT COMMITTEE
The Audit and Risk Oversight committee reviewed the report on internal administrative /operational structures and controls in the year under review at its meeting on the 25th of May 2018, which meeting quorate and the documentation for approval by the committee was circulated with the meeting agenda in advance with due notice.
Mr K PATEl Chairperson Audit & Risk Oversight Committee (AROC)
MR V joNES Director Internal Audit
46 A NNUAL R EPORT 2017
Report on Assessment of Risk Exposure and Risk Management
Effective assessment of risk exposure and risk management is of primary importance to the University, especially in so far as cognisance needs to be taken of the operational, managerial and governance levels where risks are controlled. The Council is ultimately responsible for risk management, which includes evaluating key risk areas with mitigating factors and ensuring that processes for risk management and systems of internal control are implemented.
At CPUT the oversight for risk resides with the Audit and Risk Oversight Committee (AROC) which reports to Council. The management of risks rests with the Quality Assurance and Risk Management Committee (QARM), a joint committee of Senate and Council, approved in 2012.
QARM meets quarterly and comprises of the Vice Chancellor (Chairperson), the Registrar, representatives from Council, Senate, AROC and the Student Representative Council, Executive Management of CPUT, Deans, the Director Quality Management, Director of Internal Audit and the Directors of MIS and Legal Services. QARM’s main activities entailed creating an appropriate risk culture at the University and to monitor the University’s risk profile – its ongoing and potential exposure to Strategic, Operational, Business continuity, Fraud and Environmental Risks and to ensure that appropriate mitigation actions are implemented to reduce risks.
RISK IDENTIFICATION AND ASSESSMENT
A strategic risk identification and assessment workshop was facilitated by Sizwe Ntsaluba Gobodo (SNG) during May 2016 to identify risks that could have an impact on the University achieving its strategic objectives. Mitigating action plans were identified to reduce the impact of the identified significant risks and were adopted by the Management Committee in July 2016. The Audit and Risk Oversight Committee recommended the 2016 Institutional Strategic Risk register to Council for adoption on 28 November 2016. The Strategic Risk register was reviewed and amended during the 2017 financial year and recommended to Council for approval via its Audit and Risk Oversight Committee.
CPUT’S RISK PROFILE
Taking into account the expectations of stakeholders, the current state of affairs in the South African higher education sector, the global mega trends affecting the society educated by the University and the above risk management processes, we summarise our material risk and opportunities as follows:
The top twelve risks were identified, aligned to strategic goals, accepted by CPUT and assigned to risk owners. In order to cater for ongoing changing circumstances, provision is made for the continuous re-evaluation of the risk profile to ensure appropriate risk coverage.
• Uncertainties in the external higher education (HE) landscape, particularly funding issues ( Inadequacy of the funding model (including over-dependence on subsidy and fees, specifically as a result of #feesmustfall).
47
• Socio-political instability resulting in University disruptions. (Student unrest situation at campus levels could affect student experience.
• Integration of in-sourced employees (Challenge relating to grading of staff; the integration of staff and the merging of salary and benefit expectations).
• Inadequate residence management (Increase demand for student accommodation; inadequate security controls at residences and lack of maintenance management).
• Lack of research and Innovation optimisation resulting in lost opportunities to generate additional third-stream income.
• Lack of inclusive organisational culture at the University and inefficiencies in the Human Capital department;
• Risk of a decrease in academic standards due to poor integration and consolidation across all campuses which could also lead to increased operating expenses due to non-integration of various campuses at a business level.
• Risk of Increase in Dropout rates, decrease in throughput and success rates resulting in the nonachievement of agreed DHET targets and loss of income.
• Ineffective business model resulting in ineffective co-ordination between academic units, support units and student affairs.
• Failure to attract and retain world class researchers and scarce skills due to scarcity in the market and the inability to retain well qualified staff.
• Cybersecurity vulnerability risk and instability of the IT infrastructure adversely affecting academic programmes (e-learning and class tests), research initiatives as well as the administrative operations of CPUT.
• Increase in cases of non - compliance with the Student Code of Conduct and policies resulting in student disciplinary processes.
Action plans to mitigate significant strategic risks were implemented by executive management during the year and progress was reported and monitored at the Quality and Risk Management committee and Audit and Risk Oversight Committee.
Each Faculty and Department maintained an operational risk register and presented quarterly reports to the Quality and Risk Management Committee.
MANAGEMENT AND CONTROL OF RISKS
Aside from the inherent management obligation that resides with each risk owner and manager at CPUT, the risk register is used to provide AROC with insight into areas to include in the internal audit plan for the following year. This is an ongoing management process and is supplemented by audits conducted internally at CPUT, when required. Management of risk is therefore integrated into the daily activities of CPUT. Potential risk consequences were continuously identified and evaluated during 2017 and, through appropriate management actions, the conditions within which such risks arose were controlled and monitored accordingly. Emerging risk areas were also considered by management and AROC during the financial year and mitigating controls were implemented to reduce the risk exposure to the University.
CONCLUSION
Potential risk consequences were continuously identified and evaluated during 2017 and, through appropriate management actions, the conditions within which such risks arose were controlled and monitored accordingly. CPUT still needs to embed a culture of integrated risk management University wide. As the understanding of risk and risk management develops further, CPUT strives to be more proactive in its approach to risk management, to enhance the efficiency and effectiveness of business and academic processes and to ensure the optimum economical utilisation of the University’s resources.
Mr K PATEl Chairperson Audit & Risk Oversight Committee (AROC)
MR V joNES Director Internal Audit
48 A NNUAL
2017
R EPORT
Report of the Chairperson of the Institutional Forum
This report highlights the activities of IF during the year under review.
1 ROLE OF THE IF
The Higher Education Act as well as the CPUT Statute outlines the role of the Institutional forum (IF) as an advisory body to council on issues affecting the University, including but not limited to, the following:
a. The implementation of the Act and the national policy on higher education;
b. Race and gender equity policies;
c. The selection of candidates for senior management positions;
d. Codes of conduct, mediation and dispute resolution procedures; and fostering of
Name of constituency
COUNCIL
SENATE
MANAGEMEMT
CONVOCATION
CPUEU
NTEU
NEHAWU
an Institutional culture which promotes transformation, social cohesion, respect for fundamental human rights and creates an appropriate environment for teaching, research and learning
e. Language policy
The IF must perform such other functions as may be delegated or assigned to it by the council.
2 COMPOSITION OF THE IF
In terms of the Institutional Statute, the IF is a constituency based body that is equally representative of the following interest groups in the Institution; and its membership for 2017 was as follows:
Name of designated member
Mr S Ngxiza
Mr B Ngqentsu
Ms L Gie
Ms M Silo (Chairperson - August 2017)
Mr N Ntsababa
Prof Fatoki
N Figlan
Prof R Chetty
Adv N Leach
Ms M Pike
Mr H Theys
Mr S Thwalani
Mr A Moses (Deputy Chairperson - August 2017)
SRC P Mncamase
Non-academic representatives
M Madikizela
Mr D Nel
Vacant Secretariat
Academic representatives
Ms V Cornellissen
49
3 MEETINGS HELD IN 2017
IF meetings for the reporting year were held as follows:
- 30 May 2017
- 24 August 2017
- 18 October 2017
- 18 October 2017 (governance workshop)
- 23 November 2017 (special meeting)
4 ITEMS CONSIDERED BY IF
IF considered mainly the following items during this reporting year and made advisory submissions to council on those italicised:
4.1 Appointment of the Director Transformation and Diversity
4.2 Draft Policy on Renewal of Fixed Contracts (level 1-4)
4.3 IF representation on the Senate Language Committee
4.4 IF guide on the appointments of Senior Managers
4.5 Search and Selection committee for Senior Appointments- appointments of:
a. Dean of the Faculty of Business and Management Sciences
b. Dean of the Faculty of Engineering
c. Executive Director: HC Consultant
d. Acting Vice-Chancellor
4.6 Review of CPUT Statute

4.7 Student Ill-discipline and violence of students during protests
4.8 Installation of the Chancellor
4.9 Decolonisation of Education
4.10 Appointment of the IF Chairperson and Deputy Chairperson
4.11 CPUT BBBEE Status
4.12 Remarks on the DHET Documents re IF Guiding Principles and Community of Practice of IF Chairpersons
5 CONCLUSION AND CHAIRPERSON’S REMARKS
It is a pleasure to report that IF successfully carried out its consultative and advisory role as outlined in the CPUT Statute. The IF Chairperson wishes to express sincere appreciation to IF members who have worked diligently to fulfil the mandate of IF for this reporting year.
MS MANDISA SIlo IF Chairperson
50 A NNUAL R EPORT 2017
Senate Report for 2017
The Senate of the Cape Peninsula University of Technology (CPUT) convened quarterly meetings during 2017 primarily to consider the following:
• Senate Committee reports
• Senate Executive Committee reports
• Submissions from the Faculty Boards
• Recommendations for Ad Hominem Promotions
• Reports on success rates and throughput rates
• Policy proposals relating to the academic project
• Admission and Readmission Criteria
• Research matters
The Executive of Senate met on a monthly basis to deal with matters that required urgent attention such as appointments of academic staff, applications for recognition of prior learning, applications for exemption and recognition of subjects, approval of examiners and moderators, requests for mark alterations, request for changes to the academic structure and quality assurance self-evaluation and programme accreditation reports.
The minutes of the Senate Executive meetings were ratified at the quarterly meetings of Senate.
1 COMPOSITION OF SENATE
1.1 Senate comprised:
• Members of the Executive Management, with the Vice-Chancellor as Chairperson and the Registrar as Secretary.
• Representatives of the academic faculties (Deans, Associate Deans, Head of Departments)
• Professors and Associate Professors
• Directors of academic support units
• Representatives of the academic employees
• Representatives of the non-academic employees
• Representatives of the CPUT Council
• Representatives of the Student Representative Council.
1.2 Senate Committees:
The following committees of Senate met at least once per quarter throughout the year and tabled reports at each Senate meeting:
• Academic Planning
• Library
• Research
• Teaching and Learning
• Higher Degrees
• Language
• Research Ethics
• Student Administration
In addition reports were received from the Quality Assurance and Risk Management Committee and the Hotel School Board which served as Joint Committees of Senate and Council. Reports and recommendations were also received from each of the Faculty Board.
Senate established a task team to undertake a research project entitled “Revisioning Culture, Identity and Image at CPUT”. The task team tabled reports at each Senate meeting.
The Information Literacy Committee served as a sub-committee of the Teaching and Learning Committee. The Centre for Personal and Professional Development, and the Centre for Community Engagement and Work Integrated Learning tabled reports at Senate Teaching and Learning Committee meetings.
51
2 CHANGES TO ACADEMIC STRUCTURE
2.1 The following new Higher Education Qualifications Sub Framework (HEQSF) aligned qualifications were approved by the DHET and submitted to the CHE for accreditation:
• Advanced Diploma in Agriculture and Crop Production
• Advanced Diploma in Agriculture and Livestock Production
• Advanced Diploma in Analytical Chemistry
• Advanced Diploma in Mathematical Sciences
• Advanced Diploma in Marketing
• Advanced Diploma in Project Management
• Diploma in Sport and Leisure Management
• Advanced Diploma in Technical and Vocational Teaching
• Postgraduate Certificate in Education in FET Teaching
• Postgraduate Certificate in Education in Senior Phase & FET Teaching
• Advanced Diploma in Clothing & Textile Technology
• Advanced Diploma in Engineering Management in Quality
• Bachelor of Engineering Technology in Computer Engineering
• Bachelor of Engineering Technology in Electrical Engineering
• Bachelor of Marine Engineering
• Bachelor of Nautical Science
• Advanced Diploma in Somatology
• Bachelor of Nursing (Bellville)
• Higher Certificate in Emergency Medical Care
• Advanced Certificate in Medical Rescue
• Diploma in Dental Technology (240 credit qualification)
• Advanced Diploma in Architectural Technology
• Advanced Diploma in Fashion
• Advanced Diploma in Industrial Design
• Advanced Diploma in Interior Design
• Advanced Diploma in Jewellery Design and Manufacture
• Advanced Diploma in Photography
• Advanced Diploma in Public Relations and Communication
• Advanced Diploma in Urban & Regional Planning
• Advanced Diploma in Journalism
• Advanced Diploma in Visual Communication Design
These qualifications have been earmarked by the Institution as pivotal qualifications to ensure a progression route for students into postgraduate qualifications at the Institution. Some of the qualifications earmarked for submission to CHE in March 2018 also include Master’s degrees in engineering in niche research areas of the Institution which have been developed in collaboration with international higher education partners and related organisations. For example, the Master of Engineering in Satellite Systems and Applications was developed in partnership with French South African Institute of Technology (F’SATI) and other higher education partners in the Southern African region and the Master of Engineering in Electrical Engineering in Smart Grid was developed through the Erasmus+K2 DAMOC project.
2.2 In the Engineering Faculty the following HEQSF aligned qualifications were approved by the DHET and accredited by the CHE for introduction in 2017 which required changes to the academic structure:
• Diploma in Clothing and Textile Technology
• Diploma in Clothing and Textile Technology (extended)
• Master of Engineering in Civil Engineering
• Doctor of Engineering in Civil Engineering
• Master of Construction
• Master of Engineering in Mechanical Engineering
• Doctor of Engineering in Mechanical Engineering
• Master of Engineering in Quality
2.3 In the Applied Sciences Faculty the following HEQSF diplomas were implemented in the 2017 academic year:
• Agriculture
• Agricultural Management
• Biotechnology
• Consumer Science: Food and Nutrition
• Food Technology; Environmental Management
• Horticulture
• Landscape Architecture
• Marine Sciences
• Nature Conservation and
• Mathematical Sciences.
52 A NNUAL R EPORT 2017
The Bachelor of Environmental Health, the Doctor of Horticultural Science and the Doctor of Food Science & Technology commenced in 2017
2.4 An important change to the academic structure of the Health and Wellness faculty in 2017 was the introduction of the new HEQSF-aligned Diploma in Emergency Care (NQF 6). This programme was offered in 2017 in collaboration with the WCG: Department of Health.
2.5 In 2017 the articulation programme for Biomedical Sciences was approved by Senate for implementation in 2018. This allowed students to articulate from the Diploma NQF 6 and BTech NQF 7 to the BHSc degree NQF 8. The delivery will be by blended learning with some content covered online.
2.6 The following programmes were approved by the DHET and accredited by the CHE and were started in 2017:
• Doctor of Applied Arts and Design
• Doctor of Information and Communication Technology
• Doctor of Philosophy in Informatics
2.7 In the Faculty of Business the following Diploma programmes were accredited and are currently offered in place of the discontinued National Diplomas:
• Entrepreneurship
• Human Resource Management
• Management
• Marketing
• Business and Information Administration
• Operations Management
• Public Administration and Governance
• Retail Business Management
• Real Estate (Distance)
In addition, the first Professional Bachelor’s Degree within the faculty, the Bachelor of Paralegal Studies was accredited and registered with SAQA in 2017, and is currently being offered. Another first for the Institution, was the launch of the accredited distance learning programme: Diploma in Real Estate.
2.8 In 2017 all departments remained involved in a major curriculation exercise to align their academic programmes with the HEQSF. The focus of the Curriculum Officers’ forum shifted
towards the implementation of new HEQSFaligned qualifications, capacitating academic departments with the development of programme and subject guides, considering matters pertaining to articulation and credit transfer between non-HEQSF and HEQSF-aligned qualifications as well as exploring innovative and technology-rich modes of delivery.
3 SIGNIFICANT DEVELOPMENTS:
3.1 There was an ongoing focus in the academic sector on the development of academic related policies to regulate and guide the academic project. During the course of the year the following policies and guidelines were approved by Senate:
• Policy on Recognition of Prior Learning
• Honorory Degrees Awards Policy
• ECP Guidelines document.
3.2 The implications of the phase out date for qualifications not aligned to the Higher Education Qualifications Sub-Framework (HEQSF) remained a standing item on the agenda of meetings of the Academic Planning Committee. Progress on the development of HEQSF compliant programmes was closely monitored by this committee. The primary focus of the committee during 2017 was on programmes that provide progression pathways to HEQSF aligned postgraduate qualifications.
3.3 Quality related activity at CPUT focussed primarily on the Departmental Quality Improvement Plans that responded to the recommendations emanating from departmental programme reviews and professional body accreditation visits. Quarterly meetings were held with departmental heads and the Quality Management Directorate to monitor progress in addressing recommendations.
3.4 The report on Phase II of the Quality Enhancement Project which focused on the Curriculum was finalized, and approved by Senate in November 2017.
3.5 Senate considered reports from faculties on their subject review process and qualifications review process, which were specifically aimed at improving success and throughput rates at the Institution.
53
3.6 The Centre for Innovative Education Technolgies (CIET) introduced improved student analytics to measure student online learning activities and to allow lecturers to use special retention tools in the electronic learner management system (LMS) to identify students at risk and to monitor student performance and communicate effectively with students in the electronic classroom.
3.7 A new system to allow for proctored assessments for distance education students was developed and integrated into the LMS. The system uses webcams on the student side to monitor activities and ensure that the assessments are secure.
3.8 At the end of the year CIET also introduced a mobile application for teaching and learning, integrated into the Institutional LMS. There are special and dedicated apps for lecturers and for students.
3.9 All faculties were involved in Service-Learning in 2017. There was a total of 53 Service-Learning projects implemented by various academic disciplines, lecturers and students. The Civic Engagement unit also began its campaign to recruit student volunteers and to form partnerships with the student organisations.
3.10 The third International Summer academy on student leadership in Community Engagement was convened from 16-28 July 2017 in China.. Four students and two teachers from CPUT, two teachers and eight students from the University of Applied Science of Osnabrück, and six teachers and eight students from Guizhou University of Finance and Economics, China participated in the academy. Students shared their experiences and lessons with the CPUT community at a seminar in November 2017.
3.11 A Service-Learning Community Engagement (SLCE) research retreat was held from 5 – 6 December 2017 to provide practitioners with a space to share ideas and resources relating to their projects. The workshop also allowed for the conceptualization of research topics and the development of journal articles.
3.12 The SLCE Units in collaboration with IMPALA coordinated and hosted the launch of the CPUT Impala Action Committee (IMAC) on Tuesday, 30 May 2017. The purpose of the workshop was
to engage staff in strategic reflections on the IMPALA workshop series which was co-funded by the Erasmus+ programme of the European Union. The IMPALA project (Internationalisation and Modernisation Programme for Academics, Leaders and Administrators) focuses on capacity building for higher education, with four task areas, namely: staff development, policy development and implementation, academic issues and mobility.
3.13 The SLCE units coordinated the CPUT District Six heritage project funded by the National Lotteries Commission which involved the renaming of the Cape Town campus to the District Six campus as a heritage initiative. This posed opportunities for faculties to engage in SL and CE activities with students across various faculties, departments and units. The Department of Hospitality Management and the Cape Town Hotel School conceptualised a new community engagement project which involved the training of D6 community food stall holders.
3.14 CPUT was appointed by ETDP SETA to implement the National Senior Certificate 2nd Chance Project in the Western Cape from February 2017. The project aims to prepare Matric learners to rewrite the Matric examination in September/October 2017 by providing tuition in Mathematics, Physical Sciences, Life Sciences, Accountancy and English FAL. The 243 registered NSC Matric Learners are drawn from the Western Cape region.
3.15 Teaching and learning:
The Fundani Centre for Higher Education Development (CHED) was involved in the following initiatives in 2017:
• Obtaining funding for the final cycle of (Phase Out) Teaching Development Grants (TDG) and implementing the TDG programmes;
• Curriculum review, revision and development (focus on degrees and advanced diplomas);
• Language development and the promotion of multilingualism within the Institution;
• The implementation of the Postgraduate Diploma in Higher Education Teaching and Learning (PGDip(HE)(TL));
• Recognition of Prior Learning (RPL);
• Subject and Qualifications Reviews in each faculty
• The First Year Experience programme
• Best Practice Seminars, writing for publication retreats and academic conferences
54 A NNUAL R EPORT 2017
RITAL: The annual University Research and Innovation in Teaching and Learning conference (RITAL) was held in March 2017, attracting 70 staff and 37 presentations. The topic was ‘Transitioning In and Transitioning Out: The Context of Transforming the HE Landscape’, focusing on the first year experience as well as how students cope with later transitions between years and to the workplace.
Writing Retreats: Fundani hosted three writing retreats in 2017. Research has shown that each of these retreats generate an average 3 to 4 articles within 2 to 3 years subsequent to the retreat
The First Year Experience (FYE) project uses a strategy of bringing together the following initiatives: First Year Coordinators, Retention Officers; Mentoring programme; and CPUT 101. First Year Coordinators play an important role in building relationship between students, academics, student support and other stakeholders within the Institution. Retention Officers (RO) were established to track first year students’ performance and assist students to settle in their first year University study. ROs are responsible for the facilitation of orientation, on-going support for first year students and referral of students at risk to the relevant support service. Peer mentoring is regarded as an effective tool in retaining first year students. Each peer mentor is allocated 10-15 first year students. In the initial meeting the peer mentor compiles mentee profile which assist in identifying risk factors. The peer mentors have weekly meetings with mentees in groups and/or individually. 72 mentors were trained from the different faculties; the CPUT 101 module was revised and aligned to the graduate attributes and will be implemented in 2018 to be taken by first year students.
CPUT work-sharing model: The spirit of the new model, as opposed to a work-load model, is that teaching, research, community engagement and WIL and administrative (and other) activities need to be acknowledged as workload and shared equitably within departments. The model was further refined during 2017 and implemented across all facuties.
Language development and the promotion of multilingualism: Donor funds (National Heritage Council) were received to support multilingual signage at CPUT. In addition, a multilingual touchsreen (similar to those found in shopping centres) was acquired for the Electrical Engineering building and was officially launched in October 2017 . The language unit has also been involved in the development of multilingual blogs and online glossaries for the CPUT. This initiative is guided by specific objectives contained in the Language Implementation Plan such as (i) language development initiatives– with specific focus on isiXhosa (taking into account the need to cater for other languages in the future- as per the profile of the student population), (ii) the promotion of multilingualism within the Institution and (iii) the integration of language into content in academic offerings across faculties
Teaching Assistants (TA): A total of 93 TAs were appointed across the whole University in 2017 to service all faculties. Their function and responsibilities include but were not limited to: lesson planning; facilitation/coteaching; educational technology implementation; monitoring and evaluating; tutor management. All potential TAs have to undergo training with Fundani in order to be certified as fully fledged TAs. Where reported on, the TA’s had a positive impact on the pass rates in the classes.
Tutors and Tutorial programme assists lecturers with their academic programme by creating extra classroom time and more space for peer learning and engagement. This has and continues to generate opportunities for lecturers to engage constructively with tutors and students to ensure a deeper understanding of the course content.
Academic staff development: The Scholarship of Teaching and Learning (SoTL) programme was conceptualized following the findings of an evaluation study on the Teaching Development Programme. In 2017, 35 new academic staff members enrolled for the TDP programme. From those members who completed the programme, 26 met the requirement and successfully completed the programme. In addition, 95% completed with a certificate of excellence/merit which indicated a good quality of completion. The outputs
55
for the 2017-2018 cycle were that most candidates produced masters and doctoral proposals. The focus on using the SoTL programme to work towards improvement of qualifications is an unexpected consequence of the programme but is useful in a UoT where most staff do not have doctoral qualifications. Fundani is involved in a continuous capacity development programme. The PGDip (HE)(T&L) is a formal programme, at NQF level 8, and is currently running as a part-time programme (with a duration of two years). The programme is implemented through collaboration between Stellenbosch University (SU), The University of the Western Cape (UWC) and CPUT.
The Information Literacy programmes were implemented by the library in all faculties across the Institution. In 2017 Senate approved a recommendation that an Information Literacy component be integrated into all academic programmes and that this component receive at least a 15% weighting.
Best Practice Seminar: Flowing from the Subject Review Mechanism, the Faculties of Business and Engineering arranged best practice seminars in order to create opportunities for departments to present their innovative teaching practices to the faculty. Such seminars are used as the basis for 1) staff applying for teaching awards and 2) the Teaching and Learning Report.
New Masters Programme in Satellite Engineering: Under the DST/DHET-supported project PAUSSI, the Faculty of Engineering has completed the academic structure for the development of a new Masters Programme in Satellite Engineering, with emphasis on systems and applications. CPUT, through the Faculty of Engineering, is earmarked to be the principal African partner and host of PAUSSI, together with partnering universities; University of Pretoria, University of Cape Town, Stellenbosch University, Durban University of Technology, NorthWest University, University of Kwazulu-Natal, and University of Fort Hare. DHET approval for this programme was submitted in 2017 and is in progress and the online application for accreditation will be submitted as soon as PQM clearance is obtained from the CHE
New Master of Engineering in Smart Grid: Under the Erasmus+K2 DAMOC project the Faculty of Engineering has completed the academic structure for the development of a new Masters Programme in Electrical Engineering in Smart Grid. CPUT, through the Faculty of Engineering, is the principal African partner together with a consortium of southern African universities. The European partner consortium is led by the Technical Univeristy of Dresden, Germany. DHET approval for this programme was obtained in 2017 and the online application for accreditation has been submitted to the CHE.
International mobility: The Faculty of Business was once again in the forefront of international mobility with thirty (30) faculty staff embarking on international visits. The faculty hosted 22 international academic visits, including a high level delegation of 22 from Baden Wurttemberg. In order to ensure that mobility is a reality for the faculty staff, five ERASMUS+ funded Mobility Teaching and Training Exchanges existed with European Union partners.
Winter School: Chemical Engineering and Civil Engineering had Winter Schools in July 2017. Chemical, Mechanical and Civil Engineering ran Summer Schools in January 2018. The main purpose was to improve the throughput rate in the Departments and it assist with the phase-out of old qualifications.
Innovative modes of delivery: All departments in the Health and Wellness faculty have implemented some innovative changes to the mode of delivery. The ‘flipped classroom’ modality was used as a pedagogical strategy wherein the traditional lecture environment is reversed (flipped) and class time is repurposed into workshops, where cooperative learning is encouraged. Students are active participants in the session and instructors function as guides. This modality was reported as being very effective by one department in particular, where a traditionally “at-risk” subject, Physics, is no longer at risk. A staff member of the radiography department facilitated a workshop on “Introducing the Virtual Environment for Radiotherapy Training (VERT)” with staff at the Centre for Innovative and Educational Technology (CIET). This equipment is state-of-the-art and in 2017 it was obvious how VERT could change the learning of difficult content in radiation therapy.
A NNUAL R EPORT 2017 56
3.16 Research Development
CPUT staff were granted 11 NRF Ratings in 2017 of which 4 were upgrades, 3 were ratings retained and 4 were new additional ratings. CPUT currently has 36 NRF rated researchers.
From the 18 submissions made to the NRF, a total of R29 298 992 of NRF funding was obtained by CPUT academics through applying to funding calls.
During 2017 the Senate Research and Ethics Committee tabled a draft position paper on Gender Based Violence that was endorsed by Senate and circulated through all the Institutional structures for input.
3.17 Innovation
3.17.1 Royalties
CPUT, through the Research Development office supports academic staff with funding for both local and international conference participation. A total of 83 conference applications were received and processed and the overall amount CPUT research office contributed towards Conference Funding (ConfCom) participation was R1 746 197.
A total of 9 Research Exchange Programme (REP) applicants were awarded a total amount of R353 918.
CPUT, through the Research Development office also supported academics with research running costs through the University Research Funding (URF). A total of 46 applications were approved and allocated a total amount of R1 570 292.
A license for the Flow-Viz technology to the Swedish company, Incipientus Ultrasound Flow Technologies AB (IUFT) was finalized with approval for the first time ever in 2017. Total licensing fees received amounted to R25 138. This income accrued from 4 different licenses.
3.17.2 Spin Outs
A holding company, Aonyx Holdings was created in 2017. Aonyx Holdings will hold equity in all of the CPUT spinoffs, start-ups, and commercialisation vehicles. A new spin-off company, Amaya Space was created in December 2017. Amaya Space (Pty) Ltd is the first truly transformed space company, by Africans for Africans.
3.18 Postgraduate studies
The total Masters and Doctoral graduates for 2017 per faculty is as follows:
57
Rating status Rating level Ratings per faculty/unit Upgrades – 4 Retained ratings – 3 New ratings – 4 C1 – 3 C2 – 3 C3 – 4 Y1 – 1 Applied Sciences - 5 Business and Management Sciences - 1 Informatics and Design - 1 Health & Wellness Sciences - 3 Institute for Biomedical and Microbial Biotechnology - 1 Graduation APS FBMS EDU ENG FID HWS Total September 2017 Masters 3 14 3 17 4 1 42 Doctoral 1 4 1 1 7 Sub-total 4 14 3 21 5 2 49 December 2017 Masters 5 23 4 11 4 2 49 Doctoral 1 2 3 3 1 10 Sub-total 6 25 4 14 7 3 59 April 2018 Masters 5 9 2 13 6 2 37 Doctoral 2 1 3 2 8 Sub-total 7 10 5 15 6 2 45 TOTALS PER FACULTY Masters 2017 13 46 9 41 14 5 128 Doctorates 2017 4 3 3 9 4 2 25 TOTAL 17 49 12 58 18 7 161
A NNUAL R EPORT 2017
4 COMPOSITION AND SIZE OF STUDENT BODY:
The student composition making up this total is broken down by gender, population groups, qualification levels and types and faculties; and is as presented on the table below:
5 TEACHING AND LEARNING:
5.1 limitations on Access to certain courses:
• Access to CPUT programmes was again broadened with the implementation of Extended Curriculum Programmes (ECP).
CPUT offered 38 such programmes in
2018 ( Business 10, Applied Science 11, Engineering 6, Health and Wellness 4 and Informatics and Design 7). The Step-Up Training was conducted by Fundani in departments with ECP Programmes.
• In the Applied Sciences Faculty Extended Curriculum Programmes (ECP) students sat the National Benchmark Test (NBT) in order
58
Total Student Enrolment during 2017 34 702
Measures Headcounts Percent of headcounts Category Sub-Category 2015 2016 2017 2015 2016 2017 All 32 674 34 455 34 702 100.00% 100.00% 100.00% Gender Female 17 685 18 797 19 103 54.13% 54.56% 55.05% Male 14 989 15 658 15 599 45.87% 45.44% 44.95% Population Group African 19 738 21 610 22 543 60.41% 62.72% 64.96% Coloured 8 754 9 033 8 876 26.79% 26.22% 25.58% Indian 348 350 310 1.07% 1.02% 0.89% White 3 834 3 462 2 973 11.73% 10.05% 8.57% Qualification level and type Undergraduate 30 757 32 346 32 426 94.13% 93.88% 93.44% Postgraduate (Masters and Doctoral) 1 406 1 626 1 846 4.30% 4.72% 5.32% Postgraduate (Other) 377 380 290 1.15% 1.10% 0.84% Occasional 134 103 140 0.41% 0.30% 0.40% Masters Degree 1 191 1 390 1 561 3.65% 4.03% 4.50% Doctoral Degree 215 236 285 0.66% 0.68% 0.82% BTech Degree 5 318 5 678 5 893 16.28% 16.48% 16.98% BEd and Bachelor of Education 3 206 3 460 3 618 9.81% 10.04% 10.43% Other Bachelor Degrees 533 628 726 1.63% 1.82% 2.09% Faculty Education 3 868 4 194 4 338 11.84% 12.17% 12.50% Applied Sciences 3 094 3 332 3 326 9.47% 9.67% 9.58% Business & Management Sciences 12 104 12 904 12 967 37.04% 37.45% 37.37% Health & Wellness Sciences 2 818 2 939 3 020 8.62% 8.53% 8.70% Engineering 7 371 7 543 7 588 22.56% 21.89% 21.87% Informatics & Design 3 419 3 543 3 463 10.46% 10.28% 9.98%
to identify their knowledge gaps.
• In many programmes access was limited due to infrastructural constraints such as limited lecture rooms and laboratories. However, funding received from the Department of Higher Education and Training is being used to expand physical facilities in SET programmes and in Education to enable student enrolment in these programmes to be increased in line with the CPUT Enrolment Plan.
• Recognition of Prior Learning was used by all faculties to grant access to their programmes. In the light of the legislation pertaining to RPL and Articulation, the RPL unit established a RPL Task Team to look into streamlining the RPL process within the University and to make sure that it is aligned to national legislation.
• The Information Technology department has embarked on a partnership with three TVET colleges in the Cape Town area which enabled them to offer the Higher Certificate: Information & Communication Technology in 2017. The aim of the TVET partnership is to improve access for learners with a qualification that can better prepare them for studying ICT at a University of Technology.
• The Information Technology department, supported by funding from the MICTSETA has created digital courseware material for all of the subjects of the Higher Certificate in ICT and this is providing students with access to quality learning material that they have access to at no cost.
• Most departments in Health & Wellness indicated that student transport to clinical sites was a major challenge. The concerns range from availability of transport to student safety in high crime areas.
• The development of a fully distance education programme in Real Estate, that used a well designed online learning structure on the Institutional LMS, allowed CPUT to develop their strengths in this field and more distance education programmes are now in development, using the experiences from this programme. It is worthy to note that this allowed studnte nationally to study in this field and the first offering showed that students on the distance education programme did better than the full time programme.
5.2 levels of academic programmes and levels of study:
• All departments offered programmes to the level of the four year B Tech degree. The majority of departments offered programmes to the Masters Level. Doctorate programmes were only offered in selected programmes, but were offered in all faculties at CPUT.
• The Education Department offered a fouryear BEd degree, while most academic departments in the Health and Wellness Sciences Faculty offered four year professional degree programmes.
5.3 Awards and Achievements
In a year characterised by the national #FeesMustFall campaign, staff displayed high levels of commitment, resilience, dexterity and passion towards ingenious teaching and learning methodologies, curriculum renewal, student development, research and community engagement. There were a number of notable achievements.
• Departmental and Faculty Distinguished Teachers awards were presented in all faculties during 2017. These awards were funded by the Teaching Development Grant. The top three awardees were then nominated for (and portfolios submitted to) the national HELTASA awards programme.
• Fundani arranged an awards function to celebrate teaching excellence at the Institution and to honour recipients of national awards. The following staff were honoured:
- Siddique Motala: Civil Engineering, the recipient of one of the five national HELTASA Teaching Excellence Awards which were awarded by HELTASA in 2017.
- Dr Hannlie Dippenaar: Faculty of Education; Dr Xena Cupido: Fundani and Dr Muhammad Nakhooda: Faculty of Applied Sciences who were recipients of the Teaching Advancement at University (TAU) Fellowship Programme (TAU awardees), which is also a national programme.
- Dr Mark Marais:Faculty of Health & Wellness Sciences and Dr Muhammad Nakhooda: Faculty of Applied Sciences who were recipients of the Institutional Distinguished Teachers Award
59
• Dr. D Walker was appointed team leader on the Winter Sea-Ice Cruise on SA Agulhas II from 27 June to 13 July. The purpose of the trip to investigate Southern Ocean and sea-ice dynamics in collaboration with the Universities of Cape Town and Stellenbosch. She was accompanied by 9 BTech and Masters level CPUT students.
• Prof Beatrice Opeolu was elected to the position of Vice-president of the Society of Environmental Toxicology and Chemistry (SETAC) Africa Geographic Unit by the council of the society in October 2017. She will take over the leadership of the society in Africa as the President, SETAC Africa (SAF) in 2019.
• Prof Chux Gervase Iwu, Acting Assistant Dean: Research & Innovation in the Faculty of Business and Management Sciences, with the collaborative research team he leads walked away with this year’s Emerald African Management Research Fund Award.
• An occupational professional nurse received an award at SASHON for the best occupational nurse nationally.
• Raina Ghiwala was awarded best Masters research (nationally) by the Emergency Care Society of South Africa (ECCSA)
• The Design Indaba selected Robin Erispe, a Graphic Design Student as an Emerging Creative. The programme finds SA’s most promising young creatives and gives them an international platform to display their work.
• Surface Design lecturer Penny George initiated a partnership with the District Six Museum, which saw 50 local and international artists participating in the compilation of a print exchange portfolio under the theme: Remembering 60 000 Forced Goodbyes. Last year marked 50 years since the apartheid government declared District Six a white area under the Group Areas Act.
• Interior Design student, Kriska Liebenberg, won a prestigious competition, which saw sees winning designs being manufactured and sold by a renowned Cape Town-based furniture-maker. Kriska won prize money of R10 000 and will also receive a percentage of future sales for her nesting chair, which as the name implies was inspired by a bird’s nest.
6 RESEARCH, TECHNOLOGY, INNOVATION AND PARTNERSHIP
6.1 Research Strategy
The Cape Peninsula University (CPUT), Research, Technology and Innovation (RTI) Blueprint is the guiding document to all our research endeavours and provides a roadmap towards research, innovation, technology and partnerships. Through the RTI Blueprint, research areas and research niche areas have been identified and allows for specialisation and support in a managed environment whilst not excluding new areas of research.
The benefits of these research areas are:
• Increased visibility, stature and improved brand worth of CPUT as a result of the impact of research and innovation outputs;
• Enhanced attractiveness of CPUT to donors and venture capitalists as a result of high quality, high visibility research and innovation;
• The overall contribution of CPUT to economic growth and to the GDP of the country as a result of producing high quality post-graduate doctoral output, high quality research, and the injection of innovation output into the local economy;
• A concentration of efforts on the research areas and the resultant improved synergies, research outputs and associated returns;
• The appointment of top-rated scientists as Research Chairs to lead flagship research niche areas within the research focus areas; and
• Climate change and environment
• Human and social dynamics The growth of a robust cohort of post-graduate students and post-doctoral fellows across disciplines for increased masters and doctoral outputs.
The following are the seven focus areas identified and funded by the CPUT:
• Bio-economy and biotechnology
• Space science and technology
• Energy
• Climate Change and the Environment
• Human and Social Dynamics
• Economic growth and international competitiveness
• Design for Sustainability.
60 A NNUAL R
2017
EPORT
In addition, during 2017 research and development was conducted in 3 research Institutes, 8 centres, 2 units , 2 research groups and 3 Laboratories.
During 2017 Senate approved:
- The registration of the French South African Institute for Technology.
- The registration of registration of the Oxidative Stress Research Centre.
- The establishment of a Proteomics Unit within the Institute for Biomedical and Microbial Biotechnology.
- The document on Contract Nomenclature and party responsibility for vetting.
- Moving away from Info Ed as the Research and Information Management System to the use of Converis.
In 2017, 16 research capacity building workshops and 3 writing retreats were presented by the Research Directorate. They list below were conducted to enhance the research and development within CPUT, research publications and improving qualifications. These workshops are repreated throughout the year.
• Capacity Development for Established Researchers Programme
• Research Interchange, Collaboration and Partnerships Initiative
• Institutional systems improvement, upskill of current staff mannaging the RDG grant and intake of human resources for effective phasing out of this grant
This amount of R29 298 992 was paid from the NRF to the Institution and included NRF grants obtained in the following categories:
Strengthening Postgraduate Supervision (Prof Jenny Clarence-Fincham)
Writing for Publication (Mr Solani Ngobeni)
Writing Retreats (Mr Solani Ngobeni)
Strategically Planning One’s Academic Research Career (Prof Johannes Cronje)
How to Develop a Research Project Plan
Ethics: Plagiarism (Dr Corrie Uys)
The workshops which were conducted, targerted for the following academic categories for: -
• Academic Improvement of Qualifications
• Capacity Development for Emerging and Early-Career Researchers Programme
• Capacity Development for Mid-Career Researchers Programme
6.2 Research chairs
During 2017 CPUT had 8 research chairs appointed and funded as per the below:
61
2017 Workshops Total Amount Contributed Research Writing (Dr
Aswegen) R968 628
Liz van
Programme Amount (Rands) Sabbatical grants to complete doctoral studies (9) R1 451 948 Incentive Funding for Rates Researchers (35) R1 400 000 Thuthuka (18) R1 576 641 International Science and Technology Agreements (1) R1 372 952 Competitive Support for Unrated Researchers (5) R670 448 Competitive Programme for Rated Researchers (5) R1 382 966 National Equipment (1) R9 882 100 Knowledge Interchange and Collaboration (9) R199 958 F’Sati (1) R1 915 000 Indigenous Knowledge Systems (2) R832 333 South African Research Chairs (2) R4 516 566 Research and Technology Fund (1) R233 531 S& F Research Development Grants for nGAP Scholars (4) R140 000 THRIP (1) R671 300 IRG (4) R1 573 246 Collaborative Postgraduate Programme (2) R1 480 000 Total Amount Funded R29 298 992
6.3 Research output
The DHET audited units for 2016 awarded were:
- Outside Agencies / Industry:
Funding from
An additional 8.91 credited were approved in Feb 2018 but will be allocated to the 2017 units. With the additional allocation CPUT improved in its research output with an increase of 12.31 units compared to 2015.
6.4 Research awards
• Four Cape Higher Education Consortium (CHEC) awards were held by CPUT academics in the amount of R100 000 for the year of 2017.
• Prestigious Projects to the amount of R3 million was awarded in 2017.
• Department of Higher Education and Training (DHET)_Improvement of Qualifications (IQ) awarded R1 924 210.
6.5 Research/ Postgraduate Studies Funding: Funding for research and bursaries was received from the following sources:
A NNUAL R EPORT 2017 62
outside agencies
Source of Funding Chair Title Faculty Appointed person ETDP SETA Integrated Learning Education Prof Joyce Nduna W&R SETA Wholesale & Retail Leadership Business Prof Roger Mason NRF/DST Work Integrated Learning Education Prof C Winberg NRF/DST Teacher Education Education Prof Yusuf Sayed NRF/SARChi Cardiometabolic Health Health & Wellness Sciences Prof Tandi Matsha-Erasmus CPUT Biotechnology Health & Wellness Sciences Prof Jeanine Marnewick CPUT Oceans Economy Applied Sciences Prof Ken Findlay CPUT Innovation in Society (Service Design) Informatics & Design and Health & Wellness Sciences Prof Thomas Thurner Output type Units Book chapters 11.87 Conference proceedings 32.68 Journal Articles 171.50 AEL R4 342 445 BTB R3 822 746 CHEC R100 000 DAAD SCHOLARSHIP R550 000 Dust Burners R738 063 Eskom R403 531 MRC-Newton Project R3 219 606 NRF Research Funding R26 253 128 Nutek Project R414 589 PPC/WRC R1 086 493 Rheology Centre R192 054 SKA R192 795 WRC R4 713 905 Maueberger R50 000 NRF Scholarships R10 187 575 NRF Post Doc Fellowships R2 000 000 NSFAS Postgraduate R3 116 000 Webb Trust R 26 000 TOTAL OUTSIDE FUNDING R61 408 930
included:
- CPUT Internal Funding
The following funding was provided to the CPUT academic staff as indicated:
the patent was badly drafted and could not stand up to scrutiny when assessed by the international search authority. The main issue was that it was drafted very broadly and hence did not teach the invention. The TTO is investigating the possibility of filing a new patent from scratch.
• The food supplement patent has been abandoned in part. The international applications (Malaysia, Singapore, Canada, USA) were abandoned as it became apparent that the application did not meet the required standard.
6.6.2 Royalties
6.6 Technology transfer and Innovation
The Technology Transfer Office (TTO) has the mandate on all IP related matters. The aim of the TTO is to facilitate, protect and enhance the transfer of IP from CPUT to the business sector in order to enhance commercialisation for the ultimate upliftment of the communities we serve.
VISION STATEMENT: To create a technology transfer process that is vibrant and benefits the ordinary South African. The strategic direction of the TTO and the successful operation of the office will require ‘new ways of working and thinking’ by all stakeholders. While these new ways of working will be underpinned by relevant policies and procedures, mere compliance is not what is required for success.
6.6.1 Patents
No new patents were filed in 2017. Instead the focus was on consolidating and managing costs in the portfolio. The portfolio was assessed and RSA patents were paid to term instead of paying continuous maintenance fees. Some National Phase patents were abandoned.
Two patent families were abandoned to different extents.
• The rooibos slow release formulation patent (SlowRedT) was abandoned in entirety. The rationale being that
Two of the technologies licensed in 2017 are from the University’s Functional Foods Research Unit (FFRU). The main objective of the FFRU since 2010 was to develop food supplements and commercialize products which will promote health and reduce the risk for degenerative diseases in consumers.
The products developed so far are based on a unique ingredient of plant origin, namely Caro-E when combined with other micro- and phytonutrients, provides unique health properties. Products include an Omega Caro-E emulsion, cookies, a culinary oil, peanut butter, infant cereal, and new Omega Caro-E capsule for pregnant women. Omega Caro-E was launched in February 2013 and carries the CANSA logo, the first food supplement in South Africa to be endorsed by CANSA. Since the launch of Omega Caro-E, sales have increased from 120 to 1042 units per month. The product range is unique in terms of composition and potential health benefits offered to the consumer, addressing each sector of the community.
Societal impact is reflected in the license of the patent family to Sozo Food (A specialist functional food research, development and manufacturing company). The portfolio consists of Food supplements, Micronutrient supplements and Omega 3 Fatty-acid emulsions. These were developed largely in response to
63
University Research Fund R1 570 292 Conference Attendance Fund R1 746 197 Research Exchange Programme R 353 918 Prestigious Projects R3 000 000 (DHET) Improvement of Qualifications (IQ) R1 924 210 CPUT Contribution to NRF Funding R4 508 103 Post Doc Fellowships R480 000 TOTAL CPUT FUNDING R13 582 722
the fact that many micronutrients and Omega 3 are known to be absent or deficient in the diet of the majority of people, especially in the diet of vulnerable population groups. Sozo Food is targeting nutritional deficiencies, such as poor dietary habits, poverty, malnutrition, etc. Products are cost effective, affordable and accessible to the lower income consumer market. CPUT and FFRU with these food supplements are making their mark in industry.
6.6.3 Spin Outs
Aonyx Holdings, a CPUT holding company, was created in 2017. Aonyx Holdings will hold equity in all of the CPUT spin-offs, start-ups, and commercialisation vehicles. The most important aspect for establishing this holding company, is to ensure that its structure maximizes the capacity for spinning-out technologies when they are market ready resulting in the maximum potential socio-economic impact for ordinary South Africans. Creating a holding company that has the skill and authority to spin-out IP at fair market value and when the IP is market ready and at a pace which is in line with private technology commercialisation, will ensure three things:
• The risk to the University of spinning out IP prematurely is mitigated.
• Ensuring technology is spun-out fast enough to remain competitive in the market and without burdening the University with unnecessary admin and approval processes.
• Maximize socio-economic benefits through the process of commercialising IP.
The company will be operationalized in 2018.
Amaya Space, a new spin-off company, was created in December 2017. Amaya Space (Pty) Ltd is the first truly transformed space company, by Africans for Africans. This spin-off company is directed at commercialising CPUT technology related to nano-satellites. The company has the opportunity to be the first business of its
nature that aligns directly with Government directives in the area of transformation. CPUT will retain a controlling interest in Amaya via Aonyx. This is significant as CPUT is a University of technology with a majority black student composition, which aligns with the direction of the company in terms of empowerment imperatives. The company has been registered and Directors appointed. Further the financial forecast and valuation of the company has been finalised.
The company is further backed by exceptional young South African researchers, technicians and engineers. This pipeline is being fed by the Satelite Space programme at CPUT. It is envisaged that Amaya Space will significantly contribute to the development of expert skills among black professionals in the industry. The company will further aim to catalyse a transformational supplier development programme.
6.6.4 Other innovation outputs
In total 23 projects were funded by TIA amounting to R8 032 468 over the period 2014-2017. Of these 14 have been terminated (project failed) or closed out (project complete). At the end of 2017 there were 9 active seed projects at CPUT funded by TIA.
CPUT received its first ever TIA Technology Development Fund (TDF) grant in 2017. This was awarded for the Coortech waste water reactor project. The award amount is R4 845 046 with the project expected to be complete in 2018. The underlying technology is directed at removing inorganic pollutants (more specifically the dyes) from textile waste water. Following on this funding, two further innovation projects were initiated with the TIA technology Development Fund in 2017 amounting to just under R50 million.
6.6.5 Contract research:
The TTO reviewed/vetted 45 contracts in 2017. The total value of the contracts was
64 A NNUAL R EPORT 2017
R38 226 913 of this funding to the value of R30 226 913 was research related and R8 000 000 was due to the rendering of services. It should be noted that this not a true representation of the University contract value as some contract owners by-pass the TTO and some contracts that are reviewed are not executed. In addition to the above contracts, 14 zero value contracts and permits were reviewed by the TTO.
7 FINANCIAL AID:
7.1 Access
Students with proven academic record and financial need qualify for financial assistance.
7.2 Provision
Financial Aid Provision for 2017
• Inadequacy of the funding model (including over-dependence on subsidy and fees, specifically as a result of #feesmustfall and in-sourcing).
• Socio-political instability resulting in University disruptions.
• Lack of research and innovation optimisation resulting in lost opportunities to generate additional third stream income.
• Possible non achievement of strategic goals due to the lack of inclusive organisational culture at the University;
• Risk of a decrease in academic standards due to poor integration and consolidation across all campuses which could also lead to increased operating expenses due to non-integration of various campuses at a business level.
• Risk of increase in drop out rates, decrease in throughput and success rates resulting in the non achievement of agreed DHET targets and loss of income.
• Ineffective business model resulting in ineffective co-ordination between academic units, support units and student affairs.
• Lack of financial resources to fund high performing students who cannot afford fees during the academic progression.
• Lack of experienced and qualified academic staff and researchers.
• The instability of the IT infrastructure may adversely affect a number of areas, including the academic programmes (e-learning and class tests), research initiatives as well as the administrative operations of CPUT.
NOTE: The 23 878 represents the number of awards, not headcount, as some students at times receive multiple awards
8 RISKS TO THE ACADEMIC PROJECT
During 2016 CPUT commissioned a risk assessment workshop with senior management and head of divisions at the University.
As a result of this workshop following top ten risks were identified:
These risks have been included in the Institutional risk register and mitigation strategies have been developed for each of these risks. Throughout 2017 progress in addressing these risks was reported to the Quality Assurance and Risk Management Committee, a joint committee of Senate and Council.
DR CHRIS NHlAPo Acting Vice-Chancellor
65
CATEGORY TOTAL NUMBER OF AWARDS Nominated Bursaries R127 673 279 5 519 NSFAS R351 539 013 17 363 University Administered R3 384 720 163 Work Study Program R6 185 461 833 R488 782 473 23 878
66
NNUAL
2017
A
R EPORT
Report on Transformation
CPUT has, since 2015, been guided in its Human Capital and Transformation initiatives by the CPUT Transformation, Social Cohesion and Diversity Charter.
This Charter is CPUT’s blueprint for the process of embedding transformation, enhancing social cohesion and engaging with diversity in the fabric and culture of the Institution. These three tenets can best be realized through transformative processes being pursued in the employment of staff, curriculum development, teaching and learning, student engagement and governance; underpinned by democracy and transparency. The CPUT Social Cohesion and Diversity Charter contains the following principles, each described in the Charter:
• Equity and Redress
• Access, Retention and Success
• Non-Racism and Non-Discrimination
• Diversity
• Conducive Working Climate
• Gender
Within this context the comprehensive Transformation Strategy that was approved in 2013 is being executed and remains the driver for Institutional Transformation Plans.
Unfortunately, the debilitating turbulence experienced at CPUT during 2017 made it extremely difficult, and at times impossible, to pursue the various aspects of the Transformation Strategy: the focus had to be directed towards creating and maintaining order and stability so that practical, day to day tasks could be completed to ensure the smooth operation of the Institution.
This situation was aggravated by the absence of both a Director for Transformation and an Employment Equity Officer.
In spite of the turbulent and challenging events of 2017 and the focus on sustaining operational
performance, the challenges faced and reflected on, have resulted in a recognition and acceptance of the need for significant changes which, it is anticipated, will lead to a new era of transformation in CPUT.
Central to this recognition is a fundamental acceptance of the non-negotiable need for a clear focus on the development of and execution of the Transformation Strategy.
The strategic priorities, given the events of 2017 and the commitment to the Charter and Transformation Strategy are:
• the renewal and reinforcement of workplace values and supporting behaviour throughout the Institution
• a passionate focus on student centeredness.
• a call for all CPUT leaders to commit to building a culture of excellence founded on a commitment to action, strongly supported and endorsed by the CPUT Council Chair and Council members through strong direction and governance
This will position CPUT both philosophically and practically as a place of higher learning to which every CPUT community member is committed and in which every CPUT community member visibly participates.
Current Human Capital and Transformation initiatives which are in various stages of progress are:
• New thinking and energy from established current and new transitional leaders in various senior key roles with a common focus on the process of realising the CPUT Vision 2020. This will also lead to a new permanent leadership structure in the year ahead which will reinforce and accelerate the process which has already commenced. This has been supported by the retention of many committed stakeholders, students and staff who courageously continue to support the CPUT Vison 2020, amidst the turbulence and instability experienced in 2017. This has visibly demonstrated a shared dedication to pursue the goals of an Institution of higher learning committed to contributing to South Africa.
• A leadership focus on direction, culture and strategy implementation with the aim of realising Vision 2020
67
and beginning to shape Vision 2030. Some of the key developments illustrating this focus are:
• The welcoming back into the CPUT community of some 960 service employees; this has established a benchmark of contribution towards upliftment and the creation of a more equal society. This has been a challenging process but it is firmly believed that it will enhance the CPUT workplace today, and in future.
• Processes and barriers that hamper the achievement of our standards of excellence have been identified and plans are being put in place to address these, thereby creating a better future for the CPUT community. This means a focus on creating a quality workplace with much improved service division service-centeredness.
• The appointment of a new Director for Transformation who commences early in 2018.
• The optimisation of Employment Equity planning and execution processes, also in 2018; supported by a new EE Officer.
• The establishment of mediation and conflict resolution processes to ameliorate the profoundly negative effect of continuous, often unresolved complaints and grievances from stakeholders
• The provision of support and coaching by Human Capital practitioners to assist CPUT leadership and staff in coping with the demands of working in a turbulent and challenging higher education work environment
• The introduction of a renewed Performance Leadership system which will reinforce the move towards a more desired culture, as identified by the culture survey communicated in 2015. This entails developing a work place where leaders will genuinely engage and recognise the contribution of their team members, while also providing a workplace with clear accountability for all to continuously improve collaborative workplace performance. So far some 120 members of management have attended development workshops in support of this process of needed change.
• A multi-rating 360-degree feedback system has also been devised to provide leaders with feedback, to help create the desired culture which will assist CPUT in transforming from its current, somewhat uncertain state, to an Institution where clear and transparent leadership practices support the consistent application of
fair and transparent systems and processes.
• The need, in some cases for organisation structure changes and re-design was also identified. This will lead to the reshaping of a number of units, faculties and divisions into transformed entities to meet the planned changes required for the current and desired future CPUT.
• A previously completed student residence survey has provided valuable information for new plans which have been developed for implementation in 2018.
The turbulence and challenges of 2017 have resulted in CPUT embarking on a much more deliberate and focussed path toward the creation of an exciting visiondriven future based on a strong culture. Transformation plans conceived in 2017 as well as several new initiatives will be communicated, consulted on and executed. Many change challenges exist and there is a reliance on the CPUT community to embrace a vision for a future focussed on establishing “One Smart CPUT”. This will require a collaborative effort based on teamwork, partnership, mutual respect and a striving to have CPUT compare and excel relative to the best of Universities of Technology, nationally and internationally.
NojozI (MS) Chairperson of Council
DR CHRIS NHlAPo Acting Vice-Chancellor
68 A NNUAL R
2017
EPORT
NoGolIDE
This Charter is CPUT’s blueprint for the process of embedding transformation, enhancing social cohesion and engaging with diversity in the fabric and culture of the Institution.
Annual Financial Review
The University’s financial reporting and preparation of financial statements is in accordance with International Financial Reporting Standards (IFRS) as well as the Department of Higher Education and Training (DHET) reporting requirements for Higher Education Institutions.
With the advent of the #FeesMustFall protests in 2015, 2016 and 2017, the core income stream of the University, namely the subsidies and tuition fees, were adversely affected and have not kept pace with cost increases for personnel costs and other operating expenses. Similarly the level of student debt has grown exponentially when compared with prior years and is placing the continued sustainability of the University in question.
The impact of a reduction in the core income stream has resulted in the University’s inability to invest in and upgrade the capital infrastructure of the University as part of the consolidation process. The ability of the University to increase its Residential offering has also been impacted as a result of the strain on its cash flow. The dependency on the Department of Higher Education and Training (DHET) to fund backlog maintenance and residential projects continues to escalate.
Management sets budget directives annually for the next budget year which stem from the Vision 2020, specific priority projects and the CPUT strategy. Due to the pressure placed on the University’s cash flow, the University has not been able to generate sufficient funds to maintain both the day to day operational needs of the Institution as well as adequately fund the capital infrastructure and other strategic initiatives. The budgeting processes are performed by various Committees that are representative of the broader University stakeholders.

69
The budget forms part of the Annual Performance Plan which includes a three year budget projection, cash flow projection and capital expenditure projections.
The University has not been able to continue its turnaround strategy as CPUT budgeted for a recurrent surplus of R542k in 2017 (deficit of R8.6 million in 2016). This financial objective was unfortunately not achieved with the University reporting an actual net recurrent deficit of R40.6 million for 2017 (actual recurrent deficit in 2016 was R181.6 million). The key reasons for the negative financial performance during 2017 being:
• Increase in personnel overheads of 10.2% (R130 million). Of this a 1% salary increase was approved over and above the 6% provided for in the 2017 budget.
• Increase in security charge due to student protest of R22 million.
• Rental of buildings increased by a further 14.5% due to additional residences beds being leased.
• Impairment of investments of R17.6 million.
• Student transport increasing by 22.6% due to additional residences being utilised.
• WCCN agency agreement payment of R28 million for the training of Nursing students.
Key highlights from the Comprehensive Income Statement for the year ended 31 December 2017 were as follows:
1. Other operating expenses increased by 9.4% compared to increases of 11.7% in 2016. There were significant increases in unbudgeted costs as a result of the #FeesMustFall campaign at the beginning of the financial year in respect of additional security cost.
2. The student residences reported a net recurrent deficit of R779k for 2017 (2016: recurrent deficit of R 25,3million). This is as a result of an additional bad debt provision of R130 million processed at year end that has been apportioned for residences. The target is always to ensure that residences breakeven and are self-sustaining.
3. State appropriations – Although subsidies and grants have increased by 21.4% to R1 252 billion (2016 – R1 031 billion) as a result of an increase in student numbers and a R49 million increase in foundation phase subsidy. The general purpose subsidy from the DHET increased by only 9.95% to R1 074 billion (2016: R977 million). A Missing Middle Grant of R39 million was received in 2017 and not the prior year.
4. Tuition and other fee income increased by 9.8%
to R896 million (2016: R816 million). The increase arose from an increase in student fees of 8% and an increase student intake compared to the 2016 financial year. The increase in residence fees of 17.9% is as a result an increase in residence fees of 8% and additional residence beds taken up at Park Central, Toplin House and Kruskal.
5. Gifts & Donations increased by 49.9% to R137.2 million (2016: R91.5 million). The increase relates to an increase of nominated bursaries received from various donors for 2017.
6. Interest and dividends received were R79 million (2016: R74 million). Interest rates have been fairly flat over the past two years. The increase in the bank balance had a positive impact on interest returns.
7. Depreciation of assets have increased from R60.6 million in 2016 to R83.5 million in 2017, as a result of splitting land and buildings during the year. Depreciation has increased by R22.9 million and is mainly due to a reversal of building depreciation in 2016. This has not been repeated as a full investigation is being done on this category and we do not want to skew the expense line at this stage.
8. Total payroll expenses have increased by 10.2% to R1.41 billion (2016: R1.28 billion). The increase in the recurrent payroll expense, in excess of the 6.5% general increase, has resulted from the creation of new posts, regrading and revised salaries.
The key items to highlight in respect of the statement of financial position as at 31 December 2017 are as follows:
1. The net book value of property, plant and equipment has increased by R7 million to R1.930 billion (2016: R1.923 billion). Additions to land and buildings and leasehold improvements were R32.6 million in 2017. The additions relate to the following building projects: HDI Electrical Engineering, Chemical Engineering and Education Mowbray and Wellington. The movables additions include R27.7 million in respect of furniture & equipment attributable to the furnishing of new buildings while R29.9 million is attributable to the purchase of computer equipment as there were significant purchases of computers to replace computers that reached the end of their economic useful lives and attempt to continuously provide students with the latest technology.
2. The market value of investments has decreased by R36 million to R1.245 billion (2016: R1.281 billion). This decrease is due to the withdrawal of funds from our investment managers during the first quarter
70
NNUAL
2017
A
R EPORT
of the financial year to fund recurring operations when the cashflow suffered a huge knock during the #FeesmustFall campaign. As a result student fee receipts decreased significantly during that period.
3. The net student fees outstanding (after provisions) at year end amount to R201.2 million (2016: R146.8 million). The student bad debt expense for the year (i.e. the movement in the provision and actual write-offs in the year) was R183.9 million (2016: R212.1 million). During 2017, R36.6 million of debt older than 3 years and deemed irrecoverable, has been written off (2015 – R75.6 million). The University will continue to engage and participate in the joint efforts of NSFAS and DHET in respect of obtaining additional funding for our students who cannot afford their tertiary education. For future funding creativity is required due to the ever changing and very unpredictable tertiary education landscape.
4. Accounts receivable and prepayments increased from R98.5 million in 2016 to R167.4 million in 2017. This can largely be attributed to an increase in the amount due for other government receivables at year end (R93.3 million) as compared to the same time in 2016 (R41.3 million).
5. Cash and cash equivalents have increased from R146.5 million at the end of 2016 to R211.3 million at the end of 2017. This is mainly due to
the withdrawal from our investment of R146 million.
6. The University has been closely monitoring its cash flow requirements throughout 2017 and has compiled detailed cash flow projections for 2018 to confirm that the University has sufficient funds to meet its obligations in terms of both its normal operations and the major capital commitments in terms of the DHET Infrastructure programme.
7. Total interest bearing borrowings have decreased from R322.1 million at the end of 2016 to R289.0 million at the end of 2017. No new loan agreements were concluded and no new Ministerial requests for new loans were submitted during the 2017 financial year (refer to note 9 to the financial statements).
8. It should be noted that in terms of the statement of financial position, current assets of R586.7 million (2016: R398.8 million) exceeded current liabilities of R380.5 million (2016: R317.9 million) by R206.2 million. However, R78.8 million (2015: R92.5 million) of these liabilities are in respect of leave pay which do not represent a current cash liability. Furthermore, the University’s investment portfolio is reflected as a non-current asset but can be accessed at short notice if required.
A selected list of financial ratios and extracts from the financials for the past 5 years follows below:
71
2017 2016 2015 2014 2013 2012 Current ratio 1,54:1 1,44:1 1,16:1 1,33:1 1,36:1 1,19:1 Quick ratio 1,52:1 1,42:1 1,14:1 1,30:1 1,33:1 1,16:1 Cash ratio 0,56:1 0,45:1 0,32:1 0,61:1 0,43:1 0,74:1 Student debt turnover ratio 1,51:1 2,03:1 1,51:1 1,42:1 1,45:1 1,52:1 Net gain/ (loss) on Residences (million) (R0.78) (R25.30) R10 R6.50 (R12.80) (R18.30) Salaries as % of Recurring Income 56.0% 53.0% 56.5% 53% 54.3% 53.5% Other current operating expenses as % of Recurring Income 41.1% 41.4% 40.7% 36.7% 37.4% 36.0% State Subsidies as % of Recurring Income 49.7% 48.2% 47.4% 47.0% 49.8% 50.6% Tuition and other fee income as % of Recurring Income 35.6% 38.2% 37.4% 34.7% 35.0% 34,6% Private gifts & donations as % of Recurring Income 5.4% 4.3% 6.4% 5.7% 6.3% 6.6% Sustainability ratio 0.72 0.73 0.83 0.96 0.99 0.95 (Council Controlled reserves only) (Council Controlled reserves/ annual recurrent expenditure on council controlled expenditure Sustainability ratio 0.74 0.80 0.95 1.06 1.04 1.05 (Total CPUT reserves) Total CPUT Reserves/ annual recurrent expenditure
KEY HIGHLIGHTS IN FINANCIAL ADMINISTRATION
The budgetary process for 2017 split the budget between Council Controlled Funds, Specifically Controlled and Residences. This included a cleanup of cost centres to ensure that they are correctly allocated to either Council or Specifically funded. Budget was only allocated for recurrent income. Profit on the sale of investments was excluded from the budget process in order to commence the process of reducing dependency on this source of income.
As part of the cleanup process, one of the major interventions was the review of the Establishment Tables. This has enabled us to clearly identify the number of approved Council Controlled posts to which both the Faculties and Support Services need to work towards as an immediate target. The benchmark of 68% of recurrent income has been tested and proven and will now be the target to which the University has to work. Stricter cost management has to be embedded in the everyday life of the University to ensure its future sustainability.
The University’s management wishes to thank Council’s Finance and Audit & Risk Oversight Committees for their guidance and commitment in steering the Institution. A special word of thanks is also extended to the staff of the Finance Division for their selfless efforts and continued commitment in serving CPUT.

PETER DU PlESSIS
Executive Director: Finance
zolA FIHlANI
Chairperson: Finance Committee
72 A NNUAL R EPORT 2017
Statement of Responsibility for the Financial Statements
The Council is accountable for the integrity and fair presentation of the annual financial statements of the Cape Peninsula University of Technology.
The annual financial statements, presented on pages 81 to 131 of this Annual Report, have been prepared in accordance with International Financial Reporting Standards (IFRS) and the requirements of the Minister of Higher Education and Training as prescribed by the Higher Education Act, 1997 (Act No.101 of 1997 as amended), and include amounts based on judgments and estimates made by management. The Council is also responsible for the University’s system of internal financial control. These are designed to provide reasonable, but not absolute, assurance as to the reliability of the annual consolidated financial statements. The Council also prepared other information as required to be included in this Annual Report and is responsible for
both its accuracy and consistency with the financial statements.
The “going concern” basis has been adopted in preparing the financial statements. Nothing has come to the attention of Council to indicate that any material breakdown in the functioning of the system, procedures and controls has occurred during the year under review. The Council also has no reason to believe that the Cape Peninsula University of Technology is not a “going concern” in the foreseeable future, based on forecasts and available cash resources. The viability of the Cape Peninsula University of Technology is supported by the content of the financial statements.
The financial statements have been audited by the independent accounting firm, KPMG Inc., who were given unrestricted access to all financial records and related data, including minutes of meetings of the Council and all its committees. The Council believes that all representations made to the independent auditors during their audit were valid and appropriate.
Approval of the Financial Statements
The annual financial statements on pages 81 to 131 were approved by the Council of the Cape Peninsula University of Technology on 23 June 2018 and are signed on its behalf by:
NoGolIDE NojozI (MS) Chairperson of Council
DR CHRIS NHlAPo Acting Vice-Chancellor
MR PETER DU PlESSIS Executive Director: Finance
73
74 A NNUAL R EPORT 2017
75
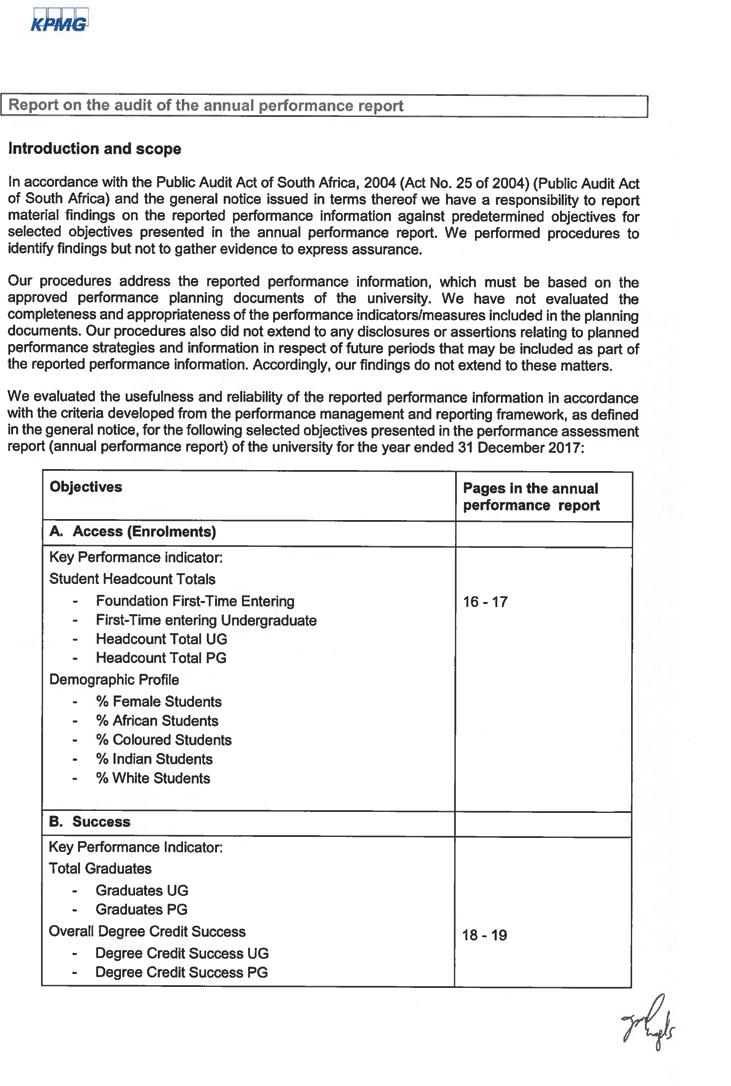
76
NNUAL
2017
A
R EPORT
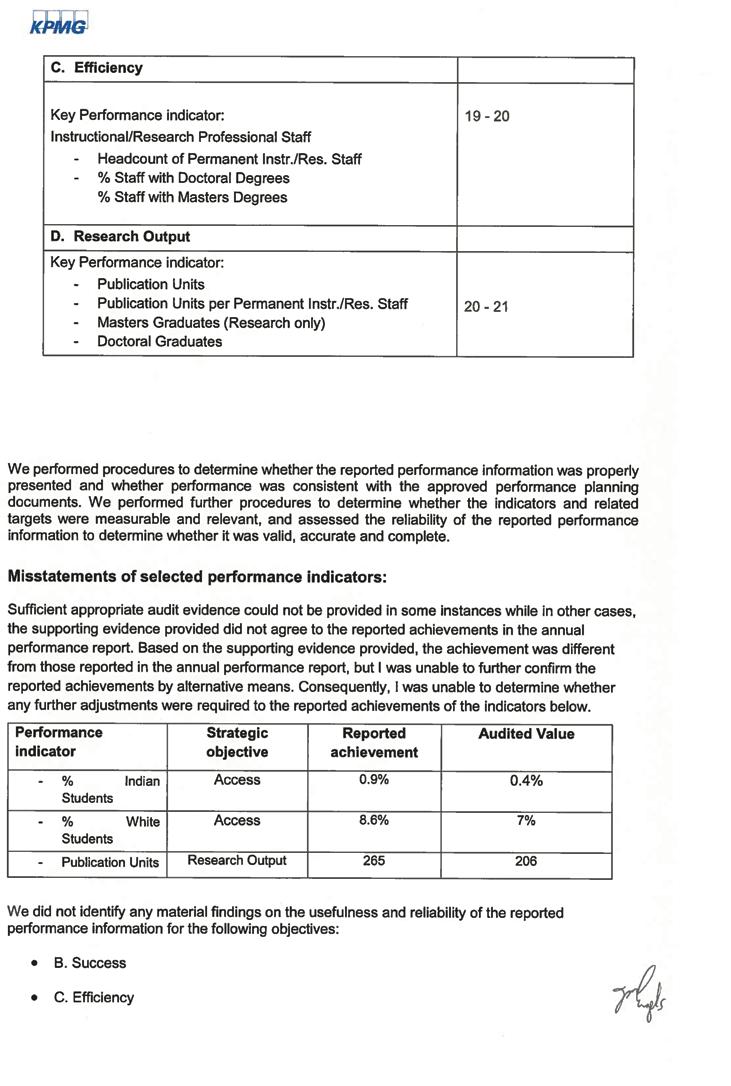
77
78
NNUAL
2017
A
R EPORT
79
Financial Statements
for the year ended 31 December 2017
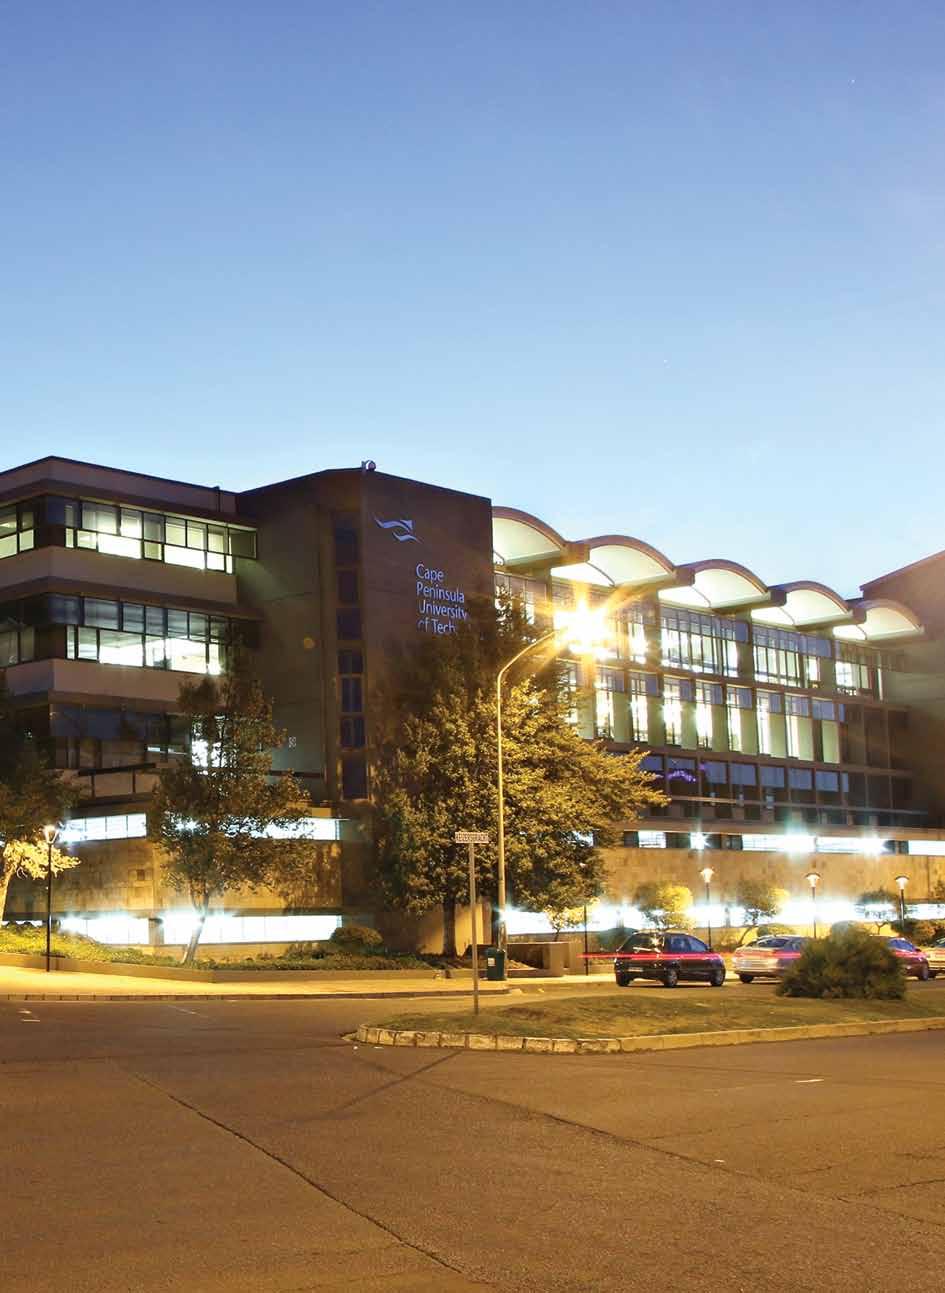
80 FINANCIAL STATEMENTS 2017
STATEMENT OF FINANCIAL POSITION as
at 31 December 2017
81
2017 2016 Note R R ASSETS Non-current assets 3 175 342 252 3 204 460 706 Property, plant and equipment 2 1 929 939 962 1 922 943 530 Available-for-sale investments 3 1 245 402 290 1 281 517 176 Current assets 586 717 854 398 832 566 Inventory 4 6 756 034 7 029 823 Accounts receivable and prepayments 5 167 448 170 98 490 818 Student fees receivable 6 201 192 688 146 843 762 Cash and cash equivalents 7 211 320 962 146 468 163 Total assets 3 762 060 106 3 603 293 272 FUNDS AND LIABILITIES Accumulated Funds 1 899 173 754 1 857 690 167 Council controlled unrestricted funds 1 331 974 945 1 282 883 656 Specifically restricted funds 314 008 097 265 475 400 Available-for-sale reserve 253 190 712 309 331 111 Non-current liabilities 1 482 430 724 1 427 710 680 Interest-bearing borrowings 8 253 222 924 288 889 859 Post-retirement medical aid obligation 10.2 494 192 133 470 221 457 Pension fund obligation 10.3 11 010 025 9 798 000 Government grants – deferred income 16.2 –16.6 724 005 642 658 801 364 Current liabilities 380 455 628 317 892 425 Accounts payable and accrued liabilities 11 256 569 685 182 862 477 Employee leave liability 10.1 78 810 204 92 516 493 Current portion of interest-bearing borrowings 8 35 783 439 33 221 155 Government grants – deferred income 16.2 –16.6 9 292 300 9 292 300 Total funds and liabilities 3 762 060 106 3 603 293 272
FINANCIAL STATEMENTS 2017
STATEMENT OF PROFIT OR LOSS AND OTHER COMPREHENSIVE INCOME for the year ended 31 December 2017
82
2017 2016 Note Council Controlled Unrestricted Specifically Funded Activities Restricted SUB - TOTAL Student & staff Accommodation Restricted TOTAL TOTAL R R R R R R TOTAL INCOME 1 901 451 381 509 203 201 2 410 654 582 254 040 560 2 664 695 142 2 250 998 660 RECURRENT REVENUE 1 756 473 101 509 052 779 2 265 525 880 254 040 560 2 519 566 440 2 139 140 600 State appropriations – subsidies and grants 12 1 097 693 136 154 670 279 1 252 363 415 - 1 252 363 415 1 031 808 014 Tuition and residence fees 562 709 410 90 823 831 653 533 241 242 383 634 895 916 875 816 173 066 Income from contracts: 3 087 653 73 978 555 77 066 208 - 77 066 208 64 500 038 for research 429 326 61 168 999 61 598 325 - 61 598 325 39 660 963 for other activities 2 658 327 12 809 556 15 467 883 - 15 467 883 24 839 075 Rendering of services 13 583 033 52 340 399 65 923 432 11 656 926 77 580 358 61 088 691 Private gifts and donations (62 893) 137 239 715 137 176 822 - 137 176 822 91 520 555 Sub-total 1 677 010 339 509 052 779 2 186 063 118 254 040 560 2 440 103 678 2 065 090 364 Interest income and dividends 13 79 462 763 - 79 462 763 - 79 462 763 74 050 236 NON-RECURRENT INCOME 144 978 280 150 422 145 128 702 - 145 128 702 111 858 060 Loss on scrapping/disposal of property, plant & equipment 10 810 (209 753) (198 943) - (198 943) ( 266 138) Realised gains on sale of investments 3 141 670 474 - 141 670 474 - 141 670 474 101 499 901 Other non-recurrent income 3 296 996 360 175 3 657 171 - 3 657 171 10 624 297 TOTAL ExPENDITURE 1 862 256 215 460 670 504 2 322 926 719 254 819 500 2 577 746 219 2 325 719 251 RECURRENT ExPENDITURE 1 844 698 308 460 670 504 2 305 368 812 254 819 500 2 560 188 312 2 320 725 524 Personnel 15 1 229 036 393 162 821 413 1 391 857 806 19 785 002 1 411 642 808 1 281 444 331 Academic professional 637 945 587 88 911 499 726 857 086 2 025 330 728 882 416 685 599 564 Other personnel 591 090 806 73 909 914 665 000 720 17 759 672 682 760 392 595 844 767 Other operating expenses 14 561 039 540 272 682 195 833 721 735 202 964 660 1 036 686 395 947 349 040 Depreciation 2 53 501 652 25 166 896 78 668 548 4 860 499 83 529 047 60 548 770 Sub-total 1 843 577 585 460 670 504 2 304 248 089 227 610 161 2 531 858 250 2 289 342 141 Finance costs 9 1 120 723 - 1 120 723 27 209 339 28 330 062 31 383 383 NON-RECURRENT ExPENDITURE 17 557 907 - 17 557 907 - 17 557 907 4 993 727 Impairment of investments 3 17 557 907 - 17 557 907 - 17 557 907 4 993 727 NET SURPLUS/ (LOSS) FOR THE YEAR 39 195 166 48 532 697 87 727 863 (778 940) 86 948 923 (74 720 591) OTHER COMPREHENSIVE INCOME (45 465 336) - (45 465 336) - (45 465 336) (78 183 548) Items which are subsequently reclassifiable to surplus/(loss): Fair value gains on available-for-sale investments 3 85 530 075 - 85 530 075 - 85 530 075 6 616 274 Realised gains on sale of investments 3 (141 670 474) - (141 670 474) - (141 670 474) (101 499 901) Items which will never be reclassified to surplus/(loss): Remeasurements of the pension fund obligation 10.3 (1 273 712) - (1 273 712) - (1 273 712) (870 000) Remeasurements of the post-retirement medical aid obligation 10.2 11 948 775 - 11 948 775 - 11 948 775 17 570 079 TOTAL COMPREHENSIVE INCOME (6 270 170) 48 532 698 42 262 528 ( 778 940) 41 483 588 (152 904 139) NET RECURRENT (LOSS) (88 225 207) 48 382 275 (39 842 932) ( 778 940) (40 621 872) (181 584 924)
STATEMENT OF PROFIT OR LOSS AND OTHER COMPREHENSIVE INCOME for the year ended 31 December 2017
83 2016 Note Council Controlled Unrestricted Specifically Funded Activities Restricted SUB - TOTAL Student & staff Accommodation Restricted TOTAL R R R R R TOTAL INCOME 1 688 679 839 348 914 937 2 037 594 775 213 403 885 2 250 998 660 RECURRENT REVENUE 1 578 312 619 347 393 970 1 925 706 589 213 434 011 2 139 140 600 State appropriations – subsidies and grants 12 982 655 698 49 152 316 1 031 808 014 - 1 031 808 014 Tuition and residence fees 512 924 957 97 627 409 610 552 366 205 620 700 816 173 066 Income from contracts: 5 763 328 58 736 710 64 500 038 - 64 500 038 for research 247 843 39 413 120 39 660 963 - 39 660 963 for other activities 5 515 485 19 323 590 24 839 075 - 24 839 075 Rendering of services 5 290 525 47 984 855 53 275 380 7 813 311 61 088 691 Private gifts and donations (2 372 125) 93 892 680 91 520 555 - 91 520 555 Sub-total 1 504 262 383 347 393 970 1 851 656 353 213 434 011 2 065 090 364 Interest income and dividends 13 74 050 236 - 74 050 236 - 74 050 236 NON-RECURRENT INCOME 110 367 220 1 520 966 111 888 186 (30 126) 111 858 060 Loss on scrapping/disposal of PPE (209 712) (26 300) ( 236 012) (30 126) (266 138) Realised gains on sale of investments 3 101 499 901 - 101 499 901 - 101 499 901 Other non-recurrent income 9 077 031 1 547 266 10 624 297 - 10 624 297 TOTAL ExPENDITURE 1 755 361 976 331 694 067 2 087 056 043 238 663 208 2 325 719 251 RECURRENT ExPENDITURE 1 750 368 249 331 694 067 2 082 062 316 238 663 208 2 320 725 524 Personnel 15 1 134 273 883 127 509 699 1 261 783 582 19 660 749 1 281 444 331 Academic professional 619 523 081 64 070 762 683 593 843 2 005 721 685 599 564 Other personnel 514 750 802 63 438 937 578 189 739 17 655 028 595 844 767 Other operating expenses 14 573 119 540 190 554 915 763 674 455 183 674 585 947 349 040 Depreciation 2 41 546 263 13 629 453 55 175 716 5 373 054 60 548 770 Sub-total 1 748 939 686 331 694 067 2 080 633 753 208 708 388 2 289 342 141 Finance costs 9 1 428 563 - 1 428 563 29 954 820 31 383 383 NON-RECURRENT ExPENDITURE 4 993 727 - 4 993 727 - 4 993 727 Impairment of investments 3 4 993 727 - 4 993 727 - 4 993 727 NET (LOSS) FOR THE YEAR (66 682 137) 17 220 869 (49 461 268) (25 259 323) (74 720 591) OTHER COMPREHENSIVE INCOME (78 183 548) - (78 183 548) - (78 183 548) Items which may be reclassified to surplus/(loss): Fair value gains on available-for-sale investments 3 6 616 274 - 6 616 274 - 6 616 274 Realised gains on sale of investments 3 (101 499 901) - (101 499 901) - (101 499 901) Items which will never be reclassified to surplus/(loss): Remeasurements of the pension fund obligation 10.3 (870 000) - (870 000) - (870 000) Remeasurements of the post-retirement medical aid obligation 10.2 17 570 079 - 17 570 079 - 17 570 079 TOTAL COMPREHENSIVE INCOME (144 865 685) 17 220 869 (127 644 816) (25 259 323) (152 904 139) NET RECURRENT LOSS (172 055 630) 15 699 903 (156 355 727) (25 229 197) (181 584 924)
FINANCIAL STATEMENTS 2017
STATEMENT OF CHANGES IN FUNDS for the year ended 31 December 2017
84
Council Controlled Unrestricted Funds Specifically Restricted Funds Student & staff Accommodation Funds Available for Sale Reserve TOTAL Note R R R R R Balance at 31 December 2015 1 358 125 037 248 254 531 - 404 214 738 2 010 594 306 Total comprehensive income (49 982 059) 17 220 869 (25 259 323) (94 883 627) (152 904 139) Net surplus for the year (66 682 137) 17 220 869 (25 259 323) - (74 720 591) Remeasurements of the pension fund obligation (870 000) - - - ( 870 000) Remeasurements of the post-retirement medical aid obligation 17 570 079 - - - 17 570 079 Gains on available-for-sale investments - - - (94 883 627) (94 883 627) Transfers – credits/(debits) (25 259 323) - 25 259 323 -Balance at 31 December 2016 1 282 883 656 265 475 400 - 309 331 111 1 857 690 167 Total comprehensive income 49 870 229 48 532 698 (778 940) (56 140 399) 41 483 588 Net (loss)/surplus for the year 39 195 166 48 537 698 (778 940) - 86 948 924 Remeasurements of the pension fund obligation (1 273 712) - - - (1 273 712) Remeasurements of the post-retirement medical aid obligation 11 948 775 - - - 11 948 775 Gains on available-for-sale investments - - - (56 140 399) (56 140 399) Transfers – credits/(debits) (778 940) - 778 940 -Balance at 31 December 2017 1 331 974 945 314 008 098 - 253 190 712 1 899 173 755
STATEMENT OF CASH FLOWS for the year ended 31 December 2017
85
2017 2016 Note R R Cash flow from operating activities Cash receipts from government 1 121 571 838 912 129 385 Cash receipts from students and other customers 1 065 499 082 1 008 176 294 Cash paid to employees and suppliers (2 284 599 378) (2 051 724 042) Cash utilised in operations (97 528 458) (131 418 363) Dividends received 13 16 459 130 18 020 520 Interest income 13 63 003 633 56 029 715 Finance costs 9 (28 330 062) (31 383 383) Net cash inflow from operating activities (46 395 757) (88 751 511) Cash flow from investing activities Purchase of property, plant and equipment 2 (91 130 499) (149 249 704) Proceeds from disposal of property, plant and equipment 406 078 6 099 Purchase of investments 3 (193 871 331) (140 881 885) Proceeds from disposals of investments 3 297 958 385 325 914 977 Cash utilised in investing activities 13 362 632 35 789 487 Cash from financing activities Repayments of loans (33 104 651) (30 624 719) Infrastructure and other grants received 16.2 – 16.6 130 990 574 140 326 658 Cash flows from financing activities 97 885 923 109 701 939 Increase in cash and cash equivalents 64 852 799 56 739 915 Cash and cash equivalents at beginning of year 146 468 163 89 728 248 Cash and cash equivalents at end of year 7 211 320 962 146 468 163
FINANCIAL STATEMENTS 2017 STATEMENT OF CASH FLOWS for the year ended 31 December 2017
86
2017 2016 Note R R Reconciliation of net surplus to cash generated from operations Net (deficit)/ surplus 86 948 923 (74 720 591) Adjusted for: Depreciation on property, plant and equipment 2 83 529 047 60 548 770 Government grants released to income 16.2 – 16.6 (65 786 297) (37 443 645) Loss on sale of property, plant and equipment 198 943 266 138 Interest income 13 (63 003 633) (56 029 715) Dividends received 13 (16 459 130) (18 020 520) Finance costs 9 28 330 062 31 383 383 Impairment of investments 17 557 907 4 993 727 Realised gains on sale of investments (141 670 474) (101 499 901) Remeasurement of the pension fund obligation (1 273 712) (870 000) Remeasurement of the post-retirement medical aid obligation 11 948 775 17 570 079 (59 679 589) (173 822 275) Movement in working capital Increase/ (decrease) in employee leave liability 10.1 (13 706 289) 11 209 539 Increase in employee benefits 10.2 – 10.3 25 182 701 24 794 747 Accounts receivables, student fees, non-current receivables and prepayments (123 306 277) (20 956 310) Inventories 273 789 ( 41 515) Accounts payable, accrued liabilities and student deposits 73 707 207 27 397 450 Cash (utilised in)/ generated from operations (97 528 458) (131 418 363)
NOTES to the Financial Statements for
the year ended 31 December 2017
87
N OTES TO THE FINANCIAL STATEMENTS for
the year ended 31 December 2017
1 BASIS oF PREPARATIoN AND ACCoUNTING PolICIES
1.1 General Information and Basis of preparation
The Cape Peninsula University of Technology was established on 1 January 2005 with the merger of the former Peninsula and Cape Technikons and is domiciled in South Africa. The University’s registered office is at the Administration Building, Symphony Road, Bellville South, 7530.
The financial statements of the University for the year ended 31 December 2017 were authorised for issue in accordance with a resolution of Council on 23 June 2018.
The principal activities of the University relate to teaching, research and the providing of residential accommodation to students.
STATEMENT oF CoMPlIANCE
The financial statements of the Cape Peninsula University of Technology have been prepared in accordance with and comply with International Financial Reporting Standards (IFRS) and, in the manner required by the Minister of Higher Education and Training in terms of S41 of the Higher Education Act 101 1997 (as amended).
BASIS oF PREPARATIoN
The accounting policies set out below are consistent with those applied in the previous year except as stated below. The financial statements have been prepared on a going concern and historical cost basis, except where stated otherwise (refer accounting policies). The financial statements are presented in Rands and all amounts rounded to the nearest rand.
CHANGE IN ACCoUNTING PolICIES Standards issued but not yet effective
A number of new standards are effective for annual periods beginning after 1 January 2018 and earlier application is permitted; however, the University has not early adopted the new or amended standards in preparing these financial statements.
IFRS 9 FINANCIAl INSTRUMENTS
Nature of change:
i Classification - Financial Assets
IFRS 9 contains a new classification and
measurement approach for financial assets that reflects the business model in which assets are managed and their cash flow characteristics.
IFRS 9 contains three principal classification categories for financial assets: measured at amortised cost, FVOCI and FVTPL. The standard eliminates the existing IAS 39 categories of held to maturity, loans and receivables and available for sale.
The University’s equity and debt instruments are currently classified as available for sale financial assets for which a fair value movement is recognised through other comprehensive income while any impairment losses are recognised in profit or loss. Based on its assessment, the University does not believe that the new classification requirements will have a material impact on its accounting for equity and debt instruments that are managed on a fair value basis. At 31 December 2017, the University had equity and debt instruments classified as available-for-sale financial instruments with a fair value of R1 245 402 290 which are held for long-term strategic purposes. Investments classified as equity instruments amounted to R911.7million at 31 December 2017 and investments classified as debt amounted to R333.7 million.
Equity financial instruments
Under IFRS 9, the University can elect to designate these investments as measured at FVOCI. If this election is made, all fair value gains and losses will be reported in OCI, no impairment losses will be recognised in profit or loss and no gains or losses will be reclassified to profit or loss on disposal.
In the 2017 financial year impairment losses on equity investments of R17.6 million (2016: R5 million) were recognised in profit or loss while realised gains on disposal of investments recycled to profit or loss amounted to approximately R103.7 million. Once IFRS 9 is implemented impairment losses will be recognised in OCI with no reclassification of gains or losses upon disposal to profit or loss.
Debt financial instruments
The university’s objective is to both collect
88 2017
N OTES TO THE FINANCIAL STATEMENTS
(continued) for the year ended 31 December 2017
contractual cash flows and to sell debt financial instruments which will result in the debt instruments being classified at FVOCI.
In terms of this classification interest revenue, credit impairment & foreign exchange gains or losses will be recognised in profit or loss while other gains and losses are recognised in OCI. On derecognition, cumulative gains or losses in OCI will still be reclassified to profit or loss. This treatment is largely in line with the current treatment of debt financial instruments in the 2017 financial year with some refinement required for credit losses relating to debt financial instruments which will be recorded in profit or loss. In the 2017 financial year, approximately R38m realised gains on disposal of investments were recycled to profit or loss. Historically the University has not incurred significant credit losses on debt instruments.
ii Impairment - Financial Assets and contract assets
IFRS 9 replaces the ‘incurred loss’ model in IAS 39 with a forward-looking ‘expected credit loss’ (ECL) model. This will require considerable judgement about how changes in economic factors affect ECLs, which will be determined on a probability-weighted basis.
The new impairment model will apply to financial assets measured at amortised cost and to contract assets.
Under IFRS 9, loss allowances will be measured on either of the following bases:
- 12-month ECLs: these are ECLs that result from possible default events within the 12 months after the reporting date; and
- lifetime ECLs: these are ECLs that result from all possible default events over the expected life of a financial instrument.
Lifetime ECL measurement applies if the credit risk of a financial asset at the reporting date has increased significantly since initial recognition and 12-month ECL measurement applies if it has not. An entity may determine that a financial asset’s credit risk has not increased significantly if the asset has low credit risk at the reporting date. However, lifetime ECL measurement always applies for student and trade receivables and contract assets
without a significant financing component. The University has chosen to apply this policy also for trade receivables and contract assets with a significant financing component.
The University has a structured process to collect student fees in that it usually requires students to pay an initial instalment in respect of tuition and accommodation fees at registration. Tuition and residence fees are invoiced in January and February. In addition, students with an outstanding balance from the previous year, are requested to sign a payment plan agreement whereby monthly debit orders are uploaded. Both the collection procedures and the assessment of collection patterns after year-end, are taken into account in calculating the current allowance for doubtful debt. The University does therefore not expect a significant increase in the loss allowance relating to tuition and residence fees. Trade receivables (other than student receivables) approximates R30 548 360 (after impairment of R21 088 046) representing 18.24% of accounts receivable and prepayments at 31 December 2017. It is unlikely for the new impairment requirements of IFRS 9 to have a material impact on trade receivables of the University, as the carrying amount is not material at the reporting date.
iii Cash and cash equivalents
The cash and cash equivalents of the University are held with major South African banking Institutions with strong credit ratings as at 31 December 2017.
The University considers that its cash and cash equivalents have low credit risk based on the external credit ratings of these counterparties.
The University estimated that the application of IFRS 9’s impairment requirements at 1 January 2018 will have a minimal impact on the cash and cash equivalents held at the reporting date.
iv Classification - Financial liabilities
IFRS 9 largely retains the existing requirements in IAS 39 for the classification of financial liabilities.
However, under IAS 39 all fair value changes
89
TO THE FINANCIAL STATEMENTS
(continued) for the year ended 31 December 2017
of liabilities designated as at FVTPL are recognised in profit or loss, whereas under IFRS 9 these fair value changes are generally presented as follows:
· the amount of change in the fair value that is attributable to changes in the credit risk of the liability is presented in OCI; and the remaining amount of change in the fair value is presented in profit or loss.
The University has not designated any financial liabilities at FVTPL at the reporting date and it has no current intention to do so and therefore no impact is expected
DISCloSURE
IFRS 9 will require extensive new disclosures, in particular about credit risk and ECLs.
The University is in the process of analysing whether there are any data gaps against current processes. Once these have been identified they will start implementing the system and control changes that it believes will be necessary to capture the required data.
TRANSITIoN
Changes in accounting policies resulting from the adoption of IFRS 9 will generally be applied retrospectively, except as described below.
The University will take advantage of the exemption allowing it not to restate comparative information for prior periods with respect to classification and measurement (including impairment) changes. Differences in the carrying amounts of financial assets and financial liabilities resulting from the adoption of IFRS 9 will be recognised in accumulated funds at 1 January 2018.
IFRS 15: REVENUE FRoM CoNTRACTS WITH CUSToMERS
Name of Change
IFRS 15 establishes a comprehensive framework for determining whether, how much and when revenue is recognised. It replaces existing revenue recognition guidance, including IAS 18 Revenue, IAS 11 Construction Contracts and IFRIC 13 Customer Loyalty Programmes.
The new standard contains a single model that applies to contracts with customers and is based on the principle that revenue is recognised when
control of a good or service transfers to a customer.
Impact
The main sources of revenue for the University is from state appropriations, which is accounted for as a government grant and tuition and other fees earned annually. Together these revenue streams make up approximately 85% of the income of the University with limited or no impact from the adoption of IFRS 15.
Management has started to assess the effects of applying the new standard on the University’s financial statements and has identified the following areas that will be affected: research contract income and other activity contract income (in aggregate representing 3% of the University’s income) and will under IFRS 15 be recognised when the related performance obligations are satisfied.
The application of IFRS 15 may result in the identification of separate performance obligations in relation to these research and other activity contracts which could affect the timing of the recognition of revenue going forward. In addition, costs to obtain or fulfil these contracts would be capitalised and deferred over the term of the specific research contract.
Transition
The University plans to adopt IFRS 15 using the cumulative effect method, with the effect of initially applying this standard recognised at the date of initial application (i.e. 1 January 2018). As a result, the University will not apply the requirements of IFRS 15 to the comparative period presented.
IFRS 16: lEASES
Name of Change
IFRS 16 replaces existing leases guidance, including IAS 17 Leases, IFRIC 4 Determining whether an Arrangement contains a Lease, SIC15 Operating Leases – Incentives and SIC-27 Evaluating the Substance of Transactions Involving the Legal Form of a Lease.
The standard is effective for annual periods beginning on or after 1 January 2019. Early adoption is permitted for entities that apply IFRS 15 at or before the date of initial application of IFRS 16.
90 2017 N
OTES
N OTES TO THE FINANCIAL STATEMENTS
(continued) for the year ended 31 December 2017
IFRS 16 introduces a single, on-balance sheet lease accounting model for lessees. A lessee recognises a right-of-use asset representing its right to use the underlying asset and a lease liability representing its obligation to make lease payments. There are recognition exemptions for short-term leases and leases of low-value items. Lessor accounting remains similar to the current standard – i.e. lessors continue to classify leases as finance or operating leases.
Impact
The standard will affect primarily the accounting for the University’s operating leases. As at the reporting date, the University has non-cancellable operating lease commitments of R78 613 644see note 19.2.
IFRS 16 will result in the recognition of a lease liability and a corresponding right of use asset. It is anticipated that while the net surplus before depreciation, interest and income tax will improve, depreciation and finance charges will increase as a result of the adoption of IFRS 16.
Transition
As a lessee, the University can either apply the standard using a; - retrospective approach; or - modified retrospective approcah with the optional practical expedients
The lessee applies the election consistently to all of its leases.
The University plans to apply IFRS 16 initially on 1 January 2019, using the modified retrospective approach. Therefore, the cumulative effect of adopting IFRS 16 will be recognised as an adjustment to accumulated funds at 1 January 2019, with no restatement of comparative information.
When applying the modified retrospective approach to leases previously classified as operating leases under IAS 17, the lessee can elect, on a lease-by-lease basis, whether to apply a number of practical expedients on transition. The University is assessing the potential impact of using these practical expedients.
The University is not required to make any adjustments for leases in which it is a lessor
except where it is an intermediate lessor in a sub-lease.
1.2 Significant accounting judgements and estimates judgements
In the process of applying the University’s accounting policies, management has made certain judgements apart from those involving estimations, which have the most significant effect on the amounts recognised in the financial statements as discussed below. Management assesses the University’s assets and liabilities based on the criteria at the reporting date to reach the appropriate conclusions in this regard.
ESTIMATIoN UNCERTAINTY
The key assumptions concerning the future and other key sources of estimation uncertainty at the reporting date, that have a significant risk of causing a material adjustment to the carrying amounts of assets and liabilities as well as the release of income with respect to these assets, within the next financial year are set out below.
STUDENT FEES RECEIVABlE
Management estimates the amounts that it expects to recover from outstanding balances based upon the age profile of the debts outstanding, payment trends experienced in both the current and prior years, and the levels of student registration and payments received from outstanding students post year end as well as events potentially impacting the recoverability of fees receivable. A provision for impairment is raised based on these estimates. The carrying value of student fees receivable at 31 December 2017 was R201 192 688 (2016: R146 843 762) refer Note 6.
INVESTMENTS
The University classifies certain assets as available-for-sale and recognises movements in their fair value in other comprehensive income. When the fair value declines, management makes assumptions about the decline in value to determine whether it is an impairment that should be recognised in income and expenses. An investment is considered impaired if either; the fair value at year end is more than 30% below original cost; or the fair value is below cost for a period of
91
OTES TO THE FINANCIAL STATEMENTS
(continued) for the year ended 31 December 2017
greater than 12 months. At 31 December 2017 impairment losses of R17 557 907 (2016: R4 993 727) have been recognised for available-for-sale investments. The carrying value of investments at 31 December 2017 was R1 245 402 290 (2016: R1 281 517 176) refer Note 3.
DEPRECIATIoN
At each reporting date management reviews the assets within property, plant and equipment to assess whether the useful lives and residual values applied to each asset category are appropriate. With the exception of motor vehicles residual values have generally been assumed to be nil as it is the University’s intention to fully consume assets through use. In determining the expected useful lives of individual assets management has considered the University’s historical patterns of usage as well as future expected usage. The estimates for the expected useful lives of buildings have been based upon the nature and use of the buildings concerned and the type of construction and materials used in construction. The carrying value of property, plant and equipment at 31 December 2017 was R1 929 939 962 (2016: R1 922 943 530). Refer to Note 2 for further detail.
Post-retirement medical aid benefit obligation
The University’s future obligation in respect of post-retirement medical aid contributions is actuarially valued based on the projected unit credit method. For the purpose of the valuation at 31 December 2017 key assumptions were made in respect of the discount rate, expected inflation on medical aid contributions, actual return on plan assets, expected age of retirements and mortality rates. More details on these assumptions are provided in Note 10.2.
The carrying value of the post retirement medical aid obligations at 31 December 2017 is a liability of R494 192 133 (2016: R470 221 457).
PENSIoN FUND oBlIGATIoN
The University provides for its obligations relating to conditional benefits in respect of certain employees who are members of the National Tertiary Retirement Fund. The University’s future obligation in respect of this pension fund obligation is actuarially valued based on the projected unit credit method. For the purpose of the valuation at 31 December 2017 key assumptions were made in respect of the discount rate, expected salary
and pension fund increases, expected return on plan assets, expected age of retirements and mortality rates. More details on these assumptions are provided in Note 10.3.
The carrying value of the obligation as at 31 December 2017 was R11 010 025 (2016: R9 798 000).
1.3 Segment Information
Segmentation provided in the Statement of Comprehensive Income of these financial statements is in terms of the guidelines prescribed by the Department of Higher Education and Training (DHET) and is not required in terms of IFRS 8.
A segment is a recognised component of the University that is engaged in providing products or services that are subject to risks and returns different from those of other segments.
The operating businesses are managed separately but fall under the oversight of the Cape Peninsula University of Technology executive leadership.
CoUNCIl CoNTRollED
The Council controlled segment predominantly represents the teaching component of the Cape Peninsula University of Technology. Decision making rights relating to income earned in this segment rests with Council.
SPECIFICAllY FUNDED ACTIVITIES RESTRICTED
The specifically funded activities restricted consist mainly of research activity and bursary donations. Here decision making rights over income earned and related expenses rest with researchers. Council retains an oversight role in regard to ensuring that expenditure is in accordance with the mandate received from funders.
STUDENT AND STAFF HoUSINg
Student and staff housing relates to the provision of accommodation to students. The availability of this accommodation being a strategic initiative aimed at ensuring that students adopt the Cape Peninsula University of Technology as their preferred place of study.
92 2017
N
N OTES TO THE FINANCIAL STATEMENTS
(continued) for the year ended 31 December 2017
STATEMENT oF CHANGES IN FUNDS
The total comprehensive income generated in the Statement of Comprehensive Income segments is further allocated into additional funds within the Statement of Changes in Funds. Council controlled funds are allocated between unrestricted funds and designated funds, whereby the Council sets aside specific funds for designated purposes. Transfers between these funds are an internal allocation by the University and have no effect on income and expenses.
1.3.1 Accumulated
Funds
Council controlled unrestricted funds reserve
This reserve predominantly represents the cumulative net surplus of the teaching component of the Cape Peninsula University of Technology. The net (loss)/ surplus for the year for the student and staff accommodation is included here.
Specifically restricted funds reserve This reserve comprises the cumulative net surplus of specifically funded activities.
Available-for-sale reserve
This reserve comprises the cumulative net change in the fair value of available-forsale financial assets until the assets are derecognised or impaired.
1.4 Foreign currency translation
The financial statements are presented in Rands, which is the University’s functional and presentation currency.
Transactions in foreign currencies are initially recorded in the exchange currency rate ruling at the date of the transaction.
Monetary assets and liabilities denominated in foreign currencies are retranslated at the rate of exchange ruling at the reporting date. All differences are taken to net surplus or loss in the year in which they arise.
Non-monetary items carried at cost are translated using the exchange rate at the date of the transaction, whilst assets carried at fair value are translated at the exchange rate when the fair
value was determined. When a gain or loss on a non-monetary item is recognised directly in other comprehensive income, any exchange component of that gain or loss shall be recognised directly in other comprehensive income. Conversely, when a gain or loss on a non-monetary item is recognised directly in net surplus or loss, any exchange component of that gain or loss shall be recognised directly in net surplus or loss.
1.5 Revenue recognition
Revenue is measured at the fair value of the consideration received, or receivable excluding discounts, rebates and VAT. Revenue is recognised to the extent that it is probable that the economic benefits will flow to the University and the revenue can be reliably measured. The following specific recognition criteria must also be met before revenue is recognised:
STATE APPRoPRIATIoNS - SUBSIDIES AND GRANTS
Government grants relating to revenue State subsidy and grants for general purposes are recognised in surplus or loss as revenue in the financial year in which they become receivable. Subsidies and grants for specific research purposes are recognised in surplus or loss as revenue in the financial period in which they become receivable to the University in accordance with the relevant conditions of such grants and agreements. Such subsidies and grants are presented separately as revenue in surplus or loss. Subsidies and grants relating to specific expenses incurred by the University are not offset from the related expenses, but are presented separately as revenue in surplus or loss.
GoVERNMENT GRANTS RElATING To ASSETS
When a grant relates to an asset, the fair value is credited to a deferred income account and is released to income over the expected useful life of the relevant asset on a systematic basis.
DESIGNATED INCoME FRoM CoNTRACTS, PRIVATE GIFTS AND DoNATIoNS
Revenue received for designated specific purposes arises from contracts, private gifts and donations. Such revenue is recognised in the financial period in which they become
93
OTES TO THE FINANCIAL STATEMENTS
(continued) for the year ended 31 December 2017
receivable by the University in accordance with the conditions attached to the relevant agreement.
Income from contracts for research activity is recognised over the duration of the associated research activity as determined with reference to the stage of completion. Stage of completion is determined on a cost or time- apportionment basis. Revenue from contracts for other activities is recognised when such activities occur.
Private gifts and donations, whether of cash or assets, are recognised as revenue in the period they are received or receivable only when the University obtains control of these funds, the right to receive it or it is probable that the economic benefits comprising these funds will flow to the University and the amount of the private gifts and donations can be measured reliably.
Private gifts and grants with restrictions or conditions attached are recognised as income if the restrictions and conditions are under the entity’s purview and it is probable that these restrictions and conditions would be met. Alternatively, these funds are recognised as deferred income until the above criteria are fulfilled or when the restrictions or conditions expire.
Income is recognised at the fair value of the private gifts and donations received or receivable. Private gifts and donations in the form of services are measured at the fair value of the services received or the fair value of the asset enhancement resulting from the services. Fair value is the price that would be received to sell an asset or paid to transfer a liability in an orderly transaction between market participants at the measurement date.
TUITIoN AND RESIDENCE FEES
Tuition and residence fees charged are applicable to one academic and financial year and are recognised in revenue in the period to which they relate on a stage of completion basis determined on a time-apportionment basis.
INTEREST INCoME
Revenue is recognised as interest accrues (using the effective interest method that is the rate that discounts estimated future cash receipts through the expected life of the financial instrument to the net carrying amount of the financial asset).
DIVIDENDS
Dividends are recognised when the right to receive payment is established.
RENDERING oF SERVICES
Various academic departments render a range of services to industry. Revenue from rendering of these services is recognised by reference to the stage of completion, determined on a cost or time-apportionment basis, as appropriate of the services involved.
1.6 Retirement benefits
DEFINED CoNTRIBUTIoN RETIREMENT PlAN
Employer contributions to the Cape Peninsula University of Technology Retirement Fund (previously known as the Cape Technikon Retirement Fund) are recognised as expenses as the related service is provided.
DEFINED CoNTRIBUTIoN AND DEFINED BENEFIT RETIREMENT PlAN
Employer contributions to the National Tertiary Retirement Fund (NTRF) are recognised as expenses as the related service is provided.
The NTRF is a defined contribution fund and members were transferred from the AIFPF (previous State Pension Fund) with conditional benefits which materialise once these conditions are met. In terms of the conditional retirement benefits, members’ benefits are equal to the actual value at date of retirement provided that they are 60 years or older and the Employer is obliged to ensure that the conditional retirement benefit is effected, as referred in those members’ conditions of employment and the contract between the Fund and the respective participating employers to fund any shortfall (difference between the Member Share account and actuarial value of the benefit) at retirement.
The costs incurred in respect of these pension fund obligations are charged as an expense, as the employee renders the service. The present value of the pension fund obligation is actuarially determined annually using the projected unit credit method in accordance with IAS 19 Employee Benefits. The liability is recognised at the reporting date.
When the calculation results in a potential asset,
94 2017 N
N OTES TO THE FINANCIAL STATEMENTS
(continued) for the year ended 31 December 2017
the recognised asset is limited to the present value of economic benefits available in the form of any future refunds from the plan or reductions in future contributions to the plan. To calculate the present value of the economic benefits, consideration is given to any applicable minimum funding requirements.
Remeasurements of the net defined benefit liability, which comprise actuarial gains and losses, the return on plan assets (excluding interest) and the effect of the asset ceiling (if any, excluding interest), are immediately recognised in Other Comprehensive Income (OCI). The Institution determines the net interest expense/ (income) on the net defined benefit liability/ (asset) for the period by applying the discount rate used to measure the conditional benefit obligation at the beginning of the annual period to the then net conditional benefit liability/(asset) during the period as a result of contributions and benefit payments. Net interest expense and other expenses related to defined benefit plans are recognised in surplus or loss.When the benefits of a plan are changed or when a plan is curtailed, the resulting change in benefit that relates to past service or the gain or loss on curtailment is recognised immediately in surplus or loss. The Institution recognises gains or losses on the settlement of a conditional benefit plan when the settlement occurs.
PoST-RETIREMENT MEDICAl AID oBlIGATIoNS
The Cape Peninsula University of Technology has an obligation to provide certain post retirement medical aid benefits to its eligible employees and pensioners. The University is required to provide a defined amount of the medical aid contribution due. One of the University’s plans is funded with a plan asset.
Other staff members elected to take out individual retirement annuities which will be used to fund their medical aid obligation upon retirement. The Institution provides these staff members with a monthly allowance to enable them to fund these individual retirement annuities.
The costs of providing post-retirement medical aid benefits are determined using the projected unit credit method.
When the calculation results in a potential asset, the recognised asset is limited to the present value of economic benefits available in the form of any future refunds from the plan or reductions in future contributions to the plan. To calculate the present value of the economic benefits, consideration is given to any applicable minimum funding requirements. The net obligation is calculated separately for each plan by estimating the amount of the future benefit that the employees have earned in the current and prior periods, discounting that amount and deducting the fair value of any plan assets.
Remeasurements of the net defined benefit liability, which comprise actuarial gains and losses, the return on plan assets (excluding interest) and the effect of the asset ceiling (if any, excluding interest), are immediately recognised in Other Comprehensive Income (OCI). The Institution determines the net interest expense/ (income) on the net defined benefit liability/(asset) for the period by applying the discount rate used to measure the defined benefit obligation at the beginning of the annual period to the then net defined benefit liability/(asset) during the period as a result of contributions and benefit payments. Net interest expense and other expenses related to defined benefit plans are recognised in surplus or loss.
When the benefits of a plan are changed or when a plan is curtailed, the resulting change in benefit that relates to past service or the gain or loss on curtailment is recognised immediately in surplus or loss. The Institution recognises gains or losses on the settlement of a defined benefit plan when the settlement occurs.
1.7 Borrowing costs
Borrowing costs are accrued based on the effective interest rate. Borrowing costs that are directly attributable to the acquisition, construction or production of an asset that necessarily takes a substantial period of time to get ready for its intended use or sale are capitalised as part of the cost of that asset. All other borrowing costs are recognised as an expense.
95
1.8 Research costs
Research costs are expensed as incurred and is included in other operating expenses.
1.9 Property, plant and equipment
Property, plant and equipment are initially recognised when it is probable that future economic benefits will flow to the University and the cost of the item can be measured reliably. Property, plant and equipment are initially measured at cost. The cost of an asset comprises the purchase price and any costs directly attributable to bringing the asset to the location and condition necessary for it to operate as intended by management.
Subsequently, property plant and equipment is measured at cost less accumulated depreciation and net of any accumulated impairment losses. Subsequent costs are included in the asset’s carrying amount or are recognised as a separate asset, as appropriate, only when it is probable that future economic benefits will flow to the University and the cost of the item can be measured reliably. Maintenance and repairs, which do not meet these criteria, are recognised in surplus or loss as incurred. Donated items of property, plant and equipment are initially recognised at fair value of the asset received. Land is not depreciated as it is deemed to have an indefinite life.
Property, plant and equipment are depreciated on a straight-line basis estimated to write each asset down to its estimated residual value over the estimated useful lives of the assets which range as follows:
If significant parts of an item of property, plant and equipment have different useful lives then they are accounted for as separate items of property, plant and equipment.
Depreciation commences when an asset is available for use, i.e. when it is in the location and condition necessary for it to be capable of operating in the manner intended by management. Depreciation ceases at the earlier date that the asset is either classified as held for sale or the asset is derecognised.
An item of property, plant and equipment is derecognised upon disposal or when no future economic benefits are expected from its use. Any gain or loss arising on derecognition of the asset (calculated as the difference between the net disposal proceeds and the carrying amount of the asset) is included in surplus or loss in the year the asset is derecognised.
1.10 Impairment of non-financial assets
The University assesses at each reporting date whether there is an indication that an asset may be impaired. If any such indication exists, the University makes an estimate of the asset’s recoverable amount.
An asset’s recoverable amount is the higher of an asset’s fair value less costs to sell and its value in use. Value in use is the present value of future cash flows expected to be derived from an asset or cash generating unit. Where the carrying amount of an asset exceeds its recoverable amount, the asset is considered impaired and is written down to its recoverable amount and impairment losses recognised in surplus or loss.
Computer equipment 3 to 12 years
The assets’ residual values and useful lives are reviewed, and adjusted if appropriate, at each reporting date.
An assessment is made at each reporting date as to whether there is any indication that previously recognised impairment losses may no longer exist or may have decreased. If such indication exists, the recoverable amount is estimated. A previously recognised impairment loss is reversed only if there has been a change in the estimates used to determine the asset’s recoverable amount since the last impairment loss was recognised. If that is the case the carrying amount of the asset is increased to its recoverable amount. That increased amount cannot exceed the carrying
96 2017 N
OTES TO THE FINANCIAL STATEMENTS (continued) for the year ended 31 December 2017
Useful life Land Indefinite Buildings 5 to 200 years
Improvements Lease period
vehicles 5 to 12 years
Leasehold
Motor
Furniture and equipment 1 to 15 years
N OTES TO THE FINANCIAL STATEMENTS
(continued) for the year ended 31 December 2017
amount that would have been determined, net of depreciation, had no impairment loss been recognised for the asset in prior years. Such reversal is recognised in net surplus.
After such a reversal the depreciation charge is adjusted in future periods to allocate the asset’s revised carrying amount, less any residual value, on a systematic basis over its remaining useful life.
1.11 Financial assets and liabilities
Financial assets and liabilities are initially recognised on the statement of financial position when the University becomes party to the contractual provisions of the instrument. The trade date method of accounting has been adopted for ‘regular way’ purchase or sale of financial assets. The trade date is the date that an enterprise commits to purchase or sell an asset. A ‘regular way’ contract is a contract for the purchase or sale of financial assets that require delivery of the assets within the time frame generally established by regulation or convention in the market place concerned.
Financial assets are classified as either loans and receivables or available-for-sale financial assets, as appropriate. The University determines the classification of its financial assets at initial recognition and, where allowed and appropriate, re-evaluates this designation at each financial year-end.
Financial assets and liabilities are initially measured at fair value including transaction costs. Subsequent to initial recognition the measurement of financial assets and liabilities depends upon the classification of the instrument as follows:
loANS AND RECEIVABlES
Loans and receivables are non-derivative financial assets with fixed or determinable payments that are not quoted in an active market. Such assets comprise student fees , NSFAS, trade, government, other and accounts receivable in terms of contracts. These assets are initially measured at fair value and are subsequently measured at amortised cost using the effective interest method. Gains and losses are recognised in net surplus or loss when the loans and
receivables are derecognised or impaired, as well as through the amortisation process.
AVAIlABlE-FoR-SAlE FINANCIAl ASSETS
Available-for-sale financial assets are those nonderivative financial assets that are designated as available-for-sale. Such assets are comprised of investments in listed equity shares, quoted interest bearing corporate and government bonds, quoted unit trusts and money market deposits. After initial recognition available-for-sale financial assets are measured at fair value with gains or losses being recognised as other comprehensive income in the available-for-sale reserve until the investment is derecognised or until the investment is determined to be impaired at which time the cumulative gain or loss previously reported in other comprehensive income is included in income and expenses. The fair value of investments that are actively traded in organised financial markets is determined by reference to quoted market prices at the close of business on the reporting date.
CASH AND CASH EqUIVAlENTS
Cash and cash equivalents are initially measured at fair value. They are subsequently measured at amortised cost. Cash and cash equivalents consist of cash on hand, short-term deposits and balances at banks, net of outstanding bank overdrafts for purposes of the Statement of Cash Flows.
FINANCIAl lIABIlITIES
Financial liabilities are comprised of trade payables and accrued expenses, student creditors and deposits, other payables and interest-bearing loans and borrowings.
Accounts payable and accrued liabilities are initially measured at fair value. They are subsequently measured at amortised cost using the effective interest method. Gains and losses are recognised in net surplus or loss when the liabilities are derecognised as well as through the amortisation process.
Students with credit balances and upfront deposits by current and prospective students are treated as current liabilities until the amount is settled as due. Student creditors and deposits are initially measured at fair value being the amount received. They are subsequently measured at amortised cost using the effective interest method.
97
STATEMENTS
Gains and losses are recognised in net surplus or loss when the liabilities are derecognised as well as through the amortisation process.
Subsequent to initial recognition, interest-bearing loans and borrowings are measured at amortised cost using the effective interest method. The interest expense is recognised using the effective interest method. Gains and losses are recognised in net surplus or loss when the liabilities are derecognised as well as through the amortisation process.
Financial assets and liabilities are offset and the net amount reported on the statement of financial position when there is a current legally enforceable right to set off the recognised amounts and there is an intention to realise the assets and settle the liabilities on a net basis.
1.12 Derecognition of financial assets and liabilities
FINANCIAl ASSETS
A financial asset (or, where applicable a part of a financial asset or part of a group of similar financial assets) is derecognised where:
• the rights to receive cash flows from the asset have expired;
• the University retains the right to receive cash flows from the asset, but has assumed an obligation to pay them in full without material delay to a third party under a ‘pass-through’ arrangement, or
• the University has transferred its rights to receive cash flows from the asset and either
(a) has transferred substantially all the risks and rewards of the asset, or
(b) has neither transferred nor retained substantially all the risks and rewards of the asset, but has transferred control of the asset.
FINANCIAl lIABIlITIES
A financial liability is derecognised when the obligation under the liability is discharged or cancelled or expires.
Where an existing financial liability is replaced by another from the same lender on substantially different terms, or the terms of an existing liability are substantially modified, such an exchange or modification is treated as a derecognition of
for the year ended 31 December 2017
the original liability and the recognition of a new liability, and the difference in the respective carrying amounts is recognised in net surplus or loss.
1.13 Impairment of financial assets
The University assesses at each reporting date whether a financial asset or group of financial assets is impaired. A financial asset or group of financial assets is impaired and impairment losses are incurred if, there is objective evidence of impairment as a result of one or more events that occurred after initial recognition of the asset (a “loss event’) and that loss event has an impact on the estimated future cash flows of the financial asset and can be reliably estimated. Evidence of impairment may include indications that debtors or a group of debtors are experiencing significant financial difficulty, default or delinquency in interest or principal payments, the probability that they will enter bankruptcy or other financial reorganisation and where observable data indicate that there is a measurable decrease in the estimated future cash flows, such as changes in arrears or economic conditions that correlate with defaults.
ASSETS CARRIED AT AMoRTISED CoST
If there is objective evidence that an impairment loss on loans and receivables carried at amortised cost has been incurred, the amount of the loss is measured as the difference between the asset’s carrying amount and the present value of estimated future cash flows (excluding future credit losses that have not been incurred) discounted at the original effective interest rate (i.e. the effective interest rate computed at initial recognition). The carrying amount of the asset shall be reduced either directly or through use of an allowance account. The amount of the loss shall be recognised in net surplus or loss.
The University first assesses whether objective evidence of impairment exists individually for financial assets that are individually significant, and individually or collectively for financial assets that are not individually significant. If it is determined that no objective evidence of impairment exists for an individually assessed financial asset, whether significant or not, the asset is included in a group of financial assets with similar credit risk characteristics and that group of financial assets is collectively assessed for
98 2017 N
OTES TO THE FINANCIAL
(continued)
N OTES TO THE FINANCIAL STATEMENTS
(continued) for the year ended 31 December 2017
impairment. Assets that are individually assessed for impairment and for which an impairment loss is or continues to be recognised are not included in a collective assessment of impairment. If, in a subsequent period, the amount of the impairment loss decreases and the decrease can be related objectively to an event occurring after the impairment was recognised, the previously recognised impairment loss is reversed. Any subsequent reversal of an impairment loss is recognised in net surplus or loss, to the extent that the carrying value of the asset does not exceed its amortised cost at the reversal date.
AVAIlABlE-FoR-SAlE FINANCIAl ASSETS
Where there is objective evidence that the asset is impaired, the cumulative loss is removed from other comprehensive income and recognised in net surplus or loss. The cumulative loss is the difference between the acquisition cost less any impairment losses previously recognised. In the case of equity investments classified as available-for-sale, objective evidence would include a significant or prolonged decline in the fair value of the investment below cost. ‘Significant’ is evaluated against the original cost of the investment and ‘prolonged’ against the period in which the fair value has been below its original cost.
If, in a subsequent period, the fair value of a debt instrument classified as available for sale increases and the increase can be objectively related to an event occurring after the impairment loss was recognised in net surplus or loss, the impairment loss shall be reversed, with the amount of the reversal recognised in net surplus or loss.
Impairment losses on equity investments are not reversed through net surplus or loss, increases in their fair value after impairment are recognised directly in other comprehensive income.
1.14 Inventories
Inventories are measured at the lower of cost and net realisable value. Net realisable value is the replacement cost of the inventories. Cost is determined on the weighted average method. The cost of inventories comprises of all costs of purchase,costs of conversion and other costs incurred in bringing the inventories to their present location and condition.
Jewellery is loaned to the University for use by students. The jewellery is accounted for as inventory and is valued at its market value on the date it is received. It is subsequently remeasured to fair value at the end of each year with fair value changes recognised directly in surplus or loss. A corresponding liability is raised and is included in accounts payable.
1,15 Provisions
Provisions are recognised when the University has a present obligation (legal or constructive) as a result of a past event, it is probable that an outflow of resources embodying economic benefits will be required to settle the obligation and a reliable estimate can be made of the amount of the obligation.
The expense relating to any provision net of any reimbursement is presented in surplus or loss. If the effect of the time value of money is material, provisions are discounted using a current rate that reflects, where appropriate, the risks specific to the liability. Where discounting is used, the increase in the provision due to the passage of time is recognised as a finance cost. The discount rate is a pre-tax rate that reflects current market assessments of the time value of money.
1.16 leases
The determination of whether an arrangement is, or contains a lease is based on the substance of the arrangement at inception date of whether the fulfillment of the arrangement is dependent on the use of a specific asset or assets or the arrangement conveys a right to use the asset. A reassessment is made after inception of the lease only if one of the following applies:
(a) There is a change in contractual terms, other than a renewal or extension of the arrangement;
(b) A renewal option is exercised or extension granted, unless the term of the renewal or extension was initially included in the lease term;
(c) There is a change in the determination of whether fulfilment is dependant on a specified asset; or
99
TO THE FINANCIAL STATEMENTS
(d) There is a substantial change to the asset. Where a reassessment is made, lease accounting shall commence or cease from the date when the change in circumstances gave rise to the reassessment for scenarios (a), (c) or (d) and at the date of renewal or extension period for scenario (b).
Leases of property, plant and equipment where the University assumes substantially all the benefits and risk of ownership are classified as finance leases. Finance leases are capitalised at the lower of the fair value of the asset at inception date or the present value of the minimum lease payments.
Each minimum lease payment is allocated between liability and finance charges to achieve a constant rate on the finance balance outstanding. The corresponding rental obligations, net of finance charges, are included in interest-bearing borrowings. The interest element of the finance charges is charged to surplus or loss over the lease period. The property, plant and equipment acquired under finance leasing contracts are depreciated over the shorter of the useful life of the assets or the lease term, only if there is no reasonable certainty that the University will obtain ownership at the end of the lease term.
Leases of assets under which all the risks and benefits of ownership are effectively retained by the lessor are classified as operating leases. Payments made under operating leases are charged as an expense on a straight-line basis over the period of the lease. Any contingent rental expenses are accounted for as incurred. Any difference that arises between the straight line basis and contractual cash flows is recognised as an operating lease obligation or asset.
When an operating lease is terminated before the lease period has expired, any payment required to be made to the lessor by way of penalty is recognised as an expense in the period in which termination takes place.
(continued) for the year ended 31 December 2017
1.17 other employee related liabilities
SHoRT-TERM EMPloYEE BENEFITS
University’s staff members, in the case of death, qualify for different categories of benefits depending on whether they are a member of the Pension or Provident Fund.
oTHER loNG-TERM EMPloYEE BENEFITS\
Certain staff members of the two heritage Institutions (Cape and Peninsula Technikons) qualify for certain post-retirement medical aid benefits (refer Note 10.2) and pension fund benefits (refer Note 10.3). In some cases the Institution will contribute either 50%, 66,67% or 100% of the medical aid contributions to an approved scheme upon retirement, whilst in the case of other qualifying members the University is paying a monthly allowance to those staff members to enable them to purchase a retirement annuity which they could utilise upon retirement towards their medical aid contributions. The cost pertaining to these benefits is expensed during the period. With regards to staff members of the NTRF who qualify for defined benefits upon retirement, the University pays the shortfall as calculated by the actuaries, into the members’ fund during the year of retirement. The related cost is expensed during that period.
PoST-EMPloYMENT BENEFITS
Qualifying staff members who were employed at the University prior to 1 January 2005, accrue leave at a rate of 12 days per annum. The accumulative leave is limited to 120 days. Upon termination of employment, the unutilised portion of this accumulative leave is paid to the staff member at the rate of pay prevailing at the termination date.
100 2017 N
OTES
N OTES TO THE FINANCIAL STATEMENTS (continued) for the
year ended 31 December 2017
101
PRoPERTY,
2017 Land and buildings R Leasehold improvements R Furniture and equipment R Computer equipment R Motor Vehicles R Total R Cost Cost 1 January 2017 1 970 393 433 24 550 364 355 280 785 190 765 431 14 981 773 2 555 971 786 Additions 32 164 566 461 564 27 681 051 29 908 782 914 536 91 130 499 Disposals/ Scrapping - - (1 519 621) (1 552 223) (127 779) (3 199 623) Cost 31 December 2017 2 002 557 999 25 011 928 381 442 215 219 121 990 15 768 530 2 643 902 662 Accumulated Depreciation Balance 1 January 2017 235 653 836 13 724 258 228 808 038 144 005 316 10 836 807 633 028 255 Depreciation charge 30 948 026 522 675 29 687 739 21 472 817 897 790 83 529 047 Disposals/ Scrapping - - (1 257 141) (1 209 682) (127 779) (2 594 602) Balance 31 December 2017 266 601 862 14 246 933 257 238 636 164 268 451 11 606 818 713 962 700 Carrying value 31 December 2017 1 735 956 137 10 764 995 124 203 579 54 853 539 4 161 712 1 929 939 962 2016 Land and buildings R Leasehold improvements R Furniture and equipment R Computer equipment R Motor Vehicles R Total R Cost Cost 1 January 2016 1 854 643 070 24 490 270 345 111 290 172 090 626 14 420 794 2 410 756 050 Additions 115 810 457 - 10 914 250 21 964 018 560 979 149 249 704 Disposals/ Scrapping - - ( 744 755) (3 289 213) - (4 033 968) Reclassification (60 094) 60 094 - - -Cost 31 December 2016 1 970 393 433 24 550 364 355 280 785 190 765 431 14 981 773 2 555 971 786 Accumulated Depreciation Balance 1 January 2016 224 599 439 12 439 425 201 477 337 128 054 295 9 670 720 576 241 216 Depreciation charge 11 054 397 1 284 833 27 936 188 19 107 265 1 166 087 60 548 770 Disposals/ Scrapping - - ( 605 487) (3 156 243) - (3 761 730) Balance 31 December 2016 235 653 836 13 724 258 228 808 038 144 005 316 10 836 807 633 028 255 Carrying value 31 December 2016 1 734 739 597 10 826 106 126 472 747 46 760 114 4 144 966 1 922 943 530
2
PlANT AND EqUIPMENT
TO THE FINANCIAL STATEMENTS
2 PRoPERTY, PlANT AND EqUIPMENT (continued)
A register of land and buildings is available for inspection at the business address. The University is not permitted to dispose of, or otherwise alienate, its land and buildings without the preapproval of the Minister of Education.
The balance for land and buildings includes R184 177 578 (2016: R184 177 578) in respect of land. There were no additions to the land balances in the current year.
The University purchased land on Caledon Street for R30 893 152 in November 2009 and entered into a lease agreement with developers to build a residence on this land and once completed the University would commence lease payments over a 15 year period after which ownership of the buildings will revert to the University.
The building was completed in February 2011 and monthly lease payments commenced on 1 March 2011. The monthly lease payments escalate at 8% per annum over the life of the lease. From an accounting perspective the lease is treated as a finance lease and the buildings are valued based on the present value of future lease payments. The future lease payments have been discounted using an interest rate of 9,5%. As a result the
(continued) for the year ended 31 December 2017
University has raised an asset of R148 132 748 and a matching lease liability was raised at the commencement of the lease (refer Note 8).
CPUT in terms of its approval process obtained approval from both its Council as well as the Minister of Higher Education and Training to purchase the property referred to as the Welgelegen Sectional Title Scheme for a total purchase price of R143,5 million(100% ownership).
In February 2014, CPUT entered into an agreement to purchase all the sectional title units at Cape Suites and on 12 June 2014, the University purchased all the sectional title units (bar three) for an amount of R140 407 267.
Other land and buildings additions relate to the HDI Electrical Engineering, Sandenburgh Residence Extension, Health and Wellness, and Applied Sciences building projects.
The Cape Peninsula University of Technology’s accumulated leasehold improvements with a carrying value of R10 764 995(2016: R9 956 620) consist of improvements to the buildings and residences at the Mowbray and Wellington campuses which are currently owned by the Western Cape Education Department and are in the process of being transferred into Cape Peninsula University of Technology ownership.
102 2017 N
OTES
2017 R 2016 R Opening balance 1 281 517 176 1 464 927 721 Additions 193 871 331 140 881 885 Disposals (156 287 911) (224 415 076) Realised gains on sale of investments (141 670 474) (101 499 901) Impairment of investments (17 557 907) (4 993 727) Fair value movement in investments 85 530 075 6 616 274 Closing balance 1 245 402 290 1 281 517 176 Investments comprise of the following: Equities – local 402 340 332 670 445 876 Equities – foreign 240 063 323 224 881 004 Unit trusts – local 269 256 622 31 276 673 Interest bearing bonds - Foreign 219 256 791 7 047 985 Interest bearing bonds – local 1 831 656 277 965 643 Money market deposits – local 108 986 595 61 501 280 Money market deposits – foreign 3 666 971 8 398 715 Total available-for-sale investments 1 245 402 290 1 281 517 176 All investments are classified as available-for-sale investments.
3 AVAIlABlE-FoR-SAlE INVESTMENTS
N OTES TO THE FINANCIAL STATEMENTS (continued) for the year ended 31
December 2017
Investments comprised investments in equities and interest bearing bonds which are all listed on recognised markets. In addition, funds are held in a variety of money market deposit accounts. Consequently, there are no fixed maturity dates or significant terms and conditions attached to the investments.
The University has pledged a maximum of R34 000 000 of the investment portfolio managed by Pan African Asset Management
as security against a loan facility of R42 168 971 with the Development Bank of Southern Africa. As at 31 December 2017 the outstanding balance of this loan facility was R42 168 971 (2016: R59 036 559).
The market value of the pledged investment Pan African Asset Management portfolio at 31 December 2017 is R224 974 815 (2016: R241 620 513).
No inventory was written off during the year (2016: Nil). Jewellery held as inventory is on loan to the University and the amount of R315 160 (2016: R467 721) is included in other payables (refer Note 11).
5 ACCoUNTS RECEIVABlE AND PREPAYMENTS
Accounts receivables are non-interest bearing and are generally on 30 day terms .
103
2017 R 2016 R Consumables 6 078 427 5 906 027 Jewellery 479 717 990 046 Food & beverage 197 890 133 750 6 756 034 7 029 823 2017 R 2016 R Prepayments 11 336 386 10 790 086 VAT receivable 59 925 2 999 298 National Student Financial Aid Scheme (NSFAS) 93 387 008 41 349 144 Other government receivables - 199 000 Other receivables 32 116 491 13 561 636 Trade receivables 51 636 406 39 664 341 Less: Provision for doubtful debts – trade receivables (21 088 046) (10 072 687) 167 448 170 98 490 818
INVENToRY
4
2017 N OTES TO THE FINANCIAL STATEMENTS (continued)
Age analysis of accounts receivable
“The age analysis below is based on the balances per Note 5 above, but excluding prepayments and VAT receivable. The age analysis is based on the date of invoice or the date the receivable was raised in the accounts depending on the nature of
for the year ended 31 December 2017
the transaction, such as claims from government.
Any balances older than 30 days are considered past due but not impaired, except for balances to the value of R21 088 046 (2016:R10 072 687) which had been provided for at year-end.
Movements in the provision for impairment of accounts receivable were as follows:
Receivables consist mainly of claims from government. The University considers receivables which are neither past due nor impaired to be fully recoverable as there is no indications that the amount is not recoverable.
6 STUDENT FEES RECEIVABlE
Annual fees fall due and are payable in monthly instalments from February to November at a rate of 10% of the fees. Semester fees fall due and are payable in monthly instalments at a rate of 20% of the fees from February to June for first semester and from July to November for second semester students respectively. Any amounts outstanding in respect of annual and semester fees after these dates are subject to interest at prime plus 3% as
and when a monthly instalment is past due. No interest was charged during 2017 (2016: NIL).
The debtors book of the University is subject to collective impairment with the exception of R201 192 688 (2016: R146 843 762) which is past due by less than one year but not impaired. This relates to student fees from currently registered students which are considered fully recoverable.
104
Current R 30 Days R 60 Days R 90 Days + R Total R 2017 2 513 431 4 184 080 11 257 619 159 184 775 177 139 905 2016 1 800 152 28 150 83 208 82 789 924 84 701 434
Collectively Impaired R At 31 December 2015 (13 982 798) Charged 3 910 111 At 31 December 2016 (10 072 687) Released/(Charged) (11 015 359) At 31 December 2017 (21 088 046)
2017 R 2016 R Student debtors 716 484 476 463 025 607 Less: Provision for doubtful debts (515 291 788) (316 181 845) 201 192 688 146 843 762
N OTES TO THE FINANCIAL STATEMENTS
(continued) for the year ended 31 December 2017
Age analysis of student fees receivable
The table below provides the age analysis of student fees receivable (before provisions) as at 31 December 2017. Due to the nature of its
operations, the University only tracks outstanding fees on an academic year basis. All outstanding balances are past due.
Movements in the provision for impairment of student fees receivable were as follows:
7 CASH AND CASH EqUIVAlENTS
Cash at bank earns interest at floating rates based on daily bank deposit rates, whilst short-term deposits earn interest at a fixed rate.
The fair value of cash and cash equivalents is R211 320 962 (2016: R146 468 163).
The University cancelled the R40 million borrowing facility during in April 2017 due to the
fact it has never made use of the borrowing facility and incurred unnecessary costs.
The University held no funds on short term bank deposits at year end (2016: Nil). The effective interest rate of all short-term deposits held throughout the period was 9.86% (2016: 9.02%).
105
Current year R Prior year R Older years R Total R 31 December 2017 221 786 290 223 583 133 271 115 053 716 484 476 31 December 2016 235 664 789 67 713 832 159 646 986 463 025 607
Collectively Impaired R At 31 December 2015 179 447 461 Provision write off (75 615 968) Charged 212 087 116 Utilised 323 236 At 31 December 2016 316 181 845 Prior year write off adjustment 49 806 348 Provision write off (34 688 543) Charged 183 873 278 Utilised 118 860 At 31 December 2017 515 291 788 2017 R 2016 R Cash at bank and on hand 211 320 962 146 468 163 211 320 962 146 468 163
OTES TO THE FINANCIAL STATEMENTS
(continued) for the year ended 31 December 2017
State subsidised loans
These loans all have fixed interest rates ranging from 9,50% to 13,22% and varying repayment terms. They are unsecured and subsidised to the extent of 85% for both interest and capital repayments.
Finance leases
The University commenced a 15 year lease to own arrangement in respect of the Caledon Street residence in February 2011 (refer Note 2). The lease is treated as a finance lease and the liability is valued based on the present value of future lease payments which have been discounted using an interest rate of 9,5%. Contingent rental to the value of R15 992 980 (2016: R14 810 426) was expensed through surplus/(loss) in the year.
At the commencement of the lease, a liability of R128 912 748 was raised and for accounting purposes interest will accrue on the balance at 9,5% over the life of the lease. As at 31 December 2017, the lease liability is R126 739 230 (2016: R130 612 578) and the interest charged in respect of the liability in 2017 is R12 091 132 (2016: R12 424 508).
The leased premises shall be used as a student residence, provided that such use does not contravene any town planning conditions applicable in respect of the property and for no other purpose without the prior consent, which consent shall not be unreasonably withheld or delayed.
Financial Institutions loans Development Bank of Southern Africa
A loan facility of R150 000 000 was agreed with the Development Bank of Southern Africa during
2009 and as at 31 December 2017 the balance outstanding on the facility was R42 168 971 (2016: R59 036 559). The loan bears interest at a variable rate based on the 6 month ZAR-JIBARSAFEX rate plus 2,75%. The loan is for a 10 year period and payments are made twice a year at the end of March and September. The first two payments in 2010 were in respect of interest and thereafter there will be 18 equal payments including interest and capital. The University has pledged certain investments as security against this loan facility refer to Note 3.
First National Bank loan summary
A commercial property finance loan of R150 000 000 in respect of Cape Suites was registered at the Deeds Office on 28 October 2014 and as at 31 December 2017 the balance oustanding on the facility was R118 112 988 (2016: R130 612 578). The mortgage bond is for a 10 year period and semi-annual payments of R11 332 608 (2016: R11 332 608) is due on 1 May and 1 November each year. The bond bears interest at prime rate less 1,50% (2016: prime rate less 1.90%) compounded monthly. The Cape Suites residence is pledged as security against this mortgage bond.
loan Flexing
* Market data was not available for the determination of the credit rating for these loans. Flexing of the credit spread was performed to determine whether a change in interest rate would have a material effect on the financial statements. It was determined that a decrease of 100 basis points would result in the fair value being lower than the carrying value by R7 358 285 (2016: R9 496 667).
106 2017
N
2017 R 2016 R Current 35 783 439 33 221 155 State loans 512 677 464 666 Finance leases 5 602 200 3 873 348 Financial Institution loans * 29 668 562 28 883 141 Non-current 253 222 924 288 889 859 State loans 1 154 618 1 667 295 Finance leases 121 137 030 126 739 230 Financial Institution loans * 130 931 276 160 483 334 289 006 363 322 111 014
8 INTEREST-BEARING BoRRoWINGS
N OTES TO THE FINANCIAL STATEMENTS (continued) for the year ended 31 December 2017
A provision is made for the estimated liability for annual accumulative leave as a result of services rendered by employees up to the reporting date but charged at the 2016 salary rate. As the
University does not have the unconditional right to defer settlement of this liability for at least 12 months after the reporting date, the liability is classified as being current.
107
2017 R 2016 R Not later than 1 Year 17 270 136 15 992 980 Later than 1 Year and not later than 5 years 84 022 172 77 806 752 After 5 years 87 314 998 110 800 554 188 607 306 204 600 286 Future finance charges on finance leases (61 868 076) (73 987 708) Present value of finance lease liabilities 126 739 230 130 612 578 The present value of finance lease liabilities may be analysed as follows: Not later than 1 Year 5 602 200 3 873 348 Later than 1 Year and not later than 5 years 45 813 084 35 724 681 After 5 years 75 323 946 91 014 549 126 739 230 130 612 578 2017 R 2016 R Finance costs - state loans 212 324 255 777 - finance leases 12 091 132 12 424 508 - financial Institution loans 16 026 606 18 700 473 - bank borrowings and other - 2 625 28 330 062 31 383 383 2017 R 2016 R Leave provision – balance at the beginning of the year 92 516 493 81 306 954 (Reduction)/Increase (13 706 289) 11 462 928 Amounts utilised - ( 253 389) Leave provision – balance at the end of the year 78 810 204 92 516 493
INTEREST-BEARING BoRRoWINGS (continued) 9 FINANCE CoSTS 10 oTHER EMPloYEE BENEFITS
Employee leave liability
8
10.1
OTES TO THE FINANCIAL STATEMENTS
(continued) for the year ended 31 December 2017
10.2 Post-retirement medical aid obligation
The University operates defined benefit medical aid schemes for the benefit of permanent employees. Prior to the formation of the merged Institution both former Technikons had separate contractual obligations to provide post retirement medical benefits to qualifying employees. The obligation in respect of the former Peninsula Technikon is funded by a plan asset whereas the obligation in respect of the former Cape Technikon is unfunded. Both obligations are actuarially valued and accounted for separately as the University does not have the legal right to offset the plan assets in respect of the former Peninsula Technikon scheme against the liabilities that arise on the former Cape Technikon scheme.
An explanation of each individual scheme and a
reconciliation of the movement in the obligation in the scheme is set out separately below.
Former Peninsula Technikon Scheme
In terms of employment contracts, postretirement medical benefits are provided to certain employees who commenced employment at the former Peninsula Technikon prior to 1 January 1999 by subsidising the medical aid contributions of retired employees.
The University’s future obligation in respect of this post-retirement medical aid contributions is actuarially valued annually by independent, professional qualified actuaries using the projected unit credit method. The last valuation was performed as at 31 December 2017 and the principal actuarial assumptions used in the valuation were as follows:
Former Peninsula Technikon Scheme
With effect 1 May 2003, a group annuity policy was created, which meets the definition of a plan asset in terms of IAS19. The fair value of the plan asset at 31 December 2017 of R70 192 799 (2016: R74 985 531) has therefore been set off against the funding obligation.
108 2017 N
2017 2016 General inflation rate 5,58% 6,43% Discount rate 8,69% 9,23% Return on plan assets 8,69% 9,23% Medical inflation 6,83% 7,68% Retirement age 63 63 % married on retirement 90% 90% Mortality – active (rated down 3 years for females) SA 85-90 SA 85-90 Mortality – pension (rated down 2 years) PA(90-2) PA(90-2)
N OTES TO THE FINANCIAL STATEMENTS
(continued) for the year ended 31 December 2017
10.2 Post-retirement medical aid obligation (continued)
109
Movement in net Post-Retirement Medical obligation
2017 R 2016 R Total assets 70 192 799 74 985 531 70 192 799 74 985 531 Post-retirement medical obligation Fair value of plan assets Net Post-retirement medical obligation R 2017 R 2016 R 2017 R 2016 R 2017 R 2016 Balance at 1 January 128 893 410 126 382 448 (74 985 531) (63 794 797) 53 907 879 62 587 651 Included in profit and loss Current service costs 757 666 974 658 - - 757 666 974 658 Interest expense/(income) 11 594 572 12 015 299 (6 621 428) (6 312 022) 4 973 144 5 703 277 12 352 238 12 989 957 (6 621 428) (6 312 022) 5 730 810 6 677 935 Included in Other comprehensive income (OCI) Remeasurements loss/(gain): - Actuarial loss/(gain) arising from: • Basis changes: increase in net discount rate (4 219 083) (2 719 262) - - (4 219 083) (2 719 262) • Medical inflation higher than assumed 875 652 4 583 316 - - 875 652 4 583 316 • Changes to membership profile different from assumed 5 316 376 356 034 - - 5 316 376 356 034 • Change in prior year actual loss/(gain) - (7 317 131) - - - (7 317 131) - Actuarial (gain)/loss on plan assets excluding interest income - - 4 848 132 (10 260 664) 4 848 132 (10 260 664) 1 972 945 (5 097 043) 4 848 132 (10 260 664) 6 821 077 (15 357 707) Other Benefits paid (6 566 028) (5 381 952) 6 566 028 5 381 952 -(6 566 028) (5 381 952) 6 566 028 5 381 952 -Balance at 31 December 136 652 565 128 893 410 (70 192 799) (74 985 531) 66 459 766 53 907 879 Represented by: Net Post retirement-medical obligation: Former Peninsula Technikon 66 459 766 53 907 879
Plan Assets Assets are invested with Sanlam (2016:AIG) which has been set aside to fund the University’s postemployment health care liability.
2017 N OTES TO THE FINANCIAL STATEMENTS
10.2 Post-retirement medical aid obligation (continued)
Sensitivity Analysis
(continued) for the year ended 31 December 2017
Reasonably possible changes at the reporting date to one of the relevant actuarial assumptions, holding other assumptions constant, would have affected the obligation by the amounts shown below.
in the accrued liability.
a 1% decrease in the health care cost inflation assumption would result in a 9.0% (2016:9.0%) decrease in the accrued liability.
Contributions to the plan for 2018 are expected to amount to R7 961 364 (2016: R6 566 028).
The former Cape Technikon operated a post-retirement medical benefit scheme for retired and certain employees who joined the Institution prior to 1 January 2003.
The University’s future obligation in respect of this post-retirement medical aid contributions is actuarially valued annually by independent, professional qualified actuaries using the projected unit credit method. The last valuation was performed as at 31 December 2017 and the principal actuarial assumptions used in the valuations were as follows:
110
Former Cape Technikon Scheme
2017 1% increase R Valuation basis R 1% decrease R 1% increase and decrease in the assumed rate of health care cost inflation on the liability 151 820 000 136 652 565 123 680 000 1% increase and decrease in the discount rate 123 433 000 136 652 565 152 395 000 1% increase and decrease in the assumed rate of health care cost inflation on Employer’s service and interest cost 13 855 100 12 352 300 11 078 600 1% increase and decrease in the assumed discount rate on Employer’s service and interest cost 12 189 400 12 352 300 12 494 000 One year decrease in post-retirement mortality on Employer’s service and interest cost 12 823 700 12 352 300 One year age reduction in the assumed rates of post-retirement mortality 141 755 000 136 652 565One year decrease in the assumed average retirement age 138 305 000 136 652 565An absolute reduction of 10% in the continuation rates at retirement 132 635 000 136 652 5652016 1% increase and decrease in the assumed rate of health care cost inflation on the liability 143 563 000 128 893 410 116 382 000 1% increase and decrease in the discount rate 116 117 000 128 893 410 144 147 000 1% increase and decrease in the assumed rate of health care cost inflation on Employer’s service and interest cost 14 658 000 12 989 957 11 584 700 1% increase and decrease in the assumed discount rate on Employer’s service and interest cost 12 606 100 12 989 957 13 397 100 One year decrease in post-retirement mortality on Employer’s service and interest cost 13 483 000 12 989 957 One year age reduction in the assumed rates of post-retirement mortality 133 771 000 128 893 410One year decrease in the assumed average retirement age 130 445 000 128 893 410An absolute reduction of 10% in the continuation rates at retirement 124 032 000 128 893 410 -
care
inflation
would
a 11% (2016:11.4%) increase
Therefore, a 1% increase in the health
cost
assumption
result in
Similarly,
N OTES TO THE FINANCIAL STATEMENTS
(continued) for the year ended 31 December 2017 10.2 Post-retirement medical aid obligation (continued)
111
Movement in net Post-Retirement Medical obligation 2017 2016 General Inflation rate 5.58% 6,43% Discount rate 8,93% 9,36% Medical inflation 7,08% 7,82% Retirement age 64 64 % married on retirement 90% 90% Mortality – active (rated down 3 years for females) SA 85-90 SA 85-90 Mortality – pension (rated down 2 years) PA(90-2) PA(90-2) Post-retirement medical obligation Fair value of plan assets Net Post-retirement medical obligation R 2017 R 2016 R 2017 R 2016 R 2017 R 2016 Balance at 1 January 416 313 578 384 771 059 - - 416 313 578 384 771 059 Included in profit and loss Current service costs 7 018 506 7 553 780 - - 7 018 506 7 553 780 Interest expense/(income) 38 279 611 39 472 391 - - 38 279 611 39 472 391 45 298 117 47 026 171 - - 45 298 117 47 026 171 Included in Other comprehensive income (OCI) Remeasurements loss/(gain): - Actuarial loss/(gain) arising from: • Basis changes: increase in net discount rate (17 406 587) (8 844 988) - - (17 406 587) (8 844 988) • Medical inflation higher than assumed 1 593 943 10 427 782 - - 1 593 943 10 427 782 • Changes to membership profile different from assumed (2 957 208) (9 715 689) - - (2 957 208) (9 715 689) • Change in prior year actual loss/(gain) - 5 920 523 - - - 5 920 523 (18 769 852) (2 212 372) - - (18 769 852) (2 212 372) Other Benefits paid (15 109 476) (13 271 280) - - (15 109 476) (13 271 280) (15 109 476) (13 271 280) - - (15 109 476) (13 271 280) Balance at 31 December 427 732 367 416 313 578 - - 427 732 367 416 313 578 Represented by: Net Post retirement-medical obligation: Former Peninsula Technikon 427 732 367 416 313 578
2017 N OTES TO THE FINANCIAL STATEMENTS
10.2 Post-retirement medical aid obligation (continued)
Sensitivity Analysis
(continued) for the year ended 31 December 2017
Reasonably possible changes at the reporting date to one of the relevant actuarial assumptions, holding other assumptions constant, would have affected the obligation by the amounts shown below.
Therefore, a 1% increase in the health care cost inflation assumption would result in a 14.0% (2016:13.2%) increase in the accrued liability.
Similarly, a 1% decrease in the health care cost inflation assumption would result in a 11.7% (2016:9.8%) decrease in the accrued liability.
Contributions to the plan for 2018 are expected to amount to R17 598 480 (2016: R15 109 476).
112
2017 1% increase R Valuation basis R 1% decrease R 1% increase and decrease in the assumed rate of health care cost inflation on the liability 488 097 000 427 732 366 377 660 000 1% increase and decrease in the discount rate 377 115 000 427 732 366 489 833 000 1% increase and decrease in the assumed rate of health care cost inflation on Employer’s service and interest cost 52 667 000 45 298 000 39 287 000 1% increase and decrease in the assumed discount rate on Employer’s service and interest cost 42 860 000 45 298 000 48 069 000 One year decrease in post-retirement mortality on Employer’s service and interest cost 47 428 000 45 298 000 One year age reduction in the assumed rates of post-retirement mortality 447 585 000 427 732 366One year decrease in the assumed average retirement age 433 525 000 427 732 366An absolute reduction of 10% in the continuation rates at retirement 410 105 000 427 732 3662016 1% increase and decrease in the assumed rate of health care cost inflation on the liability 477 757 000 416 313 578 365 602 000 1% increase and decrease in the discount rate 364 993 000 416 313 578 479 627 000 1% increase and decrease in the assumed rate of health care cost inflation on Employer’s service and interest cost 54 906 000 47 026 171 40 629 000 1% increase and decrease in the assumed discount rate on Employer’s service and interest cost 43 966 000 47 026 171 50 587 000 One year decrease in post-retirement mortality on Employer’s service and interest cost 49 239 000 47 026 171 One year age reduction in the assumed rates of post-retirement mortality 435 969 000 416 313 578One year decrease in the assumed average retirement age 422 149 000 416 313 578An absolute reduction of 10% in the continuation rates at retirement 397 609 000 416 313 578 -
N OTES TO THE FINANCIAL STATEMENTS
(continued) for the year ended 31 December 2017
10.3 Pension fund obligation
10.3.1 Pension fund - defined contribution
Staff of the former Peninsula Technikon belong to the National Tertiary Retirement Fund (NTRF). This is a defined contribution scheme, with certain conditional benefits (see 10.3.2).
Staff of the former Cape Technikon belong to the Cape Peninsula University of Technology Retirement Fund (previously known as the Cape Technikon Retirement Fund). This is a defined contribution scheme.
The employer contributed an amount of R123 298 894 in the current year (2016: R112 835 570) in respect of both schemes.
10.3.2 Pension fund obligation
The NTRF is essentially a defined contribution fund with conditional benefits to employees transferred from the AIPF (State Pension Fund) and who has not since surrendered this benefit through an official buy out. At retirement age, sixty or older, the employee has a choice to retire with the fund balance or the actuarial value of the fund according to AIPF formula. During 2003 Peninsula Technikon agreed with employees to fund any shortfall on the benefit on a pay-as-you-go basis.
The actuarially calculated shortfall at 31 December 2017 amounted to R11 010 025 (2016: R9 798 000).
113
2017
Discount rate per annum 8,17% 8,90% Salary increase per annum 6,14% 7,20% Actual rate of return on assets 8,17% 8,90% Pensions increase per annum 2,83% 3,41% Mortality tables – active staff (rated down 1 year males – 4 years females) SA56-62 SA56-62 Mortality tables – pensioners (rated down 2 years) PA90 PA90
2016
2017 N OTES TO THE FINANCIAL STATEMENTS (continued)
Movement in Net Pension Fund
for the year ended 31 December 2017
114
Conditional
Pension Fund Conditional obligation Fair value of plan assets Net Pension Fund Conditional obligation R 2017 R 2016 R 2017 R 2016 R 2017 R 2016 Balance at 1 January 11 549 000 10 990 000 (1 751 000) (3 124 000) 9 798 000 7 866 000 Included in profit and loss Current service costs 255 000 265 000 - - 255 000 265 000 Interest expense/(income) 986 313 1 080 000 ( 349 000) ( 283 000) 637 313 797 000 1 241 313 1 345 000 ( 349 000) ( 283 000) 892 313 1 062 000 Included in Other comprehensive income (OCI) Remeasurements loss/(gain): - Actuarial loss/(gain) arising from: • Change in economic assumptions 200 588 1 141 000 - - 200 588 1 141 000 • Change in demographic assumptions 1 994 818 ( 675 000) - - 1 994 818 ( 675 000) • Investment returns on member shares (2 078 232) 2 338 000 - - (2 078 232) 2 338 000 • Other miscellaneous items 150 000 ( 1 000) - - 150 000 ( 1 000) • Salary increases ( 520 799) (1 142 000) - - ( 520 799) (1 142 000) • Operating costs - ( 17 000) - - - ( 17 000) • Model Upgrade - (1 568 000) - - - (1 568 000) • Benefits due - ( 383 000) - - - ( 383 000) - Actuarial loss on plan assets excluding interest income - - 1 527 337 1 177 000 1 527 337 1 177 000 ( 253 625) ( 307 000) 1 527 337 1 177 000 1 273 712 870 000 Other Contributions paid by the employer - - - - -Benefits paid ( 954 000) ( 479 000) - 479 000 ( 954 000)( 954 000) ( 479 000) - 479 000 ( 954 000)Balance at 31 December 11 582 688 11 549 000 ( 572 663) (1 751 000) 11 010 025 9 798 000 Represented by: Net Pension Fund Conditional Liability 11 010 025 9 798 000
liability
N OTES TO THE FINANCIAL STATEMENTS (continued) for the year ended 31 December 2017
10.3 Pension fund obligation (continued)
Reasonably possible changes at reporting date to one of the relevant actuarial assumptions, holding other assumptions constant, would have affected the obligation by the amounts shown below.
11 ACCoUNTS PAYABlE AND ACCRUED lIABIlITIES
12
APPRoPRIATIoNS - SUBSIDIES AND GRANTS
115
2017 R 2016 R Subsidy for general purpose 1 074 356 549 977 144 833 DHET infrastructure grant recognised 8 137 300 5 316 737 DHET capital grant recognised 180 000 180 000 Foundation programme grant 64 277 451 15 125 000 Clinical training programme grants 13 935 038 4 660 926 Teaching development and collaborative grants 14 077 103 19 684 918 Research development grant 31 304 726 4 194 242 Subsidy for interest and redemption on state guaranteed loans 575 442 575 442 Missing middle grant 39 245 000Other 6 274 806 4 925 916 Total 1 252 363 415 1 031 808 014
Sensitivity Analysis
Trade and other payables and accrued expenses are non-interest bearing and are normally settled on 30-day terms.
2017 1% increase R Valuation basis R 1% decrease R 1% increase and decrease in the discount rate 4 510 000 11 582 687 23 981 000 1% increase and decrease in the inflation rate 14 418 000 11 582 687 9 271 000 Pension increase policy (70% CPI) 20 454 000 11 582 687 5 662 000 Expected retirement age (NRA 65) 12 913 000 11 582 6872016 1% increase and decrease in the discount rate 4 080 000 11 549 000 24 729 000 1% increase and decrease in the inflation rate 19 766 000 11 549 000 5 571 000 Pension increase policy (70% CPI) 19 766 000 11 549 000 5 571 000 Expected retirement age (NRA 65) 7 673 000 11 549 0002017 R 2016 R Trade payables and accrued expenses 152 935 689 115 480 324 Student creditors and deposits 100 428 072 63 366 280 Other payables 3 205 924 4 015 873 256 569 685 182 862 477
STATE
2017 N OTES TO THE FINANCIAL STATEMENTS
(continued) for the year ended 31 December 2017
12 STATE APPRoPRIATIoNS - SUBSIDIES AND GRANTS (continued)
Government grants relating to revenue
State subsidy and grants for general purposes are recognised in surplus or loss as revenue in the financial year in which they become receivable. Subsidies and grants for specific research purposes are recognised in surplus or loss as revenue in the financial period in which they become receivable to the University in accordance with the relevant conditions of such grants and agreements. Such subsidies and grants are presented separately as revenue in surplus or loss. Subsidies and grants relating to specific expenses incurred by the University are not offset from the related expenses, but are
13 INTEREST INCoME AND DIVIDENDS
presented separately as revenue in surplus or loss.
Government grants relating to assets
When a grant relates to an asset, the fair value is credited to a deferred income account and is released to income over the expected useful life of the relevant asset on a systematic basis.
Refer to Note 16 for a reconciliation of payments received from the Department of Higher Education and Training (DHET) in respect of capital, infrastructure, teaching and development as well as clinical training grants.
The following items are included in other operating expenses:
116
2017 R 2016 R Bank interest 33 304 839 19 479 671 Interest income on loans other - ( 5 350) Interest income on student receivables ( 22 965) ( 18 899) Income from available-for-sale investments - Dividends 16 459 130 18 020 520 - Interest 29 721 759 36 574 293 Total 79 462 763 74 050 235 2017 R 2016 R Total other operating expenses 1 036 686 395 947 349 040
Repairs and maintenance – land and buildings 26 589 075 24 808 117 Repairs and maintenance – moveable assets 15 477 308 11 520 144 Software licenses and consumables 15 645 201 9 431 010 General services outsourced 157 327 533 154 622 648 Catering services outsourced 54 000 145 528 Fixed property rentals 91 183 231 79 602 998 Equipment rentals 8 777 911 8 072 706 Bad debts 194 650 917 213 010 725 Bursaries 174 514 998 106 193 754 Auditors’ remuneration 6 521 694 4 529 541 Statutory audit of Annual Financial Statements 2 928 660 2 783 504 - Current year 2 928 660 2 783 504 Other audit services 3 593 034 1 746 037 - Current year 3 593 034 1 746 037
14 oTHER oPERATING EXPENSES
N OTES TO THE FINANCIAL STATEMENTS (continued) for
the year ended 31 December 2017
15 PERSoNNEl CoSTS
16 DEFERRED INCoME
Infrastructure and Merger income
The deferred income balance is comprised of R15 660 000 (2016: R15 840 000) which relates to funding received from the Department of Higher Education and Training (DHET) in respect of Merger cost claims for the period 2004-2007.
The DHET’s Infrastructure programme is comprised of Phase 1: R115 300 563 (2016: R117 525 563); Phase 2: R155 024 000 (2016: R159 294 000) and Phase 3: R235 562 400 (2016: R237 204 700)
The DHET approved a capital infrastructure grant of R153million for CPUT in Phase 1 of its capital
infrastructure programme. The first tranche of R30 million was received in March 2007, whilst the second and third tranches of R48 and R75 million respectively were received in March and November 2008.
In addition, the DHET has approved a further R175,9 million for CPUT in Phase 2 of the infrastructure programme. The first tranche of R32,7 million was received in December 2010, whilst the second and third tranches of R34,4 and R20,0 million respectively were received in January and February 2011 and the balance of R88,8 million in January 2012.
In December 2012, DHET approved a further
117
Year ended –
Academic Professional R Other Personnel R Total R Wages and salaries 646 562 031 603 566 931 1 250 128 962 Movement in pension fund obligation 428 310 464 003 892 313 Movement in leave pay provision (9 183 213) (4 523 075) (13 706 288) Retirement fund – defined contribution 66 581 403 56 717 491 123 298 894 Movement in post-retirement medical aid obligation 24 493 885 26 535 042 51 028 927 Total Personnel costs 728 882 416 682 760 392 1 411 642 808 Year ended
Academic Professional R Other Personnel R Total R Wages and salaries 590 700 464 511 679 264 1 102 379 728 Movement in pension fund obligation 509 760 552 240 1 062 000 Movement in leave pay provision 7 680 162 3 782 766 11 462 927 Retirement fund – defined contribution 60 931 208 51 904 362 112 835 570 Movement in post-retirement medical aid obligation 25 777 971 27 926 135 53 704 106 Total Personnel costs 685 599 565 595 844 767 1 281 444 331
31 December 2017
– 31 December 2016
Average number of persons employed during the year 2017 2016 Full time 2 992 2 605 Part-time 3 841 4 157 Total 6 833 6 762
OTES TO THE FINANCIAL STATEMENTS
(continued) for the year ended 31 December 2017
R388,8 million for Phase 3 of CPUT’s infrastructure programme of which R150 million of the funding must be provided by CPUT. The first tranche of R79,616 million was received in January 2013, whilst the second and third tranches of R79,615 and R79,616 million respectively were received in March and September 2014.
An additional grant of R85 100 000 for infrastructure repairs and maintenance was received in April 2016 and an amount of R93 823 896 in April 2017 (refer note 16.2)
Teaching Development and Collaborative Programme grants
The deferred income balance comprises of R8 752 863 (2016: R6 107 929) which relates to funding from DHET. The aim of these funds is to provide financial support to improve the graduation rate and therefore increase the annual student success rate. The allocation for 2017 for this grant was R15 468 000 (2016: R19 702 000) and the collaborative grant R Nil (2016: R NIL) (Refer note 16.3)
Clinical Training grant
The deferred income balance comprises of R5 390 719 (2016: R4 382 209) which relates to
16.1 Government grants released to income 16.2 Government Grants -
funding from DHET. The aim of these funds is to provide clinical training to health professionals. The allocation of R7 005 800, allocations of R3 470 000 and R3 678 000 respectively were received in June 2011 and January 2012 and the amounts of R4 260 000 and R1 114 000 in March and April of 2015 and the amount of R2 426 800 in July 2016. We received an amount of R14 943 200 for 2017 (refer note 16.4)
NGAP grant
The deferred income balance comprises of R16 861 875 (2016: R18 578 538) which relates to funding received from DHET. The aim of these funds is in support of the new nGAP appointees over the 6 years of the nGAP. The allocation for 2015 in support of this initiative was R13 049 274 with an additional allocation of R2 500 000 for 2017 (2016: R9 330 968).
Research and Development Grant
The deferred income balance comprises of R1 821 883 (2016: R24 060 725) which relates to funding received from DHET. The allocated funds represent significant government investments in research development and should also ensure that the transformation requirements of the country are addressed in the use of these funds.
and merger cost claims:
118 2017
N
Infrastructure
2017 R 2016 R Income recognised – capital items (linked to depreciation charge) 8 317 300 5 496 737 8 317 300 5 496 737 2017 R 2016 R Opening balance – deferred income 614 964 263 535 361 000 Amount raised – infrastructure grant received 93 823 986 85 100 000 Released to income (8 317 300) (5 496 737) Closing balance – Infrastructure and Merger cost claims 700 470 949 614 964 263
N OTES TO THE FINANCIAL STATEMENTS (continued)
for the year ended 31 December 2017
16 DEFERRED INCoME (continued)
119
Clinical
Government
NGAP
Government
- Research and Development
2017 R 2016 R Opening balance 6 107 929 4 664 832 Amount raised – grant received 17 595 638 21 128 015 Released to income (14 950 704) (19 684 918) Closing balance – Teaching development grant 8 752 863 6 107 929 2017 R 2016 R Opening balance 4 382 209 6 616 335 Amount raised – grant received 14 943 200 2 426 800 Released to income (13 935 038) (4 660 926) Closing balance – Clinical training grant 5 390 371 4 382 209 2017 R 2016 R Opening balance 18 578 538 12 654 393 Amount raised – grant received 2 500 000 9 330 968 Released to income (4 216 664) (3 406 823) Closing balance – NGAP grant 16 861 874 18 578 538 2017 R 2016 R Opening balance 24 060 725 5 914 092 Amount raised – grant received 2 127 750 22 340 875 Released to income (24 366 592) (4 194 242) Closing balance – Research and Development grant 1 821 883 24 060 725 Current balance 9 292 300 9 292 300 Non-current balance 724 005 642 658 801 364 733 297 942 668 093 664
16.3 Government Grants - Teaching development and Collaborative programme grants: 16.4 Government Grants -
training grant: 16.5
Grants -
grant: 16.6
Grants
grant:
FINANCIAL STATEMENTS
17 FINANCIAl RISK MANAGEMENT oBjECTIVES AND PolICIES
The University’s principal financial instruments comprise investments, accounts receivable, student fees receivable, staff loans, cash and short-term deposits, interest bearing borrowings, accounts payable and accrued liabilities.
The University manages a substantial portfolio of investments with a long term view to growing the portfolio in order to provide financial stability and support for new initiatives of the University.
The main purpose of the interest bearing loans and borrowings is to raise finance for the University’s capital building projects. The University has various other financial assets and liabilities such as accounts and student fees receivable and accounts payable, which arise directly from its operations.
The main risks arising from the University’s financial instruments are market risk, credit risk and liquidity risk. Council, through its Finance Committee reviews, agrees policies for managing each of these risks and they are summarised below.
Market Risk
The risk that the fair value or future cash flows of a financial instrument will fluctuate because of changes in market prices. Market risk comprises three types of risk: price, currency and interest rate risks. The University’s exposure to market risk relates primarily to its investments and loans.
The University’s investments are managed by selected portfolio managers who operate under defined mandates, which are designed
for the year ended 31 December 2017
to limit the exposure of the University. The investment decisions made and performances of these managers are closely monitored by the Finance Committee. This Committee comprises members of the University’s Council and executive management members with specific expertise relating to investments.
Interest rate risk
The risk that the fair value or future cash flows of a financial instrument will fluctuate because of changes in market interest rates. The University’s interest-bearing borrowings are a combination of fixed and floating rates of interest. The University has a number of receivables where interest rates charged are linked to the prime rate.
Per note 6 the University did not charge any interest on student fees receivable for the current year due to a change in the University’s policy.
The total fixed rate financial instruments amount to R1 667 295 (2016: R2 131 961) and the variable rate financial assets amount to R1 657 915 940 (2016: R1 574 829 101) and variable rate financial liabilities amount to R287 339 068 (2016: R319 979 053)
The University holds a substantial amount of interest bearing investments and interest earning bank deposits. Interest risks relating to the University’s investments are managed by selected portfolio managers.
The following table demonstrates the sensitivity of the University’s financial assets and liabilities that are subject to interest rate risk to a reasonable change in market values, with all other variables constant. The effect of these are considered on a net basis.
120 2017 N
OTES TO THE
(continued)
Impact of interest rate changes on Net surplus and Accumulated funds Interest rate change (BP) +200 BP +100 BP -100 BP -200 BP At 31 December 2017 R R R R Net financial assets (1 447 023) ( 723 511) 723 511 1 447 023 At 31 December 2016 Net financial assets (3 302 243) (1 651 122) 1 651 122 3 302 243
N OTES TO THE FINANCIAL STATEMENTS (continued) for the year ended 31 December 2017
17 FINANCIAl RISK MANAGEMENT oBjECTIVES AND PolICIES (continued)
Price risk
The risk that the fair value or future cash flows of a financial instrument will fluctuate because of changes in market prices (other than those arising from interest rate and currency risks). The University is exposed to price risk in respect of its investment portfolio. The University manages this
risk through investing in a wide variety of assets.
The following table demonstrates the sensitivity of the University’s financial assets that are subject to price risk to a reasonable change in market values, with all other variables constant.
Foreign currency risk
The University is exposed to foreign currency risk to the extent that it has accounts receivable and payable balances denominated in foreign currencies. The amount of such balances is negligible at year-end.
Credit risk
The risk that one party to a financial instrument will cause a financial loss for the other party by failing to discharge an obligation.
The University trades only with recognised, credit worthy third parties. In addition, receivable
balances are monitored on an ongoing basis with the result that the University’s exposure to bad debts, with the exception of student fee receivables is not significant, and there is no significant concentration of credit risk at year end. The maximum exposure is the carrying amount reflected in Notes 5, 6 and 7(excluding prepayments and VAT receivable).
All credit risk associated with student receivables is adequately provided for. The outstanding fees balance at year end is as follows amongst the student body:
121
Impact of interest rate changes
and Accumulated
Market variance +10% +5% -5% -10% At 31 December 2017 R R R R Equities – local 40 234 033 20 117 017 (20 117 017) (40 234 033) Equities – foreign 24 006 332 12 003 166 (12 003 166) (24 006 332) Unit trusts – local 26 925 662 13 462 831 (13 462 831) (26 925 662) Interest bearing bonds – local 21 925 679 10 962 840 (10 962 840 ) (21 925 679)
Equities – local 67 044 588 33 522 294 (33 522 294) (67 044 588) Equities – foreign 22 488 100 11 244 050 (11 244 050) (22 488 100) Unit trusts – local 3 127 667 1 563 834 (1 563 834) (3 127 667) Interest bearing bonds – local 27 796 564 13 898 282 (13 898 282) (27 796 564)
on Net surplus
funds
At 31 December 2016
2017 N OTES TO THE FINANCIAL STATEMENTS
(continued) for the year ended 31 December 2017
17 FINANCIAl RISK MANAGEMENT oBjECTIVES AND PolICIES (continued)
With respect to credit risk arising from the other financial assets of the University, which comprise cash and cash equivalents, availablefor-sale debt instruments, the University’s exposure to credit risk arises from default of the counterparty, with a maximum exposure equal to the carrying amount of these instruments.
The University only places cash and cash
deposits with major financial Institutions with good credit ratings. The University considers financial assets which are neither past due nor impaired to be fully recoverable.
Fair values
Set out below is a comparison by category of carrying amounts and fair values of all of the University’s financial instruments.
The fair value of interest bearing borrowings has been calculated by discounting the expected future cash flows at prevailing market interest rates. It should be noted that the fair value of fixed rate borrowings is impacted by the fact that these loans are subsidised by the State (refer note 8).
The fair value of short-term financial assets and liabilities approximates their carrying values.
The fair value of investments is based on quoted bid-market prices at the statement of financial position date.
The following table below reflects the fair values of financial instruments, including their levels in the fair value hierarchy. It does not include fair value information for financial instruments not measured at fair value if the carrying amount is a reasonable approximation of the fair value.
122
Carrying Value amounts 2017 Fair Value amounts 2017 Carrying Value amounts 2016 Fair Value amounts 2016 R R R R Financial assets Available-for-sale investments 1 245 402 290 1 245 402 290 1 281 517 176 1 281 517 176 Accounts receivable (excluding prepayments, Vat receivable) 156 051 859 156 051 859 84 701 435 84 701 435 Student fees receivable 208 355 979 208 355 979 146 843 762 146 843 762 Cash and cash equivalents 211 320 962 211 320 962 146 468 163 146 468 163 Financial liabilities Interest bearing borrowings: 289 006 363 289 522 979 322 111 014 322 801 046 - Fixed rate borrowings 1 667 295 2 183 911 2 131 961 2 821 994 - Floating rate borrowings 287 339 068 287 339 068 319 979 053 319 979 053 Accounts payable and accrued liabilities 256 569 685 256 569 685 182 862 477 182 862 477
2017 R 2016 R Range of Balance Number of students Outstanding balance as at 31 December Number of students Outstanding balance as at 31 December Up to R10 000 19 259 71 846 770 56 604 55 804 550 R10 001 to R30 000 16 273 224 453 358 16 216 247 163 304 R30 001 to R50 000 5 564 216 691 605 3 831 133 392 347 >R50 000 2 928 203 492 743 1 058 26 665 406 44 024 716 484 476 77 709 463 025 607
N OTES TO THE FINANCIAL STATEMENTS (continued) for the year ended 31 December 2017
17 FINANCIAl RISK MANAGEMENT oBjECTIVES AND PolICIES (continued)
Reconciliation of Level 3 Fair value instruments
The University uses the following hierarchy for determining and disclosing the fair value of financial instruments by valuation technique:
level 1: Quoted prices(unadjusted) in active markets for identical assets and liabilities.
level 2: Inputs other than quoted prices
Type
Long-term borrowings: fixed interest rate
Valuation Technique
Discounted cash flows: The valuation model considers the present value of expected payments, discounted using a risk adjusted discount rate.
The expected payment is determined by considering the possible scenarios of forecast (prime rate), the amount to be paid under each scenario and the probability of each scenario. The discounting rate used is prime less 2,5 %
included within Level 1 that are observable for the asset or liability, either (i.e. as prices) or indirectly (i.e. derived from prices).
level 3: Inputs for the asset or liability that are not based on observable market data (unobservable inputs).
Significant unobservable inputs
The interest rates used to calculate cash flows ranges from 9,5% to 13,22%. The discount rate prime less 2,5% was used to calculate the present value for the remaining repayment periods.
Significant increases (decreases) in any of those inputs in isolation would result in a significantly lower (higher) fair value measurement.
There are no interrelationships between unobservable inputs, as only one unobservable input was used in the valuation.
123
Level 1 Level 2 Level 3 Total R R R R As at 31 December 2017 Financial assets Available-for-sale investments 1 245 402 290 - - 1 245 402 290 Financial liabilities Interest bearing borrowings - - 2 183 911 2 183 911 Total 1 245 402 290 - 2 183 911 1 247 586 201 As at 31 December 2016 Financial assets Available-for-sale investments 1 281 517 176 - - 1 281 517 176 Financial liabilities Interest bearing borrowings - - 2 821 994 2 821 994 Total 1 281 517 176 - 2 821 994 1 284 339 170 2017 2016 R R
Opening balance 2 821 994 3 299 740 Plus interest accrued 212 324 255 778 Less payments made ( 676 991) ( 676 991) Plus fair value adjustments ( 173 416) ( 56 533) Closing balance 2 183 911 2 821 994
2017 N OTES TO THE FINANCIAL STATEMENTS
liquidity risk
The risk that an entity will encounter difficulty in meeting obligations associated with financial liabilities. The timing and nature of the University’s cash inflows and outflows are such that liquidity problems are unlikely to arise.
The cashflow position is monitored by management daily and the University has access to funds through either its holding of short-term bank deposits or the investments portfolio in the event that any unforeseen events occur.
Capital Management
The Institution’s policy is to sustain a healthy accumulated fund balance in order to maintain donor, creditor and public confidence as well as sustain future development of the Institution.
(continued) for the year ended 31 December 2017
Specifically restricted funds are managed within the rules as agreed with the relevant funders. Management monitors the return on accumulated funds. There are no externally imposed requirements for the management of the accumulated funds.
The Institution monitors accumulated funds using a ratio of adjusted net debt to accumulated funds. For this purpose net debt is defined as total liabilities, comprising interest-bearing loans, borrowings and obligations under finance leases less cash and cash equivalents.
The Institution’s objective is to keep the ratio below 2.00. The Institution’s adjusted net debt to accumulated funds ratio at 31 December was as follows:
124
2017 R 2016 R Total liabilities 1 862 886 352 1 745 603 105 Less: Cash and cash equivalents (211 320 962) (146 468 163) Net debt 1 651 565 390 1 599 134 942 Accumulated Funds 1 899 173 754 1 857 690 167 Net debt to accumulated funds ratio 0,87 0,86 Year ended 31 December 2017 R R R R R R Financial liabilities On demand Less than 3 months 3 - 12 months 1 - 5 years More than 5 years TOTAL Interest-bearing borrowings - 11 595 382 37 818 908 120 087 424 157 441 031 326 942 745 Trade payables and accrued expenses - 152 935 689 - - - 152 935 689 Other payables and accrued liabilities 100 428 072 3 205 924 - - - 103 633 996 Total 100 428 072 167 736 995 37 818 908 120 087 424 157 441 031 583 512 430
17 FINANCIAl RISK MANAGEMENT oBjECTIVES AND PolICIES (continued)
The following table sets out the maturity profile of the University’s financial liabilities based on contractual undiscounted payments.
N OTES TO THE FINANCIAL STATEMENTS
(continued) for the year ended 31 December 2017
17 FINANCIAl RISK MANAGEMENT oBjECTIVES AND PolICIES (continued)
18
The following table sets out the maturity profile of the University’s financial instruments which are exposed to interest rate risk with the following categories:
CoNTINGENT ASSETS, lIABIlITIES AND FINANCIAl GUARANTEES
Claim for payment of outstanding private rental
The Plaintiff is claiming from CPUT an amount of R758 300 plus interest and legal costs for accommodation provided to students in their personal capacity. The matter is instituted in the High Court. During the litigation proceedings the Plaintiff appealed to the Supreme Court of Appeal (SCA) against the High Court ruling (relating to an exception taken by CPUT to Plaintiff’s particular of claim. The High Court made an order in favour
of CPUT but afforded the Plaintiff an opportunity to amend its particulars of claim). CPUT opposed the appeal. The SCA dismissed the application for condonation and reinstatement of the appeal with costs. Litigation is proceeding in the High Court.
Claim by certain employees of CPUT
The Plaintiffs instituted a claim against CPUT for the payment of an amount of R5 273 027 plus interest and costs, which comprises the total sum of their individual claims. These claims are premised on an alleged breach of the terms and conditions of employment. The matter is proceeding in the High Court.
125
Year ended 31 December 2017 R R R R R R Financial instruments On demand Less than 3 months 3 – 12 months 1 – 5 years More than 5 years TOTAL Cash, cash equivalents and interest bearing bonds 144 178 739 4 641 033 40 575 876 60 477 358 170 871 388 420 744 394 Total 144 178 739 4 641 033 40 575 876 60 477 358 170 871 388 420 744 394 Year ended 31 December 2016 R R R R R R Financial instruments On demand Less than 3 months 3 – 12 months 1 – 5 years More than 5 years TOTAL Cash, cash equivalents and interest bearing bonds 155 223 208 32 075 353 33 374 740 44 880 135 216 832 027 482 385 463 Total 155 223 208 32 075 353 33 374 740 44 880 135 216 832 027 482 385 463
Year ended 31 December 2016 R R R R R R Financial liabilities On demand Less than 3 months 3 - 12 months 1 - 5 years More than 5 years TOTAL Interest-bearing borrowings - 15 280 153 45 892 074 171 024 074 220 094 955 452 291 256 Trade payables and accrued expenses - 115 480 324 - - - 115 480 324 Other payables and accrued liabilities 63 366 280 4 015 873 - - - 67 382 153 Total 63 366 280 134 776 350 45 892 074 171 024 074 220 094 955 635 153 733
18
OTES TO THE FINANCIAL STATEMENTS
(continued) for the year ended 31 December 2017
CoNTINGENT ASSETS, lIABIlITIES AND FINANCIAl GUARANTEES (continued)
Claim for damages based on alleged contract breach
The Plaintiff instituted a claim against CPUT for payment of an amount of R1 570 207 plus interest and legal costs for alleged breach of contract. The matter is instituted in the High Court and is set down for trial.
Claim for damages relating to security system agreement
CPUT instituted a claim for damages in the High Court in the amount of R12 374 672 plus interest and legal costs with further claims in the alternative. The claim results from electronic
Financial guarantees
security services not fully installed, or not installed to the required standard; fully maintained ; or not maintained to the required standard. The matter is proceeding in the High Court.
Claim for payment relating to sub-lease agreement for student accommodation
Plaintiff instituted a claim against CPUT for the recovery of rental and damages allegedly due in terms a sub-lease agreement concluded in 2013 for student accommodation, in the amount of R1 093 302 plus interest and legal costs. The matter is proceeding in the High Court.
The University provides guarantees in respect of housing loans for University staff. These amounts are set out in the table below.
19 CoMMITMENTS
19.1 Capital commitments
Capital commitments as listed below relates to amounts formally designated for the acquisition, construction and improvement of building projects.
It is intended that the University will fund these commitments from internal resources, investments and loans.
126 2017
N
2017 R 2016 R Housing loan guarantees: University Staff 600 463 700 892 600 463 700 892 2017 R 2016 R Amounts allocated for capital expenditure at reporting date, but not contracted 256 442 678 86 469 070 Expenditure contracted for at year end, but not yet incurrred 56 288 894 58 289 336 312 731 572 144 758 406
N OTES TO THE FINANCIAL STATEMENTS (continued) for the year ended 31 December 2017
19 CoMMITMENTS (continued)
19.2 operating lease commitments
The total of future minimum lease payments under non-cancellable operating leases are as follows:
Operating lease commitments relate to rental of buildings, photocopy and PABX equipment. The amounts disclosed above are the minimum lease payments. Escalation clauses are either based on CPIX or are between 6% and 8%. Whilst options
to renew exist on some leases, no decision has been taken at balance sheet date in this regard.
The expenses reflected in the surplus or loss in respect of operating leases are as follows:
20 REMUNERATIoN oF KEY MANAGEMENT
The following disclosure, as required by the Minister of Higher Education and Training, relates to compensation paid to members of the University’s executive management team.
Remuneration is based on cost of employment to the University. Compensation paid for other services performed within the University is reflected separately.
127
2017 R 2016 R Equipment Within 1 year 6 865 116 7 592 230 2 to 5 years 6 365 141 2 184 797 after 5 years -13 230 257 9 777 027 Property Within 1 year 54 205 455 70 416 663 2 to 5 years 11 177 932 65 383 387 after 5 years -65 383 387 135 800 050 2017 R 2016 R Equipment 8 777 911 8 072 706 Property 91 183 231 79 602 998 99 961 142 87 675 704
2017 N OTES TO THE FINANCIAL STATEMENTS
20 REMUNERATIoN oF KEY MANAGEMENT (continued)
(continued) for the year ended 31 December 2017
128
Name Office Held Basic cost of employment Leave Encashment Post Retirement medical fund Total Primary Services Other Total Remuneration 1 2 2017 R R R R R R Nevhutalu AP (Note 1) Vice-Chancellor 2 349 329 - - 2 349 329 - 2 349 329 Volmink J (Note 2) Acting-Vice Chancellor 1 315 455 - - 1 315 455 - 1 315 455 Staak AP Deputy ViceChancellor: Academic 2 253 419 - 32 280 2 285 699 - 2 285 699 Nhlapo NS (Note 3) Acting-Vice Chancellor 2 512 069 - - 2 512 069 - 2 512 069 Fourie LCH DVC:Knowledge, Information and Technology 2 149 785 - - 2 149 785 - 2 149 785 Sibanda S Executive Director: Infrastructure and Facilities Management 1 666 998 - - 1 666 998 - 1 666 998 Mkhabela OK (Note 4) Executive Director: Vice-Chancellor's Office 1 974 182 - - 1 974 182 - 1 974 182 Qomoyi NS (Note 5) Acting Executive Director: Human Capital 1 024 764 - - 1 024 764 - 1 024 764 Du Plessis P Executive Director: Finance 1 758 838 - - 1 758 838 - 1 758 838 Ntsababa NN Registrar 1 850 250 - - 1 850 250 - 1 850 250 Motale MC Dean of Students 1 847 250 - - 1 847 250 - 1 847 250 Fatoki OS Dean: Applied Sciences 1 525 929 - - 1 525 929 - 1 525 929 Cronje J Dean: Informatics and Design 1 553 744 - - 1 553 744 - 1 553 744 Mda TV Dean: Education and Social Sciences 1 499 184 - - 1 499 184 - 1 499 184 Sheldon MS (Note 6) Acting DVC: Research,Technology Innovation and Partnerships 1 546 691 - - 1 546 691 - 1 546 691 Lotter WA Acting Dean: Business 1 391 173 - - 1 391 173 - 1 391 173 Moll CM (Note 7) Acting Dean: Engineering 613 323 - - 613 323 - 613 323 Total 2017 28 832 383 - 32 280 28 864 663 - 28 864 663
remuneration
Gross
N OTES TO THE FINANCIAL STATEMENTS
(continued) for the year ended 31 December 2017
20 REMUNERATIoN oF KEY MANAGEMENT (continued)
The following disclosure, as required by the Minister of Higher Education and Training, relates to compensation paid to members of the University’s executive management team.
Remuneration is based on cost of employment to the University. Compensation paid for other services performed within the University is reflected separately.
129
Name Office Held Basic cost of employment Leave Encashment Post Retirement medical fund Total Primary Services Other Total Remuneration 1 2 2016 R R R R R R Nevhutalu AP Vice-Chancellor 2 710 047 - - 2 710 047 - 2 710 047 Volmink J Acting-Vice Chancellor 361 373 - 361 373 - 361 373 Staak AP Deputy ViceChancellor: Academic 2 148 517 - 32 280 2 180 797 - 2 180 797 Nhlapo NS DVC: Research, Technology Innovation and Partnerships 2 146 944 - - 2 146 944 - 2 146 944 Fourie LCH DVC:Knowledge, Information and Technology 2 047 648 - - 2 047 648 - 2 047 648 Sibanda S Executive Director: Infrastructure and Facilities Management 1 595 755 - - 1 595 755 - 1 595 755 Mabuza MN Executive Director: Human Resources 734 793 - - 734 793 (34 947) 699 846 Mkhabela OK Executive Director: Vice-Chancellor's Office 1 374 211 - - 1 374 211 - 1 374 211 Du Plessis P Executive Director: Finance 546 911 - - 546 911 - 546 911 Geduld-Jeftha ME Acting Executive Director: Finance 1 391 417 - - 1 391 417 - 1 391 417 Ntsababa NN Registrar 1 756 846 - - 1 756 846 - 1 756 846 Motale MC Dean of Students 1 779 472 - - 1 779 472 - 1 779 472 Fatoki OS Dean: Applied Sciences 1 476 498 - - 1 476 498 - 1 476 498 Gihwala D Dean: Health and Wellness Sciences 2 115 312 - - 2 115 312 - 2 115 312 Cronje J Dean: Informatics and Design 1 619 242 - - 1 619 242 - 1 619 242 Mda TV Dean: Education and Social Sciences 1 431 345 - - 1 431 345 - 1 431 345 Sheldon MS Acting Dean: Engineering 1 220 280 - - 1 220 280 - 1 220 280 Binza MS Dean: Business 354 260 - - 354 260 - 354 260 Lotter WA Acting Dean: Business 1 103 785 - - 1 103 785 - 1 103 785 Total 2016 27 914 656 - 32 280 27 946 936 (34 947) 27 911 989
N OTES TO THE FINANCIAL STATEMENTS
(continued) for the year ended 31 December 2017
All of the above remuneration amounts are in respect of short-term employee benefits in terms of IAS 24 except for:
1. Included in Basic Cost of Employment is an amount of R3 098 9456 (2016: R3 101 746) in respect of the Employer’s Contribution to Retirement Funds and Group Life Schemes.
2. These amounts are in respect of post retirement medical aid. Some members receive an allowance in respect of Post Retirement Medical Aid Contributions, whilst for others the Institution provides for the liability and the contributions are paid over on retirement to the Medical Aid Schemes.
Note 1: The Vice-Chancellor, Dr AP Nevhutalu has terminated his service as from 28 September 2017.
Note 2: The Acting Vice-Chancellor, Dr J Volmink ended his acting service on 31 July 2017. He remains a member of Council.
Note 3: Dr Nhlapo, DVC: Research, Techonology, Innovation & Partnership has been Acting Vice-Chancellor from 01 August 2017 until such time the position is filled.
Note 4: Executive Director to the ViceChancellor’s office, Dr OK Mkhabela resigned on 31 October 2017
Note 5: Ms NS Qomoyi was Acting Executive Director: Human Capital from 01 March 2017 till 31 March 2017 and then again from 01 November 2017.
Note 6: Prof. MS Sheldon, Dean: Engineering is currently acting as DVC: Research, Technology, Innovation and Partnership since 01 August 2017
Note 7: Dr CM Moll is currently acting as Dean: Engineering from 01 August 2017
Balances per the table are the remuneration received during the period as indicated.
No lump sum payments in excess of R249 999 were paid in 2017 (2016: Rnil)
Remuneration of Council Members
Payments for attendance at meetings of the Council and its Sub-Committees Committee
Reimbursement for travelling expenses and stipends of R665 250 (2016: R588 000) were paid to external Council for attendence at meetings of Council and its Sub-Committees. External council members receive a stipend of R1 500, Chairperson of sub-committees R1 750, and the Chairperson of Council R2000 per meeting.
The following table represents the disclosure required in terms of IAS 24 in respect of compensation of key management.
130
2017
Number of members Chair of Council 1 Chairs of Committees 8 Members of Council 25
2017 R 2016 R Short-term employee benefits 25 765 718 24 810 243 Post-employee pension and medical benefits 3 098 945 3 101 746 Total compensation paid to key management personnel 28 864 663 27 911 989
N OTES TO THE FINANCIAL STATEMENTS
(continued) for the year ended 31 December 2017
21 RElATED PARTY TRANSACTIoNS
The related party relationships of the Cape Peninsula University of Technology in terms of IAS 24 are as follows:
- Key management personnel, which comprises members of both Council and the University executive management team (refer note 20).
- The Department of Higher Education and Training (DHET) (refer notes 12 and 16).
- UAV - SysCo (Pty)Ltd (100% held subsidiary of CPUT)
Due to the nature of the University’s operations
and the composition of its Council (being drawn from public and private sector organisations) it is likely that transactions will take place with organisations in which a member of Council may have an interest, these are conducted in accordance with the University’s procurement procedures.
During the current year the University did not purchase any goods and services from companies in which a Council member or senior management has a major interest.
The following are significant related party balances and transactions as listed below:
There are various terms and conditions in respect of subsidies and grants, and are available upon request.
22 EVENTS AFTER THE REPoRTING DATE
As at reporting date Council is not aware of any events which had a significant impact on the statement of financial position at year end which require an adjustment or disclosure in these financial statements.
23 GoING CoNCERN
The Council believes that the University has adequate financial resources to continue in operation for the foreseeable futue and accordingly the financial statements have been prepared on a going concern basis. This basis presumes that funds will be available to finance future operations and that the realisation of assets
and settlement of liabilities, contingent obligation and commitments will occur in the ordinary course of business.
24 CoMPARATIVE FIGURES
Comparative figures has been restated in the notes to the financial statement relating to the number of the average part-time and full time staff members employed during the financial year. Where appropriate, comparative figures are restated with full disclosure of the respective changes.
131
2017 R 2016 R 1. UAV – SysCo(Pty) Ltd • loan owing from 118 000 118 000 2. DHET • loans owing (to) (1 667 295) (2 131 961) • various subsidies and grants received 1 206 843 609 1 026 882 098
132 A NNUAL R EPORT 2017 Notes
+27 (0)21 959 6767
info@cput.ac.za www.cput.ac.za
www.facebook.com/cput.ac.za @cput @wearecput
