1 minute read
Total Personal Insolvency
by AICM
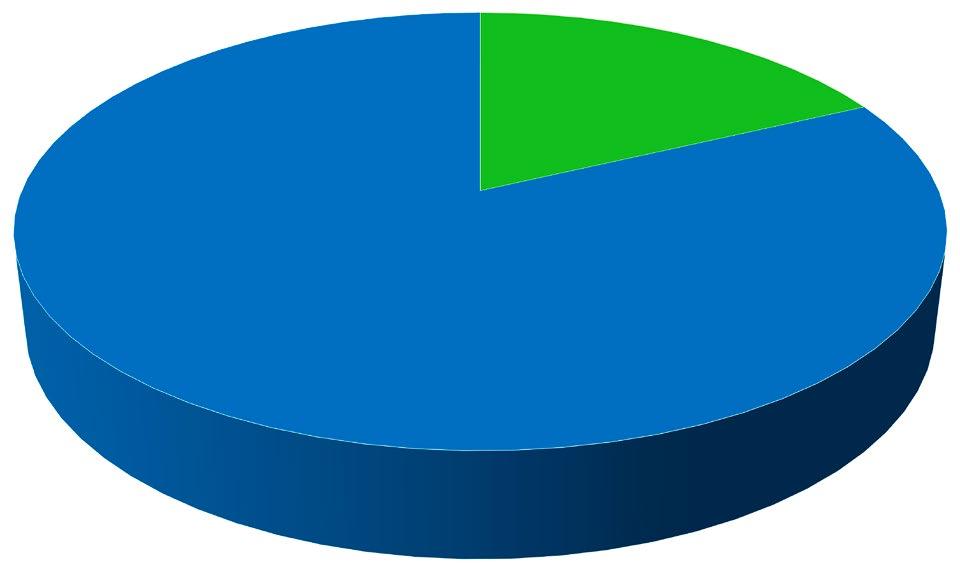
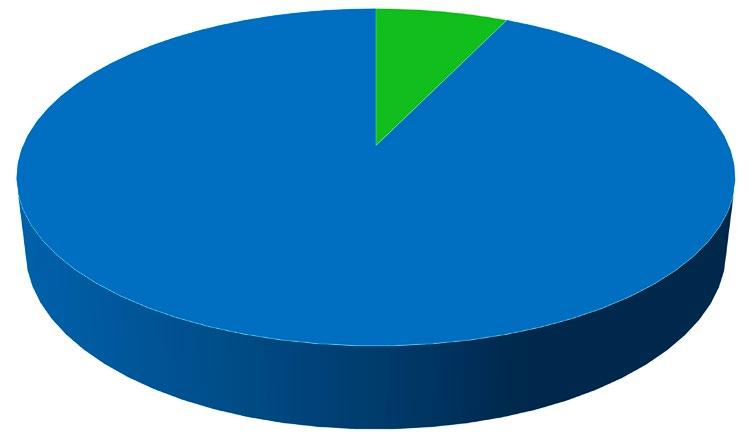
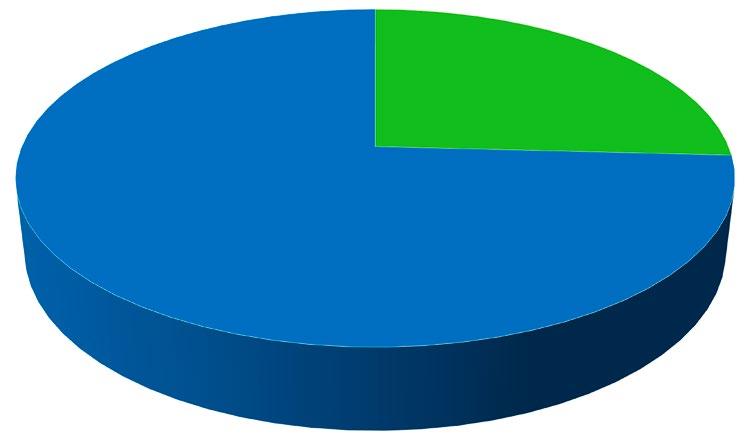
Number of Debtors entering new Administrations July 2018 to June 2019
Total Debtors
Advertisement
4,938 18%
22,534 82%
n Business Related
n Non-Business Related
Number of Bankrupts
4,065 25.8%

11,670 74.2%
Number of Debt Agreement Debtors

824 7.1%
10,725 92.8%
NUMBER OF DEBTORS ENTERING NEW ADMINISTRATIONS UNDER THE BANKRUPTCY ACT 1966, 2018-2019
State/ territory Number of bankrupts Number of debt agreement debtors Number of personal insolvency agreement debtors Total debtors
Business related
Nonbusiness related Total Business related
Nonbusiness related Total Business related
Nonbusiness related Total Business related
Nonbusiness related Proportion of debtors with a business related personal insolvency
Total Bankrupts Debt agreement debtors Personal insolvency agreement debtors
Total debtors
NSW 962 3,370 4,332 242 3,298 3,540 14 36 50 1,218 6,704 7,922 22.2% 6.8% 28.0% 15.4% ACT 36 119 155 5 146 151 2 3 5 43 268 311 23.2% 3.3% 40.0% 13.8%
Vic 712 1,912 2,624 172 1,894 2,066 7 21 28 891 3,827 4,718 27.1% 8.3% 25.0% 18.9% Qld 1,322 3,409 4,731 214 3,227 3,441 10 34 44 1,546 6,670 8,216 27.9% 6.2% 22.7% 18.8% SA 234 810 1,044 36 540 576 2 5 7 272 1,355 1,627 22.4% 6.3% 28.6% 16.7% NT 43 109 152 9 134 143 0 2 2 52 245 297 28.3% 6.3% 0.0% 17.5%
WA 661 1,500 2,161 129 1,239 1,368 13 35 48 803 2,774 3,577 30.6% 9.4% 27.1% 22.4% Tas 52 309 361 16 240 256 1 3 4 69 552 621 14.4% 6.3% 25.0% 11.1%
Other 43 132 175 1 7 8 0 0 0 44 139 183 24.6% 12.5% – 24.0%
Total 4,065 11,670 15,735 824 10,725 11,549 49 139 188 4,938 22,534 27,472 25.8% 7.1% 26.1% 18.0%
Note:
State/territory “Other” includes records where no address is stated, records coded to Other Territories and records where the stated address is not in the Australian Statistical Geography Standard (ASGS).


