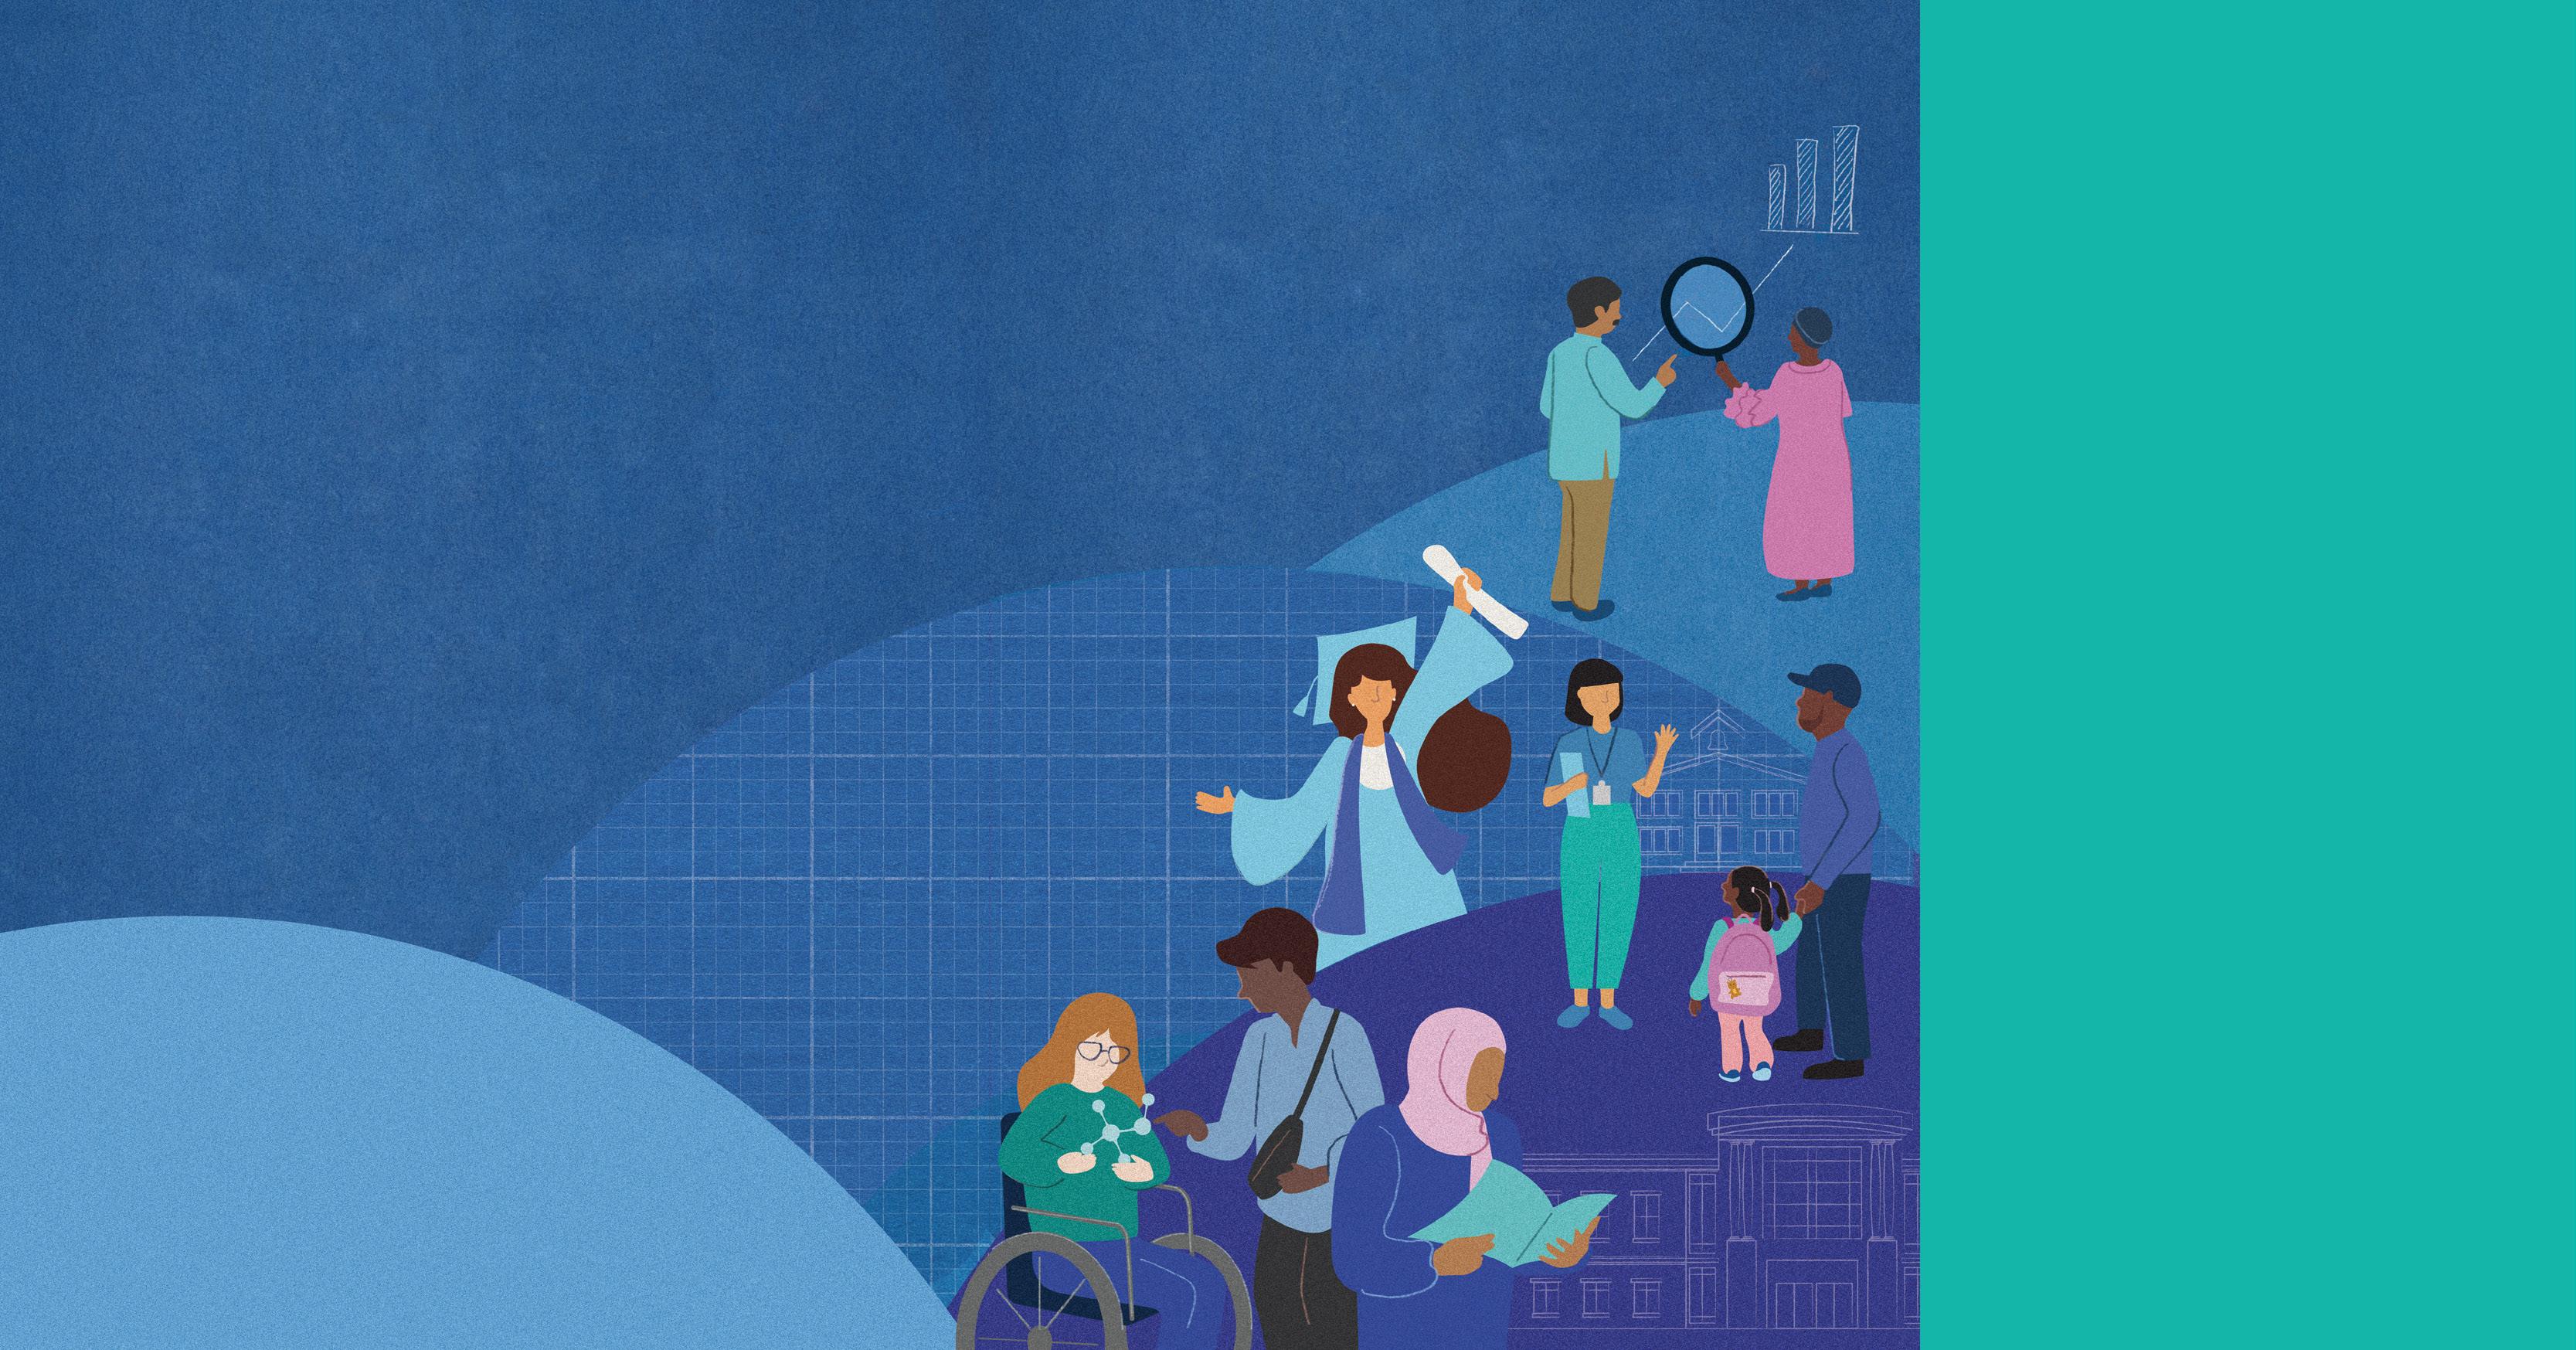
Spark & Sustain
How All the World’s School Systems Can Improve Learning at Scale
FEBRUARY 2024


How All the World’s School Systems Can Improve Learning at Scale
FEBRUARY 2024
This research examines data from over 100 education systems, incorporates interview and survey insights from 50 systems, and deeply pro les 14 systems beating to odds to deliver education improvements at scale.

WHY NOW?
Students in low and middleincome countries are living in learning poverty
Children are in learning poverty 7 in 10 1 Billion
Cumulative learning loss from COVID-19 8 Months 350 Million
Children could be lifted out of learning poverty if the conclusions from this report are put into action

This article is a collaborative effort by Jake Bryant, Felipe Child, Ezgi Demirdag, Emma Dorn, Stephen Hall, Kartik Jayaram, Charag Krishnan, Cheryl Lim, Emmy Liss, Kemi Onabanjo, Frédéric Panier, Juan Rebolledo, Jimmy Sarakatsannis, Doug Scott, Roman Tschupp, Seckin Ungur, and Pierre Vigin, representing views from McKinsey’s global Education Practice.
The authors wish to acknowledge the tireless work of school system leaders, school principals, and particularly classroom teachers, who have dedicated their lives to educating youth and who work every day to close gaps in student achievement.
The authors are additionally grateful to the more than 200 individuals who shared their perspectives during the development of this paper. Particular thanks go to the following leaders and experts for their counsel and thought partnership: Luis Benveniste, Tracey Burns, Borhene Chakroun, Chinezi Chijoki, Euphrates Efosi Wose, David Evans, Judith Herbertson, Rob Jenkins, Wendy Kopp, Leanna Marr, Benjamin Piper, Lant Pritchett, Jaime Saavedra, Andreas Schleicher, Nic Spaull, Joanne Weiss, and Prachi Windlass. Many organizations, including Education World Forum, OECD, UNESCO, UNICEF, and the World Bank contributed to this effort. The authors also wish to acknowledge current and former system leaders who shared their stories, as well as the many civil servants, donors, partners, and researchers who have contributed to education transformations.
The authors would like to acknowledge Li-Kai Chen, the fearless leader of our global education practice over the past decade, who sponsored and supported so many of us in this work and our careers. This report benefited from the contributions of many current and former McKinsey colleagues and advisers globally over multiple years, including Amaya Bremauntz Enriquez, Solly Brown, Avery Cambridge, Tomas Calleja, Julian Carrigan, Alberto Chaia, Will Corbit, Gemma Corke, Nadine Diaz-Infante, Roland Dillon, Marco Dondi, Diana Ellsworth, Marcus Frank, Arne Gast, Ben Gummer, Ghita El Kadiri, Julia Jeffries, Ria Joneja, Jussi Hiltunen, Michael Horn, Jay Kloppenberg, Min-Jung Kim, Bengi Korkmaz, Jonathan Law, An Lanh Le, Nate Levenson, Philip Lindsay, Nawal M’Jahad, Nomfanelo Magwentshu, Stephanie McBride, Alexa Meng, Lucia Mercado Cordova, Gloria Macias, David Meredith, Aldous Mitchell, Peggy Moriarty, Mike Munroe, Arooj Naveed Haq, Laura Ng, Bing Quek, Andrea Pagola, Ted Rounsaville, Paul Rutten, Shajia Sarfraz, Sidney Scott, Dirk Schmautzer, Shriya Sethi, Shalini Shybut, Danilo Silva, Laurie Sztejnberg, Vera Tang, Alex Teece, Safia Tmiri, Kenza Touhs, Marily Van Nevel, Pablo Vazquez, Nicole Ventrone, Ellen Viruleg, Patrick White, Phillia Wibowo, Anna Wiesinger, Claire Williams, Dominic Williams, Todd Wintner, Bart Woord, Timothy Yap, Rebecca Yeoh, Anna Zawada, and Rea Zhubi.
This report received writing and editing support from Liz McCrocklin and was designed by Camille Davis, Bethany Kersey, Kristin Redman, and Michael Sambar at Cricket Design Works.

In many parts of the world, the gap between what education systems deliver and what economies demand has widened significantly over the past two decades. This will have dramatic consequences in the decades to come, as our schools today will be our economy, our society, and our democracy tomorrow. And yet, the results from the OECD’s Programme for International Student Assessment (PISA) surveys show that some countries have bucked this downward trend and continued to improve quality, equity, and efficiency in educational services—even during the difficult last years of the pandemic.
Spark & Sustain: How all the world’s school systems can improve learning at scale discerns what distinguishes successful reforms from those that are unsuccessful. Its biggest contribution lies in identifying patterns related to the “why” and the “how” of successful and sustained educational reform that policymakers can adapt to their specific context. The why and the how are often overlooked in conventional policy analysis, but they are crucially important. The lack of progress in education cannot be simply explained by a lack of resources or by a lack of promising policy initiatives. Much comes down to ineffective policy implementation; the road of educational transformation is littered with many good ideas that were implemented poorly or in the wrong context.
Governments are under pressure to deliver results while ensuring that citizens’ tax dollars are spent wisely and effectively. They set ambitious reform agendas and develop strategic plans to achieve them. But in conversations with education ministers around the world, the most commonly cited challenges are not about the “what” of reforms but about how the “what” can be put into practice in successful and sustainable ways. Transforming education at scale will require more than a vision of what is needed and knowledge of what is possible. It will
also take smart strategies—and knowledge of what works is only as valuable as our capacity to act on it.
Policy makers face tough choices when evaluating policy alternatives; they need to weigh the potential impact against the economic and political cost of reform, keeping in mind that the costs for reform are usually short-term and certain, while any benefits will be long-term and uncertain. Should they pursue what is most technically feasible? What is most politically and socially acceptable? What can be implemented quickly? What can be sustained over a sufficient time horizon and across electoral cycles?
Reforms often fail when challenges of transformation are treated as merely technical issues. Technical issues have known solutions and can be resolved through the existing structures and mechanisms of education systems. Transformational issues can only be addressed through changes in priorities, beliefs, and behavior. This is much harder to achieve, because education systems tend to involve complex mazes of stakeholders. The laws, regulations, structures, and institutions on which policy makers tend to focus are like the small visible tip of a huge iceberg. The reason it is so hard to move school systems is that there is a much larger invisible part under the water. This invisible part is about the beliefs, capacities, motivations, and fears of the stakeholders who are involved in education, teachers and parents included. This is where unexpected collisions occur, because this part of the education system tends to evade the radar screen of public policy. That is why educational leaders are rarely successful with reform unless they build a shared understanding and collective ownership for change, and unless they build capacity and create the right policy climate, with accountability measures designed to encourage innovation rather than compliance. This is where the “why” of reform comes in.


The road of educational transformation is littered with many good ideas that were implemented poorly or in the wrong context.
In fact, most successful educational reforms start with a compelling “why”—the purpose and cause of reform. They inspire the education system to act through this “why,” and they use the “what” of the reform—the specific actions and processes—as the tangible outcome of that “why.” By inspiring educators and administrators with the ideas underpinning the effort, successful reforms nurture a sense of purpose or belonging that is not solely linked to external incentives. For those who are inspired, the motivation to act is deeply personal and thus sustainable beyond the short term. Great school systems become great because people in them feel they belong. People across all cultures share the very basic need to belong, which is fulfilled when people share values and beliefs. When policy makers clearly communicate the “why” of educational reform, educators are more likely to buy into the value proposition of these reforms, and will therefore often go the extra mile to implement those reforms even when they encounter difficulties.
In the early stages of reform, ideas are fueled by passion, driving people to make sacrifices to support a cause bigger than themselves. However, most policy makers know that even successful pilots and programs rarely scale. Countless initiatives that were highly successful when they were small never made the grade. Culture is what scales, and a strong culture is the hallmark of effective leadership. Culture is about system learning, system-wide innovation, and purposeful collaboration that leads to large-scale and ongoing improvement. Humans have succeeded as a species because of our ability to form cultures— people who come together around shared values and beliefs. Building shared cultures is also our best bet for effective reform. Not surprisingly, this report
devotes a large part of its analysis to building a culture of transformative leadership.
It is equally important to detect the formal and informal exercise of power of individuals and stakeholder groups within the education system, and to understand the commitments, loyalties, beliefs, and fears of each stakeholder and how these affect decisions. One should never underestimate stakeholders’ perception that a reform is a threat to them and their values, even if all they want is to retain what is familiar, stable, and predictable in their work and life. A key challenge is that the benefits of reform are often thinly spread. It is hard to mobilize stakeholders in support of reform, and the costs can be highly concentrated, making it easy to mobilize opposition.
Leaders will need to forge alliances with people who will support the reform, integrate and defuse opposition, and give valuable dissenting voices a role to adjust perspectives and implementation processes. Understanding what stakeholders care about often makes it possible to find ways for them to serve those values other than by opposing reform. Successful reform therefore requires the ability to recognize potential losses to different stakeholders and predictable defensive responses to those losses at the individual and system level. The potential loss of advantages or privileged positions is of particular importance in education reform, because the vast structure of established providers means that there are extensive vested interests. As a result, the status quo has many protectors—stakeholders in education who stand or expect to lose a degree of power or influence if changes are made. Put simply, it is difficult to ask the frogs to clear the swamp.


It is equally important to understand the network of alliances each stakeholder is embedded in. Policy makers are likely to encounter hidden alliances between stakeholder groups that can facilitate or hinder the effective implementation of reform. An understanding of these connections, and of relationships that go beyond organizational charts, can help leaders identify ways to leverage supportive alliances and mediate opposing ones.
Policy makers need to prepare stakeholders for the disequilibrium the reform will introduce in the system and closely watch for signals about how much heat the system can stand. By engaging with resisters, policy makers acknowledge the sacrifices they are asking them to make and how difficult these may be. In the same vein, it is essential to understand the true degree of each stakeholder’s resources, power, and influence over success or failure of the reform; and how much the stakeholder actually cares about the reform and its outcome.
Often there is also uncertainty about costs, because the education infrastructure is large and involves multiple levels of government, each often trying to minimize or shift its own costs for the reform.
Assessing the relative costs and benefits of reform in education is difficult also because of the large number of intervening factors that can influence the nature, size, and distribution of any improvements. The investment may be expensive over the long term, while in the short term it is rarely possible to predict clear, identifiable results from new policies, especially given the time lags between implementation and effect.
Timing is also relevant to education reform, and in more than one sense. Most significantly, there is a substantial gap between the time at which the initial cost of reform is incurred and the time when it
becomes evident whether the benefits of reform will actually materialize. While timing complicates the politics of reform in many domains, it seems to have a greater impact on education reform, where the lags often involve many years. Education reform becomes a thankless task when elections take place before the benefits of reform are realized. Policy makers may lose an election over education issues, but they rarely win an election because of education reform.
Sometimes crises can facilitate reform. When nothing is certain, anything becomes possible. The COVID-19 pandemic provides a powerful example. While the pandemic induced tremendous hardship for learners and educators, it also facilitated unprecedented technological and social innovation in education. Decades of investment in the professional development of teachers to use digital technologies in education yielded less progress than what was achieved within the first year of the pandemic. In crisis conditions, change is often the only available choice. Moreover, social acceptance for change is usually much greater in crisis conditions. Before the pandemic, digital technologies were seen as an addition or an “extra” in education, and there were often many reasons to resist their introduction. During the pandemic, these technologies became a lifeline for education, and discussions shifted from the “if” to the “how” of their use. Shocks that can leverage change are not confined to events that suddenly disrupt the ability of educational institutions to function; they can also be events that alter perceptions of the education system. For example, the view of employers that educational qualifications are no longer relevant can lead companies to hire on the basis of alternative criteria and thus devalue established educational pathways.
It is important for governments to strive for ambitious outcomes that can take longer to deliver. But
Progress tends to be seen as radical in the long term when it is incremental, consistent, and coherent in the moment.
they also need to deliver tangible results in the short and medium term to keep stakeholders engaged. As important as it is to design reforms to scale across space, it is equally important to carefully craft their trajectory over time. Education reform is so complex because many things need to happen over considerable periods of time to produce the desired outcomes. Few education reforms start by conceptualizing the entire trajectory of reform—that is, the entire sequence of steps, their interrelationships, and their short-term, intermediate, and long-term outcomes. The result is often a piecemeal approach and layers over layers of incoherent reforms.
Communicating short-term, medium-term, and long-term outcomes will help leaders build ownership for reform implementation and sustain efforts and resources over sufficiently long periods. This requires them to be honest and up-front about the length of the reform cycle. Even if it were possible to change early childhood education overnight, it would take many years for the outcomes to translate into improved learning in school and better labor market outcomes in life. Radical and erratic changes in education rarely lead to improvements but rather cause reform fatigue. Progress tends to be seen as radical in the long term when it is incremental, consistent, and coherent in the moment. Helping system stakeholders reach the periphery of their comfort zone in the short term often leads to more sustainable change than radically changing the approach. The challenge is to keep the temperature within the productive zone of disequilibrium and to anticipate and counteract tactics that people will use to lower the heat to more comfortable levels.
Clear trajectories help leaders monitor and understand progress in the education system, but they also enable an informed discussion about the questions that are central to successful reform implementation: What is the reform trying to achieve? How is it intending to pursue this? How will the system know at any moment in time whether reform implementation is on track? What should be done when implementation diverges from the trajectory? When stakeholders and the public do not
see the entire trajectory, with clear perspectives on when specific outcomes are expected to materialize, they often do not sustain the effort over sufficiently long periods. It also becomes easy for subsequent governments to criticize reforms by pointing to outcomes that have not yet been attained, even if they were only meant to be attained in the medium and long term.
Finally, an important aspect of effective policy implementation is the ability to look not just forward but also outward. It is not surprising that a strong and consistent effort to carry out international benchmarking and to incorporate the results of that benchmarking into policy and practice is a common characteristic of the most rapidly improving education systems. And the faster the context evolves, along with the demands on education, the harder it becomes to just lean on past experience. In the past, policy makers could safely follow the lead of their predecessors, because their predecessors knew the world quite well, and the world changed slowly. But in a fast-changing world, it is much harder to distinguish between timeless wisdom and outdated bias. This report will help policy makers look outward in deliberate ways, and this has never been more important than it is today. The world has become indifferent to tradition and past reputations, unforgiving of frailty, and ignorant of custom or practice. Success will go to individuals, institutions, and countries that are swift to adapt, slow to complain, and open to change. The task for governments is to help their citizens rise to this challenge.
Andreas Schleicher Director for the Directorate of Education and Skills Organisation for Economic Co-operation and Development
It is more important today than ever before to improve the quality and equity of education systems around the world. Most school systems globally have stagnated or declined in the past decade, even before the COVID-19 pandemic.
More children than ever are in school, but many are not mastering basic skills. The World Bank estimates that seven in ten students in low- and middle-income countries are living in “learning poverty,” unable to read a simple sentence by the time they finish elementary school.1 The same is true for nine out of ten students in sub-Saharan Africa. 2
Automation is expected to increase demand for educated workers, creating a greater need for technological, socioemotional, and cognitive skills. The recent rise of generative AI is likely to accelerate these workforce transitions.3 In addition to preparing students for the workforce, education systems are increasingly being asked to participate in resolving broader societal issues, from rising mental health challenges among young people4 to political instability and polarization5 to combating climate change.6
The pandemic exacerbated these challenges. Lost learning time widened equity gaps within and between countries, while workforce changes accelerated. This is creating a scissor effect as learning losses collide with a growing need for higher-order skills. If historical trends continue, it will take until 2040 just to get back to where we were in 2019 in terms of student learning outcomes.
To understand how school systems globally can reignite growth and recover from the learning losses of the pandemic, McKinsey examined the drivers of school system improvements in the decade prior to the COVID-19 pandemic. This research covered both school systems that were improving and those in decline. We analyzed global data and spoke with more than 200 system leaders, donors and philanthropists, not-for-profit leaders, academics, and consultants—all of whom pointed to the complexity of the challenge.
At first glance, the lack of progress in learning outcomes may seem puzzling. Over the past decades the education community has researched, developed, and codified strong evidence on what students need to master foundational skills, including reading, writing, and critical thinking. We know which interventions work to achieve proficiency for most students.
Why do so many efforts fail? Simply put, the biggest barrier to success is execution. Most school systems struggle to turn improvements into action, and well-intentioned changes fizzle out. To make changes stick, leaders must know both “what” interventions to use and “how” to implement them well at scale.
Stagnating school systems tend to get stuck in one or more “failure modes.” They may have the right idea (a new curriculum) but the wrong details (choosing the wrong one). Improvements may falter in the face of political pushback, lack the momentum to make it to the classroom, or get overtaken by changing circumstances.
Yet failure is not inevitable. The global education community can chart a new path and learn from the systems that have managed to beat the odds and produce meaningful gains in student learning year after year. These outlier school systems exist on every continent and at every level of national development.
To understand what is driving improvement—and how it can be replicated— we conducted in-depth research on 14 school systems that demonstrated improvement in the decade prior to the pandemic (Exhibit E1).
Traditionally, education studies have tended to focus on school systems that performed well on international assessments, taking a snapshot of performance without considering the size of the system, the return on investment for spending, or improvement over time. To paint a more balanced picture, this research focuses on large national and subnational systems, across a range of income levels, that demonstrated improvement at scale.7
EXHIBIT E1
We researched 14 systems that are beating the odds to understand why.
Ceará,

Our analysis suggests that successful systems use a set of reinforcing strategies to create a virtuous cycle enabling significant, long-term gains in student learning (Exhibit E2):
Based on clear research into what influences outcomes, successful school systems ground changes in the classroom, focusing first and foremost on teachers and the content they deliver. They choose evidence-backed strategies relevant to their starting place and prioritize foundational learning, particularly in poorly resourced systems. They use technology as a tool to enhance learning, not as an end in itself.
Successful school systems focus on a few coherent priorities, rallying stakeholders around those priorities to ensure that everyone is on board—from system leadership to principals to teachers. They invest in authentic, two-way communication with families, educators, and communities to design better policies and build deeper buy-in.
Successful systems move quickly from strategy to implementation, pacing reforms to show early traction while building stamina for the long road to impact. They build dedicated delivery teams that have the organizational structures and individual skills to execute on plans over time.
Successful systems rigorously measure what matters—student learning outcomes—and use data that is shared transparently to improve their interventions. As they roll out tried-and-true methods, they create space for innovation and measure the impact of new ideas, which feeds back into the evidence base of what works.
• Ground system strategy in better classroom instruction, aligning the system around learning outcomes at the instructional core.
• Recognize the context – start the journey from where you are, moving from poor-to-fair-to-good-to-great performance.


1 Set fewer priorities to get more done, with coherent, sustained, evidence-based goals.
2 Cultivate leadership beyond a single leader, and institutions beyond the ministry.
3 Engage educators and families authentically, with two-way communication.
4 Create coordination and cadence for change, turning strategies into plans, budgets, and timelines.
5 Build implementation structures and skills across the center and middle layer.
6 Measure student outcomes and make them transparent; use this to create momentum, and to tailor and adapt policies and approach.
7 Roll out what works, but create space for innovation, measuring to build evidence for ‘what works’.
Sustained improvers use a set of reinforcing strategies to create a virtuous cycle for long-term, outsized gains in student learning.

ANCHOR IN THE EVIDENCE
REINFORCING IMPROVEMENT STRATEGIES FOR SUCCESS
BUILD A DURABLE COALITION FOR CHANGE
CREATE DELIVERY CAPACITY TO SCALE DRIVE AND ADAPT WITH DATA
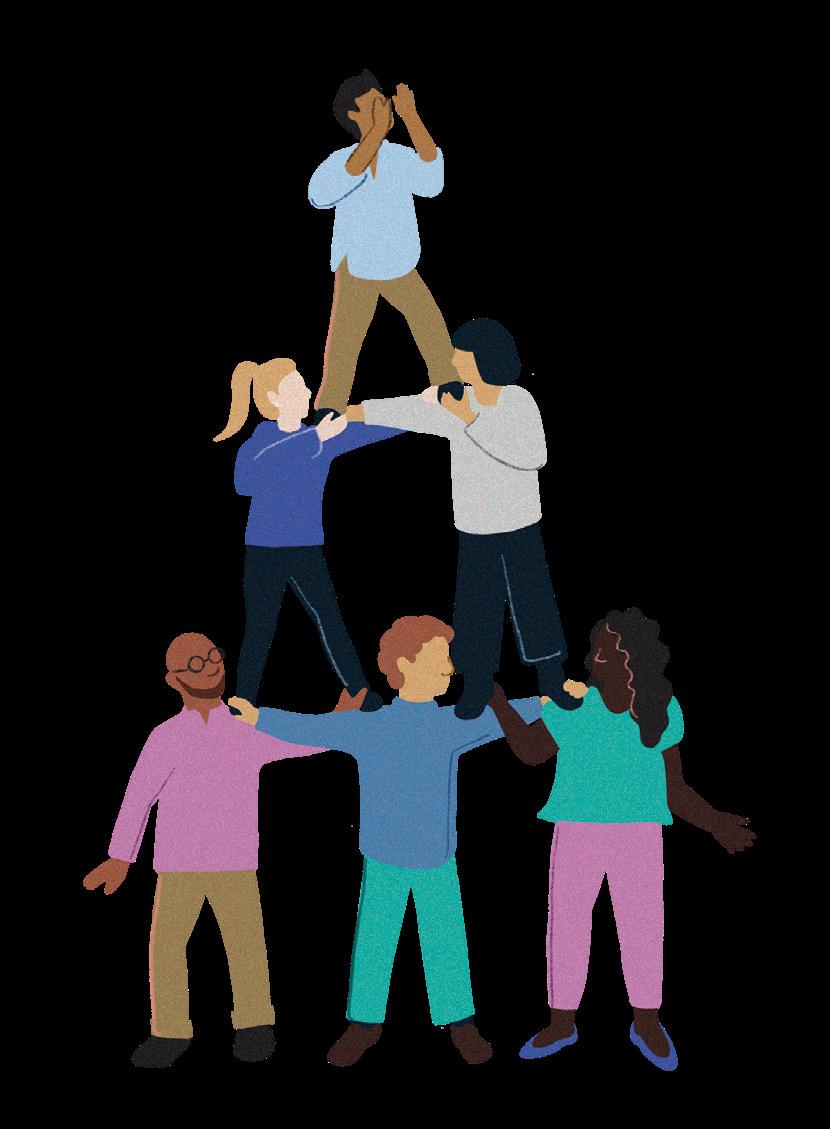
Individually, these strategies may seem obvious or incremental. Together, they are transformative. The slow and steady work of implementation sets improving school systems apart from the rest. Education leaders can learn from these success stories, particularly as systems seek to recover from recent declines in student learning.
The stakes are high: if historical trends continue, more than 700 million children will remain in learning poverty in 2050—unable to read a simple text by the end of elementary school. The pandemic wiped out decades of educational improvements, and we cannot wait decades to catch up. The world’s population is growing fastest in the places where learning lags furthest behind.8 Doing nothing would have tremendous implications on economic growth and political stability worldwide. However, this grim future is not inevitable. If all systems could improve student outcomes at the rate of the top improvers, an additional 350 million students could be lifted out of learning poverty in the next 30 years (Exhibit E3). This report considers what it would take to make that happen.
EXHIBIT E3
If all systems could improve at the rate of top improvers, ~350M children could be lifted from learning poverty by 2050.
NUMBER OF STUDENTS IN LEARNING POVERTY 1 UNDER DIFFERENT GO-FORWARD SCENARIOS M of children ages 5-16 2
PRE-COVID LEARNING POVERTY 20223
SCENARIO 1: AT-SCALE TOP PERFORMERS 4 823 1022 728 381 2019-2022 2050
347m
ADDITIONAL CHILDREN LIFTED OUT OF LEARNING POVERTY
STATUS QUO: CURRENT TRAJECTORY 2019 351 SCENARIO 1: AT-SCALE TOP PERFORMERS (pop.>3m) 248
1 Learning poverty refers to children not in school or who complete primary school without learning to read and understand a simple sentence text.
2 The number of children in learning poverty is very sensitive to the population used. We chose 5-16 to reflect the number of students who were in learning poverty when they completed primary (age 10-14) as well as those currently in primary school who are not on track to gain basic literacy skills.
3 Learning poverty projections through COVID (2019-2022) are based on regional growth rates estimated by the World Bank. Where there was not regional growth rate data (North America), we used the World Bank’s learning poverty projections for high income countries.
4 Our top performers scenario included the top at-scale (3M+ population) systems for each performance band (below poor, poor, fair, good, great) in terms of international or regional assessment growth. More information can be found in the methodological appendix.

Governments around the globe understand the critical importance of educating their citizens to thrive in a rapidly changing world. Over the past decade, many countries have attempted to transform their education systems and to raise student achievement levels. Yet progress has proved elusive. While more students are in school than ever before, learning outcomes are largely stagnant, and equity gaps within and between countries remain troubling.
More children are attending school, but learning outcomes are not keeping pace
Global enrollment rates have increased significantly since 2000. This is particularly true in low- and lower-middle-income countries, where primary school enrollment rose by more than ten percentage points from 2000 to 2015. By 2018, almost 90 percent of children globally were attending primary school (Exhibit 1).9
But even though more students are in class, many children are not mastering basic skills.10 The World Bank estimates that seven in ten students in lowand middle-income countries are living in “learning poverty”—unable to read and understand a simple text by age ten. In sub-Saharan Africa, the number is nearly nine in ten students.11
And these numbers are not getting better—learning outcomes as measured by international assessments barely improved globally in the decade before the COVID-19 pandemic, with small gains for low- and middle-income countries and stagnation in high-income countries.12 Measures of adult literacy over a longer time frame reveal not just a lack of progress but a potential regression. Research using demographic and health surveys administered by the US Agency for International Development (USAID) suggest that African women born in the 1950s who received an elementary education were 13 percentage points more likely to have basic literacy skills as adults than those born in the 1990s with a similar number of years of schooling.13 While this may be partly because more girls are now accessing primary education, it suggests that the quality of primary education has not improved over the time period (and may actually be declining).
Even though more students are in class, many children are not mastering basic skills.
1 Net enrollment rates are the total number of students divided by the number of people in a country in the school-age group
2 High and upper-middle income systems are based on PISA. Analysis includes any country that took PISA in at least five of the six administrations between 2000 and 2018. Low- and lower-middle income systems analysis is based on SACMEQ and PASEC, respectively, and includes systems that took SACMEQ in 2000, 2007, and 2013 and systems that took PASEC in 2014 and 2019.
3 Change shown for 2000-2018 forPISA, for 2000-20013 for SACMEQ, and 2014-2019 for PASEC
Source: UNESCO, World Bank

School system performance varies greatly across countries. The World Bank has consolidated the results of multiple international assessments into a single Harmonized Learning Outcomes (HLO) database that enables comparison across a spectrum of performance from poor to fair to good to great.
At lower levels of spending—up to about $6,000 to $8,000 per student at purchasing-power parity— performance levels are highly correlated with the amount spent. Above that level, the correlation breaks down, with country performance largely independent of spend. At every spending level, there is significant variation in performance, with some systems achieving stronger outcomes than their spending would suggest and others lagging behind their peers at similar levels of spend (Exhibit 2).
Much of the academic debate around country performance in education revolves around a small subset of mostly high-income countries that have
relatively high scores on the three major international assessments: the Programme for International Assessment (PISA), Trends in International Mathematics and Science Study (TIMSS), and Progress in International Reading Literacy Study (PIRLS). We classify those countries as having “good” or “great” performance.
Globally, however, more than 90 percent of children live in countries where average education outcomes are below poor, poor, or fair.14 Historically, many of these countries have not taken international assessments, but more recently the introduction of regional assessments15 and the Early Grade Reading Assessment (EGRA) has enabled a broader global comparison of learning outcomes. The OECD suggests that approximately 20 PISA points are equivalent to a year of learning. By that measure, high school students in many sub-Saharan African countries may be ten or more years behind their peers in Europe, North America, or East Asia.16
Meanwhile, demands on education systems have accelerated. Schools are increasingly being asked to contribute to solving broader societal issues, from rising mental health challenges among young people17 to political instability and polarization18 to combating climate change.19
At the same time, the workforce is changing. Automation is increasing the need for technological, socioemotional, and cognitive skills. Workers are spending less time on predictable physical labor and more time interacting with people and applying expertise. And the pandemic amplified existing trends toward remote work, e-commerce, and automation.20 Industries that once served customers in person ramped up digital-first interactions, and early postpandemic data suggests that these shifts are durable.
This transformation means that many jobs may come with new responsibilities, while lower-skill jobs may be eliminated. The World Economic Forum forecasts that 23 percent of global jobs may change in the next five years,21 and Goldman Sachs estimates that up to two-thirds of jobs in the United States and Europe could be affected.22 This will increase competition for employment and raise the ante for preparing students for the future of work.23
This is creating a scissor effect: learning losses are colliding with an increasing need for higher-order skills. The implications are profound. Lower levels of learning translate into lower future earnings potential for students and lower economic productivity for nations. By one accounting, the economic impact of pandemic-related learning delays could lead to annual losses of $1.6 trillion worldwide, or 0.9 percent of total global gross domestic product (GDP) by 2040.24
1 HLO scores are standardized, comparable achievement scores for K-12 students. They are based on the international assessment PISA, TIMSS, and PIRLS, along with the regional assessments SACMEQ, PASEC, LLECE, and EGRA. Eleven countries are imputed by World Bank using the GAML method which relies on national assessments. Systems are sorted into bands based on their HLO
scores such that a score less than or equal to 375 places a system as below poor, a score greater than375 and less than or equal to 425 places a system as fair, and so on. This chart includes the country with the highest and lowest HLO score in each spending group, plus all systems profiled in the report. A comprehensive version of this exhibit appears in the appendix.
2 To ensure government spend was comparable across the countries analyzed, internationally comparable data sources were utilized in the following order: UNESCO, World Bank, Eurostat. Most data (>80%) is from 2017-2020. Where data was scarce, earlier data was used and adjusted for inflation. For countries with no internationally comparable data available from 2014-2020, a GDP per capita
model or government websites were employed.
Source: World Bank, UNESCO UIS, Eurostat, OECD, Government websites
EXHIBIT 2
Performance is uneven even at similar levels of spend.
UNIVERSAL SCALE BASED UPON WORLD BANK HLO SCORES 1
$13K - $14K
$12K - $13K
$11K - $12K
$10K - $11K
$9K - $10K
$8K - $9K
$7K - $8K
$6K - $7K
$5K - $6K
$4K - $5K
$3K - $4K
$2K - $3K
$1K - $2K
Many education improvement efforts don’t translate into learning gains for students. In some cases, students fall even further behind. The country-level trends in student learning outcomes are sobering: of the 73 countries with longitudinal data from international assessments over the past decade, only 23 managed to sustain significant, sustained, and consistent improvements in student outcomes. In other words, only one in three systems is improving.
In most countries, student outcomes stagnated— or even declined. In 17 countries, student scores slipped by more than half a year of learning or more even before COVID-19, based on at least two international assessments over the past decade.25 Systems that already had high levels of performance (“good” and “great” systems) were the most likely to see their outcomes decline significantly, including many former education “stars,” such as New Zealand, Finland, the Netherlands, and South Korea (Exhibit 3).
Even in systems that are improving or have relatively strong levels of achievement, overall system performance may mask significant inequities in achievement; every system that uses PISA has performance gaps correlated with socioeconomic status. In many countries, the gaps are significant in size. The OECD found in 2018 that the gap in reading performance between the most advantaged 10 percent and the most disadvantaged 10 percent in France, Germany, Hungary, Israel, Peru, and the Slovak Republic was equivalent to more than four years of schooling.26


NUMBER OF COUNTRIES BY PERFORMANCE1 THAT HAVE IMPROVED2 , DECLINED2 OR STAGNATED2 ON INTERNATIONAL ASSESSMENTS OVER THE PAST DECADE
1 Performance is based on World Bank Harmonized Learning Outcomes (i.e., Harmonized Test Scores) scores. 2020 scores are used where available. Otherwise, earlier data is referenced. Countries are categorized as follows: Below poor (<375 HLO), Poor (375-425 HLO), Fair (425-475HLO), Good (475-525 HLO), Great (>525 HLO)
2 Countries are categorized as “improved” if they gained 10 points on two subject tests across PISA math, PISA reading, PISA science, PIRLS reading, TIMSS math, and TIMSS science in the past decade, and improved on average by 10 points or more on average across tests. Countries are categorized as “declined” if they lost 10 points on two subject tests in the past decade. Countries are categorized as “stagnated” if they are not categorized as “improved” or “declined” some of these had stable performance, others had differing performance across different tests. Countries are excluded from the analysis if they lack enough evidence (i.e., have not taken 2 international tests with a decade’s worth of data)
Source: World Bank, PISA, TIMSS, PIRLS 23 17 33

All children, regardless of gender, deserve equitable education opportunities. Historically, girls have faced barriers in accessing school or completing their education. In some countries they still do, and these unacceptable inequities must be addressed. 27
At the same time, great progress has been made in expanding access to education for girls. The most recent statistics globally show the gender gap in primary school enrollment has been nearly halved since 2000 to a two-percentage-point difference between boys and girls, and enrollment rates in secondary school are now nearly identical. 28
But the closing of gender gaps does not mean all girls have sufficient access to education. There are still 258 million children and youth, both girls and boys, who are not in school. There are also regional differences: in sub-Saharan Africa, UNESCO estimates there are four million girls who will never attend school, compared to two million boys. 29 Girls are more likely to be excluded from education across Northern Africa and Western Asia. (In South Asia, East Asia, and Southeastern Asia, boys are more likely to be out of school.)
For those in school, girls are now performing better than boys. Girls outperform boys in reading in every US state,30 and they outperform boys on all higher-level exams in the United Kingdom. 31 These trends are consistent in both developing and developed countries, and girls are now overtaking boys in science and math as well as in reading. 32 In countries where girls outperform boys in math, such as Thailand and Malaysia, they perform even better on reading.
33
What can be learned from this nuanced picture? Girls’ education should remain a priority in places where structural barriers persist. For example, UNICEF partners with governments in low-income countries to improve sanitation
and hygiene so that girls can more easily attend school during their menstruation cycles. 34 Many advanced school systems still need to better engage girls in science, technology, engineering, and math (STEM) education, given persistent gender gaps in the STEM workforce.
In some countries, however, it may be boys that need a boost. Boys in many systems face higher rates of suspension and expulsion, struggle more with behavior, and drop out at higher rates. 35 Every OECD country now has more female students than male students pursuing bachelor’s degrees, and girls are more likely to persist through college than boys.
36 To address these gaps, systems can adapt curriculum and instructional materials that feel more relevant to all students, focus on teaching boys the skills to engage in learning (rather than simply penalizing them when they struggle), and help educators understand their own biases. 37 Expanding high-quality early childhood education could create more opportunity to teach behavioral and social-emotional skills at a younger age.
The precise intersection between gender and student performance is likely to vary across and within systems. For some, systemic inequities may require targeted gender-based interventions. But the most effective interventions, particularly in systems with high rates of learning poverty, are likely rooted in a broader strategy to improve education for all. If most children in a given system are not learning to read, or are not attending school at all, the consequences will be dire for boys and girls alike.
Prior to COVID-19, global systems were making some progress on equity, at least in the aggregate: from 2000 to 2015, the percentage of variation in global reading and math performance on PISA that could be explained by socioeconomic status decreased by 2.2 and 2.4 percentage points, respectively. There are examples of both high performing and lower performing systems that made progress in closing these gaps. 38
Systems have continued to make progress on other measures of equity as well. While there are still persistent gender equity gaps in enrollment and achievement around the world, we see greater participation and stronger outcomes from girls than ever before (see sidebar “What about girls’ education?”).
An important caveat here: international standardized assessments of student learning are not the only, or arguably the most important, measure of what a young person receives from education. There is an important debate to be had around the broader goals of an education system in preparing students for work, life, and citizenship, and in providing a joyful learning experience in the moment. Yet there is also fundamental alignment that part of the responsibility of education systems is to impart basic literacy and numeracy skills to all students. And on those basic goals, progress is often halting. While acknowledging the broader goals of education systems, we have largely limited the scope of this report to learning outcomes as measured by some form of international, regional, or national assessment given their relative objectivity and global comparability.
The lack of progress by such measures may seem puzzling: the global education community has 25 years of international student learning data and increasing consensus about the interventions that improve student outcomes. So why haven’t school systems seen across-the-board improvements?
Education system improvement programs and education researchers often focus on “what” changes to make. Yet even when school systems have a sound plan, leaders can struggle to put improvements into action, and well-intentioned changes can fizzle out. To make changes stick, leaders need to understand not only “what” interventions to use but also “how” to implement them well at scale.
Education is one of the most complex branches of government to transform because it involves changing the behavior of hundreds of thousands of educators over a sustained period of time. The scale far exceeds that of any other type of private- or public-sector organization. McKinsey’s recent survey of more than 400 education leaders around the world found that only 20 percent of education improvement efforts meet their stated goals. (For more detail on this survey, see the methodological appendix.)
Additional data demonstrates that improving and stagnating systems often attempt to pull the same broad levers for education improvements (Exhibit 4).
A review of education reforms in Stanford University’s World Education Reform Database implemented since 2000 shows that the most-improved school systems often tackle the same areas of improvement as other systems, particularly in low- and middle-income countries, but they get very different outcomes. 39
This analysis is necessarily simplified. A focus on “academics” could include a range of strategies, some higher impact than others. Still, the relative consistency in focus between top improvers and other systems, especially in countries early in their improvement journey, underscores that it is not only the choice of interventions that matters, but also the execution. (For more detail on this analysis, see the methodological appendix.)
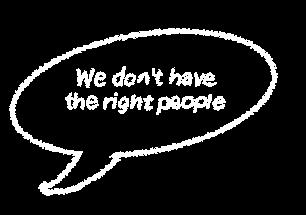
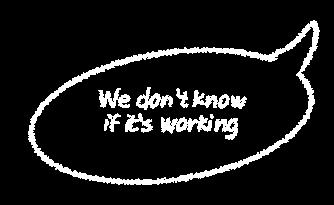
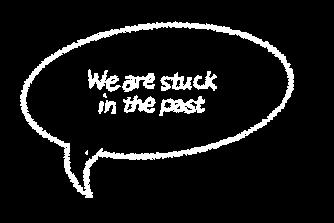
Our survey and our interviews with more than 200 education system leaders, experts, and academics identified seven common failure modes that undermine improvement efforts (Exhibit 5).
Yet failure is not inevitable. In the past decade, some countries have transformed their education systems and produced meaningful gains in student learning, year after year. These outlier school systems exist on every continent and at every level of national development. They show us that transformation is challenging but not impossible.
EXHIBIT 4
Improving systems and stagnating systems appear to be focusing on the same areas in education reform efforts.
AVERAGE NUMBER OF EDUCATION REFORMS IMPLEMENTED BY COUNTRY SINCE 2000 BY ACHIEVEMENT JOURNEY AND PERFORMANCE
SYSTEM EXCELLENCE LEVER
STUDENT OUTCOMES
ACADEMICS
HUMAN CAPITAL
PERFORMANCE MANAGEMENT
WHOLE CHILD SUPPORTS
ENABLING FACTORS
SCHOOL READINESS
IMPROVERS
STUDENT OUTCOMES
ACADEMICS
HUMAN CAPITAL
PERFORMANCE MANAGEMENT
WHOLE CHILD SUPPORTS
ENABLING FACTORS
SCHOOL READINESS
STUDENT OUTCOMES
ACADEMICS HUMAN CAPITAL
5
In interviews, leaders identified multiple challenges to implementation-at-scale.
IMPLEMENTATION “FAILURE MODES”
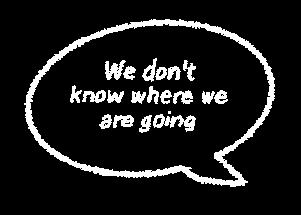
CONFLICTING DIRECTIONS
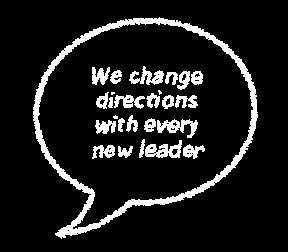
LEADERSHIP DISCONTINUITY
EXAMPLE CHALLENGES RAISED IN INTERVIEWS AND SURVEY
61%
IDENTIFIED THIS AS A TOP 5 CHALLENGE TO EDUCATION IMPROVEMENTS
• Education not seen as a priority – inability to raise donor or domestic funds needed to deliver; budgets burdened with entrenched initiatives
• Lack of clarity around the ‘purpose of education’ between grassroots and those in power
• Goals are too many, too far out in the future, vague, and unmeasurable
• Lack of coherence across the individual elements of reform; systems pulled in many directions, and nothing ends up moving forwards
33%
IDENTIFIED THIS AS A TOP 5 CHALLENGE TO EDUCATION IMPROVEMENTS
• Reform is an 8-to-12-year journey, but rapid electoral cycles do not create sufficient runway to accomplish true change
• Minister of Education role often short-lived
• Whipsaw effect as policies change with each leader; leaving teachers and principals disillusioned and resistant to change
• Short-term donor programs undermine continuity of reforms ORGAN REJECTION OR REFORM
31%
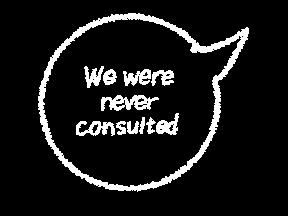
IDENTIFIED THIS AS A TOP 5 CHALLENGE TO EDUCATION IMPROVEMENTS
• Top down, system-level policies fail to consider and adapt to local specificities and the realities of the classroom
• Insufficient communication of reform priorities and rationale
• Important stakeholders including teachers, principals and families push back against reforms, either through outright or passive resistance
• Mistrust towards the private sector hampers private sector engagement and innovation
Source: McKinsey’s Global Education Survey; Interviews
IMPLEMENTATION “FAILURE MODES”
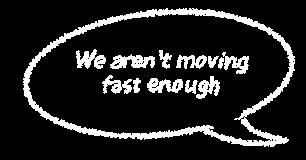
INSUFFICIENT COORDINATION AND PACE
LIMITED IMPLEMENTATION CAPACITY
EXAMPLE CHALLENGES RAISED IN INTERVIEWS AND SURVEY
42%
• No roadmap to implement; budgets not allocated to strategies; unclear accountability for inputs and outcomes
• Too many small-scale pilots resourced in a way that are not scaleable
• Poorly aligned expectations of what can be achieved in what timeframe; lack of initial progress undermines confidence in the plan, leading to churn
46%
IDENTIFIED THIS AS A TOP 5 CHALLENGE TO EDUCATION IMPROVEMENTS
• Lack of people leadership, program management and analytical capacity within government; limited budget to hire seasoned leaders
• Policy adoption drops off at each level from the state to the district to the school to the classroom
• Donor technical assistance over-dependent on international consultants who leave, rather than local players
IDENTIFIED THIS AS A TOP 5 CHALLENGE TO EDUCATION IMPROVEMENTS
IDENTIFIED THIS AS A TOP 5 CHALLENGE TO EDUCATION IMPROVEMENTS 26%
• System leaders (national, middle layer, and school) have no visibility into progress in the classroom
• Lack of conversations around dashboards and data to change go-forward strategy and activities
• Lack of transparency for parents and students into school performance and options
29% IDENTIFIED THIS AS A TOP 5 CHALLENGE TO EDUCATION IMPROVEMENTS
• No adaptation to changes in the external environment—in the labor market, economy, cultural and political environment, etc.
• Multiple pilots and innovations across the system (100 flowers are blooming) but no-one knows which are having a positive impact on student outcomes
Some systems are beating the odds, but not necessarily the ones you expect
To understand what it would take for more school systems to improve, we conducted research across both improving and declining school systems, analyzed global data, and spoke with more than 200 school system leaders, donors and philanthropists, not-for-profit leaders, academics, and consultants (Exhibit 6).
We identified improving school systems for more in-depth profiles by using comparative international, regional, and national assessments of student performance, along with expert interviews and data on system scale and spending. We focused on larger systems in the international data and layered in new examples of noteworthy subnational and low-income systems that may not take comparable international assessments, but that have shown promising results on other tests. We also focused on improvements prior to the COVID-19 pandemic, so we did not take into account the 2021 PIRLS or 2022 PISA data. While these latest results provide a fascinating insight into which systems were best able to weather a global pandemic, they provide less insight into which systems are able to sustain consistent improvements in learning outcomes over the long run (see feature “What do postpandemic assessments tell us?”).
We ultimately focused on 14 school systems across a range of income levels that are improving education at scale. None of these systems are perfect, and in some the absolute level of achievement is still low, but each has meaningful lessons to impart at different stages of the educational improvement journey based on the strategies they took to improve performance (Exhibit 7).
Our research looked at three categories of improvement with the highest bar for significant, sustained, and consistent improvement at scale:
Systems in this category achieved improvements that are significant (equivalent to more than ten PISA points, or more than one-half of a year of learning40), sustained (over the past decade), and consistent (demonstrated across at least two of the major
international subtests). Of the 23 global systems that improved student outcomes on international assessments, we focused on seven representative systems, predominantly those that were at scale, with more than three million students in their systems (Poland, Peru, Morocco, and South Africa). We included a few smaller improvers in the good-to-great journey given the limited number of at-scale improvers in this category (Estonia, Norway, and Singapore).
Systems in this category have achieved improvements that are significant (equivalent to more than one-half of a year of learning), but that only have data from regional assessments or over a limited time frame. Given the data constraints, the selection of systems to focus on within this segment (Kenya and Malawi) was validated through interviews of education experts.
SUB-NATIONAL IMPROVERS:
Because many large education systems are run at a regional level, rather than nationally, we also looked at subnational regions that outperformed their counterparts. These are systems that have improved by more than one-half of a year of learning over the past decade as documented on national or local assessments, with a focus on subnational systems within some of the largest federal school systems in the world (including Brazil, India, and the United States). This category by definition was more subjective, so expert perspectives informed the selection of regions to focus on within this subset (Mississippi; Washington, DC; London; Ceará (Brazil); and Punjab (India)).
Interviews included 200 experts around the world.
Note:
WE INTERVIEWED MORE THAN 200 GLOBAL SYSTEM LEADERS, DONORS, NONPROFITS AND THOUGHT-LEADERS ACROSS THE WORLD
60+ SYSTEM LEADERS 50+ DONORS, MULTI-LATERALS, BI-LATERALS, FOUNDATIONS
30+ THINK-TANKS, ACADEMIA
NON-PROFIT AND NON-GOVERNMENTAL ORGANIZATIONS 20+ PRIVATE SECTOR EDUCATION COMPANIES
EXHIBIT 7
We researched 14 systems that are beating the odds to understand why.
SYSTEM
Singapore
Estonia
Poland
SUSTAINED & OUTSIZED IMPROVERS EMERGING IMPROVERS

SUBNATIONAL IMPROVERS
Norway
Peru
Morocco
South Africa
Kenya
Malawi
London, UK
Washington DC, USA
Mississippi, USA
Ceará, Brazil
Punjab, India
PISA, PIRLS, TIMSS
PISA, PIRLS, TIMSS
PISA
PISA
PISA TIMSS TIMSS
SACMEQ
SACMEQ
NAEP
GCSE NAEP
SAEB
NAS, ASER
The methodological appendix contains additional details on system selection and performance over time, including data on all sustained improvers, emerging improvers, declining systems, and stagnating systems.
We also considered lessons from other systems that did not have sufficient data to be included in the categories above but that may have lessons to impart, based on emerging evidence. For example, Vietnam has participated in some international assessments and registered results that far exceed peer countries and what might be expected based on its level of spend, but there is insufficient longitudinal data
to draw trend lines. Multiple studies have isolated a strong impact from cultural forces; students, parents, educators, and leaders have all embraced the importance of education in a way that permeates practice and affects outcomes.41 Culture alone does not explain Vietnam’s performance—and across the world, systems from all different cultural constructs both perform well and underperform—but this case suggests that Vietnam has effectively leveraged the strong cultural norms around education to enable outsize performance.
1 Trends in International Mathematics and Science Study (TIMSS) – 20112016; Program for International Student Assessment (PISA) – 2009-2018; Progress in International Reading Literacy Study (PIRLS) – 2006-2016; the Southern and Eastern Africa Consortium for Monitoring Educational Quality (SACMEQ) – 2007-2013; National Assessment of Educational
Progress (NAEP) for U.S. school systems – 2009-2019; General Certificate of Secondary Education (GSCE) in the U.K. - 2011-21; Sistema Nacional de Avaliação da Educação Básica (SAEB) in Brazil - 2009-19; National Achievement Survey (NAS) and Annual Status of Education Report (ASER) in India - 2009-19
What does this diverse set of improving school systems have in common?
The analysis shows that all successful systems use a common set of reinforcing strategies to create a virtuous cycle enabling significant, long-term gains in student learning (Exhibit 8).
• ANCHOR IN THE EVIDENCE.
Based on clear research into what influences outcomes, successful school systems ground changes in the classroom, focusing first and foremost on teachers and the content they deliver. They choose evidence-backed strategies relevant to their starting place and prioritize foundational learning, particularly in poorly resourced systems. They use technology as a tool to enhance learning, not as an end in itself.
• BUILD A DURABLE COALITION FOR CHANGE.
Successful school systems focus on a few coherent priorities and rally stakeholders around them to ensure that everyone is on board—from system leadership to principals to teachers. They invest in authentic, two-way communication with families, educators, and communities to design better policies and build deeper buy-in.
• CREATE DELIVERY CAPACITY TO SCALE.
Successful systems move quickly from strategy to implementation, pacing reforms to show early traction while building stamina for the long road to impact. They build dedicated delivery teams with the organizational structures and individual skills to execute on plans over time.
• DRIVE AND ADAPT WITH DATA.
Successful systems rigorously measure what matters—student learning outcomes—and use data that is shared transparently to improve their interventions. As they roll out tried-and-true methods, they create space for innovation and measure the impact of new ideas, which feeds back into the evidence base of what works.
Individually, these strategies may seem obvious or incremental. Together, they are transformative. Our survey suggests that systems that used all seven of the “how” levers above were six times more likely to be successful in meeting their student outcome and system transformation goals than those that used four or fewer (Exhibit 9).
The slow and steady work of implementation sets improving school systems apart from the rest. Education leaders can learn from those systems—and the stakes are high. If every nation heeded these lessons and improved at the rate of the world’s top improvers, up to 350 million additional children could be lifted out of learning poverty globally.
• Ground system strategy in better classroom instruction, aligning the system around learning outcomes at the instructional core.
• Recognize the context – start the journey from where you are, moving from poor-to-fair-to-good-to-great performance.
1 Set fewer priorities to get more done, with coherent, sustained, evidence-based goals.
2 Cultivate leadership beyond a single leader, and institutions beyond the ministry.
3 Engage educators and families authentically, with two-way communication.
4 Create coordination and cadence for change, turning strategies into plans, budgets, and timelines.
5 Build implementation structures and skills across the center and middle layer.
6 Measure student outcomes and make them transparent; use this to create momentum, and to tailor and adapt policies and approach.
7 Roll out what works, but create space for innovation, measuring to build evidence for ‘what works’.
EXHIBIT 8
Sustained improvers use a set of reinforcing strategies to create a virtuous cycle for long-term, outsized gains in student learning.
ANCHOR IN THE EVIDENCE
REINFORCING IMPROVEMENT STRATEGIES FOR SUCCESS
BUILD A DURABLE COALITION FOR CHANGE
CREATE DELIVERY CAPACITY TO SCALE DRIVE AND ADAPT WITH DATA
EXHIBIT 9
Systems that use all 7 levers are ~6x more likely to be successful than those that use 4 or fewer.
NUMBER OF LEVERS USED BY SUCCESSFUL TRANSFORMATIONS, % of transformations in each category that were successful 6x 4
18 23
Source: McKinsey’s Global Education Survey
In recent months, data from the first international assessments following the worst of the pandemic have cast light on how school systems fared through the pandemic: the PIRLS 202142 results and the PISA 2022 results.43 Across PIRLS and PISA, more countries slipped in this latest assessment than in previous rounds (Exhibit 10).
EXHIBIT 10
Many countries saw a drop in student test results during the height of the pandemic, but some scores were falling even before COVID-19.
COUNTRIES PERFORMANCE PRE- AND POST-COVID ONSET, NUMBER OF COUNTRIES IN EACH CATEGORY PER AVERAGE SCORE CHANGE 1
INCREASE PREAND POST-COVID
DECREASE PRE-COVID, INCREASE POST-COVID
INCREASE PRE-COVID, DECREASE POST-COVID
(3%)
DECREASE PRE-COVID, AND POST-COVID
(17%)
1 PISA: pre-COVID (2009-18) and post-COVID (2018-22); PIRLS: pre-COVID (2006-16) and post-COVID (2016-21)
Source: PISA (2009-22), PIRLS (2006-2021)
Note: List of countries is non-exhaustive.
In the PISA assessment, which covers the period from 2018 to 2022 and thus more closely mirrors the timing of the public health emergency, nearly 80 percent of countries slipped in the most recent assessment. Mean performance since 2018 fell by approximately ten score points in reading (half a year of learning) and approximately 15 score points in math (three-quarters of a year of learning). One in four 15-year-olds globally are now considered low performers in math, reading, and science; this is nearly double the 13.4 percent of students in 2018 who performed below proficient in all three subjects.44
Many of the countries that dropped in performance in the latest PISA assessment were already losing ground, including many European countries. But a new cohort of countries that were improving prior to the pandemic also saw declines in the recent assessment. By contrast, some countries seem to have weathered the pandemic better. Japan, Korea, and Taiwan were slipping prior to the pandemic but improved in this past cycle. And seven countries (Israel, Kazakhstan, Peru, Qatar, Romania, Singapore, and Serbia) consistently improved their performance on PISA – improving scores both in the decade prior to the pandemic, and between 2018 to 2022 (Exhibit 11).
In both assessments, the data is likely more reflective of how countries perform in a global pandemic than how effective they are at sustaining educational improvements over the long term. The systems profiled in this report sustained progress for a full decade or more. However, despite this strong foundation, some experienced declines in the most recent PIRLS and PISA data. This serves as a sobering reminder that system improvement requires consistent focus and attention.
Some of the systems profiled in this report continued to improve even through the pandemic. Singapore remained the top-scoring country in all subject areas, and Peru maintained its significant gains from the past decade.
Some countries were hit hard by the pandemic. Estonia and Poland remain among the top absolute scorers on PISA but saw declines in performance in all three subject areas from 2018 to 2022. Norway, which had improved significantly on PIRLS and the Trends in International Mathematics and Science Study (TIMSS) in the previous decade, also saw declines in both PISA and PIRLS scores. South Africa’s PIRLS scores fell by more than 30 points.
ONLY 6 COUNTRIES INCREASED THEIR PISA SCORES BEFORE AND AFER COVID-19; FOR MOST COUNTRIES, THE NEGATIVE

United
For others, the latest results were a mixed bag. Morocco’s math results were largely unchanged from 2018 to 2022, and both reading and science scores declined, though there was a significant uptick in the number of students who took the most recent test administration.
While the PISA results were sobering, the hope is that recognition of results can spur action to improve. In our global education survey, taken just before results were released, many education leaders globally were sanguine about the impact of the pandemic. Almost 50 percent of respondents believed that students in their country had fully recovered from COVID-19’s impact on learning and were performing at equivalent or higher levels to prior the pandemic. In every region, PISA results indicate students’ performance still lags pre-pandemic results (Exhibit 12).
For some system leaders, PISA 2022 offers the first large-scale quantitative evidence of the pandemic’s impact on learning. For others, national assessment data already provided an indication of performance trends. In the United States, the release of the 2022 National Assessment of Educational Progress (NAEP) data—which showed that students had lost two decades of progress during the worst of the pandemic—provided a wake-up call to leaders.45 The most recent PISA and PIRLS data may have a similar impact globally.
There are many additional insights to glean from the PISA 2022 results. Learning losses were not as closely correlated to the length of school closures as expected. Parental engagement went down during the pandemic despite news reports to the contrary.46 Although there was widespread concern about the equity impact of school closures, the PISA results suggest that the pandemic did not meaningfully widen disparities in most countries.47 (Other assessment tools do show widening racial and socioeconomic achievement gaps in many systems though, suggesting that leaders should consider multiple data sources as they navigate pandemic recovery efforts.48) And worryingly, despite the widespread adoption and innovation in digital learning, students report being distracted by digital devices to the point that it negatively impacts performance and well-being.
Researchers will continue to unpack this data, and it may lead to new policy ideas and innovations. More immediately, though, as leaders grapple with the scale of learning gaps and determine how to proceed, this report offers valuable implementation lessons to ensure no additional time is lost as learning recovery continues.
12
Despite a shared belief that countries have fully recovered from the pandemic’s impact, all regions saw score declines from 2018 to 2022.
Share that believe their system has FULLY RECOVERED from COVID-192, % (Survey results)
1 Respondents included senior leaders (e.g., such as minister of education, department leader, and superintendent) and senior members of executive teams (e.g., including minister, advisor, department leader, chief academic officer, and chief operating officer).
2 Includes 2 answers: 1) Fully recovered from the pandemic and performing at higher levels than pre-pandemic and 2) Fully recovered from the pandemic and performing at equivalent levels to pre-pandemic
PISA 2022 VS 2018 change in average score 3
TOTAL RESPONDENTS 1
Share that believe their system has PARTIALLY RECOVERED from COVID-19, % (Survey results)
3 Weighted average of the change in average score across math, science, and reading, adjusted for the number of respondents in each country. South Africa, Sierra Leone, Nigeria, Uganda, India, and Laos did not participate in PISA 2022
Source: McKinsey’s Global Education Survey
When it comes to student learning, the research is clear: a few core interventions are central to supporting student success. Students need access to high-quality materials aligned to rigorous standards and wellprepared teachers equipped to deliver those materials in a differentiated way. This “instructional core” is at the heart of teaching and learning, and evidence-based interventions exist to improve student learning.
Yet delivering this instructional core looks very different for a poor-to-fair system than for a good-togreat one. Systems that have improved performance apply an evidence-based playbook that is tailored to their current level of performance and to the resources and capabilities across the system. For example, providing earned autonomy to teachers and principals has been a successful strategy in high-performing systems. In lower-performing systems, educators may instead need more scaffolding to succeed at core instruction.

• Ground systems strategy in better classroom instruction
• Start the journey from where you are
Kenya | Ceará (Brazil) | Poland | Singapore

Successful school systems place learning outcomes at the core of improvement efforts. They focus first and foremost on teachers and the instruction they deliver. Any element of change in the broader school system is intentionally aligned to support what is happening in the classroom.
Starting with the classroom may sound obvious, but it’s easy for improvement efforts to diverge from the evidence base of what works. Leaders may be tempted to start with system structures, such as reorganizing the education ministry, creating new school models, or scaling devices and connectivity to “digitalize education.” These are not necessarily bad ideas, but they must support the instructional core, not supersede it (see sidebar “What about education technology?”).49
Decades of research show that to improve outcomes, systems need to focus on interventions closest to students and work outward, starting with the classroom (what is taught and how it is taught), then the school (what supports exist for students and teachers), and finally aligning system supports (performance management, technology, infrastructure, and funding) to what is needed in the classroom.
At the classroom level, successful systems recruit, develop, and retain the highest-quality teachers possible, developing talent before teachers enter the classroom and on a continual basis throughout their careers. Teachers are equipped with high-quality instructional curricula, instructional materials, and assessments so that they can deliver high-quality instruction to every student.
At the school level, successful systems hire and build strong school leaders who both demonstrate instructional leadership and support teachers and school staff in meeting the needs of the whole child. School leaders create a positive school environment and engage families and the community. This focus on student well-being leads to improved attendance and learning.
Everything else in the system is aligned to support the work in the classroom and at the school. Tools to track and manage performance, effective resource allocation, infrastructure and technology, governance and organization design—all come together to undergird student outcomes at the center.
Finally, investments in children’s earliest years, including providing access to early childhood education and to pre- and postnatal health support, help ensure that students are ready to learn when they enter school (Exhibit 13).
The past decade has added a tremendous body of evidence to a still-growing research base about which specific interventions work, both in the instructional core and in the supporting elements of school systems. We looked at hundreds of academic studies and manuscripts in an attempt to understand what works to improve student learning in the highest-performing systems.
School system excellence starts in the classroom.

We screened interventions using three lenses (see the methodological appendix for more detail):
• IMPACT ON STUDENT OUTCOMES.
Systems may define student success broadly, including achievement, well-being, and educational attainment. For comparability and consistency in analysis, we used standard deviations of improvement on relevant assessments as the main impact measure, which excluded the fewest studies from consideration.
• STRENGTH OF THE EXISTING EVIDENCE BASE.
Some interventions have been well-studied in multiple systems with strong experimental and quasi experimental designs to estimate their impact on student outcomes. Other interventions don’t lend themselves well to experimental design or have yet to have rigorous, large-scale program evaluations completed. We gave each intervention a categorical score based on how many large-scale experimental (or quasi experimental) studies existed and how broadly the intervention had been evaluated across different contexts in those studies.
• FEASIBILITY OF IMPLEMENTATION.
Here we considered three factors that influence the feasibility of actually rolling out an intervention at scale – the cost of the intervention, the political will required for adoption, and the complexity of its implementation. Interventions in the “moderate” feasibility category tend to look similar to existing practices (e.g., earlier hiring of teachers, summer learning programs), while interventions at the other “most challenging” end of the feasibility spectrum (e.g., reducing class size, or desegregating schools) require large expenditures or significant political shifts to accomplish.
We used the best available evidence to plot interventions based on their impact and feasibility of implementation, understanding that reasonable debates are ongoing around many of these interventions and their efficacy. The message was clear: the majority of high-impact interventions relate directly to the instructional core by focusing on the
teachers in the classroom and the materials and pedagogy they employ (Exhibit 14).
As systems consider interventions from across the matrix, a few caveats are in order. First, intervention effects vary from system to system. Academic studies rarely find the same or even similar effects from the same interventions in different contexts. As promising interventions scale, they often lose efficacy. System leaders know well that simply “importing” what has worked somewhere else is never as simple as it sounds. The details matter. For example, general professional development for teachers has shown disappointing impact on student outcomes, but job-embedded, curriculum-aligned professional development has shown promising results. 50 Similarly, several studies have shown the efficacy of highdosage tutoring. However, efforts to scale tutoring have proved disappointing when the scaling process ignores or makes changes to key ingredients— including the intensity (three to five times a week, 30 to 50 minutes, and incremental to existing classroom instruction), the location (in school), and the tutor (college educated and consistent).
Second, no intervention stands alone. A balanced portfolio of investments will likely include some expensive but high-impact big bets, as well as several smaller efforts with lower (but still positive) impact that are cheaper and easier to accomplish. Systems may also balance interventions that have more impact on test scores with those that have impact on other measures, including attendance, retention, or student well-being. Some interventions may have moderate impact overall but high impact on subgroups of students. For example, diversifying the teacher workforce may have moderate impact on overall test scores but has shown significant impact on educational attainment for students of color.
Across all these interventions, the evidence we draw on largely comes from well-established, higher-income education systems. But just because the interventions have worked in high-income countries doesn’t mean that low-income countries should apply the evidence base to their own, very different, context. In fact, the next lesson suggests that could be the worst thing they could do.
EXHIBIT 14
For developed systems, proven interventions can be assessed based on their impact and feasibility.
High quality preK
Adaptive personalized, mastery-based curriculum and enabling technology
Inquiry based instruction
Reducing class size
School desegregation efforts
Standardized assessments for accountability
$1000 increase in per pupil spend1
Addressing teacher biases/expectations
Governance changes (i.e., state takeovers)
EVIDENCE
1 Overall spending can produce gains for students, but spending on instruction, support services, and capital improvements have a stronger evidence base.
Job-embedded, curriculumaligned teacher PD
High dosage tutoring
Innovative classroom staffing2
Principal pipeline & development
Social Emotional learning and Student mindset interventions (e.g. self-awareness, selfmanagement, relationship skills) 3
Diversifying the teacher workforce
Teacher evaluation
Culturally responsive teaching
Non-academic student support
Grade retention
Absenteeism interventions
Developing trust-based relationships between student and teacher
Teacher incentives
Use of technology by teachers
Parental engagement in early childhood
Restorative Justice programs
Multi-tiered System of Supports
Access to devices and connectivity
Early, unconstrained teacher recruiting/hiring
Differentiation and advancement for students
Flexible heterogeneous grouping of students
Use of formative assessments
Increasing parental support/ involvement
Practical, residency-based pre-service
Access to grade level materials
Trusted/Reliable performance management systems
Teacher retention incentives
Teacher professional development (general)
Hiring/Incentivizing based on teacher credentials
Principal performance & evaluation systems
2 This includes models that extend the impact of the highest performing teachers (e.g., Opportunity Culture).
3 This includes interventions that help students develop self-awareness, self-management, relationship skills, metacognition.
There is a deep body of evidence about what helps students learn at the classroom and school level. Systems can employ proven strategies to recruit, develop, and retain high-quality teachers and leaders; deliver high-quality instructional content to students; and enhance student well-being.
AEDUCATORS: Recruit, develop, and retain the highestpossible quality teachers and leaders
Great teaching starts with great teachers. Research shows that even one great teacher can set students on a substantially different academic trajectory.51 It’s hard to identify a great teacher from observable characteristics.52 What we do know about teacher quality is that teachers with greater cognitive skills and subject knowledge are associated with higher student performance53 and that, to an extent, teacher diversity matters.54 So how can systems get more great teachers in front of students?
ATTRACT THE RIGHT POOL OF TEACHER CANDIDATES.
Top systems are more likely to have teachers who graduated in the top quartile of their training cohort. To attract a high-performing and diverse group of teachers, systems can provide multiple pathways into teaching and hire early to secure top talent. 55 Increasing teacher pay can be effective in recruiting high-quality teachers, though broad increases can lead to greater retention of lower-quality teachers if not carefully targeted or paired with other strategies.
ENSURE PRACTICAL PRE-SERVICE TRAINING.
To prepare teachers to hit the ground running on day one, school systems can invest in practical pre-service training such as apprenticeships and residencies. This training can be aligned with professional standards and closely linked to actual practice in schools. For example, future teachers could have opportunities to practice teaching in a classroom and have access to role models, coaching, and real-time feedback. 56
SUPPORT AND DEVELOP TEACHERS.
Research shows that most teacher professional development is ineffective.57 Yet some strategies do make a difference, such as job-embedded, curriculum-aligned professional development, which takes place at school and focuses on teachers’ daily work of implementing the curriculum in their classrooms (for example, a coach observing a lesson or a teacher examining student work, rather than one-off teacher seminars). 58 Teachers benefit from professional learning communities that breed collaboration and collegiality and create opportunities to take risks.
59
Top systems treat teachers as professionals with individual strengths and weaknesses.60 They reward strong performance, address underperformance, and deploy their best teachers to the highest-need students and schools. Staffing choices can help drive stronger outcomes; for example, students may experience added benefit from spending multiple years with the same teacher.61
RETAIN TOP TEACHERS.
Top systems invest in creating a compelling teacher value proposition, including pay as well as career pathways and support.62 They create ways for great teachers to grow without leaving the classroom, such as by allowing them to mentor new teachers, serve as “master teachers” whose expertise benefits a broader set of educators, or provide instructional coaching to other teachers.
ATTRACT, DEVELOP, DEPLOY AND RETAIN GREAT SCHOOL LEADERS.
Great principals don’t just manage a building; they manage a teaching team. Leaders set a clear vision for quality instruction and build teachers’ skills through observation, coaching, and data-driven instructional programs.63 Research shows that an effective principal can influence student learning nearly as much as an effective teacher.64
Having great teachers isn’t enough. Great school systems equip those teachers with the right tools and supports to succeed. Teachers need high-quality instructional materials (HQIM) and the skills to help all students access them, regardless of their academic needs.65
START WITH GREAT EXPECTATIONS.
High-performing systems have high standards and clear expectations for what classroom learning should cover at each grade level. Students who get more access to advanced materials tend to perform better in school, even if they start out behind grade level.66 Systems can set expectations that demand rigorous materials and create room for joy in learning. Students deserve both. However, you can’t prescribe joy; that depends on the individual relationship between teacher and student. Systems can provide the framework for rigor and give teachers the freedom to create joyful and challenging learning experiences.
EQUIP TEACHERS WITH CURRICULA BASED ON THE SCIENCE OF LEARNING.
According to cognitive research, certain strategies (such as spacing lessons out over time or using quizzes to reinforce learning) help students remember information. Early emphasis on phonics (teaching students to explicitly connect sounds with letters) helps students learn to read. Curricula can provide students with the skills and attributes required for the current and future workforce.67
EQUIP TEACHERS TO DELIVER HQIM TO EVERY STUDENT AND GIVE THEM THE INCENTIVES TO DO SO.
Adopting new curricula and high-quality instructional materials can require significant changes in teaching practices. Great systems provide teachers with extensive, ongoing support on effective use of HQIM.68
ASSESS FOR LEARNING AND DIFFERENTIATION. Great systems make good use of formative assessments to monitor student learning, identify misunderstandings, and address gaps.69 Frequent, standards-aligned assessments help teachers tailor their instruction to different student learning
needs.70 Differentiated instruction has been linked to increased academic performance, particularly for students with learning disabilities.71
TEACH KNOWLEDGE, SKILLS, AND MINDSETS: Research suggests that students’ “mindsets”—like growth mindset and sense of belonging—are twice as predictive of students’ test scores than home environment and demographics.72 Interventions focused on metacognition and social-emotional learning have demonstrated meaningful impact on student outcomes at a relatively low cost.73 But teaching knowledge is also critical. Human working memory is limited, and students need to store knowledge in their long-term memory to be able to access information to solve problems (for example, memorizing multiplication tables allows students to access this information automatically when doing complex calculus equations).74
PROVIDE STUDENT SUPPORT TO ENSURE THAT EVERY STUDENT CAN SUCCEED.
Great systems use proven strategies for students who need extra support. High-dosage tutoring (one-on-one or small-group tutoring at least three times a week) produces significant academic gains.75 Summer school and longer school days can create additional time for learning if they are structured well. Research also shows that acceleration (starting with the current grade’s content, with support) is more effective than remediation (reviewing content missed) in helping students catch up.76 For students who speak another language at home, language and vocabulary skill development requires repetitive review of new vocabulary and regular, structured opportunities to practice oral and written language skills.77 Students with disabilities benefit from learning alongside their peers with routines, behavioral accommodations, and differentiated instruction.78
In addition to advancing student learning, schools play a critical role in student health and community support. For students to learn most effectively, they must be mentally and physically well, and they need to feel safe at school. Students experiencing trauma struggle to learn,79 and the COVID-19 pandemic has exacerbated existing mental health challenges among young people.80 Schools cannot address these factors alone, but they can be equipped to respond.
CREATE A POSITIVE SCHOOL CLIMATE.
Great schools create a positive emotional climate for learning. They build strong relationships among educators, students, and families, and create connections with the broader community. They prioritize the physical and emotional safety of students with appropriate facilities for learning; policies that protect students from harassment, bullying, and violence; and clear and fair approaches to discipline. 81
OFFER COMPREHENSIVE STUDENT SUPPORT.
Great schools also provide comprehensive support to students struggling with emotional, social, or academic challenges.82 They provide multitiered support services with whole-school interventions, such as those focused on school climate and family engagement (tier 1),83 support delivered in small groups (tier 2), and individual student supports (tier 3).84 These interventions have a small to moderate impact on achievement, but they have a larger impact on attendance, behavior, and retention, and they meet broader societal goals.
School systems start in different places. Teachers in Sierra Leone, where 40 percent of primary school classrooms do not have access to running water,85 face different challenges than educators in Singapore, who teach in modern facilities with universal access to high-speed internet and technology.86 Teachers have different needs, and leaders have different resources at their disposal. By necessity, school systems invest differently in their instructional core.
School system leaders often copy successful strategies from other countries. It’s good to aim high, but emulating countries such as Finland or Singapore can be counterproductive. With classrooms of more than 100 students,87 community teachers in Malawi may not have the training and background to design complex project-based multidisciplinary lessons from scratch as teachers in Finland do. Instead, they may benefit from more-structured lesson plans based on a carefully sequenced literacy and numeracy curriculum. Educators in different systems share the same end goal—improved student learning—but the student context is different, and instructional strategies can be, too (see sidebar “What about 21st century skills?”).
The most improved school systems start the journey from where they are. They consider student performance, their financial resources, and the capabilities of their people, particularly teachers and school leaders. This is true both across the system and within it, given the variation across schools and even classrooms. In systems with more than 90 percent of children in learning poverty, leaders may consider interventions designed to support the overall student population, whereas systems with higher rates of average student performance may target specific achievement gaps.
In our 2010 report on the world’s most improved school systems,88 we grouped school systems into several categories, or performance bands, based on student learning levels: poor, fair, good, great, and excellent. These performance bands correlate to different score groupings on international assessments and provide a shorthand for understanding
how academic achievement in each system stacks up against international standards. The 2010 report also considered the journey from one band to the next; in other words, what does it take to move from poor to fair, from fair to good, and from good to great?
In this report, we continue to use these performance bands as a reference tool when considering which strategies might be most effective in systems with varying outcome levels, but with several notable changes. In the past decade, performance data for many low-income systems has become available for the first time, enabling us to add those systems to our data set. We therefore introduced an additional band at the lower end of performance to create more nuance between “poor” systems, which have lower levels of student achievement, and “below poor” systems, which include those with the highest rates of learning poverty. Increasing the number of systems covered by our schema also affected the performance-band cutoffs across the other levels— including collapsing the “great” and “excellent” categories, because few or no systems met the threshold for the latter group.
Across all levels of performance, the imperatives of systems strategy stay the same: starting in the classroom with rigorous materials delivered by the highest-quality educators the system can develop; continuing at the school level with quality principals creating a positive school environment that provides whole-child support; and aligning all system enablers in support. But these imperatives look very different in practice across different levels of performance. (Exhibit 15).
The journey to improve starts from where you are.
A Recruit, develop and retain the highest-possible quality teachers and school leaders
Provide motivation and scaffolding for low teachers
• Practical spaced teacher training
• Structured coaching (re-purposed from compliance to coaching)
Provide instructional training to all school leaders
Develop incentives for both teachers and school leaders to attract and retain top talent
• Meritocratic hiring processes
• Investment in recruiting, pre-service training and aligned coaching
• Fair pay based on national standards (equivalent to GDP per capita)
B Deliver high-quality instructional curriculum to every student
Make teacher’s lives easier through guided systems of teaching
• Focus on literacy and numeracy
• School schedule to maximize learning time
• Scripted lesson plans and teacher focused technology
• Universal textbook provision
Adopt competence-based curricula and assessments at system level
• Resources to reinforce pedagogy for advanced literacy and numeracy
• Flexible curriculum adapted to local contexts
• Instruction tied to economic pathways
C Enhance student wellbeing to improve attendance and learning
Provide basic human needs to encourage attendance and health
• School meals
• School infrastructure (e.g. WASH, consistent power, connectivity
• Trauma-support (e.g. for refugees)
Support student’s holistic needs through:
• Education enablers like healthcare services and transportation provision
• Student social-emotional learning integrated into academics
• Expanding access to early childhood
D Track and manage the performance of all schools
Develop clear outcome targets and provide transparency on performance
Establish school performancesystems based on student assessments, made public for accountability; provide support for action plans and school-level matching programs
E Ensure fair and effective resource allocation, governance, and operations
Ensure adequate overall funding Provide central guidance and supports Root out corruption and dysfunction
Foster continuous improvement culture
• Job-embedded curriculumaligned teacher professional development
• Collaborative proactive, peer-learning
• Top performers to high-need schools
• Sustainable career tracks
Support and hold teachers and schools accountable to adopt HQIM that includes:
• Standards-aligned evidence-based content
• Future-forward skills and knowledge
• Social emotional learning
• Coherent instructional ed-tech including adaptive personalized learning
Address whole child student wellbeing through:
• Multi-tiered systems of support
• Collaboration with health and other agencies and CBOs
Ensure equitable resourcing, with focus on high-need students and schools BELOW POOR & POOR
Implement performance-based budgeting systems with qualified autonomy for school levels budgeting
Empower school-based decision making, with segmented approach to accountability and capability building supports
Systems can make significant gains no matter where they start if they choose strategies that make sense for their context.
• School systems that perform at the GOOD AND GREAT level (like Estonia, Poland and Singapore), rely more on decentralized innovation and schoolbased decision-making, but still provide central guidance and support. They may use peer-led learning to empower top teachers and foster a culture of continuous improvement. They hold schools accountable to using high-quality instructional materials. They address unique student needs, like learning differences, and provide structured support for struggling students. At this level, schools tend to be fairly autonomous and highly accountable for student outcomes.
• At the other end of the spectrum, school systems at the POOR AND BELOW POOR LEVEL (like Malawi and South Africa) benefit from more centralization and structure. They focus on ensuring universal one-to-one access to textbooks, and provide teachers with more scaffolding—including structured lesson plans focused on literacy and numeracy, in-situ training spread across the school year, and ongoing support from teacher coaches. To support student attendance and health, they meet basic needs such as school meals, bathrooms, and consistent power and internet. At this level, leaders work to secure sufficient funding and define clear learning targets for the system overall.
• In the middle of the spectrum, school systems at the FAIR LEVEL (like Ceará (Brazil) and Kenya) start to add in greater flexibility and accountability. They may invest in incentives to attract and retain both teacher and leader talent. Their curriculum still reinforces core literacy and numeracy, but with more emphasis on next-level skills required for local labor markets and the workforce. Student support includes early childhood education, socioemotional learning, and school healthcare and transportation. At this level, schools are held more publicly accountable to outcome-based measures of student performance and school systems may begin to provide qualified autonomy to higherperforming schools.
Just as there is an established evidence base for which interventions have the greatest impact and feasibility in high-performing schools in high-income countries, consensus and evidence are rapidly emerging on specific interventions that lead to the greatest improvements in student outcomes in lower-resourced environments. Several evidencebased approaches emerge as particularly promising.
Focusing on foundational literacy and numeracy enables countries with lower levels of educational performance to build a strong foundation for future skills and knowledge. The Education Quality Improvement Programme in Tanzania (EQUIP-T), a multiyear effort to improve literacy and numeracy instruction through teacher training and strengthened materials, led to considerably improved learning outcomes in Kiswahili and math.
Ensuring that students have access to high-quality instructional materials at a one-to-one ratio in every classroom helps them gain those foundational literacy and numeracy skills. Structured pedagogy approaches combine structured student learning materials matched with explicit teachers’ guides to help teachers deliver materials effectively. Particularly when paired with in-situ teacher training and coaching, this approach can have meaningful impact. Under the Tusome program in Kenya, teachers were trained on semi-scripted lessons that emphasized role models, small-group practice, and discussions. More than 80 percent of teachers used the recommended methods, and supportive coaching improved their practice. Over a decade, Kenya’s average performance across subject areas in international assessments grew by 84 points, taking the country’s system from “poor” to “fair” based on our categorization.89
The Teaching at the Right Level (TaRL) program organizes students into learning groups by skill level rather than grade level. In Punjab, India, leaders used Teaching at the Right Level to reduce targeted learning gaps in primary school. Teachers received training and support to change behaviors. While the share of students in India who could read a grade 2 text as measured by the Annual Status of Education Report (ASER) declined from 2006 to 2014, the share in Punjab surpassed the national average and grew by 13.2 percentage points.90 Punjab has continued to make gains, registering more significant growth on ASER tests of math and literacy skills from 2009 to 2019 than most other states in India.91
Used well, education technology can save teachers time, personalize student learning, and build 21st century digital skills. Expanding connectivity and low-cost devices are making education more accessible in remote areas.
Education technology is often touted as a silver bullet, but the reality is far more complex. Buzzy new tools can distract attention from foundational literacy and numeracy. Rollouts often fail, and devices gather dust. Students are left alone with screens. In some scenarios, students using tech perform worse than their peers without tech.92 It is not enough add devices to the classroom, check the box, and hope for the best.
Data from the 2022 PISA provides additional reasons to be cautious with the use of technology in schools. Across OECD countries, nearly two-thirds of students reported feeling distracted by devices while engaged in classroom instruction. Devices may be having a negative impact on student well-being, with nearly half of students indicating they feel nervous or anxious when their phone is not with them. While learning outcomes were often better for students who used devices in school for learning than for those who did not, the benefits are strongest for those who use their device for up to an hour a day; the impact decreased with additional use. Moreover, students who used devices at home for leisure for more than an hour a day
saw a big decline in math performance. One of the few effective strategies found to decrease distraction from device use was banning cellphone use in school. While bans are not always fully and effectively enforced, they do lead to decreased use of devices by students, both in school and at home.93
Broader research shows that everything from the type of device to the intensity of its use can influence student learning outcomes. Systems rolling out technology systems can apply a set of core principles to help ensure that technology drives impact rather than causing distraction:
• START WITH THE USE CASE, NOT THE TECHNOLOGY.
Successful implementation of technology starts with learning goals and teacher needs and then selects tools and software that are based on a high-quality, evidence-based curriculum. Technology can then be embedded within a coherent learning system, with aligned formative assessments, core curricula, and digital supplemental practice tools.


• CONSIDER TECH FOR SYSTEMS AND TEACHERS, NOT JUST FOR STUDENTS. Systems often focus on student-facing technology, which can be the most challenging to implement well. Technology to support teachers and overall system improvements has great potential but is often underused by comparison.
• ENSURE TECHNOLOGY IS FIT FOR CONTEXT. Just as broader system interventions need to be tailored to context, so too does technology. Starting with existing technology (for example, SMS texts versus video streaming in low-bandwidth regions or offline solar-powered devices in remote areas) can enable systems to build toward the desired technology.
• PROVIDE TRAINING & SCAFFOLDING FOR STUDENTS, TEACHERS, AND PRINCIPALS. Technology won’t help students if it sits in a cupboard. Successful technology rollouts design for adoption and provide significant professional training to teachers on how to effectively integrate technology into the school day. Training can also help systems avoid some of technology’s downsides—for example, by reducing the distraction from connected devices, minimizing implicit bias in AI-based programs, and ensuring that tech usage does not cannibalize other learning time.

• PAY ATTENTION TO EQUITY. Technology can widen educational divides if systems don’t pay attention to unequal access. When schools distribute devices and expect students to use them at home, students who have greater access to high-speed broadband or adults who can help them with assignments may have an advantage over their peers. Many systems saw these inequities play out during the COVID-19 pandemic, when students with more resources were able to participate more fully in remote learning.94 Systems can mitigate this danger by putting a diverse set of intended users at the heart of development and implementation, and by prioritizing access and support for historically disadvantaged students.
• COMPLEMENT TEACHER AND PEER INTERACTIONS; DON’T REPLACE THEM. Technology does not replace a teacher, but it can help a teacher be more effective. Systems can consider what technology does best (for example, increasing personalization or quickly identifying what students know and do not know) to free up teacher time for what teachers do best (including student coaching, relationship building, motivation, and support).
The introduction of ChatGPT has dramatically increased the visibility of generative AI (Gen AI) and its implications for K–12 education. Will Gen AI be able to support student learning goals, not just do interesting things? It’s too soon to say for certain—and views on this question are certain to shift as the technology evolves. At this moment in time, there are a few promising use cases for Gen AI in K–12 education that have the potential to drive meaningful impact globally—if used properly.
CONTENT DEVELOPMENT.
Gen AI can speed up the initial content drafting process and streamline subsequent updates, while ensuring that humans remain the final arbiters of content.
• Instructional content for curriculum providers and publishers: Gen AI tools can be deployed to create a first draft of instructional content, enhancing the relevance and quality of published materials.95 However, human intervention is needed to ensure that such content adheres to requisite teaching standards, is scoped and sequenced appropriately, and is aligned to the science of learning.
• Lesson planning for teachers: AI can also support teachers with lesson planning and has shown potential in tailoring plans and identifying activities to support them (such as videos or in-class prompts and questions).96This use case is most effective if teachers understand how to use AI well; being prescriptive with prompts is essential to ensure that lesson plans align with scope, rubric, and student development needs.
CHATBOTS FOR TEACHERS.
Gen AI can guide teachers toward content for students, deliver in-the-moment professional development, and provide feedback based on behind-the-scenes analytics. One large-scale

provider of high-dosage tutoring in the United States is testing AI as a tool to support its tutors. AI is not replacing the tutors, but enhancing their established best practices for high-quality tutoring.97
CHATBOTS FOR STUDENTS.
Gen AI can help students find resources and probe for understanding, as long as interactions are tied tightly to student learning objectives. Several education technology organizations have recently launched chatbot tutors to support student learning. One early tool follows tutoring best practices by prompting the student with hints and data points to get to the answer themselves, rather than providing an answer. It also acts as a writing coach, helping students develop characters and plot by posing questions.98
ASSESSMENT AND FEEDBACK.
Gen AI can free up teachers’ time by automating grading of assignments, detecting plagiarism, and providing high-level feedback. For example, several tools already provide automated grading of essay structure and content, including for high-stakes graduate school admissions exams.99
As society becomes more technologically advanced, schools are being asked to do more and more. McKinsey research has documented a lengthy list of foundational skills that will be needed in the future of work.108 The list includes cognitive skills, such as logical reasoning and translating knowledge to different contexts; interpersonal skills, such as humility and conflict resolution; self-leadership skills, such as self-confidence and coping with uncertainty; and digital skills, such as digital literacy and computational and algorithmic thinking.
While this broad range of skills may be inspiring and exciting to some, it is daunting for many education systems. Many primary and secondary schools are struggling to impart the most basic literacy and numeracy skills; many national curricula are already “overstuffed” and require streamlining; and many teachers are already overwhelmed and at capacity.109 How then should systems think about incorporating these new “21st century skills” on top of the existing foundational knowledge and skills?
System leaders could consider a few key principles:
KNOWLEDGE IS STILL IMPORTANT.
“Working memory”—where conscious processing of information takes place—is limited and can hold only a small amount of information at one time. Learning takes place when students can take in information, process it, and store it in their long-term memory. Complex thinking results when students can retrieve concepts from their long-term memory in response to what they observe in their external environment.100
Developing students’ core knowledge allows them to better learn and retain information and build connections between ideas and what they are learning.101 This is the foundation of advanced learning.

NOT ALL SKILLS ARE CREATED EQUAL.
Literacy and numeracy are the essential foundation.102 If students cannot read and write, then advanced academic skills such as digital literacy, data analysis, and programming are irrelevant—not because they are not important, but because students will not have the foundational skills necessary to learn and retain them.
SOME SKILLS CAN REINFORCE BROADER LEARNING.
Evidence suggests that some specific skills, particularly those related to self-regulation, can help students with literacy.103 Many of these metacognitive skills can be incorporated into regular instruction, which is more effective than trying to teach them in the abstract.104 For example, teachers can help students

develop planning skills, such as deciding how much time to spend on a specific activity, during a core lesson.
SKILLS GROW WITH THE STUDENT.
Foundational learning and critical metacognitive skills such as self-management are relevant even in the youngest grades and provide important scaffolding for more advanced learning. Other higher-order cognitive skills may be more relevant in secondary school and beyond. Some more specialized technical skills could be taught in higher education or as part of job training.
SYSTEM CAPACITY AND PERFORMANCE MATTERS.
In lower-capacity systems, leaders can start with the most important skills and sequence them over time. Higher-capacity systems can experiment with building more-advanced skills. Singapore, for example, has successfully integrated higher-order skills such as social awareness, responsible decision making, and relationship management into its curriculum and expectations for all students. Teachers are trained specifically to teach these competencies in their pre-service training and ongoing coaching and development.
The specific skills that matter most in each system vary based on local workforce needs, too. Over the next ten years, India’s greatest need will be for workers with trade skills (for example, construction workers and electricians), whereas China will see a pronounced need for workers skilled in customer interactions.105
Education system leaders could partner with other government agencies and with the private sector to diagnose where the biggest skill gaps will be for the workforce of the future and tailor education to meet those needs.
MEASURING SKILLS IS THE FIRST STEP TO VALUING THEM.
If systems want educators to teach these skills, they need to provide them with the appropriate instructional and assessment tools. In other words, educators need to be able to measure whether they are effectively developing these skills in their students. In Australia, the University of Melbourne is partnering with educators at all levels to deploy a suite of tools that measure student progress toward advanced competencies such as collaboration, active citizenship, and agency in learning.106
In the United States, some researchers are shifting toward measuring academic progress in demonstrated skills rather than in time spent learning, and are developing assessment tools that would more holistically capture what students have learned.107
EDUCATION IS MORE THAN JUST PREPARATION FOR THE WORKFORCE.
School prepares students for the workforce, but learning can also serve a greater purpose. Education prepares children for life and to be contributing members of society. Each school system has a different set of values for its citizens. Those values can be reflected in a system’s approach to schooling and in which 21st century skills it prioritizes.
EMERGING IMPROVER
STUDENT POPULATION
13 million
PERFORMANCE FROM 2005 TO 2020
Moved from “Poor” to “Fair”
EDUCATION SPENDING PER STUDENT <$1K

As recently as 2012, Kenya’s primary-school students had low literacy levels. Only 40 percent of grade 2 pupils could read a simple sentence,110 and just 5 percent were fluent in Kiswahili and 7 percent in English, the country’s two national languages.
Between 2014 and 2021, Kenya scaled up evidence-based early literacy programs to all primary schools, reaching 7.8 million students in grades 1–3. The share of students meeting the government’s literacy benchmarks nearly doubled as a result.111
Education in Kenya has a long history of successful pilot interventions that were not well designed for scale. From 2010 to 2014, national literacy rates did not move at all, despite the implementation of more than 25 different interventions. Prior efforts were based on outdated evidence, lacked trust from educators, or burdened educators with tasks that took away from instruction.112
In 2014, Kenya’s education leaders decided to scale up a successful pilot of early literacy interventions with the support of USAID and RTI International, a technical-assistance provider. This time, their approach to scale relied on stronger evidence and provided meaningful support for teachers, allowing the interventions to gain the traction lacking in earlier initiatives.

The program, Tusome (or “Let’s Read”), was a seven-year, $88 million initiative led by the Kenyan Ministry of Education. Using a structuredpedagogy approach, it combined learning content (including a textbook for every student in both Kiswahili and English as well as associated teachers’ guides), teacher training (including six days of annual training), and ongoing coaching by trained curricular support officers (CSOs).

Students benefited from science-backed learning materials; 95 percent of grade 2 students had their own Tusome textbooks, as measured in a USAID study of implementation.113 Training programs emphasized role models, small-group practice, and discussions. CSOs visited schools regularly, providing coaching and support while monitoring progress through a central dashboard.
Following the implementation of the program, more than 80 percent of teachers used the recommended methods.114 The greater the exposure to Tusome, the more student reading improved.
As of 2021, the Kenyan government has assumed full ownership of Tusome. Since taking over, the government has printed two rounds of materials at scale using its own funds. The partner organizations that helped establish the program worked with the government to build up the infrastructure for ongoing capacity building and teacher support, policy and management, and assessment.115
SUBNATIONAL IMPROVER
STUDENT POPULATION
1.2 million 116
PERFORMANCE FROM 2005 TO 2020
Moved from “Poor” to “Fair”
EDUCATION SPENDING PER STUDENT <$1K117
In the early 2000s, the state of Ceará had some of Brazil’s lowest education scores and highest poverty levels. Sobral, a city of 200,000 in Ceará with one of the highest poverty rates in the country, did not rank within the top 1,000 Brazilian municipalities for educational outcomes.118 The city took on an ambitious education reform agenda, vaulting to the top-performing spot in the nation in both primary and secondary education by 2017.119
Under the leadership of several reform-minded governors, the state of Ceará took a comprehensive approach to strengthening its instructional core based upon the reform framework from Sobral. By 2017, Ceará registered the greatest rise in national exam scores for elementary education. Today, the state has Brazil’s lowest rate of learning poverty and some of its highest reading and math scores in the national benchmark exams taken in fifth and ninth grade. As student learning rises, the state’s economic outcomes are expected to rise as well.120
Ceará’s reforms focused on the classroom, starting with better curricula, support for teachers, and recruitment for principals.
Ceará invested heavily in supporting teachers to deliver quality content. The state prioritized Portuguese literacy and math in the curriculum, with a focus on elementary school. It developed context-appropriate textbooks, and teachers received structured lesson plans to enhance their teaching practices. All teachers engaged in focused and practical professional development, including classroom observations, and the state government deployed coaches to train municipal education staff on scripted learning materials.

To strengthen school leadership, Ceará created a meritocratic system for recruiting and training school principals. It moved away from political appointment of school principals and created several strategies to improve the skills of current principals, including ongoing training and peer-learning forums. To monitor progress, the state used large-scale student assessments that it had recently created.
As schools improved, the state adjusted school governance structures, creating early stages of autonomy for higher-performing schools. Leaders shifted the management of elementary education to municipalities while offering technical assistance, increasing both autonomy and accountability. School funding was linked to performance, and the best-performing schools were paired with the worst performing to encourage peer learning.

SUSTAINED & OUTSIZED IMPROVER
STUDENT POPULATION
5 million
PERFORMANCE FROM 2005 TO 2020
Moved from “Good” to “Great”

Prior to the 1990s, most leaders in Poland would have said the country’s primary goal of education was equipping young people for basic employment. As Poland’s economy evolved, its workforce was underprepared for a job market requiring new skills; the nation had one of the OECD’s lowest rates of full secondary education participation.121
In response, Poland reformed its education system several times over the past two-plus decades. Comprehensive structural reforms in 1999 included the introduction of junior high school (gimnazjum) and national curriculum changes. Additional curricular reforms were implemented in 2008, and an expansion of early education started in 2009.122
Student outcomes on PISA and other international assessments have largely improved over the past 20 years. Poland moved from below the OECD average to a top-performing country in Europe and in the world.123 Four times as many people earned postsecondary degrees in 2022 as in 1990.124
In the mid-2000s, Polish leaders prioritized curriculum reform based on the science of learning, supporting teachers to upskill and deliver the new curriculum effectively and expanding access to kindergarten education.
Though the national curriculum had been updated in the late 1990s, experts noted that the curriculum created a “content overload.” 125 Over the course of the early 2000s, the share of students pursuing tertiary education had grown substantially, creating the need to build a new set of skills in secondary grades. Polish students struggled to translate their specific knowledge in math and science into independent thinking and problem solving. The curriculum reforms initiated in 2008 were informed by PISA data and an expert panel, establishing a strong feedback loop between the central government and research professionals. The redesign drew on research about learning and comprehension to prioritize critical thinking and reasoning, and the resulting curriculum emphasized the development of comprehensive cognitive and analytical abilities.126
Polish leaders launched a major public-information campaign to help educators, students, and parents understand the new approach and the rationale behind it. They also employed a series of strategies to ensure the new curriculum would be implemented with fidelity while granting teachers and leaders autonomy. To that end, system leaders focused on building the skills of educators. The ministry deployed experts to coach teachers and school leaders on the changes. Professional trainings were ongoing and involved everyone within a school’s ecosystem. Regional education departments were given new tools to assess progress in their area schools and provide tailored support. The central government also worked closely with publishers to refresh textbooks and to support teachers’ use of these new materials.
SUSTAINED & OUTSIZED IMPROVER
STUDENT POPULATION
<1 million
PERFORMANCE FROM 2005 TO 2020
EDUCATION SPENDING PER STUDENT >$14K
From the moment Singapore achieved independence in 1965, education has been at the core of its national societal vision. Leaders designed the school system to promote the critical thinking, continuous-learning mindset, and character foundations they hoped to create in the nation. Next, Singapore invested heavily in its instructional core, including intensive teacher development, a curriculum for character and citizenship education, and holistic student health.
Singapore has consistently been one of the highest performers on global assessments such as PISA—and, unlike many other systems, has sustained that performance over time.
Singapore’s emphasis on evidence is particularly apparent in its approach to attracting and developing top teacher talent. The Ministry of Education recruits and selects teachers for the entire country. Singapore’s relatively small workforce of 33,000 teachers makes this centralized approach possible.


BUILD A DURABLE COALITION FOR CHANGE
Engage educators and families authentically Highly effective education leaders understand they cannot effect change alone. Continuous improvement and growth require aligning the system on a few coherent priorities, buffering against leadership discontinuity, and authentically engaging families and educators in two-way communication to design better policies and build deeper buy-in. 1 2 3
Set fewer priorities to get more done
Cultivate leadership beyond a single leader

CASE STUDIES
Morocco | Poland | Washington, D.C. (U.S.)

Education leaders are accountable to a wide range of powerful stakeholders, including donors, voters, and unions. As a result, they are regularly pulled in too many directions. The job becomes a constant battle of fighting fires, and long-term investments that benefit students slip to the bottom of the list. To make progress and maintain their role, leaders often feel pressured into overpromising. To counteract this, leaders of successful school systems focus on a few coherent, sustained, and evidence-based priorities.
Set a North Star vision and choose a few measurable priorities. Successful systems paint a vivid picture of the destination and why the reform is necessary, taking into account existing performance and what would happen if action is not taken. They take a collaborative approach to designing this strategic vision to build commitment among leaders and define a rallying cry for stakeholders. Then they identify a limited set of core priorities (typically no more than five) that are most likely to advance their long-term vision and attach measurable goals to them (Exhibit 16).
For example, Peru’s education minster simplified a complex, 200-part national education plan into four key points that the system could organize around.127
In Mississippi, education leaders created clarity by defining six core goals for the state, including strengthening literacy outcomes and expanding access to early education. The state superintendent started every meeting by naming the six goals, and anyone proposing a new initiative had to explain how it supported at least one of those goals.
Use the evidence base to set nonnegotiables. Effective education plans draw on evidence-based best practices to deliver their North Star vision. They bring evidence into decision making by engaging research partners, rooting their choices in data, and scaling high-impact practices. For example, leaders in Kenya developed the Tusome program by taking
evidence-based practices on structured pedagogy, training, and coaching that had succeeded elsewhere and infusing them into a scalable model. Tusome delivered results where similar efforts had failed partially because of its emphasis on clear outcome goals and its structured approach to data collection and monitoring.128
While it’s critical to hold steady on nonnegotiables, it’s also important to consider when a compromise might be necessary or strategic without undermining the system’s ability to achieve its goals. Leaders in the Canadian province of Ontario agreed to reduce class sizes, despite mixed evidence on outcomes, because it was a feasible action in an environment of increasing education funding. This created the political capital to pursue their core research-based priority of building teacher capacity.
Ensure that country leadership, donors, and partners support key priorities. Funders sometimes have their own agendas, leading school systems to implement disconnected initiatives. Funding cycles and the expectation for rapid results may distract leaders from other priorities; a typical donor program may include a one-year ramp-up, a three-year program, and a one-year ramp down. Donors and not-for-profit partners often work hand in hand to scale new programs and present leaders with prebaked models to implement. Even with the best of intentions, external partners may try to
“If everything is a priority, nothing is.”
-Carey Wright, Former State Superintendent of Mississippi, U.S.
force the system to conform to a specific model or approach, rather than modifying to local context. This approach can lead to mushrooming priorities or multiple disconnected missions as governments shift to integrate new partners. Successful leaders rally donors and partners around their priorities, pulling in external expertise but avoiding the potential whiplash. They work with partners to implement new initiatives that fit within predefined priorities and intentionally bring in partners whose approach aligns with their vision.
When war broke out in Syria in 2011 and refugees entered into Lebanon’s school system, more than a dozen donor countries and multilateral organizations arrived to help. The Lebanese Ministry of Education and Higher Education worked with USAID to create a coordinated effort for donors, rather than allowing each donor to target funds separately.129
In India, some states have upward of 70,000 to 100,000 schools and many nongovernmental entities working to advance change alongside state government. One not-for-profit partner, Mantra4Change, works further upstream by helping state education leaders define their mission so they can then bring partners into the established mission rather than letting each partner define its own set of goals. When successful, this approach results in a more coherent set of priorities that guide the work of everyone involved.
Government leaders outside the ministry of education often have an important role to play in supporting key education priorities and helping to maintain focus and attention. On the other hand, a failure to align with other government agency leaders on education priorities can hurt progress or lead to misaligned investments. For example, the goal of increasing access to education in rural communities would likely require aligned investments in transportation access. Education and health priorities can often go hand in hand, and a shared approach among ministry leaders can multiply the impact of focused investment.
In Malawi, education leaders have engaged other government departments to ensure that upgrades to the country’s electrical and broadband infrastructure will support the rollout of an at-scale technologybased education intervention.
EXHIBIT 16
A priorities map could help school systems link vision to action.
What is the school system trying to achieve over the long run?
Improving student achievement and well-being across all grade levels
What are the broad themes that you will focus on to achieve that vision? (usually valid for 3-5 years)
What are the workstreams and initiatives that will translate these into action? (usually completed in 6 months-2 years)
Pipeline for teacher talent
Training staff to step into school leadership roles
Teacher coaching
Adoption of HQIM
Roll out of formative assessments
Upgraded teacher PD and Professional Learning Communities
Universal screening
Behavioral health coaches
Parental engagement
FOR SPECIFIC THEMES
Data-training for teachers
Teacher deployment to high-need schools
Strategic resource allocation
How will we track impact across each theme – financial, operational, and student outcome metrics
• Teacher recruitment and retention
• Staff and leader vacancies
• Staff evaluations
• Teacher use of HQIM
• Staff feedback on revised PD and PLC cadence
• Teacher class-observations
• Student attendance
• Suspension rates
• Parent & student wellbeing and satisfaction (survey)
• Financial health metrics
• Implementation fidelity of new systems
What are the overarching metrics that will inform whether you are on track or met your overall aspiration?
• Student achievement on national assessment increasing by X%
Student equity gaps (e.g., student achievement gaps among demographic identifiers decreasing by Y%)
• Teacher, Student, and Parent survey satisfaction and wellbeing over Z%
Set a North Star vision and choose a few measurable priorities:
Do we have a clear North Star vision for the next three to five years? Is it memorable and focused on students?
How do our education priorities reflect changes in the workforce and the broader economic, political, and cultural environment?
Use the evidence base to set nonnegotiables:
Does our vision include three to five evidencebased priorities focused on the classroom? How will we turn evidence into practice?
Are we investing political and personal capital in those priorities and spending a significant amount of time visibly reinforcing them?
Do we have measurable goals attached to each of our priorities and a system in place to track our progress toward meeting those goals?

Which parts of our plan allow for compromise? Where will we take a firmer stance?
Ensure that country leadership, donors, and partners support key priorities:
Do we have the support of political leadership (for example, the board of education or the prime minister)? Do we invest in understanding legislative priorities and constraints?
Do we convene donors to build alignment around a single multiyear agenda? Are we willing to turn down money if it comes with too many strings or distractions?

Do we meet regularly with our counterparts from health, economic development, and other related departments to identify opportunities to reinforce our priorities?
Rapid leadership turnover is the enemy of sustained change. True transformation can take a decade, but few leaders have that much time.130 The minister of education can have a short tenure, and the terms are often set by politics beyond education (such as shifts in school boards or country leadership). Leaders feel pressure to “make their mark” quickly, but when policies change frequently, the whiplash can leave teachers and principals feeling disillusioned. Successful systems establish priorities to ensure continuity through building other leaders, creating an ecosystem within and outside of government, and establishing reforms in policy and process.
Build individuals beyond the leader. The daily functioning of any government agency depends on a layer of career civil servants who outlast political leaders. Successful systems build a strong bench of employees who are committed to the reform agenda and invest in the next generation of education leaders at every level of the system—at the central office, in middle management, and in schools.
Beginning with the reform efforts launched in 2007, education leaders in Washington, DC, focused on empowering their senior leadership teams to carry on work across administrations. As chancellor, Michelle Rhee recruited Kaya Henderson to serve as her deputy; Henderson then went on to lead the department. Many senior staff served under both chancellors and stayed beyond Henderson’s tenure. Both chancellors intentionally recruited talented leaders from within and beyond the system and invested in them. Former leaders shared in interviews with McKinsey that the environment was intense and there was strong accountability, but members of the leadership team felt empowered and supported and were committed to seeing through the impact of their reforms. The culture that the two chancellors created extended to the layers below their leadership team; many of the chief
positions just below the chancellor are still filled with former deputies who were trained during the Rhee and Henderson administrations.
Foster institutions beyond ministry.
Education is often politicized; reforms passed by one administration become targets, only to be eliminated by the next leader. Giving stakeholders across the political spectrum a reason to support changes can be powerful. In 2009, Norway’s new education minister chose to build on the prior minister’s efforts rather than adopt a completely new approach. This was facilitated in part by senior civil servants at trusted external institutions, who provided the same evidence-based research to both political parties. As a result, the system saw greater consistency in approach and sustained improvements in student performance.131
Some leaders create longevity by building support within other government agencies outside of the ministry of education. In Spain, investments in expanding vocational education have persisted through multiple political administrations in part because of support from government leaders focused on labor and the workforce, as well as from employers.
“My initiative is now being fulfilled by a conservative government. This kind of continuity gives me hope for the future.”
-Kristin Halvorsen, Former Minister of Education of Norway
Successful systems minimize the politicization of their education agenda by leveraging nonpartisan institutions and processes to sustain their efforts. A healthy ecosystem of external partners can further policy development to help new government leaders when they step into office, jump-starting reform work on a faster timeline. When the Mississippi Department of Education had to develop plans to meet the state’s new literacy goals, department leaders leveraged work done by the Barksdale Reading Institute, which had already laid out a clear approach to coaching for reading improvement.132
External organizations can also serve as a training ground for future ministry leaders. Poland’s Centre for Education Development worked closely with the ministry on the country’s curriculum redesign. Multiple directors from the Centre went on to take leadership positions at the ministry, continuing to implement the priorities that been set.
Embed changes in policies or processes. Embedding core improvement priorities in standard policies and operating procedures reduces the likelihood of reversal and increases their likelihood of outlasting individual political leaders.
For example, Morocco created new laws to enshrine its education reforms; this legislative framework created coherence among the reforms, established a performance infrastructure to monitor implementation, and drove accountability. In multiple systems profiled in this report—both higher-performing systems, such as Estonia,133 and lower-performing systems, such as Punjab in India134 —the government added preschool education as part of formal education policy. This shifted family expectations about the educational services their children will receive, making it harder for administrators or leaders to consider reversing these policies.
Build individuals beyond the leader:
Have we invested in empowering a senior team that has bought into the change effort?
Do we have a bench of at least ten n-2 leaders— the next generation of leaders, who report to our senior team—who are committed to the priorities of the change effort? Have we trained a big and diverse enough group for future leadership positions?
Do we have support and engagement from our nonpolitical staff, especially civil servants in the middle layer and principals across the system?

Foster institutions beyond the ministry:
Have we engaged a broad range of partners (such as think tanks, not-for-profits across the political spectrum, donors, and philanthropists) to support the work?
Can our institutional partners continue to drive work forward outside of the government infrastructure?
Have we taken steps to depoliticize the actions we are taking (for example, enlisting external champions or engaging with political leaders outside our party)?

Embed changes in policies or processes:
Have we considered ways to embed changes in legislation or regulation?
Authentic engagement is especially hard to do well within the context of education. Nearly everyone has been to school at some point in their lives; many families have their children in school or have parents, sisters, and cousins who are educators; and schools play a central role in many communities, especially as other community organizations wither.135 Everyone with a stake in the school system—educators, students, families, and communities—has an opinion informed by deep personal lived experience. Engagement takes precious time, energy, and money, and can backfire if the process gets politicized. But making change only from the top down invariably breeds mistrust. This can lead to outright rejection of reform or cause improvement efforts to gradually fizzle out.
Despite the challenges, successful leaders treat authentic engagement as a nonnegotiable. Successful engagement makes change efforts both more effective and more likely to succeed over the long run.
Collect ongoing input from educators and families. Successful school systems deliberately allocate time up front to understanding the lived experiences of students and educators in schools and classrooms. This enables them to design policies that respond to the realities on the ground. They hold inclusive conversations with the people most affected by the changes, and create a variety of ongoing forums for engagement, such as advisory boards, input sessions for specific initiatives, informal breakfasts, and listening tours. Some systems continually collect feedback and information through surveys covering a representative sample of principals, teachers, students, and parents.
An effective stakeholder engagement approach also recognizes that different stakeholders have different types of expertise. This means that systems need to
be transparent with stakeholders at the outset about which decisions they are providing input for and which decisions are under their control to make. For example, parents are experts on their own kids. They can provide valuable feedback on their aspirations for their children—what they want the school environment to feel like and what kinds of opportunities they want their children to be prepared for. Teachers are experts on classroom dynamics. They can often identify what is missing from implementation and what is likely to look good on paper but not work in the messy reality of day-to-day instruction. Curriculum experts and researchers are experts on the evidence and research on the science of learning, and are likely best consulted on the scope and sequence of grade-level standards—what should be learned when and how.
“We asked people, ‘What are your hopes and your dreams for the district and for your students?’”
-Kaya Henderson, Former Chancellor of DC Public Schools
Colombia’s education minister met monthly with principals, convened 1,500 teachers, shared information with unions, and went on a listening tour to a different region each week. The constant flow of information gave leaders a better understanding of what educators were experiencing and what they needed; it improved the dynamic between system and union leaders and had an impact on the way leaders framed key reforms.136
Policy makers in many systems are in big cities, removed from the experiences of many citizens and educators. Leaders need to listen to a diverse range of viewpoints across rural and urban communities, across the political spectrum, across racial and ethnic divides, across genders, from students and schools that are performing well, and from those that are struggling. The information can be revealing. As leaders in Ghana and Kenya engaged with female students in recent years, particularly in rural communities, they learned that girls were unable to attend schools during their menstrual periods; this new information has pushed leaders to focus on infrastructure and sanitation.137
Many successful leaders also engage a broader set of community members, such as prospective employers, private-sector leaders, or trusted authority figures in the community. After all, education affects every part of society. As Estonia made a focused push to grow its tech sector, it worked with employers to understand the skills students would need and infused that information into the curriculum.138
Create and communicate a compelling change story.
Systems need to communicate effectively so that educators, principals, students, and families understand the purpose and methods of the reform. Stakeholders need to understand why change is happening, why it’s happening now, and what it means for them. Sometimes a compelling story can inspire rapid and transformative action. After the 2022 podcast Sold a Story revealed the widespread use of certain non-evidence-backed reading curricula in the United States, 15 states passed laws requiring instruction to be backed by the “science of reading”— part of a growing trend to push educators to follow a more evidence-based approach.139
Strong leaders tell a story about how their proposed changes will improve students’ daily experiences at school. Strong stories address six main questions about change: what is our aspiration, why are we changing now, why is it worth it, how will we get there, what are our expectations of one another, and why are we confident it will work this time? Repetition is key. Successful systems develop comprehensive communication plans and use a variety of channels. For example, Mississippi’s education department built out a robust communications team, live streamed most meetings, and used TV and radio to share key priorities.
Successful systems also divide their stakeholders into segments—such as principals, teachers, students, families, unions, and donors—and identify the unique roles and motivations of each group. Then they tailor their communications to each audience segment, ensuring that messages connect to each audience’s motivations (Exhibit 17).
STEP
Identifying stakeholders (e.g., principals, teachers, students, families, community members, political leaders, unions, donors) and their unique motivations
SOCIETY
•Improving educational outcomes
•Building the community
•Stewarding resources
TEAM EXPERIENCE
SCHOOL SYSTEM
•Becoming a leading school system
•Increasing enrollment
•Balancing budgets
•Nurturing high-performing teams
•Bolstering sense of belonging
•Fostering a caring meritocracy
STUDENTS
•Improving student experience
•Improving instructional quality
•Making learning fun and relevant
PERSONAL EXPERIENCE
•Achieving personal development
•Receiving recognition/promotion
•Providing for family
Categorize and engage stakeholders depending on influence and support of project
Importance of stakeholder to project success
Ability to help with project implementation
INFORM
With lower influence and interest, these stakeholders benefit from having basic information available but are not strategic to engage more actively
ENGAGE
Keep in close 2-way contact with these stakeholders and involve them actively throughout the project to inform analysis and insight
ACCOMMODATE
Reach out to these stakeholders to be sure they are aware from the beginning and be responsive to requests
COMMUNICATE
These stakeholders may be partners in ongoing work and responsible for delivering on later changes, making it important to have proactive information sharing
Potential attitude towards project
Perceived willingness to support or “push back” during implementation
In Malawi, the Ministry of Education engaged with a wide circle of partners to roll out an ambitious program that will bring connected tablets to every primary school. Leaders took steps at the time of the program’s launch to ensure that government—at all levels of the education system, and in all sectors— was aware of the work, and that all stakeholders understood the roles they could play and the potential benefits of the program. It was critical for teachers to understand that the technology was not going to replace them; rather, it would support them in doing their jobs and they would undergo the training necessary to implement new practices.
Bringing all stakeholders along as champions for educational improvement can have a powerful effect. In Vietnam, World Bank researchers found that as much as half of the country’s score differential on the 2012 and 2015 PISA tests could be explained by the diligence students brought to their studies, the expectations that parents placed on students and teachers, and the discipline teachers brought to their work.140 One lesson from Vietnam’s journey is that strong results are rarely the result of policy alone. Rallying a nation behind the education system has meaningful impact.
Influence change by shifting mindsets and behaviors. Telling a compelling story is critical but often insufficient on its own; our research has found that systems are most successful when they take a comprehensive approach to shifting mindsets and behaviors. Transformations are eight times more likely to succeed when leaders use all four elements of the framework below—tell a compelling story (as outlined above), align incentives, provide the necessary skills, and model the change—than when they employ just one (Exhibit 18).141
• Align incentives or other reinforcements to drive behavior change.
Successful school systems give stakeholders tangible reasons to participate in improvements. This can include monetary incentives for individuals and schools, career advancement opportunities for teachers and leaders, and access to new services and programs. In Ceará, system leaders took a new approach to school financing that created incentives for school leaders at all performance levels. The 150
highest-performing schools “adopted” the 150 lowest-performing schools, and both schools in a pair were financially rewarded if the adopted school improved.142
• Provide the skills required to implement change Research on effective transformations shows that people often overestimate their own abilities, discounting the new skills they will need to implement change. But once they are given the tools, they are motivated to drive improvements.143 Successful change efforts include training for educators, leaders, and government officials, tailored to provide the skills they need to shift the way they work. Strong systems are able to differentiate skill building based on need. In Ceará, the state empowered municipal education departments to work with teachers on implementing scripted lessons. In cities with the most struggling schools, the state led a long and sustainable journey to improve the quality of municipal education leaders, empowering them to provide better support for teachers and schools.
• Use trusted role models to exemplify the change and motivate peers. It’s the job of leaders at every level in the system to model the change; different stakeholders will be motivated by the role models who feel most relevant to them. In Punjab, Pakistan, this meant engaging the leaders of mosques to drive up school attendance. In Sierra Leone, it meant enlisting traditional tribal leaders as partners to build confidence among rural families in government-run schools. Many successful systems pair schools together to learn from each other, providing principals with a role model whose experience is directly relatable; this was a core component of the London Challenge strategy, where leaders invested in making good schools great so they could serve as a model for others.144 In Shanghai, China, deputy principals of successful schools can only become a principal if they served as part of a leadership team that drove the turnaround of a struggling school.145
EXHIBIT 18
The four building blocks of change.
“I will change my mindset and behavior if …”

F
EXAMPLES
System, school, or project leaders modeling behavior (e.g., school and system leaders tutoring students)
Symbolic acts (e.g., highlighting successes, providing spaces to receive authentic feedback)
Structured opportunities for peer sharing around successes
“I believe that implementing this new curriculum is the right thing to do for our students”
“I see my principal and colleagues collaborating to implement the new curriculum”
EXAMPLES
Teacher and principal training (e.g., instructional methods, supporting students with special needs)
Ministry and middle-layer training (e.g., program management, analytics)
Tools to help integration
EXAMPLES
System-level communications (e.g., mission and vision, press strategy, leveraging credible external sources)
School-level communications (e.g., ongoing, twoway communications with staff or families, townhalls, letters to families)
Peer-to-peer communications (e.g., student speaking panels, teacher peer groups)
“Barriers are being removed, and I’m being rewarded for implementing the new curriculum”
“I have the skills, tools, and opportunities to implement and use our new curriculum”
EXAMPLES
System and school structures (e.g., curriculum, school governance)
Processes (e.g., enrollment, student assignments, behavior management)
Incentives (e.g., rewards, performance bonuses, autonomy)
Source: McKinsey & Company, “The four building blocks of change,” April 2016
Collect ongoing input from educators and families:
Do we incorporate perspectives from a broad range of voices that represent our entire system (for example, rural or urban, different layers within the school systeml, demographic diversity)?
Do the processes we use to design, select, launch, and evaluate policies include and reflect the perspectives of those historically excluded from such processes?
Do our minister and cabinet members visit a diverse set of schools several times a month? Do we have a mix of planned visits and spontaneous opportunities to observe instruction?
Do we have regular (at least annual) surveys of parents, teachers, principals, and students to inform decisions?
Do we regularly engage an educator advisory board and a parent and student advisory committee, and do we make it clear that their role is to provide input, not make final decisions?
Do school visits, surveys, and advisory groups have clear feedback loops to decision making?
Build and communicate a compelling change story:
Do we have a comprehensive plan for internal and external communications, and does our team have the communications expertise to tell a clear story of reform?
Have we identified potential supporters and detractors of our plan and developed a tailored communication, engagement, and mitigation plan for each?
Do we have clear community-led initiatives developed and championed by key stakeholders, such as educators, parents, and students?
Influence change by shifting mindsets and behaviors:
Do we provide incentives for the outcomes we want to see (for example, adoption of quality materials)?
Have we given government officials, principals, and teachers the tools and training they need to implement the new policies?
Can our principals, teachers, and parents articulate our priorities?
Do we know who our educators trust, and have we enlisted those trusted community members as allies?
SUSTAINED & OUTSIZED IMPROVER
STUDENT POPULATION
7 million
PERFORMANCE FROM 2005 TO 2020
Moved from “Below Poor” to “Poor”
EDUCATION SPENDING PER STUDENT
$2-3K

Morocco’s leaders declared 1999 to 2009 to be the ‘decade of education’ and have worked continuously since to improve the national education system.146 These improvements have become more visible with Morocco’s participation in TIMSS starting in 2011 and PISA starting in 2018.147 Between 2011 and 2019, Morocco made significant and sustained progress on TIMSS (gaining 33 points in math and 64 points in science), making it the fastest-improving large country 148 globally on international assessments in the past decade, and one of the few African countries showing sustained improvements. Though it still lags in overall achievement and faces persistent challenges in its education system, Morocco has begun to climb from “below poor” to “poor” performance—a leap many systems struggle to make.
In implementing education reforms over more than a decade, Morocco’s leaders were able to address the mindsets and behaviors of key stakeholders to work toward lasting change.
For example, the ministry created new incentives and pressures for school leaders by publicly releasing the strongest academic results and celebrating performance. This healthy competition improved the quality of classroom instruction, leading to stronger student outcomes.149 Starting in 2008, the government launched a conditional cash transfer program to provide grants to poor families to address the underlying economic constraints driving school dropouts. The program demonstrated successful results; it has since been expanded and is ongoing.150
Recent efforts have leveraged coalition building to drive outcomes. In 2019, Morocco passed its first-ever framework law in education, loi cadre 51-17, and the ministry set up a multi-stakeholder commission to monitor implementation.151 To scale preschool participation, education leaders leaned on other government partners and foundations for support. The number of preschool classes grew from 7,000 in 2019 to 30,000 in 2023.152
Morocco’s performance on international assessments since the onset of COVID-19 raises concerns about the pandemic’s impact on achievement 153 and there have been recent tensions between the government and the country’s teaching workforce unions, including a lengthy teacher strike.154 While this does not take away from the progress Morocco made historically, it underscores the challenge in sustaining educational improvements over the long run.
SUB-NATIONAL IMPROVER
STUDENT POPULATION
<100K155
PERFORMANCE
FROM 2005 TO 2020
“ Good”
In the early 2000s, DC Public Schools (DCPS) had the lowest math and reading scores of any major metropolitan school district in the United States. From 2007 to 2016, Chancellors Michelle Rhee and Kaya Henderson made significant changes to restore confidence in the school system. Under both leaders, DCPS improved core systems and operations (such as data, finance, and payroll), overhauled its talent strategy, implemented a new curriculum, and streamlined accountability.
During that period, DC students made significant improvements in reading and math on national assessments. In 2019, they outperformed the US average. At the same time, DCPS saw enrollment gains for the first time in 40 years.

When Henderson became chancellor in 2010, she put authentic community engagement at the core of all her decisions. As she shared in an interview with McKinsey, her first act as chancellor was to launch a public-engagement campaign, asking community members, “Ten years from now, what should DCPS look like? What are your hopes and your dreams for the district and for your students?” DCPS reached out to families, posting information about how they could engage with the school system in barbershops and other neighborhood institutions. Ten thousand people shared their ideas through community forums, surveys, teacher and principal advisory meetings, and school visits from senior leaders. Collectively, these ideas formed the foundation of the district’s strategic plan.
Input from parents, students, and educators informed the district’s work on launching new programs and, subsequently, employing strategies to rebuild public confidence in the school system. The benefits of this community-centered approach were clear in tougher moments, too, including in 2013, when DCPS announced a plan to close a significant number of schools. Before putting forward the closure proposals, senior leaders invested time in explaining the rationale to community members so they understood how consolidating the number of schools would bring new resources and services to the remaining schools. System leaders told a compelling change story that helped the public understand why the change was happening and how it could ultimately benefit their schools.
Prior school closures had led to protests and resulted in families leaving the system. This time, families and educators helped shape what their schools would look like after the closures and consolidations. Stakeholders had a chance to truly be part of the process, and Henderson reported that pushback was much more limited as a result.
Read McKinsey’s interview with Kaya Henderson to learn more about DC’s story.157
SUSTAINED & OUTSIZED IMPROVER
STUDENT POPULATION 900K
PERFORMANCE FROM 2005 TO 2020 “ Good”
EDUCATION SPENDING PER STUDENT >$14K

Norway is one of the few countries that have managed to sustain programs of education reform over multiple years, despite changes in political leadership.
In 2000, Norway performed well below expectations on the global PISA assessment—an event now known as the “PISA shock.” Nearly 20 percent of students were not able to read with any deep understanding, a challenge for democracy as a whole.158 Since then, leaders across the political spectrum in Norway have consistently collaborated to improve student outcomes, relying on data rather than doctrine.
This stability led to sustained results for students: from 2001 to 2016, student scores improved on all major international assessments. (PISA scores have since slipped slightly, possibly correlated with changes in Norway’s population and demographics.159)
In 2001, Kristin Clemet stepped into education leadership for the Conservative Party. As she shared in an interview with McKinsey, she used the poor PISA results as a catalyst to implement a more rigorous curriculum, broader data metrics, and improved accountability during her tenure. She spent significant time communicating with the public to outline the problems her administration was working to solve and to point to the evidence base behind the proposed shifts. Clemet had strong connections with leaders in the Socialist Left Party – they were able to work together over coffee and cigarettes.160 This collegiality contributed to a smooth transition when power shifted in 2005 and the Socialist Left took over leadership.
Though the other party had proposed to make changes to some of the reforms during their campaign, the reality hewed closer to a maintenance of the status quo. This was in part because of a cultural respect that leaders in Norway have for the consensus view and a tradition of building on prior work, rather than tearing it down. But this was also because many of the reforms of the early 2000s had been institutionalized; there were experienced civil servants who stayed on and were able to push for continuity.
Under Clemet’s leadership, the ministry had introduced new national tests. When Kristin Halvorsen of the Socialist Left Party took over the education post in 2009, her administration found ways to maintain the tests, while transforming their use to respond to the stakeholder feedback they had received. As she shared with McKinsey in conversation, this minimized churn for the education system while still allowing the new leaders to work toward their goals. The test administration was shifted from the end of the year to the beginning of the year to allow them to serve as a formative tool and leaders minimized the use of tests as a ranking tool.
When the Conservative Party stepped back into leadership, they too maintained many elements of the approach in place, continuing work on curriculum started under Halvorsen’s leadership. Once again, the stability and professionalism of the ministry’s civil servants and external research partners combined with an evidence-based approach paved the way for continuity.

Create coordination and cadence for change
Build implementation structures and skills

Turning strategies into action into results requires intentional skills and planning. Effective education systems do this by translating strategies into implementation road maps, budgets, and cadence, and building implementation structures and capacity to deliver. 4 5 CASE STUDIES
South Africa | Peru | London | Mississippi

Developing a clear, community-informed plan with sound ideas is just the beginning. If there’s no road map for implementation and nobody is held accountable for putting the plan into action, the plan can end up sitting on a shelf. Successful systems spend less time creating strategies and more time creating change through those strategies. Leaders can also strike a balance between setting an ambitious pace for change and ensuring that the changes create their intended impact.
Translate strategies into a concrete road map. The first step is to turn a strategy into a concrete road map, with clear workstreams, targets, milestones, delivery plans, ownership, and risk mitigation. Keep targets limited, specific, and outcome-based, resisting the temptation to add “nice to haves” (Exhibit 19).
It’s also important to pressure test implementation plans. For example, systems can run a quick “premortem” meeting to identify risks up front, asking: “If this initiative fails in five years, what will have gone wrong?” Another option is to run a “day in the life” simulation in which stakeholders (such as teachers) experience the new process as they would in a typical day.162 In 2020, Chiefs for Change, an association of state and district education leaders in the United States, supported many of its members in running simulations of remote, hybrid, and in-person schooling options to refine COVID-19 response plans.
Ensure the budget is oriented around priorities. Too often, budgeting is disconnected from the strategy process, responding to past needs instead of future ones. Successful school systems ground their budgets in their instructional priorities, projecting needs and funding sources for now, a year out, and up to five years out. An integrated budget process— in which finance and academic departments collaborate through budget development—can be far more
productive than parallel processes in which alignment is attempted in the last-minute run-up to approval. The realities of budgeting can vary dramatically depending on a system’s income level, but there are still strategic lessons to apply in every context.
In 2007, Poland’s Ministry of Education defined two priorities—curriculum reform and expansion of kindergarten education—and harnessed funds from the European Union to work toward them. The central government created a funding match for any locality that opened new kindergarten classrooms.
In Sierra Leone, the government has worked systematically to add teachers to the public payroll to boost teacher quality, especially in rural areas. This has represented a significant new investment, and funding has grown steadily each year, although there are still gaps to fill to fully meet instructional needs.
Systems can effectively tie their budgets to priorities even when adding new funding is not possible. Ceará effectively employed a financing model in which municipalities received a greater share of the state’s resources if they made progress toward educational goals. The approach encouraged equity by rewarding municipalities that made progress with the lowestperforming students and penalizing those that did not assess all students. This model of results-based budgeting reinforced system leaders’ priorities.
“You can be nimble and agile. The fact that you can work at a ridiculously higher speed than government normally works makes people believe in you in a completely different way.”
-Sir Jon Coles, Former Director of the London Challenge
Pace reforms to show early traction and build for sustainability. Leaders can consider a balance between setting an ambitious pace for change while also building stamina and investment for the long road to impact. In an attempt to get moving, school systems may launch a flurry of rapid pilots they cannot scale. It’s important to show quick wins and ensure that they create a real impact. This drives buy-in and gives systems the credibility to continue with reforms. When Poland introduced the idea of kindergarten education, some reacted with skepticism; especially in rural communities, there was no precedent for early education. Families saw immediate benefit when students enrolled in the first set of classes; their enthusiasm helped bring local leaders in as partners to continue the expansion. In 2020, 88 percent of Polish children attended kindergarten, versus 30 percent in 2005.163
Successful leaders take a “design for scale” approach, setting up pilots with an eye toward widespread adoption later. In Malawi, education leaders are scaling student use of tablets to improve foundational literacy and numeracy skills in primary school. The tablets selected are solar-powered, available offline, and affordable enough to scale nationwide. Teachers can easily learn to use the tablets, and schools can make effective use of them within weeks of receiving them.
School systems can translate strategies into a road map using an initiative implementation framework.
FRAMEWORK FOR VISUALIZING PROCESS OF AN INITIATIVE LIFECYCLE
Local context
Student and system data
Community sentiment Experience of leaders
Learnings from other systems
Personal beliefs and ideas
OPPORTUNITIES IDENTIFIED
• Prioritize gaps and opportunities
• Evaluate evidence to support initiative
• Estimate impact and feasibility of various ideas
• Plan goals, strategies, milestones, and KPIs
• Prepare systems for data collection and continued monitoring
• Identify needed capacity and plan to create it
• Establish clear roles and responsibilities
INNITIATIVES PLANNED
• Track progress in an organized system and share with leaders
• Ensure readiness to implement in schools
• Pivot when necessary in response to data
PROGRAMS EXECUTED
• Execute all critical milestones
• Communicate regularly across teams in the ministry and out to regional and school leaders
IMPACT REALIZED
• Review final impact (e.g., end-of-year student assessment)
• Compare actual impact to projections
Translate strategies into a concrete road map:
Have we dedicated a finite period of two to three months to planning, after which we can move to implementation?
Have we dedicated time and expertise to set clear road maps, timelines, and owners?
Do we have set processes to review progress, approve initiatives, and troubleshoot? Have we made sure these processes are equitable and inclusive?

Ensure the budget is oriented around priorities:
Have we passed a budget alongside priorities, embedding funding as recurring if possible?
Have we identified budgets with the flexibility to be reallocated?
Do initiatives go through a risk management and mitigation process up front to identify potential challenges and create preliminary plans to address them?
Are our targets informed by unbiased analysis and our equity goals? What is our historical performance against these metrics (both baseline and trends)?
Do we have a process in place to review budgets periodically and consider what to expand, maintain, improve, or sunset?

Pace reforms to show early traction and build for sustainability:
Have we prioritized quick wins in the first six months to build momentum?
Do we have a road map for building on early wins?
Are we allocating time for senior leaders to consider “important but not urgent” priorities for the long run?
Do we have a plan for sequencing changes so as not to overwhelm principals, teachers, and other school staff?
A strong strategy is not enough to create change. Many leaders lack the team structure and talent within their organizations to implement their plan with fidelity. In some cases, leaders need novel organizational structures or staff with new skills to implement changes but lack the authority to restructure their existing teams or the money to hire. Even if they do manage to bring in experts, outsiders may be viewed with suspicion. To overcome these challenges, successful school systems set up the structure they need to deliver impact, find creative ways to build teams with implementation expertise, and provide clear direction to those teams.
Assess delivery capacity for project management expertise. The skills needed to execute the status quo are different from those needed to deliver large-scale improvements. Most school systems are staffed with educational experts who have spent their careers inside the system. This expertise is critical, but it is typically insufficient for a transformation. In addition to great educators, school systems need great managers with expertise in program and project management.
An effective team doesn’t require everyone to have all capabilities. In general, educators can be trained on specialized skills, and functional experts (in functions such as finance, analytics, and project management) can be grounded in educational realities by visiting schools. The best teams include representatives from both groups and foster a healthy respect for one another’s expertise.
Where there are gaps, successful systems hire or build missing capabilities at every level. That could mean redeploying or retraining existing staff or bringing in outside experts to support key activities. In Benin, education leaders set up new agencies with experts from other sectors who were accountable
for specific, measurable goals such as a national data system. In Peru, the ministry remade the top team, bringing in experienced managers from within and outside of government, with a specific goal of improving management and increasing the pace of change.
Set up dedicated delivery structures and accountability. Major change efforts need a dedicated home within the organization to create accountability and maintain momentum.
Multiple structures can support a transformation, including a dedicated transformation office outside of the education ministry (for example, within the prime minister’s office), a dedicated transformation office within the ministry, or a more diffuse model in which transformation work is infused in the day-to-day responsibilities of the ministry’s senior team members. The best-fit model depends on the capacity of the ministry’s leaders, the role they can play in the transformation, the scope of the change effort, and the anticipated timeline for impact.
The transformation of Mississippi’s education system required every member of the leadership team to
take a new approach. Team members aligned the work of their divisions with the department’s six priorities and were held accountable for reporting on their progress toward those goals. This was necessary to drive change through the entire system and to reorient the department’s culture toward one in which every student was expected to meet early literacy goals and supported in doing so. In London in the early 2000s, a new team with direct access to the minister led the London Challenge to support the transformation of the city’s school system; the change effort was focused and intense, requiring the full-time attention of a senior leader. This allowed for rapid decision making directly informed by insights from the ground, and enabled faster deployment of resources than was typical for the government.
But delivery doesn’t end at the central office. Successful transformations require local-enough champions with technical expertise who interface regularly with schools and who have a clear feedback loop to central leaders. This depends on sufficient capacity and accountability in the middle layer and in the schools to own the change and to implement it.
In Punjab, India, starting in 2008, 700 dedicated reading program coordinators were trained on how to use Teaching at the Right Level (TaRL), a program that groups students by skill level rather than by grade. The reading coordinators then spread out across the state to train and support 14,000 teachers on implementing the new approach. These “leaders of practice” had seen the change, served as role models for other teachers, and provided ongoing on-site support.
In Peru, the central leadership team was reconstituted to incorporate the right capacities to drive change. But it was just as important to ensure that school leaders had the right skills to manage and lead. As part of reforms under Jaime Saavedra’s leadership, from 2013 to 2016, the ministry instituted meritocratic selection processes for the country’s 15,000 principals. This was a shift away from the former process, in which local authorities selected school leaders. All incumbent principals were given the opportunity to take an objective test and could remain in their roles if they passed. This left leadership gaps, particularly in rural areas, prompting the Peruvian government to introduce new career paths and training efforts to strengthen the leadership pipeline specifically for rural schools.164
“It was important for me to build a multidisciplinary team able to deliver on the reform program. I ended up changing most of the top 60 positions in the ministry to ensure the right managerial skills and implementation capacity, including attracting people from the Ministry of Finance.”
-Jaime Saavedra, Former Minister of Education of Peru
Establish clear delivery processes, roles, and responsibilities
Strong systems ensure there is a clear structure for making decisions and approving investments at every level of the system. Leaders support rapid implementation with strategic opportunities to step back and assess progress. They assign clear roles to both existing decision makers and transformation team leaders. Existing decision makers—such as ministers, superintendents, school boards, and cabinets—often serve as executive sponsors for change workstreams (such as implementing a new curriculum). On the transformation team, staff have dedicated capacity and clear responsibilities for specific workstreams and initiatives.
Successful teams set clear targets for change, own the execution of those changes, and track progress. Tightly focused teams can accelerate the pace of implementation, quickly surface and communicate about bottlenecks, and create transparency
throughout the organization. They identify the right cadence of meetings to avoid meeting overload but also ensure a fast and steady clip of progress. Meeting time is used well, the right people are in the room to make decisions, and participants are prepared with prereading.
In Malawi, the Ministry of Education created a new team to implement the BEFIT Program and bring tablets to every primary school. The team reports to both the minister of open distance and e-learning and to the minister of basic education to ensure the effort is supported both technologically and academically. The BEFIT team specifically dedicates human resources to device rollout and teacher training, as well as to quality assurance and ongoing research.
Assess delivery capacity for project management expertise:
Do we have dedicated expertise in project and program management, data analytics, and communications? Have we trained our transformation team on these skills?
Have project managers dedicated time and energy to learn from education experts and tailor their approach to fit with the work of schools?
Set up dedicated delivery structures and accountability:
Have we created a delivery team and tasked people specifically with leading the improvement?
Have we separated political and technical leadership so that progress can continue even when political leadership is drawn into fighting fires?
Do we have clear processes to hold the delivery team accountable for outcomes?
Have we thought creatively about other entities that can thoughtfully lead or contribute? Are there private partners who can bring additional capacity and skills to bolster our delivery team?
Establish clear delivery processes, roles and responsibilities:
Are roles and responsibilities clearly defined at every layer of the school system (central office, middle layer, and school)?
Do we have clear protocols for making important decisions? Do we understand each person’s role in the decision-making process?
Are our meetings purposeful and actionable, with tight agendas, appropriate attendees, prereading, and clarity on decisions to be made?
Do we spend 90 percent of our senior leadership meeting time on our highest four to five priorities across the system?
EMERGING IMPROVER
STUDENT POPULATION
12 million
PERFORMANCE

Under apartheid, South Africa had an intentionally unequal education system. With the end of apartheid in 1994, learning outcomes in the early grades began to improve but inequities persisted and progress on international assessments, which primarily focused on older grades, was halting. Schools saw a major influx of students but lacked teacher capacity to support the growing enrollment. The first post-apartheid curriculum, Outcomes Based Education, had significant challenges and was eventually phased out. Public sentiment was that schools could and should be better.

Leaders responded by introducing a new curriculum with workbooks for all primary school students in languages and mathematics and aligned teacher training. There was a focus on equity; per student spending was equalized between White and Black learners and investments were specifically made in geographies with the greatest needs. Between 2006 and 2016, South Africa saw sustained student learning gains, with increases of 6 percent on global HLO scores, though there is still much progress to make in addressing racial inequities and performance remains uneven. (South Africa has seen some declines in overall performance in more recent years, as measured by postpandemic assessments.165)
Starting in 2011, the Department of Education started producing free literacy workbooks in all Indigenous languages (known as “home languages”) for all primary school grades. It was an ambitious project, leading to the production of workbooks in English and ten African languages. More than just a translation, each version was closely tailored to local language and context.166
To achieve this level of customization, the project designed for scale from the beginning. A committee of subject advisers, language experts, senior teachers, and representatives from various provinces signed off on the content. The rollout was a model of effective implementation, and workstreams were tightly coordinated. Because the 2011 launch of the workbooks coincided with curriculum reform, teachers were trained on both the curricula and the workbook content simultaneously.
At the central ministry office, a dedicated delivery team oversaw the entire process, from development to printing and delivery of the workbooks. To ensure smooth distribution and adoption, a network of 40,000 adult-literacy teachers provided information and assistance during the book delivery phase.
Copies were initially distributed to 6.5 million students across 20,000 schools.167 Though there were some initial challenges in delivery to remote rural schools, these issues have been addressed – thanks in part to social pressure and litigation—and for the last decade, the books have been delivered to all schools on time.168 From 2011 to 2015, more than 150 million books were delivered to schools.169 Teachers in 80 percent of schools reported using the workbooks in their classrooms.170 Over the same time period, South Africa saw improvement in literacy; from 2007 to 2013, South Africa’s reading performance on SACMEQ improved by 43 points.171
SUSTAINED & OUTSIZED IMPROVER
STUDENT POPULATION
6 million
PERFORMANCE FROM 2005 TO 2020
“Poor”
EDUCATION SPENDING PER STUDENT
$1-2K
In the early 2000s, Peru had a history of educational underperformance with a teacher hiring and promotion process that privileged seniority over skill, poor implementation of curriculum reforms, infrastructure gaps in most schools, and weak coordination between the Ministry of Education and subnational governments.
Major improvements began in 2012 with the passage of the Teacher Reform Law, and subsequent critical changes took place during the tenure of Minister of Education Jaime Saavedra (2013–16), including a focus on talent, curriculum, and performance management.
By 2016, Peru had achieved the fourth largest improvementin PISA scores globally and the largest improvement in Latin America. Performance continued to improve through the 2018 PISA administration.172

In 2013, Peru placed at the bottom of the 65 countries that participate in PISA. Saavedra had just stepped into office, and the ministry used the dismal results to put education at the top of the national agenda. Peru already had a national education plan, produced in a two-year process with 25 commissions and 100 meetings. The ministry simplified the plan to just four pillars—teachers, learning, infrastructure, and management—and then built a team to deliver on the reforms.
People with diverse backgrounds were recruited in the ministry, with both education and public management experience, emphasizing hires who understood how government operates. Then the team moved quickly to show progress. Saavedra shared in conversation with McKinsey that he taught his team members to operate as if they only had six months to deliver results, recognizing the uncertainties of working inside a political system.
For example, when the ministry wanted to shift from half-day secondary school to full day, some education experts recommended starting with a small pilot of 50 schools, then doing a three-year impact evaluation before scaling up a tested model. But more momentum was needed to make progress irreversible. The ministry launched the shift in 1,000 schools, knowing that such a scale would build demand among parents to continue a rapid expansion and allow the ministry to reach all 8,000 secondary schools in Peru.
SUBNATIONAL IMPROVER
STUDENT POPULATION
<500K174
PERFORMANCE FROM 2005 TO 2020
“ Good ”
EDUCATION SPENDING PER STUDENT
$9-10K175
Read McKinsey’s interview with Carey Wright to learn more about Mississippi’s story.176
In the early 2000s, Mississippi had the lowest reading scores in the United States, the result of poorly trained teachers, limited accountability, a lackluster rollout of curricula aligned to the Common Core State Standards, and what many leaders described as a culture of low expectations, particularly connected to the state’s history with race and slavery. Many leaders accepted the overall low performance and the yawning racial achievement gap as part of their reality.
Over two decades, Mississippi saw a tremendous transformation, becoming one of the fastest-improving states in both literacy and math, according to the National Assessment of Education Progress (NAEP), and making significant progress in closing the racial achievement gap. In 2000, Mississippi lagged behind the NAEP average in fourth-grade reading by nearly ten points. By 2019, Mississippi had made sufficient gains to fully catch up to the national average. Throughout the COVID-19 pandemic, Mississippi sustained its gains better than most parts of the country; performance on fourth grade reading in particular stayed relatively steady. Many of the critical changes that contributed to this growth took place during the tenure of State Superintendent Carey Wright (2013–22).

When Wright became state superintendent in 2013, the state legislature had just passed legislation that focused on early literacy and enshrined the “science of reading” into state instructional requirements. But the education department itself lacked the structure and expertise to drive implementation and support schools in making the necessary changes.
To build implementation expertise, Wright brought in senior leaders, many of whom had experience with school transformation in other geographies (Wright herself was a veteran of successful efforts in Washington, DC, having served as chief academic officer and deputy chief of teaching and learning from 2009 to 2013). The ministry set six clear priorities and selected proven strategies for literacy interventions, which allowed the team to move quickly to implementation.
More capacity was needed at all levels of the system to effectively drive change. To build the right skills within schools, the department provided training for all K–3 teachers, deployed qualified literacy coaches directly to districts, and overhauled support and training for teachers and curriculum specialists. The state led the change effort directly and retained complete control over coach deployment, which made coaching more effective and eliminated variability between districts. When they could not find sufficiently strong coaches, leaders decided to hire fewer coaches rather than compromise on quality. This model represented a stark difference from the way state leaders in the United States approach school improvement work, typically leaving far more discretion to districts to operationalize with state resources.
This strategy allowed the department to demonstrate quick wins. By targeting the weakest student learning areas with proven interventions, the state was able to show results almost immediately. This helped encourage the legislature to keep investing in coaching because they saw a clear return on investment.
SUBNATIONAL IMPROVER
STUDENT POPULATION
1.4 million 177
PERFORMANCE FROM 2005 TO 2020 M oved from “Good” to “Great”
EDUCATION SPENDING
In the early 2000s, schools in London had among the lowest achievement scores in England, with particularly low performance in Inner London.179
Major improvement efforts at the national level were already under way, including curricular reform, teacher training, and new assessments. In 2002, the London Challenge launched with a three-part strategy: to radically change the educational experience for students in five underperforming, low-income boroughs of London; to transform the 50 most struggling schools in the city; and to create a supportive context to help all schools in London improve.
During the London Challenge, London schools improved faster than the national average. From 2000 to 2015, London schools saw a 62 percent improvement on national test scores.180

To implement the London Challenge, leaders set up a dedicated delivery team. The team, helmed by Sir Jon Coles, had a direct line to ministry leadership. This gave team members access to request and receive new resources, such as housing stipends for teachers, and a bully pulpit to push school leaders to act. But it also gave them the flexibility and nimbleness to work directly with schools and deploy resources based on need.
To operationalize the plank of the strategy focused on individual schools, the London Challenge team included coaches—known as the London Challenge advisers—who were assigned to work directly with underperforming schools, a break from the traditional hands-off government approach. These team members, who were experienced educators, were in schools every day, providing tailored coaching and support to school leaders. Leaders wanted school communities to feel engaged in the transformation, not as though the transformation was just something happening to them.
In addition, the advisers could command resources rapidly; they would identify needs on the ground, communicate with the central team, and deploy new resources in a matter of days. These resources included anything from additional curriculum training to facilities personnel who could address building issues. The London Challenge team operated at a speed that was unprecedented.
In each borough targeted for improvement, the London Challenge team met with local education leaders to establish and launch a vision for improvement. Each road map was developed jointly with local input on schedule, milestones, and activities. To sustain change once it was started, the London Challenge team set clear measures of success and met twice a year with the director of education in each of London’s boroughs to align on progress. These meetings were deeply focused on operations—not politics or blame—and the input from local leaders led to shifts in approach.

To continue driving impact, system leaders benefit from a clear understanding of whether their reforms are working. This requires rigorously measuring what matters and making that data transparent. While continuing to roll out what works, the most effective leaders also create space for innovation and measure the impact of new ideas rigorously to build an evidence base for the next generation.

Measure student outcomes and make them transparent
Roll out what works, but create space for innovation
Punjab (India) | Estonia | Malawi

Too many leaders are flying blind without real-time data to inform actions. They may face concerns about excessive testing or teaching to the test, and collecting clean data may be difficult. When data does exist, it may live in disconnected systems with individual owners, or reporting may happen
piecemeal and obscure important nuances. Successful school leaders collect the right information, build robust data systems, identify trends, make information transparent, and use data to build a shared culture of continuous improvement.
Measure what matters, beyond standardized test results.
Data is the crux of effective decision making, but systems need to have access to the right information, analyzed in ways that drive action and impact. Without an organizing framework for the data being collected, the information may sit unused or—worse—be misinterpreted and deployed improperly.
Effective school systems measure data on both system performance and system health. System performance reflects eventual student outcomes. These can include achievement metrics (cognitive skill development that can be measured through assessments of proficiency against preset, defined standards), attainment metrics (whether students meet certain educational milestones, measured through access, progress, and graduation rates), and experience metrics (how students and teachers experience the system, including measures of well-being). Any performance measures can be evaluated with respect to quality, cost, and equity.
Data on “system performance” is critical, but it can take years before system leaders see results in performance data. Data on “system health” can provide a leading indicator of progress against their priorities. These metrics will need to be tailored by school system
but can include data on the teacher and principal pipeline (for example, credentialing, teacher/student ratios, and retention), on learning materials and how they are being used (for example, adoption and teacher use of rigorous learning materials aligned to standards, equitable access to advanced courses), on whole-child supports available to students (such as school meals and availability of mental health counseling), and on supporting infrastructure and resources (for example, technology availability and use and spend per student). If systems are implementing evidence-based practices, positive trends in system health indicators can help leaders predict whether they might later see improvements in system performance. A mismatch between leading and lagging indicators may suggest a breakdown in the implementation process.
Collecting data on student outcomes can quickly turn political. Standardized assessments are a lightning rod for many systems, and some systems have rolled them back. But a lack of consistent student performance data can hamper leaders’ ability to measure progress and improve instruction accordingly. Input measures alone are not enough; the answer to imperfect assessments is not “no assessments” but “better assessments.” For example, Norway successfully reframed
the issue by administering assessments at the start of the new school year rather than the end of the prior one, turning them into a formative tool to shape instruction for the year. This increased teacher support. Other school systems are beginning to broaden the student performance data they measure beyond standardized math, language, and science assessments to include other measures of student outcomes important to system goals.
Data from multiple sources then needs to be integrated and displayed in a way that facilitates use by decision makers at the classroom, school, district, and system levels. As education data is collected and stored, system leaders increasingly need to consider the privacy and security of this information, given the rise of cybersecurity attacks on school systems.
In Estonia, student outcome data is linked with broader social data; the government maintains a centralized data system for all public services with a unique ID for every citizen. Families can look at their own children’s achievement data within this broader context. Schoollevel data is made transparent to the public and used regularly by the ministry to support policy making.
In the early 2000s, Washington, D.C. Public Schools had 29 data systems, and none of them communicated with one another. Payroll and staffing systems were so outdated that leaders half-joked they were paying people who were dead.181 Traditional HR systems were disconnected from those measuring teacher attendance, professional development, and classroom outcomes, meaning there was no obvious way to measure educator effectiveness or the strength of interventions. One of the district’s first steps was to dismantle the old systems and create a better infrastructure for reporting and linking data. This provided the necessary foundational information to drive the district’s overall talent priority.
Create public transparency to build momentum. Making important information public builds trust among parents and students and enables them to make informed choices (to the extent allowable in their system). Transparent information also puts pressure on poorly performing parts of the system, highlights bright spots, and creates momentum for continued work when there is clear impact. However, data can be divisive when it’s perceived as punitive for teachers and principals or stigmatizing for schools or students. To start, system leaders can celebrate instances of progress, which can in turn encourage broader sharing. They can use newly public data to build demand for continued progress among decision makers such as boards and donors. Successful systems report data on improvement, not just absolute performance, with the context of student demographics to track progress against inequities.
Driven by the goal of creating an improvementoriented culture, leaders in Poland shifted away from school evaluations that assigned a single letter grade to each school to a system with publicly available descriptive assessments of performance along multiple dimensions.182 In Sierra Leone, student learning outcomes data had historically been seen and analyzed by a single consultant. Over the past five years, leaders have automated that analysis and publicized key data points. As a result, the public could see student pass rates in their home district for the first time. In locations with low pass rates, citizens and educators organized for change. This led to policy shifts, which in turn drove increases in student pass rates (see sidebar “How Sierra Leone is using data to spur system improvement”).
“I made sure that we had data to inform everything we did. From day one, all policies had to be grounded in data and evidence.”
-David Moinina Sengeh, Minister of Basic and Senior Secondary Education and Chief Innovation Officer for
Sierra Leone
Segment schools for accountability and support. Successful systems don’t just collect data—they use it to drive action. A first step is creating simple dashboards to make it easy to visualize progress against both inputs (such as the rollout of new phonics materials to K–2 teachers) and outcomes (resulting K–2 student scores on literacy). But a dashboard cannot change student outcomes by itself. More important than dashboards are the conversations about the data that lead to changed outcomes.
Data-driven education systems use data at the classroom, school, and system level to continuously improve student outcomes. At the system level, leaders can use data to tailor reforms by geography and school. Within systems, schools are often in very different places on their journeys and need different supports. For example, high-performing schools may be ready for more autonomy, whereas low-performing schools may need more support. Just as system leaders need to consider where their overall system is on the trajectory from poor to great, they also need to consider where each school is in its journey within the system. They can then use that data to tailor interventions accordingly. Segmentation can consider both student growth (not just performance) and student demographics.
In South Australia, a state in south-central Australia, leaders applied data to develop a more differentiated model of support for the 500 schools in their district. Each school leader received access to a dashboard of performance metrics that provided insights on where the school was on its improvement journey. State leaders used this data to plot schools along a “maturity model” to understand how schools compared with one another, examining both absolute performance and growth. They made a conscious decision not to publish these results to avoid a perception of ranking or competition but used the data internally to define tailored interventions. Schools received differentiated support from the central office based on their data. This was a departure from the prior support model, which leaders characterized as being designed around the median.183
In London, leaders rolled out changes tailored to three tiers of schools. They designed a set of interventions for all schools in the five most underperforming regions, another set of interventions for the 50 lowest-performing schools, and a broad set of strategies to improve schools citywide. Schools in the first two categories were identified through a
mix of academic and demographic data sources and received the most intensive interventions.
Use data to continuously adapt interventions on rapid cycles.
Effective leaders establish a regular cadence of data reviews at every level, focusing conversations on problem-solving rather than assigning blame. In successful systems, these conversations happen at all levels: at the central office to adapt overall system strategy, in the middle layer to drive support and accountability, at the school level to influence instruction and practice, and in classrooms to drive personalization.
An e-learning provider working in partnership with national governments across Africa uses data feedback loops to continuously tailor support, particularly for the lowest-performing schools. The provider uses data from teacher tablets to track and adjust everything from teacher attendance to lesson comprehension. Basic data on teacher attendance helps governments strengthen their personnel management and create accountability. More advanced data, such as information on how much learning material teachers can deliver in a set time period, informs instructional design, teacher professional development, and assessments. Constant data collection allows the team to iterate on shorter time cycles than would otherwise be typical for education policy making.184
Working with research partners at the University of Chicago, school leaders in Chicago uncovered and analyzed data to identify indicators of freshman performance (such as number of credits earned and semester grades) that are more predictive of high school graduation than any other factor, including demographics and past academic performance combined. This Freshman OnTrack metric enabled the district to create new biweekly reports for every high school so that students who were veering off track could be identified and targeted for early intervention.185 Working with external partners, the district provided training to help schools maximize the impact of the data. The district also made the data transparently available to enable external partners to engage effectively, measure their own impact, and improve offerings accordingly.186 The on-track metric was one of several critical factors that raised high school graduation rates from 62.2 percent in 2008 to 84.0 percent in 2022.187
In Los Angeles, the school district worked with Harvard University’s Public Education Leadership Project to deploy coaches who worked with educators on interpreting data, adapting their practices, and driving toward continuous improvement. Teachers saw results right away, which motivated them to collect data more frequently and engage in faster improvement cycles. Leaders started by seeking volunteers to engage in this kind of coaching, but once the initial participants saw results, others
wanted to try it. The practices expanded, ultimately reaching more than 3,000 educators.
At the classroom level, teachers can use formative assessment tools to continually check for understanding and comprehension, to adapt their instruction based on gaps they observe across the classroom, and to personalize instruction and interventions for individual students based on their results.

Measure student outcomes that matter:
Have we identified clear metrics we can track to assess system performance and system health?
Have we identified a comprehensive set of student outcome metrics that map to our learning objectives?
Are we tracking not just absolute performance but also cost-effectiveness, changes over time
Create public transparency to build momentum:
Is data publicly available? Where appropriate, is it being used to celebrate progress and build stakeholder buy-in?
(value-added), and differences by subgroup (equity)?
Is data for each metric currently being tracked and uploaded to a central system or dashboard that is easily accessible to transformation stakeholders? Have we taken the necessary steps to ensure this data is safe and secure?

Have we thought about the potential unintended consequences of data use and planned accordingly?
Segment schools for accountability and support:
Can data be segmented by regions, schools, and student demographics to ensure targets are appropriate and strong performance is not masking major inequities?
Have we considered differentiated goals, autonomies, and supports for each of the different segments?
Use data to continually adapt interventions on rapid cycles:
Is data being used at the system level to adapt policy?
Is data being used at the regional level to inform support and monitoring?
Is data being used at the school level to influence instruction and practice?
Is data being used in the classroom to differentiate instruction?
After a decade of civil war and multiple health crises, Sierra Leone’s government is rebuilding basic education from the ground up. Just 8 percent of third-grade students can read a simple text,188 and adult literacy rates lag behind the rest of sub-Saharan Africa.189 Historically, Sierra Leone’s data collection was highly manual. This meant that ministry leaders had a limited picture of what was happening on the ground; for example, there was no central count of the number of classrooms or teachers in the country.
Since 2018, the ministry has prioritized a massive effort to digitize the data it could already access. It subsequently partnered with a diverse stakeholder group including government leaders, private-sector partners, multilaterals, and other local organizations to integrate other data that would be critical to establishing a baseline in the new Education Management Information System. System leaders launched a national early-grade reading and math assessment in 2021, with plans to repeat the assessment in 2023.190 The system has put measures in place to continuously improve data collection. All primary schools were given tablets to help them monitor teacher and student attendance and school performance; schools get financial rewards when teachers are in attendance, school starts on time, and data is maintained.
This newly digitized data became the reference point for all decisions, and the ministry created new protocols to review data, set goals, and target interventions. Leaders could disaggregate results by school and geography and tailor support. This allowed them to understand new layers of nuance and consider where to build new classrooms, where to invest in new tools and people, and how to prioritize limited resources. A clearer picture of need has also enabled leaders to successfully make the case to increase domestic spending on education.191

This information also shaped policies on “radical inclusion”—efforts to dramatically boost enrollment for marginalized populations, including girls, students with disabilities, and children from remote rural regions. The Ebola epidemic exacerbated Sierra Leone’s rates of teen pregnancy, the result of a reported increase in sexual violence and exploitation.192 The data showed troubling dropout rates among female students, at least in part the result of a rule that banned girls from attending school while visibly pregnant.193 With new data in hand pointing to the discrepancies, the ministry reversed the policy in 2020; girls can now maintain their school enrollment during pregnancy 194 and receive supports in school as new parents.195 The data revealed more nuanced trends; for example, in Port Loko, a populous district in the northern part of the country, teen pregnancy rates were among the highest in the country and the gender gap in enrollment was among the largest in the country. Based on this data, government leaders opened a specialized secondary school in the district targeted just for girls.196
These data-driven changes are still new and data on student outcome improvements is still limited, but the country has made clear progress on some of the leading indicators: school enrollment increased from 2.0 million students in 2018 to 3.1 million students in 2021, with the greatest increases among the poorest households.197
How do school systems square the need to roll out what works with the need to prepare students for the future of work and citizenship in a rapidly changing world? On the one hand, leaders need to start by building from the current evidence base. If they place too much energy on innovation, they risk being distracted by silver bullets and losing focus on fundamentals. On the other hand, if they sideline innovation they can get stuck solving yesterday’s problems. Successful school systems walk a middle road on innovation: they build on the best of what already works, continuously improve on what doesn’t, and measure the results to strengthen the current evidence base.
Create organizational space for innovation. Government bureaucracies can easily default to the status quo. When the work is not going well, leaders may default to what they perceive to be tried-and-true strategies. When systems are performing well, leaders may settle into the new rhythm and focus on maintenance. Innovation is critical at all levels of performance, but systems need to intentionally plan for it and create the institutional space to focus on it. Systems that continue improving share a common sentiment that the current state is not good enough and the system needs to keep getting better.
Government can consciously build structures to test and evaluate new innovations. In Peru, the MineduLAB—an innovation lab housed in the Ministry of Education and supported by external funding and research partners—works within government to identify and diagnose challenges, brings in outside partners to test new solutions and evaluate their impact, and uses the output of those evaluations to decide what to scale. Projects driven by the lab have been deployed at scale to address challenges including school leader
compliance with administrative duties and secondary school dropouts.198 Other Latin American countries have launched similar innovation labs based on the MineduLAB model.
Lower-capacity systems can harness external partners to drive innovation. Across the globe, there are many promising examples of private-sector experiments in education that were later adopted by government. Government leaders could consider what kind of policy environment will be most conducive to innovation and whether they need to build in-house capabilities alongside private partners to ensure longer-term sustainability for new practices (see sidebar “What about the private sector?”).
Singapore has demonstrated that even the most successful school systems need to keep innovating, particularly as students’ needs change. This has led to new experiments and investments in student mental health supports, social-emotional learning, and 21st century skills to complement the system’s already-strong approach to math and literacy instruction. For example, as a strategy to address
student stress, Singapore recently shifted its secondary school structure from streaming or tracking students across all subjects to subjectspecific attainment groupings. Leaders felt comfortable making this shift because students had reached such strong outcome measures overall. Before rolling this out at scale, system leaders piloted the reduction of streaming. They collected input from teachers, students, and administrators; tracked academic and emotional outcomes of students; and partnered with a research organization. The findings from the pilots helped leaders refine the practices and then roll them out at scale. Singapore is also experimenting with generative AI, piloting automated marketing systems, adaptive learning programs, and an AI-enabled learning companion for students.199 Singapore stands out among top-PISA scoring systems because it continues to grow while others have stagnated.200
Consider all types of innovation. Not all innovation is created equal. Thriving organizations use a mix of sustaining and disruptive innovation. “Sustaining innovation” improves existing processes or products, such as tweaking a teacher training or improving a curriculum. “Disruptive innovation” challenges established norms, such as redefining the role of a teacher or the purpose of school.
Talk of innovation tends to focus on disruptive innovations that upend an entire field, such as ChatGPT. But even the most innovative private-sector organizations spend a majority of their energy on sustaining innovation and just a small portion of their energy on disruption.201 In general, government systems have even less bandwidth and lower risk tolerance for experiments. Disruptive innovation can feel particularly high stakes in education because
individual students’ experiences and learning outcomes are on the line. Most education systems will focus on sustaining innovation.
Under the right conditions—when a system is either starting from the ground up or working on a discrete program that sits outside of the regular school day— there might be opportunities for government to engage in more significant experiments. In developing systems where the alternative to a new approach to schooling might be no schooling at all, disruptive innovation may be more welcome. The innovation imperative may also vary by level of education. At the primary level, there are tried-and-true strategies to improve literacy; systems may need to innovate on delivery. By comparison, there is less evidence on the best strategies in secondary education; more disruptive innovation may be needed on strategies for high school redesign.
Collaborating with the private and nonprofit sectors may be the best approach to disruptive innovation. For example, NewGlobe, an e-learning provider, developed a program that used tablets to connect lower-skill teachers with a structured curriculum— a disruptive innovation. But it took a partnership with the Nigerian government to bring those tablets to scale, reaching every public school in the populous Edo State.
The International Baccalaureate (IB) program, which operates in schools globally, views itself as a model that school systems can learn from. Without being constrained by the political issues facing many national education systems, IB has been freer to experiment with new ways of implementing its curriculum and approach.
“When we talk about professional learning, we can never say we have arrived. … The moment we say we have arrived, that will cause our downfall.”
-Yen Ching Chua-Lim, Deputy Director-General of Education (Professional Development), Singapore.
Measure innovation to improve the evidence base and identify what to scale. Where the evidence is still moderate or emerging, innovation can help improve the evidence base itself before school systems make big bets. Leaders can consider not just how to improve the interventions being used or which interventions are being used, but also how those innovations are delivered at scale. Both areas can be equally valuable.
Some areas need better interventions. For example, teacher quality is critical to student learning, but many existing methods of professional development fail to deliver large-scale impact. Similarly, student mindsets are important, but current interventions to shift them have limited impact. Innovation is needed on the interventions themselves.
In other areas, high-impact interventions already exist but are difficult to implement well. For example, high-dosage tutoring has a significant impact, but it’s also very expensive. There is a need for more scalable models of tutoring. Similarly, structured pedagogy is proven, but it relies on upgrading human capital at scale. Innovation is needed on the delivery.
However leaders focus their experimentation, it is critical to measure the impact of pilots to build the evidence base of the future. Measurement was a major missed opportunity during the COVID-19 school closures. Despite all the rapid-fire innovation during lockdowns, such as new approaches to virtual instruction, remote professional development, and asynchronous learning, little data exists on what worked.
Evidence can also help leaders make the challenging but important decision to sunset innovations that are not leading to impact. Effective systems set a timeline and goals up front and measure progress against them. Short cycles of innovation with robust data collection can be a useful strategy to start building the case for new approaches.
Collecting evidence on small-scale experiments can also help build the case for scale. For example, Sierra Leone used radio capabilities to broadcast school lessons during Ebola lockdowns. When COVID-19 arrived, education leaders already knew this approach was effective and doubled down on this strategy as a way to sustain learning during lockdowns.202 This example stands in contrast to many cautionary tales about technology use in which systems rapidly scale an intervention, such as giving every student a device, before developing a more robust, impact-based approach to using the tool.
But evidence changes with scale. For example, there is evidence that very low student-to-teacher ratios can have an impact on learning outcomes when done well in a few classrooms. But across an entire system, it may be challenging to recruit, train, and retain enough high-quality teachers to manage a much larger number of classes. Because teacher quality is an even more important variable than class size, reducing the student-to-teacher ratio may lead to lower student outcomes when rolled out at scale.203
Systems that use data well to drive scaling efforts start by gathering evidence that a program or policy is effective enough to begin growing its impact. They then measure effectiveness and continue innovating at each stage of implementation as the work scales.
Create organizational space for innovation:
Who within our organization can focus on identifying and testing new innovations?
What outside organizations can we partner with on more experimental practices?
Consider all types of innovation:
Have we experimented with how we implement the strategies that we know already work to improve delivery (for example, to reduce cost or to make implementation easier for teachers, principals, or government officials)?
What are the one or two big new ideas we want to explore this year?
Can we pilot new approaches in areas where we struggle most to move the needle?
In what part of our system do we require more of an end-to-end rethinking of approach (that is, a disruptive innovation)?
Measure innovation to improve the evidence base:
How are we collecting data from our pilot projects? How does that data link into the policy making and budget cycles?
Have we set a deadline to assess the impact of our pilot programs and make a decision about whether to continue or sunset the program?
Have we considered what might change about the program’s efficacy as it grows? What processes can we put into place to monitor impact and adjust course as needed?
Public–private partnerships in education have the potential to make service delivery more efficient, open new financing opportunities, bring new expertise into the sector, and create productive competition. 204 Across the globe, private schools and privately operated public schools play an increasingly large role. The share of students in private schools in many low- and middle-income countries is now substantial; across South Asia and urban pockets of sub-Saharan Africa, nearly 40 percent of students attend private primary schools. 205 In India, private schools serve nearly half of all students. 206
Across low- and high-income countries, there is evidence that privately run schools can advance the work of public education systems and stimulate improvement in traditional public schools. 207 Some private and privately operated schools are particularly effective at serving student populations that have been historically marginalized. 208 Not all private schools are created equal, though. Shifting a large portion of the student population to nongovernmental schools without proper guardrails can lead to a lack of visibility and a divergence of quality and consistency, furthering systemic inequities.
Under the right conditions, the private sector can create healthy competition, bring promising ideas to scale, and create feedback loops that inform government practice. As system leaders consider how to improve outcomes for all students, strengthening partnerships with privately operated public schools and private schools can be a lever for growth.
• Privately operated public schools. Governments can create policy and funding structures that allow for innovation beyond traditional school models. With the right conditions, private-sector players can create pilots that become a proving ground for innovation and create pathways to scale. As part of the London Challenge, leaders in London invited private operators to open academies that could experiment in ways that traditional schools could not. The learning from these small-scale experiments can then inform broader policy making. There are examples of privately run schools across the globe with strong student outcome measures, including U.S. charter school networks. 209
System leaders can learn from the practices of schools that are demonstrating results. On

balance, there is evidence that school choice can be beneficial both to students who opt for charter schools and to those who stay in traditional public schools, largely because competition drives school improvement.
210 In the United States, these effects have been measured primarily in high-poverty urban areas.
211
• Private schools: While traditional private schools operate largely outside of the public system, there are opportunities for oversight and for partnership. Particularly in systems where private education is the norm, government eaders may have a responsibility to consider the practices of all schools, not just those they directly operate, to ensure a quality education for all future citizens. In Lagos State, Nigeria, where 60 to 70 percent of students or more are in private school,212 the government is focusing on streamlining processes and structures to encourage increased transparency between the private and public systems. One commonset of standards now applies to both public and private schools.
In addition to the role that the private sector can play in operating schools, school systems may be able to work with private partners to deliver a range of services within public schools. As described elsewhere in this report, private partners can play a particularly valuable role in driving innovation.
As public school system leaders consider the role of the private sector, it is important to do so through a consistent lens of what drives student outcomes. Research shows that simply shifting to a different governance model will not move outcomes. 213 All schools can be good schools by rooting their approach in the robust evidence base of what makes for good classroom instruction.
SUBNATIONAL IMPROVER
STUDENT POPULATION
3 million 214
PERFORMANCE FROM 2005 TO 2020
Moved from “Below Poor” to “Poor”
EDUCATION SPENDING PER STUDENT
<$1K 215

Punjab, India is a subnational system, but with more than 19,000 schools under the oversight of the Punjab School Education Board, it rivals the size of many national systems.
In 2008, Punjab registered extremely low scores on the Annual Status of Education Report (ASER), a national survey that assesses reading comprehension and numeracy. Enrollment rates in primary school were high, but the district had significant learning gaps, and students with vastly different learning levels were in the same classroom. State leaders were motivated to make change and set clear goals to grow outcomes, particularly in foundational literacy and numeracy.
Throughout the process, the Education Board has turned to partners with tested and proven strategies to inform their strategies, help build capacity, and drive toward improved outcomes. The interventions they have put into place are rooted in evidence and driven by data that informs the ongoing improvement work.
From 2009 to 2019, Punjab saw a 19.5 percent improvement on India’s National Achievement Survey (NAS). In 2021, Punjab ranked higher than any other state on NAS.216 Over the same time period, Punjab also registered meaningful gains on ASER, demonstrating more significant growth in math and literacy skills from 2009 to 2019 than most other states in India.217

The Punjab government has enlisted key partners to drive change and has implemented new approaches that have led to an increased use of data at the system, school, and classroom level.
In 2008, the Punjab government partnered with the Pratham Education Foundation to support a focus on foundational skills. Pratham had developed Teaching at the Right Level (TaRL), an internationally recognized program to reduce literacy gaps in primary school. TaRL uses data from a simple oral assessment to group students by learning level, rather than by grade, and to track their progress. Data from the assessments is used at a system level to assess overall need and target interventions, at a school level to adjust student groupings, and at a classroom level to tailor instruction.
The TaRL model had already been tested when Punjab approached Pratham with the opportunity to take it to scale. Government leadership worked with Pratham to train 750 teachers in the TaRL approach, including coaching them on how to collect and use assessment data. Those 750 teachers in turn supported 14,000 schools on an ongoing basis for three years. Teachers and schools received ongoing support for behavior change.
In 2019, Punjab partnered with Mantra4Change, an organization supporting educational-change efforts across five states in India, to specifically focus on growing the capacity of educators and school leaders and to engage families more effectively in their children’s education. Despite having considerable experience, Mantra4Change did not present Punjab with an off-the-shelf plan; organization leaders worked with state leadership to develop a model that fit Punjab’s needs.
Punjab leadership and Mantra4Change have taken a data-driven approach to doing work at scale. Previously, more than 1,000 coaches from the state’s Education Board completed multiple school visits every week, and the information from these thousands of visits were being tracked on paper. Now, the output from those visits is being digitized and analyzed so that leaders at all levels of the system can understand trends and pivot policy based on data.
SUSTAINED & OUTSIZED IMPROVER
STUDENT POPULATION
<200,000
PERFORMANCE FROM 2005 TO 2020
Moved from “Good” to “Great”
EDUCATION SPENDING PER STUDENT
$9-10K

Since gaining independence from the Soviet Union, Estonia has focused on growing its economy, with a specific emphasis on technology and the skills of its workforce. Since the 1990s, Estonia has introduced a new national curriculum, professionalized its teaching workforce, and expanded early childhood education.
Estonia invested in technology through a national digital transformation known as the Tiger Leap. Starting as early as 2000, every school in Estonia received computers, software, and access to broadband. To encourage adoption, the ministry trained 4,000 teachers through a 40hour course and established a school in which teachers with computer skills could instruct other teachers.218 Leaders tied the technology adoption directly to student learning goals and larger societal aims.
Over the past two decades, Estonia has emerged as one of the most consistent high performers on PISA, and its economy and technology sector have seen tremendous growth. The country has nearly tripled its GDP since 2000 and has the largest number of tech start-ups per capita in Europe. 219
Estonia employs data at every level of its education system. This is enabled by the system’s robust technology infrastructure but also reflects a strong culture around collecting, analyzing, and publishing a rich set of metrics and then using that information to drive policy and practice.
At the classroom level, teachers use diagnostic tools to understand where students are in their learning. Teachers have access to several tools, developed in partnership with research universities, and have a fair amount of discretion about how and when to use these assessments.
At the school level, data from formative assessments and more formal summative exams feeds into platforms used by school leaders to assess overall progress toward goals. Over time, Estonia has used this data to introduce more personalized and competency-based instruction.
All data collected by the education system, including student achievement metrics, is maintained in the Estonian Education Information System, the central government system. Every citizen has a unique digital identifier across government data systems, meaning education data can easily be linked to other information. This allows education leaders to track student progress systematically from primary through tertiary education and look more holistically and longitudinally at outcomes.220Schools are required by law to maintain data in this centralized system, which reinforces its accuracy. 221
Anonymized data is also made transparent to the public through a platform known as the Educational Eye. This enables families to compare schools and see how their own child’s data compares with general trends.
Such data integration can guide the choices that families and educators make to support student learning, even outside the classroom. For example, most students in Estonia attend “hobby schools” outside of their core instructional day. 222 Leaders have started to look at data from these extracurricular activities to better understand their impact on learning outcomes.
SUBNATIONAL IMPROVER
STUDENT POPULATION
5.5 million
PERFORMANCE FROM 2005 TO 2020
“ Below Poor”
EDUCATION SPENDING PER STUDENT
<$1K
After Malawi introduced free primary education in the early 1990s, primary school enrollment increased from 1.6 million students to more than 3.0 million in the first year of the policy alone. 223 It has continued to grow ever since. However, schools have struggled to deliver quality education to this growing population because of insufficient school infrastructure, a shortage of trained teachers, and a lack of learning materials.
In the past two decades, Malawi has piloted improvements in partnership with nongovernmental groups, particularly on literacy and numeracy in primary schools. This effort has already yielded improvements in student outcomes—Malawi’s performance on the Southern and Eastern Africa Consortium for Monitoring Educational Quality (SACMEQ) improved in both reading and math from 2000 to 2013. Malawi is now experimenting with more disruptive innovation to further improve learning outcomes.
While Malawi has made steady progress in student achievement over the past decade, change has been incremental and growth is limited by the confluence of rapidly growing enrollment, severe teacher shortages, and a lack of funding. To change this narrative, leaders are exploring scalable, evidence-based approaches that will allow the system to leapfrog past its current challenges and move toward a radically different model for learning. Since 2013, the Malawi government has been using small-scale pilots coupled with rigorous research, including randomized control trials, to test new strategies for moving the needle on foundational learning. Two years ago, one pilot demonstrated significant enough results for the ministry to consider how to scale it up nationally with help from other partners.
Under the program, known as Building Education Foundations through Innovation & Technology (BEFIT), students will receive access to tablets with child-directed adaptive lessons that are tied to the national curriculum and intended as a supplement to teacher instruction. The program is relatively low cost (less than $7 per child per year) and relies on durable tablets that can be run without power or internet.224 Over six years, the ministry will ensure that every public school in Malawi has tablets to enhance student learning, that teachers have been trained to implement these tools effectively, and that schools have the infrastructure to support use. In parallel, focused efforts to make the curriculum stronger and more challenging are ongoing through the National Reading Program and the National Numeracy Program, which have both received international funding and support.
The government recognizes that scaling up can be very different from piloting. With its external partners, ministry leaders are conducting ongoing implementation research to inform the design and rollout of the BEFIT program. Nongovernmental actors are helping the ministry implement and have temporarily embedded of the capacity, tools, and processes that are needed to deliver better outcomes while government scales up its own capacity. Ministry leaders have made it clear that the effort must be wholly owned by the government to be successful.
In conversation with McKinsey, BEFIT leaders used the analogy of a spaceship to describe their partnerships. Their core nongovernmental partners—Imagine Worldwide, VSO, OneBillion, and others—are like gas cylinders. Once implementation is far enough along, the gas cylinder will drop off and the main ship—the government—will continue, bolstered by new capacity that has been built within the ministry. For example, when the first 40,000 tablets arrived in Malawi, the Imagine Worldwide team activated and configured them, helped deliver them to schools, and connected them to technology so teachers and students could begin using them and data could begin feeding into the centralized dashboards. A team from the ministry partnered with Imagine Worldwide at each step of the process. When the second 40,000 tablets arrived, national ministry staff led the configuration and delivery and district-level staff managed setup within schools.
Ministry leaders hope to use the BEFIT program as a model for doing development work and strengthening systems. Rather than work in parallel with a broken system, BEFIT is meant to change the way the system works.

This work will ultimately make the education system in Malawi more “innovation ready” by bringing solar power to schools, training teachers to understand how technology can support their work, and building the government’s capacity to implement new interventions. This will create the foundation for Malawi to continue testing and scaling to make meaningful improvements.
The stories told by continuously improving school systems demonstrate that all education leaders around the world have the tools to spark and sustain changes in student learning. Their journeys suggest that there is no silver bullet or magical answer. It is tempting to point to one or two strategies as the path forward. But change is not simple, and it does not take place overnight. Education reform is not sexy. It is dogged, hard work done consistently over multiple years based on a clear set of goals.
The systems and leaders studied in this report succeeded because they focused on the “what” and the “how” together. They rooted their work in evidence on how to improve instruction and approached their change journey from whatever their starting place was. They built strong and durable coalitions through clear priorities, stakeholder engagement, and consistent leadership. They turned their strategies into plans and structured their teams to implement those plans. Finally, they measured progress in ways that continued to inform policy improvements and the day-to-day decisions of educators. These levers—anchor in the evidence, build a durable coalition for change, create delivery capacity, and drive and adapt with data—may not seem transformative on their own. But together, they allow systems to grow and ultimately to transform.
Our analysis suggests that if all systems could improve at the rate of top improvers, an additional 350 million children could rise out of learning poverty by 2050 (Exhibit 16). Without these changes, the future is not as bright. At the historical rate of improvement, the number of students in learning poverty in 2050 will be more than 700 million.
What would the world look like if all school systems could use these strategies and improve at the rate of the top-performing systems? Imagine the potential of hundreds of millions more children equipped to read, write, and think critically each year. Unlocking their potential is a key ingredient in addressing the major challenges facing the world, including income inequality and climate change. The stakes are high, but so is the opportunity. And students are counting on us.
EXHIBIT 20
If all systems could improve at the rate of top improvers, ~350M children could be lifted from learning poverty by 2050.
NUMBER OF STUDENTS IN LEARNING POVERTY 1 UNDER DIFFERENT GO-FORWARD SCENARIOS M of children ages 5-16 2
PRE-COVID LEARNING POVERTY
SCENARIO 1: AT-SCALE TOP PERFORMERS 4 823 1022 728 381 2019-2022 2050
347m ADDITIONAL CHILDREN LIFTED OUT OF LEARNING POVERTY
SCENARIO 1: AT-SCALE TOP PERFORMERS (pop.>3m) 248
STATUS QUO: CURRENT TRAJECTORY 2019
1 Learning poverty refers to children not in school or who complete primary school without learning to read and understand a simple sentence text.
2 The number of children in learning poverty is very sensitive to the population used. We chose 5-16 to reflect the number of students who were in learning poverty when completed primary (age 10-14) as well as those currently in primary school who are not on track to gain basic literacy skills.
3 Learning poverty projections through COVID (2019-2022) are based on regional growth rates estimated by the World Bank. Where there was not regional growth rate data (North America), we used the World Bank’s learning poverty projections for high income countries.
4 Our top performers scenario included the top at-scale (3M+ population) systems for each performance band (below poor, poor, fair, good, great) in terms of international or regional assessment growth. More information can be found in the methodological appendix.
This report uses a mixed-methods approach to understand what enables school systems to perform at a high level, continue improving, and implement reforms at scale. To inform this report, we engaged with a wide range of sources:
• Academic research review. We reviewed more than 400 publications across 20 years, including perspectives on a diverse range of education system transformations. This takes a global and economically inclusive approach to PK–12 transformation. These research publications are focused on impact studies with experimental or quasi-experimental methodological approaches that can conclusively speak to the impact of approaches that have been implemented in school systems. See the bibliography for a list of some of the resources we reviewed.
• Expert interviews. We had conversations with more than 200 system leaders, experts, donors, philanthropists, and researchers. The information gained from these interviews helped substantiate our system selection methodology, validate our working hypotheses, and learn about system reform efforts. For each system we profiled in detail, we spoke to multiple experts, including current and former government leaders, researchers, donors, and partner organizations.
• Multiple quantitative analyses. We conducted a global survey and performed multiple quantitative analyses, including benchmarking systems based on Harmonized Learning Outcomes and government spending on education, analysis on global learning poverty and how it might grow or contract under different scenarios, analysis on the evidence from various education interventions to assess their
impact and feasibility, and analysis of Stanford University’s World Education Reform Database.
• Case studies of school system improvement. Based on research, interviews, and analysis, we identified and built case studies of 14 systems that had made and sustained improvements over a decade or more, documenting their reform efforts and the factors that system leaders credit for sustainable improvement. We employed a mix of quantitative and qualitative data to identify these systems, which represent low-, medium- and highincome countries and regions across the globe.
Our quantitative methods are described in more detail below.
McKinsey’s Global Education Survey was conducted between September and December of 2023 and gathered a total of 422 responses from 27 countries across Africa, Asia and Pacific, Europe, Latin America, the Middle East, and North America (Exhibit A). Survey respondents included senior leaders (such as minister of education, department leader, and superintendent) and senior members of executive teams (including minister, adviser, department leader, chief academic officer, and chief operating officer). The education systems represented in the survey varied in size. This survey quantitatively probed themes that arose in prior qualitative interviews about education system goals and desired outcomes, priority intervention areas, implementation practices used, and challenges faced.
Harmonized Learning Outcomes (HLO) scores are standardized, comparable achievement scores for K–12 students computed by the World Bank. They are based on international assessments—the Programme for International Student Assessment (PISA), the Trends in International Mathematics and Science Study (TIMSS), and the Progress in International Reading Literacy Study (PIRLS)—and on regional assessments: the Southern and Eastern Africa Consortium for Monitoring Educational Quality (SACMEQ), the Programme for the Analysis of Education Systems (PASEC), the Latin American Laboratory for the Assessment of the Quality of Education (LLECE), and the Early Grade Reading Assessment (EGRA). Data for 11 countries is imputed based on national assessments.
For the HLO scores used in this report, we relied on public data released by the World Bank.225 Except where otherwise noted, we used HLO scores from 2020, the year of the newest available data at the time of analysis.
We defined five performance bands based on HLO scores:
• Below poor: HLO score below 375
• Poor: HLO score greater than or equal to 375, less than 425
• Fair: HLO score greater than or equal to 425, less than 475
• Good: HLO score greater than or equal to 475, less than 525
• Great: HLO score greater than or equal to 525
This is an update from the performance bands used in McKinsey’s prior education reports, notably our 2010 report on the world’s most improved school systems.226 We made three major changes to the performance bands:
• We eliminated the historical “excellent” band because we saw limited differentiation between “great” and “excellent” systems. Additionally, very few systems score this high; only Hong Kong and Singapore might have crossed the threshold from “great” to “excellent.”
• We introduced the “below poor” band for this report to capture nuances among systems at the lower end of performance, which were less of a focus in prior reports. Systems categorized as “below poor” are more likely to have limited physical infrastructure in schools (for example, lacking electricity and connectivity) and much more constrained teacher capacity (such as classrooms with 50 to 100 students). This category also includes systems facing broader societal challenges that affect education, such as major disease epidemics or global conflict.
• As a consequence of the first two changes, we changed the score cutoffs slightly and extended each of the “poor,” “fair,” and “good” bands to include a 50-point range based on feedback from experts.
We also analyzed the per-student spend in each country, adjusted for purchasing-power parity, to better understand patterns across each band of performance (Exhibit B). To ensure that government spending data was comparable across the countries analyzed, we used internationally comparable data sources where possible: wherever possible, we used UNESCO data; for countries not listed in the UNESCO data, we referenced first data from the World Bank, and if data was unavailable, then OECD.227 Most data (more than 80 percent) is from 2017–20. Where data was scarce, data from as early as 2014 was used and adjusted for inflation. For countries with no internationally comparable data available from 2014–20, we used data from government websites.
For visual clarity, the chart in our report excludes countries spending less than $3,000 per student with K–12 age populations below five million, unless they have the highest or lowest HLO score in their spending group. Student population data is based on reported data from the UNESCO Institute for Statistics (UIS).
levels of government spend.
2 To ensure government spend was comparable across the countries analyzed, internationally comparable data sources were utilized in the following order: UNESCO, World Bank, OECD. Most data (>80%) is from 2017-2020. Where data was scarce, data from as early as 2014 was used and adjusted for inflation. For countries with no internationally comparable data available from 2014-2020, a GDP per capita model or government websites were employed. Systems are organized in this chart into bands, such that a system in the $2-4K band has spend greater than $2K and less than or equal to $4K.
scores are standardized, comparable achievement scores for K-12 students. They are based on the international assessment PISA, TIMSS, and PIRLS, along with the regional assessments SACMEQ, PASEC, LLECE, and EGRA. Eleven countries are imputed by World Bank using the GAML method which relies on national assessments. Countries spending less than $3k per student with K-12 age populations less than 5m are excluded from the chart, unless they have the highest or lowest HLO score in their spending group. Systems are sorted into bands based on their HLO scores such that a score less than or equal to 375 places a system as below poor, a score greater than 375 and less than or equal to 425 places a system as fair, and so on.
HLO
Learning poverty is defined as the percentage of students who cannot read or understand a basic text by the age of ten. This statistic is helpful for understanding an education system for three reasons: (1) basic reading comprehension is universally understood, (2) lack of a basic reading level indicates a general lack in foundational learning, and (3) reading ability is a strong predictor for future success.228
Learning poverty includes two parts: learning deprivation and school deprivation. Learning deprivation is the share of students who have not reached a minimum reading proficiency level, and school deprivation is the share of students who are out of school. The equation for calculating learning poverty (LP) is as follows:
LP=(learning deprivation%*(1-school deprivation %))+(school deprivation %)
To understand what would happen if all countries improved at the rate of top improvers, we forecast learning poverty rates at a country level under a status quo scenario and a more optimistic “top improvers scenario” with the following assumptions:
• Age band. Although learning poverty refers to a student’s reading ability at the age of ten, it is often applied to larger age ranges to get a better sense of how many children face similar academic challenges. UNESCO and the World Bank use varying age ranges with learning poverty, although the consensus is that using the age of ten and the age ranges of five to 16, ten to 14, and nine and up is appropriate in different circumstances. We used the age range of five to 16 and applied population data for each country beginning in the year 2019. We then used the World Bank’s population projections of this age range in each country for 2030, 2040, and 2050.229
• Learning poverty baseline data (pre-pandemic). In its most recent report, the World Bank published 2019 data on learning poverty for 111 countries.230 To fill in the gaps for countries that lack data on learning poverty, we applied a weighted average of region and income groups, using regional classifications (East Asia and Pacific, Europe and Central Asia, Latin America, the Middle East and North Africa, North America, South Asia, and sub-Saharan
Africa) and income brackets (low income, lower-middle income, upper-middle income, and high income) as defined by the World Bank.
• Student performance baseline data (pre-pandemic). We used 2020 HLO scores to determine countries’ most recent performance band because these provide standardized, comparable achievement scores for K–12 students across the broadest set of countries.
• Post-pandemic learning poverty estimation. Because we used pre-pandemic data on learning poverty, we applied estimated regional learning poverty increases from 2019 to 2022 from the World Bank.231 The only region without regional projection data was North America. For North America, we applied the World Bank’s high-income projection.232
• Student performance forecast. To forecast changes in student performance going forward, we used historical changes in the underlying international assessments (PISA, TIMSS, and PIRLS), as well as in regional assessments (SACMEQ, PASEC, and LLECE), because these provide the best available like-for-like longitudinal time-series data.233 We examined two scenarios:
Status quo: continuing the current trajectory for improvements in student learning outcomes, applying the weighted averages of international or regional assessment improvements of all countries with data in each band over the past decade of assessment results
Optimistic: assuming all countries improve at the rate of current top improvers, using the top five at-scale (with more than three million students) improvers on international and regional assessments within each HLO band (below poor, poor, fair, good, and great)234
• The relationship between learning poverty and student performance. To translate student performance forecasts into changes in learning poverty over time, we first calculated the correlation between learning poverty and learning outcomes as measured by HLO scores. Our resulting coefficient was –0.453, meaning that a one-point increase in HLO scores is correlated with a –0.453 drop in learning poverty percentage. (The resulting r2 value
was 0.74.) We used learning outcome changes in each band to forecast learning poverty percentages in 2030, 2040, and 2050. Given that our coefficient represents change in learning poverty for a ten-year time span and that our baseline year was 2022, we multiplied our coefficient by 0.8 to get to 2030. Once we had the percentages of learning poverty, we multiplied them by the country population projections to determine the number of students projected to be in learning poverty. Additionally, as HLO scores increased, systems would sometimes jump into a new performance band. When this happened, we applied the new weighted average learning outcome improvement. Throughout our learning poverty analysis, we applied a ceiling of 98.5 percent, which represented the highest rate of 2019 learning poverty (Zambia), and a floor of 2.2 percent, the lowest rate of 2019 learning poverty (Kazakhstan).
This analysis is more of a hypothetical thought exercise than a precise forecast. It is unlikely that all systems will improve their learning outcomes at the rate of the top systems globally. Our intention with the optimistic scenario is to provide an upper bound of the number of students who could be relieved from learning poverty using current best practices. Any optimistic scenario with this kind of outcome would require significant change in school systems around the globe.
We looked at hundreds of academic studies and manuscripts to understand what works to improve student learning in the highest-performing systems. We prioritized large-scale, experimental, and quasi-experimental studies, alongside large meta-analyses, especially those that summarized findings from causal impact evaluations. As described in the body of the report, we screened interventions using three lenses:
• Impact on student outcomes. Systems may define student success broadly, including achievement, well-being, and educational attainment. For comparability and consistency in analysis, we used standard deviations of improvement on relevant assessments as the main impact measure. To generate estimates of the impact of each indicator, standardized-effect size ranges were established from academic manuscripts and peer-reviewed papers found in major academic journals and
field-leading working paper repositories—for example, the National Bureau of Economic Research (NBER) and EdWorkingPapers. Indicators were then ranked from largest to smallest impact, and cutoffs were established empirically based on clusters of effect size estimates.
• Strength of the existing evidence base. Some interventions have been well studied in multiple systems with strong experimental and quasi-experimental designs to estimate their impact on student outcomes. Other interventions don’t lend themselves well to experimental design or have yet to have rigorous, large-scale program evaluations completed. We gave each intervention a categorical score based on how many large-scale experimental (or quasi-experimental) studies existed and how broadly the intervention had been evaluated across different contexts in those studies.
• Feasibility of implementation. Here we considered three factors that influence the feasibility of rolling out an intervention at scale—the cost of the intervention, the political will required for adoption, and the complexity of its implementation. Interventions in the “moderate” feasibility category tend to look similar to existing practices (such as hiring teachers earlier in their training period or summer learning programs), while interventions at the “most challenging” end of the feasibility spectrum (for example, reducing class size or desegregating schools) require large expenditures or significant political shifts to accomplish.
Given outstanding questions and sometimes unequal evidence bases for indicators, we consulted multiple experts to review and debate the impact and feasibility scores.
Interventions were drawn from the World Education Reform Database (WERD), a collection of more than 10,000 policy changes enacted across 183 countries that was compiled by teams across Stanford and the University of Toronto. The semantic data (that is, the name and description of each reform) was analyzed using natural language processing to categorize reforms from the past 20 years into seven categories based on which element of system excellence they primarily targeted: student outcomes, academics, human capital, performance management, whole-child supports, enabling factors, and school readiness.
Countries were categorized as top improvers if they were in the top five countries within their performance band by absolute improvement in the past ten years on international student assessments (PISA, TIMSS, or PIRLS) or on regional student assessments (LLECE, PASEC, or SACMEQ). All other countries included in the WERD database are considered in the “other countries” category.
There are limitations to this taxonomy and analysis because the categories are broad and not entirely mutually exclusive. However, the analysis provides the directional input that there is limited variation in what top performers and other countries target in their interventions, particularly in systems performing at the poor and fair levels.
In selecting systems to study more deeply, we examined international assessments administered over a multiyear period. The assessments used to measure sustained student performance included the following:
• Trends in International Mathematics and Science Study (TIMSS): 2011–16
• Programme for International Student Assessment (PISA): 2009–18 (excludes 2022 results to avoid focus on potential impacts of the pandemic on student outcomes)
• Progress in International Reading Literacy Study (PIRLS): 2006–16 (excludes 2021 results to avoid focus on potential impacts of the pandemic on student outcomes)
We also used national and state or regional assessments for school systems that do not participate in international assessments, including the following:
• The Southern and Eastern Africa Consortium for Monitoring Educational Quality (SACMEQ): 2007–13 (Botswana, Kenya, Lesotho, Malawi, Mauritius, Mozambique, Namibia, Seychelles, South Africa, Eswatini, Uganda, Zambia, Tanzania, Zanzibar, Zimbabwe)
• Programme for the Analysis of Education Systems (PASEC): 2014–19 (Benin, Burkina Faso, Burundi, Cameroon, Chad, Côte d’Ivoire, Dominican Republic, Gabon, Guinea, Madagascar, Niger, Republic of Congo, Senegal, Togo)
• Latin American Laboratory for the Assessment of the Quality of Education (LLECE): 2013–19 (Argentina, Brazil, Chile, Colombia, Costa Rica, Cuba, Dominican Republic, Ecuador, Guatemala, Honduras, Mexico, Nicaragua, Panama, Peru, Paraguay, El Salvador, Uruguay)
• National Assessment of Educational Progress (NAEP) for US school systems: 2009–19 (excludes post-2019 results to avoid focus on potential impacts of the pandemic on student outcomes)
National school systems demonstrating improvement were grouped into two categories:
1. Sustained and outsize improvers. These are nations demonstrating significant performance improvements on international assessments over the past decade (Exhibit C). They achieved gains equivalent to ten or more PISA points, sustained over the past decade (intermediate tests throughout the decade indicate a consistent, upward trajectory of scores), and corroborated in at least two of the following international assessments subtests: PIRLS, PISA, TIMSS; math, reading, science.
Sustained and outsized: 23 national systems are beating odds.
2. Emerging improvers. These are nations that demonstrate significant performance improvements but do not yet have a decade of longitudinal data on sustained improvement (Exhibit D). These countries have achieved gains that are equivalent to ten or more PISA points, consistent across two or more of the international (TIMSS, PIRLS, PISA: math, reading science) or regional assessment subtests (SACMEQ, PASEC, LLECE; math, reading, science). These countries are not in the “sustained and outsized” category because they have noncurrent test scores or because scores declined in an intermediate testing period during the past decade (for example, 2009–18 PISA shows improvement, but there was a decline in the 2015–18 PISA testing cycle).
In some countries, education is governed much more at the regional level than the national level, which led us to identify a third category of systems to profile:
3. Subnational improvers. These are regional systems demonstrating significant performance improvements on national or local assessments over the past decade (Exhibit E). These subnational regions have achieved significant gains representing the largest improvement of subnational regions in the country, sustained over the past decade, and documented on national or local assessments (such as the United States’ NAEP, India’s National Achievement Survey, or England’s GSCE).
The 14 systems we ultimately selected to profile in this report map to the three categories above. Selected school systems meet three objectives: 1) they have achieved sustained and meaningful improvement in student outcomes as measured by international benchmark assessments, while not outspending their peers, 2) they represent a range of starting places in student performance, and 3) they are a diverse-enough sample to identify what was unique versus what was universal, thereby ensuring our insights have wide-ranging relevance. We also
considered population size: across all categories, we focused our research on countries with student populations above three million, except if a system was in the top five improved performers within its performance journey, or if a subnational system was representative of broader national gains.
There are lessons to learn from many other systems around the globe, and these 14 systems are far from perfect. Many are still behind in absolute performance, and each faces its own challenges. But we believe that collectively, they have many lessons to teach the world about implementing at scale.
We also looked at national, regional, and private-school systems demonstrating bright spots in either actions or outcomes, without the data of the other categories. These are systems that have had success in their inputs (activities) or their outcomes (for example, on local assessments, in enrollment or attainment, over smaller subregional populations) but have not yet met the criteria of the other categories. Many of these systems were identified in interviews by experts. Examples include Vietnam, which has outperformed in PISA but has insufficient data, and Sierra Leone, which has improved enrollment but does not yet have consistent, sustained growth in student performance measures. While we ultimately chose not to elevate any of these examples to the list of systems profiled in depth, we have included lessons from their experiences elsewhere in the report.
Last, we considered previous high performers: systems that have historically scored well on international assessments but have experienced stagnation (Exhibit F) or decline (Exhibit G) in recent years. While these systems are not profiled in detail in the report, we completed interviews and collected data on their stories to inform our perspective on implementation challenges. Insights from those discussions are incorporated throughout the report.
D Emerging: 21 national systems are showing meaningful gains.
1 Consistent improvement defined as 10-point improvement over the past decade on at least 2 of 7 regional assessments (SACMEQ reading, SACMEQ math, PASEC reading, PASEC math, LLECE reading, LLECE math, LLECE science); 2 Performance band based on 2020 HLO score 3 Points change for consistent improvers is as close to the past decade as possible: SACMEQ 2007-2013, PASEC 2014-2019, LLECE 2013-2019 4 LLECE countries: Ecuador, Dominican Rep., Paraguay; SACMEQ countries: Eswatini, Kenya, Mauritius, Namibia, Seychelles, Botswana, Lesotho, Malawi, Mozambique, Uganda, Zambia; PASEC countries: Benin, Cameroon, Chad, Congo, Rep., Cote d’Ivoire, Niger, Senegal
Source: OECD PISA, TIMSS, PIRLS, SACMEQ, PASEC, LLECE, Harmonized Test Scores, World Bank
EXHIBIT E In certain large, decentralized systems, subnational analysis may be more relevant than national.
BRAZIL Sistema Nacional de Avaliação da Educação Básica (SAEB) improvements, %, 2009-19 Top 5 of 28 regions
Annual Status of Education Report (ASER) improvements in math and literacy, %, 2009-19 Top 5 of 21 states
1 National Achievement Survey (NAS) improvements, %, 2009-19 Top 5 of 35 states and territories
INDIA
UNITED STATES National Assessment of Educational Progress (NAEP) score improvements, %, 2009-19 Top 5 of 53 jurisdictions 2
ENGLAND Share of General Certi cate of Secondary Education (GSCE) grades above 7 (A), %, 2011-21 Top 5 of 10 regions
2 Includes all 50 states plus Washington, DC, Puerto Rico, and schools managed by the Department of Defense
1 To most accurately understand trends over time in India, two assessment tools were examined in this analysis
Source: Indian Ministry of Education, Pratham Education Foundation, Brazilian Ministry of Education, Ofqual, NCES
Stagnated: 33 national systems have remained stagnant.
IN 33 COUNTRIES, SCORES HAVE REMAINED STAGNANT1 OVER THE PAST DECADE, WITH NO SIGNIFICANT IMPROVEMENT NOR DROP ACROSS INTERNATIONAL ASSESSMENTS
1 Countries in which scores have not increased by 10 points or more nor decreased by 10 points or more in 2 or more of the 6 international assessments and their international test average is less than 10 points
2 Performance band based on 2020 HLO score
3 Points change is as close to the past decade as possible: PISA 2009-2018, PIRLS 20062016, TIMSS 2011-2019 |
Source: OECD PISA, TIMSS, PIRLS, Harmonized Test Scores, World Bank
G Declining: For every improver, there is a country that has slipped.
1 Countries who have slipped are defined as those in which scores have decreased by 10 points or more in 2 or more of the 6 international assessments 2 Performance band based on 2020 HLO score 3 Points change is as close to the past decade as possible: PISA 2009-2018, PIRLS 2006-2016, TIMSS 2011-2019 Source: OECD
Abram, Zara, “Boys are facing key challenges in school. Inside the effort to support their success,” Monitor on Psychology, April 2023, Volume 54, Number 3.
Abrams, Lisa, Lisa Jackson, and Divya Varier, “Unpacking instructional alignment: The influence of teachers’ use of assessment data on instruction,” Perspectives in Education, 2016, Volume 34, Number 4.
Adelman, Melissa Ann and Renata Freitas Lemos, Managing for learning: Measuring and strengthening education management in Latin America and the Caribbean, World Bank, January 1, 2021.
Alagui, Abdelhakim and Fouad Chafiqi, “Educational reform in Morocco and overhaul of curricula in scientific disciplines,” Carrefours de l’éducation, 2011, Volume S1, Number 3.
Allensworth, Elaine M. and John Q. Easton, “The on-track indicator as a predictor of high school graduation,” Consortium on Chicago School Research, June 2005.
Ander, Roseanna, Jonathan Guryan, and Jens Ludwig, Improving academic outcomes for disadvantaged students: Scaling up individualized tutorials, Hamilton Project, March 28, 2016.
Angrist, Joshua D., Parag A. Pathak, and Christopher R. Walters, “Explaining charter school effectiveness,” American Economic Journal: Applied Economics, 2013, Volume 5, Number 4.
Angrist, Noam et al., “Measuring human capital using global learning data,” Nature, March 2021, Number 592.
Angrist, Noam et al., How to improve education outcomes most efficiently? A comparison of 150 interventions using the new learning-adjusted years of schooling metric, World Bank working paper, Policy Research Working Paper, number 9450, October 2020.
APM Reports, “Sold a story: How teaching kids to read went so wrong,” accessed January 4, 2024.
Asadullah, M. Niaz, Liyanage Devangi H. Perera, and Saizi Xiao, “Vietnam’s extraordinary performance in the PISA assessment: A cultural explanation of an education paradox,” Journal of Policy Modeling, 2020, Volume 42, Number 5.
Audisio, Ariana, et al., Does teacher professional development improve student learning? Evidence from leading educators’ teacher fellowship model, Annenberg Institute at Brown University working paper, EdWorkingPaper series, number 22-597, April 2023.
Auguste, Bryon, Paul Kihn, and Matt Miller, Closing the talent gap: Attracting and retaining top-third graduates to careers in teaching: An international and market research-based perspective, McKinsey, September 2010.
Bacalhau, Priscilla, Diana Goldemberg, and Ildo José Lautharte Junior, “Can peer mentoring coupled with incentives affect school turnaround? Evidence from Ceará state in Brazil,” World Bank, June 30, 2020.
Bachman, Heather J., Nermeen E. El Nokali, and Elizabeth Votruba-Drzal, “Parent involvement and children’s academic and social development in elementary school,” Child Development, 2010, Volume 81, Number 3.
Baker, Scott et al., Teaching academic content and literacy to English learners in elementary and middle school, a joint report from the National Center for Education Evaluation and Regional Assistance (NCEE), Institute of Education Sciences, and US Department of Education, April 2014.
Barber, Michael and Mona Mourshed, How the world’s best performing school systems come out on the top, McKinsey, September 1, 2007.
Barber, Michael, Chinezi Chijioke, and Mona Mourshed, How the world’s most improved school systems keep getting better, McKinsey, November 1, 2010.
Basford, Tessa and Bill Schaninger, “The four building blocks of change,” McKinsey Quarterly, April 11, 2016.
Beavis, Adrian et al., “Formative evaluation of workbooks and textbooks South Africa,” Australian Council for Educational Research, February 2013.
Bedasso, Biniam, Ministerial turnover and performance of World Bank education projects, Center for Global Development Working Paper, number 641, April 2023.
Black, Paul and Dylan Wiliam, “Inside the black box: Raising standards through classroom assessment,” Phi Delta Kappan, September 2010, Volume 92, Number 1. Bokhove, Christian and Daniel Muijs, Metacognition and self-regulation: Evidence review, Education Endowment Foundation, May 2020.
Briggs, Joseph et al., The potentially large effects of artificial intelligence on economic growth (Briggs/ Kodnani), Goldman Sachs, March 26, 2023.
Brown, Peter C., Mark A. McDaniel, and Henry L. Roediger III, Make it Stick: The Science of Successful Learning, Cambridge, MA: Belknap Press, 2014.
Bryant, Jake, Avery Cambridge, Emma Dorn, and Jimmy Sarakatsannis, “What it would take for US schools to fully recover from COVID-19,” McKinsey, August 7, 2023.
Bryant, Jake, Emma Dorn, Leah Pollack, and Jimmy Sarakatsannis, “COVID-19 learning delay and recovery: Where do US states stand?”, McKinsey, January 11, 2023.
Bryant, Jake, Felipe Child, Emma Dorn, and Stephen Hall, “New global data reveal education technology’s impact on learning,” McKinsey, June 12, 2020.
Burgess, Simon, Understanding the success of London’s schools, Center for Market and Public Organisation working paper, number 14/333, November 12, 2014.
Burns, Jason, Samantha Cullum, and Erica Harbatkin, “The role of school climate in school turnaround,” Education Policy Innovation Collaborative, July 2023.
Cadena, Andres, Li-Kai Chen, Felipe Child, and Emma Dorn, “Bringing major improvements to education in Colombia,” McKinsey, May 29, 2019.
Calleja, Tomás, Sofía Collado, Gloria Macías, and Cristina San José, Educación en España: Motivos para la esperanza, McKinsey, January 6, 2012.
Carnelli, Marta, Pragya Dewan, and Janice Kaday Williams, “Addressing the learning crisis in Sierra Leone with the Learning Passport,” UNICEF, May 30, 2023.
Carroll, Kathleen, Barbara Davidson, and Michael J. Petrilli, Follow the Science to School: Evidence-based practices for Elementary Education, Melton, United Kingdom: John Catt Educational, 2022.
Carver-Thomas, Desiree, “Diversifying the teaching profession: How to recruit and retain teachers of color,” Learning Policy Institute, April 19, 2018.
Catalina, Miranda et al., “Socioeconomic status, parental involvement and implications for subjective well-being during the global pandemic of COVID-19,” Frontiers in Education, November 2021, Volume 6.
Central Square Foundation, State of the sector report: Private schools in India, November 24, 2022.
Chen, Li-Kai, Emma Dorn, and Paul Rutten. “The leerKRACHT foundation: Continuous improvement in Dutch education,” McKinsey, February 27, 2020.
Chen, Li-Kai, Emma Dorn, and Tore Vamraak, “Education reform in Norway: Looking beyond politics to bring sustained change,” McKinsey, June 21, 2019.
Chen, Li-Kai, Felipe Child, Emma Dorn, and Raimundo Morales, “An interview with former Peruvian Minister of Education Jaime Saavedra,” McKinsey, September 26, 2019.
Chiefs for Change, Day in the life of (DILO) resources, July 2020.
Chisaka, Tichafara and Kate Richards, “Supporting girls’ education in Sierra Leone through inclusive data systems,” Global Partnership for Sustainable Development Data, July 19, 2021.
Christodoulu, Daisy, Teachers vs. Tech? The case for an ed tech revolution, Oxford, United Kingdom: Oxford University Press, 2020.
Chtatou, Mohamed, “A Moroccan success story tainted with some shortcomings,” paper commissioned for Education for All 2000-2015: Achievements and challenges, EFA Global Monitoring Report, 2015.
Cilliers, Jacobus et al., Improving early grade reading in South Africa, 3ie, March 2019.
Coenen, Johan et al., “Teacher characteristics and their effects on student test scores: A systematic review.” Journal of Economics Surveys, May 2017, Volume 32, Number 3.
Cook-Harvey, Channa and Linda Darling-Hammond, Educating the whole child: Improving school climate to support student success, Learning Policy Institute, September 2018.
Cooper, Katherine R., and Michelle Shumate, Networks for Social Impact, Oxford, United Kingdom: Oxford University Press, 2022.
Cotter, Kerry et al. (eds), TIMSS 2015 Encyclopedia: Education policy and curriculum in mathematics and science, Boston College, TIMSS & PIRLS International Study Center, 2016.
Cowan, Nelson, “Working memory underpins cognitive development, learning, and education,” Education Psychology Review, June 2014, Volume 26, Number 2.
Crato, Nuno, Improving a Country’s Education: PISA 2018 Results in 10 Countries, New York, NY: Springer, 2021.
Croft, Andrew et al., Job-embedded professional development: What it is, who is responsible, and how to get it done well, National Comprehensive Center for Teacher Quality, April 2010.
Crouch, Luis, Systems implications for core instructional support lessons from Sobral (Brazil), Puebla (Mexico), and Kenya, RISE Insights, July 8, 2020.
Cruz, Louisee and Andre Loureir, Achieving world-class education in adverse socioeconomic conditions: The case of Sobral in Brazil, World Bank, June 2020.
Cruz, Louisee et al., The state of Ceará in Brazil is a role model for reducing learning poverty, World Bank, June 2020.
Darling-Hammond, Linda, Maria E. Hyler, and Madelyn Gardner, “Effective teacher professional development,” Learning Policy Institute, June 2017.
Das, Jishnu et al., “Forum: Why and how the public vs. private schooling debate needs to change,” RISE, March 21, 2023.
de Oliveira, Victor Hugo, Ildo Lautharte, and André Loureiro, Incentives for mayors to improve learning: Evidence from state reforms in Ceará, Brazil, World Bank, January 2021.
De Jong, Marc, Laura Furstenthal, and Erik Roth, “What is innovation?,” McKinsey, August 17, 2022.
De Witte, Kristof, et al., Financing Quality Education For All: The Funding Methods of Compulsory and Special Needs Education, Leuven, Belgium: Leuven University Press, 2019.
Dickinson, David K. and Susan B. Neuman (eds), Handbook for research in early literacy, New York, NY: Guilford Press, 2003.
Dixon, Pauline and Steve Humble, School Choice Around the World … and the Lessons We Can Learn, London, England: Institute of Economic Affairs, 2019.
Dogan, Selcuk, Jennifer Mesa, and Rose Pringle, “The impacts of professional learning communities on science teachers’ knowledge, practice and student learning: A review,” Professional Development in Education, 2016, Volume 42, Number 4.
Dondi, Marco, Julia Klier, Frédéric Panier, and Jörg Schubert, “Defining the skills citizens will need in the future world of work,” McKinsey, June 25, 2021.
Dorn, Emma, “Behind the scenes of Mississippi’s school turnaround with Carey Wright,” McKinsey, August 3, 2023.
Dorn, Emma, “Lessons in leadership: Transforming struggling US K–12 schools,” McKinsey, March 28, 2023.
Dorn, Emma, Bryan Hancock, Jimmy Sarakatsannis, and Ellen Viruleg, “COVID-19 and education: An emerging K-shaped recovery,” McKinsey, December 14, 2021.
Dorn, Emma, Bryan Hancock, Jimmy Sarakatsannis, and Ellen Viruleg, “COVID-19 and learning loss— disparities grow and students need help,” McKinsey, December 8, 2020.
Dorn, Emma, Marc Krawitz, and Mona Mourshed, “How to improve student educational outcomes: New insights from data analytics,” McKinsey, September 22, 2017.
Egalite, Anna J., Brian Kisida, and Marcus A. Winters, “Representation in the classroom: The effect of ownrace teachers on student achievement,” Economics of Education Review, 2015, Volume 45.
Elwick, Alex and Tony McAleavy, School improvement in London: A global perspective, Education Development Trust, 2016.
Emig, Carol and Kristin Anderson Moore, “Integrated student supports: A summary of the evidence base for policymakers,” Child Trends, February 2014.
Epstein, Joyce L. and Steven B. Sheldon, “Involvement counts: Family and community partnerships and mathematics achievement,” The Journal of Educational Research, 2015, Volume 98, Number 4.
Evans, David K. and Andre Loureiro, “Getting education right: State and municipal success in reform for universal literacy in Brazil,” World Bank, January 1, 2020.
Eyles, Andrew, Stephen Machin, and Sandra McNally, “Unexpected school reform: Academisation of primary schools in England,” Journal of Public Economies, November 2017, Volume 155.
Farmer, Joanna and Ben Jensen, School turnaround in Shanghai: The empowered-management program approach to improving school performance, Center for American Progress, May 2013.
Figlio, David N., Cassandra M.D. Hart, and Krzysztof Karbownik, Competitive effects of charter schools, Institute of Labor Economics, July 2021.
Fullan, Michael, “The return of large-scale reform,” Journal of Educational Change, 2000, Volume 1.
Ganimian, Alejandro J., Karthik Muralidharan, and Abhijeet Singh, “Disrupting education? Experimental evidence on technology-aided instruction in India,” American Economic Review, April 2019, Volume 109, Number 4.
Gershenson, Seth et al., The long-run impacts of same-race teachers, Institute of Labor Economics, March 2017.
Gilraine, Michael Uros Petronijevic and John D. Singleton, “Horizontal differentiation and the policy effect of charter schools,” American Economic Journal: Economic Policy, August 2021, Volume 12, Number 3.
Gorard, Stephen and Siddiqui, Nadia, “How trajectories of disadvantage help explain school attainment,” SAGE Open, January 2019, Volume 9, Number 1.
Govender, Radhamoney and Anna J. Hugo, “An analysis of the results of literacy assessments conducted in South African primary schools,” South African Journal of Childhood Education, July 2020, Volume 10, Number 1.
Grassick, Laura and Martin Wedell, International Perspectives on Teachers Living with Curriculum Change, London, United Kingdom: Palgrave Macmillan, 2018.
Grawe, Nathan D., Demographics and the Demand for Higher Education, Baltimore, MD: Johns Hopkins University Press, 2018.
Greenberg, Mark T., “Evidence for social and emotional learning in schools,” Learning Policy Institute, March 6, 2023.
Grissom, Jason A., Anna J. Egalite, and Constance A. Lindsay, How principals affect students and schools: A systematic synthesis of two decades of research, The Wallace Foundation, February 2021.
Hanushek, Eric A., “Improving student achievement: Is reducing class size the answer?,” Stanford University, June 1998.
Hanushek, Eric, Marc Piopiunik, and Simon Wiederhold, “The value of smarter teachers: International evidence on teacher cognitive skills and student performance,” The Journal of Human Resources, March 2018.
Härmä, Joanna, “Private responses to state failure: the growth in private education (and why) in Lagos, Nigeria,” National Center for the Study of Privatization in Education (NCSPE), 2013.
Hendricks, Matthew, “Does it pay to pay teachers more? Evidence from Texas,” Journal of Public Economics, January 2014, Volume 109.
Hess, Frederick and Pedro Noguera, A Search for Common Ground: Conversations About the Toughest Questions in K–12 Education, New York, NY: Teachers College Press, 2021.
Hess, Frederick M., The Great School Rethink, Cambridge, MA: Harvard Education Press, 2023.
Hill, Andrew J. and Daniel B. Jones, “A teacher who knows me: The academic benefits of repeat studentteacher matches,” Economics of Education Review, June 2018, Volume 64.
Hill, Nancy E. and Diana F. Tyson, “Parental involvement in middle school: A meta-analytic assessment of the strategies that promote achievement,” Developmental Psychology, May 2009, Volume 45, Number 3.
Himmler, Oliver, The effects of school choice on academic achievement in the Netherlands, Georg August University of Göttingen, March 2007.
Hitt, Dallas and Pamela Tucker, “Systematic review of key leader practices found to influence student achievement: A unified framework,” Review of Educational Research, 2016, Volume 86, Number 2.
Hopfenback, Therese et al., Balancing trust and accountability? The assessment for learning programme in Norway, OECD, December 13, 2013.
Horn, Michael, From Reopen to Reinvent: (Re)Creating School for Every Child, San Francisco, CA: JosseyBass, 2022.
Irish Aid and UNICEF, Out-of-school children study: Sierra Leone, November 2021.
Jakubowski, Maciej, “Accountability in the Polish education system,” UNESCO, 2017.
Jordan, Rachel and Jonathan Pamel, “Key findings from learning at scale and the education quality improvement program in Tanzania (EQUIP-T),” Learning at Scale, June 2022.
Kidson, Marc and Emma Norris, Implementing the London Challenge, Institute for Government, July 10, 2014.
Kitsing, Maie and Peeter Mehisto, Lessons from Estonia’s Education Success Story: Exploring Equity and High Performance through PISA, Milton Park, Abingdon, Oxfordshire: Routledge, 2022.
Kotlowitz, Alex, There Are No Children Here: The Story of Two Boys Growing Up in The Other America, New York, NY: Doubleday, 1992.
Kraft, Matthew A., John Papay, and Leigh Wedenoja, Second time’s the charm? How sustained relationships from repeat student-teacher matches build academic and behavioral skills, Annenberg Institute at Brown University working paper, EdWorkingPaper series, number 22-590, June 2022.
Leigh, Andrew, “Teacher pay and teacher aptitude,” Economics of Education Review, 2012, Volume 31, Number 3.
Levenson, Nathan, Six Shifts to Improve Special Education and Other Interventions: A Commonsense Approach for School Leaders, Cambridge, MA: Harvard Education Press, 2020.
Levin, Ben, How to Change 5000 Schools: A Practical and Positive Approach for Leading Change at Every Level, Cambridge, MA: Harvard Education Press, 2008.
Li, Fengxiao, “Impact of COVID-19 on the lives and mental health of children and adolescents,” Frontiers in Public Health, October 2022, Volume 10.
Li, Guirong et al., “Does teacher training actually work? Evidence from a large-scale randomized evaluation of a national teacher training program,” American Economic Journal: Applied Economics, 2019, Volume 11, Number 3.
Llorent-Bedmar, Vicente, “Educational reforms in Morocco: Evolution and current status,” International Education Studies, 2014, Volume 7, Number 12.
Lovison, Virginia and Cecilia Mo, Investing in the teacher workforce: Experimental evidence on teachers’ preferences. Annenberg Institute at Brown University working paper, EdWorkingPaper series, number 22528, February 2022.
Mathematica, “Long-term impacts of KIPP middle and high schools on college enrollment, persistence, and attainment,” September 12, 2023.
McAleavy, Tony, Transforming teacher professional development: A case study from England, Education Development Trust, 2021.
McCaffrey, Daniel F., et al., Have we identified effective teachers? Validating measures of effective teaching using random assignment, Bill & Melinda Gates Foundation, January 2013.
McGivney, Eileen and Rebecca Winthrop, “Why wait 100 years? Bridging the gap in global education,” Brookings Institution, June 2015.
McKinsey, “Improving schools: Reflections from education leaders in South Australia,” January 27, 2021.
McKinsey, “Lifting Poland’s Ambition: On the cusp of a new era?,” May 25, 2023.
McKinsey, “Partnering for Outcomes: Public-private partnerships for school education in Asia,” 2014
McKinsey, “Reforming public education in Australia: An interview with Mark Scott AO,” October 9, 2020.
McKinsey Global Institute, Generative AI and the future of work in America, July 26, 2023.
McKinsey Global Institute, Jobs lost, jobs gained: What the future of work will mean for jobs, skills, and wages, November 28, 2017.
McKinsey Global Institute, The future of work after COVID-19, February 18, 2021.McLaughlin, Colleen and Alan Ruby, Implementing Educational Reform: Cases and Challenges, Cambridge, United Kingdom: Cambridge University Press, 2021.
McNaught, Tim, “A problem-driven approach to education reform: the story of Sobral in Brazil,” Research on Improving Systems of Education (RISE) Insights, March 2022.
Miller, Caroline, “How trauma affects kids in school: Signs of trauma and tips for helping kids who’ve been traumatized,” Child Mind Institute, updated October 13, 2023.
Morgan, John, “The London Challenge: a model to recreate?,” TES Magazine, November 29, 2023.
Muijs, Daniel, Eleanor Stringer, and Alex Quigley, Metacognition and self-regulated learning: Guidance report, Education Endowment Foundation, October 27, 2021.
National Center on Education and the Economy, “Brief on high-performing systems: Estonia,” October 2020.
National Center on Education and the Economy, “Building an integrated data system: Lessons from Estonia,” May 2, 2021.
Newman, Kirsty, Lant Pritchett, and Jason Silberstein, Focus to flourish: Five actions to accelerate progress in learning, RISE, 2022.
Nickow, Andre, Philip Oreopoulos, and Vincent Quan, The impressive effects of tutoring on preK-12 learning: A systematic review and meta-analysis of the experimental evidence, National Bureau of Economic Research working paper, number 27476, July 2020.
OECD, Back to the future of education: Four OECD scenarios for schooling, September 15, 2020.
OECD, Curriculum overload: A way forward, November 25, 2020.
OECD, Early learning and child well-being in Estonia, March 21, 2020.
OECD, Education at a glance 2022: OECD indicators, October 3, 2022.
OECD, Effective teacher policies: Insights from PISA, June 11, 2018.
OECD, Equity in education: Breaking down barriers to social mobility, October 23, 2018.
OECD, Strengthening the governance of skills systems: Lessons from six OECD countries, March 27, 2020.
OECD, Strong performers and successful reformers in education: Lessons from PISA for the United States, May 6, 2011.
Özüdoğru, Fatma, “Investigating the effect of differentiated instruction on academic achievement and self-directed learning readiness in an online teaching profession course,” i.e.: inquiry in education, 2022, Volume 14, Number 2.
Parandeka, Suhas D. and Elisabeth K. Sedmik, Unraveling a secret: Vietnam’s outstanding performance on the PISA test, World Bank Group, Policy Research Working Papers, number 7630, April 2016.
Paterson, Chris, Measuring what matters: secondary school accountability indicators that benefit all, Centre Forum, August 2013.
Pretorius, Elizabeth and Nic Spaull, Early Grade Reading and Mathematics Interventions in South Africa, Cape Town, South Africa: Oxford University Press Southern Africa, 2022.
Phillips, Katherine W., “How diversity makes us smarter,” Scientific American, October 1, 2014.
Piper, Benjamin, “Institutionalizing Tusome in Kenya: promise and pitfalls,” UNESCO, 2022.
Pritchett, Lant, A lifecycle, economy-wide framework for human capital in Africa, shared at the African Economic Research Consortium Senior Policy Seminar XXV, March 2023.
Pritchett, Lant, “Understanding the politics of the learning crisis: Steps ahead on a long road,” in Sam Hickey and Naomi Hossain (eds), The Politics of Education in Developing Countries: From Schooling to Learning, Oxford, United Kingdom: Oxford University Press, 2019.
Reeves, Richard V. and Ember Smith, “Boys left behind: Education gender gaps across the US,” Brookings Institute, October 12, 2022.
Reimers, Fernando M., Audacious Education Purposes: How Governments Transform the Goals of Education Systems, New York, NY: Springer, 2020.
Republic of Kenya Ministry of Education, Tusome external evaluation midline report, December 7, 2017.
Republic of Sierra Leone, Ministry of Basic and Senior Secondary Education 2019 annual schools census report and statistical abstract, November 2019.
Reville, Paul and Elaine Weiss, Broader, Bolder, Better: How Schools and Communities Help Students Overcome the Disadvantages of Poverty, Cambridge, MA: Harvard Education Press, 2019.
Ripley, Amanda, The Smartest Kids in the World: And How They Got That Way, New York, NY: Simon & Schuster, 2014.
Rivers, June C. and William L. Sanders, “Cumulative and residual effects of teachers on future student academic achievement,” University of Tennessee ValueAdded Research and Assessment Center, November 1996.
Robinson, Jenny Perlman and Rebecca Winthrop, Millions Learning: Scaling up quality education in developing countries, Center for Universal Education at Brookings, April 2016.
RTI International, Learning at scale: Interim report, October 2021.
RTI International, “Let’s Read: Understanding Kenya’s success in improving foundational literacy at scale,” December 9, 2016.
Sachdeva, Suman, “Early-grade learning assessments spur Sierra Leone to strengthen foundational literacy and numeracy skills,” Brookings Institution, September 26, 2022.
Santiago, P. et al., OECD reviews of school resources: Estonia 2016, OECD, April 6, 2016.
Schleicher, Andreas, PISA 2018 insights and interpretations, OECD, 2019.
Schleicher, Andreas, PISA 2022 results (volume I): The state of learning and equity in education, OECD, 2023.
Schleicher, Andreas, World class: How to build a 21stcentury school system, OECD, May 29, 2018.
Seepro-r, Workforce profiles in systems of early childhood education and care in Europe, 2017.
Seng Tan, Oon, Teacher policies: Global best practices for developing the teaching profession, National Institute of Education, Singapore, 2015.
Sorenson, Kimberly, “Evidence-based interventions for children with disabilities,” Waterford, 2018.
South African Human Rights Commission, Report: Delivery of primary learning materials to schools, May 29, 2014.
The International Commission on Financing Global Education Opportunity, The Learning generation: Investing in education for a changing world, August 2016.
TIMSS & PIRLS International Study Center, Lynch School of Education and Human Development, Boston College, and International Association for the Evaluation of Educational Achievement, “PIRLS 2021 international results in reading,” 2023.
The New Teacher Project, Accelerate, don’t remediate: New evidence from elementary math classrooms, May 23, 2021.
The New Teacher Project, The mirage: Confronting the hard truth about our quest for teacher development, August 4, 2015.
The New Teacher Project, The opportunity myth: What students can show us about how school is letting them down—and how to fix it, September 25, 2018.
The New Teacher Project, “The widget effect: Our national failure to acknowledge and act on differences in teacher effectiveness,” June 8, 2009.
UNESCO, Global Education Monitoring Report 2021/2: Non-state actors in education: Who chooses? Who loses?, 2021.
UNESCO, Global education monitoring report 2023: Technology in education: A tool on whose terms?, 2023.
UNESCO, Global education monitoring report: Gender report, deepening the debate on those still left behind, 2022.
UNESCO, Reimagining our futures together: A new social contract for education, 2021.
UNESCO, “South African women and girls empowered by literacy programme to take their place in society,” September 7, 2015.
UNICEF, Sierra Leone national early grade reading and mathematics assessment baseline study, November 2021.
USAID, USAID Reading MATTERS conceptual framework, November 2019.
Whitmire, Richard, Why Boys Fail: Saving Our Sons From an Educational System That’s Leaving Them Behind, New York, NY: AMACOM, 2010.
Willingham, Daniel T., “How knowledge helps,” American Educator, 2006, Volume 30, Number 1.
Willingham, Daniel T., Why Don’t Students Like School?: A Cognitive Scientist Answers Questions About How the Mind Works and What It Means for the Classroom, San Francisco, CA: Jossey-Bass, 2021.
World Bank, “A recipe for a more equitable and efficient learning system,” August 28, 2020.
World Bank, Cost-effective approaches to improve global learning levels, October 2020.
World Bank, The state of global learning poverty: 2022 update, June 23, 2022.
World Economic Forum, “Future of jobs report 2023: Up to a quarter of jobs expected to change in next five years,” April 30, 2023.
1 “70% of 10-year-olds now in learning poverty, unable to read and understand a simple text,” World Bank, June 23, 2022.
2 The state of global learning poverty: 2022 update, World Bank, June 23, 2022.
3 Joseph Briggs et al., The potentially large effects of artificial intelligence on economic growth (Briggs/Kodnani), Goldman Sachs, March 26, 2023.
4 “Education: Overview,” World Bank, updated October 11, 2023.
5 Sarah Garland, “Can we teach our way out of political polarization?,” The Hechinger Report, January 25, 2021.
6 “Climate change education,” UNESCO, accessed January 4, 2024.
7 While some of these systems faltered in more recent assessments, including the 2022 PISA administration, we believe this is largely a reflection of their ability to weather a global pandemic, versus their ability to sustain improvements at scale over a sustained time-period. It is also a reminder of the reality that even the most successful system transformations cannot be taken for granted.
8 Population growth is projected to be significant in many lowand middle-income countries, particularly in Sub-Saharan Africa (for example, 43 percent projected population growth in the Democratic Republic of Congo from 2019 to 2030), but flat or negative in many higher-income countries (for example, 1 percent projected population decline in Canada over the same period).
9 Eileen McGivney and Rebecca Winthrop, “Why wait 100 years? Bridging the gap in global education,” Brookings Institution, June 2015.
10 The Coalition for Foundational Learning—a group consisting of FCDO, UNICEF, UNESCO, USAID, the World Bank, and the Bill & Melinda Gates Foundation—came together in 2022 to create urgency around global learning poverty rates and to improve foundational learning for all students, particularly in low- and middle-income countries. “The Coalition for foundational learning,” UNESCO, accessed January 4, 2024.
11 “70% of 10-year-olds,” June 23, 2022.
12 There are many different measures of how a school system is performing. Learning poverty provides a helpful picture in children’s earlier years. In later years, international assessment data provides a useful and comparable metric; PISA, for example, is taken by 15 year-olds in dozens of countries. These measures are all highly
correlated however. Systems where students don’t learn to read by the end of elementary school also tend to have lower results on assessments towards the end of secondary school.
13 Analysis is from Lant Pritchett, A lifecycle, economy-wide framework for human capital in Africa, shared at the African Economic Research Consortium Senior Policy Seminar XXV, March 2023. Underlying source data is from Demographic and Health Surveys Program datasets.
14 Based on UNESCO population data of countries with World Bank Harmonized Learning Outcome (HLO) data
15 Relevant regional assessments include the Southern and Eastern Africa Consortium for Monitoring Educational Quality (SACMEQ), Programme for the Analysis of Education Systems (PASEC), and Latin American Laboratory for the Assessment of the Quality of Education (LLECE).
16 The translation of PISA points to a year of learning is an art, not a science. Latest analysis from OECD suggests that approximately 20 PISA points reflect a year of learning, while the World Bank suggests a year of learning equates to 20 to 50 PISA points. There is likely some variation depending on a student’s age; typically, students learn more content in a single year in the younger grades.
17 “Education: Overview,” World Bank, updated October 11, 2023.
18 Sarah Garland, “Can we teach our way out of political polarization?,” The Hechinger Report, January 25, 2021.
19 “Climate change education,” UNESCO, accessed January 4, 2024.
20 The future of work after COVID-19, McKinsey Global Institute, February 18, 2021.
21 “Future of jobs report 2023: Up to a quarter of jobs expected to change in next five years,” World Economic Forum, April 30, 2023.
22 Joseph Briggs et al., The potentially large effects of artificial intelligence on economic growth (Briggs/Kodnani), Goldman Sachs, March 26, 2023.
23 “Generative AI and the future of work in America,” McKinsey Global Institute, July 26, 2023; “The future of work,” February 18, 2021; “Jobs lost, jobs gained: What the future of work will mean for jobs, skills, and wages,” McKinsey Global Institute, November 28, 2017.
24 “How COVID-19 caused a global learning crisis,” McKinsey, April 4, 2022.
25 The translation of PISA points to a year of learning is an art, not a science. Latest analysis from OECD suggests that approximately 20 PISA points reflect a year of learning. PISA 2022 results (volume I): The state of learning and equity in education, OECD, December 5, 2023.
26 Andreas Schleicher, PISA 2018 insights and interpretations, OECD, 2019.
27 This sidebar takes a binary view of girls’ educational outcomes compared to those of boys because this has been a focus in the global education community and reflects the definitions used in international education assessments (see “Girls’ education,” World Bank, accessed January 4, 2024). However, we recognize that the diverse gender identities of students around the world may not conform to this simplified binary.
28 “New methodology shows that 258 million children, adolescents and youth are out of school,” UNESCO, September 2019.
29 Ibid.
30 Richard V. Reeves and Ember Smith, “Boys left behind: Education gender gaps across the US,” Brookings Institution, October 12, 2022.
31 Richard Adams, “Girls overtake boys in A-level and GCSE maths, so are they ‘smarter’?,” The Guardian, August 13, 2021.
32 “Girls’ performance in mathematics now equal to boys (UNESCO report),” UNESCO, April 26, 2022.
33 “Global education monitoring report: Gender report, deepening the debate on those still left behind,” UNESCO, 2022.
34 “UNICEF: Committed to educating girls,” UNICEF, accessed January 4, 2024.
35 Richard Whitmire, Why Boys Fail: Saving Our Sons From an Educational System That’s Leaving Them Behind, New York, NY: AMACOM, 2010.
36 Richard V. Reeves, “Why boys fall behind,” The Spectator, October 15, 2022.
37 Zara Abram, “Boys are facing key challenges in school. Inside the effort to support their success,” Monitor on Psychology, April 2023, Volume 54, Number 3.
38 Equity in education: Breaking down barriers to social mobility, OECD, October 23, 2018.
39 Interventions were drawn from the World Education Reform Database (WERD), a collection of more than 10,000 policy changes enacted across 183 countries that
were compiled by teams across Stanford and the University of Toronto. See methodological appendix for more detail on how analysis was conducted.
40 The translation of PISA points to a year of learning is an art, not a science. Latest analysis from OECD suggests that approximately 20 PISA points reflect a year of learning. PISA 2022 results, December 5, 2023.
41 Suhas D. Parandeka and Elisabeth K. Sedmik, Unraveling a secret: Vietnam’s outstanding performance on the PISA test, World Bank Group, Policy Research Working Papers, April 2016; M. Niaz Asadullah, Liyanage Devangi H. Perera, and Saizi Xiao, “Vietnam’s extraordinary performance in the PISA assessment: A cultural explanation of an education paradox,” Journal of Policy Modeling, 2020, Volume 42, Number 5.
42 The Progress in International Reading Literacy Study (PIRLS) is administered every five years. The most recent results cover the period from 2016 to 2021. Given the length of time between assessments, it is hard to discern how much of the decline in results is due to prepandemic trends (2016–20) and how much is directly due to COVID-19 (2020–21). “PIRLS 2021,” International Association for the Evaluation of Educational Achievement, accessed January 4, 2024.
43 The Programme for International Student Assessment (PISA) was last administered in 2018, so the most recent results provide more of a direct signal of the impact of COVID-19. However, the picture is still muddied by performance from 2018 to 2020 and differential investments in catch-up efforts since the pandemic. “PISA 2022 results,” OECD, 2023.
44 PISA 2018 results (volume I): What students know and can do, OECD, December 3, 2019.
45 Jake Bryant, Emma Dorn, Leah Pollack, and Jimmy Sarakatsannis, “COVID-19 learning delay and recovery: Where do US states stand?,” McKinsey, January 11, 2023; Jake Bryant, Avery Cambridge, Emma Dorn, and Jimmy Sarakatsannis, “What it would take for US schools to fully recover from COVID-19,” McKinsey, August 7, 2023.
46 Some reports during the pandemic suggested parents were more engaged than ever in their children’s education, though subsequent studies show these patterns varied by geography, socioeconomic status, and parental education levels and technology proficiency. Alyson Klein, “Pandemic parents are more engaged. How can schools keep it going?,” Education Week, September 14, 2021; Miranda Catalina et al.,
“Socioeconomic status, parental involvement and implications for subjective well-being during the global pandemic of COVID-19,” Frontiers in Education, November 2021, Volume 6.
47 In many countries, the socioeconomic gap in performance did not widen substantially because both the more-advantaged students and less-advantaged students experienced declines in academic performance. Of the 68 countries with PISA data available for 2018 and 2022, the socioeconomic gap in math performance did not change in 51 of the countries, though the gap widened on average across OECD countries and in 12 participating systems. PISA 2022 results (volume I): The state of learning and equity in education, OECD, December 5, 2023.
48 Emma Dorn, Bryan Hancock, Jimmy Sarakatsannis, and Ellen Viruleg, “COVID-19 and education: An emerging K-shaped recovery,” McKinsey, December 14, 2021; Jake Bryant, Emma Dorn, Leah Pollack, and Jimmy Sarakatsannis, “COVID-19 learning delay and recovery: Where do US states stand?,” McKinsey, January 11, 2023.
49 The top influence in John Hattie’s earlier research and his updated 2023 influences on student achievement is “collective teacher efficacy,” with a weighted mean effect size of 1.34 across three meta-analyses and 85 studies. “Global research database,” Corwin Visible Learning, accessed January 5, 2024.
50 The mirage: Confronting the hard truth about our quest for teacher development, The New Teacher Project (TNTP), August 4, 2015.
51 June C. Rivers and William L. Sanders, “Cumulative and residual effects of teachers on future student academic achievement,” University of Tennessee Value-Added Research and Assessment Center, November 1996.
52 Daniel F. McCaffrey et al., Have we identified effective teachers? Validating measures of effective teaching using random assignment, Bill & Melinda Gates Foundation, January 2013.
53 Eric Hanushek, Marc Piopiunik, and Simon Wiederhold, “The value of smarter teachers: International evidence on teacher cognitive skills and student performance,” The Journal of Human Resources, March 2018; Johan Coenen et al., “Teacher characteristics and their effects on student test scores: A systematic review,” Journal of Economics Surveys, May 2017, Volume 32, Number 3.
54 Sophia Kerby and Crosby Burns, “The top 10 economic Facts of diversity in the workplace: A diverse workplace Is integral to a strong economy,” Center for American Progress, July 12, 2012; Anna J. Egalite, Brian Kisida, and Marcus A. Winters, “Representation in the classroom: The effect of own-race teachers on student achievement,” Economics of Education Review, 2015, Volume 45; Katherine W. Phillips, “How diversity makes us
smarter,” Scientific American, October 1, 2014; Seth Gershenson et al., The long-run impacts of samerace teachers, Institute of Labor Economics, March 2017; teachers of color boost the performance of students of color in the United States: Desiree Carver-Thomas, “Diversifying the teaching profession: How to recruit and retain teachers of color,” Learning Policy Institute, April 19, 2018.
55 Bryon Auguste, Paul Kihn, and Matt Miller, Closing the talent gap: Attracting and retaining top-third graduates to careers in teaching: An international and market research-based perspective, McKinsey, September 2010; Strong performers and successful reformers in education: Lessons from PISA for the United States, OECD, May 6, 2011; Oon Seng Tan, Teacher policies: Global best practices for developing the teaching profession, National Institute of Education, Singapore, 2015.
56 First principles: Designing effective pre-service teacher education programs compendium, USAID, December 2011.
57 Research shows that most teacher training does not work: Guirong Li et al., “Does teacher training actually work? Evidence from a large-scale randomized evaluation of a national teacher training program,” American Economic Journal: Applied Economics, 2019, Volume 11, Number 3; in-service professional development in the United States generally does not work, regardless of the activities tried: The mirage: Confronting the hard truth about our quest for teacher development, TNTP, August 4, 2015.
58 Andrew Croft et al., Job-embedded professional development: What it is, who is responsible, and how to get it done well, National Comprehensive Center for Teacher Quality, April 2010.
59 Linda Darling-Hammond, Maria E. Hyler, and Madelyn Gardner, “Effective teacher professional development,” Learning Policy Institute, June 2017; Ariana Audisio et al., Does teacher professional development improve student learning? Evidence from leading educators’ teacher fellowship model, Annenberg Institute at Brown University working paper, EdWorkingPaper series, number 22-597, April 2023.
60 “The widget effect: Our national failure to acknowledge and act on differences in teacher effectiveness,” TNTP, June 8, 2009.
61 Andrew J. Hill and Daniel B. Jones, “A teacher who knows me: The academic benefits of repeat student-teacher matches,” Economics of Education Review, June 2018, Volume 64; Matthew A. Kraft, John Papay, and Leigh Wedenoja, Second time’s the charm? How sustained relationships from repeat student-teacher matches build academic and behavioral skills, Annenberg Institute at Brown University working paper, EdWorkingPaper series, number 22-590, June 2022.
62 Higher salaries are associated with greater desire of graduates to become teachers: Effective teacher policies: Insights from PISA, OECD, June 11, 2018. Teacher pay increases drive improved test scores: Matthew Hendricks, “Does it pay to pay teachers more? Evidence from Texas,” Journal of Public Economics, January 2014, Volume 109 and Andrew Leigh, “Teacher pay and teacher aptitude,” Economics of Education Review, 2012, Volume 31, Number 3. Salary increases alone are insufficient: Effective teacher policies, June 11, 2018. Teachers value student support improvements above salary increases: Virginia Lovison and Cecilia Mo, Investing in the teacher workforce: Experimental evidence on teachers’ preferences, Annenberg Institute at Brown University working paper, EdWorkingPaper series, number 22-528, February 2022. Teachers of color value different supports than their White counterparts: “Retaining teachers of color,” California Department of Education, March 9, 2023. Teachers value being or feeling heard and appreciated: TNPT blog, “These 4 strategies can help schools retain their best teachers,” blog entry by Victoria Van Cleef, TNPT, May 12, 2022.
63 Dallas Hitt and Pamela Tucker, “Systematic review of key leader practices found to influence student achievement: A unified framework,” Review of Educational Research, 2016, Volume 86, Number 2.
64 Grissom, Jason A., Egalite, Anna J. &. Lindsay, Constance A. How Principals Affect Students and Schools: A Systematic Synthesis of Two Decades of Research. The Wallace Foundation, 2021.
65 Jason A. Grissom, Anna J. Egalite, and Constance A. Lindsay, How principals affect students and schools: A systematic synthesis of two decades of research, The Wallace Foundation, February 2021. USAID defines high-quality texts and materials as being designed specifically for student use; meeting global standards for being available, accessible, appropriate, and affordable; being language- and level-appropriate; coming with a structured teacher’s guide; and aligning with curriculum and textbooks. USAID Reading MATTERS conceptual framework, USAID, November 2019.
66 The opportunity myth: What students can show us about how school is letting them down—and how to fix it, TNTP, September 25, 2018; teacher estimates of achievement has the second highest weighted mean effect size of more than 350 influences assessed in John Hattie’s Visible Learning database: “Teacher estimates of achievement,” Corwin Visible Learning, accessed January 5, 2024; acceleration programs have a potential to considerably accelerate learning with a weighted mean effect size of 0.53 times across more than 100 studies, as documented in John Hattie’s Visible Learning database: “Acceleration programs,” Corwin Visible Learning, accessed January 5, 2024.
67 Daniel T. Willingham, “Why don’t students like school?,” American Educator, 2009, Volume 33, Number 1; Holis S. Scarborough, “Connecting early language and literacy to later reading (dis) abilities: Evidence, theory, and practice,” in David K. Dickinson and Susan B. Neuman (eds), Handbook for research in early literacy, New York, NY: Guilford Press, 2003; Peter C. Brown, Mark A. McDaniel, and Henry L. Roediger III, Make it Stick: The Science of Successful Learning, Cambridge, MA: Belknap Press, 2014.
68 “Effective teacher professional development,” June 2017; Selcuk Dogan, Jennifer Mesa, and Rose Pringle, “The impacts of professional learning communities on science teachers’ knowledge, practice and student learning: A review,” Professional Development in Education, 2016, Volume 42, Number 4.
69 In their review, Black and Wiliam found that student gains impacted by formative assessment practices were “among the largest ever reported for educational interventions.” Paul Black and Dylan Wiliam, “Inside the black box: Raising standards through classroom assessment,” Phi Delta Kappan, September 2010, Volume 92, Number 1.
70 Lisa Abrams, Lisa Jackson, and Divya Varier, “Unpacking instructional alignment: The influence of teachers’ use of assessment data on instruction,” Perspectives in Education, 2016, Volume 34, Number 4.
71 Fatma Özüdoğru, “Investigating the effect of differentiated instruction on academic achievement and self-directed learning readiness in an online teaching profession course,” i.e.: inquiry in education, 2022, Volume 14, Number 2.
72 Emma Dorn, Marc Krawitz, and Mona Mourshed, “How to improve student educational outcomes: New insights from data analytics,” McKinsey, September 22, 2017.
73 Mark T. Greenberg, “Evidence for social and emotional learning in schools,” Learning Policy Institute, March 6, 2023.
74 Daniel T. Willingham, Why Don’t Students Like School? A Cognitive Scientist Answers Questions About How the Mind Works and What It Means for the Classroom, San Francisco, CA: Jossey-Bass, 2021.
75 Andre Nickow, Philip Oreopoulos, and Vincent Quan, The impressive effects of tutoring on preK-12 learning: A systematic review and meta-analysis of the experimental evidence, National Bureau of Economic Research working paper, number 27476, July 2020; Roseanna Ander, Jonathan Guryan, and Jens Ludwig, Improving academic outcomes for disadvantaged students: Scaling up individualized tutorials, Hamilton Project, March 28, 2016.
76 Accelerate, don’t remediate: New evidence from elementary math classrooms, TNTP, May 23, 2021.
77 A What Works Clearinghouse practice guide for teachers identifies four recommendations that address what works for English learners in the classroom. These recommendations include teaching vocabulary intensively across multiple days and instructional activities, integrating English-language instruction into content-area instruction, providing structured and frequent opportunities to work on written skills, and offering small-group intervention: Scott Baker et al., Teaching academic content and literacy to English learners in elementary and middle school, a joint report from the National Center for Education Evaluation and Regional Assistance (NCEE), Institute of Education Sciences, and US Department of Education, April 2014.
78 Kimberly Sorenson, “Evidence-based interventions for children with disabilities,” Waterford, 2018.
79 Caroline Miller, “How trauma affects kids in school: Signs of trauma and tips for helping kids who’ve been traumatized,” Child Mind Institute, updated October 13, 2023.
80 Fengxiao Li, “Impact of COVID-19 on the lives and mental health of children and adolescents,” Frontiers in Public Health, October 2022, Volume 10.
81 Jason Burns, Samantha Cullum, and Erica Harbatkin, “The role of school climate in school turnaround,” Education Policy Innovation Collaborative, July 2023.
82 Channa Cook-Harvey and Linda Darling-Hammond, Educating the whole child: Improving school climate to support student success, Learning Policy Institute, September 2018.
83 Across 50 studies, parental involvement was positively associated with achievement, with the exception of parental help with homework. Involvement that reflected academic socialization had the strongest positive association with achievement: Nancy E. Hill and Diana F. Tyson, “Parental involvement in middle school: A meta-analytic assessment of the strategies that promote achievement,” Developmental Psychology, May 2009, Volume 45, Number 3. A study examining the effect of school engaging families for subject-specific support found that students scored above proficient at higher rates: Joyce L. Epstein and Steven B. Sheldon, “Involvement counts: Family and community partnerships and mathematics achievement,” The Journal of Educational Research, 2015, Volume 98, Number 4. Parental involvement predict declines in problem behaviors and improvement in social skills but do not predict changes in achievement: Heather J. Bachman, Nermeen E. El Nokali, and Elizabeth Votruba-Drzal, “Parent involvement and children’s academic and social development in elementary school,” Child Development, 2010, Volume 81, Number 3.
84 Carol Emig and Kristin Anderson Moore, “Integrated student supports: A summary of the evidence base for policymakers,” Child Trends, February 2014.
85 Ministry of Basic and Senior Secondary Education 2019 annual schools census report and statistical abstract, Republic of Seirra Leone, November 2019.
86 Darryl David, “Additional support to primary school students to ensure sufficient digital access,” Ministry of Education Singapore, April 21, 2023.
87 “Reliance on remote learning yields little gains in Malawi,” blog post by Esme Kadzamira, Isaac Mwale, and Radhika Nagesh, Center for Global Development, February 17, 2023.
88 Michael Barber, Chinezi Chijioke, and Mona Mourshed, How the world’s most improved school systems keep getting better, McKinsey, November 1, 2010.
89 See the methodology appendix for a detailed explanation of the performance bands and correlating HLO scores used in this report.
90 “Punjab rural: Trends over time: 2006-2014,” ASER, January 2015.
91 Punjab’s reading and math performance on ASER improved by 5.7 and 5.5 points, respectively, from 2009 to 2019. This composite growth puts Punjab in the top five of the nation’s 21 states with ASER results.
92 Jake Bryant, Felipe Child, Emma Dorn, and Stephen Hall, “New global data reveal education technology’s impact on learning,” McKinsey, June 12, 2020.
93 “PISA 2022 results,” 2023
94 Emma Dorn, Bryan Hancock, Jimmy Sarakatsannis, and Ellen Viruleg, “COVID-19 and learning loss—disparities grow and students need help,” McKinsey, December 8, 2020.
95 Duolingo, a language-learning app with more than 21 million users, published details on how it uses AI to generate lessons based on a series of prompts, with the caveat that human review is always necessary. Duolingo Blog, “How Duolingo uses AI to create lessons faster,” blog entry by Parker Henry, June 22, 2023.
96 Kahoot! launched new AI features to enable educators to auto-create quizzes and presentations based on basic prompts. Jostein Håvaldsrud, “Kahoot! launches new AI features for more powerful learning,” Kahoot!, June 7, 2023.
97 Sarah Schwartz, “Can AI tutor students? Why it’s unlikely to take over the job entirely,” Education Week, May 31, 2023.
98 Nadia Bidarian, “Meet Khan Academy’s chatbot tutor,” CNN, August 21, 2023.
99 IntelliMetric uses automated scoring to assess GMAT essays. “Intellimetric scores the GMAT,”
IntelliMetric, accessed January 5, 2024.
100 Nelson Cowan, “Working memory underpins cognitive development, learning, and education,” Education Psychology Review, June 2014, Volume 26, Number 2.
101 Daniel T. Willingham, “How knowledge helps,” American Educator, 2006, Volume 30, Number 1.
102 World Bank Blogs, “How to tackle Learning Poverty? Delivering education’s promise to children across the world,” blog entry by Jaime Saavedra, December 23, 2019.
103 Christian Bokhove and Daniel Muijs, Metacognition and self-regulation: Evidence review, Education Endowment Foundation, May 2020.
104 Daniel Muijs, Eleanor Stringer, and Alex Quigley, Metacognition and self-regulated learning: Guidance report, Education Endowment Foundation, October 27, 2021.
105 Jobs lost, jobs gained: Workforce transitions in a time of automation, McKinsey Global Institute, December 2017.
106 “School and network partnerships,” Melbourne Assessment, accessed January 5, 2024.
107 Rebecca Koenig, “What if we measured learning through skills gained, not time spent in the classroom?,” EdSurge, April 18, 2023.
108 Marco Dondi, Julia Klier, Frédéric Panier, and Jörg Schubert, “Defining the skills citizens will need in the future world of work,” McKinsey, June 25, 2021.
109 Many systems have curricula that include too many topics for teachers to conceivably cover during instruction. This is the result of new topics being added over time based on demands placed upon the school system without removing older topics or changing the amount of time that teachers have for instruction. When teachers attempt to cover all topics on an overloaded curriculum, they are limited in their ability to review content, loop back to previously discussed topics, or engage in other best practices that drive comprehension. “What does research say?” in Curriculum overload: A way forward, OECD, November 25, 2020.
110 “Let’s Read: Understanding Kenya’s success in improving foundational literacy at scale,” RTI International, December 9, 2016.
111 Tusome external evaluation midline report, Republic of Kenya Ministry of Education, December 7, 2017.
112 Joseph Destefano et al., “Scaling up successfully: Lessons from Kenya’s Tusome national literacy program,” Journal of Educational Change, July 2018, Volume 19.
113 Tusome external evaluation midline report, Republic of Kenya Ministry of Education, December 7, 2017.
114 Benjamin Piper, “Institutionalizing Tusome in Kenya: promise and pitfalls,” UNESCO, 2022.
115“Let’s Read,” December 9, 2016.
116 Ceará enrolled 1.2 million students in primary and secondary education at the time of its major reforms. As of 2020, total enrollment had dropped to 900,000. “A recipe for a more equitable and efficient learning system,” World Bank, August 28, 2020.
117 In 2017, Ceará spent $916 per student in basic education, below the national average. Kelly Oliveira, “Brazil spends 6% of GDP in education, school performance still poor,” Agência Brasil, July 6, 2018.
118 What a Brazilian state can teach the world about education,” Economist, December 18, 2021.
119 Louise Cruz and Andre Loureir, Achieving world-class education in adverse socioeconomic conditions: The case of Sobral in Brazil, World Bank, June 2020.
120 David K. Evans and Andre Loureiro, “Getting education right: State and municipal success in reform for universal literacy in Brazil,” World Bank, January 1, 2020.
121 Strong performers, 2011.
122 Jerzy Wiśniewski and Marta Zahorska, “Reforming education in Poland,” in Fernando M. Reimers, Audacious Education Purposes: How Governments Transform the Goals of Education Systems, New York, NY: Springer, 2020.
123 Maciej Jakubowski, “Poland: Polish education reforms and evidence from international assessments,” in Nuno Crato, Improving a Country’s Education: PISA 2018 Results in 10 Countries, New York, NY: Springer, 2021.
124 “Lifting Poland’s ambition. On the cusp of a new era?,” McKinsey, May 25, 2023.
125 Małgorzata Tetiurka, “Giving English teachers autonomy and choice: Coping with curriculum change in Poland,” in Laura Grassick and Martin Wedell, International Perspectives on Teachers Living with Curriculum Change, London, United Kingdom: Palgrave Macmillan, 2018.
126 Fernando M. Reimers, Audacious Education Purposes: How Governments Transform the Goals of Education Systems, New York, NY: Springer, 2020.
127 Li-Kai Chen, Felipe Child, Emma Dorn, and Raimundo Morales, “An interview with former Peruvian Minister of Education Jaime Saavedra,” McKinsey, September 26, 2019.
128 “Scaling up successfully,” July 2018
129 Amer Haddad and Bruce McFarland, “Donor coordination for enhanced public education services,” USAID Learning Lab, accessed January 5, 2024.
130 Reforms take six years or more to stick in secondary education: Michael Fullan, “The return of large-scale reform,” Journal of Educational Change, 2000, Volume 1. US superintendents last, on average, two to three years: Evie Blad, “High pace of superintendent turnover continues, data show,” Education Week, September 19, 2023. Multiple sources point to short tenure among global education leaders as a factor in implementation failure: “Examples of countries where ministers last less than one year on average are plentiful”: World Bank Blogs, “Four of the biggest problems facing education—and four trends that could make a difference,” blog post by Eduardo Velez Bustillo and Harry A. Patrinos, September 12, 2023. “Short tenures … get in the way of evidence-based policymaking”: “Concept note for the 2024/5 Global Education Monitoring Report on leadership and education,” UNESCO, 2023.
131 Li-Kai Chen, Emma Dorn, and Tore Vamraak, “Education reform in Norway: Looking beyond politics to bring sustained change,” McKinsey, June 21, 2019.
132 “A conversation with Kelly Butler,” Coaching Literacy, October 12, 2020.
133 “Chapter 2. The context of early learning in Estonia,” in Early learning and child well-being in Estonia, OECD, March 21, 2020.
134 “Indian state encouraged by success of pre-primary classes in every school,” Theirworld, June 22, 2018.
135 Paul Reville and Elaine Weiss, Broader, Bolder, Better: How Schools and Communities Help Students Overcome the Disadvantages of Poverty, Cambridge, MA: Harvard Education Press, 2019.
136 Andres Cadena, Li-Kai Chen, Felipe Child, and Emma Dorn, “Bringing major improvements to education in Colombia,” McKinsey, May 29, 2019.
137 World Bank Blogs, “Globally, periods are causing girls to be absent from school,” blog entry by Oni Lusk-Stover et al., June 27, 2016.
138 “Brief on high-performing systems: Estonia,” National Center on Education and the Economy (NCEE), October 2020.
139 Christopher Peak, “After Sold a Story, more states spell out reading instruction,” APM Reports, May 18, 2023.
140 Suhas D. Parandeka and Elisabeth K. Sedmik, Unraveling a secret: Vietnam’s outstanding performance on the PISA test, World Bank Group, Policy Research Working Papers, number 7630, April 2016.
141 Tessa Basford and Bill Schaninger, “The four building blocks of change,” McKinsey Quarterly, April 11, 2016.
142 Priscilla Bacalhau, Diana Goldemberg, and Ildo José Lautharte Junior, “Can peer mentoring coupled with incentives affect school turnaround? Evidence from Ceará state in Brazil,” World Bank, June 30, 2020.
143 “The four building blocks,” April 11, 2016.
144 The London Challenge was a formal program launched in the early 2000s to support the transformation of London’s school system.
145 Joanna Farmer and Ben Jensen, School turnaround in Shanghai: The empowered-management program approach to improving school performance, Center for American Progress, May 2013.
146 Major efforts to reform Moroccan education began with the 1999 release of the National Charter for Education and Training by the Special Commission for Education and Training (COSEF). In its “decade of education,” national leaders set goals to reduce illiteracy, improve educational quality, address socioeconomic and gender disparities in achievement, and further develop the private education sector; Vicente Llorent-Bedmar, “Educational reforms in Morocco: Evolution and current status,” International Education Studies, 2014, Volume 7, Number 12.
147 TIMSS is the Trends in International Mathematics and Science Study, and PISA is the Programme for International Assessment.
148 Defined as a system with three million or more students.
149 Mohamed Chtatou, “A Moroccan success story tainted with some shortcomings,” paper commissioned for the EFA Global Monitoring Report 2015, Education for All 2000-2015: Achievements and challenges, 2015.
150 The program reduced the dropout rate by 76 percent among the 44,000 children the program reached initially; Mohamed Chtatou, “A Moroccan success story tainted with some shortcomings,” paper commissioned for the EFA Global Monitoring Report 2015, Education for All 2000-2015: Achievements and challenges, 2015.
151 Ministère de l’Éducation Nationale, de la Formation Professionnelle, de l’Enseignement Supérieur et de la Recherche Scientifique, “Mesures liées à la mise en oe uvre des dispositions de la loi-cadre n°51-17” (Implementation-related measures of the provisions of framework law number 51-17), Bilan D’activité Du Ministère, Sept. 2021
152 Ahmed Ntungwabona, “Morocco pledges to reduce preschool dropout by 2026,” Morocco World News, July 25, 2023.
153 From 2018 to 2022, Morocco registered flat performance on PISA in math and saw declines in both reading and science. The number of students enrolled in education at age 15, and thus eligible to sit for PISA, increased between test administrations. “Morocco,” PISA 2022 results: Factsheets, OECD, December 5, 2023.
154 Jihane Rahhou, “National teachers assembly extends strikes in Morocco,” Morocco World News, December 25, 2023.
155 Lumpkin, Lauren. “D.C. releases ‘highest ever’ school enrollment figures,” Washington Post, Oct. 26, 2023.
156 “Per pupil spending continues to increase in 2020,” United States Census Bureau, May 18, 2022.
157 Emma Dorn, “Lessons in leadership: Transforming struggling US K–12 schools,” McKinsey, March 28, 2023.
158 “Education reform in Norway,” June 21, 2019.
159 “Poland,” in Education at a glance 2022: OECD indicators, OECD, October 3, 2022; Pamela Oberhuemer and Inge Schreyer, “Poland: Key contextual data,” in Workforce Profiles in Systems of Early Childhood Education and Care in Europe, Seepro-r, 2017.
160 “Education reform in Norway,” June 21, 2019.
161 Ibid.
162 Day in the life of (DILO) resources, Chiefs for Change, July 2020.
163 “Poland: Overview of the education system (EAG 2023),” OECD, accessed January 5, 2024.
164 Melissa Ann Adelman and Renata Freitas Lemos, Managing for learning: Measuring and strengthening education management in Latin America and the Caribbean, World Bank, January 1, 2021.
165 From 2016 to 2021, South Africa’s score on the PIRLS reading assessment dropped by 32 points—a decline more significant than the gains made in the prior decade (from 2006 to 2016, South Africa’s reading score rose by 18 points on PIRLS).
166 “South African women and girls empowered by literacy programme to take their place in society,” UNESCO, September 7, 2015.
167 “20,000 schools to receive workbooks,” SANews, July 6, 2010.
168 Report: Delivery of primary learning materials to schools, South African Human Rights Commission, May 29, 2014.
169 “South African women and girls empowered,” September 7, 2015.
170 Adrian Beavis et al., “Formative evaluation of workbooks and textbooks South Africa,” Australian Council for Educational Research, February 2013.
171 Radhamoney Govender and Anna J. Hugo, “An analysis of the results of literacy assessments conducted in South African primary schools,” South African Journal of Childhood Education, July 2020, Volume 10, Number 1.
172 “PISA 2018 results,” 2019.
173 Li-Kai Chen, Felipe Child, Emma Dorn, and Raimundo Morales, “An interview with former Peruvian Minister of Education Jaime Saavedra,” McKinsey, September 26, 2019.
174 Mississippi Department of Education.
175 “Per pupil spending,” May 18, 2021.
176 Emma Dorn, “Behind the scenes of Mississippi’s school turnaround with Carey Wright,” McKinsey, August 3, 2023.
177 “School Pupils and their Characteristics,” 2022-23, Explore Education Statistics Gov.UK.
178 “Net current expenditure per pupil in schools in England in 2021/22, by region,” Statista, December 7, 2023.
179 Alex Elwick and Tony McAleavy, School improvement in London: A global perspective, Education Development Trust, 2016.
180 As measured by the General Certificate of Secondary Education (GCSE).
181 Washington, DC’s, citywide payroll system, which was used by DC public schools, was found in 2002 to still have the Social Security numbers of more than 200 deceased city employees. “$34 million fails to fix D.C. payroll computers,” Washington Post, October 4, 2002.
182 Maciej Jakubowski, “Accountability in the Polish education system,” UNESCO, 2017.
183 “Improving schools: Reflections from education leaders in South Australia,” McKinsey, January 27, 2021.
184 New Globe uses continuous data cycles in their partnership with the Edo state government in Nigeria. “The EdoBEST Effect,” New Globe, accessed January 5, 2024..
185 “What does UChicago Consortium research say about why Freshman OnTrack matters?,” The To&ThroughProject, accessed January 5, 2024.
186 Elaine M. Allensworth and John Q. Easton, “The on-track indicator as a predictor of high school graduation,” Consortium on Chicago School Research, June 2005.
187 “District data: Metric,” Chicago Public Schools, accessed January 5, 2024.
188 Marta Carnelli, Pragya Dewan, and Janice Kaday Williams, “Addressing the learning crisis in Sierra Leone with the Learning Passport,” UNICEF, May 30, 2023.
189 “Country profiles: Sierra Leone,” World Bank Gender Data Portal, accessed January 5, 2024.
190 Suman Sachdeva, “Early-grade learning assessments spur Sierra Leone to strengthen foundational literacy and numeracy skills,” Brookings Institution, September 26, 2022.
191 “President Bio addresses UN Tranforming Education Summit,” Global Times, September 19, 2022.
192 Palko Karasz and Dionne Searcey, “Sierra Leone declares national emergency over rape of young girls,” New York Times, February 8, 2019; “Informing and empowering pregnant adolescent girls after the Ebola outbreak,” United Nations Population Fund, June 2015; “Children report increased exploitation, teenage pregnancies in Ebola-affected Sierra Leone,” World Vision, June 17, 2015.
193 Out-of-school children study: Sierra Leone, a joint report from Irish Aid and UNICEF, November 2021.
194 “Education for all girls in Sierra Leone,” Human Rights Watch, May 8, 2023.
195 Randa Grob-Zakhary and David Moinina Sengeh, “Lessons from Sierra Leone: How to get girls back to school,” Aljazeera, December 15, 2022.
196 Tichafara Chisaka and Kate Richards, “Supporting girls’ education in Sierra Leone through inclusive data systems,” Global Partnership for Sustainable Development Data, July 19, 2021.
197 Might Kojo Abreh and Jack Rossiter, “Sierra Leone has made a big bet on free education for poor children—so long as they can pass the exams,” Center for Global Development, August 26, 2022.
198 “A government innovation lab to improve education,” Abdul Latif Jameel Poverty Action Lab, updated February 2020.
199 “Tech and education: How automation and AI are powering learning in Singapore,” GOVTECH Singapore, February 23, 2023.
200 See the methodological appendix for more detail on improving versus stagnating systems on PISA and other international assessments.
201 Marc De John, Laura Furstenthal, and Erik Roth “What is innovation?,” McKinsey, April 17, 2022.
202 “School hits the airwaves: Sierra Leone turns to education radio as a response to COVID-19,” World Bank, May 13, 2021.
203 Eric A. Hanushek, “Improving student achievement: Is reducing class size the answer?,” Stanford University, June 1998.
204 “Partnering for Outcomes: Public-private partnerships for school education in Asia,” McKinsey, 2014.
205 Global Education Monitoring Report 2021/2: Non-state actors in education: Who chooses? Who loses?, UNESCO, 2021; Jishnu Das et al., “Forum: Why and how the public vs. private schooling debate needs to change,” RISE, March 21, 2023.
206 State of the sector report: Private schools in India, Central Square Foundation, November 24, 2022.
207 Studies in the United States and the Netherlands both show positive effects: David N. Figlio, Cassandra M.D. Hart, and Krzysztof Karbownik, Competitive effects of charter schools, Institute of Labor Economics, July 2021; Oliver Himmler, The effects of school choice on academic achievement in the Netherlands, Georg August University of Göttingen, March 2007.
208 Stanford’s Center for Research on Education Outcomes has produced multiple reports that show charter schools perform better for minority students that are economically disadvantaged compared to traditional district schools. “CREDO at Stanford University finds that students in charter schools, on average, perform better academically than those attending traditional public schools,” CREDO at Stanford University, June 6, 2023.
209 “Long-term impacts of KIPP middle and high schools on college enrollment, persistence, and attainment,” Mathmatica, September 12, 2023.
210 Michael Gilraine, Uros Petronijevic, and John D. Singleton, “Horizontal differentiation and the policy effect of charter schools,” American Economic Journal: Economic Policy, August 2021, Volume 12, Number 3.
211 Much of the body of research on charter schools comes from high-poverty urban areas where charter schools are more likely to be oversubscribed and their effects can therefore be measured through lottery studies. Lottery studies are often considered to be more rigorous because they are based on random assignment. There is far less evidence that charter schools in nonurban areas lead to the same benefits for student achievement. Joshua D. Angrist, Parag A. Pathak, and Christopher R. Walters, “Explaining charter school effectiveness,” American Economic Journal: Applied Economics, 2013, Volume 5, Number 4.
212 Dr. Joanna Härmä, “Private responses to state failure: the growth in private education (and why) in Lagos, Nigeria,” National Center for the Study of Privatization in Education (NCSPE), 2013.
213 Andrew Eyles, Stephen Machin, and Sandra McNally, “Unexpected school reform: Academisation of primary schools in England,” Journal of Public Economies, November 2017, Volume 155.
214 Harmandeep Singh, “Punjab govt school enrolments up by 4.36%,” Hindustan Times, April 8, 2023.
215 Ambrish Dongre, Avani Kapur, Vibhu Tewary, “How much does India spend on elementary education?,” Accountability Initiative, 2014.
216 Analysis was conducted using data from the National Achievement Survey results published by the Ministry of Education of India.
217 Punjab’s reading and math performance on ASER improved by 5.7 and 5.5 points, respectively, from 2009 to 2019. This composite growth puts Punjab in the top five of the nation’s 21 states with ASER results. ASER results are published by the Pratham Education Foundation.
218 “How it all began? From Tiger Leap to digital society,” Education Estonia, accessed January 5, 2024.
219 Future of IT: The ultimate guide for IT buyers, investors and experts, Emerging Europe, 2022; Trevor Clawson, “Starting from zero: What can Estonia teach us about building a startup ecosystem?,” Forbes, September 22, 2022.
220 “Case study: The Estonian Education Information System (EHIS),” in Strengthening the governance of skills systems: Lessons from six OECD countries, OECD, March 27, 2020.
221 “Building an integrated data system: Lessons from Estonia,” NCEE, May 2, 2021.
222 Hobby schools are defined as “an educational establishment operating in the area of youth work that creates an opportunity for the acquisition of hobby education and for the diverse development of the personality, including cultivation of one’s own language and culture, in different areas of hobby education.” Hobby schools include visual and performing arts, sports, crafts, and other focus areas. “Youth work,” Republic of Estonia Ministry of Education and Research, updated August 17, 2023.
223 “Learn more about education in Malawi,” Ripple Africa, accessed January 5, 2024.
224 “Building Education Foundations through Innovation & Technology: Malawi scale-up program overview,” Government of Malawi Ministry of Education, September 8, 2022.
225 “Harmonized Test Scores,” Gender Data Portal, World Bank, accessed January 20, 2024.
226 How the world’s most improved school systems, November 1, 2010.
227 UNESCO Institute for Statistics, accessed January 20, 2024; “DataBank,” World Bank, accessed January 20, 2024; OECD.Stat, accessed January 20, 2024.
228 “What is learning poverty?,” World Bank, April 28, 2021.
229 “Health Nutrition and Population Statistics: Population estimates and projections,” World Bank, updated December 20, 2023.
230 The state of global learning poverty, June 23, 2022.
231 Ibid.
232 After performing our 2022 projections, our global learning poverty percentage was within one percentage point of the World Bank’s figure.
233 Outlying systems of Niger and Benin were excluded from our weighted calculations as well as from our forecasts because their regional assessment improvements (165 and 118, respectively) were far greater than other systems’ learning improvements over a decade.
234 HLO and included assessments are normalized to a mean of 100 and a standard deviation of 100.
See Noam Angrist, “Measuring human capital using global learning data – supplement,” Nature, 2021, Volume 592.

McKinsey’s focus is on improving education and employment outcomes for all to create a more prosperous society with equal opportunity, and enabling new research that builds stronger communities and improves the environment.
McKinsey is committed to improving lifelong learning opportunities and outcomes around the globe by collaborating with clients on their top-of-mind issues while always keeping equity at the forefront. Our teams include former teachers, institutional leaders, policymakers, and researchers with deep expertise across all levels of education from early childhood and K-12, to higher education and workforce development.
We serve education institutions and systems, governments, philanthropists, investors, service providers, and vocational training providers, complementing our hands-on work with original research to allow us to better understand the sector’s toughest challenges, and build new capabilities to help solve them.
Get in touch: Education_Practice@mckinsey.com
What would the world look like if all school systems could develop strategies to improve at the rate of the top-performing systems? Imagine the potential of hundreds of millions more children equipped to read, write, and think critically each year. Unlocking their potential is a key ingredient in addressing the major challenges facing the world, including income inequality and climate change. The stakes are high, but so is the opportunity. And students are counting on us.