
INSIGHTS
LONG ISLAND, BROOKLYN & QUEENS
Q1 2024 MARKET REPORT
Q1 2024 • LONG ISLAND, BROOKLYN & QUEENS
Market Overview
As we reflect on the first quarter of 2024 and compare it to the same time last year, we see a reduction in the number of sales and available inventory in Queens, Nassau County, Suffolk County, and a slight increase in the number of sales on the East End of Long Island as well as in Brooklyn, presenting a narrative of resilience and complexity. Amidst evolving market dynamics, the relationship between a noticeable dip in the number of sales and an increase in the median sales prices paints a picture of an industry navigating a transformation. The shortage of available homes on the market is likely to keep the spring market competitive for buyers and a continuation of potential bidding wars and price increases.
We witnessed an increase in median sales prices across all regions with an average of 5% and Suffolk County leading with an 11% uptick. The market is showing tenacity amid decreased inventory. From Q1 2023 to Q1 2024, inventory levels dropped in all markets we serve. And while the eastern end of Long Island had a smaller decrease, the boroughs of Brooklyn and Queens saw an increase in days on market suggesting a reconfiguration of buyer interest and market supply.
Despite a rise in new listings, the demand from buyers continues to exceed the available supply. While the intensity of demand has not reached the peak levels seen during the pandemic due to factors such as high mortgage rates and elevated home prices affecting buyers' purchasing power, it still surpasses the current inventory levels. This demand is not anticipated to change in the coming months.
The relationship between broader economic trends and real estate market dynamics offers significant insights. The Dow Jones continued its ascent, ending the first quarter of 2024 close to 38,600, showcasing a strong stock market performance despite worries about extended periods of high-interest rates. During this quarter, the stock market saw notable growth, with stocks increasing by over 10% and total returns approaching 30% over the previous year. Consumer confidence declined 5% in the three months ending March 31, 2024, but remains consistent with the previous year's levels.
The increase in mortgage rates has contributed to the decrease in sales volume, highlighting the delicate balance between home affordability and market dynamics. Higher interest rates particularly impact buyers in the more affordable housing segments. In addition, many homeowners, content with their current rates, are hesitant to take on mortgages with higher interest, affecting their willingness to move or purchase new properties.
This hesitancy among potential sellers, coupled with varying buyer capabilities, contributes to the supply-demand imbalance, which, in turn, drives up home sale prices. However, the price rise is not just a result of competitive bidding. The market is witnessing a shift in the
2 • INSIGHTS

types of traded properties, with a noticeable move toward more luxury and higher-end homes. This shift is pushing the median prices upward. Our premium segments are less affected by the mortgage rate hikes and are insulated from broader national housing trends, largely due to the steady demand for housing near New York City and a desire for larger homes with space to accommodate those who work from home.
In our markets, twelve-month median sale prices at the end of Q1 2024 rose in Brooklyn by 4%, Queens by 2%, Nassau County by 9%, and Suffolk County by 11%, compared to last year.
With each quarter of progress, we move closer to the median prices and market conditions experienced before the pandemic. For now, homeowners considering selling can still realize the maximum value for their property but should expect to have it on the market for longer than in the past few months.
Economic conditions nationally appear to support the continuation of a transitional period for housing. According to the Labor Department, unemployment has remained rather steady at around 3.7%, and inflation has begun to stabilize. Inflation in 2024 hovers around 3.2%, slightly decreasing from the previous year. Mortgage rates remain around 6.9% and the previously anticipated decreases pushed back toward the end of the year.
With much of 2024 ahead of us we are expecting a modest increase in inventory as well as the number of buyers in the market - as both sellers and buyers come to terms with the present state of the market and choose to move on with their lives in new homes that better meet their present needs, as opposed to waiting for interest rates to decline.
For a deeper engagement with our market insights or to explore real estate opportunities, we encourage you to connect with our expert team, poised to guide you through the intricacies of these dynamic regions. Our teams of Real Estate Advisors are adept at navigating this evolving landscape. They are informed and equipped with forwardthinking strategies, embracing the opportunities and challenges that lie ahead in our vibrant real estate markets.

 Deirdre O’Connell Chief Executive Officer
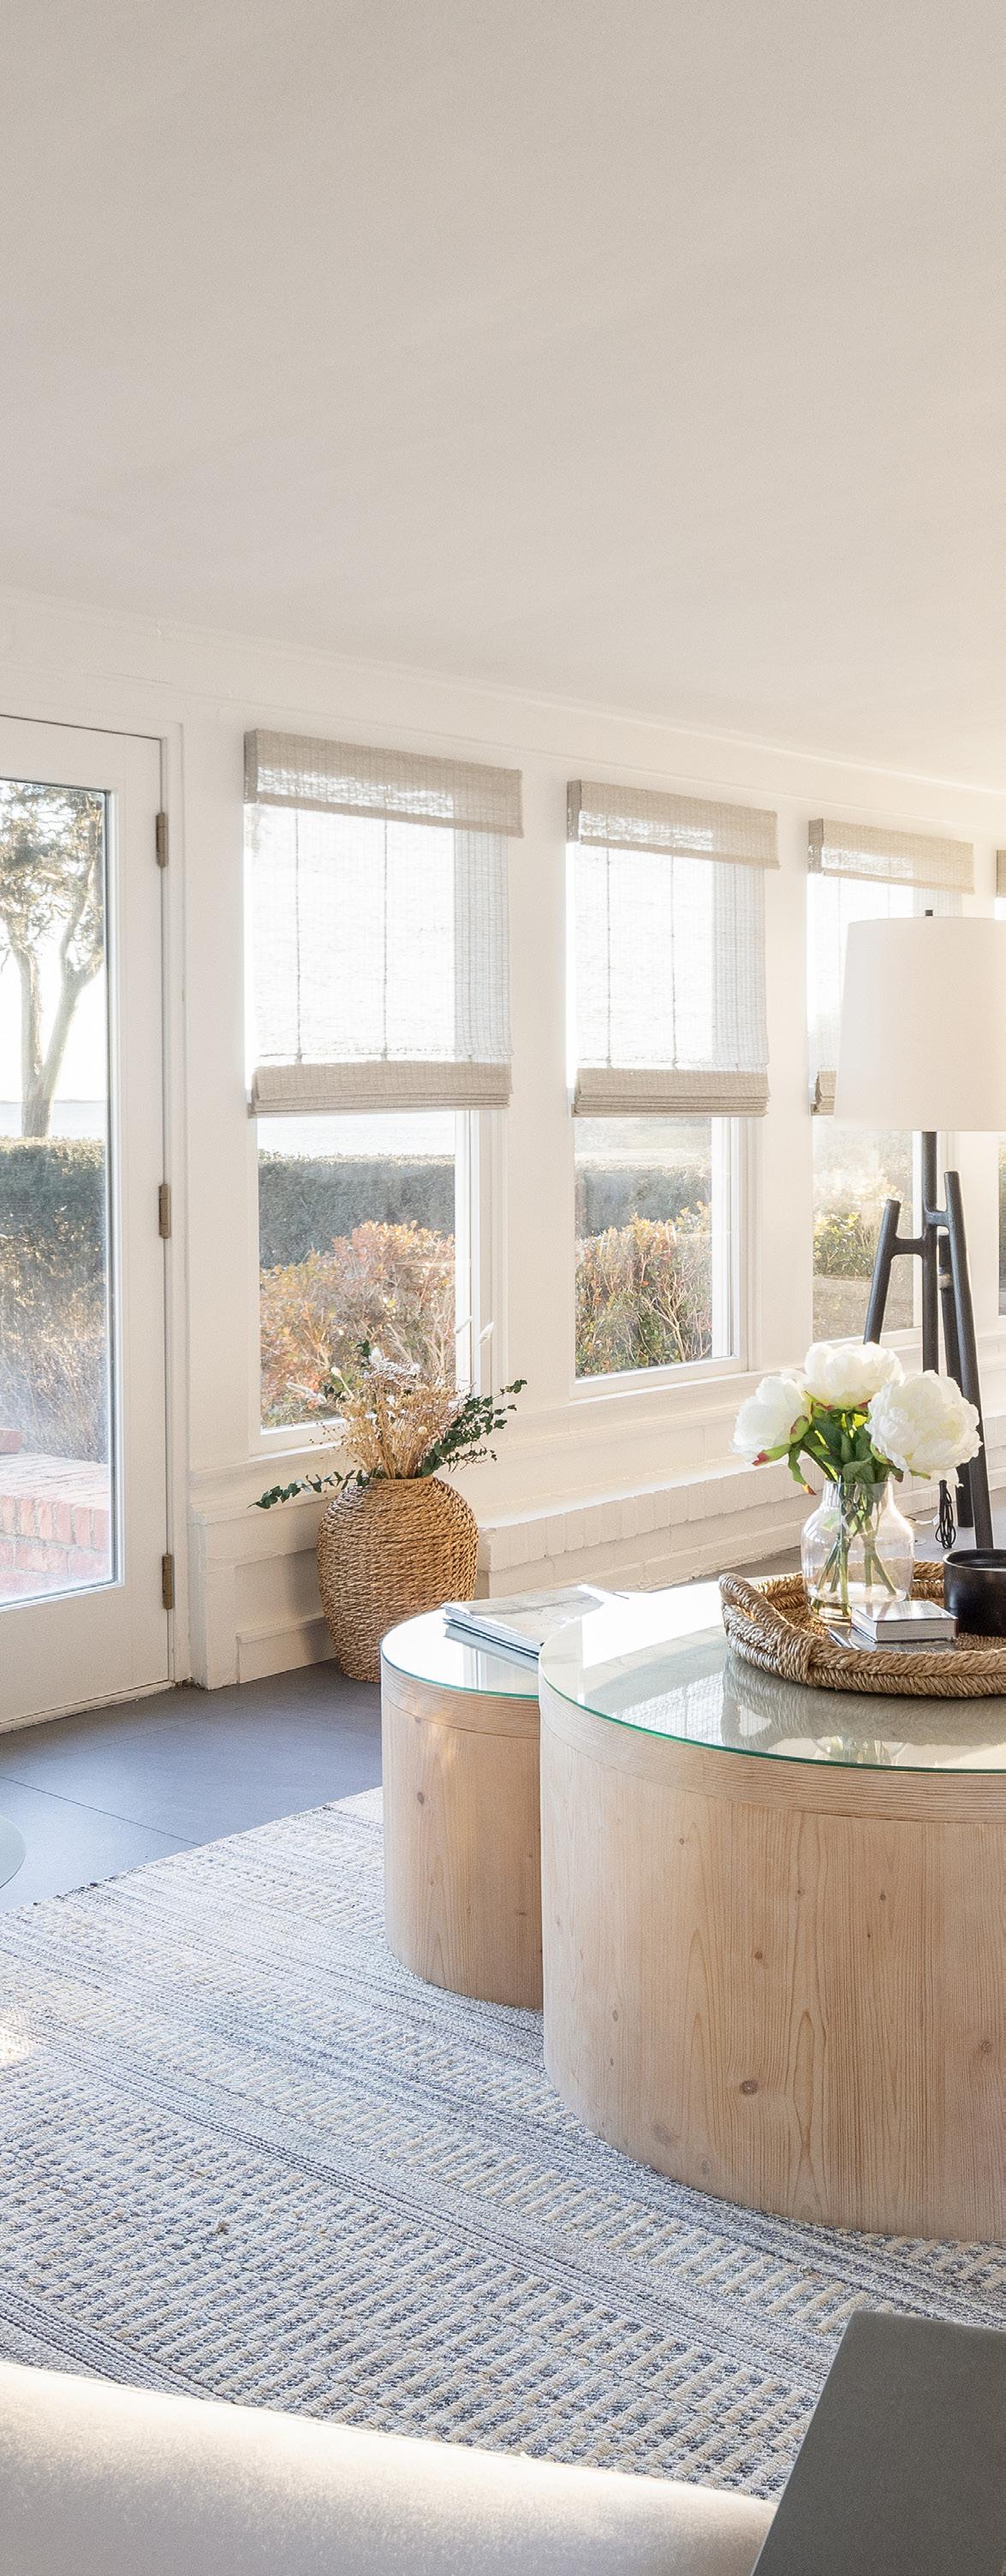
Bellport Village, NY • MLS# 3534922 INSIGHTS • 3
Table of Contents

Brooklyn 10–21 Queens 22–27 Nassau County 28–37 Suffolk County 38–41 North Fork 44–47 Hamptons 48–51
Cover Listing Matinecock, NY • MLS# 3538437 4 • INSIGHTS

Upper Brookville, NY • MLS# 3534999 INSIGHTS • 5
Red Hook, NY • MLS# PRCH-8353197 6 • INSIGHTS
Definitions
Median
The threshold which divides the real estate market into two equal halves, in reference to pricing. One half of the homes in the market were sold at a price above the median home price, while the other half were sold below that price.
Average
The sum of prices of all homes sold in a certain area in a certain period, divided by the number of properties sold in the same area in that period.
Inventory
Housing inventory is a measure of our market's supply and affects value. Inventory is measured as active properties on the market at the end of the quarter.
INSIGHTS • 7
Nassau County
Brooklyn Queens Click to Explore Data by County


Suffolk County
North Fork Hamptons


Brooklyn
Q1 2024 Summary • January 1 – March 31, 2024
2,438 0%
Number of Sales
Q1 2024 vs Q1 2023
119 +4%
Average Days on Market Q1 2024 vs Q1 2023
$968K +4%
Median Sales Price Q1 2024 vs Q1 2023
$1.25M +4%
Average Sales Price Q1 2024 vs Q1 2023
1,754 -12%
Listing Inventory
Q1 2024 vs Q1 2023
10 • INSIGHTS

Bushwick, NY • MLS# PRCH-7760102 INSIGHTS • 11
Residential
2024 Summary • January 1 – March 31, 2024

Bay Ridge
Bedford Stuyvesant
Boerum Hill
Brooklyn Heights
Bushwick
Carroll Gardens
Clinton Hill
Cobble Hill
Crown Heights
Ditmas Park
Dumbo
East Williamsburg
Flatbush
Fort Greene
Greenpoint
Greenwood
Kensington
Midwood
Ocean Hill
Park Slope
Prospect Heights
Prospect Lefferts
Prospect Park South
Red Hook
Sunset Park Williamsburg Windsor Terrace 48 45 34 81 60 23 37 15 95 31 53 11 36 29 66 23 57 27 11 115 33 38 11 18 64 25 118 20 -20% -13% -8% -33% -23% -44% -14% -29% 7% 0% -26% 10% -41% -3% 10% -15% 16% -37% -35% -3% -8% 23% 22% -28% -25% 14% 7% -23%
YTD 2024 %CHANGE YTD '23 vs '24 INVENTORY NEIGHBORHOOD
Active Listings Click Here To View 12 • INSIGHTS
Stuyvesant Heights
Q1
Brooklyn
$745,000 $1,082,500 $2,490,000 $1,375,000 $1,100,000 $2,742,500 $850,874 $1,600,000 $1,100,000 $1,138,200 $1,732,500$720,000 $2,150,000 $1,675,000 $1,492,500 $625,000 $950,000 $990,000 $1,495,000 $1,242,500 $1,155,714 $875,000 $1,999,950 $1,097,500 $1,165,000 $1,340,000 $977,500
127 109 84 112 85 121 128 85 131 137 217161 146 77 199 165 197 117 93 73 122 303 246 175 147 126 89 -25% 0% 100% 16% 13% 10% -29% -20% 8% -24% -17%6% 123% 50% 19% -4% 7% 3% -5% -8% 22% 30% 26% 13% 29% -6% -2% 63 76 21 64 96 29 37 23 94 27 47 4 58 17 42 17 39 47 12 113 46 27 25 6 72 51 122 27 56 104 25 70 79 22 52 11 75 19 26 0 39 19 88 22 61 65 16 111 22 21 12 8 64 57 141 26 -11% 37% 19% 9% -18% -24% 41% -52% -20% -30% -45% -100% -33% 12% 110% 29% 56% 38% 33% -2% -52% -22% -52% 33% -11% 12% 16% -4% YTD 2024 YTD 2024 %CHANGE YTD '23 vs '24 %CHANGE YTD '23 vs '24 YTD 2023 YTD 2024 %CHANGE YTD '23 vs '24 YEAR-TO-DATE UNIT SALES MEDIAN SELLING PRICE YEAR-TO-DATE DAYS ON MARKET 39% 0% 11% -8% -41% -8% 3% 4% -4% -9% 29%39% 83% -27% 44% 67% -34% 68% 15% -33% 3% 185% 49% 21% 32% 41% -12% INSIGHTS • 13
Rentals
Q1 2024 Summary • January 1 – March 31, 2024

Bay Ridge
Bedford Stuyvesant
Boerum Hill
Brooklyn Heights
Bushwick
Carroll Gardens
Clinton Hill
Cobble Hill
Crown Heights
Ditmas Park
Dumbo
East Williamsburg
Flatbush
Fort Greene
Greenpoint
Greenwood
Kensington
Midwood
Ocean Hill
Park Slope
Prospect Heights
Prospect Lefferts
Prospect Park South
Brooklyn
Stuyvesant Heights Sunset Park Williamsburg Windsor Terrace 13 54 16 60 93 20 45 15 82 16 24 10 55 16 53 17 13 4 23 85 21 22 7 9 73 11 136 8 -43% -13% -27% 13% -2% -50% -49% -17% 37% 33% -8% 0% 62% -41% 61% 113% -32% 33% 92% 15% -36% 100% -22% 29% 33% -27% 30% -27% YTD 2024 %CHANGE YTD '23 vs '24 INVENTORY Crown Heights, NY MLS# PRCH-7752625 Active Listings Click Here To View 14 • INSIGHTS NEIGHBORHOOD
Red Hook
$4,500 $5,200 $3,075 $4,500 $3,740 $4,075 $3,325 $3,196 $6,898 $3,850 $2,704 $4,213 $4,100 $3,100 $2,575 $2,875 $2,900 $4,000 $3,850 $2,988 $2,695 $3,800 $3,050 $2,500 $4,500 $3,725
50 54 48 69 70 42 45 45 51 31 82 101 82 51 52 31 36 24 50 58 49 47 64 66 54 53 48 25 2% 25% 61% 30% 33% -14% 13% 27% 1% -40% 4% 211% -31% 82% 17% -13% -27% -93% -44% 36% -19% 44% 23% 0% 21% 104% -24% -62% 35 106 71 102 128 76 149 54 194 18 55 30 48 57 112 28 28 14 16 209 84 30 12 15 125 36 520 28 18 96 43 111 93 43 122 48 110 12 28 16 43 74 65 21 18 2 14 196 50 24 13 9 90 13 310 22 -49% -9% -39% 9% -27% -43% -18% -11% -43% -33% -49% -47% -10% 30% -42% -25% -36% -86% -13% -6% -40% -20% 8% -40% -28% -64% -40% -21% YTD 2024 %CHANGE YTD '23 vs '24 YTD 2023 YTD 2024 %CHANGE YTD '23 vs '24 YEAR-TO-DATE UNIT SALES MEDIAN SELLING PRICE YEAR-TO-DATE DAYS ON MARKET $2,307 $3,050
-15% 5% 14% 19% 3% 8% 4% -3% 11% 37% 17% 14% 3% 12% 5% -11% -3% -9% 2% 5% 3% 0% -5% 9% 2% 20% 20% 27% YTD 2024 %CHANGE YTD '23 vs '24 INSIGHTS • 15
Town Homes
Q1 2024 Summary • January 1 – March 31, 2024
Bay Ridge
Bedford Stuyvesant
Boerum Hill
Brooklyn Heights
Bushwick
Carroll Gardens
Clinton Hill
Cobble Hill
Crown Heights
Ditmas Park
Dumbo
East Williamsburg
Flatbush
Fort Greene
Greenpoint
Greenwood
Kensington
Midwood
Ocean Hill
Park Slope
Prospect Heights
Lefferts
Brooklyn
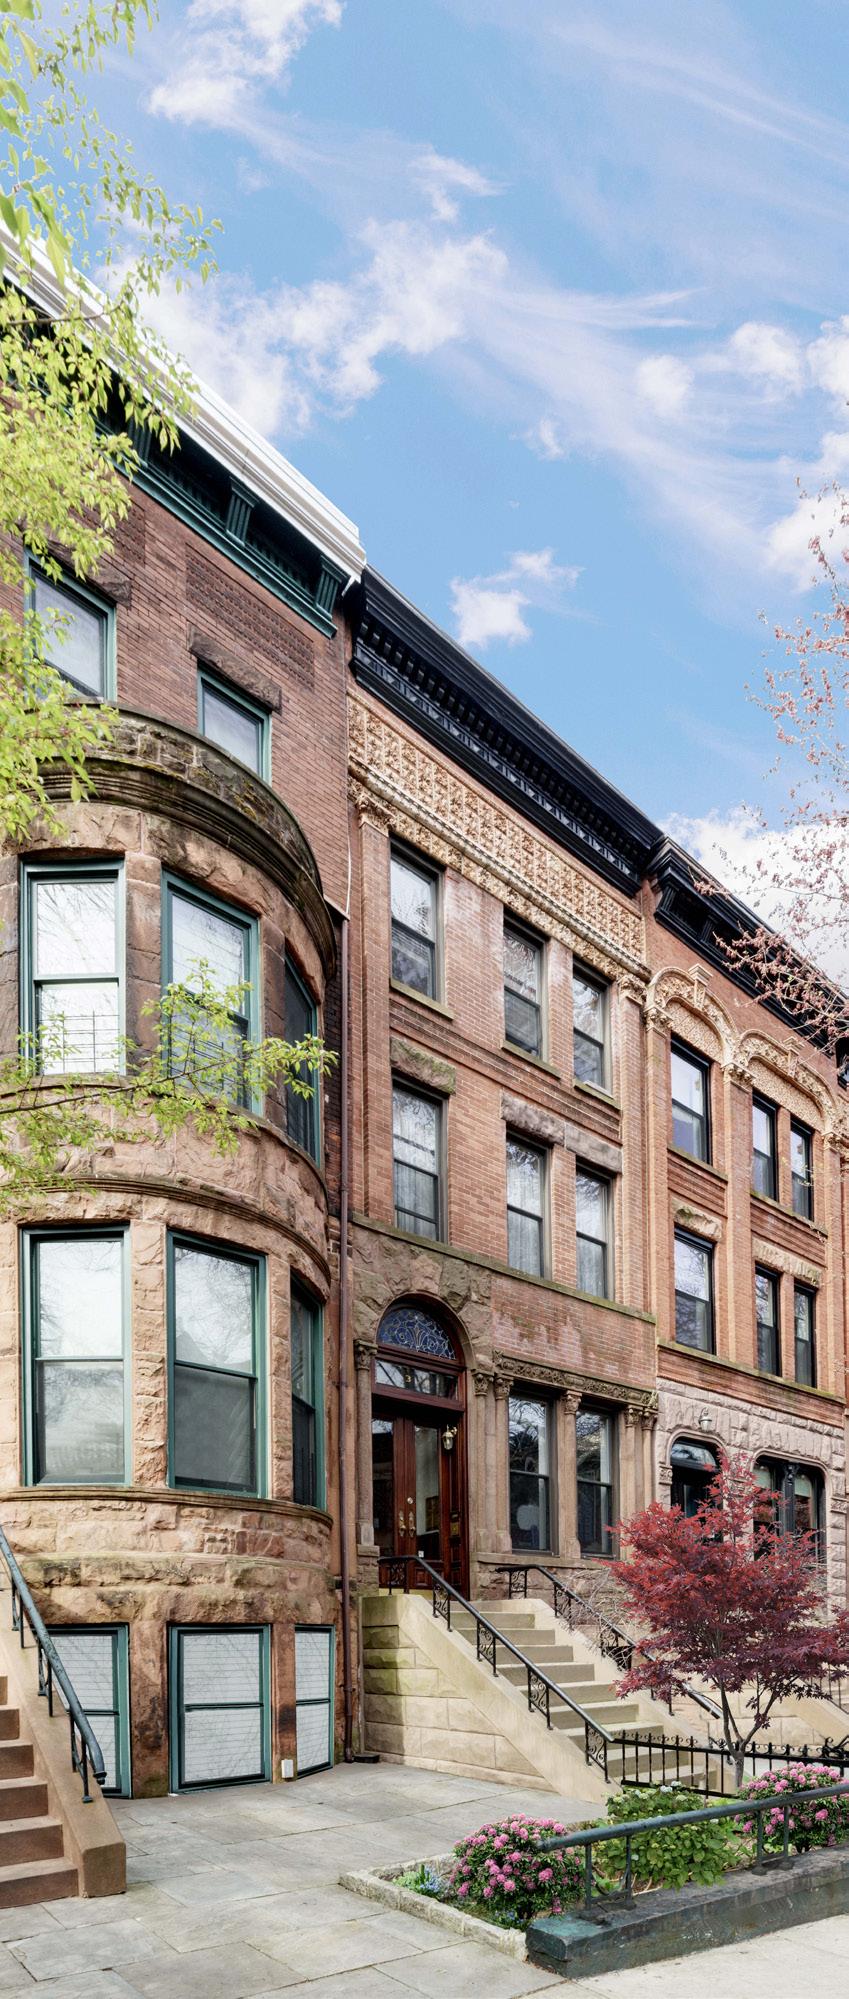
Hook Stuyvesant Heights Sunset Park Williamsburg Windsor Terrace 20 19 13 19 21 14 13 7 36 6 0 3 12 9 11 9 6 4 8 38 2 12 2 8 39 3 19 4 -13% -34% 44% 46% 40% -22% 30% 0% 29% -33%50% 9% 0% -15% 0% 100% -60% -11% 15% 0% 33% 100% -20% -25% -75% 58% -60% YTD 2024 %CHANGE YTD '23 vs '24 INVENTORY Park Slope, NY MLS# PRCH-8056485 Active Listings Click Here To View 16 • INSIGHTS NEIGHBORHOOD
Prospect
Prospect Park South Red
$460,000 $999,999 $2,362,466 $1,737,500 $1,150,000 $2,625,000 $800,000 $2,200,000 $990,000 $1,200,000 $1,550,000$727,588 $2,550,000 $1,712,500 $1,340,000 $585,566 $960,000 $580,000 $1,450,000 $1,711,250 $1,227,857 $665,000 $1,999,900 $999,000 $990,000 $1,250,000 $1,415,000
47 127 139 179 100 117 112 57 100 174124 96 45 174 104 62 204 89 144 69117 123 54 53 35 36 6 4 67 12 10 7 37 19 0 3 28 6 7 7 12 30 8 31 8 10 3 4 47 29 20 12 27 46 4 4 46 13 10 3 39 10 1 0 20 9 18 13 22 44 12 18 5 11 0 2 48 37 20 9 -23% 28% -33% 0% -31% 8% 0% -57% 5% -47%-100% -29% 50% 157% 86% 83% 47% 50% -42% -38% 10% -100% -50% 2% 28% 0% -25% YTD 2024 %CHANGE YTD '23 vs '24 YTD 2023 YTD 2024 %CHANGE YTD '23 vs '24 YEAR-TO-DATE UNIT SALES MEDIAN SELLING PRICE YEAR-TO-DATE DAYS ON MARKET
-63% -39% 7% -74% -3% -21% -70% -55% -24% -31%-25% -24% 1% 1% -57% -24% -53% -56% -47% -3% -45% -3% -22% -32% -44% -19% YTD 2024 %CHANGE YTD '23 vs '24 -53% 26% 34% -19% -49% 4% -4% -46% -11% 10%84% -10% -69% 53% 36% -77% 164% 8% 2% 211%-19% 71% -50% -35% INSIGHTS • 17
Condos
Q1 2024 Summary • January 1 – March 31, 2024

Bay Ridge
Bedford Stuyvesant
Boerum Hill
Brooklyn Heights
Bushwick
Carroll Gardens
Clinton Hill
Cobble Hill
Crown Heights
Ditmas Park
Dumbo
East Williamsburg
Flatbush
Fort Greene
Greenpoint
Greenwood
Kensington
Midwood
Ocean Hill
Park Slope
Prospect Heights Prospect Lefferts Prospect Park South
Brooklyn
Hook Stuyvesant Heights Sunset Park Williamsburg Windsor Terrace 1 25 21 36 38 8 13 6 41 10 52 8 12 14 54 14 22 9 3 50 12 20 1 9 23 13 94 9 -67% 9% -22% -38% -39% -64% 18% -25% -7% 233% -28% 0% -70% 0% 17% -22% 38% -55% -63% -11% -37% 33% -80% -40% -28% 333% 6% 125% YTD 2024 %CHANGE YTD '23 vs '24 INVENTORY Active Listings Click Here To View 18 • INSIGHTS NEIGHBORHOOD
Red
$540,000 $1,090,500 $3,017,500 $1,375,000 $927,500 $4,150,000 $999,000 $2,183,305 $600,000 $974,100 $1,935,000$787,500 $1,787,500 $1,575,000 $1,525,000 $532,000 $930,000 $1,100,000 $1,730,000 $1,190,000 $555,000 $970,000
$1,002,500 $900,000 $1,450,000 $1,042,500
44 106 73 192 80 123 256 108 148217193 141 82 207 225 329 45 124 65 178 500 246 233134 119 3 40 12 14 29 15 13 12 50 2 47 1 19 3 34 10 9 7 4 37 16 11 13 1 24 10 97 4 3 57 20 20 32 7 20 4 28 1 25 0 11 7 65 9 22 4 2 48 4 7 8 6 16 14 113 5 0% 43% 67% 43% 10% -53% 54% -67% -44% -50% -47% -100% -42% 133% 91% -10% 144% -43% -50% 30% -75% -36% -38% 500% -33% 40% 16% 25% YTD 2024 %CHANGE YTD '23 vs '24 YTD 2023 YTD 2024 %CHANGE YTD '23 vs '24 YEAR-TO-DATE UNIT SALES MEDIAN SELLING PRICE YEAR-TO-DATE DAYS ON MARKET
-
-54% 29% 189% -65% 50% 108% -39% 56% -37% 1% -8%31% 32% 46% 69% -37% 43% 95% 17% -25% -31% 44%64% 92% 6% 17% YTD 2024 %CHANGE YTD '23 vs '24-12% 10% 25% -36% -18% 92% 39% 4%29%64% 40% -22% 40% 40% 123% -33% 79% 2% -15% 747% 237% 98%50% -25% INSIGHTS • 19
Co-Ops
Q1 2024 Summary • January 1 – March 31, 2024

Bay Ridge
Bedford Stuyvesant
Boerum Hill
Brooklyn Heights
Bushwick
Carroll Gardens
Clinton Hill
Cobble Hill
Crown Heights
Ditmas Park
Dumbo
East Williamsburg
Flatbush
Fort Greene
Greenpoint
Greenwood
Kensington
Midwood
Ocean Hill
Park Slope
Prospect Heights
Prospect Lefferts
Prospect Park South
Brooklyn
Stuyvesant Heights Sunset Park Williamsburg Windsor Terrace 27 1 0 26 1 1 11 2 18 15 1 0 12 6 1 0 29 14 0 27 19 6 8 1 2 9 5 7 -21%-100% -47% 0% 0% -50% -67% 6% -21%20% -14% 0%-3% 8%-10% 27% -14% 167%100% 29% -44% -42% YTD 2024 %CHANGE YTD '23 vs '24 INVENTORY Active Listings Click Here To View 20 • INSIGHTS NEIGHBORHOOD
Red Hook
$1,150,000 $1,328,000 $2,540,000 $1,100,000 $892,500 $2,850,000 $1,195,000 $975,000 $1,143,577 $1,014,500 $1,885,000$507,000 $845,000 $1,750,000 $1,807,500 $991,500 $895,000 $805,000 $1,600,161 $972,500 $1,850,000$2,100,000 $1,489,547 $1,540,000 $1,382,500 $764,500
152 187375 70 129 75130 323 48149 154 66 65 63 90 105154 73 106 25 0 3 46 0 2 14 4 7 6 0 0 11 8 1 0 18 10 0 45 22 6 9 1 1 12 5 11 26 1 1 46 1 2 22 4 8 8 0 0 8 3 5 0 17 17 2 45 13 3 4 0 0 6 8 12 4%-67% 0%0% 57% 0% 14% 33%-27% -63% 400%-6% 70%0% -41% -50% -56% -100% -100% -50% 60% 9% YTD 2024 %CHANGE YTD '23 vs '24 YTD 2023 YTD 2024 %CHANGE YTD '23 vs '24 YEAR-TO-DATE UNIT SALES MEDIAN SELLING PRICE YEAR-TO-DATE DAYS ON MARKET
246%167% 18%126% 64% 43% 182% 127%73% 51% 211%101% 172%61% 2% 230%83% 414% 254% 105% 8% YTD 2024 %CHANGE YTD '23 vs '24 83%-32%-36% -3% -13% -22%-13% 485% 12%74% -67%-29% -47% 52% -44%2% 10% 31% INSIGHTS • 21
Q1 2024 Summary • January 1 – March 31, 2024
2,783 -9%
Number of Sales
Q1 2024 vs Q1 2023
106 +8%
Average Days on Market
Q1 2024 vs Q1 2023
$650K +2%
Median Sales Price
Q1 2024 vs Q1 2023
$723K +1%
Average Sales Price
Q1 2024 vs Q1 2023
3,731 -8%
Listing Inventory
Q1 2024 vs Q1 2023

22 • INSIGHTS
Queens

• MLS# 3525352 INSIGHTS • 23
Bayside, NY
Q1 2024 Summary • January 1 – March 31, 2024

Bellerose
College Point
Corona
Douglaston
East Elmhurst
Flushing Forest Hills
Fresh Meadows
Glendale
Jackson Heights
Jamaica Estates
Kew Gardens
Little Neck
Long Island City
Maspeth
Middle Village Oakland Gardens
Ozone Park
Rego Park
Hill
Residential
Queens
Astoria Bayside
Albans Sunnyside Whitestone Woodhaven Woodside 117 49 34 39 30 33 15 632 320 17 28 207 27 98 24 29 49 34 95 15 176 8 15 63 38 87 47 100 -2% -17% -28% -20% -3% -27% 25% 19% -21% -43% -18% -14% -4% 15% -33% -6% -26% -6% -31% -38% -9% -50% -12% -24% 3% -14% -4% 0% YTD 2024 %CHANGE YTD '23 vs '24 INVENTORY Active Listings Click Here To View 24 • INSIGHTS NEIGHBORHOOD
Richmond
Ridgewood St.
$670,000 $1,079,000 $725,000 $892,000 $330,000 $955,000 $890,000 $663,630 $397,000 $980,000 $790,000 $390,000 $176,000 $273,000 $335,000 $702,592 $868,500 $800,000 $360,000 $702,500 $449,500 $750,000 $998,000 $640,175 $468,000 $755,000 $800,000 $470,000
131 145 83 69 49 137 223 113 110 59 93 138 121 99 67 109 88 79 99 86 139 114 86 110 93 113 103 73 78 44 48 36 32 31 20 331 172 17 37 133 23 49 52 25 95 47 107 29 90 23 34 89 43 52 67 42 83 38 37 32 49 34 17 309 146 23 35 91 16 34 54 23 64 35 114 16 74 23 35 79 33 43 68 36 6% -14% -23% -11% 53% 10% -15% -7% -15% 35% -5% -32% -30% -31% 4% -8% -33% -26% 7% -45% -18% 0% 3% -11% -23% -17% 1% -14% YTD 2024 %CHANGE YTD '23 vs '24 YTD 2023 YTD 2024 %CHANGE YTD '23 vs '24 YEAR-TO-DATE UNIT SALES MEDIAN SELLING PRICE YEAR-TO-DATE DAYS ON MARKET
-12% 28% 4% 13% -19% -4% 3% -11% -1% -15% 0% -17% -32% -3% 8% -9% 20% -4% -1% 1% 22% -15% 4% 8% 17% -11% 7% 6% YTD 2024 %CHANGE YTD '23 vs '24 0% 99% -18% -29% -64% 95% 300% 22% -5% -26% 29% 2% -2% 28% -23% -57% 19% -12% -2% -13% 28% 50% 28% 7% -3% 7% 7% -8% INSIGHTS • 25
Condos/Co-ops/HOA
Q1 2024 Summary • January 1 – March 31, 2024
Astoria
Bayside
Bellerose
College Point
Corona
Douglaston
East Elmhurst
Flushing
Forest Hills
Fresh Meadows
Glendale
Jackson Heights
Jamaica Estates
Kew Gardens
Little Neck
Long Island City
Maspeth
Middle Village
Oakland Gardens
Ozone Park
Rego Park
Richmond Hill
Ridgewood
St.
Queens
Whitestone Woodhaven Woodside 102 21 12 21 23 16 1 574 286 5 2 195 20 88 19 26 18 14 63 3 163 0 6 1 36 53 6 98 -3% -22% -25% 31% -4% 0% -50% 28% -24% -29% -50% -13% 18% 17% -32% -13% -49% 27% -37% -25% -8%-50%3% 4% -14% 5% YTD 2024 %CHANGE YTD '23 vs '24 INVENTORY
Albans Sunnyside
Active Listings Click Here To View 26 • INSIGHTS NEIGHBORHOOD
Douglaston, NY MLS# 3541647
$482,000 $350,000 $224,000 $460,000 $350,000 $162,000 $250,000 $315,000 $702,083 $493,430 $331,000 $328,000 $500,000 $340,000$730,000 $36,000 $381,500 $425,000 $217,500 $412,740
135 144 168 48 49 94124 115 70 39 144 132 102 69 109 101 75 105 57 14210388 105 32 80 45 20 13 10 17 7 0 197 138 1 1 83 14 41 42 19 36 6 73 2 80 0 11 0 31 20 1 29 54 11 6 6 27 11 0 193 119 5 2 70 10 27 45 22 8 7 85 3 60 0 5 1 22 21 2 23 20% -45% -54% -40% 59% 57%-2% -14% 400% 100% -16% -29% -34% 7% 16% -78% 17% 16% 50% -25%-55%-29% 5% 100% -21% YTD 2024 %CHANGE YTD '23 vs '24 YTD 2023 YTD 2024 %CHANGE YTD '23 vs '24 YEAR-TO-DATE UNIT SALES MEDIAN SELLING PRICE YEAR-TO-DATE DAYS ON MARKET $602,000
-
6% -4% 9% -24% 9% -22%-7% 0% 49% -2% -3% -9% -9% 4% -1% -4% -31% 2% 21% -2%20%6% -5% -25% 15% YTD 2024 %CHANGE YTD '23 vs '24 1% 44% -15% -48% -59% 35%12% -8% -67% -36% -2% 1% 27% -27% -57% 41% -36% -13% 10% 29%72%-13% -6% -73% -4% INSIGHTS • 27
$265,000 $285,000 $515,755 $235,000 $255,000
Nassau County
Q1 2024 Summary • January 1 – March 31, 2024
1,885 -7%
Number of Sales
Q1 2024 vs Q1 2023
63 -14%
Average Days on Market
Q1 2024 vs Q1 2023
$700K +9%
Median Sales Price
Q1 2024 vs Q1 2023
$872K +12%
Average Sales Price
Q1 2024 vs Q1 2023
1,989 -23%
Listing Inventory
Q1 2024 vs Q1 2023

28 • INSIGHTS
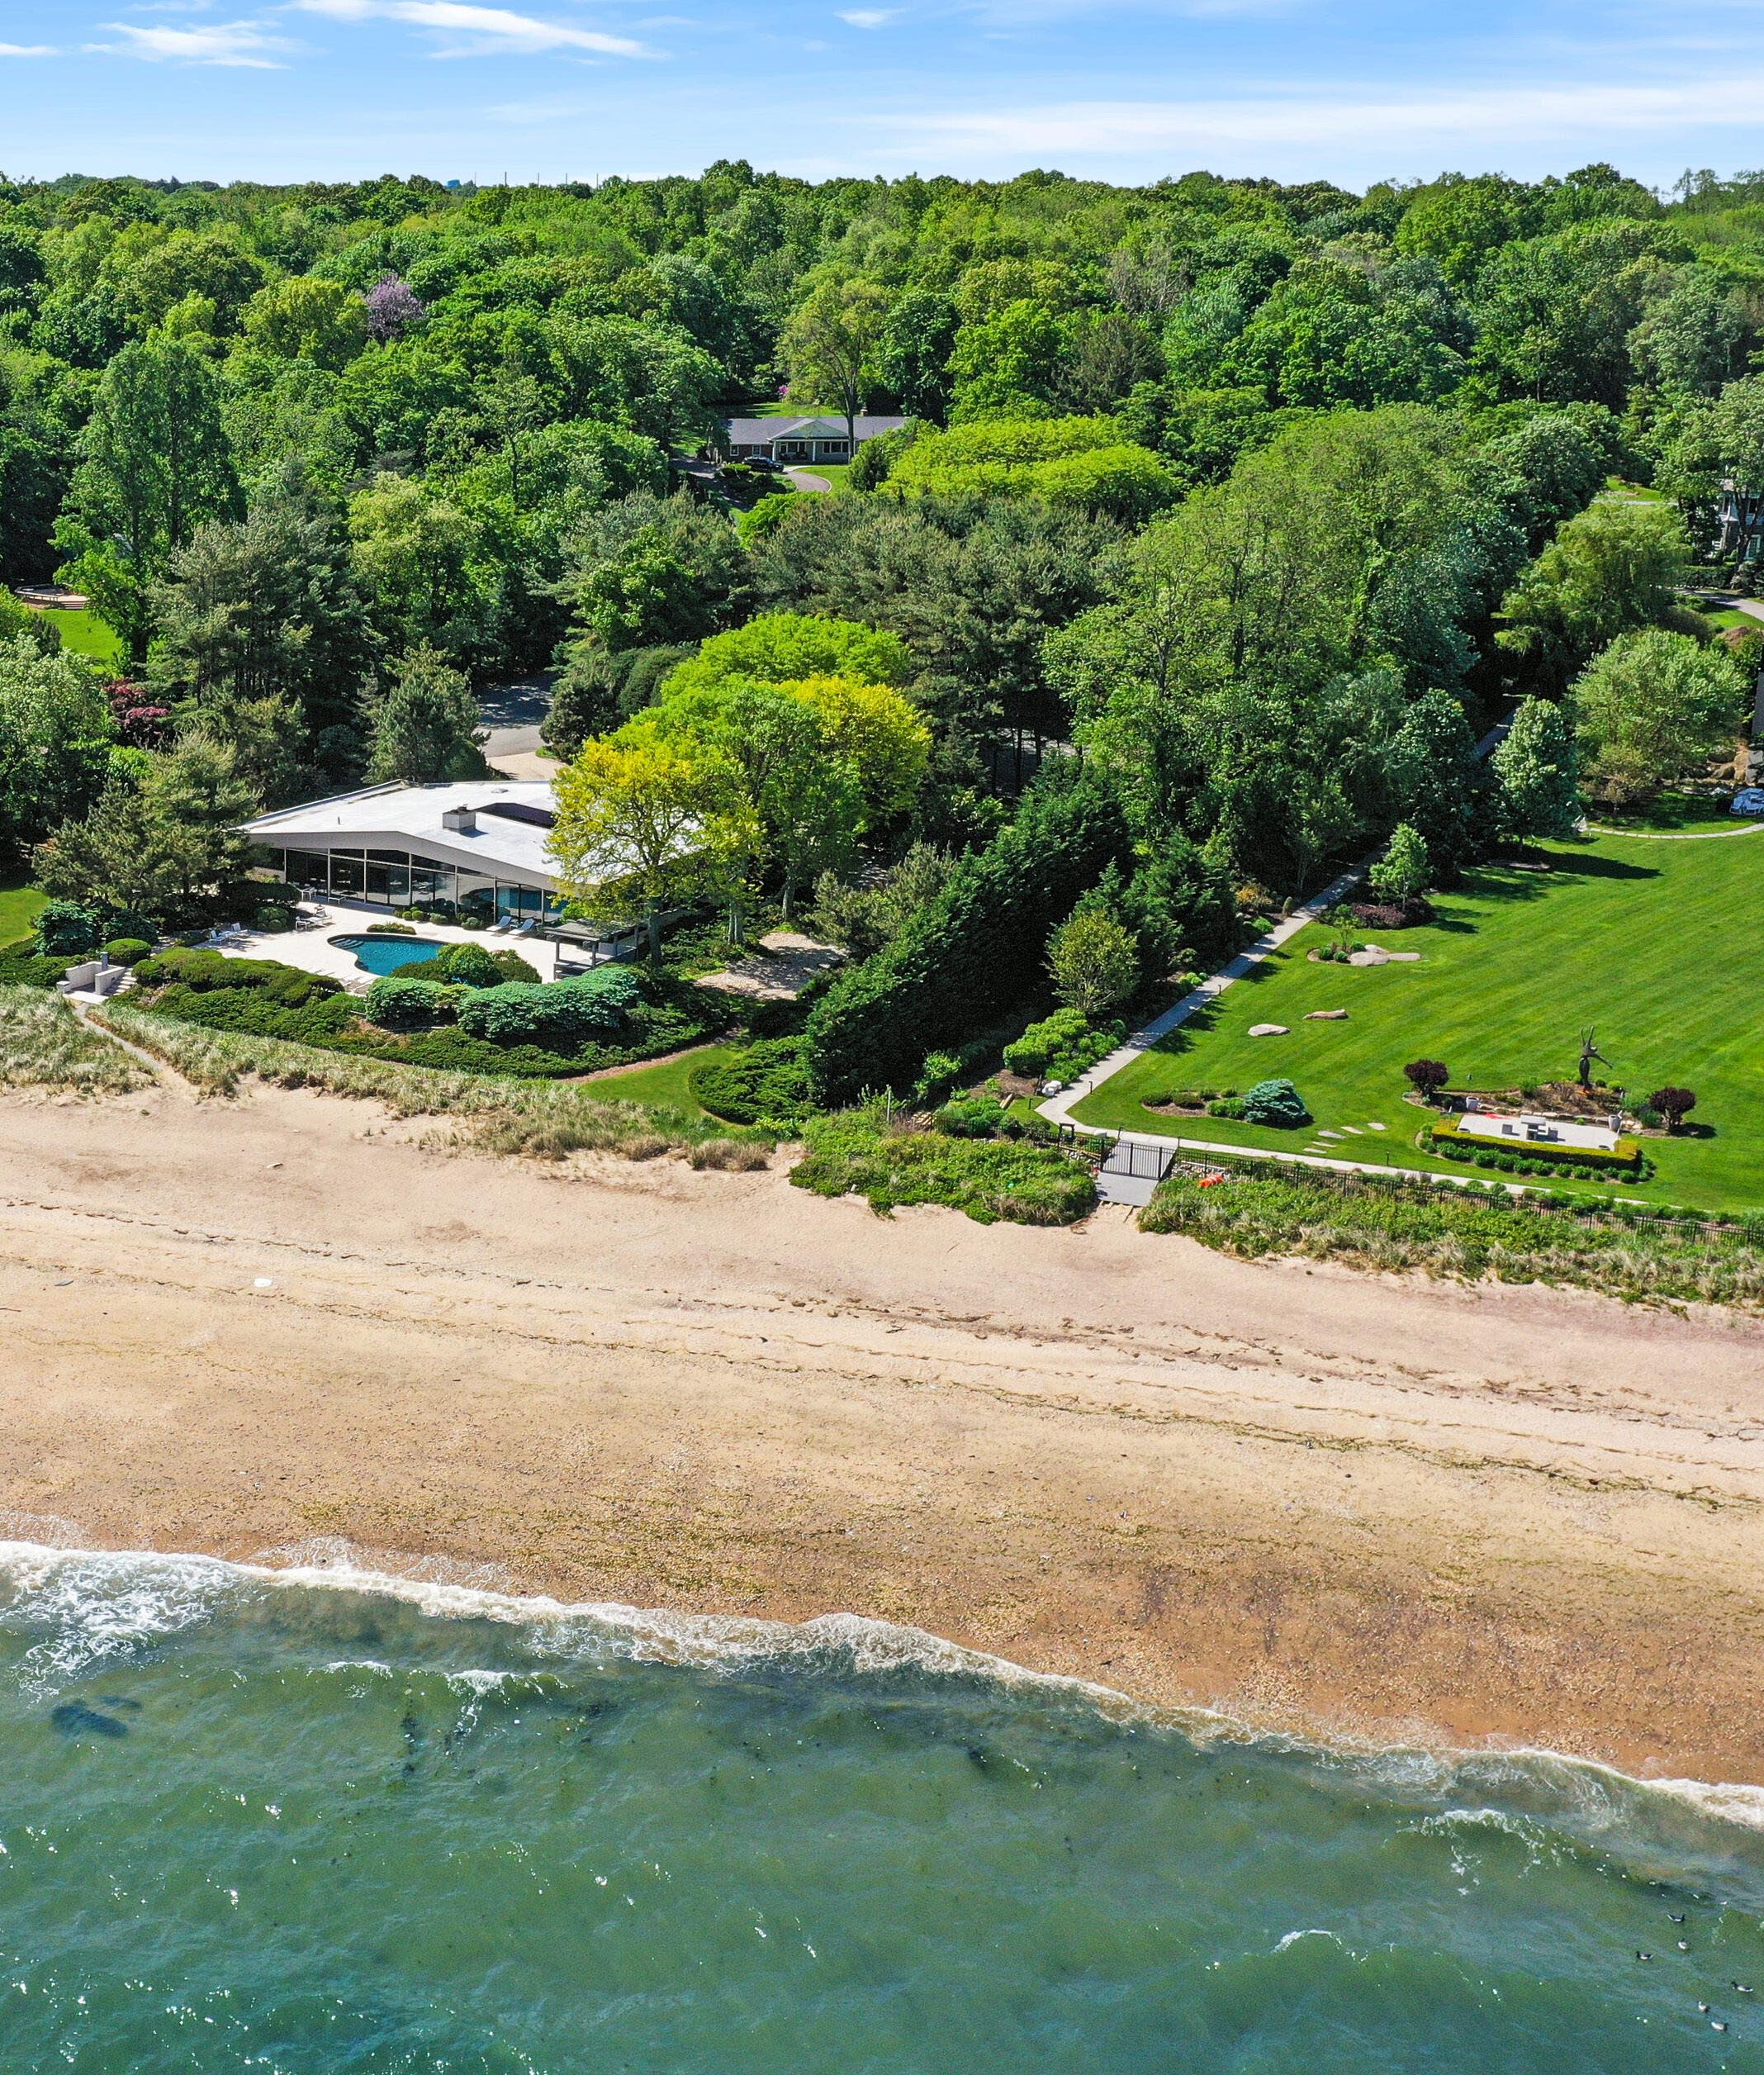
Sands Point, NY • MLS# 3397349 INSIGHTS • 29
Nassau County
Q1 2024 Summary • January 1 – March 31, 2024

Baldwin/N. Baldwin/Baldwin Harbor Bayville
Bellmore/N. Bellmore
Brookville
Carle Place
5-Towns
Centre Island
Residential
Albertson
Atlantic Beach
East Meadow East Norwich Floral Park Franklin Square Freeport Garden City Glen Cove Glen Head/Glenwood Landing Great Neck Greenvale Hicksville Island Park Jericho Kings Point Lattingtown 6 16 44 5 38 8 5 103 6 1 23 3 13 30 4 23 19 60 37 50 13 119 3 47 8 23 2 2 50% 33% -27% -75% -31% -62% -17% -11% -14% -50% -21% 50% 8% -39% 0% 5% -47% -42% -3% -25% 8% -30% -40% -24% -56% -34% 0% 100% YTD 2024 %CHANGE YTD '23 vs '24 INVENTORY Great Neck, NY MLS# 3518696 Active Listings Click Here To View 30 • INSIGHTS NEIGHBORHOOD
Cove Neck East Rockaway East Williston East Hills
$665,000 $1,390,000 $590,000 $1,205,000 $720,000 $3,000,000 $742,500 $735,000 $4,750,000 $5,550,000 $630,000 $1,650,000 $1,570,000 $730,000 $830,000 $662,500 $750,000 $520,000 $1,075,000 $650,000 $890,000 $980,000 $770,000 $670,000 $652,500 $1,199,500
73 34 73 31 49 168 43 107272 53 25 74 47 85 79 70 53 50 71 67 78 124 54 44 5614 6 42 2 60 2 6 49 0 0 22 3 5 71 3 26 26 74 30 36 17 78 1 62 11 20 0 1 7 2 37 4 43 6 8 42 1 3 23 1 12 55 3 22 31 73 33 28 9 81 2 55 6 18 0 0 -50% -67% -12% 100% -28% 200% 33% -14%5% -67% 140% -23% 0% -15% 19% -1% 10% -22% -47% 4% 100% -11% -45% -10%-100% YTD 2024 %CHANGE YTD '23 vs '24 YTD 2023 YTD 2024 %CHANGE YTD '23 vs '24 YEAR-TO-DATE UNIT SALES MEDIAN SELLING PRICE YEAR-TO-DATE DAYS ON MARKET
--6% 8% 0% 39% 10% 67% 19% -8%8% 66% 21% 13% 26% 9% 24% 4% 24% 13% 0% 17% -36% 5% 6% 27%YTD 2024 %CHANGE YTD '23 vs '24 -16% -46% 56% 27% -41% 55% -14% 10%-44% -53% -13% -15% 282% -18% -12% -40% -40% -25% -39% -32% 143% -16% -68% -34%INSIGHTS • 31
Nassau County
2024 Summary • January 1 – March 31, 2024

Manhasset Hills
Masspequa/Massapequa Park
Matinecock
Merrick/N. Merrick Mill Neck Mineola Muttontown New
Residential Q1
Laurel Hollow Levittown
Beach Locust Valley
Beach
Lido
Long
Lynbrook Malverne Manhasset
Hyde
Hills
Old Brookville
Westbury
Bay
Cove Plainview Point Lookout Port Washington Rockville Centre Roslyn Roslyn Estates 14 45 18 17 102 29 7 36 2 89 3 38 8 18 14 30 5 50 7 27 12 8 32 9 41 29 16 3 75% -13% 13% 13% 7% 38% 17% -33% -33% -14% -25% -43% -20% -22% -26% -36% -29% -22% 0% 35% -20% -56% -38% 29% -20% -34% -24% 0% YTD 2024 %CHANGE YTD '23 vs '24 INVENTORY Active Listings Click Here To View 32 • INSIGHTS NEIGHBORHOOD
Park North
Oceanside
Old
Oyster
Oyster Bay
$1,695,000 $657,000 $819,500 $1,450,000 $550,000 $580,000 $724,000 $1,945,000 $1,820,000 $700,000 $3,531,000 $792,500 $4,700,000 $527,500 $1,500,000 $765,000 $2,465,000 $650,750 $4,825,000 $1,900,000 $762,500 $1,600,000 $785,000 $1,065,000 $1,009,500 $669,500 $1,090,000 $2,525,000
49 49 124 59 96 91 69 103 100 52 9 39 10 78 76 51 136 74 29 52 101 88 59 70 62 68 79 66 4 86 6 13 50 36 14 39 5 97 0 62 4 28 8 46 0 54 0 6 13 7 50 1 31 48 11 2 3 73 8 3 55 23 14 30 1 106 1 56 4 42 5 48 2 50 1 8 6 5 62 1 50 48 8 1 -25% -15% 33% -77% 10% -36% 0% -23% -80% 9%-10% 0% 50% -38% 4%-7%33% -54% -29% 24% 0% 61% 0% -27% -50% YTD 2024 %CHANGE YTD '23 vs '24 YTD 2023 YTD 2024 %CHANGE YTD '23 vs '24 YEAR-TO-DATE UNIT SALES MEDIAN SELLING PRICE YEAR-TO-DATE DAYS ON MARKET
41% 15% -10% 51% -1% 3% 4% 32% 23% 8%12% 16% -19% -33% 5%7%-23% 25% -32% 0% -1% 10% -15% 1% 63% YTD 2024 %CHANGE YTD '23 vs '24 73% -17% -16% -5% -12% 31% 43% 14% 55% -19%-47% -90% -2% -36% -25%15%-21% 15% 11% 2% -39% 7% 12% 77% 300% INSIGHTS • 33
Residential Nassau County
Q1 2024 Summary • January 1 – March 31, 2024


Roslyn Harbor Roslyn Heights
Point
Cliff
Stewart Manor Syosset Upper Brookville Valley Stream West Hempstead Wantagh Westbury Williston Park Woodbury 0 18 2 14 6 19 1 0 44 11 66 30 22 48 6 32 -100% -10% -33% -22% -45% -24% 0% -100% -14% -15% -37% -21% -35% -31% 0% -18% YTD 2024 %CHANGE YTD '23 vs '24 INVENTORY Active Listings Click Here To View 34 • INSIGHTS
South Hempstead Sands
Sea
Seaford Searingtown
NEIGHBORHOOD
$1,772,500 $1,200,000 $600,000 $3,450,000 $1,225,000 $667,500
$887,500 $944,444 $2,350,000 $650,000 $655,000 $727,500 $659,500

142 63 46 118 48 3720 52 195 50 71 57 51 16 88 0 18 1 1 6 25 1 5 40 2 78 38 46 82 6 12 2 15 2 5 7 30 0 4 40 5 61 35 40 60 4 15-17% 100% 400% 17% 20% -100% -20% 0% 150% -22% -8% -13% -27% -33% 25% YTD 2024 %CHANGE YTD '23 vs '24 YTD 2023 YTD 2024 %CHANGE YTD '23 vs '24 YEAR-TO-DATE UNIT SALES MEDIAN SELLING PRICE YEAR-TO-DATE DAYS ON MARKET
$835,00023% 3% 19% 29% 12%37% 5% 6% 5% 7% 17% 10% 11% -11% YTD 2024 %CHANGE YTD '23 vs '2413% -22% 293% -25% -31%-70% -11% 621% -31% 18% -4% -34% -71% 33% INSIGHTS • 35 Old Westbury, NY • MLS# 3533796
-
$775,000
Nassau County
Condos/Co-ops/HOA
Q1 2024 Summary • January 1 – March 31, 2024

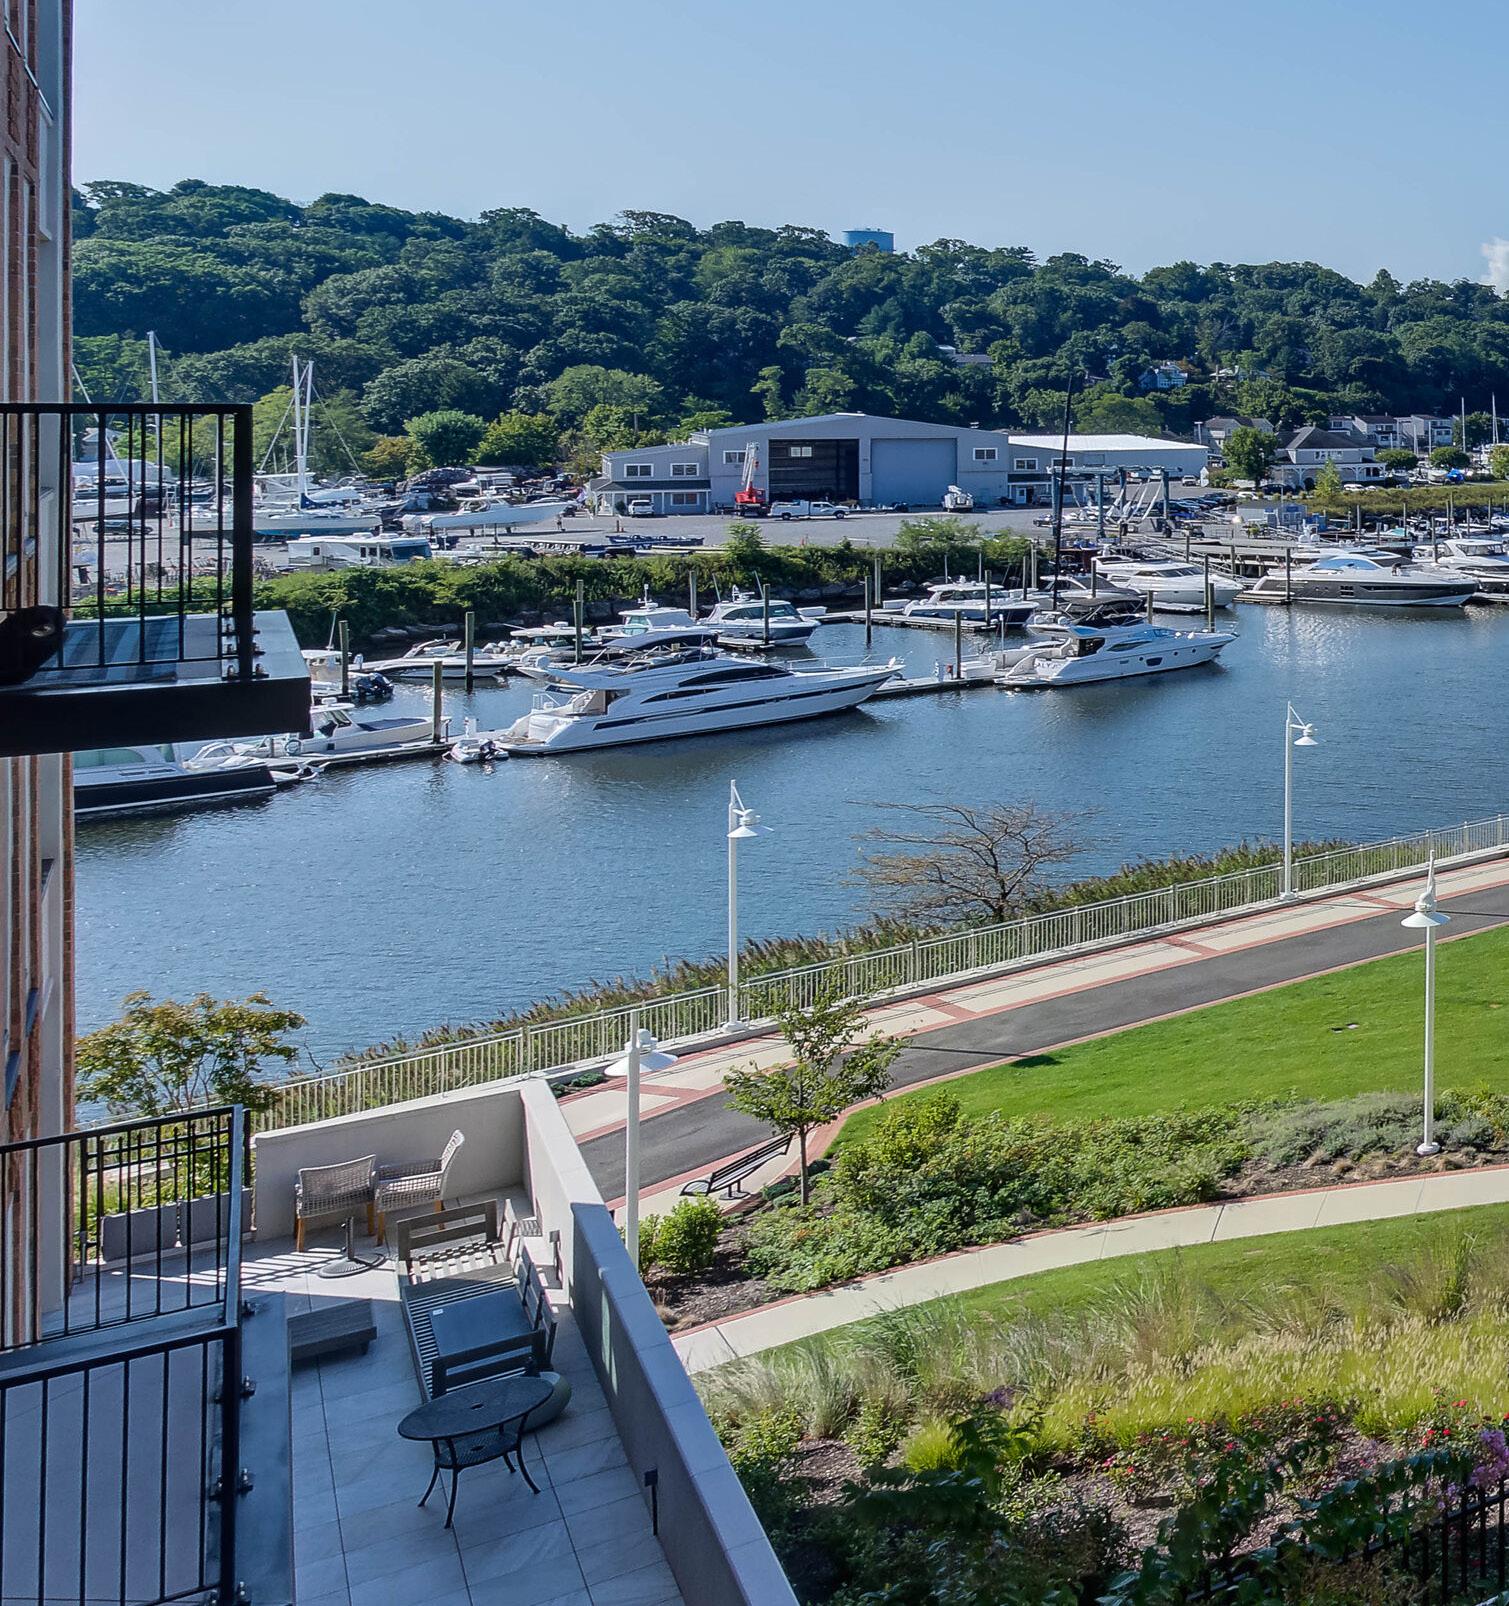
Garden City Glen Cove Glen Head/Glenwood Landing Great Neck Jericho Long Beach Manhasset North Hills Port Washington Rockville Centre Roslyn Roslyn Heights 16 18 0 58 1 46 7 4 9 5 5 1 23% -33%-39% -67% 0% 133% -43% 0% -69% -58% 75% YTD 2024 %CHANGE YTD '23 vs '24 INVENTORY Garden City, NY MLS# 3514919 Active Listings Click Here To View 36 • INSIGHTS
NEIGHBORHOOD
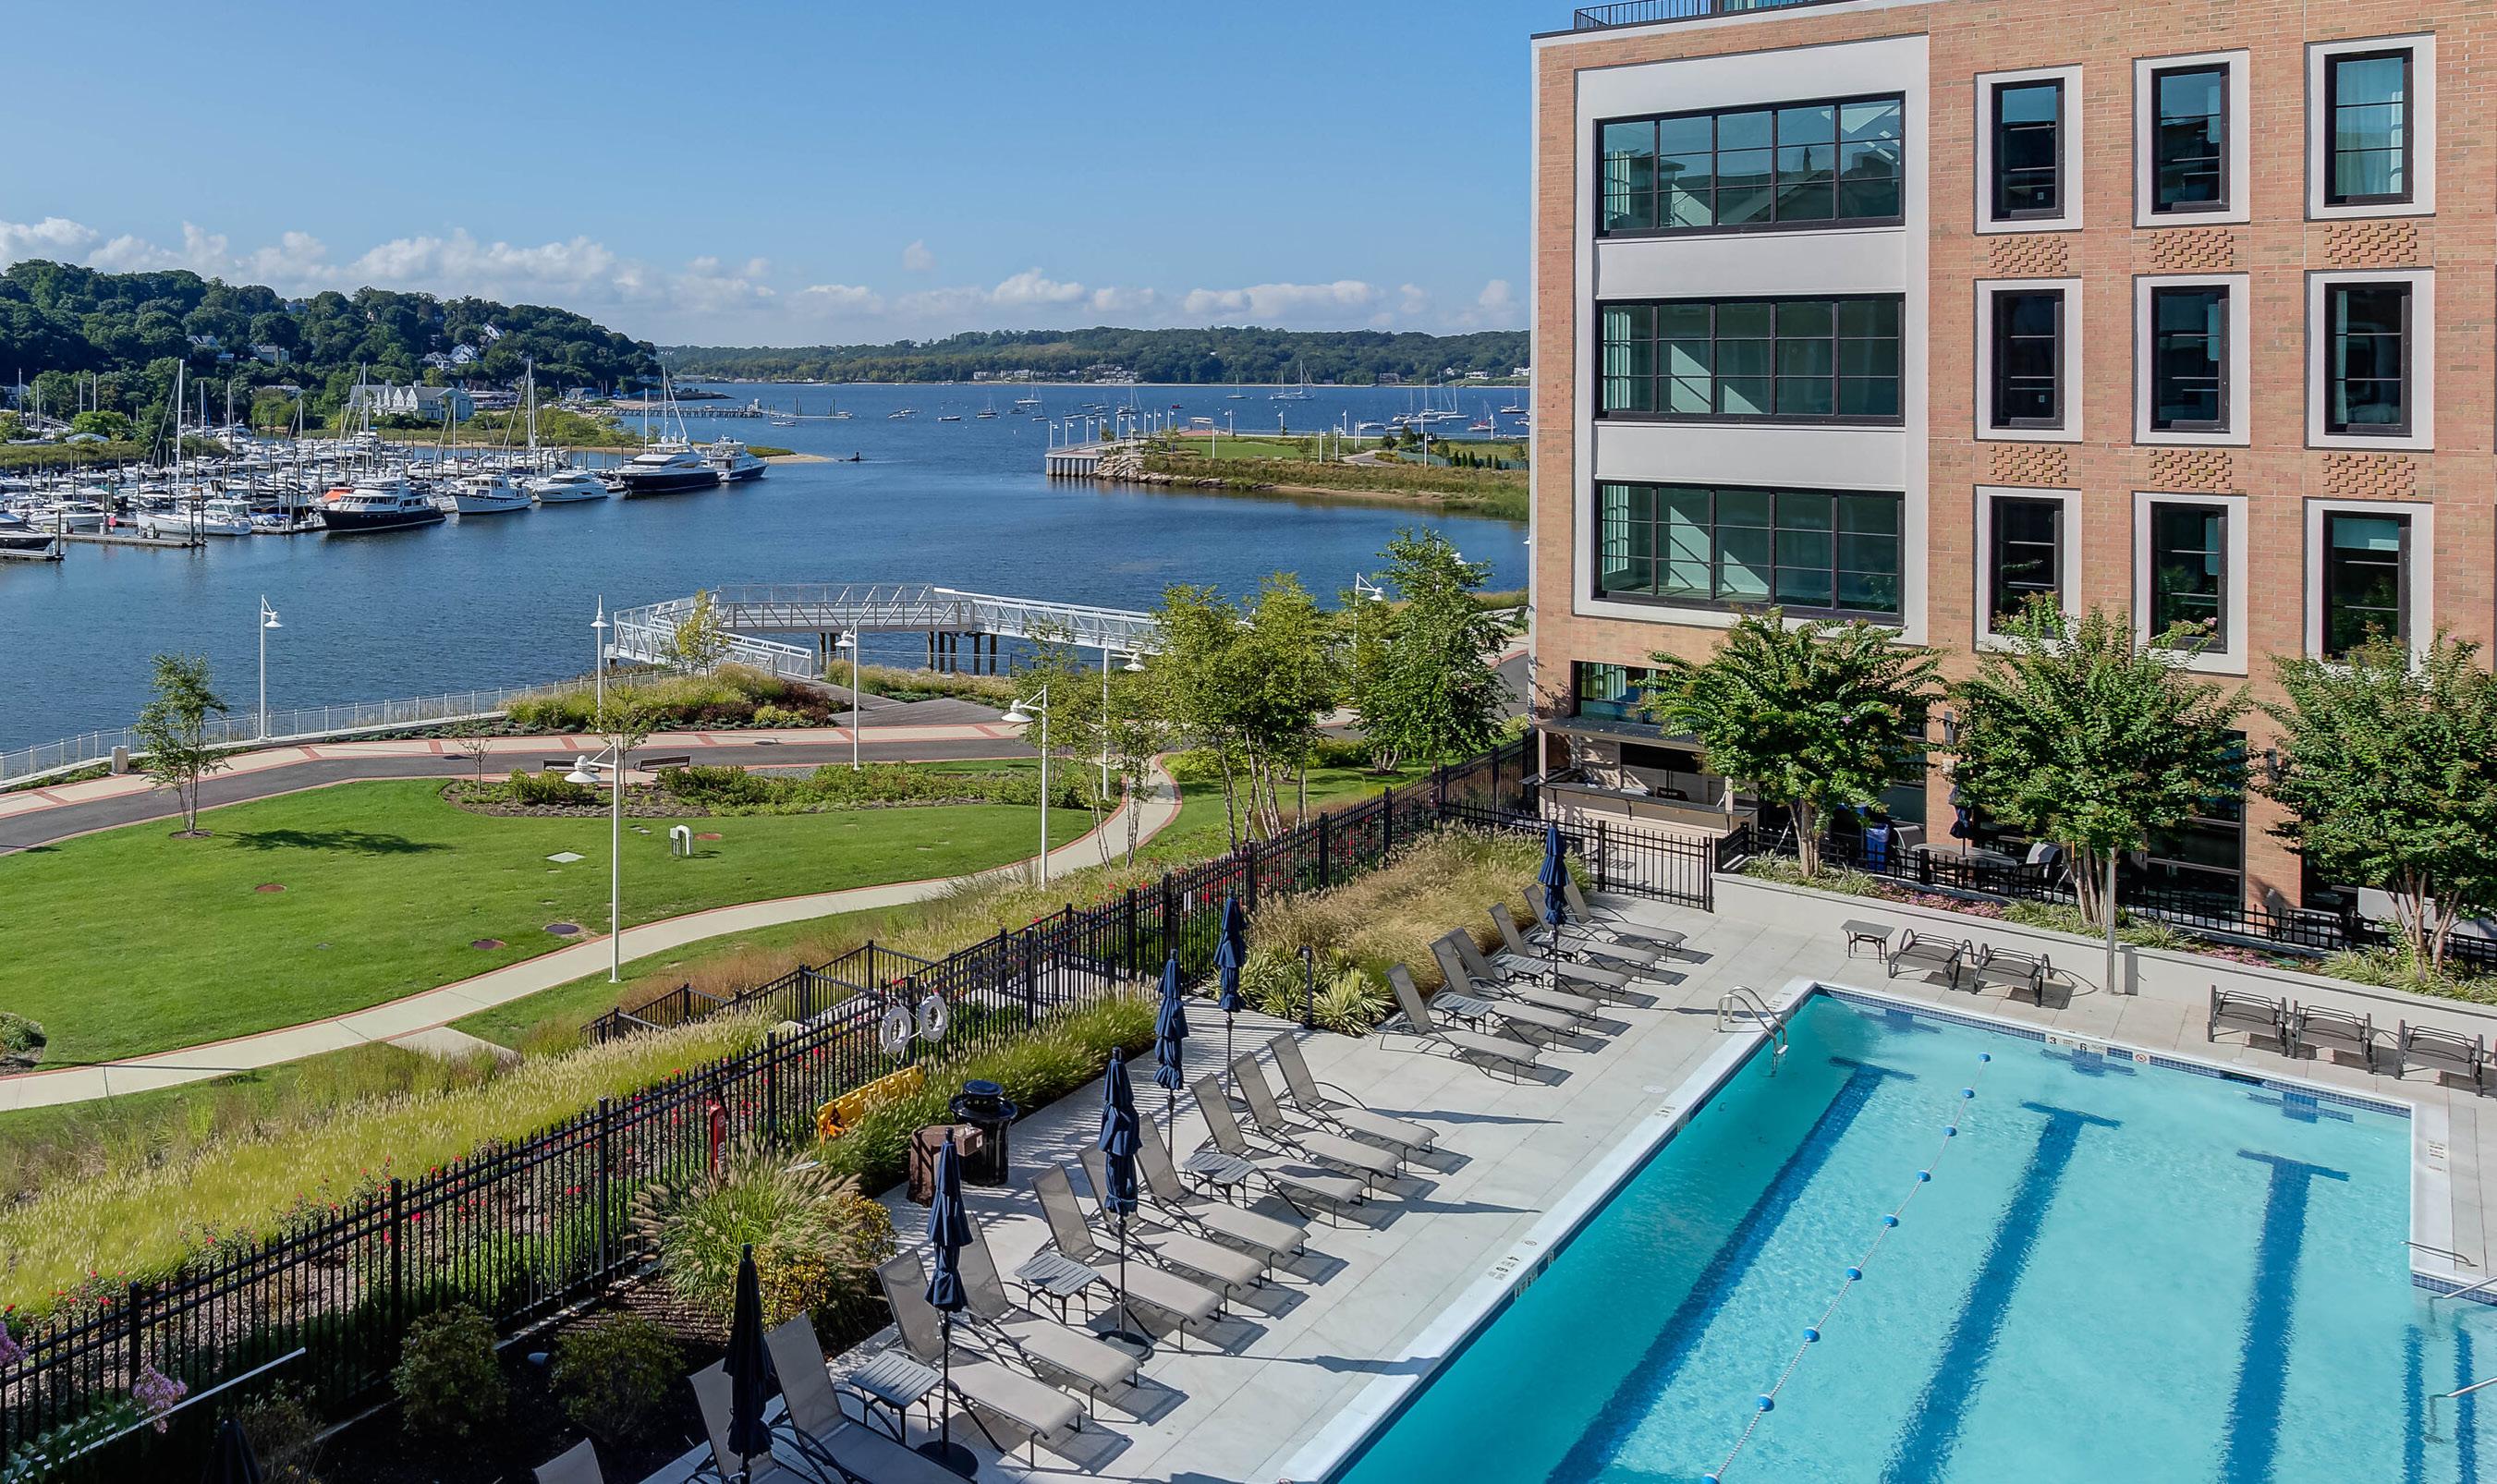
Glen Cove, NY • MLS# 3542866 53 101104 79 67 57 136 84 88 15 22 10 10 1 39 6 31 6 0 6 12 3 3 10 11 0 38 2 33 4 2 9 22 2 3 0% 10% -100% -3% -67% 6% -33%50% 83% -33% 0% YTD 2024 %CHANGE YTD '23 vs '24 YTD 2023 YTD 2024 %CHANGE YTD '23 vs '24 YEAR-TO-DATE UNIT SALES MEDIAN SELLING PRICE YEAR-TO-DATE DAYS ON MARKET $577,500 $369,000 -
$325,000 $993,500 $262,000 52% 14%-2% 34% 4% 15%2% -6% 42% -22% YTD 2024 %CHANGE YTD '23 vs '24 -65% -13%-16% 36% -36% -67%25% 4% -79% -45% INSIGHTS • 37
$357,550 $1,087,000 $425,000 $1,645,000 $2,465,000 $720,000
Suffolk County
Q1 2024 Summary • January 1 – March 31, 2024
2,298 -13%
Number of Sales
Q1 2024 vs Q1 2023
56 -17%
Average Days on Market
Q1 2024 vs Q1 2023
$585K +11%
Median Sales Price
Q1 2024 vs Q1 2023
$714K +10%
Average Sales Price
Q1 2024 vs Q1 2023
2,527 -7%
Listing Inventory
Q1 2024 vs Q1 2023

38 • INSIGHTS
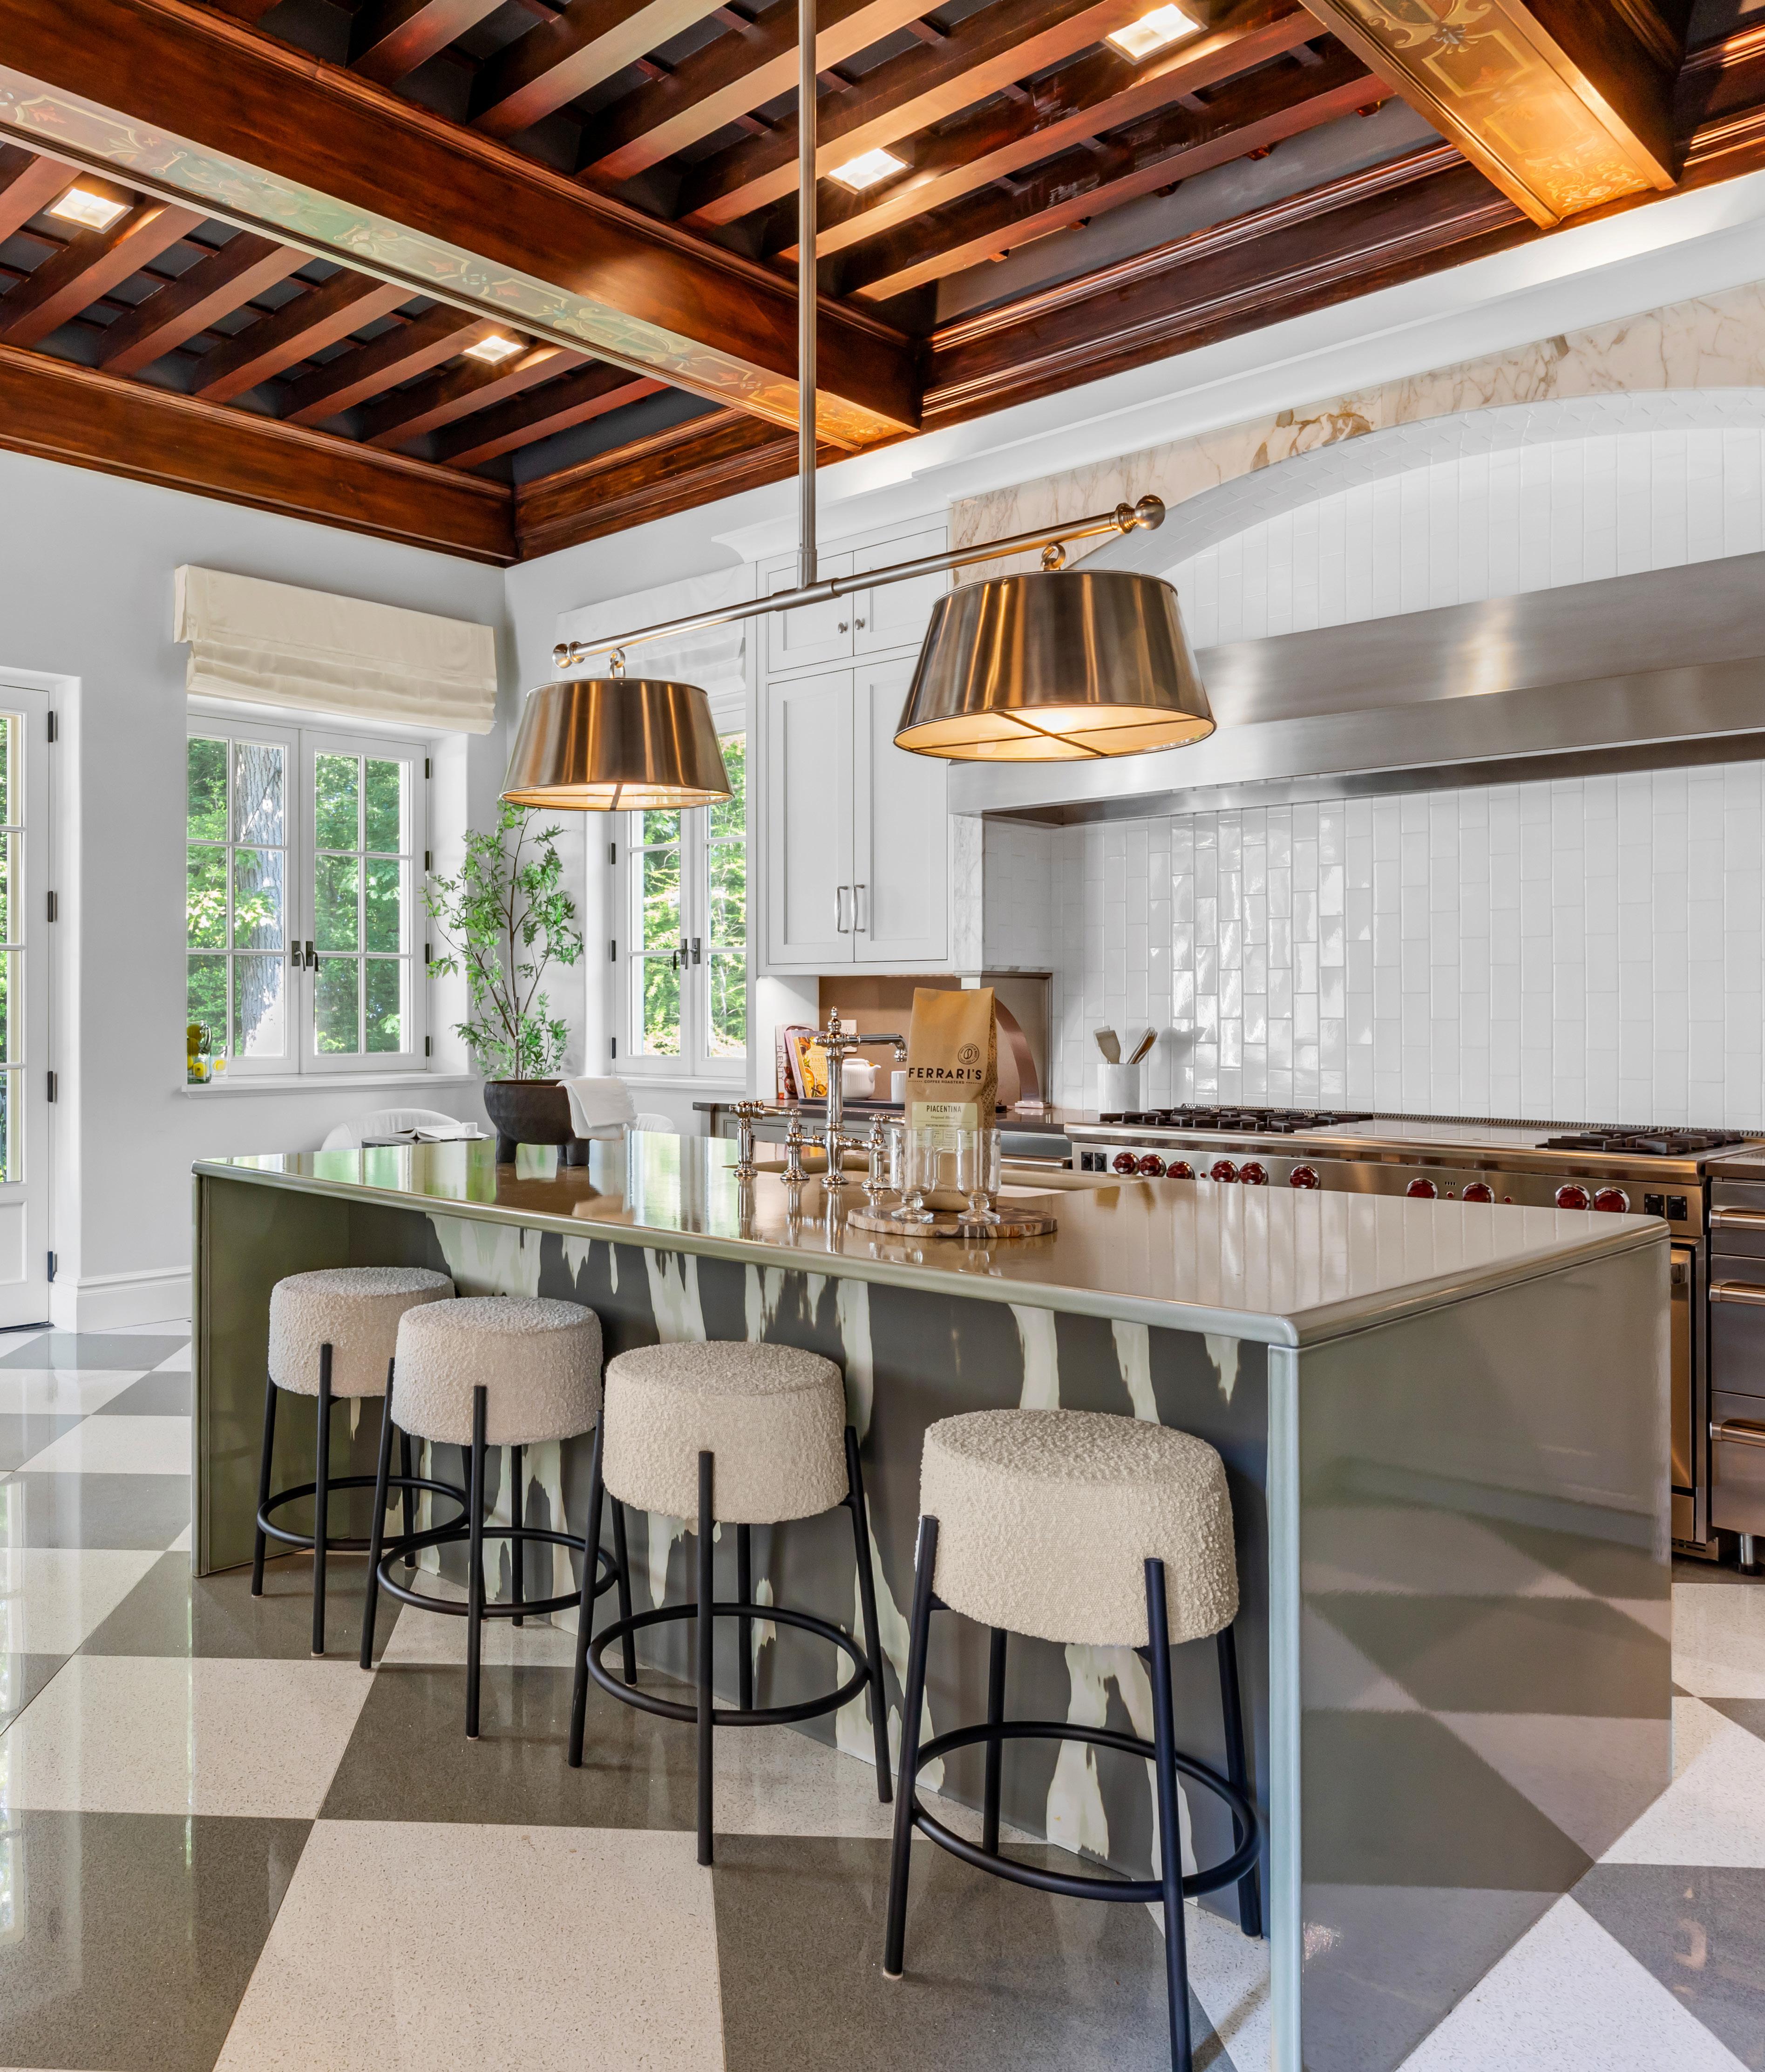
NY • MLS# 3480793 INSIGHTS • 39
Old Field,
Suffolk County
Q1 2024 Summary • January 1 – March 31, 2024

Residential
Asharoken Babylon Bay Shore Belle Terre
Spring Harbor Commack Dix Hills East Northport East Islip Greenlawn Hauppauge
of the
Huntington Huntington Bay Huntington Station Kings Park Lake Grove Lloyd Harbor Lloyd Neck Melville Miller Place Mt. Sinai Nesconset Nissequogue Northport 0 19 47 2 14 26 10 13 24 39 25 14 7 15 0 60 4 32 16 23 10 3 36 15 28 18 7 34-5% -44% -71% -22% -21% -23% 8% -29% -7% -7% -18% 0% 50% -100% 0% 0% -20% -36% 53% -23% 0% -8% 15% 12% -22% -30% -26% YTD 2024 %CHANGE YTD '23 vs '24 INVENTORY Active Listings Click Here To View 40 • INSIGHTS NEIGHBORHOOD
Bellport Centereach Centerport Cold
Head
Harbor
$557,000 $975,000 $448,750 $547,500 $880,000 $1,625,000 $682,500 $954,000 $705,000 $660,000 $907,000 $715,000 $930,000 $800,000 $2,864,500 $600,000 $616,250 $605,000 $2,120,000
$830,000 $600,000 $675,000 $672,500 $965,750 $1,070,000
49 53 98 55 55 55 112 51 52 46 49 55 41 234 60 47 37 65 52 6538 53 57 46 90 122 0 26 79 0 15 39 11 13 46 43 34 24 11 28 1 60 5 58 39 28 5 1 45 24 31 35 7 44 0 14 77 3 12 30 11 5 44 51 46 23 7 32 1 62 2 49 20 17 3 0 31 23 17 24 2 23-46% -3%-20% -23% 0% -62% -4% 19% 35% -4% -36% 14% 0% 3% -60% -16% -49% -39% -40% -100% -31% -4% -45% -31% -71% -48% YTD 2024 %CHANGE YTD '23 vs '24 YTD 2023 YTD 2024 %CHANGE YTD '23 vs '24 YEAR-TO-DATE UNIT SALES MEDIAN SELLING PRICE YEAR-TO-DATE DAYS ON MARKET -
6% 10%8% 15% 24% 6% 1% 7% 11% 18% 53% 26% -50% 24% 91% 16% 4% -4% 36%11% -1% 12% 22% -3% 40% YTD 2024 %CHANGE YTD '23 vs '24-29% -31%-34% 13% 33% 42% 2% -22% 9% -23% -44% -16% 420% -8% 39% -45% -9% -5% -11%-46% -7% -16% -41% -37% 52% INSIGHTS • 41
$620,000
-
Suffolk County
NEIGHBORHOOD
Q1 2024 Summary • January 1 – March 31, 2024


Residential
Old Field Port Jefferson Port Jefferson Station South Huntington Setauket/East Setauket Smithtown St. James Stony Brook Wading River West Islip 1 24 37 7 34 38 24 21 15 34 -50% -14% 3% -22% -11% -21% -8% -32% 0% 6% YTD 2024 %CHANGE YTD '23 vs '24 INVENTORY Active Listings Click Here To View 42 • INSIGHTS
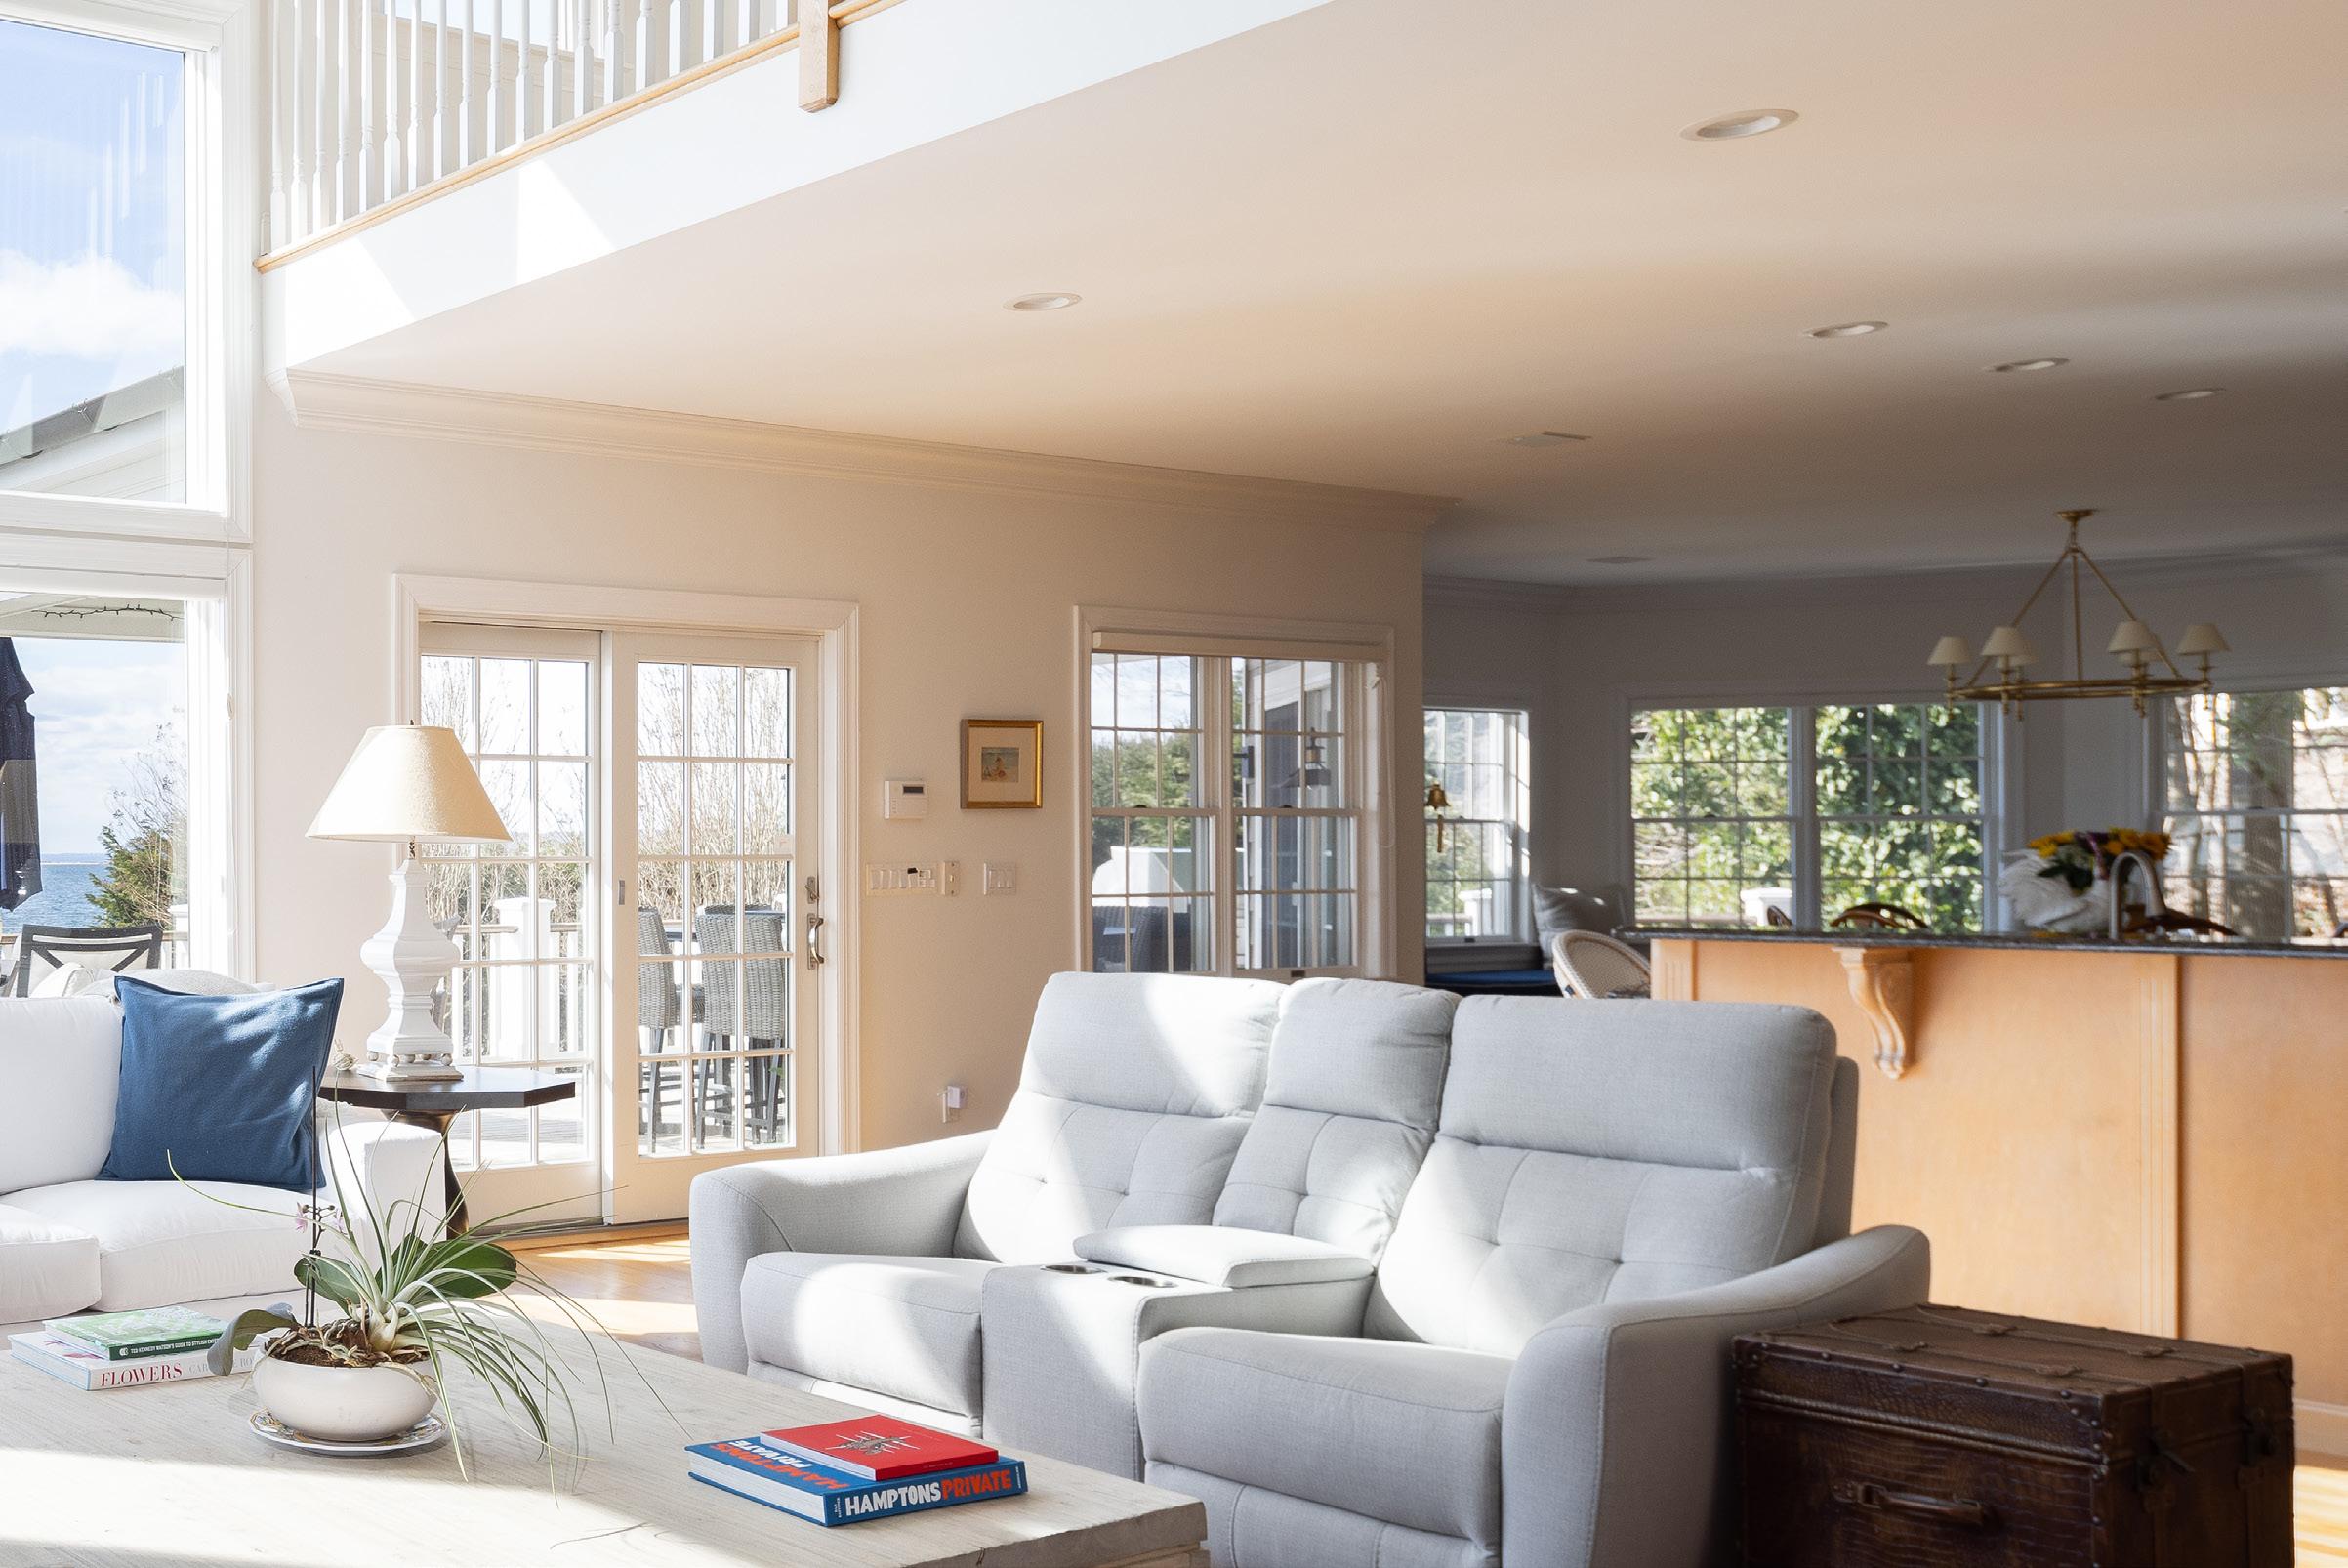
Northport, NY • MLS# 3539506 19 68 52 50 54 45 47 43 81 40 0 20 51 5 24 55 28 23 18 49 1 17 48 5 21 55 22 23 23 33-15% -6% 0% -13% 0% -21% 0% 28% -33% YTD 2024 %CHANGE YTD '23 vs '24 YTD 2023 YTD 2024 %CHANGE YTD '23 vs '24 YEAR-TO-DATE UNIT SALES MEDIAN SELLING PRICE YEAR-TO-DATE DAYS ON MARKET $990,000 $684,000 $540,000 $725,000 $680,000 $680,000 $567,500 $560,000 $665,000 $687,5005% 8% 27% 0% 5% 12% -11% -6% 22% YTD 2024 %CHANGE YTD '23 vs '24-26% 5% 52% -39% -34% -35% -21% 1% -46% INSIGHTS • 43
Q1 2024 Summary • January 1 – March 31, 2024
143 0%
Number of Sales
Q1 2024 vs Q1 2023
78 +11%
Average Days on Market
Q1 2024 vs Q1 2023
$685K -5%
Median Sales Price
Q1 2024 vs Q1 2023
$863K -4%
Average Sales Price
Q1 2024 vs Q1 2023
227 -1%
Listing Inventory
Q1 2024 vs Q1 2023
44 • INSIGHTS
North Fork

• MLS# 3508245 INSIGHTS • 45
Riverhead, NY
North Fork
Q1 2024 Summary • January 1 – March 31, 2024


Residential
Baiting Hollow Calverton Cutchogue East Marion Flanders Greenport Jamesport Laurel Mattituck New Suffolk Orient/Orient Point Peconic Riverhead South Jamesport Shelter Island/Shelter Island Heights Southold Wading River 11 13 13 23 6 6 26 5 5 19 2 4 5 29 0 15 31 15 0% -50% 18% 77% 0% -14% 53% -38% 67% -27% 0% -43% 0% -9% -100% 25% 15% 0% YTD 2024 %CHANGE YTD '23 vs '24 INVENTORY Active Listings Click Here To View 46 • INSIGHTS NEIGHBORHOOD
Aquebogue
$1,577,500 $135,000 $420,000 $1,746,105 $1,185,000 $520,000 $900,000 $1,400,000 $1,140,000 $865,000$1,400,000

75 98 42 76 51 39 106 71 120 81124 138 71106 81 8 5 8 9 8 3 10 2 3 7 0 6 1 34 2 1 18 18 2 9 16 8 5 7 11 3 2 14 0 1 1 26 0 0 15 23 -75% 80% 100% -11% -38% 133% 10% 50% -33% 100%-83% 0% -24% -100% -100% -17% 28% YTD 2024 %CHANGE YTD '23 vs '24 YTD 2023 YTD 2024 %CHANGE YTD '23 vs '24 YEAR-TO-DATE UNIT SALES MEDIAN SELLING PRICE YEAR-TO-DATE DAYS ON MARKET
$489,500$907,500 $665,000 94% -77% 51% 62% 26% 49% -1% 62% 50% 5%-40% 195% 9%-2% -6% YTD 2024 %CHANGE YTD '23 vs '24 -9% 61% -54% 6% -25% -59% 67% 376% 178% 107%-34% 557% 35%42% 1% INSIGHTS • 47 Shelter Island, NY • MLS# 3498830
$2,850,000
Q1 2024 Summary • January 1 – March 31, 2024
174 +13%
Number of Sales
Q1 2024 vs Q1 2023
91 -11%
Average Days on Market
Q1 2024 vs Q1 2023
$855K +6%
Median Sales Price
Q1 2024 vs Q1 2023
$1.36M -7%
Average Sales Price
Q1 2024 vs Q1 2023
564 +17%
Listing Inventory
Q1 2024 vs Q1 2023

48 • INSIGHTS
Hamptons

Hampton Bays, NY • MLS# 3493288 INSIGHTS • 49
Q1 2024 Summary • January 1 – March 31, 2024

NEIGHBORHOOD
Amagansett
Bridgehampton
Center Moriches
East Hampton
East Moriches
East Quogue
Eastport
Hampton Bays
Manorville
Montauk
Moriches
North Haven
Noyack
Quogue
Remsenburg
Sag Harbor
Sagaponack
Shinnecock
Southampton
Speonk
Wainscott
Water Mill
Westhampton Westhampton
Residential
Hamptons
Beach/Quiogue Westhampton Dunes 8 13 14 77 15 37 20 70 40 13 5 1 0 29 20 42 3 0 92 1 1 0 44 52 0 -20% 0% -26% 60% -12% 106% 82% 21% -26% 8% -44%61% -20% 40% -40%30%-50%69% 18% -100% YTD 2024 %CHANGE YTD '23 vs '24 INVENTORY Active Listings Click Here To View 50 • INSIGHTS
$4,950,000$599,000 $1,585,000 $690,000 $1,171,500 $847,000 $901,250 $497,500 $2,075,000 $555,000 $3,125,000
$2,350,000 $1,075,000 $1,700,000
$2,772,500
$1,687,500 $2,337,500 $2,625,000
2862 98 80 102 73 108 59 60 87 58112 170 138111-147 181 347 2 2 11 23 4 20 1 36 29 3 3 0 0 6 6 3 0 0 13 1 0 0 10 9 0 1 0 17 22 11 12 8 20 43 2 7 1 0 7 4 9 0 0 14 0 0 0 6 10 1 -50% -100% 55% -4% 175% -40% 700% -44% 48% -33% 133%17% -33% 200%8% -100%-40% 11%YTD 2024 %CHANGE YTD '23 vs '24 YTD 2023 YTD 2024 %CHANGE YTD '23 vs '24 YEAR-TO-DATE UNIT SALES MEDIAN SELLING PRICE YEAR-TO-DATE DAYS ON MARKET
-
-
--
134%16% -1% -6% 6% 130% 16% -9% 57% 23%-27% -23% -27%30%-48% 42%YTD 2024 %CHANGE YTD '23 vs '24 -45%-17% -26% 40% 22% -13% 9% 12% -35% 137%-56% 18% 28%22%--19% 92%INSIGHTS • 51
516.402.3469
28-07 Ditmars Boulevard Astoria, NY 11105
718.650.5855

Francis Lewis Boulevard Flushing, NY 11358 718.762.2268
364 Plandome Road Manhasset, NY 11030
516.627.4440
Offices Strategically Located Throughout Long Island, Brooklyn
Queens CORPORATE 36 Main Street
RELOCATIONS & REFERRALS 36
DGNY COMMERCIAL
&
Cold Spring Harbor, NY 11724 631.423.1180
Main Street Cold Spring Harbor, NY 11724 800.445.4460
175 Broadhollow Road, Suite 140 Melville, NY 11747
ASTORIA
BAY SHORE
BAYSIDE/FLUSHING
CARLE PLACE/WESTBURY 356 Westbury Avenue Carle Place, NY 11514 516.334.3606 COBBLE HILL 207 Court Street Brooklyn, NY 11201 718.689.6400 COLD SPRING HARBOR 5 Main Street Cold Spring Harbor, NY 11724 631.692.6770 CUTCHOGUE 28080 Main Road Cutchogue, NY 11935 631.734.5439 GARDEN CITY 102 Seventh Street Garden City, NY 11530 516.248.6655 GREAT NECK 42B Middle Neck Road Great Neck, NY 11021 516.466.4036 GREENPORT 114 Main Street Greenport, NY 11944 631.477.0013 HAMPTONS 100 Main Street Westhampton Beach,
11978 631.288.1050 HUNTINGTON 263 Main Street Huntington,
11743
LOCUST VALLEY 1
Locust
LONG BEACH
MANHASSET
249 W. Main Street Bay Shore, NY 11706 631.647.7013
35-16B
NY
NY
631.427.6600
Buckram Road
Valley, NY 11560 516.759.4800
350 National Boulevard, Suite 2E Long Beach, NY 11561 516.670.1700
631.298.0300

631.298.4130
631.754.3400
516.674.2000
718.638.6500
MATTITUCK 10095 Main Road, #9
Mattituck, NY 11952
MATTITUCK LOVE LANE 70 Love Lane
Mattituck, NY 11952
NORTHPORT 77 Main Street
Northport, NY 11768
NORTH SHORE 329 Glen Cove Avenue Sea Cliff, NY 11579
PARK SLOPE 89 7th Avenue Brooklyn, NY 11217
PORT WASHINGTON 350 Main Street Port Washington, NY 11050
ROCKVILLE CENTRE 36 S. Park Avenue Rockville Centre, NY 11570 516.678.1510 SEA CLIFF 266 Sea Cliff Avenue Sea Cliff, NY 11579 516.759.6822 SHELTER ISLAND 11 Grand Avenue Shelter Island Heights, NY 11965 631.749.1155 SMITHTOWN 81 Route 111 Smithtown, NY 11787 631.584.6600 STONY BROOK/PORT JEFFERSON 1067 Route 25A Stony Brook, NY 11790 631.689.6980 SYOSSET/MUTTONTOWN 7951 Jericho Turnpike Woodbury, NY 11797 516.677.0030 WHEATLEY PLAZA 342 Wheatley Plaza Greenvale, NY 11548
WILLIAMSBURG 299 Bedford Avenue Brooklyn, NY 11211
516.883.2900
516.626.7600
718.689.8400
danielgale.com Each office is independently owned and operated. We are pledged to provide equal opportunity for housing to any prospective customer or client, without regard to race, color, religion, sex, handicap, familial status or national origin. Based on residential properties reported as closed January 1 to March 31, 2024 by OneKey Multiple Listing Service (MLS) and Perchwell.


 Deirdre O’Connell Chief Executive Officer


