DAN ANNUAL DIVING REPORT
A REPORT ON 2018 DIVING FATALITIES, INJURIES, AND INCIDENTS 2020 EDITION


2020 Edition
A report on 2018 diving fatalities, injuries, and incidents
FRAUKE TILLMANS, PHD EditorDIVERS ALERT NETWORK DURHAM, NC
Data for the 2020 Annual Diving Report was collected and assembled by DAN employees and associated professionals. DAN wishes to recognize the following for their important contributions.
Frauke Tillmans, PhD
AUTHORS
George Anderson, BS (Appendix C)
Dinesh Ariyadewa (Seciton 3)
Rhiannon Brenner, BS (Section 4)
FranÇois Burman, IntPE, MSc (Appendix A)
Peter Buzzacott, MpH, PhD, FUHM (Section 5, Appendix C)
James Caruso, MD (Section 1)
James M Chimiak, MD (Section 1, Section 2)
Petar Denoble, MD, DSc (Section 1, Appendix C)
Grant Dong, B.Sc (Section 4)
Jim Gunderson (Appendix B)
James Grier, MD (Appendix C)
Catherine Harris (Section 3, Section 4)
Elizabeth Helfrich, BS, BA (Section 4)
Akiko Kojima, BA (Section 3)
Yasushi Kojima, MD (Section 3)
John Lippman, PhD (Section 3)
Anna Maese (Section 5)
Marta Marrocco (Section 3)
Alessandro Marroni, MD, MSc (Section 3)
Craig Nelson, MD (Section 1)
Matias Nochetto, MD (Section 2)
Tara Nowroski (Section 5)
Leah Potts (Section 5)
Camilo Saraiva, MD (Section 2)
Frauke Tillmans, PhD (Section 1, Section 4, Section 5, Appendix C)
Jeanette Moore
Linda Van de Zande
Lesley Blogg, PhD
DAN would like to thank all the individuals involved in the worldwide diving safety network. is network includes many hyperbaric physicians, DAN on-call sta , nurses and chamber technicians who complete DAN reporting forms. DAN also thanks local sheri s, police, emergency medical personnel, US Coast Guard personnel, medical examiners, coroners, and members of the public who submit incident data and share their stories.

Diver ClassificationsUnited States & CanadianOtherTotal
Recreational 55 45100 Breath-hold 29 3059 Commercial 6 7 13 Public Safety 1 1112 Military 0 11 Not reported / Unknown 1 34
Total 92 97189
Table 1-1. Total Number of Collected Fatalities Worldwide in 2018 (n=189)
Country Total Count (2008–2017) 10-year Average Total Count (2018)
United States 549 55 36 Canada 57 6 5 Other 207 21 14 Total 813 82 55
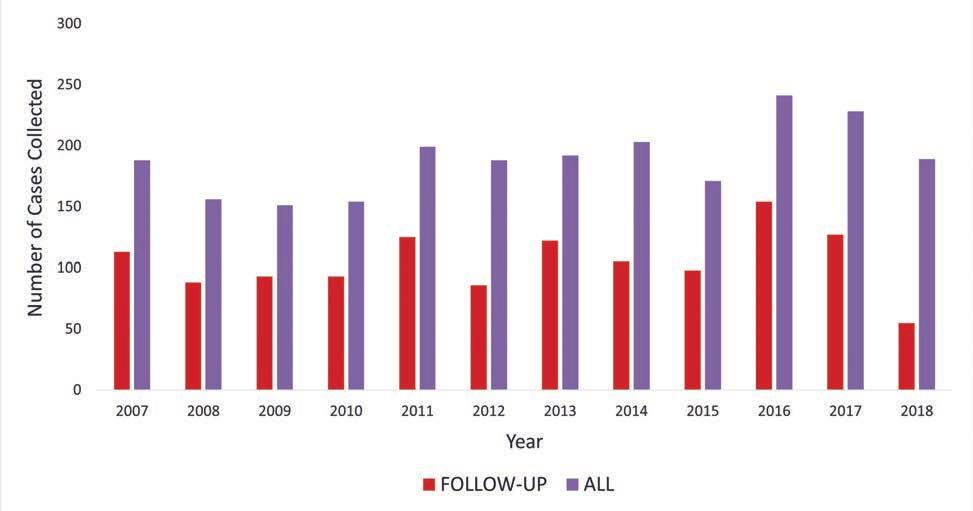
Table 1-2. Number of follow-up cases in the United States, Canada and other countries for 2018 (n=55)
Figure 1-1. Number of Dive Fatalities by Year
State
Total Count (2008–2017) 10-Year Average Total Count (2018)
Florida 186 19 7 California 102 10 3 Hawaii 40 4 8 Washington 35 4 0 Massachusetts 19 2 6 Michigan 16 2 1 North Carolina 14 1 1 New York 14 1 0 Pennsylvania 14 1 0 New Jersey 13 1 0 Wisconsin 13 1 0 South Carolina 7 1 0 Nevada 7 1 0 Rhode Island 6 1 0 Ohio 6 1 0 Texas 5 1 0 Maine 4 0 0 Oregon 4 0 0 Alabama 4 0 0 Virginia 4 0 0 Illinois 4 0 0 Arizona 3 0 0 Guam 3 0 0 Minnesota 3 0 1 Missouri 3 0 0 Louisiana 2 0 0 Georgia 2 0 1 South Dakota 2 0 0 New Mexico 2 0 1 Arkansas 2 0 0 Tennessee 2 0 0 Puerto Rico 1 0 0 New Hampshire 1 0 0 Kansas 1 0 0 Montana 1 0 0 Utah 1 0 1 Alaska 1 0 0 Wyoming 1 0 0 Oklahoma 1 0 0 Virgin Islands 0 0 1 Vermont 0 0 1 Connecticut 0 0 1 Total 549 55 33
Table 1-3. The Number of reported cases in the United States by the state, for 2018, compared to previous 10-year average. Disclaimer: the cases indicated in the 10-year average were rounded to reflect whole numbers as they pertain to individuals themselves.
Year Total Count 2014 30 2015 28 2016 48 2017 58 2018 18
Table 1-7. Total number of divers’ death notifications received through the emergency line
Map 1-1. Total number of Collected Fatalities Worldwide in 2018
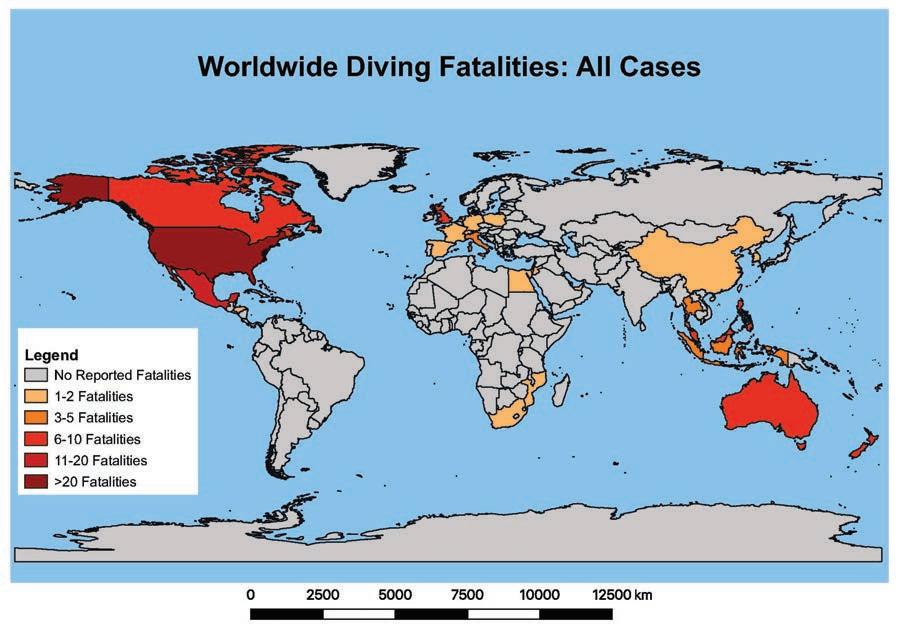
Map 1-2. Number of follow-up scuba fatalities in the United States, Canada and other countries for 2018
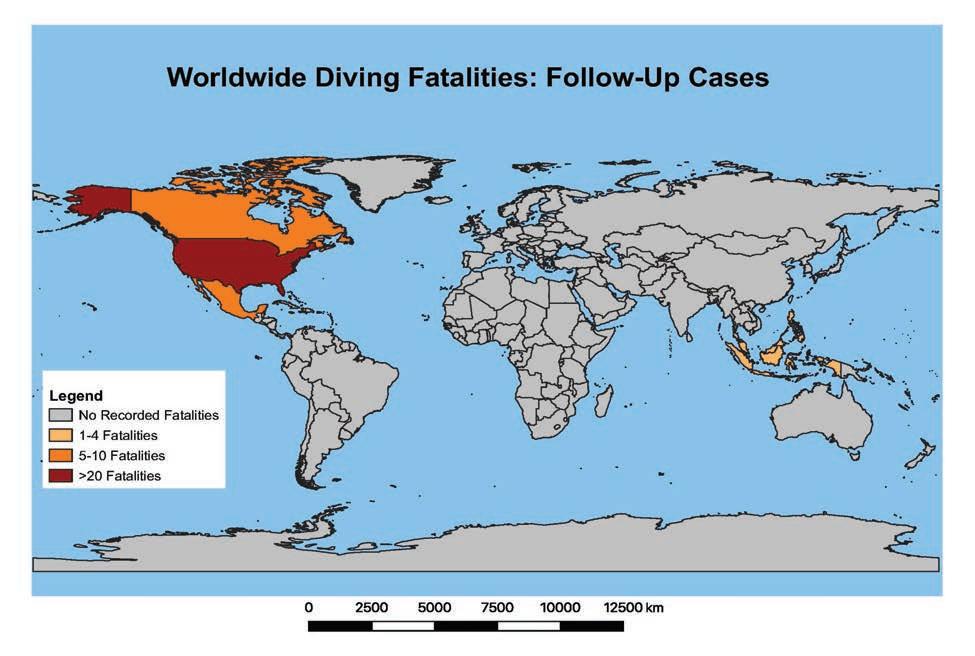
Canada Provinces
Total Count (2008–2017) 10-year Average Total Count (2018)
Ontario 19 2 2 British Columbia 19 2 1 Alberta 6 1 0
Nova Scotia 5 1 0 Saskatchewan 2 0 1 Quebec 2 0 1
Newfoundland and Labrador 1 0 0 Manitoba 1 0 0
Total 55 6 5
Table 1-4. Number of follow-up cases in Canada by province for 2018. Disclaimer: the cases indicated in the 10-year average were rounded to reflect whole numbers as they pertain to individuals themselves.
Country
Total Count (2008–2017)
10-year Average Total Count (2018)
Mexico 45 5 5 Cayman Islands 30 3 2 Netherlands Antilles 20 2 1 Belize 13 1 1 Bahamas 9 1 1 Indonesia 7 1 1 Philippines 3 0 1 Malaysia 0 0 1 Italy 0 0 1 Grenada 0 0 1 Other 80 8 0
Total 207 21 15
Table 1-5. The number of fatal diving accidents for United States & Canadian citizens occurring in countries outside of the United States and Canada. Disclaimer: the cases indicated in the 10-Year Average were rounded to reflect whole numbers as they pertain to individuals themselves.
State County 2008–2017 2018 TotalMeanRange
Monroe 959.5(4–14) 2 Palm Beach 31 3 (1–5) 1 Broward 202.3(1–4) 2 California
Florida
Los Angeles 494.9(2–7) 0 Monterey 222.2(1–5) 0 San Diego 19 2 (1–4)1(2)*
Table 1-6. Number of U.S cases in counties with most scuba fatalities.
Figure 1-2. Age and sex distribution of reported fatal scuba accidents worldwide in 2018.
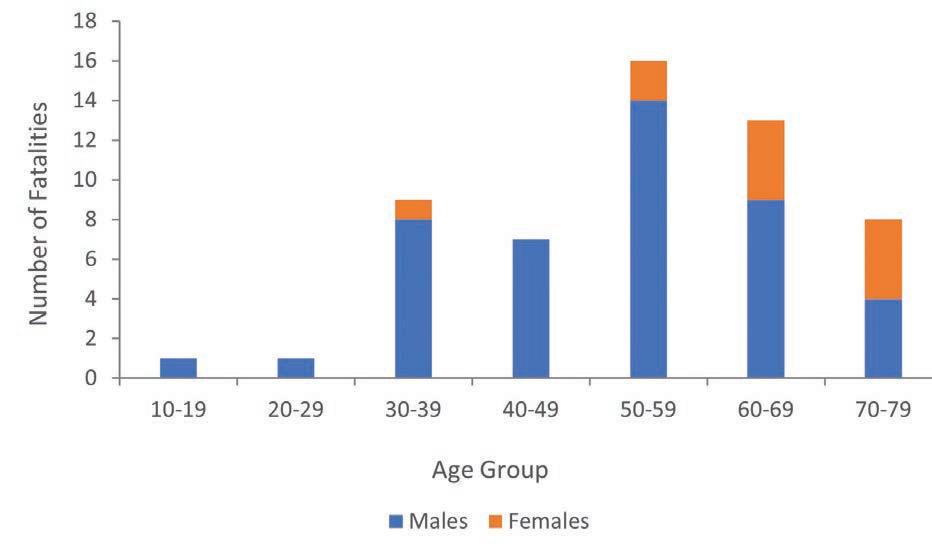
Figure 1-3. Mean age of Fatalities by year (2004–2018).
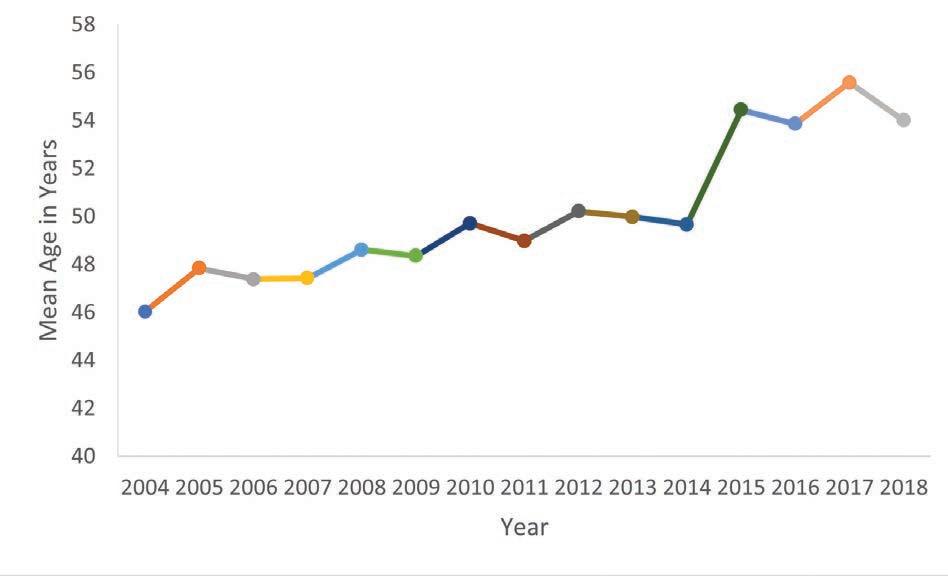
Figure 1-4. The distributions of the phase of the dive when the problem became apparent. Four of the 29 cases where the issue became apparent during the dive happened during ascent.
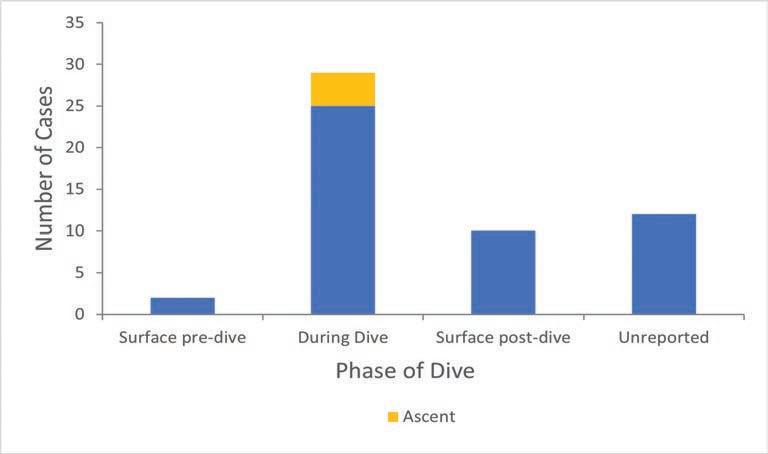
Figure 1-5. Cause of death as reported by medical examiners
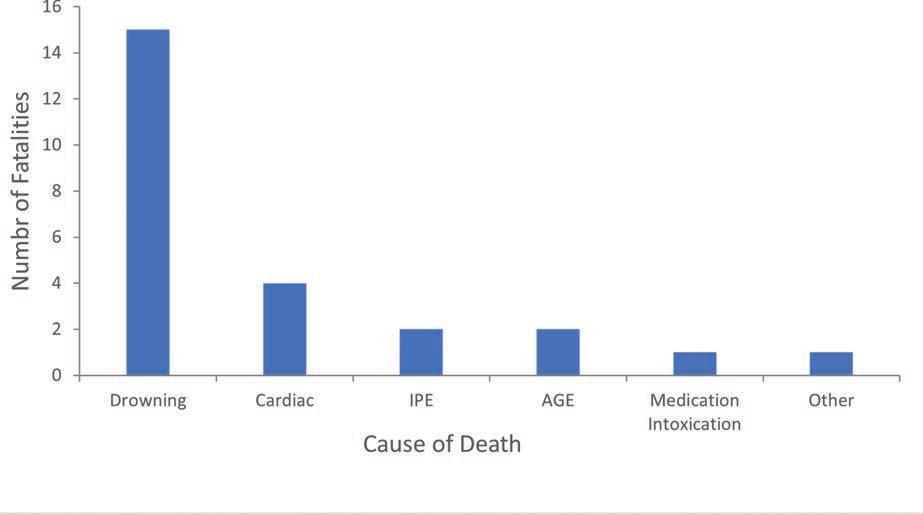
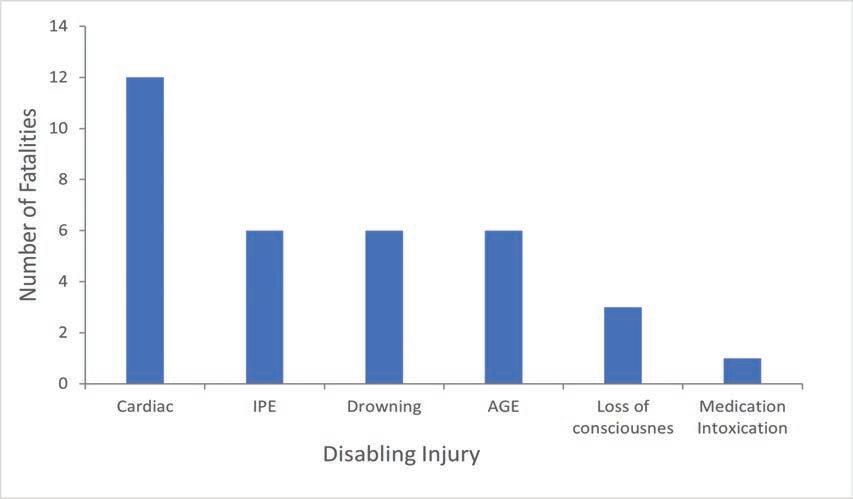
Figure 1-6. Disabling injury (DI) or medical condition preceding death
Age Sex Height (cm) Weight (kg)
Heart Weight (grams) Measured Vanhaebost et al, 2014. Wingren et al, 2015. PredictedUpper limitPredicted+1 StdDev 53 male 162.676.7710362447390.9452 57 male 180.3147.4630493*578*632.4743 64 male 190.5116.6600457548591694.3 68 male 177.8105.7525432518553.2650 73 male 172.799.3490417503546.1641.7 67 male 180.393.4480402488495.8573.2 72 male 182.9104.3480427513574.2674.7 73 male 170.0110.0460443528570.2669.9 Table 1-8. Heart weight and reference values in eight cases with cardiomegaly determined by a medical examiner
Age Sex Ht (cm)Wt (kg) BMI High blood pressure
Left ventricular hypertrophy Cardiomegaly (grams)
Coronary heart disease (>75% stenosis) 53 male 162.676.729.0 + 1.7 710 57 male 180.3147.445.3 + 1.6 630 + 64 male 190.5116.632.1 + 2.1 600 68 male 177.8105.733.4 + 525 + 73 male 172.799.333.3 + 490 + 67 male 180.393.428.7 + 480 + 72 male 182.9104.331.2 + 2 480 73 male 170.0110.038.1 1.4 460 +
Table 1-9. Contributing medical conditions in eight cases with cardiomegaly
Harmful Event/ Mechanism n Rapid ascent 4 Natural disease 5 IPE 3 Insufficient breathing gas 3 Arrhythmia due to methamphetamine 2 Other 3 Unknown 29 Lack of buoyancy 1 Hypoxic breathing gas 1 Suffocation 1 Cardiac Dysrhythmia 1
Table 1-10. Harmful Events or Mechanisms of injury
Trigger n
Immersion 3
Low on air 3 Exertion 3 Drug use (methamphetamine) 2 Equipment problem 2 Intrinsic 5
Closed oxygen cylinder 1 Struggle and Entanglement 2 Nitrogen Narcosis 1 Rough Seas 1 Unknown 30
Table 1-11. Trigger Events of Injuries
20143,1696,3619,530 20153,4856,63510,120 20163,5936,72710,320 20173,8097,09410,903 20183,1276,3739,500 Total17,18333,19050,373
Table 2 -1: Emergency cases and information requests per year.
Figure 2-1. The geographic origin of emergency calls 2014–2018.
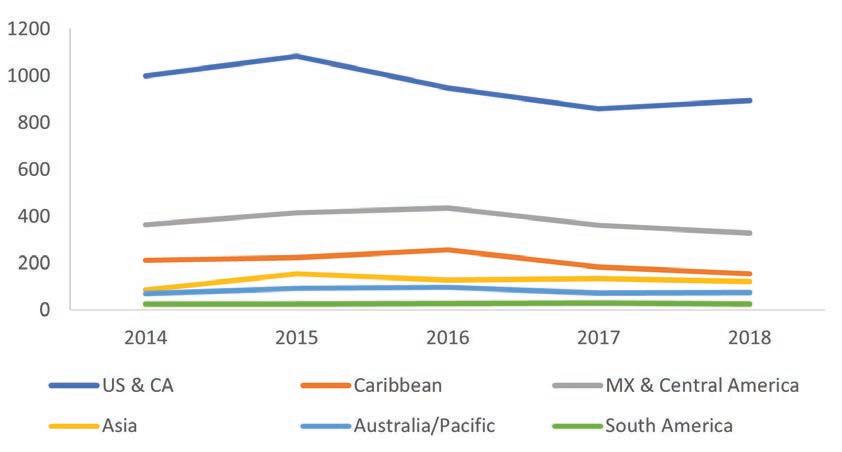
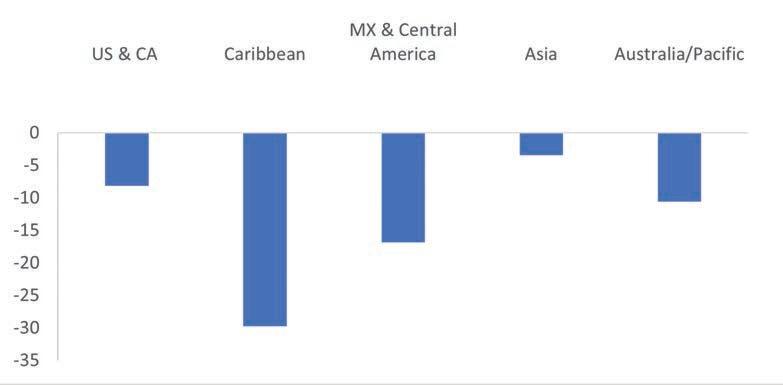
Figure 2-2. The percent change in the volume of emergency calls in comparison to average numbers in the 2014–2017 period.
ILLNESS/INJURY2014 -2017 (mean)2018 (count) 2018 (% of 2014–2017 average)
Diving Related 2,117 2,069 97.7 Non-Diving Related 1,502 1,395 92.9 Total 3,619 3,464 95.7 % Non-Diving 41.5 40.3 97.1
Table 2-2. Diving and non-diving related injuries reported to DAN in 2018 compared to the previous four-year average.
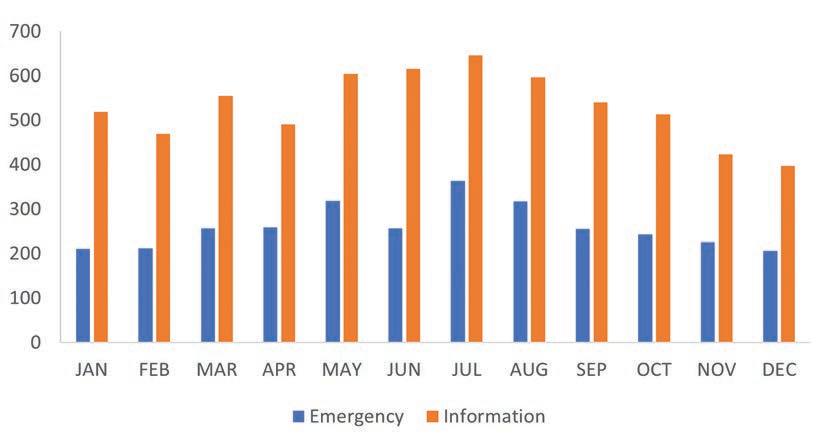
Figure 2-3. Seasonality of call volume: Count of emergency and information calls by month of the year in 2018.
DIVING RELATED2014–2017 (mean)2018 (count)2018 (% of 2014–2017 mean)
Barotrauma 1,008 1,053 104
Decompression Sickness 606 624 103 Marine Envenomation 234 202 86 Immersion Pulmonary Edema (IPE) 46 47 102
Arterial Gas Embolism (AGE) 40 41 104 Fatality 41 18 44 Non-Fatal Drowning 23 17 76 Gas Contamination 22 18 84
Finfoot 18 13 71
Motion Sickness 14 24 171 Mask Squeeze 15 5 33 Loss of Consciousness 11 5 45
Cardiac Arrhythmia 7 0 0 Nitrogen Narcosis 3 2 62
Table 2-3. Diving and non-diving related injuries reported to DAN in 2018 compared to the previous four-year average.
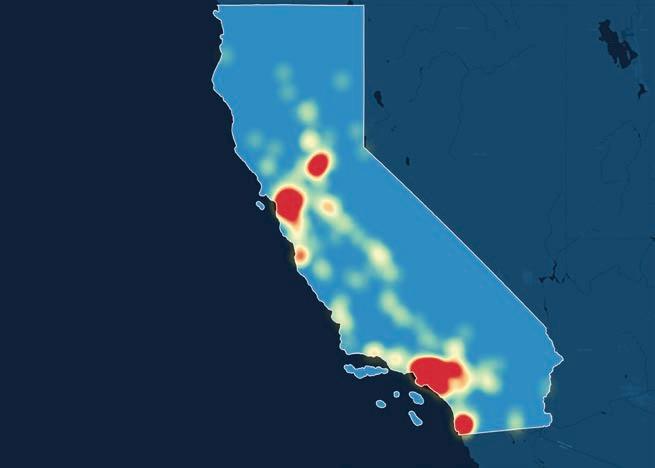
California Emergency Call Volume by Density: 2018
Sacramento
Fresno Los Angeles
San Diego
Map 2-2: Volume of emergency calls from California in 2018.
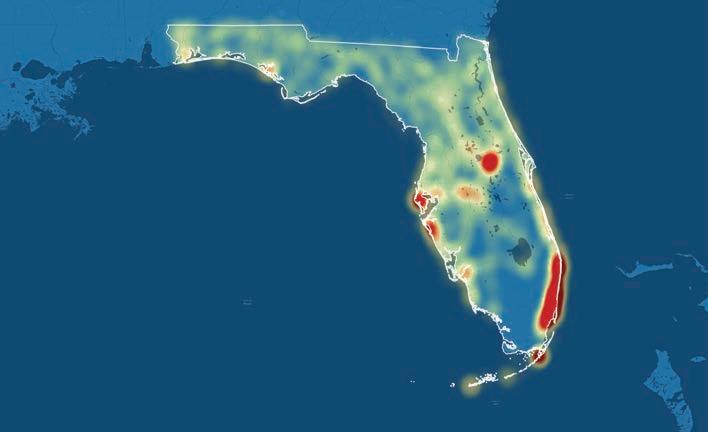
Florida Emergency Call Volume by Density: 2018
Jacksonville
Orlando
Tampa
Miami
Map 2-3: Volume of emergency calls from Florida in 2018.
Neurological (DCS Type 2) 269.75 222 82.3
Cutaneous 158.75 141 88.8 Pain Only (DCS Type 1) 139.25 160 114.9 Pulmonary / Chokes 8.5 4 47.1
Table 2-4. Distribution of DCS cases by type of symptoms Geographic
Table 2-4. Evacuations in 2018.
Figure 2-4 The distribution (%) of 2018 suspected decompression sickness (DCS) cases by type of symptoms.
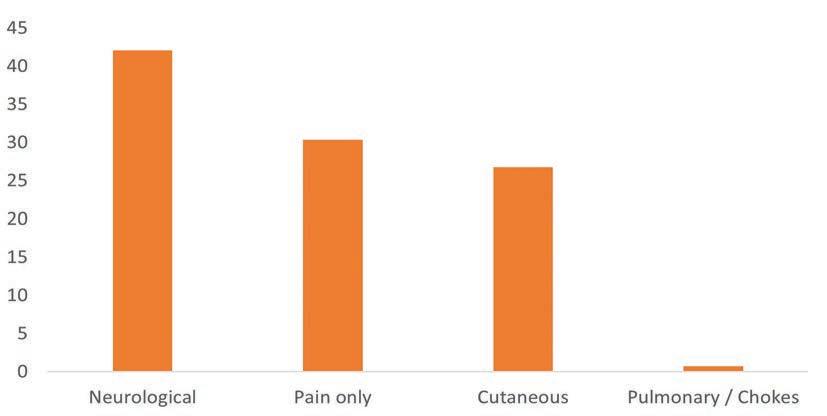
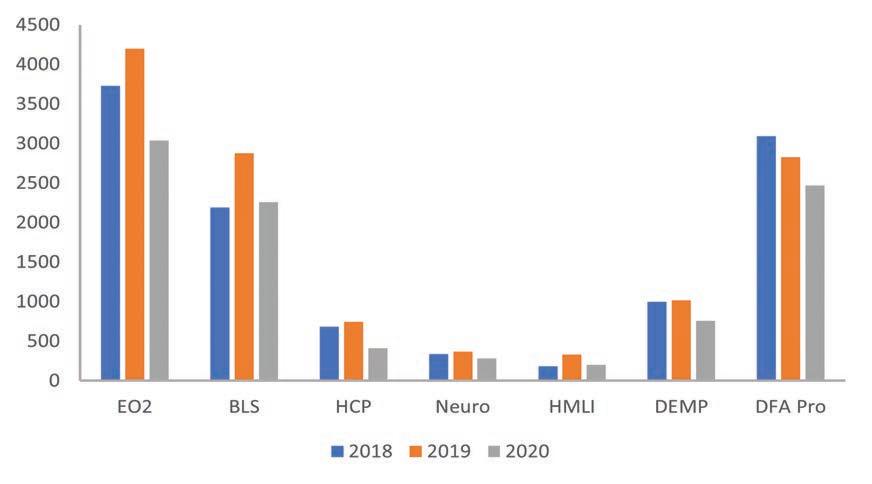
Figure 2-5. Number of evacuations by ground/boat, commercial and air broken down by health problem. HMLI, Hazardous Marine Life Injuries.
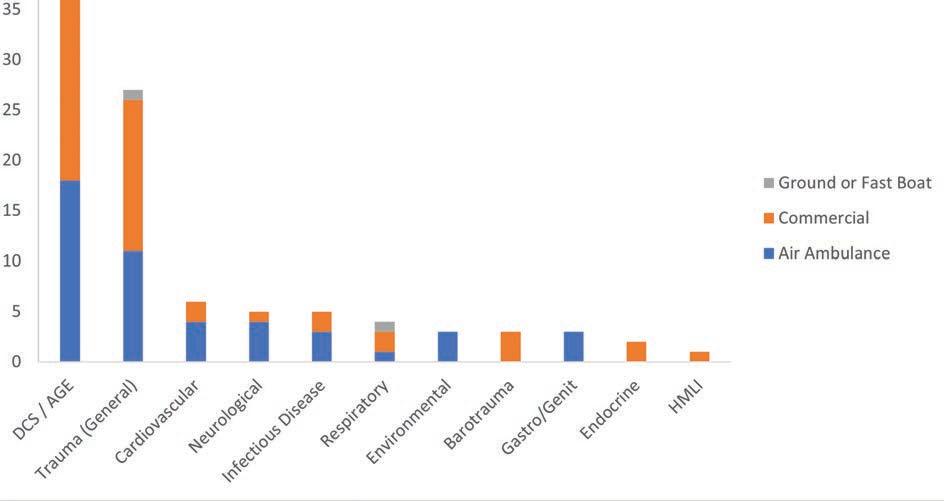
Figure 2-6. Number of evacuations due to dive related incident, broken down by gender and age.
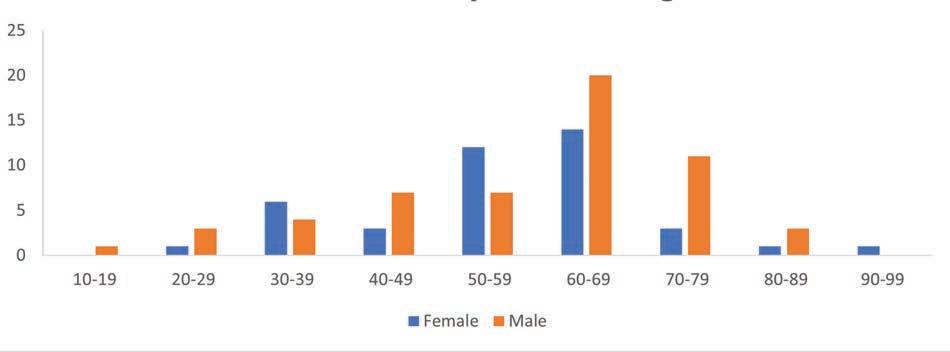
Figure 2-7. Right superior quadrantanopia. The areas of the visual field lost in each eye are shown as black areas. This visual field defect is characteristic of damage to MEyer’s loop (part of optic radiation) on the left side of the brain.
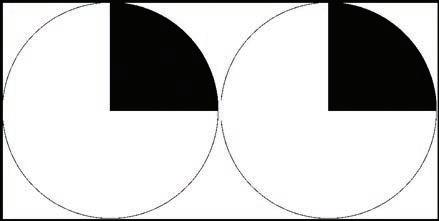
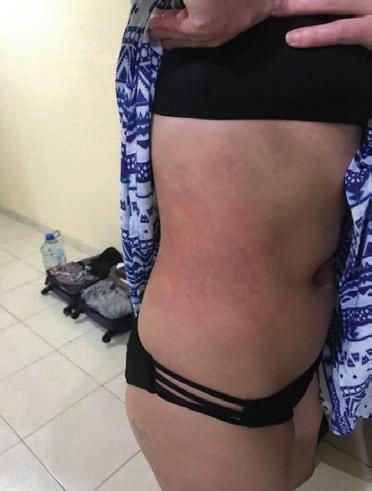
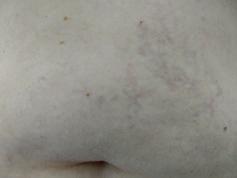
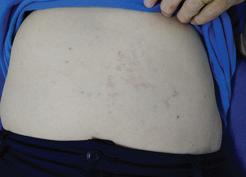
Figure 2-8 (left). Suspected cutaneous DCS onset three hours after the second dive.

Figure 2-9 (right). Same individual one hour after oxygen treatment at local dive shop.
2-11
Figure 2-10.
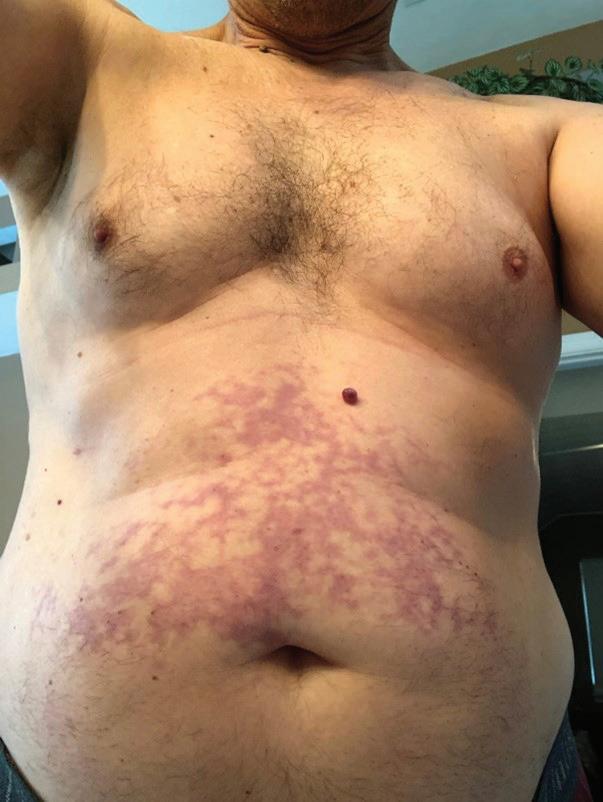
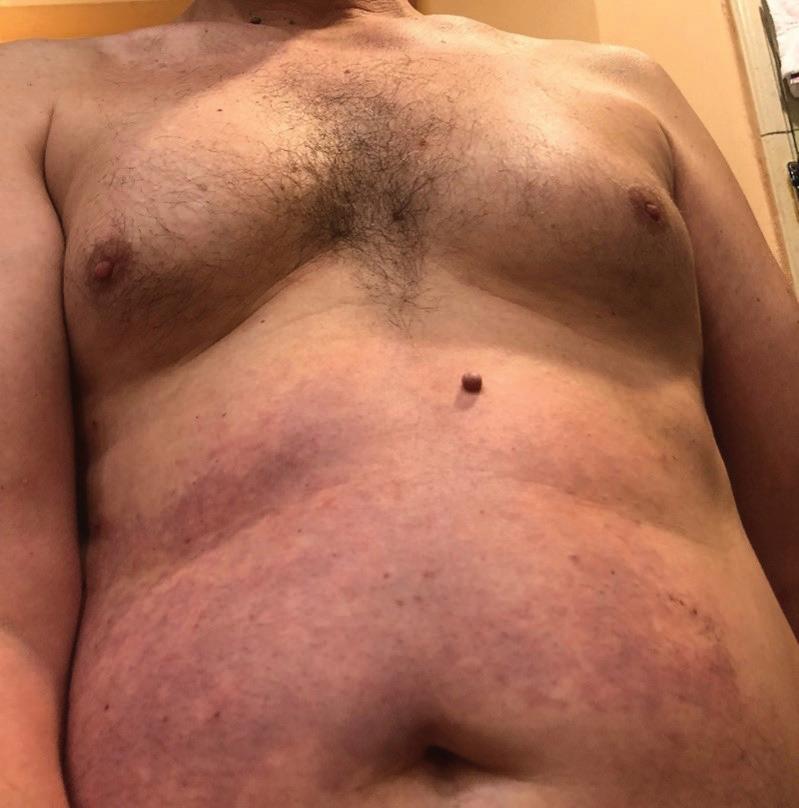

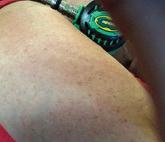

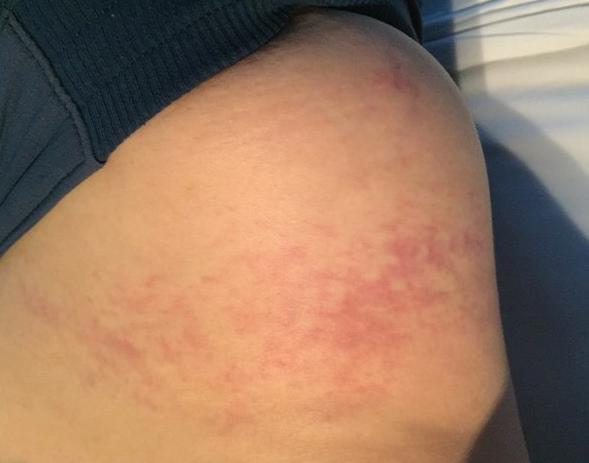
Figure 2-16. Suspected cutaneous DCS presenting approximately two hours after last dive.
Figure 2-17. Suspected cutaneous DCS, rash improvement
John Lippmann, Alessandro Marroni, Marta Marrocco, Yasushi Kojima, Akiko Kojima, Dinesh Ariyadewa, Catherine Harris
Table 3-1. Number of DCI Cases in DAN Europe members by type.Reported both by hotline and by membership claims. *Note: Taravana is a disease most commonly found amongst divers who descend and ascend in rapid succession, multiple times per day, to erratic depths and without breathing apparatus.
Table 3-2 displays the di erent diagnoses reported to DAN Europe in 2018. ese reports were collected by both the hotline and through membership claims.
e following tables display the number of diving and non-diving accidents reported to DAN Europe based on country where the accident occurred. ese reports were collected by both the hotline and through membership claims. e legend for these tables is as follows:
Unknown 24 Total 329
Table 3-2. Diving related medical emergencies, 2018.
Table 3-4. Origin of emergency calls to the Australian DES / DAN hotline
Table 3-5. Divers treated for DCI in Australia in 2018
Figure 3-1. Divers treated for DCI in Australia, 2012 – 2019
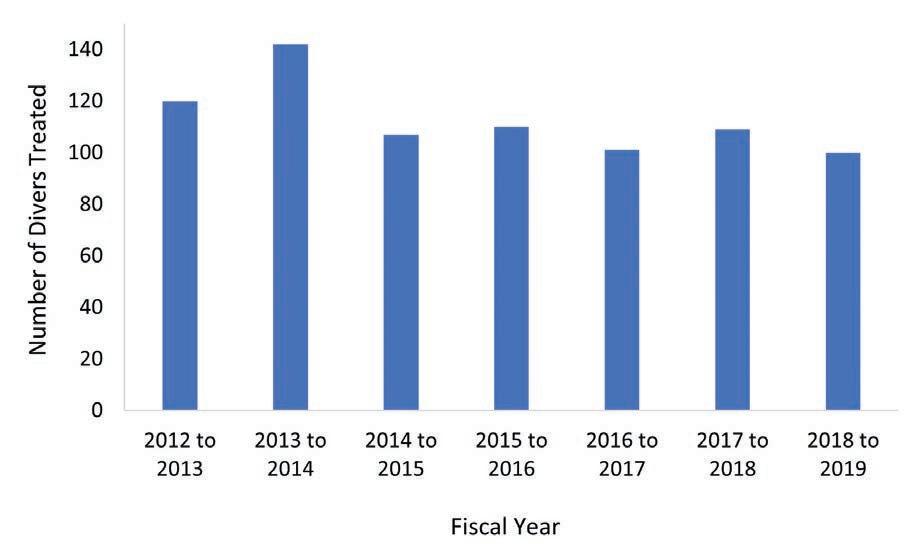
Figure 3-2. Number of fatalities from 2009 to 2018 reported to DAN Japan.
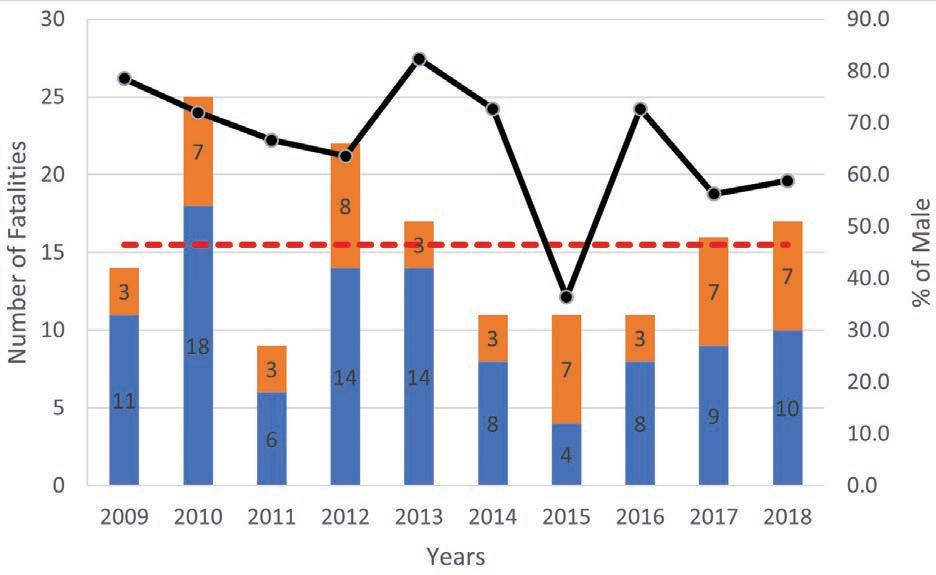
Figure 3-3. Number of fatalaties by age group reported to DAN Japan.
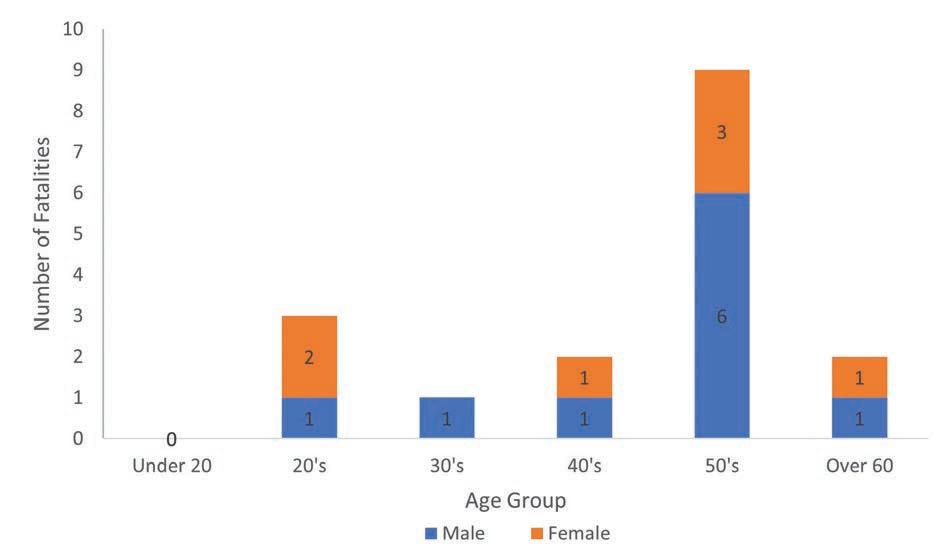
Figure 3-4. Cause of death reported to DAN Japan.
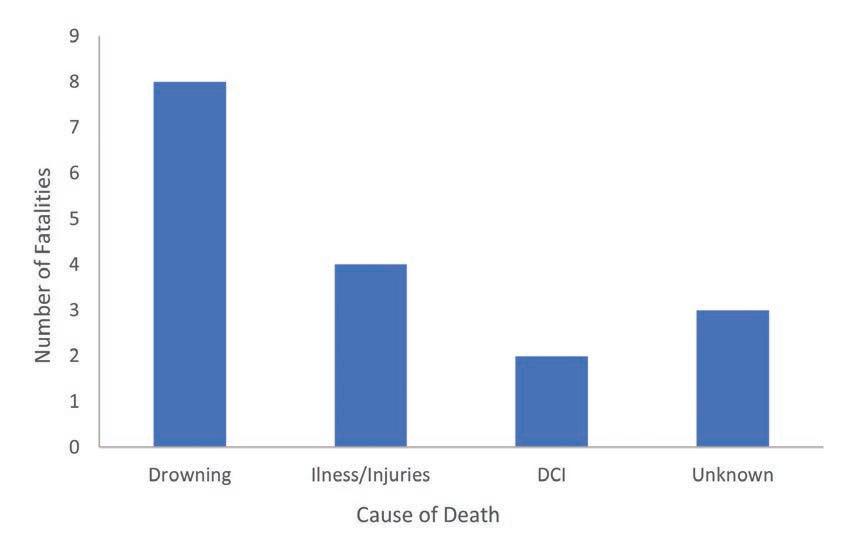
Figure 3-5. Number of fatalities by diver experience reported to DAN Japan.
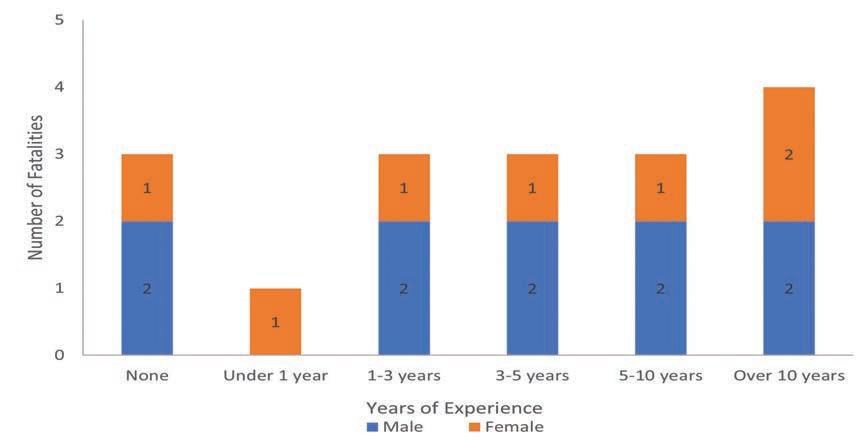
Figure 3-6. Number of fatalities based on number of dives completed one year prior.
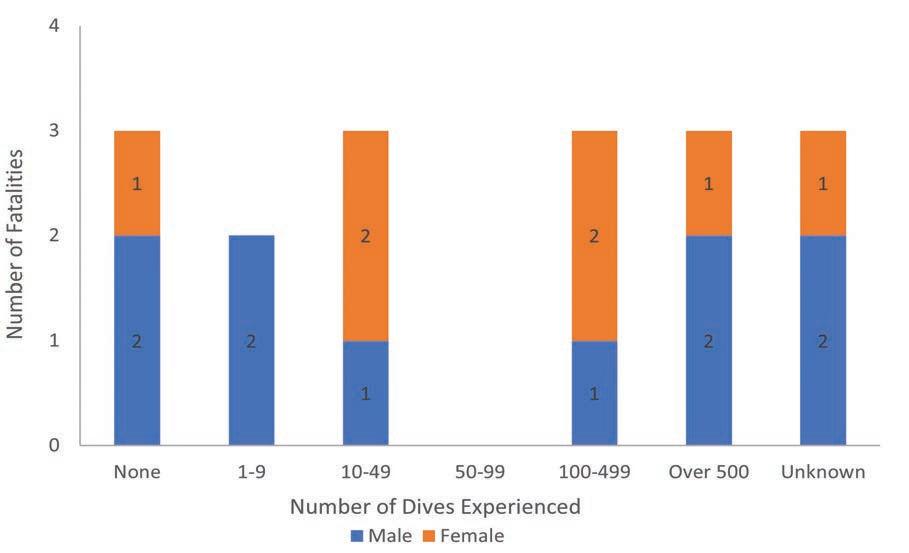
Figure 3-7. Number of fatalities by total number of lifetime dives.
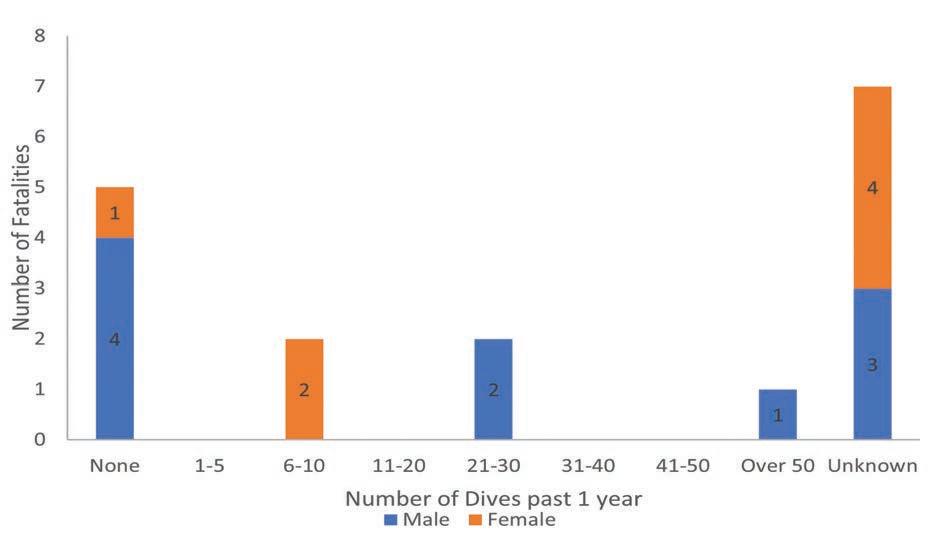
Figure 3-8. Distribution of fatalities by month.
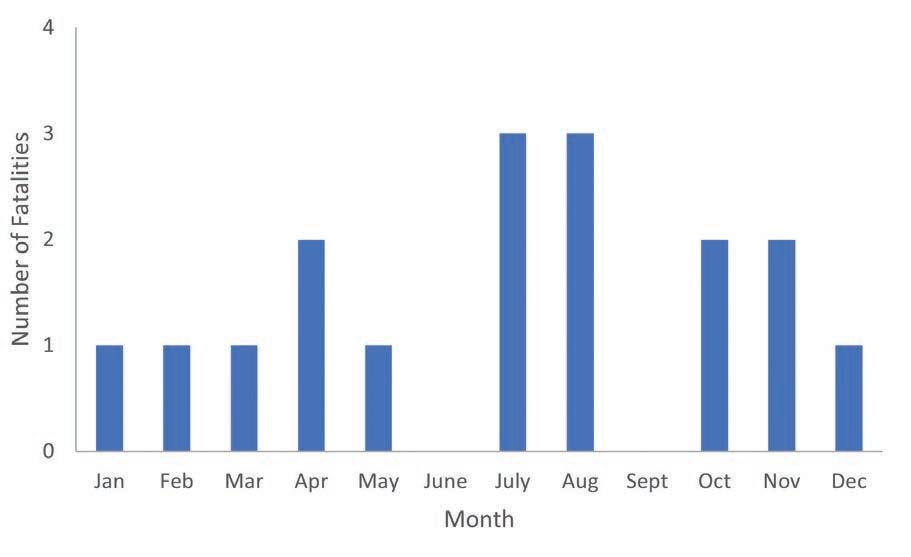
Figure 3-9. Fatalitites by type of dive organization
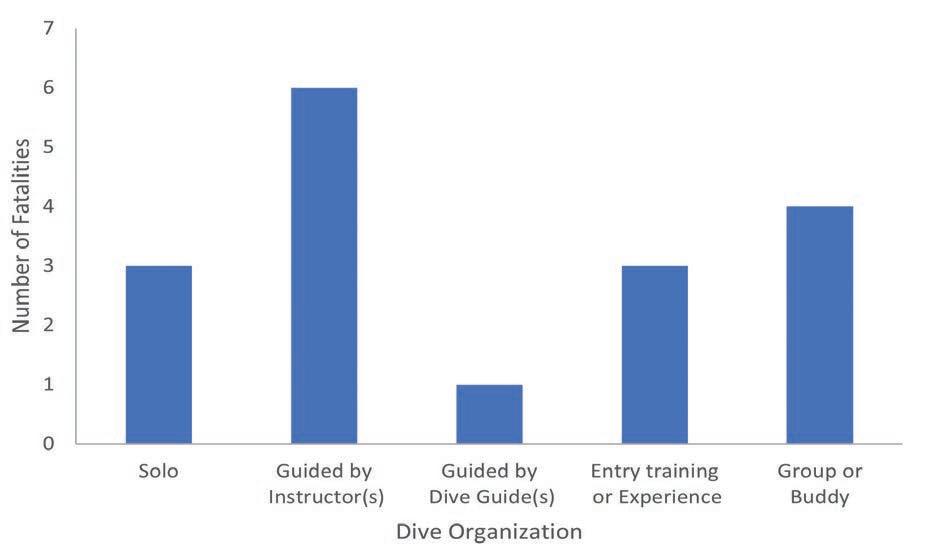
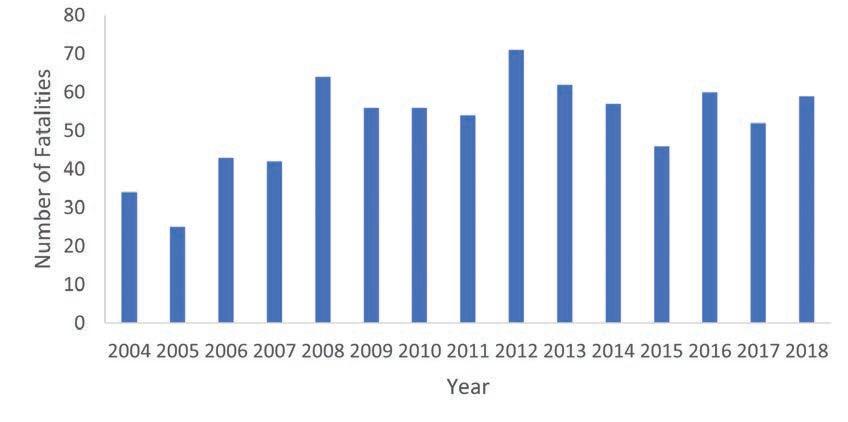
Figure 4-1. Breath-hold fatalities between 2004 and 2018 (n=781)
Discipline Description
Static apnea (STA)
Constant weight (CWT)
Resting, immersed breath-hold in controlled water (usually a swimming pool)
Women Men
9:02 minutes June 21, 2013 11:35 minutes June 8, 2009
Vertical self-propelled swimming to a maximum depth and back to the surface; no line assistance allowed 160 meters August 17, 2002 214 meters June 9, 2007
Free immersion (FIM)
No limit (NLT)
Dynamic without fins (DNF)
Constant weight without fins (CNF)
Variable weight (VWT)
Dynamic with fins (DYN)
Vertical excursion propelled by pulling on a rope during descent and ascent; no fins 107 meters July 26, 2018 130 meters July 18, 2018
Vertical descent to a maximum depth on a weighted sled; ascent with a lift bag deployed by the diver
257 meters October 13, 2019 300 meters July 2, 2016
Horizontal swim in controlled water 92 meters June 11, 2019 300 meters July 2, 2016
Vertical self-propelled swimming to a maximum depth and back to the surface; no line assistance allowed
Vertical descent to a maximum depth on a weighted sled; ascent by pulling up a line and/or kicking
Horizontal swim in controlled water
130 meters October 18, 2015 146 meters November 1, 2015
208 meters March 7, 2019 250 meters October 13, 2019
98 meters October 16, 2019 110 meters August 5, 2019
Table 4-1. AIDA-recognized competitive freediving disciplines and record performances (current as of March 2021)
Figure 4-2. Breath-hold fatalities in 2019 by citizenship.
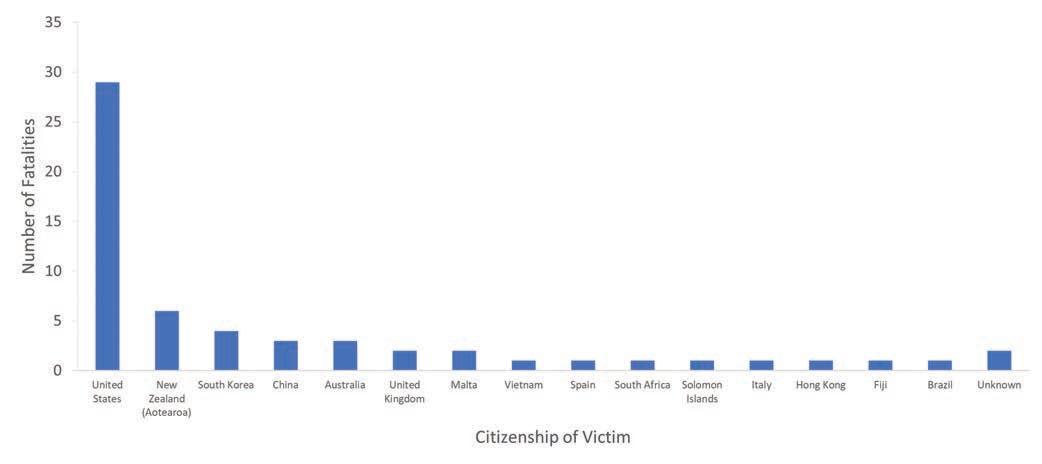
Table 4-2. Breath-hold fatalities by location of incident
Figure 4-3: Disctribution of breath-hold fatalities by activity category in 2018
Figure 4-4: Distribution of freediving fatalities by activity category in 2018
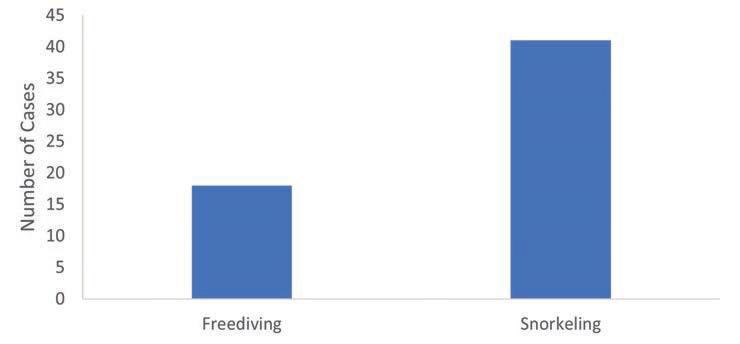
Figure 4-5. Distribution of snorkeling fatalities by activity category in 2018
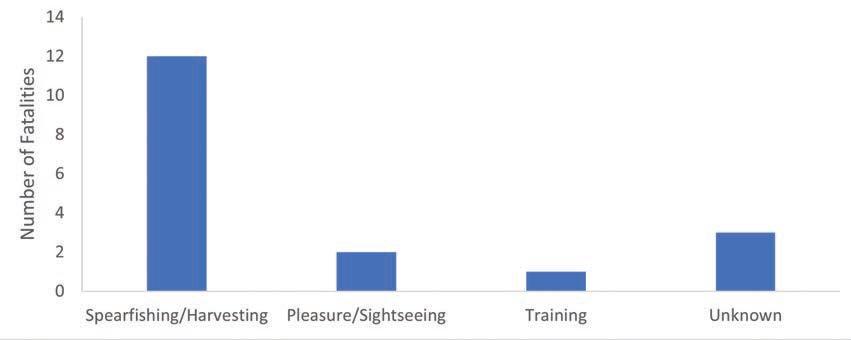
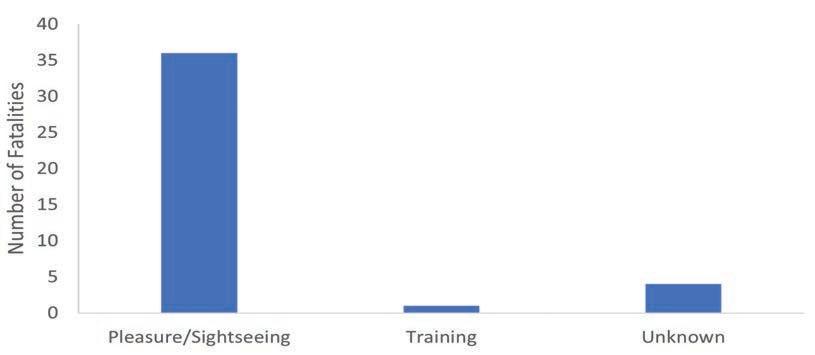
Figure 4-6. Average age of victims by diving mode preceding the incident in 2018
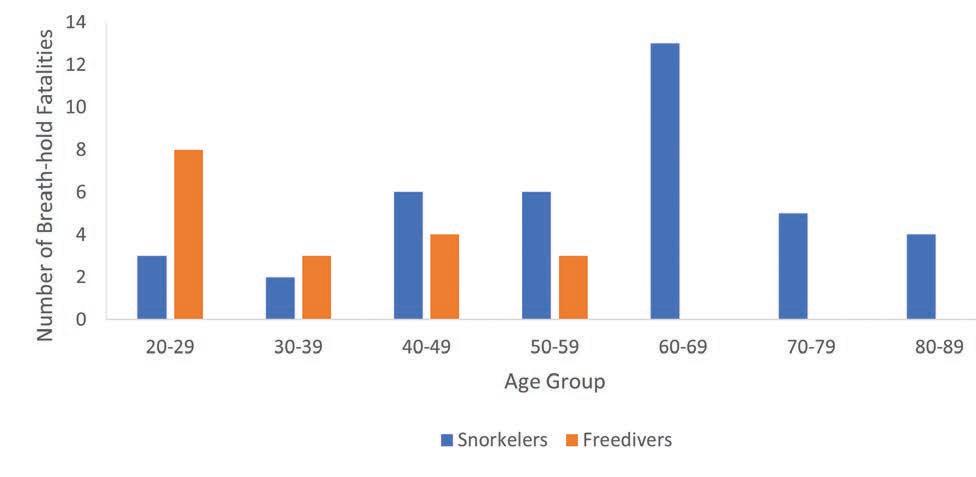
Figure 4-7. Distribution of fatalities by age group in 2018
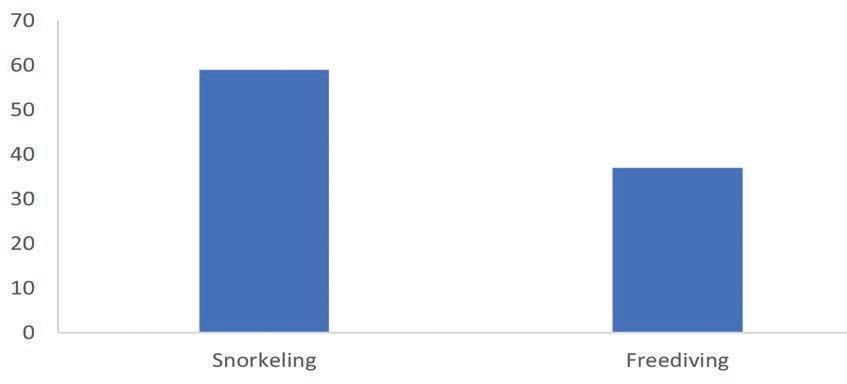
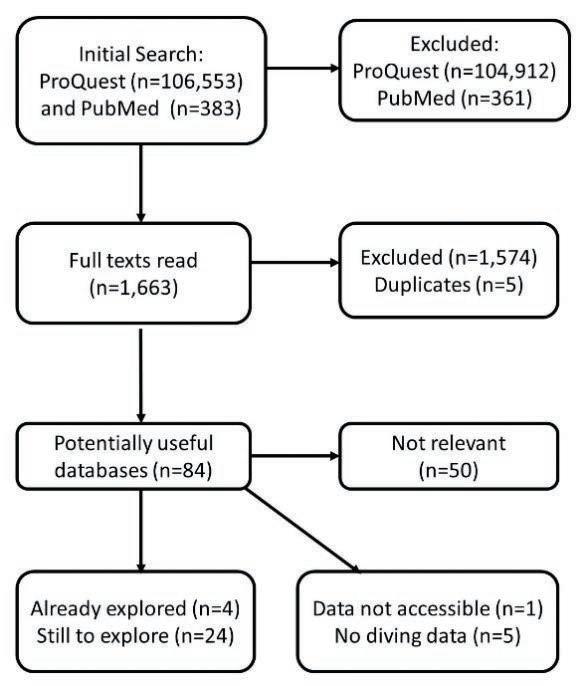
Figure 5-1: Flow of compiling data for injury monitoring

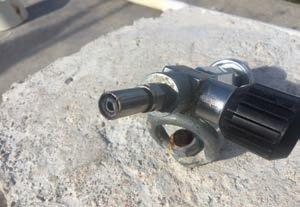

Figures A-2: braided hose failure: A) Inflator hose clearly kinked. Credit DAN, B) Branded breathing hose intact; unbranded inflator hose clearly degraded. Credit DAN; C) Regulator low pressure chamber filled with debris. Credit DAN; D) Second stage inlet clogged with hose debris. Credit DAN.
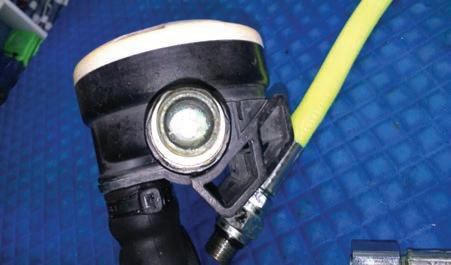

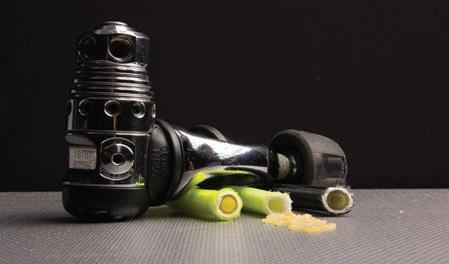
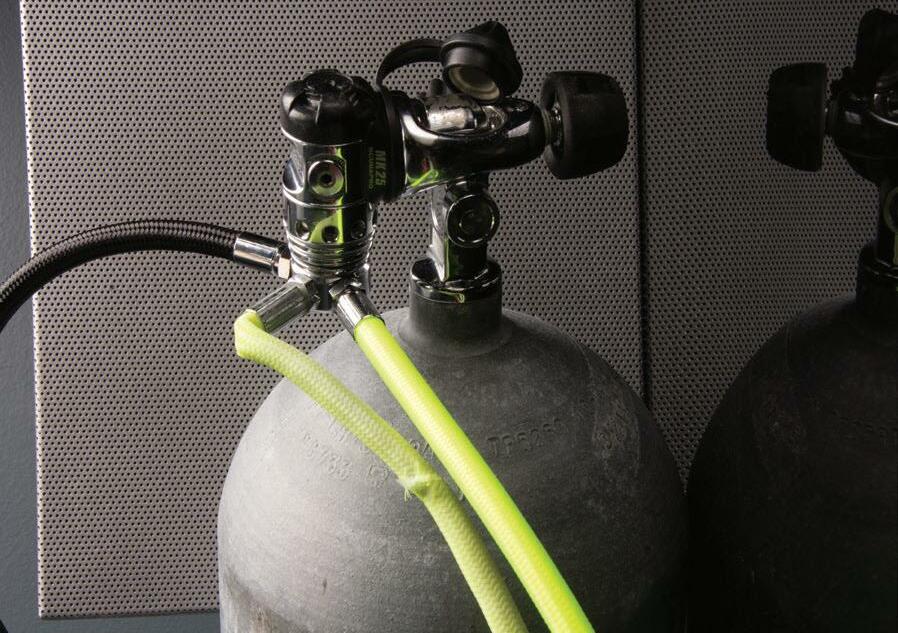
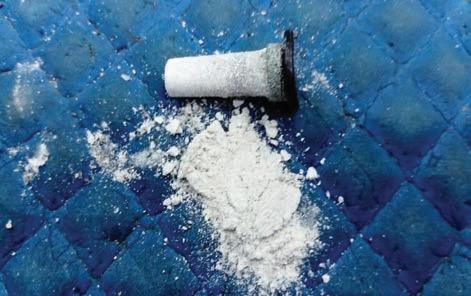
A B C
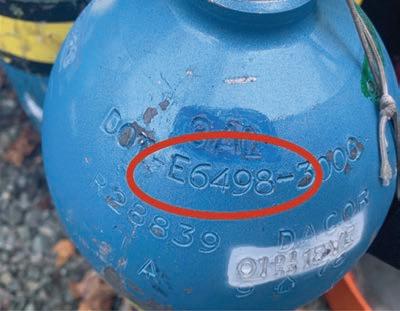
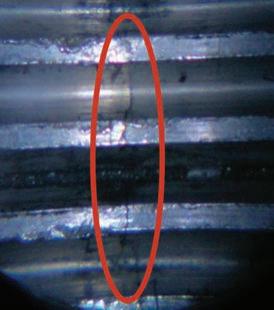
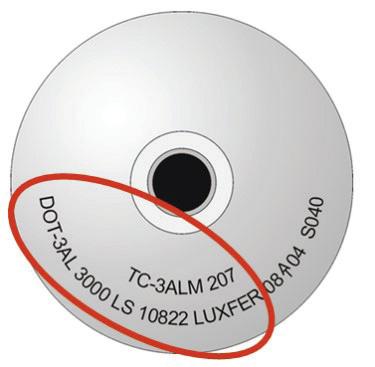
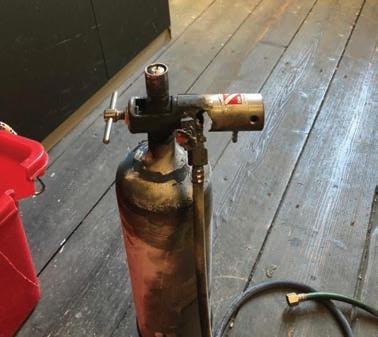
A B C D E
F
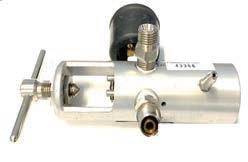
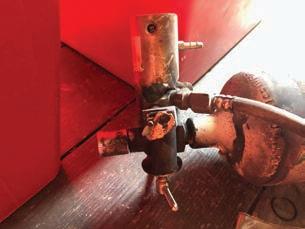
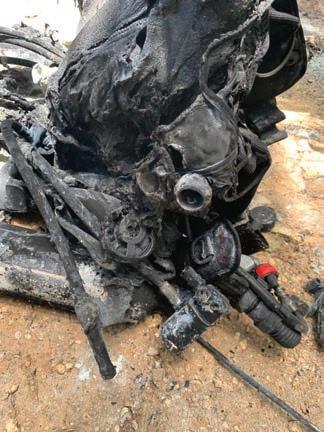
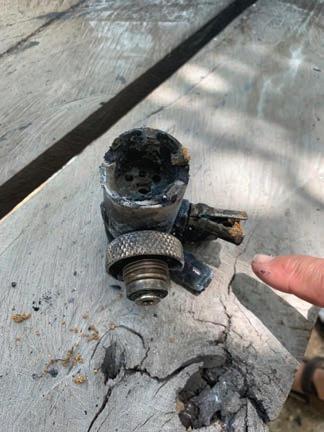
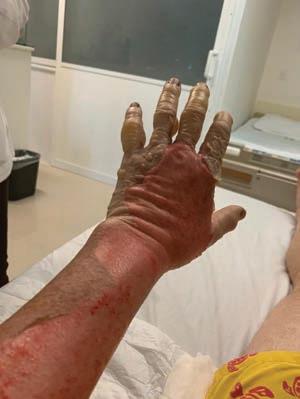
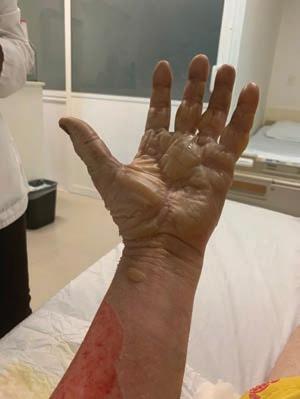
Pictures A-6: Victim and equipment after an oxygen fire (Case 6); A-C) Severe burns to hand, forearm and face. Credit F. Rueda; D) Burned inlet filter element next to new filter element. Credit AP Diving; E-F) Total destruction of rebreather by fire. Credit F. Rueda


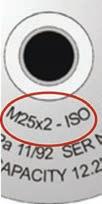
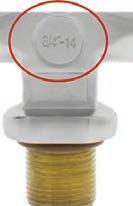
Figures A-7: Different cylinder valve configurations: A) ¾ - 14 NPS (National Pipe Straight), United States standard, DGX DX-722401-O2; B) M25 x 2 - ISO, international harmonized standard, IMCA SF 01/16.
Oxygen (%) 20.3 20.2 20–22
Carbon dioxide (ppm) 3263 3135 1000
Carbon monoxide (ppm) 490 503 10
Table A-2. Potential effects of elevated carbon monoxide (CO) at the surface

