
Darden Employment Report 2022–23

02 Welcome 03 Full-Time Class of 2022 Career Outcomes 12 Full-Time Class of 2022 Top Hiring Employers 14 Full-Time Class of 2023 Internship Outcomes 18 Full-Time Class of 2023 Top Hiring Internship Employers 20 Class of 2022 Executive MBA Career Outcomes 26 Class of 2021 M.S. Business Analytics Career Outcomes 31 Admissions Profiles: Rising Executive MBAs and Part-Time MBAs Table of Contents
Dear Darden Community,
Last year Darden students across programs achieved outstanding career outcomes and personal successes. We could not be prouder of these mission-driven individuals from around the globe, who demonstrated determination, resilience, and compassion through another season of change and renewal. As the most recent internship and full-time hiring numbers attest, the world’s leading companies continue to prize Darden MBA talent in a wide variety of industries and functions.
Highlights Across Darden Degree Programs
• Base salary for the Full-Time MBA Class of 2022 (the largest class in the School’s history) reached a record mean of $157,090
• Almost 98% of students in the Full-Time MBA Class of 2022 received an offer of employment by three months after graduation
• 132 unique employer partners hired students from Darden’s full-time MBA Class of 2022
• Darden’s Employer Engagement team delivers 400+ recruiting events each year across degree programs
• Top employers for the Executive MBA Class of 2022 included Amazon, CapitalOne, Deloitte, Inova, the U.S. Marine Corps, the U.S. Navy, and Workiva
• The MSBA Class of 2021 experienced a 17% average base salary increase from program beginning to end
• Darden welcomed its inaugural class for the Part-Time MBA program, which offers a mix of in-person and virtual delivery to provide flexibility for working professionals in the D.C. area

For career services professionals, one of the most rewarding aspects of the job is accompanying students throughout their MBA career journeys. I know I speak for the entire Career Center team when I say it has been a pleasure and a privilege to collaborate with these accomplished and innovative professionals as they worked so diligently toward their dreams. Together, we look forward to witnessing their new endeavors and celebrating their future triumphs.
Warm regards,
Jeff McNish
Assistant Dean, Career Center
 +1-434-297-7971
McNishJ@darden.virginia.edu
02 UVA D arden S chool of B usiness Employment Report 2022–23 SPRING 2023
FULL-TIME MBA CLASS OF 2022
Full-Time MBA Class of 2022 Admissions Profile
395 CLASS SIZE
35 COUNTRIES REPRESENTED
63
INTERNATIONAL STUDENTS
38% WOMEN
16% U.S. MINORITY
41 CONSORTIUM MEMBERS
27 AVERAGE AGE
705 AVERAGE GMAT
3.49 AVERAGE UNDERGRADUATE GPA
5.3 AVERAGE YEARS OF WORK EXPERIENCE
13% ADVANCED DEGREES
8% MILITARY BACKGROUND
03 UVA D arden S chool of B usiness Employment Report 2022–23
FULL-TIME MBA CLASS OF 2022
Nearly All Darden Graduates Have Full-Time Offers Three Months Post-Graduation

Timing of First Job Offers
94% RECEIVED AN OFFER BY GRADUATION
97.5% RECEIVED AN OFFER BY THREE MONTHS AFTER GRADUATION
98%
OF STUDENTS WITH NON-PERMANENT WORK AUTHORIZATION RECEIVED AN OFFER BY THREE MONTHS AFTER GRADUATION
Total Seeking Employment First Offer Accepted by Graduation First Offer After Graduation and by Three Months After Graduation Have Not Reported Receiving an Offer by Three Months After Graduation NUMBER PERCENT NUMBER PERCENT NUMBER PERCENT Permanent Work Authorization 313 291 93.0% 14 4.5% 8 2.6% Non-Permanent Work Authorization 54 53 98.1% 0 0% 1 1.9% Total Graduates Seeking Employment 367 344 93.7% 14 3.8% 9 2.5% 04 UVA D arden S chool of B usiness Employment Report 2022–23
FULL-TIME MBA CLASS OF 2022
96% of Students Accept Job Offer by Three Months After Graduation

Timing of First Job Acceptances
91% ACCEPTED AN OFFER BY GRADUATION
96% ACCEPTED AN OFFER BY THREE MONTHS AFTER GRADUATION
94% OF STUDENTS WITH NON-PERMANENT WORK AUTHORIZATION ACCEPTED AN OFFER BY GRADUATION
98% OF STUDENTS WITH NON-PERMANENT WORK AUTHORIZATION ACCEPTED AN OFFER BY THREE MONTHS AFTER GRADUATION
CLASS OF 2022
Total Seeking Employment First Offer Accepted by Graduation Accepted Job After Graduation and by Three Months After Graduation Have Not Reported Accepting a Job by Three Months After Graduation NUMBER PERCENT NUMBER PERCENT NUMBER PERCENT Permanent Work Authorization 313 282 90.1% 19 6.1% 12 3.8% Non-Permanent Work Authorization 54 51 94.4% 2 3.7% 1 1.9% Total Graduates Seeking Employment 367 333 90.7% 21 5.7% 13 3.5% 05 UVA D arden S chool of B usiness Employment Report 2022–23
CLASS OF 2022
FULL-TIME MBA CLASS OF 2022
Base Salaries for Darden Students Reach Record Highs
Base Salary
(1) Divides number of students reporting Base Salary by the number of students reporting accepting a position Note: Darden uses the 12Twenty system to ensure consistent and timely currency conversion
Signing/Starting Bonus
(2) Divides number of students reporting useable Signing/Starting Bonus information by the number of students providing base salary information. Note: Darden uses the 12Twenty system to ensure consistent and timely currency conversion
# Reporting Base Salary % Reporting Base Salary1 Mean Median Low High Permanent Work Authorization 298 99.0% $156,670 $175,000 $65,000 $215,000 Non-Permanent Work Authorization 52 98.1% $159,501 $175,000 $90,000 $185,000 Total Reporting Base Salary 350 98.9% $157,090 $175,000 $65,000 $215,000
# Reporting Signing/ Starting Bonus % Reporting Signing/ Starting Bonus 2 Mean Median Low High Permanent Work Authorization 265 88.9% $34,377 $30,000 $5,000 $95,000 Non-Permanent Work Authorization 49 94.2% $36,762 $30,000 $15,000 $85,300 Total Reporting Signing/ Starting Bonus 314 89.7% $34,749 $30,000 $5,000 $95,000
06 UVA D arden S chool of B usiness Employment Report 2022–23
Darden Graduates In Demand Across Industries
Compensation by Industries Industry Graduates Accepting New Employment Graduates Reporting Salary Mean Base Salary Median Base Salary Low Base Salary High Base Salary NUMBER PERCENT NUMBER Consulting 154 43.5% 154 $170,402 $175,000 $104,913 $185,000 Consumer Packaged Goods 12 3.4% 12 $120,308 $117,500 $110,000 $154,300 Energy 2 0.6% 2 I/D I/D I/D I/D Financial Services 90 25.4% 88 $164,739 $175,000 $100,000 $200,000 Government 1 0.3% 1 I/D I/D I/D I/D Healthcare (Including Products and Services) 12 3.4% 12 $126,356 $127,885 $112,000 $140,000 Hospitality 3 0.8% 3 $112,822 $120,000 $90,000 $128,466 Manufacturing 10 2.8% 9 $128,863 $125,000 $120,000 $140,100 Media/Entertainment 1 0.3% 1 I/D I/D I/D I/D Non-Profit/Education 3 0.8% 3 $81,300 $78,900 $65,000 $100,000 Real Estate 4 1.1% 4 $152,500 $145,000 $120,000 $200,000 Retail 5 1.4% 4 $144,875 $139,750 $125,000 $175,000 Technology 49 13.8% 49 $134,166 $139,000 $73,000 $175,000 Transportation and Logistics Services 5 1.4% 5 $130,000 $140,000 $115,000 $140,000 Other 3 0.8% 3 $215,000 $215,000 $215,000 $215,000 Total Reporting 354 100% 350 $157,090 $175,000 $65,000 $215,000 I /D: Fewer than three data points. Individual compensation information is confidential. To protect confidentiality, the Career Center only reports compensation information for data points equal to or greater than three. % Grads in Top Hiring Industries Technology Financial Services Consulting 50 30 40 20 10 0 26 18 32 2018 24 15 36 2019 25 14 44 2022 26 19 32 2021 19 20 41 2020
FULL-TIME MBA CLASS OF 2022 07 UVA D arden S chool of B usiness Employment Report 2022–23
FULL-TIME MBA CLASS OF 2022
Darden MBAs Thrive Across Business Functions
I /D: Fewer than three data points. Individual compensation information is confidential. To protect confidentiality, the Career Center only reports compensation information for data points equal to or greater than three.

Compensation by Professional Functions Function Graduates Accepting New Employment Graduates Reporting Salary Mean Base Salary Median Base Salary Low Base Salary High Base Salary NUMBER PERCENT NUMBER Consulting 156 44.1% 156 $168,871 $175,000 $90,000 $185,000 Finance/Accounting 95 26.8% 93 $161,011 $175,000 $65,000 $200,000 General Management 39 11.0% 37 $134,481 $135,000 $100,000 $175,000 Human Resources 1 0.3% 1 I/D I/D I/D I/D Marketing/Sales 45 12.7% 45 $129,939 $125,000 $90,000 $175,000 Information Technology 4 1.1% 4 $137,500 $151,000 $73,000 $175,000 Operations/Logistics 11 3.1% 11 $137,409 $140,000 $120,000 $170,000 Other 3 0.8% 3 $215,000 $215,000 $215,000 $215,000 Total Reporting 354 100% 350 $157,090 $175,000 $65,000 $215,000 CLASS OF 2022
08 UVA D arden S chool of B usiness Employment Report 2022–23
CLASS OF 2022
FULL-TIME MBA CLASS OF 2022
Darden Grads Pursue Careers in Sought-After Locations
Compensation by World Region Summary
No outcomes reported in Africa or Oceania.
I /D: Fewer than three data points. Individual compensation information is confidential. To protect confidentiality, the Career Center only reports compensation information for data points equal to or greater than three.
Compensation by United States Region
The percentage of graduates accepting new employment is based on the U.S. Region total (344), not the North American total (345). Please note that there was only one outcome in Canada.
Graduates Accepting New Employment Graduates Reporting Salary Mean Base Salary Median Base Salary Low Base Salary High Base Salary United States NUMBER PERCENT NUMBER Mid-Atlantic 68 19.8% 68 $152,936 $165,000 $65,000 $215,000 Midwest 26 7.6% 26 $150,596 $162,500 $102,000 $175,000 Northeast 121 35.2% 120 $164,312 $175,000 $112,000 $215,000 South 42 12.2% 42 $159,190 $175,000 $105,000 $215,000 Southwest 46 13.4% 46 $161,739 $175,000 $120,000 $200,000 West 41 11.9% 39 $146,038 $150,000 $73,000 $185,000
Region Graduates Accepting New Employment Graduates Reporting Salary Mean Base Salary Median Base Salary Low Base Salary High Base Salary NUMBER PERCENT NUMBER Asia 4 1.1% 3 $117,894 $123,000 $104,913 $125,770 Europe 2 0.6% 2 I/D I/D I/D I/D Latin America/Caribbean 3 0.8% 3 $119,000 $125,000 $95,000 $137,000 North America 345 97.5% 342 $157,844 $175,000 $65,000 $215,000 Total Reporting 354 100% 350 $157,090 $175,000 $65,000 $215,000
09 UVA D arden S chool of B usiness Employment Report 2022–23
The Darden MBA Experience Prepares Leaders for Any Location
Compensation by United States Region
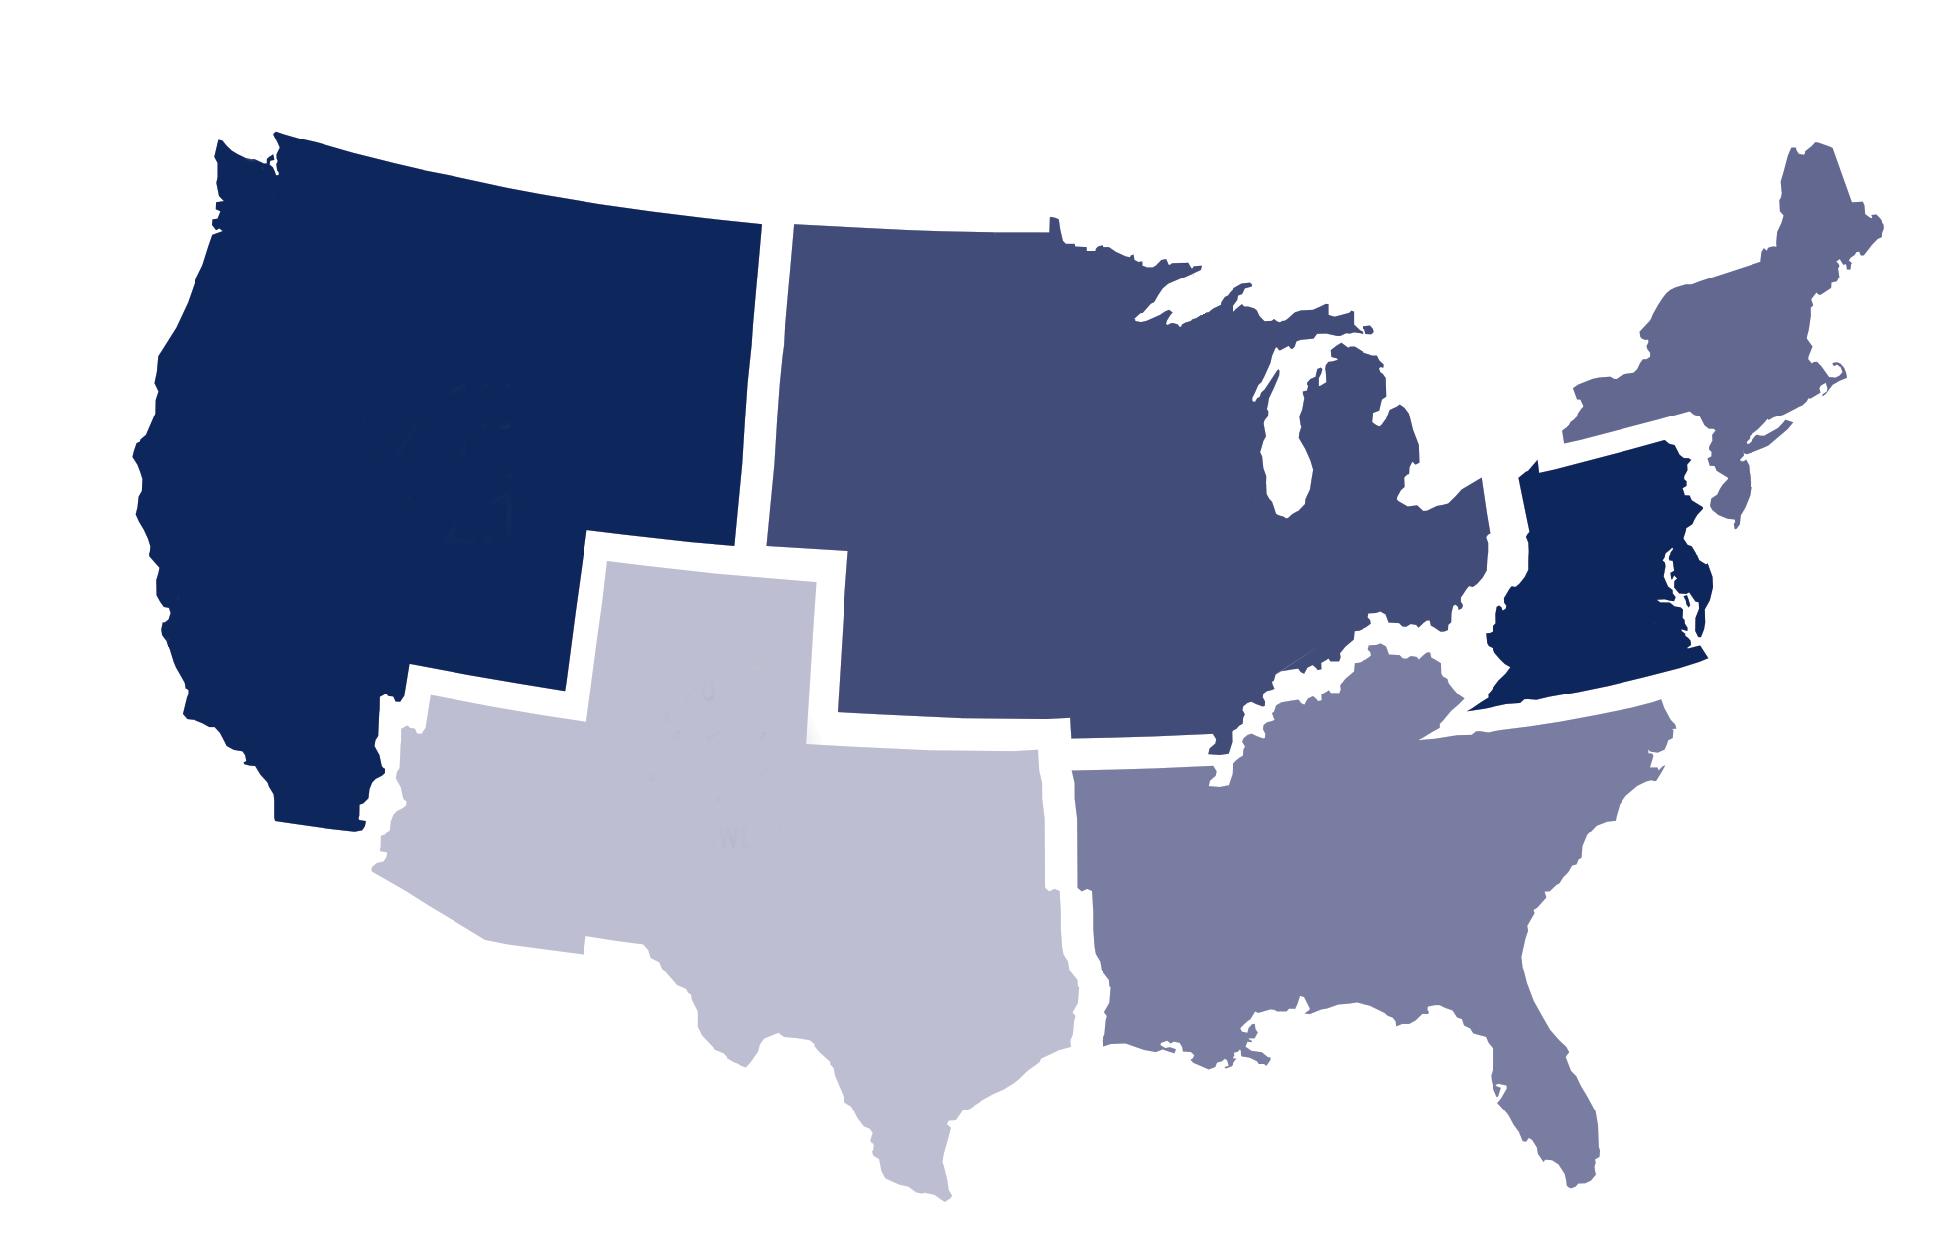
% of students Region Median Base Salary 12% WEST $150,000 8% MIDWEST $162,500 13% SOUTHWEST $175,000 12% SOUTH $175,000 35% NORTHEAST $175,000 20% MID-ATLANTIC $165,000
CLASS OF 2022 10 UVA D arden S chool of B usiness Employment Report 2022–23 FULL-TIME MBA CLASS OF
2022
FULL-TIME MBA CLASS OF 2022

Primary Source of Full-Time
Job Acceptances
School-Facilitated Activities Number Percent Scheduled Interviews on or off campus for full-time employment 35 9.9% Activities supported by career center (e.g. job fairs/conferences, employer events, information meetings, school promoted job boards) 14 4.0% Conversion of Internship; Internship obtained through School sources 83 23.4% Job Postings on school career systems, resume books, resume referrals by career center 114 32.2% Other School-facilitated source 12 3.4% School network/resources (e.g. faculty referrals, alumni referrals, classmates, campus speakers, treks, club events, class projects) 14 4.0% Total School-Facilitated Activities 272 76.8% Graduate-Facilitated Activities Number Percent Personal contacts (e.g. previous employers, family, friends outside of school, etc.) 28 7.9% Conversion of internship; internship obtained through graduate-initiated sources 19 5.4% Online job postings e.g. social media/LinkedIn, Indeed, company websites) 23 6.5% Other graduate-facilitated sources 12 3.4% Total Graduate-Facilitated Activities 82 23.2% Total 354 100%
11 UVA D arden S chool of B usiness Employment Report 2022–23


12 UVA D arden S chool of B usiness Employment Report 2022–23 FULL-TIME MBA CLASS OF 2022
Tranformational Global Employers Hire Darden’s Most Recent Graduates Top Hiring Companies
Full-Time MBA Class of 2023 Internships Report

FULL-TIME MBA INTERNSHIPS REPORT CLASS OF 2023
Full-Time
MBA Class of 2023 Admissions
Profile
351 CLASS SIZE
14 COUNTRIES REPRESENTED
112 INTERNATIONAL STUDENTS
40% WOMEN
21% U.S. MINORITY
52 CONSORTIUM MEMBERS
28 AVERAGE AGE
715 AVERAGE GMAT
3.52 AVERAGE UNDERGRADUATE GPA
5.8 AVERAGE YEARS OF WORK EXPERIENCE
17% ADVANCED DEGREES
7% MILITARY BACKGROUND
14 UVA D arden S chool of B usiness Employment Report 2022–23
CLASS OF 2023 FULL-TIME MBA INTERNSHIPS REPORT CLASS OF 2023
Darden Interns In Demand by Top Industries
Compensation by Industries
I /D: Fewer than three data points. Individual compensation information is confidential. To protect confidentiality, the Career Center only reports compensation information for data points equal to or greater than three. *Salaries reported are monthly.
15 UVA D arden S chool of B usiness Employment Report 2022–23
Industry Graduates Accepting New Employment Graduates Reporting Salary * Mean Base Salary * Median Base Salary * Low Base Salary * High Base Salary * NUMBER PERCENT NUMBER Consulting 122 36.3% 121 $13,873 $14,582 $3,792 $15,833 Consumer Packaged Goods 14 4.2% 14 $7,898 $7,558 $6,933 $10,000 Energy 4 1.2% 4 $7,104 $6,542 $4,333 $11,000 Financial Services 100 29.8% 98 $12,625 $14,583 $3,120 $15,417 Healthcare (Including Products and Services) 13 3.9% 13 $7,831 $8,500 $2,000 $9,533 Hospitality 1 0.3% 1 I/D I/D I/D I/D Manufacturing 15 4.5% 15 $8,843 $10,000 $1,083 $10,416 Media/Entertainment 3 0.9% 3 $8,707 $8,667 $7,453 $10,000 Non-Profit/Education 3 0.9% 3 $5,289 $5,200 $4,000 $6,666 Real Estate 5 1.5% 5 $7,760 $8,000 $3,467 $11,666 Retail 6 1.8% 6 $8,750 $8,877 $7,999 $9,750 Technology 45 13.4% 45 $8,880 $8,875 $4,000 $14,751 Transportation and Logistics Services 2 0.6% 2 I/D I/D I/D I/D Other 3 0.9% 3 $12,976 $16,875 $4,200 $17,853 Total Reporting 336 100% 333 $11,649 $13,000 $1,083 $17,853
OF 2023
Darden Experience Prepares First Years to Excel in Any Business Function
by Professional Functions
I /D: Fewer than three data points. Individual compensation information is confidential. To protect confidentiality, the Career Center only reports compensation information for data points equal to or greater than three. *Salaries reported are monthly.
16 UVA D arden S chool of B usiness Employment Report 2022–23 Compensation
Function Graduates Accepting New Employment Graduates Reporting Salary * Mean Base Salary * Median Base Salary * Low Base Salary * High Base Salary * NUMBER PERCENT NUMBER Consulting 120 35.7% 119 $13,811 $14,582 $4,000 $15,833 Finance/Accounting 102 30.4% 100 $12,421 $14,583 $2,000 $15,417 General Management 46 13.7% 46 $8,203 $8,708 $1,083 $13,750 Human Resources 3 0.9% 3 $8,867 $9,208 $8,000 $9,393 Marketing/Sales 43 12.8% 43 $8,389 $8,500 $4,000 $13,000 Information Technology 11 3.3% 11 $9,730 $10,200 $7,100 $11,341 Operations/Logistics 8 2.4% 8 $10,344 $9,923 $8,873 $14,500 Other 3 0.9% 3 $12,976 $16,875 $4,200 $17,853 Total Reporting 336 100% 333 $11,649 $13,000 $1,083 $17,853
FULL-TIME MBA INTERNSHIPS REPORT CLASS
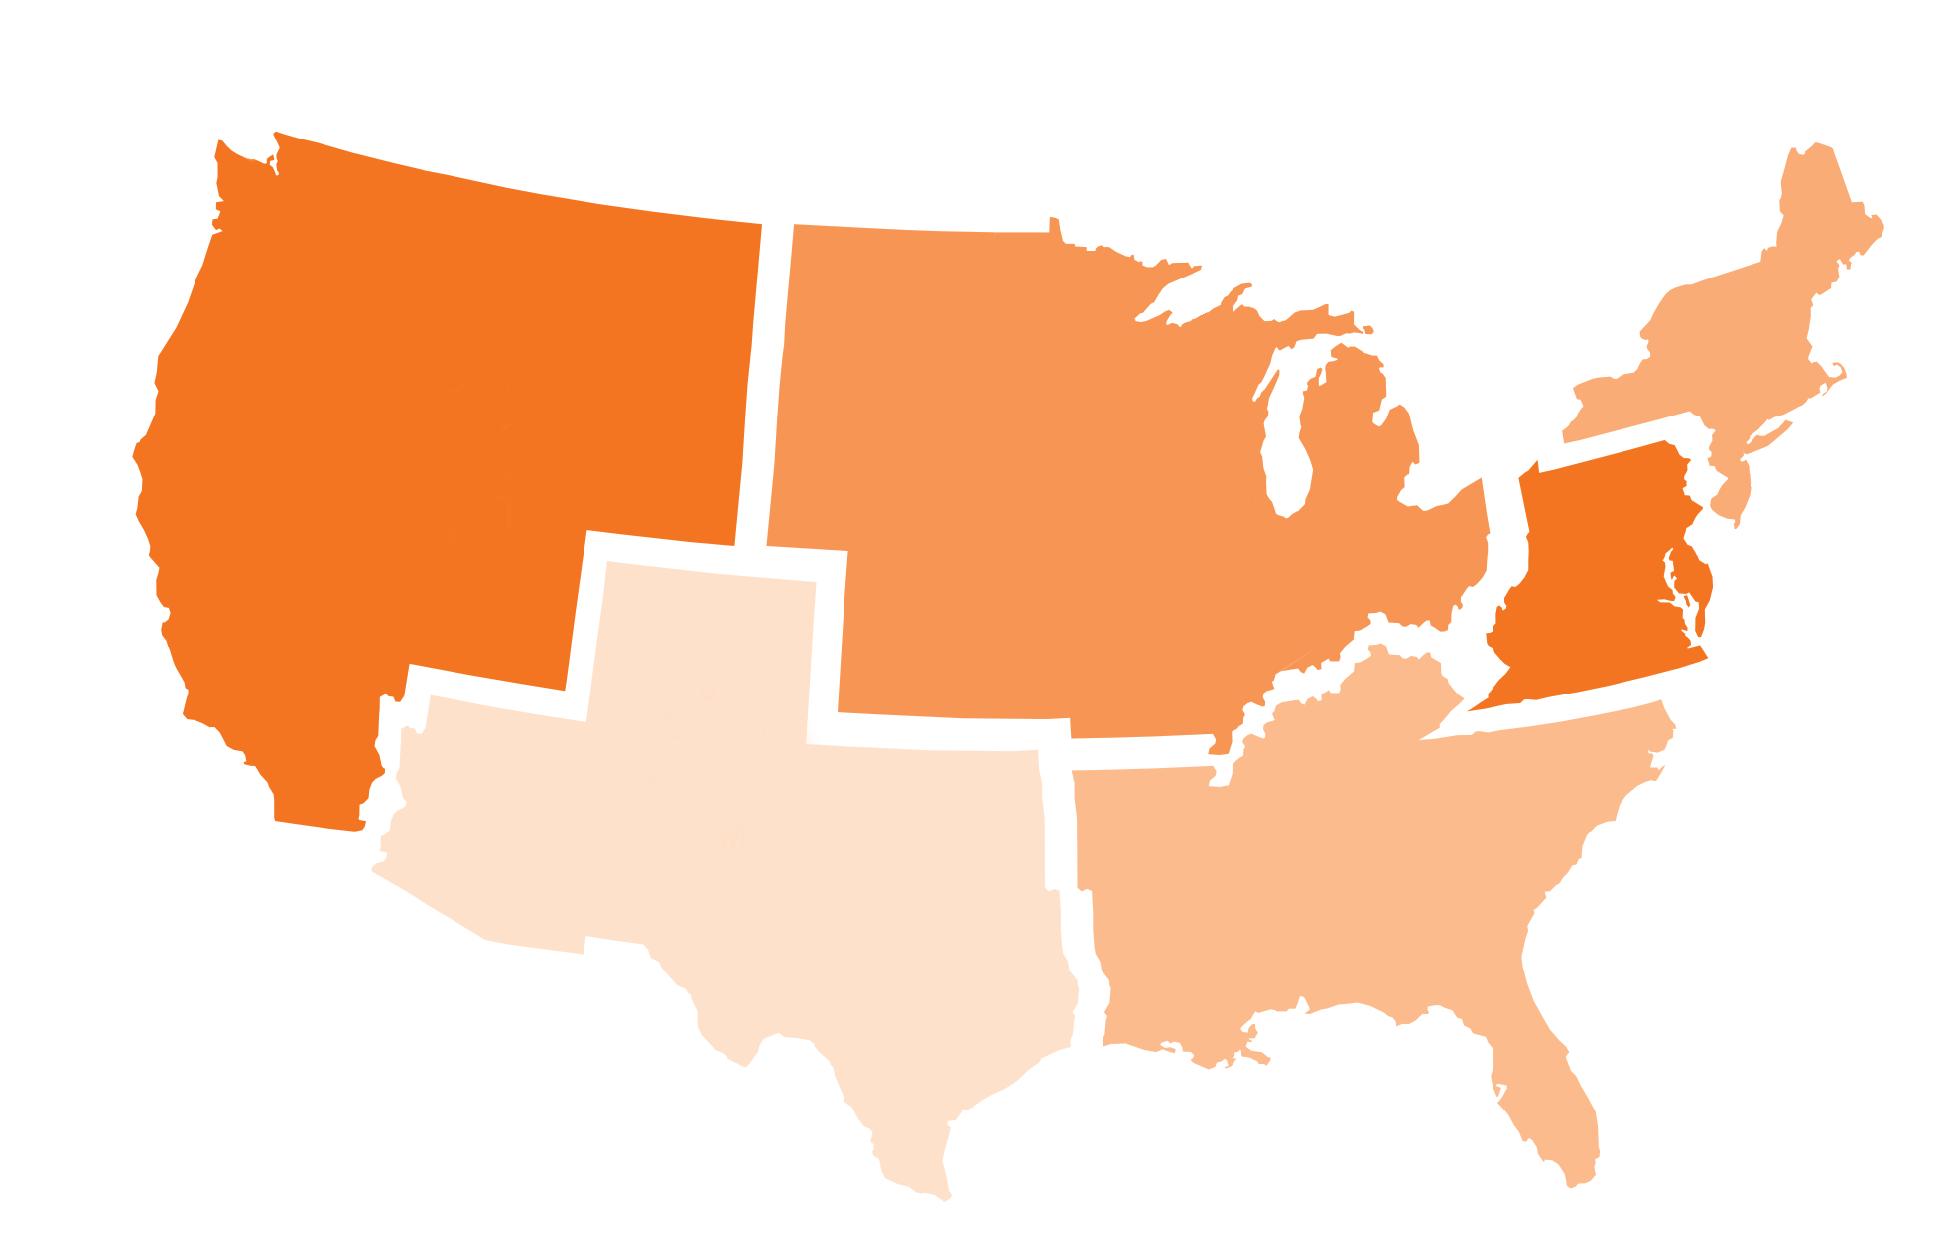
Compensation by United States Region
% of students Region Mean Base Salary (monthly)
FULL-TIME MBA INTERNSHIPS REPORT CLASS
17 UVA D arden S chool of B usiness Employment Report 2022–23 16% WEST $9,994 8% MIDWEST $11,161 11% SOUTHWEST $11,423 7% SOUTH $12,329 35% NORTHEAST $12,888
MID-ATLANTIC $11,169
OF 2023
23%
Darden Interns Gain Widespread Experience
Class of 2023 Top Hiring Companies for Interns

18 UVA D arden S chool of B usiness Employment Report 2022–23
FULL-TIME MBA INTERNSHIPS REPORT CLASS OF 2023
Executive MBA Class of 2022 Career Outcomes

EXECUTIVE MBA PROGRAM CLASS OF 2022
Executive MBA Class of 2022 Admissions Profile
151 CLASS SIZE
10 COUNTRIES REPRESENTED
30% WOMEN
18% U.S. MINORITY
34 AVERAGE AGE
37% ADVANCED DEGREES
11.2 AVERAGE YEARS OF WORK EXPERIENCE
28% MILITARY BACKGROUND
20 UVA D arden S chool of B usiness Employment Report 2022–23


Executive Graduates Experience Large Gains in Salary After Earning Their Darden MBA Top Employers for the Executive MBA Class of 2022 EXECUTIVE MBA PROGRAM CLASS OF 2022 $180,998 AVERAGE BASE SALARY AT END OF PROGRAM $60K to $1.5M END OF PROGRAM BASE SALARY RANGE $150,664 AVERAGE BASE SALARY AT BEGINNING OF PROGRAM 21 UVA D arden S chool of B usiness Employment Report 2022–23
EXECUTIVE MBA PROGRAM CLASS OF 2022
Executive MBA Graduates Enter A Wide Variety of Functions
I /D: Fewer than three data points. Individual compensation information is confidential. To protect confidentiality, the Career Center only reports compensation information for data points equal to or greater than three.

Compensation
Function Function Graduates Employed Graduates Reporting Salary Mean Base Salary Median Base Salary NUMBER PERCENT NUMBER Consulting 26 18.6% 25 $147,076 $145,000 Finance/Accounting 11 7.9% 8 $161,889 $165,000 General Management 38 27.1% 33 $163,389 $146,750 Human Resources 3 2.1% 2 I/D I/D Information Technology 7 5.0% 7 $186,000 $177,000 Marketing/Sales 29 20.7% 29 $159,138 $150,000 Operations/Logistics 19 13.6% 19 $158,514 $142,000 Other 7 5.0% 7 $570,000 $400,000
by
22 UVA D arden S chool of B usiness Employment Report 2022–23
EXECUTIVE MBA PROGRAM CLASS OF 2022
The World’s Leading Industries Seek Out Darden’s Executive MBAs
I /D: Fewer than three data points. Individual compensation information is confidential. To protect confidentiality, the Career Center only reports compensation information for data points equal to or greater than three.
Compensation by Industry Industry Graduates Employed Graduates Reporting Salary Mean Base Salary Median Base Salary NUMBER PERCENT NUMBER Consulting 21 15% 20 $141,625 $137,000 Consumer Packaged Goods 2 1.0% 2 I/D I/D Energy 2 1.0% 2 I/D I/D Financial Services 18 13% 16 $178,500 $150,000 Government or Military 18 13% 18 $143,362 $134,428 Healthcare (including Products & Services) 18 13% 17 $367,824 $350,000 Hospitality 3 2.0% 3 $148,667 $157,000 Information Technology 1 1.0% 1 I/D I/D Manufacturing 9 6.0% 9 $151,778 $150,000 Media/Entertainment 6 4.0% 6 $150,833 $140,000 Non-Profit/Education 6 4.0% 6 $118,000 $117,000 Real Estate 7 5.0% 6 $186,083 $179,000 Retail 3 2.0% 3 $106,667 $100,000 Technology 22 16% 22 $165,235 $158,000 Transportation & Logistics Services 1 1.0% 1 I/D I/D Other 3 2.0% 3 $183,000 $170,000
23 UVA D arden S chool of B usiness Employment Report 2022–23
EXECUTIVE MBA PROGRAM CLASS OF 2022
Darden’s Executive MBAs Lead Across the Nation
by Region
I /D: Fewer than three data points. Individual compensation information is confidential. To protect confidentiality, the Career Center only reports compensation information for data points equal to or greater than three.
Compensation
Region Percent Graduates Reporting Salary Mean Base Salary Mid-Atlantic 84.03% 113 $180,998 Northeast 6.25% 9 $165,000 South 4.86% 6 $220,750 Southwest 3.47% 5 $161,000 Midwest 1.39% 2 I/D
24 UVA D arden S chool of B usiness Employment Report 2022–23
Master of Science in Business Analytics
Class of 2021 Career Outcomes

Designed for professionals with strong problem-solving and communication abilities, the University of Virginia’s Master of Science in Business Analytics (MSBA), offered in partnership by the Darden School of Business and the McIntire School of Commerce, empowers students with essential and emerging data analysis techniques within a business context. Faculty from Darden and McIntire jointly deliver a projectoriented curriculum that positions MSBA graduates at the forefront of business analysis. This one-year program is delivered in a hybrid format, with online instruction and in-person residencies at the UVA Darden DC Metro location in Arlington, Virginia. Outcomes for MSBA Class of 2022 will be provided in the 2023-24 Employment Report.
MSBA Class of 2021 Admissions Profile
71 CLASS SIZE
9 STATES REPRESENTED
20% VETERANS OR ACTIVE DUTY
32% WOMEN
39% OUT OF STATE
17%
7.8 AVERAGE YEARS OF WORK EXPERIENCE
21% ADVANCED DEGREES
just one year,
Class of 2021
% 24 % Began a new job by graduation Began a new role by graduation
MASTER OF SCIENCE IN BUSINESS ANALYTICS CLASS OF 2021 In
many
graduates secure a new job or new role 30
URM
26 UVA D arden S chool of B usiness Employment Report 2022–23
MASTER OF SCIENCE IN BUSINESS ANALYTICS CLASS OF 2021
Business and Data Skill Sets Help Students Succeed Across Many Business Functions
by Function
I /D: Fewer than three data points. Individual compensation information is confidential. To protect confidentiality, the Career Center only reports compensation information for data points equal to or greater than three.
MSBA Class of 2021 Salaries
$95,525 AVERAGE BASE SALARY AT BEGINNING OF PROGRAM
$111,482 AVERAGE BASE SALARY AT END OF PROGRAM
17% AVERAGE BASE INCREASE FROM BEGINNING TO END OF PROGRAM
Compensation
Function Graduates Employed Graduates Reporting Salary Mean Base Salary Median Base Salary NUMBER PERCENT NUMBER Consulting 13 26% 10 $114,950 $116,000 Finance/Accounting 4 8.0% 3 $93,666 $90,000 General Management 5 10% 3 $100,879 $115,000 Human Resources 1 2.0% 1 I/D I/D Information Technology 5 10% 4 $130,500 $130,000 Marketing/Sales 7 14% 5 $112,800 $120,000 Operations/Logistics 8 16% 6 $99,450 $98,350 Other 7 14% 5 $121,800 $100,000
27 UVA D arden S chool of B usiness Employment Report 2022–23
OF SCIENCE IN BUSINESS ANALYTICS CLASS OF 2021
MASTER
$91,000 FINANCIAL SERVICES
Median Base Salary for Top 3 Industries Graduates Employed by Industry Consulting 13 Financial Services 10 Technology 6 Government 5 Consumer Packaged Goods 3 Other 3 Media/Entertainment 2 Transportation 2 Energy 1 Hospitality 1 Manufacturing 1 Pharma/Biotech/Healthcare 1 Real Estate 1 Retail 1 28 UVA D arden S chool of B usiness Employment Report 2022–23
$114,000 TECHNOLOGY
MSBA Graduates Gain Cross-Industry Employment and Expertise
MSBA CLASS OF 2021
$110,000 CONSULTING
With Focus on the Mid-Atlantic, MSBA Graduates Still Pursue Cross-Country Employment
by Region
*Fewer than three data points. To protect confidentiality, the Career Center only reports compensation information for data points equal to or greater than three.

Compensation
Graduates Employed Graduates Reporting Salary Mean Base Salary Median Base Salary NUMBER PERCENT NUMBER Region Mid-Atlantic 41 82% 29 $110,950 $105,000 Northeast* 2 4% 2 I/D I/D Remote* 3 6% 2 I/D I/D Southwest 3 6% 3 $101,667 $108,000 West* 1 2% 1 I/D I/D
MASTER OF SCIENCE IN BUSINESS ANALYTICS
29 UVA D arden S chool of B usiness Employment Report 2022–23
CLASS OF 2021
Admissions
Profiles: Rising Darden Executive MBA and Part-Time MBA Classes

EXECUTIVE MBA PROGRAM CLASS OF 2023
The Executive MBA program at the University of Virginia Darden School of Business prepares students for purpose-driven leadership and helps develop an enterprise perspective. Guided by our top ranked professors, students gain the leadership capabilities, experience, and proven professional skills to propel firms forward. After graduation, many students begin new roles, join new companies or launch their own ventures. The Executive MBA program is based at the UVA Darden D.C. Metro location in Arlington, Virginia.
Executive MBA Class of 2023 Admissions Profile
138 CLASS SIZE
46% WOMEN
12 AVERAGE YEARS OF WORK EXPERIENCE
35 AVERAGE AGE
8 COUNTRIES REPRESENTED
23% U.S. MINORITY
25% MILITARY BACKGROUND
36% ADVANCED DEGREES
31 UVA D arden S chool of B usiness Employment Report 2022–23
The Part-Time MBA program at the University of Virginia Darden School of Business offers the transformational education experience Darden is known for, with a mix of in-person and virtual delivery, providing flexibility to working professional students. Students establish a solid foundation in the fundamentals of business with ample opportunity for exploration. At Darden, we empower agile, creative and critical thinkers to be catalysts for global business and social change. Darden’s signature approach to teaching and learning allows students to pursue their purpose, master business tools and concepts and gain the holistic leadership skills they need to help your organization make an impact. The Part-Time MBA program is based at the UVA Darden D.C. Metro location in Arlington, Virginia.
Part-Time MBA Inaugural Class Admissions Profile
68 CLASS SIZE
40% WOMEN
27 AVERAGE AGE
10 COUNTRIES REPRESENTED
32% U.S. MINORITY
5.5 AVERAGE YEARS OF WORK EXPERIENCE
9% MILITARY BACKGROUND
54 UNIQUE EMPLOYERS
32% ADVANCED DEGREES
16 INDUSTRIES
PART-TIME MBA PROGRAM INAUGURAL CLASS
CAREER OUTCOMES FOR THIS CLASS AVAILABLE IN LATE 2025
32 UVA D arden S chool of B usiness Employment Report 2022–23
100 Darden Blvd, Charlottesville, VA 22903 USA darden.virginia.edu Career Center coaching@darden.virginia.edu +1-434-924-7283 FROM HERE TO ANYWHERE


