QUARTERLY MARKET REPORT
Third Quarter 2024 ~ July - September

QUARTERLY MARKET REPORT
Third Quarter 2024 ~ July - September
Pelican Bay
Vanderbilt Beach
Kalea Bay, The Dunes
New Buffalo, Three Oaks
Union Pier
Lakeside, Harbert
Sawyer Grand Beach, Michiana, Long Beach
Lake Geneva, Williams Bay
Fontana, Linn
Delavan, Como
Kenilworth,
Deer Valley Old Town/Park City/Mountain Resort
The Canyons/The Colony
Thaynes Canyon, Park Meadows
Sun Peak/Bear Hollow
Silver Springs Area/Old Ranch Road/Kimball
Trailside Park/Quinn’s Junction
Silver Creek Estates/Village
Prospector
Jeremy Ranch/Pinebrook/Summit Park
Heber City/Midway
Kamas
Jordanelle/Mayflower Jordanelle
Hideout
Glenwild
Promontory, Red Ledges
Tuhaye, Victory Ranch
#1
TEAM IN MIDWEST 2
#1
TEAM IN ILLINOIS 3
#1
TEAM IN SOUTHWEST FLORIDA 4
#1
TEAM IN UTAH 5
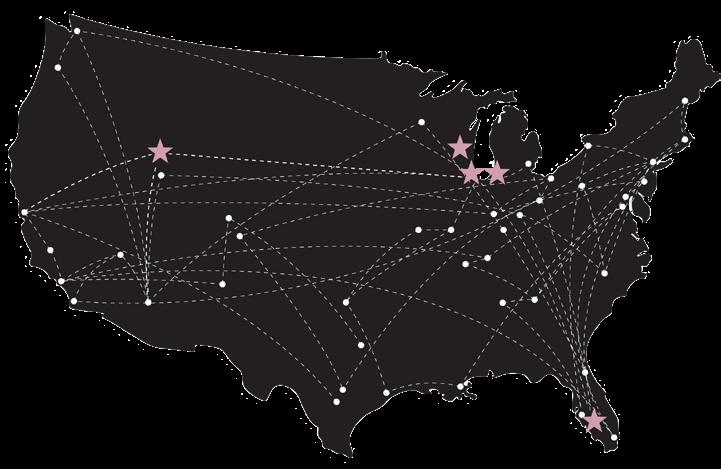
The DMG Difference is the power of our incomparable network. Our team receives daily calls from our global real estate partners with buyers who are interested in our markets in Illinois, Florida, Michigan, Utah and Wisconsin. These connections give us the ability to tap into a different buyer pool in a matter of seconds.
We operate as a true team. Our resident Chicago, Hinsdale, Lake Forest, Lake Geneva, Naples, New Buffalo and Park City agents cover the full spectrum of properties, handling both sales and rentals at all price points.
We work with clients across the nation. As Coldwell Banker’s top team in Illinois, the Midwest, Southwest Florida and Utah, our network extends beyond our markets to qualified buyers from all over the US and beyond.
• Chicago, Lake Forest/ Lake Bluff and Winnetka, Illinois
• Lake Geneva, Wisconsion
• Naples, Flordia
• New Buffalo, Michigan
• Park City, Utah
• Arizona
• California
• Colorado
• Connecticut
• District of Columbia
• Florida
• Georgia
• Hawaii
• Illinois
• Indiana
• Long Island
• Louisiana
• Maine
• Maryland
• Massachusetts
• Michigan
• Minnesota
• Nevada
• New Jersey
• New York/ Long Island
• North Carolina
• Oregon
• South Carolina
• Tennessee
• Utah
• Virginia
• Washington
• Belgium
• Canada
• France
• Italy
• London
• Luxembourg
• Mexico
• Monaco
• Switzerland

BY DAWN MCKENNA
The third quarter of 2024 saw the U.S. real estate market navigating a mix of challenges and positive shifts. Although housing inventory saw notable increases, high prices and mortgage rate changes have been key in shaping the market, albeit slowly, during the last quarter.
One of the key developments in Q3 2024 was the significant growth in housing inventory. The number of homes actively for sale jumped by 22.9% compared to the previous year1 . This growth was especially pronounced in September, driven by a drop in mortgage rates, which helped erode the “rate-lock” effect that had kept many sellers on the sidelines. This “lock-in” effect occurs when homeowners with low mortgage rates hesitate to sell, as they face significantly higher borrowing costs on a new home.
Despite these gains, inventory remains 23.2% below pre-pandemic levels2. This slow but steady recovery is a sign that the market is moving toward a more balanced state. However, the market still favors sellers, particularly in high-demand regions.
Mortgage rates played a pivotal role in shaping the market during the third quarter. The Federal Reserve’s decision to cut interest rates by 50 basis points in September led to a marked decrease in mortgage rates, reaching their lowest levels in two years. This provided a much-needed boost in buying power for sidelined buyers and sparked increased market activity.
The number of pending home sales (homes under contract but not yet closed) rebounded, increasing by 3.5% in September year-overyear—a stark contrast to the modest 0.3% gain seen the previous month.
Home prices remained resilient in Q3 2024, continuing to rise but at a slower pace. Nationally, home prices increased by 3.9% year-over-year in August 2024 and are expected to rise by another 2.3% by August 2025, according to CoreLogic3 . While inventory growth and declining mortgage rates will offer relief to some buyers, the steady price growth still poses challenges for buyers, particularly in high-demand areas.
While inventory increases and falling mortgage rates suggest a more balanced market, the recovery remains uneven. Regional variations persist, with some markets, particularly in popular metropolitan areas, still facing strong demand and limited supply, while others are experiencing more stagnation. Investor activity has also cooled, contributing to a more measured pace of market recovery compared to the rapid post-pandemic surge.
The National Association of Realtors (NAR) agreement and buyer representation agreements are key documents that define the relationship between real estate agents and their clients, whether they are buyers or sellers. On August 17, 2024, changes were
1, 2 https://www.realtor.com/research/september-2024-data/#:~:text=In%20September%2C%20all%20four%20regions,and%2014.8%25%20in%20the%20Northeast. 3 https://www.corelogic.com/intelligence/us-home-price-insights-october-2024/#:~:text=Forecast%20Prices%20Nationally,August%202024%20to%20August%202025.

introduced to align these agreements with evolving legal standards, market dynamics, and new technological tools used in real estate transactions.
The NAR Agreement updates focus primarily on three areas. First, agents are now mandated to provide clearer information about their relationships and roles when representing buyers and sellers. Although commission has always been negotiable between buyers, sellers, and their agent, they must also offer more detailed breakdowns of commission divisions between buyer and seller agents. Second, the language around the use of technology has been expanded, particularly in reference to online services and tools that facilitate the real estate process. Finally, provisions for protecting consumer data have been strengthened, specifying how personal information is stored, shared, and managed. At the same time, disclosure requirements have been enhanced to ensure greater transparency throughout the transaction.
While recent market changes following the NAR settlement aim to raise the bar for agent professionalism, DMG has consistently held itself to even higher standards, long before these new benchmarks were set.
We believe that this commitment to excellence is what led to DMG’s most successful third quarter in our nearly 22-year history. While the media and many in the real estate industry are sounding alarms about a market downturn, that’s not the case for us. Why? Because we are a force multiplier. In the military, force multiplication refers to strategies that make a team exponentially more effective. We embody that concept in representing our clients.
We’ve been a part of these communities for years, understanding every home and every buyer, inside and out. Our connections are your solutions. If you’re searching for something off the market, reach out to us. If you’re a buyer, we know where your perfect home is. If you’re a seller, we have your buyer.
During the third quarter of 2024, the overall number of sales in both communities increased compared to the third quarter of 2023. However, not surprisingly, sales fell compared to the typically more active spring months in the second quarter of 2024.
Gold Coast sales remained consistent year-over-year for single-family homes, while demand drove a significant increase in condominium sales, particularly in the $500,000 to $1 million range. The median sales price did fall compared to 2023; however, this was likely due to an increase in sales in the lower price brackets.
In Old Town, increased demand for condominiums, especially in the $250,000 to $500,000 range, led to a rise in the median sales price compared to the third quarter of 2023. Additionally, an increase in single-family home sales over $4 million contributed to the higher median sold price.
Diving deeper into the statistics, the demand for higher-priced luxury properties saw significant growth. For instance, No 9 W. Walton saw four sales in the last quarter, which totalled $19.8 million, compared to no sales in the first six months of the year.
JULY 1 - SEPTEMBER 30, 2024 VS. SAME PERIOD 2023
JULY 1 - SEPTEMBER 30, 2024 VS. SAME PERIOD 2023
$2,259,250
Median Sales Price
Months Supply of Inventory
45
Avg. Market Time
$390,000
Median Sales Price
29 4.6
Months Supply of Inventory
41

JULY 1 - SEPTEMBER 30, 2024 VS. SAME PERIOD 2023
$2,442,500
Sales Price
JULY 1 - SEPTEMBER 30, 2024 VS. SAME PERIOD 2023
Market Time
$439,500 19 2.9 116 27 Months Supply of Inventory Months Supply of Inventory
Sales Price
Market Time
Demand in both of these predominantly highrise communities continues to be strong, and overall, the number of sales has increased compared to the same quarter in 2023. This increase can be attributed to higher inventory levels as well as the lowering of interest rates in September.
River North and Streeterville both experienced growth in sales for higher-priced properties ($1 million and above) compared to the same quarter in 2023. The number of sales could
CONDO/TOWNHOUSE
have been higher, but inventory levels for these price points fell due to the high demand in the second quarter of 2024.
Expectations are that the fourth quarter will see an increase in sales as demand rises in response to the recent fall in interest rates.
Don’t forget to check out local activities and events happening this fall and upcoming holiday season.
5.7
42 Months
CONDO/TOWNHOUSE
$420,000
8
58 Months

Despite inventory levels remaining low across all property types in Lakeview and Lincoln Park, demand and sales have remained comparatively strong. A couple of significant sales in the $15 million range also occurred during the third quarter of 2024.
In both communities, the number of singlefamily home sales has remained fairly consistent over the last three months compared to both the previous quarter and year-over-year. However, due to the lack of inventory, sales for condominiums and townhomes have decreased.
Prices remaining stable over the last year, combined with low inventory levels, indicate that demand for properties in these communities remains strong.
In Lakeview, a full building permit was issued in September for a new mixed-use, four-story development at 3037 N. Lincoln. This development will feature retail space on the ground floor and 15 residential units across the upper three floors, along with a rooftop deck.
JULY 1 - SEPTEMBER 30, 2024 VS. SAME PERIOD 2023
CONDO/TOWNHOUSE
JULY 1 - SEPTEMBER 30, 2024 VS. SAME PERIOD 2023
$3,600,000
Sales Price Median Sales Price
$1,670,000 $400,000 2.1 1.8 41 16 Months Supply of Inventory


JULY 1 - SEPTEMBER 30, 2024 VS. SAME PERIOD 2023
JULY 1 - SEPTEMBER 30, 2024 VS. SAME PERIOD 2023
$1,951,250
$562,500 3.8 1.6 44
$1M
North Center and Lincoln Square continue to experience strong demand, reflected in a slight increase in median sales prices, low inventory levels, and a short average time on the market.
The $1-2 million price range for single-family homes, and the $500,000 to $1 million range in the condominium/townhome market in both communities, continue to see the greatest demand, with substantial increases in sales compared to the same quarter in 2023.
In North Center, the City Council has approved a mixed-use development at 2035 W. Irving Park, offering 3,000 square feet of retail space and 37 residential units. Meanwhile, in Lincoln Square, DMG is representing the upcoming rentals of a luxury apartment building called The Trieuth, featuring 12 units.
Expect these neighborhoods to celebrate the arrival of fall and don’t miss the North Center Chamber Holiday Party on December 12th.
JULY 1 - SEPTEMBER 30, 2024 VS. SAME PERIOD 2023
CONDO/TOWNHOUSE
JULY 1 - SEPTEMBER 30, 2024 VS. SAME PERIOD 2023
$3,600,000
$1,687,500 $558,000 2.2 1.5 13 11

JULY 1 - SEPTEMBER 30, 2024 VS. SAME PERIOD 2023
$951,000
JULY 1 - SEPTEMBER 30, 2024 VS. SAME PERIOD 2023
Market Time
$376,500 1 2 17 20 Months Supply of Inventory Months Supply of Inventory
Market Time
Sales in all three communities have remained relatively steady compared to the third quarter of 2023, with a slight decrease, as expected, from the more active spring months of the second quarter of 2024.
In West Town and Wicker Park, single-family homes priced between $500,000 and $1 million saw the most notable increase in sales compared to both Q3 2023 and Q2 2024. Interestingly, it was condominium sales in the $1-2 million range that experienced the largest year-over-year growth for this period.
Demand in Humboldt Park is equally strong, with a significant rise in single-family home
sales compared to the third quarter of 2023.
In Logan Square and Bucktown, sales of single-family homes across all price ranges have generally increased both year-overyear and quarter-over-quarter. Meanwhile, condominium sales have also seen year-overyear growth.
A major trend in all three communities is the ongoing inventory shortage, particularly for properties priced below $800,000. This scarcity has led to many homes receiving multiple offers and selling above the asking price.
JULY 1 - SEPTEMBER 30, 2024 VS. SAME PERIOD 2023
JULY 1 - SEPTEMBER 30, 2024 VS. SAME PERIOD 2023
$3,600,000
Sales Price $1,137,500 $572,500 3.3 2.8 26 18 Months Supply of Inventory
SINGLE-FAMILY
JULY 1 - SEPTEMBER 30, 2024 VS. SAME PERIOD 2023
CONDO/TOWNHOUSE
JULY 1 - SEPTEMBER 30, 2024 VS. SAME PERIOD 2023
SINGLE-FAMILY
JULY 1 - SEPTEMBER 30, 2024 VS. SAME PERIOD 2023
CONDO/TOWNHOUSE
JULY 1 - SEPTEMBER 30, 2024 VS. SAME PERIOD 2023
Median Sales Price
Median Sales Price
Median Sales Price
Median Sales Price $1,122,500 $361,000 $486,500 $317,000 3.1 5.1 2.5 1.4 26 40 12 18 Months Supply of Inventory Months Supply of Inventory
New construction is booming in both communities, with major projects like the $7 billion United Center investment, Project 1901 set to revitalize Chicago’s West Side, and The Equinox offering a mixed-use development.
In August, The Pizzuti Companies celebrated the grand opening of Coppia, their first multi-family high-rise in the West Loop, featuring 298 rental units and 82 parking spaces. Meanwhile, in September, the City Council approved a revised plan for the Mavrek Development, adding 10 more residential units, a grocery store, and additional parking stalls.
While The Loop is renowned for its towering high-rises and iconic commercial landmarks like the Willis Tower, it is quickly transforming into a hotspot for impressive new residential developments. Major projects such as the Old Main Post Office Redevelopment, the Union Station Redevelopment, and a large multifamily development in the Southwest Loop are making waves among homebuyers.
For those looking for seasonal excitement, don’t miss the many fall and holiday festivals and events happening this November and December.
JULY 1 - SEPTEMBER 30, 2024 VS. SAME PERIOD 2023
$709,400
JULY 1 - SEPTEMBER 30, 2024 VS. SAME PERIOD 2023
$3,600,000
Median Sales Price Median Sales Price
$385,000 10 3.3 92
Avg. Market Time
Months Supply of Inventory
26 Months Supply of Inventory

$375,000 5.2 41
Lake Forest and Lake Bluff are known for hosting a variety of popular community events that residents eagerly anticipate each season. These include Lake Forest’s Annual Tree Lighting Holiday Celebration on November 29th and “It’s a Wonderful Life in Lake Bluff!” on December 7th.
In Lake Bluff, the ongoing lack of inventory continues to drive up property values. Notably, there has been increased demand for homes in the $1-2 million price range, compared to both Q2 2024 and Q3 2023.
In Lake Forest, the shortage of homes priced under $1 million is reflected in a significant decline in sales compared to Q3 2023. However, more inventory in the higher price ranges has led to an uptick in sales, particularly compared to Q2 2024.
Similarly, Highland Park continues to see most of its sales activity in homes priced above $1 million, highlighting strong demand in this segment.
New dining spots in Lake Forest include Once Upon A Bagel, a popular North Shore chain, and The Café at Elawa Farm.
JULY 1 - SEPTEMBER 30, 2024 VS. SAME PERIOD 2023
JULY 1 - SEPTEMBER 30, 2024 VS. SAME PERIOD 2023
$875,000
Median Sales Price
13
Avg. Market Time
$1,250,000 2.3 3.7
34 Months Supply of Inventory Months Supply of Inventory
Median Sales Price


JULY 1 - SEPTEMBER 30, 2024 VS. SAME PERIOD 2023
$778,000 2.7 20 Months Supply of Inventory
Sales Price
Market Time
Inventory shortages in these communities continue to affect sales and pricing, with demand remaining strong especially for move-in ready homes.
Glencoe continues to perform well, with sales holding steady year-over-year and remaining similar to Q2 2024 levels. Winnetka also showed resilience, with slight increases in sales volume compared to both quarters.
Kenilworth experienced an uptick in inventory, which led to a rise in the number of homes sold. However, Wilmette, with less than 1.5 months of available inventory, saw no growth in its rate of sales.
Fall is in the air and while local markets are starting to close there are plenty of upcoming events for your enjoyment, including the Antique & Modernism Show from November 8th-10th and Winnetka’s tree-lighting on December 6th.
SINGLE-FAMILY
JULY 1 - SEPTEMBER 30, 2024 VS. SAME PERIOD 2023
SINGLE-FAMILY
JULY 1 - SEPTEMBER 30, 2024 VS. SAME PERIOD 2023
$1,658,500
Median Sales Price
19
Avg. Market Time
$1,715,000 1.2 2.4
12 Months Supply of Inventory Months Supply of Inventory
Median Sales Price
Market Time

JULY 1 - SEPTEMBER 30, 2024 VS. SAME PERIOD 2023
JULY 1 - SEPTEMBER 30, 2024 VS. SAME PERIOD 2023
Median Sales Price
Median Sales Price $1,947,000 $1,200,000 4.5 1.5 12 24 Months Supply of Inventory Months Supply of Inventory Avg. Market Time
Market Time
Strong sales volumes continue, particularly in the upper-tier market, compared to Q3 2023, despite ongoing low inventory levels.
The Drake Group began construction on a new mixed-use residential and commercial
SINGLE-FAMILY
building at the former Bess Hardware site in Glenview, featuring luxury rentals.
Don’t miss Fall Fest at Wagner Farm or visiting the new restaurant Ema in Glenview.
JULY 1 - SEPTEMBER 30, 2024 VS. SAME PERIOD 2023
JULY 1 - SEPTEMBER 30, 2024 VS. SAME PERIOD 2023
JULY 1 - SEPTEMBER 30, 2024 VS. SAME PERIOD 2023
Median Sales Price
$837,500 2.3 26 Months Supply of Inventory Avg. Market Time
$916,250
Median Sales Price
1.8
18 Months Supply of Inventory
Median Sales Price
$876,000 2.2
13 Months Supply of Inventory Avg. Market Time

1 2 3 4 5 6 7 8 9 10
Affordable Living: Compared to other major cities in the U.S. Chicagoland offers comparatively more affordable living in and out of the city, for those looking to buy or rent.
World Class Cuisine and Dining: Chicagoland offers a diverse and thriving culinary culture that ranges from Michelin Star restaurants and international fine dining to deep-dish pizza and Chicago-style hot dogs.
Theatre and Festivals: Chicago is the perfect place to be if you are looking to be wowed by entertainment. There are musicals, ballet performances, shows at the Chicago Symphony Orchestra, and outdoor concerts with a view of the skyline at Northerly Island.
Access to Lake and Outdoor Spaces: Lake Michigan shoreline and beaches, including swimming, boating and fishing. In winter, activities abound.
Excellent Education System: Many schools, colleges and universities have been recognized as being in the U.S. Top 10 percentile for their category.
Midwestern Warmth: Extends even into downtown Chicago, where people are fast to say hello and offer a helping hand.
Easy Transportation System: Chicago has one of the most highly rated transportation systems, including the Chicago Transit System (the “L”), bus lines, water taxis, Amtrak and access to two international airports.
Exciting Sports Options: Sports in Chicagoland offer a diverse range of excitement, from baseball and basketball to football, hockey, soccer, and thrilling college sports events.
Vibrant Arts and Culture Scene: Museums, theaters, galleries, music venues, and festivals that cater to a wide range of interests and provide a captivating cultural experience.
Abundant Job Opportunities: Chicagoland presents a multitude of job opportunities across various industries, thanks to its thriving economy, diverse sectors, and the presence of major corporations, making it an attractive destination for professionals seeking career growth.
Two key trends continue to drive these markets: low inventory and high demand. Over the past three months, the number of sales has largely remained consistent, both year-over-year and compared to Q2 2024.
Western Springs did see a decline in sales within the $1-2 million range compared to Q2, but this was due to limited inventory rather than a lack of demand. La Grange reported a similar trend in the $500,000 to $750,000 range.
La Grange Park maintained strong sales consistency, with a notable increase in properties sold over $750,000 compared to Q2. Meanwhile, La Grange Highlands continued its impressive sales growth over the past two quarters, surpassing figures from the same periods in 2023.
Petite Vie in Western Springs and Mana (a Greek restaurant) in La Grange, opened this summer, and reportedly thriving, while Gone Crazy is set to open its storefront this October.
JULY 1 - SEPTEMBER 30, 2024 VS. SAME PERIOD 2023
SINGLE-FAMILY SINGLE-FAMILY
JULY 1 - SEPTEMBER 30, 2024 VS. SAME PERIOD 2023
Median Sales Price
Median Sales Price $735,000 $720,000 2.1 0.8
20 12 Months Supply of Inventory Months Supply of Inventory Avg. Market Time
JULY 1 - SEPTEMBER 30, 2024 VS. SAME PERIOD 2023
$515,000
JULY 1 - SEPTEMBER 30, 2024 VS. SAME PERIOD 2023
Market Time
$433,975
Supply of Inventory
1.3 1 22 10 Months Supply of Inventory
Market Time
Fall has arrived and with it the arrival of exciting events and festivals celebrating the upcoming season, including the Naperville Noon Lions 27th Annual Turkey Trot 5K on November 28th.
Downers Grove, Naperville, and Elmhurst continue to face challenges with low inventory, with less than a two-month supply of homes
available. Despite this, sales in Downers Grove and Naperville in the $750,000 to $1 million range saw an increase compared to Q3 2023.
In the higher price bracket, Oak Brook saw little change in sales volume, even with an increase in available inventory.
JULY 1 - SEPTEMBER 30, 2024 VS. SAME PERIOD 2023
$525,000
1.7
JULY 1 - SEPTEMBER 30, 2024 VS. SAME PERIOD 2023
$700,000

JULY 1 - SEPTEMBER 30, 2024 VS. SAME PERIOD 2023
JULY 1 - SEPTEMBER 30, 2024 VS. SAME PERIOD 2023
$600,000 $1,130,000 2.5 3.4 16 26 Months Supply of Inventory
Strong demand and low inventory levels continue to define the real estate market in all of these communities.
Despite Clarendon Hills and Hinsdale facing continued record-low inventory, with less than a month’s supply, the number of sales has surprisingly increased compared to both Q3 2023 and Q2 2024.
Inventory in Burr Ridge and Willowbrook saw an uptick over the last quarter. While
Burr Ridge experienced an increase in sales compared to Q2 2024 and Q3 2023, sales in Willowbrook dipped compared to Q3 2023.
Looking ahead there are plenty of events that celebrate the arrival of fall and the upcoming festive season. Don’t forget to check out the Hinsdale Chamber Christmas Walk on December 6th.
SINGLE-FAMILY
JULY 1 - SEPTEMBER 30, 2024 VS. SAME PERIOD 2023
$725,000
Median Sales Price
0.6
SINGLE-FAMILY
JULY 1 - SEPTEMBER 30, 2024 VS. SAME PERIOD 2023
13
Avg. Market Time
$1,525,000
Median Sales Price
1.5
27 Months Supply of Inventory Months Supply of Inventory

JULY 1 - SEPTEMBER 30, 2024 VS. SAME PERIOD 2023
JULY 1 - SEPTEMBER 30, 2024 VS. SAME PERIOD 2023
Sales Price $952,500 $580,000 3.1 5.3 23 12 Months Supply of Inventory
During a typically slower time of year, both luxury communities experienced a comparative rise in inventory levels, offering more opportunities for buyers.
Port Royal saw three notable sales exceeding $20 million, with the highest sale surpassing $35 million.
Interest in high-priced homes remains strong as affluent buyers are drawn to the exclusive properties available. At the same time, there
is growing demand for fixer-uppers among those looking for renovation opportunities.
On August 21st, the Naples City Council unanimously approved a conditional-use petition for the 65-year-old Port Royal Club. The new facility will feature indoor and outdoor dining, a pool and deck, outdoor seating areas, a two-story garage, and updated landscaping and lighting. This rebuild comes after the original clubhouse was destroyed by Hurricane Ian in 2022.
SINGLE-FAMILY
JULY 1 - SEPTEMBER 30, 2024 VS. SAME PERIOD 2023
$26,000,000
Median Sales Price
29
208 Months Supply of Inventory
Avg. Market Time
SINGLE-FAMILY
JULY 1 - SEPTEMBER 30, 2024 VS. SAME PERIOD 2023
$0
Median Sales Price
$10,450,000 N/A
226 Months Supply of Inventory
Avg. Market Time
In the quieter summer months of Q3, inventory levels declined as expected compared to Q2 2024. However, overall sales across these two communities increased compared to Q3 2023. The only exception was that sales, aside from condominiums in Olde Naples, fell when compared to Q2 2024.
In the previous quarter, condos in the $0 to $1 million range in Olde Naples were in the highest demand. Recently, though, sales in the $2 to $3 million range have surged, nearly tripling compared to Q2.
Exclusively represented by The Dawn McKenna Group, The Avenue will set a new standard for downtown Naples. This landmark project spans 4.5 acres along 5th Avenue and encompasses two full blocks between 5th & 6th Avenue and 9th & 11th Streets. Designed as a vibrant addition to the heart of downtown, The Avenue comprises four boutique buildings with 75,000 square feet of retail and hospitality on the ground floor and 50 ultra-luxury condominiums above, blending premier living with dynamic urban amenities.
JULY 1 - SEPTEMBER 30, 2024 VS. SAME PERIOD 2023
$5,487,500
With private residences designed by Noa Santos and his acclaimed team at Led by Nainoa, every aspect of the interiors, shared amenities, pool, and rooftop spaces will reflect unparalleled luxury. These residences bring an elevated level of sophistication to downtown Naples, offering future owners a rare opportunity to invest in what will be regarded as one of the most significant developments introduced to the area in recent years.
Sales officially open in Q1 2025, with the initial 20 residences available as part of the first phase, expected for delivery in Q4 2026. The Avenue not only redefines urban living in Naples but also reaffirms the city’s standing as a premier destination for luxury real estate.
JULY 1 - SEPTEMBER 30, 2024 VS. SAME PERIOD 2023
JULY 1 - SEPTEMBER 30, 2024 VS. SAME PERIOD 2023
$7,000,000
14
Sales Price Median Sales Price
121 Months Supply of Inventory Months Supply of Inventory Avg. Market Time
7.4 219
$1,995,000
Market Time
Overall, these communities saw steady yearover-year sales as Naples entered its quieter summer months, though Q3 2024 may have felt especially subdued following the stronger-than-expected sales in Q2 2024.
Notably, Coquina Sands experienced a comparative uptick in condo and townhome sales in Q3 2024. Also of importance to this community is the redevelopment of the historic Naples Beach Hotel & Club, turning it into The Naples Beach Club and Four Seasons Hotel. The Athens Group plans to enhance the resort’s golf course and beach bar while preserving 104 acres for recreation and open
space, honoring the three-generation legacy of the Watkins family.
In The Moorings, condominium sales slowed, but by the end of September, inventory levels had risen significantly. This may be in response to the drop-in interest rates, with sellers anticipating increased buyer demand.
In Park Shore, an increase in available inventory during the third quarter did provide buyers with more opportunities, leading to a rise in sales, particularly in the higher-end property market.
JULY 1 - SEPTEMBER 30, 2024 VS. SAME PERIOD 2023
JULY 1 - SEPTEMBER 30, 2024 VS. SAME PERIOD 2023
$3,600,000 SINGLE-FAMILY CONDO/TOWNHOUSE
$2M
$3,612,500
$917,500 9 6 90 121 Months Supply of Inventory Months Supply of Inventory
JULY 1 - SEPTEMBER 30, 2024 VS. SAME PERIOD 2023
$6,100,000
Median Sales Price
JULY 1 - SEPTEMBER 30, 2024 VS. SAME PERIOD 2023
Market Time
$705,000
Median Sales Price
29 20 154 73 Months Supply of Inventory Months Supply of Inventory
Market Time
JULY 1 - SEPTEMBER 30, 2024 VS. SAME PERIOD 2023
JULY 1 - SEPTEMBER 30, 2024 VS. SAME PERIOD 2023
$3,600,000
Market Time
$3,799,500 $2,100,000 13.5 14.5 177 110 Months Supply of Inventory Months Supply of Inventory
Sales Price Median Sales Price
JULY 1 - SEPTEMBER 30, 2024 VS. SAME PERIOD 2023
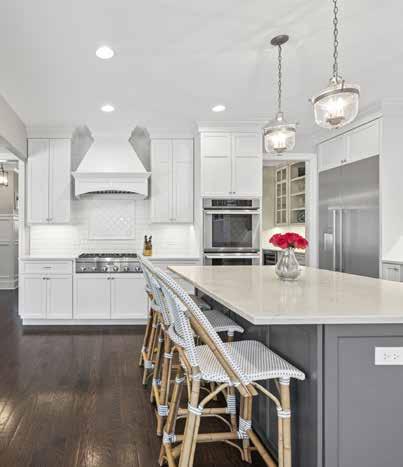
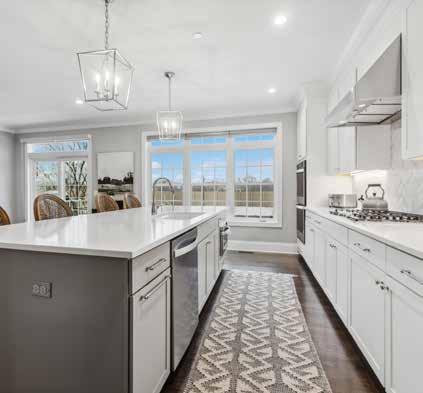
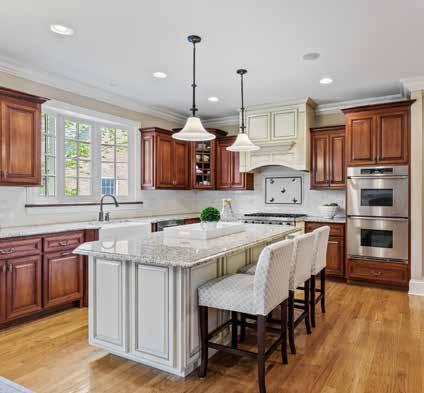
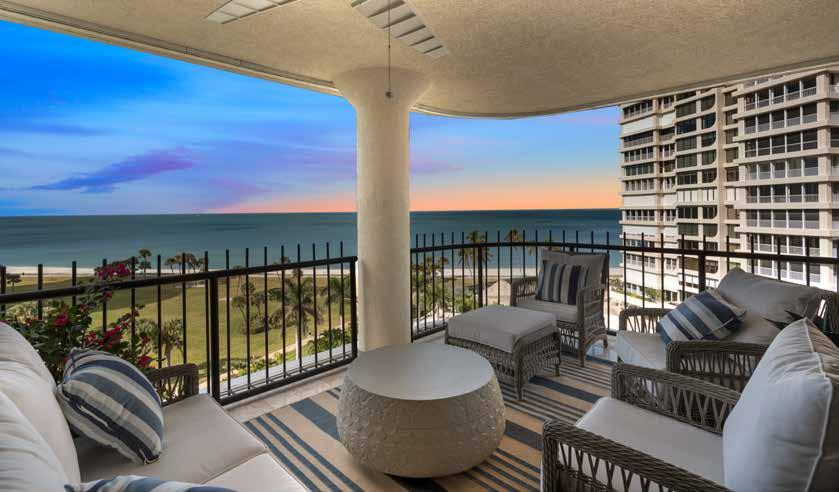
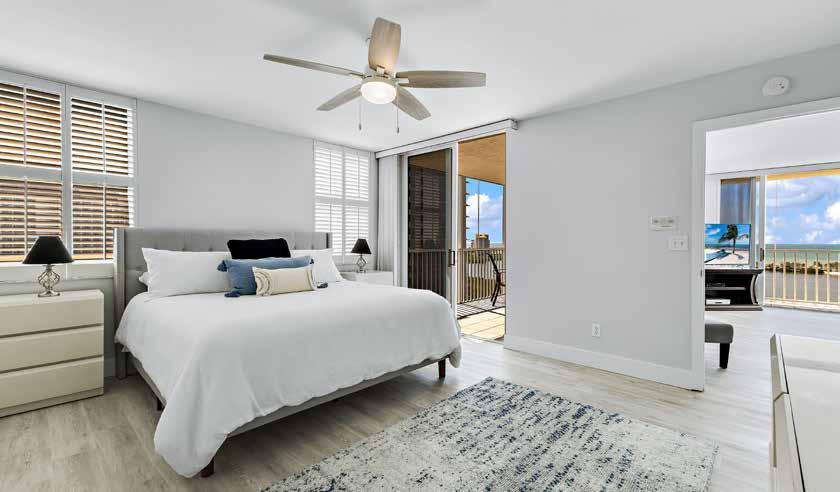
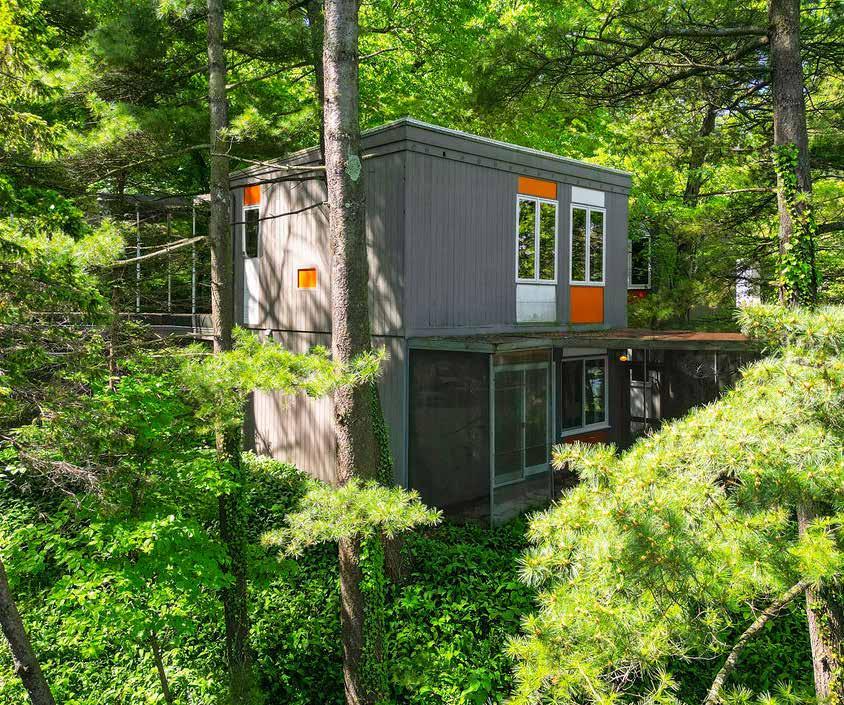
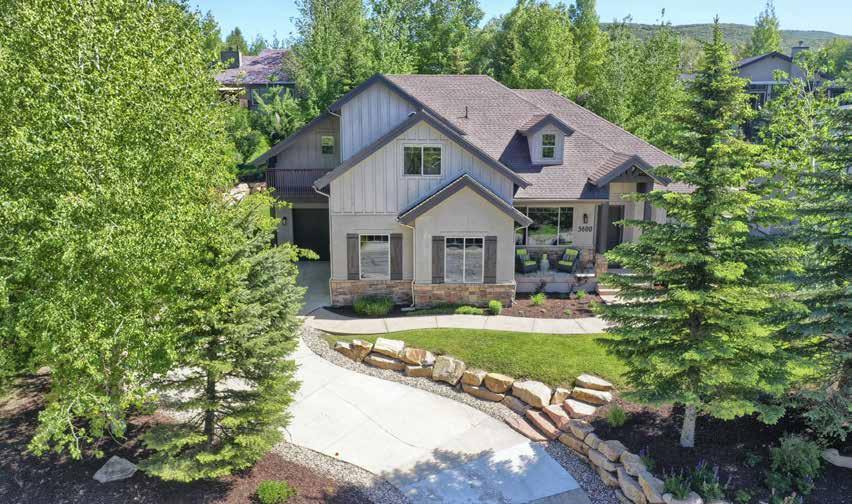
Like other Naples communities, both Pelican Bay and Vanderbilt Beach experienced a significant drop in sales during the quieter Q3 2024 compared to Q2, which was expected.
In Pelican Bay, the single-family market saw a decline in sales compared to Q3 2023, while condo and townhome sales remained steady. By the end of September, inventory levels rose, likely due to falling interest rates and sellers anticipating increased buyer activity.
Vanderbilt Beach had a similar trend, though single-family home sales held steady compared to Q3 2023, while condo and townhome sales saw a slight dip. Inventory levels also increased substantially during September.
Demand for move-in-ready condominiums continues to be stronger than for those requiring renovations, appealing to both full-time residents and investors alike.
JULY 1 - SEPTEMBER 30, 2024 VS. SAME PERIOD 2023
$5,550,000
CONDO/TOWNHOUSE
JULY 1 - SEPTEMBER 30, 2024 VS. SAME PERIOD 2023
$3,600,000
$1,172,500 15 10.8 194 114 Months Supply of Inventory Months Supply of Inventory Avg. Market Time Avg. Market Time
JULY 1 - SEPTEMBER 30, 2024 VS. SAME PERIOD 2023
$2,495,000
Market Time
CONDO/TOWNHOUSE
JULY 1 - SEPTEMBER 30, 2024 VS. SAME PERIOD 2023
Median Sales Price
$1,500,000 21 24.5 136 129 Months Supply of Inventory Months Supply of Inventory
Market Time
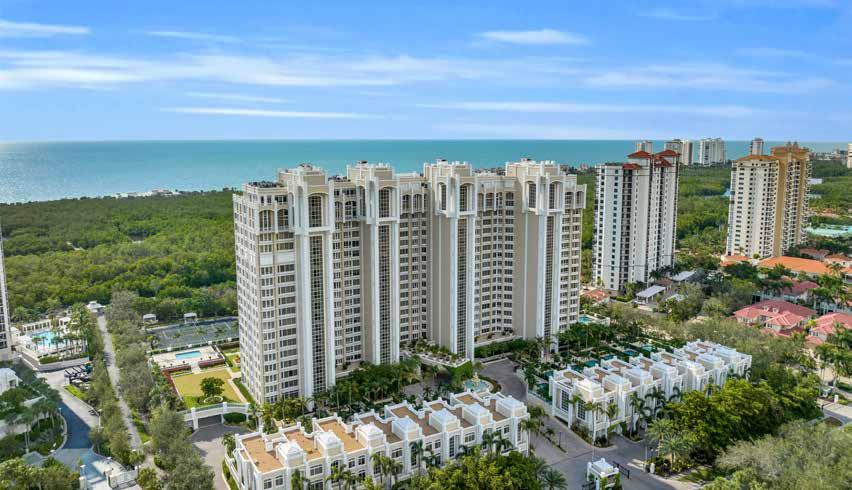
Just north of Vanderbilt Beach are the prominent developments of Kalea Bay and The Dunes. These residences offer exceptional resort lifestyle with premier amenities and services, not to mention breathtaking views and waterfront access.
In Q2 2024, a significant number of preconstruction sales in the $2-3 million range were finalized with the completion
of Kalea Bay’s fourth tower. Today, many of these units are reselling for $4-5 million, as reflected in the Q3 2024 resale activity.
The Dunes continues to see strong demand in Q3 2024, particularly for properties in the $1-2 million range. Inventory levels rose in September as sellers anticipate Naples’ busier selling season.
CONDO/TOWNHOUSE
JULY 1 - SEPTEMBER 30, 2024 VS. SAME PERIOD 2023
$4,435,000
7
86 Months Supply of Inventory Avg. Market Time
CONDO/TOWNHOUSE
JULY 1 - SEPTEMBER 30, 2024 VS. SAME PERIOD 2023
$1,400,000
18
112 Months Supply of Inventory
Market Time

1 2 3 4 5 6 7 8 9 10
Naples has been recognized by US News and World Report as one of the top 10 best places to live in America for the years 2023 and 2024, based on quality of life, value, job market and desirability.
Tropical Paradise: The year-round warm weather allows for outdoor activities and a relaxed lifestyle.
Outdoor Recreation: From boating, fishing and kayaking there are countless water activities. Naples is also recognized for being both the “Golf and Pickleball Capital of the World”, with a choice of over 80 championship golf courses and 160 public pickleball courts.
Golfing Galore: There are 108 courses within a 15-mile radius of Naples, 16 of which are public courses and 82 are private courses. There are 86 18-hole courses and 22 nine-hole layouts.
Diversifying Population: Naples has long been a popular retirement and second home community, however the growth in the last five years has evolved into full-time residents that include younger and multigenerational families.
Shopping & Dining: Naples offers a wealth of upscale shopping and dining experiences.
Thriving Real Estate Market: As a national vacation hot spot, real estate in Naples has consistently been a good investment.
Cultural Hub: A world-class zoo, a stunning botanical garden, and numerous museums and galleries, such as Artis Naples, The Naples Philharmonic, Naples Players, and Gulfshore Playhouse, make art, culture, and entertainment the way of life in Naples.
You’re Well-Connected: Naples is conveniently located near larger cities like Sarasota, Marco Island, Fort Myers and even Miami, which is only 2 hours away.
A Robust Economy & Job Market: There are plenty of exciting work opportunities, thanks to the city’s impressive growing economy, that includes many Fortune 500 companies.
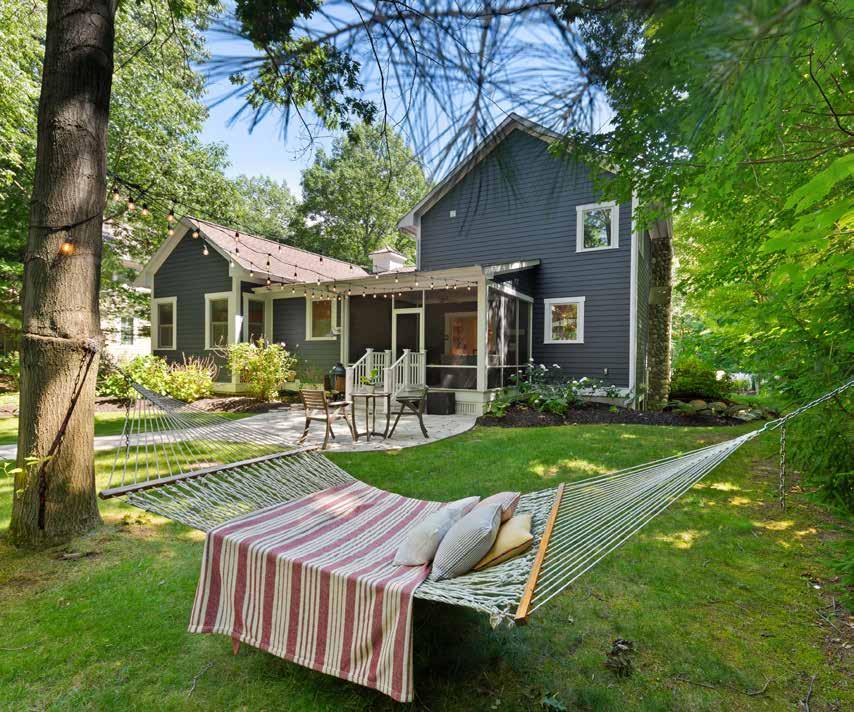
Whether it’s the Harvest and Wine Festival or the Children’s Halloween Parade in New Buffalo, apple picking at Dinges Apple Farm, or the Apple Cider Century bike race in Three Oaks, there’s no shortage of fall activities in these three communities.
New Buffalo has welcomed several new restaurants and stores, with Seedz Brewery being named the #1 Best New Brewery in the U.S. by USA Today in recent months.
By the end of September, New Buffalo experienced a notable rise in inventory levels, likely driven by more sellers entering the market as a result of declining interest rates.
While Three Oaks and Union Pier experienced a slight decline in sales compared to Q3 2023, both communities saw an increase in sales over Q2 2024.
SINGLE-FAMILY
JULY 1 - SEPTEMBER 30, 2024 VS. SAME PERIOD 2023
SINGLE-FAMILY
JULY 1 - SEPTEMBER 30, 2024 VS. SAME PERIOD 2023
Median Sales Price
$505,000 11.5
40 Months Supply of Inventory Avg. Market Time
$295,000 6.5
55 Months Supply of Inventory Avg. Market Time
Median Sales Price
$1,287,500 2.3
32 Months Supply of Inventory
Market Time
Growing confidence and investment in these three communities continue to enhance their charm and opportunities.
Lakeside boasts attractions like the Antiques Mall and beautiful nearby beaches, making it a quaint and inviting town.
Sawyer, home to Warren Dunes, offers breathtaking views with dunes soaring 260 feet above Lake Michigan. Visitors can camp overnight, with the park open until November. Sawyer also welcomed a new restaurant,
SINGLE-FAMILY
Out There, creatively built from a converted gas station.
Harbert features the beloved Luisa’s Harbert Swedish Bakery & Market, in operation since 1917, known for using fresh, natural ingredients to bake breads, doughnuts, pies, and cookies. They even offer frozen treats ready to bake at home.
Both Lakeside and Harbert saw an uptick in sales compared to Q2 2024 and Q3 2023, while Sawyer, in contrast, experienced a slight decline in sales during the same periods.
JULY 1 - SEPTEMBER 30, 2024 VS. SAME PERIOD 2023
SINGLE-FAMILY
JULY 1 - SEPTEMBER 30, 2024 VS. SAME PERIOD 2023
Median Sales Price
$1,050,000 8 28 Months Supply of Inventory
Avg. Market Time
Median Sales Price
$840,000 3
15 Months Supply of Inventory
Avg. Market Time
$1,060,000
Median Sales Price
2.3
63 Months Supply of Inventory
Market Time
Sales have remained steady year-over-year in these three communities, with the highest demand for properties priced between $500,000 and $750,000.
SINGLE-FAMILY
Additionally, don’t miss the upcoming events in and around these communities celebrating Halloween, Thanksgiving, and the holiday season over the next few months.
JULY 1 - SEPTEMBER 30, 2024 VS. SAME PERIOD 2023
SINGLE-FAMILY
JULY 1 - SEPTEMBER 30, 2024 VS. SAME PERIOD 2023
JULY 1 - SEPTEMBER 30, 2024 VS. SAME PERIOD 2023
Median Sales Price
$1,820,000 12
43 Months Supply of Inventory
Avg. Market Time
Median Sales Price
$622,500 N/A
44 Months Supply of Inventory
Avg. Market Time
Median Sales Price
$669,250 7
49 Months Supply of Inventory Avg. Market Time

1 2 3 4 5 6 7 8 9 10
Scenic Beauty: Boasts stunning natural landscapes, including sandy beaches along Lake Michigan, lush forests, and rolling dunes. The area’s picturesque beauty provides a tranquil and serene environment.
Lake Michigan: Living here means access to one of the largest freshwater lakes in the world. Residents can enjoy water activities, including swimming, boating, fishing, sailing, paddleboarding, kayaking and relaxing on the beach.
Quaint Small Towns: Home to charming small towns such as New Buffalo, Sawyer, and Three Oaks. These towns offer a relaxed pace of life, friendly communities, and unique local shops and restaurants.
Culinary Scene: The region is known for its diverse culinary scene, featuring farm-to-table dining, wineries, distilleries, breweries, and artisanal food producers. Residents can explore a variety of dining options that showcase local flavors.
Arts and Culture: Has a vibrant arts and culture community, with galleries, theaters, and cultural events throughout the year. This adds a creative and enriching aspect to the community.
Outdoor Recreation: Beyond the beaches, residents can enjoy hiking, biking, and exploring nature trails in the area. Warren Dunes State Park and Indiana Dunes National Park are popular destinations for outdoor enthusiatsts.
Seasonal Activities: Experiences all four seasons, each offering unique activities. From summer beach days to fall foliage tours, winter sports, and springtime blossoms, residents can enjoy a variety of seasonal experiences.
Winery, Brewery and Distillery Tours: The region is known for its wineries, breweries and distilleries, making it a paradise for wine and beer enthusiasts. Residents can explore local vineyards and tasting rooms.
Community Events: Hosts various community events and festivals, fostering a sense of community and providing opportunities for residents to come together and celebrate.
Proximity to Chicago: Conveniently located near Chicago, making it an ideal getaway for city dwellers. The short drive or a fast train journey, through a new high-speed rail system from Chicago, will allow residents quick access to the the peacefulness of Harbor Country.
The summer months of Q3 2024 saw an overall increase in sales across the four communities surrounding Geneva Lake compared to the previous year, and in some price ranges, sales even surpassed those of Q2 2024.
Lake Geneva continues to experience a rise in the median sold price, with a significant increase in sales in the $500,000 to $1 million range compared to both Q3 2023 and Q2 2024, driven in part by higher inventory levels.
Williams Bay also saw a notable boost in sales within the $500,000 to $1 million price range, particularly compared to Q3 2023. Fontana,
SINGLE-FAMILY
JULY
SINGLE-FAMILY
on the other hand, recorded more sales in the $1-2 million range.
In contrast, Linn faced a significant drop in inventory, but sales still improved compared to Q3 2023. The only substantial change was in the $0 to $500,000 range, which saw a sharp increase compared to Q2 2024.
Properties on or near the lake, even teardowns, and private developments with older homes such as Abbey Springs in Fontana, but with access to the water and a wealth of amenities, remain highly sought after, making it challenging for potential buyers.
$514,950
Median Sales Price
$578,625 4.3 4.3 50
39 Months Supply of Inventory Months
Market Time
Median Sales Price
JULY 1 - SEPTEMBER 30, 2024 VS. SAME PERIOD 2023
$0
JULY 1 - SEPTEMBER 30, 2024 VS. SAME PERIOD 2023
Sales Price Median Sales Price $830,000 $615,000 6.3 3.6 61 49 Months Supply of Inventory Months Supply of Inventory Avg. Market Time
Market Time
For buyers seeking water access at more affordable price points, these two communities have become popular choices. Sales have remained steady, both year-overyear and quarter-over-quarter.
In June 2024, the new master-planned conservation development, The Shores of Delavan Lake, broke ground, with the first phase set to offer 114 single-family lots.
Meanwhile, on the shores of Lake Como, Destination Geneva National provides a private, gated community with 54 holes of championship golf, offering potential buyers an exceptional escape within a luxurious golfcourse setting. SINGLE-FAMILY
JULY 1 - SEPTEMBER 30, 2024 VS. SAME PERIOD 2023
JULY 1 - SEPTEMBER 30, 2024 VS. SAME PERIOD 2023
$335,000
Median Sales Price
5.7
24
Avg. Market Time
$384,750
Median Sales Price
6
53 Months Supply of Inventory Months Supply of Inventory
Avg. Market Time

Natural Beauty: Boasts stunning natural beauty with its crystal-clear waters, picturesque shoreline, and surrounding scenic landscapes.
Recreational Activities: The area offers a plethora of recreational activities, including boating, fishing, swimming, hiking, biking, and golfing, providing ample opportunities for outdoor enthusiasts.
Water Sports: The expansive Geneva Lake is a haven for water sports enthusiasts, offering activities such as sailing, jet skiing, paddleboarding, and kayaking in the summer and ice boating, ice fishing and snowshoeing in the winter.
Resort Town Charm: Exudes a charming resort town atmosphere, with its quaint shops, boutiques, restaurants, and cafes lining the streets, creating a delightful ambiance.
Historic Architecture: The town showcases beautiful historic architecture, including grand mansions and estates, adding a touch of elegance and history to the area.
Events and Festivals: Hosts a variety of events and festivals throughout the year, including the Venetian Festival, Winterfest, and the Lake Geneva Restaurant Week, providing entertainment and cultural experiences for residents.
Proximity to Chicago: Close proximity to Chicago allows residents to enjoy a peaceful lakeside lifestyle while still having access to the amenities and opportunities of a major city.
Family-Friendly Environment: The area is known for its family-friendly environment, offering excellent schools, safe neighborhoods, and a range of activities and attractions suitable for all ages and known as a childhood paradise.
Shopping and Dining: Features a vibrant shopping and dining scene, with a mix of local boutiques, specialty stores, antiquing and a wide array of restaurants, ensuring residents have plenty of options to explore.
Community Spirit: Has a strong sense of community spirit, with friendly residents, community events, and a welcoming atmosphere that fosters a sense of belonging and connection among its residents. 1 2 3 4 5 6 7 8 9 10
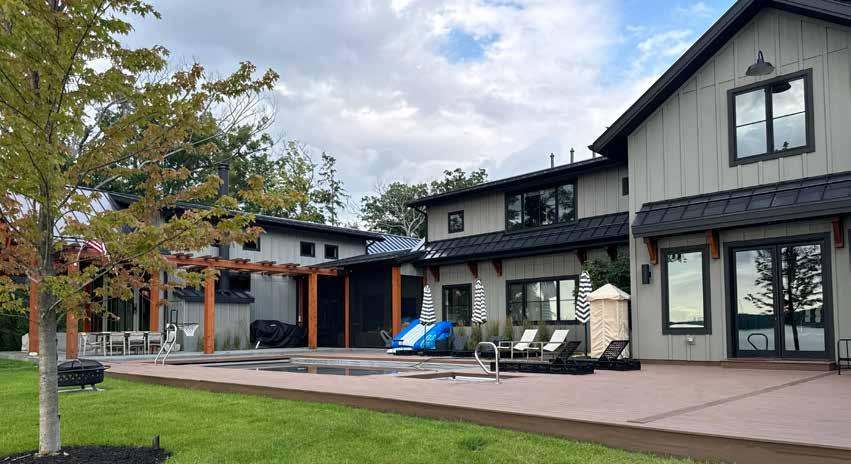
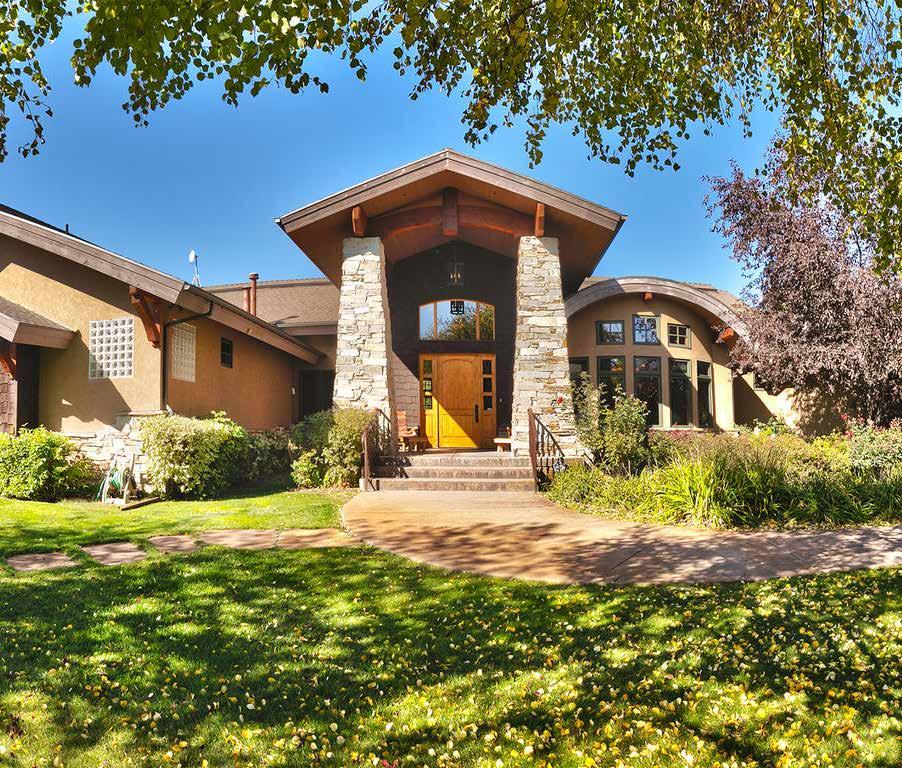
In Q3 2024, both communities experienced a slightly stronger sales market compared to Q3 2023, though sales declined from Q2 2024, as expected during the quieter summer months.
In Deer Valley, development at Snow Park continues to make progress, with expectations for a soft opening this winter. Some ski runs are set to open, along with select retail and residential components.
Inventory levels in Deer Valley rose for single-family homes but dropped sharply for condos and townhomes. Sales in the
$4-5 million range increased for single-family homes, while condo sales in the $2-3 million range also saw an uptick.
Meanwhile, in Old Town and Park City Mountain Resort, despite declining inventory, single-family home sales saw an uptick compared to both Q2 2024 and Q3 2023.
With the arrival of fall, residents and visitors can still enjoy a variety of activities, including concerts at the Egyptian Theatre, the 8th annual Shot-Ski event and December festivities.
JULY 1 - SEPTEMBER 30, 2024 VS. SAME PERIOD 2023
$4,640,000
Median Sales Price
JULY 1 - SEPTEMBER 30, 2024 VS. SAME PERIOD 2023
Market Time
$2,275,000
$3,600,000
Median Sales Price
13 1.9 75 80 Months Supply of Inventory Months
JULY 1 - SEPTEMBER 30, 2024 VS. SAME PERIOD 2023
JULY 1 - SEPTEMBER 30, 2024 VS. SAME PERIOD 2023
Median Sales Price Median Sales Price $3,512,500 $1,300,000 7.5 3.5 139 77 Months Supply of Inventory Months Supply of Inventory Avg. Market Time
Market Time
The Canyons Wine Festival, held on October 3-5, celebrated another successful event and announced plans to expand to a biannual schedule, with their spring festival set to debut in April 2025.
While condo and townhome sales remained steady, except for properties in the $1-2 million range, there were no reported single-family home sales in the last quarter. This was largely due to low inventory rather than a drop in demand. The ongoing construction of new condominium buildings is expected to improve future inventory levels.
In contrast, Thaynes Canyon saw an increase in sales compared to both Q2 2024 and Q3 2023, though further growth was limited by dwindling inventory.
Park Meadows, however, maintained steady sales volume across both single-family homes and condo/townhomes compared to the previous quarter and Q3 2023. Inventory levels began trending upward at the end of September, potentially signaling increased opportunities for buyers.
JULY 1 - SEPTEMBER 30, 2024 VS. SAME PERIOD 2023
JULY 1 - SEPTEMBER 30, 2024 VS. SAME PERIOD 2023
Median Sales Price
$3,600,000
Median Sales Price N/A
$1,250,000 N/A 3.9 N/A 104 Months Supply of Inventory Months Supply of Inventory Avg. Market Time
Market Time
JULY 1 - SEPTEMBER 30, 2024 VS. SAME PERIOD 2023
JULY 1 - SEPTEMBER 30, 2024 VS. SAME PERIOD 2023
CONDO/TOWNHOUSE
JULY 1 - SEPTEMBER 30, 2024 VS. SAME PERIOD 2023
Median Sales Price
$3,167,000 1.3 212 Months Supply of Inventory
Avg. Market Time
$4,151,000
Median Sales Price
$3,600,000
12 3 29 32 Months Supply of Inventory Months Supply of Inventory
$2,425,000
Median Sales Price
Avg. Market Time Avg. Market Time
Overall, inventory levels declined during Q3 2024, as these established neighborhoods saw sales either rise or remain consistent with Q3 2023.
Sun Peak and Bear Hollow experienced an uptick in single-family home sales in the $1-2 million range, while demand for condos in the $500,000 to $1 million range remained strong. Inventory fell compared to Q2 2024
in both markets, particularly in the condo/ townhome sector, which was reduced to just one month’s supply.
Silver Springs, Old Ranch Road, and Kimball also saw a drop in inventory levels, especially in the condo/townhome category, likely contributing to fewer sales compared to Q3 2023. Additionally, Silver Springs reported no vacant lots available for sale.
JULY 1 - SEPTEMBER 30, 2024 VS. SAME PERIOD 2023
$1,550,000
Median Sales Price
CONDO/TOWNHOUSE
JULY 1 - SEPTEMBER 30, 2024 VS. SAME PERIOD 2023
$3,600,000
$1,112,500 7 1 100
42 Months Supply of Inventory Months Supply of Inventory Avg. Market Time
Sales Price
JULY 1 - SEPTEMBER 30, 2024 VS. SAME PERIOD 2023
$2,457,500
Median Sales Price
CONDO/TOWNHOUSE
JULY 1 - SEPTEMBER 30, 2024 VS. SAME PERIOD 2023
$3,600,000
Market Time
Median Sales Price
$643,000 10.5 6.2 37 64 Months Supply of Inventory Months Supply of Inventory
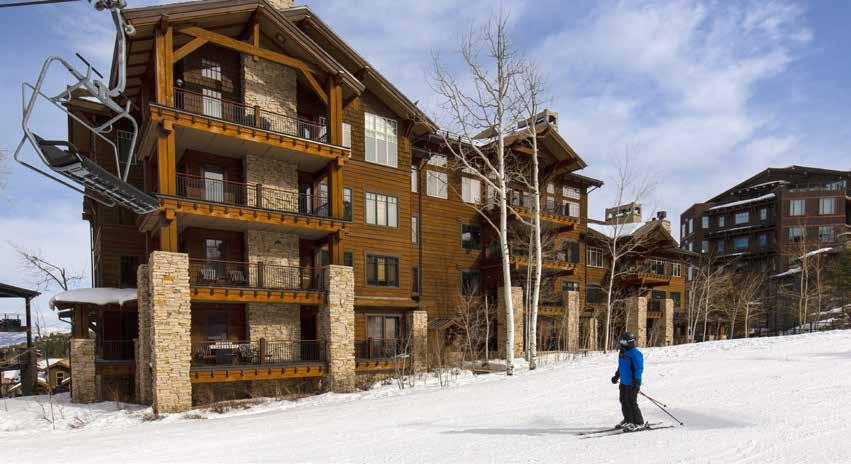
Overall, sales in these two communities during Q3 2024 remained consistent with both the same quarter of the previous year and Q2 2024.
Demand for single-family homes in the $1-2 million range remained strong, with a slight rise in median sale prices driven by activity in higher price points. By the end of September, inventory levels had increased,
and with the recent fall in interest rates, there is optimism for an uptick in sales in these highly desirable areas.
Silver Creek Village continues to expand its infrastructure, adding new restaurants and retail shops, including the Hispanic Anaya Market. The area’s diverse housing options, ranging from small condos to large acreages, continues to attract a variety of buyers.
JULY 1 - SEPTEMBER 30, 2024 VS. SAME PERIOD 2023
Median Sales Price
$1,965,000 7 12 Months Supply of Inventory Avg. Market Time

JULY 1 - SEPTEMBER 30, 2024 VS. SAME PERIOD 2023
CONDO/TOWNHOUSE
JULY 1 - SEPTEMBER 30, 2024 VS. SAME PERIOD 2023
$1,200,000
$877,250 5.4
$3,600,000
9 71 111 Months Supply of Inventory
Market Time
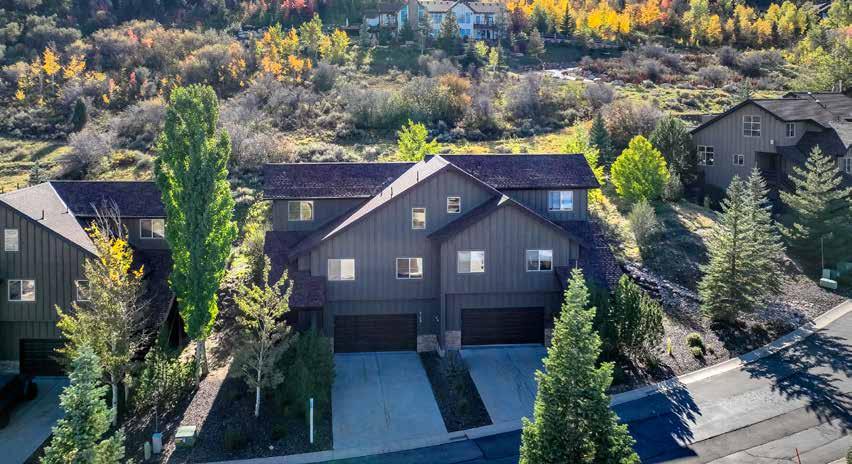
These communities, offering a diverse range of homes, estates, and attached developments with convenient access to the slopes and Salt Lake City, are expected to maintain strong demand, especially if interest rates continue to decline.
In Prospector, inventory levels dropped compared to Q2 2024, but sales still saw a slight increase compared to both Q3 2023 and the previous quarter.
Meanwhile, single-family home sales in Jeremy Ranch, Pinebrook, and Summit Park remained steady across both quarters as inventory levels held consistent. The condo/ townhome market, however, saw a significant rise in sales within the $1-2 million range, driven by increased inventory that gave buyers more options to purchase new homes.
SINGLE-FAMILY
JULY 1 - SEPTEMBER 30, 2024 VS. SAME PERIOD 2023
$2,163,285
Median Sales Price
CONDO/TOWNHOUSE
JULY 1 - SEPTEMBER 30, 2024 VS. SAME PERIOD 2023
$3,600,000
Market Time
Median Sales Price
$370,500 2.5 3.8 29 45 Months Supply of Inventory Months Supply of Inventory
Market Time
JULY 1 - SEPTEMBER 30, 2024 VS. SAME PERIOD 2023
CONDO/TOWNHOUSE
JULY 1 - SEPTEMBER 30, 2024 VS. SAME PERIOD 2023
$3,600,000
Sales Price Median Sales Price $1,600,000
$1,137,500 5.1 10 53 35 Months Supply of Inventory Months Supply of Inventory Avg. Market Time
Market Time
These thriving communities are undergoing a renaissance, with new single-family homes, condo/townhome complexes, and retail stores contributing to a bustling atmosphere.
While single-family home sales in Heber City and Midway have declined compared to Q3 2023, this is largely due to persistently low inventory levels, as demand from incoming buyers continues to rise. Inventory for condo/ townhomes is even more constrained, with supply falling below a three-month threshold.
Kamas, on the other hand, has experienced significant and steady growth across all price ranges compared to previous quarters, though this surge has severely depleted available inventory.
As we moved into fall residents enjoyed exciting events and hospitality, including Haunted Hayrides, the 2024 Biathlon Schutzenski Festival & Training Camp, and The Pumpkin Train.
SINGLE-FAMILY
JULY 1 - SEPTEMBER 30, 2024 VS. SAME PERIOD 2023
$886,000
Sales Price
CONDO/TOWNHOUSE
JULY 1 - SEPTEMBER 30, 2024 VS. SAME PERIOD 2023
$3,600,000
$515,950 5.1 2.7 43
Sales Price
JULY 1 - SEPTEMBER 30, 2024 VS. SAME PERIOD 2023
$1,125,000
Median Sales Price
3.6
45 Months Supply of Inventory
Market Time
New construction remains a hot topic in these rapidly growing communities, particularly with the expansion of Deer Valley’s East Village Resort. The development is set to include 42 units of moderate-income housing and 600 affordable housing units in Marina West, located on the east side of U.S. 40 near the Jordanelle Reservoir.
In Jordanelle, sales of single-family homes remained steady during Q3 2024, even showing a slight increase compared to the last quarter. However, the condo/townhome
market saw a slight decline, particularly for properties priced between $750,000 and $1 million.
Hideout, a smaller neighboring community, experienced a rise in sales for single-family homes, condos, townhomes, and even vacant land during Q3 2024.
Demand for properties, especially condos and townhomes in the $1-2 million range, has remained strong in both communities.
SINGLE-FAMILY
JULY 1 - SEPTEMBER 30, 2024 VS. SAME PERIOD 2023
CONDO/TOWNHOUSE
JULY 1 - SEPTEMBER 30, 2024 VS. SAME PERIOD 2023
$3,600,000

JULY 1 - SEPTEMBER 30, 2024 VS. SAME PERIOD 2023
LAND AT GOLDEN EAGLE
JULY 1 - SEPTEMBER 30, 2024 VS. SAME PERIOD 2023
JULY 1 - SEPTEMBER 30, 2024 VS. SAME PERIOD 2023
$1,945,000 $1,354,439
$3,600,000
8 6.5 2.6 106 132 Months Supply of Inventory
Sales and inventory in the golf communities of Park City continue to remain strong providing excellent opportunities for potential buyers where they are looking for land, spec homes or resale properties.
Alongside the golf communities listed below Park City will be adding two more: Wohali and Marcella. Wohali already has its course, club house and amenties open to the public, whereas Marcella has yet to break ground.
JULY 1 - SEPTEMBER 30, 2024 VS. SAME PERIOD 2023
$0 - $2M
JULY 1 - SEPTEMBER 30, 2024 VS. SAME PERIOD 2023
$5,400,000
Median Sales Price
9.5
70 Months Supply of Inventory Months Supply of Inventory Avg. Market Time
14

JULY 1 - SEPTEMBER 30, 2024 VS. SAME PERIOD 2023
JULY 1 - SEPTEMBER 30, 2024 VS. SAME PERIOD 2023
JULY 1 - SEPTEMBER 30, 2024 VS. SAME PERIOD 2023
JULY 1 - SEPTEMBER 30, 2024 VS. SAME PERIOD 2023
Median Sales Price
$4,425,000 26 56 99 Months Supply of Inventory Months Supply of Inventory Avg. Market Time
$6,515,000 8.5 10.3 154 Months Supply of Inventory Months Supply of Inventory Avg. Market Time
Median Sales Price
SINGLE-FAMILY
JULY 1 - SEPTEMBER 30, 2024 VS. SAME PERIOD 2023
JULY 1 - SEPTEMBER 30, 2024 VS. SAME PERIOD 2023
JULY 1 - SEPTEMBER 30, 2024 VS. SAME PERIOD 2023
JULY 1 - SEPTEMBER 30, 2024 VS. SAME PERIOD 2023
Median Sales Price
$2,511,250 6.3
7.6 163 Months Supply of Inventory Months Supply of Inventory Avg. Market Time
$4,100,000
Median Sales Price
6.3
33 Months Supply of Inventory Avg. Market Time
32 Months Supply of Inventory

Natural Beauty: Nestled in the stunning Wasatch Mountains, offering breathtaking views and access to outdoor activities like hiking, skiing, and mountain biking.
World-Class Skiing: Renowned for its exceptional ski resorts, including Park City Mountain Resort and Deer Valley Resort, providing unparalleled winter sports opportunities.
Outdoor Recreation: Beyond skiing, Park City offers a plethora of outdoor activities year-round, such as hiking, mountain biking, fishing, golfing, and horseback riding.
Festivals and Events: Hosts various festivals and events throughout the year, including the Sundance Film Festival, Kimball Arts Festival, and Park City Food & Wine Classic, providing a vibrant cultural scene.
Small-Town Charm: Despite its popularity, Park City maintains a smalltown charm with a tight-knit community, friendly locals, and a welcoming atmosphere.
Quality Education: Boasts excellent schools, making it an ideal place for families seeking quality education for their children.
Proximity to Salt Lake City: A short drive away from Salt Lake City, offering access to additional amenities, international airport, and urban attractions.
Strong Economy: Economy is robust, driven by tourism, outdoor recreation, and a growing tech industry, providing ample job opportunities.
Health and Wellness: Prioritizes health and wellness, with numerous fitness centers, spas, yoga studios, and access to outdoor activities that promote an active lifestyle.
Community Engagement: Has a strong sense of community engagement, with numerous volunteer opportunities, community events, and a supportive network of residents who care about the town’s well-being. 1 2 3 4 5 6 7 8 9 10
All data included represents a review of January 2023 through June 2024. The data is sourced from the Multiple Listing Systems of each market represented in the report, ie. Chicagoland, Lake Geneva, Naples, New Buffalo and Park City.
The data is represented quarterly throughout the report, using medians, averages, totals, and percentages. The figures (in terms of inventory, solds or list prices), are based on closed sales reported before the end of the period, ie. the last day of the month. Any property closed after the quarterly analysis period was not included. Property-specific sales records were standardized, inaccurate sale prices were corrected when necessary and all duplicate records were manually excluded. As a result, statistics available via the source data providers may not correlate to this analysis.
A stand-alone house is a free-standing residential building with no common party wall. It is sometimes referred to as a detached home but is not a multi-family residential dwelling.
An condo/townhouse means that a home shares a common party wall usually on both sides of the property (including condominiums, duplexes and townhomes).
A new property that has become available within the last quarter.
Figures based on known closings recorded at the time the report is prepared and recorded in their respective quarters.
The variance by percentage between each quarter compared.
The middle price of the given dataset.
The number of months it would take for the current inventory of homes on the market to sell given the current sales pace.
The average number of days all properties were on the market prior to being sold.
312.750.9333
HINSDALE
8 E. HINSDALE AVENUE
HINSDALE, IL 60521
630.686.4886
LAKE FOREST
675 FOREST AVENUE LAKE FOREST, IL 60045
847.737.4775 WINNETKA
BAY ROAD GLENCOE IL 60022
847.807.3660