Madison DeMay Urban Planning Portfolio

University of Cincinnati
Class of 2024
2 About Me • About Me • Resume Design Workshop Co-op City of Kettering Co-op Junior Planning Project Sophmore Planning Project Freshman Planning Project
4-5 6-9 10-11 12-17 18-25 26-35
Table of Contents

About Me
I am an Urban Planning Senior at the University of Cincinnati. I grew up a county away in the suburbs of Liberty Township, and have made frequent visits to downtown Cincinnati for most of my life. I spent a year at Kent State University for Visual Communication Design before realizing that even though I love design, my passion was in planning. Outside of school I work on photography and graphic design, exploring parks and going to concerts.

My love for planning was realized when I went to DAAP camp in 2015 for Architecture. I left wondering what I could do to create change on a larger scale to positively impact the every day life of the people within a community. A site is a small but important part of a larger connected system. Focusing on a connected system rather than a site alone helps ensure that the site and the larger system feed off each other in a positive way.

4
Madison DeMay
(513)917-7925 | demayme@mail.uc.edu
5098 Julia’s Rose Court, Liberty Township, OH
Education:
University of Cincinnati | College of Design, Architecture, Art, and Planning | Fall 2019 - Present | Participating in the Professional Practice Program, alternating semesters of classroom study with work in the field of design. | Urban Planning | Dean’s List Honor| 3.7
GPA
Kent State University | August 2018 - May 2019 | School of Visual Communication Design | Dean’s List Honor | 3.5 GPA
Activities:
Kent State Undergraduate Student Sociology Collective | Vice President | Planned social activities for students to learn about sociological issues; created logo and design for club; produced flyers for events.
Skills:
Adobe
• Illustrator, Lightroom, Photoshop (certified), InDesign
GIS ArcPro
SketchUp
Microsoft Office
• Word, PowerPoint, Excel
Work Experience: Design Workshop | Spring Semester 2023 | In-person Work Key projects I was involved with at Design Workshop included a county master plan, a city parks and recreation DEI study, and a county fairgrounds master plan. Primary project deliverables included regional and site analysis, research, creation of narratives, memos and visualizations, creation of advertisement and community engagement materials, and survey creation and coding. In addition to these projects, I led a submission for the 2023 APA awards which involved developing the slide deck, creating supporting visualizations and collaborating on the narrative for the project. Assisted in marketing efforts through data collection and analysis and supported a local municipality by creating public facing forms.
City of Kettering | Fall Semester 2022 | In-person Work Local Government | Part-Time | Worked with Community Development division to design the flow of work and assessment of the STAYPUT Emergency Rental Assistance Program. This aided 300+ clients and expended $1.3 million. Responsible for quickly and effectively resolving issues by providing accurate responses to the public as to both routine and technical matters, using independent judgment and initiative while maintaining confidentiality.
5
Design Workshop
Douglas County Fairgrounds Plan

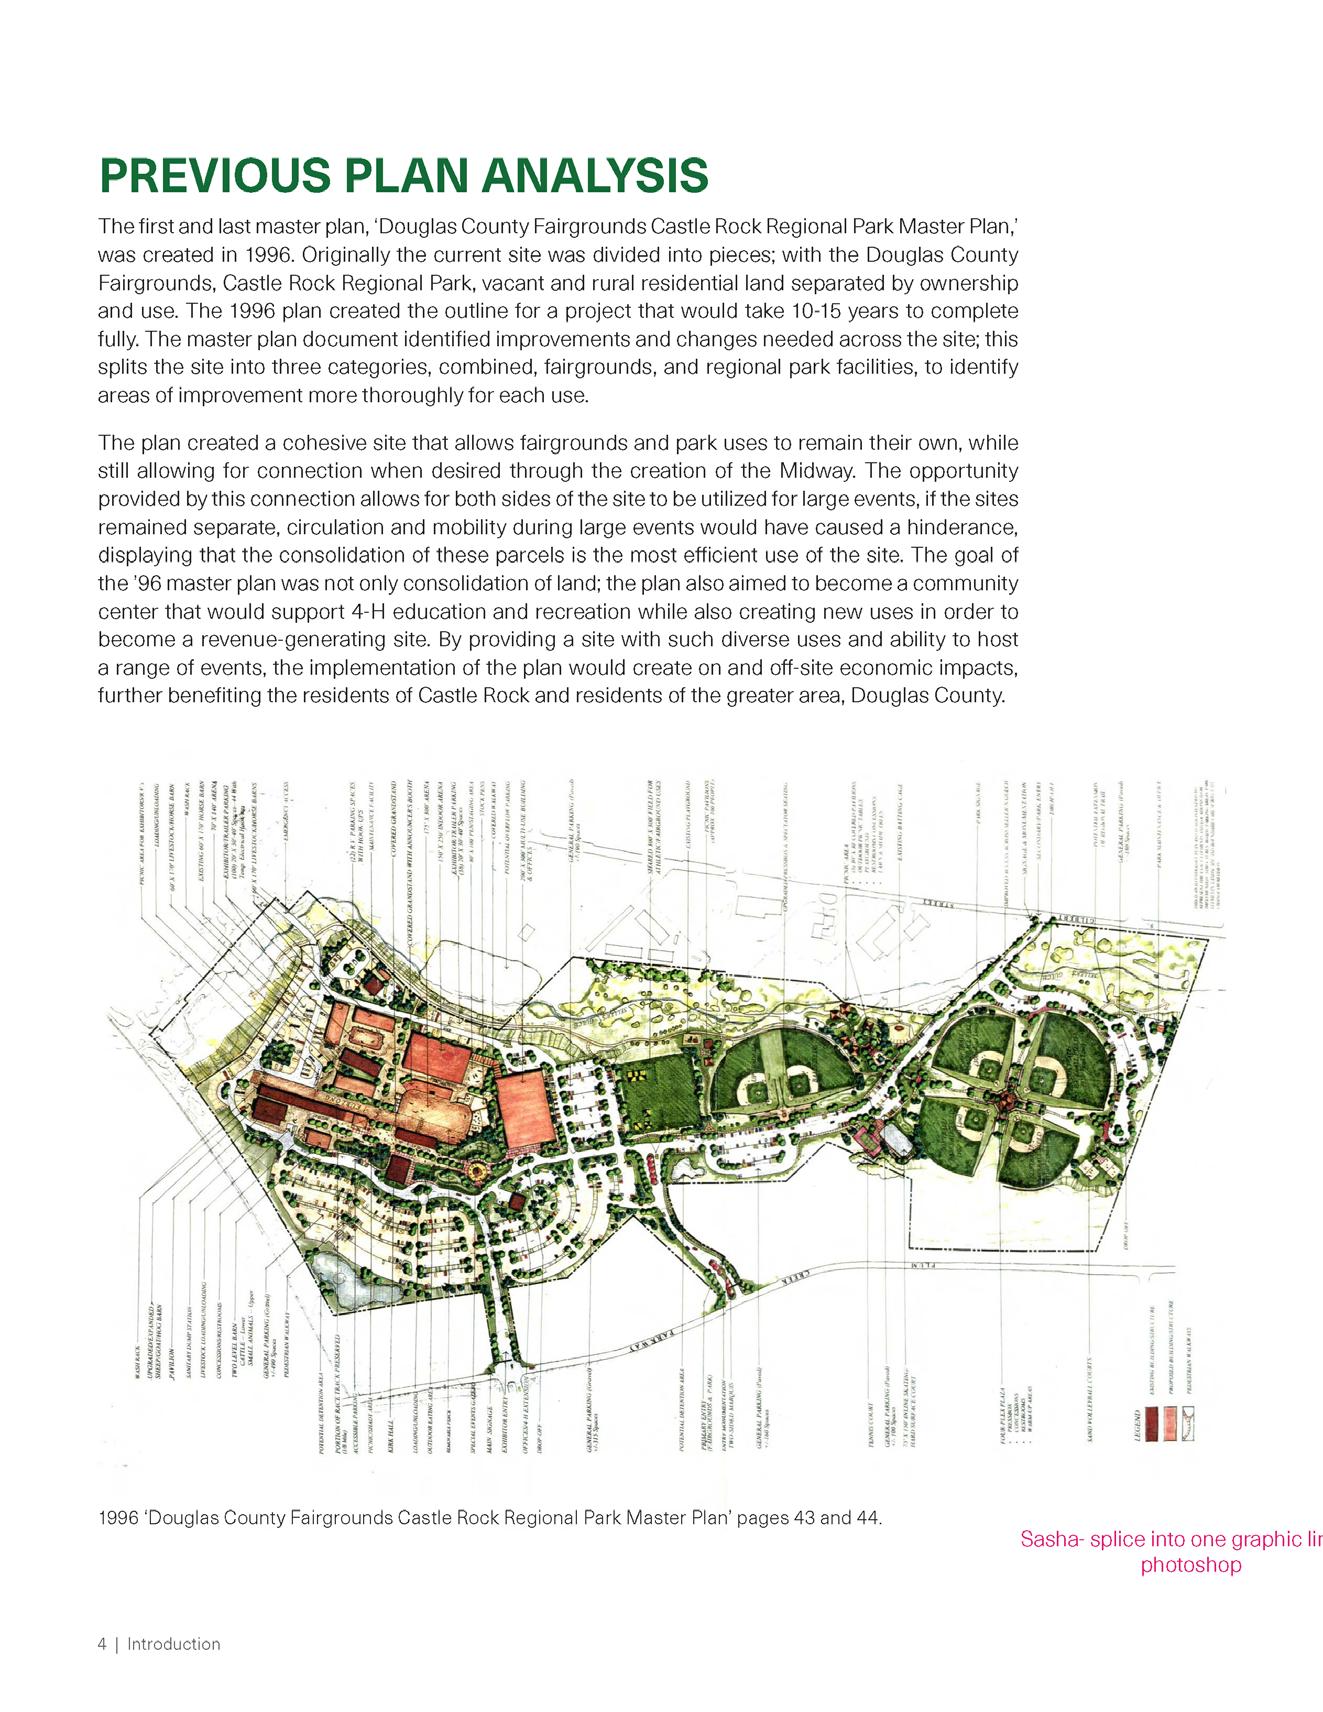
Kicked off a master plan by producing and analyzing regional and site analysis maps and diagrams. Researched a variety of topics and developed a chapter narrative. Designed the layout of the plan document. Created visualizations for client meetings.
Master Plan Dpcument
6
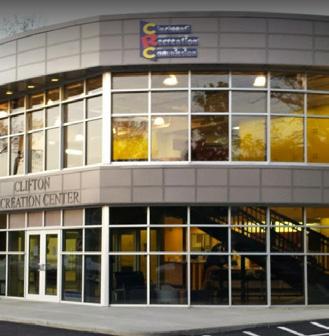
City of Tempe’s DEI Parks and Recreation Study

Developed investment maps and created cross-platform advertisement for community engagement events. Created memos from the results of community survey data coding and provided research summaries.
Investment Map Equity Project Ads
Capital Investment in Parks, 2015 - 2023 & Equity Zones Overlaid
CELEBRATE AND EXPLORE
What
7
0 1 0.5 Miles ¯
Legend Tempe Municipal Boundary Light Rail Station Light Rail Line Recrecreation Centers $444,753 $500,000 $500,001 $1,000,000 $1,000,001 $3,000,000 $3,000,001 $6,228,017 Waterbody Maricopa County Water Areas Maricopa County Parks $0 $1 - $100,000 $100,001 $500,000 $500,001 $1,000,000 $1,000,001 $3,000,000 $3,000,001 $6,030,565 Priority Class Medium Priority High Priority Very High Priority ASU Railroads Streams in Tempe
making space: AN EQUITY STUDY FOR PARKS AND RECREATION
the online survey before May 22. LEARN JOIN how this study can impact our community at the Making Space Festival on May 10. us at a virtual public input workshop April 24 at noon or 6 p.m. FIND DETAILS at tempe.gov/MakingSpace Art, Bikes, Food, Music, Play!
equity could look like for Tempe Parks and Recreation SHARE your experiences and hopes by taking our survey. Take
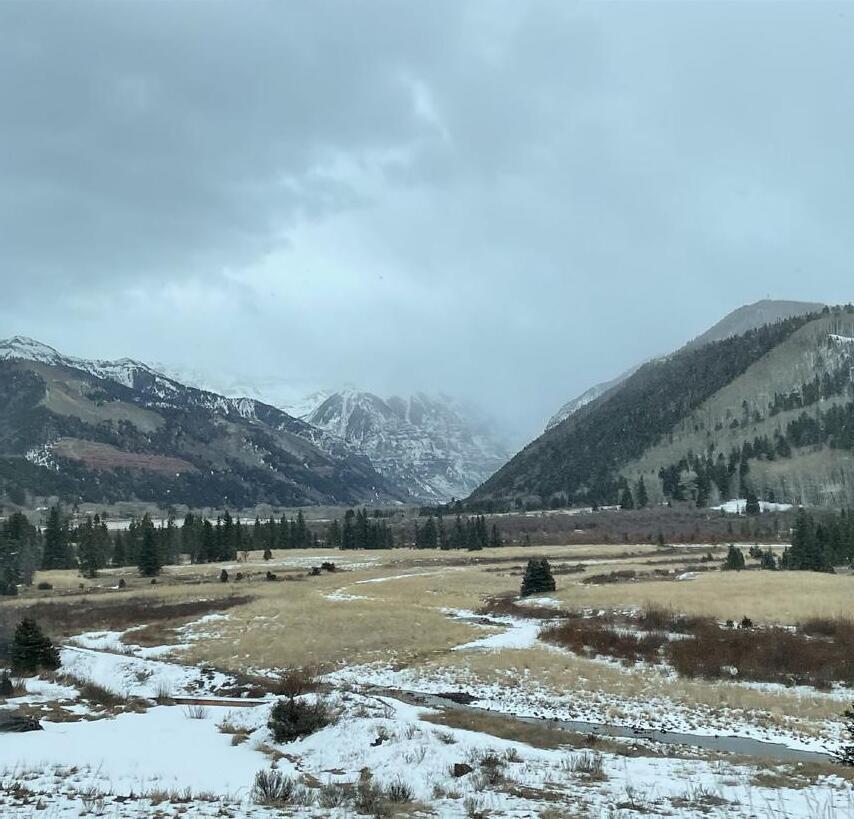
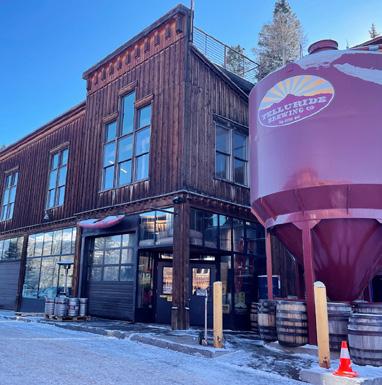


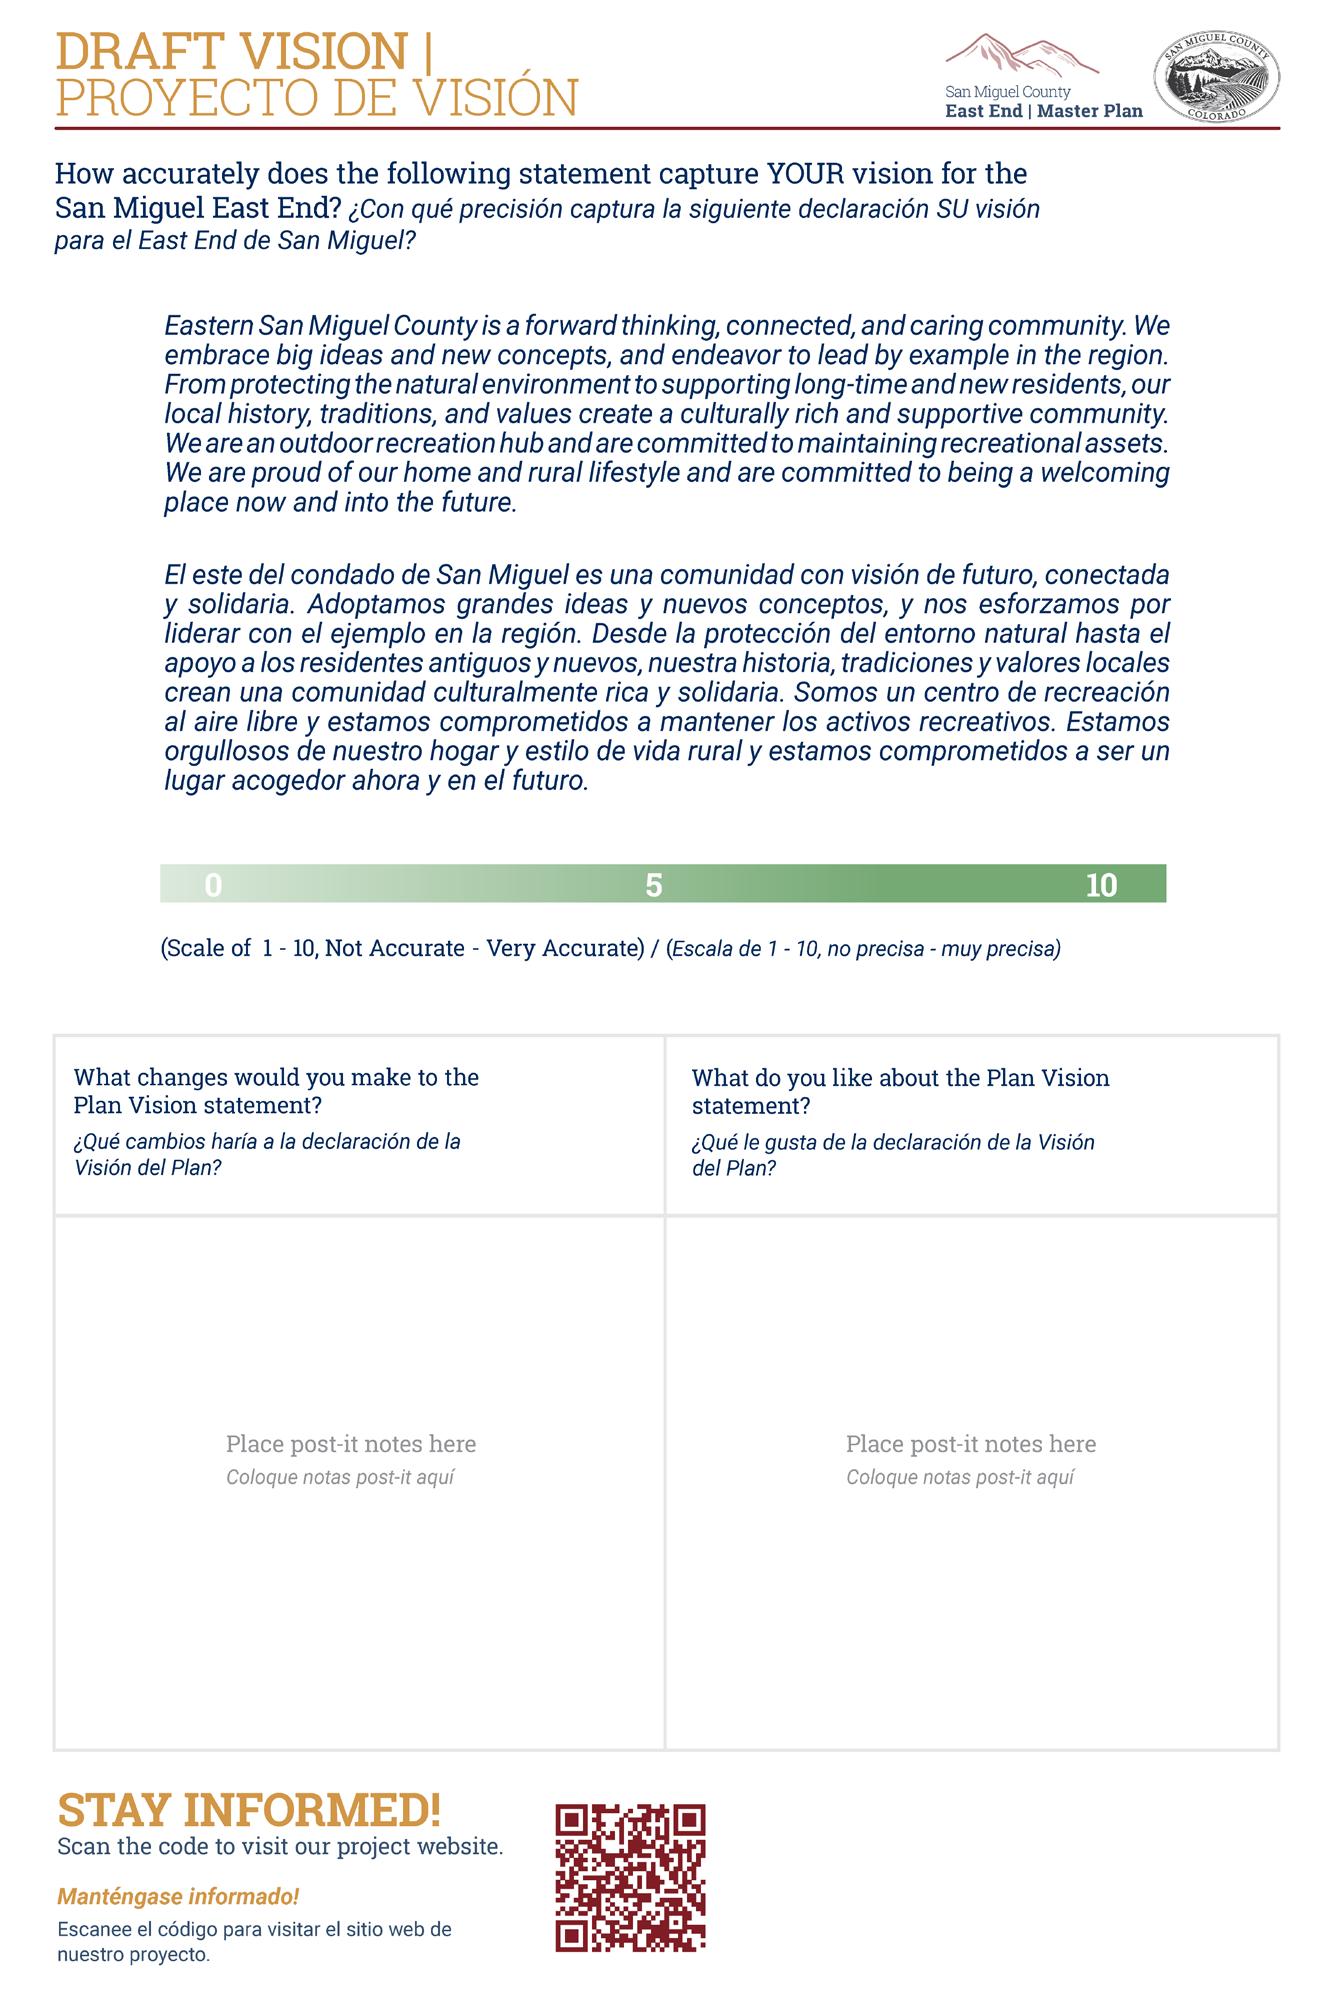
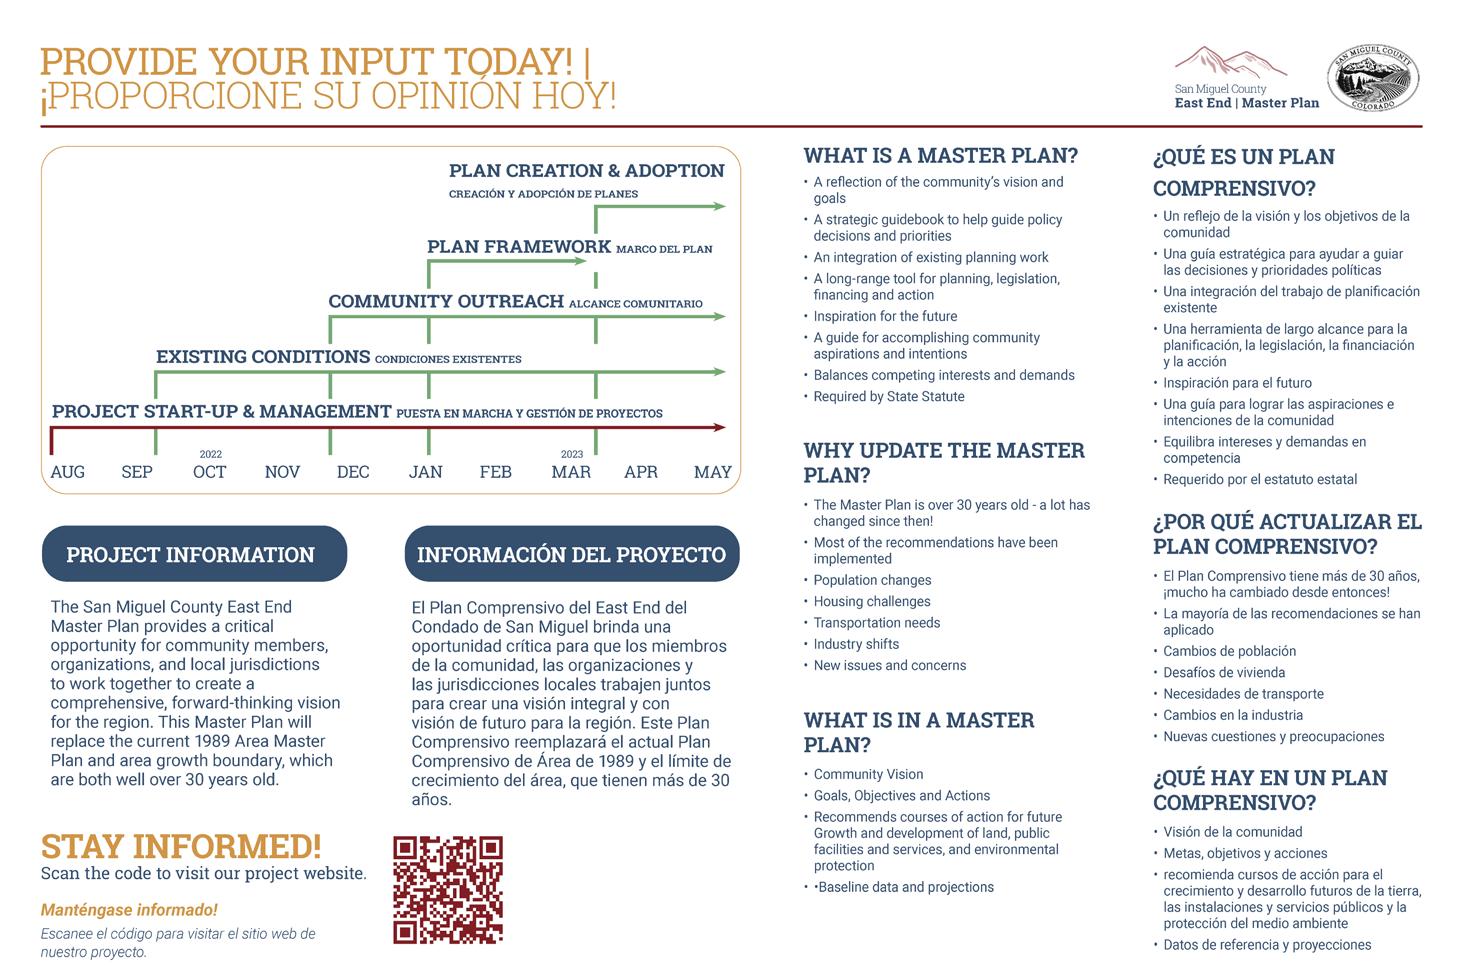
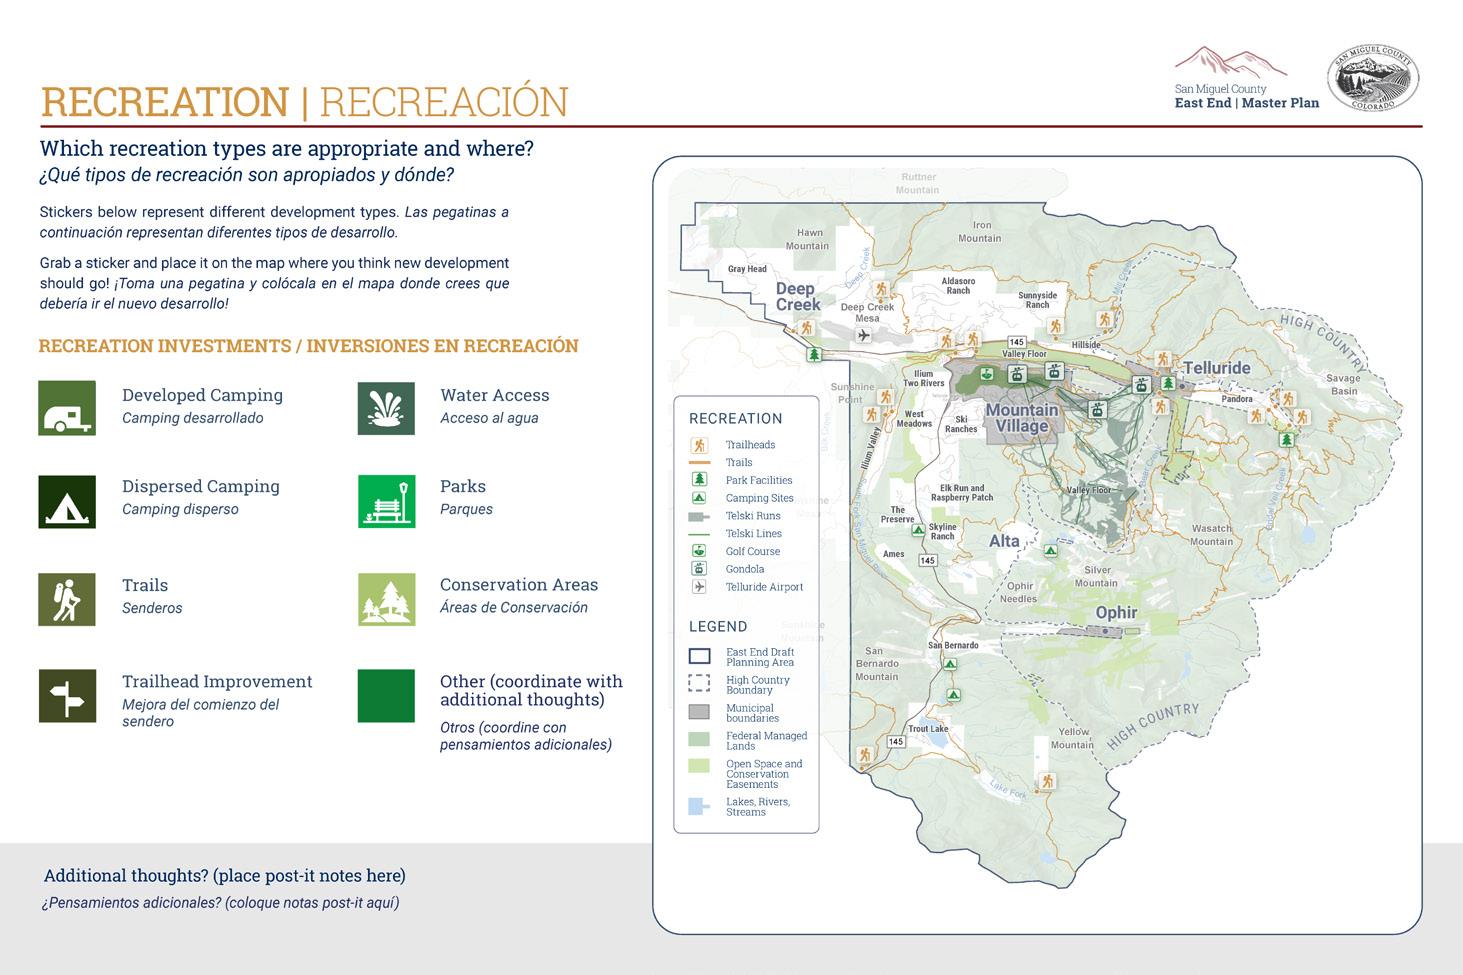
8 San Miguel County East End County Plan Created advertisement and community engagement materials. Participated in community engagement events. Created memos from community survey data coding and provided research summaries. Engaged in advisory group meetings. Save the Date! The San Miguel County East End master plan is an intentional road map to guide the county toward its shared vision and goals. Join fellow community members and share your ideas for the future of Eastern San Miguel County. We want to hear YOUR vision for the East End! Attend the Community Open House and tell us YOUR vision for the future. To learn more about the San Miguel County East End master plan, scan the QR code below For additional information, go to: http://www.sanmiguelcountyco.gov/eastendmasterplan Or contact the San Miguel County Planning Department: Call (970)729-3083 or Email masterplan@sanmiguelcountyco.gov Join us on Tuesday, March 21st at the Wilkinson Public Library | 100 W. Pacific Avenue Drop in between 11am-2pm or 4pm-7pm Open House Ads Make Your Voice Heard! Take the San Miguel County East End Master Plan Community Survey Open February 13th - March 3rd Scan the QR code to take the survey! The Eastern San Miguel County Master Plan will define the vision of the community. This plan is an intentional road map to guide the county towards its shared vision and future goals This survey was created to understand what it is like to live, work, and play in eastern San Miguel County, and to understand your vision for the region’s future. For additional information, go to: https://www.sanmiguelcountyco.gov/731/East-End-Master-Plan or contact masterplan@sanmiguelcountyco.gov Survey Ads
Community Open House Exhibits
9
STAYPUT Emergency Rental Assistance Program
The City of Kettering secured funding for our Emergency Rental Assistance Program (ERAP), StayPut, after the Community Development department saw that many of the city’s residents were struggling to be approved for program funding due to no fault of their own. A key factor in the struggle to be approved was tthqat organizations distributing the funding for Montgomery County were backlogged; due to the sheer number of tenants in need applying to secure their housing, especially as the moratorim had ended. The county agreed to add the City of Kettering as a partner in distributing CARES Act funds with the condition that we take on all zip codes covered by the city court’s jurisdiction. The city’s funds were to be distributed across codes in and that overlap with the City of Kettering, Centerville, Washington Township, and Moraine.
I began working for the city just before the program officially began. I became a part of the program team under the guidance of the Planning Director and begun developing our program methodology and systems to digitally and physically account for our clinets, landlords, and attorneys. Throughout the time I spent with the city I adapted and refined their programming, trained many new and current employees on how to work for their clients, brounght forward additional support features, attended weekly evicyion hearings, collaborated with our Community Development department as well as the county, and secured additional funding. I also worked towards creating a support network that will eventually replace this temporary program.
10 City of Kettering |
STAY ON Utility Assistance

We developed a city-specific program for the intended purpose of assisting those who had fallen behind on their utility nills. Many of the Kettering STAYPUT recipients told us of their struggle to keep their utility bills paid when county HEAP (Home Energy Assistance Program)/ PIPP (Percentage of Income Payment Plus) resources were not available. The program would begin to cover the gap created by restrictions that kept residents from accessing utility assistance from Miami Valley Community Action Plan.
This program was created through the group effort of our two co-ops, two Community Development leaders, and myself. The co-ops and I created the connections with water, electric, and gas services that we needed in order to assist with utility payments, program methodology, developed necessary forms to gather pertinent infromation, and organized communication channels.
11
City of Kettering |
Developing a Resilient Regional Plan
For this studio, our class was tasked with looking into the Mill Creek Region’s future without any change in how the city currently develops; each group then devised a plan of what the future could look like with intervention. My group developed a plan to shape the region to become stronger with the implementation of a resilientflexible plan; guided by the drivers of climate change, equity, economy, and technology.
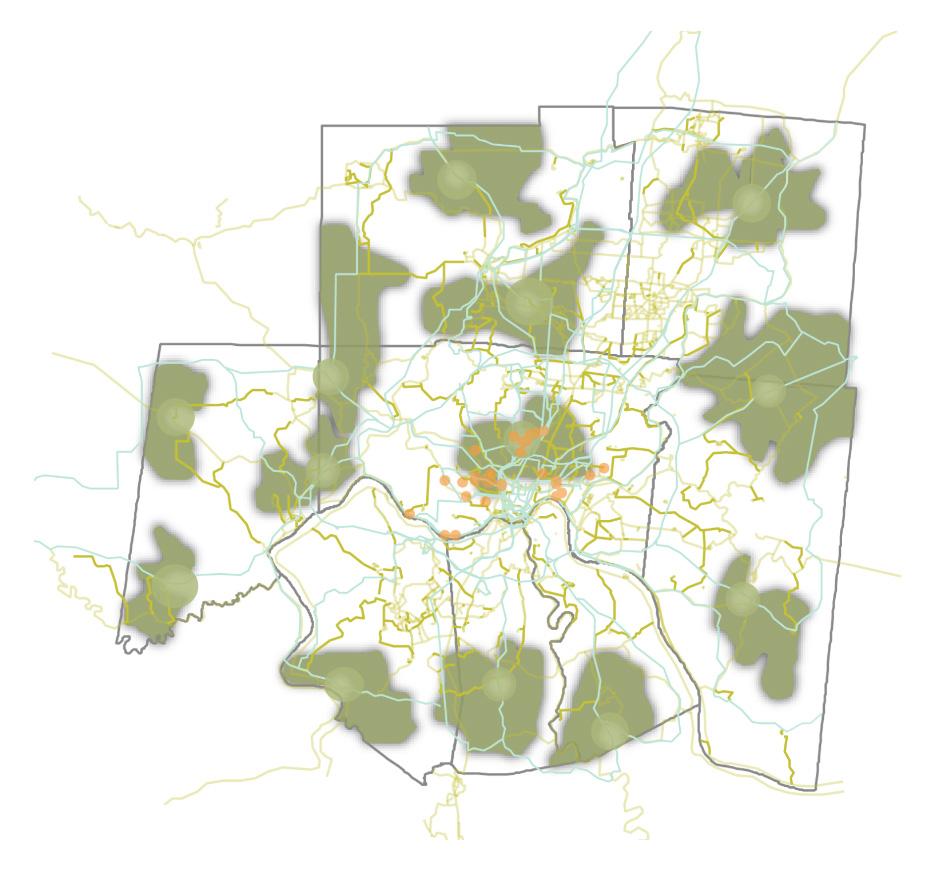
Our final scenario shows how our plan would transform our focus area by implementing our three-prong plan designed to change the future of the Mill Creek region.
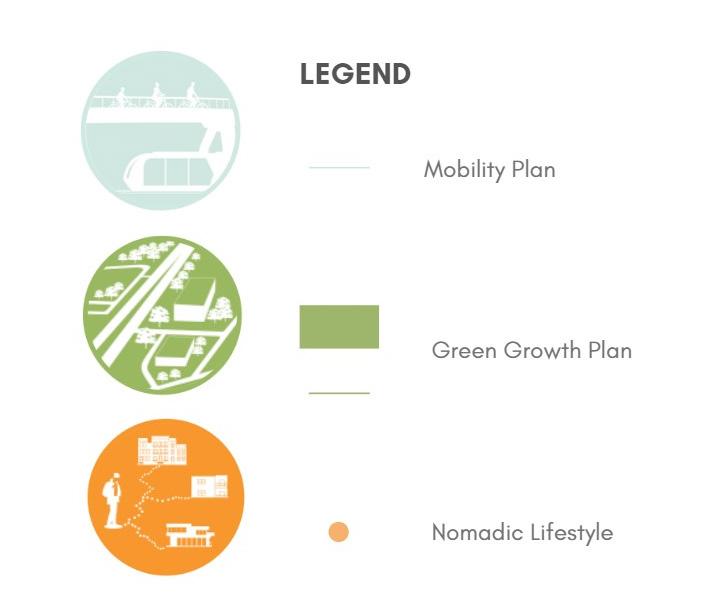
Nomadic Lifestyle Developing Sustainable Growth Mobility through Transportation
Within our group my focus was on the development of the ‘Nomadic Lifestyle’ pillar within our plan for the Mill Creek Region. This project was a group effort apart from individual renderings
StoryMap
12
The Future of the Mill Creek Reegion
The Current Path to 2042:
Population: Growth in population due to climate refugees and increase density.
Economy: Limited growth in businesses and job opportunities, temporary waves of increased employment before human labor will begin to decline due to technology.
Transportation: Slight improvement seen in public transportation due to lack of incentives
Technology: Improve quality of transportation for private entities as well as personal technology.
Public Health: General health will suffer as growth occurs; no incentives given to improve quality of life for the public.
Government + Policy: Progress will remain stagnant for the public but improve for private entities.
Equity: Increased awareness and advocacy attempting to inspire change; quality of education, housing will remain stagnant, and skilled labor will decrease.


Climate Change: Infrastructure will continue to fail and present structural and environmental problems will be exacerbater.

A Re-imagined Path to 2042:
Nomadic Lifestyle
The Nomadic Lifestyle approach to housing grants the population freedom through mobility. A network of connected leases allow the low-tomiddle-class population to participate in temporary relocation for reasons such as personal choice or to have better access to job opportunities.
Green Growth
The Green Growth plan creates a more balanced and sustainable approach to development. Blue and Green Corridors, as well as Green Growth Hubs create opportunities for nature to better incorporated into the dense city environment.
Increased Mobility
Increasing mobililty within our region consists of a robust multi-modal transit system; the system must be designed at a regional scale to ensure efficiancy and connectedness throughout. Our system will decrease private vehicle ownership, as it will no longer be a necessity, as well as lower the high level of carbon emissions.
13
Nomadic Lifestyle
Aspects of each housing type:
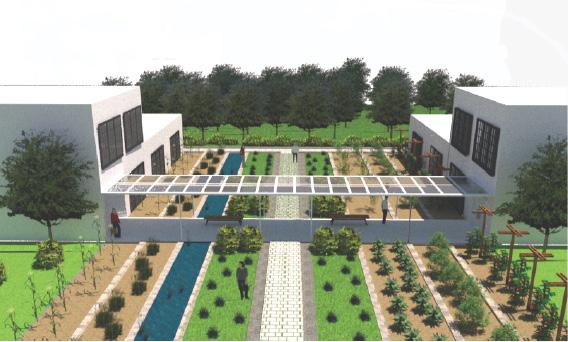
Ecovillages
• Variety of housing types and incomes
• Increases local food production
• Produce educational events
• Increases density
• Encourages shared community space
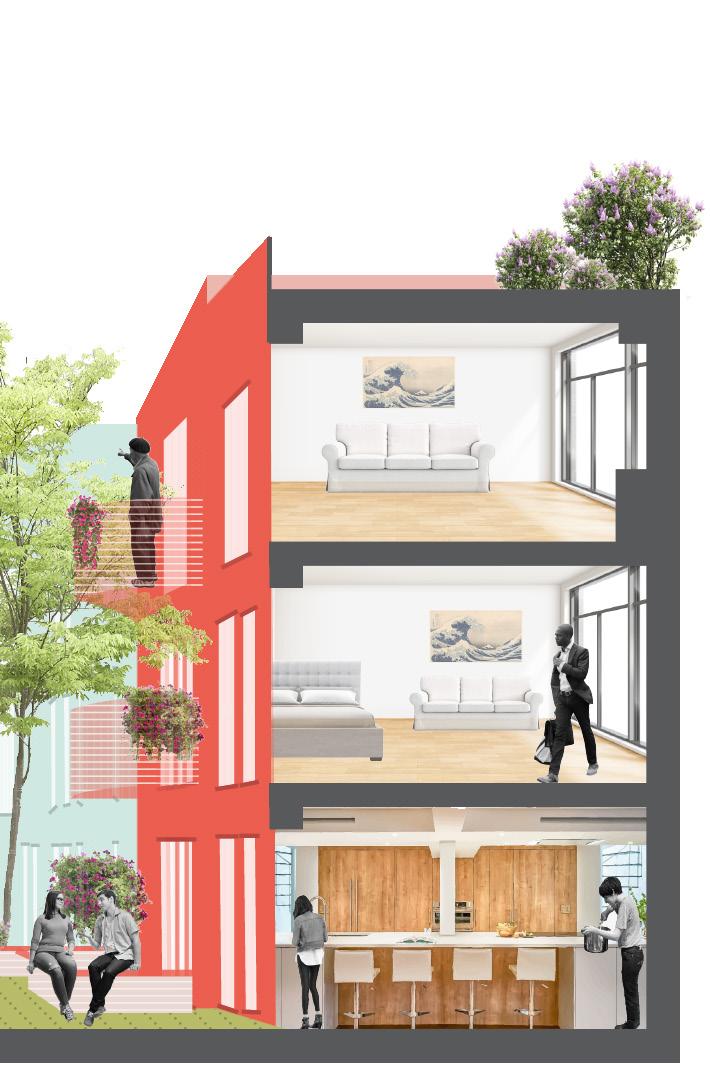
Cohousing
• Creates community-focused
• Building footprint encourages private space development
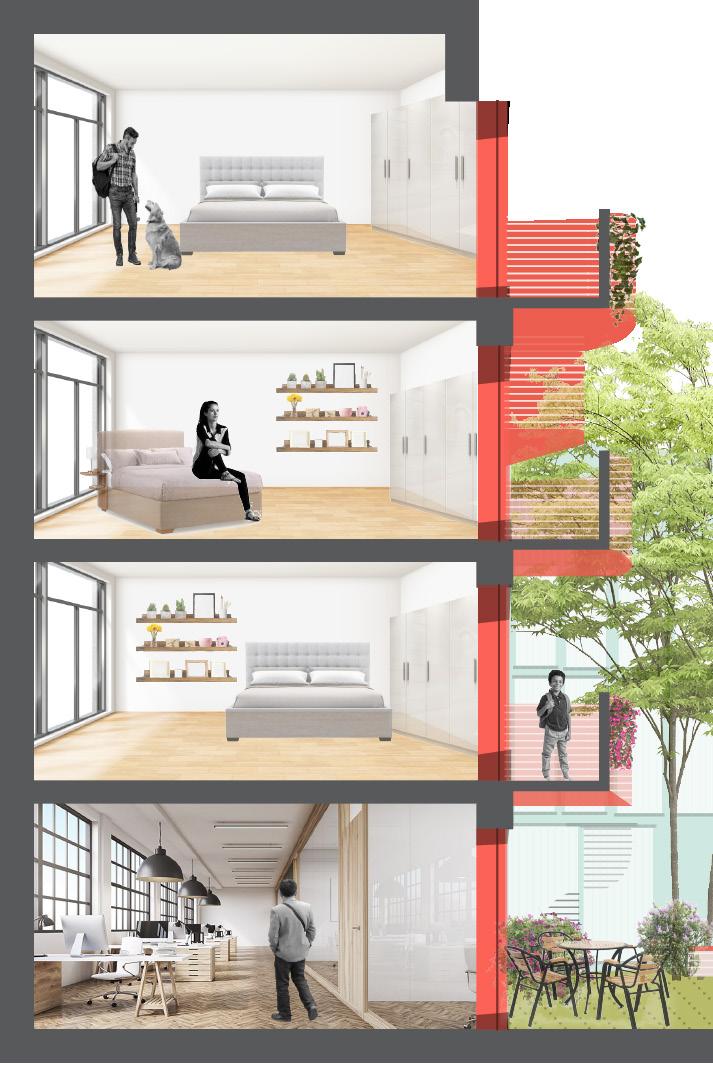
• Furnished unites
• Is suited for many environments
14
community-focused apartments encourages bare necessities development environments
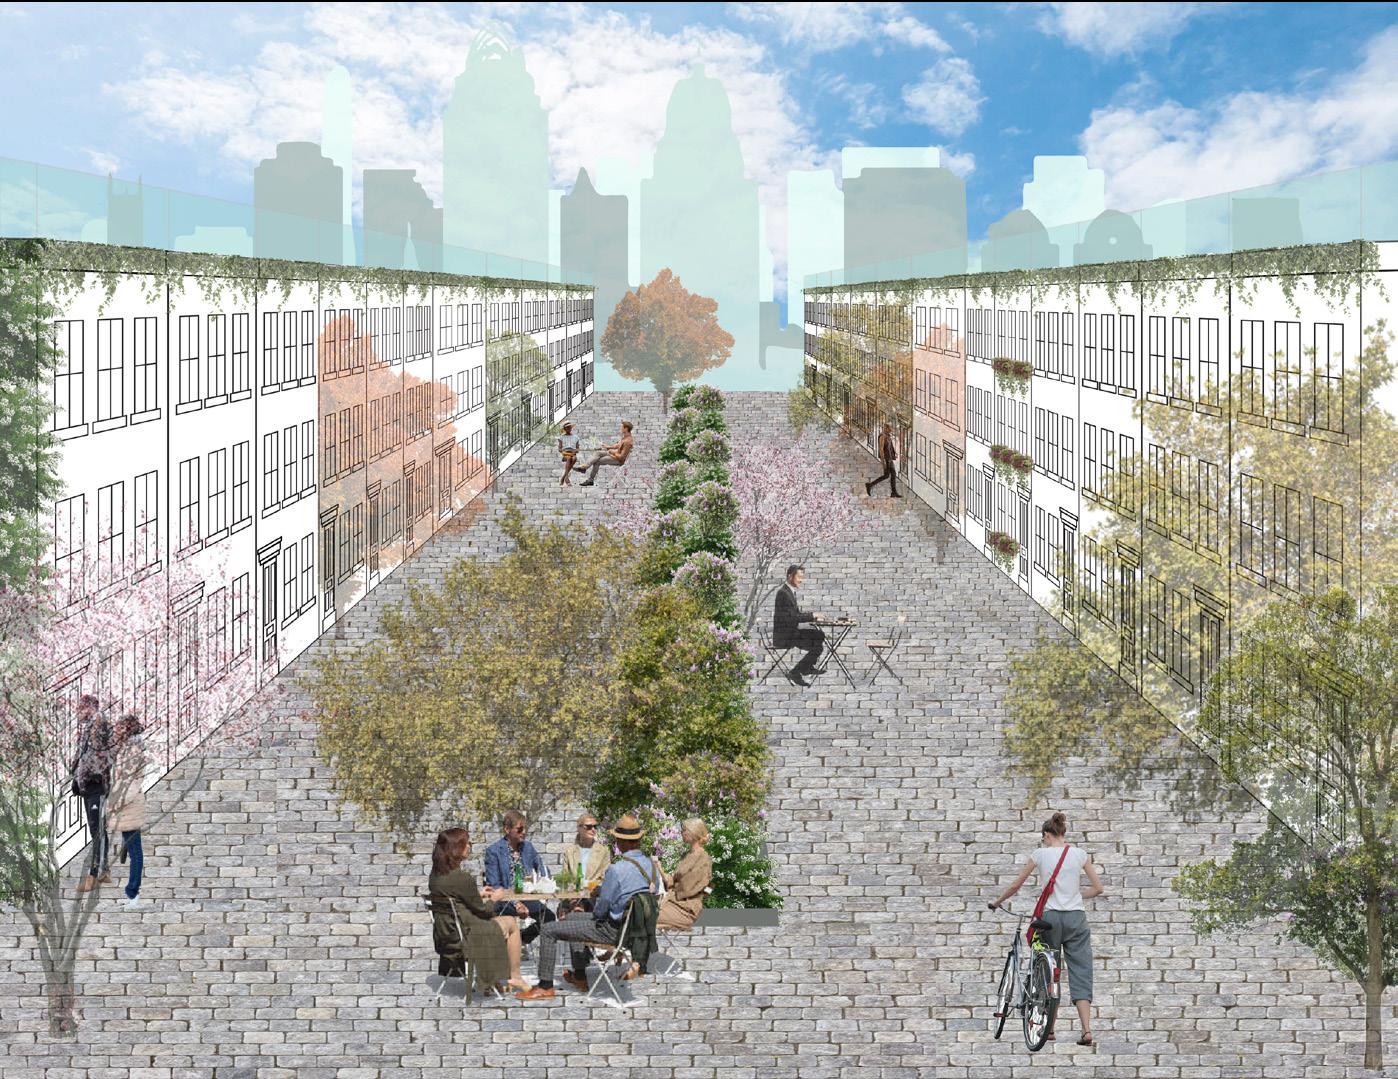
Alley Housing
• Beneficial greenspace stormwater management
• Creates recreation and green spaces
• Increases buildable area by using less land
• Pedestrian-oriented, no private vehicle use
15
Creating a Nomadic Housing Network

After defining Nomadic Lifestyle and identified what housing types would fall under the term, we then surveyed our region at a micro, meso, and macro scale to pinpoint current opportunitiy areas for future development. A majority or opportunity areas were within our micro (The Mill Creek) and meso (Hamilton and Butler County within the watershed) scale, with little opportunity noted at the macro (OKI) scale. This was purposeful, our goal was to develop these housing typologies within and around pre-existing built environments as to limit sprawl.
16
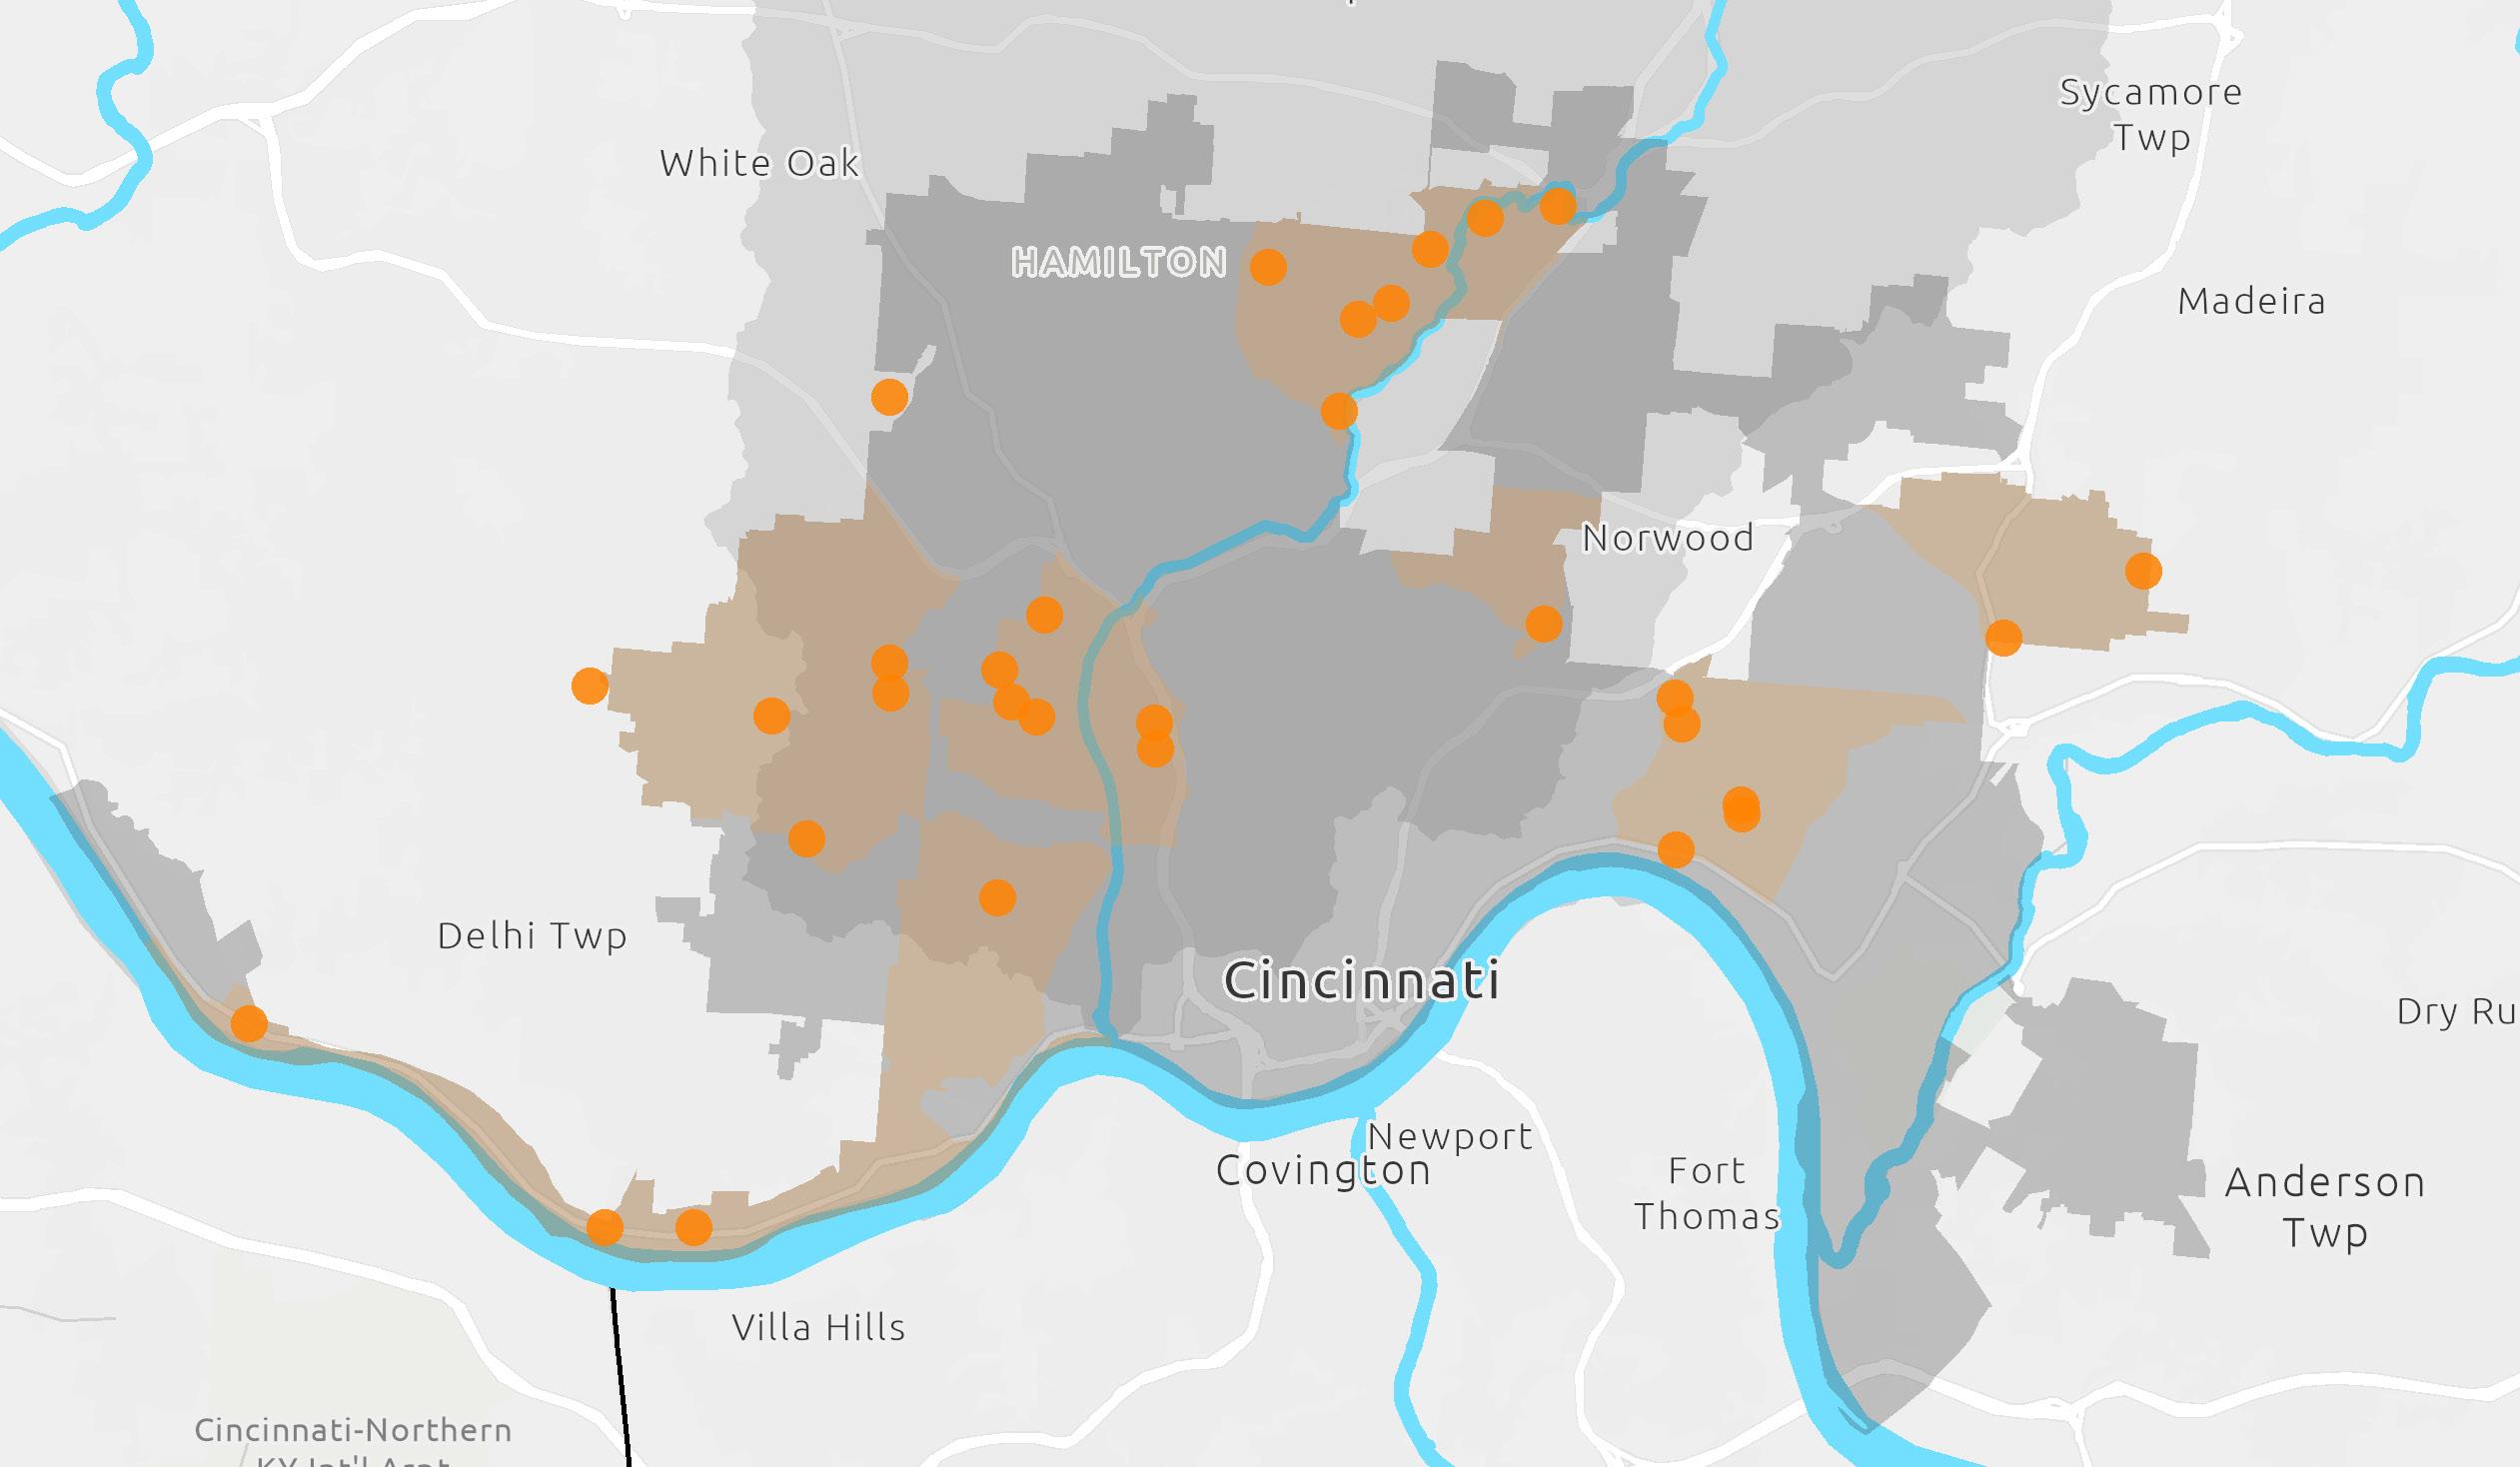
Potential Sites
Areas of Opportunity Within Hamilton County
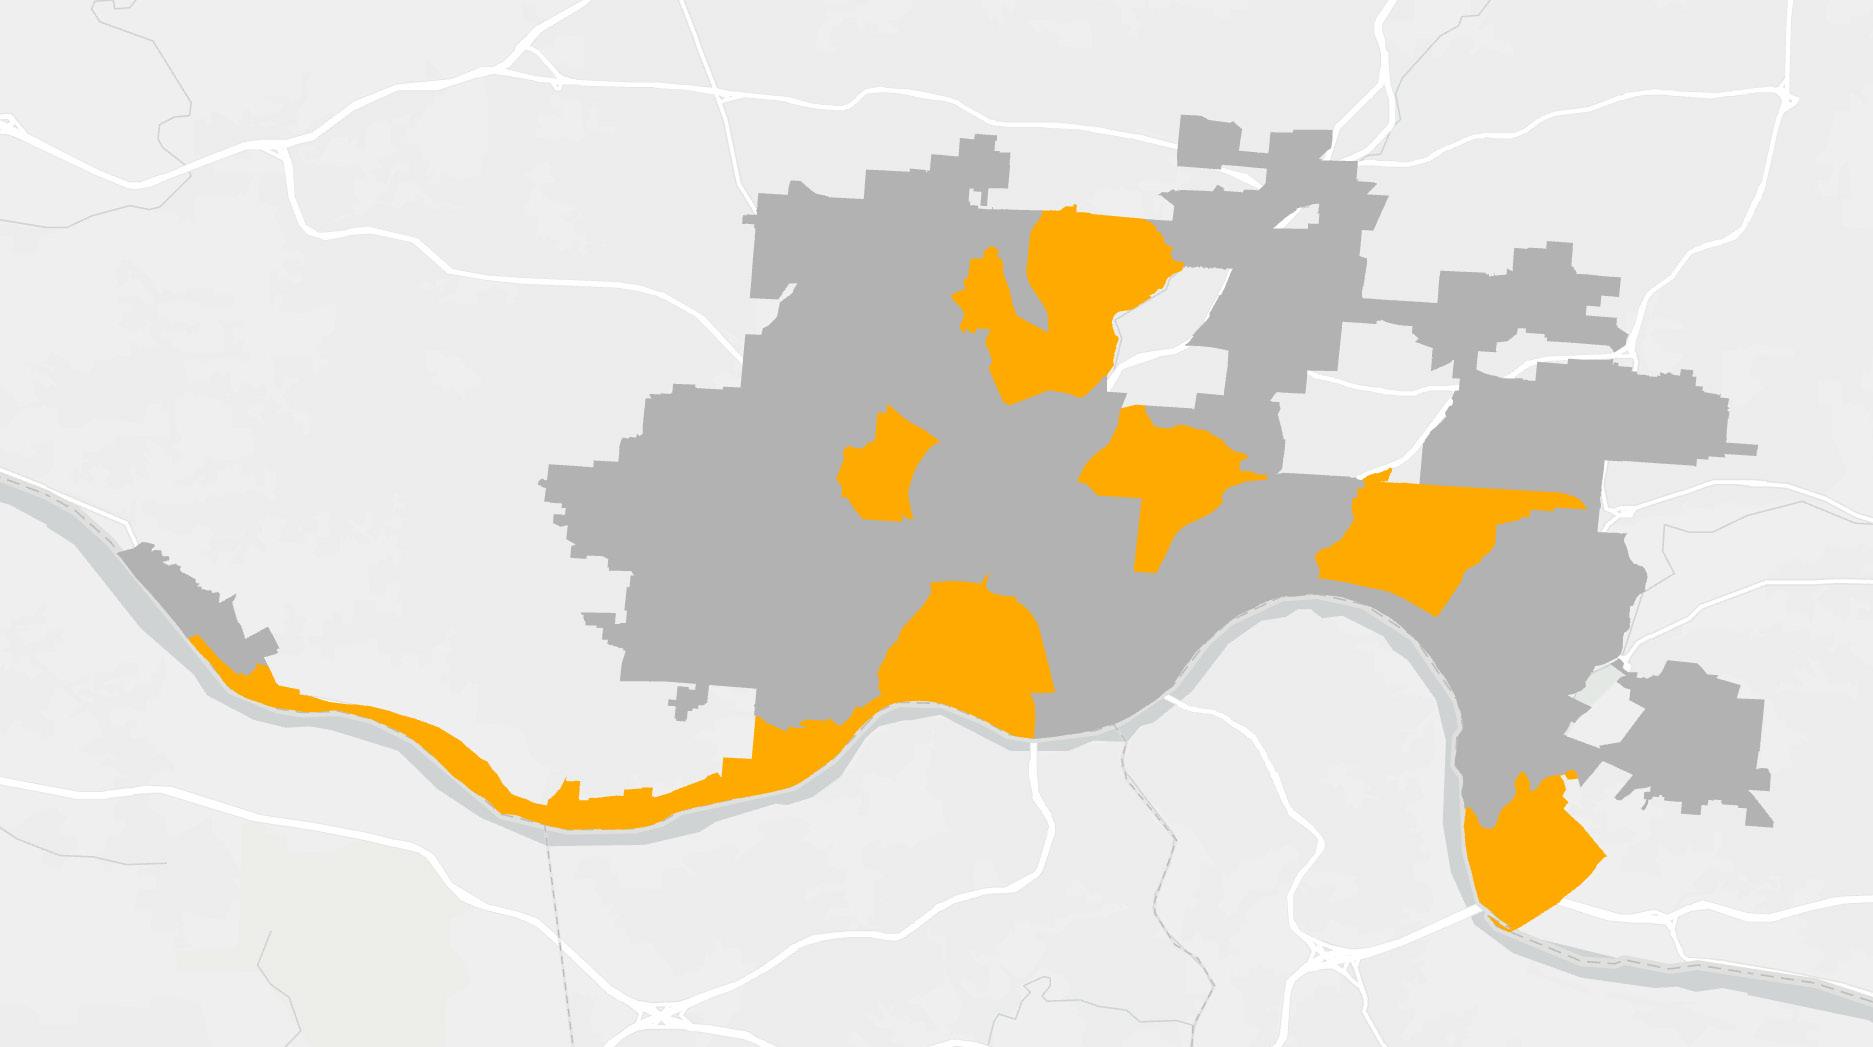
These sites were discovered through the use of in-depth walkthroughs by taking advantage of Google Map’s and Goodle Earth’s aerial imagery. Shown in maps are the areas with largest opportunity area with the watershed, not all listed are shown.
As of 5/2/22:
• Carthage
• Winton Hills
• Avondale
• Queensgate
• Millvale
• South Cumminsville
• English Woods
• Camp Washington
• Hyde Park
• Riverside
• Sedamsville
17
Neighborhood Analysis
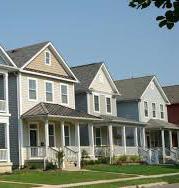
English Woods, Cincinnati, OH
Introduction to English Woods
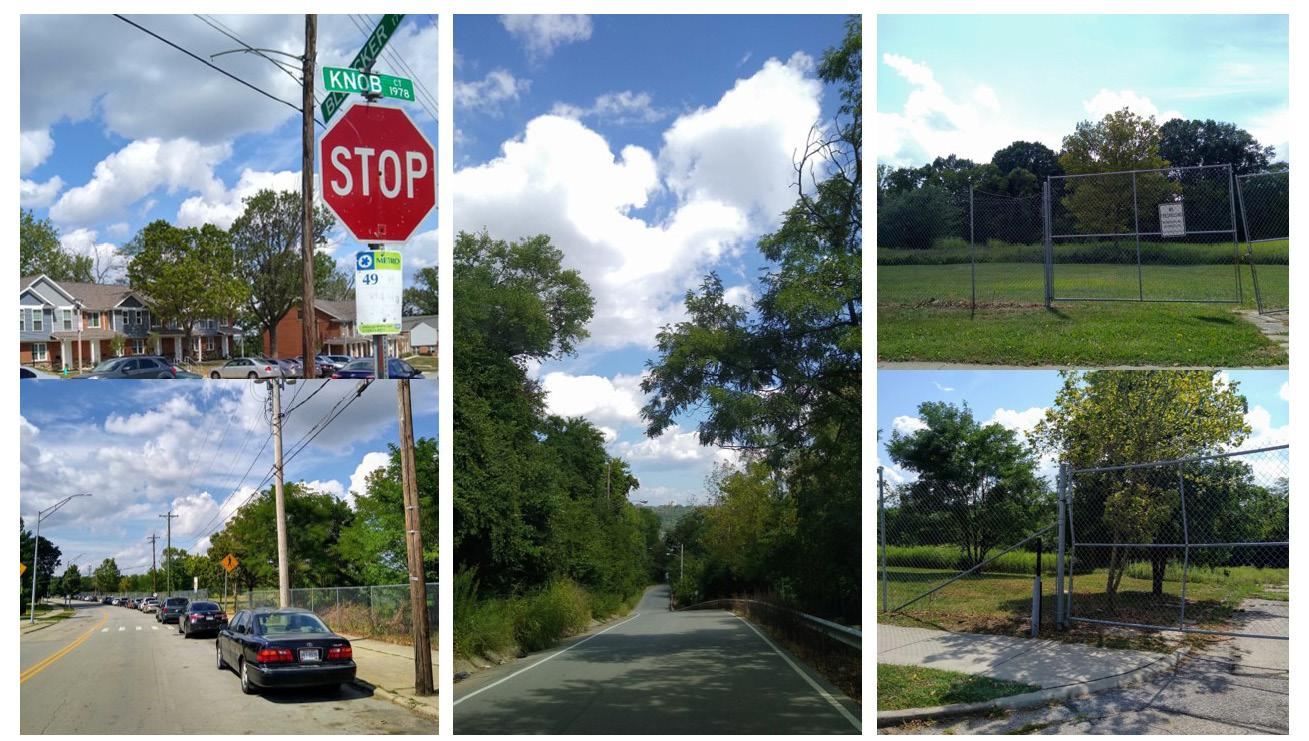
English Woods was created in 1940 to be a CMHA (Cincinnati Metro Housing Authority) neighborhood. Originally the site was home to over 700 units spread across 82 buildings. Modernization and improvement projects made the neighborhood the gold standard of public housing in the early 90’s. Though the tide drastically shifted by 1999 when neighborhood occupancy dropped by 90% in one year.
Existing structures fell into disrepair and CMHA applied to demolish what was left of the neighborhood. Their reasoning being that everything inside of the walls, including infrastructure, needed to be replaced and would be more costly to fix than tear down. The English Woods Civic Association sued to avoid demolition and residents were allowed to stay until 2006.
By 2008 CMHA removed almost every unit from the neighborhood other than Marquette Manor and the Sutter View community. There has been some work on remodeling Marquette Manor and some development added to the Sutter View community since then but besides that, not much has changed. Today open spaces are blocked behind large fences, and the only commercial site the English Woods market, has been abandoned.
19
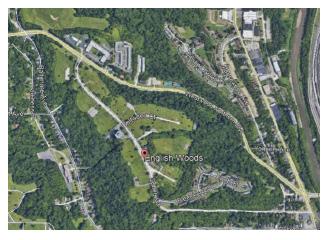
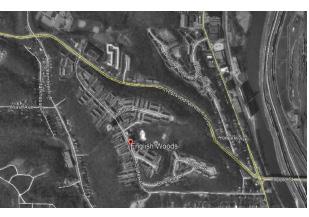
Neighborhood ariels provided by Google Earth showing the difference of the landscape between 1994 and 2020
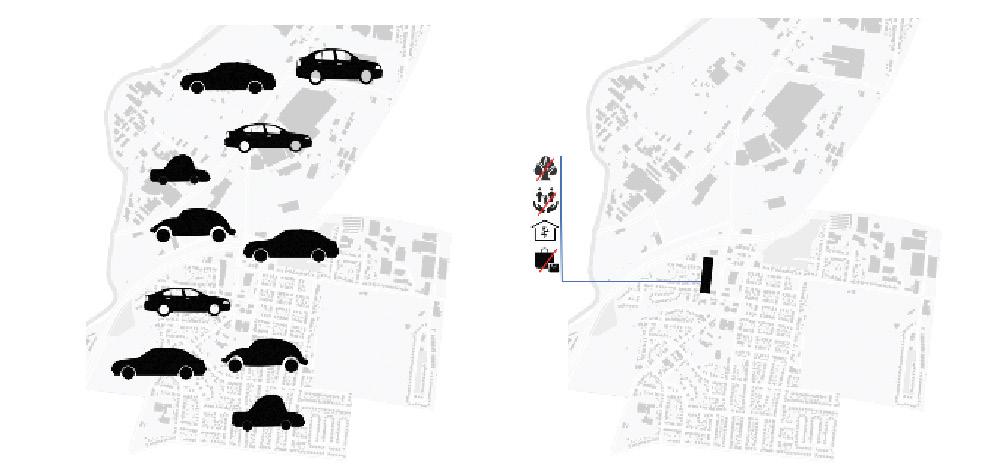
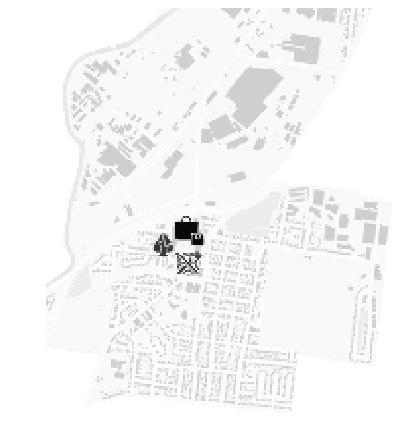
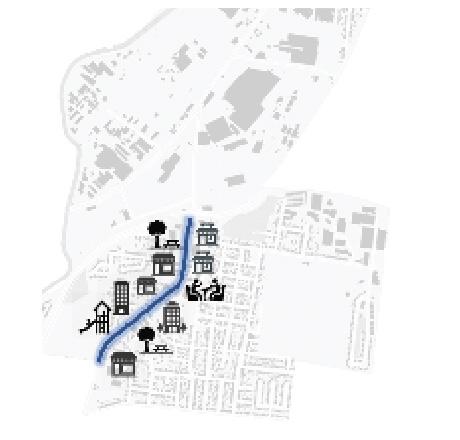
Context Analysis
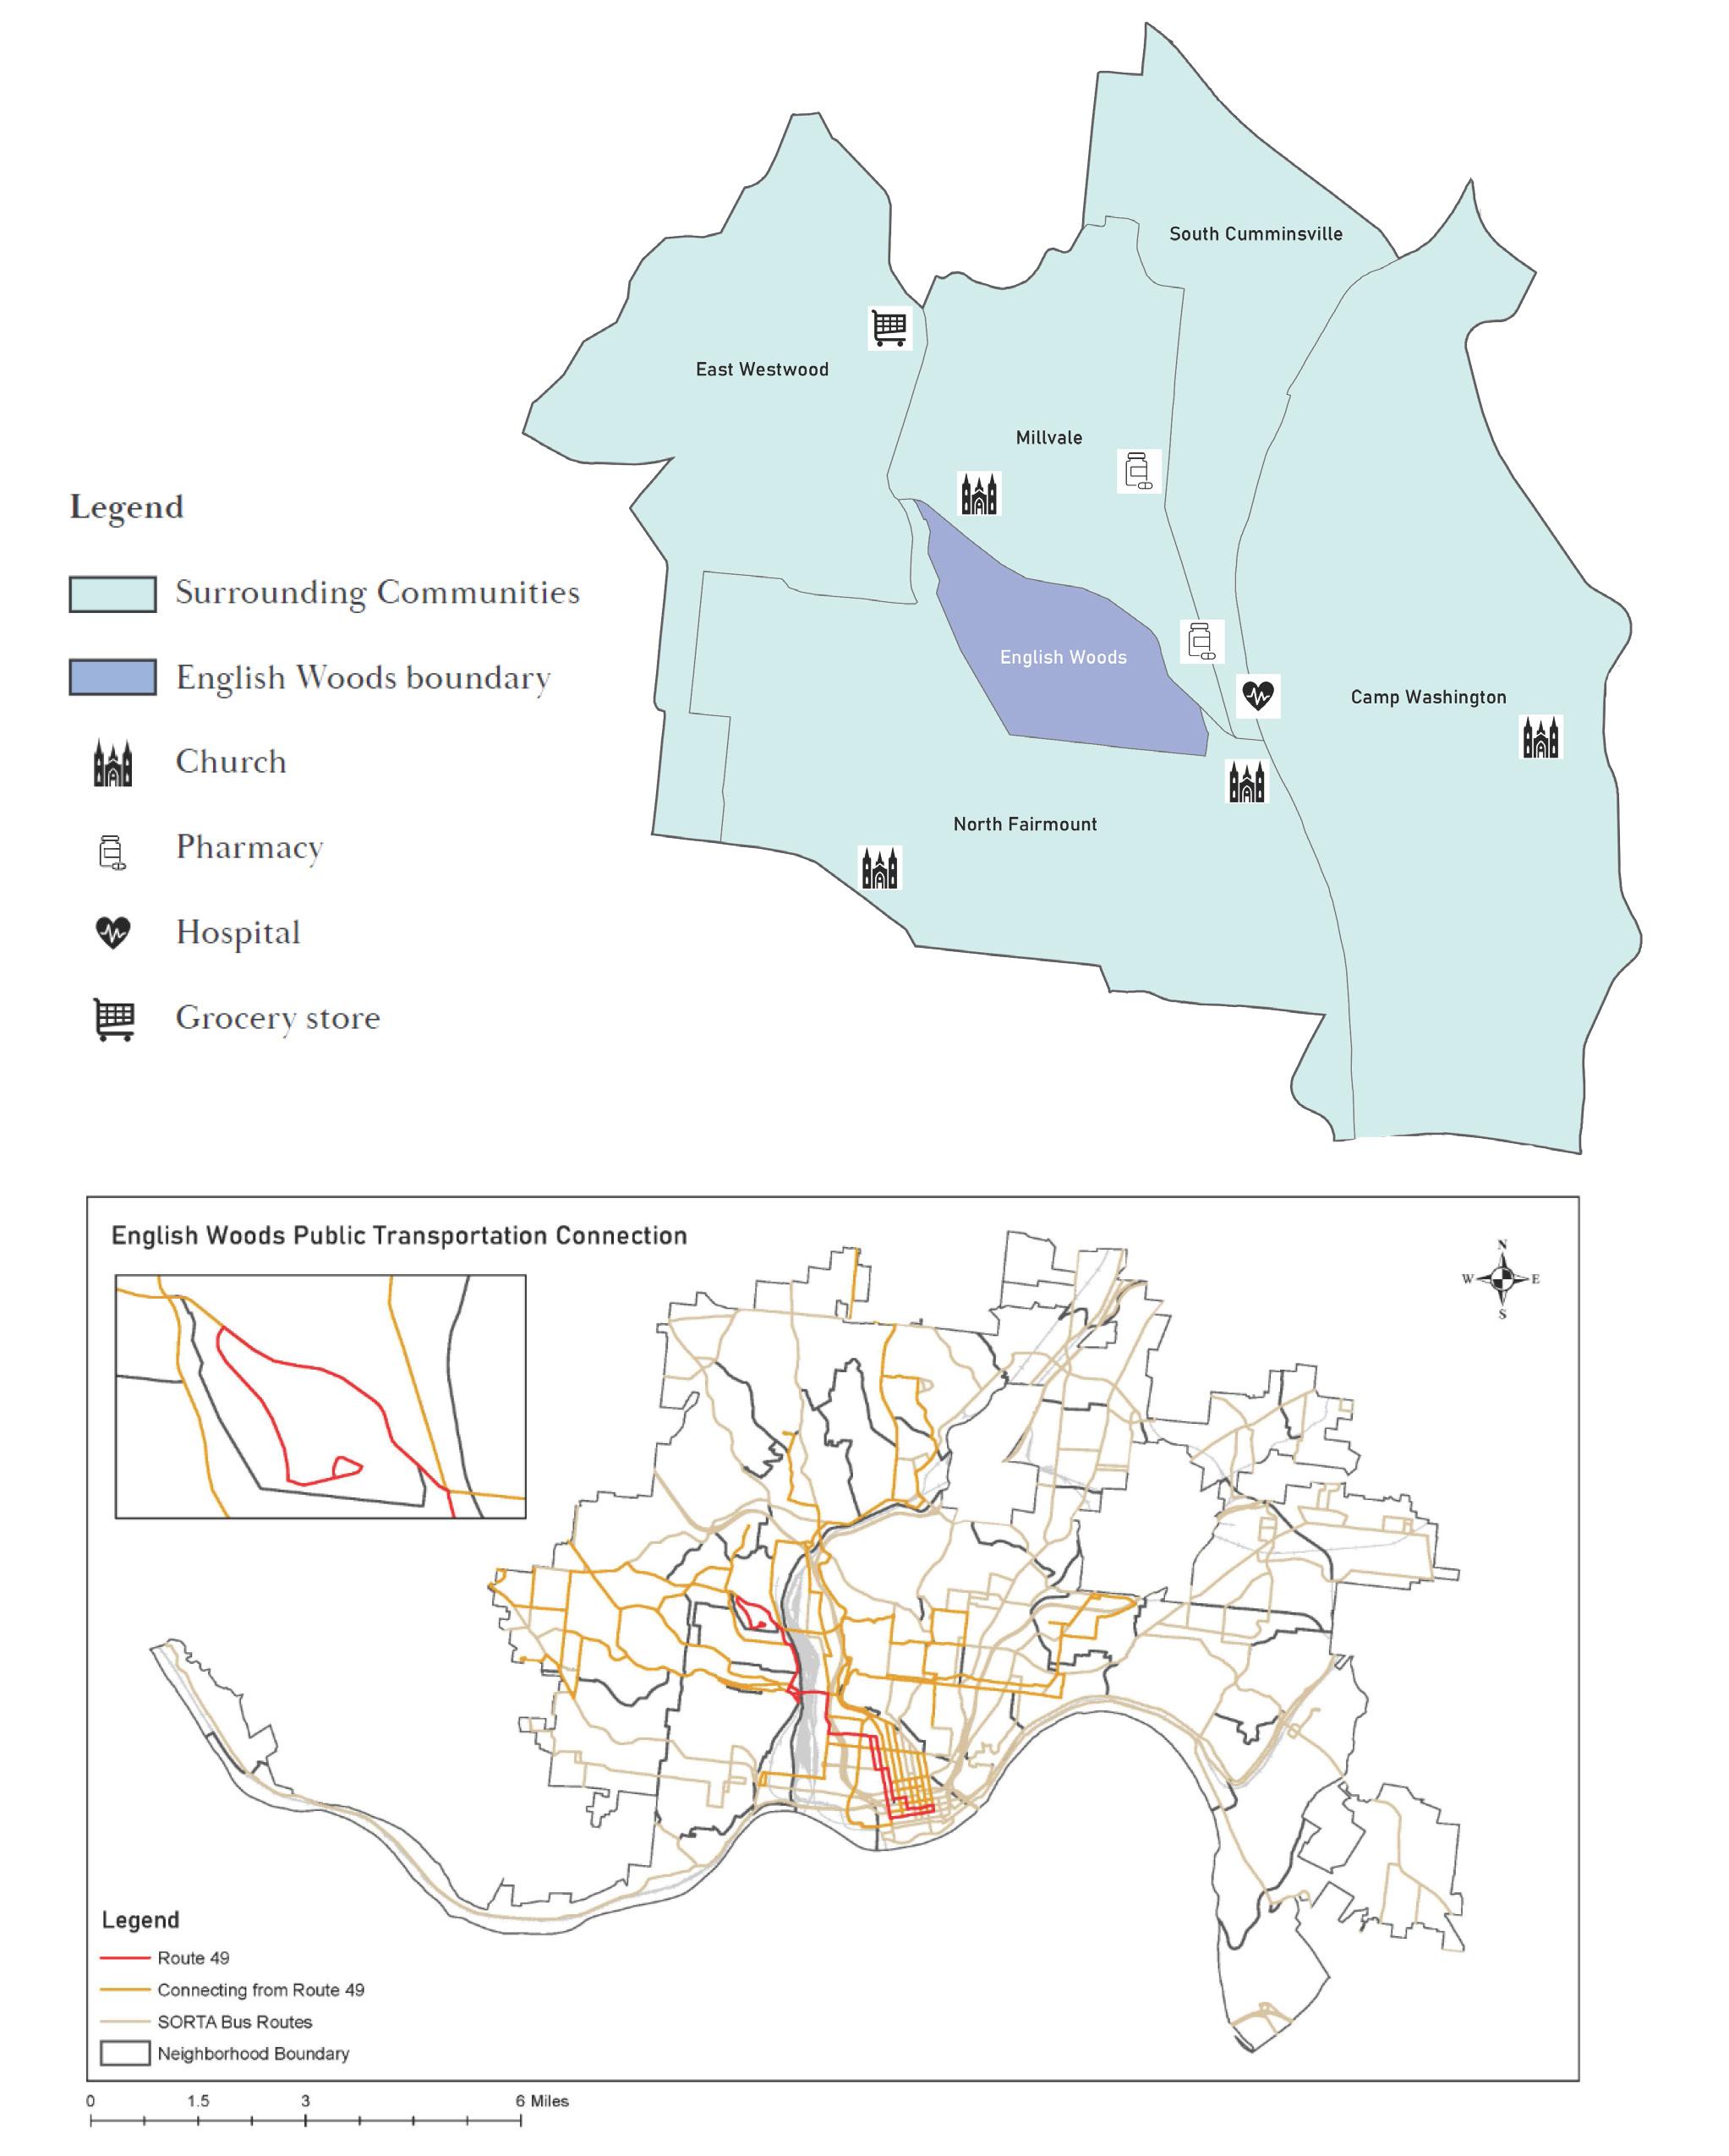
Connectivity
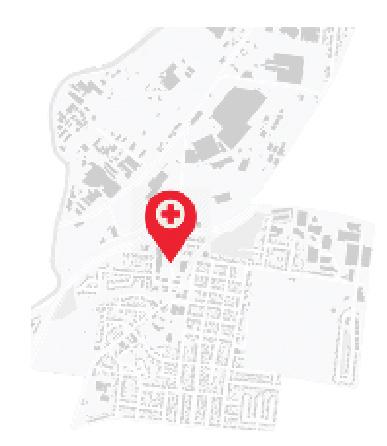
English Woods and bordering neighborhoods lack access to basic necessities due to lack of nearby assets as well as a lack of walkability. Half of the population of English Woods residents do not have a personal automobile and must rely on public transportation or delivery services. The closest stores are gas stations and corner stores that lack fresh food, which designates the site as a food desert. The two closest grocery stores are within a 15-minute drive of the neighborhood but take over 40 minutes to access by bus.
There are hospitals nearby that take under 12 minutes to reach by car but even the closest hospital, Good Samaritan takes 50 minutes to reach by bus. Route 49 is the main bus connection for the neighborhood and has 7 connecting stops to different routes, but is not time efficient or effective, as the main route primarily leads to the downtown business district which does not serve the current residents.
Both maps were created using ArcGIS and Adobe Illustrator. Bus route information came from the Esri and SORTA websites, and information for the necessity map came from Google Earth.
20
Demographics

The data shows that the residents of English Woods are at a disadvantage due to a high poverty rate, lack of educational attainment, and lack of private vehicle attainment in a community created for automobile travel. Another important statistic shows that the large majority of the residents are people of color, which asks the question of why so many POC were place in the disadvantaged community for affordable housing.
Site Analysis

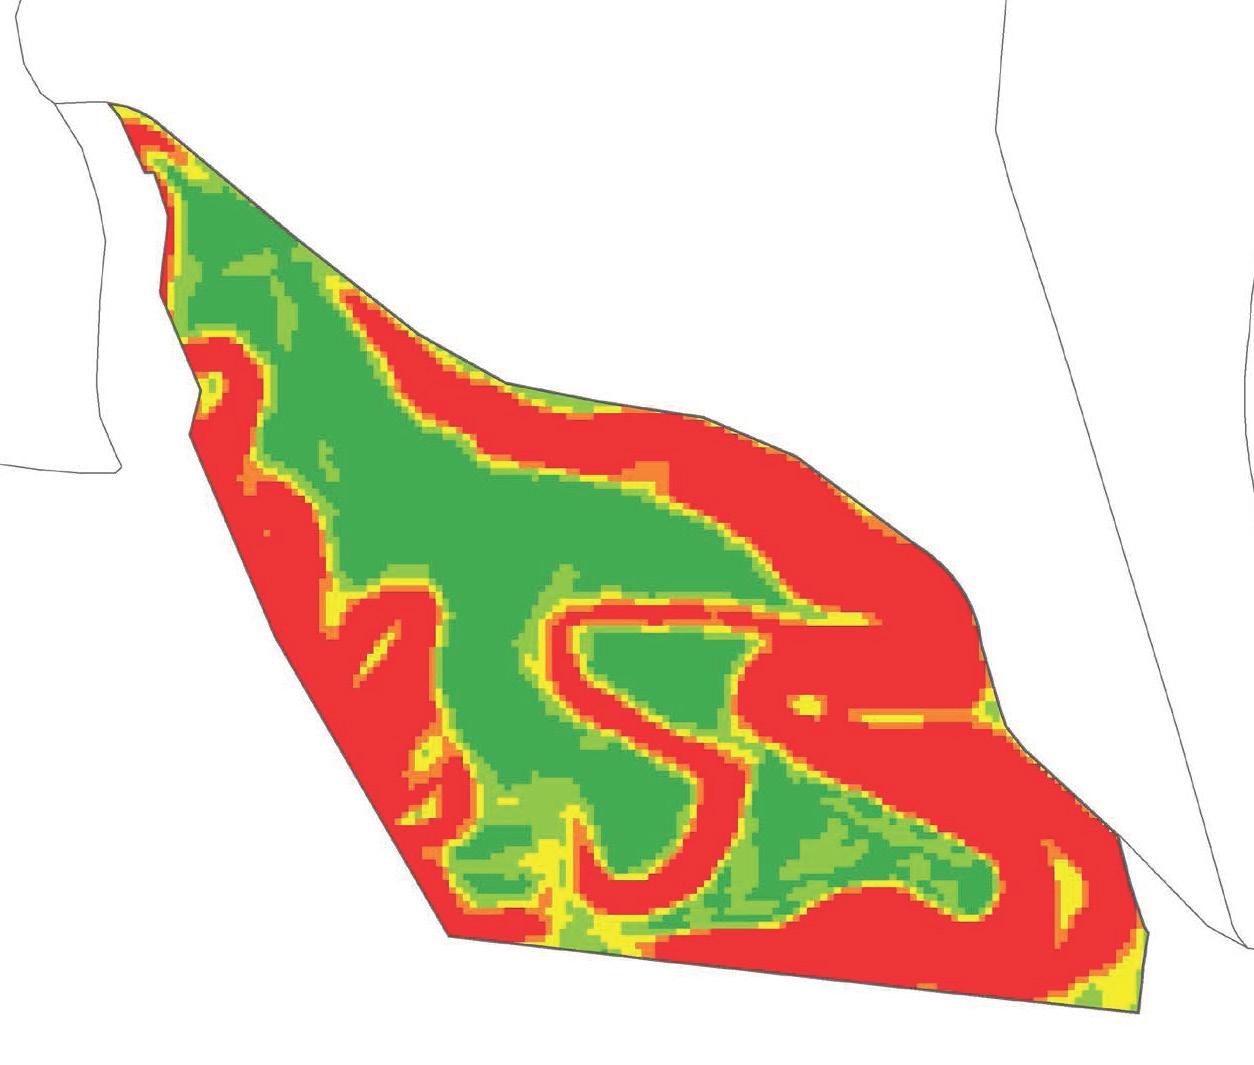
The land in English Woods are at extremes, mainly either flat or at a significant slope. Significantly sloped areas are the least desirable to be built on, but methods like cut and fill can be a solution; though we have to keep in mind that we need to limit development in order to keep the hillside stable. Planting trees or creating a barrier to contain the neighborhood soil from slipping may be desirable with increased populations needing more development. This map. This map was created in ArcGIS with slope data from USGS.
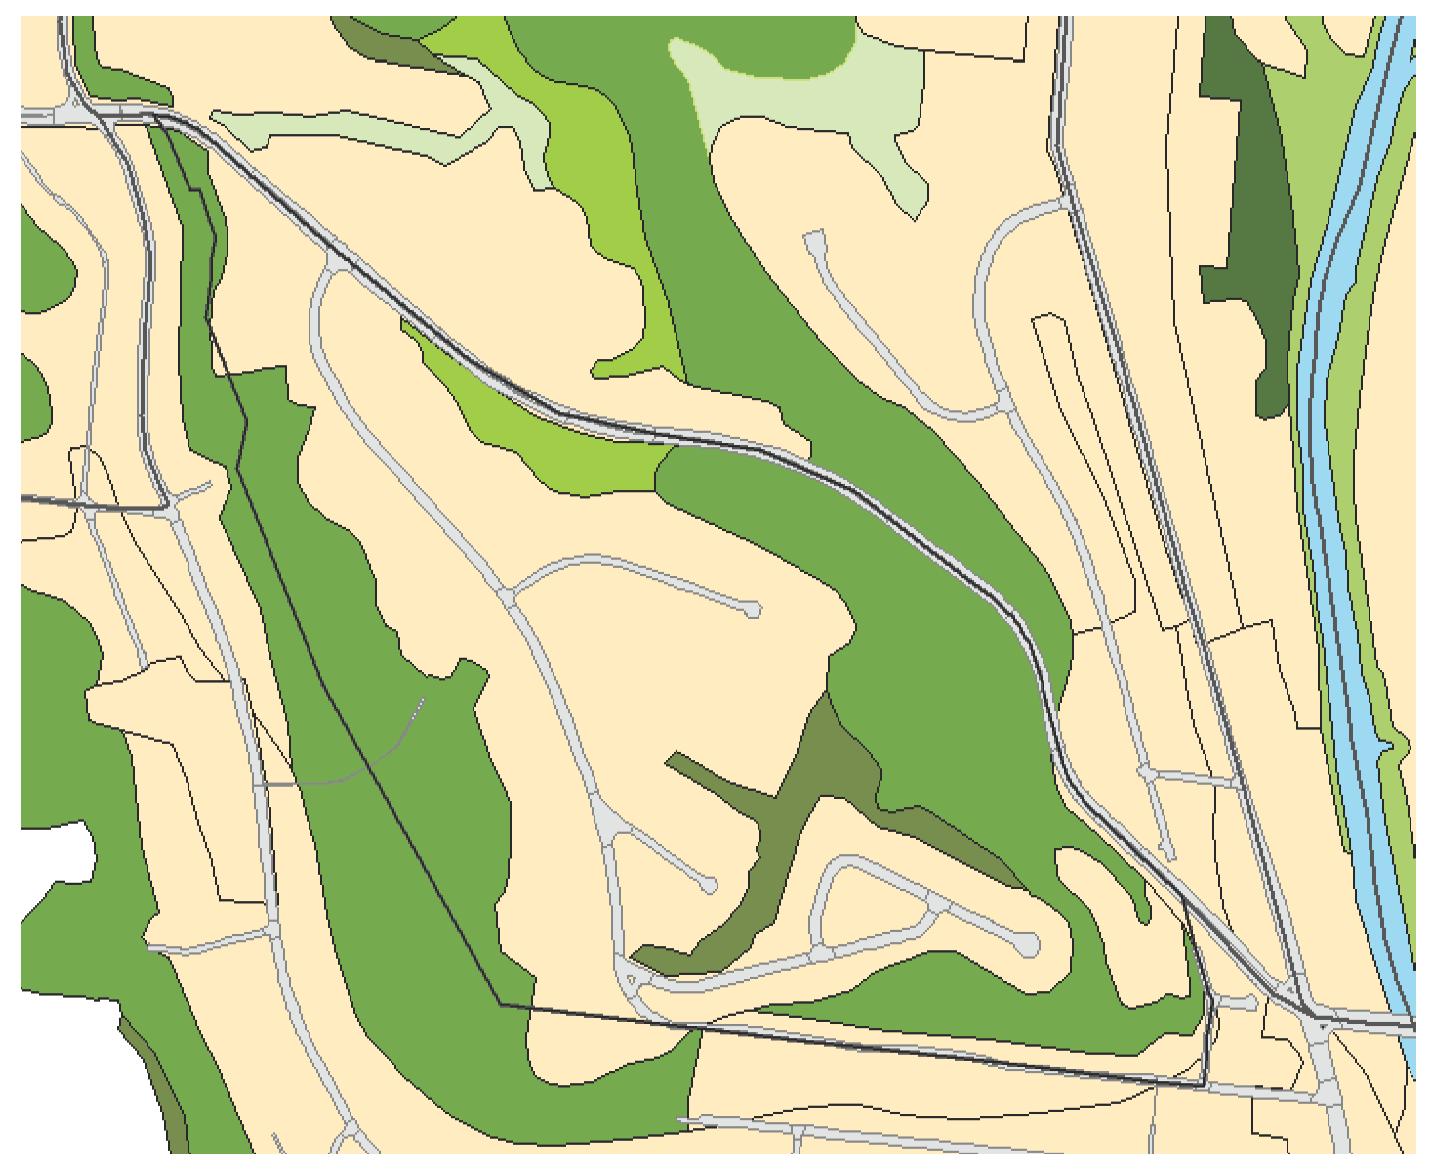
There are two main types of soil in English Woods, previously developed soil is classified as urban land. The surrounding soil is mainly a silty loam soil with clay mixed in. I break down the three classifications of loam soil by the steepness of the slope in the area; as both are conditions that would affect what could be built there. This map was created in ArcGIS and utilizes data from the NRCS/USDA ‘Web Soil Survey’ website.
21
>5% 6-10% 11-15% 16-19% <20% Urban Land,
Low Slope Silt Loam, Moderate Slope Silty Clay Loam, Steep Slope Silty Clay Loam, Low Slope
Site Analysis
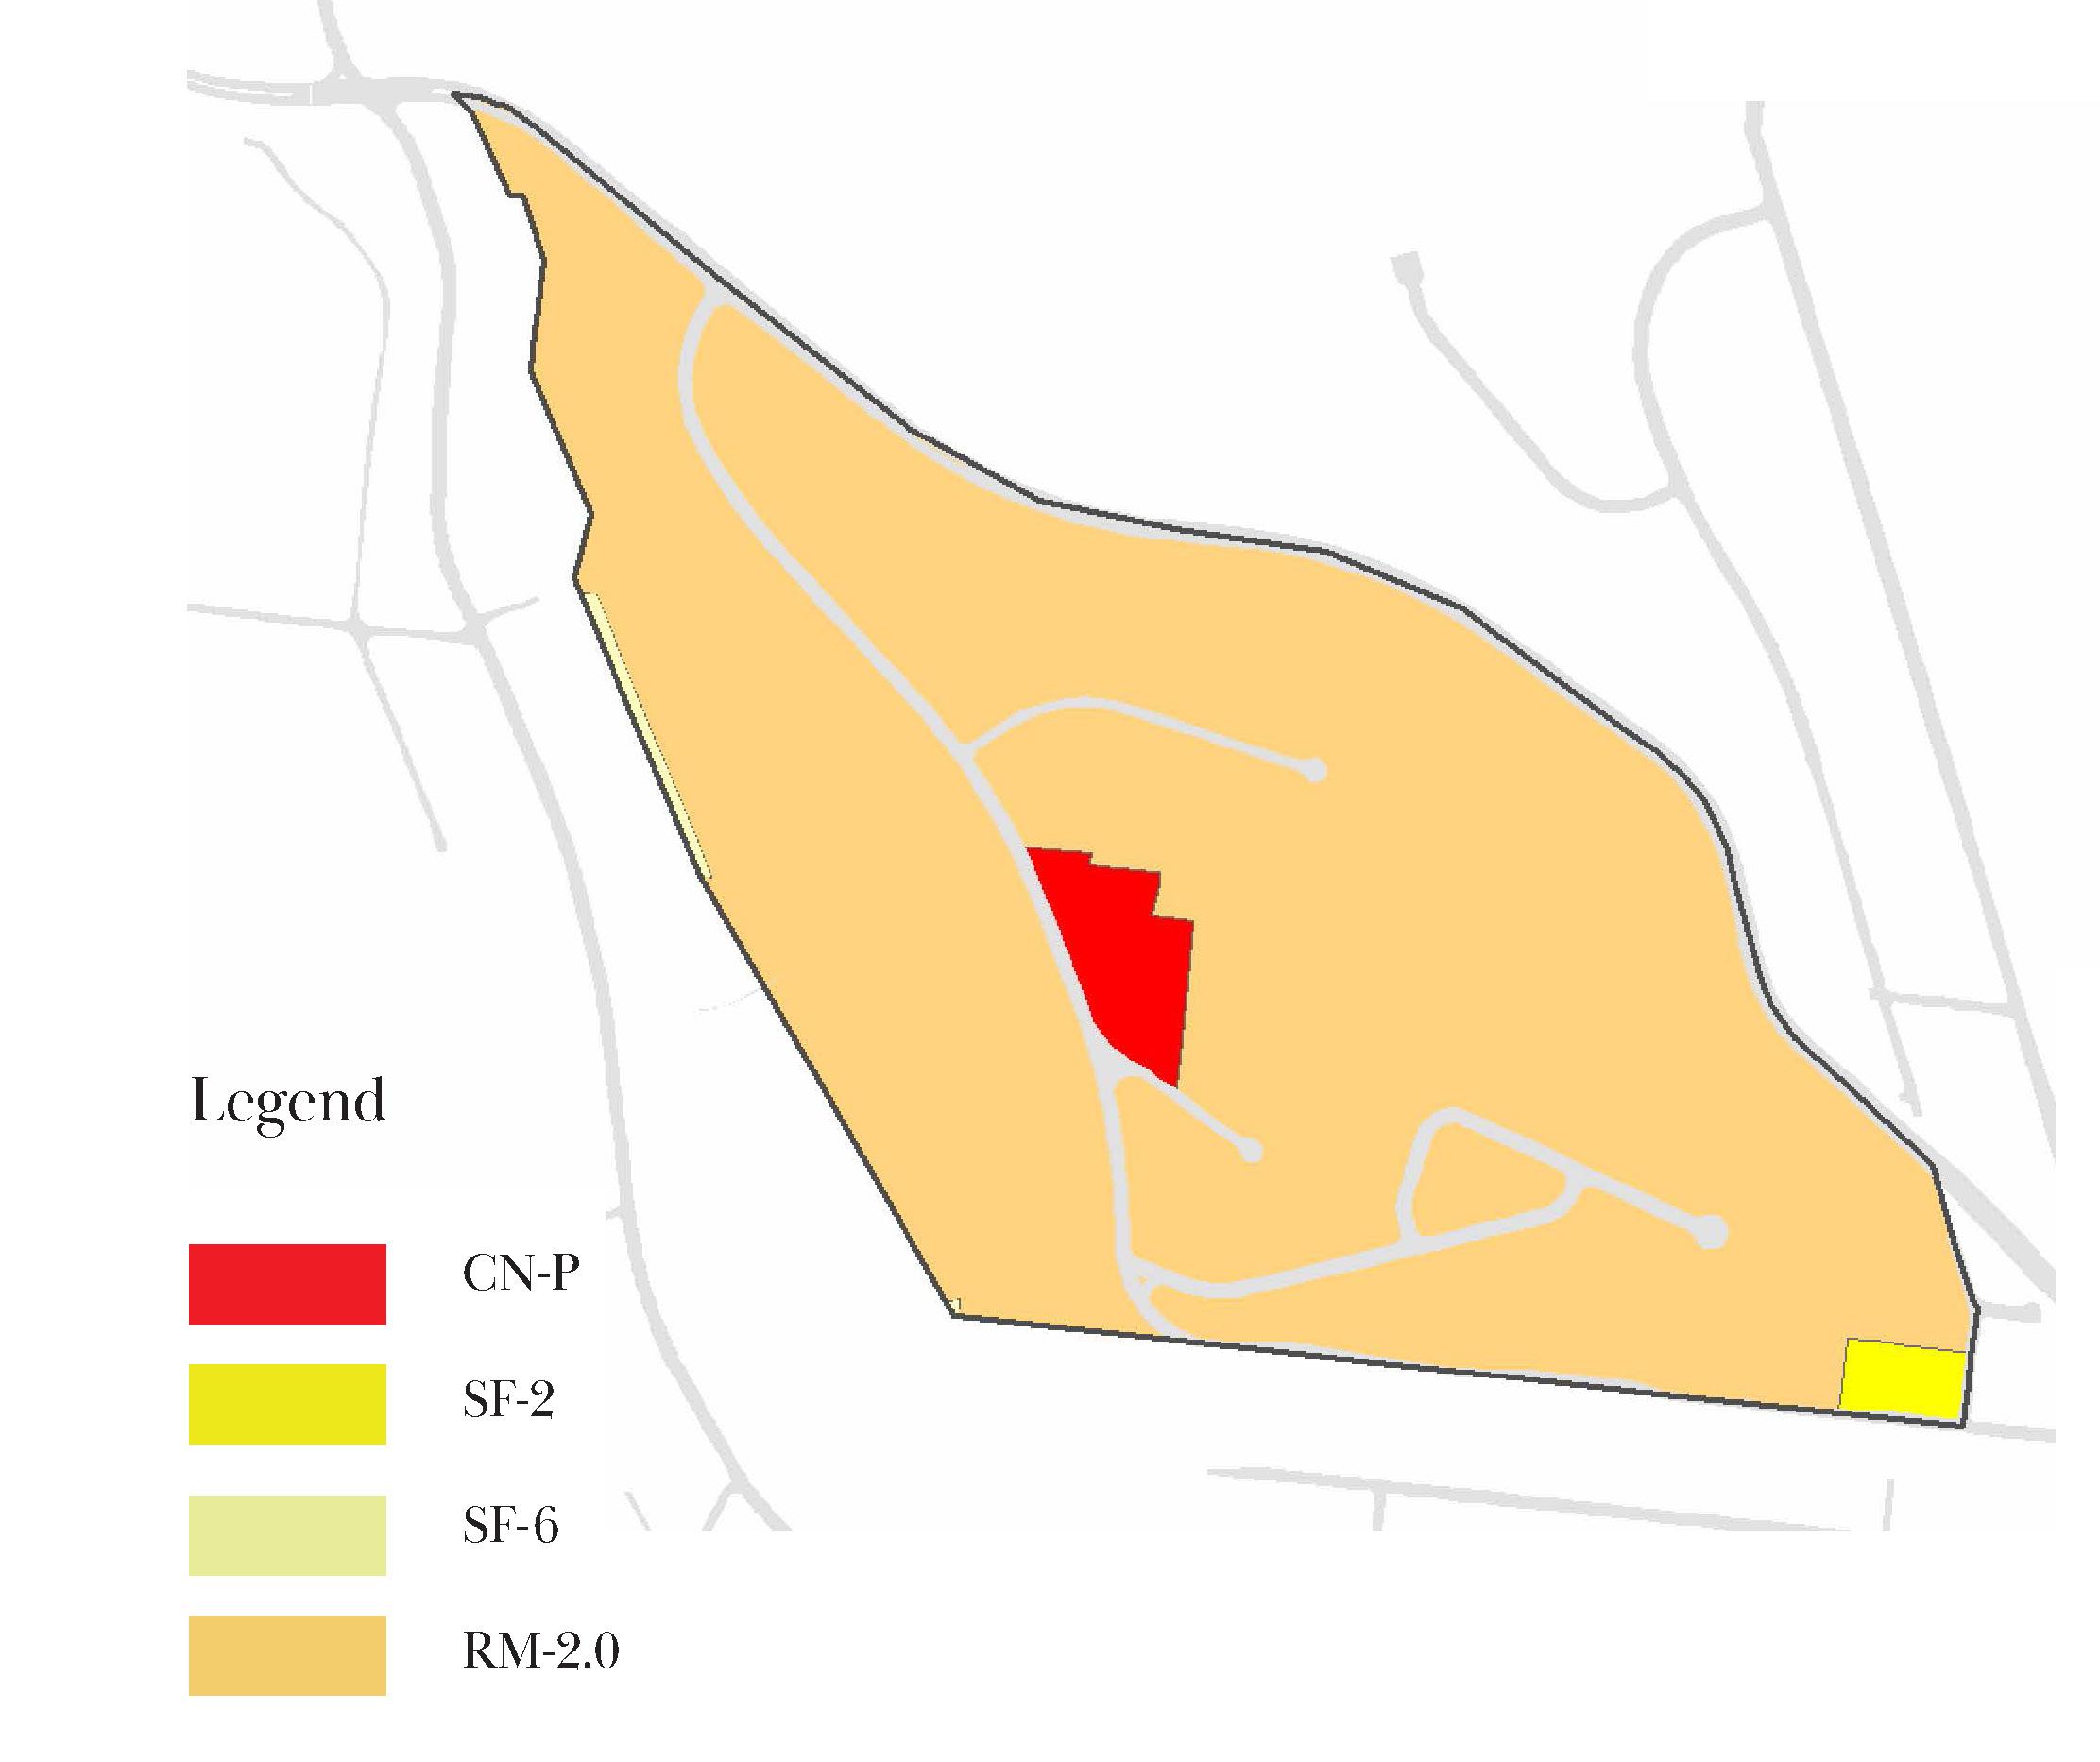
Zoning
The four main types of zoning within the neighborhood is CN-P (Commercial Neighborhood District), RM-2.0 (Residential Multi-Family), and SF 2 & 6 (Single-Family).
The majority of the land has been designated for multifamily development, which isn’t suprising as it has been a historically mixed-use affordable housing neighborhood. With this in mind, as well as the need to provide 400 new units of housing as well as rehousing those in the Marquette Manor tower as parameters for this project, it would be smart to keep the majority of this neighborhood as mixeduse development. This map was created in ArcGIS with data from the Hamilton County GIS data server.
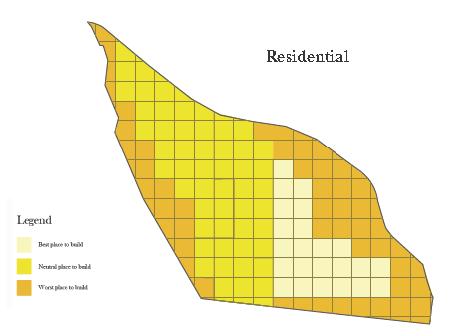
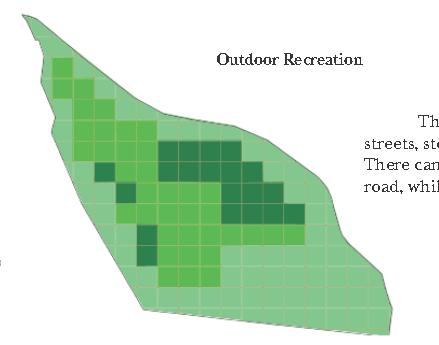
Suitability Analysis
• The best area for residential development is from the right side of the site to Sutter Avenue.
• The best area for outdoor recreation is around moderate slopes and flat vacant parcels.
• The best area for commercial development in English Woods is mainly along the left side of the site, with a large area of opportunity in the upper north, middle, and a small portion to the south.
With these findings in mind, the zoning of the site will need to change for development. The community must plan the most developable land wisely, as it is limited by the steep slopes of the hillside.
22
CN-P SF-2 SF-6 RM-2.0
Best Neutral Worst Worst Neutral Best
Final Design
23
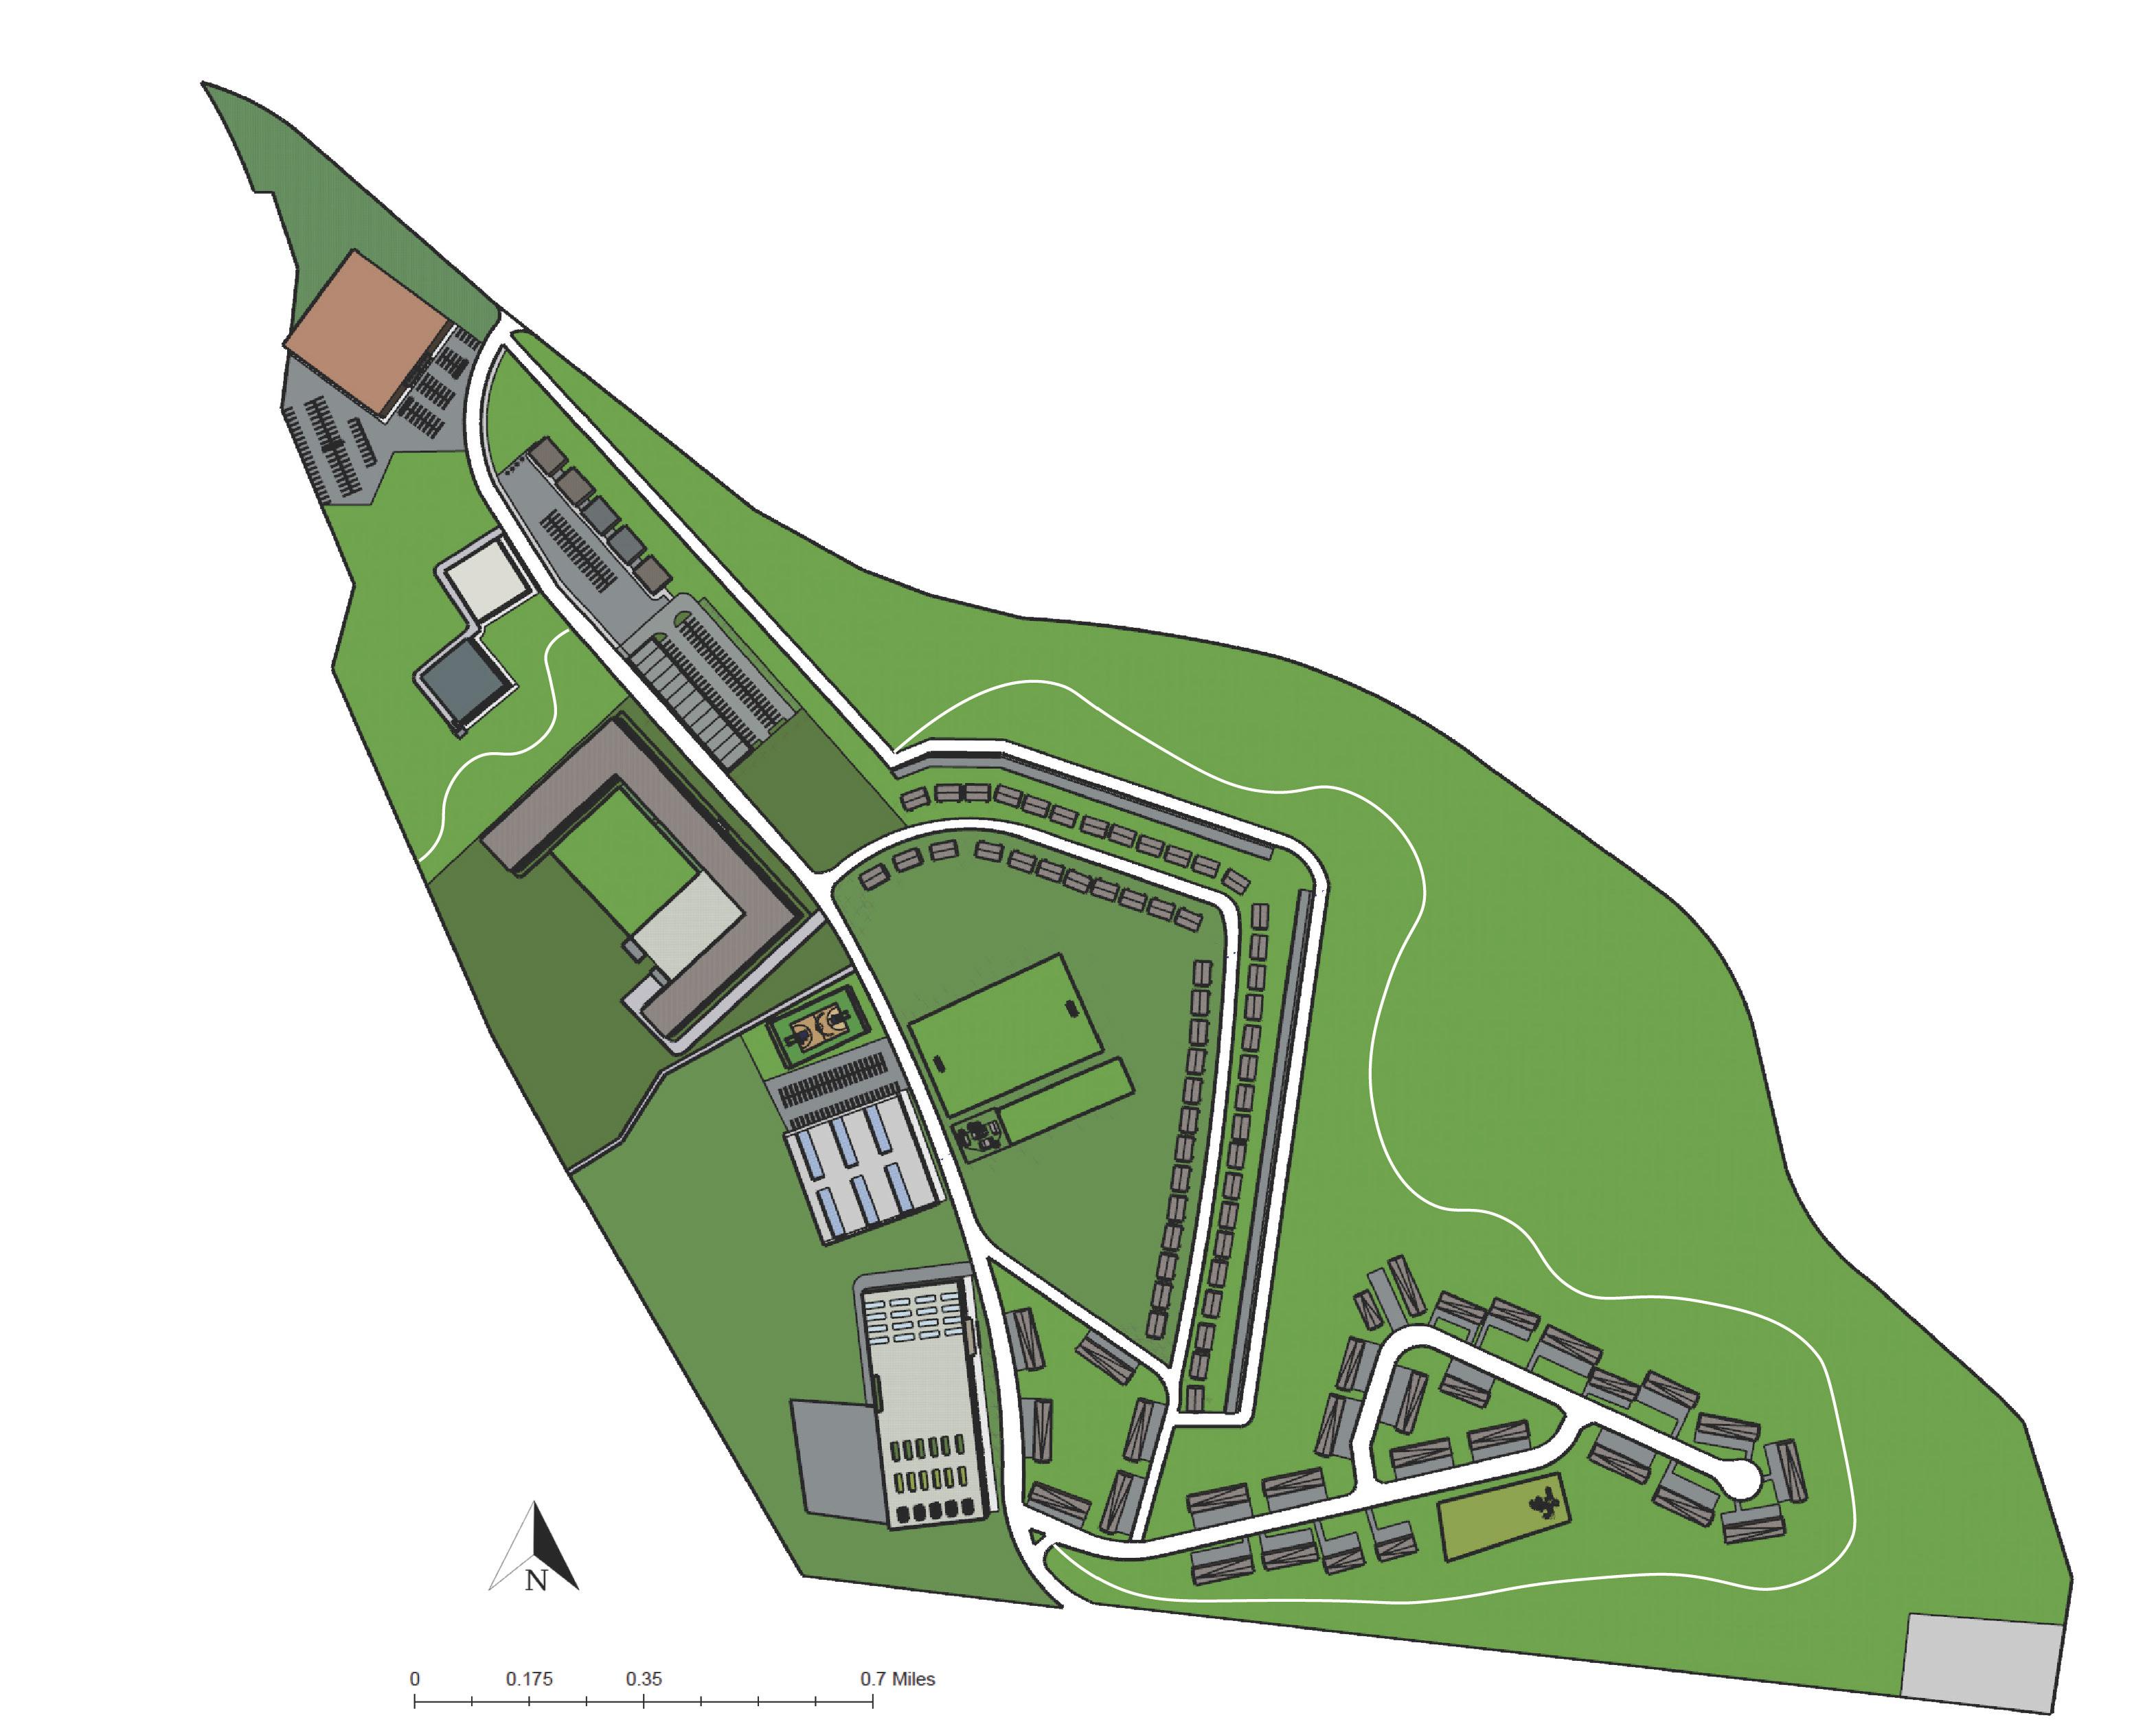
Proposed Design and Site Plan

Land Use with Gross Area
Office = 2.8 acres
Low Density Multi-Family = 9.2 acres
High Density Multi-Family = 16.1 acres
Commercial = 5.5 acres
Conservation = 61.5 acres
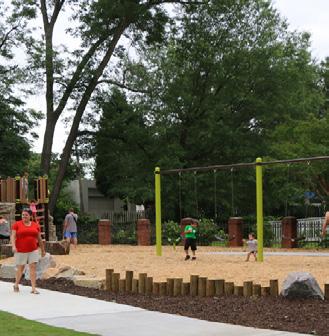
Parks and Recreation = 15.6 acres
Institutional = 2.8 acres
Mixed Use = 1.4 acres
Trails = .12 acres
24
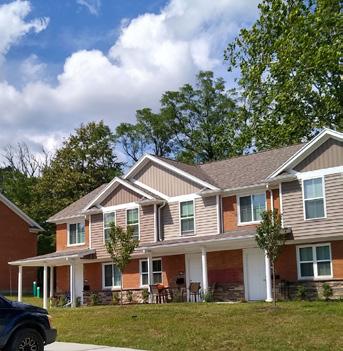
Create seven additional six unit row houses to the current CMHA housing area, as well as a fenced in greenspace with a playground.
26 units above retail space. Units will be 1,000 sq ft. Residents will park behind the units and enter through the dual space.
54 duplex units, housing 108 families. Garages behind the row of houses to park. The duplex section will face the open greenspace.
School CMHA Playground Recreation
Replacing Marquette Manor, unit will be 800 sq ft. in size. 5 floors, 40 units per floor. Commons will sit on top of parking garage. There will bike parking, a fenced rec areas.
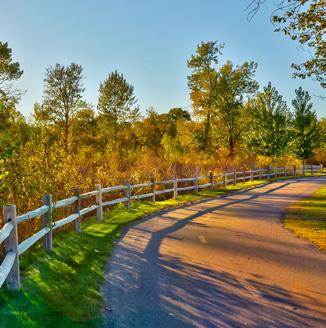
Trails and Stairs
The center is 30,000 sq ft. and has a parking lot that can house 61 cars. Basketball court on the opposite side of the parking lot and across the road there are other outdoor recreation spaces.
130,000 sq ft. per floor and be two floors tall. Create vocational spaces, as well as public school education. Underground parking, garden and solar panels on roof.
Small playground addition to empty space in neighborhood.
Trails along nature preservation area looping around the residential half of the site. A renovation of the Merrell Avenue stairs is also needed.
Office Space Commercial Strip Grocery Store
40,000 sq ft., store parking lot has 102 parking spaces and multiple cart corrals. Provides for EW and border neighborhoods
Two new 10,000 sq ft. buildings. One is 48 feet tall and 4 floors tall. The second unit will be 30 feet tall and have two floors.
5 restaurants, each at 2,000 sq ft. There will be outdoor seating and 36 parking spots.
25 Housing Mixed-Use Duplex Apartment Complex
CMHA
Commercial & Office
Recreation & Institutional
Neighborhood Analysis
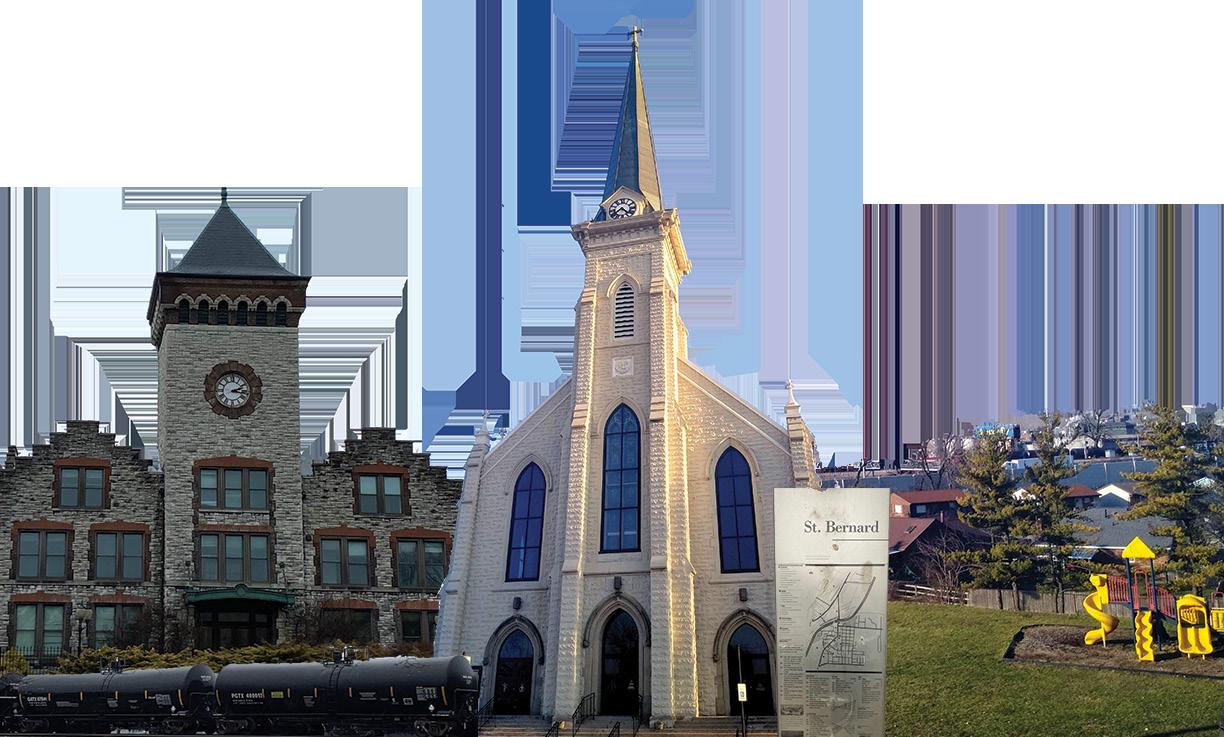
St. Bernard, OH
Introduction to the Village of St. Bernard
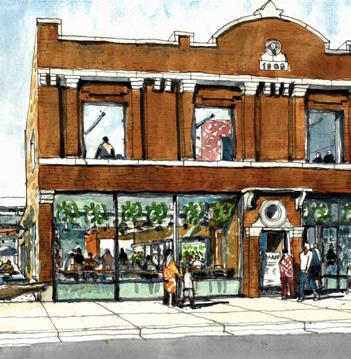
There is more than meets the eye to St. Bernard, Ohio; close to 1-75 and Vine and only 10-20-minute car ride away from Downtown. St. Bernard historically thrived due to industry located in the northern half of the neighborhood. Companies such as A. Erkenbrecher’s St. Bernhard Starch Works and the Ivory soap of Procter and Gamble, had a big impact on the community.
Companies like P&G are still partially located in the area today but have less of an impact on the residents of the area as they had in the past. Now, most people who work in the neighborhood do not also live in St. Bernard. In spite of that, St. Bernard remains a tightknit community, where most residents have lived in their homes for many years. There is a small-town quality to the village, when walking into a small business it seems that most people are on a first name basis with those who work there. St. Bernard is located in the middle of the city area but are independent of Cincinnati, and that is how residents would like it to stay.
27
Seperated
Saint Bernard, OH Est. 1851
Pepperidge Farm
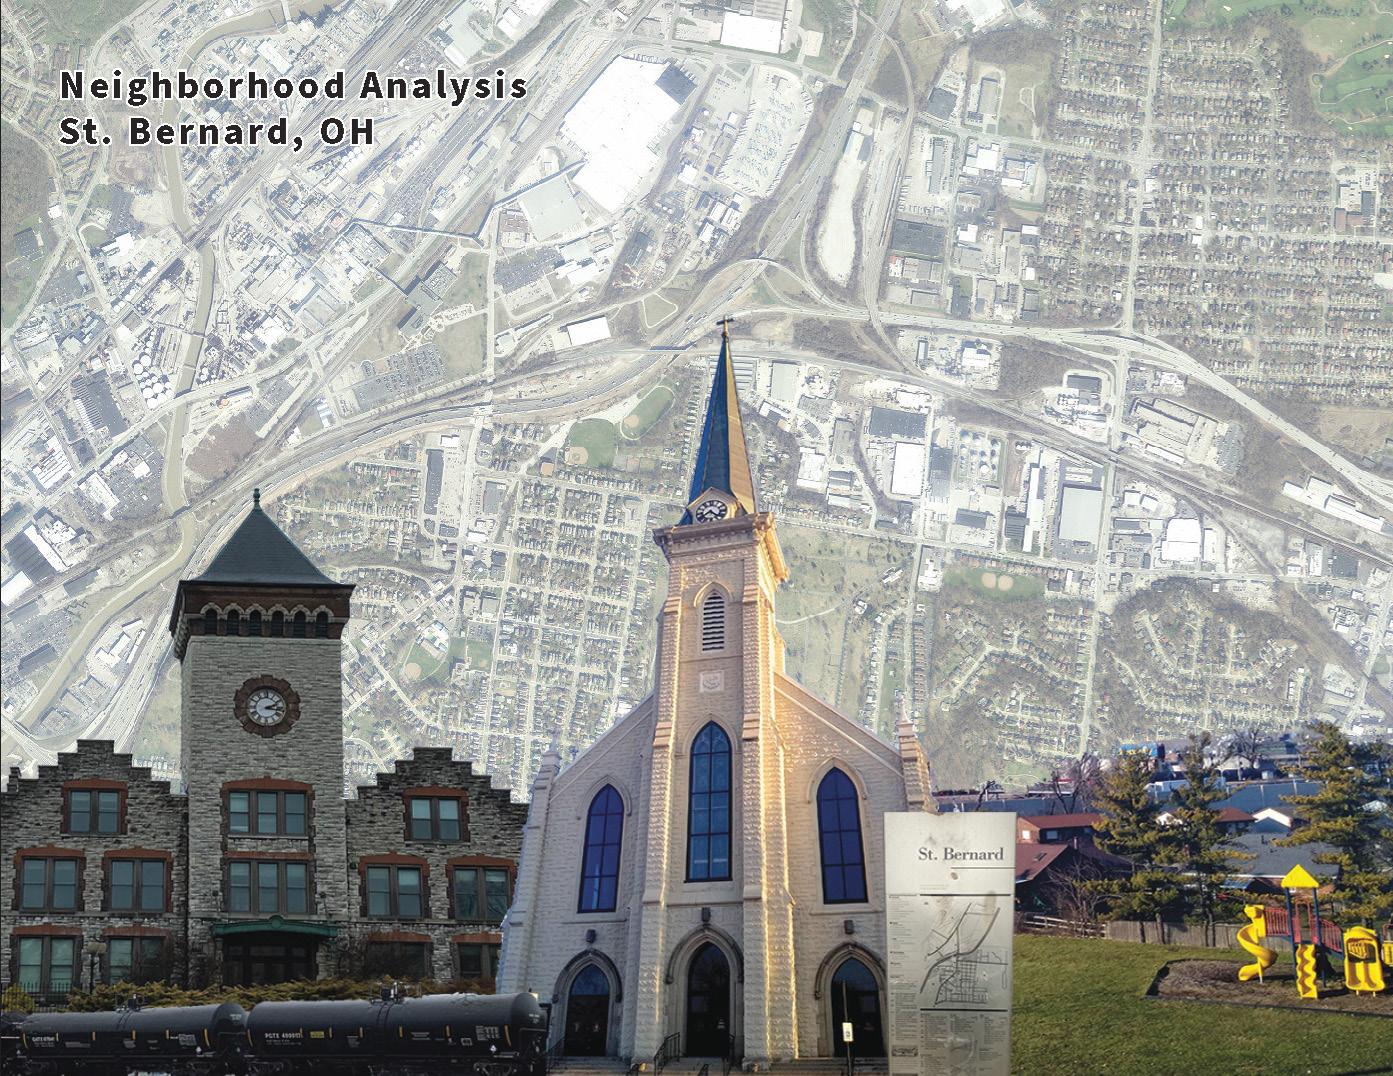
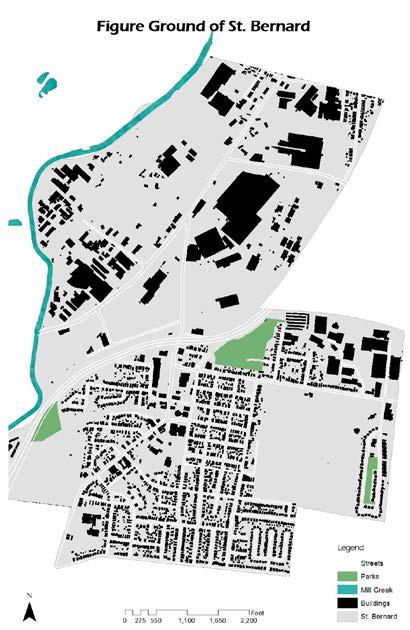
Mapping the Neighborhood
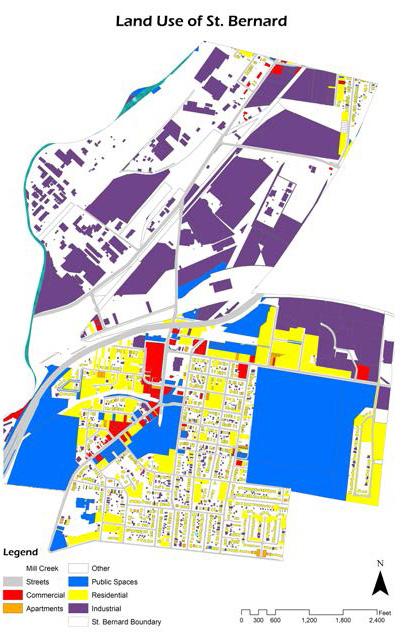
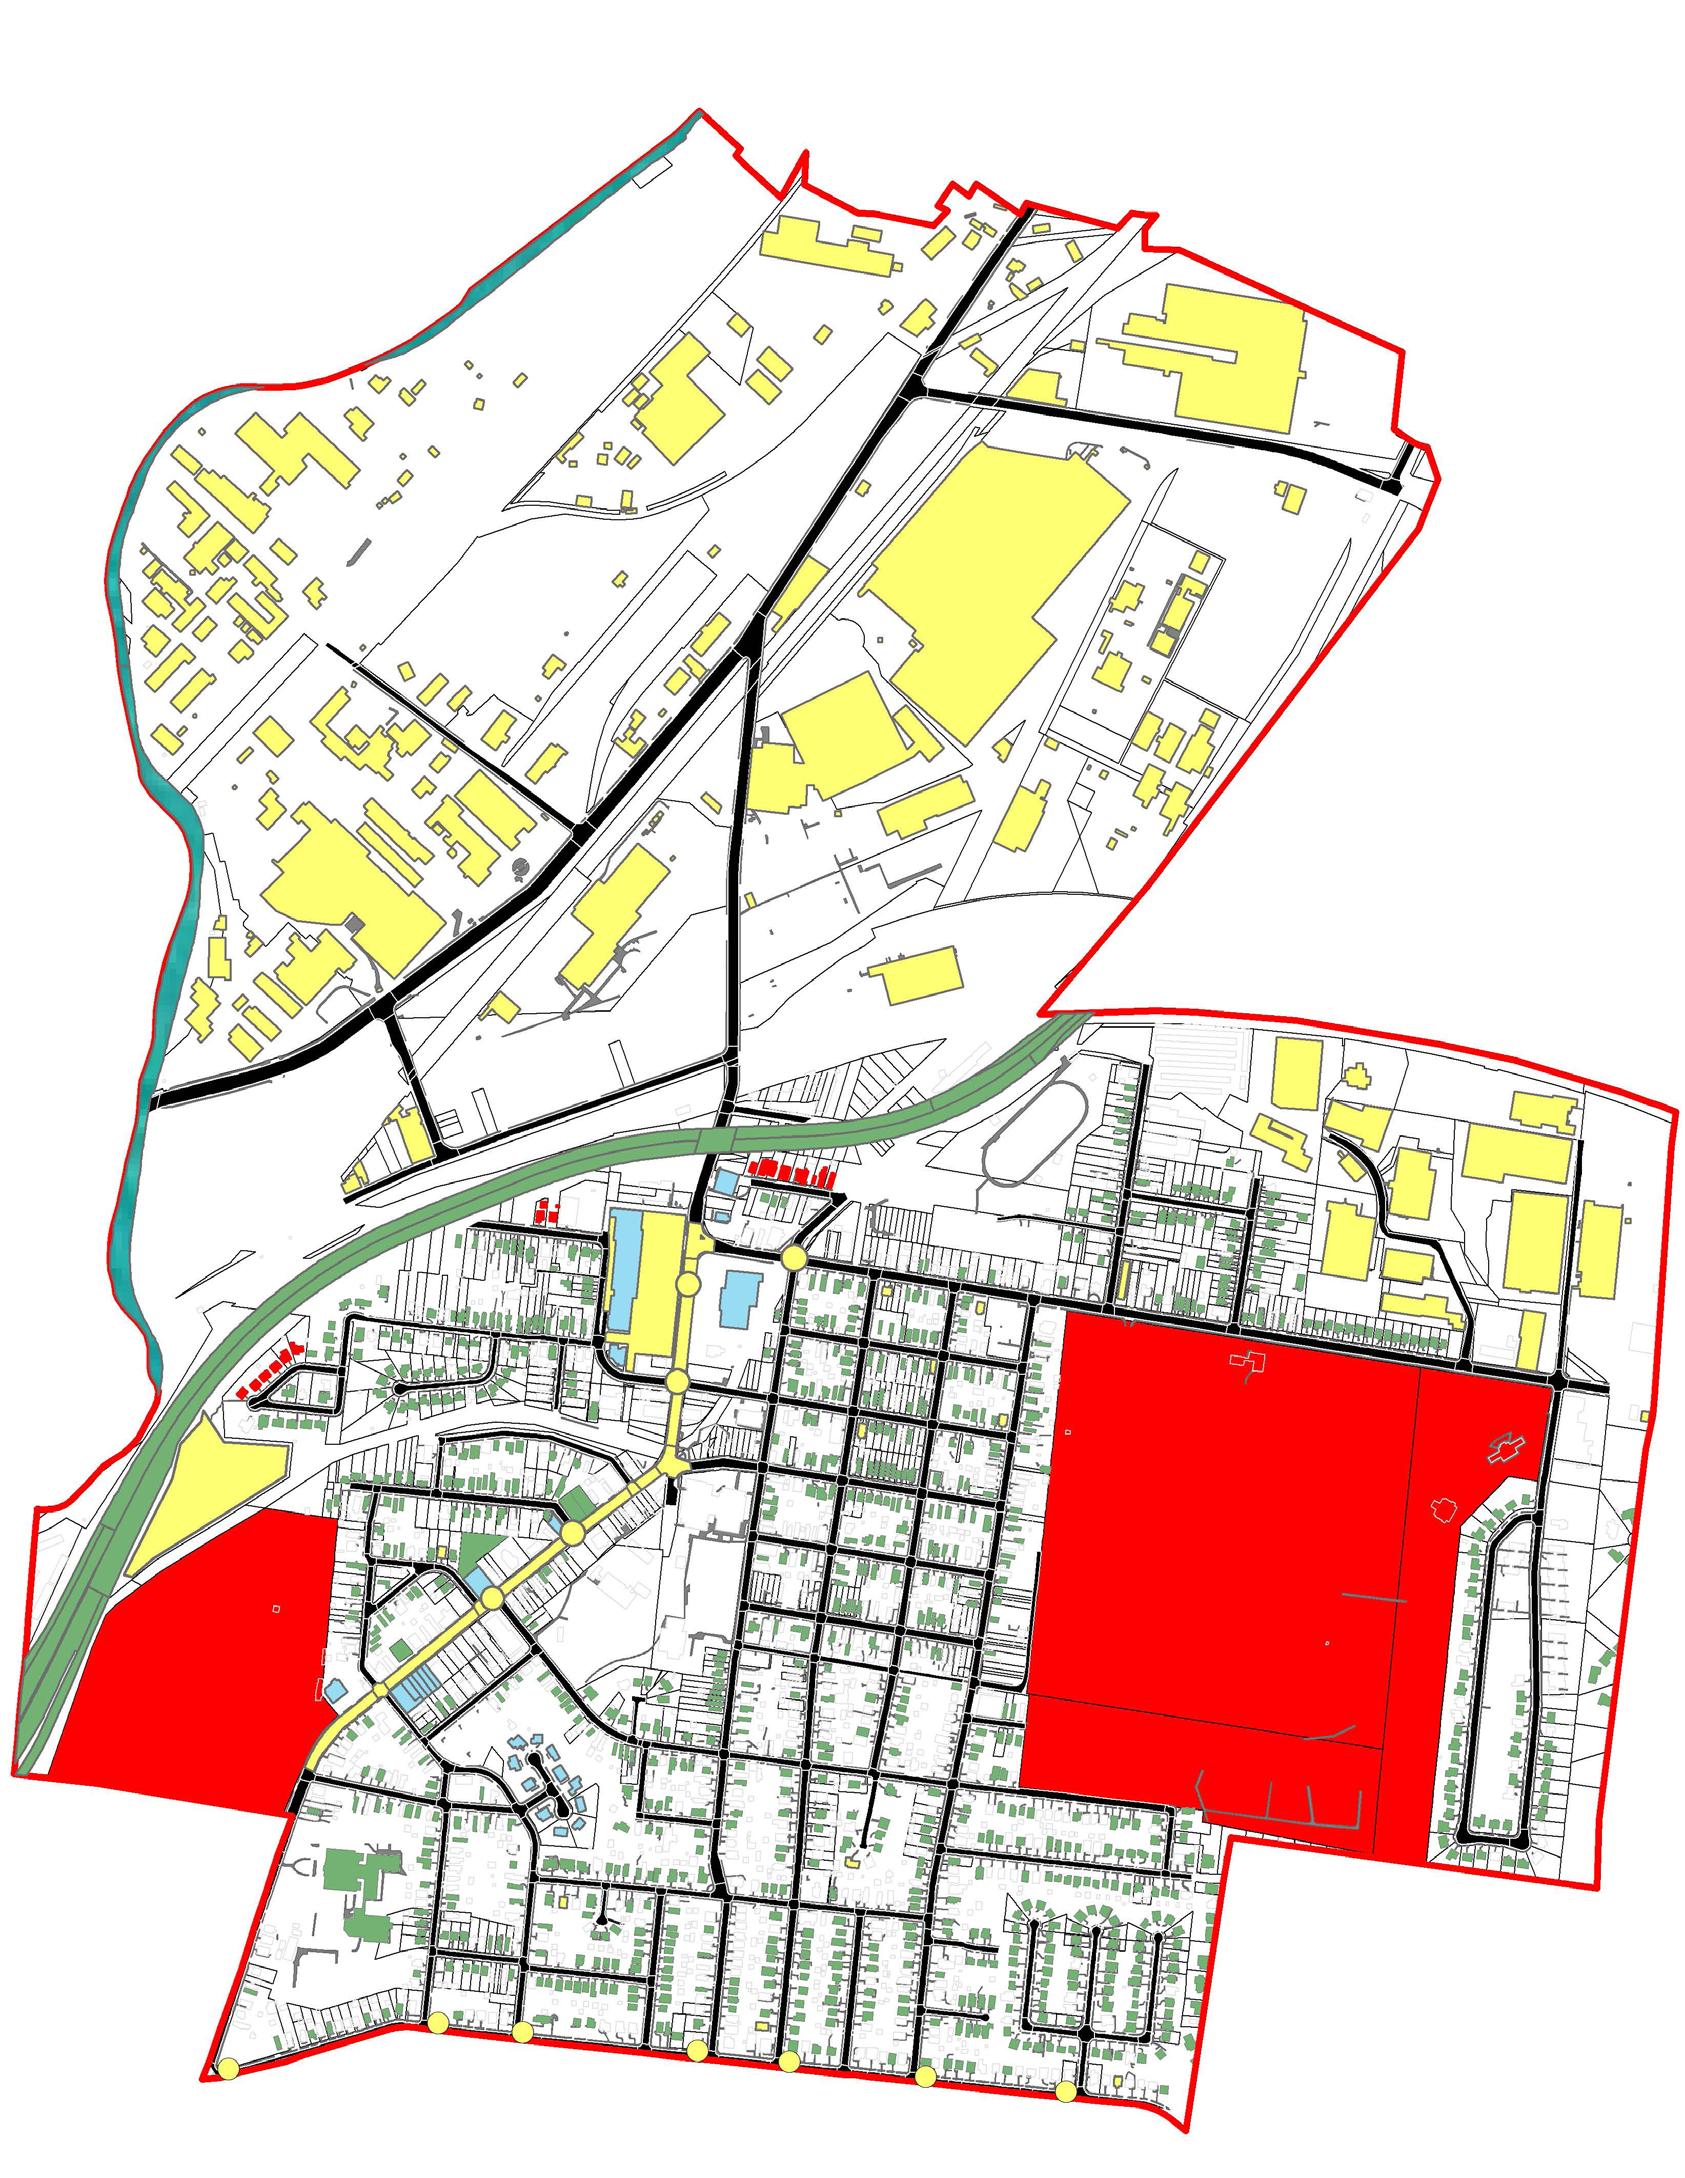
After getting to know St. Bernard, OH through many inperson site visits, I began mapping out important items such as land use, notable linkages, and inspected if the neighborhood land was being used to the best of its ability in a figure ground map. Along with field knowledge, I utilized data from the census data server and Hamilton County’s GIS data.
The figure ground map showed that there is a clear division between the northern and southern halves of the village. The northern part which consists of large businesses and industry, and the southern half is majority residential, with some mixed-use structures. These findings were reinforced in the land use map. I concluded that the land is separated by use as well as by the local highway, I-75.
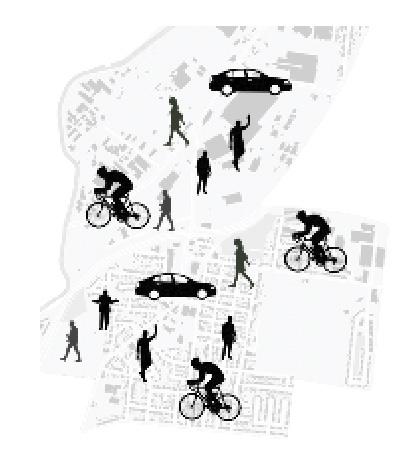
For linkages I chose three distinct walksheds to map. The first near the schools which was very walkable based on location and incline, the second was placed in another residential area which had decent sidewalks but is not very walkable due to incline and traffic, and the third was placed in the industrial half to showcase that the entire area is not walkable because there are not many sidewalks, as well as active train crossings and heavy daily traffic.
28

29
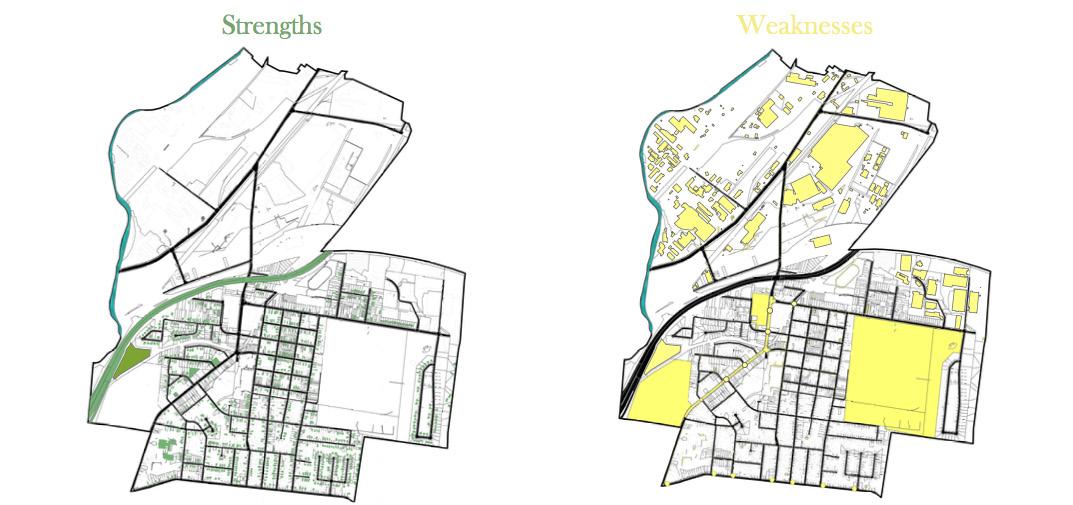
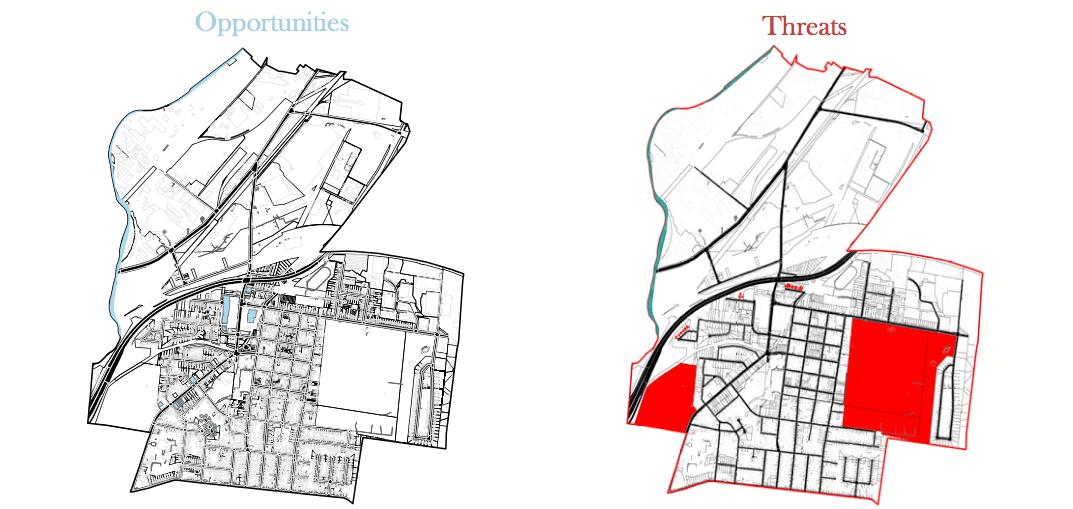
SWOT Analysis
The first step of the analysis was mapping out all of the neighborhoods strengths, weaknesses, opportunities, and threats based on quanitative and qualitative data.
After narrowing down the insights into those categories it was time to map the data in ArcMap.
Top Strength:
Tight knit but welcoming community
Top Weakness:
Lack of apartments, most of the housing stock is single or multi-family
Top Opportunity: Available parcels of land along Vine Street and along the Mill Creek
Top Threat:
Landlocked by surrounding neighborhoods, 1-75, and the Mill Creek, and cemeteries in neighborhood
30
Breakdown of SWOT:
Strengths:
• Tight knit but welcoming community
• Limited vacancy in housing stock
• Promotes walkability and bikeability in residential areas with good sidewalks
• Free public parking lots
• Good circulation because of Vine Street and proximity to I-75
Weaknesses:
• Two large cemeteries take up a lot of the residential land area and can be seen from many houses
• Lack of commercial district
• Lack of bus stops
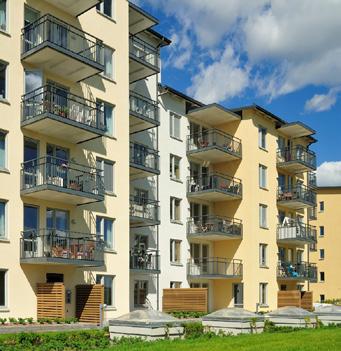
• Lack of apartments
• Lack of walkability in the northern half of the neighborhood
Opportunities:
• Available parcels along Vine Street and the Mill Creek
• Suburban feel close to the city
Threats:
• Landlocked by surrounding neighborhoods, 1-75, and the Mill Creek
• Some houses are too close to the sound barrier
31
Issues Into Opportunities

32
Inaccessibility to Health Resources Blocked Mill Creek Access Vine Street Lacking Business Vehicle Prioritized Crumbling Plaza
Prioritizing Health
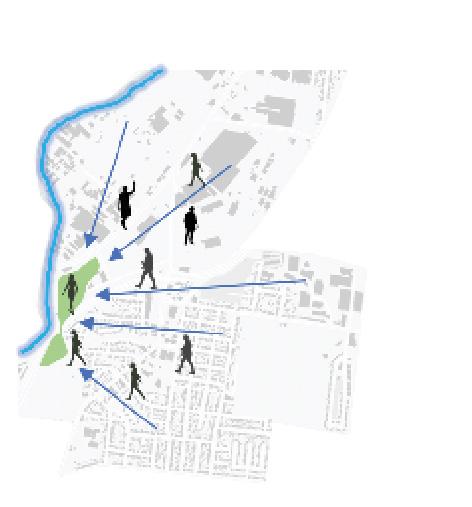
Creating Access to the Mill Creek
Attracting Business
Bring a pharmacy and a clinic in St Bernard by Vine St, in front of the proposed Plaza.
A Green Bridge, part of the Ludlow Park project. will connect the industrial side to the residential side of St. Bernard and create access to the Creek.
Walkability and Bikeability
Vine Street in the residential half of St Bernard will become a place for residents and outsiders to visit with new development
Creating Better Options
Prioritize pedestrians and cyclists by creating bike lanes and well maintained sidewalks.
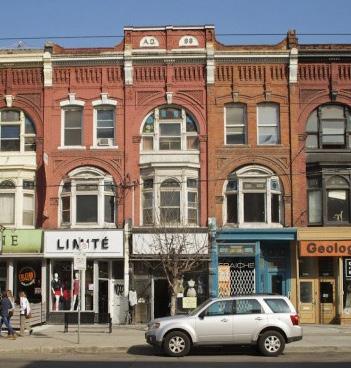
Remove the dollar stores and create a larger grocery store. Create a new plaza with different stores
33
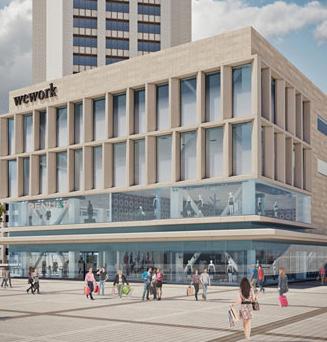
In-depth Improvement
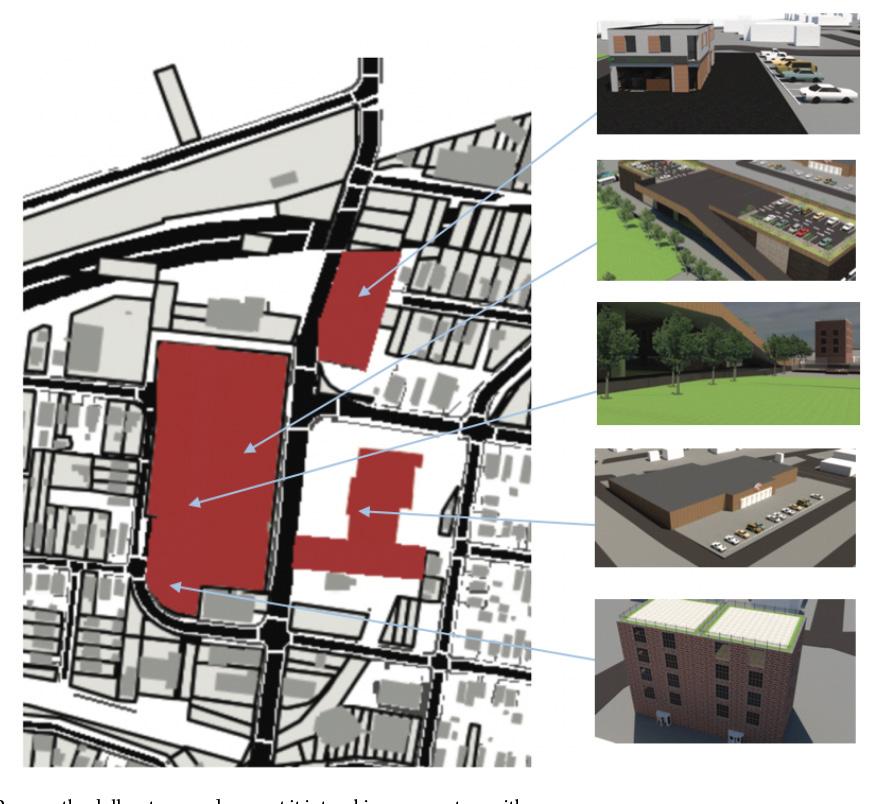
A New Plaza
The plan for the new plaza is extenesive, I proposed that we frist replace the old strip mall with a small apartment compex, as well as provide a new space for shops with an outdoor space in the middle. On the back of the project I want to provide another park for the neighborhood and allow it to serve as a buffer between the new shopping center and pre-existing housing.
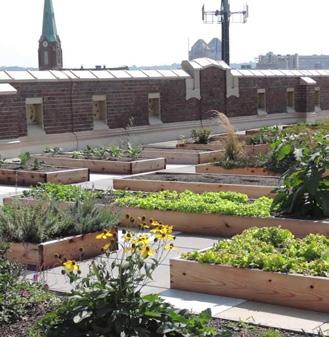
On the other side of the street I would like to expand the grocery store by removing the current dollar stores which local officials are planning to remove; as well as provide a small clinic and pharmacy on the lot of the abandonded resturaunt lot. Past the clinic a community garden would be created for local schools and community residents to utilize.
To render this project I utilized SketchUp software.
34
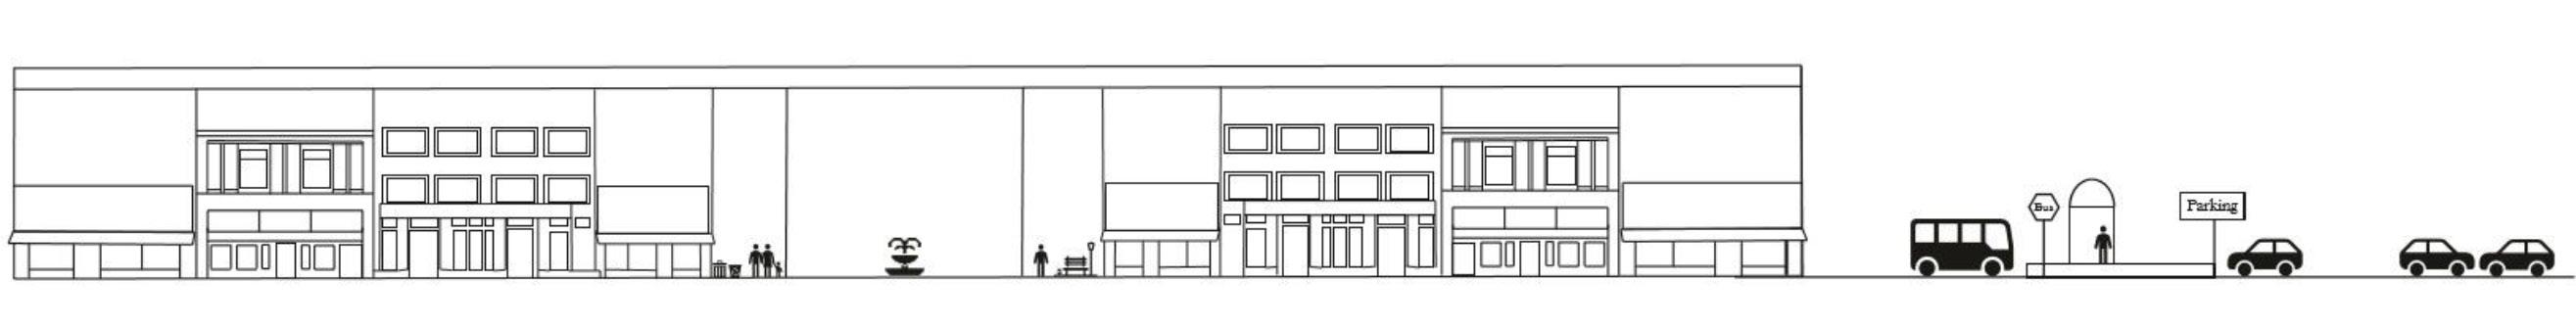
To further illustrate the proposal of the new plaza I utilized Adobe software to create elevations. Below is the proposed park space which would include a basketball court and dog park, and a small-scale apartment complex.
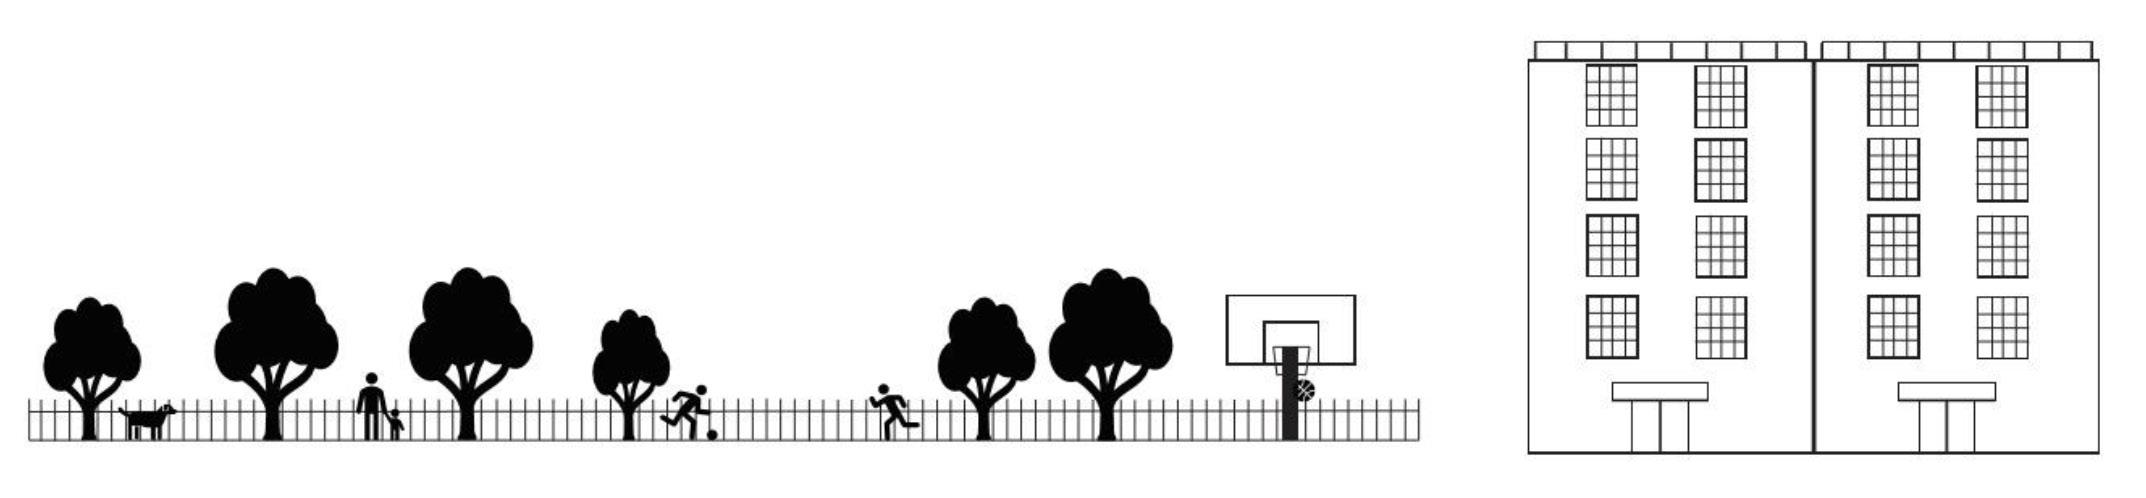
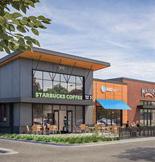
A new strip of businesses would replace the current parking lot and providing parking on top of the businesses, making the businesses more walkable for pedestrians as they are moved closer to the road and sidewalks. In the middle of the businesses is a new outdoor seating area, and a new park and ride station to be utilized for residents who would like to take the bus to work.
The community garden, clinic & pharmacy, and expanded grocery store would help ensure that residents could have their needs met from within the neighborhood, as well as provide the services to border neighborhoods such as Elmwood Place.
35
& Apartment Building Pharmacy & Grocery Store New Park & Ride Station New Businesses
Park
replacing the Old Strip Mall

Thank you. Madison DeMay (513) 917-7925 demayme@mail.uc.edu 424 Straight St, Cincinnati, OH 45219
