7 minute read
TOM! cement plant Target Operating Models Maintenance 4.0 elements Businesses impacted by the recent global crisis have been finding innovative ways to bounce back and get ready for a new normal


- MAINTENANCE 4.0 ELEMENTS TOM! CEMENT PLANT ‘TARGET OPERATING MODELS’ - MAINTENANCE 4.0 ELEMENTS
by Angus Maclean, EVP Construction & Building Materials EMEA, Proudfoot
Mr Angus Maclean
Businesses impacted by the recent global crisis have been finding innovative ways to bounce back and get ready for a new normal.
A key strategy to revitalise business and profitability is to identify ways to maximise business value. Proudfoot, a global management consulting firm that focuses on value creation through operations and digital transformation, has just launched TOM!, the next generation Target Operating Models (TOM) for business transformation. Proudfoot’s TOM! service takes approximately 20 weeks to design, develop and implement, and optimises business operations to create maximum value. Raw materials sourcing, production, maintenance, supply chain, outbound logistics, sales, suppliers, management processes and systems, strategy, and digital capabilities are all critical elements of a TOM. Cement TOMs overcome the technical, operational, financial, commercial, digital, environmental and organisational challenges, that the cement industry currently faces, end-toend, from the quarry to the client’s site. TOMs allow firms to optimise, digitise and humanise.
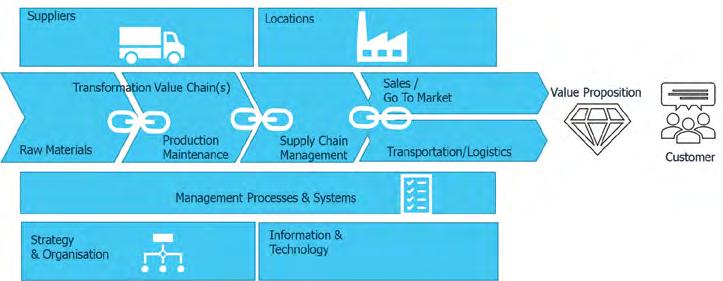
Figure 1: TOM components for an industrial firm.
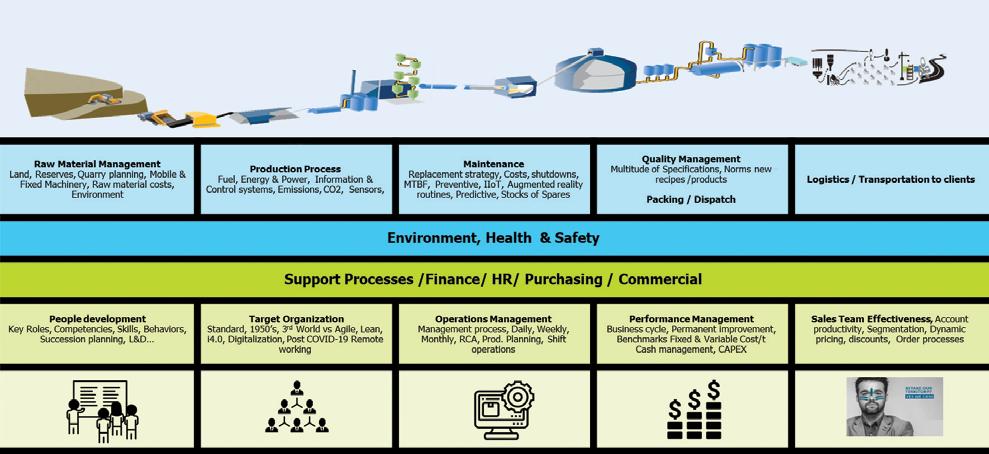
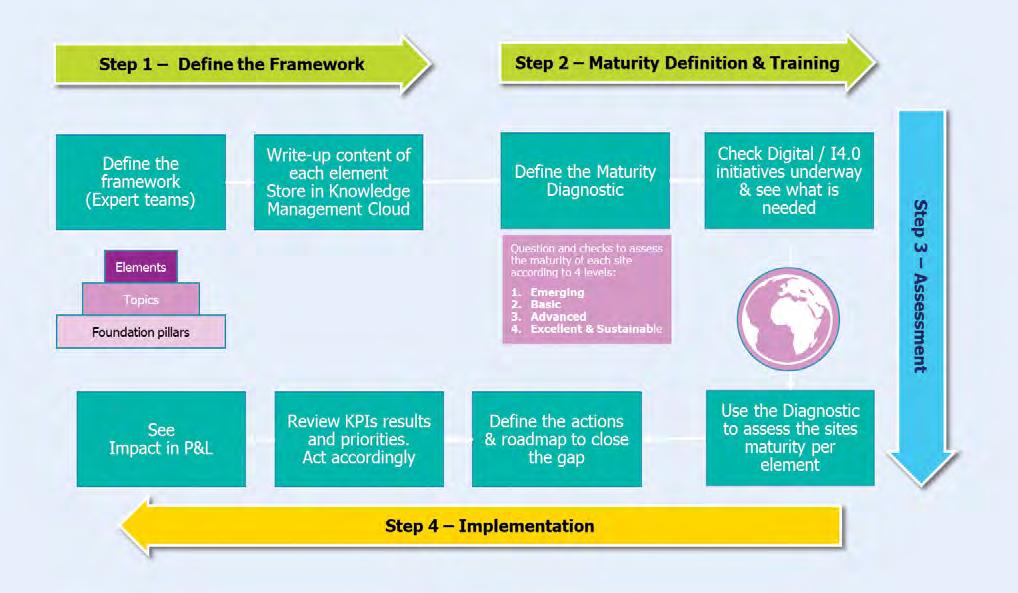
Figure 3: TOM design, development, assessment and implementation process.
TOM! OPTIMIZE: Maintenance 4.0 elements
Operating models are found in most enterprises, whether they are plant, supply chain, logistics, or commercial models. However, very few businesses have end-to-end operating models. Through digitalisation, leaders can achieve significant gains by having one global TOM model incorporating both globalisation and localisation (Glo-Cal) management elements. Another advantage of TOM! is its suitability for both new and old plants because, fortunately, technology does not impede this model. TOM! provides visibility where firms have business continuity or resilience issues. By gaining visibility, management can see where to reduce costs and improve working capital and business forecasting. TOM! is not a maturity assessment matrix, it is the IP and content that is stored in the cloud for each topic and element. Using the TOM! Framework, Proudfoot and client industry experts take anywhere from six to 12 weeks to determine the element content while it will only take an extra two days to develop the maturity assessment matrix for the content. The critical steps in designing and developing the best-fit TOM! include the following: • Defining the framework and the number of foundation pillars, topics and elements that are required. Once the framework is determined, the experts need to write up the content and the method to implement each element. This content is usually stored in KM (Key
Management) clouds now, for ease of upgrading. • Defining the maturity diagnostic and training the internal team. Questions are developed to enable the team assessing the business to assess the maturity level. Typically, there are between three to five levels of maturity. In this case we have four. They are: -Emerging -Basic -Advanced -Excellent & Sustainable For a cement firm, once the maturity assessment matrix has been developed to assess its element content, a workshop format is used to check / assess all the digital / i4.0 initiatives that are underway and to see what is needed. • Assessment of each of the cement businesses. Here the TOM maturity assessment is used to assess the maturity of sites. • Implementation. The actions to improve and the roadmap on how to achieve them are designed, i.e. the
Transformation Program. We link them to performance
KPIs to show the results, and the impact in the P&L /
Balance Sheet is identified. A cement TOM typically has four pillars: -Operational -Performance -People -Growth & Innovation
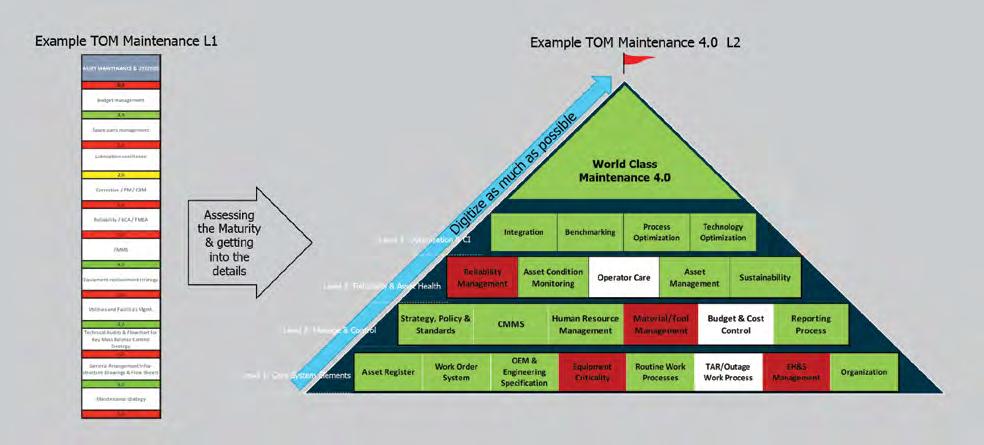
It covers 10 topics following the end-to-end process. Each topic is then broken down into multiple elements. Initially, TOM design & development is typically done on Excel, for ease of use. As the model stabilises, we move them to cloud applications such as Concerto Analytics, a Proudfoot strategic partner, which allow simulation scenarios, multi-plant views, links to ERPs and cloud applications, and allow for live large screen or smartphone viewing. Most often, the functions of TOM Maintenance 4.0 elements are to design, develop, implement or accelerate the new maintenance strategy and operating model, for example, to achieve the following: • Optimise the maintenance cost per tonne. • Increase equipment availability. • Increase equipment reliability by raising mean time between failures (MTBF). • Maximise the lifetime of equipment (optimal replacement CAPEX). • Minimise spares & materials inventory value. • Increase the ‘discipline in execution’. • Minimise external contractors and providing solutions for ‘people’ issues. Figure 6 shows an example of a maintenance element, covering Reliability / RCA (Root Cause Analysis) / FMEA (Failure Mode and Effect Analysis). Probing questions are used, with an explanation on what best practice routines must be in place to reach a certain level. For the final score of the element, the lowest score is used. Each element is then linked to operational / financial KPIs and identified if it impacts the P&L or Balance Sheet. Often our clients operate at two levels: • Level 1 covers the key maintenance elements and is used in the overall business TOM. • Level 2 allows the maintenance team to dive into much more detail and is often presented in the traditional maintenance pyramid format.
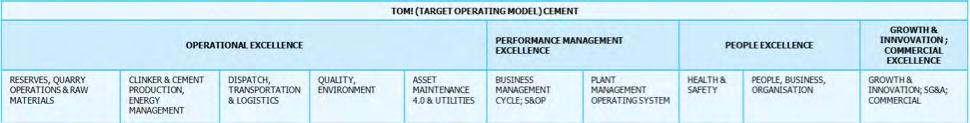
Figure 4: An example of a cement TOM.

All our cement clients are experimenting with Maintenance 4.0 digitalisation IoT programs. Most are having trouble getting paybacks and most are having digital architecture, cloud confusion, network bandwidth and ‘discipline in execution’ issues. Figure 8 illustrates some of the digitalisation initiatives we see during our projects.
How to optimise and digitalise value
There is a considerable difference between optimising and digitising, and businesses must differentiate between the two. Businesses must first start from scratch to identify and assess the numerous TOM elements and their value creation in the entire end-to-end value chain, and then prioritise the best-fit solutions - be they digital or other. For example, suppose a Maintenance 4.0 programme, a reasonable CAPEX budget and the right digital solutions and resources do not improve sales. In that case, you should make a trade-off by investing in a sales-generating digital solution. Similarly, we see a proliferation of cloud software from Microsoft Azure to Amazon Web Services, along the process value chains, among different teams, from
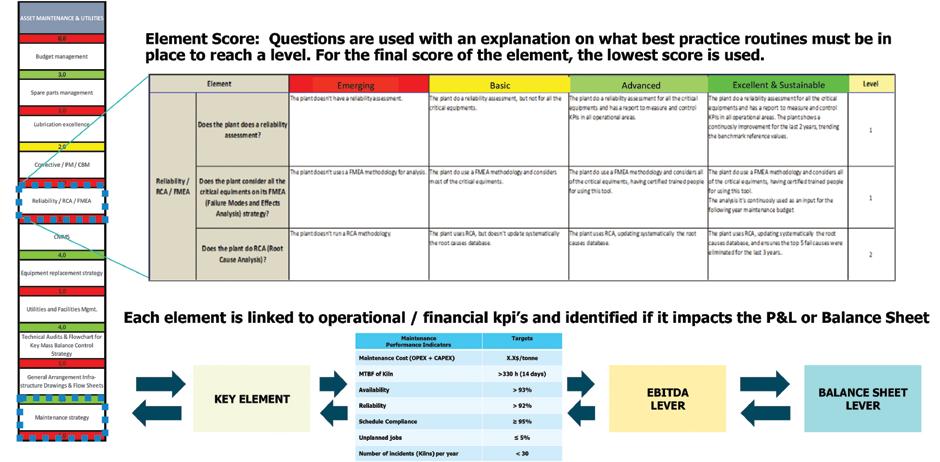
Figure 6: An example of a maintenance element, covering Reliability / RCA / FMEA.
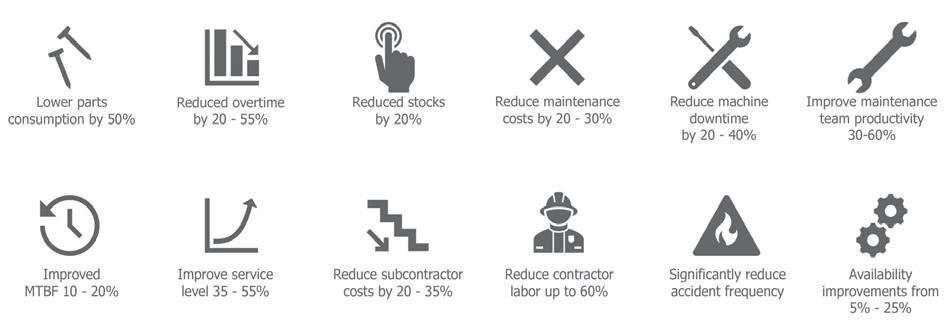
programming, supply, production, third party logistics and sales. In the future, this might make data analysis complicated. Hence, after careful planning and consideration, companies must invest in the right solutions, with a robust TOM! Businesses can then generate an improvement roadmap which helps to monetise and estimate the time-tobenefit, by mapping each initiative. Typically, we split them into four to five months, six to 12 months and one to two years, and then further into categories such as Smart Operations, Smart Assets, and Smart Workforce. We have partnered with multiple digital and technology providers (big, medium and small) in order to be able to provide our clients with the appropriate digital solutions they need, i.e. we are IT supplier-agnostic. A typical TOM! improvement program will generate a USD 3 to USD 5 per tonne improvement in Earnings Before Interest, Taxes, Depreciation, and Amortisation (EBITDA), thereby improving business operating performance. Many teams have found that optimising and digitising is key to maximising value creation. Operating models are key to strategy and TOM! is easily customisable for various businesses to obtain the best value creation. The numerical results in Figure 9 are based on the projects we have done over the last 10 years in cement plants in more than 60 countries. They are typically what we achieve during one of our projects. Some sites might achieve more and some less, as it all depends on where the base line is set. Our projects tend to include multiple plants and multiple countries as TOM! then gives multinational players a way of accelerating value creation rapidly across their entire organisation. (More information on Proudfoot and the company’s solutions may be obtained by emailing the author at amaclean@proudfoot.com).
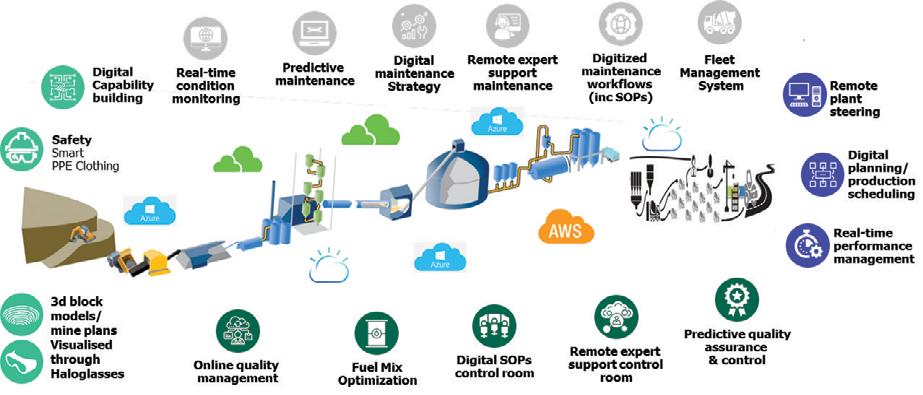
Figure 8: Maintenance 4.0 elements digitalisation initiatives.