


February 2024
Unlocking the Power of Diverse Workforces for the Future of the Transportation Industry
kpmg.com/us Driving Diversity
© 2024 KPMG LLP, a Delaware limited liability partnership and a member firm of the KPMG global organization of independent member firms affiliated with KPMG International Limited, a private English company limited by guarantee. All rights reserved. USCS009201-1A Contents Introduction 1 About this Study..................................................................................................................................2 State of the Workforce ........................................................................................................................3 Focus on Gender Diversity 4 Focus on Racial/Ethnic Diversity 7 Diversity among Executives, Senior Leadership, and Manager Roles 10 Promotions and Attrition 12 Candidate Recruitment Pipeline 15 Driving Diversity: Best Practices 17 Conclusion 21 Appendix 22

Introduction
In recent years, the transportation industry has been rapidly changing thanks to emerging technologies, evolving consumer preferences, and an increased focus on sustainability and environmental factors. Concurrently, the workforce has grown as new skills are brought into the industry and the industry attracts workers to support its growth. As these transformations intersect, industry leaders are striving to create workplaces of the future – high-tech, diverse, and efficient. To achieve this, many organizations have implemented Diversity, Equity, and Inclusion (DEI) programs, expanded their talent pools, and invested in early talent programs. The question remains: Have these efforts provided meaningful progress towards a more diverse workforce?
DEI is crucial for advancement of the transportation industry. A diverse workforce can contribute to more innovation, better management decisions, and a supply of labor that meets the industry’s changing needs. A diverse workforce brings together teams from various backgrounds and perspectives, fostering innovative solutions to the industry's most complex challenges. A more equitable and inclusive workplace produces higher levels of employee engagement, boosts retention and positively impacts overall performance. By committing to practices that increase diverse representation, ensure fair access to opportunities and create a sense of belonging, the industry can better meet customer needs, respond to market dynamics, and maintain a competitive edge in an increasingly dynamic landscape. Diverse leaders bring new perspectives and increase performance. Ultimately, prioritizing DEI can help the industry thrive and remain sustainable for the long term.
One of the fundamental reasons for conducting a baseline study is to understand the current state of diversity in the transportation industry. The data collected as part of this study will help organizations to evaluate their current state and existing initiatives and identify areas for further development. The study will also help establish benchmarks against which future progress can be measured. By evaluating the industry's current landscape, stakeholders can gain valuable insights and strategize to address gaps, thus promoting sustainable growth and progress within the industry. We hope that sharing leading practices and highlighting the need for industry-wide cooperation will galvanize leaders to prioritize and enact change within their organizations.
CADIA's mission is to support organizations in their DEI initiatives and help them realize their aspirations. Developed in partnership with KPMG LLP, this study aims to provide a critical baseline to understand the state of diversity in the industry, measure against other industries and sectors, evaluate progress over time, develop key areas of focus to diversifying talent and leadership development, and to be a catalyst for continued advancement.
© 2024 KPMG LLP, a Delaware limited liability partnership and a member firm of the KPMG global organization of independent member firms affiliated with KPMG International Limited, a private English company limited by guarantee. All rights reserved. USCS009201-1A 1
About this Study
Funded by a grant provided by MICHauto, CADIA and KPMG conducted a survey of transportation companies to collect demographic data on their US workforce including gender, race/ethnicity, and job category. The data was collected in a similar format as the EEO-1 form submitted to the US Equal Employment Opportunity Commission (EEOC) with additional fields for hourly/salaried employees, business function, and geography.
Survey Data: Twenty companies provided data in response to the survey covering over 110,000 employees. Survey respondents were largely Tier 1 and Tier 2 automotive suppliers Only a handful of survey respondents provided information on the additional requested fields of business function and geography which limited the ability to develop meaningful insights on those dimensions.
In addition to collecting data on the current workforce, the survey also requested demographic information for organizations’ applicant/recruiting pipeline, promotions, and terminations within a 12-month lookback period. Less than half of the survey respondents submitted data for this section of the survey, and it remains an area for further study.
Secondary Sources: The survey data was supplemented by secondary sources including publicly available EEO-1 filings, annual reports, and sustainability reports released between 2020 and 2022 covering 20 additional companies including suppliers, OEMs, aftermarket, and defense companies totaling over 580,000 additional employees
In total, the summary of the current workforce reflects information collected from 40 companies in the transportation industry covering over 690,000 employees. The combination of survey data and secondary sources is referred to as Study Data throughout the report. Comparison data for the demographics of the US workforce was sourced from the Bureau of Labor Statistics and the National Center for Education Statistics.

© 2024 KPMG LLP, a Delaware limited liability partnership and a member firm of the KPMG global organization of independent member firms affiliated with KPMG International Limited, a private English company limited by guarantee. All rights reserved. USCS009201-1A 2
State of the Workforce
The results presented in this section focus on the findings from the Study Data as compared to the overall US Workforce. The discussion focuses on gender and racial/ethnic diversity because it aligns to EEO-1 filings and because many organizations do not reliably collect data related to other, less observable diversity characteristics The terminology and capitalization used throughout the report is consistent with the federal race/ethnicity and gender categories used for EEO-1 data collection
Of the 20 companies that responded to the survey, almost all collect data around gender and race/ethnicity for the current workforce. That number shrinks with regards to their US recruiting efforts, where these dimensions are not required to be collected.
Furthermore, as the dimensions of diversity continue to expand, companies may look to advance their data collection and workforce analytics capabilities to include additional dimensions such as veteran status, disability status, sexual orientation, and more. Of survey respondents, 30% are already collecting data on other diversity characteristics in their current workforce (15% collect it as part of their US recruiting efforts).
Diversity Data Collected by Survey Respondents
Source: Based on Survey Data.
*Note: Employers with at least 100 employees (and federal contractors with at least 50 employees) are required to collect and report on gender and race/ethnicity on an annual basis by submitting an EEO-1 Report Only 19 and 17 survey respondents indicated that they collect gender and race/ethnicity data related to their current workforce, respectively.

Key Takeaway
Self-identification (self-ID) campaigns encourage employees to provide their demographic data, which helps employers identify ways to expand employment opportunities, advancement, retention, engagement, and inclusion. Trust, transparency, and psychosocial safety are all foundational elements to a successful self-ID campaign.
© 2024 KPMG LLP, a Delaware limited liability partnership and a member firm of the KPMG global organization of independent member firms affiliated with KPMG International Limited, a private English company limited by guarantee. All rights reserved. USCS009201-1A 3
Dimension Current Workforce Recruiting Pipeline Gender* 20 16 Race/Ethnicity* 20 15 Age 11 7 Other 6 3 Veteran status 3 1 Disability status 4 2 Other (not specified) 3 3
Focus on Gender Diversity
One of the key findings of the study is the lower representation of women (24%) in the industry workforce when compared to the composition of the total US workforce (47%). This finding is in line with similar data published by the Bureau of Labor Statistics for the “Transportation equipment manufacturing” industry.
Gender Distribution
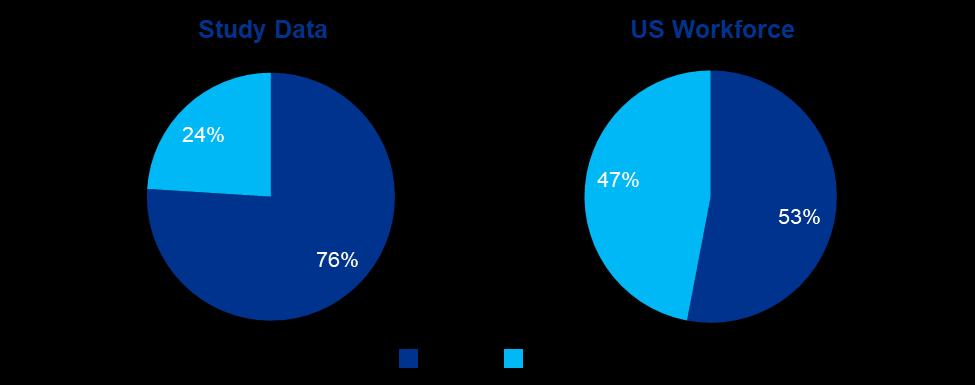
Source: Based on Study Data. US Workforce data from the Bureau of Labor Statistics Household employment data, 2022.

© 2024 KPMG LLP, a Delaware limited liability partnership and a member firm of the KPMG global organization of independent member firms affiliated with KPMG International Limited, a private English company limited by guarantee. All rights reserved. USCS009201-1A 4
The workforce can be further broken down by job category to identify how women are represented in different roles relative to their overall proportion of the workforce:
• Job Category with Highest Representation: Administrative Support has the highest representation of women out of all the job categories and exceeds the general representation of women in the US workforce overall. Roles that generally fall into this category include human resource assistants, office and administrative support workers, customer service representatives, bookkeeping/ payroll/ accounting clerks, production and planning clerks, and receptionists.
• Job Category with Lowest Representation: Craft Workers has the lowest proportion of women out of all the job categories and is well below their overall representation in the US workforce. Roles that generally fall into this category include skilled trades like electricians, machinists, automotive service technicians and mechanics, sheet metal workers, and general maintenance and repair workers
Gender Distribution by Job Category
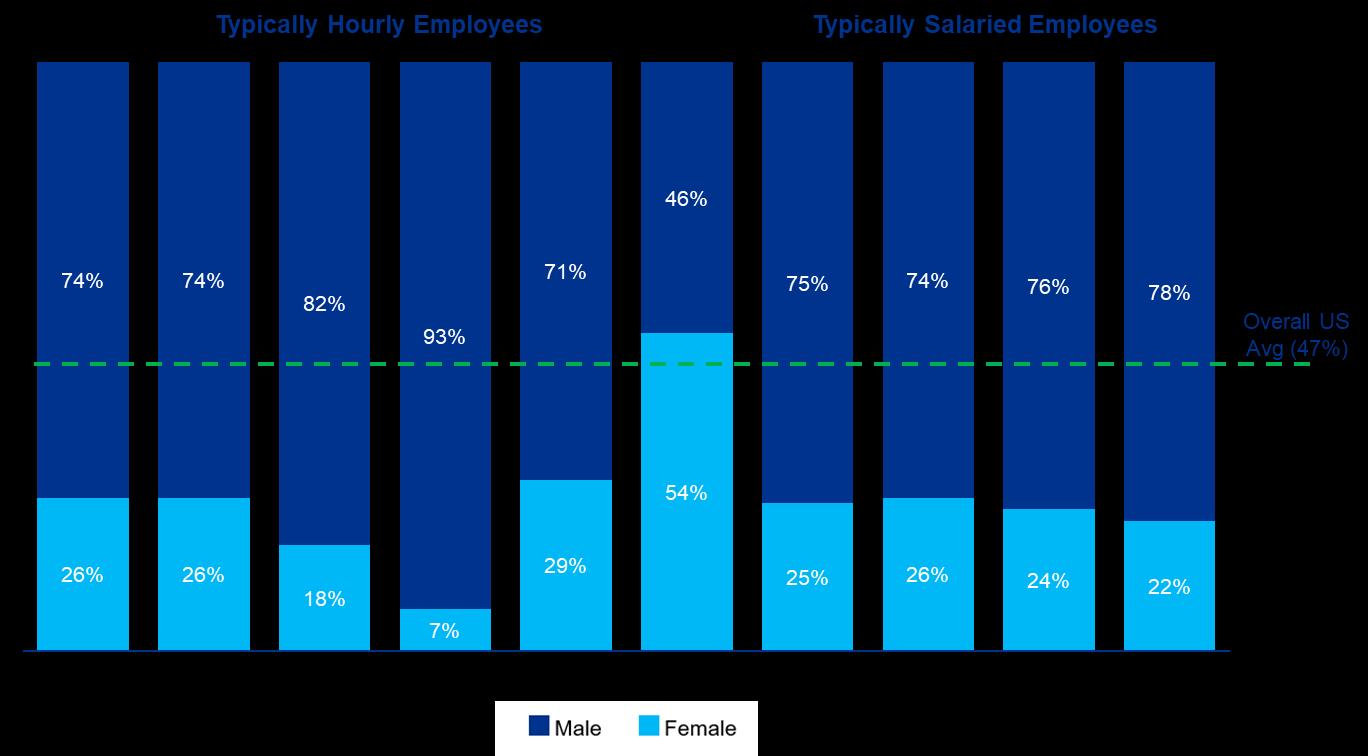
Source: Based on Study Data
Job categories labeled as “Typically Hourly Employees” comprise roles that are most often categorized as non-exempt or paid by the hour. Similarly, job categories labeled as “Typically Salaried Employees” comprise roles that are most often categorized as exempt or paid an annual salary.
Key Takeaway
A robust succession planning process that embraces diverse representation is a key component of success. Improving and maintaining the gains in the representation of women in leadership roles across the industry demands deliberate focus and time investment.
Regular data reviews are critical to understanding lower representation and higher attrition rates as they can help pinpoint gaps across all leadership tiers and job categories, especially in critical skill areas. There is a particular need to focus on identifying gaps in traditionally hourly roles to address the low representation of women in Technician and Craft roles.
© 2024 KPMG LLP, a Delaware limited liability partnership and a member firm of the KPMG global organization of independent member firms affiliated with KPMG International Limited, a private English company limited by guarantee. All rights reserved. USCS009201-1A 5
An alternative view of the data by business function is possible based on additional data fields provided by survey respondents (note: this view excludes data collected from secondary sources and the totals will differ from the aggregate summary above). The results are similar to the view by Job Category, but it becomes clearer that more women work in Human Resources and Accounting and less women work in functions like Information Technology and Research & Development compared to the general population
A somewhat surprising finding is that women represent a similar proportion of roles in both Sales, General & Administrative and Manufacturing & Operations functions
Gender Distribution by Business Function (based on Survey Data only)
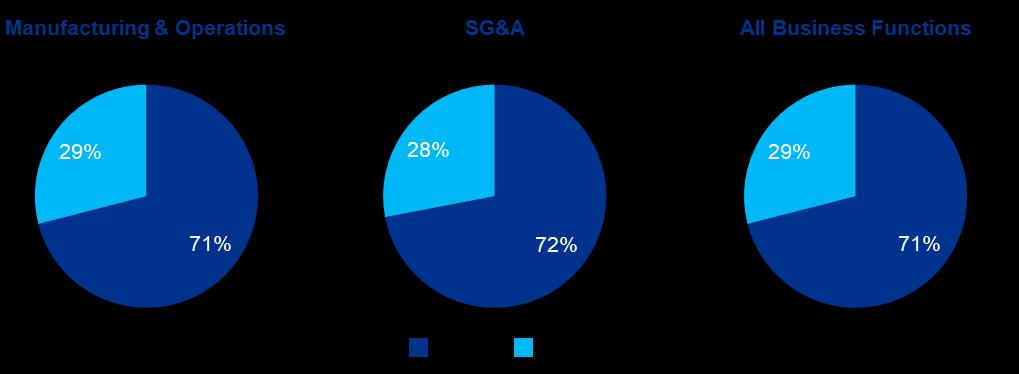
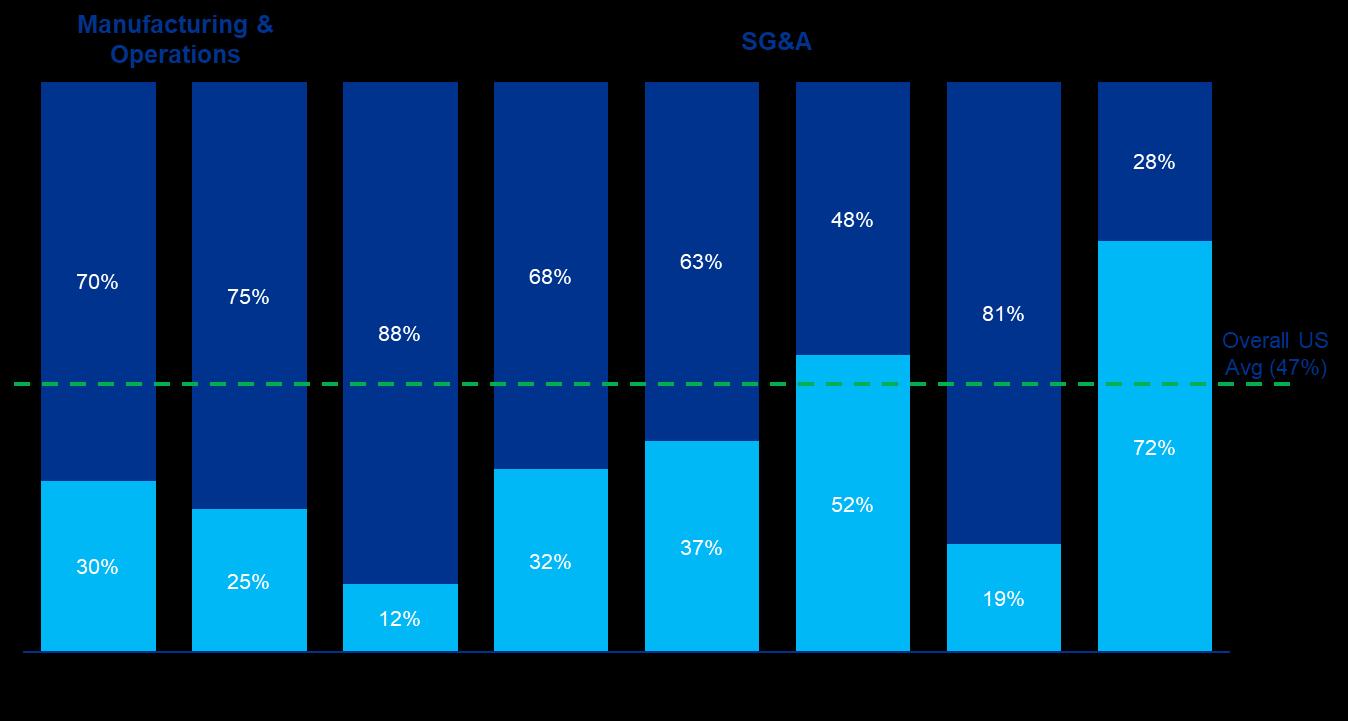
Source: Based on Survey Data only
Note: “SG&A” (Sales, General & Administrative) includes roles in Sales, Marketing, Research and Development, IT, HR, Finance and Accounting, and Procurement functions. “Manufacturing and Operations” includes roles in Manufacturing, Production and Operations functions (e.g., plant management, fabrication, assembly, production planning, quality, facilities, maintenance, resource management, supply chain, demand planning, etc.).
© 2024 KPMG LLP, a Delaware limited liability partnership and a member firm of the KPMG global organization of independent member firms affiliated with KPMG International Limited, a private English company limited by guarantee. All rights reserved. USCS009201-1A 6
Focus on Racial/Ethnic Diversity
According to Study Data, the overall racial and ethnic diversity of the transportation industry workforce deviates from the National US workforce, with a greater representation of Black or African American and White employees and a lower representation of Hispanic / Latino employees.
Race/Ethnicity Distribution
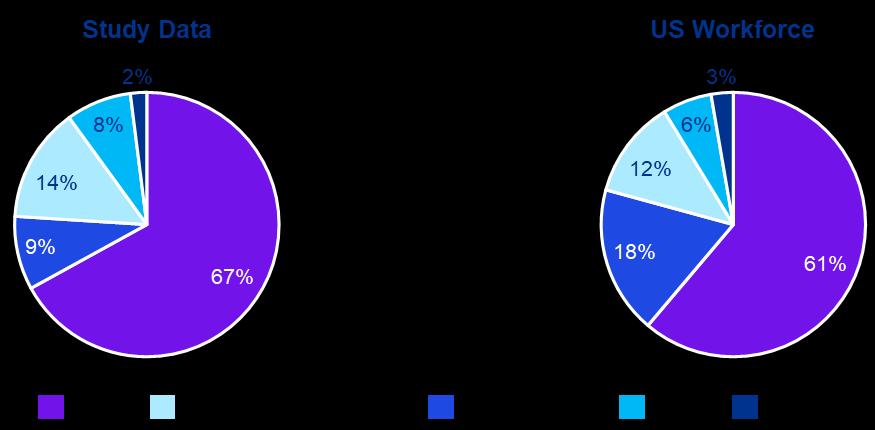
Source: Based on Study Data. US Workforce data from the Bureau of Labor Statistics Household employment data, 2022.
Inclusion and Community Building in Plants
Plant leadership is on the front line of driving diversity, equity, and inclusion and addressing racial disparities on the shop floor – those that do this well connect their plant to the surrounding community, encourage and support a diverse and inclusive workforce, and create a climate of inclusivity and teaming.
• Community: Awareness of the many roles in a manufacturing plant and the working conditions are often times lacking. Leading plant managers find ways to invite the community into the plant, build awareness of the good jobs, pay and benefits offered, and give back. This connection encourages community members to see opportunities within the plant where they otherwise would not have and makes the inside of the plant look a lot more like the surrounding communities.
• Encourage and support all workers: Fostering an inclusive workplace requires an understanding of the unique challenges that different workers may face and finding ways to help everyone be successful in their roles. Leadership within plants are doing more to share career paths, provide mentoring and coaching, and access apprenticeship, tuition reimbursement, or other training programs. This ensures that all workers see opportunities to build skills that can take them into more technical positions like welders or machinists or leadership roles.
• Inclusivity and teaming: Strong plant leadership builds a team mentality. Defining shared KPIs and accountability allows the team to know and share in the successes and feel committed to improvement where needed. Great plant leadership takes a servant-leader mentality, helping each employee succeed in their role for the betterment of the team. When employees feel supported by leaders and have shared goals, inclusivity follows as everyone works together to succeed.
Plant Managers are uniquely positioned to bring these best practices to life in their facilities by encouraging collaboration and knowledge-sharing among employees and overseeing mentorship programs and job shadowing to help build a support network within the Company. Fostering an inclusive work environment and offering educational support are crucial factors in nurturing talent.
© 2024 KPMG LLP, a Delaware limited liability partnership and a member firm of the KPMG global organization of independent member firms affiliated with KPMG International Limited, a private English company limited by guarantee. All rights reserved. USCS009201-1A 7
The workforce can be further broken down by job category to identify roles where different groups are represented relative to their overall proportion of the workforce:
Job Categories with Highest Representation: The Laborers and Helpers job category and Operatives job category are the most racially / ethnically diverse.
• Roles that generally fall in the Laborers and Helpers category include production workers, machine feeders and off bearers, cleaners of vehicles and equipment, and freight, stock, and material movers.
• Roles that generally fall in the Operatives category include assemblers of electronics, engines or systems, and machine setters, operators, and tenders (including molding machines, extruding and drawing machines, cutting, punching, and press machines, etc.). Refer to the EEO-1 job classification guide for a complete list of positions in each job category.
Job Category with Lowest Representation: Executive/Senior Level is the least racially / ethnically diverse out of all the job categories. Roles that generally fall into this category are at the highest levels of organizations (generally within two reporting levels of the CEO) and include employees responsible for setting the overall direction and strategy of the company.
There is an opportunity to invest in career paths for employees to be able to advance into more technical and mid-level, senior roles.
Race/Ethnicity Distribution by Job Category
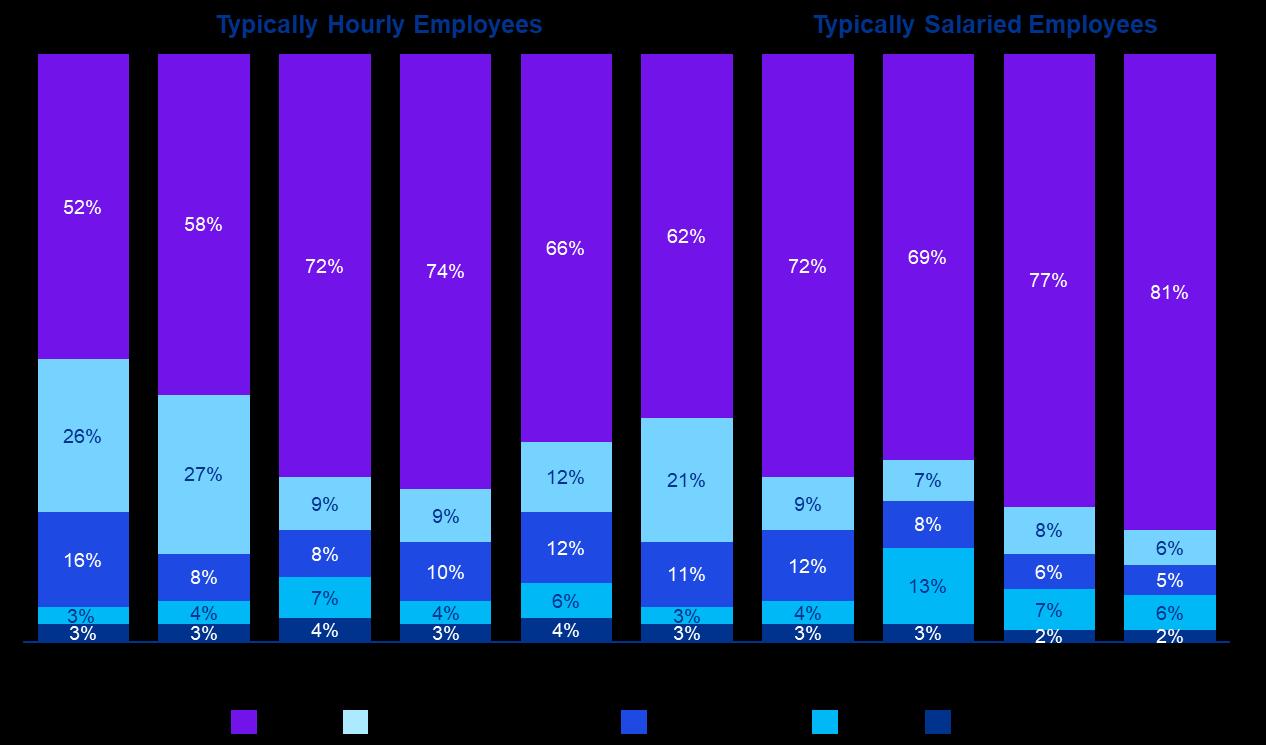
Source: Based on Study Data.
Key Takeaway
Employers must establish clear career pathways for advancement that are accessible to all employees. As a first step, look for potential barriers for advancement throughout the entire employee lifecycle: sourcing and recruiting, interviewing and hiring, onboarding, employee evaluations, development programs, and succession planning. As part of recruiting, consider outreach to a range of communities through internships, partnerships with academic institutions and collaboration with organizations that specialize in specific skills development.
© 2024 KPMG LLP, a Delaware limited liability partnership and a member firm of the KPMG global organization of independent member firms affiliated with KPMG International Limited, a private English company limited by guarantee. All rights reserved. USCS009201-1A 8
An alternative view of the data by business function is possible based on additional data fields provided by survey respondents. Note that this view excludes data collected from secondary sources and the totals will differ from the aggregate summary above. Entries that indicated “No Response” have been excluded.
Race/Ethnicity Distribution by Business Function (based on Survey Data only)
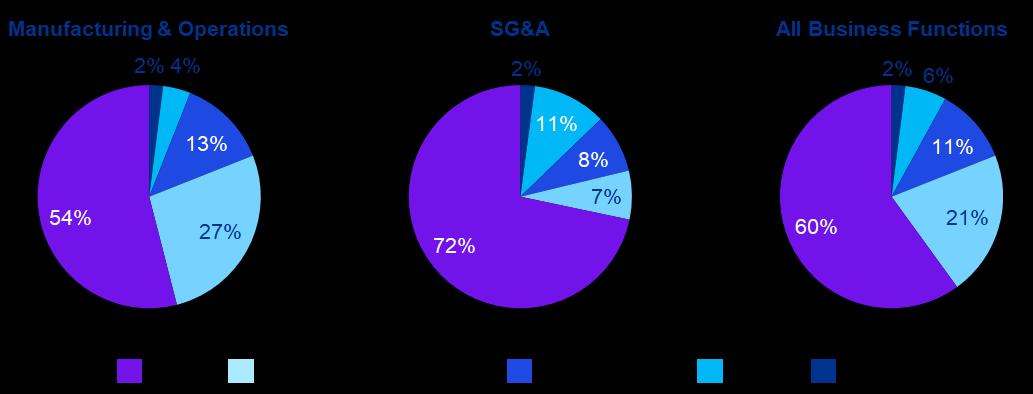
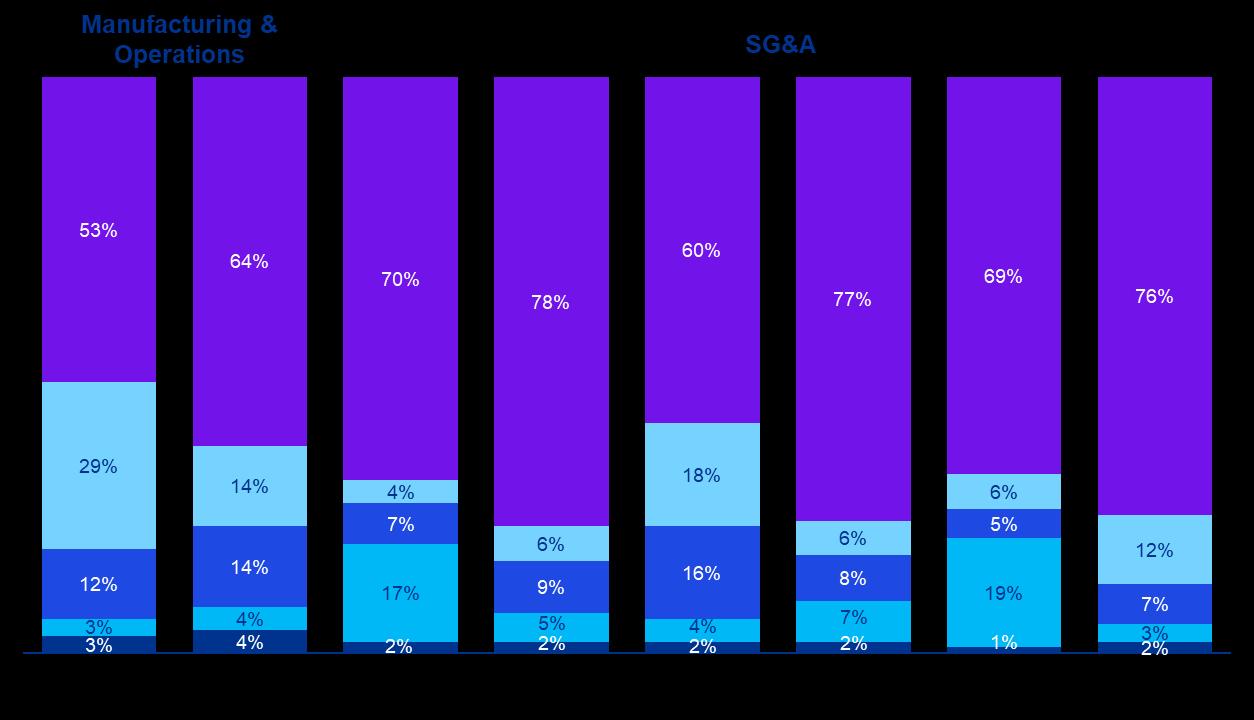
Source: Based on Survey Data.
Note: “SG&A” (Sales, General & Administrative) includes roles in Sales, Marketing, Research and Development, IT, HR, Finance and Accounting, and Procurement functions. “Manufacturing and Operations” includes roles in Manufacturing, Production and Operations functions (e.g., plant management, fabrication, assembly, production planning, quality, facilities, maintenance, resource management, supply chain, demand planning, etc.).
Racially / ethnically diverse employees are represented more in manufacturing and operations roles (46%) relative to their representation across all business functions (41%) and less in SG&A roles.
• Black or African American employees have especially high representation in Manufacturing roles (29%) and low representation across other business functions.
• Hispanic/Latino employees have higher representation in Manufacturing & Operations roles (13%) and lower representation in SG&A positions (8%).
• Asian employees have relatively low representation in Manufacturing & Operations roles (4%) and high representation in SG&A roles (11%), including Information Technology and Research & Development.
• White employees have high representation in SG&A roles (72%), concentrated in Sales & Marketing, Finance & Accounting, and HR relative to their representation across all business functions (60%)
© 2024 KPMG LLP, a Delaware limited liability partnership and a member firm of the KPMG global organization of independent member firms affiliated with KPMG International Limited, a private English company limited by guarantee. All rights reserved. USCS009201-1A 9
Diversity among Executives, Senior Leadership, and Manager Roles
The representation of women among Executive, Senior Leadership and Manager roles (23%) is largely proportional to representation of women in the industry workforce (24%) This may be due, in part, to the increasing number of organizations making public pledges to improve the gender diversity of their senior leadership teams and boards of directors in recent years. It is certainly a bright spot in this study to acknowledge that given that gender representation in leadership roles was an early area of focus for the industry, leaders represent the overall workforce on a gender basis. This does not mean there is not still work to do to advance gender representation across the industry, but it does demonstrate the impact of expanding talent pools, and can serve as a blueprint for advancing further diversity in leadership. One remaining area for improvement is the representation of diverse women in Executive, Senior Leadership and Manager roles (6%) which lags their representation in the industry workforce (10%).
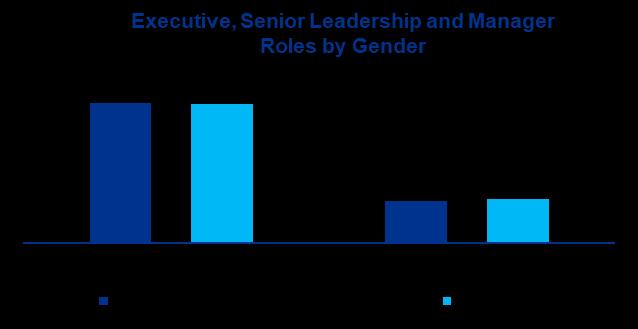
Source: Based on Study Data which includes all survey respondents and secondary source data from public EEO1 filings.

© 2024 KPMG LLP, a Delaware limited liability partnership and a member firm of the KPMG global organization of independent member firms affiliated with KPMG International Limited, a private English company limited by guarantee. All rights reserved. USCS009201-1A 10
Racially / ethnically diverse employees are underrepresented in Executive, Senior Leadership and Manager roles (22%) relative to the share of the industry workforce (33%). The largest gap is found among Black or African American employees who comprise approximately 14% of the total workforce, but only 7% of the Executive, Senior Leadership and Manager roles
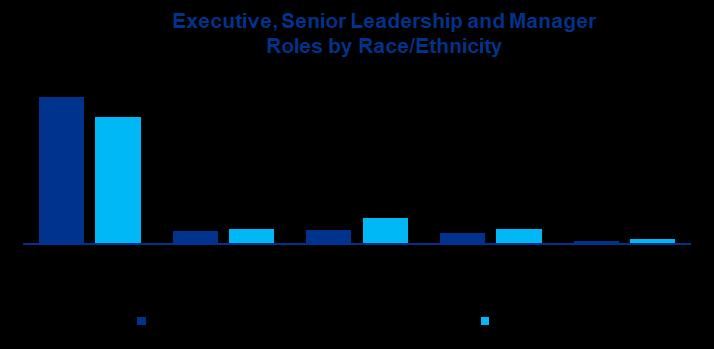
Source: Based on Study Data which includes all survey respondents and secondary source data from public EEO1 filings.
Key Takeaway
Access to support networks may not be equitably available to all workers. It is crucial to ensure robust support systems that aid in talent development and increase success for everyone in new roles. This includes formal and informal mentoring, sponsorship, coaching, and dedicated leadership development programs

© 2024 KPMG LLP, a Delaware limited liability partnership and a member firm of the KPMG global organization of independent member firms affiliated with KPMG International Limited, a private English company limited by guarantee. All rights reserved. USCS009201-1A 11
Promotions and Attrition
In addition to collecting baseline data on the demographics of the current workforce, the survey also asked employers to provide demographic data on employees who were promoted in the last 12 months and those that left the company through attrition (both voluntary and involuntary). The goal in collecting this data was to identify any trends or disparities in rates of promotions or attrition relative to the overall workforce We also thought that the data may provide some explanation for the demographics of the current workforce and how it might change in the future, including representation in Executive / Senior Leadership and Manager roles
Survey respondents provided limited data regarding the demographics of promoted employees and those leaving the company over the last 12 months. As a result, the data on this topic should be considered anecdotal and cannot be generalized more broadly. This remains an area for future inquiry. Even among survey respondents who collected and provided attrition data, race/ethnicity identification was not provided for approximately half of employees, and gender was not provided for about a quarter.
We believe that there is an opportunity for employers to track employee outcomes more closely (in the form of attrition and promotions) to help gauge the progress of their DEI programs, to help understand which programs may be working, and where there are opportunities to adjust.
The comparisons below reflect the data provided by the limited number of survey respondents that provided promotion and attrition data by gender and race/ethnicity The Respondent US Workforce represents the workforce composition for those same survey respondents.
DEI Data Evolution
We heard from many respondents that data collection was a challenge, that some requested components were not available or there were limitations to their ability to respond. This is, in itself, a finding of the study –organizations do not centrally house this data and may not be looking at it regularly and in aggregate. As companies develop their data and analytics capabilities for their workforce, they should consider how to best collect, manage, and monitor data related to diversity
One limitation for organizations is the reliance on self-identification for many different types of diversity data –many organizations ask employees to voluntarily report their gender, race/ethnicity or other diversity dimensions. In order to encourage self-reporting, organizations need to foster an inclusive and psychologically safe environment for employees where they feel the information will be protected and used only to support them. Unfortunately, the reliance on self-reporting for some organizations likely means that diverse individuals are not fully reflected within the data that organizations use to monitor workforce.

© 2024 KPMG LLP, a Delaware limited liability partnership and a member firm of the KPMG global organization of independent member firms affiliated with KPMG International Limited, a private English company limited by guarantee. All rights reserved. USCS009201-1A 12
Promotions and Attrition by Gender (based on Survey Data only)
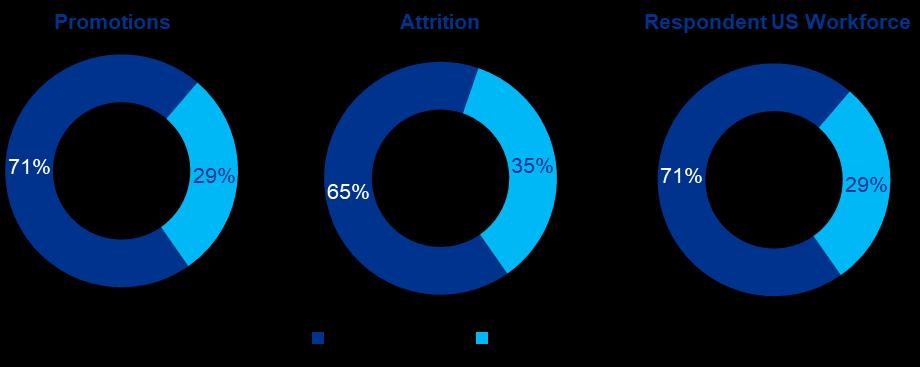
Source: Based on a subset of Survey Data provided by survey respondents. Secondary source data was not available for this view.
Promotions: For the survey respondents that provided data, the proportion of promotions for women over the last 12 months was generally in line with the share of the overall workforce
Attrition: The proportion of total employee attrition over the last 12 months had a higher representation of women (35%) relative to the share of the workforce for survey respondents (29%), which suggests more difficulty in retaining women compared to men. Of women that left the company in the last 12 months, 56% left voluntarily (compared to 59% of men). Organizations benefit from exit surveys split by demographic dimensions as they can further understand what drives attrition. They can then develop focused programs to mitigate turnover within specific groups.
Promotions and Attrition by Race/Ethnicity (based on Survey Data only)
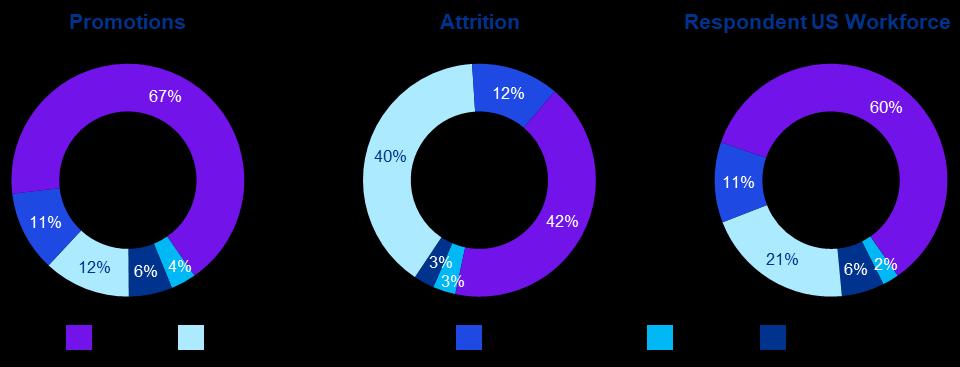
Source: Based on a subset of Survey Data provided by survey respondents. Secondary source data was not available for this view
Promotions: Based on the limited data provided by the survey respondents, 33% of employees promoted within the last 12 months were non-White. Black or African American employees received 12% of the overall promotions while representing 21% of the survey respondent workforce. White employees received a disproportionate share of the promotions at 67% while representing 60% of the survey respondent workforce.
Attrition: Based on the limited data provided by survey respondents, 58% of employees that left the company within the last 12 months were non-White compared to 40% of the survey respondent workforce. Approximately half of the employee attrition was due to voluntary terminations with the other half classified as involuntary. Black or African American employees disproportionately left their companies, representing 40% of the attrition compared to 21% of the overall workforce. White employees only represented 42% of attrition compared to 60% of the survey respondent workforce. At least a portion of the observed differences in attrition can be explained by the previously discussed differences in
© 2024 KPMG LLP, a Delaware limited liability partnership and a member firm of the KPMG global organization of independent member firms affiliated with KPMG International Limited, a private English company limited by guarantee. All rights reserved. USCS009201-1A 13
representation across job categories. In general, job categories like Laborers and Helpers, Operatives, and Administrative Support have higher turnover and a larger share of Black or African American employees in those roles, while White employees are more highly represented in job categories that tend to have lower turnover like Executive/Senior Leadership and First/Mid Level Manager.
Key Takeaway
It’s important to regularly analyze your data to uncover potential hidden biases within your talent management system. Delve deeper to comprehend why attrition occurs by conducting executive listening sessions, exit interviews, stay interviews, and focus groups. Identify missed opportunities in these areas and develop solutions that target both individual leaders and systemic issues to ensure comprehensive change.

© 2024 KPMG LLP, a Delaware limited liability partnership and a member firm of the KPMG global organization of independent member firms affiliated with KPMG International Limited, a private English company limited by guarantee. All rights reserved. USCS009201-1A 14
Candidate Recruitment Pipeline
Most organizations that responded to the survey were not able to provide a snapshot of the demographics of their recruitment pipeline, which may point to insufficient tracking and access to data in this population. As a result, the data should be considered anecdotal and an area for future inquiry.
Monitoring and assessing representation among job applicants can result in insights that drive more diversity in the future, but it can also slow hiring for specific roles. To ensure a proactive and effective approach towards cultivating a diverse workforce, organizations must build a capability around accurately tracking and analyzing diversity within their candidate population and adjust their talent development and recruitment strategy as needed. A longer-term view to increase the diversity of candidates in talent pools will allow hiring managers to efficiently consider a broader slate of candidates in the process.
Based on the limited data collected from respondents around recruitment profiles (i.e., the number of applicants to open roles in the US in the last 12 months), non-white racial / ethnic groups applied to 57% of available open roles When compared to their relative share of the workforce (39%), it becomes clear that diverse talent is attempting to enter the transportation workforce. Organizations should now consider how best to expand their recruitment pools to attract all of this talent
The Changing Demographics of Educational Attainment
The US workforce continues to become more diverse over time and the availability of qualified, diverse talent continues to grow. Educational attainment data for the US labor force indicates educational outcomes have improved substantially over the past 20 years
Educational Attainment of the US Labor Force (Age 25 and Older) – Change from 2003 to 2022
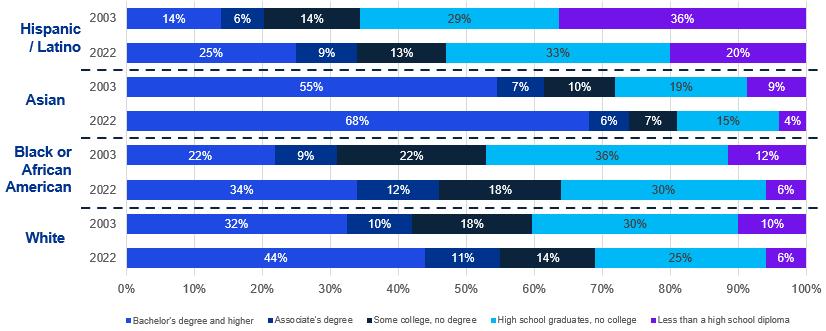
Source: Bureau of Labor Statistics
While educational attainment for Hispanic/Latino and Black or African American groups has historically lagged White and Asian groups, there has been substantial improvement over time. The share of the Hispanic / Latino workforce with less than a high school diploma fell from 36% in 2003 to 20% in 2022, while the share of the population with a bachelor’s degree or higher increased from 14% to 25% over the same time period. Similarly, the share of the Black or African American population with a bachelor’s
© 2024 KPMG LLP, a Delaware limited liability partnership and a member firm of the KPMG global organization of independent member firms affiliated with KPMG International Limited, a private English company limited by guarantee. All rights reserved. USCS009201-1A 15
degree increased from 22% in 2003 to 34% in 2022. As organizations look to diversify their workforces across all business units, functions and locations, they may consider this increase in educational attainment as a positive indicator of qualified, diverse talent ready for the opportunity to pursue a career in the transportation industry.
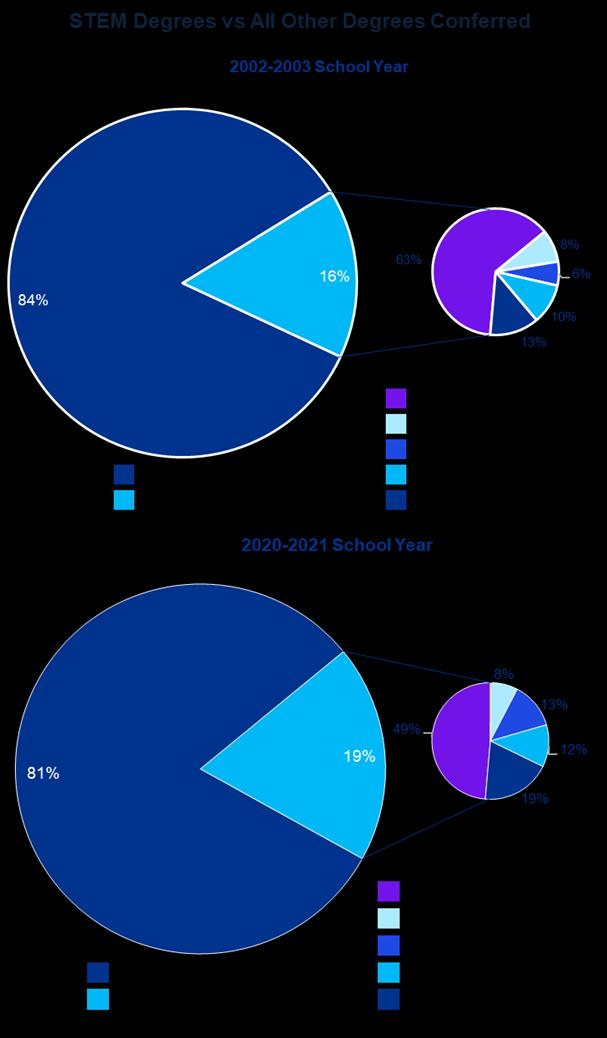
Educational attainment in the form of STEM-related college degrees is generally a good proxy for the ability to successfully work in skilled and technical roles within the transportation industry. Similar to the data on overall educational attainment, the proportion of STEM degrees awarded to diverse talent and women has improved over the past 20 years. For the 2002-2003 academic year, non-white graduates were awarded 37% of the total STEM degrees conferred and women were awarded 32% of the total STEM degrees conferred. That share increased to 51% and 35%, respectively, in the 2020-2021 academic year, suggesting an increasingly diverse pool of talent.
Source: National Center for Education Statistics. Associate’s degrees, Bachelor’s degrees, Master’s degrees, and Doctor’s degrees conferred by degreegranting institutions, by sex, racial/ethnic group, and major field of study: 2002-2003 and 2020-2021.
Note: STEM majors include Biological and biomedical sciences, Computer and information sciences, Engineering, Engineering technologies, Health professions and related clinical sciences, Mathematics and statistics, and Physical sciences and science technologies, as defined by the National Center for Education Statistics

© 2024 KPMG LLP, a Delaware limited liability partnership and a member firm of the KPMG global organization of independent member firms affiliated with KPMG International Limited, a private English company limited by guarantee. All rights reserved. USCS009201-1A 16
Driving Diversity: Best Practices
As the industry and its workforce continue to transform, companies must continue to implement and advance initiatives that address the recruitment, retention, and advancement of a diverse group.
While every organization is different, there are many best practices that have had demonstrable impact on diversity in the industry. Incorporating these can help bridge the gaps in key areas while helping to nurture a more inclusive work environment.
Establish DEI as a Business Objective
DEI should be treated like every other business objective. Establishing metrics, processes, and accountability will demonstrate that DEI is not something extra – it is a necessary component of the business.
• Incorporating DEI reviews into monthly or quarterly Business Plan Reviews alongside other business processes.
• Use reporting and accountability that exist in other areas of the business to benchmark and monitor progress in DEI metrics.
• To further incorporate DEI into the business, consider applying existing problem-solving methods. There’s no need to reinvent the wheel, the transportation industry has some of the best tools to identify and solve for root cause including: PDCA (Plan, Do, Check, Act), 8Ds (the 8 Disciplines of Problem Solving) and the Six Sigma Black Belt Problem Solving toolbox. These tools can help identify gaps and areas of opportunity and serve as a foundation for how to resolve issues.

© 2024 KPMG LLP, a Delaware limited liability partnership and a member firm of the KPMG global organization of independent member firms affiliated with KPMG International Limited, a private English company limited by guarantee. All rights reserved. USCS009201-1A 17
Focus on Attracting Diverse Talent
To create a diverse workforce, it is necessary to attract and hire a diverse group. Doing so requires innovative approaches to traditional recruitment activities, an increased focus on reaching a diverse group, and a clear and accessible hiring process.
• Sponsoring events and hands-on educational opportunities that advance STEM education can help raise awareness of both your company and the job opportunities available in the industry. Robotics, coding, and engineering clubs and competitions are also a great way for your employees to become more involved in their local communities.
• Streamline and simplify the recruitment, application, and hiring processes to make them more userfriendly and efficient. Minimize unnecessary steps and work to reduce or eliminate barriers and requirements that could deter qualified candidates.
• Explore non-traditional recruiting methods by tapping into your Employee Resource Group (ERG) members to help broaden your efforts.
• Review the language and messaging used within your sourcing, recruitment, and hiring materials. It’s also important to examine the accessibility of these materials, such as how they may be used by individuals with vision or hearing impairments.
• Work to mitigate unconscious bias in all company materials and begin incorporating or increasing the use of more inclusive language.
Attract Early Talent: One of the primary obstacles to attracting early talent is the lack of awareness among students and young professionals about the diverse range of roles and opportunities available in the industry. This limited understanding may also be compounded by outdated perceptions of the industry, such as that it only involves manual labor and isn’t all that innovative. According to the MICHauto High-Tech Talent Initiative Perception Study, the industry is more defined by production, service, mechanic, and sales roles than technology or innovation. They also noted that Engineering and Manufacturing were the most mentioned career paths for the industry.
• To overcome these perceptions and bring early career talent into the industry, companies must effectively communicate the exciting opportunities and career paths available.
• Demonstrating advanced technologies and products to these audiences can help create a better understanding of the current industry. Consider pairing a hiring fair with an auto show or industry event or hosting an open house of your technical facilities.
• Ensure that the job description accurately reflects the role and company culture. Throughout the application process make sure clear information is provided about expectations, responsibilities, and opportunities for growth.
Per MICHauto’s High-Tech Talent Initiative Perception Study, adult influencers who identify as diverse have conversations about future careers with youth ages 15-17 more often than those identifying as White, with 62% of diverse adult influencers frequently initiating these conversations (compared to 47% of White adults) and are more frequently asked their opinion on careers by young talent (compared to 38% White). However, roughly half of early career talent do not agree that the Transportation industry is an attractive career field for early career talent or diverse individuals, and less than 10% of youth across select Automotive/Transportation as a career field of interest. The study found negative perceptions about the industry include uncertainty (layoffs, shutdowns, market shifts) and challenging conditions (long hours, physically demanding, factory-based, dangerous). Both groups say they want more details about the types of jobs/work available, education/training/ certifications needed, and the working environment.
© 2024 KPMG LLP, a Delaware limited liability partnership and a member firm of the KPMG global organization of independent member firms affiliated with KPMG International Limited, a private English company limited by guarantee. All rights reserved. USCS009201-1A 18
Mid-Career Transitions: Encouraging diverse mid-career professionals from all backgrounds to transition into the transportation industry from other sectors can also be challenging. If they are aware of potential career opportunities, candidates may have concerns about job security, career progression and the skill sets required in the industry.
• Companies must be proactive in showcasing a commitment to mid-career professionals looking to make a successful transition into the sector. Start by identifying transferable skills from other industries and highlighting their value.
• Consider the benefits of mid-career transitions facilitated by Reboot and Returnship Programs, which serve as a win-win scenario for both the organization and the employee. These programs capitalize on transferable skills, allowing individuals to contribute significantly to the organization's success.
• Build relationships with organizations helping to facilitate mid-career transitions, such as those that work with former members of the military.
Retain Existing Talent
When developing inclusive strategies, it is critical to consider the needs of current employees. Embracing flexibility in the workplace is a valuable strategy for enhancing a sense of belonging, which creates an environment that is supportive of the varying needs of a wide variety of workers.
• By implementing measures such as flexible working hours, remote work options, and inclusive benefits, organizations can address the barriers that have traditionally hindered specific demographic groups - such as working parents, caregivers, or people with disabilities - from fully participating in the workforce.
• Flexible work arrangements also demonstrate a commitment to prioritizing work-life balance, which can be an appealing factor for prospective employees from a variety of backgrounds.
• ERGs serve as a valuable support network for workers, helping to build a sense of belonging. They drive open and are critical to promoting a more inclusive and equitable working environment. ERGs can also create networking opportunities that lead to growth and career progression.
• Develop a comprehensive onboarding program that helps new hires acclimate quickly. Provide necessary training, resources, and introductions to colleagues to ease the transition into new roles and help new hires feel valued within the organization.
• Ensure consistency between messaging and information communicated during the recruitment process and those used in the actual work environment.
Foster a Culture of Continuous Improvement
Successful talent strategies and programs are built on the foundation of continuous improvement. This is an ongoing process, one that changes frequently and requires transparency, honesty, and communication.
• It is important to develop processes and platforms for employees to express themselves freely, share their experiences, and contribute ideas to the company's growth and success. Employee surveys, focus groups and listening sessions are tried and true methods.
• Be open about what’s working - and what isn’t. Transparency around DEI initiatives is vital to building trust and increasing participation.
• Focus on implementing programs and initiatives that are outcome-centered and align with employee needs and the company’s mission, vision and values.
• Regularly review and refine the recruitment and onboarding processes based on feedback and incorporate evolving best practices to continually enhance the experience for both applicants and new hires.
© 2024 KPMG LLP, a Delaware limited liability partnership and a member firm of the KPMG global organization of independent member firms affiliated with KPMG International Limited, a private English company limited by guarantee. All rights reserved. USCS009201-1A 19
• Supporting a diverse workforce requires a departure from the “one size fits all” approach to the Employee Value Proposition (EVP) of the past. A well-rounded EVP should reflect and cater to the unique needs, aspirations, motivations, and concerns of employees from a wide range of backgrounds and life stages.
Build a Robust Talent Development Process
To create equitable opportunities for all employees to advance, companies must establish a comprehensive talent development process that incorporates both systemic changes and expectations for individuals.
• At the systemic level, career paths should be clearly defined and desired competencies for advancement should be accessible to all employees. Ensure that all advancement and development requirements are equitable and that they don’t unintentionally and unfairly exclude anyone. Additionally, consider allowing individuals to declare their interest in development and advancement programs rather than having management make all selections.
• Establish an ongoing talent review process and ensure that employees have a representative that is outside their reporting relationship. On a regular basis, provide employees with feedback on identified areas of development and allow an opportunity to ask questions and develop growth plans.

• Mentorship and sponsorship also play a critical role in fostering inclusion and belonging within organizations. Mentorship programs, which pair experienced professionals with promising talent, provide guidance and knowledge-sharing, as well as networking opportunities. Sponsorship, on the other hand, pairs influential advocates with high-potential talent to actively promote their career advancement. Sponsorship creates visibility, leading to recognition, opportunities, and career progression.
• As the industry evolves, the topic of reskilling has become increasingly commonplace. There are many opportunities to train and develop the existing workforce to take on new roles in EV, autonomous vehicles, and Industry 4.0. There are many talented individuals in the industry who, with incremental training and certifications, would be able to develop the skills demanded by a changing industry. Organizations should consider developing their own programs as well as partnership with non-profits, industry groups, and educational institutions to meet these needs. Doing so would help to retain critically needed talent and help increase the representation of diverse populations in the industry. Reskilling programs would also offer an opportunity to transition employees from primarily Manufacturing and Operations roles to positions in SG&A functions.
© 2024 KPMG LLP, a Delaware limited liability partnership and a member firm of the KPMG global organization of independent member firms affiliated with KPMG International Limited, a private English company limited by guarantee. All rights reserved. USCS009201-1A 20
Conclusion
The transportation industry has made noticeable strides to advance DEI within its workforce. However, as evident from the findings of the study, there are still challenges that should be addressed. To ensure meaningful progress towards a truly diverse workforce, organizations within the transportation sector must continue to prioritize DEI initiatives and embrace strategies that foster inclusivity, innovation, and sustainable growth.
Key components of supporting a diverse workforce and inclusive work environment include the implementation of flexible work arrangements, the establishment of Employee Resource Groups, and the promotion of mentorship and sponsorship programs. By providing deliberate support and nurturing a diverse group of talent, transportation organizations can create a more inclusive and competitive industry that is better positioned to tackle complex challenges and respond to dynamic market shifts.
The definition of diversity will continue to evolve. While we see significant progress around gender diversity, organizations are now looking at additional dimensions of diversity. Companies continue to encourage employees to describe themselves through dimensions such as veteran status, sexual orientation, or neurodiversity. As organizations think about inclusive workforce practices, opening the aperture around what diversity is and creating programs and policies that will benefit all employees.
Moreover, organizations should strive to continuously monitor their DEI progress, leveraging data-driven insights to assess the effectiveness of current initiatives and identify opportunities for further development. By actively benchmarking DEI efforts and measuring outcomes, transportation companies can drive meaningful change within their organizations

© 2024 KPMG LLP, a Delaware limited liability partnership and a member firm of the KPMG global organization of independent member fi KPMG International Limited, a private English company limited by guarantee. All rights reserved. USCS009201-1A
Appendix
EEOC Job Categories
Illustrative roles included in each category:
• Laborers and Helpers –production workers, machine feeders and off bearers, cleaners of vehicles and equipment, and freight, stock, and material movers.
• Operatives – assemblers of electronics, engines or systems, and machine setters, operators, and tenders (including molding machines, extruding and drawing machines, cutting, punching, and press machines, etc.).
• Technicians – Drafters, engineering technicians, surveying and mapping technicians.
• Craft – skilled trades like electricians, machinists, automotive service technicians and mechanics, sheet metal workers, and general maintenance and repair workers
• Service Workers – Janitors and building cleaners, security guards, pest control workers, transportation attendants.
• Administrative Support – office and administrative support workers, payroll and timekeeping clerks, procurement clerks, customer service representatives, HR assistants, receptionists
• Sales – Sales representatives of wholesale and manufacturing, parts salespersons, first-line supervisors of sales workers.
• Professionals – accountants and auditors, budget analysts, computer programmers, network and computer system admins, materials engineers, mechanical engineers, technical writers, HR and labor relations specialists
• First/Mid Level Officials and Managers – individuals who serve as managers other than as Executive / Senior Managers. Generally includes Vice Presidents and Directors charged with carrying out the direction of the Executives / Senior Level
• Executive/ Senior Level Officials and Managers – roles at the highest levels of organizations (generally within two reporting levels of the CEO) and include employees responsible for setting the overall direction and strategy of the company.
© 2024 KPMG LLP, a Delaware limited liability partnership and a member firm of the KPMG global organization of independent member firms affiliated with KPMG International Limited, a private English company limited by guarantee. All rights reserved. USCS009201-1A 22

Cheryl Thompson Founder and CEO, CADIA info@cadia.org

Kristine Coogan Principal, KPMG 312-665-2641 kristinecoogan@kpmg.com

Marc Craig Managing Director, KPMG 312-665-3203 macraig@kpmg.com
Thank You
This project is part of a partnership to support MICHauto’s High-Tech Talent Strategy to strengthen Michigan’s global competitiveness in the automotive, mobility, and technology industries. The broader initiative is being funded by a grant through the State of Michigan’s Mobility Futures Initiative with a goal of growing high-tech talent in Michigan and bringing to life the Michigan Office of Future Mobility and Electrification’s MI Future Mobility Plan
Some or all of the services described herein may not be permissible for KPMG audit clients and their affiliates or related entities.
© 2024 KPMG LLP, a Delaware limited liability partnership and a member firm of the KPMG global organization of independent member firms affiliated with KPMG International Limited, a private English company limited by guarantee. All rights reserved. USCS009201-1A For more information, contact us:
