March 2024


Home Prices Final 2023 Home Price Appreciation & A Peek Ahead To 2024
Source: Case-Shiller
Final 2023 Percent Appreciation in the SA Case-Shiller 20-City Index Metro % Change Metro % Change Atlanta 6.3% Miami 7.8% Boston 7.2% Minneapolis 2.9% Charlotte 8.0% New York 7.6% Chicago 8.1% Phoenix 3.8% Cleveland 7.4% Portland 0.3% Dallas 2.1% San Diego 8.8% Denver 2.3% San Francisco 3.2% Detroit 8.3% Seattle 3.0% Las Vegas 4.2% Tampa 4.1% Los Angeles 8.3% Washington, D.C. 5.1% U.S. National: 5.5%
Case-Shiller 2023 Home Price Appreciation

Looking back at the year, 2023 appears to have exceeded average annual home price gains over the past 35 years . . . While we are not experiencing the double-digit gains seen in the previous two years, above trend growth should be well received considering the rising costs of financing home mortgages.
- Brian D. Luke, Head of Commodities, S&P Dow Jones Indices
Percent of Annual Home Appreciation
Source: Freddie Mac
-15% -10% -5% 0% 5% 10% 15% 20% 1980 1990 2000 2010 2023 Each December as compared to previous December 4.86% 43-Year Average
1980–2023, Seasonally Adjusted, Rounded To Nearest Full Number
Percent Change in Home Prices
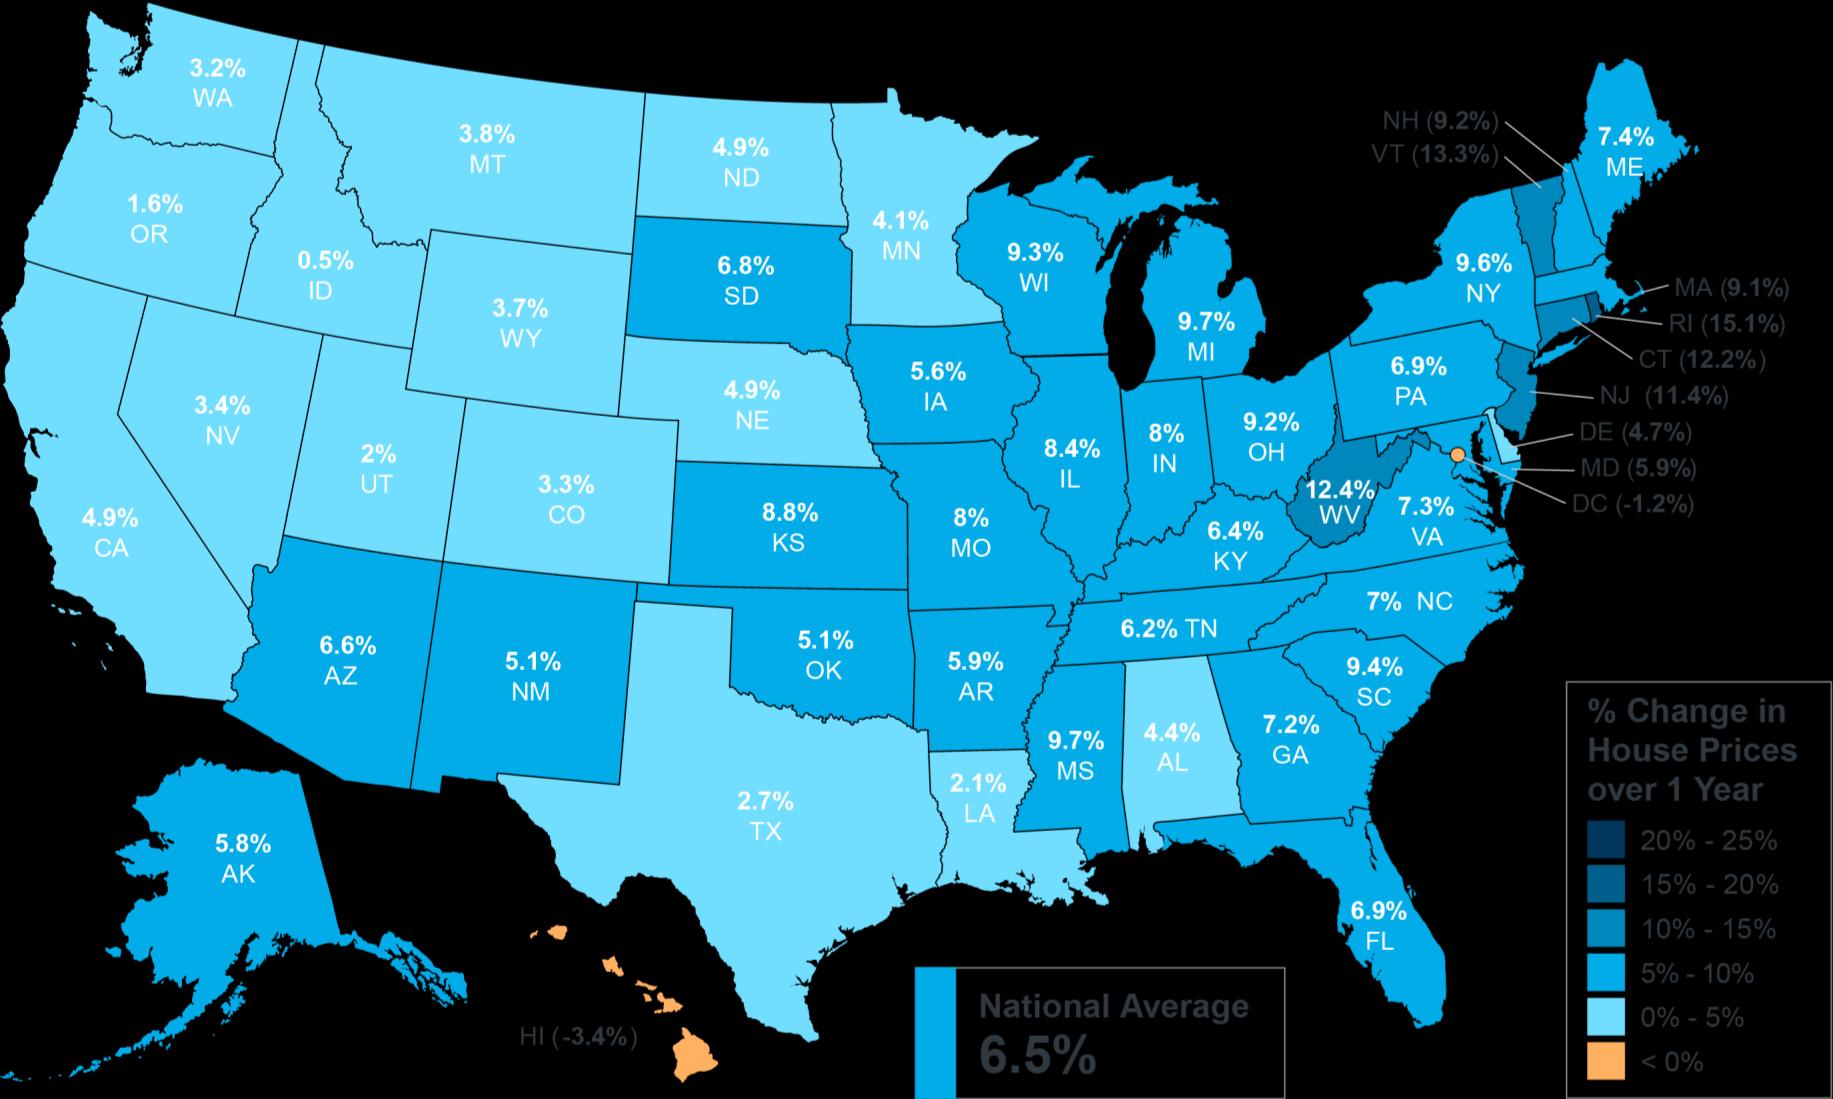
Source: FHFA
Year-Over-Year, Q4 2023
As mortgage rates continue to hover in the 7% range, it will be difficult to convince existing homeowners to move at the current time. Nevertheless, as recent surge in mortgage application data has shown, following a drop in rates, buyers are anxiously waiting to jump into the market. That means that 2024 is likely to show another year of home price highs.
- Selma Hepp, Chief Economist, CoreLogic


Home Price Expectation Survey
A nationwide panel of over one hundred economists, real estate experts and investment & market strategists.

Estimated Home Price Performance
Pre-Bubble Bubble Bust Recovery To Date 3.78% 3.36% 3.87% 4.18% 4.11% 2024 2025 2026 2027 2028 Source: HPES
December – December, as Forecast in Q1 2024
Potential growth in household wealth over the next 5 years based solely on increased home equity if you purchase a $400K home in January 2024 Pre-Bubble
Based on price appreciation projected by the Home Price Expectation Survey
Source: HPES
Bubble Bust Recovery To Date $400,000 $415,120 $429,068 $445,673 $464,302 $483,385 2024 2025 2026 2027 2028 2029
$83,385

Housing Inventory
Change in Inventory
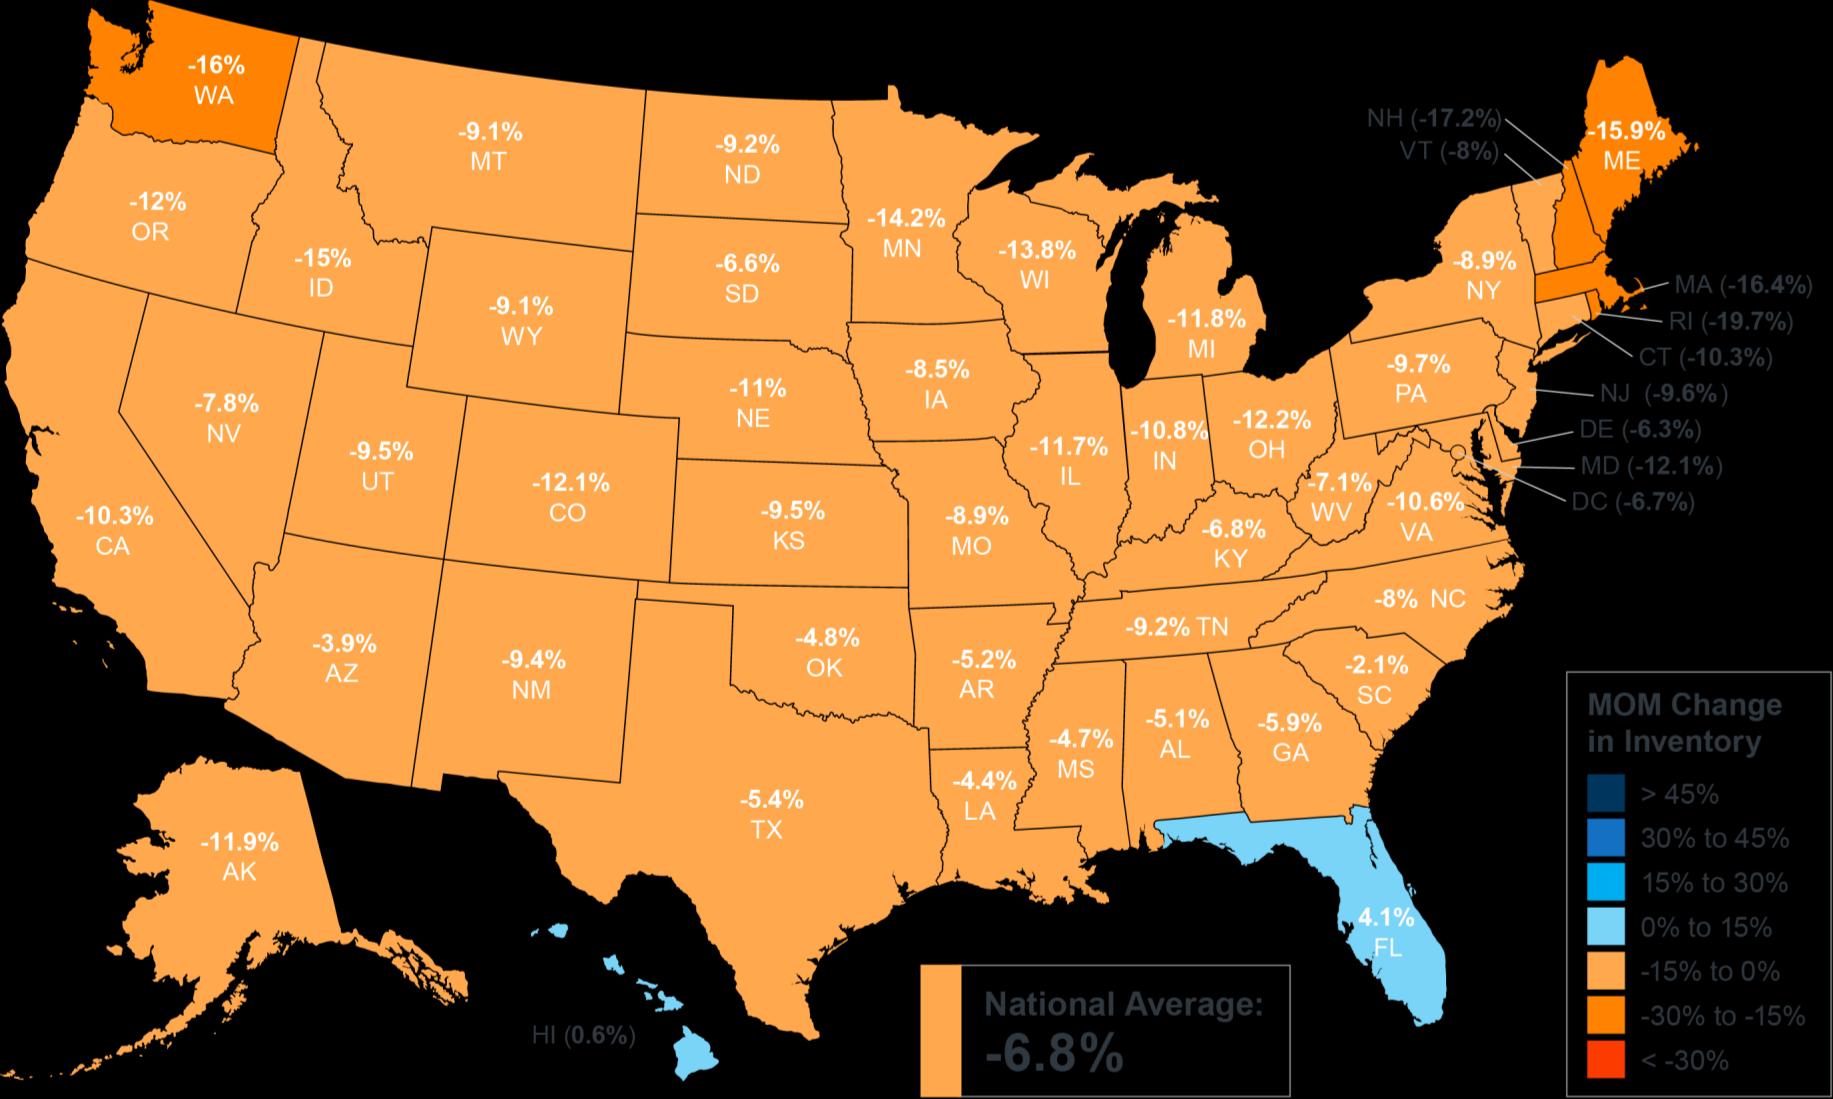
Source: Realtor.com
Month-Over-Month, January 2024
Year-Over-Year Inventory Levels
Source: NAR
-30% -20% -10% 0% 10% 20% 30% January 2014 January 2015 January 2016 January 2017 January 2018 January 2019 January 2020 January 2021 January 2022 January 2023 January 2024
