Contributors
LaurentBlond,DrMédVét,MSc,DACVR CliniqueVétérinaireLanguedocia 395rueMauriceBéjart 34080Montpellier,France
DonaldBrown,DVM,PhD,DACVMCardiology VermontVeterinaryCardiology PEAKVeterinaryReferralCenter 158HurricaneLane Williston,VT05495; AdjunctAssociateProfessor DepartmentofClinicalSciences TuftsCummingsSchoolofVeterinaryMedicine NorthGrafton,MA01536,USA
ÉricNormanCarmel,DMV,DACVR CentreVétérinaireLaval 4530Highway440 Laval,Québec,Canada,H7T2P7 & CentreHospitalierUniversitaireVétérinaire/Teaching Hospital
Facultédemédecinevétérinairedel’Universitéde Montréal Saint-Hyacinthe,Québec Canada,J2S7C6
SuzanneCunningham,DVM,DACVMCardiology AssistantProfessorCardiology DepartmentofClinicalSciences CummingsSchoolofVeterinaryMedicine, TuftsUniversity 200WestboroughRoad NorthGrafton,MA01536,USA
Marc-Andréd’Anjou,DMV,DACVR CentreVétérinaireRive-Sud 7415boulevardTaschereau Brossard,Québec,Canada,J4Y1A2 &
Facultédemédecinevétérinairedel’Universitéde Montréal
Saint-Hyacinthe,Québec Canada,J2S7C6
HuguesGaillot,DVM,MS,DiplECVDI CliniqueVétérinaireADVETIA 5rueDubrunfaut 75012Paris,France
SilkeHecht,Dr.med.vet.,DACVR,DECVDI AssociateProfessorofRadiology DepartmentofSmallAnimalClinicalSciences UniversityofTennesseeCollegeofVeterinaryMedicine Knoxville,TN37996,USA
JudithHudson,DVM,PhD,DACVR ProfessorofDiagnosticImaging DepartmentofClinicalSciences CollegeofVeterinaryMedicine AuburnUniversity Auburn,AL35849,USA
WilfriedMai,DrMédVét,MSc,PhD Chief,SectionofRadiology,DepartmentofClinical Studies ClinicalBoardMember,RyanVeterinaryHospital AssociateProfessorofRadiology SchoolofVeterinaryMedicine,SectionofRadiology UniversityofPennsylvania 3900DelanceyStreet, Philadelphia,PA19104,USA
RobertO’Brien,DVM,MS,DACVR Professor
CollegeofVeterinaryMedicine,SectionofRadiology UniversityofIllinois 1008WestHazelwoodDrive Urbana,IL61802,USA
DominiquePenninck,DVM,PhD,DACVR,DECVDI ProfessorofDiagnosticImaging DepartmentofClinicalSciences CummingsSchoolofVeterinaryMedicine, TuftsUniversity 200WestboroughRoad NorthGrafton,MA01536,USA
StefanoPizzirani,DVM,PhD,DECVS,DACVO AssociateProfessor,Ophthalmologyservice DepartmentofClinicalSciences CummingsSchoolofVeterinaryMedicine, TuftsUniversity
200WestboroughRoad NorthGrafton,MA01536,USA
RachelPollard,DVM,PhD,DiplomateACVR AssociateProfessorofDiagnosticImaging UniversityofCalifornia,Davis SchoolofVeterinaryMedicine DepartmentofSurgicalandRadiologicalSciences Davis,CA95616,USA
GabrielaSeiler,Dr.Med.Vet,DAVCR,DECVDI AssociateProfessor CollegeofVeterinaryMedicine 1052WilliamMooreDrive Raleigh,NC27606,USA
KathySpaulding ClinicalProfessorRadiology LargeAnimalClinicalSciences CollegeofVeterinaryMedicineandBiomedical Sciences TexasA&MUniversity 4475TAMU CollegeStation,TX77843-4475,USA
JamesSutherland-Smith,BVSc,DACVR AssistantProfessor,DiagnosticImaging DepartmentofClinicalSciences CummingsSchoolofVeterinaryMedicine, TuftsUniversity 200WestboroughRoad NorthGrafton,MA01536,USA
OlivierTaeymans,DVM,PhD,DipECVDI,MRCVS Hon.Assoc.ProfessorinVeterinaryDiagnostic Imaging–UniversityofNottingham Adj.Assoc.ProfessorinVeterinaryDiagnostic Imaging–TuftsUniversity,USA DickWhiteReferrals,SixMileBottom Cambridgeshire,CB80UH,UK
AllisonZwingenberger,DVM,DACVR,DECVDI AssistantProfessorofDiagnosticImaging DepartmentofSurgicalandRadiologicalSciences SchoolofVeterinaryMedicine UniversityofCalifornia 1ShieldsAvenue Davis,CA95616,USA
PracticalPhysical ConceptsandArtifacts
Marc-Andréd’Anjou1,2 andDominiquePenninck3
1 CentreVétérinaireRive-Sud,Brossard,Québec,Canada
2 Facultédemédecinevétérinairedel’UniversitédeMontréal,Saint-Hyacinthe,Québec,Canada
3 DepartmentofClinicalSciences,CummingsSchoolofVeterinaryMedicine,TuftsUniversity,NorthGrafton,MA,USA
Fundamentals
Sound comprisesaseriesofvibrationstransmitted throughanelasticsolid,aliquid,oragas.Sound waveshavevariablewavelengthsandamplitudes, withafrequencydefinedasbeingthenumberofcycles repeatedoveragiventimeinterval.Ahigh-frequency sound,therefore,hasashorterwavelengthand morecyclespersecond(cycles/sorHz)thana low-frequencysound.Thehumanearcanperceive soundsintherangeof20–20,000cycles/s,orup to20kHz(Hangiandreou2003).Beyondthisrange, itiscalled“ultrasound.”Ultrasoundfrequencies usedinmedicalimaginggenerallyvarybetween3 and12MHz,or3–12millioncycles/s,whichiswell beyondwhatthehumanearcanperceive.
Electroniclinearprobesareequippedwitharowof piezoelectriccrystals whosealignmentvariesfrom flat(orlinear)toconvex.Thematerialcontainedin eachoneisdeformedwhenitreceivesanelectrical charge,andemitsavibration–thisistheinitialultrasoundpulsation.Theultrasoundwavetravelsthrough thetissues,generatingseveralreturningwaves-or echoes-that,uponreachingtheprobe,makethecrystalsvibrateagain,producinganewelectriccurrent thattravelstothesystem’scomputerandprovides informationoneachofthereflectedwaves.Thesetof allthereflectedwavescreatestheultrasoundimage.
Toproducean image,thefirstpiezoelectriccrystals arestimulatedtogenerateashortultrasoundpulse–comprisingthreetofourwaves–thattravelsthrough tissueinterfacestoproducethousandsofechoes thataresentbacktotheprobe(Figure1.1).Shortly
afterward,anewultrasoundpulseleavestheprobe atadifferentangle,generatinganewsetofechoes thatreturntothesecondseriesofcrystals.Assuminga constantwavepropagationspeedof1,540m/sinsoft tissues,eachoftheseechoescanbelocatedprecisely alongthetrajectory,dependingonthetimeinterval betweenthedepartingwaveandthereturningecho (Hangiandreouetal.2003).Hundredsofwavelinesare producedthisway,scanningtissuesathighspeedto produceover30images/s,eachonecontainingthousandsofpixelsdescribingtheacousticcharacteristics ofthescannedtissues.
Tissueacousticcharacteristicsaredefinedbythe acousticimpedance,whichdictatestheirlevelof ultrasoundreflectionandthustheirechogenicity. Impedanceistheproductofthespeedofultrasound wavesthroughagiventissuemultipliedbyitsdensity (Table1.1)(Bushberg2011).Ultrasoundwavereflection isstrongeratinterfacesoftissuesthatgreatlydifferin acousticimpedance,andweakerwhentraversingan interfaceoftissueswithsimilaracousticimpedances. Mildvariationsinacousticimpedancearedesirablefor tissueexamination,resultinginvariableechogenicity andechotexture,whichallowinternalarchitectures tobecompared.Infact,notonlydoestheultrasound systemlocatetheoriginofeachecho,italsomeasures itsintensity,whichisexpressedintermsofpixel brightnessontheunitmonitor(Bmode).
Normal tissueechogenicity,whichvariesamong organsandstructures(Figure1.2),anddamagedtissue withalteredacousticcharacteristicscanbecompared. Normalandabnormalstructurescanbedefinedin termsofechogenicityashypoechoicorhyperechoicto
AtlasofSmallAnimalUltrasonography,SecondEdition.EditedbyDominiquePenninckandMarc-Andréd’Anjou. ©2015JohnWiley&Sons,Inc.Published2015byJohnWiley&Sons,Inc. Companionwebsite:www.SmallAnimalUltrasonography.com
Table1.1
Densityandspeedofsoundinmaterialsandbiological tissuesandresultingacousticimpedance
Materialor
Air1.23300.0004 × 106
Lung3006000.18 × 106
Fat9241,4501.34 × 106
Water1,0001,4801.48 × 106
Softtissues(ingeneral)1,0501,5401.62 × 106
Liver1,0611,5551.65 × 106
Kidney1,0411,5651.63 × 106
Skullbone1,9124,0807.8 × 106
Source:Bushbergetal.(2011).
theirnormalstate,ortootherstructureswithwhich theyarecompared.Fluidswithoutcellsorlarge particlesareanechoic(i.e.,totallyblack)becauseofthe absenceofreflectors.
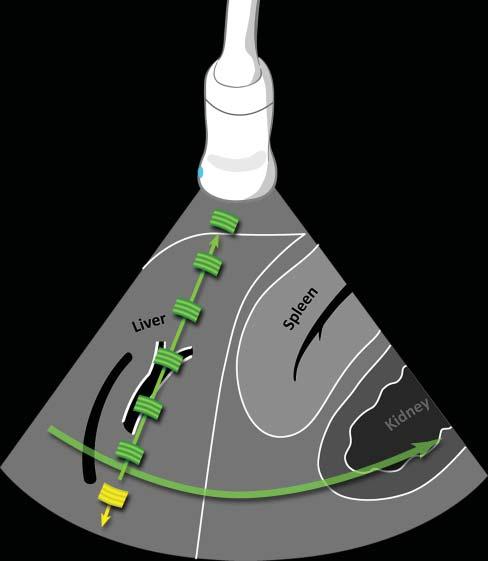
Interactionsbetweenultrasoundwavesandtissues andmaterialsvary,dictatingtheintensityofechoes generatedandtheresidualintensityofthepulsethat pursuesitscoursethroughtissues(Hangiandreou etal.2003)(Figure1.3).Forinstance,ultrasound wavespenetratingfatresultin acousticdiffusion,or scattering,astheprimaryinteraction,reducingthe
Figure1.1. Ultrasoundpropagationandimageformation. Eachultrasoundimageisformedbytheadditionofhundredsofindividualscanlines.Eachlineisproducedaftera singleultrasoundpulse(inyellow)isemittedbythetransducer.Asthispulsepropagatesthroughsofttissues,many echoes(ingreen)aregeneratedatinterfacesofdifferentacousticimpedance(suchashepatocytes–connectivetissue),producinganimageofvariableechogenicityandechotexture. Eachechoisanatomicallylocalizedbasedonthetimeinterval betweentheemittedpulseanditsreception.Afteraspecific time,anewpulseisemittedalonganadjacentline,producing anadditionalscanline.Scanlinesaregeneratedveryrapidly andsuccessively,producing15–60images/s,allowing“real time”ultrasonography.
intensityoftheinitialpulse.Thistypeofinteraction alsoexplainstheechotexture–i.e.,granularity–ofthe parenchymathatvariesamongorgans.Ontheother hand,theinteractionwithasmoothinterfacethat isperpendiculartothebeamaxis,suchastherenal capsuleinFigure1.3,causes specularreflection,which producesintenseechoesintheoppositedirectionof theinitialpulse.Somematerialslikemineralabsorba significantcomponentoftheinitialpulseenergythat becomestooweaktogenerateechoesfromdeepertissues.Ultrasound absorption canthencauseashadow (seethesection“Artifacts”).Finally,ultrasoundwaves maychangeindirectiondueto refraction.Inreality, thesetypesofinteractionsareoftencombinedand theirpresenceandrelativeimportanceismainly influencedbythedifferencesinacousticimpedance andbytheshapeofthetissue(ormaterial)interfaces. Theseinteractionscausetheemittedultrasoundpulse energytoeventuallybecomecompletelydissipated.
UltrasoundProbes andResolution
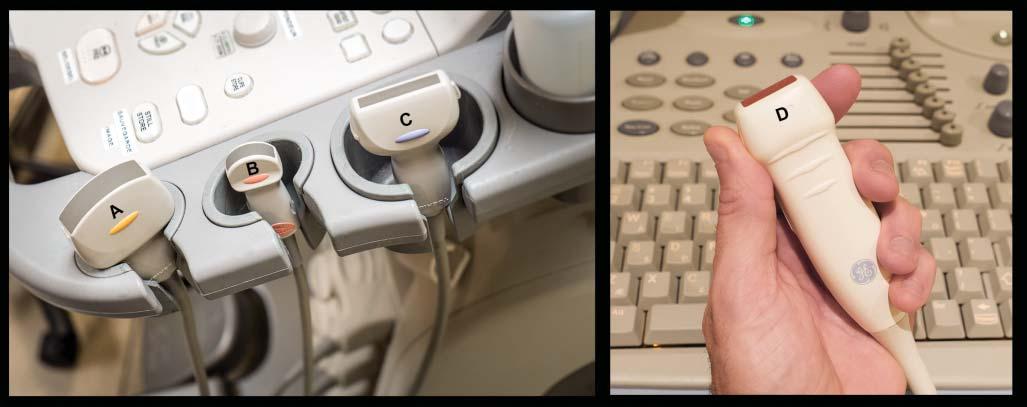
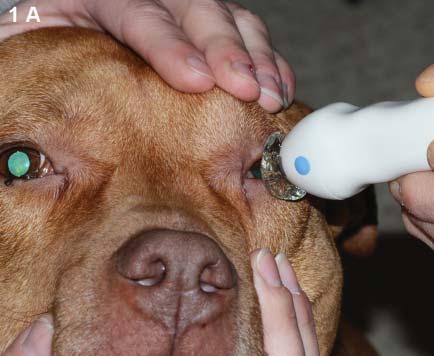
Ultrasoundprobes varyinconfigurationsforspecific needs(Figure1.4).Curvedlinearprobes,alsocalled convexormicroconvex,haveoneorseveralrowsof piezoelectriccrystalsalignedalongaconvexsurface, withvaryingbeamsandtracks.Theseprobesproduce

Figure1.2. Relativeechogenicityoftissuesandothermaterials. Structurescanberecognizedanddifferentiatedbytheir echogenicity.Thisfigureillustratestherelativeechogenicityofnormalabdominalstructuresindogsandcats.Notethat thewallsoftheportalvein(PV)arehyperechoicevenwhenthisveinisnotperpendiculartotheinsonationbeam,differing fromtheadjacenthepaticvein(HV).TheHVandsplenicvein(SV)externalinterfacesonlybecomehyperechoicwhenperpendiculartothebeam.Thefluidinthesmallintestinal(SI)lumen(Lu)isnotfullyanechoicbecauseoftheingestedparticles.The renalcortexisoftenhyperechoicinnormaldogsandcatsandmaybecomeisoechoictotheliverandeventothespleen.The adrenalmedullamaybehyperechoicincertainnormalanimals,sometimesexceedingtheechogenicityoftherenalcortex.Itis importanttopointoutthattissueechogenicitymayalsobeinfluencedbyseveralequipment-relatedfactors,suchastransducer frequencyandorientation,focalzonenumberandposition.
Figure1.3. Interactionsbetweenultrasoundwavesand tissues. Theemittedultrasoundpulseischargedwithenergy. Inthisexample,thepulseinitiallyinteractswiththeabdominalfat(1),causingacousticdiffusion(greenhalo)andpartly losingitsenergyasitcontinuesitscourse.Wheninteractingwithasmooth,linearinterfacesuchastherenalcapsule (2),astrongspecularreflectionoccursthatgeneratesahighly intenseecho(greenarrow).Theweakerultrasoundpulsethen reachestherenalpelviccalculus,whichabsorbsmostofthe waveenergywhilecausingastrongreflection(greenarrow). Anacousticshadowisgeneratedandtheinitialpulseenergy iscompletelydissipated.
atriangularimagebecauseofthediverginglinesof ultrasoundwavestheygenerate.Themainassetsof thistypeofprobeareitssmallerfootprintanditslarge scanningfield,makingittheidealprobeforassessing theabdomen,particularlythecranialportionalong
theribcage.Thepiezoelectriccrystalsofthelinear probesaredistributedalongaflatsurface,producing arectangularscanfield.Thephaseintervalofthe impulsionscanalsoproduceatrapezoid-shaped image,allowingittocoveralargersurface.Thisis
Figure1.4. Practicalultrasoundtransducers. Mostultrasoundunitsareequippedwithconvex (A,B) andlinear (C) electronictransducerswithvariablefrequencies.Amacroconvexprobe (A) offeringlowerfrequencies(3–8MHz)isbestsuitedfor theabdomenoflargedogs,whereasamicroconvexprobe (B) ofhigherfrequencyandsmallerfootprintispreferredforthe abdomenofsmallpatientsandwhenonlyasmallacousticwindowisavailable(e.g.,theintercostalapproachofalunglesion). Ahigh-frequency(10–18MHz)linearprobe (C) ismostusefulforassessingsuperficialstructuresonarelativelywideandflat surface(e.g.,assessingbowelsinacat,bicepstendoninadog).Aphasedarraytransducer (D) offersasmallflatfootprintand isidealforechocardiography.
especiallyusefulwhenevaluatingsuperficialorgans whosediametermaybegreaterthanthewidthofthe scannedarea,suchasthekidneysandspleen.The lengthoftheprobe’sfootprintindicatesthewidthof theareaitscans.
Spatialresolution istheabilityofasystemtorecognizeanddistinguishtwosmallstructureslocated closetogether.Forinstance,optimalspatialresolution allowsustodistinguishbetweentwosmallnodules intheliverinsteadofmistakingthemforonlyone,or
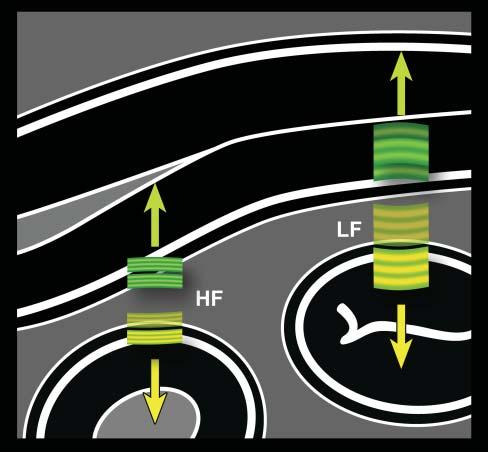
Figure1.5. Ultrasoundfrequencyversusaxialresolution. Thehigherthefrequency,theshorterthepulse.Becausethe lengthofthepulsedoesnotchangeindepthorafterinteractionwithtissues,high-frequency(HF)echoes(ingreen)that comebacktothetransducerarebetterdiscriminatedbythe system.Closelyassociatedinterfaces,suchassmallintestinal walllayers,arethenbetterrepresented.Conversely,echoes fromcloselyalignedlayersgeneratedbyalow-frequency(LF) pulse(inyellow)partlyoverlapandareinterpretedbythesystemasoriginatingfromasingleinterface.Thisphenomenon isexaggeratedinthisillustrationforbettercomprehensionof thisimportantconcept.
missingalesionthatisadjacenttoanormalstructure. Thespatialresolutionalongthepathoftheultrasound beam–the x-axis–isdeterminedbythelengthof thepulse,whichinturnisrelatedtowavefrequency (Figure1.5).Astheultrasoundfrequencyremains constantwithdepth,sodoestheaxialresolution. Conversely,lateral(y-axis)andslice-thickness(z-axis) resolutionsvarywithdepthastheultrasoundbeam changesinshapetonarrowatthelevelofthefocalzone (Figure1.6).Foragivenprobe,theaxialresolutionis

Figure1.6. Shapeoftheultrasoundbeamindepth. The ultrasoundbeamislargeratitsemissionpoint(piezoelectricelements)beforenarrowingatthefocalpoint(FP),and becominglargeragainfurtherindepth.Thischangeinshape affectsthelateralresolution(LR,i.e.,beamwidth)andslice thickness(ST,orelevationalresolution),butdoesnotaffect theaxialresolution(AR),whichisdictatedbythepulse frequencythatremainsconstantindepth.Generally,the axialresolutionissuperiortotheotherresolutions.The whitearrowsrepresentthepathofeachwaveline,whichis repeatedalongthegreycurvedarrowtocovertheentirefield.
generallysuperiortolateralorslice-thicknessresolutions,meaningthatmeasurementsshouldbeobtained alongthat x-axis,wheneverpossible.
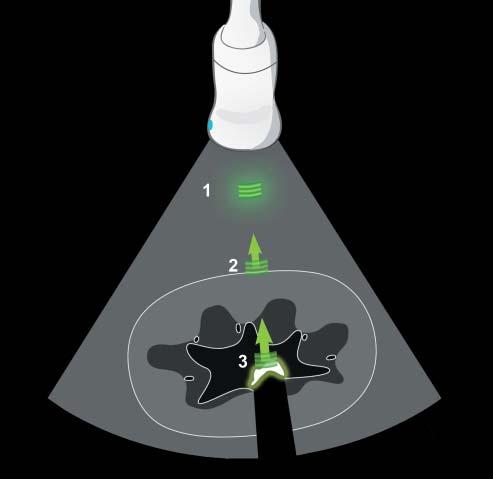
Contrastresolution isthesystem’sabilitytodifferentiatestructuresthatpresentsmalldifferencesin acousticbehavior(Figure1.7).Theinfluenceofthese twotypesofresolutionissignificantandhingeson imagequality,theabilitytoevaluatestructuresandto detectanddescribelesions.
Asseenearlier,ultrasoundwavesinteractwithtissuesindifferentways,causingtheinitialpulsetoprogressivelyloseitsintensityindepth.Thisattenuation limitscontrastresolutionindeeperareas,particularly whenusinghigh-frequencyprobes.Indeed,thecoefficientofattenuationofultrasoundwavesthroughtissuesincreasesindirectproportiontowavefrequency.

Figure1.7. Spatialandcontrastresolutions. Thecapacityofanultrasoundsystemtodetectanddistinguishstructuresofsmallsizeandsimilaracousticcharacteristicsgreatly influencesitsdiagnosticcapability.Inthisillustration,the hyperechoicnodule1isclearlydepicted.Itscharacteristics (size,echogenicity,andmargin)favoritsidentification.The hypoechoicnodule2isalsovisualizedduetoitssizeand markedhypoechogenicity,butithasill-definedcontours. Nodules3and4arelargerbutlessconspicuousbecause oftheirechogenicity,whichissimilartotheregionalliver parenchyma.Thecontrastresolutionofthesystem–and certainimageadjustments–dictatesitscapacitytoidentify structuresofcharacteristicsthataresimilartothebackground.Thesmallhypoechoicnodule5isdifferentiatedfrom theadjacenthepaticveinbecauseofsufficientspatialresolution.Lowerspatialresolutionwouldcausethisnoduletobe confusedwiththevessel.
Excessivebeamattenuationcanbeparticularlyproblematicincertainanimals,suchaslargeobesedogs,or withcertaindiseaseprocesses(e.g.,lipidosis).Theuse oflower-frequencyprobescanpartiallycompensate forthislossofsignal,butatthecostofreduceddetail (lowerspatialresolution).Generally,theprobeoffering thehighestfrequencybutallowingalldesiredtissues tobeimagedwithsufficientsignalshouldbeselected.
SystemAdjustments andImageQuality
Imagescanbefrozentotakemeasurementsand addtextpriortorecordingstillorloopedimages thatcanbearchivedorsubmittedtoacolleaguefor anotheropinion.Butbeforebeingrecorded,they mustbeoptimized.Exceptforautomaticprocesses, manyadjustmentscanandshouldbemademanually
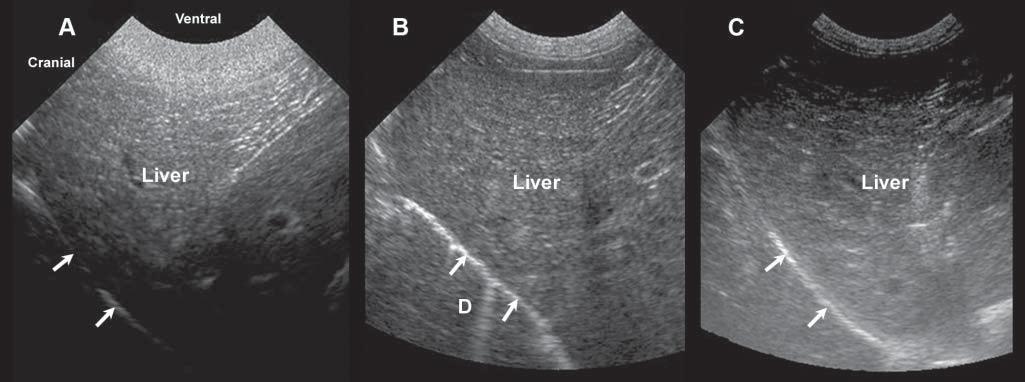
Figure1.8. Gainsetting. Becauseoftheattenuationoftheultrasoundbeamasittravelsthroughsofttissues,theamplification ofechoesreceivedmustbeadjustedaccordingtotissuetypeanddepth.Thismodulationcanbemadeusingtimegaincompensationbarsorfar/near/generalgainknobs.Thesethreeimagesshowthevariationinechogenicityofanormalliverwith excessiveneargainandinsufficientfargain (A),well-adjustednearandfargains (B),andinsufficientneargainandexcessive fargain (C). D,diaphragminterface.
throughouttheexamination.Changesintissuedepth andacousticpropertiesrequireconstantadjustments.
The gain determinesthelevelofamplificationof echoestocompensatefortheirattenuationintissues, increasingthebrightnessofcorrespondingpixelson thescreen.Itcanbeadjustedgenerally,ormodulated specificallyindepth(Figure1.8).Timegaincompensation(TGC)isadjustedthroughslidingknobs, reducingsuperficialamplificationorincreasingdepth amplification,forinstance.Asultrasoundattenuation willvaryfromoneanimaltoanotherandfromone abdominalregiontoanother,dependingontheacousticcharacteristicsofnormalandabnormaltissues, boththegeneralgainandTGCwillhavetobeadjusted duringtheexamination.
Imagefield depth determinesthelengthofthelong axis,allowingthesamestructuretobeimagedcompletely,orpartly.Thisalsoneedstobeadjustedcontinuallytomaximizethevisualizationofstructuresin theregionofinterest.
Theultrasoundbeamcanbeelectronically focalized toreduceitsdiameterataspecificdepth.Inthefocal zone,thebeam’swidthandthicknessareconsiderably reduced,increasingthecapacityofthesystemto depictsmallstructuresalongthe y (lateral)and z (slice-thickness)planes,respectively(Hangiandreou etal.2003)(seeFigure1.6).Moreover,theintensityof thebeamisconcentratedoverasmallarea,increasing thesignalfromtissuesinthatregion,favoringcontrast resolution.Thus,thefocalzoneshouldbeadjusted duringexaminationatthedepthoftheregionof
interest.Byusingtwo(ormore)focalzones,thebeam isnarrowedoveragreaterdistance,increasingthe spatialandcontrastresolutionoveralongerdepth. Thedownside,however,isthatusingmorezones requiremoretime,therebyreducingtheframerate, whichmaylimittheexaminationofamovingstructure.Multifocaloptimizationiseasierwhileevaluating structuresthatarecompletelyimmobile.
Noise isaninherentpartofallimagingprocedures andcanbecomeproblematicinlargepatientsorwhen usinglow-endsystems.Itresultsfrominsufficient signal(i.e.,echoes)emanatingfromtissuesandreachingtheultrasoundprobe,fromelectricinterferences, fromartifacts(seethesection“Artifacts”),andfrom impropersignalprocessingbytheunit.Theresultis acoarse-grainedtexturedand/orgrayishimagethat doesn’trepresentnormaltissueanatomy,andwhich limitsourabilitytoviewshadesofgray(reduced contrastresolution).Noisecanbepartlyreduced byusingahigher-frequencyprobe,byswitchingto theharmonicorcompoundimagingmodes,orby increasingoutputpower.
Spatialcompoundimaging (whichvariesinname amongbrands)referstotheelectronicsteeringof ultrasoundbeamsfromanarraytransducertoimage thesametissuemultipletimesbyusingparallelbeams orientedalongdifferentdirections(Hangiandreou etal.2003)(Figure1.9).Tissuesarescannedfrom differentangles,simultaneously,allowingmultiple echoesfromthesametissueinterfacestobecollected andcombined,increasingtheoverallsignaland

Figure1.9. Spatialcompoundimaging.A: Withthismode,thesametissueisscannedusingdifferentbeamangulations (steering)toproduceatrapezoidalimagethatiswiderthanthefootprintofthetransducer. B,C: Superficialstructuressuchas thiskidneymayexceedthesizeoftheimagefieldwhenthestandardlinearmode (B) isused,whereasspatialcompounding expandsthewidthoftheimagetoincludethekidney,whichcanbefullyassessedandmeasured (C).Beamangulationalso influencestheshapeandorientationofshadowingartifacts(arrowheads). reducingnoise.Imagecontrastisincreasedandtissue interfacesbecomemoreconspicuous.Tissuesboundariesarebetteroutlinedand,becausebackground noiseisreduced,cysticlesionsarefullyanechoicand thusmoreeasilydifferentiatedfromsolidlesions.On theotherhand,certainusefulartifacts,suchasacoustic shadowing–whichhelpsinrecognizingmineral,for instance–maydisappearwhencompoundimaging isused.Becausemultipleultrasoundbeamsareused tointerrogatethesametissueregion,moretimeis requiredfordatacollection,reducingtheframerate whencomparedwiththatofconventionalB-mode imaging.Thismodemaylimittheexaminationof movingpatients.
The harmonicmode alsoincreasestissuecontrastby selectingechoesataspecificfrequency.Thetermharmonicreferstofrequenciesthatareintegralmultiples ofthefrequencyofthetransmittedpulse(whichisalso calledthefundamentalfrequency, f,orfirstharmonic). Harmonicfrequencyechoes(1/2f,2f,etc.)develop becauseofthedistortionofthetransmittedpulse asittravelsthroughtissues(Ziegleretal.2002).The initialpulseinfactdeformsfromaperfectsinusoidtoa sharper,sawtoothshape,generatingreflectedechoesof severaldifferentfrequencies.Theuseofhigher-order harmonicechoesinsteadofthefundamentalechoes resultsinimprovedimagecontrastandreducednoise, increasingnormalandabnormaltissueconspicuity. Thereductionofartifactsandclutterismostefficientin thenearfield.Thismayproveparticularlyvaluablein largepatientswiththickabdominalwallsandsubcutaneousfatplanes.Theharmonicmodeisalsousedfor contrast-enhancedultrasonography(seeChapter16, “ClinicalApplicationsofContrastUltrasound”).
Finally,severalotheraspectscaninfluencethequalityofultrasoundimages.Asfordigitalradiographs, thequalityoftheunitmonitor(size,dynamicrange, brightness,calibration)caninfluenceourabilityto accuratelyassessultrasoundimages.Severalfeatures canbeusedandmodulatedtocreatescanningpresets, fordifferenttypesofpatientsorbodyparts.Sonographersmustbeawareofthestrengthsandlimitations oftheirsystem.
DopplerUltrasound
Introduction
Dopplerultrasoundprovidesinformationonthepresence,direction,andspeedofbloodflow.Adetailed descriptionofDopplerultrasoundisbeyondthescope ofthispracticalatlas,butreadersareencouragedto consultreferencetextbooksandarticlesinorderto furthertheirunderstandingofitsconcepts.
Dopplerultrasoundisbasedontheinteractionof ultrasoundwithparticlesinmovement,leadingto achangeinthefrequencyoftheechoesreceived, thisphenomenonisknownasthe Dopplereffect (Figure1.10)(Boote2003).Thiseffectisdisplayedand evaluatedwithcolorschemeswhenusingcoloror powerDopplermodes,orgraphicallywithspectral Doppler(Figures1.11,1.12).Thenumerousapplicationsofthesemodesarehighlightedinseveralfigures throughoutthebook,andparticularlyinChapter6.
FlowImagingModes
With colorDoppler,acolormapisusedtodisplay thedirectionandvelocityofthebloodflow.Thesize
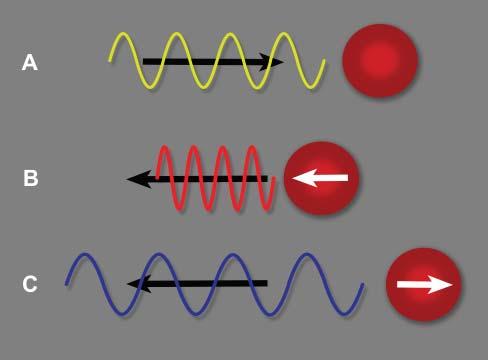
Figure1.10. Dopplereffect.A: Theultrasoundpulseemittedbytheprobemovesindirectionofaredbloodcell(RBC) ataspecificfrequency. B: IftheRBCmovestowardthispulse, apositiveDopplershiftoccurs,increasingthefrequencyof thereturningecho.Thewavelengthisreduced. C: IftheRBC movesawayfromthispulse,thefrequencyofthereturning echoisreducedanditswavelengthisincreased.Thisnegative Dopplershiftisdisplayedasabluesignalinthestandardcolor Dopplermode,whereasbloodflowmovinginthedirectionof theprobeisdisplayedinaredhue.

Figure1.11. ColorandpowerDopplermodes.A: WithcolorDoppler,thedirectionofbloodflowcanberapidlydetermined. Inthisdog,therightexternaliliacartery(a)andvein(v)showredandbluecolorhues,indicatingflowsdirectedtoward andawayfromtheprobe,respectively. B: Colorhuecanchangeinthesamevesselduetoachangeindirectionoftheflow, asdemonstratedinthistortuousportosystemicshunt(PSS).Thearrowsindicatethedirectionoftheflowthroughthatshunt. Whentheflowbecomesperpendiculartotheprobe,asignalvoid(*)appearsbecauseofthelackofDopplershift.PowerDoppler maybecomeusefulinsuchcircumstance. C: PowerDopplerhelpstodistinguishthisdilatedcommonbileduct(arrowhead) inacatfromthenearbyportalvein(PV)andcaudalvenacava(CVC). D: PowerDopplermayalsobeusedtodetectaureteral jetcomingfromapatentureter,asopposedtotheipsilateralureterwhichisobstructedbyasmallurolith(arrowhead).
andlocationoftheinterrogationboxareadjusted toprovideanoverallviewoftheflowinagiven region,andsuperimposedontheB-modeimagefor anatomicallocalization.ColorDopplerisessentialfor cardiacevaluation(seeChapter5),butcanalsoserve intheassessmentofotherbodyparts.Itallowsrapid identificationofvesselsandevaluationoftheirflow characteristics,aswellasdetectingaberrantvessels suchasportosystemicshuntsorarteriovenousfistulas andassessingtissueperfusion ColorDopplermode
requiresthatcolormapsandB-modedataareacquired simultaneously,limitingtemporalresolution,and oftenreducingthespatialresolutionoftheunderlying B-modeimage.Limitingthesizeoftheareaofcolor investigationtotheregionofinteresthelpstoincrease theframerate,thusimprovingtemporalresolution. Colorgainshouldalsobecarefullyadjustedsothatthe colorsignalsdoesnotextendbeyondvascularwalls.
PowerDoppler –alsoknownasenergyorangioDoppler–ismoresensitivetoflowsoflowvelocity asitdisplaysthesummationofalloftheDoppler shiftsignalsratherthanthemeaninagivenarea. Thismodeisfavoredforconfirmingorinformingthe presenceofbloodflow,particularlyinsmallervessels, ortodifferentiatebloodvesselsfromothertubular structuressuchasthecommonbileduct(Figure1.11).
However,asopposedtothecolormode,itdoesnot provideinformationonthedirectionorvelocityof bloodflow.Mostnewerultrasoundsystemsnowoffer ahybridcolormodecombiningthesetwomodes.
Spectral(orpulsed-wave)Doppler examinesblood flowataspecificsiteandprovidesdetailedgraphic analysisofthebloodflow.Theflowcharacteristicssuch asvelocity,directionanduniformitycanbeprecisely assessedovertime,i.e.,throughoutthecardiaccycle (Figure1.12).Flowvelocitiesandindicescanbemore accuratelymeasuredthanwithcolorDoppler.Infact, theflowpatternsofnormalandabnormalabdominal vesselshavebeenwelldescribedindogs(Szatmari etal.2001;d’Anjouetal.2004;seealsoChapter6). Sonographersshould,however,becarefultomeasure flowusinginsonationangles–whichcanbemanually


Figure1.12. PulsedorspectralDopplermode.A: Theflowinthisexternaliliacartery(a)ismainlydirectedoverthebaseline (b),i.e.,towardtheprobe,andpulsatesaccordingtotheheartbeat.Itschangesindirectionandvelocityarerepresentedover timeinthisgraph.Notethattheanglecursor(arrow)isappropriatelyalignedtothelongaxisofthevesseltomeasurethe velocityvectoralongthatline,whichreachesamaximumof91.8cm/sandameanof15.7cm/s. B: Changingtheangleofthis linecursorresultsinmeasurementerrors.Theultrasoundunitestimatestheflowvelocitiesbasedonthemeasurementofthe Dopplershiftalongthatline(66.5and11.6cm/sformaximalandmeanvelocities,respectively). C: Theflowintheadjacent vein(v)isdirectedcranially,awayfromtheprobe,andisthereforerepresentedbelowthebaseline.Itfluctuatesintime(upto about30cm/s)butisnotpulsatileasthearterialflow.Afewweakpeaksoftheadjacentarterialflowareapparentonthegraph (arrows).Notethatthecorrectionanglewasof55degrees,whichreducesthechanceoferrorsinflowvelocityestimation.
adjustedinthesamplingwindow–wellalignedto flowmovementandnotexceeding60degreestolimit measurementerrors(Figure1.12).
Artifacts
Introduction
Artifactsareomnipresentinultrasound,theyareoften partoftheimages,andmayleadtomisinterpretations (Kirberger1995;Feldmanetal.2009;Hindietal.2013). Inmedicalultrasound,itisassumedthat:
1. Ultrasoundwavesalwaystravelinstraightlines fromtheiremittingpoint.
2. Thelateralwidthanddepthofthebeamarenarrow andconstant.
3. Eachinterfacegeneratesasinglereflection.
4. Theintensityandlocationofechoesdisplayedas pixelsonthemonitortrulycorrespondtothereflectingpowerandanatomicallocationofstructures beingscanned.
5. Thespeedoftheultrasoundwavesandthecoefficientofattenuationareconstantwithintissues.
6. Eachechoseenonthescreencomesfromthemost recentlytransmittedwave.
Inreality,theseassumptionsaretheoretical,andthe soundinteractionwithbiologicaltissuesiscomplex andresponsibleformanyexplainedandunexplained artifacts.Additionally,theunderstandingofphysical propertiesofartifactshasbeenstudied invitro by severalauthors(Barthezetal.1997;HengandWidmer
2010),buttheseconditionsdonotrepresentwell thecomplexityofnumerousfactors,suchasprobe frequency,shape,operatorsettings,nature,anddepth oftissuesevaluated.
Deleteriousartifacts,suchasgas-inducedreverberation,canbepartlycontrolledbyadequatepatient preparation,scanningmethods,andsystemadjustments.Gastrointestinalcontentisresponsiblefor mostartifactsandcanbepartiallyreducedbyfastinganimalsbeforetheirexamination.Poorcontact betweentheprobeandtheskin,duetohair,debris, orcrusts,alsolimitsthetransmissionandreceptionof ultrasoundwaves.
Althoughartifactsareoftenresponsibleforimage degradation,theycanhelpwithinterpretingimagesin manyinstances.Theirrecognitionisusedtodetectand confirmthepresenceofcalculiortissuemineralization, gas,cysts,andforeignbodies.
AcousticShadowing
Shadowingisazoneofechoeswithreducedamplitude beyondahighlyattenuatingorreflectivestructure. Mostoftheincidentbeamisabsorbedand/orreflected attheinterface.Auniformlyanechoicshadowiscalled “clean,”whiletheterm“dirtyshadowing”isused whentheshadowisinhomogeneous(Rubin1991; Hindietal.2013).Cleanshadowingisencountered whenabsorptionoftheincidentbeamhappensata hyperattenuatinginterface,suchasbone,calculi,or compactforeignmaterial,thatislargerthantheultrasoundbeamwidth(Figure1.13A).Theshadowmaybe
Figure1.13. Acousticshadowingisapoorlyechoictoanechoiczonelocatedbelowahighlyattenuatinginterface.A: The cleanshadowbehindthislargegallbladdercholelithhasthetriangularshapeofthemicroconvexprobethatwasused. B: Dirty shadowingisnotedassociatedwiththemixedgasandstoolspresentinthecolon.Theextensiveartifactisshapedsimilarlyto thelongitudinalprobethatwasused.
partialbehindcalcificationsandcalculithatmeasure lessthan0.5mm(Hindietal.2013).Partialshadowing mayalsoappearbehindfatorfibrosis(Mesurolleetal. 2002;Hindietal.2013),dependingonthesize,the attenuationcharacteristicsofthebackgroundtissue, andtheequipmentandsettings,althoughthishasnot beenwelldocumentedinveterinarymedicine.
Dirtyshadowing ispresentwhentheincidentbeam ismostlyreflected,suchasatasofttissue–gasinterface (Figure1.13B).
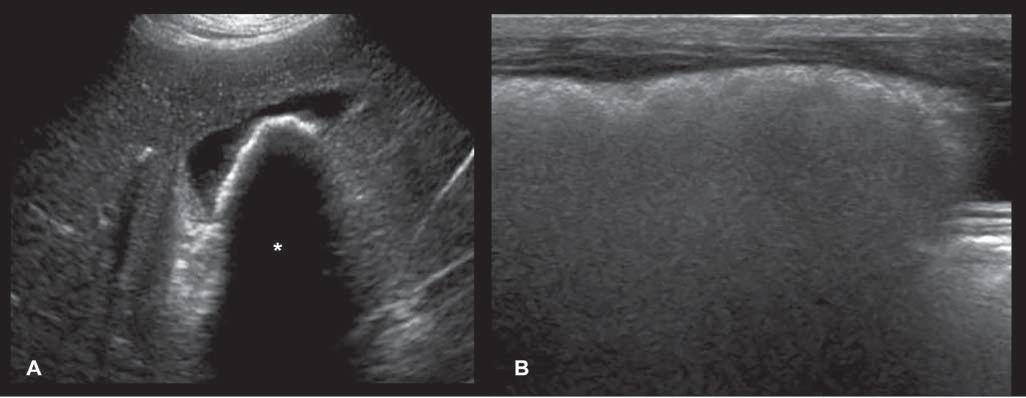
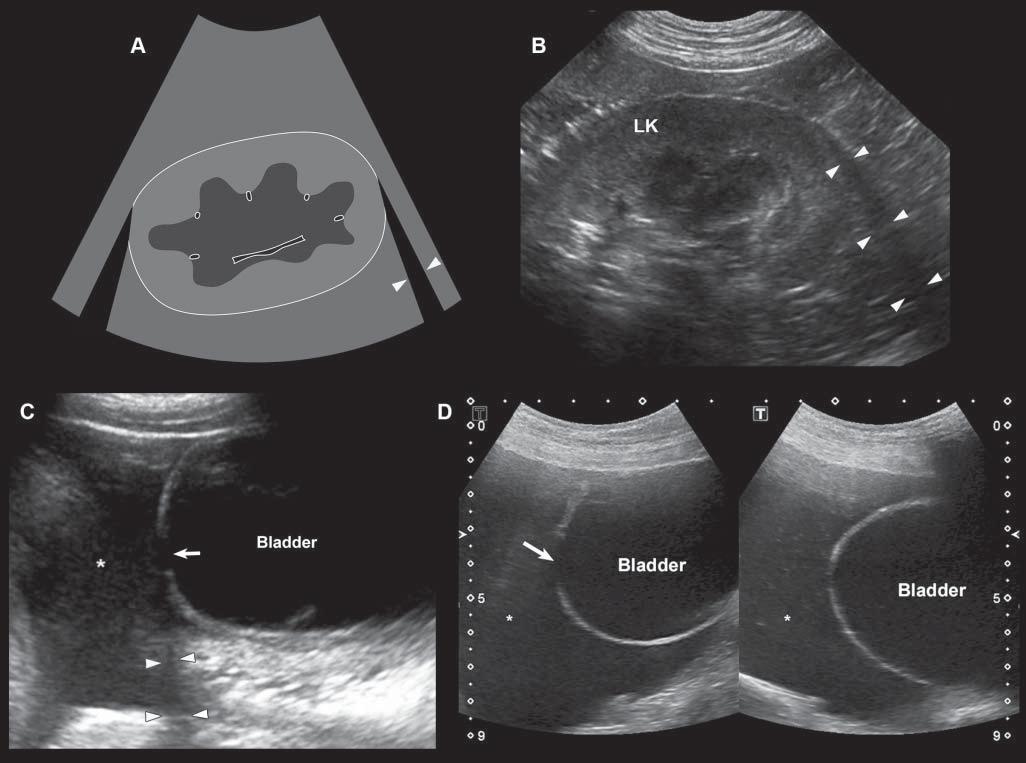
Edgeshadowing appearsasdiscrete,triangular zonesoflowamplitude,attheedgeofacurved structure(Figure1.14A).When,thecurvedstructure isfluidfilled,theedgeshadowingartifactbordersthe enhancementartifact.Thistypeofrefractiveshadowingcanbeconfusing,especiallywhenitoccursatthe
cranialaspectofafluidfilledbladder,andappearsas a“defect”ofthewall(Figure1.14B).
AcousticEnhancementorIncreased Through-transmission
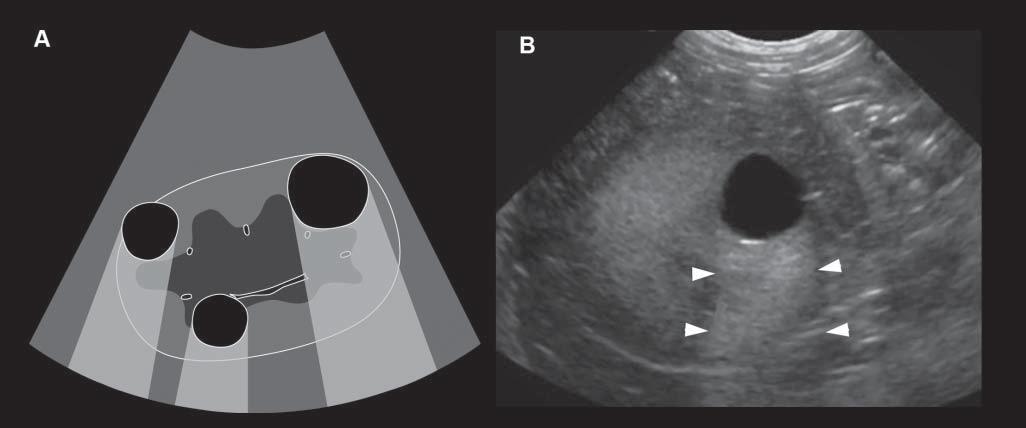
Conversely,wavesencounteringastructurethatallows themtopassthroughmoreeasily(poorlyattenuating), suchasaliquid-filledcyst,remainofhigherintensity whenreachingthedeepertissues,allowingechoesof greaterstrengthtoreturntotheprobe.Consequently, thesedeepertissuespresentanartifactualincreasein echogenicity(Figure1.15).Acousticenhancementis typicallyrecognizeddeeptoafluid-filledstructureina softtissuebackground,suchasdeeptothegallbladder ortoalivercyst,makingthemeasytoidentifyand
Figure1.14. Edgeshadowingandrefraction.A,B: Edgeshadowing(arrowheads)isoftenseeninprolongationoftherenal pole.LK,leftkidney. C: Thecurvatureofthebladderwallcausesbeamrefraction,whichresultsinanacousticshadow(arrowheads)inthisdogwithechogenicperitonealeffusion(*).Aholeinthebladderwall(arrow)isartifactuallycreated. D: Inanother dogwithcardiactamponadeandmarkedperitonealeffusion(*),theartifactualholeinthebladderwall(arrow)isattenuated byrepositioningthetransducerwithadifferentangulation.
Figure1.15. Enhancement.A: Thisartifactisrepresentedbyazoneofincreasedechogenicity,behindafluid-filledstructure.Onthisschematicdrawing,severalrenalcystsareseenassociatedwithdistalenhancement B: Anexampleofasimilar cystispresentinthisdog,whereitisseenasarounded,well-definedanechoicrenalcystassociatedwithfarenhancement (arrowheads).
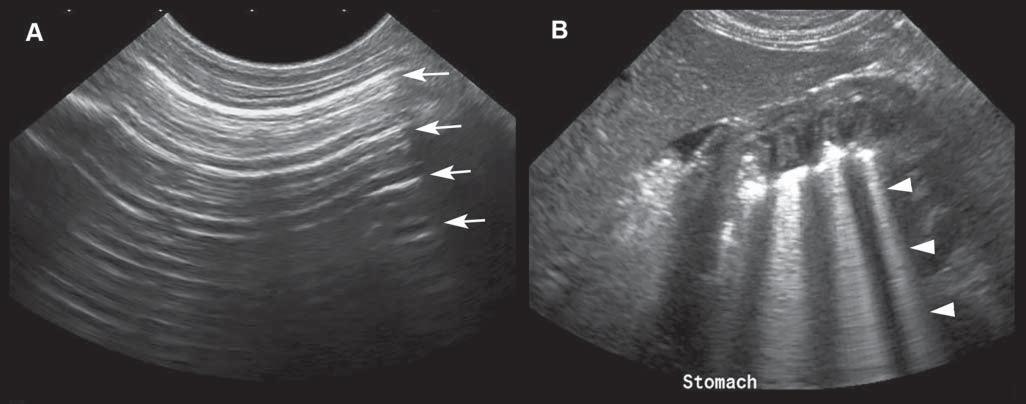
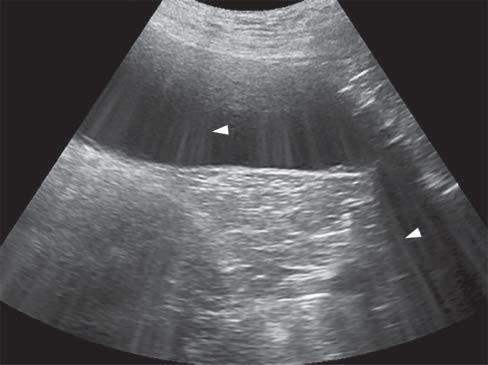
Figure1.16. Reverberationartifacts.A: Reverberationappearsasseriesofparallelandequallyspacedlines(arrows),when thebeamencountersahighlyreflectiveinterfacesuchasgas.Thecolonicwallinthenearfieldisbarelyvisualized. B: Comet tailalsoappearsasaseriesofshortandverycloselyspacedsuccessiveechoes(arrowheads)andisoftenseeninthestomach.
distinguishfromsolidlesions.Tissuesdeeptothe urinarybladderandorgansfloatinginascitesoften becomehyperechoic.
Reverberation
Reverberationartifactstypicallyappearasaseries ofmultiple,equallyspacedlines(Figure1.16A). Theyoccurwhenthebeamhitsahighlyreflective
interface–suchasanairpocket–andsendsitbackas anechoofsimilarintensity.Thehigh-intensityechois partlycapturedbytheprobe,producingahyperechoic lineatthepocket’sinterface,butwithnoechocoming fromdeepertissue.Thesurfaceoftheprobewillreflect thishigh-intensityechoandsenditbackandforth. Aspartoftheechoisperceivedeachtimeitreturns, thecomputercalculatesthetimethathaspassedsince theinitiallaunchofthewavepulseandthusrecords
severalequidistanthyperechogeniclines.Thereis decreasingechogenicityoftheinterfaceasitgoes deeper,duetoagraduallossofwaveintensitythat reboundsandisattenuatedduringitstrajectory.
Comettail isatypeofreverberationartifact–it appearsasaseriesofshortandverycloselyspacedsuccessiveechoes(Figure1.16B)thattypicallydecreasein intensityandwidthindepth.Whengasbubblesform thinlayersseparatedbyliquid–asinthedigestive tract–thewavesreboundbetweenthelayers,resulting inmanyechoesthatreturntotheprobeatregularintervals,makingatrailofechoesintheformofashadow resemblingacomet’stail.Thisartifactisalsoencounteredwithmetallicpelletsorsurgicalclips. Ringdown artifact similarlyappearsasaseriesofparallelreflectivelinesthattypicallyextendbehindagascollection. Ithappenswhenairbubblesresonateattheultrasound frequencyandthenemitreflections.Thiscanbeseen associatedwithirregularlungsurfaces,gastrointestinaltract,andabscesses.Practically,comettailandring downartifactsappearverysimilaronthescreen,even thoughtheyresultfromdifferentphysicalinteractions.
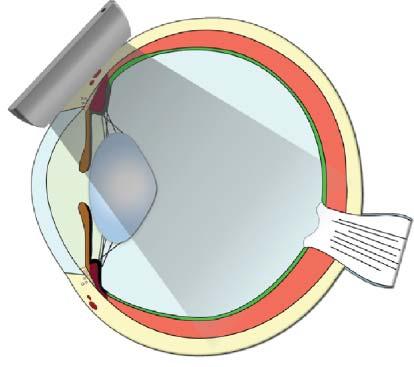
MirrorImage
Misplacingthelocationofastructureoftenhappens whenalarge,smooth,curvilinear,andstronglyreflectiveinterfacebetweentissuesisinterposed.When thisreflectoristhelungsurface,themostcommonly encounteredartifactofmisplacedorganorstructure, isthemirrorimageoftheliverand/orthegallbladder onthethoracicside(Figure1.17).
VolumeAveraging
Theshapeofthemainultrasoundbeamthatserves togenerateimageschangeswithdepth.Indeed,the exitingultrasoundbeamwidthissimilartotheprobe width,thennarrowsatthefocalzone,andwidens againdeepertothefocalpoint.Practically,thiscauses moretissuetobeincludedinareaswherethebeam isthickestandwidest(Figure1.18).Theirechogenicitiesbecomeconfoundedandaveragedtoformthe brightnessofthepixelsbeingdisplayedinthose specificregions.Thismayresultinapseudo-sludgein fluid-filledanechoicstructuressuchasthegallbladder, cysts,oreventhebladder,dependingontheirlocationandthequalityoftheprobe.Volume-averaging artifact–alsocalledslice-thicknessorbeam-width artifact–maythenleadtoerrorsininterpretingthe contentofcysticstructuresandmaylimittheconspicuityofsmalllesions.Usingtheplacementofthefocal
zonewiselyhelpsinreducingthisartifact.Reducing theoverallgaincanalsoattenuateitsappearance.
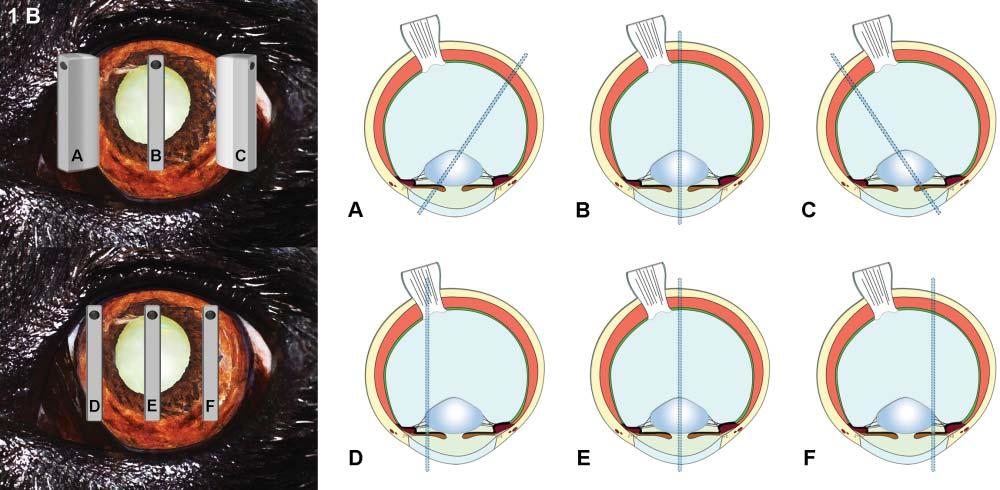
SideLobesandGratingLobeArtifacts
Sidelobesandgratinglobesaredifferenttypesof secondarylobespresentonthesideoftheprimary soundbeam.Sidelobesarepresentinalltransducers,andareusuallyoflowintensity;theycan createspuriousechoesinthenearfield.Grating lobesareassociatedwiththegeometricconstruction oflinearprobes(Barthezetal.1997).Theartifacts createdbysecondarylobesresultinmisplacementof reflectedechoes(Figure1.19).Inclinicalsituations, secondarylobeartifactsaredifficulttodifferentiate fromvolume-averagingartifacts.
SpeedErrorandRangeAmbiguity Artifacts
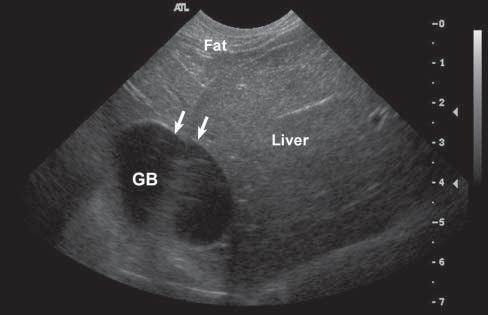
Whentheultrasoundspeedisnottheassumed 1,540m/sthroughtissues,errorsinsizeorlocation ofstructuresmayarise(Feldmanetal.2009;Hindi etal.2013).Forexample,whensoundtravelsthrough fat(withavelocityofabout1,450m/s),thereturning echoeswilltakelongertocomebacktothetransducer andthusbedisplayeddeeperintheimagethanthey reallyare(Figure1.20). Speed–orpropagation–error artifactsmaycausestructurestobeinaccurately localizedormeasured.
Ultrasoundsystemsassumethatallreceivedechoes areformedformthemostrecenttransmittedpulse. Rangeambiguity artifactoccurswhenthesystem receivesechoesfromdeepstructuresafterthesubsequentpulseisemitted,misplacingthisstructure closertothetransducerthaninreality.Thishappens predominantlywhenusinghighpulserepetition frequencyandwhenincreasingthenumberoffocal zones(O’Brienetal.2001).
Anisotropy
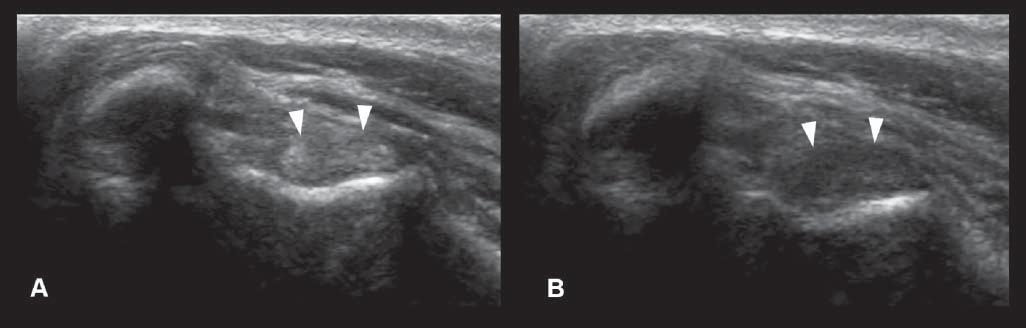
Thisartifactismostcommonlydescribedinmusculoskeletalultrasoundandconsistsofadecreasein echogenicityofthestructure(suchasthetendonor ligament),duetoanobliqueposition(ratherthan perpendicular)oftheprobeonthebodypartbeing evaluated(Figure1.21).Thiscanbeeasilycorrectedby changingtheprobeangle.
ElectronicInterference
Electronicinterferencesfromdevicessharingthe sameelectricaloutletcanappearasdiscreteradiating


Figure1.17. Mirrorimages.A-B: Sonographic (A) andschematic (B) imagesofamirrorartifactinvolvingtheliverinadog. Theimageoftheactualliverandgallbladder(GB)isobtainedbasedontheechoesgeneratedduring“normal”ultrasound wavepropagation(path1).Inthiscase,however,theremainingpulsesarenotdissipatedindeepertissues,butarealmost fullyreflectedatthecontactofthediaphragm–lunginterface(arrow),whichactsasstrongreflector.Echoesfromthisreflection arethussentbacktotheliverandGB,whichoncemorereflectsomeoftheenergybacktothediaphragm/lung,beforeitis redirectedbacktothetransducer(path2).This“secondset”ofechoesisreceivedlongafterthefirstset(producingthetrue image)andisthusinterpretedbythemachineasoriginatingfromtheothersideofthediaphragm.Amirrorimageoftheliver (liver′ )andGB(GB′ )isthenaddedonthemonitorunderneaththerealimage. B: Inanotherdog,theinterfaceofagas-filled stomachresultsinamirrorimage(blackarrowheads)ofitssuperficialwall(whitearrowheads).Aportionoftheliver(L)is alsomirroreddistally(L′ ).
Figure1.18. Impactofpartialaveragingonlesiondetection. Thedetectionofalesionisinfluencedbyitssize,its echogenicityanditspositionwithregardtotheprimaryultrasoundbeam.Itisalsoinfluencedbythespatialresolutionof thesystem.Atagivenultrasoundfrequency,thelesionwill bebetterdepictedatthefocalzone.Indeed,thesmallerwidth andthicknessofthebeamatthatlevelallowthelesiontocompletelyfillthebeam,resultinginanechoicpixelsonthescreen (B).If,however,thelesionisinalargerportionofthebeam (A, C),theresultingimagedisplayspixelsofhigherechogenicitybecauseoftheinclusionofregionalliverparenchyma.The displayedpixelsinfactreflecttheaverageechogenicityofthe sampledtissue.Lesionsmayevenbeconfoundedwhenmultipleinalargeportionofthebeam(C),orwithnormaladjacent structuressuchasvessels.Movingthefocalzonetotheregion ofinterestisessentialwhenassessingsmallstructures,suchas whenlookingforsmalllesionsorwhenmeasuringintestinal layers.Usingmorethanonefocalzonereducesthebeamsize overagreaterdepth.


Figure1.19. Sidelobes.A: Schematicdrawingofthemaincentralbeamlobeandthedivergingsidelobesoflowerenergy ofaprobewhileimagingafluidstructuresuchasthebladder. B: Artifactualechoesareprojectedinthebladder,someinthe nearfieldandsomeinthefarfield.Noticethattheechoesarecurvilinearastheyarisefromthehyperreflectivebladderwall interfacewhichinteractswiththesidelobebeams.Theseechoesareerroneouslyinterpretedtooriginatefromtheinteraction withthemainbeam.
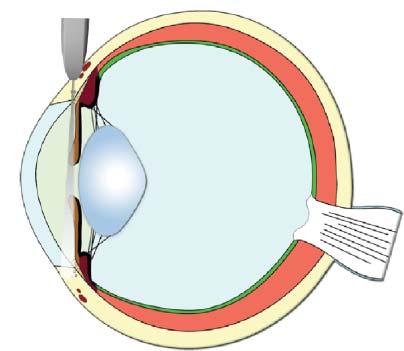
Figure1.20. Speederror. Whensoundtravelsthroughfat (withavelocityofabout1,450m/s),thereturningechoestake longertocomebacktothetransducerandarethusdisplayed deeperintheimagethantheyreallyare.Inthisnormaldog, theslowervelocityofultrasoundwavesthroughfatincomparisontoliver(around1,600m/s)resultsininaccuratedisplacementoftheGBfurtherawayfromthetransducer.
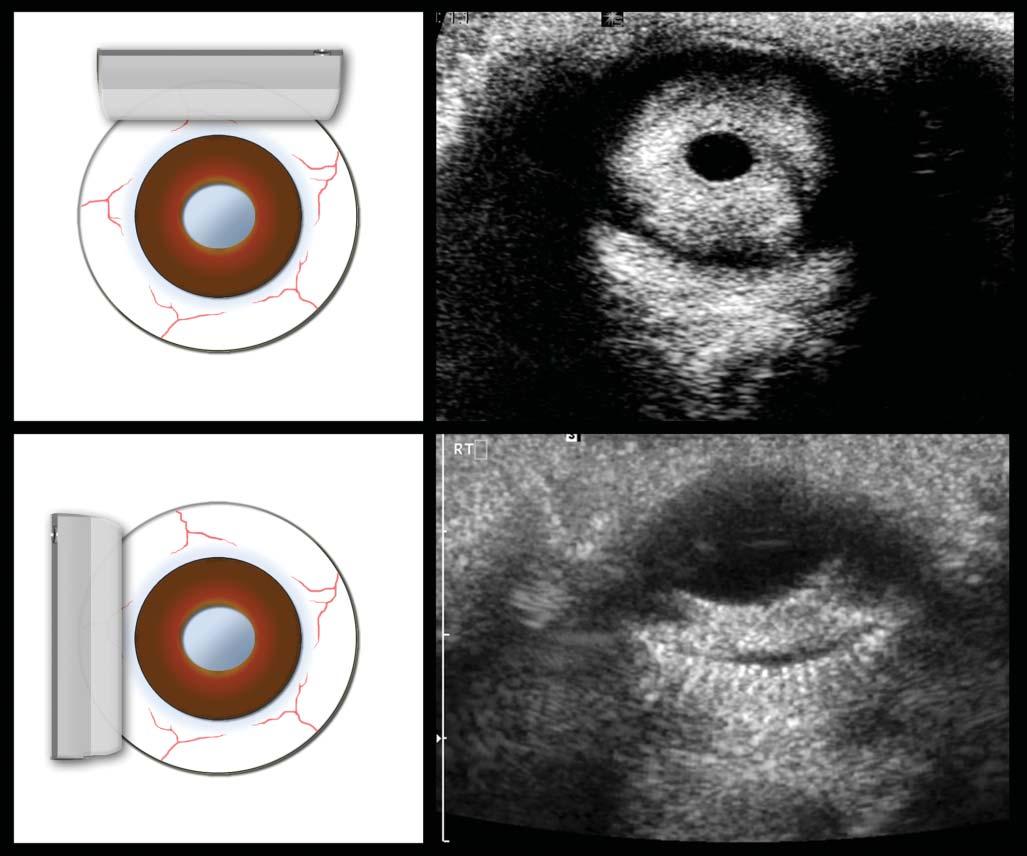
Figure1.21. Anisotropy.A: Normalcross-sectionalappearanceofthebicepstendon(arrowheads),withtheprobebeing perpendiculartothestructure. B: Thedecreaseinechogenicityofthetendonisduetoanobliquepositionoftheprobe.This canbeeasilycorrectedbychangingtheprobeangle.Thisartifactcouldbemisinterpretedasacorelesion.
Figure1.22. Electronicinterferences. Discrete,highly echogenicspikes(arrowheads)arecrossingtheentirescan field.Theyarebestseenwhentheyprojectontopoorly echogenicstructures.Thesewereduetotheuseofanelectrocutterintheadjacentroom.
echogenicspikes(Figure1.22).Thiscanbeeasilyfixed byhavingadedicatedpoweroutletfortheultrasound equipment.
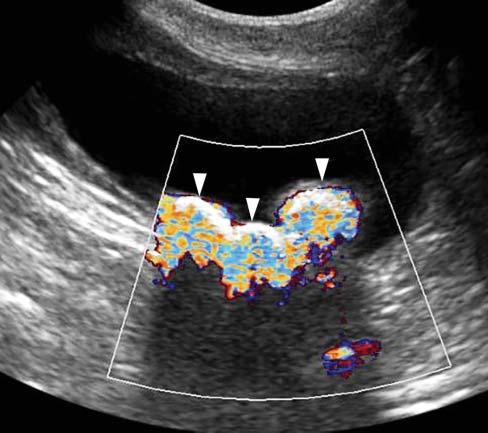
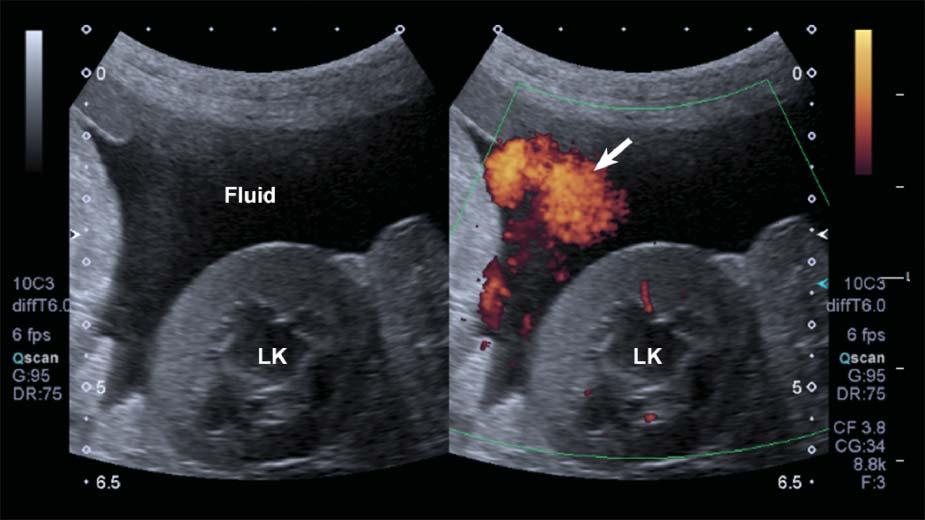
TwinklingArtifact
WhenusingcolorflowDoppler,zonesofrapidly changingredandbluehuescanbeseenbehind stronglyreflectivestructures,suchascalculiortissuemineralization(Figure1.23).Thisartifactseems independentofthecalculicomposition,anditis accentuatedbythesizeandsurfaceofthecalcification orcalculus(Louvet2006).Itcanbeencounteredwith
Figure1.23. Twinklingartifact. Severalhyperechoic interfacesassociatedwithshadowingarepresentinthe bladder,consistentwithcalculi.Whenactivatingthecolor flowDopplermode,zonesofrapidlychangingredand bluehues(arrowheads)canbeseenbehindthesestrongly reflectivestructures.
calculiinthebladder,gallbladder,orassociatedwith anytissuemineralization.
DopplerAliasing
Thisartifactoccursforahigh-velocityflowwhenthe Dopplersamplingrate(i.e.,pulserepetitionfrequency, PRF)islessthantwicetheDopplerfrequencyshift ofthatflow(Hindietal.2013).Aliasingcausesthe
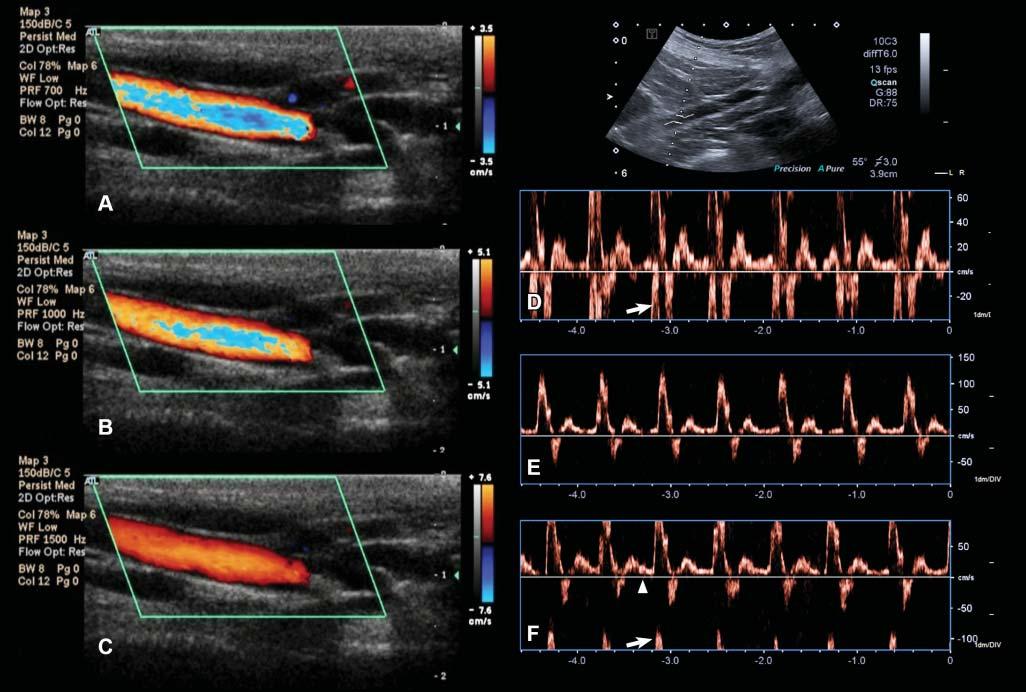
Figure1.24. Aliasingartifact.A: WithcolorDoppler,aliasingappearsasalinearormosaichueinthecenterofa high-flow-velocityvesselandwhenthemeasuringscale(ontheright–3.5cm/sinthiscase)isexceeded. B: Byincreasingthe scaleto5.1cm/s,theartifactislesspronounced. C: Itdisappearscompletelywhenthescaleisincreasedto7.6cm/s. D: With spectralDoppler,aliasingmanifestsitselfasawraparoundoftheflowprofileontheoppositeextremityofthevelocityscale. Themeasuredmaximalvelocityofthisiliacartery(inthedirectionofthetransducer)exceeds60cm/sandisinterpretedas reversed(arrow). E: Increasingthevelocityscale(orpulserepetitionfrequency)to150cm/sallowstheentireflowspectrumto beincluded.Notethatthecalculatedmaximalvelocityofthisarteryexceeds100cm/s. F: Thebaseline(arrowhead)position canalsoberesponsiblefortheonsetofaliasing.Inthiscase,itwasmovedtothepositiveside,reducingthescaleonthatside (maximalvelocityapproximating75cm/s),andresultinginvelocitypeakwraparound(arrow).
high-frequencycomponentoftheflowtowraparound thescale,fromitspositiveornegativeextremity, dependingonitsdirection(Figure1.24).
Aliasingcanbereducedoreliminatedbyincreasing thevelocityscale(whichincreasesthePRF),moving upordownthebaseline,increasingtheDopplerangle (whichdecreasestheDopplershift),orusingalower ultrasoundfrequency.
DopplerFlashArtifact
Rapidmovementofthepatient’sbody,ofastructural component(e.g.,heartorarterialpulsation),orofthe probemightleadtoDopplershiftsbeinginterpreted bythesystemasbloodflow.Aspuriousappearance
ofbloodflowisdisplayed,limitingtheassessmentof truevessels.Thisartifacttendstobemoreapparentin fluid-filledstructuresandwithascites(Figure1.25).
Visitourwebsiteat www.SmallAnimalUltrasonography.com forcomplementaryvideoclipswith annotationsandtexton:
• Formationoftheultrasoundimage
• Propagationofultrasoundwavesandinteraction withtissues
• Ultrasoundbeamandspatialresolution
• Gainandtimegaincompensation
• Mirrorimageartifact
• Shadowingartifact
• Enhancementartifact
Figure1.25. Flash. SpuriousechoesoftenappearwhenusingpowerDopplerinmovingpatientsorwhenascitesispresent, limitingtheassessmentthetissueperfusioninthesecases.LK,leftkidney.
• Reverberationartifacts
• Refractionartifact
• Speederrorandrangeambiguityartifacts
• Twinklingartifact
References
BarthezPY,LeveilleR,ScrivaniPV.Sidelobesandgratinglobesartifactsinultrasoundimaging.VetRadiol Ultrasound1997;38:387–393.
BooteEJ(2003)AAPM/RSNAphysicstutorialforresidents:topicsinUS–DopplerUStechniques:conceptsof bloodflowdetectionandflowdynamics.Radiographics 23:1315–1327.
BushbergJT,SeibertJA,LeidholdtEMJr.,BooneJM.(2011) Ultrasound.In:TheEssentialPhysicsofMedicalImaging, 3rdedition.Philadelphia,PA:LippincottWilliams& Wilkins,pp500–576.
d’AnjouMA,PenninckD,CornejoL,PibarotP(2004)Ultrasonographicdiagnosisofportosystemicshuntingindogs andcat.VetRadiolUltrasound45:424–437.
FeldmanMK,KatyalS,BlackwoodMS(2009)USartifacts. Radiographics29:1179–1189.
HangiandreouNJ(2003)B-modeUS:basicconceptandnew technology.Radiographics23:1019–1033.
HengHG,WidmerWR(2010)Appearanceofcommonultrasoundartifactsinconventionalvs.spatialcompoundimaging.VetRadiolUltrasound51:621–627.
HindiA,PatersonC,BarrRG(2013)Artifactsindiagnostic ultrasound.RepMedImaging6:29–48.
KirbergerRM(1995)Imagingartifactsindiagnostic ultrasound-areview.VetRadiolUltrasound36:297–306. LouvetA(2006)TwinklingartifactinsmallanimalColorDopplersonography.VetRadiolUltrasound47:384–390.
MesurolleB,Ariche-CohenM,MignonF,GuinebretièreJM, TardivonA,etal.(2001)Smallfocalareasofacousticshadowinginthebreast.JClinUltrasound30:88–97.
O’BrienRT,ZagzebskiJA,DelaneyFA(2001)Ultrasound corner:rangeambiguityartifact.VetRadiolUltrasound 42:542–545.
RubinJM,AdlerRS,BudeRO,etal.(1991)Cleananddirty shadowingatUS:areappraisal.Radiology181:321–236. SzatmariV,SotonyiP,VorosK(2001)Normalduplex Dopplerwaveformsofmajorabdominalbloodvesselsin dogs:areview.VetRadiolUltrasound42:93–107.
ZieglerL,O’BrienRT(2002)Harmonicultrasound:areview. VetRadiolUltrasound43:501–509.