3 minute read
Is There Room For Farmland Prices To Keep Rising?
As discussed in the last edition of Seasons, land values are primarily driven by two things: the net value of the agricultural products the land can produce over time and the cost of funding its purchase. The cost of funding agricultural land is ultimately driven by the rate of return for alternative uses of capital adjusted for the relative risk of the investment. In other words, the opportunity cost.
The earnings capacity of the land is influenced by several factors. One of the most important is the rate of productivity growth, which is the ratio of outputs produced to inputs used.
Advertisement
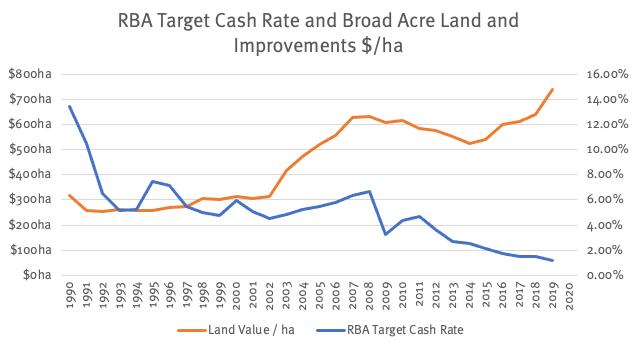
At present, the cost of funding agricultural land is historically low (see Chart 1). As interest rates have been low for some time, and with limited capacity to reduce further, it is likely that these rates are now fully priced into land values. This means they will support land prices while they remain low but are unlikely to contribute to further rises.
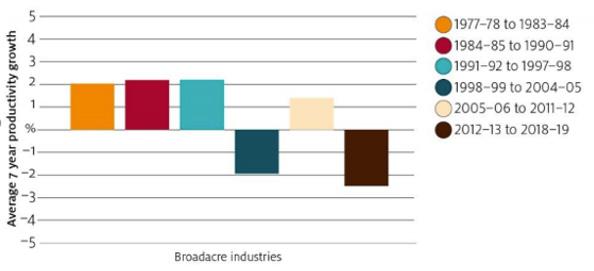
Alternative investment returns are also low, with future returns uncertain as economies adjust to the impact of COVID 19, and the COVID 19 “normal”, whatever that will be, among other things. Of interest is the more recent low rates of productivity growth, largely attributed to dry conditions in most areas of Australia, at a time of rapid increases in land values (see Chart 2). The recent rises in farm values have come from a convergence of low funding costs and improved commodity prices relative to the cost of inputs.
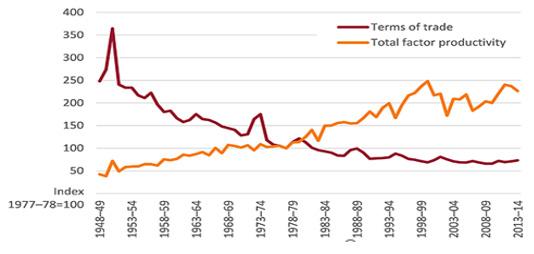
The rate of productivity growth over time compared to farmers’ terms of trade (output prices relative to input prices) is shown in Chart 3. That is, the prices received by farms have increased faster that the prices paid for inputs. This has been a key driver of increased farm returns.


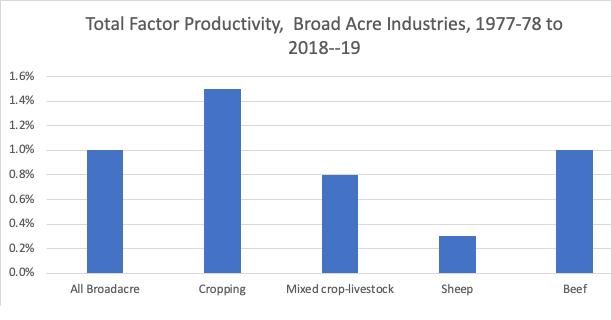
In a low interest rate environment, future land price appreciation will be more reliant on increases in growth in earnings capacity. The rate of productivity growth in Australian agriculture has been approximately 1 per cent for the last 40 years (ABARES 2020). However, this rate of growth has been highly variable across commodities and over time (see Chart and 2 Chart 4).
Sources of productivity growth vary but one of the most important recently has been scale – as enterprises expand, they improve productivity as overhead costs are spread over larger operations and they have greater capacity to invest in new technology.
Over time, productivity growth has come from a range of sources. Some of the more important have been plant genetics (dwarf cereal varieties, improvements in break crops, animal genetics and much larger capacity machinery). It is widely believed that the next round of productivity growth will come from harnessing the value of big data and the ag-tech innovations that come with it.
Future land price appreciation will require an increase in the rate of productivity growth by Australian farmers. The recent rapid appreciation in land value should not allow farmers and their research organisation to become complacent. We need to continue to drive productivity growth to remain competitive in international commodity markets and to attract and retain capital.

Chart 2: Total Factor Productivity Growth, Average 7 – Yearly Change, Broadacre Industries, Australia, 1977 – 78 to 2018 - 19
Chart 3: Agricultural Total Factor Productivity and Farmers Terms of Trade, Australia, 1948-49 to 2013-14

Chart 4: Total Factor Productivity x Broad Acre Industry


