Belgian electricity system blueprint for 2035-2050 (version française)
4.1.
Liquids
4.1.4. Imports from outside of Europe
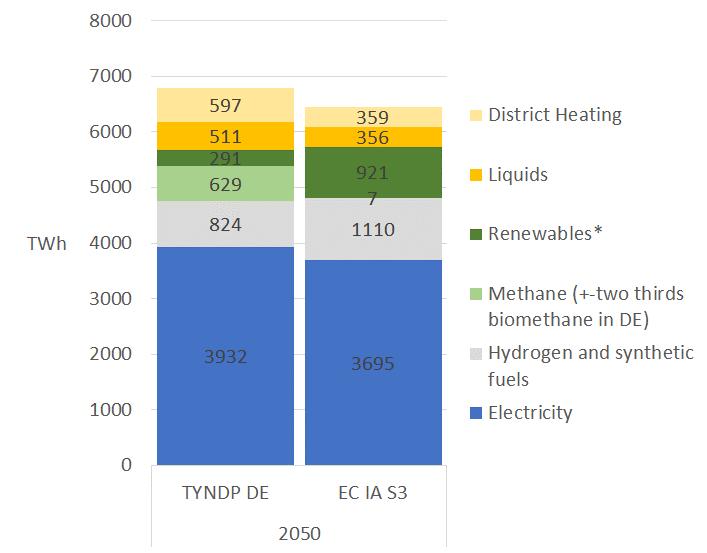
4.1.5. Total primary energy supply
4.1.6. Summary of insights
4.2. Supply and demand of electricity
4.2.1. European electricity supply and demand 119
4.2.2. Optimal amount of offshore 120
4.2.3. Zonal energy mix 122
4.2.4. Electricity flows 122
4.3. Interactions between energy vectors 126
4.3.1. Sankey diagrams for Europe 126
4.3.2. Interactions between the electricity system and the other vectors 127
4.4. Management of emissions 129
4.4.1. Changes in GHG emissions 129
4.4.2. Carbon capture, usage and storage 130
4.5. European electricity grid 133
4.5.1. Important elements for the interpretation of results 133
4.5.2. Optimal European grid found 134
4.5.3. Results of the European optimisation around Belgium 135
4.5.4. Main takeaways regarding the development of the high-voltage grid 138
4.6. Adequacy and flexibility 139
4.6.1. Required thermal generation 139
4.6.2. Generation characteristics of thermal units 140
4.7. System costs across the different scenarios 143
4.7.1. Total energy system costs including end uses 143
4.7.2. Energy system costs only 144
4.7.3. Zooming into the power system costs 145
4.8. Key takeaways 146
5. RESULTS FOR BELGIUM 147
5.1. Multi-energy results 149
5.1.1. Yearly methane balances 149
5.1.2. Yearly hydrogen balances 150
5.1.3. Yearly liquid balances 151
5.1.4. Imports 152
5.1.5. Primary energy supply 153
5.1.6. GHG emissions and their management 154
5.1.7. Link between the molecule and electricity systems 156
5.2. Current policies and levers 158
5.2.1. Results in the ‘Current Policies’ scenario 158
5.2.2. Domestic low-carbon supply and expected demand 161
5.2.3. Overview of the different options to complement Belgium’s supply 162
5.3. Electricity demand 164
5.3.1. Sufficiency as a lever 166
5.3.2. Peak demand and flexibility 168
5.4. Electricity long-term supply options 171
5.4.1. Electricity mix dashboard for 2050 171
5.4.2. Imports, exports and thermal generation 172
5.4.3. Electricity system costs of the different options 174
5.4.5. Additional indicators 186
5.4.6. Total system costs (all vectors) 188
5.5. Transition period (the road to 2050) 189
5.5.1. Electricity mix dashboard for 2036 and 2040 189
5.5.2. Electricity system costs 190
5.5.3. Nuclear extensions 191
5.5.4. Adequacy 192
5.6. Summary of the different levers 194
5.7. Electricity grid 197
5.7.1. Development and integration of the offshore network 198
5.7.2. The further development of onshore interconnectors 203
5.7.3. The creation of hosting capacity 206
5.7.4. The development of a strong and robust internal backbone grid 209
5.7.5. An overview of no-regret, minimum-regret and policy dependent evolutions to be envisaged for the Belgian off- and onshore grid 212
5.8. Other key insights 213
5.8.1. Material needs and other environmental aspects 213
5.8.2. Long-duration energy storage 216
5.8.3. Marginal costs and production costs 217
5.9. Key takeaways 218
6. APPENDIX 220
Appendix A - KARI dispatch and investment electricity model 221
Appendix B - Molecules and liquids model 225
Appendix C - Carbon capture, utilisation and storage model 227
Appendix D - Adequacy electricity model 228
Appendix E – Marginal Abatement Cost Curve methodology 230
Appendix F – Total cost methodology
F.1. General introduction
F.2. Structure of the Cost tool
F.3. Energy production system costs of different energy carriers
F.4. Energy consumption system cost of End-use sectors
F.5. Material needs 241
F.6. Comparing the results to previous studies 242
Appendix G – Schematic view of the model 243
Appendix H – Non-CO2 emissions methodology 244
Appendix I – Details on energy demand 246 Most commonly used abbreviations 247
References 248
◆ La décision quant aux sources d'énergie sur lesquelles la Belgique pourra compter dans le futur est cruciale pour le développement dans les temps de technologies bas carbone et de l’infrastructure réseau. Bien que la période 20402050 semble éloignée, lorsqu’il est question d'infrastructure, nous devons commencer à la planifier prochainement.
◆ L’étude Belgian Electricity System Blueprint for 2035-2050 offre des informations sur les options dont dispose le pays quant à son futur mix énergétique et évalue également leurs conséquences technologiques et économiques.
◆ Son objectif est d’assister les responsables politiques dans leurs décisions quant au futur mix énergétique de la Belgique et au chemin qui mènera à 2050.
EN BREF
AVANT-PROPOS
DES DÉCISIONS CONCERNANT LA PÉRIODE 2035-2050 DOIVENT ÊTRE PRISES PROCHAINEMENT, ÉTANT DONNÉ LEUR CARACTÈRE CRITIQUE POUR
L’APPROVISIONNEMENT ÉNERGÉTIQUE
FUTUR DE LA BELGIQUE
Chère lectrice, cher lecteur, Fin 2019, lorsque la Commission européenne a présenté son Green Deal et son objectif d'atteindre la neutralité climatique d’ici 2050, la neutralité carbone semblait être une ambition lointaine. Deux années plus tard, la crise du gaz et la guerre en Ukraine ont amené l'énergie sur le devant de la scène politique, soulignant ainsi son importance stratégique. Les objectifs en matière d'énergies renouvelables ont ainsi été revus à la hausse et des politiques destinées à l’arrêt rapide des combustibles fossiles ont été mises en place. Ce changement a transformé l'agenda climatique européen en une stratégie d'investissements visant à renforcer la sécurité énergétique et à ancrer l’industrie au sein de l’Union.
La sortie des combustibles fossiles a des conséquences importantes pour la politique énergétique de la Belgique. Des transformations majeures devraient avoir lieu entre 2035 et 2050. Les évolutions clés comprendront une baisse substantielle de la demande énergétique (diminution de 25 à 45%) combinée à une augmentation inédite de l'électrification (hausse de 95 à 130%). Cela placera la Belgique dans une nouvelle position par rapport à son approvisionnement énergétique.
Cette augmentation significative de la demande en électricité peut être atténuée grâce à des changements dans le comportement des consommateurs. Toutefois, garantir l'accès à un approvisionnement suffisant en sources d'énergie neutre en carbone est crucial à long terme.
Définir le futur mix énergétique de la Belgique afin de garantir sa sécurité d'approvisionnement sera un processus complexe et critique qui incombera au prochain gouvernement. Les délais associés au développement du réseau électrique et aux projets électriques à haute intensité de capital, comme l’offshore ou les projets de production nucléaire, dépassent les 10 ans. En gardant cet aspect à l’esprit, 2035 et 2050 sont bien plus proches qu’il n’y paraît.
Le développement d’options à long terme nécessitera que le gouvernement explore et tienne compte de nombreux éléments. Aucune des options auxquelles la Belgique fait face, des parcs éoliens offshore situés loin des côtes aux nouvelles unités nucléaires en passant par des mesures de sobriété et la dépendance du pays aux importations d'électricité, ne sera facile à mettre en œuvre. Chaque option implique des questions cruciales en matière de développement. Des lignes directrices sont nécessaires pour pousser différents acteurs publics et privés à travailler en vue d’atteindre le mix énergétique souhaité pour la Belgique.
Ce document offre des informations précieuses aux lecteurs et lectrices sur les options dont dispose le pays quant à son futur mix énergétique et évalue également leurs conséquences technologiques et économiques. Son objectif est d’assister les responsables politiques dans leurs décisions quant au futur mix énergétique de la Belgique et au chemin qui mènera à 2050.
Nous espérons que vous trouverez cette étude à la fois intéressante et éclairante.
Frédéric Dunon CEO d’Elia Transmission Belgium
5 MESSAGES CLÉS SUR LE SYSTÈME ÉNERGÉTIQUE BELGE D’ICI 2050
MESSAGE 1
D’ici 2050, la demande énergétique finale de la Belgique baissera de 25 à 45%. Sa dépendance énergétique diminuera donc de moitié. Les électrons et les molécules joueront tous deux un rôle dans le futur approvisionnement énergétique du pays.
2050
MESSAGE 3
Il faut encore déterminer la provenance de la moitié de l'approvisionnement électrique belge d'ici 2050. Sans politique claire quant à l’approvisionnement électrique d'ici 2050, la Belgique se retrouvera probablement dans le scénario le plus coûteux. Les options à grande échelle, comme de nouvelles unités nucléaires ou des parcs éoliens offshore non domestiques, nécessitent des signaux clairs dans les années à venir.
MESSAGE 4
En plus de préparatifs à long terme, il faudra veiller à la gestion de la période de transition. Les options efficaces en termes de coûts incluent la maximisation des sources d'énergie renouvelable (SER) domestiques en Belgique, la mise en place de mesures de sobriété, la prolongation de la durée de vie d'unités de production existantes ainsi que le développement de l’accès du pays à l’éolien offshore non domestique. Chacun de ces aspects implique ses propres contraintes spécifiques.
MESSAGE 2
D’ici 2050, la consommation électrique finale de la Belgique devrait augmenter de 95 à 130%. Sans la mise en place de nouvelles politiques visant à façonner le futur mix énergétique du pays, l’approvisionnement domestique ne devrait couvrir que la moitié de cette demande.
MESSAGE 5
Le futur mix énergétique et la localisation des unités de production à venir joueront un rôle capital dans le développement du réseau électrique. Dans tous les scénarios, le renforcement et l’achèvement du réseau 380 kV (backbone) forment la base pour les évolutions futures.
LES CHANGEMENTS LES PLUS PROFONDS
DOIVENT ENCORE ARRIVER
Au cours des prochaines décennies, l'économie belge va connaître une transition d’un fonctionnement basé sur les combustibles fossiles à l’optimisation des ressources neutres en carbone et une électrification maximale. Les changements les plus profonds pour y parvenir doivent encore se produire, ce qui nécessite la mise en place d’une stratégie à long terme pour atteindre la neutralité carbone.
Étant donné notre expertise et nos connaissances technico-économiques en matière d'énergie et de systèmes électriques, cette étude offre l’opinion d’experts aux responsables politiques belges. Ces derniers vont façonner le futur énergétique du pays d’ici 2050 et doivent pour ce faire prendre une multitude de facteurs en compte.
Que ce soit la prolongation de la durée de vie des centrales nucléaires actuelles, la construction de nouvelles unités nucléaires, l’accélération significative du développement de la production renouvelable ou la réalisation d’un plus grand nombre d'interconnexions, chaque décision relative au futur mix énergétique de la Belgique aura des conséquences directes sur le développement et la gestion du réseau électrique au cours des prochaines décennies.
Cette étude contribuera à la préparation du prochain Plan de Développement fédéral (PDF) 2028-2038. Elle aidera à évaluer les besoins à long terme pour l’infrastructure de réseau de transport et leur alignement avec les choix de la Belgique pour son futur mix électrique. La définition de politiques énergétiques futures sera un prérequis crucial pour l’élaboration de ce plan.
CETTE ÉTUDE SE FOCALISE SUR LA PÉRIODE ENTRE 2035 ET 2050
L’horizon temporel sur lequel cette étude se focalise va au-delà de la dernière étude d'adéquation et de flexibilité pour la Belgique (2024-2034) d’Elia et du Plan de Développement fédéral 2024-2034 qui comprenaient des projections pour la Belgique
jusqu’en 2034. Les décisions politiques énumérées ci-dessous ont été prises à propos du mix énergétique et de la sécurité d'approvisionnement en Belgique au cours des 10 prochaines années et servent de point de départ à cette étude.
ADÉQUATION
→ Prolongation de la durée de vie de deux réacteurs nucléaires jusqu’en 2035 et mise en place du mécanisme de rémunération de la capacité (CRM) en Belgique.
DÉVELOPPEMENT DU RÉSEAU MIX ÉLECTRIQUE RÉSEAU GAZIER
→ Approbation du PDF 2024-2034, et exploration/ préparatifs pour de futures interconnexions hybrides capables d'approvisionner la Belgique en éolien offshore non domestique.
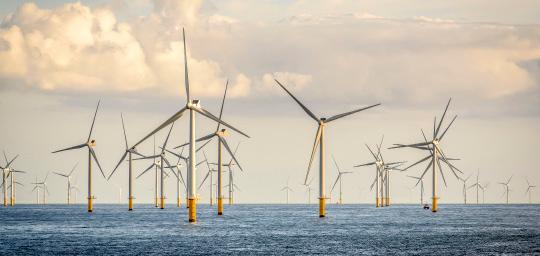
→ Développement de 3,5 GW d’éolien offshore additionnels par le biais de l’Île Princesse Elisabeth et développement ultérieur de la capacité éolienne onshore et photovoltaïque ainsi que des ambitions régionales les plus récentes relatives aux SER domestiques (photovoltaïque et éolien onshore).
→ Développement d’une stratégie hydrogène fédérale et nomination d’un gestionnaire de réseau d’hydrogène.
UN MODÈLE MULTI-ÉNERGIES A ÉTÉ MIS AU POINT DANS LE CADRE DE CETTE ÉTUDE
À la suite de demandes de nos stakeholders, cette étude englobe l’entièreté du système énergétique dans le cadre d’une approche de modélisation quantifiée (une première pour une étude d’Elia). Cette étude couvre donc à la fois l'électricité et les molécules (hydrogène et ses dérivés, CO2, méthane, etc.). L'objectif du modèle est de trouver l’optimum européen en termes de coûts parmi tous les vecteurs énergétiques pour un objectif donné en matière de carbone.
Les différents vecteurs énergétiques sont modélisés dans l’étude en fonction de leurs spécificités :
◆ le système électrique est modélisé selon une granularité horaire et en petites sous-régions géographiques afin de représenter son comportement de manière réaliste ;
◆ l’hydrogène, le méthane, l’ammoniac et les liquides sont modélisés selon une base journalière avec des niveaux adaptés de granularité géographique.
Ces étapes sont en cours d’implémentation et leur concrétisation prendra plusieurs années. Toutefois, afin d'aider la Belgique à progresser vers la neutralité climatique, une vision à long terme allant au-delà des 10 prochaines années est nécessaire. Notre étude « Electricity System Blueprint » vise à offrir notre expertise concernant la période 2035-2050.
CETTE ÉTUDE QUANTIFIE UN ENSEMBLE VARIÉ DE FUTURS POSSIBLES EN FONCTION
DE 3 HORIZONS TEMPORELS
Cette étude quantifie l’impact et les conséquences d’un ensemble très large de choix possibles pour le futur système énergétique de la Belgique. Un grand nombre de scénarios et sensibilités, à la fois européens et belges, sont pris en compte. Afin de présenter un aperçu réaliste des changements relatifs au système énergétique belge, trois horizons temporels séquentiels ont été modélisés : 2036, 2040 et 2050.
SCÉNARIOS DE DEMANDE EUROPÉENS
L’objectif de cette étude est d’évaluer l’impact de différentes voies que la Belgique pourrait emprunter vers la neutralité carbone. Celles-ci utilisent comme points de départ les scénarios de demande du Plan de développement décennal du réseau 2024 (TYNDP2024). Chaque scénario de demande mentionné ci-dessous inclut une combinaison différente de technologies et stratégies, soulignant ainsi la diversité des options disponibles pour réduire les émissions de la Belgique. Le choix entre ces scénarios dépendra d’une variété de facteurs, y compris leur faisabilité technologique, le coût, le niveau de soutien politique ainsi que d’acceptation publique.
1. GA = scénario de demande « Global Ambition »
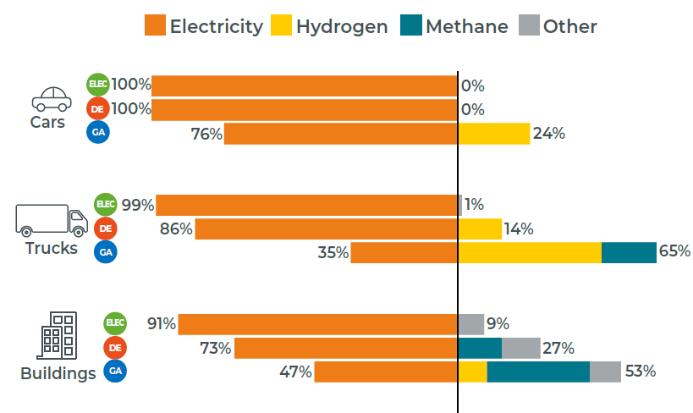
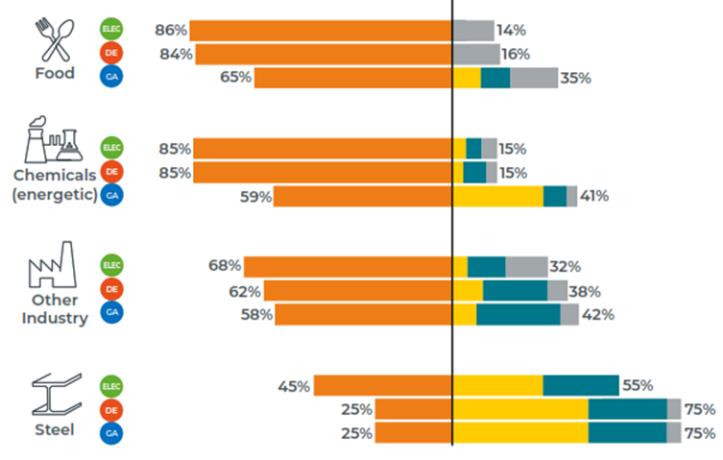
Ce scénario envisage un taux d'électrification plus faible. Il comprend l’utilisation de chaudières au gaz et de chauffage à partir d’hydrogène en plus des pompes à chaleur. En ce qui concerne le transport, il suppose qu’au maximum 30% des voitures et 50% des camions fonctionneront à l’hydrogène. Ce scénario suggère qu’un mix de technologies, y compris celles basées sur les molécules comme l'hydrogène, peut contribuer aux efforts en vue de la neutralité carbone.
EUROPEAN
2. DE = scénario de demande « Distributed Energy »
Ce scénario est davantage axé sur l'électrification mais comprend tout de même l'utilisation des molécules dans le transport, le chauffage et les secteurs industriels. Il suggère que même si l'électrification peut jouer un rôle significatif dans la réduction des émissions, d'autres vecteurs énergétiques pourraient toujours être nécessaires pour certaines applications.
3. ELEC = scénario de demande « Increased Electrification » Ce scénario suppose un degré élevé d'électrification dans le transport, les bâtiments et les secteurs industriels, d'autres vecteurs énergétiques étant toujours utilisés pour des applications spécifiques. Il suggère que l’électrification étendue pourrait être une manière clé d'atteindre la neutralité carbone.
Les scénarios de demande susmentionnés sont combinés avec plusieurs options en matière d'approvisionnement pour les énergies renouvelables onshore au niveau européen (accélération, davantage de photovoltaïque), différents objectifs en matière de carbone pour les années intermédiaires, un plus grand nombre d'appareils flexibles, différentes manières de raccorder l’éolien offshore et différents prix pour l’importation de molécules hors Europe.
Au total, 15 scénarios européens sont évalués.
SCENARIOS AND SENSITIVITIES
BELGIQUE
Pour la Belgique, le cadre en matière de scénarios se compose d’une combinaison de plusieurs éléments, ce qui conduit à plus de 300 sensibilités, qui sont obtenues en associant les différentes options pour la demande et l’approvisionnement. Plusieurs trajectoires futures sont définies pour chaque composant, ce qui permet d'évaluer l’impact des différentes options. Les scénarios de départ pour la demande en Belgique et toutes les autres hypothèses à l'étranger se basent sur le cadre européen en matière de scénarios. Les scénarios belges visent à évaluer l'impact d’un changement en Belgique seulement (toutes les autres choses restant égales).
Scénarios de demande ( DE , GA et ELEC )
- Une sensibilité en matière de sobriété est évaluée afin de quantifier l’impact de changements comportementaux sur la consommation et donc son impact sur les coûts et d'autres paramètres.
- Une sensibilité en matière de chauffage urbain est explorée dans le cadre de laquelle un plus grand nombre de réseaux de chauffage utilisant les déchets/le chauffage direct diminuerait le besoin en autres sources.
◆ Différentes options en matière d'approvisionnement (en plus du scénario lié aux politiques actuelles)
- Plus grand nombre de SER domestiques (« High RES », « Very High PV »).
- Éolien offshore non domestique directement raccordé à la Belgique (ou par le biais d’interconnexions hybrides).
- Nouvelles unités nucléaires pouvant être construites en Belgique (unités à grande échelle ou petits réacteurs modulaires).
- Accès à des SER de base éloignées.
- Prolongation des centrales nucléaires existantes pour la durée de la période de transition.
◆ Différentes combinaisons de coûts d’investissement pour les options ci-dessus.
- Hypothèses « Low/Medium/High » pour les coûts d’investissement des différentes technologies
- Différents CMPC (coûts moyens pondérés du capital) pour les différentes technologies
BELGIAN SCENARIOS AND SENSITIVITIES
tions
CETTE ÉTUDE TIENT COMPTE DE LA CONTRIBUTION DE NOMBREUX STAKEHOLDERS D’ELIA
Étant donné le large périmètre de cette étude et sa volonté d’être aussi exhaustive que possible, de nombreuses parties externes ont été impliquées tout au long de son élaboration.
Elia voudrait exprimer sa gratitude sincère à l'égard des partenaires suivants pour leur précieuse contribution à cette étude :
L'Elia Think Tank composé de stakeholders belges pertinents issus du secteur de l’énergie, a été consulté lors de plusieurs workshops axés sur les méthodes appliquées et les hypothèses adoptées pour cette étude ;
L'Elia Academic Board dont la mission a été de challenger la méthodologie de l'étude ;
Des consultants spécialisés, qui ont contribué au développement des hypothèses en termes de coûts et de certaines parties de l'analyse et les ont comparées à d'autres études dans ce domaine ;
Les Réseaux européens des gestionnaires de réseaux de transport d’électricité et de gaz (ENTSO-E et ENTSO-G) qui sont juridiquement chargés de fournir un ensemble cohérent de scénarios de demande intersectoriels pour le système européen dans le cadre du futur Plan de développement décennal du réseau (TYNDP 2024) ;
Energyville, composé de partenaires de recherche belges de la KU Leuven, de VITO, d’Imec et de l’UHasselt, a participé au contrôle croisé des données d'entrée, de la méthodologie et des résultats de l'étude ;
Fluxys le gestionnaire du réseau belge de gaz et d’hydrogène, qui a été impliqué dans l’alignement de certains paramètres d'entrée et scénarios, en challengeant les méthodes utilisées pour modéliser les réseaux gaziers et en testant certains résultats obtenus
Les gestionnaires de réseaux de distribution (GRD) en Belgique, qui ont été contactés pour challenger les hypothèses en termes de coûts relatives au développement de l’infrastructure des réseaux de distribution.
MESSAGE 1
D’ici 2050, la demande énergétique finale de la Belgique baissera de 25 à 45%. Sa dépendance énergétique diminuera donc de moitié. Les électrons et les molécules joueront tous deux un rôle dans le futur approvisionnement énergétique du pays.
D’ici 2050, le système énergétique belge devrait connaître des changements significatifs. Les gains d’efficacité entraîneront une réduction notable de 25 à 45% de la demande énergétique finale du pays, tandis que sa consommation électrique totale devrait augmenter de 95 à 130% en raison de l'électrification. Ces changements mettront la Belgique dans une situation nouvelle quant à son approvisionnement énergétique, où les électrons et les molécules joueront tous deux un rôle crucial.
L’ÉLECTRIFICATION DE LA SOCIÉTÉ EST UNE MESURE SANS
Bien que des changements significatifs sont encore nécessaires pour atteindre la neutralité carbone, les perspectives pour 2050 sont optimistes. Grâce à des gains d’efficacité, principalement liés à l'électrification, la demande énergétique finale de l’Europe peut être réduite de 40%, une baisse qui sera essentielle pour
s’assurer que la transition énergétique soit abordable. Les chiffres pour la Belgique sont similaires, bien que des différences plus importantes apparaissent entre le scénario centré sur plus de molécules (GA: 25%) et le scénario avec davantage d’électrification (ELEC: 40%).
1. 2. A B C 3.
Renovating buildings Improving the efficiency of user devices
Increasing electrification
Grâce à l'électrification directe, la consommation d'énergie primaire des bâtiments, du chauffage et des transports peut être divisée par deux ou par trois.
L'électrification de la société est une approche sans regret pour la Belgique étant donné qu’elle peut contribuer à une réduction de 40% de la demande énergétique du pays d’ici 2050 (par rapport à aujourd’hui). Bien que la vitesse de l'électrification reste incertaine, prendre des actions afin de la favoriser est essentiel pour éviter de ralentir ou d’entraver la transition énergétique.
DEMANDE ÉNERGÉTIQUE FINALE EN BELGIQUE
Le graphique ci-dessous représente la manière dont la demande énergétique finale de la Belgique (en TWh, hors aviation et trafic maritime internationaux et matières premières non énergétiques) est supposée évoluer au fil du temps. Les différentes couleurs représentent les différents vecteurs énergétiques. La demande énergétique historique de la Belgique figure sur la partie gauche du diagramme, tandis que les différents scénarios simulés en fonction de trois horizons temporels sont à droite.
QUE DÉMONTRE CE GRAPHIQUE ?
◆ La demande énergétique finale de la Belgique devrait diminuer de 25 à 45% d’ici 2050.
◆ La composition du mix énergétique change drastiquement au fil des années : la suppression progressive des molécules fossiles s'accélère et l’utilisation de l'électricité augmente rapidement.
◆ L’utilisation de l’électricité (en orange) augmente de 95 à 130% pour représenter 55 à 80% de la demande énergétique finale de la Belgique en 2050. Les molécules gazeuses constituent 12 à 38% de la demande énergétique finale du pays en 2050 (hors matières premières et transport international).
QUE NOUS RÉVÈLENT CES DONNÉES
?
Les électrons et les molécules resteront tous deux nécessaires, bien que la part qu'ils représentent dans la demande finale du pays évoluera par rapport à aujourd'hui.
EN BELGIQUE, LE DESIGN DE L’INFRASTRUCTURE DES RÉSEAUX ÉLECTRIQUE ET GAZIER PEUT ÊTRE DÉCOUPLÉ
INTERACTION ENTRE LES RÉSEAUX ÉLECTRIQUES ET GAZIER EN BELGIQUE EN 2050
Le graphique ci-dessous représente les interactions entre les électrons et les molécules dans le système énergétique belge en 2050 pour deux scénarios relatifs à la demande différents. Les inputs (manière dont les électrons et les molécules sont produits) sont représentés sur la gauche de chaque diagramme. Les outputs (forme de l'énergie et secteurs qui l’utilisent) sont représentés sur la droite de chaque diagramme.
QUE DÉMONTRE CE GRAPHIQUE ?
◆ Selon le scénario relatif à la demande énergétique finale, la manière dont différentes utilisations finales sont attribuées aux vecteurs énergétiques peut fortement différer.
◆ Les électrons et les molécules sont généralement consommés dans leur forme d’origine, ce qui signifie que les pertes liées à la transformation peuvent être évitées autant que possible.
◆ Les formes ovales démontrent le peu de transformation entre molécules et électrons qui a lieu en Belgique.
◆ Le volume d'électricité produit à partir de molécules est relativement limité.
QUE NOUS RÉVÈLENT CES DONNÉES ?
Même si le développement de vues intégrées des scénarios d'approvisionnement et de consommation est capital, le faible niveau d’interaction entre les électrons et les molécules signifie que le design de l’infrastructure de ces deux réseaux peut être découplé en Belgique. Ce n’est pas le cas dans tous les pays européens étant donné qu'il s’agit d'une caractéristique des pays ne disposant pas d'un potentiel renouvelable domestique suffisant.
Cette étude porte avant tout sur le système électrique. Les questions relatives au design du futur réseau gazier sont également pertinentes et analysées par Fluxys, le gestionnaire du réseau de transport de gaz en Belgique.
D’ici 2050, la consommation électrique finale de la Belgique devrait augmenter de 95 à 130%. Sans la mise en place de nouvelles politiques visant à façonner le futur mix énergétique du pays, l’approvisionnement domestique ne devrait couvrir que la moitié de cette demande.
Pour couvrir la demande croissante en électricité, accéder à un approvisionnement suffisant en sources d'énergie neutre en carbone est crucial.
D’ICI 2050, LA BELGIQUE AURA BESOIN DE DEUX FOIS PLUS D’ÉLECTRICITÉ QU’AUJOURD’HUI
ÉVOLUTION DE LA DEMANDE ET DE L’APPROVISIONNEMENT EN ÉLECTRICITÉ EN BELGIQUE D’ICI 2050
Le graphique ci-dessous démontre l'écart grandissant entre la demande croissante en électricité (lignes rose) et l'approvisionnement domestique bas carbone de la Belgique. Il montre la quantité d'électricité qui sera nécessaire pour couvrir la demande croissante en électricité. Cela est indépendant de l'exigence en termes d'adéquation, qui s'apparente au maintien de la sécurité d'approvisionnement du pays lors des périodes de pic.
ÉVOLUTION DE LA DEMANDE ÉNERGÉTIQUE FINALE ET DE L’APPROVISIONNEMENT DOMESTIQUE EN BELGIQUE D’ICI 2050
Le graphique ci-dessous représente l'évolution de la demande énergétique finale (TWh) et de l'approvisionnement domestique en Belgique d’ici 2050. Chaque couleur représente un vecteur énergétique différent.
Excluding international aviation & shipping and non-energetic feedstock,
QUE DÉMONTRE CE GRAPHIQUE
?
◆ Le résultat des politiques approuvées et le scénario central des sources d’énergie renouvelable (SER) domestiques entraîne un doublement de l'approvisionnement électrique domestique bas carbone entre 2025 et 2050.
◆ D’ici 2036, il apparaît que la Belgique fera face à un déficit de 50 à 60 TWh dans son approvisionnement électrique domestique.
◆ D’ici 2050, ses besoins additionnels en approvisionnement électrique atteignent 70 à 90 TWh.
QUE NOUS RÉVÈLENT CES DONNÉES ?
La production domestique d'électricité ne suffira pas pour couvrir la demande électrique en hausse du pays. Sans la mise en place de nouvelles politiques quant à son mix électrique à long terme, la Belgique augmentera sa dépendance aux importations. Pour que les assets de réseau voient le jour à temps, il faudra développer des politiques énergétiques concernant à la fois les choix structurels à long terme pour l’approvisionnement électrique de la Belgique et la manière dont la transition va être organisée.
QUE DÉMONTRE CE GRAPHIQUE ?
AUJOURD'HUI
◆ Il apparaît que la Belgique importe 80% de son énergie, dont la majeure partie est importée sous la forme de molécules (sous forme liquide et gazeuse). L'électricité représente moins de 20% de la demande énergétique finale du pays.
◆ La Belgique ne produit pas assez d'électricité via ses SER domestiques et ses unités nucléaires pour répondre à sa demande en électricité (voir zone en orange clair).
EN 2050
◆ La demande énergétique finale diminue significativement (de moitié par rapport à 2020).
◆ Sans mesures additionnelles, la production domestique augmente d’ici 2050 mais reste insuffisante pour répondre à la demande en électricité du pays. Résultat, les importations d'électricité vont doubler par rapport à 2020.
QUE NOUS RÉVÈLENT CES DONNÉES ?
La composition du mix énergétique en termes d'électricité et de molécules change drastiquement. Si aucune nouvelle politique n’est adoptée concernant le futur approvisionnement électrique du pays, sa production domestique ne sera pas suffisante pour répondre à la demande croissante. Résultat, le volume d'électricité devant être importé pourrait augmenter fortement.
MESSAGE 3
Il faut encore déterminer la provenance de la moitié de l'approvisionnement électrique belge d'ici 2050. Sans politique claire quant à l’approvisionnement électrique d'ici 2050, la Belgique se retrouvera probablement dans le scénario le plus coûteux. Les options à grande échelle, comme de nouvelles unités nucléaires ou des parcs éoliens offshore non domestiques, nécessitent des signaux clairs dans les années à venir.
Par rapport à aujourd’hui, la Belgique aura besoin de 70 à 90 TWh d'électricité supplémentaires pour couvrir sa demande en électricité en 2050. Définir le futur mix énergétique belge sera donc une des actions critiques que les prochains gouvernements devront prendre. Plusieurs options existent pour le mix énergétique 2050 du pays. Afin de façonner le mix énergétique souhaité, il faut tenir compte de plusieurs éléments et stratégies de diversification. Ces différentes options sont liées aux différents niveaux décisionnels (fédéral, régional), ce qui rend la coopération essentielle.
DE NOMBREUSES OPTIONS EXISTENT POUR COMPLÉTER LE SCÉNARIO DE RÉFÉRENCE POUR L’APPROVISIONNEMENT BAS CARBONE DOMESTIQUE DE LA BELGIQUE
Le graphique ci-dessous met en avant plusieurs leviers qui peuvent être utilisés pour compléter l'approvisionnement bas carbone domestique de la Belgique. Ils servent de blocs constitutifs au mix énergétique 2050 du pays. Une combinaison stratégique de ces leviers sera essentielle pour combler l'écart de 70 à 90 TWh qui apparaîtra entre la demande électrique croissante de la Belgique et son scénario de référence pour l’approvisionnement bas carbone domestique. Plusieurs éléments et stratégies de diversification doivent être pris en compte lors de la sélection des leviers les plus efficaces.
~ 70-90 TWh supply need 2050
On top of central domestic RES supply
Range over the demand scenarios (DE, GA and ELEC)
for each lever on each time horizon [TWh]
wind
QUE DÉMONTRE CE GRAPHIQUE
?
◆ Les diagrammes en bâtons représentent l'électricité additionnelle (en TWh) qui peut être produite (à partir de 2036) si la capacité de production ou des leviers de sobriété sont utilisés à leur maximum. Des efforts significatifs et dans les temps seront nécessaires pour atteindre ces valeurs.
◆ Par exemple, le taux d’installation de l’éolien onshore pourrait doubler (par rapport au scénario « Central-RES ») et celui du photovoltaïque pourrait même quadrupler (scénario « very high-RES »).Tous les cinq ans, 4 GW d’éolien offshore non domestique supplémentaires pourraient s'ajouter. Des options liées à l’extension maximale de la durée de vie des centrales nucléaires actuelles ainsi qu'au développement de nouvelles unités nucléaires sont également comprises.
QUE NOUS RÉVÈLENT CES DONNÉES
?
La production renouvelable domestique de la Belgique (photovoltaïque, éolien onshore et éolien offshore belge) peut grandement contribuer au mix d’approvisionnement électrique. Cela ne suffira cependant pas. Plusieurs options sont disponibles pour répondre à la demande électrique croissante du pays. En exploitant leur potentiel combiné, la Belgique a les moyens de couvrir son approvisionnement électrique requis d’ici 2050.
COMPARAISON DU COÛT SYSTÈME TOTAL SI COMBINAISON DE NOUVELLES UNITÉS NUCLÉAIRES ET D’ÉOLIEN OFFSHORE NON DOMESTIQUE
Le graphique ci-dessous représente l'évolution du coût système total de la Belgique (€/MWh) en fonction de différentes combinaisons de sources d'électricité à grande échelle. Le coût système total comprend tous les investissements et les charges opérationnelles associés à l’approvisionnement électrique selon un scénario particulier. La sécurité d'approvisionnement étant respectée dans tous les scénarios, le coût de la capacité de back-up nécessaire est également pris en compte et varie entre les différents scénarios.
Dans le diagramme au centre du graphique on compare les coûts système totaux associés à différents volumes d’éolien
offshore non domestique et de nouvelles unités nucléaires avec les hypothèses de coûts de référence.
Les diagrammes extérieurs à gauche et à droite du graphique démontrent l’impact sur le coût système total lorsque des hypothèses de coûts plus prudentes (qui reflètent différents risques) sont prises en compte. Pour l'éolien offshore (sur la gauche), ces hypothèses pourraient être liées à des problèmes de chaîne d'approvisionnement et aux coûts des matériaux. Les risques relatifs aux coûts pour les nouvelles unités nucléaires sont associés à la complexité accrue en matière de design et au manque de maturité des petits réacteurs modulaires (PRM) (génération III et IV).
PRINCIPALES QUESTIONS À RÉSOUDRE POUR DÉVELOPPER L’ÉOLIEN OFFSHORE NON DOMESTIQUE ET DE NOUVELLES UNITÉS NUCLÉAIRES
Le développement de sources d'énergie à grande échelle comme l'éolien offshore non domestique et de nouvelles unités nucléaires ne sera pas chose aisée. Ci-dessous, une liste de facteurs à prendre en compte pour le développement ultérieur des deux technologies.
ÉOLIEN OFFSHORE NON DOMESTIQUE NOUVELLES UNITÉS NUCLÉAIRES
COORDINATION INTERNATIONALE ET PLANIFICATION CONJOINTE
La planification de la production offshore et du développement de réseau offshore est actuellement organisée de manière décentralisée, chaque pays identifiant et décidant de ses investissements selon une perspective principalement nationale. Dans ce contexte, le besoin en offshore non domestique sera probablement sous développé. La solution à ce problème réside dans l’adoption d’une approche réellement régionale et conjointe en matière de panification. Parallèlement, il faut faire des efforts pour améliorer le cadre régulatoire entourant ces processus.
FINANCEMENT CONJOINT
QUE DÉMONTRE CE GRAPHIQUE ?
◆ Selon les hypothèses de coûts de référence (diagramme du milieu), ne pas prendre d'action (0 GW sur les deux axes) apparaît comme l’option la plus coûteuse. L’éolien offshore non domestique est la solution la plus efficace en termes de coûts en comparaison avec le développement de nouvelles unités nucléaires.
◆ Toutefois, en fonction de la manière dont les risques associés aux coûts sont évalués, le point ci-dessus pourrait changer. Cela souligne l’importance de prendre en compte tous les risques pertinents lors des décisions concernant le mix d'approvisionnement électrique souhaité pour la Belgique.
QUE NOUS RÉVÈLENT CES DONNÉES ?
En tant que source d'énergie à grande échelle, l’éolien offshore non domestique se révèle être plus efficace en termes de coûts que le développement de nouvelles unités nucléaires. Cependant, l’accélération du développement offshore nécessite une évolution radicale dans la coordination internationale, la planification conjointe et le financement. Si les nouvelles unités nucléaires représentent une solution viable, cette option implique néanmoins ses propres défis en termes, entre autres, de sécurité, de complexité et de financement.
En fonction de l'évolution réelle du paysage énergétique européen, il pourrait également s'avérer avantageux de relier la Belgique à une région européenne où les sources d'énergie bas carbone, par ex. l’énergie solaire, sont largement déployées. Tant que des accords internationaux adéquats sont mis en place, ce déploiement local à grande échelle pourrait s'avérer bénéfique en raison de caractéristiques régionales telles que l’espace disponible, l’approbation du public et le facteur de charge.
Le financement de l’infrastructure offshore et, là où cela s'avère nécessaire, la réduction des risques liés aux parcs éoliens par le biais de mécanismes de support impliquent actuellement des approches simplistes basées principalement sur un principe de territorialité ou une approche 50/50. De telles approches ne sont pas adaptées à la construction d’une infrastructure offshore de plus en plus complexe et maillée. À la place, des pays situés autour d’un bassin maritime particulier doivent unir leurs forces pour développer des mécanismes durables de partage des coûts et bénéfices qui garantissent la création d’incitants adéquats pour toutes les parties afin qu’elles s'engagent à développer l’infrastructure et l’éolien offshore. Cela devrait aussi attirer des investisseurs privés afin d’aider les GRT à faire face aux défis financiers.
UNE DÉCISION POLITIQUE
Les responsables politiques devront définir une ambition quantifiée (nombre de MW) et une ligne du temps pour le développement de nouvelles unités nucléaires. Cela nécessitera également une révision de la loi de 2003 relative à la sortie du nucléaire, une évaluation des incidences sur l’environnement, la consultation des pays voisins et une notification d’aide d'État à l’Europe.
DÉFINITION DES LOCALISATIONS ET SÉCURISATION DES PERMIS
La définition des localisations de nouvelles unités nucléaires, ainsi que la sécurisation des permis, est un prérequis pour la mise en service d’un nouveau réacteur. C’est un processus complexe qui implique de nombreux stakeholders.
ÉTABLISSEMENT DU CADRE
Il sera impératif de définir un cadre pour attirer les investissements (appel d’offres, initiative privée, joint-venture).
COÛT ET DURÉE DE CONSTRUCTION
L’Europe a une expérience récente limitée en matière de développement dans ce domaine et les derniers projets ont mis plus de 15 ans à être réalisés, tandis que leurs coûts ont sérieusement dépassé les budgets initiaux. Pour les nouvelles technologies telles que les PRM ou les réacteurs de prochaine génération, les informations disponibles lors de la prise de décision relative à un investissement seront limitées.
Le graphique ci-dessous démontre que booster les SER domestiques (éolien et photovoltaïque) est très efficace en termes de coûts dans tous les scénarios.
LES ÉCHANGES TRANSFRONTALIERS ENTRE PAYS EUROPÉENS RESTERONT CRUCIAUX POUR UN MARCHÉ EUROPÉEN DE L’ÉLECTRICITÉ INTÉGRÉ ET FONCTIONNEL
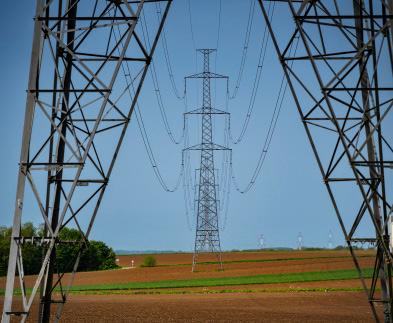
Le système électrique de demain sera bien plus volatil. La production électrique dépendant de la météo ainsi que les appareils électrifiés comme les véhicules électriques, les pompes à chaleur et les processus industriels contribuent à cette volatilité (s’ils ne sont pas gérés soigneusement). Si l’exploitation de la flexibilité des utilisateurs finaux est capitale pour gérer cette volatilité au fil du temps, le réseau de transport d'électricité interconnecté sera crucial pour faire face aux fluctuations géographiques relatives à l’approvisionnement et à la demande.
IMPORTATIONS/EXPORTATIONS D’ÉLECTRICITÉ DE LA BELGIQUE EN 2050 SELON DIFFÉRENTS SCÉNARIOS
QUE DÉMONTRE CE GRAPHIQUE ?
◆ Accélérer le déploiement de nouvelles SER domestiques s’avère être efficace en termes de coûts, indépendamment des hypothèses de capacité pour de nouvelles sources d’énergie à grande échelle en Belgique.
◆ L’impact à la baisse sur les coûts système de l’intégration d’une plus grande quantité d’énergie renouvelable domestique est plus important dans les scénarios où moins de sources d’énergie à grande échelle supplémentaires sont supposées.
QUE NOUS RÉVÈLENT CES DONNÉES ?
Avec le développement de sources d’énergie à grande échelle, la maximisation des SER domestiques (y compris l'éolien offshore dans la ZEE belge) en Belgique s’avère être une option très efficace en termes de coûts dans tous les scénarios. Néanmoins, la maximisation de la capacité photovoltaïque du pays nécessitera des stratégies adaptées afin de gérer les éventuels défis liés à la surproduction à certains moments. Les limitations spatiales (notamment en matière d’éolien offshore) et les problèmes d'acceptation publique (en particulier pour les parcs éoliens onshore) joueront un rôle crucial dans la détermination du potentiel final de ces technologies.
QUE DÉMONTRE CE GRAPHIQUE ?
◆ Le diagramme en bâtons montre l'électricité qui sera échangée entre la Belgique et ses pays voisins en 2050 (les importations sont séparées des exportations).
◆ Différents scénarios en matière d’approvisionnement sont représentés pour la Belgique, allant d'aucune nouvelle source d'énergie à grande échelle à l’installation d’une quantité maximale d'éolien offshore non domestique (16 GW) et de nouvelle production nucléaire (8 GW), ainsi que des scénarios « Central domestic RES » à « High domestic RES ».
◆ À des fins de comparaison, l'électricité échangée par la Belgique avec ses voisins pendant la période 2020-2023 est également comprise.
QUE NOUS RÉVÈLENT CES DONNÉES ?
Dans tous les scénarios d'approvisionnement pour la Belgique d’ici 2050, le volume des échanges transfrontaliers est plusieurs fois supérieur au volume actuel. Le marché électrique européen intégré reste une pierre angulaire du système énergétique de demain. Il permet d’optimiser le dispatching et d’atténuer les fluctuations géographiques ainsi que la volatilité, ce qui contribue à un système électrique efficace et abordable. Quelles que soient les décisions prises pour la Belgique en matière d’approvisionnement électrique, poursuivre le développement du réseau de transport transfrontalier est une mesure sans regret.
LES RESPONSABLES POLITIQUES
PEUVENT UTILISER LES INFORMATIONS
CLÉS SUIVANTES POUR PRENDRE DES DÉCISIONS LIÉES
AU MIX ÉNERGÉTIQUE
2050 DE LA BELGIQUE
1
LES MESURES DE SOBRIÉTÉ
PEUVENT RÉDUIRE DE 15% LE COÛT
TOTAL DU SYSTÈME
La modération de la consommation d'énergie (sobriété) présente un fort potentiel pour maintenir le coût du système sous contrôle. Étant donné que cela est principalement lié à des changements dans le comportement humain, le défi majeur de cette mesure est l’acceptation par la population, en particulier lorsque les personnes pensent que des modifications de leur comportement mèneront à une perte de confort.
VOIR PAGE 166.
2
3
LA MAXIMISATION DU DÉVELOPPEMENT DU RENOUVELABLE DOMESTIQUE EST UNE SOLUTION OPTIMALE EN TERMES DE COÛTS
Même en tenant compte du coût total du système, il est démontré que la maximisation du développement des énergies renouvelables domestiques (éolien onshore, panneaux photovoltaïques et éolien offshore dans la ZEE belge) fait partie d’une solution optimale en termes de coûts pour la Belgique, et ce, dans tous les scénarios.
VOIR PAGE 174.
LE SCÉNARIO LE PLUS COÛTEUX EST CELUI OÙ AUCUNE SOLUTION D’APPROVISIONNEMENT À GRANDE ÉCHELLE N’EST DÉVELOPPÉE EN BELGIQUE
Un choix politique clé qui devrait être posé renvoie au bon équilibre à trouver (à terme) entre les importations d'électricité et les investissements domestiques pour l’approvisionnement électrique. De nombreux aspects doivent être pris en compte, parmi lesquels : abordabilité, opportunités de redistribution des coûts et des bénéfices, agilité face aux incertitudes, résilience en cas de perturbations dans l’approvisionnement, coopération internationale afin d’assurer une approche coordonnée pour le développement offshore, risques liés aux dépassements de budget et de délais, partenariats privépublic pour le financement, méthode de financement, etc.
VOIR PAGE 174.
4
DANS LA PLUPART DES SCÉNARIOS, LE DÉVELOPPEMENT DE SOLUTIONS OFFSHORE ÉLOIGNÉES SE RÉVÈLE ÊTRE MOINS COÛTEUX QUE LA CONSTRUCTION DE NOUVELLES UNITÉS NUCLÉAIRES
Poursuivre l’exploitation du potentiel en renouvelable offshore de la mer du Nord se révèle être bénéfique pour la Belgique. Cependant, les avantages de cette option doivent être comparés à d’autres possibilités d’approvisionnement comme le développement de nouvelles unités de production nucléaire ou le raccordement de SER de base éloignées. Des aspects importants liés à ces options sont les hypothèses quant aux coûts, le délai de réalisation ainsi que le profil de risque (technologique, financier, environnemental, etc.) de chaque technologie.
VOIR PAGE 174.
5
6
LA GESTION DE L’ADÉQUATION DU SYSTÈME NÉCESSITERA LE DÉVELOPPEMENT DE NOUVELLES CAPACITÉS THERMIQUES D’ICI 2050 DONT LES HEURES DE FONCTIONNEMENT SERONT LIMITÉES (700 À 2.000 HEURES PAR AN)
Les outils de gestion de l’adéquation ont été mis en place par le gouvernement sortant. Le besoin d'outils similaires se fera sentir tout au long de l’horizon analysé. Cependant, la contribution des mesures d’adéquation au coût global du futur système énergétique est assez limitée, et des solutions techniques peuvent être déployées à relativement court terme (1 à 5 ans).
VOIR PAGE 192.
L’EXPLOITATION D'UN MAXIMUM DE FLEXIBILITÉ DANS LE SYSTÈME POUR GÉRER SA VOLATILITÉ ACCRUE EST CAPITALE, DE MÊME QU’UN ACCÈS EFFICACE AU MARCHÉ
Le système énergétique sera de plus en plus volatil. Le développement de différents modes de flexibilité (et l’accès à ceux-ci) ainsi qu’un marché électrique intégré au niveau européen seront des éléments clés pour faire face à cette volatilité. Cela sera essentiel pour gérer le système énergétique de la manière la plus efficace en termes de coûts ainsi que pour limiter le délestage économique des SER.
VOIR PAGE 186.
MESSAGE 4
En plus de préparatifs à long terme, il faudra accorder une attention supplémentaire à la gestion de la période de transition. Les options efficaces en termes de coûts incluent la maximisation des SER domestiques en Belgique, la mise en place de mesures de sobriété, la prolongation de la durée de vie d'unités de production existantes ainsi que le développement de l’accès du pays à l’éolien offshore non domestique.
Chacun de ces aspects implique ses propres contraintes spécifiques.
À mesure que le paysage énergétique belge se dessine, il est essentiel de continuer à implémenter les politiques actuelles et à prioriser les actions à court terme qui permettent de faire face à la demande croissante en électricité.
ACTIONS À COURT TERME POUVANT CONTRIBUER À RÉPONDRE AUX BESOINS D’APPROVISIONNEMENT EN 2036
Promouvoir la sobriété et maximiser les SER domestiques du pays font partie d’une solution optimale en termes de coûts sur le long terme et peuvent également jouer un rôle important pendant la période de transition. Les autres options qui devraient être étudiées sont le développement de l’accès à l'électricité offshore non domestique et la prolongation de la durée de vie d’unités de production existantes (à la fois thermiques et nucléaires). Étant donné que la volatilité va augmenter significativement au sein du système, exploiter la flexibilité en son sein est essentiel pour réduire les coûts système.
Le tableau ci-dessous offre un aperçu d'actions en cours et à court terme ainsi que de leur contribution (TWh) aux besoins d'approvisionnement de la Belgique en 2036 et 2050.
CONTRIBUTION TO THE 50-60 TWh SUPPLY NEED IN 2036
ONGOING ACTIONS: IMPLEMENTING CURRENT POLICIES
− Prolonging the lifespan of the Tihange 3 and Doel 4 nuclear units (by 10 years). Already included in basis
− Extending offshore wind in the Belgian EEZ to reach a capacity of 5.8 GW through the Princess Elisabeth Island.
− Further developing the transmission grid and interconnectors, and a first batch of non-domestic offshore wind hybrid interconnectors.
CONTRIBUTION IN THE SHORT TERM
Additional domestic RES + sufficiency
− Measures to speed up the deployment of domestic RES, as well as actions to ensure their efficient integration into the power system.
− Consumer moderation, synonymous with behavioural adaptations and also known as sufficiency, is an opportunity for further reducing the final energy demand. This approach predominantly relates to changes in human behaviour. Its implementation is hindered by challenges related to its acceptance, particularly when individuals believe that changes in their behaviour will lead to a loss of comfort. Sufficiently long implementation lead times are required for encouraging it.
Prolonging the lifespan of existing generation
− Further extending the operational life of the nuclear fleet beyond 2035 (subject to technical, safety and regulatory constraints) is a cost-effective transitory solution. Whilst the prolongation of existing nuclear units beyond 2035 seems to be cost efficient, it is only a transitory solution and won’t to fill the supply gap in its entirety.
− Next to contributing to adequacy, prolonging the lifetime of existing thermal (gas) generation will contribute to the supply mix of Belgium. The actual contribution to supply as well as the mix of (green and/or fossil) molecules used in this type of generation is strongly dependent on the energy landscape that will materialise in Belgium and abroad.
More imports
− An increased reliance on imports/foreign supplies could in any
contribute to a (transitory) solution.
*not necessarily carbon neutral
QUE DÉMONTRE CE GRAPHIQUE ?
◆ Le graphique montre le coût total du système électrique en €/MWh si aucune unité nucléaire n’est prolongée, et si 2, 3 ou 4 GW de capacité de production nucléaire sont prolongés
- En fonction de deux horizons temporels 2036 à gauche et 2040 à droite
- En fonction de deux hypothèses en termes de coûts coût de référence à gauche et coût accru à droite
- En fonction de deux niveaux d'éolien offshore non domestique raccordé 0 GW à gauche et 4/8 GW à droite.
◆ La prolongation de la durée de vie des unités nucléaires réduit le coût du système électrique belge. Bien que la prolongation de plus de 2 GW puisse ne pas encore être financièrement rentable en 2036 (en particulier dans les cas où le coût de la prolongation d’une unité est élevé), elle le deviendra en 2040 en raison de la demande électrique en hausse.
QUE NOUS RÉVÈLENT CES DONNÉES ?
Prolonger la durée de vie de 2 GW de production nucléaire s’avère être économiquement avantageux selon les hypothèses. Le bénéfice de la prolongation de réacteurs additionnels dépend de la demande électrique belge. Dans tous les cas, les prolongations du nucléaire devraient être envisagées selon une perspective plus large qui englobe davantage que les coûts concernés : des aspects tels que la faisabilité, les réglementations en matière de sécurité, la disponibilité du réseau, des facteurs socio-économiques, etc. devraient tous être pris en compte.
SE FOCALISER SUR LES ACTIONS À COURT TERME NE DOIT PAS RÉDUIRE LE BESOIN URGENT D’ENTREPRENDRE DES PRÉPARATIFS À LONG TERME
◆ NOUVELLES UNITÉS NUCLÉAIRES
Si une nouvelle capacité nucléaire est envisagée, des actions préparatoires telles que l’identification des sites potentiels, une analyse des éventuels instruments d’investissement et la préparation de l’infrastructure réseau devraient être entamées.
◆ ÉOLIEN OFFSHORE NON DOMESTIQUE
En termes de développement ultérieur de l'éolien offshore non domestique, de nouveaux partenariats internationaux devraient être conclus (en plus de ceux existants), des études de faisabilité devraient être réalisées et les obstacles actuels (par ex. le financement) devraient être surmontés.
Le futur mix énergétique et la localisation des unités de production à venir joueront un rôle capital dans le développement du réseau électrique. Dans tous les scénarios, le renforcement et l’achèvement du réseau 380 kV (backbone) forment la base pour les évolutions futures.
Bien que certains projets de renforcement du réseau s'avèrent être nécessaires dans tous les scénarios abordés dans cette étude, l'utilité d’autres projets dépend fortement de l’emplacement des unités onshore nouvelles ou prolongées et du niveau d'intégration de l’éolien offshore. Dans toutes les situations, le renforcement et l’achèvement du réseau 380 kV (backbone) forment la base pour toute future évolution.
INVESTISSEMENTS SANS REGRET DANS L’INFRASTRUCTURE RÉSEAU
Certains investissements dans l’infrastructure réseau sont des mesures sans regret et sont résilients aux changements dans le choix des sources d'énergie composant le mix d’approvisionnement électrique. Leurs principaux moteurs sont typiquement l'électrification de la demande et le développement des SER domestiques. Ces investissements devraient avoir la priorité et être implémentés sans délai afin d'éviter tout contretemps potentiel dans la transition énergétique.
RENFORCER LES RÉSEAUX DE TRANSPORT LOCAL ET DE DISTRIBUTION
À la suite de l'électrification des utilisations finales résidentielles (comme les véhicules électriques et les pompes à chaleur) ainsi que des petites et moyennes entreprises, renforcer les réseaux de distribution et le réseau de transport local est essentiel. Ce renforcement est particulièrement crucial à court terme, étant donné que l'électrification des utilisations finales locales devrait majoritairement avoir lieu dans les 10 à 15 prochaines années.
DÉVELOPPER LES RÉSEAUX POUR LES CLUSTERS INDUSTRIELS
De même, l'électrification des grands clusters industriels nécessite que les réseaux à très haute tension locaux soient significativement développés. Malgré des incertitudes concernant certains plans industriels, il y a suffisamment d’utilisateurs du réseau existants et potentiels dans ces clusters pour justifier le renforcement du réseau. Le développement dans les temps de l’infrastructure, voire son anticipation à temps, est particulièrement vital dans ce contexte. Ne pas y parvenir pourrait potentiellement conduire à la relocalisation d’industries en dehors du pays en raison du manque d’infrastructure.
RENFORCER LES INTERCONNEXIONS ONSHORE
Les interconnexions onshore continuent à jouer un rôle crucial dans le dispatching efficace de l'électricité, peu importe la dépendance de la Belgique aux importations. Renforcer l’interconnexion de la Belgique avec ses voisins est hautement efficace en termes de coûts et apporte des bénéfices significatifs.
FUTURS INVESTISSEMENTS TRANSFRONTALIERS ONSHORE
Le graphique ci-dessous montre que les investissements transfrontaliers dépendent en partie des visions en matière d'énergie adoptées par la Belgique et ses voisins, en particulier en termes de priorités mutuelles.
Onshore cross-border investments: these are a no-regret, but a link should be made with the vision for Belgium's energy future to determine priorities
Reinforcing onshore interconnectors
Invariant of the offshore/ domestic generation
QUE DÉMONTRE CE GRAPHIQUE ?
◆ La poursuite du renforcement de l’interconnexion de la Belgique avec ses voisins est une mesure sans regret. Cependant, les frontières à privilégier semblent dépendre des mix électriques choisis par la Belgique et ses voisins.
More interesting in case of less offshore generation directly connected to BE
interesting in case of more generation in Belgium
◆ Par exemple, lorsque de larges volumes d'éolien offshore sont exploités en mer du Nord, le développement d'autres interconnexions est-ouest entre la Belgique et l’Allemagne est crucial faute de quoi, à moyen terme, un accès accru aux pays du Nord devrait avoir la priorité.
CERTAINS INVESTISSEMENTS DANS L’INFRASTRUCTURE RÉSEAU DÉPENDENT DES DÉCISIONS POLITIQUES
D’importants investissements réseau, en particulier dans le backbone belge et le réseau offshore, dépendent fortement des décisions politiques relatives au mix électrique de la Belgique.
Bien que le Plan de Développement fédéral 2024-2034 souligne les investissements dans le backbone qui sont nécessaires d’ici 2035, des décisions doivent être prises pour la période allant au-delà. Étant donné les longs délais pour les projets, il est crucial d’adopter des actions spécifiques qui facilitent ou lancent des préparatifs afin de pouvoir activer les options pertinentes.
Le solide backbone AC avec ses nouvelles liaisons et renforcements HTLS (high-temperature low-sag), y compris Ventilus et Boucle du Hainaut, occupera un rôle clé afin de permettre le raccordement de production centralisée additionnelle ou de liaisons HVDC.
RENFORCEMENTS NÉCESSAIRES POUR RACCORDER LA PRODUCTION DOMESTIQUE CENTRALISÉE
Concernant la prolongation du parc nucléaire existant
Si la prolongation de la durée de vie de plus de 2 GW de production nucléaire existante est retenue, l’infrastructure électrique à proximité des sites nucléaires actuels doit y être préparée.
Les plans belges de sortie du nucléaire depuis 2003, l’arrivée d’utilisateurs du réseau additionnels à proximité et les changements dans la législation européenne ont réduit la capacité d'accueil du réseau pour de telles prolongations.
Concernant de nouvelles unités nucléaires
L’identification de potentiels futurs sites nucléaires est une étape essentielle. Cela implique de préparer les emplacements les plus probables de ces sites et de les intégrer dans le backbone global de la Belgique.
RENFORCEMENTS NÉCESSAIRES POUR RACCORDER L’ÉOLIEN OFFSHORE NON DOMESTIQUE SUPPLÉMENTAIRE
Les solutions offshore hybrides ainsi que les hubs offshore représentent l’approche la plus efficace en termes de coûts pour intégrer l'éolien offshore non domestique au mix électrique belge.
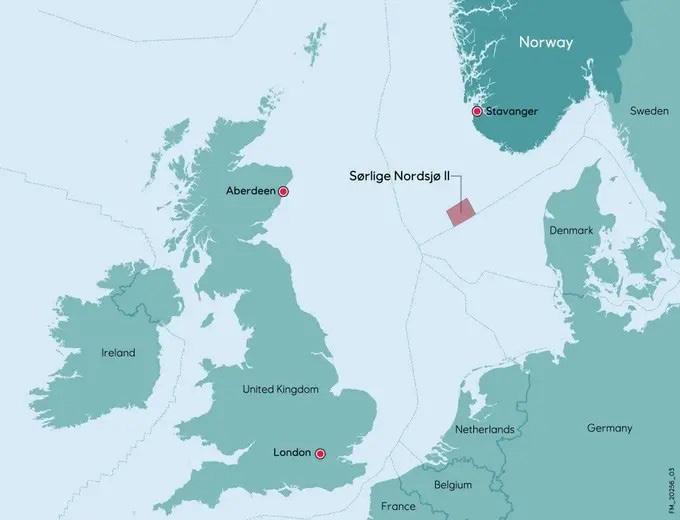
Collaborer avec des partenaires internationaux, tels que TritonLink (Belgique - Danemark), Belgique - Norvège, Belgique - Pays-Bas, Belgique - Royaume-Uni - Irlande, Belgique - France et Belgique - Allemagne, est essentiel afin d’identifier des options prometteuses et de mettre en place les structures organisationnelles et accords nécessaires pour implémenter avec succès les projets choisis.
S’attaquer aux barrières existantes en matière de systèmes hybrides potentiels reste tout aussi important (voir les publications Elia-Orsted [ELI-9] et Offshore TSO Collaboration [OTC-1]).
Les évolutions concrètes liées au raccordement d’une première vague d’interconnexions hybrides pour l'éolien offshore non domestique devront être approuvées dans le prochain Plan de Développement fédéral si l’objectif est de les mettre en service avant 2040. Pour raccorder davantage d'éolien offshore, l’axe est-ouest du backbone interne devra également être renforcé.
1. INTRODUCTION
1.1.
1.1. OBJECTIVES
AN ENERGY COMPASS FOR BELGIUM
Achieving the commitment to reach a net-zero energy mix by 2050 requires a clear vision that should be implemented via decisive measures. Given the recent European, federal and regional elections in Belgium, and clear signs that additional measures are required at different political levels, the time is ripe to take important decisions about the future of our energy system. As Belgium’s electricity transmission system operator (TSO) Elia has applied its modelling expertise in this study by quantifying different possible energy pathways that Belgium could adopt in the lead-up to 2050 and assessing the challenges associated with each of these.
This study aims to illustrate the different electricity supply options that are still open to Belgium whilst considering the influence of other energy vectors on its power system. The study evaluates a wide array of scenarios for Belgium and Europe, reflecting the broad spectrum of potential futures that both face.
Instead of prescribing one single solution or setting out one clear direction for Belgium and Europe to follow, this study outlines the choices that policymakers face regarding our energy mix, the effects of these choices on several crucial indicators such as costs or imports, and the time frames related to these choices, to ensure that sufficient time can be allocated to considering each of them. It should be noted that the impacts of some choices cannot be quantified, and certain pathways entail more uncertainties than others. Policymakers should take this into consideration when making decisions about the future of our energy mix and what it will resemble in (the transition to) 2050.
SYSTEM
Decisions about the period 2035-2050 must be taken soon, given how critical it will be for Belgium's future energy supply.
◆ 15 European scenarios and sensitivities
◆ 300 Belgian sensitivities
◆ A large set of quantified and qualitative indicators calculated
PREPARING THE ELECTRICITY INFRASTRUCTURE OF THE FUTURE
Elia is required to evaluate and identify future electricity grid requirements to ensure that these can be met in an efficient manner that is aligned with the interests of society. This is crucial, since infrastructure projects often take several years to complete, and decisions taken today influence how the grid will be developed years down the line. With Elia’s next federal development plan as a reference point in mind (see BOX 1-1 on Elia’s other studies for more information), Elia is keen to outline the potential trajectories that Belgium could adopt in the lead-up to 2050.
• Divergent scenarios BE/EU based on different visions
• Focus on power system
sufficient time to prepare an electricity grid which is ‘fit for purpose’
• Highlight necessary steps and decisions in the forthcoming legislation period …carry expertise and tools for scenario building
• Specific strengths/characteristics: hourly granularity, EU scope, physical grid constraints, …
• Grid infrastructure projects >10 years to build
• Need to define grid infrastructure corridors
• Further inform the general public and policymakers about the impact of different visions relating to Belgium's electricity landscape
• First step for future federal network development plan post 2035
1.2. CONTEXT
25 YEARS LEFT TO ACHIEVE NET ZERO: AFFORDABILITY AND SECURITY OF SUPPLY SHOULD BE FOCUSED ON WHILST WORKING TOWARDS NET ZERO
As we shift away from fossil fuels, the electrification of our society is happening at an unprecedented pace. This entails increasingly ambitious goals for renewable energy. In addition, geopolitical instability is straining our energy security and affordability (linked both to the Russian invasion of Ukraine and the energy crisis). Three facets of the energy system (also called the ‘energy trilemma’) lie more than ever at the forefront of public debate: security of supply, affordability and sustainability (see Figure 1-1).
Security of supply and affordability are essential for socioeconomic prosperity. The recent energy crisis underscored the crucial role of energy security; REPowerEU listed it as a key area of focus - the first time in several years that it was highlighted. Depending on a single energy source or supplier increases a country’s vulnerability and increases the risk of it being exposed to supply interruptions. In addition to diversifying their energy sources, the energy crisis demonstrated that countries should invest in solid energy infrastructure to ensure a stable, affordable, and secure energy supply for the future.
The fight against climate change is one of the most pressing challenges facing the world today. The EU's commitment to climate action and the implementation of the European Green Deal form important contributions towards limiting global warming to well below 2°C, as outlined in the 2015 Paris Agreement.
CURRENT AMBITIONS AND TARGETS
European plans to mitigate climate change consist of a range of measures adopted by European Union (EU) Member States. For example, the EU has set emission reduction targets for the next few decades.
The global focus on sustainable development and combating climate change has led to a significant emphasis on the energy transition and electrification. This shift is characterised by the phasing out of fossil fuels, the adoption of renewable energy sources (RES), advancements in energy storage technologies, and the electrification of transportation and industrial sectors. Governments, all sectors of the economy and communities are prioritising energy transition initiatives to reduce greenhouse gas emissions, enhance energy security, and foster a more sustainable future.
The Union’s historical GHG emissions along with its targets are illustrated in Figure 1-2.
Net GHG emissions for Europe including UK, NO, CH. ‘Energy’ category: includes international aviation and 50% of international shipping.
‘Other’ category includes agriculture, waste management and other sectors.
‘LULUCF’ category includes Land Use, Land-Use Change and Forestry.
Source: European Environment Agency.
At the European level, multiple policy measures, commitments and communications have therefore been released by the EU in relation to the above targets. Some of these are included below (in chronological order).
Adoption of Paris Agreement the legally binding international treaty on
with
12 DECEMBER 2015
TARGETS
By 2020, reduce greenhouse gas (GHG) emissions by 20% compared with 1990 levels; increase energy efficiency in the EU by 20%; and ensure that 20% of total final energy consumption in the EU is met by renewables [EUC-1]. The EU successfully reduced its emissions by 24% in 2019 and 31% in 2020 (due, in part, to the COVID-19 pandemic).
The EU has adopted a set of proposals to make its climate, energy, transport and taxation policies fit for reducing net GHG emissions by at least 55% by 2030 compared with 1990 levels [EUC-2].
TARGETS
The EC recommended in Feb. 2024 to aim for a 90% net reduction in GHG emissions compared with 1990 levels by 2040 [EUC3]. The legislative proposal needs to be submitted after the European elections and then needs to be agreed on by the European parliament and Member States.
The EU’s goal is to reach net-zero emissions by 2050, meaning that any remaining emissions are counterbalanced by measures that remove GHG from the atmosphere. [EUC-4]
FUNDAMENTAL SHIFTS IN THE ENERGY SYSTEM
Figure 1-3 illustrates some of the major changes in the energy system that are required to reach net zero by 2050:
◆ a reduction in total energy needs through sufficiency and energy efficiency (with electrification being the most important lever);
◆ an increase in the volume of RES integrated into the system which will be complemented by other low-carbon sources;
◆ the massive electrification of final energy consumption, so increasing the share occupied by electricity in the final energy demand as well as increasing the consumption of electricity in absolute terms.
The pace at which these changes are occurring has recently accelerated significantly. Numerous countries have revised their offshore wind ambitions, while the installation rate of solar photo-
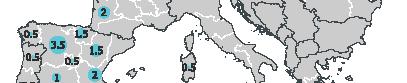
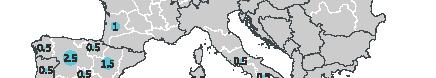
voltaic systems in Europe continues to rise. For example, Germany raised its 2030 offshore wind capacity target from 20 GW in 2020 [REU-1] to 30 GW in 2022 via the Easter Package [BMW-1]; the Dutch Government raised in 2022 the target for offshore wind capacity from 11 to 21 GW by 2030 [RVO-1]; while the total EU solar photovoltaic capacity increased by 21% in 2021 compared to 2022 [SOL-1] and by 27% in 2023 compared to 2022 [SOL-2] with Germany and Spain in the lead. Furthermore, the ban on the sale of new light-duty fossil fuel vehicles from 2035 onwards will expedite the adoption of electric vehicles, in turn leading to increased electrification. Likewise, there has been a marked increase in the installation of heat pumps across multiple European countries.
These changes will affect the energy supply mix as well as energy consumption patterns across Europe.
Figure 1-4 illustrates the historical RES share (in the energy mix) and RES-E share (in electricity consumption) in Europe and Belgium. The EU’s target for 2020 was for RES to make up 20% of its energy consumption - a goal that the EU achieved. In November 2023, a new binding RES share target of 42.5% was set for 2030 [EUC-5] with the EC estimating that the RES-E share would reach 69% in order to support the 'REPowerEU' plan [EUC-6]
Also in May 2024, Belgium planned its draft (updated) National Energy and Climate Plan (NECP) to be submitted to the European Commission by end of June 2024. The RES share calculated in this plan would be 21.7% by 2030, based on the measures outlined in the plan’s WAM scenario [BEL-1] However, additional measures should be taken by Belgium in case the country is required to raise its RES share to 33% [BEL-1], as outlined in EU legislation [EUC-7] RES AND RES-E SHARES IN EUROPE AND IN BELGIUM
amount of
consumed will be
through the use of additional energy efficiency and sufficiency measures but also through additional electrification as it mostly uses less energy to deliver the same energy use
share occupied by electricity in final/end energy consumption will increase with additional electrification
CHANGES UNDERGONE BY THE ENERGY SECTOR IN THE LEAD-UP TO NET
Source: Inspired from ‘Increasing the EU’s 2030 emissions reduction target’ report from European Climate Foundation and Climact.
PUTTING BELGIUM CENTRE STAGE
The challenge for Belgium lies in carving out an energy future that ensures that it has access to a sustainable and affordable energy supply. Belgium's strong industrial foundation and its well-connected and interconnected methane and electricity systems are key assets that have helped to achieve the welfare the country has today. Additionally, the country is home to major ports, logistics centres and industry hubs.
In addition to occupying a central position in terms of its geography, Belgium occupies a central position in terms of Europe's policy changes. It actively participates in and spearheads conversations at both industrial and political levels. This is evident in its hosting of key events such as the second North Sea Summit in Ostend in 2023 and coordination of the 'Antwerp Declaration for a European Industrial Deal' in February 2024. Belgium is also showing its innovation skills in energy infrastructure with the plan to build the first energy island (Princess Elisabeth island) to integrate more offshore wind energy and further interconnectors into the system.
Given the fact that it is a highly densely populated country with little to no economic potential for primary fossil fuel resources, Belgium's primary energy is derived from renewable sources (which also have a limited potential). Having phased out its coal production during the twentieth century and with no indige-
nous sources of methane or oil on its territory, Belgium relies on imports to meet over 90% of its primary energy supply as all fossil fuels are sourced from abroad. Over 75% of the primary energy consumed in the country still comes from fossil fuels like oil, gas and coal. Similar figures are reflected in the country’s final energy consumption.
Belgium’s primary energy supply was 52.3 Mtoe (which corresponds to 608 TWh) in 2022 [FPS-1] (including energy carriers used for non-energy purposes such as petroleum used for producing plastics and excluding international transport). Minus transformation and losses, its final energy consumption was 36.9 Mtoe in 2022 (429 TWh). Figure 1-5 covers the shares occupied by different fuels in the country’s primary and final energy consumption in 2022.
Belgium’s final energy consumption has remained stable over the past 10 years, as has the share of energy carriers:
◆ around 50%: oil;
◆ around 25%: methane;
◆ less than 20%: electricity;
◆ approximately 5%: direct heat, renewables and solid fossil fuels.
HOW THIS BLUEPRINT RELATES TO ELIA TRANSMISSION BELGIUM’S OTHER STUDIES
Elia has gained experience in energy modelling and scenario development by producing prospective studies, which require modelling methodologies to be constantly improved and require performant data quality and data management processes to be in place.
Studies performed by Elia linked to legal requirements
As required by the Electricity Act 1999, Elia publishes tenyear adequacy and flexibility studies (AdeqFlex) on a biennial basis. These explore the electricity system’s projected adequacy and flexibility needs for the following ten-year period. Assessments of the system’s ‘adequacy’ explore whether the sum of expected available capacities, including electricity imports, is sufficient to meet Belgium’s reliability standard - or the necessary level of adequacy. It should be noted that the study also assesses the economic viability of the needed capacities. Assessments of the system’s ‘flexibility’ investigate the extent to which this capacity carries the right technical characteristics to cope with future (un)expected variations in power generation (in particular, power produced from RES) and demand. The most recent ten-year Adequacy and Flexibility study was published in June 2023 (AdeqFlex’23) [ELI-1].
Elia has been mandated by law to publish Capacity Remuneration Mechanism (CRM) calibration reports which contain information that is required to determine the volume of capacity to be contracted and proposed parameters for each CRM auction. These calibration reports are published every year in November in line with the Royal Decree that sets out the method for calculating the volume of required capacity and the necessary parameters for the organisation of auctions within the framework of the CRM (‘Royal Decree on Methodology’) [ELI-2]
Elia is also responsible for writing and publishing quadrennial federal development plans and regional plans
Each federal development plan covers a period of ten years and includes a detailed estimate of onshore and offshore 150-380 KV transmission capacity needs, alongside an explanation of the assumptions and methods used to calculate them. It also includes the investment programme that Elia will need to implement to meet the identified needs. The federal plan must be approved by the Minister of Energy before being officially adopted. The latest plan, which covers the period 2024-34, was approved in May 2023 [ELI-3]. Given that Elia also owns and operates the 30kV to 70 kV high-voltage sections of the power grid which fall under the competence of the different regions, a similar (but slightly different) process of developing regional investment plans exists for Flanders, Wallonia and the Brussels region.
Long-term prospective studies
Elia also produces ad-hoc system of the future studies which cover longer periods of time (for example, up to 2050). In November 2017 Elia published its ‘Electricity scenarios for Belgium towards 2050 – Elia’s quantified study on the energy transition in 2030 and 2040’ [ELI-4] The current Blueprint study is another example of one of these long-term prospective studies.
Such studies are designed to complement existing studies that explore the lead-up to 2050 whilst focusing specifically on the Belgian electricity sector within Europe.
Additionally, Elia Group publishes specific viewpoint studies pertaining to a specific topic of the electricity value chain. The viewpoint study of 2023 (‘The Power of Flex’) focused on the barriers to the development of decentralised flexibility whilst the View Point 2022 (‘Powering Industry towards Net Zero’) offered a deep dive into the electrification needs of industry as a result of their netzero ambitions. This year’s viewpoint will be focused on European offshore development.
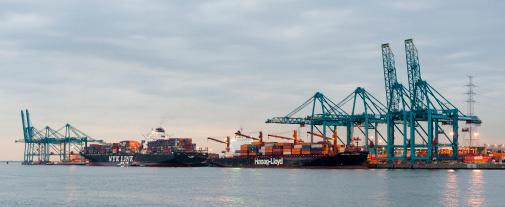
Interestingly, fuels for international aviation and shipping used in Belgium amount to about 17 and 80 TWh per year respectively (calculated as an average over the last ten years) [EUS-1]. This is mainly due to ship refuelling (bunkering), with the Port of Antwerp being a significant hub for this in Europe.
Belgium has the fifth largest non-energy feedstock demand in the EU, mainly explained by the presence of the petrochemical cluster in the port of Antwerp with a heavy concentration of refineries, chemical producers, and related industries that transform crude oil and natural gas into a multitude of chemical intermediary and final products.
52.3 Mtoe (608 TWh)
transformation and other losses
Data for 2022
Almost 70% of Belgium’s primary energy supply was made up of fossil fuels
1.3. STAKEHOLDER INTERACTIONS
INVOLVEMENT OF THE HORIZONTAL ELECTRICITY SYSTEM THINK TANK
As part of the stakeholder engagement process for this study, Elia asked for feedback from partners in order to define its scope, assumptions and methodology. Each of these was discussed during sessions organised by the Horizonal Electricity System Think Tank [ELI-5], which is made up of a wide range of energy stakeholders in Belgium.
In addition to the plenary sessions held by the Think Tank in September 2023, December 2023 and March 2024, Elia also organised 3 dedicated workshops that covered specific aspects of the study:
◆ On 24 October 2023, the main methodological elements were covered, alongside an overview of assumptions and scenarios.
◆ On 13 November 2023, the cost components were presented by Compass Lexecon.
◆ On 13 December 2023, an update on the scenarios and methodology was provided.
The workshops were complemented by a consultation of the members of the Think Tank which produced 9 replies and more than 50 comments (see BOX 1-2 for further details).
A plenary Think Tank session was held on 19 December 2023, during which the consultation comments were presented alongside several adaptations to the models.
In addition to the above, Elia took part in a number of exchanges with interested parties in order to discuss the study’s methodology and assumptions. In particular, Elia worked closely with Fluxys (the Belgian gas TSO) to define the main European scenarios that should be used in the study. Several bilateral meeting were held during the study's development to debate and discuss the scenarios, methodology and results. Elia and Fluxys agreed on the Ten-Year Network Development Plan 2024 (TYNDP 2024) scenario framework from ENTSO-E/ENTSO-G (European Network of Transmission System Operators for Electricity/Gas) as a starting point for the study’s scenarios with relevant adaptations (see Chapter 3). In addition, other costs and parameters were further aligned with Fluxys after the consultation.
The Elia Academic Board met in October 2023; during this, the methodology and scope of the study were discussed.
The interactions with stakeholders lead to several key modelling changes and improvements, as well as additional sensitivities to be investigated. The main criticisms received during the consultation phase were linked to the modelling choice to only model electricity. Therefore, Elia expanded its model to all energy vectors, not only electricity. This major change required the creation of modules for hydrogen, methane, ammonia, liquids and carbon emissions.
CONSULTATION FOR THE ELECTRICITY SYSTEM BLUEPRINT FOR 2035-2050
Three dedicated workshops
◆ 24/10/2023: scenarios and methodology
◆ 13/11/2023: costs
◆ 13/12/2023: update on scenarios and methodology
Documents submitted to consultation from 18/11/2023 to 18/12/2023
• Document providing explanations on the methodology, scenarios and input data
• Excel file with detailed input data for the costs prepared by Compass-Lexecon
? Stakeholders feedbacks
• 10 replies received
• More than 50 comments
Input data / Generation
Input data / Total electricity demand
Input data / Demand Side Response
Input data / Economic Costs assumptions for certain technologies, WACC assumption
Input data / Scenarios for Belgium
Input data / Scenarios for Europe
Input data / Other topics
Main points raised during the consultation
Belgian offshore platform
EnergyVille
Engie
EDF Luminus
Essencia
Edora
Febeliec
Fluxys
FEBEG
GE Vernova
Methodology / General Methodoolgy / Cross-border exchanges
Methodology / modelling of other vectors than electricity (hydrogen, methane, heat, liquids,..)
Methodology/CO2 computation
Questions on the modelling/clarifications
General comments
• questions related to the modelling of other vectors (hydrogen, heat, methane, liquids...)
• costs assumptions for certain technologies, WACC
• costs for non explicitly modelled vectors and scope of the cost assessment
• flexibility that can be harvested in heating networks, cogeneration...
• optimisation of investments in other generation assets than offshore and thermal
• simplifications that could be introduced in the geographical granularity
• clarifications regarding methodology, models, assumptions, scope of the assessment
• proposal for sensitivities
Main improvements applied after consultation
• Update of the costs based on the comments and more recent sources
• Alignment of the main scenarios to be used with Fluxys (based on the TYNDP2024)
• Addition of several sensitivities at Belgian and European level based on the comments
• Expansion of the modelling towards all energy vectors (initially only electricity was to be considered)
SUPPORT FROM CONSULTING FIRMS
Elia hired Compass Lexecon in order to estimate the total system costs (and its components) and material usage associated with future energy system scenarios. These were discussed during the second workshop mentioned above and were included in the consultation.
Elia also asked VITO/EnergyVille to verify and provide feedback on the assumptions and results used in the study. Their reasoned opinion is also included in this report as appendix.
In addition, Sia Partners was hired to challenge and provide input to Elia with regard to its scenarios (aviation & shipping, industry…) and methodology. Sia Partners also carried out the work underlying and related to the Marginal Abatement Cost Curve (MACC) (see Appendix E for more details).
2. METHODOLOGY
2.1.
The methodology used in this study was developed based on the expertise Elia has gained over the past decade via the publication of numerous studies as outlined in the Chapter 1. As described in the previous chapter, the methodology was presented to and discussed with stakeholders during several workshops and meetings and was subject to a consultation. As a consequence, several novel approaches were then used as part of this study.
The main changes compared with previous Elia studies lie in:
◆ the expansion of European multi-energy scenarios to feedstock, international aviation and shipping;
◆ the use of a capacity expansion model which optimises the location and the amount of selected technologies;
◆ the adoption of hourly/daily multi-energy modelling across the whole of Europe
◆ the use of a flow-based zonal modelling for the electricity system to also reflect electric bottlenecks within countries;
◆ the consideration of all carbon emissions (processes, non-CO2 LULUCF, energy…) and options for capturing or using it.
Indeed, while Elia’s past studies have focused mainly on the electricity sector, the current study is the first multi-energy study that Elia has performed for the whole of Europe. It should be noted that ‘multi-energy’ refers to the explicit modelling of multiple energy vectors (electricity, liquids, gases…). In addition, in order to grasp the physical reality of the electricity network, this study uses a flow-based model for the entire European perimeter (through an equivalent zonal grid model).
This chapter includes a summary of the methodology used. Next, an overview of the multi-energy framework that was developed and is used in this study is covered. This chapter then ends with a discussion about the creation of the marginal cost of abatement curves. Several of the study’s appendices act as a complement to this chapter: they include more information about specific aspects of the methodology.
Multi-energy
Fixed ex ante for each carrier explicitly (not optimised). Includes feedstock, international aviation and shipping.
Investment options: H and electricity infrastructure, cross-vector options (e.g.
Hourly economic dispatch for electricity supply and demand Daily (or 2-daily) for molecules supply and demand
Forward-looking database that includes
Minimisation of total system costs at European level for a given carbon target (includes optimisation of the CO2 price).
Endogenous investments for whole Europe in the grid (onshore
FEATURES OF THE MODELS USED IN THIS STUDY
FIGURE 2-1
2.1. METHODOLOGY: IN A NUTSHELL
The methodology adopted for this study is presented in Figure 2-2. It can be subdivided into the following steps:
1. EU scenario definition - combining ex ante defined parameters, potentials and candidates for investments
2. Multi-energy capacity expansion and dispatch model – deriving the optimal mix and dispatch to meet the key characteristics of the scenario defined in the previous step
3. Adequacy study – full adequacy check on all climate years for the required thermal generation in the power system
4. Application of Belgian sensitivities – changing the installed capacities of certain technologies for Belgium and re run the multi-energy dispatch for whole Europe
5. Indicators assessments OVERVIEW
Post-processing of results.
2.2. TIME HORIZONS AND SIMULATION PERIMETER
TEMPORAL GRANULARITY – 2036, 2040 AND 2050
Three time horizons are explicitly modelled in this study: 2036, 2040 and 2050. These time horizons were chosen for their relevance for the Belgian energy system:
◆ 2036 was chosen to represent the year in which, according to the current legal framework, the last nuclear reactor would close in Belgium;
◆ The availability of input data from other studies and Euro-
pean (proposed) targets (2040, 2050) explain the choice for the other two years.
The optimisation of the energy system is performed sequentially. As such, investments from previous time horizons are considered in the initialisation of the optimisation of subsequent years. This process is schematically presented in Figure 2-3.
1. Based on scenario storylines multi-energy demand vectors and supply capacities, costs and (import) potentials are defined for Europe. These quantified scenarios are supplemented with additional sensitivities which aim to identify the effects of changing certain input variables. The final demand for each energy vector is therefore defined ex ante (there is no optimisation between energy vectors for a given energy usage). However the additional consumption from one vector to another or storage losses is endogenously modelled (carbon capture and storage/utilisation or CCS/U, P2x, batteries…).
2. In a second step, the quantified scenario is subject to a combined optimisation of the multi-energy system dispatch, capacity expansion and location of key technologies such as electrical and hydrogen transmission infrastructure, thermal generation based on molecules, electrolysis, offshore wind and carbon abatement technologies. This optimisation determines the energy system which can provide the total energy load at the lowest cost subject to a European GHG emission target. The optimisation is performed sequentially and starts in 2036, meaning that the results of previous target years are used to initialise subsequent ones.
3. New electricity generation capacity is added where needed to reach the security of supply criteria (adequacy) For this simulation step, a model with a reduced level of geographical granularity is used to enable the timely calculation of the large amount of climate years needed for an adequacy assessment.
4. Starting from the models obtained after step 3, sensitivities are created to assess the effect of different choices for Belgium’s domestic electric supply. These are further detailed in the scenario chapter.
5. The results are then further processed to extract key indicators related to dispatch, sustainability, and economics. These also include an assessment of the infrastructure costs for electricity for each scenario.
Start
Optimise for 2036 starting from initial situation
Optimise for 2040 starting from 2036 optimum
Optimise for 2050 starting from 2040 optimum
Investments of previous time horizons are considered in the next optimisation
Other aspects of the methodology can be found in the appendices with details about:
◆ the KARI electricity zonal model (Appendix A)
◆ the molecule and liquid model (Appendix B)
◆ the carbon capture, utilisation and storage model (Appendix C)
◆ the adequacy model (Appendix D)
◆ the marginal abatement cost curve (MACC) model (Appendix E)
◆ the total cost methodology (Appendix F)
◆ the schematic view of the model (Appendix G)
◆ the non-CO2 emissions methodology (Appendix H)
SEQUENTIAL OPTIMISATION OVER TIME
FIGURE 2-3
GEOGRAPHICAL COVERAGE – WHOLE OF EUROPE
The perimeter for this study includes most of Europe. Depending on the energy vector being simulated, a different geographical and temporal granularity is used. The geographical perimeter and granularity for each of the vectors is shown in Figure 2-4.
In order to accurately capture the benefits of additional electrical interconnector capacity, a well-chosen geographical subdivision and sufficiently short time step is necessary. For this reason, the finest granularity in terms of both geography and time is used for the modelling of the electricity system. In total, over 500 zones are individually modelled across Europe: over 1800 thermal units (grouped into more than 600 clusters), more than 600 profiles for wind and solar and over 25,000 possible grid reinforcements are assessed using an hourly time step.
For hydrogen and methane a longer time step can be justified since the storage possibilities inherent to the system (line packing for gases, storage tanks, etc.) are sufficient to cover a period of several days. In addition, flows for these other vectors are highly steerable so a coarser geographical granularity still allows for accurate simulations of energy exchanges. Therefore, a daily or twice daily time step (every two days) and a close-to-country level granularity is used for these vectors. In total 32 zones and one
direct RES offshore zone are modelled, imports from pipelines (6 corridors for H2 and 7 for CH4), ammonia (4 geographical origins) and LNG (4 geographical origins and choice between fossil and synthetic) are taken into account on top of domestic bio and fossil production. Steam methane reforming (hereafter called SMR-H2) with CCS, direct-H2 offshore RES and over 50 potential hydrogen pipeline interconnectors as well as several processes related to the conversion of (molecule) energy vectors are assessed (HaberBosch, ammonia cracking, methanation, hydrogen to liquids, …). Those conversion processes are discussed in Section 3.1.6 and illustrated on Figure 2-5.
Finally, for liquids, a similar line of reasoning as the one adopted for hydrogen and methane can be followed regarding the temporal time step. Given that the transportation of liquids is well established through multiple modes (pipelines, trucks, tankers, trains, etc.) the assumption taken is that there would be no congestions for its transport within Europe, leading to the assumption of a single node. On top of potential domestic fossil and bio production, 17 import options from 4 geographical regions are assessed including fossil liquids, synthetic liquids and jet fuel. The conversion of hydrogen to liquids is explicitly assessed. MULTI-ENERGY MODEL AND GEOGRAPHICAL
The entire energy requirement for Europe is taken into account, which encompasses feedstock, international aviation and international shipping. These components are frequently overlooked or excluded from future-oriented studies, as they are often not included in domestic emission calculations.
◆ Feedstock This term pertains to the starting materials for a variety of chemical processes and are typically converted into a wide range of products in the chemical industry, including plastics, fertilisers, pharmaceuticals, and other chemical compounds. Examples of chemical feedstocks include methane, oil, coal, and biomass.
◆ International Aviation This involves the energy utilized by airplanes entering or leaving Europe. It's crucial to incorporate this into energy demand estimates, as the aviation sector consumes a significant amount of fossil fuels and substantially contributes to greenhouse gas emissions.
◆ International Shipping: This, much like aviation, relates to the energy used by vessels for global transportation of goods or passengers to and from Europe. Including the shipping industry, another significant energy consumer, ensures a more inclusive perspective on Europe's energy demand.
2.3. THE MULTI-ENERGY MODEL
The aim of the model is to find the European cost optimum across all energy vectors for a given carbon target by:
◆ optimally dispatching the necessary production assets imports on an hourly basis for electricity and daily for other vectors;
◆ optimising the needed infrastructure and the amount of certain production technologies.
One key novelty of the approach used in this study compared to previous Elia studies is the explicit integration of a multi-energy dispatch modelling framework. This framework enables the simulation of the exchange of energy vectors such as hydrogen, methane, and liquids along with the electricity dispatch.
This multi-energy model is coupled with a carbon emission model which carries the capability of enforcing a GHG emission target and deriving an associated carbon price. Starting from the emissions resulting from the multi-energy dispatch, the carbon emissions model invests cost optimally in carbon abatement options (CCS, CCU, conversion of CH4 to H2 turbines, Direct-Air
Capture (DAC), ...) to reach the GHG emission target. Inherently this causes the tool to define a shadow cost of carbon (the cost of the marginal carbon abatement technology). This shadow cost of carbon is then used in a series of subsequent iterations of the molecule models (H2 CH4 liquids), enabling the import of low-carbon molecules over fossil ones (which are expected to remain cheaper when not accounting for a carbon price). The cost optimal molecule dispatch and carbon abatement technologies selection is then used in the next electrical model runs. The models and their interactions are represented in Figure 2-5.
via pipeline Pipelines the model can invest in Transport via shipping Emissions
Imports from Middle-East
Imports from Africa
Imports from Australia
Imports from South-America
FIGURE 2-4
SCHEMATIC REPRESENTATION OF THE MULTI-ENERGY MODEL AND ITS MODULES FIGURE 2-5
The multi-energy model comprises three modules:
◆ The electricity dispatch and investment model (KARI) – see Appendix A;
◆ The molecule model (H2 liquids, CH4 and ammonia) – see Appendix B;
◆ The carbon capture and storage model – see Appendix C.
This study utilises a model of high complexity. For instance, the electrical model considers approximately one million constraints and over three million variables for each weekly optimisation problem. Furthermore, the model evaluates more than 25,000 investment options for the electrical grid. Due to its intricacywhich is ten times greater than the model used in the Adequacy & Flexibility study - it's run iteratively until an optimal result is achieved. This optimum is identified as the iteration where the total system costs reach a minimum for a specified GHG emission target. The interactions between the different models and the iterative process are outlined in the Figure 2-6 below.
The iterative process (see Figure 2-6) consists of:
1. A run of the hourly electricity model for three climate years: a set of electricity divestments/investments is identified and applied.
2. The results of the hourly electricity model run are aggregated temporally and/or geographically and integrated in the molecule and CO2 model. The exported results contain the molecule consumption for electricity generation and hydrogen production via electrolysis in each of the zones of the molecule model as well as the unit profitability to determine the economic viability of the conversion of conventional units to CCS or hydrogen. Finally, electricity marginal costs are exported to estimate costs of the, where relevant, additional electricity consumption of carbon abatement technologies.
3. Several iterations (a daily temporal granularity for multiple climate years) of the molecule model and carbon capture model are carried out in order to find the optimal molecule infrastructure, fuel prices, CO2 prices, CCS/U and imported fuels.
4. The outcome of the optimal molecule & carbon capture model is introduced into KARI (prices, additional electricity demand, etc... see the next subsection for details) and a new iteration can be performed.
5. The optimum reached for the combined system can then be used for further sensitivities and/or analysis.
In order to speed up the iterations, the user can also choose to simulate clustered weeks instead of full year hourly simulations.
FIGURE 2-6
2.3.1. INPUTS, OUTPUTS AND OPTIMISATION
Several parameters are fixed ex ante in the model. Other parameters are optimised by the model.
Ex ante defined parameters:
◆ Final demand for each energy carrier, including feedstock, international aviation and shipping;
◆ Electricity storage capacities and demand-side flexibility;
◆ Installed PV, onshore wind, biomass, nuclear and starting legacy thermal (existing gas and coal units) capacity;
◆ Potential for new offshore wind farms;
◆ Climate years used to create hourly/daily consumption profiles and production profiles;
◆ Potential (price and quantities) for each molecule carrier (imports of liquids and molecules; domestic biomethane, domestic/imported fossil fuels);
◆ Conversion efficiency, electricity requirements and costs between energy vectors and other technical parameters related to the conversion technology (for example, P2X, Haber-Bosch, SMR-H2 but also CCGTs, nuclear powerplants…);
◆ Costs for each technology that can be invested in and variable and operating costs;
◆ Process emissions and related potential for CCS;
◆ Non-CO2 emissions and other non-modelled sector emissions;
◆ GHG emission target that needs to be reached at EU level;
◆ Maximum CO2 permanent storage per year.
Optimised by the model:
◆ Electricity high-voltage grid (between countries and within countries), including offshore grid - both AC and DC reinforcements are accounted for;
◆ H2 grid between countries and to North Africa/Ukraine (no intra-bidding zone assessment), storage of H2
◆ Location and type of new thermal generation (H2, CH4…) for electricity generation;
◆ Location and capacity of new offshore wind;
◆ Location and capacity of new electrolysis for each electrical zone;
◆ Creation of synthetic fuels from hydrogen (ammonia, methanol, e-kerosene, e-methane…);
◆ Usage of liquid biofuels and biomethane;
◆ Carbon price (shadow carbon price of the model);
◆ Carbon capture in industry (process), electricity (thermal generation), industry (energy), SMR-H2 ;
◆ Energy dispatch of each carrier;
◆ Amount of imported fuels of each type, marginal prices.
2.3.2. THE KARI MODEL (ELECTRICITY ZONAL MODEL)
The KARI model, which is based on the open-source Antares-Simulator, is described in more detail in Appendix A.
In a nutshell, the model is a Unit Commitment model of the entire European electricity system on a zonal basis. It applies flow-based constraints based on a reduced equivalent grid model. It therefore captures grid constraints and flow patterns more accurately inside and between countries. The grid model is based on the data used for the TYNDP 2022 due to the unavailability of the TYNDP 2024 grid model when performing this study. The model was further expanded to account for more granular offshore zones.
In total there are:
◆ >100 onshore zones considered in Europe;
◆ >400 (potential) new offshore wind farms considered;
◆ >25,000 potential transmission candidates from/to all onshore/offshore zones considered.
The model calculates the optimal dispatch for the electricity system including the production of hydrogen and can make investments in infrastructure such as onshore (AC and DC) interconnectors, offshore HVDC interconnectors, hybrid interconnectors, offshore wind farms, wind farm platform extensions and
electrolysers. For a more elaborate explanation see Appendix A - KARI dispatch and investment electricity model.
After stakeholder feedback, the KARI model was linked with other models as described at the start of Section 2.3 (for a more detailed overview see Appendix G – Schematic view of the model). As such, the results of the KARI model dispatch are taken into account for the consumption and production of fuels (see earlier in this section), the system costs (see section 2.4), the calculation of the GHG emissions and the calculation of the costs of carbon abatement options (see section 3.1.5).
This linkage between the models means that their dispatches are consistent. As such interactions between for example molecule consumption to generate electricity and the resulting effect on the prices of molecules is taken into account. Inversely, the prices of molecules will also influence the profitability and as such installed capacities of electrolysers in the electricity model. The final interactions that are observed between the different energy vectors are further described in chapters 4 and 5.
The main inputs and outputs of the KARI model are shown in Figure 2-8, where the dots represent existing or potential future offshore wind farms.
MAIN
Hourly
2.4. TOTAL SYSTEM COSTS CALCULATION
Total energy system costs are quantified in this study. Depending on the type of analysis, the scope will differ:
◆ The geographical scope: Belgium only or Europe;
◆ The type of costs and sectors that are accounted for in the analysis.
Other types of benefits or costs (e.g. socio economic impact, employment) are excluded from the analysis.
The main assumptions behind the costs are further detailed in Section 3.3.
System costs are defined in four different parts:
◆ End use investments (e.g. investments in electro-mobility, energy efficiency…):
- Those are the investments made by the end users of the energy, and include the cost for acquisition of new cars, charging infrastructure, heating device or renovation in buildings;
◆ Energy vector – molecules (oil, methane…):
- Costs related to molecule infrastructure (grid and transformation processes);
- Costs related to the molecule supply (e.g. imports, domestic production but excluding the fuel used for electricity generation and fuel generated from electricity);
◆ Energy vectors – electricity:
- Electricity grid costs (offshore, backbone (high-voltage grid within a zone), regional grid (also called ‘vertical’ grid: 15070-36-30 kV), DSO grids);
- Electricity supply capital expenditure (CAPEX) costs (investments and fixed costs of production facilities);
- Electricity supply operational expenditure (OPEX) costs (fuel used to generate electricity).
In this study there are mainly three types of comparisons:
◆ When comparing divergent demand scenarios, the totality of the system costs is accounted for. This includes all energy vectors (CAPEX and OPEX) but also end use CAPEX. This will be referred as ‘total system costs’;
◆ When comparing different scenarios within a similar demand scenario, end use CAPEX costs are the same (defined ex ante via the demand scenario) and only the costs related to the CAPEX and OPEX of the energy system will be shown. This is further called ‘energy system costs’;
◆ When only comparing electricity sector for Belgium costs, the electricity costs and interfaces to the other vectors are accounted for (power to X and X to power). In this case end uses are the same across all scenarios and can be omitted for the comparison. This is called ‘electricity system costs’
Depending on the analysis, the costs can relate to either Europe or Belgium. Figure 2-9 summarises the different approaches.
3.1. European scenarios and boundaries
3.2. Belgian electricity scenarios
3.3. Financial assumptions
3. SCENARIOS
56
80
103
In order to lay the ground for establishing different scenarios, this section first outlines storylines. Storylines are high-level overviews of what the energy landscape could look like in the future (including the context, energy ambitions, etc.). These are then translated into concrete datasets - or scenarios - for different components (supply, demand, the grid, climate years, etc.) for the different countries that are simulated and in the needed granularity. Scenarios are not used to predict the future; instead, they cover a range of plausible futures so that the impact of these futures can be assessed.
As explained in Chapter 2, one part of the scenarios is fixed ex ante, while another part is optimised throughout the simulations (the constraints/ranges that are used for the optimised variables are provided below). The optimised scenarios are the result of the simulations and are provided in chapters 4 and 5.
The scenario framework is divided into 3 parts, as outlined below and in Figure 3-1.
◆ The European framework (see also Section 3.1). This is needed to assess changes in multi-energy consumption and supply at European level and the impact this will have on Belgium. In order to grasp different views relating to demand, supply and ambitions, several sensitivities are simulated. These cover:
- supply options;
- offshore supply and grid development options;
- the import costs of molecules from outside of Europe;
- the level of electrification and flexibility;
- carbon target options.
◆ Given that this study focuses primarily on Belgium and future electricity supply options (see also Section 3.2), a large amount of sensitivities (over 300 combinations) are investigated. These consist of a combinations of:
- sufficiency measures related to consumption;
- more domestic RES (PV, onshore and offshore wind installed in Belgium);
- the connection of foreign offshore wind to Belgium or far-out RES (not in Europe);
- new nuclear units in Belgium as well as the extension of its current fleet beyond 2036;
- the impact of flexibility options (storage and demand response) and the calculation of the need for additional thermal capacity to comply with the adequacy criteria;
- imports that have resulted from the above.
◆ Financial assumptions are also covered (see also Section 3.3). Indeed, these are used for the European optimisation and are used when quantifying the costs of the different Belgian sensitivities. Several cost sensitivities are also applied such as high/low estimates for CAPEX or different WACC.
Note: the area investigated by this study comprises all 27 Member States along with Norway, the United Kingdom and Switzerland. References to Europe throughout this study therefore cover these 30 states. By contrast, specific references to the European Union cover its 27 Member States only.
3.1. EUROPEAN SCENARIOS AND BOUNDARIES
3.1.1. INTRODUCTION
The scenario framework for Europe is depicted in Figure 3-2.
Most of the data is based on the TYNDP 2024
Most of the data used in this study is based on the available preliminary TYNDP 2024 scenarios. ENTSO-E and ENTSO-G produce these long-term scenarios with numerous stakeholders for their ten-year network development plans every two years [ENT-1] These are so-called ‘top-down’ scenarios for 2040 and 2050, built from the national trends scenarios for 2030 (also called ‘bottom-up’ scenarios based on official targets such as NECP). These two scenarios deviate from the national trends scenarios in order to capture uncertainties, but still reach the EU targets.
The Distributed Energy (DE) and Global Ambition (GA) demand scenarios used in this study originate from the preliminary TYNDP 2024 scenarios and are complemented by data for France based on RTE’s Futurs Energétiques [RTE-1] and the latest future energy scenarios published by National Grid [NGE-1].
Differences compared with the TYNDP 2024
Both DE and GA scenarios used by the TYNDP 2024 also assume different supply options, carbon targets, prices, etc. In order to be able to assess the impact of different supply options, this study uses the same starting points for both scenarios in terms of RES supply options and quantities, prices and carbon targets. Several sensitivities are performed as explained in Figure 3-2 in order to assess the impact of different assumptions. The DE and GA scenarios in this study differ only in terms of the final demand assumptions. Most of the sensitivities for Europe are applied on the DE scenario as it was computationally not possible to simulate all options.
In addition, the present model takes certain energy vectors into account that are not modelled by ENTSO-E or ENTSO-G. Indeed, this study goes beyond the definition of ‘hydrogen demand & derivatives’ and splits the demand of ‘hydrogen’ into end uses such as ammonia and liquids. This is a major improvement that is further detailed in the current study.
Onshore supply options
Not all options are optimised by the multi-energy capacity expansion model. Indeed, certain technologies such as onshore wind or PV are not solely driven by a pure wholesale market approach. As part of the current study, the choice was made to work with different onshore RES development scenarios. As a starting point, the CENTRAL scenario assumes the ‘central’ growth trajectories defined in the TYNDP 2024 and includes several sensitivities. The same approach is used for nuclear capacities.
Electricity grid and several options for offshore grids
The granularity of the model (zonal model for electricity) allows this study to go beyond the ‘country-based’ capacities and assesses grid bottlenecks across Europe. In addition, in terms of offshore wind supply, around 400 candidates amounting to 2 GW each are assessed which leads to several sensitivities applied to offshore development. Indeed, options such as radial connections, hybrids or meshed grids are tested and compared at European level.
Carbon targets
While all the simulated scenarios involve Europe reaching carbon neutrality in 2050, several options are considered for the intermediate period (the base being -90% by 2040 while the simulated alternative considers -80% by 2040). Similarly, a less optimistic assumption than the base scenario (S3 scenarios from the EC impact assessment) is also considered for non-CO2 and LULUCF as those emissions are not explicitly modelled but are accounted for when calculating the total emissions for Europe.
Alignment with Fluxys regarding a large set of assumptions The assumptions were also further aligned with Fluxys, the Belgian gas TSO, including (non-exhaustive list):
◆ domestic production potentials;
◆ carbon content of the different supply options;
◆ the efficiency of conversion technologies;
◆ the cost of supply grid and transformation technologies;
◆ final energy demand scenarios for DE and GA for Belgium and Europe;
◆ starting grids in each energy vector.
x2 the installed demand flex/storage in Europe
and demand flexibility) FLEX sensitivity: longer storage duration assumed
Scenarios
The final energy demand is used as an exogenous input in the models. This means that it is fixed ex ante in the optimisation. Two main reference scenarios are used: the DE and GA scenarios from the TYNDP 2024 study. An additional European demand scenario was created by Elia and is modelled in the ELEC scenario, following a request from a number of stakeholders that were consulted but also based on several literature references that are outlined in BOX 3-1.
The FLEX sensitivity assumes the same demand as in DE but the flexible assets (EV, HP, batteries, etc.) are considered with a longer storage duration. This scenario is illustrated in Section 3.1.2.3.
Storylines
The general drivers related to energy demand are included in Table 3-1. More details about the storylines for the final energy demand for GA and DE can be found in the TYNDP 2024 scenario report that was recently published [ENT-2] In concrete terms, the ELEC scenario is constructed from the DE scenario, with hydrogen used in road transport and heating in buildings replaced by electric vehicles and heat pumps, respectively. Additionally, the use of hydrogen as energy in industrial settings is limited, mainly based on the policy paper by the Florence School of Regulation [FSR-1] and other academic studies regarding the future of hydrogen and the value of efficient and smart electrification [ROS-1]. BOX 3-1. provides more background to consider higher electrification in those sectors.
3.1.2.1. FINAL ENERGY DEMAND
In the three demand scenarios which are examined (DE, GA and ELEC), the final energy demand decreases significantly, with this decrease ranging between 38% and 42% by 2050 when compared with 2021. This reduction can be attributed to a combination of energy efficiency measures and behavioural changes such as building renovations and a shift in means of transport. The most important factor (as part of the energy efficiency measures) driving this reduction is electrification. The transition from fossil-based heating systems in buildings (such as oil and gas
boilers) to heat pumps, and the replacement of internal combustion engine (ICE) vehicles with battery-electric alternatives, results in lower energy consumption for the same uses (due to the inherent efficiency of the electrical alternatives). Similarly, substituting fossil-based heating supplies in the industrial sector with electrical alternatives contributes to this decline. Therefore, it is clear that a higher level of electrification corresponds to a lower final energy demand.
Energy intensity
Energy demand reduction through energy efficiency measures (but slower than the other two scenarios)
Buildings
Road Transport
Industry
Wide range of heating technologies such as (hybrid) heat pumps, gas boilers, district heating and hydrogenbased heat
Full range of energy carriers for both light and heavy-duty transport (electric, hydrogen, liquid fuels)
In industrial settings, only lower temperature and (to a limited extent) medium temperature heat is assumed to be electrified, whereas (green) gas-based heating remains important, especially for high temperature processes
Stronger focus on energy efficiency
Focus on electric heat pumps and district heating, some gaseous heating remains
Electrification of light weight road transport, some hydrogen and liquids remaining for heavy-duty transport
Most low temperature heat as well as an important share of medium to high temperature heat is assumed to be electrified
Stronger focus on energy efficiency (same as DE)
Maximised focus on electric heat pumps
Nearly full electrification of all road transport
Full electrification of low and medium temperature heat, new breakthrough technologies would also allow the application of electricity-based processes in (very) high temperature heat processes
Figure 3-4 depicts the share occupied by electricity versus other energy vectors in final energy demand for some key demand sectors at European level in the year 2050. Electrification clearly plays a key role in these sectors – a fact which is more pronounced in the DE and ELEC scenarios.
OVERVIEW OF THE DEMAND SCENARIO TABLE 3-1
THIS STUDY EXPLICITLY MODELS THE HYDROGEN DERIVATIVES
Today, most hydrogen is used as a building block to create other products such as ammonia (for fertilisers) and methanol [EUH-1] In Europe, 99% of the time, hydrogen is made from fossil fuels via reforming and/or as a byproduct in certain industrial processes [EUH-2] For this reason, historical energy balances do not include hydrogen as a final energy carrier; instead these are expressed in primary sources such as methane. To increase transparency regarding the demand and supply of hydrogen, EUROSTAT will start undertaking detailed surveys of the area from calendar year 2024 onwards [EUS-2]
The current study draws a clear distinction between hydrogen used in its final gaseous form and hydrogen used as a building block to create synthetic fuels such as methanol, ammonia, e-methane, e-kerosene, etc. This consitutes another key difference with the TYNDP demand scenarios, where the demand for hydrogen for the creation of synthetic fuels for fertilisers, international shipping and feedstock is also expressed in the final demand for hydrogen. As such, all hydrogen demands, whether for energy and non-energy purposes, is treated as a similar form of final energy demand in which case the system is forced to either produce or import this hydrogen, whereas it could also be more economical to instead import these other molecules and/or to use a bio/fossil energy vector to supply this demand.
Figure 3-5 provides an example of how liquid demand is modelled within this study and how it compares with the TYNDP modelling. The following step-wise approach is used:
◆ energy demand is taken from the TYNDP 2024 scenario, in which the demand for hydrogen derivatives for international shipping and feedstock such as methanol and ammonia is expressed in an aggregated ‘hydrogen’ demand category without the disctinction between the different derivatives behind it;
International transport and feedstock are significant components of the global energy system, but they entail substantial challenges to reach carbon neutrality. Both components account for around 1,000 TWh each today across Europe. This study assumes that both sectors would fall under the Emissions Trading System (ETS) mechanism, meaning CO2 prices would apply for the use of fossil fuels. In the case of feedstock, this implies that the life cycle emissions of fossil-derived end products are taken into account.
Feedstock (for non-energy purposes)
Feedstock refers to the raw materials that are used in industrial processes because of their physical and chemical properties (not for their energy content). These materials are transformed in the process to create a final product. Examples include raw materials in the petrochemical industry which are used to produce products such as plastics, fertilisers, synthetic fibres and other chemical products. Today, all feedstock demand relates to fossil fuels
◆ the TYNDP demand is translated into an ‘undefined’ demand vector as an input for the model used within this study;
◆ the supply of liquids is optimised in the molecule model dispatch. In this dispatch the model can tap different sources (domestic/imported) and types of molecules (fossil/bio/synthetic) each with their own supply potential and price. The options and their characteristics can be varied to simulate different scenarios and/or sensitivities.
MODELLING OF LIQUIDS FIGURE 3-5
This method is applied for international aviation and shipping, chemical feedstock and fertilisers
By using this method, the impact of sensitivities that exploit parameters such as the price of CO2, the price of (green) molecule imports, the CAPEX/OPEX of domestic electrolysis, the availability of biomass, etc. is more correctly taken into account as it will directly determine the supply mix and source of molecules that are consumed by these sectors.
like methane, coal and crude oil. The use of non-fossil feedstock (for non-energy uses) is challenging because it often requires finding new materials or processes that can perform the same functions as fossil-based feedstock (and, in any case, carbon is a key building block for the creation of these products).
Figure 3-6 shows the changes in feedstock demand in this study. Until 2036, oil products such as naphtha remain most in demand for feedstock along with some biomass. In the lead-up to 2040 and especially 2050, synthetic liquids are due to become viable, for example via the methanol to olefins process in which methanol is converted into ethylene and propylene. The demand for ammonia for the production of fertilizers is expected to remain relatively stable compared with today. The origin of the ammonia is explained in Section 5.1. The split between the different vectors supplying the feedstock is the result of the model optimisation.
International transport (aviation, maritime shipping)
International transport, which includes maritime shipping and aviation, is heavily reliant on fossil fuels due to its requirement for fuel with a high energy density. The reduction of fossil fuel use of this sector is relatively complex as cost-effective alternatives are not yet fully commercially available and the operating margins of these sectors are relatively thin.
A general decrease in energy demand can be observed due to energy and operational efficiencies. This can be achieved through better engine technology, improved aerodynamics and lighter materials. Adjusting operational practices can also lead to significant reductions in demand. In aviation, this might involve
optimising flight paths for fuel efficiency purposes. In shipping, slower speeds can greatly improve fuel efficiency.
However, in order to further lower emissions of this segment, these sectors will need to switch to low-carbon or zero-carbon fuels. The modelling results demonstrate that both bio and synthetic liquids such as methanol in shipping and e-kerosene in aviation have a role to play in combination with (low-carbon) methane. Note that even with relatively high CO2 prices, oil-based fuels appear to remain economically viable, even in 2050. These emissions will then need to be compensated by negative emissions (such as CCS, or land use, land use change and forestry) in other sectors.
ENERGY DEMAND FOR INTERNATIONAL TRANSPORT (AVIATION & SHIPPING) IN EUROPE FIGURE 3-7
3.1.2.2.
Whereas final energy demand decreases in all 3 demand scenarios, a strong increase (ranging between 33% and 70% compared to 2021) in the demand for electricity can be observed.
The transport sector is expected to experience the largest paradigm shift in terms of energy consumption. Whilst in 2022, more than 95% of the energy demand was still met by fossil fuels, the sector is due to undergo the strongest relative and absolute increase in demand for electricity. In the ELEC scenario, which assumes that road transport methods are almost fully electrified, covering the defined electricity demand requires more than 1,100 TWh of additional electricity, equal to 1/3 of today’s European total electricity demand.
Electricity demand in buildings also increases due to the rollout of electric heat pumps (depending on the scenario). However, this is partially compensated for by the high efficiency of heat pumps and energy efficiency measures.
Today, the industrial demand for electricity mainly stems from non-thermal workloads such as compressors, machinery, lighting etc. Nearly all industrial heat is supplied by combustible fuels. Electrification has a key role to play in order to decarbonise heat in this sector. The range between the DE, GA and ELEC scenarios can mainly be explained by the uncertainty linked to the cost and technical feasibility of electrification of higher temperature heat processes.
In the GA scenario, combustible fuels remain the key energy driver, albeit in the form of decarbonised molecules such as biomethane and hydrogen (derivatives). In the DE scenario, most of the low and medium temperature heat is assumed to be electrified using already existing technologies. This includes industrial heat pumps in the food and paper industries, along with the recovery of derived heat from other industrial processes and e-boilers in the chemical sector. The direct reduction of iron with methane (and, in later, years hydrogen) in combination with electric arc furnaces is assumed to be applied for steelmaking. (Green) molecules such as biomethane and hydrogen still have a role to play in some high-temperature heat processes.
The ELEC scenario assumes that all industrial heat is mostly electrified in the form of industrial heat pumps, e-boilers, microwaves, infrared heaters, induction and resistance heaters in the metal sector, electric boilers and crackers in the chemical sector, electric arc furnaces and electrolysis steel in the steel industry and electric kilns in the cement industry; each of these are considered to be commercially available and implemented at scale by 2050. In this scenario, almost no hydrogen is used for process heat and it has only a limited role to play in some industrial processes such as in steelmaking as a reducing agent. (Bio-)methane still has a small role to play for some high-temperature energy uses.
3.1.2.3. FLEXIBILITY
In any future power system, sufficient flexibility will be required to cope with the high volatility of RES infeed. The development of large-scale storage devices (batteries or pumped-storage), end user flexibility (heat pumps, electric mobility or home batteries) and demand side response will be an important enabler to deal with future challenges in this regard.
The flexibility associated with batteries, electric mobility and heat pumps at a European level in this study is depicted in Figure 3-9. The figure summarises information about the historical volume of flexibility and the volume assumed in both the DE and GA scenarios. The data used stems from the TYNDP 2024 scenarios.
The ELEC scenario is derived from the DE scenarios with slightly more flexibility due to the higher electrification compared to DE.
An additional FLEX scenario is also created in order to assess the impact of more flexibility across Europe and assumes a doubling in energy content (not in power) from the DE scenario.
The values in the figure for the flexibility in electric vehicles and heat pumps should be considered as indicative as those vary within the day/year depending on the demand for heat and vehicles connected to chargers.
The FLEX
3.1.3. ELECTRICITY SUPPLY
Several sensitivities are applied to the electricity supply. Indeed, there are still many uncertainties regarding the pace at which certain technologies might spread. What is certain is that a higher amount of renewables will be integrated into the system. Certain types of dispatchable power are expected to be phased out in the future.
Solar PV scenario
Regarding solar PV the CENTRAL scenario assumes a total capacity of 1,600 GW of solar capacity by 2050 in the simulated European area. This is six times today’s existing capacity and corresponds to a yearly installation rate of 50 GW. An installation
rate of 75 GW per year is assumed in the RES+ scenario, leading to 2,100 GW by 2050 in Europe. A third scenario called PV+ is also considered, with an annual installation rate of 100 GW and an installed capacity of 2,700 GW by 2050.
3.1.3.1. CONTINENTAL RES
The future role played by renewables in Europe is set to be significant as the continent strives to shift towards a more sustainable and green economy. Europe is already a leader in renewable energy, with many countries like Germany, Spain and Denmark setting the pace with significant investments in wind and solar energy. This section mainly focuses on solar photovoltaic and onshore wind as they are assumed to be the two most important sources of renewable energy for the European continent in the future.
Solar photovoltaic (PV) panels are said to become the largest source of renewable energy in terms of installed capacity across Europe. As outlined in its EU Solar Energy Strategy [EUC-11] (which is part of the ‘REPowerEU’ plan), the European Commission is aiming to have 600 GW of solar PV installed by 2030 across the EU27. In addition to policy that supports its development, technological advancements and cost reductions are expected to make solar PV more accessible and affordable, so accelerating its adoption. However, challenges such as its integration into the power system and the need for significant infrastructure investment (on both the DSO and TSO side) and storage will need to be overcome.
Europe has also been a front-runner in harnessing onshore wind energy and this trend is expected to continue in the coming decades. In October 2023, the European Commission published its Wind Power Action Plan, which aims to ensure the success of Europe’s wind energy industry through measures such as an improved auction design, the faster deployment of projects, access to finance and the development of a skilled workforce. Although a number of challenges will have to be addressed (land use conflicts, public acceptance issues, and the need for extensive grid upgrades), with continued policy support and societal commitment to a green transition, onshore wind energy has a promising future in Europe.
Four scenarios are studied for solar PV and onshore wind development at European level:
◆ The CENTRAL scenario is based on the ‘central’ trajectories that were brought forward during the public consultation of the TYNDP2024 scenarios (with adaptations for the PV trajectories reflecting recent growth trends):
- PV: +50 GW/year and onshore wind: +15 GW/year.
◆ The RES+ scenario assumes a higher installation rate and final installed capacity for both PV and wind onshore. This scenario reaches the maximum potential identified in the TYNDP 2024 consultation phase.
- PV +75 GW/year and onshore wind +25 GW/year
◆ The NIMBY scenario will further reduce the installation rate of wind onshore along with higher costs for onshore grids.
- Onshore wind +10 GW/year (while PV follows the CENTRAL scenario: +50 GW/year)
◆ The PV+ scenario will further increase the PV capacity for 2050 on top of the RES+ scenario.
A total installed capacity of 620 GW of onshore wind in Europe by 2050 is assumed in the CENTRAL scenario (three times today’s existing capacity), corresponding to a yearly installation rate of 15 GW. In the RES+ scenario, a rate of +25 GW per year is assumed,
with 850 GW installed by 2050. A third scenario, the NIMBY scenario, assumes an additional 10 GW per year which is what has been observed historically.
Other continental RES
In addition to solar PV and onshore wind, European RES also include hydroelectric production and biomass The assumptions for those categories are fixed, based on the expected capacity in 2030: about 5 GW of biomass (used for electricity production) by 2030 and about 170 GW of hydro power plants (i.e. run-of-river, reservoir and pondage, excluding pumped storage). No increase or decrease in these capacities is assumed. Note the amount of hydroelectric production is dependent on the climate years that are used given the linkage with precipitation.
3.1.3.2. OFFSHORE RES
By 2050, offshore wind energy is expected to play a pivotal role in Europe's energy mix, contributing substantially to the European Union's ambitious target of achieving net-zero carbon emissions. This will be facilitated by advancements in offshore wind technology, which will make turbines more efficient and cost effective. Offshore wind capacity is expected to be spread out across different seas and oceans of Europe.
Important developments occurred in this respect last year. Europe committed to transforming the North Sea into Europe’s green power plant during the second North Sea Summit in Ostend in April, and to strengthening regional cooperation during the Baltic Offshore Wind Forum in Berlin in May.
The emergence of hybrid interconnectors and energy islands will facilitate the exchange of electricity between countries with varying levels of RES potential, while also connecting them to offshore wind farms. These hybrid interconnectors and energy islands will constitute important steps on the journey to the establishment of a European meshed offshore grid.
In this study, installed offshore capacity and its location is optimised by the tool. Therefore, this section focuses on the initial level of wind considered in the system as well as the upper boundaries allowed for the investment. The final invested offshore wind capacity is outlined in the results section. Note that the focus is set on offshore wind farms while offshore RES also includes ocean/tidal energy which is not assessed here. The approach for the offshore wind scenario applied in this study is similar to the one performed for the KARI study which was published in the last Federal Development Plan [ELI-3].
The offshore wind potential has been identified via a detailed approach which started with a database from 4C Offshore [4CO-1] and in addition considered both geographical constraints (bathymetry, shipping routes, environmental zones, etc.) and the latest identified offshore zones in national plans. Along with the latest known ambitions and announcements, this leads to the following assumptions:
◆ About 180 GW of radially connected offshore wind is assumed in the starting grid for 2036 This includes both existing capacity at the end of 2023 as well as projects that are planned to be commissioned in the coming decade. Care is taken to ensure coherence with the most recent published national plans and ambitions, such as those announced at the Ostend North Sea Summit [FPS-4]. These offshore wind farms are radially connected to the shore in the starting model. Offshore wind farms for which no landing point is known (about 80 GW) can be transformed into hybrid interconnectors by the optimiser (investing in one additional leg towards another landing point or offshore hub).
◆ A maximum potential of about 500 GW of total offshore wind capacity is assumed in Europe in 2036 and 2040. In 2050 a maximum potential of about 850 GW of total offshore wind capacity is assumed in Europe.
The investment potentials relate to the upper boundaries of possible investments for the solver. How much of it will be invested in by the optimiser is not known beforehand. The theoretical offshore wind potential is illustrated in Figure 3-13; this outlines the location of the wind farms and the total capacity potential per sea basin.
Note that 6 offshore hubs are also assumed in the initial situation. These are meant to represent the known projects/ambitions related to multi-terminal offshore hubs (e.g. the Princess Elisabeth Island in Belgium, the North Sea Power Hub in the Netherlands, …). The optimiser does not assume additional platform extension costs for the islands, as it is assumed that the necessary infrastructure for hosting additional connections has been taken into account from the start. If it brings the model closer to the optimum, the optimiser is able to reinforce the connections to these hubs to transform them into multi-terminal offshore hubs.
Offshore wind farms can be connected to the shore in different ways: via radial connections that link the farm directly to the shore; via two connections to two different coasts (hybrids); via a
hub, which includes different connections to different shores; and via connections to other offshore wind farms, which are themselves connected to the shore (see also Appendix A for more information).
In order to see the impact of allowing or limiting some types of connections, different options are simulated:
◆ only radial connections to the shore of the ‘home country’ are allowed (RAD)
◆ radial connections to other countries are allowed (RAD+);
◆ starting with already 400 GW of offshore wind in Europe that is pre-connected.
Potential offshore wind farms candidate that can
Technical potential used as upper boundary in 2036 and 2040 Assumed offshore wind farms in the initial model for 2036
OFFSHORE WIND POTENTIAL BEING CONSIDERED ACROSS EUROPE
FIGURE 3-13
OFFSHORE GRID CONFIGURATION OPTIONS
FIGURE 3-12
Hybrid offshore Multi-terminal offshore hubs
Radial offshore to shore (home country)
Radial offshore to shore (other countries)
SEVERAL STUDIES HAVE DEMONSTRATED
THAT ELECTRIFICATION IS THE MAIN PATHWAY TOWARDS THE 2050 TARGET OF CLIMATE NEUTRALITY
In the pursuit of achieving net-zero emissions, the electrification of various sectors plays a pivotal role. Electrifying transportation, buildings, and industrial processes can significantly reduce carbon emissions and drive the shift towards a more sustainable future. In order to assess higher electrification speeds, the ELEC scenario was created assuming higher shares of electrification in transport, building and industry. Many academic studies do not support the view that e.g. hydrogen and other gases would be used for transport or residential heating as opposed to electrification. As the DE scenario does still assume some level of hydrogen and other gases in transport or residential heating, the ELEC scenario allows to account for those that believe that direct electrification is the most efficient/effective solution.
A non-exhaustive list of studies is provided below:
“The share of electricity in final energy consumption increases from 23% in 2015 to above 45% in 2040 .. and up to 57% .. in 2050. This increase is mainly driven by the uptake of electric vehicles, the penetration of heat pumps and electrification of low- and medium-temperature industrial processes”
European Commission – ‘Europe's 2040 climate target and path to climate neutrality by 2050 building a sustainable, just and prosperous society’
“The Commission Communication does not call for a specific target on electrification. Instead, it acknowledges that by 2040, electricity will cover 50% of the energy consumed in Europe. Positively, electrification is considered the main driver of decarbonisation in end-use sectors”
EURELECTRIC – ‘Analysis of Commission communication on 2040 climate target’ and accompanying impact assessment
“Electrification is one of the most important strategies for reducing CO2 emissions from energy towards net zero emissions by 2050, where the majority of emissions reductions from electrification come from the shift towards electric transport and the installation of heat pumps”
IEA – Electrification & ‘Electricity 2024’
“Electricity demand more than doubles in the 3 scenarios. […]Faster electrification in general leads to 9% lower emissions in 2030 in the residential and commercial sector, while faster electrification of freight road transport leads to 75% lower emissions in 2040 in the transport sector.”
EnergyVille – ‘PATHS2050’
“In addition, it is expected that the current demand for electricity (~500TWh) will continue to increase towards a value around ~780 TWh in 2035 [...] e.g. due to increasing electrification of mobility and a more energy-intensive mobility, which so far are fossil-fuelled processes today.”
McKinsey –‘Future path |Power supply |Perspectives for increasing security of supply and economic efficiency the energy transition in Germany by 2035’
“Europe’s 2040 climate ambition should build more on renewables, electrification and circularity”
Agora Energiewende – ‘Analysis of Commission communication on 2040 climate target’ and accompanying impact assessment
“Electrifying everything possible, from transport to industry, will unlock major efficiency gains and emissions reductions.”
EMBER – ‘Our vision of a clean power system’ & ‘European-Electricity-Review-2024’
“A key step to achieving climate neutrality in the European Union is to rapidly shift from fossil fuels to electric technologies powered by renewable energies”
Adapted from Potsdam Institute for Climate Impact Research (PIK) – ‘Electrification or hydrogen? Both have distinct roles in the European energy transition’
“There is a strong and growing consensus that a simultaneously growing and decarbonising electricity sector is necessary to meet declining greenhouse gas emissions targets”
Energy Policy Columbia University
“Direct electrification is arguably one of the most cost-effective and reliable ways to decarbonise the European Union”
Adapted from Electrification-alliance.eu
“Despite the significant attention which hydrogen has received, independent evidence does not support widespread use of hydrogen for space and hot water heating”
Based on a review of 32 independent studies.
Adapted from Dr. Jan Rosenow, Director of European Programmes at the Regulatory Assistance Project (RAP).
"The results of the study indicate significant potential for the direct electrification of process heat generation, which could meet 90 percent of the energy demand not yet electrified by European industry, if fully deployed "
Agora Industry, ‘Direct electrification of industrial process heat’ June 2024
3.1.3.3. THERMAL FLEET
In addition to RES, an important part of the electricity mix today comes from the thermal fleet, which is mainly fuelled by methane, coal and nuclear. This section outlines the assumed capacities of methane, coal and nuclear in Europe.
Nuclear and coal capacity
In the past, coal-fired plants were a key source of electricity generation across Europe. However, their role has diminished in recent years due to rising environmental concerns. Indeed, several European nations have begun to limit their dependence on coal-powered electricity, with many announcing phase-outs within the next decade. Belgium took the lead in 2016 by closing all coal-powered plants, followed by Sweden and Portugal. Given the recent energy crisis, some countries like France, the UK, and Germany delayed their plans to shut down certain coal-powered plants. Despite this, the majority of European nations are committed to phasing out coal by 2030 or shortly thereafter (2033 for the Czech Republic and Croatia). Poland is an exception: it is projected to be among the last European countries to still have coal-powered capacity in 2036.
Regarding nuclear power currently the majority (almost 60%) of Europe's nuclear capacity is centralised in France. Several countries have made decisions about or are currently debating whether to prolong the operational lifespan of their nuclear plants, potentially extending their lifetimes beyond original plans
or legislative limits. In addition, several countries are also considering building new units (e.g. Poland, Romania, France, United Kingdom, the Netherlands,...). The Central scenario for nuclear power is based on current policies, taking into account planned closures and new units. The capacity is expected to decrease from about 100 GW in Europe today to about 75 GW in 2050. While it is assumed that in 2036 the existing nuclear fleet in France will still be available (60 GW from the older fleet along with the new European pressurised reactor (EPR) in Flamanville), the decommissioning of the older fleet will have started by that point. This will be partially compensated by the commissioning of new nuclear reactors, leading to a decrease of 20 GW by 2050. Changes in other countries are also taken into account, notably new units in Poland, Romania, UK, France….
In order to cover the possibility of a higher total nuclear capacity, with (for example) the emergence of small modular reactors (SMRs) in Europe, a sensitivity with 150 GW of nuclear capacity in the EU is performed reaching 170 GW of nuclear in Europe (including also UK, NO and CH). This sensitivity is inspired from the recent communication on the 'Nuclear Alliance' [NUC-1].
Gas and oil-fired capacity
Although today gas turbines are mainly fuelled by methane, it is assumed that hydrogen turbines could enter energy markets in the future (already a possibility in the model by 2036). In addition to CH4 and H2 turbines, it is also assumed that CCS technology will be available for CCGT and biomass.
In this study, the gas thermal fleet is optimised by the tool with the following logic:
◆ existing units are closed after a certain lifetime;
◆ the model can invest in new units running on hydrogen or methane (including or not CCS);
◆ the model can choose to invest in CCS or H2 reconversion for the existing fleet;
◆ the amount of capacity for each country is calculated in a separated step (adequacy step) that takes into account 200 ‘Monte Carlo’ years and the known adequacy indicators (see also Appendix D for more information).
The results of the optimisation (including the currently installed capacities) can be found in the results Section 4.6.
All oil-fired capacity for electricity generation is assumed to be decommissioned from the system by 2036.
Beyond the direct electricity supply, this analysis also delves into the sources related to gases and liquids to fulfil the demand for methane, hydrogen, ammonia, and liquids. A merit order for each of these sources for 2040 and 2050 is included in Figure 3-15. The prices provided in the merit order do not include a CO2 price or conversion costs since these are scenario dependent. Electrolysers are not included in this figure since their price depends on the electricity price at which they produce hydrogen in the electricity model which differs throughout the year. It is important to note that the merit order depicted in the figure assumes no internal congestion in pipelines and focuses exclusively on each individual molecule (note that the dispatch model accounts for those). For instance, the merit order for methane presumes the existence of an unlimited internal methane grid and anticipates the unrestricted utilisation of other molecules, such as hydrogen, independent of the actual hydrogen demand. The rest of this section will explore each of these sources individually in detail.
Methane can be sourced either domestically within Europe or through international imports. Domestic methane production encompasses both fossil methane and biomethane. Fossil methane is primarly sourced from Norway, decreasing a bit by 2050. Conversely, biomethane, distributed throughout Europe is estimated to increase towards 2040 and 2050. The amount of methane remains consistent across all scenarios and is aligned with the TYNDP 2024.
Regarding imports, both pipeline and sea freight imports in the form of liquefied natural gas (LNG) are taken into account. For pipeline imports, existing gas pipelines are considered across all years. Similarly, for LNG, existing terminals today are factored in for all years.
Additionally, methane can be produced from hydrogen through a process known as methanation, as detailed in Section 3.1.6. The model has the flexibility to determine the quantity of methane derived from hydrogen.
Hydrogen
A supply of hydrogen can be achieved through various methods: electrolysers, direct hydrogen or ammonia imports, and steam methane reforming (SMR-H2). The amount of electrolyser capacity depends on the optimisation within the electricity model. In addition, concerning their dispatch, electrolysers can only yield hydrogen when they are operational within the electricity model. During periods when the price of electricity is high, electrolysers may cease to operate, making them unable to supply hydrogen. During such instances, hydrogen must be supplied either by SMR-H2 storage or through imports.
Hydrogen can be imported via pipelines or made from imported ammonia (via terminals). The model has the capability to construct hydrogen pipelines, but the volume of hydrogen produced
in the exporting country is based on TYNDP 2024 data. Although the production capacity in the exporting country remains consistent across all scenarios, the model's ability to construct import pipelines can produce variations. For ammonia imports, the maximum export volume per exporting country outside of Europe is based on the global hydrogen flows study from the Hydrogen Council [HYD-1]. The model can decide on the quantity to use as ammonia and the amount to convert into hydrogen via ammonia cracking.
Lastly, hydrogen can be produced through SMR-H2 The SMR-H2 volume per country is derived from the DE and GA scenarios of the TYNDP 2024. In the DE scenario, this equates to the current installed SMR-H2 capacity. The SMR-H2 process always includes CCS; this assumption is aligned with the TYNDP.
Liquids
Just like methane, liquids can be sourced either from domestic production or through imports. The domestic production of liquids may be either fossil-based or bioliquids. Fossil liquids are projected to decrease towards 2050. On the other hand, the potential for bioliquid production in Europe is expected to increase. The amount of liquids is based on TYNDP 2024 data and remains consistent across all scenarios.
Given the limited potential for the production of liquids in Europe, the model primarily relies on imports to fulfil the demand for liquids. The maximum capacity of imports of fossil and synthetic liquids is set to infinite to ensure the demand for liquids can be met.
In addition to imports, liquids can also be produced domestically from hydrogen via the Fischer-Tropsch synthesis. The quantity produced through this process is not constrained and can be determined by the model.
3.1.5. GREENHOUSE GASES
Greenhouse gases (GHGs) have been a source of significant environmental concern in Europe for many years. These gases (which include carbon dioxide (CO2), methane (CH4), nitrous oxide (N2O) and F-gases) trap heat in the Earth’s atmosphere and contribute to global warming and climate change.
This section describes the GHG emission targets assumed in this study, the non-explicitly modelled emissions and the carbon capture, storage and usage assumed in this study.
3.1.5.2. NON-EXPLICITLY MODELLED EMISSIONS
This study explicitly quantifies all forms of CO2 emissions resulting from energy uses. However, as the European objectives are defined for all GHGs (i.e. not only for CO2) and all types of emissions (including process related emissions), these also need to be taken into account.
Process emissions
3.1.5.1. GHG EMISSION TARGET
As described in Section 1.2, Europe has set emission reduction targets for the next decades. Figure 1-2 illustrates the historical European GHG emission targets and net-zero targets in the lead-up to 2050. The optimisation considers the targets shown on Table 3-2 as constraints to be reached.
The target for 2036 is determined by taking the interpolation between the official EU target for 2030 (i.e. -55% compared with 1990) and the assumed target for 2040. For 2040, no official EU target exists yet, however in its impact assessment, the European Commission has recommended reducing the EU’s net GHGs by 90% by 2040 (compared with 1990) [EUC-12]. As such, this is the emission constraint used in the central scenario. In order to assess the impact of relaxing this target, a lower ambition sensitivity of -80% for 2040 (and thus also affecting the 2036 target) is also studied.
In this study, these targets are assumed to also be applicable for the UK, Norway and Switzerland, even though they are not members of the EU. Additionally, international aviation and 50% of international shipping are included in the scope, following the methodology used in the impact assessment performed by the EC [EUC-12].
The consumption of fossil fuels used as non-energetic feedstock which are not combusted or released as process emissions do not have their CO2 content included in the emissions. The system-wide CO2 price is however also applied on fossil fuels consumed within this sector. Note that in case these products are burned as waste, their associated carbon intensities are included in the emissions via the electricity dispatch model.
Process emissions are GHGs which are released during the manufacturing or chemical transformation of materials (independent from energy use). They constitute a critical part of the emissions profile of many industries, particularly in sectors like cement, steel, and the production of chemicals. These emissions occur as a result of chemical reactions (for example, when limestone is heated to produce lime and CO2 in the making of cement) and are hence independent of energy-related emissions, which are associated with the combustion of fossil fuels for energy. Process emissions are essential to take into account because they often represent a significant proportion of an industry's total emissions and cannot be eliminated by simply switching to renewable energy or improving energy efficiency. Without taking these emissions into account, the total GHGs from these industries would be severely underestimated, meaning that significant opportunities for reducing emissions would be missed.
These process emissions fall outside of the modelling framework but must be accounted for. Therefore, a fixed trajectory is used in line with the points outlined below.
◆ For the metal industry process emissions are mainly caused by the reduction of iron ore and coke production. The emission trajectory is linked with the demand scenarios within the TYNDP which foresees a switch from blast furnaces to direct reduced iron ore and/or electric arc furnaces which helps to reduce these emissions.
◆ For the chemical industry, process emissions are caused during a variety of processes such as the creation of ethylene, chloralkali etc. These are assumed to remain constant in the lead-up to 2050. The production of ammonia, which is currently carried out via steam methane reforming, is explicitly modelled and hence excluded from this fixed trajectory.
◆ For the mineral industry process emissions are mainly caused by the calcination of limestone during the production of lime and/or cement. Regardless of how heat is supplied in this sector, those emissions will persist. A slight reduction in process emissions is assumed, mainly based on a more efficient use of materials as per [CEM-1]
The final assumed trajectory is included in Figure 3-16. Note that this includes ‘gross’ emissions; these processes may be fitted with carbon capture technologies which would reduce the net emissions (see 3.1.5.3).
HISTORICAL AND
ASSUMED GHG EMISSIONS REDUCTIONS TARGETS FOR EUROPE
TABLE 3-2
Non-CO2 GHG gases and LULUCF
Just as for process emissions, non-CO2 emissions are largely decoupled from the final energy demand trajectory. Given this, an assumption is needed regarding the potential evolution of these GHG emissions. As such, the scenarios studied within the European Commission’s 2024 Impact Assessment Report [EUC12] explores three scenarios that include increasing net emission reduction ambitions to reach EU targets.
◆ The S1 scenario mainly relies on the Fit for 55 energy trends with no specific mitigation measures for non-CO2 emissions or for evolutions in the LULUCF sector.
◆ The S2 scenario builds on S1 and adds substantial reductions in terms of non-CO2 emissions and significant increases in carbon removals in the LULUCF sector.
◆ The S3 scenario builds on S2 and adds a fully developed carbon management industry by 2040, with sizeable carbon removals and the deployment of novel technologies.
As the S3 scenario is aligned with the -90% emission target (2040) used in the base scenario, its trajectory is chosen for the base scenario. This projects a significant decrease in non-CO2 GHG emissions and a relevant increase in LULUCF net emission removals in 2040 and 2050.
For this study, the consultancy company Compass-Lexecon performed an extensive analysis on the trajectories quantified by the EC in which they conclude that that the S3 scenario projections of CH4 and N2O emissions could be perceived as too ambitious. For this reason, an alternative scenario (‘non-CO2+’) which combines mitigation measures from the different EC scenarios is developed to capture a more realistic projection of non-CO2 emissions.
◆ The non-CO2+ scenario assumes the S1 scenario’s projection for CH4 emissions in the agriculture sector and the S3 scenario’s projection for CH4 emissions in other sectors.
◆ The non-CO2+ scenario assumes the S2 scenario’s projection for N2O emissions in the agriculture sector and the S3 scenario’s projection for N2O emissions in the other sectors.
The final trajectories for the central and non-CO2+ scenario are included in Figure 3-17. For more information, see Appendix H.
3.1.5.3. CARBON CAPTURE, STORAGE AND USAGE
In order to comply with emission targets, the model has the option to invest in a wide range of CO2 abatement options, each of which has a different cost depending on the specific type of technology involved and their geography. The methodology is explained in detail in Appendix C.
This study considers 3 main types of carbon capture (see also Figure 3-18):
◆ Carbon capture in industry
- In processes: the process emissions detailed in 3.1.5.2 for the metal, mineral and chemical industry have the potential to be abated using carbon capture technology.
- In combustion: methane burned for energy purposes (i.e. the delivery of heat) could also be fitted with carbon capture technology. Note that in the case of biomethane, this would imply negative emissions.
◆ Carbon capture in power generation: the model has the option to retrofit/install carbon capture technology on power generation.
◆ Direct-Air Capture (DAC) is a technology that captures carbon dioxide directly from the ambient air.
The captured CO2 then needs to be treated (i.e. through compression, liquefaction, etc.) and transported. These steps and the potential CO2 pipeline infrastructure are not explicitly modelled but their assumed cost is added to the different carbon capture technologies. The final destination is then a potential usage and/ or storage point. Different options are considered
◆ Use for the creation of synthetic fuels: in this case, CO2 is typically combined with hydrogen to create a derivative fuel such as methanol, e-kerosene, e-methane, etc. This new product is then used as a combustion fuel and thus the CO2 is emitted back into the atmosphere (if it is not captured again).
◆ Use as feedstock for the creation of materials: in this case, the CO2 is used as a building block to create chemicals and final products. One example is the synthesis of methanol into ethylene and propylene. As long as these products are not burned, the CO2 emissions are in principle bound into the final products and not emitted into the atmosphere.
◆ Underground storage: also known as carbon sequestration, this method permanently stores CO2 to prevent its release into the atmosphere. Typical storage sources include depleted oil and gas fields, unmineable coal seams, deep saline aquifers, and basalt formations.
For each iteration of the molecule model (see Figure 2-6), the CO2 module has the option to select different CO2 abatement options to invest in for each of the modelled electricity zones. For each carbon capture type and geographical location, a different amount of CO2 could be captured at a certain cost, depending on the CAPEX/OPEX, capture efficiency and electricity prices.
CARBON CAPTURE, USAGE AND STORAGE OPTIONS CONSIDERED IN THIS STUDY
18
FIGURE 3-17
3.1.6. TRANSFORMATION PROCESSES
Transformation processes play a crucial role in the energy sector by enabling the conversion of one energy source into another. These processes are incorporated into the model to capture the
transition from one molecule type to another. An overview of all the transformation processes included in this study can be found in Figure 3-19.
OVERVIEW OF THE TRANSFORMATION PROCESSES FIGURE 3-19
3.1.7. GRID
This section provides further information about the European molecule grid and the high-voltage electricity grid assumed in this study.
3.1.7.1. HIGH-VOLTAGE ELECTRICITY GRID
The initial high-voltage network for Europe is based on the TYNDP 2022 IoSN reference grid [ENT-5]. This reference grid represents a snapshot of the expected grid in 2025. To more accurately represent flows, most bidding zones that exist today are split into smaller electrical zones. Flows between electrical zones are modelled using a flow-based approach and take into account the effects of phase shifting transformers. For Belgium (see Section 3.2.5.), the approved investement in the latest federal development plan [ELI-3] are accounted for.
In contrast to the TYNDP 2022 IOSN grid, the present study considers multiple electrical zones in Great Britain. Additionally, reinforcements which were approved in the latest Belgian Federal Development plan have been added to this reference grid. An overview of the grid used and zonal granularity is depicted in Figure 3-21.
3.1.7.2. MOLECULE GRID
The starting grid for the methane system is the existing methane grid in Europe including the LNG terminals and pipelines. This is defined as capacities between the zones considered in the model as explained in Section 2.3. No investments (or decomissionings) are considered for this part of the system.
For hydrogen, no starting grid is considered. New capacities between the zones assumed in the model (see Section 2.3.) can be invested in. In addition, it is possible to build pipelines from North Africa and Ukraine to Europe. Hydrogen can also be produced via offshore electrolysers or be transformed from ammonia or methane cracking (via steam methane reforming). This is possible within each zone of the model.
For other liquids, no grid is assumed in the model and Europe is considered as a single node.
Each transformation process has its unique efficiency and electricity consumption. In the molecule model, the transition from one molecule to another takes into account the efficiency of the process. A cost is added based on the electricity consumption of the transformation and the electricity price in the country where the transformation is occurring. For instance, the cost of hydrogen production depends on the price of the primary molecule, adjusted for efficiency losses and electricity costs. An example of hydrogen production in 2050 derived from imported ammonia is illustrated in Figure 3-20. For the conversion to liquids, different efficiencies are used because this depends on the type of liquid involved. It is also important to note that the electricity consumption of these processes is added to the demand in the electricity model.
AC interconnectors
DC interconnectors
Initially connected offshore wind farms who cannot be further invested in
Initially connected offshore wind farms who can be further interconnected
Offshore wind farm investment candidates
Energy hubs
STARTING HIGH-VOLTAGE GRID
FIGURE
3.1.8. CLIMATE YEARS
When performing Unit Commitment and Economic Dispatch across multiple ‘Monte Carlo’ years, the climate impact must be accounted for. Firstly, this is important because weather-related variables impact the final amount of energy that is generated when RES are involved. Secondly, the weather also impacts the final amount of energy that is consumed: this rises during colder periods due to the demand for heating.
As part of this study, Elia uses a forward-looking climate database developed by climate experts at Météo France. This database serves to incorporate changing climate conditions into the modelling framework. Specifically, Elia utilises a climate database generated for the target year 2050, employing greenhouse gas concentration based on the scenario RCP 4.5. More details about this forward-looking climate database is available in the latest Adequacy and Flexibility study [ELI-1].
Heating Degree Days
One commonly used metric for assessing how cold the temperature was during a given period is Heating Degree Days (HDD). HDD can be considered as an indicator of heating needs, which become crucial as residential heating will increasingly rely on electricity, with the electrification of heating through the spread heat pumps. To calculate the HDD, the methodology developed by SYNERGRID is used; more details about this methodology is available on the SYNERGRID website [SYN-1]. Note that SYNERGRID relies on the temperature measurement at Uccle. However, in this study, the population weighted average temperature in Belgium is used.
Figure 3-22 depicts the HDD distribution for both the current reference period (1991-2020) and the 200 synthetic climate years for the climate in 2050. The distribution of the current reference period is derived from the historical temperature available in the PECD 4.0 database from ENTSO-E. The 200 synthetic climate years are provided by Météo France. The average HDD for the current reference period is higher than the average value for the 2050 climate database. This discrepancy can be attributed to the anticipated warming trend in future climates. As temperatures rise, the HDD diminishes, representing a reduction in heating needs.
Occurence of Dunkelflaute events
In 2050, the electricity generation landscape will predominantly rely on RES. As their output, in turn, depends on weather conditions, one of the main challenges is the occurrence of low renewable energy generation during one specific day or even during several consecutive days. This phenomenon is commonly referred to in the literature as ‘dunkelflaute’.
Currently, there is no consensus on a formal definition for dunkelflaute. Elia suggests that low renewable generation periods should be defined as the hours during which the hourly capacity factor of wind farms and the hourly capacity factor of photovoltaic panels is lower than a certain threshold, as defined in [ENE-1]. It should be noted that only events which last over 24 hours are taken into account, with the occurrences being averaged out over 200 climate years.
Figure 3-23 illustrates the annual frequency of dunkelflaute events in Belgium, defined using different capacity factor thresholds and time duration thresholds. For example, on average, there are between 0.5 to 2 events annually in which neither the hourly capacity factor of wind farms nor the hourly capacity factor of photovoltaic panels exceeds 25% for three consecutive days. Logically, the duration and the occurrence of the dunkelflaute periods is reduced when considering a lower capacity factor threshold.
Dunkelflaute in an interconnected system Long-lasting periods of dunkeflaute will be particularly challenging. During these periods, RES will not be able to cover a significant part of the load, meaning that the resulting needs will have to be covered by exchanges and/or dispatchable capacities.
Since European countries are interconnected, one solution for dealing with low RES generation infeed in one specific country is to import electricity from other countries, provided that they are not experiencing the same situation. For the purposes of this exercise, a level of RES generation from wind and solar sources that falls below 20% of their installed capacity on a 24-hour average basis is considered. Figure 3-24 depicts the occurrence of low RES generation for Belgium, European Member States, and the Central Western European (CWE) region which includes the United Kingdom, France, Belgium, Germany and the Netherlands.
Figure 3-24 shows that the number of low RES generation events across a pool of countries is significantly reduced. For example, when looking at Belgium on its own, on average, 2 events per
year lasting at least 7 days occur. By contrast, across the CWE, one event lasting 5 days occurs every year on. At a European level, there is on average one occurrence every year of an event which lasts 4 days.
Consequently, the interconnection of different countries effectively mitigates the risk of enduring long-lasting periods of dunkelflaute, due to the geographical variability of RES. This underlines the importance of interconnectors in enhancing the reliability and resilience of renewable energy generation across Europe.
Regarding the needed dispatchable capacities, an adequacy study is performed to ensure that each country reaches its legal criterion (for Belgium, 3h of loss of load expectation, or LOLE). During this process, the required dispatchable capacities can be calculated. The adequacy of the system is extensively discussed in the results chapters 4 and 5.
FREQUENCY OF DUNKELFLAUTE FIGURE 3-23
The data are averaged over the 200 climate years considered
OCCURRENCE OF LOW RES GENERATION EVENTS PER YEAR AND LENGTH FIGURE 3-24
3.2. BELGIAN ELECTRICITY SCENARIOS
3.2.1. INTRODUCTION
The main objective of this study is to analyse and quantify the different supply options for Belgium to meet its electricity consumption after 2036. A large range of options are identified that could be put in place in the lead-up to 2050.
The ‘current policies’ scenario (also referred to as ‘Central’) is the common starting point for all Belgian sensitivities.
The current policies scenario relates to the policy measures that are already put into place by regional and federal authorities. Those include for instance the acceleration of domestic RES (both onshore and offshore), the implementation of the CRM, the extension of the Doel 4 and Tihange 3 nuclear power plants until 2035, the approval of the federal and regional grid development plans, etc. These measures are key for the upcoming decade and should be further pursued in the years to come. This study takes those measures as a basis and looks beyond (2036-2050).
First, the consumption scenarios are defined. Those are based on the same storylines as the European ones from the TYNDP2024 for the DE and GA scenario. In addition, as done for the European scenario, an ELEC scenario is created to reflect the stronger electrification needs brought forward by several studies.
The Central supply scenario assumes that the current policies and ambitions are put into place:
◆ the draft updated NECP for Belgium (June 2023) for domestic renewables and electrification. This includes the additional offshore wind in the Princess Elizabeth zone by 2030;
◆ for later years (after 2030) the same growth rates for domestic renewables as for the period up to 2030 are assumed;
◆ 8 GW offshore wind in the Belgian exclusive economic zone (EEZ) is assumed in all scenarios for 2050;
◆ the extension of the two nuclear reactors - Doel 4 and Tihange 3 - until the end of 2035;
◆ the increase in flexibility in residential and industrial settings through storage and additional demand response;
◆ the closure of the older thermal units in Belgium linked to their age (> 40 years) - the model can, however, choose to keep them operational in the system if financially beneficial;
◆ no new nuclear
◆ the grid projects approved under the latest federal development plan for Belgium (such as Boucle du Hainaut, Ventilus and Nautilus);
◆ no additional non-domestic offshore;
◆ additional onshore interconnectors (on top of those approved in the latest federal development plan) found in the European optimisation for Belgium for each horizon;
◆ adequacy is guaranteed for all the scenarios and sensitivities. For certain sensitivities, this implies the need to add new thermal capacities in Belgium.
In addition to the current policies scenario (‘Central’ scenario), sensitivities are developed for additional supply options:
◆ In addition to the three demand scenarios (DE, GA and ELEC), a sensitivity related to electricity consumption is accounted for by moderating consumption through sufficiency measures (SUFF), and another sensitivity by assuming more heating networks (HEAT).
◆ Regarding the supply options, several sensitivities are applied:
- two additional domestic RES levers can be activated: high RES (high onshore and high PV) and very high PV (high onshore wind and very high PV);
- non-domestic offshore can be connected to Belgium with a certain potential for each target year;
- new nuclear can be accounted for as from 2036 with a certain potential for each target year;
- potential nuclear extensions beyond 2035 are considered as sensitivity options;
- far-out baseload RES electrically connected to Belgium is also considered as an option for 2050;
- other thermal generation (on molecules) can also provide electricity depending on the European dispatch, however their capacity is calibrated to ensure an adequate system for Belgium.
It shoud also be noted that:
◆ Imports/exports are a result of the European hourly economic dispatch;
◆ Flexibility is linked to demand scenarios, sensitivities are applied in Belgium (low and high) to assess its impact;
◆ The required thermal generation capacity (based on molecules) is updated to comply with the adequacy requirements.
The different options are depicted in Figure 3-25.
3.2.2. ENERGY DEMAND
The final energy demand is defined ex ante and is an input to the model. There is no optimisation between final energy carriers in the model; however several scenarios/sensitivities are simulated.
As for other European countries, the final energy demand, feedstock as well as international aviation and shipping demand for Belgium is based on the ‘Distributed Energy’ (DE) and ‘Global Ambition’ (GA) scenarios established and published for the European TYNDP 2024 framework [ENT-1].
In order to reflect a wider range of possibilities in terms of the evolution of useful energy needs and the level of electrification (such as outlined in BOX 3-1), one additional demand scenario was added for Belgium (as for the European scenarios). The ‘ELEC’ scenario assumes full electrification of road transport, full gas phase-out for heating in buildings and a further electrification of high-temperature industrial processes.
In addition, as part of the levers that can be activated for Belgium, the ‘sufficiency’ sensitivity (or ‘SUFF’) assumes a significant impact of consumer and behavioural changes that reduces the amount of required useful energy, leading to a decrease in final energy demand for all energy vectors. This scenario is inspired on the ‘SHIFT’ scenarios published recently by EnergyVille [EVI-1].
Regarding all demand scenarios/sensitivities, the following should be noted:
◆ the scenarios presume that existing industrial players will continue to operate in Belgium;
◆ the industrial loads are assumed to remain in their current locations;
◆ by 2050, data centre consumption is projected to increase to 10 TWh except for the SUFF sensitivity.
3.2.2.1. FINAL ENERGY
Belgium’s final energy demand has remained relatively stable over the past decade at around 400 TWh. However, the exceptional circumstances of 2020, which were primarily caused by the COVID-19 pandemic, resulted in a drop in demand to approximately 380 TWh. Following a slight rebound in 2021, high energy prices in 2022 and 2023 prompted a subsequent decrease to roughly 370 TWh. The primary driver of this reduction was a decrease in industrial output, particularly from energy-intensive industries. Additionally, energy use in residential and commercial buildings also declined significantly.
Similarly to the trend across Europe, the final energy demand is assumed to decrease significantly (a reduction of between 25%
and 45% by 2050). This reduction can be attributed to a combination of energy efficiency measures (such as electrification), behavioural changes and a shift in transport modes. In the SUFF sensitivity, additional behavioural measures across all sectors further reduce the final consumption of energy.
The most important factor driving the overall demand reduction in all scenarios (with varying intensity) is the electrification of buildings, transportation and industry which carries a higher inherent efficiency than traditional fossil fuel-based processes and appliances. In Appendix I, more information can be found on the share occupied by electricity and other fuels in the final energy demand for some key demand sectors in the year 2050.
Feedstock for non-energy usages
Belgium has the fifth largest feedstock demand in the EU, which is mainly explained by the presence of the petrochemical cluster in the port of Antwerp. The latter is one of the largest in the world and is a hub of activity that includes numerous international petrochemical companies, with a heavy concentration of refineries, chemical producers, and related industries. The Antwerp petrochemical cluster is renowned for its integrated value chain. It transforms crude oil and natural gas into a multitude of chemical products and plastics.
Figure 3-27 depicts the changes in feedstock demand in this study. Until 2036, oil products such as naphtha drive the largest portion of the feedstock demand along with some biomass. In the lead-up to 2040 and 2050, synthetic liquids could become viable via (for example) the methanol to olefins process, in which methanol is converted into ethylene and propylene. As explained in Section 5.1 this synthetic feedstock would not be synthetised in Belgium - it would need to be imported. The demand for ammonia used in fertilisers remains relatively stable compared to today. The origin of the ammonia is discussed in Section 5.1.
International transport
Whereas international transport makes up around 7% of the final energy demand in Europe, it makes up 20% of Belgium’s energy demand in 2021. Fuels for international aviation and shipping used in Belgium amount to about 17 TWh and 80 TWh per year respectively (calculated as an average over the last ten years) [EUS-1]. This is mainly due to ship refuelling (bunkering), with the Port of Antwerp being a significant hub for this in Europe. The drop due to COVID-19 in 2020 has since recovered for international shipping, but remains below the pre-COVID average for international aviation.
The demand for international shipping is assumed in the TYNDP scenarios to increase for Belgium, mainly driven by the increase in international shipping. As mentioned above, the share of oil, synthetic liquids and biofuels is optimised within the multi-energy model on a European level, as explained in Section 2.3. It is however important to mention that this consumption is modelled at European level and those fuels do not necessarily need to be produced in Belgium.
INTERNATIONAL
3.2.2.2. ELECTRICITY DEMAND
Whilst the final total energy demand decreases, in all 3 demand scenarios (DE, GA and ELEC) a strong increase in electricity demand can be observed, ranging between +110% and +130% compared to 2022. The sensitivity SUFF assumes an increase of +95% compared to 2022.
These trends are comparable to changes across the EU, with a key difference being the level of electrification in industry which makes up a relatively important share of Belgium’s energy demand and which varies greatly between the different demand scenarios.
The transport sector is assumed to experience the largest electricity demand increase of all sectors. In 2021 the transport sectors consumed ~2 TWh of electricity of which most is attributed to the train subsector. This value is set to increase at least tenfold by 2050 in all of the scenarios, ranging between 20-33 TWh. Both the ELEC & SUFF scenario assume a full electrification of road transport by 2050, however, the measures in terms of reduced person & freight travel, better loading factors and modal shifts manage to decrease electricity requirements by around 30%.
Electricity demand in buildings remains relatively stable. On the one hand, the strong rollout of electric heat pumps (more important in DE & ELEC scenarios) increases the electricity demand. On the other hand, this is compensated by the assumed reduction in heating needs due to renovations but also due to the high efficiency of heat pumps and the replacement of old electrical appliances and heating devices by more efficient ones. On top of that, the SUFF scenario assumes people will lower their heating temperature and heat spaces in general.
Today, the industrial demand for electricity mainly stems from non-thermal workloads such as compressors, machinery, lighting etc. Nearly all industrial heat is supplied by combustible fuels. Electrification has a key role to play in order to decarbonise heat
in this sector. The range between the DE, GA and ELEC scenarios can mainly be explained by the uncertainty linked to the cost and technical feasibility of electrification of higher temperature heat processes.
In the GA scenario, combustible fuels remain the key energy driver, albeit in the form of decarbonised molecules such as biomethane and hydrogen (derivatives). In the DE scenario most of the low and medium temperature heat is assumed to be electrified using already existing technologies. This includes industrial heat pumps in the food and paper industries, along with the recovery of derived heat from other industrial processes and e-boilers in the chemical sector. The direct reduction of iron with methane (and, in later years, hydrogen) in combination with electric arc furnaces is assumed to be applied for steelmaking. (Green) molecules such as biomethane and hydrogen still have a role to play in some high-temperature heat processes. The ELEC scenario assumes that all industrial heat is mostly electrified in the form of industrial heat pumps, e-boilers, microwaves, infrared heaters, induction and resistance heaters in the metal sector, electric boilers and crackers in the chemical sector, electric arc furnaces and electrolysis steel in the steel industry and electric kilns in the cement industry; each of these is considered to be commercially available and implemented at scale by 2050. In this scenario, almost no hydrogen is used for process heat and it has only a limited role to play in some industrial processes such as in steelmaking as a reducing agent. (Bio-)methane still has a small role to play for some high-temperature energy uses. Finally, the SUFF sensitivity also assumes a relatively high electrification rate, but a lower overall energy demand due to a more resource-efficient and circular economy, leading to a lower need for primary production of materials.
Note that all scenarios (except SUFF) assume around 10 TWh of data centre demand by 2050.
Sufficiency
In addition to the three demand scenarios which are also considered for Europe (DE, GA & ELEC), an additional sensitivity related to energy demand is foreseen specifically for Belgium. The SUFF sensitivity involves the impact of changes in behaviour, lifestyle, and smarter choices related to technology and design which are aimed at achieving the same or better results with less energy. Sufficiency measures could include actions like reducing and/or improving the use of vehicles (more car sharing, shifting to soft(er) transport modes…), reducing the set temperature of heating devices, or reducing the consumption of goods in general.
Introduction to sufficiency
Sufficiency is a concept related to resource use as a whole, but in the framework of this study, we will focus on the energy use. It has been described by the IPCC as policies, measures and daily practices involving sufficiency aims to avoid demand of resources (energy, materials, water and land) while still ensuring well-being [IPC-1]. It can be described as guaranteeing a sufficient level of services (heating, transport, industrial production), while adjusting their nature and quantity to reduce environmental pressure.
Sufficiency is different from energy efficiency. Efficiency implies reducing the energy used in inputs, while delivering the same quantity in outputs. Sufficiency is about redefining the means to deliver the service, or reconsidering the outputs needed. For example: Driving a smaller car reduces the energy inputs needed while delivering the same service. This is labelled as a sufficiency measure. Whereas energy efficiency would mean using the same car with a more efficient engine, or better aerodynamics reducing friction and energy losses. Both reduce energy needs, but in different ways.
Sufficiency policies go beyond temporary voluntary agreements of energy reduction. The European Sufficiency Database has documented +350 policies that can implement sufficiency [ENS-1], and these can be of different natures (economic, fiscal, educational, structural, etc...).
Sufficiency is often linked to behavioural changes, which would happen on a voluntary basis. But beyond this, documented also in the sufficiency database [ENS-1], are more societal and structural measures that take longer to be implemented (such as fiscal incentives to reduce the size of cars, or urban planning leading to a greater modal shift).
It should be noted that sufficiency is a highly cleaving concept. As it is linked to behaviours and habits, it proves to be a concept charged with political implications and up to debate. It makes it an unavoidable debate to have, to establish a credible energy pathway for Belgium and Europe. This is the reason why it has been treated as a sensitivity in this study, to explore its potential impacts on the energy system.
Sufficiency recognised by European and worldwide institutions
Sufficiency is a concept gaining traction in the energy world and is now documented as a lever to decarbonisation. Here are a few organisations and studies making use of it in modelling exercises:
◆ EnergyVille recently released a SHIFT scenario in the framework of their PATHS2050 study. The latter leads to a reduction in electricity generation of 20% leading to lower investment cost for the energy transition and pushing CO2 reduction towards 60% by 2030 and 90% by 2040 [EVI-1]. This EnergyVille scenario serves as basis for the SUFF sensitivity for Belgium presented in this paper.
◆ The Intergovernmental Panel on Climate Change (IPCC) [IPC-1] in its 2022 report, estimates that this, alongside other demand side measures (such as changes in urban planning and end-use technology) can reduce global GHG emissions in end-use sectors by 40 -70% by 2050, making it one of the main levers for mitigating climate change and CO2 emissions.
◆ RTE Futurs Energétiques has explored a low energy scenario where energy demand is reduced solely through behavioural changes. They estimate that a 14% reduction in total energy needs by 2050 compared to the central scenario can be achieved. This scenario showed to reduce the needs of additional thermal capacities by 10 GW, a reduction in materials for battery electric vehicles by more than 30%, a reduction in flexibility needs of the system and in CO2 emissions. [RTE-1]
◆ The CLEVER study is a European study done with more than 26 partners across the EU delivering a net-zero trajectory for all EU countries. [CLE-1]
◆ Elia in its latest Adequacy and Flexibility study has showed that sufficiency measures could reduce the needed volume for Adequacy by more than 1 GW [ELI-1]
Politically, the concept is also gaining more traction:
◆ During the 2022 energy price crisis, the French energy ministry released a sufficiency plan that delivered a 12% reduction in gas and electricity when compared to yearly consumption normalised with respect to the temperature [FRG-1].
◆ 70+ European organisations signed a sufficiency manifesto in March 2024 calling for the EU to manage demand through sufficiency policies [ACR-1].
So, sufficiency has shown political relevance in France and among EU organisations. It is also investigated as an energy transition scenario, where it has shown in simulations its potential to reduce the use of materials and rare earths, help ensure Security of Supply and relieve pressure on the grid by curbing the rise in electricity consumption and lower CO2 emissions (by reducing the needs for all energy vectors). This underlines the relevance of sufficiency in climate strategies and the energy transition.
However, as outlined in RTE's `Futurs Energétiques', this concept is often not well understood and sometimes ill-defined. It is still to be debated what the impacts and socio-economic costs of sufficiency could be, and whether or not all behavioural changes expected and implied by sufficiency measures would be implemented and accepted by the population.
For the quantification of this scenario, the ‘SHIFT’ scenario developed by EnergyVille is used as inspiration to derive the SUFF scenario. Starting from the DE scenario, a reduction of end use demand is applied. For a detailed presentation of the scenario, please see [EVI-1].
Table 3-3 and Table 3-4 include a comparison of some key demand drivers in the DE and SUFF demand scenarios.
3.2.3. ENERGY SUPPLY
The energy supply options are defined ex ante for Belgium. In order to grasp the impact of different developments, several sensitivities are defined for each type of electricity supply in Belgium. In addition the biomethane domestic supply is also accounted for in the multi-energy model.
This sections deals mainly with the electricity supply options. One sheet for each type of supply is discussed that outlines the different scenarios/sensitivities, barriers and enablers.
A small part will also be dedicated for far-out RES connected in areas not modelled explicitly in this study, such as North Africa.
The following type of supply for Belgium is discussed:
◆ Nuclear - Existing fleet - New build ◆ Other renewables ◆ Other thermal fleet
NOTE
The analysis in these technology sections is preliminary and not exhaustive; it is based on external sources and has as sole purpose to illustrate the type of questions that need to be addressed on top of the rather quantitative approach used in the simulations.
3.2.3.1. ONSHORE RENEWABLES – SOLAR
Solar PV has significantly increased over the past five years due to lower installation costs and soaring energy prices.
The future capacities for solar production are determined based on the following:
◆ the Central scenario is an extrapolation of the growth observed over the last three years;
◆ the High scenario assumes a twofold increase in that growth rate;
◆ the Very High scenario anticipates a more than threefold increase in the growth rate.
For the Very High scenario, the meticulous management of oversupply and distribution grids will be necessary. Further details about this are included in the results section. Both utility-scale and residential-scale PV is considered.
◆ Supply chain challenges – As global development intensifies, manufacturing capacity and the upstream supply of input materials could struggle to keep pace with it, leading to delays and cost inflation. Similar challenges for installation supply chain and workforce required to install PV. [IEA-4]
◆ Distribution network integration – At moderate levels of deployment, distribution network investments are expected to be driven by peaks in winter evening consumption caused by electric vehicles and heat pumps [FLU-1]. However, at very high levels of deployment, solar generation might exceed the network capacity dimensioned for evening peaks in more and more feeders; this would require additional network capacity, more self-consumption and/or local flexibility.
◆ Land and Space Requirements – for large-scale, groundmounted solar farms, substantial land area is needed. This requirement might lead to competition for land that could otherwise be used for different purposes, such as agriculture. [SPE-1]
What can speed
up deployment?
◆ Residential incentives – Providing additional incentives (support to specific consumers for instance) for residential use cases can increase the attractiveness of installing solar panels and should convince additional households to install them.
◆ Upgrading DSO grids – In feeders where peak injection causes curtailment due to voltage rises beyond technical limits, increasing network capacity can enable their further deployment [IET-1].
◆ Cost-effective option – Solar panel costs have dropped significantly, with installation costs accounting for increasingly larger shares of the total system cost for end users than the PV panels themselves [FIT-1].
◆ Prosumer enabler – Small-scale solar is the most decentralised generation technology, allowing individual households to generate their own energy. It is key for building energy communities, where consumption is (partially) managed at a local level through smart use of solar along with electric vehicles, batteries etc. [EUU-1]
◆ Most modular technology – PV systems are very modular; individual panels can be produced identically, and combined in a straightforward way to form a larger system. This allows for standardisation, leading to economies of scale and bringing down costs.
◆ Large & utility-scale PV – As a segment with little development in Belgium compared to residential PV, utility-scale PV could be a way to develop additional capacity at the same time; Flanders will enforce this through a policy requiring large consumers (>1GWh annually) to install PV in proportion to their available roof space [FLG-1]. Agrivoltaics could also be an option for further PV expansion [KUL-2].
SOLAR CAPACITIES FOR BELGIUM
FIGURE 3-30
Over the past decade, onshore wind capacities have been deployed at a steady pace. However, the rate of installation has slowed down mainly due to permitting issues.
Future onshore wind capacities are determined based on the latest draft NECP (June 2023) for 2030 which already assumes a doubling of the installation rate compared to historical levels. Post-2030 assumptions are as follows:
◆ in the Central scenario: a rate of increase which is similar to historical levels;
◆ in the Low scenario: an increase reduced by half beyond 2030;
◆ in the High scenario: a doubling of the trend beyond 2030.
◆ Permitting / NIMBY – Securing permits for onshore wind developments can be a significant obstacle [WEU-1], partially due to local residents adhering to a not-in-my-backyard (NIMBY) approach.
◆ Supply chain challenges – As global development intensifies, manufacturing capacity and the upstream supply of input materials could struggle to keep pace with it, leading to delays and cost inflation. [IEA-6]
◆ Distribution/transmission integration – Plans for grid connections need to be outlined with developers, to ensure the timely reinforcement of high-voltage distribution [FLU-1] and transmission grids.
What can speed up deployment?
◆ Accelerating permitting procedures – Lengthy permitting procedures present a key challenge for onshore wind deployment; streamlining permitting procedures and making sure sufficient capacity is available to process them can go a long way in speeding up deployment.
◆ Cost-effective option – Currently, onshore wind is the cheapest form of renewable generation in Belgium, making it a cost-effective option in areas where permitting challenges can be overcome. [IRE-2]
◆ Can be developed locally – Whilst not as decentralised/ small-scale as residential solar, onshore wind can also be developed in energy communities which residents can participate in [ECF-1].
◆ Advances in spatial planning – A reduction in permitting obstacles (such as ones related to aviation security [SKY-1]) can speed up the process.
◆ Spatial planning – NIMBY approaches are a key factor in lengthening and complicating permitting procedures, meaning that improved spatial planning could mitigate some local concerns and therefore speed up deployment. Furthermore, reassessing areas that are currently off limits for wind development—like aviation routes [SKY-1] and lands reserved for other uses—could open up new zones for potential wind energy generation.
◆ Involvement of local communities – co-development of wind projects with local communities could ease the permitting and acceptance of new farms. It can potentially lead to shared economic benefits. [LEC-1]
◆ Technological developments in turbine making – Since the development of the first wind zones, wind turbines have become significantly larger; repowering these zones carries a large potential of capacity increase and yield increase.
3.2.3.3. OFFSHORE WIND – DOMESTIC
Belgium emerged as a front-runner in domestic offshore wind development, successfully completing the first phase of installations with a capacity of nearly 2,300 MW by 2020. The projected growth includes the commissioning of the Princess Elisabeth Zone (PEZ) by 2030, which is expected to add a capacity of 3,500 MW.
Post-2030 options for further expansion (both assumed that could be developed for 2040):
◆ The potential repowering of the initial zone (MOG 1), which could augment the capacity by approximately 700 MW;
◆ The exploration of a potential third offshore zone in Belgium, estimated in this study to yield around 1,500 MW.
Implementing both options could elevate the installed offshore wind capacity to 8,000 MW. Studies regarding the feasibility of expanding Belgian offshore production to a potential of 8,000 MW are currently being carried out by the Belgian government. Apart from the above measures (repowering of the first offshore wind zone and developing a third offshore wind zone in Belgian offshore waters), the deployment of offshore floating solar power could also be part of the solution. However, this possibility has not been evaluated in the present study.
It is important to mention that as a result of the capacity expansion simulations, the repowering of MOG1 and the third offshore zone is always invested in by the model in all of the sensitivities and simulations and therefore prove to be a cost-effective solution.
◆ Limited space available – Belgium has a very small EEZ which also needs to accommodate (amongst other things): shipping routes, fishing areas and military uses. [FGV-2]
◆ Legal framework – EU legislation limits the ways in which the federal government can re-organise and optimise existing concessions in an effort to repower existing farms. [FGV3]
◆ Supply chain challenges – As global development intensifies, manufacturing and installation capacity as well as the upstream supply of input materials could struggle to keep pace with it, leading to delays and cost inflation. [RAB-1]
Key decisions
◆ New zone in Belgian EEZ – Find new offshore zone(s) in the Belgian EEZ, as the zones which have been identified until now only allow the country to establish 5.8 GW by 2030. Such a decision would need to be taken by 2030 to connect the wind farms by 2040 based on the development of the two previous zones.
◆ Repowering MOG I – Decide how to proceed with repowering and adapt the current legal framework accordingly. [FGV-3]
◆ Technological developments in turbine making – Since the development of the first zones, wind turbines have become significantly larger; repowering these zones has a potential capacity increase [FGV-3].
◆ Close to shore – Farms within the Belgian EEZ are relatively close to the shore, which lowers the costs of bringing the energy to shore.
◆ Past experience and Belgian expertise – As a pioneer in the industry [NSS-1], Belgium has amassed significant knowledge and has a robust supply and installation chain established.
Risks
◆ No space left – Due to Belgium’s small EEZ, following discussions with maritime stakeholders, it is possible that no suitable zone(s) can be found.
◆ Delays in permitting – Permitting delays could occur for several reasons (environmental concerns for the maritime environment, NIMBY pushback against onshore grid development, etc.).
DOMESTIC WIND OFFSHORE CAPACITIES
Offshore wind
BARRIERS ENABLERS
The term non-domestic offshore wind is used throughout this study to refer to offshore wind farms located in zones outside of the Belgian EEZ (therefore typically in another country’s EEZ when considering the North Sea or Atlantic Sea) which are directly electrically connected to Belgium (radially, or via hybrid solutions) and for which a support mechanism is foreseen in which the Belgian state takes part (like f.i. a CfD), if any. This means that the costs related to both the grid infrastructure and the offshore wind farms themselves are accounted for in the total system cost for Belgium.
Looking at the commitments made by the nine countries of the North Sea summits in Esbjerg (2022) and Ostend (2023) to develop 300 GW of offshore renewable energy capacity in the North Seas by 2050, the potential of this non-domestic offshore wind is enormous and indeed a potential choice for Belgium’s future energy supply. The significant lead times (10-15 years) for such complex projects require policy makers and relevant stakeholders to provide, in the short term, clear answers to the challenges and shortcomings in current regulatory and legal framework related to the non-domestic offshore wind that currently hamper the progress in their development/build out. These challenges are further described in BOX 3-4.
As the graph below shows, we assume in this study that:
◆ at most 4 GW of capacity can be added every 5 years from 2036 onwards (taking into account both the important grid infrastructure work and complex negotiations with international partners required for these kinds of projects and the progressive improvement of the regulatory framework at international level).
Several intermediate levels of deployment are analysed for the key scenario years.
NON-DOMESTIC OFFSHORE WIND POTENTIAL CAPACITIES FINANCED AND CONNECTED TO
◆ Shortcomings of the national perspective – The development of the offshore grid and generation will involve multiple countries of a sea basin for which the existing bilateral and individual project-by-project approach based on bottom-up national plans is not a sustainable way forward.
◆ Unprecedented funding needs – The ambitions linked to harnessing offshore wind in the North Seas will require very large amount of investment for which current amounts (e.g. CEF funds) and current way of funding projects individually will not be effective.
◆ Shortcomings of regulatory framework – The current regulatory framework is not able to find the most optimal offshore grid and a right way of sharing costs and benefits which leads to lengthy and inefficient processes with almost no chance of success.
◆ Large potential – Unlike Belgium’s EEZ, other North Sea countries have much larger EEZs with a very large potential for offshore wind development (though further offshore), with a stated combined ambition of 300 GW by 2050 [FGV4].
◆ Improved planning in the Sea Basin – In order to identify projects which carry most of the value for European society there is a need to strengthen joint TSO-led planning at sea basin level whereby synergies across different projects in a sea basin are considered.
◆ Funding and cost sharing – As outlined in the recent paper co-written by Orsted and Elia Group, (new) regional funding and cost sharing mechanisms are needed. Having simple cost and benefit sharing rules from the start and finding additional funding streams (institutions, Member States, third countries and private investors) are key enablers for more non-domestic offshore/hybrid interconnectors [ELI-9].
Key decisions
◆ Strong political support in the short and long term – It will require active political follow-up and support from policymakers to find the right solutions that unlock the offshore potential fully such as the Belgian government taking a leading role (proactively shaping and proposing solutions to these different complexities and barriers).
◆ Cooperation at a regional (sea basin) level together with other countries as well as on a European level is key. Achieving such solutions will not be easy given the complexity and it might take time to eventually get there. It is however important not to wait until all elements are solved and evolve progressively on this matter. A pragmatic approach is required to ensure that investment decisions for the first hybrid projects can be taken in the next 1-2 years so that they can be ready by the assumed time horizon of 2036.
◆ Consider grid and generation together – When taking the necessary decisions about improved planning, funding and cost sharing it is important to simultaneously address the challenges concerning offshore grid infrastructure and offshore generation which may require some de-risking mechanism in the form of support scheme such as contracts for difference.
Risks
◆ Challenges related to cost sharing – The system benefit of an hybrid interconnector can be different for both countries, not to mention that also third countries can benefit indirectly. This is hard to quantify, and, given that significant amounts of money are concerned, this could lead to lengthy negotiations between the involved countries when deciding how to split the investment.
◆ Need to involve non-EU countries – In order to harvest the full potential of the Nort Seas, it will be important to have all countries of the sea basin cooperate, which includes the non-EU countries Norway and UK. Next to the points mentioned before, their involvement also requires addressing other barriers such as an improved market design to enable efficient cross-border trades.
OTHER NON-DOMESTIC RENEWABLE OPPORTUNITIES OUTSIDE OF THE SIMULATED PERIMETER
Given the large needs for additional renewable generation capacity over the next few decades, part of the solution could be to create interconnectors to other countries which could develop renewable surpluses, or which have generation profiles that complement Belgium’s own renewables.
One key example is connecting to offshore wind in other countries, the focus of the section on non-domestic offshore. Extending the scope, there are other regions with high renewable potential; North Africa is one such example discussed in more detail below, besides other regions not discussed in this study (for example Greenland [ENE-1], Iceland [ICE-1] and floating wind in the Atlantic Ocean [WEU-2]).
According to IRENA, North Africa’s unique geography and climate make it a region with immense renewable energy potential, especially for solar & wind; they estimate the technical potential at 2300 GW solar and 223 GW wind [IRE-3]. Various European countries are investigating or planning the construction of HVDC interconnectors to North Africa. Below is a list of three such projects, ordered by increasing ambition in terms of distance and capacity:
◆ Elmed
- Connecting Italy-Tunisia
- 0.6 GW across a distance of 220 km [ELM-1]
- Status: financing secured, construction authorised by Italian government
- Expected to be commissioned in ‘28
◆ EuroAfrica Interconnector
- Connecting Greece-Cyprus-Egypt
- 2 GW (first stage of 1 GW) capacity across a distance of 1400 km [EAI-2]
- Expected to be commissioned in ‘28-’29 [EAI-1]
◆ Morocco-UK Power Project (by Xlinks)
- Connecting UK to Morocco
- 3.6 GW capacity across a distance of 4000 km [REC-1]
- Status: Raising private capital [XLI-1], conducting public consultations [XLI-2]
- Ambition to be commissioned by ’30 [REC-1]
The Morocco-UK Power Project by Xlinks most resembles what it would take for Belgium to connect to Northern Africa in terms of distance covered and is therefore discussed in greater detail here.
The interconnector proposed by Xlinks would consist of 4 cables, each 4000 km long, forming a twin 1.8 GW HVDC system. An agreement has been reached with National Grid for two connections for a total of 3.6 GW in the UK, Devon [XLI-3]. Furthermore, Xlinks is additionally investigating the feasibility of connecting to other markets, such as Germany [REC-1].
The project goes beyond the interconnector alone by also planning for 11.5 GW solar & wind power and 22.5 GWh / 5 GW battery storage system in Morocco. That renewable capacity in Morocco offers several benefits over the same in the UK [XLI-3]:
◆ Solar: Irradiance is over twice that of the UK, yielding more energy for the same capacity, and winter days have more hours of sunlight
◆ Wind: The local Moroccan wind system, the Trade Winds, is consistent, providing a more stable energy source for wind turbines
A sensitivity will be assessed in this study by considering ‘far out RES’ connected to Belgium. As a reference the costs will be taken from the project by Xlinks.
CHALLENGES IN NON-DOMESTIC OFFSHORE DEVELOPMENT
To unlock the potential of integrating non-domestic offshore into the Belgian supply mix several challenges still need to be resolved. These challenges include:
A suboptimal national planning approach
◆ Current offshore wind developments are based on a project by project approach developed on a bilateral basis, whereas the offshore developments have much more a multi-lateral dimension. This is caused by a bottom-up planning of individual projects based on national plans without considering synergies across different projects in a sea basin suboptimal national planning approach;
◆ Development of non-domestic offshore projects are also not appropriately considering offshore grid and offshore wind generation together;
◆ As a consequence, there is an absence of incentives for countries which have an excess potential offshore RES to develop their potential, and for RES countries with a lack of potential to access these renewable energy supply sources.
An innapropriate funding framework
◆ The ambitions linked to harnessing offshore wind in the North Seas will require very large amount of investment for which the current amounts of European funds (e.g. CEF funds) is insufficient and current way of funding projects individually is ineffective.
◆ The benefits of offshore wind projects of non-domestic offshore projects are often broader than solely the ones of the hosting countries, who are yet expected to bear (majority) of the costs. Due to today’s absence of an appropriate mechanism for cost and benefit sharing between countries, these projects face difficulties to be developed.
◆ Lack of clarity on ownership of offshore interconnector projects when multiple parties are involved in the cost sharing is an issue which must be clarified and improved in order to facilitate and speed up the development of these projects.
◆ Given the barriers and issues listed above, countries with an excess RES potential may have no incentive to fully unlock their potential and thus the potential of the North Sea.
Solving these challenges will require active political follow up and support to find the right solutions that unlock the offshore potential fully.
Belgium, as a country with limited offshore RES potential, has to be one of the leading forces to pro-actively shape and propose solutions to these different barriers. Otherwise, it
will not get access to this source of non-domestic offshore wind, should it be chosen as a part of the BE future’s energy supply mix.
Some solutions start to be sketched out as part of the European debate on this matter, which are summarised hereunder:
Joint planning & international coordination
◆ There is a need for an improved regional planning where TSOs of the sea basin identify the most efficient development for the offshore grid. An essential part of the improvement includes also the decision making around these projects, where the projects delivering most value, including those belonging to the non-domestic offshore category, are jointly selected and promoted at regional level.
◆ The policy makers around a sea basin could initiate these developments by providing the right mandate to their TSOs to initiate a more open and collaborative approach regarding the development of their offshore potential and the related offshore grid.
◆ The experience gained in the first voluntary initiative could then help enshrining the approach in legislative and regulatory development to ensure its sustainability towards the future.
Joint funding and cost & benefit sharing
◆ A structure providing joint funding for the offshore generation and infrastructure projects on the sea basin level may help to support the joint funding of the most interesting projects selected according to the joint planning described above.
◆ This funding structure should find improved and innovative ways of combining both public and private funding in order to finance the development of the offshore infrastructure or de-risking the offshore generation
◆ The challenge on the funding must be combined with an improved way of sharing cost and benefits of the offshore infrastructure and offshore wind, according to the identified benefits
An inclusive approach around the North Sea
◆ The offshore wind potential in the North Sea can only be developed in cooperation with non-EU countries, i.e. UK and Norway. Active engagement where all parties jointly seek to solutions for the similar ambitions must be ensured. Their involvement is not solely limited to the development of these offshore projects, but also requires addressing other barriers such as improved market design to enable efficient cross border trades.
3.2.3.5. NUCLEAR FLEET - EXISTING
The Central scenario considers the phase-out of nuclear power in accordance with the law introduced in 2003, which was amended in 2013 and 2015 to cover the operational lifetime extension of Tihange 1 and Doel 1 and 2. In addition, the Central scenario also considers the lifetime extension (also referred to later as long-term operation – LTO) of Doel 4 and Tihange 3 for 10 years, as approved by the federal government and ENGIE.
A number of sensitivities are evaluated for the period post-2036:
◆ Prolonging the extension of D4/T3 by an additional 10 years (leading to a total extension of 20 years), which would extend their operation until the end of 2045.
◆ Extending an additional 1 or 2 GW for 10 years. The specific timing of potential works, restart timing and reactors involved are not detailed. The sensitivity only assumes those could be present in the target years 2036 and 2040. Several political parties proposed such an extension ahead of the elections [PLB-1].
It is worth noting that this study does not evaluate the feasibility or other necessary safety, technical or legal measures and other consequences of extending the operation of these reactors. The primary objective of this study is to assess the impact on the electricity system.
EXISTING NUCLEAR CAPACITIES EVOLUTION AND POTENTIAL EXTENSIONS CONSIDERED IN THIS STUDY BEYOND CURRENT FRAMEWORK
Nuclear phase-out starts in ’22
decided upon
◆ Need for political consensus – The multifaceted debates surrounding nuclear energy add a layer of complexity to the decision-making process in this field. [UGE-1]. A political consensus is needed and the necessary legislation and other relevant regulation needs to be adapted.
◆ Technical & safety feasibility – The technical & safety related feasibility of lifetime extensions needs to be assessed for each reactor individually and in line with regulation, technical and grid constraints.
◆ Willingness of the nuclear operator – The operator has voiced concerns about the further extension of more reactors. [DTI-1]
Key decisions
◆ Additional lifetime extension of D4/T3 – Currently D4/T3 are set to close in 2035 after a 10-year lifetime extension. Given the necessary time to reach an agreement and realising LTO works, a timely decision is needed to allow for an additional 10-year extension until 2045 [DST-1].
◆ Extension of additional reactors – A decision is needed about whether to extend an additional 1-2 GW of reactors as some of the reactors are already shut down and preparations for dismantling are ongoing and others are going to be shut down in 2025.
◆ Most political parties indicated their willingness to prolong more nuclear – in the recent elections, several parties indicated their willingness to further extend reactors beyond 2025. [PLB-1]
◆ No need to secure new locations – Unlike building new reactors, extending existing ones would not require new locations to be secured: a complex process involving many stakeholders.
Risks
◆ Shared issues across reactors – When designs and components are similar, a problem with one reactor might also be present in other reactors, and require both to be taken offline for inspection. [WNA-1]
◆ Cost of extension – The cost of extending a reactor is subject to uncertainty as it triggers discussion at many levels [DTI-2].
◆ Waste management – The handling and storage of nuclear waste remains a key consideration [NUF-1].
The current study also delves into the exploration of new nuclear energy options. These can encompass large-scale nuclear reactors such as the European Pressurised Reactor (EPR) or smaller, more compact alternatives known as small modular reactors (SMRs).
Even though there are no definitive plans in Belgium at this stage, various stakeholders – including political circles – have underscored the necessity to explore this possibility.
The following assumptions, shaped in consultation with stakeholders, were taken into account:
◆ The earliest, an SMR (based on ‘generation 3’ designs) could be operational in 2036. However, achieving this would necessitate immediate action to identify a site, design and conceptualise the project, build, regulate and start to operate the reactor;
◆ Subsequently, it is assumed that a maximum of 2 GW could be operational by 2040 (either 1.6 GW large-scale reactor or/and several SMRs);
◆ Similarly, for 2050, a maximum of 8.2 GW is examined, which could consist of a mix of SMRs and large-scale units or solely SMRs.
However, it’s critical to emphasise that this study exclusively assesses the impact on the energy system. It did not delve into the feasibility, regulatory aspects, types of designs, locations, and detailed timelines.
New nuclear builds will require a long lead time before becoming operational (see also BOX 3-5). In addition new locations for reactors will need to be found. The graph below shows the most ambitious deployment timeline considered in this study, whilst several intermediate levels of deployment are studied for the target years.
BARRIERS ENABLERS
(Shared with existing capacity)
◆ Need for political consensus
(For new builds alone)
◆ Potentially strong NIMBY effect – Resistance from local residents is likely in cases where large numbers of new sites have to be secured (especially for small modular reactor (SMR) deployment).
◆ Development Timeline – In the context of large-scale reactors, multiple instances of exceeding the planned timeline have been observed in Europe. As for SMRs, this technology has not yet seen widespread deployment across the continent. SMRs, technology is not yet deployed in Europe [NEA-1].
Key decisions
◆ Pursue new nuclear builds or not – The first step is to decide whether to pursue new nuclear builds at all or not; and if so, which mix of traditional designs versus SMRs is desirable, and who will construct/operate and how to finance and what will/ should be the state involvement.
◆ Sites for new development – Deciding on new sites early on is important to ensure the timely preparation of the grid and other regulatory aspects.
◆ Potential 4th generation of SMR - Next generation reactor designs could further improve performance with respect to safety and waste handling. However, the timing of development is uncertain with many designs available. Most sources indicate that those will not be commercially ready before 2040s [IAE-1].
◆ Valorising heat directly – SMRs could valorise heat directly in addition to converting it to electricity, through co-location with industrial clusters or district heating [EUC-13].
◆ Few resources/space needed – SMR require much fewer input materials [IEA-5] or space [OWD-1] per reactor compared with other new generation options.
Risks
(Shared with existing capacity)
◆ Shared issues across reactors
◆ Waste management
(For new builds alone)
◆ Delays in securing permits and locations – Securing permits for new locations is a complex process involving many stakeholders, including local communities. This is a complex process, and delays could occur. [UKG-1]
Key decisions
◆ Develop a national strategy to support this `new nuclear' scenario and ensure sufficient and qualified suppliers and staff (i.e. reinforce education programmes for all nuclear professionals, support R&D programmes where needed…).
Risks
◆ Cost and time overruns in construction – Europe has very limited recent development experience, and the two most recent examples (Flamanville [BLO-1] and Olkiluoto 3 [REU-1]) took 17-18 years to construct, more than 3 times longer than was initially planned and experienced costs overruns.
◆ Technology risk – For new technologies such as SMRs or next generation reactors, there will be at most a short-term track record of existing implementations when an investment decision is taken, as nearly all designs are still in development stages today [NEA-1, GIF-1].
TIMINGS RELATED TO THE DEVELOPMENT OF NON-DOMESTIC OFFSHORE WIND/ INTERCONNECTORS AND NEW NUCLEAR REACTORS
The building of new nuclear reactors is similar to the building of offshore wind/ interconnectors: they are large, CAPEXheavy projects, with long lead times, and require strong governmental initiative.
The figure below outlines the electricity supplies that can be achieved with different combinations of nuclear and/or non-domestic offshore wind. The diagonal lines represent ‘energy isolines’: different combinations of nuclear and offshore wind capacity that yield the same amount of electricity supply.
• 1 GW nuclear is equivalent to 2 GW offshore in terms of energy
• New nuclear and foreign offshore are large investments that need to be planned 10 years beforehand
• Nuclear extensions (beyond D4/T3 for 10 years) are also considered
The maximum attainable deployment for each technology by 2036, 2040, 2045 and 2050 is strongly linked to lead times and technology maturity.
Lead time for new nuclear reactors
There are primarily two candidate technologies for the development of new nuclear reactors: large-scale reactors such as EPRs and SMRs.
EPRs are generation III+ pressurised water reactors. They are large, gigawatt-scale reactors, of which only two units have been built so far in Europe (Olkiluoto 3 in Finland and Flamanville 3 in France). The figure below outlines the lead time for these projects (from initial development decision to their commissioning) along with the lead times for one that is currently under construction (Hinkley Point C) and three more that have been announced by European countries with existing nuclear reactors. Based on this, a lead time of 15+ years seems reasonable, implying that new EPRs would not be commissioned before 2040.
SMRs are small modular reactors, an early-stage technology which promises smaller unit sizes, more flexible operation and improved costs/production ability through the standardised production of the same design. Though interest in SMRs is increasing across the globe, most evolutionary designs are still in their early stages, and it is difficult to estimate when they could become operational. Tractebel has announced that a first SMR (generation III) could be operational in Belgium in 9-12 years, roughly by 2035, provided that a decision is taken today to pursue it [KNA-1]. This would hold for an SMR ‘generation III’ reactor, based on current reactor design but smaller sizes. For ‘generation IV’ SMRs, there are still many uncertainties regarding which design would be commercially available to be installed in Europe and when.
LEAD TIME FROM DECISION TO COMMISSIONING FOR SELECTED RECENT EUROPEAN REACTORS FIGURE 3-37
Selected recent European reactors [WIK-1] (incl. still under construction and announced)
Initial construction estimate Construction delays Where we are in ‘24
3.2.3.7. OTHER RENEWABLES
In addition to solar and wind, the production capacity from hydroelectricity and biomass is also considered in this study. When it comes to hydroelectricity, Belgium's capacity and potential is limited in terms of run-of-river hydroelectricity. This form of power generation typically involves the use of small hydro units installed along rivers, harnessing the natural flow of these rivers to generate electricity. The largest of these facilities in Belgium is located on the river Meuse in Wallonia. A capacity of around 150 MW is assumed for all future years.
Regarding biomass and waste (not all renewable) for electricity generation, the country has currently a bit less than 1,000 MW installed. This amount is kept constant until 2050.
A potential for biomethane is also accounted for Belgium which can be used by the model. This amounts to around 21 TWh in 2050 based on the TYNDP2024 figures.
3.2.3.8. THERMAL FLEET
The current thermal generation in Belgium (apart from nuclear) consists of a significant amount of methane-fired generation both in large-scale units such as CCGTs or OCGT or in smaller scale units usually used also a combined heat and power (CHPs). If those units remain in the system, by 2035 there should be:
◆ around 7,300 MW of large-scale gas units;
◆ around 1,600 MW of small-scale gas units.
These figures include the new units being built in the Liège region. The age distribution of the large-scale units is provided in Figure 3-38.
Belgium still has some operational oil-fired units (around 100 MW). Those are assumed to be decommissioned by 2035.
EXPECTED AGE OF THE CURRENT THERMAL GAS FLEET IN BELGIUM IN 2035
3-38 2,500 2,000 1,500 1,000
Age of the units in 2035
Bonne photo mais nous ne l'avons pas reçue en haute def
Lead time for non-domestic offshore wind and (hybrid) offshore interconnectors
The most recent Belgian reference for hybrid offshore interconnectors is the currently investigated TritonLink project. This project aims to connect the energy hubs of Denmark and Belgium with a ~1000 kilometre-long HVDC link capable of transporting 2 GW of power. Exploratory studies started in 2020, and current plans have construction starting in 20262027 and its commissioning happening in 2031-2032 [ELI-8]. This implies a timeline of roughly 10 years (down from 12 years for the first link), with a 5-5 year split between the preparation and construction of the interconnector. This study assumes for the most ambitious scenario that 4 GW of capacity comes online every 5 years from 2036 onwards, which would require starting 2 new projects in parallel every 5 years from today.
Olkiluoto 3
Hinkley Point C
Flamanville 3
Dukovany (new)
Penly (new)
FIGURE
3.2.4. DEMAND FLEXIBILITY AND STORAGE
This section details the assumptions regarding storage reservoirs and demand side response in Belgium.
Two categories are considered regarding large-scale storage:
◆ pumped-storage reservoirs;
◆ large-scale batteries.
Three additional categories are considered regarding end user flexibility:
◆ small-scale batteries (i.e. home batteries);
◆ flexibility from electric vehicles (either via V1X or V2X);
◆ flexibility from heat pumps.
For these assets to offer their flexibility to the system, several enablers are needed. These enablers were described in the 2023 Adequacy and Flexibility study [ELI-1], and Elia Group’s most recent viewpoint, 'The Power of Flex' [ELI-7].
The last category consists of market response (large-scale demand flexibility) available across Belgium (existing and newly electrified processes).
The flexibility is associated to each demand scenario and sensitivity (from low to high):
◆ GA scenario: it is assumed that end user flexibility is developed in line with the trend assumed in the latest Adequacy and Flexibility study [ELI-1]. This scenario is associated with the GA demand;
◆ SUFF sensitivity: this sensitivity is derived from the DE scenario, considering that the associated electricity demand is lower, leading mainly to lower market response potential;
◆ DE scenario and ELEC scenario: it is assumed that in a more electrified residential consumption, more end user flexibility will be developed including more residential batteries when compared to the GA scenario. This is associated to the DE and ELEC demand;
In addition two sensitivities related to the amount of flexibility are also defined to test the impact:
◆ HIGH FLEX sensitivity: considers much more flexibility from electro-mobility, residential batteries and large-scale batteries. For 2050, the installed capacity of flexibility is equivalent to the electricity peak demand;
◆ LOW FLEX sensitivity: end user flexibility is limited in the residential sector and flexibility is mainly provided by large-scale storage and market response;
The evolution of flexibility associated with demand flexibility and storage at the Belgian level is summarised in Figure 3-39 for the different scenarios/sensitivities (DE, GA, ELEC, SUFF, LFLEX and HFLEX).
Pumped storage
Pumped storage used to be the main storage technology available in Belgium. The historical installed capacity is equal to 1,224 MW (Coo 1-6 + Plate Taille 1-4). Considering the ongoing change in the Coo turbine capacity and reservoir volume, this leads to a total installed capacity of 1,305 MW of pumped storage in Belgium by the end of 2025, along with a total reservoir volume of 6,300 MWh. No additional volume is considered for the future given the limited potential of this technology in Belgium. This does not mean that additional projects could not be developed in the future.
Large-scale batteries
The future volume is calculated based on the existing volume, the volume contracted in past Belgian CRM auctions, and an estimation of future potential based on available information regarding ongoing projects (similar approach as used in the latest Adequacy & Flexibility study). For the DE/GA scenarios, 50% of the future potential is accounted for. This percentage is decreased to 25% in the LFLEX sensitivity, while the full future potential is considered for the HFLEX sensitivity. These assumptions lead to the following volumes in 2050:
◆ 3.4 GW in LOW FLEX sensitivity;
◆ 5.4 GW in both DE and GA as well as in ELEC and SUFF sensitivities; and
◆ 9.4 GW in HIGH FLEX sensitivity.
Small-scale batteries
The volume for the future years is calculated based on projections of the installation rates and the amount of existing assets. In the DE scenario, ELEC and SUFF sensitivities, the installation rate is assumed to be 20,000 units/year until 2035 and 30,000 units/year afterwards. In the GA scenario and LFLEX sensitivity, it reaches respectively 15,000 and 10,000 units/year from 2029 to 2035 and is kept constant afterwards. Finally, in the HFLEX sensitivity the installation rate is assumed to be higher before 2030 and to increase to 50,000 units/year from 2030 to 2050, with an increasing average capacity from 4.5 to 9 kW/installation. These assumptions lead to the following volumes in 2050:
◆ 1.4 GW in LOW FLEX sensitivity;
◆ 1.8 GW in the GA scenario;
◆ 2.5 GW in the DE scenario as well as in the ELEC and SUFF sensitivities;
◆ - 9.2 GW in the HIGH FLEX sensitivity. FLEXIBILITY ASSUMED FOR EV AND HP IN THE DIFFERENT SCENARIOS AND SENSITIVITIES
Flexibility from electric vehicles
Flexibility from electric mobility consists of optimised charging (V1X) and vehicle-to-grid V2X.
V1X assumes that electric vehicles are combined with unidirectional smart charging technology (without the ability to inject electricity back into the network) to shift charging to periods with high RES infeed. The category is split between smart charging (V1M) and delayed charging (V1H). Further information about the modelling choice can be found in the latest Adequacy & Flexibility study performed by Elia.
V2X assumes that electric vehicles are combined with bidirectional smart charging technology to shift their charging away from periods with higher residual load but also to use the spare battery capacity to store energy and inject it back to the grid. This type of charging behaviour is modelled as an additional battery device that is combined with other battery types. The category is split between in the market (V2M) or out-of-market (V2H).
The capacity associated with this category depends on the amount of electric vehicles available and the share of flexibility associated with natural charging, V1X and V2X. The different flexibility shares by scenario/sensitivity are presented in Figure 3-40. It should be noted that those capacities are indicative because the model has a different flexibility available each hour of the day depending on the amount of cars connected to a charger and the state of charge of the batteries.
The following volumes are considered for 2050:
◆ 4.7 GW V1X and 1.3 GW V2X for the LOW FLEX sensitivity;
◆ 4.9 GW V1X and 2.7 GW V2X for the GA scenario;
◆ 4.3 GW V1X and 4 GW V2X for the DE scenario and the ELEC and SUFF sensitivities;
◆ 3 GW V1X and 6.6 GW V2X in the HIGH FLEX sensitivity.
Flexibility from heat pumps
Flexibility from heat pumps across Belgium consists of a mix of pre-defined (HP0), pre-heated profiles combined with smart heating (HP1H), where the heat pumps are optimally dispatched by the model following energy and power constraints (HP1M), as defined in the latest Adequacy & Flexibility study performed by Elia. In this study, the HP1H and HP1M are integrated in an equivalent HP1X category, assuming that the first category would provide less flexibility than the second one. The associated category varies on an annual basis, according to the seasonality of the heat demand and on an intraday basis, following the daily heat demand and operating mode of the heat pumps. The values provided here are indicative for an average winter day. The model has a different flexible capacity available for each climate year and day.
The amount of flexibility in GW depends on the amount of heat pumps considered in the scenario/sensitivity and on the different flexibility shares by scenario/sensitivity are presented in Figure 3 -40. This leads to the following volumes in 2050:
◆ 0.2 GW in LOW FLEX sensitivity;
◆ 0.5 GW in SUFF sensitivity;
◆ 0.6 GW in the GA scenario;
◆ 0.7 GW in the DE scenario;
◆ 0.9 GW in the ELEC and HIGH FLEX sensitivities.
Market response (including new electrified large consumers)
The volume of market response is the sum of existing usages (1843 MW, as evaluated in the 2023 Adequacy and Flexibility study) and newly electrified industrial processes (industrial heat pumps, e-boilers and direct reduced iron electric arc furnaces) and data centres. The fraction of flexible demand in the different scenarios and sensitivities is presented in Table 3-5.
The different assumptions lead to the following volumes in 2050:
◆ 3 GW in LOW FLEX sensitivity;
◆ 4.1 GW in SUFF sensitivity;
◆ 4.3 GW in the DE/GA scenario; and
◆ 5.1 GW in the ELEC and HIGH FLEX sensitivities.
3.2.5. BELGIAN ELECTRICITY GRID
The Belgian electricity grid was analysed across three levels for the current study:
◆ the horizontal grid consisting of the backbone, interconnectors and the offshore grid;
◆ the vertical grid which takes the energy from the first level to the distribution level; and
◆ the distribution level
This section provides the main assumptions regarding the Belgian starting grid.
Backbone and offshore grids
The 380 kV grid constitutes Belgium’s backbone transmission grid. Very large consumers, large electricity producers and interconnectors are connected to it. The starting grid used for this voltage level consists of all approved projects in the latest federal network development plan which was published by Elia [ELI-3]. An overview of the major projects is included in Figure 3-41; it covers projects such as the Boucle du Hainaut, Ventilus, the Princess Elisabeth Island, Lonny-Achène-Gramme and the backbone with high-temperature low-sag (HTLS1) conductors. In terms of offshore interconnectors, it includes the Nautilus interconnector with the UK. It should be noted that the costs presented in this study are in addition to those associated with approved projects.
Substation 380 kV Axis already reinforced / without potential for further reinforcement Axis with remaining potential for further reinforcement
In the model, Belgium is split into 3 electrical zones: the western, central and eastern parts of the country. This allows the optimiser to be able to choose from different projects such as reinforcing the backbone or new (offshore or onshore) interconnectors with
other countries. An additional optimisation is performed after the simulation to evaluate the need for internal backbone reinforcements based on the flows and overloads of the internal grid modelled between the three zones.
REFERENCE BELGIAN HIGH VOLTAGE HORIZONTAL ELECTRICITY GRID FIGURE 3-41
Regarding onshore interconnectors the optimiser can choose to reinforce the existing AC grid by means of HTLS reinforcements. This is the case for the Van Eyck (BE) – Maasbracht (NL) existing link. In addition, the other potential reinforcements are considered to be HVDC cables.
It should be highlighted that, except the HTLS possible reinforecements, the expenses related to the reinforcement of the grid are presumed to be equivalent to the costs of HVDC connections. For those connections, no limit is imposed in terms of capacity.
Vertical grid
The vertical grid consists of the lower voltages of Elia’s grid (which ranges from 150kV to 30kV). This grid is used to bring the bulk power from the backbone to the DSO grids or to certain directly connected grid users. It is also used by certain generation facilities, storage facilities and renewable sources.
The costs presented in this study are an estimation of the costs from 2030 onwards. Starting from the approved investment plans, the study estimates the increase in total peak load per scenario whilst taking into account that local generation will reduce the capacity need at TSO level. This is then compared to the investments based on the peak load hypotheses used for the
network investment plans, translated into an additional need for transformers, cables & substations and finally yields a high-level, updated investment need.
Distribution grids
Distribution grids bring the electricity from Elia’s grid to end consumers. While those are not modelled explicitly, the costs for the needed reinforcements are estimated, depending on the chosen scenario.
The costs presented in this study are an estimation of the costs from 2030 onwards. Starting from the DSO investment plans, these investments are then rescaled by scenario based on the expected increase in peak consumption for the load segments that are expected to be connected at distribution level.
Peak consumption during winter evenings is expected to remain the peak event that drives network investments, given the spread of heat pumps and electric vehicles across the low-voltage networks. This study assumes that the resulting network reinforcements can also accommodate the growth in PV, except for the most ambitious scenario concerning PV deployment, where the PV injection is capped at the level of the network reinforcements. This will be further explored in the results section. SCHEMATIC
3.3. FINANCIAL ASSUMPTIONS
Financial assumptions play a vital role in determining the optimal capacities in the model and quantifying the system's total costs. The model incorporates both variable and fixed costs for the technologies and infrastructure it utilises and invests in.
In addition to the costs related to the energy system and as explained in Section 2.4, the costs also include end uses and all energy vectors. This section offers a snapshot of the key cost parameters used in this study. For the variable costs (other than
fuel costs), we refer to the most recent Adequacy and Flexibility study 2023. The cost estimates were initially presented in the second workshop dedicated to the study, prepared by Compass Lexecon. These estimates were later adjusted based on feedback received from various stakeholders during the consultation phase. The range of costs is intended to capture the known uncertainty associated with the different technologies. Appendix F provides more detailed information about the total cost methodology.
3.3.1. APPROACH TO TOTAL COST QUANTIFICATION
This study does not seek to differentiate between various types of investors or evaluate the methods and time frames for financing the different technologies. Therefore the technical lifetimes used for each technology are different from the economical lifetimes used to evaluate the business case of a certain asset. Similarly, transfers between consumers and producers (e.g. subsidies) or welfare for different types of users (consumers, producers) are excluded from this analysis. The goal of the study is to quantify the total costs of the Belgian/European system; the base for cost quantification lies therefore in assessing the fixed and variable costs required to supply the needed energy.
A few assumptions need to be kept in mind when interpreting the results:
◆ all cost assumptions and figures are reported in euros (€) 2022 (unless stated otherwise);
◆ all CAPEX figures are expressed in overnight costs (without financing costs); the financing costs are added afterwards when applying the cost of capital and accounting for the construction time;
◆ emissions costs are based on the shadow carbon cost calculated by the model (see also Appendix C);
◆ import/export costs are assumed to be priced at the system marginal cost for every time step of each energy carrier.
◆ when reporting on the Belgian electricity system costs:
- existing technologies and new installations before 2030 are assumed to be fully depreciated (no CAPEX assumed) but there is a fixed operating cost (FOM) applied to these technologies;
- the same holds for the grid in instances where the costs for the distribution and vertical grids are calculated from 2030 onwards; costs for the backbone and interconnectors are calculated on top of the approved projects from the latest federal network development plan. This is further explored in this section;
- no replacement CAPEX is assumed for existing technologies other than thermal generation for electricity; this assumption does not change the comparison between scenarios as the amount of existing capacities is assumed to be the same in all the scenarios and sensitivities (except for thermal generation);
◆ For the quantification of end uses and other vectors costs, a similar approach is used:
- For OPEX and CAPEX costs for the molecule system, the same is applied as for the electricity costs. The OPEX costs are mainly the imports of molecules needed for Belgium/Europe while the CAPEX includes the infrastructure requirements;
- Concerning end uses (industry investments, buildings and transport), the reader can refer to Appendix F where more details are provided regarding the methodology. This includes quantifying the investments that the consumers are required to make in each scenario (e.g. renovation, purchase of a car, changing the heating system, etc... ).
Two ways will be used to report on costs:
Annualised approach
The first approach involves selecting a specific target year and adding up the annual payments and the operational costs of the system for that year.
◆ The annual payments (or annuities) are derived from past investments that were needed to set up the required infrastructure and technologies for a particular scenario. These annual payments are then annuitised based on a specific asset lifetime and the Weighted Average Cost of Capital (WACC).
◆ The yearly operational costs of the system are added to the annuities as those reflect the yearly variable costs of the system. Those include the purchase of the fuel of locally produced power and cost of imports (cost of fuels produced abroad and imported). In the case of exports, this is then a revenue.
The annual payments and operational costs can either be combined and presented as absolute figures or expressed relative to the energy or electricity demand. In the latter case, they would be reported in terms of €/MWh. This method will be used to compare the different scenarios between each other.
Sum of overnight CAPEX approach
To determine when investments should be made (for instance, during which 5-year period), one can also examine the investment costs required by each scenario. However, this method will only be used to asses when capital expenditures (CAPEX) would need to be made for a specific scenario, not for comparing various scenarios, as it doesn't consider operational expenditures (OPEX). Additionally, this approach does not offer insight into the cost of capital or the operational costs, so it should not be used to compare different scenarios with each other.
3.3.2. INVESTMENT COSTS
Investments costs in different technologies were consulted upon and discussed with stakeholders. The aim of these cost figures is to assess the total system costs. It is important to note that a lot of uncertainty regarding investments costs still resides until 2050. The low and high ranges aim to reflect the known uncertainty; however, new breakthrough technologies or innovations could change them. This is also the reason why many cases are simulated and costs quantified with different combinations for the Belgian sensitivities assessment.
The table in Table 3-6 the overnight CAPEX costs in €/kW. This means that the figures exclude any financing (e.g. during construction) and those should be added.
In addition to the CAPEX, technical lifetimes are used for all technologies (and not economic lifetimes) as the study aims to assess the system costs. Construction times for each technology are also accounted for.
3.3.3. COST OF CAPITAL
The overnight costs are accounted for with a certain weighted average cost of capital (WACC). Three cases are applied for supply technologies in this study:
◆ Reference: WACC of 7%;
◆ High: WACC of 10%;
◆ Low: WACC of 4%.
The same WACC is applied across all technologies; however, different risk profiles subsist. In order to reflect the differences in
risks, when quantifying the costs, different WACC sensitivities will be applied depending on the technology.
In addition to the WACC, a cost of debt of 4% is applied during construction time to reflect the cost of capital incurred during that period. The longer the construction time, the bigger the costs incurred.
For grid technologies, a WACC of 6% is applied without sensitivities on that parameter.
3.3.4. TREATMENT OF NON-DOMESTIC OFFSHORE IN THE COSTS
The grid costs that are accounted for in each scenario/sensitivity when calculating the total costs of the electricity system for Belgium include:
◆ All the costs related to the distribution and vertical grids;
◆ All the costs related to the internal backbone grid in Belgium;
◆ All the costs related to the links between Belgium and the non-domestic offshore wind accounted for in the sensitivities. Those also include any multi-terminal platforms/island in Belgium
◆ All the costs related to the non-domestic offshore wind farm up to the capacity considered in the sensitivity/scenario;
◆ Half of the costs for interconnectors from/to Belgium. This is further summarised in Figure 3-43 for the high-voltage grid.
3.3.5. OTHER COSTS COMPONENTS
Fixed costs (FOM): Each technology is associated with a certain FOM yearly cost. This is applied to existing and new investments including infrastructure.
End use costs:
◆ Transport costs: The costs accounted for are those for road transport only (new vehicles and charging infrastructure).
◆ Building costs: costs for renovation and heating systems are accounted for. Other costs such as appliance replacement, cooling are not accounted for.
◆ Industry costs: the cost of replacement of certain industrial processes by different technologies and and energy carriers used, cost for carbon capture and storage are also included here.
Emissions costs: Emissions costs are calculated based on the shadow CO2 price calculated by the model. For the Belgian supply sensitivities, the same CO2 price is used across all scenarios within the parent European scenario.
Imports and exports of energy: The exchanges from/to a certain zone (e.g. Belgium) are also accounted for. Indeed, the molecules or electricity that needs to be imported (or that is exported) is priced at the marginal cost of the corresponding energy carrier. Transfers and subsidies: Fiscal costs, such as taxes, subsidies, levies, and redistributions are excluded from the system costs.
3.3.6. COSTS OF IMPORTS OUTSIDE OF EUROPE & DOMESTIC FUELS
Generally, prices from the TYNDP 2024 are used where available. However, for ammonia imports, the TYNDP assumes a singular import price. To accurately represent the merit order of imports and the cost variations when importing from different continents,
a new cost calculation is undertaken. The methodology used to recalculate the ammonia import cost per continent is depicted in Figure 3-44.
Solar profiles of the considered country Wind profiles of the
and
WACC, lifetime, efficiencies,
For each potential export country, solar and wind profiles are analysed to determine the optimal solar, wind and battery capacity for a 1 MW electrolyser. These profiles facilitate the calculation of the corresponding full load running hours for the electrolyser. These outputs, combined with the CAPEX and OPEX of all technologies, a corresponding WACC and technical lifetime, enable the calculation of the levelised cost of hydrogen (LCOH). This cost is then increased due to the conversion cost of hydrogen to ammonia and a transportation cost which is proportional to the distance from the exporting country to Europe.
As a means of validating the derived prices, a comparison was conducted with other studies. Figure 3-45 illustrates the comparison for ammonia import prices via shipping. It is important to note that most studies present import prices based on hydrogen as the end product, while in this case, prices are calculated with ammonia as the final product. The three scenarios used from Low to High are in the range of the other studies.
A similar approach is applied for synthetic liquids and synthetic methane. The primary difference lies in the conversion costs from hydrogen to synthetic liquids or synthetic methane (which are higher, primarily due to the increased operating expenses of these installations). Additionally, for these installations, an extra cost is added for direct air capture (DAC) systems, as these conversions necessitate their use.
More detailed merit order curves are provided in Section 3.1.4.
[1] Study on hydrogen in ports and industrial coastal areas [EUH-3]
[2] TYNDP24 scenarios [ENT-1]
[3] Global Hydrogen Flows 2022 & 2023 [H2C-1]
[4] Shipping sun and wind to Belgium is key in climate neutral economy [H2I-1]
[5] Green hydrogen made in Germany will be cheaper than shipped imports in 2030 [H2I-1]
[6] Renewable hydrogen imports could compete with EU production by 2030 [AUR-1]
[7] The economics of global green ammonia trade [UEN-1]
[8] Renewable hydrogen import routes into the EU [OXF-1]
[9] Global hydrogen trade [IRE-4]
[10] Costs and risks of importing hydrogen derivatives by ship [AGO-1]
[11] Green Ammonia for climate protection [FRA-1]
[12] Learnbook: hydrogen imports to the EU market [ENT-6]
This chapter provides a summary of the main findings acquired for Europe. Although the study's primary focus is Belgium’s electricity system, examining the multi-energy results for the whole of Europe is also crucial.
The results acquired are tied to the assumptions made. Different assumptions could yield different results. Therefore, the analysis also includes various scenario variations to enable 'what if' explorations. The assumptions underlying these variations are discussed in the previous chapter.
The following aspects are analysed:
◆ the supply and demand for each energy vector
◆ the supply and demand for electricity
◆ interactions between energy carriers and those between the electricity system and the other carriers;
◆ carbon management (amount of carbon emitted, stored, re-used);
◆ electricity grid requirements at the European level across different scenarios with a focus on offshore development;
◆ adequacy and flexibility requirements;
◆ the costs of the different scenarios.
The chapter then ends with the key takeaways for the electricity system and for Belgium.
As a reminder, the area investigated by this study comprises all 27 Member States along with Norway, the United Kingdom and Switzerland. References to Europe throughout this study therefore cover these 30 states. By contrast, specific references to the European Union cover its 27 Member States only.
MULTI-ENERGY EUROPEAN RESULTS
4.1. SUPPLY AND DEMAND PER VECTOR
This section outlines the results for the multi-energy supply and demand balances for each energy vector at a European level. This covers the final usages per energy vector, but also explores the usage of these vectors for the generation of power and the potential synthetisation of derivative fuels. These results are discussed for the main European demand scenarios (DE, GA and ELEC) alongside additional sensitivities (where relevant) that illustrate the impact of exogenous changes that could influence these balances. Note that positive values are reported as supply and negative values are reported as demand values; this allows readers to understand how each energy carrier is supplied and how they are used at a European level.
4.1.1. METHANE BALANCES
Figure 4-1 depicts the yearly balances for methane. In 2021, methane was used for a variety of appliances, although its main use was as a fuel in industry, heating in buildings and as non-energetic feedstock for the production of hydrogen (and its derivatives) via SMR-H2 Around 1,500 TWh was consumed for the production of electricity.
In all simulated scenarios, the demand for methane is seen to decrease compared with today. This is explained by the key evolutions outlined below:
◆ The decrease in the demand for methane for final end uses (i.e. usage of methane in buildings, industry and transport) can mainly be explained by the assumed phase-out of gas usages such as heating in buildings and process heat in industry. This effect is stronger in the ELEC & DE scenarios, which have a stronger focus on electrification than in the GA scenario. Note that the ELEC scenario assumes that the demand for methane in end uses is the same as in the DE scenario.
◆ On the other hand, the need for gas for power generation is strongly reduced from around 1,500 TWh in 2021 to around 300-750 TWh in 2050. This is mainly explained by the assumed buildout of RES, even though electricity demand increases in all scenarios. This will be further explored in Section 4.6.
◆ SMR-H2 (with CCS) for the creation of hydrogen still occupies a (relatively small) share in 2036, but disappears completely from 2040 as domestic electrolysis and H2 imports become more economical.
The trends which emerge on the supply side are outlined below.
◆ The full amount of assumed domestic biomethane potential is used by 2040 in both scenarios and is able to almost fully meet the European demand for methane by 2050. However, this implies increasing the amount from around 40 TWh in 2021 to almost 1,100 TWh by 2050, which could prove to be challenging. As such, imports of (fossil) methane are strongly reduced and non-existent in 2050. Note that the small remaining fossil methane can be supplied domestically within Europe, mainly by Norway.
◆ The domestic production and import of synthetic methane (not reported in the figure given it is zero for all scenarios and horizons) proves to not be economically viable when compared to biomethane and local or imported fossil gas (even when the cost of CO2 is high).
4.1.2. HYDROGEN BALANCES
Although no reporting standards exist for the consumption of hydrogen, it is estimated that in 2022, around 260 TWh of hydrogen were consumed/produced in Europe [EUH-3], with the main source of demand being the production of ammonia for fertilizers and for the desulfurisation process in refineries. The production of hydrogen generates a high amount of emissions since 99% of the time it is made from fossil fuels, mainly via steam methane reforming (SMR-H2), but also (to a lesser extent) as a by-product in some industrial processes.
The following changes can be observed on the demand side.
◆ A general increase in the use of hydrogen as an energy fuel, mainly in industry and road transport (especially for the GA scenario). The level of the increase varies across scenarios. As a reminder, the ELEC scenario does not assume any hydrogen usage in buildings and road transport.
◆ Generally speaking, the higher the electricity demand and the lower the hydrogen demand are for end uses, the more hydrogen is used for power generation. This is linked to the fact that more thermal generation is then required in the power system to remain adequate. This could change if more flexibility (storage, demand response) is assumed in the more electrified scenarios but also if less hydrogen-fired power generation is assumed.
◆ Almost no synthetic liquids are produced in Europe before 2040 in any of the scenarios. This is mainly explained by the fact that other parts of the energy system can decarbonise and reach their emissions targets more cheaply without the need to decarbonise their consumption of liquids.
In terms of the projected supply, the following changes are apparent.
◆ Domestic hydrogen production via electrolysis would be able to deliver around 50% of the assumed hydrogen demand by 2036 (this implies around 70-120 GW electrolysers to be installed). This amounts to around 6 Mt-14 Mt, which is close to the ‘RepowerEU’ target of 10 Mt for 2030 for the EU-27 [EUC14].
◆ However, its production stagnates in later years. The GA scenario involves more electrolysis which is driven by the higher assumed end use demand for hydrogen but also lower end use demand for electricity. See Figure 4-24 for the localisation and installed capacities of electrolysers across Europe.
◆ As prices of piped hydrogen and imported ammonia are assumed to decrease over time, these are favoured over SMRH2 and electrolysis to meet the additional demand from 2040 onwards.
ANNUAL SUPPLY-DEMAND BALANCE FOR HYDROGEN
FIGURE 4-2
4.1.3. LIQUIDS
Liquids make up most of the energy and non-energy demand in 2021. This holds true for 96% of refined oil products such as diesel, gasoline, fuel oil, kerosene, bunkering fuels, naphtha, etc. Today, most of the demand is met by imports from outside of Europe, or non-EU countries such as Norway and the UK (included as ‘domestic fossil’ in Figure 4-3).
On the demand side, the following changes are apparent:
◆ In the lead-up to 2050, the demand for liquids in road transport and heating (‘other energy’ in the figure) is assumed to almost entirely disappear, with small levels of consumption of these remaining in industry. This is mainly assumed to be driven by the replacement of heating devices and IC engines by heat pumps and EVs and, to a lesser extent, the use of direct hydrogen (particularly in the GA scenario).
◆ The demand for liquids for international aviation, shipping and feedstock remains relatively stable in the lead-up to 2050, although their supply shifts from oil products to bio and synthetic fuels (see supply side).
On the supply side, the following changes are becoming visible:
◆ Oil products are gradually replaced by bio-liquids; from 2040 onwards, they are replaced by domestic and imported synthetic liquids such as methanol.
◆ Some oil continues to supply areas in 2050, especially aviation (kerosene), shipping (bunkering fuels) and (to a lesser extent) feedstock. This will need to be compensated by CCS in other sectors and/or direct air capture (DAC).
4.1.4. IMPORTS FROM OUTSIDE OF EUROPE
Bringing together the energy balances per energy vector provides an overview of the imports per scenario and target year. In 2021, around 50% of Europe’s primary energy needs were met by imports, of which most are oil products used in industry, transport and heating. In all scenarios, Europe can reduce its energy imports drastically both in absolute and relative terms. This is mainly explained by the following factors.
◆ A reduction in the final energy demand. As explained in Section 3.1.2.1, Europe is assumed to reduce its final energy demand by 38%-43% by 2050, which is mainly driven by energy efficiency measures and electrification.
◆ The electrification of end use does not only reduce its final energy needs but shifts demand away from liquids and gaseous molecules that are mostly imported both today and across the simulated years. In general, as the level of electrification increases (GA, DE, ELEC respectively) and the level of renewable production increases across Europe (see next point), so the requirement for imports decreases.
◆ An increase in the amount of RES in all scenarios is assumed. The increased production of green electricity reduces the need for thermal power plants running on coal (which are assumed to be almost phased out by 2036), methane or hydrogen (in later years).
◆ The local production of (green) molecules lowers the need for imported molecules. For example, the assumed increased potential of biomethane allows the levels of imported methane to be reduced. The production of (green) hydrogen and synthetic fuels lowers the need to import (mostly fossil) methane and oil.
In general, Europe would still need to import around 17% to 22% of its primary energy needs (compared to 50% today), depending on the scenario. However, these imports would no longer arrive in the form of fossil fuels such as coal, oil and fossil gas but would shift towards green molecules such as piped hydrogen, green ammonia and (to a lesser extent) synthetic liquids such as methanol.
ENERGY IMPORTS FROM OUTSIDE EUROPE
4.1.5. TOTAL PRIMARY ENERGY SUPPLY
The primary energy supply can be determined based on the final energy demand, the demand for electricity generation, the demand for transformations between energy vectors and imports.
In 2021, more than 70% of Europe’s primary energy supply came from fossil fuels such as coal, oil and fossil methane. In all scenarios, the need for primary energy decreases and is predominantly met by renewable or low-carbon sources in 2050. Several key drivers can explain this evolution, as outlined below.
◆ A general assumed decrease in final energy demand as already explained above.
◆ The role of electrification in reducing primary energy needs is key, as it mainly replaces fossil fuel-based process such as heating in buildings and internal combustion engines in transport. On the one hand, it decreases the direct need for thermal energy such as methane and/or liquids; on the other
hand, it does increase the need for electricity generation either via RES or thermal generation. As illustrated in BOX 4-1 the net effect of electrification is a general decrease in primary energy needs.
◆ The more electrification is met via RES such as wind and solar PV, the lower the primary energy needs are since electricity generation via thermal sources requires more energy input due to the inherent transformation losses.
◆ The share of fossil fuels used to meet primary energy needs is reduced to less than 10% by 2050 in all scenarios. Most supply is made up by renewables such as solar PV and wind, whereas biomass also has a key role to play both as a direct fuel and as a feedstock for biomethane and liquids. Imported ammonia and synthetic fuels also have a role to play in further decarbonising the sources used to meet primary energy needs.
ELECTRIFICATION REDUCES PRIMARY ENERGY NEEDS AND ALSO CONSTITUTES THE MOST EFFICIENT USE OF ENERGY FOR HEATING AND TRANSPORT
Electrification reduces the need for primary energy but is also the most efficient energy carrier for certain application due to mainly two reasons:
1. There are significantly more efficient technologies available for transport and low-temperature heating compared to conventional technologies. This leads to a two- to threefold reduction in terms of final energy required for the same amount of ‘useful’ energy.
2. Renewable energies predominantly produce electricity, making it the preferred energy carrier across the entire chain. Indeed, converting from one energy carrier to another results in energy losses.
To illustrate these two advantages, the first Figure 4-6 shows the varying efficiencies between energy carriers (including conversion between carriers and transport losses). The results show a combined efficiency for three types of end uses: high- and low-temperature heating, and transport. The efficiencies in the table are indicative as they could depend on factors such as distances, types of technologies, future improvements, and specific cases. However, the conclusion is clear: direct electrification should be the preferred option from an energy efficiency perspective when considering transport and heating demand (even for high-temperature heating).
Building further on the efficiencies for each carrier, the required offshore wind capacity is provided if all low-temperature heating in Belgium were to be electrified tomorrow. This amounts 7 GW offshore capacity. Doing this via
another carrier such as hydrogen would require at least 5 times more offshore wind capacity to be built. This is illustrated in Figure 4-7.
FIGURE 4-6
FIGURE
The same reasoning is then adopted for road transport. 10 GW offshore wind would be required to electrify all the road transport in Belgium while doing this via another
carrier such as hydrogen would require a twofold offshore wind capacity. This is further illustrated in Figure 4-8.
4.1.6. SUMMARY OF INSIGHTS
Given the assumptions adopted for this study, the results demonstrate certain trends relating to the molecule supply. The key assumptions that have an impact on the supply and demand for molecules are:
◆ the level of biomethane that can be harvested in the future; whilst Europe uses around 40 TWh today, the large potential (>1000 TWh) taken into account for later years is able to meet most of the methane demand. Uncertainties however remain around the feasibility to source such amounts;
◆ synthetic liquids, whether produced in Europe or imported, will depend on their associated costs (but also other elements not assessed in this study such as policy support, targets for certain sectors…);
◆ the amount of electrolysers will depend on the level of the hydrogen demand and price of imported fuels; there is still potential for the development of renewables which has not yet been harnessed in some parts of Europe (such as offshore wind or on the periphery of the continent) that could be used to domestically produce more hydrogen and its derivatives.
WHAT IF THE PRICE FOR IMPORTING MOLECULES WERE TO BE HIGHER OR LOWER?
Given the uncertainty surrounding the price of importing green molecules, an impact assessment is used to explore the impact of different green molecule prices. Two sensitivities are performed at the European level, respectively assuming higher and lower prices for importing molecules.
What assumptions are changed?
As part of this sensitivity analysis, all green molecule import prices are adjusted (including those for ammonia, hydrogen, synthetic liquids, synthetic methane, and synthetic LNG). In the high import price scenario, the central price is multiplied by a factor of 1.5. Conversely, in the low scenario, a factor of 0.75 is applied.
What does the analysis indicate?
Molecule prices directly influence the location of molecule production, as evidenced by Figure 4-9 and Figure 4-10. When import prices are lower, more molecules are imported, leading to a reduction in Europe's electrolyser capacity. Conversely, higher import prices lead to an increase in locally produced hydrogen and, subsequently, an expansion of the electrolyser capacity. Fluctuations in electrolyser capacity directly impact the installed wind capacity: an increase in installed electrolysers prompts a corresponding increase in installed wind capacity. Similar to other simulations, the installed electrolysers in this scenario also remain close to the coast, implying that there isn't a significant difference in terms of the onshore grid.
Regarding the molecules themselves, it is hydrogen which is primarily affected, with a transition from the import of ammonia to electrolysis and pipeline imports occurring in the event of high prices. The impact on methane and liquids is less significant due to the limited alternative options available for decarbonisation.
How does this affect the results for Belgium?
In the low import price scenario, there is no change compared to the reference scenario, since for Belgium nearly all molecules are already being imported in the reference scenario. However, for the high import price scenario, the same trend observed across the rest of Europe is noticeable: a shift from imported ammonia towards pipeline imports of H2 and a slight increase in electrolysis. In total, it appears that an electrolyser capacity of 2 GW in Belgium
(compared to none in the reference scenario) could be viable by the year 2050. The general increase in electrolysis in Europe also explains the shift to pipeline imports in Belgium, since it will become possible to import hydrogen made through electrolysis in other countries (see Figure 4-11). More details about the molecule balances for Belgium are available in Section 5.1.
4.2. SUPPLY AND DEMAND OF ELECTRICITY
Starting from the demand and supply potentials defined in Chapter 3, a multi-energy dispatch and capacity expansion simulation (see Chapter 2) is performed. The results of this multi-energy dispatch in terms of yearly balances for each vector is described in the previous section. This section delves deeper into the supply and demand results for the electricity dispatch for the simulation perimeter (EU27 + NO + CH + UK).
It is important to note that the onshore RES and nuclear capacities are defined ex ante and are not optimised by the model. Several sensitivities are assessed reflecting different future growth options (RES+, PV+, NIMBY, NUC150). Offshore wind capacities and their locations are optimised by the model. Adequacy is always guaranteed via the calibration of the scenarios, and flexibility is associated with the different demand scenarios (DE, GA, ELEC).
4.2.1. EUROPEAN ELECTRICITY SUPPLY AND DEMAND
Figure 4-12 shows the annual supply and demand of electricity, averaged over all simulated climate years in TWh. It can be observed that the electrical demand is assumed to increase significantly across all simulated scenarios. This increase in electrical demand is paired with an even bigger increase in renewables in all scenarios, leading to a significant reduction in the use of molecule-fired generation. However, as will be discussed in Section 4.6, thermal capacities are still essential for keeping the system adequate during moments with low RES infeed.
Increasing the temporal granularity, Figure 4-13 provides a closer picture of the average daily dispatch in Europe (as if it was a copperplate) for a given climate year for an optimised simulation in the DE scenario for 2050 with central onshore RES assumptions.
◆ Firstly, the figure demonstrates that there is a significant period where the demand across the entire simulation perimeter could be covered by technologies with a very low marginal cost and carbon intensity. To enable generation to reach the electrical load, the construction of electric transmission (and distribution) capacity is required. The results presented in Section 4.5 show that the further expansion of the electricity grid is also cost optimal.
◆ Secondly, there are also significant periods of time during which additional electricity generation is needed to cover the demand. Demand and production during these periods are brought into equilibrium in the models through a combined use of demand flexibility, dispatchable generation capacity and storage.
◆ Thirdly, at the European level, solar generation and wind generation are complementary over the year. Indeed, solar sources produce more electricity in summer and wind farms produce more in winter. The challenge is therefore to allow this generation (which is spread across Europe) to be transported to load centres.
◆ Finally, the load, including and excluding electrolysers, is plotted. Electrolysers typically operate during periods when a surplus of low-cost electricity generation is available. Note that during some specific periods, transmission constraints can result in both electrolysers and firm generation operating at the same time in different geographical zones.
FIGURE
As a result of the optimisation performed for this study, Belgium always reaches its maximum domestic offshore potential. Given the benefits of integrating additional offshore wind in the Belgian energy mix (see also Section 5.4.2) shifting the current ambitions of the federal government to reach 8 GW by 2040 to an earlier date is beneficial.
Figure 4-15 provides an overview of the range of offshore wind supplied to the optimiser as well as the capacity which is found to be optimal in all results (which always involves reaching the full potential when it is allowed to invest in it). This is the case across all the scenarios and sensitivities that are performed, and is therefore taken as the basis for all simulations for Belgium, also given its inclusion in the current Belgian ambitions.
OPTIMAL AMOUNT OF OFFSHORE
The amount of offshore wind found to be economically optimal by the model is shown in Figure 4-14. The amount (slightly above 300 GW) is far from reaching the total offshore potential that was defined at European level (>800 GW). When looking at the results per country, only a few countries utilise their assumed maximum domestic offshore potential. Belgium is one of these countries. For the optimisation it is assumed that Belgium could reach a capacity of 8 GW in the model at the soonest in 2040 due to the maturity of the plans around the development of a third offshore zone (or repowering of existing zones). As such the optimiser is constrained to not allow additional investments in domestic offshore in 2036 on top of the assumed initial capacity of 5.8 GW. However, given the benefits that were found in the integration of additional offshore wind in the Belgian energy mix (see also Section 5.4.2) it would also be beneficial to accelerate the buildout of domestic offshore in Belgium to the full assumed potential of 8 GW by or before 2036 (see also BOX 4-3). Across
Europe, 318 GW is installed (with 162 GW in the North Sea) in the DE scenario by 2050. A similar amount, 316 GW (of which 156 GW in the North Sea), is found to be installed in the GA scenario. In the ELEC scenario, a capacity of 332 GW (with 168 GW in the North Sea) is installed.
The model has the potential to invest in dedicated offshore electrolysers fed by offshore wind, provided that this is economically viable. However, this has not emerged as an economically viable option in any of the scenarios. The result of the optimisation shows that all offshore wind that is harvested in the model is connected to the electricity grid (note that electrolysers on an offshore platform connected to the offshore electricity grid are not assessed). However, given the untapped potential of offshore wind in the simulation, there could be use cases or situations where offshore sites dedicated to the production of hydrogen could maybe make sense.
OPTIMAL OFFSHORE WIND CAPACITY FOUND FOR BELGIUM FIGURE 4-15
4.2.3. ZONAL ENERGY MIX
Zooming in from a geographical perspective, Figure 4-16 provides information about the zonal distribution of the electricity generation mix in an optimised simulation in the DE scenario for 2050 with central RES and nuclear assumptions. The figure shows the average energy mix across all simulated climate years. The differences in energy policy – such as nuclear generation being more present in France, UK and eastern European countries, the focus on renewables in Germany, and the use of hydro generation in the Nordics, Austria and Switzerland – can be clearly observed. The offshore wind is pooled per sea basin in the figure for ease of understanding. The size of each pie chart is proportional to the total generation of each zone.
4.2.4. ELECTRICITY FLOWS
The difference in energy mixes along with the correlation and decorrelation of renewable energies and electrical demand result in energy flows across the European transmission grid. A map of the flows is provided in Figure 4-17. The colour of the lines shows how much electrical energy flows across an interconnector (absolute flow - average across all the climate years). The links between zones which are loaded the most bidirectionally are not necessarily the ones which are loaded the most directionally. An example are the interconnectors that connect Spain and France: electricity will flow in a northern direction when significant renewable production is available in Spain. Conversely, electricity will flow southwards during periods of lower renewable generation in Spain.
The figure also depicts the net positions of each zone:
◆ the green zones are exporting zones (the size of these bubbles is proportional to the net exports); it should be noted that the offshore wind connected to the zone and flowing towards that zone is also accounted for in the calculation of the net balance for the zones bordering the seas;
◆ the red zones are importing zones; similar to the exporting zones, the sizes of these bubbles represents the net amount of imports.
5
WHAT ARE THE CONSEQUENCES OF MORE OR LESS ELECTRICITY BEING SUPPLIED FROM ONSHORE SOURCES ACROSS EUROPE?
On top of the Central RES supply scenario which assumes an average installation rate of 50 GW/year for PV and 15 GW/year of onshore wind, several sensitivities are simulated in order to assess the impact of the onshore supply assumptions for electricity. These sensitivities are based on the DE demand scenario and include the addition
of more solar generation, wind onshore generation or nuclear generation. At the same time, a sensitivity with less onshore wind is also accounted for.
The different scenarios are described in Figure 4-18 below.
SENSITIVITIES
IMPACT ON EUROPE
Figure 4-19 shows the final electricity mix for the model’s perimeter for the above sensitivities after optimisation. All sensitivities with higher assumptions for renewable generation result in lower levels of molecule-fired generation. This also further results in lower levels of offshore wind given that more onshore renewables are assumed to be present. When considering the NIMBY scenario (less onshore and more expensive onshore grid), more offshore wind and slightly less electrolysis is found in the optimal solution.
FIGURE 4-16
ABSOLUTE FLOWS AND NET POSITIONS ACROSS THE ELECTRICITY GRID FOR THE DE 2050
FIGURE
FIGURE
EUROPEAN
In addition, depending on the supply mix, a different contribution of CCS/U electricity consumption and electrolysis consumption is obtained. This can be observed in Figure 4-20, where the load factor and optimised capacity of electrolysis is shown. This leads to the observations outlined below.
1. Increasing onshore RES and/or nuclear production while keeping the electrical demand identical results in higher electrolyser capacities. Conversely, reducing the onshore low-carbon production leads to lower installed electrolyser capacities.
2. Increasing the PV capacity beyond the capacities assumed in the RES+ scenario results in marginal additional electrolysis capacity and hydrogen production and slightly lower load factors for electrolysers. The limited effect of adding more PV on electrolyser capacity and production can be attributed multiple factors: first there is the limited load factor of solar. Secondly there is the fact that solar PV produces most of its energy during a limited set of hours in a day in which prices are on average already lower than during the rest of the day in the central RES scenario. Therefore, while the total power of renewable energy that can be harvested by the electrolysers in these hours increases, the running hours (for the same volume of electrolysers) remains relatively stable. Finally, the optimiser also invests in (slightly) less offshore wind than in the RES+ scenario.
3. Compared to the sensitivities where RES capacities are increased (RES+ and PV+), the NUC sensitivity leads to a small reduction in TWh consumed for electrolysis for a lower level of installed capacity. This effect can be explained by the availability of nuclear generation when renewable production is low, resulting in a higher level of equivalent full load running hours.
4. The NIMBY sensitivity is the only sensitivity where less electrolysis capacity is slightly lower compared to the DE scenario. The capacity factor is also lower given less excess of onshore renewables.
HOW DOES THIS AFFECT BELGIUM?
The impact on Belgium in terms of its energy mix is very limited. In terms of electrolysers, it is only in the NUC sensitivity (with an assumed nuclear capacity of 170 GW in Europe and 8.2 GW in Belgium), that a volume of 1 GW of electrolysers is found to be economically viable.
THE RENEWABLE ENERGY POTENTIAL IS NOT EVENLY DISTRIBUTED ACROSS EUROPE
There is an uneven distribution of renewable energy potential across Europe. Depending on the ratio between domestic renewable capacity and the demand for electricity, some areas may have more than enough renewable energy to meet their own demand, while others will need to either import or produce their own alternative low-carbon energy. The left-hand side of Figure 4-21 shows, for the optimal DE 2050 simulation for each zone modelled in the electricity model, the comparison of assumed low-carbon generation (central RES and nuclear) with the final electricity demand. On the right-hand side, the maximum RES potential and central nuclear generation is compared to the final electricity demand including CCS and electrolysers. Note that offshore potential is attributed to the closest onshore zone.
This leads to the following observations:
◆ Areas which have more RES potential than they need are situated in the north and south of Europe or along the coastlines. This is mainly driven by the offshore wind potential in the northern seas and PV potential in the South of Europe. A lot of potential is available across the periphery of the continent in areas like Scotland, Ireland, southern Italy, southern Spain, Finland, etc;
◆ The areas which do not have access to sufficient RES potential to meet their expected electricity demand are situated in central-western Europe, with load centres in the south of England, around Paris, Belgium, the Ruhr basin and the north of Italy. These are either small areas which are densely populated or industrial clusters;
◆ Given the assumptions used in this study, Belgium does not have sufficient domestic RES potential to meet its expected electricity consumption levels. This will be further explored in Chapter 5, in which multiple options are identified to cover the additional electricity supply arising from electrification.
RES POTENTIAL VS ELECTRICITY DEMAND FOR THE DE2050 SCENARIO FIGURE 4-21
4.3. INTERACTIONS BETWEEN ENERGY VECTORS
4.3.1. SANKEY DIAGRAMS FOR EUROPE
In the lead-up to 2050, the electrification of final demand is assumed to strongly increase. The volume of renewable generation grows significantly while the use of non-decarbonised molecule-fired generation for electricity generation drops. However, the need for dispatchable generation remains, especially during long periods with a reduced volume of renewable generation (see also Section 4.6.1). In addition to the use of molecules for power generation, electrical demand is added by electrolysers which are used to generate synthetic molecules when electricity prices are
low compared to hydrogen prices. This happens typically at times when a decarbonised electricity supply surpasses demand. An overview of this is provided in Figure 4-22, in which interactions between the European electricity, methane and hydrogen systems are highlighted in the so-called ‘Sankey’ diagram. Another noticeable change from 2036 is the reduction in liquids for the final energy and more linkage between the molecules themselves (ammonia, hydrogen, liquids, methane).
4.3.2. INTERACTIONS BETWEEN THE ELECTRICITY SYSTEM AND THE OTHER VECTORS
Figure 4-23 provides a more detailed picture of the interactions between the electricity system and the molecule system. There are basically two processes that involve a coupling:
◆ Power plants using gas (methane or in the future hydrogen);
◆ Production of hydrogen via electrolysis.
Firstly, the use of molecules for electricity generation is expected to decrease in the later years covered by this study. Indeed, the amount of gas used for power decreases from around 1,500 TWh today to values between 500 to 1,000 TWh in 2050 across all of the scenarios. To contextualise this, currently gas is used to meet 17% of the total electricity demand; this value would decrease to between 5% and 9% in 2050 (accounting for both methane and hydrogen).
Secondly, very little electricity is currently used to produce molecules. In the 2050 scenarios, electrolysis amounts to 330 to 740
TWh, or 5% to 13% in 2050 when compared to the total electricity demand.
Summing both percentages together provides an indication of the total coupling between the electricity and molecule systems (in terms of electrical energy). For the ELEC and DE scenarios, the coupling between the methane and hydrogen system on the one hand and the electricity system on the other hand decreases. Starting from 17% in 2023, it decreases to around 13-15% by 2050. For the GA scenario, a stable/slight increase in coupling is observed, from 17% today to 18% in 2050. In general, the coupling between the electricity sector and the methane and hydrogen sectors remains relatively stable or slightly decreases. More electrified scenarios result in a decrease in coupling. It is important to note that this reasoning is based on the amount of energy that is used to transform molecules into electricity or electricity into molecules and not on the capacity.
INTERACTIONS BETWEEN THE ELECTRICITY AND MOLECULE SYSTEMS
WHERE ARE ELECTROLYSERS LOCATED THROUGHOUT EUROPE?
For each of the European scenarios and sensitivities, the electrolyser capacities and locations are optimised on a zonal level (see Section 2.3). Both onshore and offshore electrolysers are considered for this optimisation. Figure 4-24 shows how much and where (in both the DE and GA scenarios) electrolyser capacity is optimally integrated into the system in the 2036 and 2050 simulations.
In the more molecule-oriented (GA) scenario, a capacity of 180 GW electrolysers is reached for the entire simulation perimeter in 2050. In the DE simulation, about 120 GW is integrated by 2050. The optimiser chooses to integrate electrolysers in areas with a relatively high share of available low-carbon energy when compared with the local electricity demand (see also Figure 4-21). Those are situated mainly at the close-to-shore zones in areas with
excess wind (Northern Europe) or in areas with excess of PV (Southern Europe). If those electrolysers were to be placed further away from those zones, this would result in additional electricity infrastructure capacity required across Europe.
Given Belgium’s relatively limited local RES potential compared to its assumed consumption, no or very little electrolysers are installed in Belgium. Only the GA scenario results in about 1 GW to be installed in Belgium by 2050.
On top of the visualised capacities, an additional capacity of around 20-30 GW of electrolysers was found in the Nordics and around 5-10 GW was found in the South of Europe for 2050.
4.4. MANAGEMENT OF EMISSIONS
4.4.1. CHANGES IN GHG EMISSIONS
It is assumed that Europe reaches net zero by 2050 in all simulated scenarios. The full scope of GHG emissions is taken into account either through ex ante assumptions for non-modelled emissions (such as LULUCF, Non-CO2 and process emissions) or by explicit modelling and quantification within the model (for energy-related emissions).
First, the emissions trajectory is defined ex ante for the base scenario, assuming a reduction of 55% by 2030, 90% by 2040 and net zero by 2050. The non-CO2 emissions and LULUCF emissions are defined following the S3 scenario of the EC (see Section 3.1.5 for more information).
The changes in emissions per sector are depicted in Figure 4-25 for both historical and simulated years. Note that all scenarios follow the same total net emissions trajectory, as this is set as a constraint in the model. In this view, it can be seen that energy emissions (i.e. from the combustion of fuels) are almost fully phased out by 2050. The remaining energy emissions mainly stem from the use of synthetic fuels; from a ‘net’ perspective, these are compensated by the fact that their emissions were previously captured either via carbon capture in industry, power generation or via direct air capture (DAC). Depending on the source
of feedstock not all biofuels are also assumed to have net-zero emissions. Emissions such as those from (industrial) processes and other GHGs such as CH4, NO2 and F-gases constitute less than 25% of total emissions in 2022, but amount to close to 70% of the remaining emissions in 2050. These are typically hard to abate even after the application of new technologies or fuel switching and will also require abatement in the form of CCS and/or LULUCF.
Focusing more specifically on the changes per sector, the power sector is almost fully decarbonised by 2036. The remaining emissions in the power sector are mainly linked to methane-fired generation as most coal in Europe is assumed to be phased out by 2036. By 2050, the buildings and domestic transport sectors are also nearly entirely carbon free. This is mainly driven by their electrification and the replacement of fossil fuels towards electrification (more so the case in the ELEC scenario) and because the remaining gaseous and liquid consumption will have mainly switched to bio and synthetic alternatives. The main sector in which emissions will still be high in 2050 is the industrial sector. This can be attributed to process emissions that do not depend on the type of fuel used. However, a lot of this remaining CO2 is compensated by carbon capture (see next section).
CHANGES IN TOTAL GHG EMISSIONS IN EUROPE PER SECTOR
4.4.2. CARBON CAPTURE, USAGE AND STORAGE
As explained in Appendix C, the model can choose to invest in carbon capture, storage and/or usage technologies (CC) if these are deemed to be financially viable and/or are required to meet the European emissions target.
Examining the captured carbon more closely (see Figure 4-26) leads to the observations below about the source of carbon captured:
◆ Most CC is installed in industry, mainly for the capturing of process emissions in the mineral, metals and cement sectors, and also in heat-based processes where CO2 is emitted during combustion;
◆ Direct air capture (DAC) is a relatively expensive technology for the abatement of emissions; however, from 2040 onwards and mainly in 2050, it will be required to compensate for
some emissions that are practically impossible to completely remove (such as some non-CO2 emissions);
◆ CC in power and SMR-H2 is limited during the whole time horizon, which can mainly be explained by the relatively low amount of running hours of gas-fired power plants (which reduces their economic viability of being fitted with CC).
The captured carbon is either stored or used:
◆ it is mainly stored underground in 2036 while it is also used to produce feedstock and synthetic fuels in later years;
◆ when the carbon is stored underground or used as feedstock for the creation of chemical products, this produces negative emissions; in cases where carbon is used for energetic synfuels, the carbon is emitted during combustion.
WHAT IS THE IMPACT OF HIGHER OR LOWER CO2 TARGETS?
While the base scenario assumes a 90% reduction by 2040 in carbon emissions across the entire European perimeter, two sensitivity analyses are conducted. One assumes a less ambitious 80% reduction by 2040 (and hence a reduction of -70% in 2036 instead of -76%), while the other reflects that non-CO2 emissions may not decrease as projected, coupled with the possibility that LULUCF may not be able to offset the emissions as anticipated. This last sensitivity implies a higher CO2 reduction in the energy sector. This is further detailed in Appendix H.
Impact of a reduced carbon reduction target on energy measures
When the carbon reduction target is lowered for the years 2036 and 2040, the new target is generally achieved with less CC. The following observations therefore hold:
◆ Figure 4-27 reveals that there is a reduced need for carbon capture and storage measures. The cap on carbon storage is not reached in these instances. In 2036, the only carbon capture incorporated is for SMR-H2 operations. This is because the application of CCS alongside SMR-H2 is inherent to the model.
◆ The model opts for reduced investment in wind and electrolysers, as hydrogen can now be produced via SMR-H2 The preference for increased SMR-H2 production in 2036 and 2040 is directly tied to the carbon reduction target. Furthermore, by 2040, the need to produce domestic synthetic liquids diminishes due to the reduced need to lower CO2 emissions in liquids. However, in 2050, when the target aligns with the base scenario of net zero, SMR-H2 is no longer used.
◆ Methane and liquids continue to be entirely based on fossil fuels as illustrated in Figure 4-28. This increases Europe’s dependence on countries that supply oil and gas compared to the base scenario.
This analysis highlights the impact that a 10% reduction in the greenhouse gas target, from 90% to 80% by 2040, can have on the EU’s energy system.
Challenges related to achieving targets when non-CO2 emissions do not decrease as anticipated If non-CO2 emissions do not decrease as anticipated, achieving the target becomes more challenging for the energy sector. The following trends are observed:
For methane, the transition to domestic biomethane occurs from 2036 onwards, rather than only from 2040.
◆ The primary difference lies in the balance of liquids, particularly in 2040, where more synthetic liquids are imported to compensate for the increased emissions in other sectors.
◆ By 2050, an increased amount of underground CCS is required to offset the unavoidable emissions.
◆ In 2036 and 2040, slightly less carbon capture is required due to the increased emissions which drive up the amount of invested wind power and augment the import of synthetic molecules from outside Europe.
OVERVIEW OF GREEN AND FOSSIL MOLECULE IMPORTS VS. DOMESTIC PRODUCTION FIGURE 4-28
SOURCE OF MOLECULES
Impact on investment decisions for the electricity system
In 2050, both the reduced target scenario and the high non-CO2 emission scenario result in a grid which is similar to the grid found in the DE scenario. However, the paths to achieving this outcome vary significantly, as depicted in Figure 4-29.
Under the reduced target scenario, grid and offshore wind investments progress at a noticeably slower pace, with strongly reduced wind and grid investment in 2036 and 2040. This leads to the need for substantial investments to be made in offshore wind capacity between 2040 and 2050.
By contrast, under the high non-CO2 emission scenario, greater wind investment occurs up until 2040. This is to offset the additional non-CO2 emissions, where the difference is more significant up until 2040.
In conclusion, the results of the model show that the establishment of more stringent intermediary targets requires an acceleration in investments related to the grid, offshore wind, and CCS (amongst other areas). Despite these efforts, the final outcome results in a similar situation to those which develop in less stringent scenarios. However, it's crucial to understand that the carbon emissions over a specific period are what truly matter, not the 'instantaneous' carbon emitted in a particular year. Indeed, the journey towards the final target is just as important as the final target itself. The difference between -80% and -90% reduction pathways towards 2050 results in an additional 5 gigatonnes in the atmosphere in 2050.
4.5. EUROPEAN ELECTRICITY GRID
The European electricity grid is optimised as part of the optimisation process followed for each scenario (see Chapter 2 for more explanation of the methodology adopted). This optimisation provides insights into what the European high-voltage electricity grid would look like if it could be optimised by a (simplified) central planner and in a zonal set-up (big countries are split into multiple zones to reflect the grid physics). The optimisation minimises the costs at the European level (no indicator of zonal or country benefits was taken into account), meaning it invests in the different reinforcements if these reduce European system costs.
4.5.1. IMPORTANT ELEMENTS FOR THE INTERPRETATION OF RESULTS
The following points need to be kept in mind when interpreting the results:
◆ The geographical granularity and flow-based approach used in this study raises the possibility of identifying key trends about cross-border transmission for each scenario. The results also provide (partial) insights into reinforcements within each country. It's crucial to note that depending on the market design (like bidding zones or other rules for cross-border capacity calculation and allocation) or other constraints which are unaccounted for, different reinforcement needs may arise;
◆ Complementing the previous point, additional calculations are performed to analyse the need for internal reinforcements (corridors) in Belgium which consider the current market design. This additional analysis is performed for all Belgian sensitivities since, depending on the scenario, the need for reinforcements to the internal backbone emerges and the need is accounted for in the Belgian system costs. These results are further discussed in section 5.7;
◆ In addition, while the charts in this section provide graphical illustrations of potential reinforcements, these reinforce-
ments could deviate from the illustrations shown in the current study as they are designed in more detail. However, if the projects fall within a strategic corridor that was put forward by the optimisation model and if their potential is confirmed by the investigations, they are very close to the theoretical optimal solution and their realisation should be pursued;
◆ It is important to note that while a cost optimal solution can be found, many other constraints are not accounted for in the model such as spatial constraints, the willingness of countries/zones to develop projects, NIMBY approaches, routing constraints, national/zonal benefits, financial constraints, etc;
◆ For Belgium, the ‘current policy’ scenario is used as input for the European optimisation (no nuclear after 2036). The amount of non-domestic offshore wind connected to Belgium is not capped and could reach values beyond the maximum potential beyond the Belgian EEZ boundaries (see 3.2.3.4);
◆ Finally, when multiple scenarios show the same key trends, these investments are likely to bring value to society independently of the scenario that finally materialises.
4.5.2. OPTIMAL EUROPEAN GRID FOUND
Figure 4-30 depicts the resulting grid for the DE scenario for the years 2036 and 2050. The following observations can be made:
◆ A large amount of the grid needs to be further developed over the coming decade. Indeed, the rate of increase in infrastructure capacity is more than two times higher between now and 2040 compared with between 2040 and 2050. This is linked to the increase in electrification and the increase in renewable generation in Europe (point 1 & 2 in the figure);
◆ A meshed offshore grid is found to be developed by 2036 in the North Sea, showing that such a solution is interesting from a European total cost perspective (BOX 4-8 explores the consequences of doing this via radial connections) (point 3 in the figure);
◆ Finally, the further construction of connections between the British Isles and the continent but also across the Baltic and Mediterranean seas are observed.
In addition to the DE scenario, the GA and ELEC scenarios are also assessed. A comparison between the installed capacities of the grid is depicted in Figure 4-31. A significant expansion in the installed grid can be observed for all scenarios. More electrified
scenarios obviously require more
grids; however, the need remains
scenarios.
4.5.3. RESULTS OF THE EUROPEAN OPTIMISATION AROUND BELGIUM
Having explored the European grid results above, this section provides some insights into results from the optimisation for the grid in and around Belgium. It is important to note that only cross-border results are shown. Internal grid reinforcements and more details about the onshore interconnectors being assessed are explored in Section 5.7. As multiple European scenarios, each with their own full grid optimisation, are analysed, it is possible to assess the number of scenarios in which certain reinforcements appear. Cross-border investments which appear in multiple sce-
narios demonstrate robustness in the face of changes to the assumptions. Figure 4-32 outlines the investments per border and the number of different optimisations they occur in for the target year 2050. It can be observed that the buildout of the offshore grid occurs in all scenarios. Some level of reinforcement happens on the east border in all optimisations, although these vary from 1 GW to 5 GW depending on the optimisation. The Belgian grid results are further discussed in Section 5.7.
WHAT IF CERTAIN TYPES OF ELECTRIC (OFFSHORE) CONNECTIONS ARE NOT ALLOWED OR MORE EXPENSIVE IN EUROPE ?
Grid development in different sensitivities
In addition to the main scenarios (DE, GA and ELEC) several sensitivities are applied by adding constraints to the optimisation algorithm. Figure 4-33 provides an overview of the optimal grid obtained in the RAD, RAD+, 400 GW and NIMBY sensitivities in 2050.
In all sensitivities, considerable onshore grid development is observed. However, in the NIMBY sensitivity, this onshore expansion is slightly more limited due to the assumed higher onshore grid costs (and lower onshore
wind assumed). Compensating for this reduction in the onshore grid, the offshore grid is more developed meaning that, in total, grid volume remains similar to the reference case in this sensitivity. This shift is also reflected in wind power with the reduced assumed volume in onshore wind resulting in higher offshore wind volumes being integrated. In the radial-only sensitivities, the model shows a shift to onshore-to-onshore overseas links, instead of hybrid connections to other countries as in the reference case.
The impact of restricting offshore grid buildout on overall system costs
Restricting the expansion of the offshore grid to solely radial connections, or even more stringently to national radial connections, leads to a rise in the overall system cost. This cost increase is mainly driven by two factors. Firstly, offshore wind integration is less efficient as it is confined to land-based transportation, rather than being able to exploit more optimal sea routes. Secondly, allowing only radial connections for new offshore results in interconnections between onshore zones having to be made with direct interconnectors instead of being able to benefit from a meshed offshore grid.
When a forced investment of 400 GW offshore wind is considered, the cost increase for the total system is relatively limited. This is because additional investments in
offshore wind and grid past the optimum, although they result in increased costs, also bring significant benefits which largely compensate for the additional costs. In general a certain asymmetry is observed in the optimisation where pushing the investment loop to invest past the optimum results in a less steep increase in total costs than when investing too little.
Finally, while not presented in the figures, a sensitivity is performed where the total grid is optimised for 2050 without taking into account investments in earlier years. Theoretically this should lead to a more optimal grid for 2050 (but not necessarily in total as the intermediate years are not considered). It is observed that the final grid configuration remains largely the same.
IN COSTS FOR DIFFERENT SENSITIVITIES
4.5.4. MAIN TAKEAWAYS REGARDING THE DEVELOPMENT OF THE HIGHVOLTAGE GRID
The results for Europe as a whole highlight the following points:
◆ major expansion work across the high-voltage grid is found to be needed between today and 2050. The biggest need emerges between 2036 and 2040: +50% compared to the initial grid. By 2050, the growth of the grid amounts to around +75% in total;
◆ the need for this grid expansion is experienced in all scenarios and sensitivities analysed as part of this study. A key driver for the growth of the grid is the electrification of consumption and the increase in RES integrated into the system linked to the net-zero ambitions.
When assessing the impact around Belgium the following becomes clear:
◆ the results show that onshore borders towards the north and east are reinforced (the western border is mainly reinforced via the sea combined with offshore), making these interesting areas to explore further;
◆ a major rise in offshore capacity is also found to be optimal for Belgium (on top of the current policies and considering no new nuclear).
In terms of offshore grid development relevant insights that require further investigation include:
◆ Offshore hybrids and meshing provide greater societal gains at a European level. When co-optimising on- and offshore generation and transmission infrastructure, substantial offshore meshing is selected by the optimiser. Such meshing, of course, relies on the availability of the required technology;
◆ Significant offshore reinforcements across the North Sea appear in the simulations and could constitute a fundamental building block of the future offshore European network. Although the exact locations of those reinforcements can be different across each of the scenarios, they are strongly present in all of the scenarios that allow for offshore meshing;
◆ The construction of additional connections from Ireland and the United Kingdom to the continent, whether through hybrids or through direct interconnectors, also emerges in several scenarios. Other corridors also seem to appear in the Baltic Sea, Atlantic Sea or between islands in the Mediterranean Sea.
4.6. ADEQUACY AND FLEXIBILITY
The adequacy of the power system is guaranteed in all scenarios via the installation of thermal units (on top of all flexibility that was defined ex ante for each demand scenario based on the TYNDP assumptions and on top of nuclear generation). This thermal generation can be methane-fired or hydrogen-fired. The model also
includes the option to add CCS to power generation. Other thermal generation, such as biomass-fired generation and nuclear, are defined ex ante in the scenarios. Biomass is kept constant while a sensitivity is performed with increased nuclear capacities.
4.6.1. REQUIRED THERMAL GENERATION
The amount of thermal capacity across Europe is depicted in Figure 4-35. This is the capacity required for each zone in the model to be adequate. The figure shows the historical split between nuclear, coal, oil and methane-fired units, as well as the amounts for each of the simulated scenarios and the split between nuclear, coal, existing methane-fired and new thermal required.
The peak demand included in the graph is the synchronous European peak, excluding any type of flexibility or storage. The range provided corresponds to the weather variability (e.g. colder/ warmer winters).
The following points can be derived from the figure:
◆ electricity peak variability is expected to increase, linked to the assumed electrification of heat (compared to the historical observations). The peak depicted in the graph excludes any demand flexibility;
◆ the amount of thermal capacity required (assuming that the flexibility in demand and additional storage is developed) is expected to slightly decrease from around 500 GW in 2020 to around 400 GW as from 2036;
◆ depending on the level of electrification, there is a difference of around 100 GW between the GA and ELEC scenarios;
◆ from 2036 onwards, half of the adequacy requirements are met by thermal generation, with the other half met by additional and existing storage, demand flexibility and increased (on- and offshore) RES and additional interconnectors that allow an efficient use of RES across borders;
◆ additional new thermal generation emerges in all scenarios. However, its amount varies depending on the existing fleet and level of electrification. The level of flexibility and level
of interconnection also impact the amount of dispatchable capacity required.
The required new capacity could come in the form of new methane-fired units (with or without CCS), or new hydrogen-fired units. It could also be supplemented by additional new nuclear generation units on top of the ex ante assumption made. Technology-related choices do not need to be taken right now, but adequacy should be monitored over a 10-year period (as is currently carried out for most adequacy assessments in Europe). This will be vital for identifying the need for capacity, the economic viability of existing (and new) generation, and any necessary support mechanisms.
Based on the modelling exercise, several insights can also be provided regarding the technology choices:
◆ The model rarely opts for CCS in power generation due to the decreasing operational hours needed for power plants. This makes the high capital expenditure (CAPEX) associated with CCS less appealing. Moreover, CCS in power generation competes with other CCS applications (like in the industrial sector), from which more value can be derived.
◆ Extending the lifespan of existing units is consistently seen as a cost-effective option due to their lower CAPEX requirements compared to new units. However, the potential availability and price of biomethane, synthetic methane and other applications where methane is used should be factored into the decision-making process.
◆ The decision between installing new methane or hydrogen turbines should be made on a case-by-case basis, considering each unit and location as well as the availability and price of synthetic or biomethane and required (new) infrastructure. The model tends to favour the installation of hydrogen units in most locations, since the potential of domestic low-carbon methane is being used for other end uses.
4.6.2. GENERATION CHARACTERISTICS OF THERMAL UNITS
In all scenarios, the amount of running hours of different molecule-fired thermal technologies is expected to decrease compared with today. However, these dispatchable capacities remain needed to cover sustained periods of low RES infeed. The need for dispatchable capacities will need to be closely monitored in each country / across Europe as it will depend on the level of flexibility that can be activated, the interconnectors, changes in electricity consumption and the amount of renewables (and their type) in the system.
Dispatchable capacities do not run very often given their high marginal cost. Periods during which low amounts of RES are available mainly occur in winter and are typically driven by low wind infeed. Indeed, during the rest of the year, electricity consumption is lower and PV generation, wind generation and storage combined allow consumption to be covered most of the time.
Figure 4-36 shows the duration curve of the share of the load covered by thermal generation in Europe (produced from methane or hydrogen):
◆ While dispatchable capacities do not run often, it is possible that they run at different moments within the year (explaining that there is some thermal generation running around 50% of the time);
◆ The highest hourly share of dispatchable generation found (compared to the electricity load) is between 25% and 40% across the different sensitivities;
◆ Dispatchable generation is used less often when considering more onshore supply.
Figure 4-37 depicts the thermal generation distribution over an entire year for Europe. The seasonality effect can be clearly observed with the generation happening almost exclusively dur-
ing the winter months. This analysis excludes any requirements to keep dispatchable generation for other reasons (e.g. redispatching, balancing…).
IMPACT OF MORE FLEXIBILITY IN THE EUROPEAN POWER SYSTEM
The demand flexibility and storage capacities are defined ex ante in the different scenarios. Those are based on the TYNDP2024 and are linked to the demand scenarios.
◆ To evaluate the effect of enhanced system flexibility, a sensitivity analysis is conducted for the DE scenario, in which the energy content of storage and demand flexibility is doubled. The main impacts observed are as follows:
◆ Less thermal generation is required in order to comply with adequacy at European level. This also results in a reduced need for CCS visible in Figure 4-39.
◆ Figure 4-38 shows the grid in the high flexibility scenario. As the same amount of offshore wind is installed (in total 134 GW of new wind capacity), a similar investment in the offshore grid is observed. However, there
is a decrease in onshore grid investment as additional renewables can be temporarily stored at their production sites, reducing the need for immediate transportation.
◆ With increased flexibility leading to the more efficient integration of renewables, there is a decrease in the installation of electrolysers, with only 105 GW installed across Europe. This trend is further illustrated in Figure 4-39.
◆ There is a decrease in the amount of curtailed energy from renewables. As can also be concluded from Figure 4-39, the capacity of renewables in the system is equal; however, the total generation of renewables is greater in the high flexibility scenario due to lower curtailment.
4.7. SYSTEM COSTS ACROSS THE DIFFERENT SCENARIOS
The total costs of the energy system are presented in this section and include the capital expenditure costs (CAPEX), operating expenditure costs (OPEX) and fuel costs associated with the final energy use of energy carriers and energy-related investments in three end user sectors (industry, transport and buildings). Fiscal costs, such as taxes, subsidies, levies, and redistributions are excluded from the system costs. All investment costs are annualised over the assumed technical lifetime of the asset. The annualisation follows a normative depreciation and actualisation approach, where a constant WACC (with sensitivities) is assumed
invariant of the technology. This approach excludes considerations of contractual structures or market interventions, e.g. price guarantees, but supports the key objective of the study to compare alternative energy mix scenarios from a system point of view (in contrast to individual project’s/investors’ point of view). All costs are expressed in real euros and have been adjusted for inflation to 2022 values. The annuities stemming from already made investments are assumed to be the same as the annuities of the first modelled year. Also see Section 2.4. and Appendix F for more details.
4.7.1. TOTAL ENERGY SYSTEM COSTS INCLUDING END USES
This section includes OPEX and CAPEX annualised to a WACC for:
◆ the power system;
◆ the other vectors (molecules);
◆ the end uses investments in industry, transport and buildings.
In order to compare the different scenarios, the total system costs in billions of euros per year for the whole of Europe are depicted in Figure 4-40. The split between the different cost categories is also included. The values relate to annual spending amounts, including the yearly CAPEX over the assumed technical lifetime of each asset and assumed WACC, OPEX, and network costs. Note that fuel costs are included in the power and molecules costs, but excluded from end uses. More information on the methodology used can be found in Appendix F.
Compared with the gross domestic product (GDP) of the entire region (a bit less than €20,000 billion in 2022 [EUC-15] [NOG-2]
[WBG-1], the costs related to investments and operational costs of the system (which include investments in energy efficiencies such as insulation of buildings, acquisition of new cars or charging infrastructure) would represent around 10% to 15% of the total GDP of Europe. Note that these costs do not include CO2 prices.
In all scenarios, the cost for end-use sectors generally accounts for the largest relative share of the total cost. The primary drivers in these sectors are the costs associated with renovations and the replacement of heating devices in buildings, as well as the necessary investments for renewing the vehicle fleet and rolling out new infrastructure, such as electric vehicle charging stations. Moreover, the scenarios which involve a higher level of electrification require lower annual spending. A higher degree of electrification requires more investment in the power system for grid, (backup) capacity and operational costs; however, this is more than compensated for by the fact that the reduced amount of required domestic and imported molecules reduces the cost of the molecule system. Additionally, the GA scenario assumes some end use technologies that are relatively more expensive, such as fuel cell vehicles and hydrogen heating in buildings.
4.7.2. ENERGY SYSTEM COSTS ONLY
This includes OPEX and CAPEX annualised to a WACC for:
◆ the power system;
◆ the other vectors (molecules).
Figure 4-41 zooms in on the cost of the energy system only (i.e. excluding end uses). It can be seen that the cost of the system does increase even though final and primary energy demand decreases in general for all scenarios (see previous sections). Several trends can explain the cost evolution:
◆ As explained in Section 3.1.3., electricity demand increases by 75-95% by 2050, depending on the scenario. Most of the
increase is met by new RES sources, mainly via solar PV and wind which take on the main share of required investments. At the same time, new flexible assets such as large-scale batteries and molecule-fired plants are required for adequacy reasons;
◆ Even though the consumption of molecules decreases in all scenarios, the costs remain rather stable over time. This is explained by the fact that these molecules shift from relatively cheap fossil fuels to more expensive molecules such as ammonia, methanol, biomethane, etc.;
◆ CCS/U is a relatively costly but necessary technology required to reach European climate targets for which the cost increases over time;
4.7.3. ZOOMING INTO THE POWER SYSTEM COSTS
This includes OPEX and CAPEX annualised to a WACC for: ◆ the power system (including molecules required to run powerplants).
Figure 4-42 zooms in specifically on the power sector. It can be seen that CAPEX investments in generation assets will make up the bulk of power system costs. Even though fuel costs are
strongly reduced due to the decrease in power generation via molecule-fired power plants (see Section 4.6.), other OPEX costs (such as for generation assets) do increase. As explained in Section 4.5, the optimisation leads to an expanded onshore & offshore transmission grid which, however in terms of total power system costs, these investments remain limited as compared to other cost components. The main grid expansion costs are located at the distribution level, mainly due to the electrification of heating and vehicles at the DSO-level.
In general it can be observed that the more electrified scenarios show lower total system costs for the energy subsystem. While these scenarios require higher spendings in the power sector this is more than compensated for by the lower spending elsewhere in the system resulting from the overall lower molecule demand. In 2050 the difference in Energy system costs between the most electrified (ELEC) and most molecule-focused (GA) scenarios amounts to 70 Beur per year. Comparing this to a reduction in total system costs between these scenarios (see figure 4-40) of 190 BEur it can be observed that the difference in costs in the Energy sector amounts for more than one third of the reduction. The other two thirds in reduction result from the reduction in end-uses costs.
Comparing the different scenarios it can be observed that the higher degree of electrification, the more costs are located in the (electric) power system. As observed in figure 4-40 these additional costs are more than compensated for by a reduction in costs in other sectors of the system. The key differentiator for power system costs are the OPEX & fuel costs. These costs are strongly related to the use of molecules in electricity generation which could be further reduced by the integration of additional flexibility and/or renewable generation in the electricity system.
4.8. KEY TAKEAWAYS
As we approach 2050, a significant amount of uncertainty remains concerning both the supply and demand of each energy vector. As is currently the case, the demand scenarios to be pursued towards 2050 for the energy system should be jointly defined across all energy vectors. However, due to the decreasing interplay between the electricity and molecule systems in the future (in share of energy), the design of the electricity system (i.e. supply and infrastructure) can be largely separated from the molecule system. Additionally, the points of intersection between the different vectors should be jointly evaluated in terms of location (as is the case today for power plants).
The question of whether the supply of molecules will be imported from outside of Europe or produced domestically is a significant uncertainty. Based on the sensitivities and simulations carried out, it seems that this will hinge on the prices of imported synthetic molecules and the economic viability of electrolysers (linked to the available surplus of low-carbon supply within Europe). Factors like energy dependency and other geopolitical considerations could also influence this decision, potentially leading to an increase in domestic production. The simulations reveal that there is still untapped offshore potential that could be harnessed for this purpose once the electricity supply has been sufficiently decarbonised.
It is therefore important to note that without a surplus of electricity in certain areas, producing hydrogen via electricity in these areas may not make economic sense due to the fact that there is insufficient electricity to meet the demand. Areas with electricity surpluses should be prioritised in terms of the generation of green molecules. This approach would not only benefit the system by producing molecules at a lower cost, but could also avoid the need to invest in additional electricity grid to import the energy to be used for the production of green molecules.
Even in a future system which is dominated by renewable energy, dispatchable generation will still be necessary. Although the required thermal dispatchable capacity remains similar to today's levels (despite the peak load capacity almost doubling), the underlying assumption that several newly electrified appliances are expected to be flexible and that more storage will be installed is key. Greater flexibility (long-term storage, demand
flexibility) could further reduce the need for thermal generation and may even help to avoid the need to build new units in the short term. However existing installations are also getting older and there will be a need to replace those as well. Similarly, new nuclear generation units could provide the needed thermal generation (and also provide low-carbon energy) instead of building new molecule-fired thermal generation units. The results show that it is typically more beneficial to continue operating existing units using methane and greening the supply of methane, rather than switching to hydrogen, as this would require investing in new infrastructure (power plants, grid). However, such conclusions should be drawn on a country-by-country and location-specific basis. Carbon capture and storage (CCS) for power generation is, however, very limited.
The key takeaways for the Belgian electricity system are the following:
◆ a potential third offshore zone in the Belgian EEZ (to reach 8 GW in total) is always selected by the optimiser; indeed, with the zone being situated close to the coast and given the undersupply of electricity in Belgium, this would be a very appealing option from a financial point of view;
◆ additional onshore interconnectors are found to be optimal for Belgium (when optimising those for European system costs):
- additional capacity with the Netherlands (HTLS reinforcement);
- additional capacity with Germany in the DE, ELEC scenarios;
- additional capacity via the offshore interconnectors developed.
◆ a very limited amount of electrolysers (mostly none) is found to be optimally installed in Belgium. Up to 1 GW in the GA scenario and up to 2 GW in the high European NUC scenario; this is an important outcome, since more electrolysers in Belgium implies more consumption, while the country’s potential for domestic RES generation is limited (see the next chapter for more insights about this).
5.1.
5.5.
5.6.
5. RESULTS FOR BELGIUM
This chapter outlines the results for Belgium. The first part of this chapter explores the multi-energy carrier results. The focus then shifts to the Belgian electricity system (supply options, grid and other aspects of the system). It is important to note that the simulations performed in this study start from 2036 onwards and are based on the scenarios outlined in previous chapters. For an overview of the different options simulated for Belgium, Figure 5-1 provides a summary of the different combinations of sensitivities simulated in this study.
In terms of demand:
◆ 3 scenarios are simulated (DE, GA, ELEC) for all combinations of RES, non-domestic offshore and nuclear;
◆ 2 additional sensitivities are defined. the 'SUFF' sensitivity is used to quantify the impact of sufficiency measures on system costs while the 'HEAT' sensitivity investigates the impact of additional district heating in 2050.
In terms of supply options:
◆ For each target horizon, three domestic RES sensitivities are performed:
- Central RES, which reflects the current policies;
- High RES, which increases the amount of PV and onshore wind;
- High RES and very high PV, where the installation rate of PV is almost quadrupled compared to the central scenario.
◆ Secondly, the combination of non-domestic offshore (or ‘farout’ RES) and new nuclear options is simulated according to the potentials assumed for each target year in this study. For each target year, several combinations covering the range of options are simulated.
◆ In addition, for the intermediary period, three sensitivities (for each of the combinations of non-domestic offshore and new nuclear) are simulated. These cover the extension of Doel 4 / Tihange 3 beyond 2036, and an additional 1 or 2 GW on top.
◆ Other sensitivities related to adequacy and flexibility are also outlined in the study.
Given the large amount of combinations and sensitivities (over 300), the most relevant are depicted in Figure 5-1, with non-domestic offshore wind capacity along the x-axis and new nuclear capacity along the y-axis.
5.1. MULTI-ENERGY RESULTS
The multi-energy vector results for Belgium are explored first. Similar to the approach for Europe in the previous chapter, the model is able to combine the supply and demand for each energy vector. The results presented in this section include the main DE, ELEC and GA demand scenarios in combination with the central electricity supply scenario (no new nuclear, ‘central’ onshore RES and optimised offshore wind). Note that ‘net’ imports and exports are shown in the figures, meaning that the absolute imported and exported values can differ. For more information about the definition and interactions between the different energy vectors, see Section 2.3.2.
5.1.1. YEARLY METHANE BALANCES
Today, methane is mainly consumed for the provision of heating in buildings, industrial heat as a feedstock for the creation of hydrogen (via SMR-H2) and for power generation in gas power plants. With no natural resources of fossil gas and very limited biomethane production (~0.1 TWh in 2021), nearly all methane consumed originates from imports either via pipelines or via LNG.
The trends which emerge on the demand side are outlined below.
◆ In the lead-up to 2050, methane demand decreases, mainly due to the phase-out of gas usage in end uses such as heating in buildings, and process heat in industry. This effect is stronger in ELEC and DE than in GA (in that order). On the other hand, methane for shipping purposes becomes relatively important (up to 40 TWh in 2050), and becomes the main source of methane demand for Belgium in 2050.
◆ In 2036, in the absence of nuclear generation and despite the strong rollout of RES, methane remains important for power generation in all scenarios, after which (due to the addition of more RES) this need is reduced in 2050. These required volumes strongly depend on the considered electricity supply scenario in Belgium. Note that Figure 5-2 demonstrates the results in a situation where no more nuclear capacity exists in Belgium and offshore wind connected to Belgium is optimised. For detailed results related to the required gas for power volumes, see Section 5.4.
◆ The production of hydrogen via SMR-H2 still exists in 2036; from 2040 onwards, this form of hydrogen production is replaced by imports and – to a lesser extent – electrolysis (see next section).
Looking at the supply side, the following changes can be observed.
◆ It makes economic sense in all scenarios to deploy the full biomethane potential (21 TWh by 2050); however, this remains insufficient to meet all domestic demand, subject to the considered demand scenarios, even by 2050.
◆ Belgium will still need to import vast amounts of methane. From 2040 onwards, piped methane could be sufficient to meet demand. Note that this does not necessarily have to imply fossil methane, as many neighbouring countries with far more biomethane potential would be able to export this to Belgium (see Section 4.1.1).
◆ The domestic production or import of synthetic methane is not deemed economically viable in any of the scenarios (including on a European scale; see Section 4.1.1).
5.1.2. YEARLY HYDROGEN
BALANCES
It is estimated that in 2022, around 11 TWh of hydrogen were consumed in Belgium [EUH-3], with the main source of demand being the desulfurisation process in refineries (grouped under End use in Figure 5-3) and the production of ammonia for fertilisers. The production of hydrogen generates a high amount of emissions since 99% of the time it is made from fossil fuels, mainly via steam methane reforming (SMR-H2), but also (to a much lesser extent) as a by-product in some chemical processes.
The following observations can be drawn by looking at the future changes on the demand side:
◆ Hydrogen is used to fulfill demand in end uses such as in the steel sector, for refineries and (to a certain extent) to provide industrial heat. In the GA scenario, there is also some significant demand for H2 in transport.
◆ Hydrogen for power generation carries some importance for fulfilling peak demands. This effect is stronger in the ELEC and DE scenarios (respectively) and in later years, due to the higher degree of electrification. These required volumes strongly depend on the considered electricity supply scenario in Belgium. Note that Figure 5-3 depicts the results in a situation where no more nuclear capacity exists in Belgium and non-domestic offshore wind connected to Belgium is optimised. For detailed results relating to the required gas for power volumes, see Section 5.4.
◆ Ammonia and synthetic liquids produced from hydrogen do not appear to be economically viable in Belgium; instead, the model chooses to import these molecules (see liquids balance).
On the supply side:
◆ Belgium will have to import hydrogen, as the demand for H2 generally increases. In later years especially, it becomes more economically attractive to import hydrogen (via pipelines or in the form of ammonia) instead of using methane (via SMRH2) or electrolysis to produce H2
◆ Electrolysis in Belgium is rather uneconomical, with some installed capacity in the GA scenario (1 GW in 2050), mainly due to the higher demand for hydrogen and lower demand for electricity in that scenario.
◆ Due to the lower overall demand for hydrogen in Europe in the ELEC scenario, there is more availability of electrolysis-based hydrogen in Europe which can be imported via pipelines. In the DE and GA scenarios, this availability of electrolysis-based hydrogen is more limited, with Belgium needing to import hydrogen from outside of Europe (via shipped ammonia).
5.1.3. YEARLY LIQUID BALANCES
Liquids – namely oil products such as gasoline, diesel, naphtha, kerosene, bunkering fuels, etc. – make up the main source of the final energy demand in Belgium. These products are used for energy purposes such as transport fuels, heating in buildings, and process heat in industry but are also used as non-energy feedstock in the chemical sector.
Looking at the future changes on the demand side, the following observations can be made:
◆ The demand for liquids in road transport and heating ('Other energy' in Figure 5-4) is almost entirely phased out due to the near complete phase-out of ICE vehicles and oil heaters.
◆ Liquids used for process heating are assumed to be phased out completely by 2050 as well, being replaced by either gaseous molecules and direct electrification.
◆ International aviation, shipping and feedstock are a relatively stable source of demand in the lead-up to 2050.
This can be explained by the fact that reducing net emissions of these demands will still require liquid fuels. In the future these could however be bio and or synthetic based fuels.
On the supply side the following changes can be observed:
◆ Belgium continues to be significantly reliant on the import of liquids, there is an observable increase in the use of biobased and synthetic liquids at the European level, as detailed in Section 4.1.3 of the report (not shown in this figure). As a result, the country's dependence on imported liquids is gradually shifting away from traditional oil and its derivatives. In other words, while Belgium's relatively high dependency on imported liquids remains unchanged, the nature of these imports is becoming more diversified and less reliant on oilbased products.
5.1.4. IMPORTS
In 2021, around 80% of Belgium’s primary energy needs were met via imports, most of which were products based on fossil fuels such as oil and methane which are used in industry, transport and heating. In all scenarios, Belgium can reduce its required energy imports by 2050 in absolute terms, yet it would remain dependent on imports to meet between 63% and 68% of its primary energy needs. The following key drivers explain the changes in fuel imports:
◆ A reduction in the final energy demand also reduces the need for imports. As explained in Section 3.2.2.1, it is assumed that Belgium will reduce its final energy demand by 25% to 45% by 2050, which is mainly driven by energy efficiency measures and electrification.
◆ The electrification of end use does not only reduce its final energy needs but shifts demand away from liquids and gaseous molecules that are mostly imported both today and in the simulated future years. In general, as the level of electrification increases (rising under the GA, DE, ELEC scenarios, in that order) and the level of renewable production increases in Belgium, so the requirement for imports decreases.
◆ The required need for thermal (backup) generation greatly depends on the considered electricity demand scenario. On the one hand, the increased production of green electricity
via solar PV, onshore and offshore wind reduces the need for methane and/or hydrogen used in power plants. On the other hand, the increased electricity demand increases this requirement, especially in the ELEC and DE scenarios. For detailed results, see Section 5.4.
◆ The local production of (green) molecules remains relatively limited in Belgium. The production of hydrogen and synthetic methane and/or liquids is (nearly) non-existent in all scenarios. It is only the production of biomethane which slightly reduces the need for methane imports.
◆ In general, Belgium’s dependence on imports remains relatively elevated. However, these imports would no longer arrive in the form of fossil fuels such as coal, oil and fossil gas (not specified in Figure 5-5), but would shift towards including green molecules such as green ammonia, synthetic liquids such as methanol and piped hydrogen in the ELEC scenario.
Belgium will also switch from being a net exporter in 2021 to being a net importer of electricity in the coming years. However, for the years under consideration, the extent to which this is true varies greatly based on the electricity supply scenario considered. Many different combinations of electricity demand, supply and flexibility and their impact on electricity imports (amongst other things) are analysed in detail in this Chapter.
5.1.5. PRIMARY ENERGY SUPPLY
The primary energy supply can be determined based on the final energy demand, the demand for electricity generation, the demand for conversions between energy vectors and imports.
In 2021, around 70% of Belgium’s primary energy supply came from (imported) fossil fuels such as coal, oil and fossil methane. In all scenarios, the need for primary energy decreases and renewables are seen to meet more than 50% of its needs. Several key drivers can explain this change, as outlined below:
◆ A general assumed decrease in final energy demand as explained above.
◆ The role of electrification in reducing primary energy needs is key due to the high inherent efficiency of most electrification technologies. The net effect is a general decrease in primary energy needs, especially when most of the electricity is supplied via RES.
◆ The higher the amount of electrification met via RES such as wind and solar PV, the lower the primary energy needs are, since electricity generation via thermal sources requires more energy input due to inherent energy losses.
◆ Most supply is made up of renewables such as solar PV and wind, whereas biomass also has a key role to play both as a direct fuel and as a feedstock for biomethane and liquids but also for direct usage in certain sectors. Imported ammonia (and hydrogen) also have a role to play in further decarbonising the sources used to meet primary energy needs.
Note that the primary energy supply depends on the considered electricity supply scenario in Belgium; Figure 5-6 outlines the results in a situation where no more nuclear capacity exists in Belgium, under the central onshore RES scenario (see Section 3.2.3 ) and the offshore wind supply is optimised. For detailed analyses relating to the impact of these electricity supply choices, see Section 5.4.
PRIMARY ENERGY SUPPLY FOR BELGIUM
FIGURE 5-5
5.1.6. GHG EMISSIONS AND THEIR MANAGEMENT
The total emissions considered within the scope of this study (i.e. including international aviation and 50% of international shipping) amount to around 121 MtCO2-eq/y. The change in emissions per sector and scenario is depicted in Figure 5-7 for both historical and simulated years.
It is clear that energy emissions (i.e. from the combustion of fuels) are almost fully phased out by 2050. The remaining energy emissions mainly stem from the international aviation and shipping sectors. Emissions such as those from (industrial) processes and other GHGs such as CH4, NO2 and F-gases constitute around 25% of total emissions in 2022, but amount to close to 50% of the remaining emissions in 2050. These are typically hard to abate even after the application of new technologies or fuel switching and will also require abatement in the form of CCS and/or LULUCF.
Focusing more specifically on the changes per sector, the power sector is almost fully decarbonised by 2050. By 2050, the buildings and domestic transport sectors are also nearly entirely carbon free. This is mainly driven by fossil fuels being replaced by electrification (particularly in the ELEC scenario) and because the
remaining consumption of gases and liquids will have mainly switched to bio and synthetic alternatives. In industry, some emissions persist in 2050. This can be attributed to process emissions that do not depend on the type of fuel used. However, a lot of this remaining CO2 is compensated by carbon capture (CC) (see next section). International transport, which already generated a relatively important share of Belgian emissions in 2022 compared with other European countries, looks to be the main form of remaining energy emissions by 2050, as not (all) fuel usages are switched to green alternatives such as methanol. Ultimately carbon abatement via carbon capture (CC) and a small amount of LULUCF helps to lower overall net-emissions.
As can be seen, a net-zero Europe does not necessarily mean that Belgium needs to reach net zero for its domestic emissions. Depending on the scenario, Belgium could still emit between 11 MtCO2 and 14 MtCO2 in 2050, implying a relative decrease of 91% to 93% compared with 1990 levels (153 MtCO2). The ELEC scenario generally reaches the highest level of decarbonisation in all simulated years.
Figure 5-8 focuses on the carbon capture (CC) volumes in Belgium. As it demonstrates, a decent amount of CC would be economically viable by 2036, especially for the capturing of process emissions in the steel and chemical sectors. From 2040 onwards, CC in the mineral industry (mainly cement) and combustion-based emissions would make economic sense. The decline in captured emissions between 2040 and 2050 mainly stems from the decreased combustion of fuels containing carbon. In the ELEC scenario, there is also less methane combustion in industry compared with the DE and GA scenarios, explaining why there is less carbon captured in the ELEC scenario compared with the
DE and GA scenarios (in which more industrial processes are still fueled by methane combustion).
The model deems the domestic production of synthetic fuels, which combines hydrogen with captured CO2 to be economically viable in Belgium in none of the scenarios. This means that the captured volumes of CO2 in Belgium would need to be transported to other countries, either for underground storage or for usage as feedstock for the creation of synthetic fuels and/ or chemical products. This transport requirement is out of scope of the model used within this study.
*Excluding SMR, accounted under ‘SMR-H2
CARBON CAPTURE VOLUMES PER SECTOR IN BELGIUM
FIGURE 5-8
5.1.7. LINK BETWEEN THE MOLECULE AND ELECTRICITY SYSTEMS
Both molecules and electrons are crucial components of the future energy system. One way to explore the coupling between the electricity system on the one hand and the methane and hydrogen system on the other hand is to evaluate the amount of energy that is exchanged between both systems. Dividing the total amount of electricity generated using methane and hydrogen by the electricity demand quantifies the coupling in the direction from molecules to electrons. To estimate the interaction in the other direction, from electrons to molecules, the energy consumed by electrolysers is divided by the total electricity demand.
Figure 5-9 depicts these couplings for 2021 and for the target years assessed in this study. For each of the three main demand scenarios, all Belgian supply sensitivities are assessed. The sensitivities with the highest total coupling (sum of the coupling in both directions) and lowest total coupling are presented in the figure. Several observations can be drawn:
◆ The coupling decreases over time; starting from 27% in 2021, the total coupling drops to a value of between 20% and 13% by 2036. This trend continues in the lead-up to 2050, with the coupling decreasing by 5 to 10 percentage points in each
demand scenario. The main driver of this reduction is the decreasing use of gas for the generation of power.
◆ Electrolysis occurs in Belgium in the GA scenario only. The amount of electrolysis is very limited for each of the target years.
◆ The coupling between the electricity and molecule systems is for a given supply, on average, the highest in the ELEC scenario. Although more molecules are used in the electricity system, the electrification assumptions used in this scenario result in a more efficient use of primary energy and as such the total primary energy demand for molecules is lower (see also Section 5.1).
◆ While not depicted in the figure, the sensitivities with the lowest level of coupling are found to be those with the most renewable and/or nuclear domestic supply in their assumptions. In these sensitivities, the dispatch prefers the use of these sources as they have lower marginal costs than methane and hydrogen generation. Conversely, the sensitivities with the lowest renewable and/or nuclear domestic supplies rely more on molecules for electricity generation.
COUPLING BETWEEN THE ELECTRICITY AND METHANE SYSTEMS
In addition to the previous analysis, the Sankey diagram (Figure 5-10) depicts the interactions and transformation processes between energy vectors. The left-hand side of the figure depicts the primary supply entering Belgium, whilst the right-hand side depicts the final demand for each vector.
While the energy interactions are limited, the capacity (e.g. the location of power plants or electrolysers) will need to be accounted for when designing the future electricity grid, just as new power plants are considered when they are connected to the grid today.
The figure demonstrates that the only interaction between molecules and electricity in 2021 was the power generation from methane. This is still the case at the time of writing (September 2024). In the future, hydrogen could also be used for electricity generation, but overall, the interaction is shown to decrease (in varying proportions depending on the scenario). Additionally, some electricity could be used to produce hydrogen. However, as determined through various sensitivities and results (see also Figure 5-8), only a very limited amount of electricity (or none at all) would be used for this in Belgium from a European cost-optimal perspective.
In conclusion, this section presents the coupling between the electricity sector and the methane/hydrogen sector in the performed simulations. The coupling of these systems decreases over time in all scenarios. Therefore, it can be argued that the infrastructure design of electron and molecule systems can be decoupled in Belgium. However, attention should be paid to the location of the interactions (power plants and electrolysers).
SANKEY DIAGRAMS
5.2. CURRENT POLICIES AND LEVERS
Building on the findings outlined in previous sections, the electricity system impact assessment can be decoupled from the molecule one. This conclusion is based notably on:
◆ the limited decreasing interactions between the electricity and molecule systems in the future for Belgium;
◆ the limited impact of European sensitivities on the Belgian electricity system (similar need for grid, electrolysers, etc.).
The following sections will focus on the electricity system in Belgium. The interactions with the other parts of the system will be accounted for in the dispatch model (amount of molecules produced or consumed) and their costs will also be assessed.
The Current Policies scenario starts from the approved policies and current ambitions. Section 3.2 includes more details about these. These scenarios were then further quantified through the optimisation process such that an European optimum was reached. These scenarios then form the basis for the results in this chapter. In all scenarios, they include from a supply point of view:
◆ the increase in domestic offshore capacity to 8 GW from 2040 onwards
◆ the extension of Doel 4 / Tihange 3 until 2035 and no new nuclear;
◆ no non-domestic offshore wind accounted for as Belgian supply;
◆ the Central RES scenario for domestic RES (onshore wind, PV, biomass, hydro and offshore wind in Belgium (or the Belgian EEZ);
◆ the Belgian reliability standard is met (hence each sensitivity will always ensure sufficient capacity to meet adequacy requirements);
◆ the development of flexibility (storage, demand flexibility), defined ex ante and stable across the same consumption scenarios; this amounts to >15 GW in 2040 and >20 GW in 2050 across the different demand scenarios;
◆ additional onshore cross-border grid capacity found as ‘optimal’ in the European optimisation (see section 4.5.3) in addition to the approved projects in the latest federal development plan (see Section 3.2.5):
- Reinforcement of the border with the Netherlands, amounting to 1 GW;
- Reinforcement of the Germany-Luxembourg border, amounting to between 1 and 4 GW.
5.2.1. RESULTS IN THE ‘CURRENT POLICIES’ SCENARIO
The results related to current policies and trends regarding RES deployment are depicted in Figure 5-11.
The figure includes the need for thermal capacity, the domestic electricity mix, imports/exports and indicators of ‘oversupply’ through means of ‘number of hours of curtailment’ and ‘low marginal prices’. This last indicator provides an indication of the number of hours during which almost solely RES generation is running in the model. The figure depicts the three demand scenarios (DE, GA and ELEC) in a situation where the Central domestic RES scenario is accounted for and no new nuclear nor new non-domestic offshore supply for Belgium is considered. The first row provides an indication of the current system parameters.
Several observations arise from the Current Policies simulations, as outlined below:
◆ Belgium's net imports are projected to be around 40 to 50 TWh in 2036, increasing to approximately 60 TWh in 2040 and 2050. This is a significant rise when compared with recent years, during which imports have largely equalled exports (barring a few exceptions). The increase in imports over time correlates with a surge in consumption due to electrification, which outpaces the moderate rise in low-carbon generation in Belgium under current policy supply evolutions. Furthermore, a noteworthy increase in the quantity of exchanges is observed in all scenarios, escalating from around 30 TWh to over 100 TWh in 2050.
◆ The new dispatchable capacity required (on top of the already assumed existing units that would remain in 2050 and flexibility options) lies between 1,000 MW and 3,000 MW in 2036 and goes up in 2050 to reach between 8,000 MW and 10,000 MW. This capacity is needed to maintain the adequacy of the system, despite the increase in flexibility (storage, demand flexibility) assumed in the Current Policies scenario. The total thermal capacity required in 2050 lies between 13 GW and 15 GW, on top of the more than 20 GW of flexibility options assumed in the scenarios.
◆ The dispatchable thermal generation generates around 20-30 TWh electricity from molecules in 2036 and 15-30 TWh in 2040 and 2050. This amount decreases over time in most scenarios (when compared to the actuals) alongside the increase in renewables abroad. However, a certain volume remains due to the increase in the thermal capacity which is required and in order to cope with hours during which there is low RES infeed.
◆ The amount of hours during which curtailment occurs (due to excess energy) remains limited (<50 hours in all scenarios) and the amount of hours with low prices (<€20/MWh) decreases between 2036 (over 1,000 hours) and 2050 (less than 1,000 hours). These are hours of curtailment in a ‘perfect foresight’ situation where all flexibility and storage is optimally dispatched. The low amount of hours can be explained by the relatively limited uptake of renewables compared to the consumption of electricity. The assumed uptake in flexibility (DSM and storage) allows curtailment to be mitigated in perfect foresight.
Pursuing current policies without additional measures would therefore result in the need for up to 8,000-10,000 MW new thermal capacity to keep the system adequate and could result in up to 50-60 TWh of net electricity imports and up to 20-30 TWh of electricity generated from molecules in 2050. The amount of RES curtailment would remain limited, however the amount of hours with low marginal prices would increase due to the increase of RES abroad.
ADEQUACY AND ELECTRICITY SUPPLY ARE NOT THE SAME THING
It is important to note that adequacy and electricity supply are two different concepts that are linked but separate. This study focuses primarily on the electricity mix’s contribution to maintaining Belgium’s adequacy. Importing a lot of electricity does not mean that the country cannot maintain the adequacy of its electricity system.
Adequacy is the system’s ability to meet the demand for electricity. It is measured via different metrics such as the loss of load expectation (LOLE) and energy not served (ENS). This implies that there is enough installed capacity across the system in order to cope with consumption. A system’s adequacy is calculated by accounting for all types of electricity resources (including imports) and the ability of other countries to supply the system with electricity during periods of ‘stress’.
The energy output from the electricity installations, which is determined by a European economic dispatch, depends on their availability and variable costs in relation to other technologies within Belgium and beyond. This implies that a country could import a significant amount of electricity annually (due to the economic dispatch from both domestic and international generation), yet still preserve its adequacy by retaining sufficient capacity within its borders.
Figure 5-12 illustrates three important points:
◆ the lead times related to the deployment of different technologies are very different; however, it is important to note that some technologies are also bound by a maximum amount that can be installed per year due to supply chain/workforce constraints;
◆ the indicative contributions of different technologies to adequacy expressed as a percentage of their nominal capacity;
◆ the energy load factor range (or energy contribution) of each technology; the load factor depends on the European economic dispatch for some technologies.
Figure 5-12 also demonstrates that some technologies mainly contribute to adequacy, while others contribute to adequacy in a more limited way. Generally, technologies contributing to electricity supply take longer to develop than those related to adequacy. This is an important factor to consider when the core question is related to meeting an energy supply need.
5.2.2. DOMESTIC LOW-CARBON SUPPLY AND EXPECTED DEMAND
Figure 5-13 combines the Current Policies scenario with the past and expected evolution of electricity consumption and generation in the lead-up to 2050. Electricity consumption (including CCS, electrolysers and losses) is assumed to more than double from ~80 TWh today to a bit less than 180 TWh up to almost 200 TWh by 2050. This consumption includes the resulting need for electricity for electrolysis (if any), grid losses and CCS. Until 2030, current policies cause electricity generation to follow consumption (though short by ~10 TWh) through renewable growth, the operational extension of nuclear plants and fossil gas-fired thermal capacity.
From 2036 onwards, which is the primary focus of this study, Figure 5-13 shows the expected electricity consumption under various demand scenarios (DE, GA, ELEC) versus the electricity generation that follows current policies which are in place (i.e. the renewables due to be installed in line with current trends and ambitions). Molecule-fired generation is not shown as the exact generation will depend on the other choices. The following observations can be made:
◆ A difference of 50-60 TWh in 2036 between consumption and generation - From 2036 onwards, there is a need for about 50 to 60 TWh that has to be met by imports or additional measures, on top of current policies related to renewables.
◆ A difference of 70-90 TWh in 2050 - This need grows over time with the increasing demand for electricity, but is partially offset by more renewables installed, reaching between 70 and 90 TWh in 2050.
◆ Options to meet this need can include:
- reducing demand – Notably through sufficiency measures, which can yield a similar outcome whilst employing less energy-intense methods, by (for example) encouraging renovation and the recycling of building materials;
- increasing supply - This can be achieved by increasing domestic electricity generation or by importing more from abroad; the next subsection will explore possible supply levers in more detail.
ADEQUACY AND ELECTRICITY SUPPLY ARE TWO DIFFERENT CONCEPTS FIGURE 5-12
5.2.3. OVERVIEW OF THE DIFFERENT OPTIONS TO COMPLEMENT BELGIUM’S SUPPLY
Even under the most conservative demand scenario, a supply need of 50-70 TWh remains when considering current policies. To close this need, additional supply is required on top of current policies. This study assesses 5 supply levers which are depicted in Figure 5-14 in addition to sufficiency as a demand lever; these are:
1. Onshore wind farms and solar PV – These are deployed as relatively small, decentralised projects that are typically connected to lower voltage levels and are mostly a regional matter.
2. Nuclear plants – Traditionally, these are very large-scale projects connected to higher voltage levels and require a high degree of government coordination at the federal level. There are two main ways to increase their capacity versus the Current Policies scenario: extend the lifetime of additional existing reactors and/or build new ones.
3. Non-domestic offshore wind farms – Much like nuclear, these are very large-scale projects that require a high degree of government coordination at the federal level. Since additional domestic potential is limited (and is already fully used in the Current Policies scenario), activating these levers means developing non-domestic wind farms in the North Sea or elsewhere, connected through (hybrid) transmission systems. This includes the potential financing/support of these wind farms in order for them to be counted towards Belgian supply.
4. Imports/Exports – This is a consequence of the choices made for the other levers and a result of the European dispatch. However, the level of dependence on foreign supplies should be actively chosen by the government, given its significant implications.
5. Thermal – Molecule-based thermal generation can produce power in Belgium, which would imply importing the needed molecules; however, as these thermal generation methods have high variable costs (compared to other technologies in the European system), their running hours as an outcome of the European dispatch would be limited (see Section 4.6.2. for more details).
Note that this list is not exhaustive: it focuses on levers that can contribute substantial amounts of energy to the supply need. Other technologies are also key for integrating renewables and managing the system. These other technologies include batteries and other storage options which provide temporal flexibility and grids which provide spatial flexibility by connecting generation and loads across the whole continent at different voltage levels.
The concept of far-out baseload RES combines both spatial and temporal flexibility. Given Europe’s high demand for low-carbon energy, some projects which are being investigated involve the building of interconnectors to renewable development in other continents, such as solar and wind in Northern Africa. These far-out RES are beneficial in that they can potentially have higher capacity factors and draughts that are not correlated with domestic ones. Furthermore, one of the most notable examples, the Morocco-UK Power Project by Xlinks, considers combining this with significant storage capacity in Morocco. By using its temporal flexibility, it could offer a more baseload-like profile for the UK's consumption.
Figure 5-15 quantifies the maximum potential energy contribution of each lever (for some split into subcomponents) to closing the supply need, i.e. on top of what the Current Policies scenario includes. Per lever, this comes down to:
Supply levers potential on top of current policies
1. Onshore wind and solar PV
- Onshore wind: going from the Central to the High scenario (+12 TWh in 2050).
- Solar PV: from Central to High (+24 TWh) or Very High (+41 TWh) in 2050. Note that for PV, not all installed capacity will be capable of being evacuated. This will be further assessed in the simulation results and is already accounted in these figures.
2. Offshore wind
- Domestic: all future potential (repowering and potential additional zone(s)) is already included in Current Policies from 2040 onwards: a total of 8 GW is considered.
- Non-domestic offshore: 4 GW could be installed every 5 years from 2036 onwards to reach 16 GW in 2050.
3. Nuclear
- Lifetime extensions: further extension of 2 GW, 3 GW or 4 GW after 2036.
- New builds: up to 8.2 GW considered in 2050, with 2 GW in 2040.
4. Imports/exports Unlike other levers, these are not set in advance, but are rather the outcome of choices made for the other levers and the European set-up.
5. Thermal: Whilst the capacities are set to guarantee adequacy, the actual dispatch depends on the other levers and the situation abroad; Figure 5-15 shows a range across simulated outcomes for different combinations of levers. In 2050, this could amount to between 5 TWh and 30 TWh.
6. Far-out baseload RES Far-out RES is considered as a sensitivity on an ad-hoc basis; this would require building interconnectors to e.g. Northern Africa, like the UK-Morocco Power Project is aiming to do. BOX 5-4 provides more details about the sensitivity.
Demand levers: potential on top of current policies
1. Sufficiency (demand reduction through behavioural changes, modal shifts…): since the range of the need only takes into account the base demand scenarios (DE, GA, ELEC), moving towards the sufficiency demand scenario represents an additional lever.
2. District heating: although not depicted in the figure, a sensitivity analysis is conducted with an increased focus on district heating. This could potentially reduce the need for additional supply for the generation of electricity.
5.3. ELECTRICITY DEMAND
While the final energy demand is expected to decrease in Europe and Belgium, the demand for electricity is expected to rise. Indeed, as explained in previous chapters, the reduction in the final energy demand is mainly driven by electrification as more efficient devices are used for transport and heating. The electrification of heating and transport can also be analysed by looking at the cost it takes to remove a certain amount of carbon from the system when compared with other options. This is discussed in BOX 5-2 through the marginal abatement cost curves. It is clear that the electrification of heat or transport is the preferred option from a carbon abatement cost point of view.
MARGINAL ABATEMENT COST CURVES (MACCS) FOR DEMAND LEVERS
What is a MACC?
Many ways and technologies can be explored to decarbonise energy uses. But which option is the most cost efficient?
A MACC is a tool which is often used as part of decarbonisation exercises which aim to identify the cheapest decarbonisation options within and across sectors and, ultimately, are aimed at devising a successful climate strategy. The tool visually represents the cost associated with achieving each additional unit of pollution reduction, ordered from the least expensive to the most expensive. For comparison purposes, the decarbonisation options are sorted per sector and type of consumption.
This exercise requires several inputs for each technology, such as CAPEX, OPEX and emissions related to the use of the assets, as well as those related to the decarbonisation option which is being considered (e.g. considering the Marginal Abatement Cost for a heat pump is different if it replaces a gas boiler or an oil boiler). All of these are aligned with data used in the framework of this study’s inputs and simulations (price of fuels, CO2 prices…).
These inputs can also change over time. For instance, the cost of hydrogen fuel and technologies is expected to decrease over time, and electricity is expected to have a lower CO2 intensity in 2040 than in 2030.
A MACC exercise is most robust when defining range values for two reasons:
1. the inputs can be prone to uncertainties (the price of hydrogen in the future is uncertain);
2. a decarbonisation option can be applied to different extents. For instance, ‘residential insulation’ could cover the simple replacement of windows or could involve the renovation of a whole house.
Elia asked Sia Partners to construct MACCs for the selected demand-side technologies from a societal perspective (which means considering wholesale prices for fuel costs, which are different from a consumer perspective, and considering other investments required for the decarbonisation option, such as charging points for electric vehicles). The latter include the different options for reducing the use of fossil fuels in buildings, transport and industry, as well as carbon capture techniques. An explanation of the methodology written by Sia Partners is included in Appendix E, as well as associated limits and caveats.
How should a MACC be read?
On the graph, the values in € per tonne of CO2 are displayed as bars. Where relevant, a range is indicated with the whiskers. This range represents high and low values when there are uncertainties in the costs (e.g. a range specified in the literature). When the value exceeds €1,000/tonne, this is indicated with a dashed bar. Some values are negative, indicating that decarbonising is cheaper than not doing it.
The chart is split into several sections:
◆ From left to right, decarbonisations are sorted per (i) sector (buildings, transport, industry and carbon), (ii) assets to decarbonise (e.g. for buildings: oil-fired boiler, gas-fired boiler, energy efficiency), and (iii) options available for each asset (e.g. for gas boiler, you could go to electric heat pumps or hydrogen boilers).
◆ From top to bottom, the exercise has been realised for two time horizons: 2030 and 2040. These exercises leverage baseline data from 2024 & 2030 respectively. So for each decarbonisation option, it is clear how MACC values are expected to evolve through time.
WHAT CAN WE CONCLUDE FROM THE MACC?
A successful climate ambition strategy, for demand-side applications, could then be based on the insights provided by this MACC. Notably that:
1. From an economic point of view, some decarbonisation options are no-regret options, as they save money compared with the base case. This is true in the shortterm for oil-fired boilers, energy efficiency in homes and industry, and in the long-term, for low-temperature heat in industry (heat pumps).
2. Across all sectors, electrification options prove cheaper than their green molecules counterpart. Whether for residential and tertiary heating, person and freight transport, or industrial heat.
3. All decarbonisation becomes cheaper in the future. Heat pumps are a no-regret option in financial terms, with the largest cost reduction expected for heavy-duty vehicles and high-temperature heat for industry.
4. Carbon capture options seem interesting compared to other options. However, they also carry economic and technological challenges.
Further comments on conclusions and insights are detailed more extensively in Appendix E.
5.3.1. SUFFICIENCY AS A LEVER
SUFFICIENCY IN THIS
STUDY
The sufficiency sensitivity explored in this study is based on the EnergyVille SHIFT scenario, part of the PATHS2050 study [EVI-1] [EVI-2]. It assumes a reduction of 30 TWh in energy demand compared to the DE scenario in 2050, as described in Section 3.2.2.
Measures were applied in different sectors:
◆ Residential and tertiary the main measures considered are (i) optimising space and (ii) reducing the heating setpoint (by 1°C). Optimising space corresponds to increased co-living (increasing the average amount of people per house), and sharing office spaces.
◆ Transport whether for passenger or freight transport, two types of measures are applied: (i) modal shift and (ii) increasing occupancy per trajectory (vans load factors or average passengers per trip). For passenger transport, there is an increase in the share of public transport and active modes of transportation (walking and biking), leading to a reduction in the car modal share.
◆ Industry: it is assumed to increase resource efficiency through circularity and a change in the means of production and in the manufacturing model. This assumes optimised product design, reuse and recycling. The reader should note that all these measures cannot be implemented from one day to another. Some can but others require political will and structural changes.
Out of the 30 TWh of energy demand reduction, around 20 TWh are related to electricity by 2050. But this energy demand reduction does not happen overnight. Behaviours are expected to change gradually. Some energy demand reduction can happen fast (as demonstrated in France in 2022, following the sufficiency plan), but other measures need support and policies to materialise. Hence, a distinction can be made between sufficiency measures activated in the short-term and the long-term. As already explored in the most recent Adequacy & Flexibility study:
◆ Certain measures could be implemented in the shorter term and are linked to behaviour changes. Those are estimated to be around 5 TWh in the 2030. A few examples would be a decrease in the heating set point, lower speed limits on highways and a modal shift for short distances (< 1 km). Note that this is similar to the sufficiency plan established by the French Government in 2022-23, where the largest gains happened through lowering heating consumption, and controling lighting waste;
◆ In addition more long-term behaviour changes could lead to another 5 TWh reduction in electricity consumption in the 2030. Some examples would be reducing the average size of cars, and average size of dwellings. These measures need policies to be incentivised and adopted on a longer time frame;
◆ The remaining 10 TWh assumed in this study relies on more systemic changes. These could include notably the use of circularity in industry. Also, measures related to freight transport (modal shift towards train and boat) require structural changes in supply chains that do not happen overnight. Here again, policies are required to encourage and implement these measures over a prolonged period.
IMPACT OF THE POTENTIAL ASSUMED
The impact of the sufficiency sensitivity is depicted in Figure 5-17. The sensitivity applied assumes a reduction of around 20 TWh of electricity consumption and hence includes both shorter term and longer term measures as described above. It is important to mention that the socioeconomic cost of the sufficiency measures is not quantified, as it is still up for debate. Hence the impact shown is the impact on the electricity system costs only. Certain measures could require investments or public support (e.g. more public transportation).
According to the simulations, if all the potential measures are applied:
◆ The costs of the electricity system are reduced by around €15 to €20/MWh;
◆ The net imports can be reduced by 15 to 20 TWh;
◆ The need for additional capacity for adequacy can be reduced by 2 to 3 GW.
Sufficiency does not only impact electricity consumption, the impact on other vectors is also significant, however those were not assessed in the present study.
IMPACT OF SUFFICIENCY ON KEY SYSTEM INDICATORS
FIGURE 5-17
Impact on costs of the electricity system in [EUR/MWh]
5.3.2. PEAK DEMAND AND FLEXIBILITY
While the additional dispatchable capacity needed was calculated for each scenario following a similar approach to the one used in adequacy studies, it is interesting to have a look at the expected peak demand for the electricity system in Belgium. It is important to note that in the future, given the large amount of expected flexible consumption, it is not straightforward to define something like a peak. Indeed the peak demand of the system is greatly influenced by the demand flexibility ‘dispatch’. This will be further highlighted in this section.
YEARLY PEAK DEMAND
Rather than the absolute hourly peak demand, a proxy value to analyse the required additional capacity needed on top of the domestic RES concerns the ‘residual’ demand which is defined here for each day of the climatic year considered as:
The yearly peak residual demand is then obtained by taking the day with the highest residual demand for each climate year. Figure 5-18 shows the distribution of the peak residual demand (calculated as the day with the highest residual demand over the entire year) across the 200 forward-looking climate years used in this study. As such it can be seen that this peak residual demand increases over time and is obviously higher in the scenarios with a higher degree of electrification. The peak demand ranges between 15 and 25 GW in 2036 depending on the scenario and weather conditions during winter. By 2050, the peak demand is projected to increase, reaching between 20 and 30 GW in 2050 (across different scenarios and climate years). Such increase compared to today (around 12-13 GW) is driven by the additional electrification assumed in all scenarios. Another interesting insight that can be derived from the figure is the increased distribution of the peak demand for a given scenario over time. As heating processes become more electrified, the variance between colder and warmer winters significantly influences the peak demand. This effect is even more pronounced when considering scenarios with higher levels of electrification.
FLEXIBILITY ACTIVATION AND RESIDUAL DEMAND
Next to dispatchable capacity, demand flexibility and storage (further referred as 'flexibility' in this section) also has a key role to play in contributing to adequacy (see also BOX 5-6), smoothening fluctuations of demand and allowing a better integration of intermittent renewables. Figure 5-19 illustrates the impact of flexibility and storage on the hourly residual demand for the DE scenario in the year 2050. For this example, the points in the figure are sorted from high to low residual demand for each hour of a single simulation year in the case there is complete lack of demand-side flexibility and storage (black line), the light blue dots show the impact of activated flexibility and storage options in the unit dispatch model for each hour on the black line. In general it can be seen that the activation of demand flexibility and storage reduces the residual demand in hours with (very) high residual demand and vice-versa leading to a flattened overall residual demand curve over the whole period. The assumptions regarding flexibility in the scenarios (storage and demand flexibility) are described in Section 3.2.4.
residual demand (in Belgium) is not the sole driver of flexibility activation. For instance it is possible that the situation is different in other countries or that the marginal prices allow to ‘charge’ batteries eventhough the residual demand in Belgium is high. This can be observed when in some hours the residual demand after flexibility activation is higher than the one without.
◆ When residual demand is low, flexibility is usually used to increase it as those are moments where there is an excess of renewables in the system.
◆ The ‘peak demand’ is not necessarily expected to happen at maximal residual demand. Indeed with large volumes of flexibility (> 20 GW), it is possible that the ‘peak demand’ after flexibility activation is observed during other moments and not necessarily when renewable production is low and con-
It can be observed that:
◆ The latter observation confirms that representing only an hourly peak consumption does not provide a complete view as the hourly peak can happen outside of high consumption (ex ante flexibility activation). A better proxy for ‘peak demand’ is the daily peak demand as the flexibility is mostly able to
DISTRIBUTION OF THE YEARLY PEAK RESIDUAL DAILY DEMAND IN BELGIUM
IMPACT OF MORE HEATING NETWORKS IN 2050
As requested by several stakeholders, a sensitivity assuming more heating networks is assessed. Heating networks are currently very limited in Belgium. In the DE scenario, 3.5 TWh of district heating is already assumed (compared to almost nothing nowadays). This sensitivity identifies the impact of additional district heat (such as heating networks) replacing part of the residential heat pumps. In their study, EnergyVille identified a total technical potential of 24 TWh by 2050, with up to 8 TWh being found to be economically viable according to their model [EVI-1].
The sensitivity considered in this study assumes 15 TWh in order to test a reasonable extreme. Such heating networks could be either supplied via direct heat or combined with heat pumps. The way in which this heat would be supplied is not analysed. The same stands for the costs. The costs of developing such infrastructure and the costs of upstream heat generation are not accounted for in the impact assessment. This is an important assumption that should be accounted for when looking the results.
More heating networks could lead to several benefits:
◆ Reductions in the peak demand for the electricity system and hence the adequacy requirements and local grid requirements;
◆ Re-use of waste heat (e.g. industrial heat) that would otherwise remain unused;
◆ Such a solution could be interesting notably for densely populated areas.
The main impact on the electricity system is reduced electricity demand (if the heating networks are replacing electrified heat), hence impacting imports and adequacy needs. A smaller part is also attributed to the local grids (lower peak demand).
Figure 5-20 summarises the results for electricity system costs, net imports and adequacy requirements. It is however important to mention that the additional costs related to the heating networks (deployment, construction) and to the supplied heat are not accounted for. Those should be accounted for when performing a full cost-benefit analysis of the solution (which was out of scope of this study). One can conclude that given the large benefits, such technology and solutions should be further investigated.
5.4. ELECTRICITY LONG-TERM SUPPLY OPTIONS
With the expected growth in electricity demand, Belgium has the opportunity to steer what its future electricity supply mix looks like. Several supply and demand levers were identified which could be activated if desired. In this section a quantitative assessment of the effect of each of these levers under a diverse set of scenarios and sensitivities is explored for indicators within Elia’s domain of expertise. It should be noted that the final choice of levers is a complex and multidimensional problem covering not only costs but also energy independence, the careful consideration of risks, societal dimensions and others, and as such should include other elements outside of the results presented here.
5.4.1. ELECTRICITY MIX DASHBOARD FOR 2050
Starting from known ambitions for Belgium complemented with assumptions about growth potentials, a diverse set of supply sensitivities is identified for each of the target years. A selected set of sensitivities is shown for the 2050 horizon for the DE demand scenario in Figure 5-21. This figure gives an overview of the supply capacities in each considered category on the left and the results of the European multi-energy dispatch on the right. It is shown that sensitivities with more domestic renewables, nuclear
or non-domestic offshore supply result in a lower need for thermal capacity, less imports and more moments with low (below €20/MWh) electricity prices. To paint a more complete picture, the costs to install and maintain these supply options as well as required infrastructure (including also TSO and DSO grids), fuel costs, import costs, export benefits, congestion rents,… should be taken into account.
ELECTRICITY MIX DASHBOARD FOR 2050 (DE SCENARIO)
FIGURE 5-21
5.4.2. IMPORTS, EXPORTS AND THERMAL GENERATION
First, one can assess the amount of net imports/exports for each of the options in 2050. Those are shown in Figure 5-22 and depend on the amount of domestic RES (comparison between the upper and lower charts) and on the amount of non-domestic offshore and new nuclear considered. The same is shown for the thermal generation (sum of methane and hydrogen-fired turbines). While the analysis is based on the DE scenario, similar trends can be observed in the GA and ELEC demand scenarios.
A few observations can be made:
◆ Increasing the amount of domestic RES (from Central to High RES) can reduce the net imports by around 30 TWh (no matter what level of non-domestic offshore or nuclear is accounted for). However the decrease in thermal generation is much more limited (1 to 2 TWh). This can be attributed to the fact that the amount of thermal capacity needed is relatively similar in the Central and High RES and that thermal generation is dispatched when there are low volumes of renewables in the European system (during winter);
◆ Increasing non-domestic offshore and assuming that the generation is counted as ‘Belgian’ allows net imports to be decreased by the same amount as the offshore generation. A similar conclusion can be made for nuclear generation.
◆ More non-domestic offshore or nuclear allows the thermal generation in Belgium to be reduced as the amount of installed thermal capacity required to keep the system adequate decreases. This effect is higher with more nuclear given its higher contribution to adequacy than wind offshore.
◆ In the Central RES scenario, installing either 16 GW of non-domestic offshore or 8 GW of new nuclear results in Belgium net importing around 10 TWh of electricity. Combining the above with a higher domestic RES scenario, Belgium becomes a next exporter of around 20 TWh.
◆ In the high domestic RES scenario, Belgium could have a net import close to zero if it installs at least either 8 GW non-domestic offshore or 4 GW of nuclear or a combination thereof (4 GW offshore and 2 GW nuclear). In such a case, the thermal generation would produce around 15 TWh.
5.4.3. ELECTRICITY SYSTEM COSTS OF THE DIFFERENT OPTIONS
The different supply options can be compared in terms of total electricity system costs. Those costs include all costs of the electricity system:
◆ CAPEX annuities of supply options, for all investments required from 2030;
◆ fixed operation and maintenance costs of supply options;
◆ CAPEX and OPEX of the grid (DSO, TSO);
◆ variable costs (fuel costs, CO2 costs, hydrogen generation benefits and imports/exports costs/benefits).
The costs are expressed in €/MWh in order to give the reader a value that can be compared between scenarios of different final electricity demand. However, these costs are not to be confused with the ‘electricity price’ paid by the consumer, nor the ‘wholesale’ price on bulk power markets. Indeed the ‘wholesale’ price is driven by the marginal costs of the system (which only include variables costs and other opportunity costs of flexible devices). In addition, the electricity price paid by consumers can differ depending on the different types of costs included in the final bill (grid, taxes, wholesale…). The total system cost considered in the next sections is therefore the sum of the yearly costs (annuities and variable costs) divided by the total electricity consumption.
Different scenarios will be assessed in terms of cost assumptions for the investments made. Indeed, there are many uncertainties regarding the future cost of supply options. As explained in Section 3.3, two types of sensitivities are performed– those will be clearly indicated in the results:
◆ Low/Ref/High costs of investments (CAPEX), which differ for each technology;
◆ Low/Ref/High WACC (cost of capital) assessed (4%-7%-10%).
REFERENCE COSTS AND WACC
As a starting point one can depict the total electricity system costs in €/MWh for the reference CAPEX and WACC (7%) assumptions taken for each technology. Similar to the previous section three levers are shown together: Central/High RES on two separate charts, the level of non-domestic offshore on the x-axis and the level of new nuclear generation on the y-axis. The results are shown in Figure 5-23.
It can be seen that the cost of the system ranges between €123/ MWh and €107/MWh depending on the different sensitivities assessed. A few observations can be made:
◆ The High domestic RES scenario allows the system costs to be reduced by €2 to €9/MWh. The reduction is more pronounced for sensitivities with less non-domestic offshore or new nuclear. Indeed, in those cases, Belgium imports a lot of its electricity and the increase in domestic RES avoids the most expensive imports;
◆ In the Central domestic RES scenario, no new nuclear or no new offshore wind is always more expensive compared with scenarios where one of these options (or a combination) is used, even when accounting for the additional investment costs. This means that reducing the amount of net imports from the Current Policies scenario allows Belgium to reduce its total electricity system costs.
◆ Installing more non-domestic offshore always reduces total system costs, in any of the combinations except in the ‘high domestic RES’ and 8 GW new nuclear case where going from 8 GW to 16 GW offshore increase the costs by €1/MWh. New non-domestic offshore wind impacts the costs as follows:
- €-2/MWh (8 GW new nuclear) to €-13/MWh (no new nuclear) in the Central RES scenario;
- €-7/MWh (no new nuclear) to €1/MWh (8 GW new nuclear) in the High domestic RES scenario.
◆ Installing new nuclear reduces total system cost if there is no new non-domestic offshore. Otherwise it is always more expensive from a system cost point of view. New nuclear impacts the costs as follows:
- €-4/MWh (no non-domestic offshore) to €7/MWh (16 GW non-domestic offshore) in the Central RES scenario;
- €0/MWh (non-domestic offshore) to €8/MWh (16 GW non-domestic offshore) in the High RES scenario.
COSTS AND WACC SENSITIVITIES
In order to grasp the impact of different cost assumptions for new nuclear and non-domestic offshore, Figure 5-24 shows the impact of:
◆ Higher costs for new nuclear generation (€10,000/kW instead of €7,500/kW). This also includes a higher WACC (10% instead of 7%) to reflect that higher risks for big projects could rise the investor’s demanded return. Other parameters such as construction time are left unchanged. This was assumed to be 7 years for an SMR and 9 years for a large-scale unit (see BOX 3-5 for more information on recent construction durations);
◆ High offshore and grid costs (€2,200/kW instead of €1,600/ kW for non-domestic offshore wind). The WACC was not increased given that the risks associated to wind and grid projects (usually regulated) are more limited than for nuclear projects.
The variation on costs is applied on the figure as follows:
◆ In the chart on the left, the cost increase of offshore wind and grids is applied;
◆ In the chart on the right, the cost increase of new nuclear is applied.
It can be observed that when considering high costs for non-domestic offshore wind and grids but keeping the reference assumptions for nuclear costs:
◆ There is a benefit observed to do non-domestic wind when there is no nuclear in the system. The impact is limited to €-1/ MWh;
◆ If there is nuclear in the system, the cost increases by €2/ MWh (when 4 GW nuclear) to €9/MWh (when 8 GW nuclear). It can also be observed that when considering high cost assumptions for new nuclear and keeping the assumptions for offshore wind and grids as the reference:
◆ The costs are higher in any of the sensitivities. The cost increases by €20/MWh when there is no offshore to €33/MWh where there is 16 GW of non-domestic offshore;
◆ The impact of changes in cost assumptions on the total system costs is therefore higher for nuclear than for non-domestic offshore.
IMPACT OF HIGHER HVDC CONVERTER COSTS
Due to the fact that the EU high voltage electricity grid is projected to nearly double in size by 2050 compared to its current state, the supply chain for high voltage electric components is under stress. This strain on the supply chain results for example in increased prices for HVDC convertors. As it is very uncertain for how long this situation will endure, to account for different grid cost evolution scenarios two additional sensitivities involving increased HVDC convertor costs were conducted for 2036 and are outlined below. For these sensitivities, the cost of offshore HVDC converters are doubled compared to the reference costs, while onshore converters experience a 25% cost increase. Impact on the EU high voltage electricity grid optimum for 2036 First, the EU optimum was recalculated using aforementioned high convertor costs throughout Europe. From these results it was observed that only slightly less new offshore wind capacity (around 6 GW less compared to the reference cost scenario) was developed in Europe. For Belgium the domestic offshore potential remained however fully used, reaching the 5.8 GW by 2036 (the increase to 8 GW in the BE EEZ is only included as an investment candidate as of 2040). The Nautilus hybrid interconnector, connected to the Princess Elisabeth Island, remains present in the cost-optimum as well.
IMPACT OF HIGH HVDC CONVERTER COSTS
In addition, 2 GW of hybrid interconnectors connecting non-domestic offshore wind in the North Sea to Belgium were found to be cost-optimal for 2036. While overall less offshore wind farms and hybrid interconnectors are developed in Europe compared to the reference costs scenario (about half as much kilometer cables (GW*km, see also figure 4-31) of offshore HVDC is installed in the high costs case compared to the reference cost case), it was observed that it remains cost-optimal on system level for Belgium to further develop domestic offshore wind capacity, create an offshore energy hub, and connect far-out offshore wind through hybrid interconnectors to the country. Effect on the cost effectiveness of the BE domestic supply mix
The impact of the increased grid cost on the estimated total electricity system cost for Belgium (per MWh) is shown the figure in this box for different domestic supply mixes for 2040 and 2050. It can be seen that even with such high cost estimates for HVDC converters, the connection of additional non-domestic offshore wind on top of the 8 GW of offshore wind in the Belgian EEZ remains cost-effective, indicating a robustness of the investments to this type of unexpected event. The tipping point at which investing in additional non-domestic volumes stops reducing system cost is however slightly shifted downwards, especially with high volumes of nuclear generation in Belgium.
COSTS COMPONENTS OF THE DIFFERENT SENSITIVITIES
The total electricity system costs presented in the previous sections combine all types of costs of the system. In order to assess the different components and their size, it is possible to split the costs by component.
Figures 5-25 and 5-26 present the costs for the DE scenario with Central RES and High RES assumptions. Five sensitivities are chosen to show the differences between OPEX and fixed costs and the different component sizes. Those cover the range of the previous charts with non-domestic wind offshore on the x-axis and new nuclear on the y-axis.
The components are split by category:
◆ Variable costs:
- Import/export costs are related to the amount of spending to buy electricity abroad or to sell this electricity. The net costs are reported. Those can be negative if the revenues from exports are higher than the costs of imports;
- Fuel and CO2 costs are linked to the fuel used in thermal generation (nuclear, methane or hydrogen) as well as costs for CO2 abatement (if any).
◆ Fixed costs (annuities for investments from 2030 and fixed costs of operation):
- Domestic RES fixed costs are annuities and FOM related to PV, wind onshore, hydro, biomass and wind offshore in Belgium;
- Adequacy (thermal) are the annuities and fixed costs related to thermal power plants other than nuclear;
- Flexibility costs are annuities and fixed costs related to storage and demand flexibility;
- Nuclear are the costs related to new nuclear installations;
- Non-domestic offshore are the costs related to offshore wind outside of the Belgian EEZ;
- Grid costs are all costs related to the grid (DSO costs, regional grid costs (30-70-150 kV), backbone (380 kV and onshore interconnectors) and offshore grids.
The costs components are very different depending on the scenario:
◆ The first sensitivity (0 GW non-domestic offshore and 0 GW nuclear or ‘Current Policies’) incurs the highest OPEX costs, accounting for 50% of the total costs. This indicates that these costs are associated with purchasing resources from abroad, such as fuel or electricity;
◆ The other sensitivities have lower OPEX costs but a higher share of CAPEX (up to 80 % of the costs).
A few more observations can be made:
◆ As identified previously, the combination with the lowest system costs (for the reference cost assumptions) is the one with 16 GW non-domestic offshore and no nuclear. This is indicated by the red dot on the graph;
◆ The part related to grid investments is between 7% (no non-domestic offshore) and 20% (16 GW non-domestic offshore) for the TSO related costs (which include regional, backbone, interconnectors and offshore grid);
◆ DSO related costs make up around 18% of the total costs across all supply scenarios. This share is rather stable across demand scenarios as well as it is mainly linked to residential electrification;
◆ Adequacy related costs (fixed costs of power plants) are rather limited, up to 6 % in the scenario with the highest need for thermal generation and less than 1 % in the lowest one. Note that the variable costs related to the operation of those power plants are included in the fuel costs in the chart;
◆ Both the High and Central domestic RES scenarios display a similar trend. However, in the High RES scenario, benefits from exporting electricity can be observed in all combinations shown in the graph, except for Current Policies.
INVESTMENTS OVER TIME
Depending on the chosen pathway, the amount of CAPEX spent can differ. Indeed, some scenarios rely more on OPEX as illustrated in the previous paragraphs and others more on fixed costs (investments). Figure 5-27 illustrates the amount of overnight CAPEX spent depending on the chosen pathway. This only includes overnight costs and no financing costs. In addition, it does not account for costs incurred during construction. Indeed, for some technologies, the costs could begin to accrue well before the different installations are commissioned.
A few interesting observations can be made:
◆ The scenarios with the highest CAPEX share are the ones where the highest amount of overnight CAPEX needs to be spent. The scenarios differ in terms of amount to be spent every 5 years;
◆ While yearly grid costs (when compared to the total annual system costs) represent less than 20% for DSOs and less than 10% for TSOs (see previous charts), the share of the amount of total CAPEX to be spent is around 50% if current policies
are pursued. This share is lower if new nuclear is considered in the system.
It is to be noted that the different supply options (e.g. non-domestic offshore wind versus new nuclear) are developed with a different timing, as reflected in the chart with respect to investment costs. This also results in benefits of those investments materialising differently over the full time horizon, which is to be taken into account when comparing different options and pathways. Another noteworthy observation is that aiming for the most cost-effective scenarios (those with lower total system costs, including both fixed and variable costs) will necessitate higher capital expenditure (CAPEX). This means that not only will there be a need to source the funding for these investments, but it will also be crucial to try and minimize financing costs as much as possible. The similar observation can be made for CAPEX to be spent for grids. Reaching the best scenarios from a total system costs point of view will require more investments into the grids.
CONSUMER AND PRODUCER SURPLUS
When considering scenarios with a high share of net imports such as the Current Policies scenario, the total amount of inframarginal rent received by Belgian producers is lower compared to situations with more Belgian electricity supply. In order to illustrate the effect of having more electricity generation in Belgium, the Current Policies scenario is compared with the scenario with 16 GW non-domestic offshore and 8 GW new nuclear. Figure 5-28 aims to illustrate the impact on the inframarginal rents and consumer payments when international fuel prices increase by 1.5x or 2x. The figure (provided as illustration of the effect) gives the following insights:
◆ When international fuel prices increase, the cost for electricity increases. Indeed, the import costs will increase in moments where the marginal unit is molecule-fueled thermal generation. In addition, when this type of generation is marginal in Belgium it will result in an increase in operational costs of the system. Such effect is observed in both cases but the absolute impact is higher in case of less domestic generation as the prices are then more correlated to fuel prices;
◆ In the situation where Belgium would have more domestic generation, the increase in costs for consumers can be compensated by the increase in ‘revenues’ for the producers whose marginal costs are less or not at all affected by variations in fuel prices. Such a situation can help dampen the electricity final price paid by consumers if part of that increase for producers could be captured and redistributed.
ILLUSTRATION OF THE IMPACT ON INFRA-MARGINAL RENTS AND CONSUMER PAYMENTS OF INCREASING INTERNATIONAL FUEL PRICES IN DIFFERENT ELECTRICITY SUPPLY SITUATIONS FOR BELGIUM.
0
FIGURE 5-28
FAR-OUT BASELOAD RES CONNECTED TO BELGIUM
Another option outlined in the scenarios is ‘far-out’ baseload RES that would be connected to Belgium. This assumes an HVDC link from North Africa or other regions which would be linked to Belgium being able to provide quasi-baseload renewable generation. This is further explained in BOX 3-3 in the scenarios chapter.
Similar to new nuclear and new non-domestic offshore, the sensitivity can be shown on the X/Y axis figure. In this case, the new nuclear y-axis was replaced by baseload RES connected to Belgium.
A few observations can be made:
◆ In the reference cost scenario, the option is similar to new nuclear. The CAPEX costs are assumed to be €9,000/kW in the reference case and are based on the project brought forward by Xlinks (see [XLI-3]) and a
WACC of 7%. A small decrease in total system costs can be observed for the scenario without new non-domestic offshore and a limited amount of far-out baseload RES. However, an increase in costs can be observed if there is non-domestic offshore wind integrated into the Belgian energy system. This conclusion is similar to the case of new nuclear;
◆ When using high CAPEX cost assumptions (€12,000/ kW) the option becomes less interesting; further increasing the WACC as well to reflect higher risks associated to such a project increases system costs even more.
The option of ‘far-out baseload RES’ can prove interesting if the cost and the risk associated with the project can be kept low.
IMPACT OF ‘FAR-OUT’ BASELOAD RES ON THE SYSTEM COSTS FOR
EUROPEAN BASELOAD RES CONNECTED TO BELGIUM
Although not directly examined in this study, such an analysis could potentially evaluate the advantages of, for instance, linking Belgium to a European region with extensive deployment of low-carbon energy sources. This large-scale local deployment could prove its benefits due to regional attributes such as space availability, public approval, and load factor. Given that the cost assumptions used in figure 5-29 were based on regions external to Europe, the distance needed for electric transmission could be lower. As such the benefits associated to such a project could be higher. Such projects could become relevant for Belgium depending on the actual evolution of Europe's energy landscape and future technology costs.
5.4.4. IMPACT OF ADDITIONAL DOMESTIC RES AND PV
The assessed impact of additional domestic RES concluded that it can reduce system costs and imports but doesn’t considerably affect thermal capacities (installed and generated energy). This section delves deeper and explores the impact on the cost of renewable energy sources and the effect of having even more photovoltaic (PV) generation in the system than in the High RES scenario (i.e. the Very High PV sensitivity scenario – going from 65 to 97 GW by 2050). Figure 5-30 shows the total system cost for the central RES, high RES and very high PV scenarios (where the PV was capped to the estimated DSO peak) under reference and
low CAPEX assumptions in a similar format as presented before: with the amount of non-domestic offshore integrated on the x-axis and the amount of new domestic nuclear on the y-axis. The results shown for high PV are the ones where the evacuation capacity is capped to the maximum peak demand for the distribution grid (see also BOX 5-5 for further explanation). Note that if this was not the case, the system costs should be further increased with the additional distribution grid reinforcement that would be required to integrated additional PV on the local grids.
IMPACT ON SYSTEM COSTS OF INTEGRATING ADDITIONAL RENEWABLES IN THE BELGIAN ELECTRICITY SYSTEM ON TOP OF THE CENTRAL RES ASSUMPTIONS FOR THE REFERENCE AND LOW CAPEX ASSUMPTIONS.
It can be observed that:
◆ Going beyond the central RES assumptions to the high RES assumptions always results in a decrease in total system cost. This decrease in costs is higher for the sensitivities with low amounts of non-domestic offshore integrated into the Belgian electricity system and low amounts of new nuclear. This intuitively makes sense as in the scenarios with lower domestic generation electricity prices will tend to be higher and more expensive imports can be replaced by domestic RES production.
◆ While the benefits of installing additional solar PV diminish with increased domestic supply, they decrease at a slower
rate with an increase in non-domestic offshore supply compared to an increase in domestic nuclear. Indeed, the variable nature of wind and its seasonal complementarity with solar (more wind is produced on average in winter while solar energy production peaks in winter) means that they impact each other’s benefits less.
◆ Increasing the PV assumptions even further to the very high PV assumptions is beneficial (or neutral) when using low CAPEX assumptions. However, when reference CAPEX numbers are used the results are positive only if no additional nuclear is installed.
MANAGING A MASSIVE PENETRATION OF SOLAR PV
One of the sensitivities assessed in this study models a massive increase in PV capacity, reaching almost 100 GW in 2050. Without considering any grid limitations, the production of PV would be directly proportional to the installed capacity.
When considering a very high penetration of solar PV, the peak generation could become higher than the consumption peak on which distribution networks are dimensioned. This raises the question of whether it is more beneficial for society to limit photovoltaic production in a set of overproduction hours or to invest in accommodating the full photovoltaic production. This study explores this effect by examining a scenario where the photovoltaic production is capped to ensure no reinforcements have to be made to the DSO grid to accommodate these large volumes of photovoltaics on top of the investments already needed for the increase of the peak demand. A simplified reasoning is applied and is further explained below.
Two scenarios are used when considering very high PV generation:
◆ One where there is no capping assumed;
◆ One where the generation is capped (before the dispatch) and associated to additional local storage. This is the scenario that is accounted for when providing results for the high PV scenario.
By capping the production, the aim is to limit the cost associated to the additional strengthening of the DSO network for overproduction. The capping considers a threshold production for the photovoltaics on a national level and is applied to the assumed residential PV installed capacity. Above this threshold, it is assumed that excess solar production can be stored in small-scale batteries dedicated to reducing curtailment which were added to the very high PV capped sensitivity. Any energy which cannot be evacuated through the DSO grid or absorbed into batteries is curtailed. It is assumed the battery is discharged as soon as possible but without exceeding the energy evacuation threshold. This optimisation happens before the dispatch and aims to maximise the PV generation.
In the case of ‘no capping’, additional costs should be accounted for in order to integrate the additional PV capacity. This amount was not calculated however it could significantly raise the costs of the system. Figure 5-31 presents three distinct cases for one climate year of the Météo France climate database 2050. Case 1 represents the situation where neither curtailment nor storage is necessary to respect the threshold. Case 2 represents the situation where the battery capacity is sufficient to prevent any curtailment while still respecting the threshold. Case 3 represents the situation where the size of the battery falls short in preventing curtailment.
COMPARISON OF PV GENERATION IN DIFFERENT SITUATIONS:
With substantial volumes of PV generation in Europe/ Belgium, other system aspects also need to be considered and enhanced. Managing the short-term variability (due to i.e. prediction and forecasting errors), is one such aspect that will become increasingly critical with the
heightened penetration of RES, particularly PV given its decentralized nature. This element was not examined in this study, yet it is crucial for the future electricity system and must be factored in.
Finally, Figure 5-32 shows the comparison of the yearly photovoltaics production for the very high PV scenario without and with a production cap for 2036, 2040 and 2050. Note that the amount of assumed storage is based on the installed PV capacity at 1 GW per 3 GW of difference between the nominal power of the PV and the DSO accomodation capacity. Obviously, if the storage size is increased, the curtailed energy is reduced.
The maximum output limitation is introduced to limit additional reinforcements of the DSO grid, but the results obtained are close to the results of the market optimisation. Indeed, some peak PV production is also curtailed as a result of the market dispatch in the very high PV scenario as seen in Figure 5-32.
◆ In 2036, the required curtailment as an effect of the capping is negligible: it is only required for an average of 75 hours per year over 200 climate years. With battery storage, solar curtailment is minimal. The energy curtailed through the market dispatch process of the very high PV sensitivity without capping is also negligible.
◆ By 2040, the impact of the capping grows. Curtailment is applied for an average of 450 hours per year over 200 climate years, resulting in 1.7 TWh of curtailed energy, or 3% of total production. Note that due to the market dispatch in the very high PV sensitivity without capping, finally a similar overall curtailment occurs compared to the scenario with capping.
◆ In 2050, capping has a more important effect, and would be activated for an average of 1075 hours per year over 200 climate years. This leads to around 11 TWh of curtailed energy to respect the maximum threshold. When no local storage is added, around 3 TWh is additionally curtailed. Finally, the market dispatch in the very high PV sensitivity with capping curtails 4 additional TWh. Note that due to the market dispatch in the very high PV sensitivity without capping, finally roughly the same overall curtailment occurs compared to the scenario with capping.
FIGURE 5-31
CURTAILMENT OF PV GENERATION IN THE VERY HIGH PV SENSITIVITY WITHOUT CAPPING (LEFT) AND WITH CAPPING (RIGHT).
FIGURE 5-32
RES CURTAILMENT AND LOW MARGINAL PRICE SITUATIONS
Next to the costs per MWh several other indicators characterising the electricity system can be extracted from the economic dispatch simulation. In this section indicators related to moments where electricity prices are low are explored further.
First of all, indicators such as the number of hours where RES is curtailed in the market dispatch and the number of hours with low prices give an idea of how much renewable energy was produced by renewable energy sources but not consumed and how many hours exist where flexible technologies could benefit from very low electricity prices.
The number of hours with RES curtailment and with marginal prices below €20/MWh are presented in Figure 5-33. It can be seen that increasing the amount of domestic RES results in both more hours with low marginal prices and more RES curtailment. Capping the solar production in the Very High PV scenario (as described in BOX 5-5) results in approximately a halving (depending on the scenario) of the hours with RES curtailment in the market dispatch while keeping the number of hours with marginal prices below €20/MWh approximately the same.
RAMPING
Finally, due to the fluctuating nature of renewable generation, integrating more renewables into the system causes an increase in the variability of the electricity residual demand. Flexible technologies capable of smoothening out these fluctuations will therefore become key in the future. The 90th percentile ramps over one and three hours are indicators which can be used to quantify supply fluctuations in the system. The selected percentile and indicators are chosen to provide an idea of the increased need for intraday flexibility or ramping between hours. However, it should not be inferred that these indicators should be used for system dimensioning.
It should be noted that the simulation set-up used is based on a perfect foresight model. As such, it does not inherently capture forecast errors in renewable production, consumption or variations due to power plant outages. These forecast errors increase the need for flexibility and as such need to be considered when dimensioning and managing the actual system. Similarly, the concept of 'short-term flexibility', as evaluated in the Adequacy & Flexibility study, is not assessed in the current study.
The resulting 1-hour and 3-hour ramping ranges over all domestic supply scenarios is presented in Figure 5-34. It can be observed that:
◆ Ramping tends to increase over time with the scenario with the most domestic renewables showing the largest ramping. This is mainly linked to the increase in renewables and more particularly PV;
◆ The ramping rate is significantly reduced in 2050 in the high PV capped (HPVC - where the PV generation is capped to a certain value) when compared to the high PV (HPV - where no capping is applied on PV). This highlights the impact of PV on the rampings of the residual load (see also BOX 5-5 for more information on how the HPVC scenario was constructed);
◆ The nominal capacity of storage assumed is higher than the 1h ramping for all scenarios and time horizons. This means that it is capable of covering most of the 1h ramping (if the state of charge allows it);
◆ The 3-hour ramping is higher than the 1-hour ramping. This is mainly due to morning and evening rampings (linked to PV and consumption). However for the 3-hour ramping many other technologies are able to provide such a service for the system;
◆ The figure only compares the rampings to the installed storage in the scenarios. This therefore excludes other types of, interconnectors or demand flexibility.
◆ The figure demonstrates that the flexibility of the electricity system will be needed to cope with intraday variations in the residual demand.
HOURLY AND 3-HOURLY
CENTRAL
High
High
High
5.4.6. TOTAL SYSTEM COSTS (ALL VECTORS)
The previous sections analysed the electricity system costs only. Those costs included the costs from other vectors to produce the needed electricity or the benefits incurred from producing molecules from electricity. This method allows different electricity supply options to be compared.
In order to grasp the total energy system costs, an exercise was completed to evaluate what the other aspects of the Belgian energy system would cost. This also includes the cost of end-use investments. As explained in Section 2.4, those costs can be split into three main categories:
◆ End uses investments (e.g. investments in electro-mobility, energy efficiency…):
- Those are the investments made by the end users of the energy and include the cost for acquisition of new cars, charging infrastructure, heating devices or building renovations.
◆ Energy vector – molecules (oil, methane…):
- Costs related to molecule infrastructure (grid and transformation processes);
- Costs related to the molecule supply (e.g. imports, domestic production but excluding the fuel used for electricity generation and fuel generated from electricity);
◆ Energy vectors – electricity:
- Electricity grid costs (offshore, interconnectors, backbone (high voltage grid within a zone), regional grid (also called ‘vertical’ grid: 150-70-36-30 kV), DSO grids);
- Electricity supply capital expenditure (CAPEX) costs (investments and fixed costs of production facilities);
- Electricity supply operational expenditure (OPEX) costs (fuel used to generate electricity).
Other types of benefits or costs (e.g. socioeconomic impact, employment …) are excluded from the analysis. The main assumptions behind the costs are further detailed in Section 3.3.
Figure 5-35 compares the annual costs of these components in 2050 for the three main demand scenarios and ‘Current Policies’ electricity supply scenario. It can be observed that:
◆ Electricity system costs would only represent between 19% and 23% of the annual spending of the energy system by 2050;
◆ Even though the consumption of molecules is strongly reduced in all demand scenarios, the costs remain important. This can be explained by the fact that by 2050 most (imported) molecules consist of relatively expensive green molecules such as ammonia, biomethane and synthetic liquids when compared to (cheaper) fossil fuels today;
◆ In all scenarios, the cost for end use sectors generally accounts for the largest relative share of the total. The primary drivers in these sectors are the costs associated with renovations and the replacement of heating devices in buildings, as well as the necessary investments for renewing the vehicle fleet and rolling out new infrastructure such as electric vehicle charging stations in the transport sector. In industry, the costs are mainly driven by the replacement of fossil fuel based appliances by electric/green molecule-based alternatives and the investment in carbon capture technologies;
◆ In general, the scenarios which involve a higher level of electrification result in lower total costs. A higher degree of electrification requires more investments in the power system for grid, (backup) capacity and operational costs; however, this is more than compensated for by the fact that the reduced amount of required domestic and imported molecules reduces the cost of the molecule system. Additionally, the GA scenario assumes some end use technologies that are relatively more expensive than their electrical counterparts, such as fuel cell vehicles and hydrogen heating in buildings.
5.5. TRANSITION PERIOD (THE ROAD TO 2050)
5.5.1. ELECTRICITY MIX DASHBOARD FOR 2036 AND 2040
Where the previous section focused on the long-term (2050) electricity options for Belgium and the choices that are to be made, this section focuses on the period leading up to 2050. Studying the intermediate period is crucial as it paves the road to 2050. Not taking action early enough may result in the exclusion of certain options for 2050. In addition, access to affordable, clean energy is as crucial in the period leading up to 2050 as it is after 2050.
During this period, Belgium also has access to some options which will likely not be available in 2050. For example, the extension of existing nuclear plants will not be possible beyond a certain date. Similar to the analysis for 2050, an overview of the different supply options considered and their effect is shown in Figure 5-36 for the DE scenario in 2036 and Figure 5-37 for 2040. The figures only show some of the possible combinations. Extension options for existing nuclear units (beyond 2036) are discussed in Section 5.5.3.
REFERENCE COSTS AND WACC
Similarly to Section 5.4.3, the total electricity system costs in €/ MWh for the reference CAPEX and WACC (7%) assumptions are shown for the three target years. Figure 5-38 first shows the results for the Central RES scenario on top. The level of non-domestic offshore wind is shown on the x-axis and the level of the new nuclear generation on the y-axis. The bottom graphs depict the results for the High RES scenario. Note that for this figure no nuclear extensions are shown, those are presented in Section 5.5.3.
In general:
The cost range increases as the target year is moved further into the future. This intuitively makes sense as in 2050 the range of possible supply mixes is bigger than in earlier years. It should however not be forgotten that not investing early enough may result in supply options in 2050 becoming unreachable. In addition, investing early means that there are more years where society can benefit from the reduction in costs. Therefore, the decisions made for 2036 may seem less impactful from the figure but they certainly are when looking at the long-term numbers.
For 2036 with reference costs and WACC: It can be observed that the total system costs range between €98/MWh and €100/MWh depending on the different sensitivities assessed. A few observations can be made (from a costs point of view):
◆ High domestic RES never results in an increase in costs and, depending on the level of new nuclear and non-domestic offshore wind, allows the system costs to be reduced by up to €2/MWh.
For 2040 with reference costs and WACC: It can be observed that the costs range between €102/MWh and €108/MWh depending on the different sensitivities assessed. Based on those a few observations can be made:
◆ High domestic RES never results in an increase in costs and, depending on the level of new nuclear and foreign offshore wind, allows allows the system costs to be reduced between €2 to €4/MWh.
◆ In the Central domestic RES scenario, no new nuclear or no new offshore wind is always more expensive than doing one or a combination of both. This means that reducing the amount of net imports allows Belgium to reduce its total electricity system costs.
◆ Investing in non-domestic offshore wind is always more interesting than not doing it if no new nuclear is installed. If new nuclear is installed the benefits of installing additional offshore are not as clear.
The results for 2050 were discussed in Section 5.4.3 and are not discussed again here.
5.5.3. NUCLEAR EXTENSIONS
The possible extension of existing nuclear plants was considered in the intermediate period. For both 2036 and 2040 an extension of 0, 2, 3 and 4 GW was simulated, combined with different levels of non-domestic offshore wind integrated into the Belgian electricity system. In addition, a sensitivity on the costs was assessed where the cost of the extension was raised from €1000/kW to €1200/kW and the WACC was increased from 7% to 10%. It is important to repeat that a decision about nuclear extensions should consider a broader set of criteria than only costs (feasibility, safety, regulation, grids, socioeconomics, etc.).
The results are presented in Figure 5-39. It can be seen that the extension of existing nuclear:
◆ Makes sense from a cost point of view in all studied sensitivities under the central cost assumptions;
◆ Results in the biggest reduction in total cost for the sensitivities with higher levels of imports. In these sensitivities the
additional electricity generation is used to meet a large part of the domestic load, resulting in benefits for consumers as well as for producers being captured in Belgium. This can also be observed in the reduction in import volumes;
◆ Results in a significant adequacy benefit, resulting in a lower volume of new thermal that needs to be installed to ensure that the security of supply criteria are met. The reduction in costs that this entails are included in the presented numbers;
◆ Results in bigger benefits in 2040, where the growth of electrical demand results in higher levels of import if no additional domestic supply is built on top of the central buildout of renewables;
◆ Still makes sense or is neutral from a cost point of view when higher cost assumptions are used.
NUCLEAR EXTENSION COSTS, NET IMPORTS AND NEW THERMAL
5.5.4. ADEQUACY
In order to ensure security of supply criteria are met in all the sensitivities, it is sometimes necessary to add firm backup capacity. The cost of this additional capacity is already taken into account in the electricity system costs presented earlier in this chapter.
Figure 5-40 shows the remaining capacity needs (excluding additional domestic supply of nuclear or non-domestic offshore; i.e. in the ‘Current Policies’ scenario) for each demand scenario and target year.
As flexibility and RES increase across the system, the adequacy derating factors (the contribution of storage and energy limited resources to adequacy) are expected to decrease. Their exact contribution will depend on the amount of energy limited resources that are installed in the future system (both in Belgium and abroad). In order to illustrate the impact that the amount of flexibility in the system will have on the contribution to adequacy (i.e. the derating factor), Figure 5-41 provides indicative values for several storage durations as well as ranges depending on the scenarios accounted for in terms of installed flexibility.
With the flexiblity assumptions used in the DE scenario the derating of batteries decreases towards later time horizons. The decrease over time can be mainly explained by the higher share of RES in the system and more flexibility at European level.
In the 0 GW battery in Belgium sensitivity it can be observed that the derating factor for storage remains relatively high from 2036 to 2050. Nevertheless a decrease can be observed which is driven by the same elements as in the DE scenario.
In the High FLEX sensitivty the installed capacity of batteries represents up to 40% of the average daily peak load and the derating factor for a 4h large-scale battery is equal to 25% for 2036/2040. In 2050, this derating decreases to about 15%, as the ratio of installed batteries capacity to average daily peak load increases to more than 50%. This means that 6.3 GW of 4h storage could be used to fill 1 GW of adequacy GAP. For 2h storage, the needed volume would be close to 10 GW.
Several observations can be made:
◆ The need for firm capacity increases towards the later years. This increase is mostly driven by the increased electrical demand given the electrification assumptions used in this study;
◆ The assumed existing domestic thermal capacity still present by 2050 in the central scenario covers (only) approximately 4.5 GW of the total need of 23.5 to 27.5 GW. In the supply sensitivities the addition of new nuclear, extension of existing nuclear or addition of renewable energy is taken into account;
◆ The growing need for firm capacity is partially compensated by the assumed growth in installed batteries and the unlocking of flexibility in the building, transport and industrial sectors. In 2050 flexibility covers 13 GW of the firm capacity needs which would otherwise need to be met with other sources;
◆ Depending on the load scenario a higher or lower volume of firm capacity is needed. The SUFF scenario where behavioral changes result in a lower electricity demand has the lowest requirements. The ELEC scenario where the electricity consumption is highest out of all demand scenarios results in the highest need for firm capacity.
5.6. SUMMARY OF THE DIFFERENT LEVERS
As observed in the sections above, decisions about domestic supply can never be fully decoupled. For example, the presence of more onshore renewable generation has an impact on the benefits obtained when adding new non-domestic offshore, nuclear generation or the extension of existing nuclear. Each of the supply and demand levers impact in some way or another the benefits of the others. Nevertheless, it is possible to identify general trends by assessing the effect of the levers on each of the sensitivities.
FOR 2050:
Figure 5-42 shows the impact on system costs of each lever per MWh of demand in the DE scenario when applied to the current policy scenario (circle). To represent the effect of the lever under other sensitivities (more nuclear, more non-domestic offshore, ...) the supply lever was applied on a diverse set of sensitivities and analysed for each. The average of the resulting effects is shown using the diamond. By including both indicators, a view of the scenario robustness is provided for assessing trends.
In addition to assessing the effect of the levers for the reference costs, the effects of each lever are also analysed when the costs for the selected lever turn out to the high or low assumptions instead of the central costs (again for the set of supply and demand sensitivities). This also allows for a robustness check of trends with respect to changes in costs.
Finally, the figure depicts the impact on net imports and firm capacity needs (to respect security of supply criteria) of each sensitivity. The effect of these changes is taken into account when calculating the system costs. It should be noted that the district heating and sufficiency levers are assessed but no cost is accounted for the buildout of heating networks nor for the application of sufficiency measures. These costs should also be considered when assessing the desirability of these options.
The figure offers several interesting insights when looking at the costs (and associated sensitivities), net imports and firm capacity requirements:
Impact of a given sensitivity when applied to current policies scenario ( ) or average impact across supply sensitivities ( ) Sensitivities 2050
No-regret levers:
◆ Increasing the ambitions for domestic RES to the values assumed in the High DRES scenario is beneficial even when the costs turn out to be higher. From a cost point of view, this lever is thus a no-regret decision.
Minimum-regret levers:
◆ Increasing the ambitions for domestic PV even further (High DRES + PV) is beneficial except when costs turn out at the high estimate. Therefore, pushing the development of PV beyond even the High DRES assumptions should be considered as a minimum regret while requiring a monitoring of the costs. The integration of large amounts of PV into the distribution grids and the flexibility requirements associated to large volumes of PV are two aspects requiring important attention when applying this lever;
◆ The integration of 8 up to 16 GW of non-domestic offshore wind results in overall net benefits except for the scenario where costs turn out to be at the high estimate, similar to High DRES + PV. On top of this, the integration of non-domestic offshore wind results in a significantly decreased reliance on electricity imports.
Levers that can be advantageous depending on the reference sensitivity:
◆ The desirability of integrating new nuclear and/or far-out baseload RES depends on the scenario in the central costs case. If the high costs materialise these options appear to be not financially attractive. Inversely, when using low-cost assumptions these options are beneficial in all scenarios. It should be noted that these options do have a significant impact on the net imports needed in Belgium and the required amount of other firm capacity that is to be installed, and can have other societal advantages as well.
Levers whose costs need to be assessed further, but look promising:
◆ Both the district heating (DH) and sufficiency (SUFF) sensitivities result in lower electrical demand and therefore end up costing less overall. The costs associated with these levers were however not assessed in this study and as such remain to be further investigated.
FOR 2040 (BUT ALSO REPRESENTATIVE OF THE INTERMEDIARY PERIOD):
In 2040 an additional lever – the extension of existing nuclear –is considered. The results are shown in the same format as they were for 2050 in Figure 5-43. When interpreting these results, it should be kept in mind that depending on the decisions made for the intermediary period some options for 2050 might become unattainable.
The following trends can be observed:
No-regret levers:
◆ Similarly to 2050, high domestic RES remains a no-regret lever.
◆ The extension of existing nuclear appears to be a no-regret lever from a cost point of view even if high cost estimates are used. In addition, this lever, like the installation of new nuclear, has a significant impact on firm capacity needs and net imports. However other aspects not covered in this study (such as safety, regulation, grids, etc) should be taken into account as well.
Minimum-regret levers:
◆ The integration of 8 GW of non-domestic offshore wind is beneficial except when high cost assumptions are used. On top of this, the integration of non-domestic offshore results in a significant decreased need for foreign electricity imports.
Levers that can be advantageous depending the reference sensitivity
◆ From a cost perspective, the buildout of additional new nuclear appears only to be beneficial in some sensitivities.
Levers which are advantageous only if low cost assumptions are used:
◆ Increasing the solar capacity ambitions to levels beyond those assumed in the High DRES scenario seems to be beneficial only if costs lower than the reference costs are assumed.
Levers whose costs still need to be assessed further:
◆ As for 2050, the SUFF sensitivity is assessed for 2040, similarly showing significant benefits if it were to materialise. These benefits are to be compared to cost calculations. The costs calculations for the implementation of SUFF are not performed in the framework of this study.
SUMMARY OF THE LONG-TERM IMPACT OF THE DIFFERENT DEMAND AND SUPPLY LEVERS (DE 2050)
FIGURE 5-42
IN CONCLUSION
Using the framework developed in this study, the effect of several levers on the energy costs, import needs and need for firm capacity of the Belgian electricity system are assessed. The acceleration of domestic onshore RES to the high levels assumed in this study appear beneficial in all cases. As such, it is highly advisable to investigate how these levels of renewables could be attained. Furthermore, the extension of existing nuclear if all related aspects (which are not further developed in this study) allow it, also presents an interesting opportunity to reduce system costs in the period leading up to 2050. The buildout of non-domestic offshore wind integrated into the Belgian energy system also shows great promise in terms of reducing system costs and should be further investigated. For the buildout of new nuclear the results are less straightforward and depend to an important extent on the cost assumptions taken.
Finally, the impact of sufficiency measures and district heating show important potential to further reduce system costs, but it should be noted that the costs associated with implementing these measures are not calculated in this study and as such additional analysis is to be performed.
Finally, Elia would like to reiterate that the insights provided are based about and limited to the area of expertise of Elia. Making decisions about the future energy system is a complex multi-dimensional exercise where not only system costs but also the implications for other societal aspects such as the environment, public acceptance and budgetary constraints are to be taken into account. It is the full prerogative of policymakers to define the principles of the Belgian electricity supply mix for 2050, and the pathway to reach it.
5.7. ELECTRICITY GRID
Electricity grids are an essential part of the energy system. They support society in its transition to net zero by facilitating:
◆ the integration of onshore and offshore renewable generation and other low-carbon electricity sources into the energy system;
◆ the efficient exchange (import and export) of green electricity with neighbouring countries;
◆ large-scale electrification, both on an industrial (e.g. steel sector, data centres, etc.) and residential level (e.g. transportation, residential heating, etc.);
◆ the integration of the necessary (physical) means for adequacy, such as storage systems and backup generation.
Based on the insights gained from this study, this section explores the potential impact on the future evolution of the Belgian electricity grid and the concrete infrastructure projects for grid reinforcement that are to be expected. The development of the Belgian electricity system consists of three key pillars which are supported by a strong foundation, as follows:
◆ Pillar 1: Development and integration of the offshore network this involves an efficient integration of offshore renewable electricity into the energy system as well as the (offshore) exchange of electricity between countries.
◆ Pillar 2: The further development of onshore interconnectors this allows for the onshore exchange of electricity between neighbouring countries, thus enabling the efficient use of renewable electricity on a European scale.
◆ Pillar 3: The creation of hosting capacity: this involves developing sufficient and suitably located grid capacity to connect new consumption, production, and storage systems to the grid, via the different substations, and pertains to grid development at the backbone level, at regional transmission level, but also at distribution level.
◆ The foundation: The development of a strong and robust internal backbone grid enables power flows resulting from the three key pillars to be securely managed across the whole Belgian electricity system.
The impact of the future energy system on grid development is assessed based on the expected benefits at the European level, and expressed as additional needs on top of the grid development projects that were approved in the context of:
◆ Elia’s federal development plan 2024-2034 [ELI-3] approved by the Belgian Minister of Energy on 05/05/2023 (see also Figure 3-41 on the reference grid for the present study, which includes the projects approved in this latest federal development plan).
◆ The Walloon region adaptation plan [ELI-11];
◆ The Brussels capital region investment plans [ELI-12];
◆ The Flemish region investment plan [ELI-13].
In the following sections, grid development needs are provided for each of the four development categories, and broken down into three types of development measures:
FIGURE 5-44
sustainability in network development
and integration of the offshore network Further development of the onshore interconnections Creation of hosting capacity
Optimisation of the existing potential Realisation of the missing links Ensuring system stability
Reinforcement and expansion of the internal backbone 380 kV
No-regret infrastructure measures
Certain grid infrastructure investments are considered to be no-regret measures and are resilient to changes to the choice of energy sources for the Belgian electricity supply mix. Typically, their main drivers are the electrification of demand and the development of domestic RES. These investments should be prioritised and implemented without delay to avoid any potential setbacks in the energy transition process. Therefore, the first steps leading to their realisation should be taken today. Additional studies may be required to further detail and optimise the exact configuration and scope of the concrete grid infrastructure projects, factoring in technology constraints, practical feasibility, environmental impact, etc.
Minimum-regret infrastructure measures
These are grid development projects that provide substantial benefits to society across a wide array of scenarios and assumptions, while posing minimal financial risks to the other remaining scenarios. Generally speaking, not proceeding with these measures would entail bigger risks than further pursuing them. The exact timing and order of these developments, however, is subject to policy decisions.
Policy-dependent infrastructure measures
Several infrastructure needs for the Belgian grid strongly depend on the electricity supply mix selected, which is thus mainly driven by policy choices. Swift decision-making regarding the future of Belgium’s energy system is required to anticipate the realisation of these grid developments in a timely manner.
It should be noted that this study points towards overarching needs regarding the development of strategic corridors and therefore does not indicate specific grid development projects. Concrete infrastructure developments (projects) that fall within these strategic corridors should be further investigated through more detailed assessments. Investigations into tangible grid development projects will typically cover a wide range of aspects, such as their technical feasibility, integration into the existing transmission network, routing, integration into market mechanisms, stability aspects, environmental aspects, etc. alongside more detailed economic studies and should be performed with all of the involved TSOs.
When further developing such concrete project proposals, they might deviate from the graphical illustrations shown in the current study. However, if the projects fall within a strategic corridor that was put forward by the optimisation model and if the potential is confirmed by the detailed investigations, they are very close to the theoretical optimal solution and their realisation should be pursued without further ado.
More detailed investigations will now be carried out to establish concrete project concepts that address the different needs. If these more detailed studies reconfirm the anticipated benefits for society, the projects will be presented to the authorities, for approval in the upcoming federal development plan 2028-2038.
Some concrete examples of ongoing investigations regarding new grid development projects that Elia is involved in, are provided in separate boxes throughout the following sections.
5.7.1. DEVELOPMENT AND INTEGRATION OF THE OFFSHORE NETWORK
The North Sea holds a significant amount of potential in terms of the generation of offshore renewable electricity, namely through large amounts of offshore wind potential. This study demonstrates that the large-scale integration of this offshore wind production into Belgium’s electricity system may be an important lever for the decarbonisation of Belgium’s electricity mix. Indeed, depending on the scenario and policy choices, the results demonstrate important benefits linked to the integration of non-domestic offshore wind in Belgium, on top of a total Belgian domestic offshore production which lives up to its total potential of 8 GW.
Of course, the electricity generated offshore needs to be transported back to the Belgian mainland as efficiently as possible. This section provides insights regarding future developments to the Belgian offshore grid and its links to an integrated North Sea offshore grid.
5.7.1.1. MAXIMISE OFFSHORE RES GENERATION IN THE BELGIAN PART OF THE NORTH SEA
The results of this study clearly outline the benefits that are linked to the development of Belgium’s full domestic offshore wind potential of 8 GW and its connection to the Belgian electricity system, for all considered scenarios and from 2040 onwards. This indicates that the development of an additional 2.2 GW of domestic offshore production through the repowering of the first offshore wind zone and/or development of a third Belgian
offshore wind zone will be a no-regret option by 2040 (should it prove to be feasible).
Existing connection capacity to the Belgian mainland, through the MOG and the Princess Elisabeth Island, will not be sufficient to connect this additional 2.2 GW to the Belgian grid. An additional (third) Belgian offshore node will be required. This third node could also be used to connect additional offshore (hybrid) interconnectors, on top of a first hybrid interconnector (see further), and could ultimately be linked to the second offshore node, i.e. the Princess Elisabeth Island. However, the latter is dependent on policy choices.
The possibility of allocating supplementary areas to the development of offshore wind is to be investigated as part of the publication of the new Marine Spatial Plan 2026-2034. The latter should be finalised in 2025 and adopted on 20 March 2026 at the latest [FPS-5].
Therefore, depending on the results of the various feasibility studies, a further increase in Belgian domestic offshore production to a total of 8 GW and its integration into the Belgian transmission grid is a no-regret grid development decision in the lead-up to 2040. The necessary studies regarding its development should be anticipated and the first steps towards its realisation should be undertaken from today onwards. Furthermore, in this framework, a Belgian strategy relating to the repowering of the first offshore zone should be elaborated as soon as possible (such as shown in BOX 4-3).
5.7.1.2. CONNECTING A FIRST BATCH OF NONDOMESTIC OFFSHORE WIND VIA HYBRID INTERCONNECTORS
The results of the current study indicate that investments in hybrid offshore interconnectors (an interconnectors connected to a foreign offshore wind zone) appear cost-efficient for complementing Belgium’s energy supply. As offshore (interconnector) projects take a long time to develop, it is important to continue working towards the development of a first batch of non-domestic offshore wind hybrid interconnectors.
An example - as stated in the federal development plan 2024-2034 - is the hybrid interconnector between Belgium and Denmark, which is named TritonLink. Acknowledging that projects of this
size may encounter several hurdles, Elia is actively investigating several offshore hybrid interconnector opportunities, as described in BOX 5-7
Furthermore, all scenarios confirm the benefit of creating an Offshore Energy Hub by physically connecting the DC assets of the Princess Elisabeth Island with a supplementary hybrid interconnector. The latter is of course also to be realised in HVDC-technology, and thus depends on the level of maturity of this DC coupling technology, namely for DC circuit breakers. This project was approved in the federal development plan 2024-2034 [ELI-3], on the condition of its technical maturity. Figure 5-45 below illustrates this concept.
5.7.1.3. FURTHER INVESTIGATIONS INTO OFFSHORE HYBRID INTERCONNECTORS ARE MINIMUM-REGRET MEASURES
Although the scenarios show different possible decarbonisation pathways for Belgium, it must be acknowledged that offshore wind farms are a mature and proven low-carbon technology and are seen as a cornerstone of Europe’s future green electricity supply. Hybrid offshore solutions and offshore hubs are often the most cost-efficient approach for incorporating far-offshore locations into the Belgian electricity mix. However, the lead time for the realisation of such projects can be as long as 10 to 15 years. Without pre-empting upcoming energy policy decisions, further investigations into offshore hybrid interconnectors should thus be considered as a minimum risk, especially when they are aligned with the strategic corridors identified in the simulations. This will ensure that a first batch of mature projects are ready in the project portfolio, which can then swiftly be continued once a final decision is taken.
At this point, in addition to the TritonLink project, it is too early to identify the specific offshore hybrid projects that would best serve Belgian and European interests (see also Section 4.5). Collaboration with international partners is essential for identifying promising options and establishing the necessary organisational structures and agreements to successfully implement the chosen projects. Therefore, further detailed investigations with these partners have been launched within the framework of the above-mentioned conclusions in order to elaborate a set of key project candidates, which will allow for further decision-making. These investigations are presented in BOX 5-7. The concrete developments will have to be approved in the next federal development plan if commissioning before 2040 is envisioned.
THE OFFSHORE ENERGY HUB ON THE PRINCESS ELISABETH ISLAND FIGURE 5-45
1. A third lever: deployment of offshore floating solar power, is also under investigation. This has not been explored in this study.
This box provides an overview of all the concrete investigations into offshore hybrid interconnectors that Elia is currently engaged in. These investigations are clearly aligned with the results of this study. Although it is far from certain that all these projects will (need to) be realised, each option must be investigated in a timely manner in order to facilitate timely decision-making.
Belgium Netherlands
At the North Sea Summit held in Ostend 23 April 2023, Elia and TenneT signed a memorandum of understanding (MoU) relating to the investigation of the socioeconomic welfare potential (for Belgium, for the Netherlands and for Europe as a whole) of an electrical interconnector between the Netherlands and Belgium that would also be connected to an offshore wind farm (possible realisation: between 2035 and 2040).
The results of the current study confirm the need to further investigate the reinforcement of the interconnection capacity between Belgium and the Netherlands (both on- and offshore). This emphasises the importance of the ongoing investigations.
Belgium Norway
On 15 November 2023, a memorandum of understanding (MoU) was signed by Elia and Statnett. The MoU covers investigations and cooperation relating to one or more potential electrical hybrid interconnectors that would benefit both countries. This could improve security of supply, diversify energy sources, facilitate the integration of wind power across sectors and create positive climate effects.
The offshore area which is being considered is the Sørvest F area (an extension of the Sørlige Nordsjø II area) in Norwegian waters. The overall offshore length of the interconnector would amount to a total of ~1,000 km.
Source: www.equinor.com
The development and commissioning of the potential BE-NO hybrid interconnector will be aligned with the timeline and size of relevant and anticipated wind farm allocations and wind developer plans. The investigations covered by the MoU are in line with the political decision-making process and timings set by the Norwegian government. This potential project could provide an appropriate solution for the strategic North – South offshore corridor, which is identified in this study as a key building block of offshore development in the North Sea.
Currently, the examination of several concepts is ongoing. Statnett (NO) has signed similar MoUs with Amprion (DE), Energinet (DK), National Grid (UK) and TenneT (DE).
Belgium Germany
Besides the investigations that cover onshore connection options between Belgium and Germany (see BOX 5-10), an offshore hybrid interconnector that would link Belgium and Germany via the North Sea is also to be investigated as a possible solution for the strategic North-South corridor. The German and Belgian governments signed a joint statement during the Energy Council that was held on 30 May 2024, agreeing to further explore this idea. The next step will involve discussions being held between the involved TSOs and determining the scope of the study.
Ireland United Kingdom Belgium
The governments of Ireland, the United Kingdom and Belgium signed a letter of intent (LOI) covering electricity interconnectors during the Bruges Offshore event on 15 May 2024. This LOI is a clear example of the willingness of the respective nations to enhance regional cooperation and to move from a current bilateral perspective to more regional, multi-lateral cooperation.
Elia is committed to supporting the investigations initiated by different governments. Acknowledging that the results of this study demonstrate that a renewable energy corridor stretching from Ireland through the UK to Belgium holds potential, Elia will thus work alongside the Irish and British TSOs to investigate optimal infrastructure options to find fitting solutions for this strategic corridor. This work will also consider possible offshore routes, integrating offshore wind from Ireland and the UK into the transmission system of each country. Plans for this work still need to be established, but the objective is to deliver input for the North Sea Summit being held in June 2025.
5.7.1.4. POLICY-DEPENDENT EVOLUTION OF THE BELGIAN OFFSHORE GRID
In several scenarios, the North Sea emerges as a major source of electricity production for Belgium, since it is seen to play a crucial role in achieving the continent’s climate goals. In situations where policymakers decide that more electricity generated in the North Sea will be tapped to complement Belgium’s electricity mix, on top of the currently planned offshore projects, offshore electricity hubs in Belgian waters will become indispensable, given the scarcity in coastal landfall points and cable routes to the inland transmission system. These hubs, which differ in number and size depending on the scenario being explored, bundle renewable energy produced in the North Sea and allow this energy to be transported in bulk to Belgian load centres.
Furthermore, these hubs would not only be vital for the decarbonisation of Belgian society but would also be an essential building block for the decarbonisation of Europe. Although it is a relatively small country with a short coastline, Belgium’s central position is of strategic importance for the buildout of offshore renewable energy and its transportation back to shore and across the continent. With its access to the North Sea and proximity to several electricity markets (France, UK, Netherlands, Germany and Lux-
embourg), such offshore hubs would allow for the very efficient trade of renewable electricity between these different markets, benefitting customers throughout Europe.
Furthermore, creating offshore transport capacity for bulk transport between these different countries allows existing onshore transmission infrastructure to be bypassed, so reducing onshore reinforcement needs.
Belgian offshore electricity hubs could serve as vibrant energy roundabouts, powering an offshore backbone integrating offshore wind from (for example) France, Belgium, the United Kingdom, the Netherlands, Norway or Denmark.
Beyond the technical challenge of realising a grid which spans the entire North Sea, other barriers exist and are currently slowing down the development of offshore hybrids. Elia is actively working on alleviating these barriers and proposing solutions to them through publications such as the ‘Making Hybrids Happen’ [ELI-9] paper that was jointly developed with Ørsted, and the OTC expert paper II [OTC-1].
OFFSHORE TSO COLLABORATION (OTC)
The OTC is an informal group of offshore TSOs from nine Member States and third countries which border the North Seas. Its purpose is to accelerate the development and implementation of an offshore grid and to support the realisation of ambitious political goals in the best possible way. The OTC is working on the implementation of an offshore hybrid grid in the North Seas that includes hybrid interconnectors, energy hubs and hydrogen infrastructure and is based on the political declarations of the North Sea summits in Esbjerg and Ostend.
Elia plays a very active role in its work, since harnessing the offshore renewable potential of the North Sea is of vital importance for the decarbonisation of Belgian society.
During the offshore summit held by the Belgian government on 15-16 May 2024 in Bruges, the second OTC expert paper was launched. A third expert paper is planned to be delivered during the North Sea Summit being held in June 2025.
The paper covers both the key projects that will underpin the development of a North Seas grid in the long term and an initial grid map of hybrid projects. The most advanced projects amongst those mentioned above are already depicted in the map, such as TritonLink, Nautilus, Belgium-Netherlands and Belgium-Norway.
The paper also includes a series of policy recommendations, each of which falls into one of three areas:
1. supply chain enhancement;
2. market conditions framework;
3. cost sharing and funding of infrastructure related to offshore hubs and hybrid projects.
The OTC plays a vital role in offshore grid development in the North Seas as it fulfils the role of the missing link between conceptual long-term studies and the creation of a short- to medium- term coherent multi-lateral project portfolio. Indeed, current approaches, which have mainly resulted in bilateral agreements and follow-up, need to be replaced by a multi-lateral approach, allowing all impacted TSOs to contribute during the early stages of infrastructure development.
In order to achieve this, the offshore project investigations mentioned above will be fed into the OTC investigations along with project investigations from other TSOs (that Elia is not involved in). This will ensure that projects are not only developed for bilateral benefits, but that they are assessed on a more holistic level, allowing the most optimal combination of all of these projects to be selected.
5.7.2. THE FURTHER DEVELOPMENT OF ONSHORE INTERCONNECTORS
This study highlights that onshore interconnectors continue to play a crucial role in ensuring the efficient dispatch of electricity throughout Europe, regardless of Belgium’s dependence on imports. Strengthening the interconnection capacity across certain borders is highly cost effective and continues to yield significant benefits for society. Therefore, the further development of additional Belgian interconnectors (on top of those that have been approved in the federal development plan 2024-2034) remains beneficial. This is critical for Belgium’s full integration
into the European electricity market and is a crucial component for a net-zero energy system.
Although the further reinforcement of Belgian interconnectors remains beneficial, the borders to be prioritised appear to depend on the electricity mix chosen for the country and neighboring countries. Figure 5-46 provides an overview of the interdependency between the benefits of reinforcing a specific border in relation to energy mix choices.
Three main trends clearly emerge:
1. Point-to-point interconnectors with the Netherlands become more attractive in situations where lower levels of offshore generation are connected to Belgium. This is logical, since such interconnectors would give Belgium access to the vast domestic offshore potential of the Netherlands.
2. Interconnectors with Germany and Luxembourg are more beneficial in situations where Belgium’s local electricity supply is increased. Indeed, in such situations, these interconnectors offer more opportunities to sell power produced in Belgium to areas with limited access to renewable energy.
3. The need for interconnection capacity between Belgium and France is not significantly determined by the energy mix choices in Belgium.
The following sections link these general trends and study results with concrete onshore interconnector projects. As mentioned previously, regarding possible offshore projects, hybrid solutions are more attractive, as they offer a cost-effective solution for integrating offshore wind into the system whilst increasing cross-border capacity.
5.7.2.1. REINFORCEMENT OF THE INTERCONNECTION CAPACITY WITH THE NETHERLANDS
The reinforcement of Belgium’s north border will prove to be essential for the decarbonisation of Belgian society through imports of green electricity from northern Europe. Indeed, the current study reveals that the reinforcement of cross-border interconnection capacity with the Netherlands is a no-regret measure in all considered scenarios. The expected benefits increase as domestic (renewable) electricity generation decreases, but the business case remains positive in all scenarios. This is partly because additional cross-border reinforcement can be done in a very cost-efficient way, by reinforcing the existing axis between the substations of Van Eyck (Belgium) and Maasbracht (the Netherlands) through the replacement of the existing conductors with high-performance conductors (HTLS conductors), which more than double the transport capacity on that particular axis.
These results confirm the analysis that was carried out as part of the federal development plan 2024-2034; more information about this project can be found under section ‘4.3.2. Versterking
Van Eyck - Maasbracht (NL)’ [ELI-3]. As discussed in BOX 5-7, the realisation of this project is being investigated in line with the existing MoU that was signed by Elia and TenneT.
A further increase in the exchange capacity between Belgium and the Netherlands, on top of the no-regret reinforcement of the Van Eyck – Maasbracht axis, may be beneficial in multiple future scenarios. Indeed, the business case for an additional cross-border link between Belgium and the Netherlands will, for example, become increasingly attractive when:
◆ domestic production in Belgium is lower, meaning that Belgium will depend more on imports from other countries;
◆ technology will not prove to be sufficiently mature for realising an offshore meshed DC grid, requiring far-out offshore renewable electricity to be imported more via the onshore grids.
Such developments may lead to a positive business case for an additional link between Belgium and the Netherlands from 2036 onwards.
PENTALATERAL STUDY
On 1 March 2023, an MoU was signed between five TSOs, of four countries: RTE (France), Amprion (Germany), Transnet (Germany), Creos (Luxembourg) and Elia (Belgium). The resulting study, which is currently being developed, is therefore referred to as the Pentalateral Study.
The study aims to identify additional interconnector needs and internal reinforcements where relevant between Belgium, Luxembourg, France, and Germany after 2040. It also seeks to identify potential project candidates that should be included in future international planning processes (TYNDP) and national development plans.
5.7.2.2. REINFORCEMENT OF THE INTERCONNECTION CAPACITY WITH LUXEMBOURG
Luxembourg is one of the European countries that lacks a direct sea connection. It will depend on green electricity imports from its neighbours as it transitions to net zero.
A clear strategic corridor identified in this study is the corridor that crosses the south-east of Belgium. Although this is not a newly identified need, it is the first time that the corridor features so strongly in the results. Indeed, cross-border reinforcement between Belgium and Luxembourg is shown to be beneficial across all scenarios. It can thus be considered as a no-regret investment. However, more detailed work is needed to assess the feasibility of different technological options, as this will influence the costs. Synergies with other cross-border projects, for Belgium and for other countries, may also prove to be possible through a more holistic analysis approach across multiple borders.
SECOND INTERCONNECTOR BETWEEN BELGIUM AND GERMANY
A second HVDC interconnector between Belgium and Germany was provisionally included in section 4.3.3 of the federal development plan 2024-2034, to give readers an idea of its estimated potential (Tweede interconnector België-Duitsland [ELI-3]). The results of the current study confirm the potential identified in the framework of the federal development plan.
Building on the results presented above and on the extensive experience gained through the construction and operation of their first shared interconnector, Elia Transmission Belgium and Amprion recently intensified
their exploratory work related to a second electricity interconnector and launched a concept development study. The study will be finalised before the end of 2024 and will put forward an optimal capacity for the underground HVDC link (1 vs 2 GW), a detailed cost-benefit analysis, an indication of the connection points with the transmission systems in both countries, an idea of the necessary reinforcements of the internal backbones in order to host the new interconnection capacity and, finally, an initial timeline relating to its realisation, with an expected commissioning in 2037-2038.
5.7.2.4. REINFORCEMENT OF THE INTERCONNECTION CAPACITY WITH FRANCE
The project candidates that are relevant for Belgium relate to further onshore reinforcements between Belgium and France on the one hand and Belgium and Luxembourg on the other.
The authors of the study intend to work towards a joint feasibility report which focuses on a common vision of grid development projects after 2040 (cross-border and internal reinforcements where relevant). This common vision is to be finalised in mid-2025, so ensuring that the results can be taken into account during the next TYNDP and subsequent national development plans.
5.7.2.3.
REINFORCEMENT OF THE INTERCONNECTION CAPACITY WITH GERMANY
ALEGrO, the first interconnector built between Belgium and Germany, was commissioned in November 2020. It was realised with HVDC technology and has an exchange capacity of 1 GW in both directions. The optimisation model selects ample additional interconnection capacity between Belgium and Germany, on top of ALEGrO, in all scenarios but the Global Ambition scenario. Within the Distributed Energy scenario, an additional cross-border capacity of up to 2 GW, on top of ALEGrO, proves to be beneficial by 2040, which is even increased to 3 GW by 2050. As shown in Figure 5-46, the higher the level of domestic electricity supply and/or non-domestic offshore wind in Belgium, the more attractive this reinforcement becomes.
Whereas the study shows that the additional cross-border capacity is beneficial in almost all scenarios, the nature of its behaviour in the market depends on the market situation and configuration in both countries. For example, depending on the connection points and the market configuration in Germany, cross-border exchanges may tend towards a position of net exports of renewable electricity to the energy-intensive Ruhr area, or rather towards a position of net imports of renewable electricity from the high amounts of German renewable generation capacity. In any case, across all scenarios, the flows between both countries remain relatively well balanced in both directions, showing a clear benefit for both countries in the effective integration of renewable generation on a European scale.
The border between France and Belgium is already very well developed. The further reinforcement of onshore cross-border capacity is not directly selected by the optimisation model of the current study; however, implicitly, the model increases cross-border capacity between Belgium and France through an offshore route via offshore French and Belgian nodes. Should the feasibility of such offshore development prove to be difficult, or undesirable for other reasons, the realisation of an additional onshore
interconnector may prove to be beneficial and desirable. As the need for Belgian-French cross-border reinforcements seems to be unaffected by choices relating to the Belgian energy mix, the feasibility and impact of the different (onshore and offshore) options need to be explored. The further reinforcement of cross-border capacity between Belgium and France is currently being studied as part of the same Memorandum of Understanding, elaborated for the launch of the pentalateral study (see BOX 5-9).
5.7.3. THE CREATION OF HOSTING CAPACITY
The development of domestic RES and the increasing electrification of the industrial, mobility and heating sectors carries important implications for the electricity system. As the electrification of local end use and the buildout of domestic RES is expected to primarily unfold over the next 10 to 15 years, taking swift action now in order to create hosting capacity across the grid in a timely manner is of the utmost importance.
Although the realisation of new infrastructure is essential, it is not the only lever that needs to be deployed in order to create sufficient hosting capacity. It should be emphasised here that unlocking flexibility on both the consumer and producer sides is the first way to swiftly create hosting capacity by efficiently managing congestions. However, as flexibility for congestion
GRID HOSTING CAPACITY
In order to guide grid users (either new grid users or those who want to increase their offtake) to suitable grid connection points, Elia launched a Grid Hosting Capacity map [ELI-10] at the end of 2023. The map provides a simplified indication of the grid hosting capacities that are still available on top of capacity reservations/allocations/ low-voltage connected evolutions and also takes into account planned grid infrastructure development.
management is not the central focus of this chapter (and study) it will not be explored in any detail.
Furthermore, the smart selection of locations for new grid connections for new large load offtake facilities, such as big data centres and (ultimately) power-to-X plants, plays a crucial role in ensuring the grid is used in the most efficient manner. Bringing production and large loads closer together shortens the distance electricity has to travel from generation to load, reduces losses and also reduces the need.
Therefore, the smart selection of sites for large load centres is not just about finding a location that meets the needs of individual consumers, but it is also related to the optimisation of the grid on a holistic system level.
The map also provides users with information about the capacity for flexible connections. This refers to the maximum percentage of permissible yearly energy curtailment relative to the yearly total generated or consumed energy. This map effectively serves the purpose of guiding new electrical loads to suitable locations.
In this vein, depending on the scenario, new sites which consume a lot of electricity and that have a certain degree of freedom with respect to their choice of location for site development, can be best placed close to the landing sites of offshore wind or nuclear production sites. And, vice versa, the integration of new offshore wind can actively support an efficient use of the grid by being connected near to the large load centres in Belgium.
This not only benefits individual consumers through potentially shorter connection lead times, but also contributes to a less expensive and more efficient and sustainable electricity grid for everyone.
Although both levers mentioned above are indispensable, new transmission infrastructure remains essential across the three parts of the Belgian electricity system (see Figure 5-48) to create the required hosting capacity for new loads, production and storage:
1. The horizontal grid is the Belgian backbone (380 kV and 220 kV) to which interconnectors, centralised production and large industrial loads and storage are connected (typically >300 MVA). The required evolutions of the horizontal grid are discussed in Section 5.7.3.1.
2. The vertical grid is supplied via transformers connected to the backbone, and provides connection opportunities for big industrial loads, decentralised production and storage (>25 MVA) and supplies the distribution grid. This network will, over time, evolve to voltage levels of 110 kV and 150 kV, increasing both its transport capacity and efficiency.
3. The distribution grid supplies small industrial grid users and residential loads and is used to connect small decentralised production and storage (<25 MVA). SCHEMATIC
With regard to the vertical and distribution grids, this study shows that the increase in electricity consumption drives reinforcement needs, which are significant in all scenarios. To match the required load evolution in each scenario, significant investments should be made for:
◆ The realisation of new substations to connect the new loads to the three parts of the system;
◆ Increasing the transformation capacity from the 380 kV and 220 kV grids (the ‘horizontal’ grid) to the underlying, regional transmission grids of 30 kV to 150 kV (the ‘vertical’ grid);
◆ The reinforcement of the 110 kV and 150 kV transmission grids - this relates to the reinforcement or upgrade of overhead lines and new underground cables;
◆ Increasing the transformation capacity from the vertical grid to the distribution grids
◆ The reinforcement of the distribution grids. These investments depend on the distribution of electricity consumption across the different elements of the grid. A grid user connected to the distribution grid will also impact the vertical grid, whilst a grid user connected to the horizontal grid will not. For some segments, the connection points are easy to forecast (EVs and residential heating are mainly expected to be connected to the distribution grid), whilst for other industrial load segments, the connection points will depend on the size and type of the industrial assets involved, which is more difficult to predict.
ELIA GRID HOSTING CAPACITY MAP
FIGURE 5-47
Across the different scenarios, the impact of decentralised generation on the grid reinforcement of the vertical system is assumed to be rather limited. The main impact is due to the level of penetration of decentralised and residential production (onshore wind, solar) which will limit the peak grid loading and therefore slightly limit the need for reinforcement. The need for additional grid reinforcements for the creation of hosting capacity will thus be higher in the scenarios with more focus on centralised production (nuclear production, offshore production) or more focus on imports from neighbouring countries, and lower in the scenarios with more focus on decentralised production.
Realisation of new substations
Historically speaking, the 380 kV backbone was mainly constructed for the transportation of bulk energy. Grid users connected to the 380 kV system were limited to large production units and very few large loads. Given the electrification of society - and, more specifically large industrial loads - and the emergence of large batteries and data centres, an increasing number of grid users will be connected directly to the 380 kV system in the future. To facilitate such connections, the creation of hosting capacity hubs at the 380 kV level is essential. As part of a first phase, this will also make it possible to free up capacity on the underlying networks for the electrification of smaller grid users.
The federal development plan 2024-2034 identified the need for 5 supplementary substations at the 380 kV level from 2024 to 2034, for currently existing areas with large loads: Antwerp, Hainaut, the Ghent area and Albert Channel. These substations will help to connect direct grid users to the grid and will also increase the transformation capacity to the lower voltage levels.
However, not all new loads are limited to the existing industrial areas. For example, batteries, power-to-X and data centres can be much more flexible in terms of their location. Supplementary hosting capacity hubs at the 380 kV level are thus to be expected in the coming decades.
For example, when observing Figure 3-39, a significant number of large-scale battery volumes (ranging from 3.4 GW in the LFLEX sensitivity, to 5.4 GW in DE, GA, ELEC and SUFF scenarios/sensitivities and up to 9.4 GW in HFLEX sensitivity) appear by 2050. Current development projects of large-scale batteries in Belgium hold a wide variety of power capacity, from tens of MW up to 750 MW (and possible higher). If we assume an average of 300 MW per battery, around 11 connections in the 3.4 GW case, around 18 connections in the 5.4 GW case, and up to 31 connections in the 9.4 GW case would be required for the grid connection of largescale batteries alone.
Although it is very difficult to predict exactly how many new substations would be required at the 380 kV level, taking into account the example above, the emergence of new large loads such as data centres and the increased need for transformation capacity in the vertical system (see below), an additional need for 5 to 10 supplementary hosting capacity hubs at the 380 kV level could be expected by 2050 on top of the identified needs for load clusters in the federal development plan. Consequently, new substations across the vertical and distribution grids are also needed to connect more grid users and free up capacity at lower levels.
Increasing the transformation capacity from the 380 kV grid
Here, two different aspects must be combined. Firstly, the increasing loads across the vertical and distribution systems will require more transformation capacity from the horizontal grid. Secondly, the increasing flows across the horizontal grid will drive the need to split up the vertical grid into many smaller electrical areas to limit the size of the flows across the lower voltage networks (e.g. instead of having one entire 150 kV network covering all of Belgium, in the future several smaller, separate 150 kV grids will exist, each covering a specific regional area). Taking the N-1 criteria and short-circuit limitation of the assets into consideration, those two aspects will lead to the need to install new large transformers (>300 MVA).
Reinforcement of the 110 kV and 150 kV transmission grids
The regional hosting capacity will have to be created for industrial loads and large decentralised production sites and storage. The reinforcement of overhead lines and new underground cables will be required to cope with the higher flows necessary for supplying the increased load. These lines and cables typically have a capacity of 200-300 MVA.
Increasing the transformation capacity to the distribution grids & reinforcement of the distribution grids
The electrification of transport, residential heating and small industrial loads will impact distribution grids at low-voltage and medium-voltage levels. This implies huge investments in the distribution grids: low- and medium-voltage underground cables, new MV substations, new transformers.
To cope with the load increase across the distribution grid, additional transformation capacity from the vertical grid will be required. A typical 150 kV/MV transformer has a capacity of 50 MVA.
Time horizon
As the creation of hosting capacity is a must for the decarbonisation of society, a large part of the required grid reinforcements is a no-regret as they are needed across all scenarios. For hosting capacity, the larger impact is felt across the distribution grid, where the needed investments are 2-4 times higher than for the vertical grid. Still, this remains a challenge for the vertical grid, across which the needed projects are more difficult to realise and take more time. A typical investment in the vertical grid takes 5 to 10 years to be realised.
New infrastructure investments must be robust enough to meet future needs throughout their typical lifetime of 40 years. Therefore, the investments that are planned for 2036 must already take changes that will happen by 2050 into consideration. This is why the next ten years will be crucial, since a large part of the investments will have to be realised in this period.
5.7.4. THE DEVELOPMENT OF A STRONG AND ROBUST INTERNAL BACKBONE GRID
The grid developments discussed in the previous sections will only be possible if a robust, reliable and meshed internal backbone grid is in place. Indeed, the internal backbone grid must be capable, with a high degree of reliability, to provide sufficient hosting capacity for an increased offtake of electricity from the 380 kV grid and below, facilitate an increased amount of international exchanges of electricity stemming from new (on- and offshore) interconnectors, and enable the integration of large quantities of new renewable or low-carbon generation into the system.
Today, the backbone grid consists of a partially meshed 380 kV grid. Several reinforcement projects have already been approved in previous federal development plans, which have been or are currently actively being developed. Important ongoing reinforcement projects include the HTLS reinforcement of a large part of the 380 kV backbone grid and the new Ventilus and Boucle du Hainaut corridors. These planned reinforcements are of the utmost importance for allowing further evolutions across the backbone grid, as well as for enabling the connection of new offshore developments and new onshore interconnectors. Without these projects, very few of the projects described in this chapter will be possible, obstructing Belgium’s path to decarbonisation.
5.7.4.1.
FULFILLING THE REMAINING POTENTIAL FOR THE REINFORCEMENT OF THE EXISTING 380 KV FLUX AXES
The currently approved backbone reinforcement projects comprised in the federal development plan 2024-2034 include the reinforcement of most of the existing 380 kV flux axes in Belgium, mainly through the replacement of the current conductors with new HTLS conductors, which potentially more than doubles the transport capacity of these axes. For two axes, a reinforcement decision is yet to be made. In light of the results of the current study, the reinforcement of these axes is proven to be a no-regret measure:
◆ reinforcement of the Zandvliet – Doel – Mercator corridor;
◆ reinforcement of the south-east Gramme – Brume –Villeroux – Aubange corridor.
More information about these projects is included in the federal development plan 2024-2034 [ELI-3] in Sections 4.5.1.2. and 4.5.1.3. It should be kept in mind that those sections describe indicative solutions which need to be further explored and fleshed out. The solution which will be adopted may thus deviate from the one described in the development plan. The reinforcement of the Doel-Zandvliet connection with HTLS conductors has been identified as being of the highest priority and a concrete project will swiftly be launched.
Substation 380 kV
Axis already reinforced / without potential for further reinforcement
Axis with remaining potential for further reinforcement
5.7.4.2. REINFORCING THE WEST-EAST CAPACITY OF THE INTERNAL BACKBONE
The currently planned west-east corridors - Ventilus and Boucle du Hainaut - are essential measures to:
◆ increase the capacity from the Belgian coast to the load centres across the country;
◆ allow for the integration of the planned offshore production (up to 5.8 GW);
◆ create additional hosting capacity for growing offtake and decentralised renewable production;
◆ increase reliability & security of supply for the respective regions;
◆ to ensure competitive and affordable energy prices by facilitating increased market exchanges with the UK and France;
However, in the lead-up to 2050, more offshore capacity might be integrated into the Belgian backbone grid (for example the evolution towards the full Belgian potential of 8 GW of domestic offshore production, and the development of non-domestic offshore wind hybrid interconnectors). The planned backbone grid with Ventilus and Boucle du Hainaut will not be able to host such additional connections on the coastline.
For the further integration of offshore connections beyond the Princess Elisabeth Zone and the Nautilus interconnector, additional west-east transport capacity will need to be realised across the backbone grid.
As part of a first phase, and up until a certain number of connections is reached, this additional west-east capacity could be realised by connecting these future offshore wind farms individually to strong 380 kV nodes situated deeper inland. This approach has already been applied in the design of the TritonLink project, for which a connection point in the Ghent area has been proposed.
When several offshore developments materialise, a holistic approach will be required to design the future backbone grid evolutions as well as to define an optimised set of connection points. The design will be influenced by multiple factors, such as local increases in the electrical load (which will increase the local hosting capacity for connecting additional offshore developments), or an uptake of nuclear generation (which will decrease the capacity for additional offshore hybrid interconnectors).
Further exploration should lead to the definition of the optimal approach and configuration for further increasing the backbone’s west-east transport capacity.
It is important to note that the timely realisation of the Ventilus and Boucle du Hainaut projects, and the resulting meshed AC backbone grid consisting of three closed 380 kV loops, is an essential prerequisite for the further west-east development of the backbone.
5.7.4.3. POLICY-DEPENDENT REINFORCEMENTS
On offshore generation
As mentioned above, increased offshore ambitions with larger amounts of (far-out or domestic) offshore wind production or hybrid interconnectors that are to be integrated into the Belgian energy system will put a lot of pressure on west-east transport capacity needs in the Belgian backbone grid.
On prolonging existing nuclear generation
A further uptake of other centralised (i.e. nuclear) production in Belgium may give rise to additional needs for internal transport capacity, as well as the further development of cross-border interconnectors. If the extension of more than 2 GW of existing nuclear units is planned, the electrical infrastructure around the current nuclear sites needs to be prepared. Belgian nuclear phase-out plans since 2003, the arrival of additional grid users nearby, and changes in European legislation have reduced the grid hosting capacity for such extensions.
On new nuclear
Identifying potential future new nuclear sites is an essential step. This involves preparing the backbone grid infrastructure at the most probable locations among those sites and integrating them into the overall Belgian backbone grid.
These evolutions will lead to the need for a holistic approach to the planning of further backbone grid reinforcements. This may give rise to overlay corridors or grids, for which the optimal configuration and sizing will be highly dependent on the exact number and locations of offshore developments, centralised onshore production facilities, and onshore interconnectors. A clearly defined roadmap for Belgium’s future energy system is essential for the timely anticipation of the further reinforcement of the Belgian backbone grid as Belgium approaches net zero in 2050.
A HOLISTIC APPROACH TO BELGIAN SPATIAL PLANNING
Our research has revealed a powerful insight: if policymakers decide on the development of non-domestic offshore wind for Belgium, this will require substantial amounts of transmission capacity to connect the offshore hubs to the onshore grid. Given Belgium’s limited coastal landfall points and scarce cable routes to the inland transmission system, the planning of cable routes on a project-by-project basis lacks efficiency.
We propose a more integrated and holistic approach to spatial planning - one that fosters collaboration between different sectors and authorities. This approach will allow the required energy corridors to be promptly identified and allocated with environmental and social implications being considered early on in the infrastructure realisa-
tion phase. Forward-thinking approaches such as this will streamline permitting procedures, foster public acceptance and ultimately pave the way for the successful integration of large-scale offshore renewable energy into our existing energy system.
For situations which involve high amounts of domestic nuclear power generation and high amounts of domestic RES, the amount of required offshore-onshore transmission capacity remains limited. Yet the need for a holistic approach to spatial planning remains imperative in a densely populated area such as Belgium. Indeed, the location of new nuclear sites demands thoughtful consideration and might have a significant impact on required electricity corridors.
5.8. OTHER KEY INSIGHTS
5.8.1. MATERIAL NEEDS AND OTHER ENVIRONMENTAL ASPECTS
The objective of this subsection is to quantify the material requirements for the Central onshore RES scenario of DE and GA for Europe. The material needs have been calculated for all the countries included in this study, as illustrated in Figure 5-50, and specifically for Belgium, as shown in Figure 5-51. The evaluated material requirements include the amount of copper, cobalt, graphite, lithium, and nickel used by the power sector (e.g. wind farms, photovoltaics, gas units), electrolysers, and electric vehicles. Note that electric vehicles in this context include passenger cars, vans, busses, and heavy trucks. However, it should be noted that the materials required for the grid are excluded from the analysis. In order to help the reader to quantify the increased needs in materials, Table 5-1 shows the world production capacity in kilotonnes for 2023 [USG-1].
Despite the scale differences between Europe and Belgium, Figure 5-50 and Figure 5-51 exhibit comparable trends. The demand for copper is primarily driven by electric vehicles, offshore wind (less impactful for Belgium), onshore wind and the photovoltaics.
As for cobalt, lithium, nickel and graphite, the demand is largely fuelled by electric vehicles.
For all the materials considered, the additional requirements represent a significant portion of the current production. This surge is largely attributed to the expected evolution in mobility choices.
For instance, under the DE scenario, the demand for lithium is expected to increase more than eightfold by 2050, compared to the projected demand in 2024. Similarly, the demand for copper is projected to be more than 4 times by 2050 the projected demand in 2024.
The estimates are subject to changes in technological advancements, particularly those related to EVs, where battery types and energy density are undergoing significant evolutions. Nonetheless, the substantial increase in material needs highlights that
material availability will be a critical factor for the success of the energy transition. This is a global challenge that must be addressed to ensure a smooth transition towards sustainable energy sources.
The demand for materials in Belgium alone is projected to double or even quadruple, but this amount is relatively small when compared to the rest of Europe, a logical outcome given Belgium's proportional size. The requirement for materials is crucial in the energy transition and should be closely monitored at both European and global levels to ensure these materials are available and can be recycled and reused in the future. As for Europe, the main impact is driven by mobility.
Considering the minimal impact of supply technologies on the total material requirements examined (excluding copper), material usage is not expected to be a crucial criterion. However, it's important to note that this analysis does not consider other types of materials (such as rare earth metals, for example). This is undoubtedly an aspect that requires further monitoring.
5.8.2. LONG-DURATION ENERGY STORAGE
While this study covers the most important technologies for 2050 as they are known today, unforeseen technological breakthroughs could happen in the lead-up to 2050 which enable a transition at a lower cost. One potential such breakthrough is the advent of cheap long-duration energy storage (LDES). Such storage types have energy contents that enable them to work on an interday or even multi-day basis (see also Figure 5-52). LDES therefore has the potential to assist during longer periods of shortage where their shorter-duration counterparts do not. LDES is, like shorter duration storage, capable of smoothening out variations in electricity supply on a short-term basis (see also 5.4.5 - Ramping) but also has the potential to do this on an interday or even multi-day basis. To provide some insights on the behaviour of such technologies in the energy system an ex-post optimisation based on electricity prices was performed. Figure 5-52 shows the amount of hours a storage system with a given energy content and efficiency are discharging in the DE scenario with central renewables. The amount of hours during which the storage is discharging gives an idea of how actively the storage
was used. A first thing that can be noted is that storage systems with a higher efficiency are more actively used than their lower efficiency counterparts. Given their higher efficiency and thus lower losses, they are able to take advantage of smaller price variations and thus are used more often. A second observation is that, for a given efficiency, the longer the charge/discharge time the more hours the battery is used. Indeed, batteries capable of delivering their nominal power for more consecutive hours are capable of charging and discharging for longer durations of low and high prices. Finally, a more limited increase in hours of charging per year per additional hour of storage is seen once battery sizes reach 4 to 8 hours, depending on the efficiency of the batteries. This indicates that a significant chunk of battery operation happens during price phenomena with a duration of 4 to 8 hours. In this case, solar PV generation causes the effect. In addition to the figure, simulations are performed for storage up to a duration of 100h in which the slowly increasing amount of hours of discharging when compared to the hours of storage is confirmed.
5.8.3. MARGINAL COSTS AND PRODUCTION COSTS
The focus throughout this report is on finding the energy system which reaches GHG emission targets with the lowest costs and as such maximises the benefits for society. The way these benefits and costs are distributed throughout society will ultimately depend on the market design and financial incentives that are put in place. One question one might ask is: ‘Would the growing share of renewables in the electricity mix, which have a very low operational cost, result in a lot of moments with zero or very low marginal prices?’. To explore this question, the hourly energy mix obtained in the DE 2050 scenario for a given Monte Carlo year is subdivided into technologies with a low operational cost (renewable and low carbon production such as nuclear), technologies with a with high marginal cost (such as gas based generation), flexibility (which discharges when marginal costs are higher and charges when marginal costs are lower) and imports. The hourly results are then sorted from moments with the highest marginal prices to lowest marginal prices. The results for the DE 2050 scenario sorted by marginal prices in Belgium and for the domestic renewable generation (excluding hybrids) of Belgium and its neighbouring countries (Netherlands, Luxembourg, Germany and France) is shown in Figure 5-53. Several interesting observations can be made:
◆ Gas-based generation is running somewhere in Belgium or its neighbouring countries 35% of the time (while representing less than 6% of the energy mix for the region and Monte Carlo year shown). This indicates that marginal prices are in the high range at these moments in at least one of the considered zones.
◆ 75% of the time flexibility is used to reduce demand or increase supply, implying that marginal prices are high enough to warrant the activation of these technologies.
◆ Finally, marginal prices are not guaranteed to be zero in the remainder of the hours as the charging of storage or production of hydrogen through electrolysers may be the technology setting the price.
◆ As a result, it can be concluded that marginal prices are likely to remain positive for a significant amount of the year even in a renewables-dominated electricity system.
Finally, it should be noted that having a significant share of the production producing at near-zero marginal cost means that for a given hour the marginal cost could be significantly higher than the average operational costs.
LONG DURATION ENERGY STORAGE AMOUNT OF CHARGING VERSUS
ENERGY MIX AS A SHARE OF DEMAND FOR BELGIUM AND NEIGHBOURING AREAS (FRANCE, GERMANY, LUXEMBURG, NETHERLANDS) SORTED BY MARGINAL PRICE IN BELGIUM
FIGURE 5-53
5.9. KEY TAKEAWAYS
Building further on the key take aways of Chapter 4, this Chapter explored first the multi-energy results for Belgium in order to give the overall picture. The core of the Chapter treats the different supply options (and demand levers) identified for Belgium. In addition, a focus was made on the required infrastructure. Finally, other implications of the scenarios such as the material used were touched upon. Several key insights can be extracted from the various analyses, and these are outlined below.
THE MULTI-ENERGY PERSPECTIVE
All investigated scenarios assumed that Belgium’s final energy demand is estimated to decrease by 25 to 45% by 2050. This decrease is mainly enabled through an increased energy efficiency: notably the electrification of energy consumption, which is energetically more efficient than the use of molecules. This results in significant challenges for the electricity system but also creates opportunities for Belgium as half of the country’s electricity supply in the lead-up to 2050 is still to be defined.
The main take aways on system level for Belgium align closely with those on a European scale. However, there are several unique aspects that need to be considered for Belgium:
◆ Belgium’s domestic renewable energy potential is limited and will not be able to cover the entire energy demand;
◆ Belgium has been, and will continue to be, a significant energy importer although this is expected to decrease in the future as domestic renewable energy generation increases and final energy demand decreases;
ELECTRICITY SYSTEM IMPACT
Flexibility
The dependence of renewable energies on weather conditions results in the electricity system’s supply becoming increasingly volatile. The development of and access to different modes of flexibility as well as the European integrated electricity market will be key to manage this volatility. Both will be essential to manage the energy system in the most cost-efficient way and to limit the economic curtailment of RES.
Adequacy
The tools for managing adequacy were put in place by the outgoing government. The need for similar tools will be felt throughout the analysed horizon. However, the relative contribution of adequacy measures to the overall cost of the future energy system is rather limited, and technical solutions can be deployed within a relatively short timeframe.
◆ The mixes for the different energy vectors were provided in this chapter in order to evaluate their annual supply balances, even though this was not the central focus of the study. The results highlight that there are still many trade-offs to be made between the type of molecules to be used as carrier as well as their source;
◆ The coupling between the electricity and molecule sector decreases in all studied sensitivities compared to today. Therefore, it can be argued that the infrastructure design of electron and molecule systems can be decoupled in Belgium. However, attention should be paid to the location of the interactions (power plants and electrolysers);
◆ Estimated total costs for the different demand scenarios show that the most electrified scenario leads to the lowest total system costs (all energy vectors and end-uses included).
Grid development
No-regret infrastructure investments in distribution, local transmissions grids, industrial clusters and are typically linked to the electrification of demand and the development of domestic RES.
In addition onshore interconnections were found to be beneficial in all studies scenarios. These investments should be prioritised and implemented without delay to avoid any potential setbacks in the energy transition.
Other important grid investments, particularly in the Belgian backbone and offshore grid, depend significantly on policy decisions regarding Belgium’s electricity mix. Timely decisions on the future energy landscape are crucial to dimension and implement the necessary changes to the electricity grid.
CHOICES RELATED TO BELGIUM’S ELECTRICITY SUPPLY AND DEMAND
The ‘current policies’ scenario (assuming the current generation development plans including additional domestic offshore, flexibility assumptions, nuclear phase-out and thermal capacities to ensure adequacy) results in:
◆ Net imports of around 60 TWh in 2050 with a strong increase of both imports and exports;
◆ Total thermal capacity requirements of between 13 and 15 GW in addition to almost 20 GW of other flexible capacities (storage, demand response…);
◆ Renewable domestic generation amounts to around 100 TWh, while thermal generation amounts between 15 to 30 TWh.
When looking at the ‘current policies’ scenario, the difference between domestic electricity supply and demand (excluding thermal generation and imports) is between 70 and 90 TWh in 2050 Several options to face this challenge were identified. Leveraging their combined potential, Belgium has the means to cover its growing demand.
Demand levers
The moderation of energy consumption (sufficiency) holds a great deal of potential in terms of keeping system costs under control. Sufficiency is predominantly related to changes in human behaviour. The main challenge of this measure lies in citizen acceptance, particularly when individuals believe that changes in their behaviour will lead to a loss of comfort. It was found that sufficiency measures have the potential to reduce the total system costs by 15%. Behavioural changes typically do not happen overnight but rather evolve gradually. As such, some energy demand reduction can happen relatively fast, but other measures need support and policies to materialize over time.
Small-scale supply options
When accounting for the total system cost, maximising the development of domestic renewable energy (onshore wind, PV panels and offshore wind in the Belgian EEZ) is demonstrated to be part of a cost-optimal solution for Belgium in all scenarios. While Belgium’s domestic RES generation can contribute significantly to the electricity supply mix, this alone will not suffice. Several additional options are however available for meeting the country’s increasing electricity demand.
Large-scale supply options
As a large-scale energy source, non-domestic offshore wind appears to be a cost-effective supply option for Belgium. Nonetheless, the scaling up of offshore wind development requires a step change in international coordination, joint planning, and funding. The benefits of non-domestic offshore wind therefore need to be weighed against other supply options, such as the development of new nuclear generation units or connecting farout baseload RES. While new nuclear plants are a viable solution, this option carries its own challenges related to areas including safety, complexity, and financing. Important elements linked to these options are the cost assumptions, the time to market and the risk profile (technological, financial, environmental, etc.) of each technology.
Imports versus domestic generation
One key policy choice that should be made relates to finding the right balance (over time) between relying on electricity imports and undertaking domestic investments in electricity supply. Numerous considerations have to be made. These include: affordability considerations, opportunities for the redistribution of costs and benefits, agility in the face of uncertainties, resilience against supply shocks,
international cooperation to ensure a coordinated approach to offshore development, risks related to budget and timing overruns, private-public partnerships for financing, funding, etc.
APPENDIX A - KARI DISPATCH AND INVESTMENT ELECTRICITY MODEL
The KARI electricity model was developed and used by Elia Transmission Belgium over several years. Amongst other it was used as part of the Federal Development Plan which was published in 2023 [ELI-3]. Its initial goal was to perform an identification of system needs in terms of both European and Belgian electricity grid infrastructure reinforcements. This included determining an appropriate quantity and strategy for integrating offshore RES into the system as well as suitable cross-border transmission capacity increases. The objective of the study was to satisfy
European and Belgian policy targets as much as possible whilst adhering to relevant system constraints. As part of this current study, the KARI model and tools have been further developed in order to include the interactions with other energy vectors as explained in appendices B and C.
The KARI model uses the open-source Antares simulation software (also detailed further in the appendices).
INTRODUCTION
The KARI model is used to find an optimal electricity system in Europe, with the following in mind:
◆ ‘optimal’: the goal is not to find a unique optimal system but one possible optimal system alongside others because the final results are influenced by many factors. The aim is thus to identify which general trends remain valid across different assessed futures.
◆ ‘electricity system’: the objective is much broader than identifying the need for new offshore infrastructure. Offshore infrastructure, onshore infrastructure, offshore RES capacities, the location of electrolysers, thermal capacities, CO2 emissions, total system costs, etc… are all intrinsically linked to each other. An integrated approach is therefore required, which takes into account the electricity system as a whole.
◆ ‘in Europe’: the challenge of integrating RES into the system is first and foremost a European one. In order for Belgium to support the achievement of European objectives, and because Belgium is an important European crossroads, its grid must be conceived within and developed in a European context.
Starting with a reference grid and a set of general assumptions (regarding national targets, standard costs, offshore RES potential…) and scenario-specific assumptions (regarding the production mix, electricity consumption, flexibility means), KARI gradually and optimally integrates additional offshore RES, expands the grid of the electrical system until a given goal is achieved.
Constraints can be added to the optimisation to reflect certain realities (e.g. limited capacity increases per decade along a given corridor) or in order to compare different network development strategies (for example, no onshore developments or offshore hybrid systems). Of course, when interpreting the study’s results, attention should be paid to the criteria which cannot be factored into the analysis – for example, political support, environmental changes or public acceptance.
It is also very important to keep in mind that the solution found by the optimiser is one possible outcome (which minimises total costs) but that other solutions, close to optimum are also possible and could be easier to implement due to other constraints (political support, acceptance…).
OPTIMISED VARIABLES
As illustrated inFigure A-1, the optimisation is based on pre-fixed scenarios (depicted in the upper half of the figure, shaded grey), with the remaining factors optimised by the tool (depicted in the lower half of the figure, shaded light orange): offshore wind, electricity network (onshore and offshore), other thermal fleet, power-to-X.
Regarding the electricity network and offshore wind farms, the type of connections for offshore wind farms that can be invested
in by the KARI model are shown in Figure 3-13 (Section 3.1.3.2), which complements the onshore or offshore point-to-point interconnectors between two zones.
Generic input data per link type (HVDC link versus AC reinforcements, onshore versus offshore cabling, distance, etc.) is used for the pan-EU system, following a standard cost approach. This inherent approximation of reality allows the optimisation to jointly and fairly consider all available options.
STARTING GRID AND CANDIDATES
The starting grid in the KARI model is based on ENTSO-E’s TYNDP 2022. Every two years, ENTSO-E undertakes an identification of system needs (IoSN): a grid study exercise performed amongst other things, to detect the grid infrastructure reinforcements which need to be carried out in a timely manner for the power system as a whole. As part of this, a zonal reference grid is used for each target year, based on input from TSOs. This means, for example, that the onshore network in Belgium is already significantly reinforced in the starting grid (i.e. HTLS backbone). The
assumptions regarding the starting grid can be found in the scenarios chapter of this study.
The zonal approach (including the use of Kirchhoff laws), in which countries are divided in several zones, enables internal grid bottlenecks to be reflected more accurately. For long-term studies, such an approach allows for an overall optimal system to be found independently from current market design rules. This is relevant, since market rules can still evolve within the considered time horizon. This approach therefore proposes a long-term sys-
tem-wide optimum. Such an approach is also the one followed in other long-term studies, including the TYNDP zonal IoSN or the e-Highways 2050 study [EUC-10].
The offshore wind potential is identified via a detailed approach, starting with a database from 4C Offshore [4CO-1], and considering both geographical constraints (bathymetry, shipping routes, environment zones, etc.) and latest identified offshore zones in national plans. The maximum offshore RES capacity which might be electrically integrated in Europe for each target time horizon is outlined in Section 3.1.3.2.
All possible offshore wind farm candidates are aggregated into offshore wind farms with a standard size of 2 GW each. Existing wind farms are modelled with their rated capacities. A distinction is made between standard offshore wind farms and radially-connected hubs. Radially-connected hubs consist of several offshore wind farms that converge onto a central offshore location (or hub) which is connected to the onshore grid. Six hubs are placed in the starting grid in order to reflect current ambitions. One of them is located in the Belgian part of the North Sea, simulating the Princess Elisabeth Island (which will be connected to 3.5 GW of offshore wind capacity). Offshore hubs are assumed to be able to welcome, without extra cost on the hub, other (hybrid) interconnectors and/or wind farms. Other hubs can be added to the model.
Four ‘types’ of standard offshore wind farms are considered, as follows (and illustrated in Figure 3-12).
◆ Existing offshore wind farms which are already radially connected to their respective countries.
◆ Pre-connected offshore wind farms that are due to be radially connected to their respective countries. These are assumed to be ready by 2036 and are thus present in the initial model for 2036.
◆ Pre-connected offshore wind farms that are due to be radially connected to their respective countries but are assumed to be potential candidates for hybrid interconnectors. These are assumed to be ready by 2036 and their radial connections are thus present in the initial model for 2036. The optimiser can, however, decide to take these into account as hybrid interconnectors.
◆ Offshore wind farm candidates. These will only be present if the optimiser invests in the offshore wind farm and its associated connection (either a radial or hybrid connection).
The cost of the offshore wind farms is also considered by the algorithm and a distinction is made between fixed-bottom wind turbines and floating wind turbines. The distance to shore is also reflected in the considered costs.
GOAL FUNCTION AND CONSTRAINTS
Different optimal solutions can be sought out for the different time horizons, in accordance with the used goal function. The goal function used for KARI as part of this study is the lowest total system cost (including operational costs (including CO2
emissions), wind and transmission annuity). The model interacts with the ‘molecule’ model and the investments are made in order to ensure that the CO2 targets are met.
CONSTRAINTS
Some general constraints are imposed in order to better reflect reality and ensure that the study’s outputs are realistic. Amongst other constraints, the connections to/from a radially pre-connected offshore wind farm can ‘only’ evolve into a hybrid system by connecting one additional leg to another hub or country. The goal is to reflect typical space limitations on offshore platforms. However, no limitations are placed on known energy hubs, since it is assumed that space limitation is less of an issue and/or better planned out for them. The direct (hybrid or radial) connections
linking offshore RES to the onshore network are limited to realistic lengths; in other words, they are connected to coastal or near-coastal areas. Similarly, the pace at which possible capacity increases occur in each corridor is limited to adequately reflect the lead time of such projects. It is assumed that the required technological progress will have been achieved by then, allowing the realisation of envisaged multi-terminal systems. In other words, no specific technological constraints related to the development of multi-terminal systems are considered.
KARI AND THE ADEQUACY MODEL USE THE OPEN-SOURCE ANTARES-SIMULATOR
The Antares-Simulator (hereafter after ‘Antares’) is an open-source hourly electricity market simulator which was developed by RTE [ANT-1] and has been used by Elia Transmission Belgium to perform the simulations for both adequacy and economic assessments. In addition, the output of the tool is also used as input for assessing the flexibility means. Antares is a UC/ED model as it calculates the optimal unit commitment and generation dispatch from an economic perspective; in other words, it minimises the generation costs of the system while respecting the technical constraints of each generation unit. The dispatchable generation (including thermal and hydroelectric generation, storage facilities and demand side response) and the resulting cross-border market exchanges constitute the decision variables of the optimisation problem.
Antares simulates each year by solving fifty-two weekly optimisation problems in a row along the whole European perimeter for each 'Monte Carlo' year. This results in an hourly dispatch over the whole year for all technologies implemented in the model, considering all generation, storage and market response capacities as well as interconnection flows.
KEY MODELLING ASSUMPTIONS TO KEEP IN MIND WHEN INTERPRETING THE RESULTS
It is important to highlight several modelling assumptions in order to correctly interpret the results. These are outlined below and need to be kept in mind when analysing the results.
◆ Perfect weekly foresight is considered for renewable generation, consumption and unit availability (known one week in advance following an ex ante draw). This also means that storage, hydro reservoirs and thermal dispatch are optimised knowing all of this in advance. In reality, this is not the case, as forecasting deviations and unexpected unit and interconnection outages can happen and need to be covered by the system. In line with the ERAA methodology, for each market zone, in order to cope with such events, part of the capacity is therefore reserved for balancing purposes and cannot be dispatched by the model.
◆ Simulations of the market are performed on the basis that all the energy is sold and bought on an hourly basis. Integrating long (i.e. capacity markets) and/or real-time markets (i.e. balancing markets) in such a model is not straightforward. Forward markets are assumed to act as financial instruments which anticipate day-ahead/real-time prices. Depending on the trading strategy and actual market conditions, an arbitrage value may exist between different time frames.
◆ The model minimises the total cost of generation (including energy not served) across the whole simulated system.
◆ A perfect market is assumed (no market power, bidding strategies...) as part of the model’s scope. The optimisation solves all the system (i.e. the whole geographical perimeter) at once.
◆ Energy Limited Resources (ELR) such as pumped storage units, batteries and demand side response, modelled as ‘in-the-market’, are dispatched/activated in order to minimise the total cost of operation of the system. In reality, they could be used to net a certain load in a smaller zone or to react to other signals. The modelling approach also assumes that price signals are driving the economic dispatch of those. During times of scarcity, ELRs (such as storage or demand response) can be dispatched in different ways. In this respect, the default ‘shedding policy’ in Antares (i.e. ‘shave peaks’ see [ANT-1]), is used in the simulations. This 'shedding policy' aims to minimise the depth of the ENS, in line with the reliability standard calculation.
◆ Prices calculated in the model are based on the marginal cost/activation of each unit/technology while considering the modelled network constraints and their shadow prices.
◆ The efficiency of each thermal unit is considered as fixed and independent of the loading of the unit. In actual fact, efficiency is a function of the generated power.
◆ Each bidding zone is considered a copper plate. This means that internal grid limitations within a bidding zone are not considered. In practice, some units can be re-dispatched in order to limit congestion on a grid.
◆ Offshore hybrid interconnectors (i.e. interconnectors which combine both offshore wind and market-to-market connections) are modelled under the assumption that the wind farms which are connected to the interconnector are in a separate bidding zone.
The Antares-Simulator is an open-source software developed by RTE. It is a sequential ‘Monte Carlo’ simulator designed for short- to long-term studies related to large interconnected power grids. It simulates the economic behaviour of a given transmission-generation system over the period of one year and on an hourly basis.
Elia Transmission Belgium (hereafter Elia) has been using the software for more than 10 years. It is used for performing the simulations that are used as part of the capacity mechanism calibration in Belgium (Strategic Reserves and more recently the market-wide CRM) and has been used for Elia’s adequacy and flexibility studies since their launch in 2016.
Antares has been used in several studies across Europe, including studies undertaken by ENTSO-E, which uses it as market modelling software. These ENTSO-E studies include:
◆ the pan-European Resource Adequacy Assessment (ERAA) that ENTSO-E publishes every year [ENT-4];
◆ the assessment related to the ten-year network development plan (TYNDP, [ENT-3]) that ENTSO-E publishes every two years.
Moreover, Antares is used as the reference market modelling software as part of many other European projects and national assessments. In addition to the adequacy studies performed by Elia and the economic assessment of the Belgian federal grid development plan, the tool has been used for (non-exhaustive list):
◆ the ‘Bilan Prévisionnel’, published by RTE [RTE-2], which assesses the adequacy of France’s system for the years 2023 to 2035;
◆ RTE’s analysis of trends and perspectives across the energy sector (transition to low-carbon hydrogen in France or integration of electric vehicles into the power system) [RTE-2];
◆ RTE’s Energy pathways 2050 (‘Futurs énergétiques 2050’) [RTE-1];
◆ the OSMOSE project [OSM-1];
◆ the Cigré Working Group C1.35: Global Electricity Network Feasibility Study [CIG-1];
◆ e-Highway 2050, which aims to develop a grid planning methodology [EUC-10];
◆ MedTSO studies [MED-1];
◆ Litgrid Adequacy Assessment [LIT-1];
◆ APG (Austrian TSO) Electricity stress test for the security of supply in winter 2022-23 [APG-1].
For the creation of annual scenarios, Antares can be provided with ready-made time series or can generate them through a given set of parameters. Based on this input data, a panel of ‘Monte Carlo’ years is generated through the association of different time series (randomly or as set by the user). Then, an assessment of the supply-demand balance for each hour of the simulated year is performed by subtracting wind and solar generation from the load, by managing hydro energy with a heuristic approach and by optimising the dispatch and unit-commitment of thermal generation clusters, storage and demand side response. The main goal is to minimise the total cost of generation for all interconnected areas.
Finally, RTE international (RTE-i) has developed a users club for Antares. This gathers different users together to enhance the application, provide training and support for it, and guide its development. TSOs which are members of this club: APG, Elia, EMS, Swissgrid, SEPS, IPTO, ELES, MAVIR, MEPSO, ESO, OST.
APPENDIX B - MOLECULES AND LIQUIDS MODEL
The KARI model is linked to a molecules and liquids model. One of the main improvements identified through discussions with stakeholders was the need to incorporate other energy vectors into the model. This is because, to accurately determine if a region can achieve carbon neutrality, all types of energy carriers need to be modelled. To fully understand the interplay between these markets, Elia Transmission Belgium has developed a ‘molecules’ model. Unlike an electricity model where supply and demand need to match at every hour, a gas-based model allows for flexibility due to the variable compression of gas within pipelines. Therefore, the molecules model is designed to operate on a (twice-)daily basis rather than an hourly one. To simplify the model, a year's worth of data is condensed into one week. This means that one hour in the model equates to 52 hours in a full year, with average values calculated over these 52 hours blocks.
The molecules model is comprised of four molecule types: methane, hydrogen, ammonia, and liquids. An overview of these is provided in Figure 2.5. Each type can be transformed into another, following the conversion processes outlined in Section 3.1.6.
For methane, Belgium, France, Germany, and the Netherlands are modelled individually, while other countries are grouped together based on their geographical proximity. The existing methane grid and storage capacities for each country are used. Additionally, existing import pipelines from outside the EU and existing LNG import terminals are incorporated. All data has been aligned and verified with Fluxys. This methane grid remains consistent across all time horizons.
Methane can then be converted into hydrogen through the use of steam methane reforming (SMR-H2). In this part of the model, every European country is modelled individually. In the 2036 scenario, there are no existing hydrogen pipelines or storage facilities. Therefore, the hydrogen aspect of the model is subject to optimisation during each iteration, with potential investments in hydrogen pipelines (either within the EU or for imports), storage facilities, or offshore electrolysers in the North Sea. Once an optimal hydrogen grid is established in 2036, this grid serves as the starting point for future years.
Hydrogen can also be obtained through the imports by sea and the subsequent cracking of ammonia. However, this method is only feasible for countries that are not landlocked.
In the model, ammonia is treated separately. The ammonia node is designed to meet all of Europe's ammonia needs, which allows for the immediate use of imported ammonia. Additional ammonia imports can then be transformed into hydrogen to satisfy the demand for hydrogen. Potential import regions include the Middle East, Africa, Australia, and South America. The associated costs of these imports are determined by factors such as shipping distance, the price of renewable energy in the country of origin, and the expenses involved in conversion. Further details regarding these costs can be found in Section 3.3.5. Additionally, in scenarios where there is an excess of hydrogen, it can be domestically converted into ammonia to meet the demand.
Finally, the model includes a category for liquids, which is further divided into four sub-categories: aviation, feedstock, shipping, and others.
The 'aviation' category encompasses kerosene, e-kerosene, and biofuels (sustainable aviation fuels, or SAF). 'Feedstock' includes naphtha, methanol, and biofuels. The 'shipping' category covers bunkering fuels, methanol, and biofuels. The 'other' category comprises traditional fuels (mazut, gasoline, and diesel), synthetic fuels (e-diesel, methanol, etc.), and biofuels (bio-ethanol).
Each of these fuels have unique efficiencies when it comes to creating synthetic variants from hydrogen and varying import costs. Therefore, they are individually modelled.
ADDITIONAL INFORMATION ON THE IMPORT COSTS
Section 3.1.4 previously provided an overview of the merit order utilised in the model. However, this did not factor in a CO2 price, leading to fossil fuels occupying the initial positions in the merit order. The molecule model incorporates an optimal CO2 price to
achieve the specific carbon reduction goals for a given year. This inclusion of a CO2 price effectively displaces fossil sources from the merit order. Figure B-1 offers a comparative example of a merit order for 2050, both with and without a CO2 price.
APPENDIX C - CARBON CAPTURE, UTILISATION AND STORAGE MODEL
The overall goal function in the present study is a minimisation of the total European system costs subject to a maximal GHG emission target. To ensure GHG emission targets are met at the lowest cost the model has the possibility to invest in a wide variety of options who have the potential to reduce emissions. These options include:
◆ The reduction of the use of fossil fuels (offshore, reconversion to hydrogen turbines, etc…);
◆ The production and/or import of decarbonised molecules;
◆ Carbon capture, utilisation and sequestration .
Note that other options to reduce greenhouse gas emissions such as increasing the efficiency of appliances, heating efficiently using renewable electricity or energy sufficiency are not optimised but
assessed through scenarios and sensitivities. In addition, it should be noted that if the model would not be able to reach the targeted emissions reduction, a very high cost is attributed to the carbon emitted above the limit.
The optimal activation of carbon removal options is orchestrated by the carbon capture, utilisation and storage model. This model collects the carbon emissions from each of the other models and has the capability to monitor the total GHG emissions and link this information to (both direct and indirect) decisions regarding infrastructure developments. More specifically the model can invest directly in technologies such as carbon capture infrastructure for process emissions and other transformation processes but also in Direct Air Capture (DAC). Furthermore, indirectly the model can influence the dispatch in the other models by setting a carbon price. This is illustrated in Figure C-1.
Select most cost-effective options to reach the emissions target taking into account technical constraints on the max amount of CO2 stored
Options activated in the carbon model itself:
- CCS for thermal power generation
- CCS for process emissions per sector (cement, chemicals, ...)
- Reconversion of thermal power generation to H2
- Investments in direct air capture underground storage of carbon Options activated by the carbon capture and storage model in the Electric and (non-CO2) models though the carbon price:
- Import of green molecules
- Increase the price of carbon-intensive electricity generation
- Investment in offshore wind
- Investments in interconnections between regions with available low-carbon supply options to regions with carbon emissions.
- Investment in direct-res offshore hydrogen generation
It is important to note that the CO2 infrastructure is not modelled explicitly. However the costs of the different carbon capture options are assumed to integrate those costs.
INTEGRATION OF CARBON CAPTURE AND STORAGE MODEL IN THE TOOLCHAIN FIGURE C-1
APPENDIX D - ADEQUACY ELECTRICITY MODEL
The goal of the adequacy electricity model is to evaluate the required capacity to comply with the adequacy criteria at Belgian and European level. This indicator is calculated based on an iterative process at European level that is required to meet the assumed reliability standard of each modelled country. The required capacity is defined as the thermal capacity layer needed on top of all capacities (generation, storage, demand response) and the grid configuration assumed in each scenario.
This model is performed at bidding zone level. As the geographic resolution is lower than the KARI model, it allows to perform a full adequacy assessment such as performed in Elia’s adequacy and flexibility studies. The adequacy assessment is performed by simulating a large amount of ‘Monte Carlo’ years, based on the same forward-looking climate database used in the rest of the study.
More information on the adequacy assessment can be found in the Adequacy and Flexibility study performed by Elia [ELI-1].
The methodology associated to the adequacy electricity model requires three steps to be followed, as illustrated on Figure D-1. This methodology is performed for each time horizon and scenario.
STEP 1: AGGREGATION
The first step consists of aggregating the zonal KARI electricity model (see Appendix A) into an adequacy model. The electricity consumption, generation, storage and demand response of each zone from the KARI electricity model before and after investment optimisation are aggregated at bidding zones level. For the model after optimisation, the additional investments in the grid and in offshore wind are also integrated. The adequacy models obtained are therefore an image of the KARI electricity model with a lower resolution.
STEP 2: EUROPEAN ADEQUACY LOOP
Once the input from the zonal KARI electricity model are integrated in the adequacy electricity models, an European adequacy loop is performed. This assessment aims to ensure that all modelled countries meet their reliability standard. In order to simplify the assessment, all countries are assumed to be compliant with their reliability standard (RS) (or to 3h of LOLE if RS is not available).
This step is performed as follows:
1. Future possible states (‘or ‘Monte Carlo’ years) covering the uncertainty of the generation fleet and HVDC (technical failures) and weather conditions (impacting RES generation and demand profiles due to thermosensitivity effects) are defined.
2. An hourly European market simulation for each ‘Monte Carlo’ year is performed in order to identify for each bidding zone structural shortage periods, i.e. moments during which the electricity production in the market is not sufficient to satisfy the electricity demand. The model allows a quantification of the amount of hours during which the system is not adequate for each future state.
3. If at least one country does not meet its reliability standard, capacity is added or removed. This iterative process aims to assess the additional capacity needed (100% available) in each bidding zone to satisfy the 3 hours LOLE criteria.
4. At the end of the process, a potential GAP is identified for each bidding zone in both the adequacy electricity models before and after optimisation.
STEP 3: ADEQUACY GAIN
Finally, the needed capacity can be used to quantify the adequacy benefits. This can be performed by looking at the required capacity defined in step 2 between two models. This indicator can be calculated either as the additional capacity savings at European level between the two models or as the equivalent benefit in M€ for the system to avoid building additional capacity. The same analysis can be performed at Belgian level.
Definition
APPENDIX E – MARGINAL ABATEMENT COST CURVE METHODOLOGY
This text was prepared by Sia Partners who performed the work related to the calculation of the MACC (Marginal Abatement Cost Curve).
INTRODUCTION
Steering the Belgian energy landscape towards climate neutrality has proven to be a complex endeavour: it requires both a myriad of policy measures as well as the implementation of multiple strategic abatement levers. Understanding the interactions between these levers, both positive and negative, adds an additional layer of complexity to the decarbonisation mission.
The MACC (Marginal Abatement Cost Curve) method is recognised as a widely used framework in decarbonisation exercises. While it may seem deceptively simple, the MACC can be valuable because it quantifies the associated implementation costs. Its visualisation provides guidance on where to allocate resources first in a merit-order like way.
Setting up a robust MACC is a resource-intensive process that demands a well-structured methodology. It starts by identifying different sectors and their corresponding baseline emissions, ensuring that data are sufficiently granular. Next, a non-exhaustive list of abatement levers is compiled through a combination of both internal expertise and literature review. The abatement levers are then further assessed for each target year to estimate their abatement costs, considering a wide range of input parameters.
Subsequently, the different abatement levers are plotted in what is called the MACC, with the most cost-effective options positioned on the left and, towards the right, increasingly expensive measures for each sector. However for this exercise, the MACC is presented by sector and measures instead of sorting the different them by a merit-order.
Although numerous technologies can be incorporated in the MACC, this study focuses solely on demand-side solutions. This does not mean that supply-side options are overlooked, but rather that they have already been thoroughly examined in the report through an extensive set of sensitivity analyses and other metrics (such as LCOE).
CAVEAT
While the MACC offers an intuitive framework for understanding different decarbonisation options, it comes with some limitations.
First, a MACC is tailored for marginal emissions reductions. This marginal focus might prioritise incremental improvements over strategic shifts.
Second, the interdependencies among emission reduction measures pose challenges. Decisions in one sector can affect outcomes in others, complicating strategy development and imposing the need for integrated approaches that consider intersectoral synergies and trade-offs.
Moreover, the assumption of uniform costs regardless of transition speed overlooks the higher costs associated with rapid transitions in hard-to-abate sectors or slow transitions in easier-to-abate sectors. Early consideration of each abatement lever becomes crucial to mitigate long-term costs effectively. In this regard, technological advancements can also further complicate the MACC approach, as evolving technology costs can significantly alter the cost dynamics of certain emission reduction measures.
Finally, it is crucial to note that some solutions within a category may exhibit high-cost heterogeneity due to unique characteristics (e.g. renovation of dwellings). Consequently, the MACC should not be viewed in isolation but should be used as an analytical tool in combination with the other analyses carried out in this study.
IDENTIFIED CATEGORIES AND LEVERS
This Sia Partners’ analysis, commissioned by Elia, focuses on Belgian demand sectors that play a pivotal role in national emission reduction efforts. Through an intensive collaboration between Elia and Sia Partners, different sectors were identified and quantified based on their greenhouse gas (GHG) emission contribution as well as their potential for implementing effective abatement levers, drawing upon insights and data from Elia’s BluePrint study.
The identified sectors are:
◆ Buildings,
◆ Transportation,
◆ Industry,
◆ Carbon Capture Techniques.
Within each sector, a range of levers has been identified to effectively target emission reductions. The non-exhaustive list of abatement levers include:
◆ Electrification,
◆ Switch to green molecules,
◆ Technological advancements such as energy efficient appliances,
◆ Innovative solutions such as carbon capture and storage.
By focusing on these specific categories and levers, a decarbonisation strategy is aimed for that maximises emission reductions while optimizing resource allocation.
METHODOLOGY FOR CONSTRUCTING THE MACC 2030 AND 2040
Sia Partners’ methodology to construct a MACC for the years 2030 and 2040 runs in parallel with projections for those years, leveraging baseline data from respectively. Constructing a MACC for each target year generally involves several steps. In each of these steps, distinct methodologies and insights are utilised to tailor the analysis to the specific abatement categories, being buildings, transportation, industry and carbon capture. Nonetheless, a number of common phases can be identified.
The initial phase involves pinpointing GHG-intensive activities within each category. This step requires an assessment of both the emission intensity and the current cost structure, encompassing CAPEX and OPEX. Understanding the inherent costs is critical for evaluating the economic impact of emission reduction efforts.
Subsequently, the potential of various abatement levers is evaluated using both in- and outputs from Elia’s BluePrint study, which explores different options for achieving net-zero emissions. This analysis considers factors such as energy prices and infrastructure development costs. By assessing the potential of installing new technologies and their associated costs, insights in their emission reduction effectiveness can be acquired.
After identifying the potential of each abatement lever for every target year, the Net Present Value (NPV) of implementing this lever relative to maintaining the baseline activity is calculated. This involves comparing the costs of adopting the new technology over time using a discount factor (predefined Weighted Average Cost of Capital (WACC)). To determine the MACC, the NPV then is divided by the discounted amount of the emission abatement potential1
Societal perspective
Throughout the MACC exercise, Sia Partners assumes a system perspective, having the interest of society as its guiding principle. This approach translates to the use of wholesale energy prices (electricity, oil, natural gas and hydrogen) instead of retail prices as input parameters.
Furthermore, the integration of the carbon price in the energy parameters provides a nuanced understanding of the economic implications of emission reduction strategies.
Buildings
For buildings, the analysis focuses on electrification, green hydrogen and energy efficiency.
In evaluating electrification, heat pumps were compared to traditional natural gas and oil-fired boilers. This comparison assesses the potential benefits of transitioning to electric heating systems.
Subsequently, to explore the abatement lever of green hydrogen, natural gas boilers were used as a baseline to examine the feasibility and effectiveness of hydrogen as an alternative energy source in residential and tertiary heating, considering both emission intensities and economic parameters.
Last, the analysis extends to energy efficiency, with a focus on using current energy labels to identify potential improvements. For insulation, for instance, a distinction is made between facade and roof insulation. Additionally, for household appliances, consideration is given to both low and high investment cost options, recognizing the variety in costs. While using averages provides an easy manner to tackle variety, the study can be extended to (or solely focus on) examining additional factors and variations in energy efficiency, such as different building types or specific household appliances.
Transportation
As regards transportation, the analysis focuses on two key abatement levers for both light-duty and heavy-duty transport: electrification2 and green molecules.
In evaluating these options, various transport-related cost factors were considered including operational expenditure (OPEX), capital expenditure (CAPEX) and fuel costs. Specifically for battery electric vehicles (BEV), the costs of changing batteries as well as infrastructure costs were examined. For fuel cell electric vehicles (FCEV), the infrastructure cost was taken into account.
The assessment encompassed not only the initial costs but also the long-term operational implications, ensuring a thorough understanding of the economic considerations associated with each option.
Industry
For industry, it is essential to acknowledge its inherent heterogeneity. This sector is composed of a diverse array of subsectors, each with its own unique characteristics and challenges. Within this complex landscape, the general focus was on three strategies: electrification, green molecules and energy efficiency.
1 A discount rate is applied to future GHG abatement, reflecting a preference for implementing the abatement lever earlier and a risk that future abatement may not occur at the projected pace.
2 The analysis deliberately excluded hybrid vehicles as an abatement lever. This decision was driven by the focus on prioritizing measures with the most significant impact on emission reductions.
Electrification was tackled by evaluating the potential of
◆ heat pumps for low-temperature processes,
◆ e-boilers for mid and high-temperature processes.
Additionally, green molecules, in particular hydrogen boilers for mid and high-temperature processes, were considered for comparison with electrified technology.
Energy efficiency was integrated as another lever. Drawing from both EU targets and literature, emphasis was placed on further improving energy efficiency to reduce overall emissions in the industry sector. It is important to note that an interval was constructed for 2030, considering the high uncertainty of investment costs.
The potential for each lever was derived from the BluePrint study and meticulously analysed together with energy consumption data from Belgian industrial processes. This methodology facilitated the assessment of each abatement lever within the intricate operational landscape of industry. Deviating from this broader scope to conduct a more granular, subsector-specific analysis could potentially dilute the transparency of the BluePrint study's overarching message.
Carbon capture
Last, two techniques for carbon capture were scrutinised:
◆ Carbon Capture and Storage (CCS),
◆ Direct Air Capture (DAC).
It is important to acknowledge the uncertainties surrounding these techniques from their technological feasibility to their economic viability, as the deployment of carbon capture poses multifaceted challenges, encompassing both business-oriented hurdles as well as regulatory and public considerations.
Furthermore, the data considered focused on the total cost of the system, encompassing both the costs associated with CCS technology and ex-post expenses (i.e. costs related to compression, transportation and storage of CO2 after capture).
GRAPHICAL REPRESENTATION
The methodologies employed in constructing the MACC for 2030 and 2040 aim to provide a robust framework for analysing various decarbonisation options. Some abatement levers, nonetheless, demonstrate a range to indicate that performing a MACC analysis should not be considered as an exact science.
The MACC visualisation, hence, needs to be carefully interpreted. If one tends to compare e.g. CCS with heat pumps, the significant differences in initial investment and operational expenses should be noted. CCS requires substantial upfront and operational costs, while heat pumps generally incur a lower upfront investment. Heat pumps also achieve less CO2 reduction compared to CCS. This limitation highlights the complexity of comparing technologies in isolation.
The results of the analysis are visualised in the MACC3 presenting the identified abatement levers together with their associated costs. This visualisation serves as a valuable tool for stakeholders, facilitating informed decision-making and strategic planning by offering options to achieve significant emission reductions.
INSIGHTS IN THE MACC FOR 2030 AND 2040
Examining the MACC for 2030 and 2040 reveals significant shifts in required abatement levers over time. In the short term (2030), energy efficiency measures emerge as highly cost-effective options. Notably, efficient appliances and industry-focused energy efficiency initiatives demonstrate significant potential for emission abatement. Additionally, the transition to electrification shows promise in achieving considerable emission reductions in the short and medium term, particularly in the transport and residential sector.
Specific insights into individual abatement options shed further light on their evolving economic viability and potential impact. As the wholesale price of natural gas currently is relatively low, gasfired boilers continue to be an interesting option for residential heating. Natural gas prices, however, are expected to rise more sharply than wholesale electricity prices over time, leading to electrified heat pumps becoming more attractive alternatives. The transition from oil-fired boilers to heat pumps already presents a viable option due to a.o. the lower coefficient of performance (COP) of oil-fired boilers.
Furthermore, BEV, encompassing both light and heavy-duty vehicles, demonstrate significant promise as abatement options. Light-duty BEV are already proving to be economically attractive, driven by their declining investment costs and increasing energy efficiency. Meanwhile, advancements in battery technology and
charging infrastructure are bolstering the potential of heavy BEV, positioning them as viable alternatives for emission reduction.
As we shift our focus towards 2040, notable changes in the cost dynamics of abatement options become apparent. One significant trend is the decreasing MAC of most levers. This reduction can be attributed to anticipated increases in energy prices which amplify the financial impact of energy loss, resulting in a lower MAC. Investments in insulation, for instance, become more economically attractive, offering a means to mitigate energy loss and reduce overall expenses. The MAC of other options, however, may increase as efficiency levels approach their pareto optimum, resulting in diminishing financial attractiveness. This is the case for efficient appliances. These trends underscore the importance of adaptive strategies and ongoing innovation to navigate evolving market dynamics and maximise the effectiveness of emission reduction efforts.
As regards the green molecule it currently faces challenges, particularly due to its elevated price. While technological advancements, market developments and infrastructure expansion are anticipated to enhance the feasibility and adoption of this solution over time, its higher MAC compared to electrified options in transport and buildings suggests that it is and will remain more expensive.
Carbon capture techniques which aim to reduce carbon emissions by capturing and storing carbon dioxide, encounter both economic and technological hurdles, making them less attractive solutions in the short term.
Last, the MACC highlights the relevance of carbon pricing mechanisms in guiding investment decisions and strategic planning. By integrating carbon prices, stakeholders can prioritise cost-effective abatement measures that align with carbon pricing mechanisms, ensuring efficient allocation of resources towards emission reduction goals.
CONCLUSION
The collaboration between Elia and Sia Partners in constructing the Belgian MACC highlights the importance of addressing decarbonisation challenges. By examining abatement options from a demand-side perspective, the analysis provides an informed ranking of the identified emission reduction options.
In this analysis, energy efficiency measures emerge as cost-effective options in the short term, alongside the promising trajectory of electrification with battery electric vehicles and heat pumps. Moreover, in this exercise, electrification of industrial heat pops up as an interesting option compared to a switch to green molecules. This can be attributed to a.o. the high price for green hydrogen
and its largely lacking infrastructure. Additionally, carbon capture initiatives show relatively promising MAC values compared to other abatement options, but significant hurdles persist in the form of high investment costs and regulatory uncertainty.
The insights gained from the Belgian MACC 2030 and 2040 analysis, reinforced by a confirmatory literature review, may offer valuable guidance for policymakers and industry leaders. This robust foundation provides a framework for informing strategic decisions and driving meaningful progress towards reaching climate goals and thus a more sustainable and resilient future for all.
APPENDIX F – TOTAL COST METHODOLOGY
This section was elaborated by Compass Lexecon to provide more insights on the total cost methodology that was developed. The presented methodology was used to calculate the total costs for Europe and Belgium. For the Belgian results, the DSO costs
approach was refined in bilateral discussions with DSO’s and the historical investment annuities were not taken into account (as they do no influence the results there).
F.1. GENERAL INTRODUCTION
The Cost tool quantifies total energy system costs for the scenarios developed in Elia’s ‘Belgian Electricity System BluePrint for 2035-2050’ future energy scenarios study. The tool covers multiple energy carriers and end-uses over the 2024-2050 period for both EU-27 plus UK, Norway and Switzerland and for Belgium. Energy system costs are defined as the sum of :
◆ Capital expenditure (CAPEX) for both production and distribution, and final consumption
◆ Operating expenditure (OPEX) excluding fuel costs for both production and distribution, and final consumption
◆ Fuel costs for both production and final consumption
F.2. STRUCTURE OF THE COST TOOL
The Cost tool models both the costs associated with the production and distribution, and the final consumption of the energy carriers, which are defined as electricity (power system) and molecules (hydrogen, ammonia, methane, and liquids).
On the production and distribution side the costs of production, storage and network for each energy carrier are modelled in details (see section 6.6.3) based on inputs from Elia’s models.
On the consumption side, end user costs modelled cover energy carriers switching costs across three sectors: transport, buildings, and industry - these sectors being the most energy intensive and requiring material investments to meet climate targets [EUC-9].
Both energy production and consumption system costs are linked through end users fuel costs which reflect the levelised energy production system cost of electricity and molecules.
Fiscal costs, such as taxes, subsidies, levies, and redistributions are excluded from the energy system costs calculation. A similar approach is used for public decision-making in the EC report of 2024 [EUC-9] and IEA & NEA report of 2020 [IEA-1], which analyses long-term impacts of energy policies and options for infrastructure development. The system cost calculation methodology and detailed assumptions were presented and challenged in two stakeholder workshops (13.11.2023 and 13.12.2023). At the end of 2023, the consultation process was opened for stakeholders to provide detailed feedback on the cost methodology and techno-economic assumptions, and written answers were given in spring 2024.
Figure F-1 illustrates the Cost tool calculation process. In addition to modelling system costs, the Cost tool also quantifies material needs for a selection of key minerals (aluminium, copper, cobalt, graphite, lithium and nickel) needed in power systems. Material needs are calculated by multiplying material intensity per technology with projected production capacity, electrolyser capacity, and EVs rollout.
INPUTS
The cost tool is fed by Elia’s models (KARI, Multi-E, …) that provide necessary inputs such as future energy demand, capacities of different technologies and import costs of different fuels among other (see Table F-1 for details). These inputs are combined with assumptions on unit costs and material intensity of different technologies, which are gathered from wide variety of sources, such as EC’s impact assessment [EUC-9], IEA reports ([IEA-1], [IEA2], [IEA-3]) and other studies. Sensitivities on key parameters can be assessed to test results robustness.
ELIA’S MODELLING INPUTS INTO THE COST TOOL TABLE F-1
Elia’s input Description
Data on final energy demand
Existing and simulated final consumption of energy in TWh by end-use and energy carrier, and assumptions on future trends, such as efficiency improvements, shares of road transport fuels, and shares of industrial processes.
Data on molecules production Simulated production, storage, and distribution of molecules in MWh.
Data on electricity production The existing and simulated capacity of power production technologies in MW.
Direct cost inputs
Various simulated costs, including cost of imports and some precalculated CAPEX and OPEX costs (based on the consulted costs) in the molecule and power sector.
OUTPUTS
All investment costs in the Cost tool are annualised over the assumed technical lifetime of the asset. Annuities depend on the user-defined Weighted Average Cost of Capital (WACC). The annualisation follows a normative depreciation and actualisation approach, where a constant WACC (with sensitivities) is assumed invariant of the technology. This approach excludes considerations of contractual structures or market interventions, e.g. price guarantees, but supports the key objective of the study to compare alternative energy mix scenarios from a system point of view (in contrast to individual project’s/investors’ point of view). The same approach is applied in several studies, such as RTE report of 2022 [RTE-1] and IEA & NEA report of 2020 [IEA-1]. All costs are expressed in real euros and have been adjusted for inflation to 2022 values.
F.3. ENERGY PRODUCTION SYSTEM COSTS OF DIFFERENT ENERGY CARRIERS
ELECTRICITY
MOLECULES
Figure F-2 illustrates the methodology applied to the power sector.
The power sector’s system costs consist of CAPEX, variable and fixed operating costs, fuel, transmission, distribution, balancing and import costs for the whole power sector. Of these costs, variable operating costs, fuel costs, import costs and grid costs are directly provided by Elia. The other elements are calculated in the Cost tool. A comprehensive benchmarking exercise and stakeholder consultation was performed to identify and collect data on the unit costs of different power generation technologies.
FLOWCHART OF THE POWER SECTOR COSTS
For each scenario, Elia’s modelling framework provides information on the existing electricity generation capacity in 2023 and on the total future capacities of the years 2036, 2040, and 2050 by technology type. The total installed capacities of the years in between are linearly interpolated. For technologies with a net increase in capacity, the existing already installed capacity is assumed to wind down over the assumed technical lifetime of each technology following a polynomial reduction function. The yearly difference between the total installed capacity and what remains at the time of the existing capacity is assumed to be newly installed.
CAPEX for newbuilt capacity is computed at yearly granularity by multiplying technology’s yearly increment in installed capacity with their associated costs (annualised), and adding annualised costs stemming from assets built in previous years. For existing capacity, the CAPEX consists of the annuity of the remaining capacity. The initial investment costs are assumed to be incurred linearly at the start of each construction year during a technology-dependent construction period and to be financed through debt at an assumed interest rate. Finally, these investment costs are annualised over the lifetime of each technology using the WACC as the discount rate.
The fixed operating costs are calculated by multiplying each year’s technology-specific total installed capacity with FOM unit costs.
Balancing costs are assumed to be driven by variable renewable energy sources (vRES) and calculated as onshore wind and solar annual generation multiplied by an assumed fixed balancing cost per unit of energy produced. Net electrical import costs for the EU as whole are assumed to be zero, while import costs for Belgium are based on Elia’s modelling.
For distribution costs the unit costs related to vRES generation, and the electrification of transport and buildings are estimated by regressing the projected distribution network investments on the projected consumption of electric vehicles, heat pumps (proxied by household electricity demand net of appliances demand), and the power generation of solar PV and onshore wind. The estimated unit costs are in turn multiplied by the amount of electricity demand (transport, buildings) and supply (vRES). Distribution costs not related to vRES or electrification of transport and buildings are assumed to make up half of the total distribution costs.
The Cost tool includes three sensitivities (low, central, high) for costs and lifetimes for each technology. These sensitivities adjust the assumed unit costs, WACCs, costs of debt and technical lifetimes of different technologies.
Production, imports, storage, and distribution costs are modelled for the following energy carriers: hydrogen, ammonia, methane and liquids. For each molecule different production methods and import modes are considered. This means that, for example, the production of fossil, bio and synthetic oils are treated separately.
Model inputs only cover years 2036, 2040 and 2050. The years in between are linearly interpolated, while the preceding years are extrapolated.
Figure F-3 illustrates the molecules cost calculation methodology.
Some costs, including total import costs, are directly provided by Elia’s model. The import costs sum the costs of each import source, and thus don’t consider the marginal price of imports.
Other costs are calculated in the Cost tool and typically involve converting yearly molecule consumption (in MWh) to yearly production/storage/transport capacities (in MW) by assuming a
capacity factor. OPEX costs are calculated by multiplying these capacities by operating unit costs of each technology, while CAPEX costs are calculated by multiplying the yearly increase in capacities and by capacity unit costs and then annualizing this investment cost with assumed lifetime and WACC.
FIGURE F-2
FLOWCHART OF THE POWER SECTOR COSTS
FIGURE F-3
Direct cost inputs
Data on molecules production
Elia input CL input
F.4. ENERGY CONSUMPTION SYSTEM COST OF END-USE SECTORS
The three end-use sectors representing the largest shares of energy demand have been included in the modelling [EUC-9].
For these three sectors, transport, industry and buildings, the following energy related costs are modelled: annualised CAPEX costs, yearly OPEX cost, and fuel costs associated with different energy carriers.
Fuel costs are calculated using the prices that the final energy consumers face. These prices include distribution costs and firm
markups but exclude taxes and subsidies. The starting values of these end user prices are based on research on current consumer fuel prices, while their projected trajectory is indexed to the levelised cost outputs of the electricity and molecule models.
Figure F-4 presents a high level overview of the end user cost methodology.
BUILDINGS
For residential buildings, Elia provides an estimate of the future number of households. By assuming a trend for household sizes and the average number of square feet for single resident, the number of households is converted into the total amount of living space. For services, Eurostat’s population projection is used to model the total population of EU and Belgium, while an assumption on the average service space per person is used to estimate the total number of service space.
The average efficiency improvements of renovated or new constructions compared to existing buildings is provided by Elia. The yearly rate of renovations is set so that the mix of existing, refur-
F.5. MATERIAL NEEDS
The assessed material needs include the amount of aluminium, copper, cobalt, graphite, lithium and nickel used by the power sector, electrolysers and electric vehicles. These materials are identified widely to be crucial for decarbonising the economy and were chosen on the basis of being included in assessments conducted by the EC in 2023 [EUC-8], RTE in 2022 [RTE-1], IEA in 2021 [IEA-2] and IRENA in 2022 [IRE-1].
bished and new buildings match Elia’s model of total household and service energy consumption. CAPEX costs are derived by multiplying the number of residential and service space being renovated or built by the respective renovation and construction unit costs.
Heating costs are calculated by combining Elia’s data on heating type shares and energy consumption with per MWh unit costs. Fuel costs are calculated by multiplying the total demand of energy with end user fuel prices.
TRANSPORT
For the transport sector, CAPEX and OPEX costs are only calculated for road transport which accounts for the largest cost component of transport [EUC-9]. Road transport includes private cars, busses, vans and trucks. Fuel costs are calculated for all modes of transportation, including aviation and maritime transport.
Historical data, sourced from Eurostat’s and OECD’s transport statistics, is used as a starting value for the size of road transport fleet and for the total number of passenger and freight kilometres travelled. Assumptions are made about the occupancy rates of passenger cars and of the load factor of freight vehicles. Elia’s inputs include assumptions about the future growth of passenger and freight transport needs, which by keeping the average yearly vehicle kilometres travelled constant, is used to model the future size of the road transport fleet. Elia’s inputs also include assumptions about the shares of vehicles by motor type. These are used to further divide the total fleet into ICE, electric, gas and hydrogen vehicles.
A part of the vehicle fleet is assumed to be renewed each year. Additionally, an assumption is made about the number of electric and hydrogen charging stations per new vehicle. The number of new vehicles is then multiplied by the unit cost of new vehicles and infrastructure to obtain CAPEX costs. These investment costs are then annualised over assumed lifetime using WACC as discount rate. OPEX costs are obtained by multiplying the total number of kilometres travelled by unit costs. Finally, total fuel
costs for the transport sector are calculated by multiplying the yearly total final demand of energy in transport with end user fuel prices.
INDUSTRY
Steel, chemistry, and refineries were chosen as industries to be modelled in detail, while the rest of industrial sector is treated as an aggregate in the “others” category. Elia’s inputs are used to estimate how much industrial processes switch their energy carriers, for example estimating how much natural gas-powered processes are being electrified. Additionally, a fixed amount of industrial capacity is assumed to be replaced each year.
Elia’s inputs include the proportions of total energy demand attributed to various industrial processes within a sector. For instance, they include the share of the energy demand of scrap processing within the steel industry. CAPEX costs are derived by multiplying the total amount of capacity being switched or replaced yearly by these process shares and by unit costs for each process given by EC’s impact assessment. These CAPEX costs are then annualised. Heating costs are treated similarly.
OPEX costs are calculated by multiplying the total capacity of each process by OPEX unit costs and fuel costs by multiplying the total demand of energy with end user fuel prices.
Key sources for per unit material needs are studies elaborated by RTE [RTE-1] and IEA ([IEA-2], [IEA-3]) which, among other sources used, quantify how much of the selected materials are needed for each MW of capacity for each power sector technology and for every MWh of energy for electrolysers and EVs. These per unit material needs are then multiplied by additional power and electrolyser capacity and EV consumption to derive the total material needs. The unit per material needs are based on current estimates of future technologies, which might not fully reflect the potential of future technological breakthroughs on material needs. Figure F-5 demonstrates the material need calculations.
FLOWCHART OF END USER COSTS
FIGURE F-4
FLOWCHART OF MATERIAL NEEDS
FIGURE F-5
F.6. COMPARING THE RESULTS TO PREVIOUS STUDIES
The final system costs were benchmarked against results of similar studies by EC [EUC-9] and Institute Rousseau [ROU-1]. Due to scope and methodological differences, comparing pure headline results is not possible, therefore the benchmarking exercise was limited to comparing investment needs. The benchmarking exercise showed the magnitude of the Cost tool’s modelled investment needs to be in line with these studies. See the methodological and scope comparison of the Cost tool and the two studies in Table F-2.
For material needs, comparisons were made against EC [EUC-9] and RTE [RTE-1]. As these reports for the most part only report material needs related to some specific use case or time frame, relevant adjustments were made to the Cost tool to ensure comparability. Additionally, RTE only reports the material needs for France. When comparing against it, RTE figures have been scaled up using France’s share of EU’s GDP. Comparisons show that estimated material needs are in line with alternative studies. METHODOLOGY AND SCOPE
APPENDIX G – SCHEMATIC VIEW OF THE MODEL
Figure G- 1 gives a schematic view of the model.
section on “Evolution of the energy system and associated raw material needs”
(includes different approaches) Geography
(extrapolated from the study of 7 member countries)
Industry
Buildings
Steel, chemicals and refineries separately. Other industries as an aggregate.
Steel and aluminium, cement and glass, olefins & aromatics, ammonia and chlorine, sugar, paper-cardboard production, methanol production
recharging and refuelling infrastructure
Unclear. Likely all industries.
COMPARISON OF
APPENDIX H – NON-CO2 EMISSIONS METHODOLOGY
Elia Transmission Belgium (hereafter Elia) asked Compass Lexecon to provide support on key questions regarding assumptions used for CH4 N2O and F-gas emissions as well as emission sinks from the LULUCF sector currently used by Elia in its Blueprint study. This section briefly analyses for each type of emissions key emission sources, implemented and planned measures to unlock reductions, associated challenges and alternative scenarios based on the EC scenarios and mapping possible evolutions at both EU and BE levels.
As basis Elia chose to take as reference the S3 scenario from the recent EC’s 2024 Impact assessment, which is the most optimistic in terms of LULUCF emissions. In addition, Elia asked Compass Lexecon to provide an alternative scenario to be performed as sensitivity. The following text has been written by Compass Lexecon for Elia and provides the background for the alternative scenario.
INTRODUCTION
The EC’s 2024 Impact Assessment report explores three scenarios with increasing net emission reduction ambitions to reach EU targets.
1. The S1 scenario, which mainly relies on the ‘Fit for 55’ energy trends, with no specific mitigation measures for non-CO2 emissions or for evolutions in the LULUCF sector.
2. The S2 scenario, which builds on S1 and adds substantial reductions in non-CO2 emissions and significant increases in carbon removals in the LULUCF sector.
3. The S3 scenario, which builds on S2 and adds a fully developed carbon management industry by 2040, with sizable carbon removals and the deployment of novel technologies.
Elia is assessing whether to rely on the S3 scenario, which projects a significant decrease in non-CO2 GHG emissions and a relevant increase in LULUCF net emission removals in 2040 and 2050, as the basis for its projections of non-CO2 emissions and LULUCF net removals.
However, achieving significant reductions in CH4 and N2O emissions could be challenging mainly due to inertia in the agriculture sector, which is the most important source of non-CO2 GHG emissions. Persisting challenges, mainly associated with cattle farming and fertiliser applications, have led to slow CH4 and N2O emission reductions both in the EU and in Belgium. Implemented and proposed policies have had limited impact in accelerating the rate of reductions.
As the S3 scenario’s projections of CH4 and N2O emissions could be perceived as too ambitious, an alternative scenario SA combining mitigation measures from the different EC scenarios is developed to capture a more realistic projection of non-CO2 emissions.
4. The SA scenario assumes the S1 scenario’s projection for CH4 emissions in the agriculture sector and the S3 scenario’s projection for CH4 emissions in the other sectors.
5. The SA scenario assumes the S2 scenario’s projection for N2O emissions in the agriculture sector and the S3 scenario’s projection for N2O emissions in the other sectors.
F-GASES
For F-gases emissions, significant reductions are expected due to already existing and planned measures. F-gases emissions have been decreasing at increasingly faster rates in recent years in the EU and in Belgium due to regulations affecting their use in heating and cooling and industrial applications. However, a complete phase-out seems more plausible to be achieved by 2050 rather than 2040, due to some monitoring issues that would take time to be completely resolved. The SA scenario assumes the S1 scenario’s projection for F-gases emissions in 2040 and the S3 scenario’s projection for F-gases emissions in 2050.
LULUCF SECTOR
In the LULUCF sector, the GHG removal potential remains uncertain as the removals are mainly due to forest land, while activities associated with croplands, grasslands, wetlands and settlements have resulted in emissions.
Historical LULUCF net emission removals have been decreasing ever faster, both in the EU and in Belgium. Main reasons are challenges associated with deforestation and forest degradation, as well as urban expansion and agricultural activities for food and energy. While LULUCF policies and regulations, both at EU and national levels, aim at restoring the sector’s carbon sink potential, there are long lag-times for measures to show results and lead to a reversal of trends.
The challenges to increase the LULUCF net removals in the EU and in Belgium are well captured in the EC’s S3 scenario – albeit with some ambitious assumptions. The alternative scenario SA therefore heavily relies on the S3 scenario. The SA scenario assumes the S1 scenario’s projection for net removals from croplands and the S3 scenario’s projection for net removals from the other land uses.
The SA and the S3 scenarios are associated with high levels of uncertainty regarding the evolution of the carbon sink potential of the different land uses, especially forest land removals and whether grasslands and croplands become sources of removals rather than emissions.
Source: CL Analysis based on EC Impact Assessment report PROJECTED EVOLUTION OF LULUCF EMISSIONS AND REMOVALS FIGURE H-2
Source: CL Analysis based on EC Impact Assessment report
Overall, the SA scenario differs from the EC scenario, especially regarding non-CO2 emissions from the agricultural sector, with
jections for
emissions in other sectors and for net removals in the LULUCF sector being relatively similar.
APPENDIX I – DETAILS ON ENERGY DEMAND
Figure I-1 shows the share of electricity, hydrogen, methane and other vector in different sectors (transport, industry, etc.) assumed in the different scenarios (ELEC, DE, GA) in Belgium in
2050. Electrification plays a key role in different sectors and its effect is more pronounced in the DE and ELEC scenarios.
Hydrogen Methane Other
MOST COMMONLY USED ABBREVIATIONS
• AC: Alternative Current
• AdeqFlex’23: Adequacy and Flexibility Study for Belgium over the horizon 2024-34, published in June 2023.
• ANTARES: A New Tool for Adequacy Reporting of Electric Systems (simulator used in this study)
• CAPEX: Capital Expenditure
• CCGT: Combined Cycle Gas Turbine
• CC: Carbon Capture
• CCS: Carbon Capture and Storage
• CCUS: Carbon Capture, Utilisation and Storage
• CfD: Contract for Difference
• CH: Switzerland
• CRM: Capacity Remuneration Mechanism
• CWE: Central West Europe
• DAC: Direct Air Capture
• DC: Direct Current
• DE: Distributed Energy (scenario)
• DRES: Decentralised RES
• DSM: Demand Side Management
• DSO: Distribution System Operator
• DSR: Demand Side Response
• EC: European Commission
• EEZ: Exclusive Economic Zone
• ELEC: ‘Electricity’ scenario
• EU: European Union
• ENTSO-E: European Network of Transmission System Operators for Electricity
• ENTSO-G: European Network of Transmission System Operators for Gas
• EPR: European Pressurised Reactor
• ERAA: European Resource Adequacy Assessment (study from ENTSO-E)
• ETB: Elia Transmission Belgium
• ETS: Emission Trading System
• EV: Electric Vehicle
• FCEV: Fuel cell electric vehicle
• GA: Global Ambition (scenario)
• GHG: Greenhouse Gases
• HDD: Heating Degree Days
• HFLEX/LFLEX: High/Low Flexibility scenario
• ICE: Internal Combustion Engine
• KARI: Elia zonal electricity model
• LDES: Long Duration Energy Storage
• LNG: Liquefied Natural Gas
• LULUCF: Land-Use, Land Use Change and Forestry
• HP: Heat Pump
• HPV: High PV scenario
• HPVC: High PV capped scenario
• HTLS: High Temperature Low Sag Conductors
• HVDC: High Voltage Direct Current
• MACC: Marginal Abatement Cost Curve
• NECP: National Energy and Climate Plan
• NIMBY: Not In My Backyard
• NO: Norway
• OCGT: Open Cycle Gas Turbine
• OPEX: Operational Expenditure
• P2X: Power to X
• PV: Photovoltaïcs
• RES: Renewable Energy Sources
• RTE: Réseau de Transport d'Electricité (French transmission system operator)
• SMR: Small Modular Reactor (nuclear)
• SMR-H2: Steam Methane Reforming (hydrogen)
• SUFF: ‘Sufficiency’ scenario
• TSO: Transmission System Operator
• TYNDP: Ten Years Network Development Program (study from ENTSO-E)
• UK: United Kingdom
• V1X: Electric Vehicles with unidirectional smart charging technology
• V1H: V1X charging optimised with a local signal
• V1M: V1X charging optimised with a market signal
• V2X: Electric Vehicles with bidirectional smart charging technology
• V2H: Vehicle-to-Home
• V2M: Vehicle-to-Market (equivalent to Vehicle-to-Grid, or V2G)
• WACC: Weighted Average Cost of Capital
REFERENCES
INSTITUTION CODE WEBSITE LINK
Association of Cities and Regions [ACR-1] https://www.acrplus.org/images/position-papers/2024_03_Sufficiency_Manifesto.pdf
Plan National Energie Climat Belgique [BEL-1] https ://www.plannationalenergieclimat.be/fr/le-pnec-c-est-quoi?plan-actualise-2023
CEMBUREAU – The European Cement Association [CEM-1] https://cembureau.eu/media/kuxd32gi/cembureau-2050-roadmap_final-version_web.pdf
CLEVER energy scenario [CLE-1] https://clever-energy-scenario.eu/
De Standaard [DST-1] Engie spreekt zich uit over de energietransitie: ‘Kernenergie is een engagement voor de lange termijn’ https://www.standaard.be/cnt/dmf20231116_97607252
De Tijd [DTI-2] https://www.tijd.be/ondernemen/milieu-energie/verborgen-factuur-van-nucleaire-verlenging-duikt-opelectrabel-vraagt-half-miljard-euro-aan-regering/10548531.html
[ENE-1] Complementarity assessment of South Greenland katabatic flows and West Europe wind regimes, Radu D et al., 2019 https://www.sciencedirect.com/science/article/abs/pii/S0360544219304529
[ENE-1]
A Brief Climatology of Dunkelflaute Events over and Surrounding the North and Baltic Sea Areas, Li B, Basu S, Watson SJ, Russchenberg HWJ, 2021 https://www.mdpi.com/1996-1073/14/20/6508
ENTSO-G [ENT-6] Learnbook: hydrogen imports to the EU market, 2023 https://www.entsog.eu/sites/default/files/2023-12/European%20Clean%20Hydrogen%20Alliance%20TD%20 RT_Learnbook%20Hydrogen%20Imports%20to%20EU%20market_20231219.pdf
EuroAfrica Interconnector [EAI-1] https://www.euroafrica-interconnector.com/at-glance/project-timeline/ European Climate Foundation [ECF-1] https://europeanclimate.org/resources/europeans-support-new-wind-and-solar-projects-in-their-local-area/ European Commission [EUC-1] https://managenergy.ec.europa.eu/publications/eu-achieves-20-20-20-climate-targets-55-emissions-cut-2030_en European Commission [EUC-2] https://climate.ec.europa.eu/eu-action/climate-strategies-targets/2030-climate-targets_en European Commission [EUC-3] https://climate.ec.europa.eu/eu-action/climate-strategies-targets/2040-climate-target_en. European Commission [EUC-4] https://climate.ec.europa.eu/eu-action/climate-strategies-targets/2050-long-term-strategy_en
European Commission [EUC-5] https://energy.ec.europa.eu/topics/renewable-energy/renewable-energy-directive-targets-and-rules/renewableenergy-targets_en
European Commission [EUC-6] Implementing the REPowerEU action plan: investment needs, hydrogen accelerator and achieving the biomethane targets eur-lex.europa.eu/legal-content/EN/TXT/PDF/ ?uri=CELEX :52022SC0230&from=EN
European Commission [EUC-7] Belgium NECP FACTSHEET (europa.eu) https://commission.europa.eu/document/download/73fd2378-8c49-4840-b0cb-22a5548ee541_ en?filename=Factsheet_Commissions_assessment_NECP_Belgium_2023.pdf
European Commission [EUC-8] https://single-market-economy.ec.europa.eu/sectors/raw-materials/areas-specific-interest/critical-raw-materials/ critical-raw-materials-act_en
European Commission [EUC-9] Impact Assessment Report, 2024 https://eur-lex.europa.eu/legal-content/EN/TXT/?uri=CELEX%3A52024SC0063
European Commission [EUC-10] https://ses.jrc.ec.europa.eu/eirie/en/data-collection/e-highway-2050-europes-future-secure-and-sustainableelectricity-infrastructure-e
European Commission [EUC-11] https://energy.ec.europa.eu/topics/renewable-energy/solar-energy_en
European Commission [EUC-12] Recommendation for 2040 emissions reduction target https://ec.europa.eu/commission/presscorner/detail/en/ip_24_588
European Commission [EUC-13] https://energy.ec.europa.eu/topics/nuclear-energy/small-modular-reactors/small-modular-reactors-explained_en
European Commission [EUC-14] https://energy.ec.europa.eu/topics/energy-systems-integration/hydrogen_en
European Commission [EUC-15] https://ec.europa.eu/eurostat/statistics-explained/index.php?title=National_accounts_and_GDP
European Union [EUU-1] Energy prosumers in Europe – European Environment Agency https://op.europa.eu/en/publication-detail/-/publication/496ccfd9-3d4c-11ed-9c68-01aa75ed71a1 European Hydrogen Observatory [EUH-1] https://observatory.clean-hydrogen.europa.eu/hydrogen-landscape/end-use
European Hydrogen Observatory [EUH-2] https://observatory.clean-hydrogen.europa.eu/hydrogen-landscape/production-trade-and-cost/hydrogenproduction
European Hydrogen Observatory [EUH-3] https://observatory.clean-hydrogen.europa.eu/hydrogen-landscape/end-use/hydrogen-demand
European Hydrogen Observatory [EUH-4] https://www.clean-hydrogen.europa.eu/media/publications/study-hydrogen-ports-and-industrial-coastal-areasreports_en
Eurostat
Eurostat
[EUS-1] Simplified energy balances https ://ec.europa.eu/eurostat/databrowser/view/nrg_bal_s/default/table?lang=en&category=nrg.nrg_quant. nrg_quanta.nrg_bal
Federal Planning Bureau [FPB-1] https://www.dc2024.be/index_nl.html
Federal Public Service - Economy (of Belgium) [FPS-1] https://economie.fgov.be/nl/themas/energie/energie-cijfers/belgian-energy-data-overview
Federal Public Service - Health, Food Chain Safety and Environment (of Belgium) [FPS-2] https://www.health.belgium.be/en/environment/seas-oceans-and-antarctica/north-sea-and-oceans/our-seanutshell
Florence School of Regulation [FSR-1] Five reflections on clean hydrogen’s contribution to European industrial decarbonisation from 2024 to 2030 https://fsr.eui.eu/publications/?handle=1814/76564
International Energy Agency and Nuclear Energy Agency [IEA-1] https://www.iea.org/reports/projected-costs-of-generating-electricity-2020
International Energy Agency [IEA-2] https://www.iea.org/reports/the-role-of-critical-minerals-in-clean-energy-transitions
International Energy Agency [IEA-3] https://www.iea.org/reports/batteries-and-secure-energy-transitions
International Energy Agency [IEA-4] https://iea.blob.core.windows.net/assets/d2ee601d-6b1a-4cd2-a0e8-db02dc64332c/ SpecialReportonSolarPVGlobalSupplyChains.pdf
International Energy Agency [IEA-5] https://www.iea.org/reports/the-role-of-critical-minerals-in-clean-energy-transitions/mineral-requirements-forclean-energy-transitions
International Energy Agency [IEA-6] https://www.iea.org/reports/renewable-energy-market-update-june-2023/is-there-enough-global-wind-andsolar-pv-manufacturing-to-meet-net-zero-targets-in-2030
International Atomic Energy Agency [IAE-1] Technology roadmap for small modular reactor deployment https://www-pub.iaea.org/MTCD/publications/PDF/PUB1944_web.pdf
IET [IET-1] Methods and strategies for overvoltage prevention in low voltage distribution systems with PV https://ietresearch.onlinelibrary.wiley.com/doi/full/10.1049/iet-rpg.2016.0277
Litgrid and RTE International [LIT-1] https://www.rte-international.com/rte-international-to-evaluate-the-lithuanian-power-system L’Echo [LEC-1] https://www.lecho.be/economie-politique/belgique/wallonie/en-wallonie-l-eolien-devra-se-developper-avec-laparticipation-des-citoyens/10524901.html
IRENA [IRE-1] https://www.irena.org/Energy-Transition/Technology/Critical-materials
IRENA [IRE-2] https://www.irena.org/Publications/2023/Aug/Renewable-Power-Generation-Costs-in-2022
IRENA [IRE-3] https://www.irena.org/Publications/2023/Dec/North-Africa-policies-and-finance-for-renewable-energy IRENA [IRE-4] https://www.irena.org/Energy-Transition/Technology/Hydrogen/Global-hydrogen-trade Knack [KNA-1] https://trends.knack.be/nieuws/duurzaamheid/tractebel-smr-mogelijk-operationeel-tegen-2035/
KU Leuven [KUL-1]
Techno-Economic Analysis of HVAC, HVDC and OFAC Offshore Wind Power Connections, Hardy et al., 2019 https://kuleuven.limo.libis.be/discovery/search?query=any,contains,LIRIAS2862630&tab=LIRIAS&search_ scope=lirias_profile&vid=32KUL_KUL:Lirias&offset=0 KU Leuven [KUL-2] https://iiw.kuleuven.be/apps/agrivoltaics/projects.html
Mediterranean Transmission System Operators [MED-1] https://med-tso.org/events/ess-wg-antares-expansion/
National Grid ESO [NGE-1] https://www.nationalgrideso.com/future-energy/future-energy-scenarios-fes Nuclear Energy Agency [NEA-1] https://www.oecd-nea.org/jcms/pl_90816/the-nea-small-modular-reactor-dashboard-second-edition
North Sea Foundation [NSF-1] https://offshore-coalition.eu/publications/north-sea-foundation-publishes-an-analysis-of-potential-risks-to-northsea-nature-posed-by-offshore-wind-energy-transition Nuclear Alliance meeting – Ministère de la transition écologique (France) [NUC-1] https://www.ecologie.gouv.fr/sites/default/files/nuclear%20alliance%20statement_VEN.pdf
Nucleair Forum [NUF-1] https://www.nucleairforum.be/publicaties/opiniepeiling-2021-belg-genuanceerd-maar-positief-tegenoverkernenergie-en-nucleaire
North Sea Summit [NSS-1] https://northseasummit23.be/en/belgium/
INSTITUTION CODE WEBSITE LINK
Open Service for Market European eXpertise (OSMOSE) [OSM-1] https://www.osmose-h2020.eu/
Reuters [REU-1] Germany raises offshore wind capacity target to 20 GW by 2030, 2020 https://www.reuters.com/article/idUSS8N2CH01M/
Dr. Jan Rosenhow [ROS-1] ‘Efficient & Smart Electrification’ Dr. Jan Rosenow, Director of European Programmes at the Regulatory Assistance Project (RAP) (World Energy Outlook Guest Speaker Series) https://www.worldenergy.org.tr/wec-mondays-dr-jan-rosenow/
Institut Rousseau [ROU-1] Road 2 Net Zero EN - Institut Rousseau (institut-rousseau.fr), 2024 https://institut-rousseau.fr/road-2-net-zero-en/
Réseau de Transport d’Electricité français [RTE-1] Futurs énergétiques 2050 les chemins vers la neutralité carbone à horizon 2050 | RTE (2022) https://www.rte-france.com/analyses-tendances-et-prospectives/bilan-previsionnel-2050-futurs-energetiques
Réseau de Transport d’Electricité français [RTE-2] https://www.rte-france.com/en/analyses-trends-and-perspectives/projected-supply-estimates
Universität Erlangen Nürnberg [UEN-1] The economics of global green ammonia trade – ‘Shipping Australian wind and sunshine to Germany’, Egerer, J. et al., 2022
U Gent [UGE-1] Wat valt er te leren uit meer dan 30 jaar nucleaire controverse in België (en waarom trekt men zo weinig lessen)? https://www.ethiekenmaatschappij.ugent.be/wp-content/uploads/2012/07/EM_91-2006-Laes-et-al.pdf
UK Government [UKG-1] https://environmentagency.blog.gov.uk/2023/03/28/permitting-a-new-nuclear-power-station-sizewell-c/
UK Government [UKG-2] https://www.ons.gov.uk/economy/grossdomesticproductgdp
United Nations Framework Convention on Climate Change (UNFCC) [UNF-1] https://unfccc.int/process-and-meetings/the-paris-agreement
U.S. Geological Survey [USG-1] Mineral commodity summaries 2024 https://pubs.usgs.gov/periodicals/mcs2024/mcs2024.pdf
World Bank Group - Norway [WBG-1] GDP (current US$) Norway https://data.worldbank.org/indicator/NY.GDP.MKTP.CD?locations=NO Wikipedia [WIK-1] List of nuclear power stations - Wikipedia
Wind Europe [WEU-1] https://windeurope.org/newsroom/press-releases/wind-energy-permitting-is-improving-but-governments-stillhave-work-to-do/
Wind Europe [WEU-2] https://windeurope.org/newsroom/news/floating-wind-is-making-great-strides/
World Nuclear Association [WNA-1] https://world-nuclear.org/information-library/country-profiles/countries-a-f/france#Stresscorrosion 4COffshore [4CO-1] https://www.4coffshore.com/
Elia utilises highly sophisticated tools that enable the modelling of various scenarios and interactions within the European energy system.
Wouter Nijs Senior expert
The results of Elia’s Blueprint were and will be of great use to our PATHS coalition.
Pieter Lodewijks Programme manager
This Blueprint, along with other modelling work, clearly demonstrates that a significant expansion of the electricity grid is required, extending beyond current plans
Pieter Vingerhoets Senior expert
Like EnergyVille’s PATHS2050 exercises, the Blueprint shows that the energy transition will significantly reduce our dependency on foreign energy. We will not necessarily produce all the electricity we need in Belgium.
Gerrit Jan Schaeffer General manager
Reasoned opinion
Introduction
The purpose of this reasoned opinion is to provide an evaluation of the "Belgian electricity system Blueprint for 2035-2050" conducted by Elia Transmission Belgium We conduct a critical analysis of the study by thoroughly evaluating its assumptions, verifying the credibility of sources, assessing the soundness of the methodology, and ensuring the coherence of arguments. We also check for logical consistency in the conclusions, all within the broader cont ext of energy transition research The focus of this analysis is on the energy system modelling and not on the g rid nfrastructure modelling nor on the materials analysis
This reasoned opinion is authored by EnergyVille a collaborative research partners hip between KU Leuven, VITO, Imec, and UHasselt. As a neutral partner with no vested interests in the policy outcomes, EnergyVille's analysis is grounded in objecti ve scientific principles, ensuring that the evaluation is both unbiased and thorough. The go al is to support policymakers and stakeholders by providing a clear, evidence -based assessment of the study's quantitative methodologies and results EnergyVille cross-checked the main mechanisms of the modelling suite, but was not granted access to the models, so a detailed validation of the model was not conducted
Context of the Blueprint study
The "Belgian Electricity System Blueprint for 2035 -2050," conducted by Elia Transmission Belgium, offers a detailed analysis of potential pathways for Belgium's energy future. The study aims to guide policymakers, industry stakeholders, and the public in achieving a low-carbon energy mix by 2050. Elia created the Blueprint to provide a comprehensive, data -driven framework for navigating Belgium's energy transition, focusing on various scenarios to meet future energy demands while reducing greenhouse gas emissions.
As Belgium's Transmission System Operator (TSO), Elia focuses on ensuring that the grid infrastructure can support new energy sources and future energy needs. The study provides a long-term vision for Belgium’s electricity system, covering the period up to 2050. This is critical given the long lead times required for infrastructure development, technological adoption, and regu latory changes. By balancing economic and environmental goals, the study offers valuable insights into cost -effective and sustainable strategies for Belgium's energy system, helping the country achieve its long -term climate targets.
Analysis of s cenarios
The study explores a wide range of scenarios, including varying levels of electrification, reliance on domestic versus imported energy, and the role of new technologies like nuclear power and offshore wind. The inclusion of over 300 sensitivities for Be lgium’s electricity demand and supply highlights the study's thoroughness. It effectively addresses the uncertainties inherent in long -term energy planning. The key insights, such as the necessity of defining Belgium's future energy mix to avoid costly scenarios, a re well-supported by the data presented.
Evaluation of m ethodology
While the analysis does not model demand options endogenously, the energy modelling in the study includes several beyond state-of-the-art features. Key advancements include multi-energy integration, allowing for optimized interactions between electricity, hydrogen, methane, and liquids; flow -based zonal modelling, which enhances the accuracy of grid constraint simulations across Europe; and an iterative optimization process that consistently refines electricity dispatch alongside mol ecule and carbon capture models. Additionally, the comprehensive carbon management approach, which optimize s carbon abatement investments, and detailed offshore grid modelling focusing on hybrid interconnectors and energy islands, are particularly crucial for future European energy landscapes.
The study utilizes a multi -energy model that includes electricity, hydrogen, methane, and other energy vectors. The quantitative analysis is built around three core scenarios for energy demand Global Ambition (GA), Distributed Energy (DE), and Increased Electrification (ELEC) which are further subdivided into various sub -scenarios and sensitivities. This approach allows for a detailed examination of how different combinations of policy decisions and technological developments might influence Belgium 's energy landscape. The use of different scenarios and time horizons (2036 , 2040, and 2050) adds depth to the analysis, allowing for a nuanced understanding of potential outcomes.
The sources used in Elia’s Blueprint study are diverse, credible, and well -aligned with the broader landscape of energy research and policy. By incorporating input from established industry bodies, consulting firms, and academic institutions, the study ensures a robust foundation for its scenarios and conclusions. Among the most referenced organizations in the report are the European Commission, ENTSOs, Federal Public Service s from Belgium, International Energy Agency, IRENA, European Hydrogen Observatory, EnergyVille, KULeuven, Xlinks and Eurostat
Economic i mplications
The study provides a clear comparison of the total system costs associated with di fferent energy mixes. The study's quantitative analysis reveals that the cost of different energy pathways varies significantly. For instance, the total electricity system cost per megawatt-hour (€/MWh) for Belgium ranges from €110 to €145, depending on th e scenario and the mix of technologies implemented. The analysis suggests that while non-domestic offshore wind appears more cost-effective than new nuclear power, the differences are small and the actual decision should consider various risks, including f inancial, technological, and regulatory uncertainties. This balanced presentation of options is a strength of the study, as it avoids prescribing a one -size-fits-all solution and instead provides a framework for informed decision -making.
Scenario results o n electrification and hydrogen
The Blueprint study presents three scenarios: DE, GA, and ELEC. The DE and GA scenarios, based on TYNDP assumptions, continue to assume the use of methane in buildings. In contrast, EnergyVille’s scenarios emphasize a greater adoption of heat pumps, which are technically capable of meeting all heating needs. In the DE and GA scenarios, there remains a significant reliance on methane for steel production, even up to 2050. The ELEC scenario, develop ed also with input from EnergyVille, features strong electrification and aligns more closely with the PATHS2050 analyses. In EnergyVille’s scenarios, energy use in cars, trucks, and buildings leans more toward technologies that utilize electricity due to heir much higher efficiency. The Blueprint study includes a range of scenarios and options, providing a comprehensive analysis of the impact of various electrification pathways and enabling readers to draw their own informed conclusions.
Total hydrogen supply amounts to 1,900 to 2,700 TWh (including pipeline, ammonia and electrolysers). Electricity based hydrogen generation is limited in Europe, around 500 TWh and often self-consumed The study estimates 121 -180 GW of electrolyser capacity, which is moderate compared to other sources primarily due to access to ammonia imports. While the study optimizes a hydrogen grid, detailed analysis of it is not provided. A graph indicates substantial electrolyser capacity in the Netherlands and Northern Germany, regions with high local hydrogen demand, abundant onshore renewable supply, and access to a robust offshore wind network. In Belgium, however, the role of electrolysers remains limited
Suggestions for future work
For future work, it's suggested to refine the balance between domestically produced and imported synfuels, evaluating the economic rationale behind ammonia -based production versus direct synfuel imports. Incorporating scenarios with higher synfuel imports could provide a comprehensive view of differen t supply chain impacts. Additionally, introducing a higher electrification scenario could address uncertainties in biomethane availability. Other key sensitivities include the impact of ammonia termin al capacity distribution, reduced natural gas use in ste el production, and temporary CO2 storage.
T ransparency
The study’s development involved significant stakeholder engagement, including consultations with academic experts, industry partners, and regulatory bodies. This collaborative approach enhances the credibility of the findings and ensures that the st udy reflects a wide range of perspectives. Overall, the choice of sources significantly contributes to the reliability and relevance of the Blueprint study. Further transparency in data accessibility and a deeper summary of external findings could enhance the ab ility of stakeholders to critically engage with the study's content. We understand and support that Elia is considering publishing additional information on their website , within the limits of confidentiality To improve transparency even more, the Elia Blueprint may provide explanations in the future of CO2 price optimization and sequential optimization techniques. This additional information would enhance transparency and collaboration.
Conclusion
Overall, the "Belgian Electricity System Blueprint for 2035-2050" is a comprehensive and well -reasoned study that provides valuable insights for policymakers. Its strength lies in the detailed scenario analysis and the balanced consideration of eco nomic, technological, and infrastructural factors. As with any scenario analysis, it is crucial to remain mindful of the assumptions and sensitivities of each scenario to ensure well -informed policy recommendations
In summary, the study is a significant contribution to Belgium’s energy planning, offering a detailed roadmap that balances ambition with practicality. It provides a strong foundation for informed decision -making, though continuous updates and transparency will be crucial as the energy landscape evolves.
Annex 1 Overview of the methodologies Us ed in Elia's Blueprint Study
The "Belgian Electricity System Blueprint for 2035 -2050" by Elia Transmission Belgium employs a range of sophisticated methodologies to analyse Belgium's potential energy futures. These methodologies are central to the study's conclusions and recommendations, making their evaluation critical to understanding the study's robustness and reliability.
Multi - energy system modelling
The study utilizes a multi -energy model that integrates electricity, hydrogen, methane, and oth er energy carriers. The model operates with hourly granularity for electricity and daily granularity for other energy vectors, providing detailed insights into the interactions between different parts of the energy system. The study’s cost-benefit analysis evaluates the economic implications of different energy pathways, considering both capital expenditure (CAPEX) and operational expenditure (OPEX) for various technologies. It also accounts for externalities such as greenhouse gas emissions.
The multi-energy modelling approach is highly comprehensive, reflecting the interconnected nature of modern energy systems. This methodology allows the study to capture complex interactions between different energy carriers, providing a more holisti c analysis than electricity-only models. By incorporating both direct and indirect costs, the analysis provides a balanced view of the economic trade-offs associated with different energy strategies. The consideration of externalities, such as the social cost of carbon, adds depth to the analysis and aligns with best practices in sustainability assessments.
The Blueprint energy system model suite
The table provides a detailed overview of the Kari model used in the Elia's Blueprint, describing its purpose, scope, features, inputs, outputs, limitations, and applications.
Category Description
Purpose
The model suite includes a unit commitment model used to simulate and optimize the European e nergy system, taking into account grid constraints, flow patterns, and interactions between different energy vectors.
Scope The electricity part covers the entire European electricity system on a zonal basis, including over 100 onshore zones and more than 400 potential offshore wind farms. It also evaluates over 25,000 potential transmission candidates.
Flow-based constraints: The model incorporates reduced equivalent grid models to accurately capture electricity flows and grid bottlenecks within and between countries.
Key features
Zonal and offshore focus: Detailed modelling of both onshore zones and offshore wind farms, considering hybrid interconnectors and offshore grid developments.
Electricity demand and supply profiles: Hourly data for electricity demand and renewable generation (wind, solar) across Europe.
Inputs
Outputs
Grid infrastructure: Existing and potential grid reinforcements, including HVD C links and AC interconnectors. Technology costs: CAPEX, OPEX, and efficiencies of various generation and storage technologies.
Optimal dispatch and investments: The model provides optimized dispatch schedules and investment decisions for generation and grid infrastructure.
Electricity prices and carbon costs: The model estimates marginal electricity costs and carbon prices based on the optimization outcomes.
Limitations The model suite relies on a zonal approximation, which may not capture all lo cal grid constraints and dynamics.
Modelling approaches beyond State - of - the - art
Though not covering all trade -offs within the entire energy system, several aspects of the energy modelling can be considered beyond state-of-the-art:
Multi-energy integration
One of the most advanced features is the multi -energy integration, where the modelling framework explicitly incorporates different energy vectors such as electricity, hydrogen, methane, a nd liquids. This allows for a comprehensive simulation of interactions between these energy systems, optimizing the overall energy mix for both cost and emissions.
Flow-based zonal modelling
Another cutting-edge aspect is the use of flow-based zonal modelling for the electricity system. This method captures grid constraints and flow patterns with a high level of granularity across Europe, providing more accurate modelling of interconnections and the physical realities of the grid, particularly in a continen -wide context.
Iterative optimization process
The iterative optimization process linking the electricity dispatch model with molecule and carbon capture models represents a sophisticated approach. It ensures that electricity dispatch and the consumption of other energy vectors are consistently optimized, reflecting real-world interactions and the dynamic nature of energy systems.
Comprehensive carbon management
The comprehensive carbon management approach is also notable. By integrating a carb on emissions model that enforces GHG emission targets and derives an associated carbon price, the model optimizes investments in carbon abatement technologies such as CCS, CCU, and Direct-Air Capture (DAC), showcasing a forward-thinking strategy for managing and reducing emissions within the energy system.
Detailed Offshore grid modelling
Finally, the detailed modelling of offshore grid developments, including potential hybrid interconnectors and energy islands, reflects a cutting-edge focus on optimizing o ffshore renewable energy sources and their connection to the grid. This is particularly crucial for the future European energy landscape.
Together, these features demonstrate that the Elia Blueprint's energy modelling is at the forefront of current capabil ities, pushing the boundaries of how energy systems are analysed and optimized in terms of integration, accuracy, and comprehensiveness.
Scenario analysis
The study employs scenario analysis to explore various potential futures for Belgium's energy system. It examines three primary scenarios: Global Ambition (GA), Distributed Energy (DE), and Increased Electrification (ELEC). Each scenario considers diffe rent levels of electrification, energy demand, and the balance between domestic production and imports.
Conclusion
The methodologies used in Elia's "Belgian Electricity System Blueprint for 2035 -2050" are generally robust and align with best practices in energy system modelling. The study’s scenario analysis, multi -energy modelling, and cost-benefit analysis provide a comprehensive and detailed exploration of Belgium’s energy future. However, the study could benefit from increased transparen cy in its modelling assumptions. Overall, the methodologies provide a solid foundation for the stud y's conclusions and make it a valuable resource for policymakers navigating Belgium's energy transition.
Annex 2 Evaluation of methods, results and data and suggestions for future work
Following tables outlines the key areas where the Elia Blueprint exce ls in clarity and where further explanation, or expansion could enhance the overall comprehensiveness and utility of the report. These suggestions aim to improve transparency, reproducibili ty, and the practical application of the Blueprint's findings and m ethodologies. The first table outlines the key methodological approaches used in the Elia Blueprint, highlighting areas that are well -explained and those that require further clarification. Recommendations for improving the methodological transparency and rigor are also provided.
SCENARIOS and METHODOLOGY Details Clear
• Multi-energy capacity expansion and dispatch model: Clearly presented steps, including scenario definition and optimization.
• The analysis covers emissions from the international aviation and shipping sectors.
• The study assumes that feedstock (non-energy purposes) would fall under the Emissions Trading System (ETS) mechanism, meaning CO2 prices would apply for the use of fossil fuels. In the case of feedstock, this implies that the life cycle emissions of fossil-derived end products are taken into account.
• Adequacy study: well-defined process for ensuring adequacy in the power system, particularly the simulation of climate years.
• Marginal abatement cost curve (MACC) methodology: general approach provided, but sector-specific data collection and assumptions are less clear.
Limited explanation in the report
• Improved explanation regarding CO2 price (optimizing CO2 price to reach carbon neutrality)
• Sequential optimization process: concept is introduced but underlying mathematical or computational techniques are not fully elaborated.
• Refine the explanation and balance between domestically produced and imported synfuel. In the current approach, synfuels are produced in Europe using hydrogen from imported ammonia, hydrogen pipelines, or electrolysis. This raises questions regarding the economic rationale behind preferring ammonia -based synfuel production over the direct import of synfuels. The model selects this approach based on the assumed spread between ammonia and synfuel prices which may not be optimal. However, the cost spread between ammonia and synfuel would be improved, the impact on the power system will likely be minimal whether synfuels are produced domestically or imported.
Suggestions for future work
• The model could also incorporate alternative scenarios where a significant share of synfuels is imported directly rather than being produced domes tically from imported ammonia. This would allow for a more comprehensive evaluation of the impacts of different supply chain configurations.
• Include a higher Electrification scenario due to the uncertainty surrounding the availability of biomethane. Rationale: almost 1,100 TWh of biomethane is used in all scenarios. As the availability of biomethane remains uncertain, exploring higher electrification scenarios will provide a clearer understanding of how Belgium can meet its energy needs with lower reliance on biomethane
• Other sensitivities on some key assumptions:
• Impact of different capacity distribution of ammonia terminals, not in line with their domestic demand
• Impact of lower natural gas use in steel production.
• Impact of CO2 release that is only stored temporarily in materials
The following table presents an overview of the results from the Elia Blueprint, indicating which aspects are clearly reported and where additional detail or case studies would be beneficial. It includes suggestions for further analysis to deepen the under standing of energy system interactions and costs.
RESULTS Details
• Energy system costs: clearly presented breakdown of total system costs, including CAPEX, OPEX, and fuel costs.
• Supply and demand balances: clear visual representations provided for methane, hydrogen, and other energy vectors.
Clear
Limited explanation in the report
• 4.2.4 Electricity flows. The report makes clear that the links between zones which are loaded the most bidirectionally are not necessarily the ones which are loaded the most directionally. It is made clear how arge annual imports or exports (average directionally flows) are in each Belgium (though in an unexpected location in the report, see “ electricity mix dashboard ”) In the grid chapter (5.7.2), it is explained that a further onshore reinforcement between Fr ance and Belgium is not selected, instead increasing capacity via offshore nodes in the Atlantic
• Information is available from the multi-region model on the type of methane supplied in the long term. Similar to electricity, methane is flowing freely and the exact source abroad cannot be identified A proxy for the fossil share of methane in Belgium is the reported EU mix.
• 5.1.4. Imports for Belgium There is limited explanation on the sourc e of electricity imported in the different scenarios, though results imply that most of the electricity imports are non-domestic offshore wind connected to Belgium Regarding electricity imports, it is understandable that you cannot simply identify the exa ct source and the technology abroad used to generate it. Without additional runs it is not possible to link additional production units responsible for the extra imports into Belgium.
• Location of electrolysers. The report explains that the optimizer places electrolysers primarily in close-to-shore zones with excess wind in Northern Europe and excess solar PV in Southern Europe. It is clearly stated that local hydrogen demand plays a crucial role. There is however a limited number of electrolysers in Southern Europe and it is unclear how results and costs for additional electricity infrastructure would change in case of massive rollout of PV
• Further elaborate on the role of flexibility within the energy system, including demand -side response and storage options. Explain why residential batteries have a smaller share in storage or demand response compared to the European results.
• Further elaborate on the costs of the methane system. The report explains that the starting grid for the methane system is the existing methane grid in Europe and that no investments (or decomissionings) are considered. Still, the maintenance of this large network has a cost a nd this cost is not begin reported.
The last table summarizes the clarity and limitations of the data presented in the Elia Blueprint, focusing on energy demand, production data, and cost inputs. It also provides suggestions for enhancing the transpare ncy and detail of the data used in future work.
DATA
Details
• Energy demand data: well-documented existing and projected final consumption of energy in TWh by end-use and energy carrier. Demands from the DE and GA scenarios are linked to TYNDP24.
Clear
Limited explanation in the report
• Power production data: clearly outlined existing and projected capacity of power production technologies in MW.
• Clear overview of ead times (construction times) for new nuclear reactors as well as construction delays. Construction delays are however not accounted for in the modelling.
• Flexibility volumes from electric vehicles. Limited explanation on the sources of the 4.3 GW V1X (optimised charging) and 4 GW V2X (vehicle-to-grid) for the DE scenario and the ELEC and SUFF sensitivities
• Relative impact of sufficiency versus the DE scenario in 2050: some (smaller) deviations to the original EnergyVille study; unclear explanation why values differ.
• The study could provide clearer documentation regarding the amount of carbon required to produce synfuel or to use it in material product ion.
• Unclear if waste treatment is included in the CAPEX of new nuclear.
Suggestions for future work
• Open data: consider making the raw data and modelling tools available to stakeholders and the public for increased transparency, collaboration and reprodu cibility
Annex 3 Renewable potential and deployment
Renewable potentials
Wind onshore and solar are in all s cenarios based on the trajectories that were brought forward during the public consultation of the TYNDP2024 scenarios (with adaptations for the PV trajectories reflecting recent growth trends) , except in the PV+ scenario The PV+ scenario increases the PV capacity for 2050 on top of the RES+ scenario : PV +100 GW/year
The assumptions for biomass capacity are fixed at approximately 5 GW, based on the expected capacity projected for 2030.
The offshore wind potential is identified via a detailed approach, starting with a database from 4C Offshore [4CO -1], and considering both geographical constraints (bathymetry, shipping routes, environment zones, etc.) and latest identified offshore zones in national plans. In the North Sea basin, the potential amounts to 360 GW.
Comparing wind and solar PV projections
In comparing the "Belgian Electricity System Blueprint for 2035 -2050" with the European Commission's impact study on the Climate Target 2040 and the REPowerEU plan, follwing differences emerge, particularly concerning the projected capacities for wind and solar energy.
1. Wind energy projections:
In the DE scenario (Central RES), which includes the EU27 plus Norway, the UK, and Switzerland (EU+), the projected total wind capacity for 2040 is 830 GW, consisting of 550 GW from onshore wind a nd 280 GW from offshore wind. By 2050, the total wind capacity is expected to increase to 940 GW, with 620 GW from onshore wind and 318 GW from offshore wind. When focusing solely on the EU, the total wind capacity is projected to be around 700 G W in 2040 and approximately 800 GW in 2050.
Due to data availability, the below statements refer to the combination of onshore and offshore wind capacities.
o 2040: The Blueprint study projects a total wind capacity of 700 GW by 2040. This is significantly lower than the European Commission’s Climate Target 2040, which estimates a round 900 GW of wind capacity by the same year.
o 2050: Similarly, the Blueprint’s projection for wind energy by 2050 is 800 GW, whereas the EU “Climate Target 2040” study anticipates a much higher capacity of around 1200 GW. This indicates that the Blueprint study is more conservative in its wind energy assumptions compared to the European Commission’s more ambitious targets. The Blueprint economically optimizes the build -out of offshore wind in Europe, primarily focusing on the local generation and treatment of hydrogen. Similarly, in the scenario runs for the European Commission, the deployment of various technologies is driven by cost optimization. However, likely due to differences in cost assumptions particularly regarding electrolysers and synfuel imports there is a significantly higher reliance on electrolysis-based hydrogen production in the European Commission’s scenarios.
o The REPowerEU plan, part of the European Commission’s strategy to accelerate the transition to renewable energy, also emphasizes a higher wind capacity compared to the Blueprint study.
2. Solar PV projections:
o The solar PV projections in the Blueprint study align closely with those in the European Commission’s Climate Target 2040 study, though the Blueprint’s estimates for 2050 are slightly lower. This suggests that both studies share similar expectations for the growth of solar energy, albeit with minor variations.
The "Belgian Electricity System Blueprint for 2035 -2050" adopts a more conservative stance on wind energy capacity compared to the European Commission’s Climate Target 2040 and REPowerEU studies.
Annex 4 Results in the broader context of energy transition research
In the next sections, EnergyVille authors compare energy results from the Blueprint study with other studies. Some results ha ve been benchmarked within the study. Chapter F.6. of the Blueprint study discusses a comparison of the final system cost s and material needs from the study with previous studies by the European Commission (EC) and Institute Rousseau, noting that while direct comparisons are limited due to differences in scope and methodology, the results show that the investment needs and material needs estimated by the Cost tool align with those from the other studies, with necessary adjustments made for scope and country-specific data (e.g., scaling RTE’s material needs for France to an EU level).
Benchmark the final energy demand with EU 2040 Climate Target Impact Assessment
Demands from the Elia DE and GA scenarios are linked to TYNDP24. In Figure 1 the comparison is presented of the TYNDP DE scenario with the European Commission's IA S31 scenario for the year 2050 There are differences in the predicted distribution of energy sources between the two scenarios, especially in how they treat renewables, hydrogen, and synthetic fuels
In terms of electricity, the TYNDP DE scenario projects a slightly higher consumption (3932 TWh) compared to the European Commission IA S3 scenario, which estimates 3695 TWh. This suggests that TYNDP DE places a slightly greater emphasis on electricity as a key energy carrier in the future, although the differenc e between the two projections is not substantial.
Figure 1: Final Energy Consumption for the EU of the TYNDP DE and EC IA S3 scenarios in 2050
Notes: Final Energy Consumption excludes energy branch, international shipping, ambien t heat, non-energy and includes aviation. Within TYNDP, additionally part of energy branch is included (as some are reported under industry). Hydrogen includes ammonia production for TYNDP scenarios. DE scenario synfuels and biomethane are distributed unde r methane and liquid demands. Renewables* only includes some biofuels and biomass in the DE scenario but also include RFNBO fuels in the EC IA scenario. Solid fuels have been removed because very low.
The contribution of hydrogen and synthetic fuels is significantly higher in the European Commission IA S3 scenario, which projects 1110 TWh compared to 824 TWh in the TYNDP DE scenario. This indicates that the Commission anticipates a larger role for these fuels in decarbonizing the energy system, espe cially in sectors that are harder to electrify.
The difference in methane is mostly due to the different categorisation. For liquids TYNDP DE estimates 511 TWh while the European Commission IA S3 scenario predicts a lower consumption of 356 TWh. The difference could be partially explained by
1 “COMMISSION STAFF WORKING DOCUMENT IMPACT ASSESSMENT REPO RT Part 3 Accompanying the Document COMMUNICATION FROM THE COMMISSION TO THE EUROPEAN PARLIAMENT, THE COUNCIL, THE EUROPEAN ECONOMIC AND SOCIAL COMMITTEE AND THE COMMITTEE OF THE REGIO NS Securing Our Future Europe’s 2040 Climate Target and Path to Climate Neutrality by 2050 Building a Sustainable, Just and Prosperous Society,” 2024, https://climate.ec.europa.eu/eu-action/climate-strategies-targets/2040-climate-target_en#documents.
the inclusion of Renewable Fuels of Non-Biological Origin (RFNBO) in the Commission's renewables category, which might otherwise fall under liquids or gas in other scenarios.
For district heating, TYNDP DE projects 597 TWh which is significantly higher than the 359 TWh predicted in the European Commission IA S3 scenario. This suggests that TYNDP DE expects a more widespread adoption of district heating as a means of delivering energy for heating and cooling purposes.
Finally, the final energy consumption (FEC) in TYNDP DE is higher, at 6817 TWh, compared to 6450 TWh in the European Commission IA S3 scenario. The Commission's scenario envisions a lower overall final energy consumption, indicating a greater emphasis on energy efficiency.
Evolution of the primary energy demand in the Blueprint’s scenarios
First, we compare the primary energy consumption of the European energy system in 2019 with the various scenarios Elia scenarios (Elia DE, Elia GA, Elia ELEC and Elia High RES). The role of renewable energy sources expands significantly. Wind energy grows to between 18-22%, a substantial increase compared to 2019. Solar PV also rises, reaching 13-20% Hydropower remains steady at around 5% This substantial increase in renewables u nderscores their central role in replacing fossil fuels in Europe’s future energy system. In addition to renewables, new low-carbon fuels such as imported hydrogen, synthetic fuels (synfuels), and ammonia play a crucial role in the 2050 scenarios. These fu els contribute between 10-20% of the total energy mix, providing key solutions for decarbonizing sectors that are more difficult to electrify. Nuclear energy remains an important part of the energy mix, although its share decreases slightly to between 9-11% Biomass and waste feedstock continue to play a significant role, contributing 24-26%, which is more than a doubling compared to 2019.
Overall, the comparison shows that the share of fossil fuels is reduced to less than 10% by 2050 in all scenarios. This sharp reduction is driven by several factors. First, electrification reduces the need for primary energy by replacing less efficient fossil fuel-based processes, such as heating and internal combustion engines. Second, the increasing role of renewables, particularly wind and solar PV
Benchmark primary energy demand with EU energy system analyses
In Figure 3 a comparison is presented of the energy mixes in different scenarios Following sources have been used in this comparison: European Commission2 Béres et al3., TYNDP244 scenario results and Neumann et al5 Absolute numbers are difficult to compare because the Blueprint study results include UK, Norway and Switzerland. For that reason, we use the share of the different energy vectors.
In the hydro category, the difference between Elia scenarios (5%) and other scenarios is minimal. Most scenarios, including the European Commission IA S3, TYNDP DE, TYNDP GA, Béres et al., and Neumann et al., report similar contributions, ranging from 3% to 5%, showing general agreement on the role of hydro energy.
For solar PV, the Elia ELEC scenario projects 15% which is aligned with the European Commission IA S3 scenario . The Elia High RES scenario (20%) is more in line with other scenarios like TYNDP DE (23%) and TYNDP GA (18%). The studies Béres et al. (26%) and Neumann et al. (27%) projects even higher Solar PV contributions. In terms of wind energy Elia s wind energy projection is moderate The Elia scenarios projects 20-22%% which is lower than the 30% in the European Commission IA S3, 40% in TYNDP DE, and 37% in TYNDP GA. Neumann et al. anticipates the highest wind energy share at 42% while Béres et al. projects a much lower 16% (but this is very scenario dependent).
Figure 3: Primary energy supply for Europe (left) and EU (right), comparison based the Elia ELEC scenario. Notes: For simplicity, we added imported hydrogen, synfuels and ammonia into one category. Includes international shipping & aviation and non -energetic feedstock demand. Where available (Elia, EC, Béres et al.), data on biomass feedstock have been used instead of bio energy products Béres et al. and Neumann et al. include ambient heat used by heat pumps in the gross available energy (as Eurostat does)
2 “COMMISSION STAFF WORKING DOCUMENT IMPACT ASSESSMENT REPORT Part 3 Accompanying the D ocument COMMUNICATION FROM THE COMMISSION TO THE EUROPEAN PARLIAMENT, THE COUNCIL, THE EUROPEAN ECONOMIC AND SOCIAL COMMITTEE AND THE COMMITTEE OF THE REGIO NS Securing Our Future Europe’s 2040 Climate Target and Path to Climate Neutrality by 2050 Building a Sustainable, Just and Prosperous Society.”
3 Rebeka Béres et al., “Will Hydrogen and Synthetic Fuels Energize Our Future? Their Role in Europe’s Climate-Neutral Energy System and Power System Dynamics,” Applied Energy 375 (December 1, 2024): 124053, https://doi.org/10.1016/j.apenergy.2024.124053. 4 ENTSO-E and ENTSOG, “TYNDP 2024 Scenario Report,” TYNDP 2024, May 2024, https://2024.entsos -tyndp-scenarios.eu
5 Fabian Neumann et al., “The Potential Role of a Hydrogen Network in Europe,” Joule 7, no. 8 (August 2023): 1793–1817, https://doi.org/10.1016/j.joule.2023.06.016.
Figure 2: Primary energy supply for Europe in 2019 and 2050, source: Elia Blueprint. Notes: Data for Europe (incl. UK, NO, CH). Includes international shipping & aviation and non -energetic feedstock demand. Historical values based on EUROSTAT
Biomass and waste feedstock is estimated at 24-25% in the Elia scenarios making it the highest among the projections. Most other scenarios, like the European Commission IA S3 ( 20%), TYNDP DE (18%), TYNDP GA (20%), and Béres et al. (15%), project lower shares for biomass. Neumann et al., with only 12%, is the most conservative. This suggests Elia ELEC places a stronger emphasis on biomass as part of the future energy mix.
The imported hydrogen, synfuels, and ammonia category shows significant differences. Elia ELEC projects 17% while most other scenarios, including the European Commission IA S3 and Neumann et al., do not include this energy source. TYND P DE and TYNDP GA project smaller shares of 6% and 10%, respectively, and Béres et al. projects 15% This indicates that Elia ELEC envisions a major role for hydrogen and synfuels in decarbonizing the energy system. The High RES scenario from Elia only reaches 10% of imported hydrogen, synfuels, and ammonia
Nuclear energy is projected to make up 9-11% of the energy mix in the Elia scenarios slightly lower than the 14% projection in the European Commission IA S3 scenario. In contrast, TYNDP DE and TYNDP GA project much lower nuclear shares, at 3% and 5% respectively, while Béres et al. anticipat es 13% For the TYNDP scenarios, the low share of nuclear is not related to the capacity but to the participation in the electricity market. Neumann et al. projects no contribution from nuclear energy.
For gas, the Elia ELEC scenario projects 3%, which is close to the 4% projection by the European Commission IA S3 scenario The scenario High RES is in line with TYNDP DE, TYNDP GA and Neumann et al., which project no gas usage. Béres et al. anticipates a very small 1%
Oil in the Elia scenarios is expected to make up 4-10% In most scenarios, a high share of oil is used for non-energy uses (feedstock) to produce materials.
In summary, the Elia ELEC sce nario emphasizes biomass and hydrogen/synfuels more than most other scenarios, while maintaining a moderate stance on wind and solar PV It anticipates a moderate role for nuclear energy and minimal use of fossil fuels like gas and oil, aligning with general trends in other scenarios but with some key differences in emphasis on specific energy sources.
Benchmark with PATHS2050 for Belgium
In all three scenarios (DE, GA, and ELEC), electricity demand shows a significant increase, ranging from +110% to +130% compared to 2022. The Electrification Scenario in PATHS2050 (2022 version) has a similar shift towards electrification, leading to a 2.3-fold increase in electricity use by 2050 compared to 2020 . The biggest difference is methane imports and usage, that is mostly consumed by industries and by ships.
Annex 5 Sources used in Elia's Blueprint study
The "Belgian Electricity System Blueprint for 2035 -2050" by Elia Transmission Belgium is a comprehensive study that relies on a diverse array of sources to inform its assumptions, methodologies, and conclusions.
Diversity and Range of Sources
The Blueprin study incorporates a wide range of sources, including academic research, industry reports, regulatory documents, and data from well-established energy organizations. Key sources cited include:
• European network transmission system operators for electricity and gas (ENTSO-E and ENTSO-G) The study references the Ten-Year Network Development Plan (TYNDP), which provides demand scenarios (TYNDP 2024) that are supported by stakeholders from each country and provides data for the European grid (TYNDP 2022)
• International Energy Agency (IEA) The study uses data and projections from the IEA, a globally recognized authority on energy statistics and policies.
• Peer-reviewed papers and reports: References to peer-reviewed articles, such as those published in the Energies journal, ensure that the study’s scientific and technical assumptions are grounded in validated research.
This diversity of sources strengthens the credibility of the study by integrating multiple perspectives and ensuring that the analysis is informed by a broad spectrum of expertise.
Consistent with TYNDP 2024 , but also going beyond
The alignment of the study’s scenarios with the TYNDP 2024 is particularly important. This ensures that the Blueprint’s scenar ios are consistent with broader European energy strategies, making the findings relevant not just for Belgium. While aligning to TYNDP 2024, Elia’s study also differs from it:
• A scenario is created to allow more electrification in vehicles and heating. Only how demand is being se rved is changed, not the actual demand level of the activity.
• Unlike the TYNDP demand scenarios, which combine all hydrogen demands into a single final demand category, this study treats energy and non-energy hydrogen demands separately. This approach all ows for the consideration of alternative strategies, such as importing synthetic fuels or using bio/fossil energy vectors, which may be more economical than producing or importing hydrogen directly.
Details on the Belgian energy demand in 2050
Specifically for Belgium, Appendix I outlines nicely the projected shares in final energy of electricity, hydrogen, methane, and other energy carriers by sector (transport, industry, etc.) for 2050. Electrification (always on the left) plays a pivotal role across sectors.
The category “Other” includes among others district heat and liquid fuels. As such, Appendix I provides critical assumptions underlying the modelling, offering essential context that readers need to consider to fully grasp the magnitude and implicat ions of the energy transition outlined in the report.
Figure 4 Details on the Belgian energy demand in 2050. Source: Elia Blueprint
Use of c onsulting f irms and Expert r eview
Elia’s study also engaged reputable consulting firms such as Compass Lexecon and Sia Partners, which provided inputs on cost assumptions and marginal abatement cost curves. The involvement of these firms is a positive aspect, as they bring specialize d knowledge in economic modelling and scenario analysis.
Transparency and d ata a vailability
The study includes detailed references and provides transparency in the sources of its data. For instance, it cites specific studies and documents from regulatory bodies and academic publications, making it easier for stakeholders to verify the information and methodology used. Chapter 3.3 covers financial assumptions including investment costs, c ost of capital
Conclusion
The sources used in Elia’s Blueprint study are di verse, credible, and well-aligned with the broader landscape of energy research and policy. By incorporating input from established industry bodies, consulting firms, and academic institutions, the study e nsures a robust foundation for its scenarios and conclusions. However, further transparency in data accessibility and a deeper summary of external findings could enhance the ability of stakeholders to critically engage with the study's content. Overall, the ch oice of sources significantly contributes to the reliability and relevance of the Blueprint study.
Registered offices
Elia Transmission Belgium, Boulevard de l’Empereur 20 1000 Brussels, Belgium
Contact
info@elia.be
Graphic design
WE WOULD LIKE TO THANK EVERYONE WHO CONTRIBUTED TO THIS REPORT