

GOING LIKE THE WIND
The virtuous circle of offshore wind benefits in Europe
“A
central element in accelerating decarbonisation will be unlocking the potential of clean energy through a collective EU focus on grids. Delivering a step change in grid deployment will require a new approach to planning at the EU and Member State levels, including the ability to effectively reach decisions and accelerate permitting, to mobilise adequate public and private financing and to innovate grid assets and processes. From a European perspective, rapidly increasing the installation of interconnectors should be the focus.”
The Draghi report, published on 9 September 2024, highlights the high cost of energy as a significant barrier to the competitiveness of European businesses. It identifies weaknesses in both gas and electricity markets that, if addressed, could help to reduce prices and their volatility. The report emphasises that accelerating the decarbonisation of the energy system in a technology-neutral and cost-effective manner is essential for sustainably lowering energy prices in the long term.
Extract from ‘The future of European competitiveness - A competitiveness strategy for Europe’ by Mario Draghi (2024)
WHAT IS A VIRTUOUS CIRCLE?
TABLE OF CONTENTS
A virtuous circle is a positive cycle of events, as part of which each event contributes to the success of the next. In the context of offshore wind benefits, the expression refers to a scenario in which addressing one challenge will make subsequent challenges easier to tackle. For example, by implementing riskreduction strategies that lower project financing costs, more private investors can be attracted to invest in the development of offshore wind energy, ultimately supporting Europe’s transition to a net-zero future.
CHAPTER 1, OFFSHORE WIND ENERGY AND CROSSBORDER CONNECTIONS ARE A WINNING COMBINATION
CHAPTER 2, STRATEGIC CROSS-BORDER PLANNING WILL MAXIMISE THE WIND POTENTIAL OF EUROPE’S SEAS WHILE ENHANCING
IT
FOREWORD
› Given that Europe’s offshore wind potential is not evenly spread out across different Member States, national solutions alone will not be enough to ensure the success of the energy transition.
› This vision paper provides a holistic view of the steps that need to be taken to reach Europe’s ambitious offshore wind targets and to bridge the gap between Europe’s current offshore wind capacity and its offshore capacity targets.
› By capitalising on the growth potential of offshore wind development, decarbonisation will become a significant source of economic growth. Moreover, Europe will be able to secure its energy future while boosting its economy and workforce.

RIPPLES OF POSITIVITY
EMPOWERING CLEAN COMPETITIVENESS IN EUROPE
Dear reader,
‘Ripples of positivity’ expresses the idea that positive actions can set off a chain reaction of beneficial outcomes, much like small waves spreading out across the surface of water. That is exactly what this vision paper is about.
‘Going Like the Wind’ explores the virtuous circle of offshore wind benefits in Europe. It demonstrates how international collaboration, strategic cross-border planning, investment security and the scaling up of supply chains in offshore wind development will each deliver benefits on their own and will also feed into each other’s success. The ripples of positivity initiated by these efforts have the potential to create a much larger wave of change. We are not alone in holding this view.
In April this year, Elia Group published Making Hybrids Happen with the Danish energy company Ørsted. In it, we proposed a novel approach to offshore development, including the adoption of a regional approach to the planning of offshore projects and the establishment of an Offshore Investment Bank to support the development of groups of projects located across the same sea basin areas together.
This vision paper goes one step further. It is not a blueprint for the future energy mix nor a grid development plan. Instead, it is one of the few papers that provides European actors with a more holistic view of the steps that need to be taken to bridge the gap between Europe’s current offshore wind capacity and its offshore capacity targets. These steps are essential, since, given that Europe’s offshore wind potential is not evenly spread out across different Member States, national solutions alone will not be enough to ensure the success of the energy transition.
Our aim for this viewpoint was to answer the following questions: what is the value of offshore wind for Europe today and what will it be in the future? How can offshore wind development be undertaken in the most efficient way possible whilst respecting wind resources and sustainability and economic feasibility considerations? How can planning, funding and risk allocation procedures be set up across sea basin areas and across borders?
Many stakeholders from the European energy sector, including other grid operators, various federations and academics, are grappling with the same questions and also endorse the urgent need for change. You’ll find their valuable contributions throughout the report. Moreover, the need for swift action is also gaining support from policymakers.
Mario Draghi’s most recent report, The Future of European Competitiveness’, has made clear what is currently at stake for Europe. It highlights the high cost of energy as being a significant barrier to the competitiveness of European businesses. The report emphasises that accelerating the decarbonisation of the energy system in a cost-effective manner is essential for sustainably lowering energy prices in the long term.
This message is undoubtedly resonating amongst European and national policymakers.
Shortly after her re-election as President of the European Commission in July, Ursula von der Leyen pointed out that the long-term goals of the Green Deal remain unchallenged. However, to maintain support for the energy transition, the Commission will place a greater importance on enhancing the competitiveness of our industries.
Although the next decade will be critical for empowering clean competitiveness in Europe, the Draghi report also carries a very hopeful message. Indeed, the EU is a global front-runner in clean technology, with one fifth of clean technologies worldwide being developed on the continent – and the global decarbonisation drive offers up an opportunity for EU industry to grow.
As demonstrated by our study, the ecosystem for offshore wind is well distributed across Europe, with several champions leading in the development of different elements of the value chain. By capitalising on the growth potential of offshore wind development, decarbonisation could become a significant source of economic growth. Europe could secure its energy future while boosting its economy and workforce.
However, to ensure that the benefits of offshore wind in Europe create a virtuous circle rather than a vicious one, many challenges need to be addressed. Unlocking the potential of clean energy at sea demands immediate political action regarding joint planning and funding and concrete laws for the manufacturing industry to scale up and deliver on Europe’s ambitions. These concrete actions all rely on the timely development of an integrated grid. As the Draghi report states: “From a European perspective, rapidly increasing the installation of interconnectors should be the priority”.
Maintaining the current status quo would not only put clean competitiveness at risk, it would also mean missing out on significant efficiency savings. The analysis for this study calculated the potential outcome of fully unlocking the benefits of international collaboration, the de-risking of investments, and an effective approach to offshore spatial planning. From 2030 to 2050, this could produce savings for the European energy system of more than €1000 billion.
Until now, the integrated European electricity market has primarily focused on imports and exports of electricity. We are slowly moving towards greater collaboration in the coordination and development of large-scale offshore wind projects. As a result, the energy futures of countries like Belgium and Germany will be increasingly intertwined with those of their European neighbours.
In any case, it is clear that good intentions in terms of cooperation and increased offshore wind targets alone are insufficient. After two successful North Sea summits in Esbjerg (May 2022) and Ostend (April 2023), the forthcoming summit in Hamburg in June 2025 will highlight what is truly at stake - and hopefully encourage actors to set the virtuous circle of benefits into motion.
This vison paper aims to offer up some key points for consideration during the upcoming discussions.
We hope you enjoy the read!
What does the figure above show?
The green bars represent the levels of offshore wind capacity that were installed across the EU, UK and Norway (in GW) in 2018 and 2023, alongside the total capacity that these three areas are likely to reach together by 2030 if the current installation pace is maintained.
The blue bars represent the offshore wind capacity targets that the EU, UK and Norway have collectively set themselves for 2030 and 2050: 166 GW and 496 respectively.
Frédéric Dunon CEO of Elia Transmission Belgium
Catherine Vandenborre Interim CEO
of Elia Group
Stefan Kapferer CEO of 50Hertz
It is clear that, if the current installation pace of 8 GW per year is maintained, only 90 GW of offshore wind capacity will be installed by 2030 – well below the 166 GW target. What does this tell us?
Whilst Europe and its neighbours recently managed to accelerate the pace at which they develop offshore wind assets, this pace will have to be sped up even further for offshore targets to be met. Given that offshore projects have long lead times (around 10 years), decisions about future projects must be taken now in order to ensure that the right amount of capacity can be developed in time.
At the invitation of Belgium, the second North Sea Summit took place in Ostend on 24 April 2023. By signing the Ostend Declaration, nine North Sea countries committed to developing the North Seas into the world’s largest green energy power plant.
“We will jointly develop the North Seas as a Green Power Plant of Europe, an offshore renewable energy system connecting our countries with a particular focus on joint hybrid/ multi-purpose and cross-border offshore projects and hubs, offshore wind and renewable hydrogen production at massive scale as well as electricity and hydrogen interconnectors and national projects, including the possibility for cofinancing by countries without direct access to the sea”.
Ostend Declaration, April 2023
THIS STUDY AIMS TO ADDRESS THE FOLLOWING KEY QUESTIONS:
1|
What essential steps are needed to bridge the gap between current offshore wind capacities in our seas and future offshore targets?
2| What is the value of offshore wind for Europe today, and what will it be in future?
3| How can offshore wind development be undertaken in the most efficient way possible whilst respecting wind resources and sustainability and economic feasibility considerations?
4| How can planning, funding and risk allocation procedures be set up to facilitate the development of sets of offshore wind projects across the same sea basin, and/or across borders?
OUR RESEARCH
In recent years, Elia Group has published several papers on offshore wind development and hybrid interconnectors in particular. We are convinced that this will help Europe to harness the full renewable potential of its seas while more effectively distributing the electricity produced among its Member States.
Elia Group publishes a white paper on the importance of hybrid interconnectors.
‘Harvesting Europe’s Full Offshore Potential’ proposes methods for incentivising countries with different amounts of RES potential to collaborate and de-risk the investments provided by wind generation and transmission developers.
Elia Transmission Belgium publishes its blueprint for the Belgian electricity system in the lead-up to 2050. The study concludes that without a long-term strategy and new policy measures in place for its future energy mix, Belgium will become increasingly reliant on imports. The study outlines several options for dealing with this change, each of which carries its own economic and technical impacts. One of the study’s insights is that, as an additional large-scale electricity source, non-domestic offshore wind seems to be a cost effective solution for Belgium.
April


Elia Group publishes its Roadmap to Net Zero study, which explores the building of a climate-neutral European energy system by 2050.
One of the study’s main conclusions is that Europe’s direct electricity demand can be met - but only if we accelerate RES expansion by a factor of three and build more interconnectors to balance out the uneven distribution of renewable energy sources (RES) across Europe.
Aside from their key role in enabling the exchange of RES between countries, interconnectors also level out (weekly) fluctuations in wind production. Therefore, they are also important for reducing the impact of local RES supply dips.

Elia Group and the Danish wind farm developer Ørsted launch a joint paper which proposes novel approaches to offshore development, including the adoption of a regional planning approach (across entire sea basins) to offshore development and mechanisms to give developers visibility on longterm commodity prices, thus strengthening their business case. The paper also proposes the concept of an Offshore Investment Bank for the first time.
HOW DID WE CONDUCT THIS STUDY?
The insights and recommendations included in this study are based on quantitative analyses of a range of scenarios as shown below. They included simulations with the Ten-Year Network Development Plan (TYNDP) 2024 scenarios by ENTSO-E and ETNSO-G, analyses of several decades of weather data, computations of supply chain demand as well as assessments of the latest maritime spatial plans. The scope of our analysis covered the whole of Europe, with a focus on the Baltic and North seas.
A framework of original analyses was set up for this study. Whilst the analyses were conducted independently, they were coupled with a selection of scenarios in order to investigate how much value collaboration holds. As a consequence, this study covers a range of aspects that should no longer be regarded as independent from each other; instead, they should be explored and viewed as forming part of one unified whole.
Over the past year, Elia Group has held discussions with over 50 companies, associations, universities and think thanks in order to outline the virtuous circle of offshore wind benefits in Europe. We would like to sincerely thank the stakeholders below for their valuable input and feedback.


CLARIFYING A FEW CONCEPTS COVERED IN THIS STUDY
RADIAL CONNECTIONS
A radial connection is a single-purpose solution. It directly links one or more domestic offshore wind farms to a designated point along one country’s main onshore electricity grid. To date, nearly all offshore wind capacity in Europe has been connected to the shore via radial connections, with the notable exception of the Krieger’s Flak - Combined Grid Solution (see point 3).
Looking ahead to 2030, offshore wind development in Europe will continue to rely on radial connections. However, several hybrid projects are already being planned and projects of this kind are expected to play an increasingly significant role in the future energy landscape.
Examples of radial connections:
▶ Elia’s Modular Offshore Grid (MOG) or plug-at-sea bundles the electricity generated by four wind farms together and then transmits it to Stevin, the high-voltage substation in Zeebrugge (Belgium). The MOG was commissioned in 2019.
▶ Ostwind 1 is 50Hertz’s first shared cabling project. It involved building three cables for two offshore wind farms (Wikinger and Arkona) in the German part of the Baltic Sea, with one of these three cables being a shared cable. The Ostwind 1 project was finished in 2019.
2| POINT-TO-POINT INTERCONNECTORS
Point-to-point interconnectors enable the direct transmission of electricity between two points. Typically, they run between two different regions, countries, or power systems. They play a crucial role in the integration of energy markets, allowing for a more efficient use of resources and helping to lower costs for consumers.
Examples of point-to-point interconnectors:
▶ Nemo Link Belgium’s first HVDC offshore interconnector, which links it to the UK; it has been operational since 2019.
▶ KONTEK the first HVDC interconnector to link Germany to Denmark; it stretches across the Baltic Sea and has been operational since 1995.
3| HYBRID INTERCONNECTORS
Hybrid interconnectors carry two functions: they link two countries together whilst also connecting these to one or several offshore wind farms.
Several projects of this kind are in different stages of planning and development across Europe, such as the Bornholm Energy Island (Denmark Germany), Nautilus (Belgium - United Kingdom) or Elwind (Estonia - Latvia).
Example of a hybrid interconnector:
To date, only one such project (the Kriegers Flak – Combined Grid Solution which connects Denmark to Germany) has been realised. This is primarily due to the regulatory framework in place, which has traditionally supported the development of either generation assets (wind farms) or transmission assets (interconnectors), rather than encouraging assets that include both – which hybrid projects do.
4| CROSS-BORDER RADIAL CONNECTIONS
Unlike domestic radial connections, cross-border radial connections directly link one or more offshore wind farms located in the exclusive economic zone of one country to the onshore electricity grid of another. Just like their domestic counterparts, these connections serve a single purpose: they do not link two separate energy systems together.
Although no cross-border radial connections currently exist, they could prove to be a valuable option for countries that are struggling to expand their domestic production of renewable energy. Crossborder radial connections could help to increase offshore wind capacity in Europe’s northern seas so that it grows beyond 400 GW, so promoting greater energy cooperation across borders.
THE VIRTUOUS CIRCLE OF OFFSHORE WIND BENEFITS IN EUROPE
2
ADOPTING A COORDINATED APPROACH TO SEA-BASIN-WIDE PLANNING IS REQUIRED FOR EUROPE TO TAP INTO THE MOST EFFICIENT OFFSHORE WIND LOCATIONS AND HARNESS ALMOST 500 GW OF OFFSHORE WIND ENERGY BY 2050.
1
3
FUNDING AND PLANNING GO HAND IN HAND. A JOINT FRAMEWORK TO FUND FUTURE OFFSHORE DEVELOPMENT WILL BE CRUCIAL FOR EFFECTIVELY STREAMLINING LIMITED FINANCIAL RESOURCES AND WILL BE A CRITICAL ENABLER FOR UNLOCKING THE BENEFITS OF SEA-BASIN-WIDE PLANNING.
4 FROM 2030 TO 2050, INTERNATIONAL COLLABORATION, THE DE-RISKING OF INVESTMENTS AND SPATIAL PLANNING IN OFFSHORE WIND DEVELOPMENT COULD LOWER SYSTEM COSTS BY MORE THAN € 1000 BN.
THE OFFSHORE WIND SECTOR IS SET TO GROW SIGNIFICANTLY, MEANING THE SUPPLY CHAIN NEEDS TO BE SCALED UP AND REQUIRING EUROPE TO SECURE ITS RAW MATERIAL IMPORTS. AT THE SAME TIME, THIS WILL OFFER UP SUBSTANTIAL GROWTH OPPORTUNITIES ALONG WITH THE CREATION OF 300,000 JOBS ACROSS EUROPE.
FROM 2030 TO 2050, INTERNATIONAL COLLABORATION,
DE-RISKING OF INVESTMENTS AND SPATIAL PLANNING IN OFFSHORE WIND DEVELOPMENT COULD LOWER THE COSTS OF THE ENERGY TRANSITION BY MORE THAN € 1000 BN.
Offshore wind energy is set to become an essential component of Europe’s energy mix by 2050. As a costeffective solution for electrifying both industry and households, its full potential can only be realised via the establishment of an international collaboration framework. This could lower the overall system cost for Europe by more than €1000 billion between 2030 and 2050.
COLLABORATIVELY REALISING OFFSHORE WIND FARMS AND GRIDS UNLOCKS BENEFITS BEYOND MERE ENERGY SYSTEM COSTS
Offshore wind is a precious source of renewable energy. Whilst the investment costs for its development are higher than those associated with the development of onshore wind or solar power, it will contribute to keeping Europe’s energy transition affordable, as this study’s analyses reveal. Failing to develop offshore wind will be more expensive for Europe in the long run. The reason for this is linked to a range of benefits that a collaborative approach towards the development of offshore wind and grids can unlock as shown below.
What does the figure below show?
The figure below illustrates how multiple levers can act together to reduce the total cost of the future energy system for the period between 2030 and 2050. It sets out how an effective approach to offshore development will reduce the overall cost for the energy system.
Beginning on the left-hand side of the chart, the grey bar represents a scenario in which Europe fails to efficiently undertake offshore development.
The most impactful lever is the adoption of joint planning and funding (first step of the ladder), as this will allow Europe to increase its offshore capacity and will ensure that transmission capacity is constructed in an effective
manner across its sea basins. As a result of joint planning, wake losses will also be reduced (second step). Furthermore, efficiencies can be gained in the supply chain through bulk manufacturing and standardisation (third step). Note that these efficiencies will only be possible if shortages in manufacturing and imports are resolved. Enhanced financing that involves a strong de-risking of project portfolios will be another critical lever for cutting down on costs in the future (step four). Eventually, other indirect benefits will be unlocked such as the continent’s improved resilience against external shocks and a boost for local value creation.
What does this tell us?
The large-scale development of offshore wind in Europe is challenging. However, by adopting a forward-looking, holistic approach to the planning, financing and manufacturing of offshore wind assets, a range of benefits can be unlocked. Each of these benefits form a virtuous circle, reinforcing each other and contributing to indirect benefits such as Europe’s overall resilience to external shocks to its energy system. The bulk of investments and decisions still needs to be taken, which opens up a window of opportunity for optimally designing the governance structures that are needed to select the most impactful levers.

Countries are increasingly retreating into their own national shells, much like turtles. However, if we are aiming to achieve independence from fossil fuels and Russian gas, we must be prepared to rely more on like-minded countries. This necessitates greater collaboration at the European level. It is only through unity and cooperation that we can effectively transition to a more sustainable and affordable energy future.
Manon Van Beeck Chief Executive Officer, Tennet

CORRELATION OF WIND SPEEDS ACROSS BALTIC AND NORTH SEAS USING THE BELGIAN PRINCESS ELISABETH ZONE (MARKED WITH A YELLOW CIRCLE) AS A REFERENCE POINT
THE LONG DISTANCE (INTER-) CONNECTION OF OFFSHORE WIND FARMS TO THE SHORE REDUCES VARIABILITY AND ELECTRICITY PRICES
Long-distance (hybrid) interconnectors level out local fluctuations in wind power generation. This reduces (but does not eliminate) the need for countries to invest in dispatchable capacity within their own borders, so reducing costs.
What does the figure on the left show?
The map shows how strongly the wind speeds in different regions of the Baltic Sea and the North Sea are correlated with each other – in other words, how often similar wind patterns occur across different regions. The map demonstrates that the further away two areas are from each other, the less likely they are to experience the same wind occurrences. By using the Belgian Princess Elisabeth Zone (PEZ) as an example, the further one moves away from it, so the amount of hours of simultaneous wind occurrences decreases (see darker colour shading). This pattern becomes particularly significant when two areas are located 500 kilometres or more from each other. Our analyses focus on assessing possible patterns across weekly time frames, since offshore wind is particularly variable and flexibility means are difficult to provide across such time frames.
This correlation effect can also be seen in the bar plot below. For the period 1979-2023, was shows the average number of days on which the offshore wind capacity is low in the German North Sea (70) and the German Baltic Sea (54), demonstrating that these two seas are windy for most of the year. Moreover, the plot shows that the average number of days on which the offshore wind capacity was low both in the German North Sea and the German Baltic Sea at the same time is even lower: 48.
What does this tell us?
Offshore wind infeed into the onshore grid from diverse and distant locations is more ‘valuable’ for the energy system. Both the variability of the resulting energy mix and flexibility needs are reduced. This makes the development of offshore wind across larger regions – and, indeed, across sea basins such as the Baltic and North seas or the Atlantic Ocean and Mediterranean Sea – so important for Europe’s power system.
HAD MULTIPLE HYBRID INTERCONNECTORS BEEN BUILT BY NOW, WE WOULD BE REAPING THEIR BENEFITS
Cross-border collaboration as part of the development of offshore wind is not solely a matter of planning for a distant future. In fact, such an approach is already making a huge difference in today’s system (as can be seen by the Kriegers Flak Combined Grid Solution, which was commissioned in 2020). The presence of additional longdistance interconnectors in today’s system could have generated further benefits, as illustrated by the example on the right.
What does the figure on the right show?
The maps show what impact an additional offshore wind hub in the Baltic Sea would have had on today’s market. Historical day-ahead trades from 2023 were reproduced and our simulations checked how cross-border trades and power prices would have changed if a 2 GW offshore hub had existed in the system. Results were calculated for 2 set-ups: the first was radially connected to the central western area (CW2) which comprises Germany and Austria (see map on the left-hand side of the figure); the second was designed as a hybrid interconnector that linked the CW2 and Baltic areas together (the latter, BAL, comprises Estonia, Latvia and Lithuania; see map on the right-hand side of the figure). It is clear that just one additional single offshore (hybrid) interconnector would have had a noticeable impact on power prices in 2023.
What does this tell us?
An additional hybrid interconnector in 2023 would have made a huge difference on Europe’s energy system. This demonstrates how accelerating the development of offshore projects which carry the highest amount of European value should be prioritised. At the same time, the results highlight that distributional effects must not be overlooked, since price effects and power flows also impact market areas which are not directly linked to an offshore project – which underscores the need for cooperation to occur across whole sea basin areas at a time.

Thomas Egebo President and Chief Executive Officer, Energinet
If we do not find a way to share the benefits and costs between exporting and importing countries in a fair way, we will not be able to fully exploit the offshore potential in the North Sea and the Baltic Sea. It is not an easy task. TSOs cannot solve this alone. Member States must take their responsibility. But we as TSOs are eager to participate in developing and qualifying solutions.
ADOPTING A COORDINATED APPROACH TO SEA-BASIN-WIDE PLANNING IS REQUIRED FOR EUROPE TO TAP INTO THE MOST EFFICIENT OFFSHORE WIND LOCATIONS AND TO HARNESS ALMOST
500 GW OF OFFSHORE WIND ENERGY BY 2050.
By promoting a joint regional planning approach between countries with limited and abundant amounts of offshore wind potential and keen third countries, the most efficient projects that will benefit Europe as a whole will be unlocked. This approach will ensure that such projects are developed and that the full amount of offshore wind potential can be harnessed. Moreover, long-term planning across borders will help to mitigate wake losses and reduce the environmental impact of offshore projects on protected areas.
COORDINATED PLANNING SHAPES THE JOINT FUNDING OF
PROJECTS AND UNITES COUNTRIES AROUND A SEA BASIN THAT CARRY HIGH LEVELS OF OFFSHORE POTENTIAL WITH THOSE THAT LACK IT
Current planning methods remain overly state-based in their approach. They overlook the collective benefits of hybrid interconnectors and the crossborder radial connection of wind farms and the need for several parties to fund projects together. To meet Europe’s net-zero targets and optimise socioeconomic welfare, around 200 GW of offshore wind (or 40% of Europe’s total offshore wind capacity in 2050) need to be developed within ‘offshore energy exporting countries’ that have more offshore wind energy potential than they need to meet their domestic demand. A lack of collaboration may stall the realisation of offshore projects after 2030, due to a lack of appetite to support the costs of these projects in countries that have too much RES potential than they need.
What does the figure below show?
The bar plot below includes three different levels of offshore wind capacity that Europe could reach by 2050, depending on the level of collaboration between Countries. The figure shows the emergence of two main groups of countries: ‘offshore energy exporting countries’ and countries whose levels of domestic offshore energy generation fall short of meeting their needs
As can be seen from the bar plot, in a scenario in which a national approach to offshore wind development is adopted, 136 GW of Europe’s capacity is developed by exporting countries. The amount they develop then increases by 70 GW in a scenario in which collaboration involving hybrid interconnectors occurs.
ACROSS THE SCENARIOS FOR 2050
What does this tell us?
The infographics reveal a fundamental fact: how challenging – and beneficial – offshore wind development will be for the whole of Europe. It requires both types of countries to collaborate as part of the planning, development, financing and funding of different projects, and requires the costs and benefits of such projects to be shared in a fair manner to ensure that offshore wind is developed in the most efficient way possible. Encouraging countries to concentrate on only maximising their own domestic potential will not be sufficient.

SIMULATION RESULTS FOR OFFSHORE BUILDOUT IN EXPORTING AND IMPORTING COUNTRIES
CROSS-BORDER OFFSHORE DEVELOPMENT PROJECTS MUST BE CAREFULLY SPACED OUT TO MAINTAIN THE PRODUCTION EFFICIENCY OF WIND FARMS
The current planning approach is suitable for delivering the first 30+ GW of offshore wind today and another 100 GW across Europe by 2030. However, in the long run, the size and number of offshore wind farms are going to increase. This will require actors to pay closer attention to ensuring that the efficiency of wind farm production is maintained so that Europe’s expectations regarding its offshore wind capacity will indeed be met.
What does the figure below show?
Offshore wind plays an essential role for decarbonizing Europe´s electricity supply. With the current offshore wind planning in the North Sea, we are at risk to experience lower RES infeed compared to expectations today. A stronger cross border collaboration and focusing on cost-optimised electricity yield targets without reducing the ambitious expansion path will help to mitigate wake effects and unlock the capacities in the most efficient way.

Kerstin Andrae
Chairwoman of
the Executive Board, German Association of Energy and Water Industries, BDEW
Focusing on wind farms located in the EEZs of Denmark, Germany and the Netherlands, the maps depict three possible outcomes in terms of their production levels in 2050. The map on the left-hand side of the figure depicts the base case: a situation in which wind farm capacities for 2050 are assumed in line with the locations and densities that are included in current Member State spatial plans, and in which wake loss effects are high, triggering high reductions in the number of full-load hours (represented by the shades of dark purple). As one moves from the map on the left-hand side of the figure to the map on the right-hand side, the wind farms are gradually and more evenly spread out4 and the associated wake loss effects are reduced, so increasing the number of full-load hours (represented by the paler shades of purple). The map on the right depicts a situation in which
cross-border collaboration is used to position the wind farms in the North Sea: they are more spread out, with some wind farm locations being shifted across borders to mitigate wake losses.
What does this tell us?
Our analyses show that for the German Bay of the North Sea, adopting a cross-border approach to wake loss mitigation could lead to a significant decrease in wake losses (translating into about 8-9 GW of recovered capacity) compared with a business-as-usual approach. For comparison purposes, this is equal to the total amount of Belgium’s future domestic offshore generation and could amount to CAPEX savings of more than €20 billion.
MITIGATION OF FULL LOAD HOUR REDUCTIONS DUE TO WAKE EFFECTS IN THE GERMAN BAY OF THE NORTH SEA FOR THREE SIMULATED 2050 SCENARIOS
COORDINATED PLANNING FACILITATES THE EFFICIENT AND SUSTAINABLE POSITIONING OF OFFSHORE ASSETS
The bulk of wind farm development in Europe has yet to occur for it to reach its offshore targets. Transmission corridors and cross-border cables will need to be carefully located across Europe’s seas, and relevant actors will need to ensure they take into consideration other maritime activities, such as shipping, fishing, natural conservation, the extraction of raw materials and national defence.
What does the figure below show?
The figure compares two 2050 scenarios that were developed with a geographic information system (GIS). The map on the left-hand side of the figure depicts a scenario in which a business-as-usual approach was taken to the laying of transmission cables from offshore wind farms to the shore: here, the GIS was programmed to minimise the costs involved, favour the use of transmission corridors and avoid cables crossing through areas being used for other activities (with high penalty costs if crossings occurred). The map on the right-hand side of the figure depicts a scenario in which a nature-first approach was taken: here, the GIS was programmed to minimise the costs involved, favour the use of transmission corridors, and avoid nature conservation
areas (with penalty costs for this being twice as high as before). Under this scenario, the number of cables crossing nature conservation areas is significantly reduced. What does this tell us?
Our analysis reveals that taking sustainability targets into consideration early on in the planning process can minimise the number and length of cables that cross through protected areas. This can be achieved without significantly increasing the total number of needed assets (in our simulation only a 2% increase in total corridor length across entire sea basins); it just requires the adoption of a crossborder and collaborative spatial planning perspective.
MINIMISING THE SPATIAL FOOTPRINT OF CABLE CORRIDORS IN PROTECTED AREAS IS POSSIBLE THROUGH THE ADOPTION OF LONG-TERM AND CROSS-BORDER PLANNING APPROACHES

Nadine
Bethge Deputy Head of Energy & Climate, Deutsche Umwelthilfe
Wake effects are often mentioned as a coordination challenge for investors in offshore wind. This report nicely illustrates that they can also be a reason for governments to collaborate across borders.

Prof Leonardo Meeus
Director of the Florence School of Regulation at European University Institute
Allocating the ambitious goal of 70 GW in the German seas is challenging in two ways: more densely planned wind turbines lead to higher wake effects, making the areas unattractive for investors. At the same time, marine protection is impaired, as the German target is not achievable without encroaching on protected areas. Hence, both the allocation of wind farms and implementation of protected areas must be a matter of costal states’ coordination.

The North Sea stands as the most advanced offshore wind region globally. Achieving a meshed grid will require coordinated planning. Close collaboration amongst system operators across the North Sea will be essential for moving forward. Ben Wilson President, National Grid Ventures
FUNDING AND PLANNING GO HAND IN HAND. A
JOINT FRAMEWORK TO FUND FUTURE OFFSHORE
DEVELOPMENT WILL BE CRUCIAL FOR EFFECTIVELY
STREAMLINING LIMITED FINANCIAL RESOURCES AND WILL BE A CRITICAL ENABLER FOR UNLOCKING THE BENEFITS OF SEA-BASIN-WIDE PLANNING.
To ensure that the right amount of investment is secured for the construction of future offshore wind and transmission grid assets, the effective streamlining of financing sources is needed alongside the adoption of de-risking measures. The establishment of an organisation such as the Offshore Investment Bank (OIB) will play a vital role in ensuring the investment demand is met whilst also facilitating the effective sharing of costs and benefits across borders.
ADOPTING A SEA-BASIN-WIDE APPROACH TO OFFSHORE COOPERATION TO REACH AN OPTIMAL GRID BUILDOUT
Coordinated planning and funding the future offshore grid are mutually dependent. Establishing a joint framework to fund the development of the offshore grid will be crucial for effectively streamlining limited financial resources and facilitating the planning of the grid. The opposite is also true: without a joint funding framework, joint planning will not be possible. This joint planning will be key for sharing out the costs and benefits of different projects in a fair manner. The current cross-border cost allocation (CBCA) tool involves interconnector project costs being assessed on an individual, project-by-project basis - and only involves the 2 directly affected countries (ie. the 2 countries which host the interconnector). It therefore does not adopt a regional/sea basin scope for joint planning, project identification, or cost and benefit sharing, meaning it is unfit for the development of a hybrid meshed offshore grid. The cost and benefit allocation method therefore needs to be changed into a framework that involves multiple countries and projects across one sea basin at a time as well as a close link to the planning procedure. This proposed approach involves five key steps, as outlined in the figure below.
What does the figure on the right show?
The figure outlines the five steps that the proposed sea basin approach to offshore cooperation should involve: projects which are developed across the same sea basin should be identified, validated and approached together; TSOs should support the planning and governance of projects with their expertise; projects should be validated on a multi-country level; the approach should involve the establishment of an organisation such as the Offshore Investment Bank (OIB), which will aggregate different sources of project financing and ensure that project costs and benefits are distributed across different parties. This cooperation framework will be essential for ensuring that the full benefits of offshore wind power can be unlocked and financial risks associated with each project are reduced. Currently, too many projects are stalled amidst lengthy negotiations due to the current framework which is unfit for purpose.
To ensure that the right amount of investment is secured for the construction of future offshore wind and transmission grid assets, the effective streamlining of financing sources is needed alongside the adoption of de-risking measures. The establishment of an organisation such as the Offshore Investment Bank (OIB) will play a vital role in ensuring the investment demand is met whilst also facilitating the effective sharing of costs and benefits across borders.
This framework will allow parties with expertise (TSOs or merchant parties) to develop and realise projects, whilst taking into account regulatory regimes in different countries.
5.Project development 1. Sea basin scope
To ensure efficient and harmonious development across a sea basin, the involvement of all countries surrounding the sea basin should be considered (including non-EU countries such as the UK and Norway). Decisions should be agreed upon by all involved sea basin countries.
4. Offshore Investment Bank
The proposed Offshore Investment Bank will act as an intermediary which will manage funding from public entities, private investors, TSOs and wind developers across different sea basins. The OIB will also oversee the sharing out of project costs and benefits amongst all involved parties.
3. Political support from multiple countries for visibility and trust
Projects decided on during the joint planning process will enjoy public/political support from multiple countries and actors from across the EU. This will increase transparency and trust both within those countries which are involved and beyond. Such insights will also be vital for ensuring the early involvement of all impacted parties in the design, development and supply chain of offshore projects. Private partners should also be involved in the execution of projects which are jointly planned. Cooperation with these private entities would need to be organised through a non-discriminatory access approach for private competitors.
2. Joint coordinated planning supported by TSO expertise
As regulated entities, TSOs should take the lead in planning based on identified system needs (as identified in the ONDP or joint assessment studies). The outcome will be a collaborative approach to identifying concrete projects which carry benefits for the whole of Europe. This collaborative approach should involve three steps: (i) the optimal identification of system needs at an EU level; (ii) the optimal identification and scoping of concrete projects on a regional (sea-basin) level; (iii) joint decisionmaking at regional level.
ADDRESSING THE INTERDEPENDENCE OF PLANNING AND FUNDING: ALIGNING THE INTERESTS OF ALL INVOLVED PARTIES
Given that offshore wind development in Europe is still in its early stages, the total cost of investment in transmission infrastructure (at least 50,000 km of corridors) and offshore wind farms (up to 500 GW) is expected to reach around €1,700 billion by 2050. This study proposes a sea basin approach to the planning and funding of offshore projects in order to tackle this challenge. This will involve project benefits and costs being distributed in an effective manner amongst different parties and will reduce their associated risks.
The future financing and funding framework should be as simple as possible, highly replicable, and have a minimal impact on grid tariffs. It should ensure that projects are highly bankable and generate sufficient returns for investors. The framework should streamline the governance structure that covers the ownership and operational control of assets, and it should be compatible with different national TSO regulatory frameworks.

Felipe Montero Chief Executive Officer, Iberdrola Germany

The sharing of costs and benefits should be carried and felt by countries located beyond project hosting countries, such as across sea basins or coalitions of willing countries. If this is not the case, Europe will not be able to tap into the full potential of its seas (as key message 2 highlights). Moreover, the process should move from projects being assessed on an individual basis to projects being assessed on a collective basis.
Additionally, it should involve the allocation of a wide range of benefits to project stakeholders, moving beyond only assessing socioeconomic welfare to include the project integration of RES, contribution to adequacy, and positive effects on market liquidity. This process should be clear from the start, while still allowing for some flexibility as discussions and projects progress.
The adoption of a risk reduction strategy could reduce the financing costs of future offshore projects by €250 billion, with the OIB lying at the heart of unlocking these benefits.
A joint funding and and joint planning framework leads to increased trust by financial institutions, lower the cost of debt, which should lead to an additional reduction in cost of capital of around €35 billion. The OIB will act as a crucial entity that unites public and private funding to support renewable energy initiatives across different sea basins. It will provide private investors with the confidence that their funds will be directed towards government-backed projects within a stable regulatory framework. What does the figure below tell us?
We need funding from different sources to be aggregated. The Offshore Investment Bank is one proposal for how the pooling of these funds could be streamlined.
Offshore Wind development in Europe is at a turning point. While we have clear targets and high ambitions, for the objectives to be met, we need to ensure reliable business cases along the entire value chain, a stable regulatory environment and political commitment. At the same time, costs and benefits need to stay in balance. Offshore hybrids could play a very significant role in strengthening the industry and cooperation between European countries.

Dickson Chief Executive Officer, Wind Europe
Well done to Elia Group and Ørsted for proposing this Offshore Investment Bank. It’s a great way of reducing the financing costs of building out offshore wind and the grid connections to connect those offshore wind farms to the grid. Take a small amount of public investment, leverage large amounts of private investment, spread the risk, reduce the financing costs, make the buildout of offshore wind and grids even more affordable.
Dr Andreas Löschel Professor of Environmental/ Resource Economics and Sustainability at Ruhr-Universität Bochum
Transforming the energy system will require massive investments that can only be realised by stimulating private capital to invest in both generation and networks. It is therefore of paramount importance to provide a suitable regulatory framework.

Chief Executive Officer, RWE Offshore Wind GmbH
The system advantages of offshore hybrids are undisputed, but these projects will only go ahead if all states see a clear benefit and investors have a viable business case. The difficulties of ‘slicing up the cake’ should be solved via intensified cooperation. Offshore Investment Banks will establish a necessary joint approach for the sharing of costs and benefits and the collaborative funding and de-risking of investments, which could make it a key enabler for the long-term buildout of offshore wind.

De-risking projects is vital, as it makes them more affordable for everyone involved.
To facilitate this, we need clear boundary conditions and a defined timeline outlining what needs to be accomplished and by when. This clarity allows for project execution that can be consistently repeated, leading to the operational excellence required.

Ørsted
Unlocking hybrid projects offers a unique opportunity to give European industry rapid access to cheap renewable energy. To deliver this on a climate relevant timeline, we need to take the first step in implementing the necessary crossborder frameworks to deliver the necessary planning and financing – we believe that is establishing an offshore investment bank per seabasin.
Sven Utermöhlen
Giels
THE OFFSHORE WIND SECTOR IS SET TO GROW SIGNIFICANTLY, MEANING THE SUPPLY CHAIN NEEDS TO BE SCALED UP AND REQUIRING EUROPE TO SECURE ITS RAW MATERIAL IMPORTS. AT THE SAME TIME, THIS WILL OFFER UP SUBSTANTIAL GROWTH OPPORTUNITIES ALONG WITH THE CREATION OF 300,000 JOBS ACROSS EUROPE.
In addition to the direct benefits of offshore wind development outlined in this study, Europe will also be given to the opportunity to preserve a key industrial sector on its shores. By capitalising on the growth potential of offshore wind development, Europe can secure its energy future while boosting its economy and workforce, including in countries that are about to scale up their offshore activities.
GIVEN THAT OFFSHORE WIND SUPPLY CHAINS WILL CONTINUE TO BE INTERNATIONALLY AND GLOBALLY INTERLINKED, EUROPE WOULD BENEFIT FROM MAINTAINING ITS STATUS AS A STRONG SUPPLIER OF OFFSHORE WIND ASSETS
To date, almost no offshore wind farm has been developed, built, and operated by companies from one single country alone: until now, European and global players together have driven the development of offshore wind, and this is likely to continue in future. The European Commission’s Wind Power Package is already producing its first effects, with recent investment decisions being taken or announced across the continent.
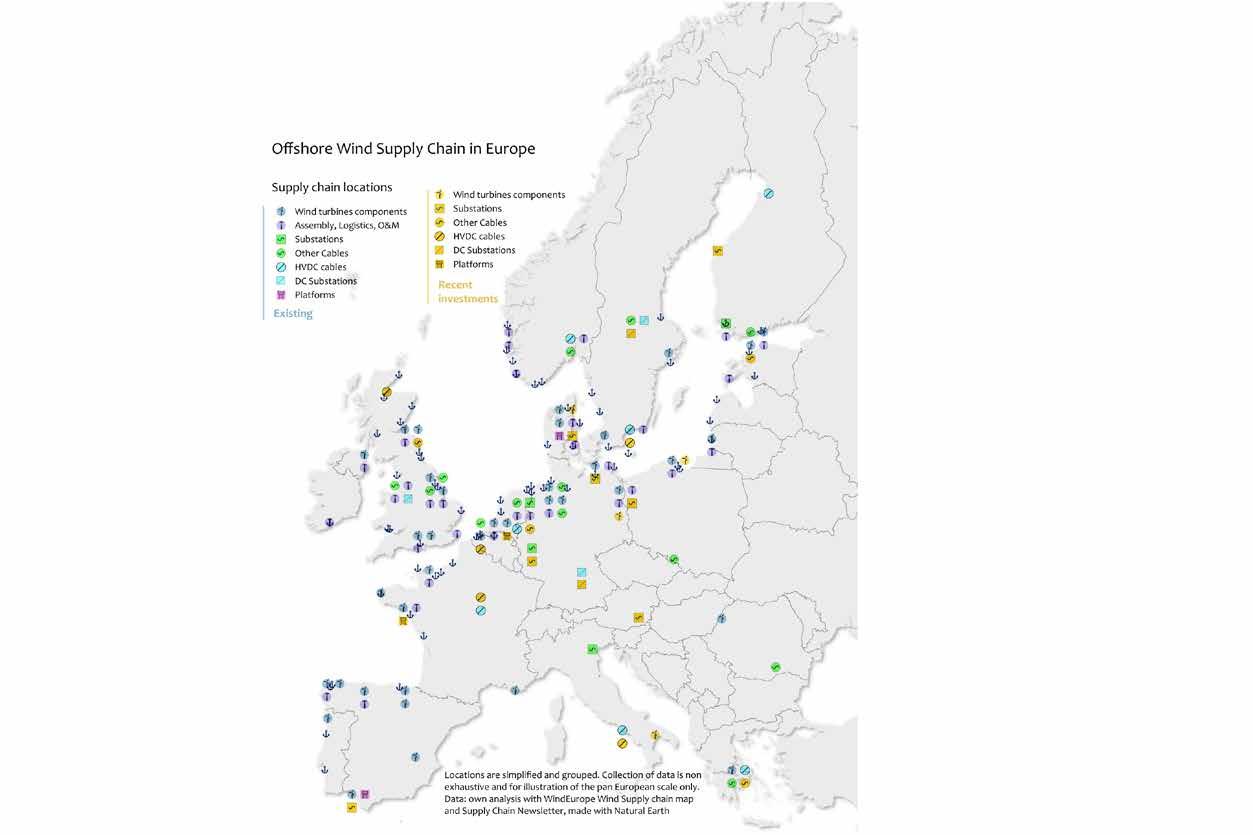
What does the figure on the right show?
The map depicts the sites belonging to different parts of Europe’s offshore wind development supply chains. In addition to manufacturing sites for wind turbine components (such as towers, blades and nacelles) and service hubs for the assembly of parts, logistics, and operation and maintenance activities, the map also includes information about (offshore) transmission grid asset manufacturers and shipyards where offshore platforms are constructed. Notice that there is no single European ‘champion’ of offshore wind development that produces everything; instead, many specialised and complementary hubs exist that develop different elements of the value chain. This pattern is being maintained, as evidenced by recent decisions that have been taken about investments in new facilities (including HVDC cables and converters), as represented by the yellow icons. What does this tell us?
The map demonstrates how the development of offshore wind is becoming an increasingly pan-European quest that involves activities that extend beyond the southern coasts of the Baltic Sea and North Sea (where the bulk of offshore development has occurred thus far). Both traditional leaders in offshore wind development (such as Belgium, Denmark, Germany, the Netherlands, and the UK) and an increasing amount of non-traditional players (such as countries located around the Baltic Sea region, Scotland and the Mediterranean Sea) are driving this.

TO
MEET EUROPE’S OFFSHORE TARGETS, MANUFACTURING CAPACITY
MUST BE SCALED UP; EUROPE’S LEADERS MUST THEREFORE ESTABLISH FRAMEWORKS THAT MAKE POLITICAL TARGETS RELIABLE VIA JOINT APPROACHES TO PLANNING AND FUNDING
Europe has been accelerating the pace at which it carries out offshore wind development in recent years, just as the demand for offshore wind installations has risen across the globe. Europe will need to increase its pace even further in order to meet its political pledges amidst a background of increasing competition and emerging offshore markets outside the Union.
What does the table below show?
The table compares current manufacturing capacities for three types of assets in Europe with the projected annual levels of demand between 2030 and 2050. The numbers show that the production capacities5 for all three asset types must be significantly increased to satisfy all of Europe’s needs via domestic suppliers only. While some of the demand may well be met by non-European suppliers, not all international manufacturers will be able to fulfil the technical and operational requirements that they need in order to qualify as suppliers in Europe. This means that European manufacturing capacities for central grid assets like converters and HVDC cables must therefore be scaled up. For this to occur, political declarations alone will not suffice; concrete enablers such as long-term planning and funding frameworks will be needed. This will establish the necessary trust for the supply chain to to scale up.
What does this tell us?
To date, the market for onshore and offshore wind energy development has largely been a European one Europe has demonstrated strong technological leadership through its manufacturing of assets and has played a leading role with regard to innovative ways of connecting countries and offshore wind farms together. Meeting the future demand for assets and services has the potential to generate the creation of 300,000 jobs across the value chain. Some of these jobs will be created in countries that are only just about to embark on their offshore development journeys.

Philippe Piron, Chief Executive Officer, GE Vernova Electrification Systems
The key question is not whether we are capable today, but rather whether we have the right visibility and commitment from our customers to justify our investments and determine the necessary dimensions for successful delivery. If we can achieve this visibility and commitment and prepare in advance, then yes, we are definitely capable!

Andreas Schierenbeck, Chief Executive Officer, Hitachi Energy
The need to integrate up to 500 GW of offshore wind in Europe by 2050 is driving a significant increase in demand for clean energy technologies. A businessas-usual approach will not be enough to deliver on our decarbonisation vision. Integrated planning, the deployment of technologies at speed and scale, innovative business models and collaboration are some of the essential enablers that can help us to accelerate the energy transition and achieve the ambitious targets we have set across the world.
THE DEMAND FOR RAW MATERIALS WILL BE HIGH, BUT NOT UNPRECEDENTED
The future demand for raw materials will be mainly driven by the rise in the development of offshore wind farms and associated grid infrastructure and factors which can only be roughly estimated today, such as future developments in the efficiency of materials; the operational lifetimes of the manufactured assets; and the circularity of materials (i.e. recycling quotas).
What do the figures below show?
The figure on the left-hand side summarises the total demand (in kilotonnes) for different (main) material types that will be needed for offshore wind development in 2050. The pie charts on the right-hand side of the figure illustrate that wind farms will be the main driver of the demand for materials (both in relative and absolute terms) in the future, especially in terms of steel, fibreglass, polymers and zinc.
The table on the right shows that the demand for certain materials will experience an eightfold increase, even with modest reductions in material intensity being assumed for the future. Note that the mere volume of future demand is not decisive on its own; indeed, the criticality of different materials (whether in terms of import dependencies, such as for rare earth metals or nickel), or in terms of competition for the use of the material (such as for copper or aluminium) is also important when considering the level of demand for different materials in future.
What does this tell us?
Accessing the right materials for the development of offshore wind will remain a key challenge that will need to be overcome. Our analysis also reveals a range of levers that can be used to reduce the size of the challenge ahead, including an increase in the material recycling rate, which would reduce the need for primary steel and copper, for instance. Furthermore, additional innovations in the substitution of materials will alleviate the demand for even the most critical materials such as rare earth metals. A comparison with historic demands for steel for gas and oil infrastructure in the Baltic Sea and the North Sea demonstrates that whilst the future demand for materials may seem enormous, such levels of demand are not unprecedented. For example, gas and oil infrastructure in the Baltic and North Sea are made out of about 60,000 kt and were built over a period of 30 years.
MATERIAL TONNAGE NEEDS AND MAIN ASSET TYPES THAT DRIVE IT
WE URGE THE EUROPEAN COMMISSION AND NATIONAL GOVERNMENTS TO…
continue to commit to the path set out in the European Green Deal by fostering European competitiveness, the decarbonisation of industry & end-use sectors and investing in clean energy infrastructure.
prioritise projects that carry the highest levels of European value by establishing a joint planning and a funding framework that aligns the interests of all involved parties. It is only this framework which will contribute to a more cost-efficient and affordable energy transition for consumers.
3
collaborate on spatial planning and the development of cross-border projects at regional level when planning the future offshore grid, and take into consideration spatial constraints and the efficiency of wind power production.
mobilise and streamline the necessary capital for wind farms, transmission systems and manufacturing capabilities by maximising public investment, leveraging and de-risking private capital, and implementing risk-absorbing measures to make it easier for commercial banks, investors, and venture capital firms to finance projects and companies. 5
capitalise on Europe’s technology leadership in the offshore wind sector and grid sector by stimulating a collective approach to industrial policy across Europe in order to step up critical manufacturing capabilities and secure the supply of raw materials. Research and innovation funding must be increased to improve efficiencies in the substitution of critical materials. Initiatives which ensure that Europe has a big enough workforce that has the right skills must be introduced.
“The rapid deployment of offshore wind projects and their grid connections, reinforcing electricity grids [...] connecting consumers and producers across Europe are probably the most important steps Europe has to take to succeed in its decarbonization path. They require a new alliance among the Member States involved in the projects and a strong EU-level support.”
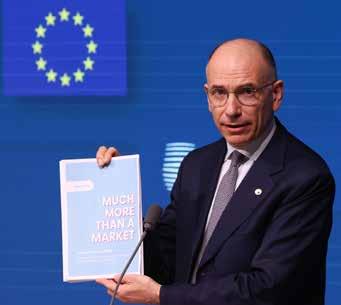
The Letta report, published on 10 April 2024, highlights the importance of a single market in Europe and spells out proposals to transform the capital markets union into a savings and investments union. It urges Member States to facilitate this move as they are essential for financing the EU’s future needs associated with the green and digital transitions.
Extract from Much More than a Market’, Enrico Letta (2024)
OFFSHORE WIND IS A KEY INGREDIENT FOR EUROPE’S TRANSITION TO NET ZERO
Europe’s seas are set to become the green power plants of the future. The European Green Deal outlined the EU’s commitment to reaching climate neutrality by 2050. Following the signing of non-binding agreements at Marienborg in 2022 (relating to the Baltic Sea) and at the North Sea Summits in Esbjerg (2022) and Ostend (2023), offshore wind is set to make a significant contribution towards reaching this goal.
By combining the ambitions of the EU with those of Norway and the United Kingdom, almost 500 GW of offshore wind is due to be established across the European continent by 2050 Moreover, Elia Group’s 2021 study, ‘Roadmap to net zero’3 demonstrated that offshore wind will make a vital contribution to levelling out the intermittency of the onshore renewable components of the energy mix, such as wind and solar power. Both onshore and offshore wind turbines have a higher output in winter, whilst solar panels reach moments of peak generation in summer.
Furthermore, offshore wind farms typically have higher capacity factors due to more stable and stronger wind speeds out at sea compared with the wind speeds across land (please see the map on the next page).
The Baltic Sea and the North Sea are of particular relevance for Europe’s offshore ambitions. In addition to their overall wind potential (average wind speeds range from 9 to 14 metres per second at heights of 100 metres across these seas), their proximity to areas which carry the highest electricity demand in Europe (such as England, Belgium, the Netherlands and Germany) makes them crucial for the continent’s adoption of a more sustainable energy supply.
In fact, it is the complementarity of offshore wind sources in these two sea basins that make them a powerful combination, as demonstrated by this study’s results.
Moreover, both seas are characterised by extensive shallow waters, which lower the technical challenges and costs associated with the installation of wind turbines and other necessary infrastructure4 These favourable conditions offer up a significant opportunity for the large-scale production of offshore wind energy in the Baltic and North seas.

Dr Simon Schäfer-Stradowsky Executive Member of the Board of IKEM
Current crises have once again underscored the critical link between energy and security, particularly in the Baltic Sea region. Our research at IKEM demonstrates that addressing threats to energy supply will require a deeper commitment to transnational cooperation and significant investments in the necessary infrastructure. By advancing projects like cross-border links for offshore wind development, Elia Group is making a vital contribution to creating a unified energy region in and around the Baltic Sea
INTRODUCTION TO DEEP DIVE
1. Ursula von der Leyen renewed the Commission’s commitment to the Green Deal in ‘Political Guidelines for the next European Commission 2024-2029’: https://commission.europa.eu/document/e6cd4328-673c-4e7a-8683-f63ffb2cf648_en (last accessed on 18/09/24)
2. ENTSOE (2024). ‘Offshore Network Development Plan’, https://www.entsoe.eu/outlooks/offshore-hub/tyndp-ondp/ (last accessed on 02/09/24)
3. Eia Group (2021). ‘Roadmap to Net-Zero’, https://issuu.com/eliagroup/docs/20211203_roadmap-to-net-zero_en_1_?fr=sYzJlZTUyNzcyMTg (last accessed on 02/09/24)
4. The Baltic Sea and the North Sea comprise extensive areas with depths of less than 40 metres (please refer to a map in the annex for illustration). These depths are lower than those of other seas, such as the Mediterranean Sea (which has an average depth of 1,500 m). However, the seabed conditions in the North and Baltic seas can be challenging, since they often comprise mud, currents, and hard bottom complexes.


AVERAGE OFFSHORE WIND SPEEDS IN NORTHERN EUROPE OVER THE COURSE OF 40 HISTORICAL CLIMATE YEARS
TO OVERCOME THE CHALLENGES, WE MUST ACT NOW
Europe has always been a global leader in offshore wind. The first offshore wind farm was installed off the coast of Denmark in 1991, marking the beginning of decades of technology leadership and economic growth. To capitalise on Europe’s know-how and meet its ambitious targets, swift and decisive action needs to be taken. This is why Elia Group has chosen to publish this offshore viewpoint now. This study aims to contribute to discussions and decisions that are being taken about offshore wind development by providing policymakers with a thorough analysis of the main challenges ahead and demonstrating how they are interlinked. Notwithstanding the potential of offshore wind power and the historical success of Europe’s wind industry, Europe is facing a number of challenges. With lead times for new offshore wind farms and their corresponding grid connections of up to 10 years, these challenges will need to be addressed now to take effect in good time.
1 Firstly, Europe’s ambitious targets have to be turned into a Europe-wide plan, which in turn should be translated into real projects. This needs to happen at an accelerated pace, which will create an unprecedented need for financing and funding within a short time frame.
While designated and investigated areas for offshore development are suitable for the installation of the planned offshore capacities, the necessary growth in this area is not yet supported by the right financing and funding instruments. The challenge right now is to attract sufficient public and private capital and to direct it towards the projects that will deliver the highest value for Europe. This starts with deeper coordination between national and cross-border planning processes as both need to go hand in hand for the offshore grid of the future to be realised5
At the same time, reliable supply chains are necessary for realising these projects. These challenges have intensified in recent years due to high levels of inflation, geopolitical tensions, the advance of climate change, an insecure supply chain and constrained access to raw materials. To build a strong EU wind industry that can more than double its pace of wind energy deployment, we need a reliable and sustainable supply chain, a clear and secure pipeline of projects, access to funding, and fair global competition.
2 Secondly, offshore energy potential is not evenly distributed across the continent. Some countries have an offshore renewable energy potential that exceeds their domestic demand (e.g. the Nordic or the Baltic countries), while others do not have enough offshore renewable energy to meet their levels of demand (e.g. Belgium and Germany).
This means that the national expansion of RES alone will not be sufficient for meeting the EU’s direct electricity demand in 2050. To harness the full potential of offshore wind, collaboration between countries across whole sea basin areas must be enhanced. An increasing number of ambitious cross-border offshore projects have already been announced. Estonia and Latvia have set up a joint venture called ELWIND and Denmark has entered into political agreements to connect its planned energy islands to neighbouring countries in the North and Baltic Seas.
Moreover, Elia Group has been contributing to this trend: it commissioned the world’s first subsea hybrid interconnector (the Kriegers Flak - Combined Grid Solution), with its Danish counterpart in 2020, and is working on projects such as the Princess Elisabeth Island, Nautilus and Bornholm Energy Island
3
Thirdly, finding suitable locations for wind farms and establishing their connections to shore, whether through radial or hybrid transmission systems, is a complex process. Maximising the wind potential of Europe’s seas and leveraging the benefits of offshore wind will require Member States to work closely together when it comes to project development and maritime spatial planning.
This is particularly true in the case of strongly used sea basins such as the Baltic and North seas. Future infrastructure will need to co-exist with other activities hosted in these maritime spaces, such as conservation projects, shipping and defence.
Moreover, without a coordinated planning approach being adopted, Europe is at risk of having access to much lower levels of wind infeed than expected from its installed capacity. Wake losses, a phenomenon inherent to wind turbines, cause reduced wind speeds downstream of them. These reduced wind speeds lead to lower levels of energy production and trigger significant production losses in dense wind farm areas.
5. A sentiment that is also echoed by Mario Draghi (2024). ‘The future of European competitiveness’, https://commission.europa.eu/topics/strengthening-european-competitiveness/eu-competitiveness-looking-ahead_en (last accessed on 20/09/24)
6. ELWIND (https://elwindoffshore.eu/)
7. Elia Group (2023). ‘Transforming our seas into Europe’s sustainable economic engine’. https://issuu.com/eliagroup/docs/20220912_offshore-study?fr=sZThlMjY3OTU2NDE
INVESTIGATING THE VIRTUOUS CIRCLE OF BENEFITS
This study outlines how addressing one challenge can unlock effects that positively affect addressing another, meaning that positive actions in one area will reinforce each other. Moreover, this study takes a wider view of the benefits of offshore wind development by looking beyond system costs and socioeconomic welfare and outlining advantages that are important from a societal perspective. Adopting a coordinated planning approach for offshore wind projects, for instance, will facilitate decisions about how to finance and fund future offshore infrastructure and vice versa. As demonstrated throughout this study, this will also reduce the cost of financing offshore projects.
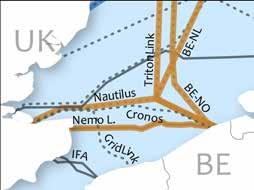
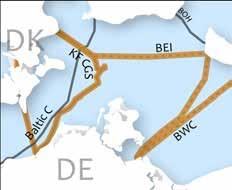
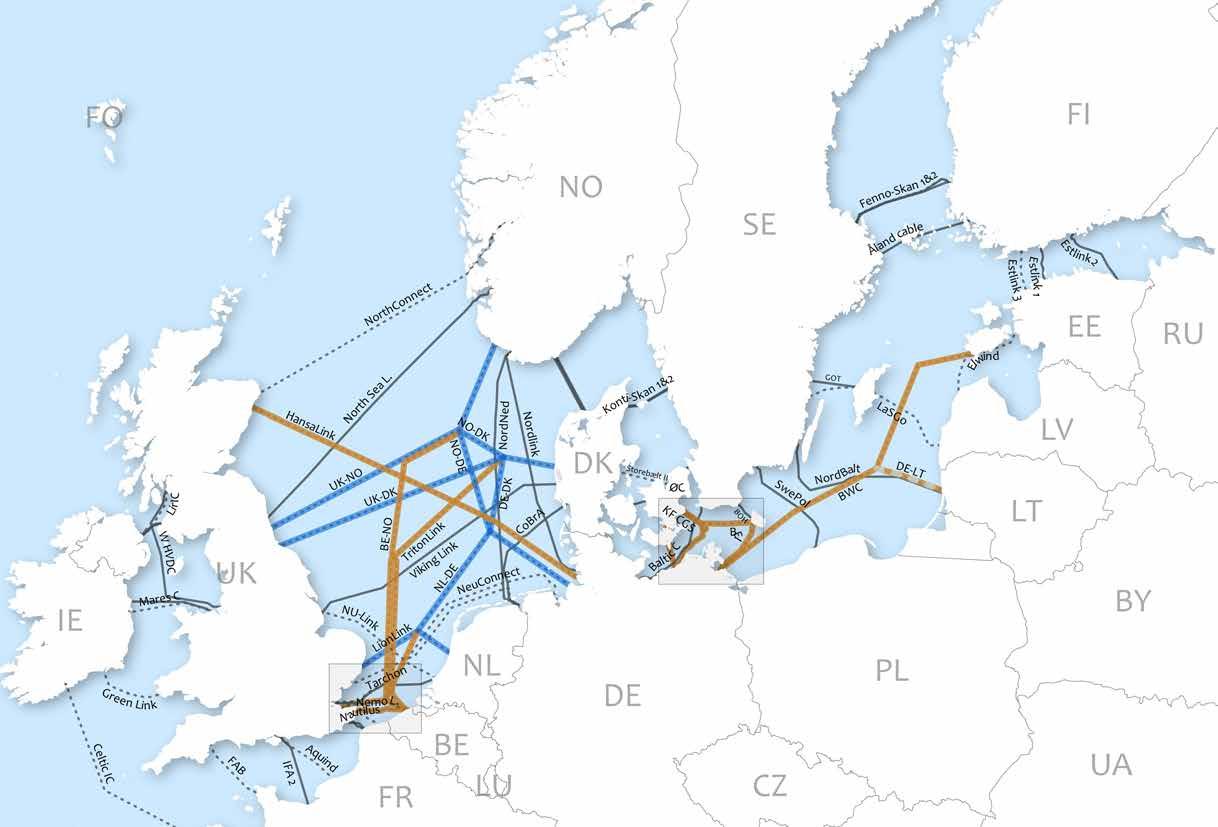
This study demonstrates how cross-border collaboration is essential for maximising Europe’s wind potential and enhancing overall efficiencies, which in turn will bring down total system costs for Europe and increase the efficiency of wind power generation. A clear pipeline of financed projects will incentivise manufacturers to follow and create robust and secure supply chains, which will contribute to increased levels of local value creation across the continent (please see for illustration the existing and future planned interconnectors in Europe in the map on the left side). Creating a prolific environment for offshore wind development is needed to strengthen this virtuous cycle of growth.
Chapter 1
This outlines the value of offshore wind development for Europe via a range of quantitative analyses. In particular, this chapter focuses on the role and benefits of (hybrid) interconnectors and cross-border projects, alongside Europe’s wind resource distribution.
Chapter 3
This addresses the challenge of the financing and funding of offshore infrastructure and emphasises the interdependency between this and coordinated planning. Additionally, the de-risking of financial investments and the distribution of costs and benefits across borders is addressed.
Chapter 2
This highlights the importance of coordinated planning, specifically in terms of the careful balancing of maritime interests and the efficient positioning of wind farms at sea. The chapter also outlines the impacts of long-term planning on supply chains.

OFFSHORE WIND ENERGY AND CROSSBORDER
The development of offshore wind is of key importance for the energy system of the future. Through the exploration of a variety of factors (e.g. system costs, trade volumes, wind variability), this chapter outlines the value that this energy source carries for society and why it is so important to collaborate across borders to leverage its benefits.
The first part of this chapter outlines how beneficial the development of offshore wind will be for Europe compared with an alternative pathway to net zero that involves the development of lower levels of offshore wind generation. The crucial ingredient of cross-border collaboration is explored in detail as this will ensure that the full benefits of offshore wind are reaped and ensure that decarbonisation targets are reached in a cost-optimal manner.
Furthermore, this chapter highlights how the benefits of offshore wind and HYBRID INTERCONNECTORS are not just part of a distant, climate-neutral future. Indeed, the simulations undertaken for this study demonstrate that visible price reduction effects could have been achieved had additional offshore wind generation capacities been present in today’s power system.
Finally, this chapter includes a deeper look at wind resources, emphasising that the integration of offshore wind farms which are located far away from the coastlines of countries that will use them will be particularly valuable for reducing the costs of Europe’s energy transition.
I. OFFSHORE WIND CAN REDUCE THE COSTS OF EUROPE’S ENERGY TRANSITION
DEVELOPING OFFSHORE WIND WILL BE CHEAPER FOR THE SYSTEM THAN NOT DEVELOPING IT
Wind and solar power will form an essential component of Europe’s future energy mix as it works towards net zero. Their combination makes them very valuable for ensuring a balanced energy mix, as was demonstrated in Elia Group’s 2021 viewpoint The analysis conducted as part of this study used this finding and expanded upon it (see section IV of this chapter). In fact, offshore wind is likely to make the energy transition cheaper for Europe. Limiting the development of offshore wind power will require Europe to rely on higher levels of electricity generated by thermal power plants and more energy imports. Whilst this will be feasible, the simulations outlined below demonstrate that this option will result in a more expensive future power system. Moreover, the increase in thermal generation in a scenario in which offshore wind development is restricted results in higher costs for the energy system. To some extend these are driven by higher CO emissions costs (denoted as the societal cost of carbon)2
Figure 1.1 summarises the main system cost findings across each of the scenarios that were assessed for this study (please see next page for a description of the modelling approach). It shows that, compared with a scenario in which offshore wind development is restricted after 2030, the development of offshore wind carries clear benefits in terms of costs for the European energy system (even when a national approach to offshore wind development is adopted.). The lower costs of the scenario with national focused offshore wind buildout (€460 billion over the period 2030-50) is due to savings in operational costs, such as those linked to: fuel for thermal power generation and the societal cost of carbon; hydrogen imports; and investments in thermal generation capacities. (please see information Box 1 for a description of considered energy system cost elements).
The high carbon costs are a result of the model emitting more CO overall in the restricted offshore scenario compared with the other scenarios. Moreover, a CO cap was only enforced for the target year 2050, but not the years before this.
Additional cost savings of €130 billion (i.e. €6.5 billion per year) were calculated as part of the simulations in a scenario where offshore wind development is carried out with European countries collaborating fully with each other and which includes innovative grid technologies that allow complex hybrid and meshed offshore connections to be built. These savings are mostly driven by the additional
deployment of offshore wind across attractive locations in northern Europe, allowing the green electricity generated to be efficiently exported across the rest of the continent. In other words, the savings are not solely driven by more offshore wind capacity (amounting to 50 GW) as such, but also by a different allocation of offshore capacity and improved crossborder exchanges that lead to a more efficient operation of the system. These effects will be further explored in the next sections, after a short introduction to the modelling approach adopted for this study.
SYSTEM COSTS
All modelled scenarios follow a path to achieve carbon neutrality by 2050. To reach this goal, the model could invest in renewable generation assets such as wind farms and solar power but also conventional generation capacities (gas- and hydrogen-fired power plants as well as nuclear power plants). In addition, gas pipelines and electricity transmission infrastructure could be built across different market areas to facilitate cross-border collaboration.
For the buildout of connections between offshore hubs, the commercial availability of DC breakers and multiterminal high-voltage converters was assumed. The respective costs were calculated in a post-processing step as an exact representation in a linear model would have been too complicated. Internal network enforcements were not modelled explicitly but their cost was partially included in the interconnector costs.
To fully capture the benefits of offshore wind integration, a dispatch of all generators, storage solutions and sectorcoupling components was calculated taking into account variable costs such as fuel costs, O&M costs and costs for hydrogen imports. Costs for congestion management inside market areas were not modelled. Altogether, the model aimed to minimise the system costs consisting of investment costs and operational costs for the full time horizon from 2030 to 2050.
(last
on 02/09/24) 2. ENTSO-E (2024). ‘4th ENTSO-E Guideline for cost-benefit
Collaborating closely with neighbouring European countries in planning infrastructure and areas for offshore wind energy projects is crucial to efficiently and sustainably maximising the potential of offshore wind resources.

MODELLING EUROPE’S FUTURE ENERGY SYSTEM
An analysis of European energy system changes in the lead-up to 2050 was carried out with the aim of better understanding the contribution of offshore wind to Europe’s goal of establishing a climate-neutral energy system. Four scenarios were defined (as shown in Information Box 2) in order to map out the benefits linked to the large-scale deployment of offshore wind and to assess the role played by cross-border collaboration. Each scenario was used to assess what the optimal decarbonisation pathway for Europe would be, given certain conditions, as follows.
1. No offshore buildout past 2030: no offshore wind farms are deployed beyond those which are associated with the realisation of current commitments outlined for 2030.
To harness the full benefits of the offshore wind potential, developments have to be approached holistically. All onshore grids around the sea basin require reinforcements. These have to be realised at the same pace as the development of the offshore grids. The lack of available onshore transmission capacity is a real risk from a wind developer’s perspective and can jeopardise the bankability of new offshore wind generation projects.

2. National approach to offshore buildout: the development of offshore wind is carried out in such a way that it satisfies the goals of each coastal country.
3. Collaboration with point-to-point connections: offshore wind is developed using (national and cross-border) radial connections and point-to-point interconnectors.
4. Collaboration with hybrid interconnectors and hubs: offshore wind is developed with a higher level of innovation involved (e.g. availability of DC circuit breakers) and the adoption of hybrid interconnectors.
By comparing these scenarios, a number of questions were explored relating to:
▶ the cost effectiveness of offshore wind deployment: the benefits of offshore wind development under each scenario (comparison of scenarios 2, 3 and 4 with scenario 1).
▶ the role played by cross-border collaboration: the benefits of the introduction of collaboration using radial (point-to-point) links (comparison of scenarios 2 and 3); and the incremental benefits of higher levels of innovation (comparison of scenarios 3 and 4).
To compare the scenarios with each other, a cost minimisation model was used that assessed the changes undergone by the European energy system and optimised investments in renewables, thermal power plants, storages, electrolysers and transmission infrastructure (hydrogen pipelines and transmission grids). It replicated a sector coupled energy system (i.e. both power flows and hydrogen flows were modelled) with a zonal resolution of the onshore bidding zones as of 2024. In order to map the geographical allocation of offshore resources, the same offshore modelling methodology as that adopted in the Ten-Year Network Development Plan (TYNDP) from ENTSO-E and ENTSOG was used (with the European seas divided into 56 zones3). The modelling perimeter and selected scenarios are summarised in Information Box 2. The appendix contains a more detailed description of how the scenarios were modelled in our simulations. The optimisation was based on the latest TYNDP 2024 energy system model and followed the scenario storyline matrix of the TYNDP. For this study, the “Distributed Energy” scenario was chosen along with a range of adaptations, as summarised in Information Box 3. The time horizon of this analysis covered the period between 2030 and 2050 in 5-year time steps, meaning that findings should always be interpreted with this 20-year time frame in mind. The following sections explore the modelling results in more detail, particularly those related to the buildout of offshore generation, infrastructure needs, the sector integration of offshore wind, and findings related to commodity prices and electricity trading volumes.
3. ENTSO-E and ENTSOG (2024). ‘TYNDP 2024 Scenarios Methodology Report’, https://2024.entsos-tyndp-scenarios.eu/#download (last accessed on 02/09/24)
MODELLING
APPROACH AND
SCENARIOS
INVESTIGATED FOR THIS STUDY
Offshore wind development does not extend further than current commitments for 2030.
Collaboration only occurs via point-topoint connections for interconnectors and wind farm connections.
Each country focuses on exploiting the offshore wind resources they need to satisfy their own demand (not to satisfy the goals of others). Cross-border offshore wind development occurs with (an assumed) higher level of innovation and the adoption of hybrid interconnectors.
Three key comparisons were calculated Modelling approach
▶ The benefits of the optimal deployment of offshore wind under the scenario conditions were assessed.
▶ The benefits of the introduction of collaboration using point-to-point links were assessed.
▶ The incremental benefits linked to higher levels of innovation and hybrid interconnectors were mapped.
▶ A sector coupled linear expansion model was used which minimised system costs.
▶ The deployment of variable energy sources, energy storage and transmission infrastructure was optimised.
▶ A Net Transfer Capacity approach was adopted and the expansion of transmission infrastructure included cross-zonal electricity lines as well as H pipelines.
▶ The simulations were run in an hourly resolution for one historical climate year (2009, being the year with the largets weighting in TYNDP).
Scenario Building was used for the offshore resolution: the European offshore territory was divided into 56 zones. Onshore zones were set in accordance with the bidding zones (c.f. map on modelling perimeter).
Mira Wenzel Project lead, Energy transition in the power sector, Agora Energiewende
Bérénice Crabs Secretary General, Belgian Offshore Platform
A CLOSER LOOK AT THE SELECTED SCENARIO FRAMEWORK
▶ The TYNDP 2024 Distributed Energy (DE) scenario was used as the foundation (it is one of the two ‘deviation scenarios’). Its starting point is 2030, and defines a pathway to carbon neutrality for the EU by 2050, with an increased focus on the electrification of the heat and transport sectors.
▶ DE was used as a basis for the analyses to represent the high levels of electrification of final energy demand that have also been found to be most efficient in previous Elia Group studies such as ‘Roadmap to net zero’ and ‘Powering Industry towards Net Zero’2 To maintain a balanced view of the future pathway to carbon neutrality, the following adaptations were made to the DE scenario:
• The first key adaptation involved aligning the onshore renewable energy potential (i.e. not pre-defined capacities but options for the model to buildout) with projections from the National Trends+ (NT+) scenario. Given that the NT+ scenario only covers the period up to 2040, ‘best estimate’ capacities for 2040-2050 were calculated based on long-term TYNDP trajectories. This ensured that the analysis remained grounded in current and future national energy trends, extending the relevance of the DE scenario to cover the entire period up to 2050.
• The second adaptation moderated the DE scenario’s focus on energy independence. It was assumed that up to 50% of the hydrogen demand will be met through domestic production, while the remaining share will be met by imports. This balanced approach is aligned with the REPowerEU 2030 targets Based on similar reasoning; it is assumed that the largest share of e-fuels will stem from imports.
• Adaptations to electricity demand in some countries
▶ A comprehensive methodology description including reference grids for electricity and hydrogen as well as the overall model structure and objective functions can be found in the TYNDP Methodology report5
Group (2021). ‘Roadmap to net zero’, URL (last accessed on 26/09/24)
2 Elia Group (2022). ‘Powering Industry towards Net Zero’, URL (last accessed on 26/09/24)
3 European Commission (2022).
5 ENTSO-E (2024). ‘Scenarios Methodology Report’, URL (last accessed on 26/09/24)
GREEN TRANSITION
DRIVING FORCE OF THE ENERGY TRANSITION
European autonomy with renewable and decentralised focus
+
aggregation of national pathways to reach EU targets
Global economy with centralised low-carbon and RES options
Fully in line with the energy efficiency first principle and with the Union’s 2030 targets for energy and climate and its 2050 climate neutrality objective
Transition initiated at a local/national level (prosumers)
Aims for EU energy independence and strategic independence through maximisation of RES and smart sector integration (P2G/P2L/ P2M)
Reduced energy demand through circularity and better energy consumption behaviour
ENERGY EFFICIENCY
Digitalisation driven by prosumer and variable RES management
Transition initiated at a European/ international level
High EU RES development supplemented by low carbon energy and diversified Imports
Reduced energy demand with priority is given to decarbonisation and diversification of energy supply
Digitalisation and automation reinforce competitiveness of EU business
Focus of decentralised technologies (PV, batteries, etc.) and smart charging Focus on large-scale technologies (offshore wind, large storage)
Focus on electric heat pumps and district heating Focus on a wide range of heating technologies e.g. hybrid heating technology
Higher share of EVs, with e-liquids and biofuels supplementing these in heavy transport Wide range of technologies and energy carriers across mobility sectors (electricity, hydrogen, e-liquids and biofuels)
II. COUNTRIES THAT EXPORT RENEWABLE ENERGY SOURCES NEED TO COLLABORATE WITH COUNTRIES THAT IMPORT THEM TO ACHIEVE THE MOST EFFICIENT
BUILDOUT
CROSS-BORDER COLLABORATION EXISTS IN MANY DIFFERENT FORMS, EACH OF WHICH IMPACTS THE COST SAVINGS
The savings associated with cross-border collaboration are influenced by its intensity and nature. In our simulations, we distinguished between three layers of collaboration (as illustrated in Figure 1.2). The first layer corresponds to no collaboration across borders (labelled as “national offshore buildout”). In this scenario, offshore wind is developed to satisfy national needs and only with the use of domestic potentials. In comparison with the “no offshore buildout past 2030” scenario, this allowed the value of offshore wind
to be computed in the long run. The second layer includes an element of cross-border collaboration, namely the co-optimisation of (domestic and cross-border) offshore wind development and point-to-point interconnectors with the overall operation of the system. This is called point-to-point cross-border collaboration, since the invested infrastructure only serves the single purpose of either connecting offshore wind to shore (via domestic or cross-border radial connections) or connecting countries together (via pointto-point interconnectors). The third layer includes hybrid interconnectors and offshore hubs in the optimisation. It is thus labelled “hybrid collaboration” and yields another step of benefits. This demonstrates that the degree of collaboration matters significantly when it comes to the total amount of benefits that offshore wind can unlock for Europe. The next sections will outline what drives these cost reduction steps.
▶ Raising the potential of offshore electricity grids will increase overall societal and economic benefits by an additional €40 billion
▶ Collaboration across the offshore wind sector will increase the benefits for all European countries by an additional €90 billion
▶ The development of offshore wind in Europe will unlock economic and societal benefits in Europe amounting to up to €460 billion, even in a scenario in which a national approach is taken
THE BENEFITS ASSOCIATED WITH OFFSHORE WIND DEVELOPMENT UNDER EACH OF THE FOUR SIMULATED SCENARIOS
FIGURE
Our government is highly ambitious about developing offshore wind in the North Sea, and Statnett, as Norway’s transmission system operator (TSO), is actively involved in this initiative. We are currently exploring potential hybrid connections with six different TSOs across the North Sea basin, with Elia Group being one of them. Collaboration will be essential to the success of this endeavor.

BUILDING UP TO 500 GW OFFSHORE WIND CAPACITY WILL CONTRIBUTE TO MINIMISING THE SYSTEM COST AS EUROPE DECARBONISES
COLLABORATION SHIFTS OFFSHORE WIND ASSETS TO MORE WINDY REGIONS
Flexible loads such as our HH2E plants benefit from the high price volatility caused by the massive expansion of renewable energies. Hybrid or longdistance interconnectors are increasingly connecting electricity markets characterised by renewables. Market coupling will be all the more efficient if flexible loads are installed at the interconnection points of the connectors and these lines can be operated with a long utilisation period and thus support an effective exchange of power between the markets even with low transmission capacities.

The results demonstrate that the buildout of offshore wind energy is important for reaching a cost-efficient and decarbonised European energy mix. The results show that an optimal offshore buildout will involve establishing an offshore wind capacity of up to 490 GW by 2050 (see scenario 4, which involves the highest level of collaboration). This is in line with the latest stated ambitions of the European Union´s Member States, the United Kingdom and Norway4 Similar results are highlighted in ENTSO-E’s 2024 Offshore Network-Development Plan (ONDP)5 As shown in Figure 1.3, this capacity translates into 2,130 TWh of offshore wind generation in 2050. The figure also reveals that a large share of the offshore wind capacity (290 GW) is built in line with a national approach. This demonstrates the high level of cost efficiency of offshore wind for coastal regions. Up
to 50 GW of offshore wind were added by the model with increasing levels of cross-border collaboration (see Figure 1.3: 40 GW in the ‘P2P cross border collaboration’ scenario and an additional 10 GW with ‘hybrid collaboration’). Whilst this difference seems small, the underlying benefits of increased interconnection that go hand in hand with a collaborative approach to offshore development are still significant, as highlighted in Figure 1.2
The stark increase in offshore wind capacity raises the share occupied by offshore wind generation in the electricity generation mix from 10% in 2030 to 30% in 2050, which reinforces the opening message of this chapter on the importance of achieving a balanced RES portfolio.
4. As of January 2023, non-binding EU Member State agreements refer to 383 GW, with an additional 15 GW in Norway and 97 GW in the United Kingdom: European Commission (2023). ‘Member States agree new ambition for expanding offshore renewable energy’, https://energy.ec.europa.eu/news/member-states-agree-new-ambition-expanding-offshore-renewable-energy-2023-01-19_en (last accessed on 02/09/24)
5. ENTSOE (2024). ‘Offshore Network Development Plan’, https://www.entsoe.eu/outlooks/offshore-hub/tyndp-ondp/ (last accessed on 02/09/24)
6. The cost reduction effects with increasing levels of collaboration vary greatly in the literature. This study can be regarded as more conservative compared to assessments: Weichenhain et al. (2019) ‘How to reduce costs and space of offshore development’, https://op.europa.eu/publication-detail/-/publication/59165f6d-802e-11e9-9f05-01aa75ed71a1 (last accessed on 02/09/24); Glaum et al. (2023) `Offshore Wind Integration in the North Sea: The Benefits of an Offshore Grid and Floating Wind’, https://arxiv. org/pdf/2305.01996 (last accessed on 02/09/24); Bermudez et al. (2020) `Optimal
pii/S0360544219322078 (last accessed on 02/09/24)
The difference in offshore wind generation capacity between the three high offshore scenarios appears to be small when comparing their relatively large capacity volumes with the ‘No offshore buildout past 2030’ scenario (step-up of 290 GW from ‘No offshore buildout past 2030’ to ‘National offshore buildout’ compared with an addition of only 50 GW under ‘Hybrid collaboration’)7 Behind these numbers, however, a spatial shift of the total added offshore wind capacity (340 GW between 2030 and 2050) across Europe can be seen, when studying Figure 1.4. The latter shows where the capacity was added by the optimisation model across the scenarios. The group of countries which export offshore wind energy experience a disproportionate increase in offshore wind capacity as collaboration is increased. In a scenario under which a national approach is taken, both groups of countries develop about 130-150 GW each, whilst under the full collaboration scenario, exporting countries are seen to increase their capacity by more than 200 GW. This group of countries spans from the British Isles, across Scandinavia, through to the Baltics (but also includes Spain and Greece). This group covers countries with rather good wind conditions and comparatively large amounts of space for wind farms (as opposed to importing countries such as Germany or Belgium).
framework should also encourage the adequate allocation of costs and benefits amongst participating countries in such a way that the most efficient buildout of offshore assets is achieved for the whole of Europe.
In other words, when cross-border collaboration was allowed by the model (via point-to-point interconnectors in scenario 3 or hybrid interconnectors in scenario 4), larger amounts of wind capacity are seen to be installed in these regions and exported back to the rest of the continent. This highlights the importance of a framework that facilitates the financial and administrative participation of multiple countries in offshore projects, instead of facilitating the participation of a project’s hosting country only. As discussed in Chapter 3, this
Some landlocked countries identified in the map in Figure 1.4 which do not have a coast or direct connection to offshore wind are marked as ‘Offshore Energy Importing Countries’. This reflects how offshore wind energy is integrated into grids beyond those which are directly connected under offshore wind farms. This point is crucial for reaching Europe’s offshore ambitions and the transformation of the energy system. It is only by adopting a coordinated approach to offshore wind development (which involves the deployment of offshore wind in the most efficient locations) that its full economic potential can be unlocked.
Elisabeth Vardheim Chief Executive Officer ad interim at Statnett SF
Hanno Balzer Head of energy management at HH2E
CROSS-BORDER COLLABORATION STRENGTHENS THE EUROPEAN ELECTRICITY MARKET
Further evidence for the importance of collaboration can be found when evaluating the buildout of cross-zonal interconnector capacities as shown in Figure 1.5 in each of the simulated scenarios8 The construction of interconnector capacity in the period 2030-50 varies more between the assessed scenarios than the offshore wind farm capacity (compare Figure 1.3 with 1.5). Increasing levels of collaboration are seen to yield higher interconnector capacities. The full collaboration scenario in particular leads to an almost 250 GW increase in interconnector capacity. At the same time, the addition of offshore (hybrid) interconnectors in this same scenario replaces some point-to-point interconnectors that exist in other scenarios. This is due to the more effective investment cost structure (lower levels of investment needed for a hybrid interconnector for connecting two countries to a wind farm compared with point-to-point interconnectors plus the parallel radial connection of a wind farm) and also the fact that hybrid interconnectors allow for a more efficient operation of the system. Further to this, increasing cross-border cooperation improves the utilisation rate of point-to-point interconnectors from about 55% to 65%.
The results show that there is a link between the expansion of offshore capacity in Europe and hydrogen imports
and domestic production. When the model was allowed to expand offshore wind capacities either via a national approach or via cross-border collaboration, this resulted in higher domestic hydrogen production9 levels and fewer imports as shown in Figure 1.6. However, in the scenario under which no additional offshore wind development occurs after 2030, only a small share of Europe’s hydrogen demand is covered by domestic production, while 80% of its needs are covered by imports10 Such a high reliance on imports (even if Europe were to have a diverse range of trade partnerships) would be a suboptimal solution for the continent. The other scenarios involve much lower amounts of hydrogen imports, amounting to around the 50% mark that was set in the model as a lower boundary following the REPowerEU 2030 targets11. Note that the hydrogen and e-fuels demand is fixed across all scenarios and reflects, amongst other things, the future green molecule demand of Europe’s decarbonising industry.
In general, the production of hydrogen occurs during periods when there is a high infeed of offshore wind, solar power and onshore wind, or during periods when one of these sources is highly available. Peaks in offshore wind yield frequently occur during the winter, while solar power production
peaks occur in the summer12 This means that hydrogen electrolysers that are utilised for the integration of RES in the summer can continue to be used for the integration of offshore wind in winter. As a result, the average annual use of hydrogen electrolysers increases when comparing the restricted offshore wind scenario (scenario 1) with the other scenarios, where offshore wind is co-optimised with the buildout of infrastructure. In the selected scenarios, this average use reaches 4,000 full-load hours.
To conclude, the production of hydrogen via sector coupling makes sense: the model sought to optimise: 1) the location of electrolysers in areas which were beneficial for the system; and 2) their operation to facilitate the efficient integration of (offshore) renewables into the electricity grid. This is also reflected in the share of offshore wind energy that is transmitted to onshore electrolysers via the transmission grid (about 40% of the total offshore electricity generation13). Moreover, countries which have an abundance of renewables (especially Ireland or Denmark in the model used for this study) can produce green hydrogen for export across Europe to support the continent’s security of supply.
The construction of offshore grids will deliver huge benefits for the European electricity market by enhancing price convergence and reducing wholesale electricity prices. Figure 1.7 illustrates that the average electricity price in 2050 is lowest in scenarios that involve high degrees of collaboration in the development of offshore wind. This reduction in electricity prices (almost -40%) is a direct consequence of increased supply from offshore wind farms and improved market efficiency resulting from higher transmission capacities across bidding zones. Thus, the rise in interconnection capacity significantly strengthens Europe’s electricity market and helps to provide consumers with affordable green energy.
This finding, alongside previous observations, underscores the value of the cross-border development of infrastructure. This will yield financial benefits (as mentioned above) and unlock further advantages such as increased market liquidity in the European energy-only electricity market. Additionally, increased cross-zonal transmission capacity contributes to enhanced security of supply (also refer to a statement by Agora Energiewende in Information Box 4).
MORE WIND FOR
CLIMATE
NEUTRALITY
Offshore wind energy is crucial for the energy transition in both Europe and Germany. In response to the European Green Deal and the 2022 energy crisis, expansion targets have surged. Meanwhile, offshore wind energy is especially attractive due to its electricity yield in winter – which coincides with periods of high demand. Winds blow more consistently at sea, and larger wind farms can built across the sea than those that can be built onshore. Technological advancements have driven down generation costs, making offshore wind projects financially viable without state revenue protection. This is evident from Germany’s 2023 and 2024 offshore wind tenders, which generated a high level of interest and a high willingness to pay despite recent market challenges.

energy entail a corresponding need for significant grid connection capacities. Currently, Germany uses radial connection systems for offshore wind farms. The insufficient level of onshore grid expansion is already hampering the integration of the relatively large wind farms that are spatially concentrated in the North Sea. This leads to the frequent curtailment of offshore wind farms and affected almost every fifth kilowatt hour in 2023. A more effective solution is to integrate offshore wind farms into a meshed European offshore grid, utilising hybrid grid connections – including energy islands – to enhance grid integration and electricity trading. These complex projects require an updated regulatory framework and robust stakeholder coordination.
To enable the cost efficient deployment and integration of the 300-400 GW of offshore needed for Europe’s green transition, offshore energy hubs that couple offshore HVDC transmission and offshore hydrogen production should be considered.

Nevertheless, achieving these ambitious offshore targets requires proactive strategies and measures from politicians, investors, operators and manufacturers to develop offshore wind farms and their supply chains. Supply chain bottlenecks and rising project costs, exacerbated by the sharp increase in demand, complicate expansion efforts. Some large wind farms in the US and UK have even been cancelled. Since 2022, financing and grid connection costs for offshore wind projects have spiked due to rising interest rates. To overcome these obstacles, it is crucial to implement supportive measures and foster collaboration among all stakeholders.
In addition, more efficient approaches to the grid connection and integration of offshore wind farms into the European electricity market will be required in future. The high expansion targets for offshore wind
High-density offshore wind farms also need to be carefully planned out to balance land use interests, for example with shipping, nature conservation and species protection, as well as to optimise wind utilisation by mitigating wake effects. Stronger cooperation with neighbouring countries in the North Sea and Baltic Sea can facilitate an efficient expansion by 2045 to address these area challenges and ensure the sustainable and efficient development of offshore wind resources.
III. OFFSHORE WIND GENERATES BENEFITS BEYOND THE COUNTRIES WHICH
ARE DIRECTLY CONNECTED
Offshore wind development is crucial to foster an independent, secure, and clean energy sector in the Baltics. Crossborder cooperation could unlock higher amounts of offshore wind potential offshore wind potential and enable a more efficient approach towards future developments.

The previous section demonstrates that offshore grids strengthen Europe’s electricity market and that electricity prices are reduced as the amount of offshore wind generation and degree of cross-border collaboration increase. These effects are not just possible parts of a future energy system; in fact, they could have had a positive effect on today’s market, too.
To demonstrate this, an analysis which replicated the market outcomes from 2023 in Europe with an additional offshore hub in the Baltic Sea was carried out. The results of this show what wholesale day-ahead electricity prices would have been in Europe if an additional offshore hub had existed in the market.
ASSESSING THE IMPACT OF A HYBRID INTERCONNECTOR
ON TODAY’S MARKET
The pan-European hybrid electricity market integration algorithm (EUPHEMIA ) for common price coupling used in single day-ahead market coupling to calculate power prices across Europe, while implicitly scheduling auctionbased cross-border flows across interconnectors.
The algorithm chooses market clearing day-ahead power market supply and demand bids from European power exchanges to maximise socialeconomic welfare, while the technical limitations of the transmission grid are respected through a flow based approach for the Core region2 and available transfer capacity (ATC) approach for the remaining areas.
How it was used for this study
▶ Two counterfactuals were simulated with a 2 GW offshore wind farm in the Baltic Sea, integrated through a new (offshore) bidding zone that was either connected:
• radially to the Central Western Europe 2 region (CW2; ‘cross-border radial’)
• via a hybrid interconnection line to the Baltics (BAL; ‘hybrid’).
▶ As an additional input, a 2023 weather time series was used based on the Copernicus data set
▶ As an output, power prices were calculated and cross-border flows were compared.
Where are the limits of this approach?
▶ The methodology only allowed ‘minor changes’ to be made to the original data of 2023 to yield meaningful results. A ‘2050 scenario’ with high levels of additional offshore wind capacity was not feasible.
▶ The UK is not part of the coupled market, meaning it could not be modelled.
▶ The year 2023 carried lower levels of renewable capacity and interconnectivity compared with the 2030 and 2050 scenarios, meaning that the findings for this individual example need to be interpreted in this light.
The bidding zones of the day-ahead market are grouped into relevant macro-regions according to the procedure adopted in the TYNDP and the Bidding Zone Review process by ENTSO-E4
Fulfilling European climate targets requires large amounts of green electricity generation and offshore wind is one of the key technologies to ensure both the volumes and deployment pace needed. Hybrid interconnection and landing zones can – in the right configuration – help integrating offshore wind efficiently and thus support this development.

Janos Hethey Senior Consultant, Energy Analytics
By modelling two hypothetical scenarios that involve both the direct radial connection of an offshore hub and a hybrid interconnector, distributional effects for prices and power exchanges were calculated for different macroregions across Europe. The definition of these macro-regions was aligned with the procedure adopted in the TYNDP and the Bidding Zones Review process (see Information Box 5 for an explanation of the modelling approach).
For the purpose of this study, a modelling facility was used that applied the EUPHEMIA algorithm to the historical order books of 2023 (hourly resolution). This produced an accurate replication of historic market and system conditions and counterfactual ‘what-if’ scenarios. The model enabled the following question to be answered: What would power prices and crossborder exchanges have been in 2023 if there had been an additional offshore hub in the Baltic Sea?
▶ This differs from a fundamental market or grid model in that this analysis involved the use of ‘real’ order books, grid constraints and market topology from historic production data. The method therefore allowed hypothetical outcomes to be assessed, as if the market was being operated including the additional offshore wind farm.
▶ Only a single additional interconnector was added to the model, so no saturation effects with additional (hybrid) interconnectors were assessed.

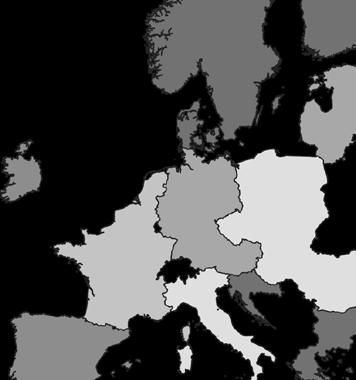
(1). Nemo Committee (2024). ‘EUPHEMIA Public Description Single Price Coupling Algorithm’, https://www.nemo-committee.eu/assets/files/euphemia-public-description.pdf (2). ENTSO-E (2024). ‘Day-ahead capacity calculation’, https://www.entsoe.eu/bites/ccr-core/day-ahead/ (last accessed on 30/09/24)
(3). Copernicus, ECMWF, European Commission (2024). ‘Climate and energy indicators for Europe from 1979 to present derived from reanalysis’ https://cds.climate.copernicus.eu/datasets/sis-energy-derived-reanalysis?tab=overview (4). ENTSO-E (2022). ‘Report on the Locational Marginal Pricing Study of the Bidding Zone Review Process’, https://eepublicdownloads.blob.core.windows.net/public-cdn-container/clean-documents/Publications/Market%20Committee%20publications/ENTSO-E%20LMP%20Report_publication.pdf (last accessed on 26/09/24)
Rokas Masiulis Chief Executive Officer, Litgrid AB
OFFSHORE CONNECTIONS AFFECT ELECTRICITY PRICES IN COUNTRIES BEYOND THEIR HOSTING COUNTRIES
The simulation results in Figure 1.8 show the reduction in the weighted average of day-ahead power prices for the year 2023. The colour gradient illustrates how an additional offshore wind farm in the market reduces the prices, and that these price effects spill out far beyond the directly connected (i.e. hosting) market areas. In the first scenario (in which the 2 GW offshore hub is only linked to the CW2 macro-region), prices are reduced by up to €1.9/MWh in CW2. Smaller yet still visible price effects are shown for the neighbouring regions. The same pattern emerges in the second scenario (in which a hybrid interconnector is established between the 2 GW offshore hub and CW2 and BAL). Although slightly lower price effects emerge in this second scenario (up to €1.8/MWh in CW2), they are more widespread across
the continent. In total, all studied market areas that are connected across Europe are shown to experience some average price reduction. Moreover, specifically in the case of CW2 and BAL, price peaks are clipped by up to 37% in the second scenario. Hourly price fluctuations are dampened such that the variance is reduced by 27%. The (hybrid) connection of offshore wind to the shore can therefore help to alleviate price peaks, which is especially valuable during periods of crisis, or at other times when prices are high. This therefore reinforces the finding (mentioned earlier) that (hybrid) interconnectors and the integration of offshore wind contributes to security of supply in a positive way by strengthening Europe’s internal energy market and lowers price variability.
OFFSHORE WIND INFEED IS EFFICIENTLY INTEGRATED ACROSS EUROPE WITH HIGH INTERCONNECTION LEVELS
The effects induced by the offshore connection in this simulation are due to the additional trade volumes. Figure 1.9 illustrates that the directly connected market areas of CW2 and BAL in the second scenario increase their net exports by a total of 4.2 TWh compared with the (base case) actual trades carried out in 2023. This represents 52% of the total electricity supply of the additional offshore hub in the Baltic Sea (8.24 TWh) and illustrates how markets that are not directly linked to hybrid interconnectors benefit from their additional offshore injections.
HYBRID INTERCONNECTORS FACILITATE A HIGHER TRANSMISSION ASSET UTILISATION RATE
In addition to increasing cross-border trades, the additional hybrid interconnector is shown to increase the utilisation rate of the offshore transmission assets (when compared with the radial scenario). Connecting the offshore wind farm via a radial connection yields an asset utilisation rate that equals the capacity factor of the offshore wind farm (here about 0.9 GW or 45% of the installed capacity). Its utilisation rate cannot be increased further, since the cable is only available for the single purpose of connecting the wind farm to the shore. In the hybrid scenario, the transmission system carries an additional purpose: that of connecting two market areas together. Figure 1.10 reveals that this additional usage of the transmission system yields an increase from 45% to 53% cable utilisation of the transmission asset along the (southern) leg to CW2. The northern leg to BAL involves a smaller absolute transmission level due to the smaller size of the link (0.5 GW), but its link utilisation is similar (slightly
larger) compared to the southern leg to CW2. Moreover, the share of transmission capacity that is used for crossborder flows is much larger compared with the CW2 link.
This leads to the conclusion that hybrid interconnectors are not necessarily used in a symmetrical manner, which adds another layer of complexity to the assessment of benefits and fair distribution of costs for such assets.
It should be noted that not all similar (hybrid) offshore connections would lead to the same price and cross-border trade effects. However, the analysis clearly demonstrates that such projects almost certainly affect non-hosting countries, i.e. neighbouring market areas around the same sea basin and beyond. This underscores the complexity involved in realising such transmission systems and sharing out their costs, benefits and risks, as discussed in Chapter 3. Whilst the price effects in this calculation would allow the wind farm and transmission infrastructure to pay off within the expected lifetime of the assets, it is clear that actual investment decisions cannot be taken based on one single example. Clearly, the exercise is hypothetical, and interconnectors commissioned in the years to come will face different market and boundary conditions. The analysis therefore does not assess the cost/benefit ratio of this particular example. The system study outlined in the previous section demonstrates that (hybrid) offshore connections can be viable and beneficial on a large scale. Realising them, and yielding the same benefits that can be calculated in simulation studies, will require a coordinated planning approach and diligent investment decisions to be taken. Both areas are investigated further in Chapters 2 and 3. Please also see the statement from Agora Energiewende in Information Box 4.
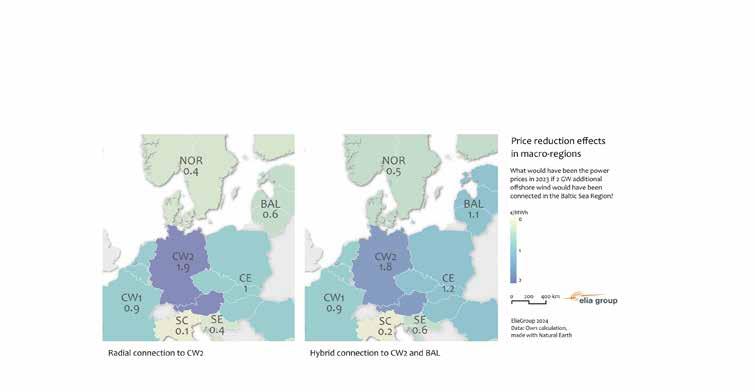
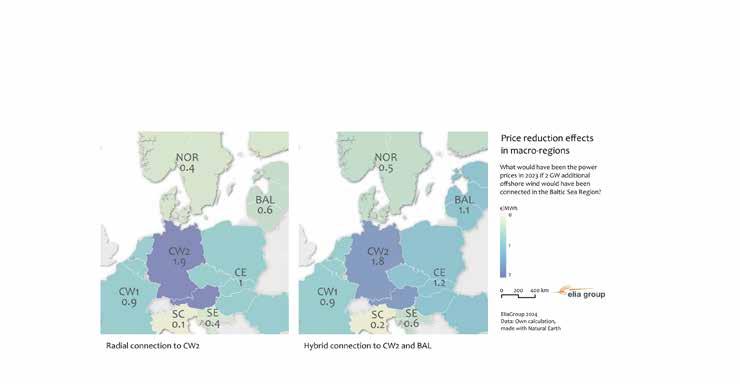

Offshore wind is vital to reaching decarbonisation targets, and efficient connections are crucial. Hybrid solutions can reduce energy prices and support optimisation efforts in view of scarce resources by reducing infrastructure, lessening environmental impacts, and providing benefits for people. Financing challenges persist, but crossborder collaboration can address them. Elia Group’s insights contribute to a sustainable energy future.
Antonella Battagilini Chief Executive Officer at Renewables Grid Initiative, RGI
IV. CONNECTING NON-DOMESTIC OFFSHORE WIND WILL REDUCE THE VARIABILITY OF THE FUTURE ENERGY MIX
The previous sections demonstrate the benefits which the development of offshore wind can yield, in particular when it is optimally developed across borders. While some of the effects are a direct result of the cost structure of the assessed alternatives, other effects, such as the utilisation rates of interconnectors and the cross-zonal trade volume of electricity, can be more subtly explained by the geographical differences of the assessed countries and partly complementary patterns in electricity demand and generation. For these reasons, this section acts as a conclusion for Chapter 1 and takes a closer look at the variability and spatial disparities of and between offshore wind resources.
The analysis conducted for this study demonstrates that offshore wind is a variable energy source which depends on the weather and whose yield fluctuates in ways that are significantly different across different sea basins, such that some of this variability cancels itself out. This means that it is possible to design a European energy mix that: comprises offshore wind, solar power and onshore wind and minimises the seasonality in electricity supply; and that, across medium time horizons (eg. weeks), smoothens out the infeed of offshore wind farms located across a sea basin. Ultimately, the analysis demonstrates that adopting a cross-border approach to offshore wind development can help to shorten periods of sustained supply shortages due to ‘dunkelflaute’.
OFFSHORE WIND COMPLEMENTS ONSHORE WIND AND SOLAR POWER
Elia Group’s 2021 viewpoint study demonstrated that the intermittent nature of RES can be managed via a welldesigned energy mix15 For example, seasonal electricity generation and consumption patterns (i.e. fluctuations that occur over several months or across a year) demonstrate that the production of solar power and (offshore and onshore) wind is complementary. Figure 1.11 demonstrates that it is only through the conjunction of solar
power with onshore wind and offshore wind that a balanced energy mix is achieved that best matches the continent’s direct electricity demand. This implies that not developing offshore wind would nudge this mix towards demonstrating patterns of higher (seasonal) variability, which in turn would demand more backup capacity. The simulation results outlined in the previous sections in this chapter confirm this finding.
To further investigate the patterns of volatility of offshore wind, a statistical analysis with the help of a Fourier analysis was conducted. This allowed patterns of variability16 that can be identified in large data sets that span several decades of European historical weather data (and come with in a high temporal and spatial resolution) to be disentangled. A better understanding of the variability of offshore wind energy (i.e. the occurrence and intensity of wind speeds) was then established. The results can help to more effectively plan out the offshore grid infrastructure of the future. Since weekly variability is particularly challenging for the power system (the period is too long to be fully covered by short-term flexibility offered up by end users), it was the focus of the Fourier analysis (c.f. Information Box 6).
FOURIER ANALYSIS
A Fourier analysis is used for data analysis: it identifies periodic patterns in a given time series and reproduces them with the help of sinusoidal functions. It reveals the extent to which certain fluctuating components contribute to the total signal, i.e. if there is a dominating fluctuation that overlaps onto all other noise in between. For example, when analysing wind infeed, a Fourier analysis can be used to reveal how large weekly fluctuations are compared with seasonal fluctuations and if other components on a daily basis are relevant or not. A Fourier analysis involves the three steps outlined below.
Discrete Fourier transformation to obtain the frequency spectrum of relevant fluctuation components and noise.
Disjoint slicing of the frequency spectrum according to the relevant timescale.
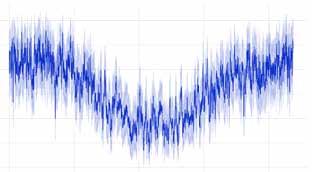
Disentangle drivers for volatility
Inverse Fourier transformation per time scale (per slice included in step 2) to obtain a signal in the time domain.
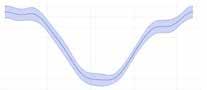
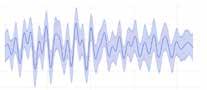
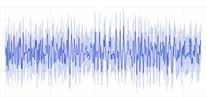
MAKING USE OF COMPLEMENTARITY ACROSS SEA BASINS
In addition to offshore wind generation patterns and solar generation patterns being complementary, the variability of offshore wind also has smoothening effects across geographical regions (such as the Baltic Sea and the North Sea). To illustrate this, Figure 12 shows the correlation of offshore wind speeds across the Baltic Sea and North Sea (based on more than 40 years of historical wind speed data17) using the Belgian Princess Elisabeth Zone (PEZ) as a reference po quantifies the extent to which windy weeks in the PEZ occur at the same time as windy weeks in other parts of the seas. For distances of 500 km and above, correlation values drop significantly (i.e. under 80%). The effect is even stronger when looking at the Baltic Sea (below 50%). Lower correlation values imply that pooling wind generation from these areas with the domestic Belgian offshore production would yield a smoother mix overall. A low correlation with the Baltic Sea thus underscores the complementarity of both seas for the future energy mix.
As the distance between the PEZ and the other wind farm areas increases, so do the chances that it will be windy in one of them. If a foreign wind farm area is located far from domestic wind farm areas, it is likely to be more easily integrated into the domestic grid, making the operation of long-distance hybrid interconnectors an attractive option. This is because the wind speed correlation decreases as the distance between wind farms increases, thereby increasing the chance that domestic offshore wind is not making (full) use of local grid capacities. The potential curtailment of wind farms is therefore avoided and the efficiency of the energy system is increased. The lower the level of correlation, the more likely these situations are to occur.
Note that with help of the Fourier analysis, only the weekly variability of the wind speeds was used for this assessment in order to focus on the most challenging time horizon in terms of variability. This filter makes the findings slightly more robust compared with a simple autocorrelation, since daily changes in wind speeds would over-emphasise the correlation (or the lack of it) across countries18
To visualise the geographical disparity in wind speeds, Figure 1.13 (which uses data from 28/01/2020) demonstrates where low wind and high wind speeds occurred across Europe on a particular day. The map shows that in the Channel area, wind speeds were very low. In fact, these were
WEEKLY CORRELATION OF WIND SPEEDS ACROSS THE BALTIC SEA AND THE NORTH SEA, WITH BELGIUM AS THE REFERENCE REGION; BASED ON A FOURIER ANALYSIS OF THE ORIGINAL COPERNICUS WEATHER DATA
The energy transition is in full swing, and renewables are rapidly being introduced into the power system. These renewables, and in particular offshore wind, are dispersed and located far from load centres. Their variability causes changing flows throughout the European system, influencing multiple zones at the same time. If we want to fully reap the benefits of the vast amounts of renewables, we’ll need to move from radially connected offshore wind farms offshore grids that cross borders.

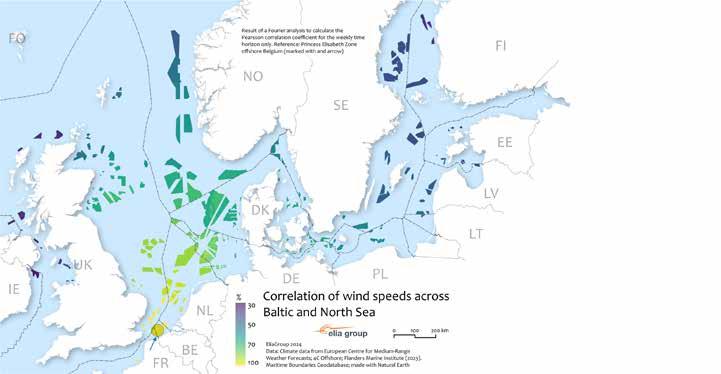
Copernicus, ECMWF, European Commission (2024). ‘Climate and energy indicators for Europe from 1979 to present derived from reanalysis’, https://cds.climate.copernicus.eu/datasets/sis-energy-derived-reanalysis?tab=overview (last accessed on 03/09/24) 18. For a deeper look at the different time horizons of variability and correlations, see this case study which focuses on Norwegian offshore wind: Hjemeland and Kristiansen Nøland (2023). ‘Correlation challenges for North Sea ofshore wind power’, https://doi.org/10.1038/s41598-023-45829-2 (last accessed on 24/09/24)
below the cut-in speed (i.e. the speed of wind that is needed for the rotors to start spinning) of the wind turbines.
The map shows that wind speeds increased across the North Sea basin, and were highest off the Norwegian coast, translating into potentially high wind farm generation levels. In this particular example, a hybrid interconnector from Belgium (or Germany) towards the north would have allowed offshore wind energy to be fed into the onshore grid, even whilst domestic production levels in the south were low. At the same time, this link would possibly have avoided the curtailment of the northern wind farms that
might not have been able to feed into northern markets any longer, since they were saturated with onshore wind power.
This example can be supplemented with an analysis which considered the historical time series for offshore wind production over the period 1979 through to 2023. Pooling the different offshore wind farms per sea basin leads to a reduced level of electrical infeed variance, and thus to reduced needs for medium-term flexibility, as mentioned above. This pooling can only be achieved through increased levels of interconnection across a sea basin, through hybrid interconnectors or (where applicable) cross-border radial connections.
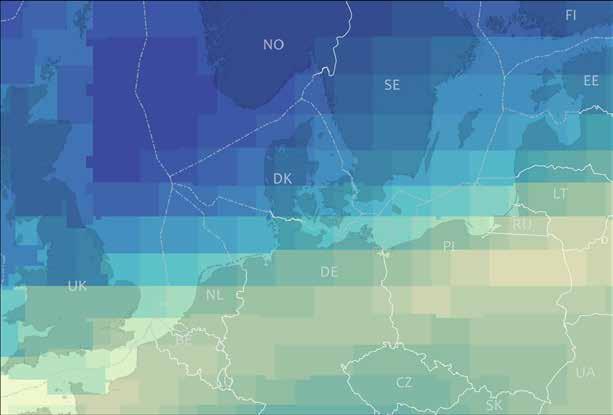
Moving from an offshore generation mix at the Belgian level to a generation mix across the southern part of the North Sea basin would induce a reduction in the weekly variability (from 70% of installed capacity in Belgium and 60% in Germany to 48% of installed capacity in a pooled southern part of the North Sea basin, as shown in Figure 1.14 on the next page). This number should be seen as a theoretical potential as it assumes a perfect level of interconnection across the sea basin, which is not a practically achievable situation; however, it indicates the potential of these connections. This potential can be extended through further (onshore) connections between the different sea basins (as highlighted in Elia Group’s ‘Roadmap to net zero’)19

The wake effect is often mentioned as a coordination challenge for investors in offshore wind. This report nicely illustrates that it can also be a reason for governments to collaborate across borders. Some countries have more space in the sea to spread their offshore wind farms (reduced wake effects) and/or are less dependent on offshore wind to meet their national energy needs, while other countries are more dependent, and do not necessarily have the same space offshore. Moreover, the numbers on correlation of offshore wind also remind us that having access to a pool of offshore wind over larger distances is beneficial if we can keep the infrastructure costs under control. am sure that many researchers will be interested to dive deeper into these numbers.
FIGURE 1.12
Prof Dirk van Hertem
WIND SPEEDS ACROSS EUROPE ON A WINTER’S DAY IN 2020 FIGURE 1.13
Leonardo Meeus Director of the Florence School of Regulation at European University Institute
POOLING HELPS TO COPE WITH MOMENTS OF LOW OFFSHORE WIND POTENTIAL
In addition to weekly and seasonal fluctuations, extreme events during which low levels of offshore wind are produced can also occur. These events are rarer and can be due to moments of low wind (below the cut-in speed for example), or high wind (when turbines are turned away from the wind for safety purposes). These events can vary in duration. For the purpose of this study, they are defined as periods where the 24 hourly (rolling) average of available offshore wind power in the studied region falls below 20% of the installed capacity. As the bulk of the gain lies in the longer duration events, pooling can significantly reduce the number of low infeed days, as shown in Figure 1.15.
These benefits are less pronounced in countries which have offshore wind farms which are spread out across larger geographical areas (e.g. Germany’s wind farms are more spread out compared with Belgium’s wind farms), as this
effect is already naturally present in their portfolio. Figure 1.15 demonstrates that the number of days that carry low levels of offshore wind potential for Belgium can be reduced by 25 (approx. 25%) when pooled with the southern part of the North Sea. The equivalent reduction for Germany amounts to 3 days. Nonetheless, the effect remains present in larger geographies. Increasing the level of interconnection even further, beyond the sea basin, can further accentuate this effect.
However, even with pooling, both variability and moments of sustained low production (lasting several weeks) can occur in the case of offshore wind. In turn, as confirmed by the simulation study outlined above, backup power plants are needed. However, their operational hours are limited as was demonstrated in ‘Roadmap to net zero’20
FISHING IN BOTH SEAS
Bidding zones which border multiple sea basins, such as Germany, could leverage the complementarity of the production potential profiles of the Baltic Sea and the North Sea. As can be seen from Figure 1.16, the simultaneous occurrence of low offshore wind potential in the sea areas connected to the German bidding zone is relatively limited when compared to low offshore wind potential occurrences in German wind farms in both sea basins separately. Taking this into account during the construction of offshore generation capacity and on- and offshore grids could further smoothen the infeed coming from offshore wind generation units, and thus reduce the need for additional backup capacity.
STRATEGIC
2
The previous chapter demonstrates that cross-border cooperation is pivotal for deploying offshore wind in a more affordable manner than via a national, bottom-up approach. This chapter focuses on how coordinated planning can help to...
… mitigate wake losses by 6-9 GW in the German Bay. While they are an inevitable part of offshore wind development, their impact can be reduced by optimising the layout of wind farms.
CROSSBORDER PLANNING WILL MAXIMISE THE WIND POTENTIAL OF EUROPE’S SEAS WHILE ENHANCING OVERALL EFFICIENCIES 6-9 GW -50% A B
… reduce the spatial footprint of subsea cables by approximately 50% in protected areas without significant markups on the additional cable corridor lengths. These subsea cables will connect future wind farms and countries together.
… boost European technology leadership and supply chain growth with a job creation potential of 300,000 jobs across Europe.
300,000
I. EFFICIENCY FIRST: ACHIEVING HIGH AMOUNTS OF FULL-LOAD HOURS
LARGE-SCALE OFFSHORE WIND CAPACITY LEADS TO INCREASING WAKE LOSSES
The economic case for offshore wind power is based on having access to a strong and stable wind resource. High amounts of full-load hours (over 4,000 FLH per year) can be achieved by modern wind farms which are situated in good locations in Europe’s northern seas With larger and more numerous wind farms in future, clusters will emerge where many wind farms are located close to each other. This proximity can lead to wake effects that reduce the efficiency of individual wind farms, ultimately significantly reducing their annual electricity output (see Information Box 7).
The North Sea provides a good example for this phenomenon. The map in Figure 2.1 shows that the winds which cross the North Sea are predominantly southwesterly in nature. Our analyses demonstrate that about 30% of the future offshore wind capacity in the North Sea will share the same wind corridor that reaches from the English Channel up along the Dutch, German and Danish coasts. Given the comparatively high power densities associated with existing and expected wind farms along this corridor (see Figure 2.1), wake losses will become an important variable in future wind farm development in this area. In fact, wind farm developers have been attaching increasing importance to this topic in recent years and have been linking it to potential risks regarding the economic profitability of their wind farm projects2
The analyses carried out for this study focused on the region of the German Bay (which covers the EEZs of the Netherlands, Germany and Denmark), as wake losses are going to be significant in this region. Analyses carried out for other regions have confirmed that cross-border wake losses can also occur elsewhere, as is the case for the Belgian Princess Elisabeth Zone and neighbouring wind farm areas.3

About
30% of the future offshore wind
capacity in the North Sea
7 UNDERSTANDING WAKE EFFECTS IN OFFSHORE WIND DEVELOPMENT


will be located in the same wind corridor.


Wind turbines convert kinetic energy into electrical energy. The blades of a wind turbine disturb the incoming air flow. Indeed, in the area behind the rotor (known as the ‘wake’), wind speed is reduced and wind turbulence is increased due to the rotor’s mixing effect. The impact of this effect can be felt for hundreds of kilometres downstream from each wind turbine, significantly affecting the performance of neighbouring turbines and wind farms. In addition to atmospheric flow conditions, the main variables that influence this effect include the size, layout and density of wind farms. The resulting loss in power production is especially felt at low and medium wind speeds, when wind turbines are not yet running at full capacity. During strong winds, this effect is much smaller, since the turbines are running at full capacity and can therefore level out slight shifts in wind speed.
In addition to wake effects, wind farms are also subject to blockage effects: reductions in wind speed upstream, caused by the cumulative piling up of the air flow in front of the turbine rotors. The impact of this effect is much smaller than the impact associated with wake effects; however, estimates calculate that blockage effects cause single-digit percentage point reductions in the annual energy production of a wind turbine.


Implications


1. Reduced energy yields: Wake effects can lead to reductions in the amount of electrical energy produced by downstream wind farms: their overall energy output can be decreased by between 10 to 30%.


2. Turbulence and fatigue: Increased turbulence in wake regions can accelerate turbine component fatigue, affecting maintenance schedules and operational costs.
3. Optimisation challenges: The layout and spacing of wind turbines need to be efficiently designed to mitigate wake effects.


1. Grothe, O., Kächele, F., and Watermeyer, M. (2022). ‘Analyzing Europe’s Biggest Offshore Wind Farms (2022): A Data Set with 40 Years of Hourly Wind Speeds and Electricity Production’. Energies, https://doi.org/10.3390/en15051700 (last accessed on 18/09/24) 2. Ørsted (2019). ‘Ørsted presents update on its long-term financial targets’, https://orsted.com/en/company-announcement-list/2019/10/1937002 (last accessed on 16/08/24) 3. Porchetta et al. (2024). ‘Annual wake impacts in and between wind farm clusters modelled by a mesoscale
(last accessed on 26/09/24)
4. Overplanting: Installing a higher wind farm capacity than the transmission capacity of the cable that transports the energy back to shore keeps the grid infeed more stable, including during moments that involve medium wind speeds.
WIND FARM AREAS AND MAIN WIND DIRECTIONS IN THE NORTH SEA ALONGSIDE THE RANGES OF OFFSHORE WIND FARM POWER DENSITIES ASSOCIATED WITH EACH COUNTRY’S SEA
Research shows that is it very important to take large-scale wake losses into account during the spatial planning phase of offshore wind power as Europe works towards establishing over 100 GW of offshore wind installations in the North Sea. We suggest including them in European power and energy system studies, especially when looking beyond 2030.

Matti Koivisto Senior Researcher, Technical University of Denmark, DTU Wind
INVESTIGATING MEASURES TO MITIGATE WAKE LOSSES
An analysis was carried out to better understand the magnitude of the wake losses in the production of offshore wind power and find out to what extent the cross-border co-optimisation of wind farm locations could mitigate these losses.
The analysis was conducted in three steps, with the first step resembling the ‘business as usual’ scenario: this covers the capacities of existing and future wind farms and their power densities (step one in Figure 2.2). By calculating two alternative scenarios and comparing them with the base case, two mitigation options were compared with each other. The latter involved: (1) the spreading out of wind farms to achieve lower power densities and less shading within different exclusive economic zones (EEZs); (2) the displacement of wind farms to other countries to achieve greater distances between each for more efficient refreshment between wind farm clusters. The analysis was carried out with the use of the Kinetic Energy Budget of the Atmosphere (KEBA) model (see Information Box 8 on the methodology) for a 2050 scenario assuming the full buildout of wind farms in line with current offshore targets.
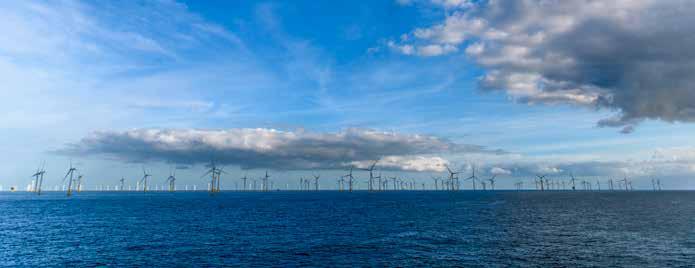
Base case (business as usual)
Wind farm capacities and densities match those of today
Power density: between 5 and 12 MW/km²
CALCULATING THE KINETIC ENERGY BUDGET IN THE ATMOSPHERE AROUND WIND FARMS
In cooperation with:

We carried out our analysis in collaboration with the Max Planck Institute of Biogeochemistry and deployed the Kinetic Energy Budget of the Atmosphere (KEBA) model developed by Kleidon and Miller(1) The model resembles a simplified representation of the kinetic energy influx, conversion, and outflow for a hypothetical boundary box around the analysed offshore regions. It is important to note that this boundary box approach is a rather abstract representation of reality; it only provides indicative results that would merit a more precise assessment with atmospheric models(2) However, for the purposes of this study, the approach was sufficient and has been validated by previous studies(3)
What KEBA does
▶ Input/Output model of kinetic energy influx, conversion and outflow for a boundary box around a wind farm or an entire offshore region
▶ Can be calibrated to different wind speeds, turbine ratings, rotor diameters, power densities, air densities, power curves of turbines, etc.
Use
▶ Simple model: fast deployment and versatile, meaning it can adapt to different needs and can provide ballpark figures for this study
More space for wind farms
Wind farms are more spread out, creating lower power densities
Power density: between 1 and 3 MW/km²
Cross-border cooperation
Optimised capacities between Germany and Denmark
Power density: between 1 and 3 MW/km²
15 GW shifted from Germany to Denmark
▶ Method has been validated by more complex atmospheric models with only low levels of deviation on small scales
Important notes
▶ Assumes single wind direction (no wind rose)(4) which requires results to be calibrated
▶ Boundary box approach is not very granular: it does not depict individual wind farms or turbines

With key assumptions


1. Single main wind direction from southwest representing 25-30% of all hours
2. Three coupled bounding boxes that cover the EEZs of NL, DE and DK respectively
3. Simulation of 10 historical climate years with an hourly resolution
(1). Kleidon, Miller (2020): The Kinetic Energy Budget of the Atmosphere (KEBA) model 1.0. Geoscientific Model Development, https://doi.org/10.5194/gmd-13-4993-2020 (last accessed on 18/09/24)
(2). Mudafort et al. (2024): Comparison of steady-state analytical wake models implemented in wind farm analysis Software Journal of Physics Conference Series, https://doi.org/10.1088/1742-6596/2767/5/052066 (last accessed on 18/09/24)
(3). Agora Energiewende, Agora Verkehrswende, Technical University of Denmark and Max-Planck-Institute for Biogeochemistry (2020). Making the Most of Offshore Wind: Re-Evaluating the Potential of Offshore Wind in the German North Sea, https://www.agora-energiewende.org/publications/making-the-most-of-offshore-wind (last accessed on 18/09/24)
(4). A wind rose compiles information about wind directions and speeds at a specific location over a designated time period.
REDUCTION IN FULL-LOAD HOURS AS A MEASURE FOR CALCULATING WAKE EFFECTS FOR THREE SCENARIOS
Reduction in full-load hours (FLH) in %
Comparing ambient conditions (no wake) with actual conditions (with wake) for the planned buildout and for an optimised buildout, as part of which some wind farms are moved across borders % NL DE DK Average
base case with current planning more space for wind farms cross-border cooperation
Bandwidth within which wake losses can be mitigated in the region 8-9 GW
The analysis findings are depicted in Figure 2.3. In the base case, which involves current plans being followed, wake losses are found to lead to an average FLH reduction of 23% in the region, with reduction peaks in Germany reaching almost 30% (see orange bars). This was computed by comparing ambient conditions (wind farms operating in perfect conditions with no wake effects) with actual conditions, while including cross-border wake effects induced by Dutch wind farms on German wind farms and further on Danish wind farms due to the main wind speed directions.
Spreading out the wind farms inside each of the EEZs reduces their power density and can achieve a smaller FLH reduction of 19% in the region (grey bars in Figure 2.3). This finding should be regarded as the theoretical limit for wake loss mitigation without cross-border collaboration, since it is constrained by other maritime interests that occupy space in the sea. For Germany, the mitigation limit is equal to 21% (or -26% relative to the base case) - a figure which has been confirmed by previous analyses4
Acknowledging that the theoretical reduction potential cannot be achieved in real conditions, the analysis estimates that the equivalent of 8 to 9 GW of offshore wind capacity could be saved from wake losses when deploying wind farms in a more coordinated manner in this region.
For comparison, this figure is equivalent to Belgium’s entire future domestic offshore wind capacity In other words, by developing the same total offshore wind farm capacity in that region, and by carefully spacing out and organising each of the wind farms across the sea, more electricity could be produced with almost the same investment and asset needs. However, this approach will impact other spatial assignments for maritime activities; the latter is one of many parameters that should be considered as parties come together to discuss the future of offshore wind development.
VALIDATING OUR FINDINGS WITH EXISTING ANALYSES
The German results are backed up by previous studies. Analyses undertaken by Fraunhofer Institute for Wind Energy Systems (IWES) confirm that increasing installed capacities in the lead-up to 2050 means that the average FLH in those regions are likely going to be reduced to at least 3,600 (see Figure 2.4 for illustration)6 These effects are highly sensitive to other (foreign) wind farms in the main wind direction (e.g. Dutch wind farms next to German ones), the available space for refreshment and the time of installation. Moreover, the Fraunhofer IWES simulations confirm that spreading out the turbines inside the German EEZ and so reducing the power density in this region could help to mitigate these losses by up to 26%. Again, this finding needs to be regarded as a theoretical limit, since spatial planning constraints will not allow for a perfect spreading out of wind farms.
Dutch capacities are not further optimised in this simulation
A displacement of offshore wind farms from Germany to Denmark could further raise the percentage by which wake losses could be mitigated in this region. Doing so would require strong cross-border cooperation related to the construction of wind farms; the results demonstrate that this could lead to lead to a 16% decrease in the average amount of FLH losses in the region (see blue bars on the right-hand side of Figure 2.3). In other words, cross-border collaboration and the spreading out of wind farms therefore carry the potential to decrease FLH reductions from 23% to 16%. Even in this best case scenario, wake losses will occur. Smarter approaches to the planning of wind farms will only reduce (but not eliminate) their impact.
In some locations, losses could increase by up to 27% compared with today
Scenario which includes 66 GW of offshore wind in Germany and some Dutch wind farms in the Dutch EEZ to the southwest of the German EEZ Simulation results by Fraunhofer IWES for Germany confirmed by Agora Energiewende and Max Planck Institute
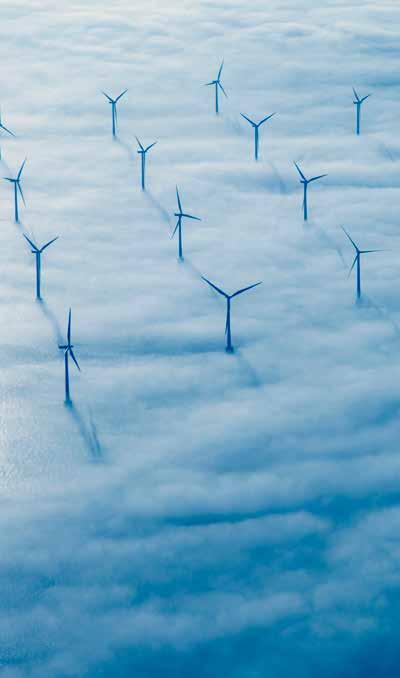
4. Fraunhofer IWES (2023). ‘Weiterentwicklung der Rahmenbedingungen zur Planung von Windenergieanla-gen auf See und Netzanbindungssystemen’, https://doi.org/10.24406/publica-2202 (last accessed on 18/09/24)
5. Belgian Government (2023). Draft update of the Belgian National Energy and Climate Plan 2023, https://www.nationalenergyclimateplan.be/ec-courtesy-translation-be-necp-draft-update.pdf (last accessed on 18/09/24) 6. Fraunhofer IWES (2022). ‘Offshore Flächenpotenziale: Analyse der Energieerzeugungseffizienz in der deutschen AWZ‘. https://bwo-offshorewind.de/uberarbeitete-flachenpotenzialstudie-des-fraunhofer-iwes/ & Fraunhofer IWES (2024). Ad-Hoc Analyse: Ertragsmodellierung der Ausbauszenarien 16 bis 21‘, Adhoc_Analyse_Ertragsmodellg_22_23.pdf (bsh.de)
REDUCTION IN AVERAGE FLH IN GERMAN EEZ WITH LARGER INSTALLED WIND FARM CAPACITIES FIGURE 2.4
II. THE CO-USE OF MARITIME SPACE –THE MISSING LINK IN THE OFFSHORE GRID
DETERMINING THE LOCATION OF FUTURE INFRASTRUCTURE IN THE SEA WILL BE CHALLENGING
Offshore wind development requires massive amounts of infrastructure to be built and placed in offshore locations amidst already intensively managed marine areas. The map in Figure 2.5 depicts how future wind farms will compete for space with other existing maritime activities such as shipping, national defence or conservation.
Previous studies like ENTSO-E’s first Offshore Network Development Plan (ONDP, published in January 2024) point to the emergence of a wide range of transmission needs (relating to radial connections that link wind farms to shore or connections which integrate wind farms into hybrid interconnectors and multi-terminal hubs). The 2024 ONDP translates these needs into a figure in kilometres, outlining that more than 40,000 km of cable routes will be required in the Baltic and North seas alone
These transmission corridors will inevitably cross other maritime activities. In many cases, detours around forbidden areas will also lead to an increase in cable corridor lengths for certain projects. However, this will heavily depend on the priority that offshore infrastructure will be given in future compared with other maritime activities. To ensure that countries and wind farms are connected together in the most efficient manner, it is crucial for maritime spatial planning (MSP, see Information Box 9) to be coordinated across borders.
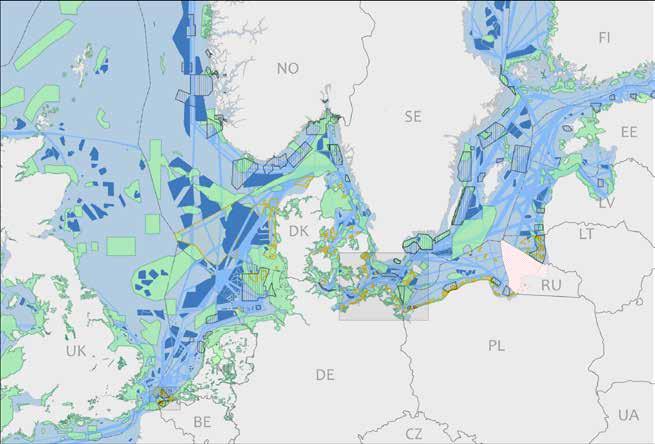

WHAT IS MARITIME SPATIAL PLANNING?
Maritime spatial planning (MSP) is a public process that spatially and temporally distributes human activities across marine areas. MSP is employed to manage the increasing demand for maritime space from traditional and emerging sectors while preserving marine ecosystems. MSP often involves plans, permits, and administrative decisions that determine the distribution of existing and future activities across marine waters. MSP therefore helps to reduce friction between sectors, encourages investment, leads to increased cross-border cooperation, and helps to protect the environment. It also helps to raise awareness of important maritime issues and produces systematic data and information.
In Europe, MSP is part of the Integrated Maritime Policy of the EU, which aims to support the sustainable development of sea- and ocean-based activities. The EU MSP Directive(1)
lists the minimum requirements for maritime spatial plans, including land-sea interactions, an ecosystembased approach, stakeholder involvement and the use of the best available data. The Directive encourages Member States to cover energy sectors at sea; maritime transport; fisheries and aquaculture sectors; and the preservation, protection, and improvement of the environment in their plans.
Germany and Belgium have, since 2009 and 2012 respectively, established a solid foundation in spatial planning that involves looped interactive processes. Their approaches include the development of clear visions and objectives; the analysis of existing and future conditions and potential conflicts; the development of solutions; and the drafting, implementation, evaluation and adaptation of their plans.
Timeline of European MSP process
Promoting nature-inclusive design and a focus on enhancing the desired environmental impacts can substantially contribute to the ‘nature friendliness’ of offshore wind infrastructure. Applying a systemic approach, including stateof-the-art knowledge in the nature conservation field and forward-thinking design, can both reduce the ecological footprint of projects and positively contribute to the marine environment.

Degraer Visiting Professor at Ghent University and coordinator at Royal Belgian Institute of Natural Sciences
MARITIME SPATIAL PLANNING AS A KEY INGREDIENT FOR THE FUTURE OFFSHORE GRID
Anticipating different marine interests at an early stage can de-risk the development of offshore projects while taking into account a range of considerations such as the conservation of nature or the bundling of cable corridors to avoid the emergence of a ‘spaghetti-like’ grid in the sea.
While this has become common practice inside the EEZs of some countries (e.g. in Belgium or Germany), adopting a holistic view of maritime activities across entire sea basins has only recently begun to gain momentum. Steps have slowly started to be taken regarding the coordination of planning across borders which include the consideration of spatial planning constraints8
In line with this trend, an analysis aimed at assessing the impact of diverging priorities in maritime spatial planning on the use of future offshore infrastructure was conducted.
GIS ANALYSIS FOR THE CONNECTION OF WIND FARMS UNDER TWO DIFFERENT SPATIAL PLANNING PRIORITIES
Let’s shape the future of offshore construction by embracing natureinclusive design from the very start. Our oceans need champions who work with (and not against) the marine ecosystem. Be an ambassador for sustainable innovation. Together, we can create solutions that benefit both industry and nature, ensuring a thriving blue economy and resilient marine life.

Opstaele Chief Executive Officer, Blue Cluster
A ‘business as usual’ case was compared with an alternative ‘nature first’ scenario in order to explore how diverging spatial planning priorities would impact connection types and cable corridors of the (hypothetical) wind farms in the year 2050. The same data was used for both scenarios, except for the weighting of spatial constraints in the sea.
Whilst the ‘business as usual’ case replicates a typical planning regime from 2024, the ‘nature first’ scenario prioritises natural conservation areas over the other considerations (while still taking into account other constraints such as military or shipping activities). As a result, the total length of required cable corridors and their spatial footprint was calculated. Note that the calculations and results of this assessment are hypothetical and only cover geographical considerations – they do not include operational simulations of the (onshore) power system or markets. They are meant to illustrate the effect that different spatial planning regimes and priorities may have on the shape of the future offshore grid. Information Box 10 summarises how this analysis was carried out.
For the purpose of this analysis, the GIS model by Fliegner and Möst was used and expanded upon in collaboration with the FfE research institute. It was used to assess all expected future wind farms that are due to be established between 2030 and 2050, considering either their shortest possible connection to their home countries or their connection to foreign countries via cross-border radial connections or hybrid interconnectors. The assessment was carried out with a routing engine that proposed cable corridors based on a penalty cost approach (applying the analytical hierarchy process methodology) . These costs were then calibrated to two scenarios and a trade-off for the optimiser was enforced: it could either cross a designated area with high penalty costs or take a longer detour with higher cable investment costs.
The optimisation was carried out in one go for the final buildout and assumed standard 2 GW HVDC transmission systems and respective costs as found in the TYNDP 2024. The model perimeter covered the entire Baltic and North Sea region. The offshore wind expansion target for each country was enforced as well as a balanced landing of power at the points of connection (POC) along the shorelines. Sea bed conditions were not monitored, but the extra effort for routing through deep waters was considered.
8. The Esbjerg Cooperation (2023). ‘Expert paper on transforming the North Sea into Europe’s green power plant’, https://offshore.amprion.net/Offshore-Vernetzung/ Expert-Paper-I_EsbjergCooperation_042023.pdf (last accessed on 18/09/24)


Steven

TRADE-OFF BETWEEN REDUCED FOOTPRINTS AND CO-USE
The spatial footprints (i.e. cable corridor placements and area crossings) depicted for both scenarios exhibit visible differences. When comparing all of the crossings through natural conservation areas (without distinguishing between national parks, marine protected areas or Natura 2000 areas) between the ‘business as usual’ and ‘nature first’ scenario, the total distance of such crossings decreases by 50% in the second (see Figure 6). This was achieved via two measures: the optimiser either bundled the remaining transmission corridors even more together, i.e. by routing more cables along a common trajectory, or the wind farms were connected to different onshore points to avoid cables from crossing through dedicated areas such as military areas.
Whilst Figure 2.6 is intended as an example only, it singles out two important attention points for the offshore grid of the future. Firstly, sustainability targets can be taken into consideration in the construction of infrastructure at an early stage; and secondly, there will be inherent path dependencies in the development of the next offshore
projects. Once a cable is placed along the sea bed, it makes sense to bundle the next cable with it. This therefore means that an anticipatory approach must be adopted for project planning. This approach will involve considering each project in the context of further projects in the years to come in order to efficiently assign maritime space to different activities.
Moreover, given the limited available space, especially in the Belgian and German EEZs, future maritime approaches are likely to move from single-use approaches to multi-activity uses to satisfy all needs. Examples from the Blue Cluster and Alfred Wegener Institute (see Information Box 11) illustrate how offshore infrastructure can have positive impacts on the maritime environment while satisfying an economic or energy-related objective at the same time. Ultimately, these use cases will, in conjunction with a holistic sea basin approach, allow sustainability targets to be aligned with Europe’s many economic interests and energy needs in future
EFFECT OF DIFFERENT MSP PRIORITIES ON CABLE LENGTHS
The second element that was investigated via this geographical analysis is the impact on future cable corridor lengths. The simulation results demonstrate that for individual projects, cable corridor lengths can differ significantly depending on the chosen connection scenario (‘business as usual’ vs. ‘nature first’). For example, the maps in Figure 2.7 indicate that the ‘business as usual’ scenario involves rather straight corridors for connecting wind farms to the shore, while the ‘nature first’ scenario results in longer detours.
The spatial constraints mean that the optimiser was forced to make a trade-off: it either had to choose longer routes around dedicated areas which involve higher asset investment costs or shorter routes that involve lower CAPEX costs but higher penalty costs that represent the extra work needed to compensate for or reduce the impact of an additional cable
route in a dedicated area. Note that this trade-off is difficult to monetise up front across entire sea basins. The results of this analysis should therefore only be seen as a demonstration of what different spatial priorities could lead to in terms of the shape of future offshore infrastructure.
One example of the extra work needed could be an avoidance measure such as the 2K criterion (see Information Box 12) for subsea cables. The extra shielding for cables required by the 2K criterion increases their installation costs. Higher costs can also arise due to the need for compensation, or substitution measures.
These are summarised in Information Box 12 alongside an example of a compensation measure that is being undertaken by 50Hertz in the Baltic Sea.
While differences in cable routes between the two scenarios can be significant when considered on an individual project level, these differences cancel each other out when considered from a wider perspective (see Figure 2.8). The total cable corridor lengths for the ‘business as usual’ and ‘nature first’ scenarios differ by a margin of 1,000 km, which is equivalent to a 2% difference given the total corridor length of more than 50,000 km. This effect is also driven by the fact that it is even more beneficial to connect offshore infrastructure to a separate onshore connection point in cases where the required detours or extra compensation efforts were too big for the optimiser in the analysis.
This finding supports the importance of a coordinated planning approach that encompasses whole sea basin areas at a time, as part of which optimal routes are established for entire regions, rather than on a project-by-project basis.

MULTI-USE APPROACHES IN THE DEVELOPMENT OF OFFSHORE WIND FARMS
SUSTAINABLY PRODUCED FOOD FROM AQUATIC ORGANISMS
The challenge
Coastal areas globally are experiencing significant influence from human activities, leading to an increased demand for space and use as well as a potential impact on marine ecosystems(1) The German North Sea in particular is a good example of a diverse and intense use of the marine realm, hampering the further expansion of activities(2) However, the sustainable growth of the blue economy requires the marine space to be used efficiently and innovative solutions for capturing emissions.(3)
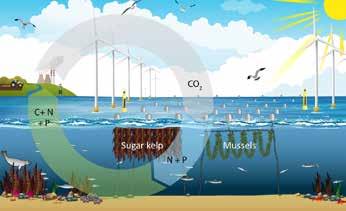
A proposed solution
One approach is the synergy of human activities, such as combining offshore wind farms with low-trophic aquaculture (LTA) - species that extract their feed and nutrients from the water column without being fed. This multi-use strategy is emission-free, provides nutritious seafood, and delivers ecosystem services by absorbing CO and nutrients, such as ammonium, nitrate, and phosphate(4) AWI scientists have been advancing this multi-use concept for over two decades. Their work includes growing LTA species like mussels, oysters, and macroalgae, developing robust technologies and innovative system design, resolving stakeholder conflicts, drafting financial plans for commercial implementation, defining the legal framework, and crafting political strategies for implementation(5)
Related projects


(1). Halpern BS, et al. (2015) Spatial and temporal changes in cumulative human impacts on the world’s ocean. Nature communications 6(1): 1-7, https://doi.org/10.1038/ ncomms861 (last accessed on 27/09/24)
(2). Buck BH, Langan R (2017) Aquaculture Perspective of Multi-Use Sites in the Open Ocean: The Untapped Potential for Marine Resources in the Anthropocene (Eds.). Springer. ISBN(1): 978-3-319-51157-3 ISBN(2) 978-3-319-51159-7 (eBook). 404 p., https://doi.org/10.1007/978-3-319-51159-7 (last accessed on 27/09/24) (3). Rayner R, et al. (2019) Ocean Observing and the Blue Economy. Frontiers in Marine Science 6 (4). Maar M, et al. (2023) Multi-use of ocean space: Integration of offshore wind farms with low-trophic aquaculture shows great potential to support the global sustainability goals. Nature Communications Earth & Environment 4: 447, https://doi.org/10.1038/s43247-023-01116-6 (last accessed on 27/09/24) (5). Buck BH, et al. (2017) Offshore and Multi-Use Aquaculture with Extractive Species: Seaweeds and Bivalves. In: Buck BH, Langan R (Eds.) Aquaculture perspective of multiuse sites in the open ocean: The untapped potential for marine resources in the Anthropocene, ISBN(1): 978-3-319-51157-3 – ISBN(2) 978-3-319-51159-7 (eBook). 23-69 (6). Buck BH, et al. (2024) Resolving the term “offshore aquaculture” by decoupling “exposed” and “distance from the coast”. Frontiers in Aquaculture, Front. Aquac. 3:1428056 (7). Lien E, Fredheim A (2002) Development of longtube mussel systems for cultivation of mussels (Mytilus edulis). In: Bridger CJ, Reid TH, editors. Open Ocean Aquaculture IV, Symposium Program and Book of Abstracts June 17-20, 2001 St. Andrews, NB, Canada.: Mississippi-Alabama Sea Grant Consortium, Ocean Springs, MS. MASGP-01-006; p. 137-41 (8). Heasman KG, et al. (2021) New system design for the cultivation of extractive species at exposed sites -Part 1: System design, deployment and first response to high-energy environments. Applied Ocean Research 110: 102603, https://doi.org/10.1016/j.apor.2021.102603 (last accessed on 27/09/24)
(9). Landmann J, et al. (2021) A new system design for the cultivation of extractive species at exposed sites Part 2: Experimental modelling in waves and currents. Applied Ocean Research 113: 102749
Implementation is underway
One site in the open ocean where this concept has been applied is the ‘Meerwind Süd/Ost’ located in the German EEZ north of the island of Helgoland. Here, AWI scientists are collaborating with international researchers in EU projects (OLAMUR, Novafoodies, MUSES) to develop technologies that can withstand harsh offshore conditions comprising wind, waves and currents(6) Until now, two different structures have been installed for the cultivation of mussels, oysters and sea lettuce. The site uses innovative cultivation structures, such as a modified SmartFarm device: a commercially available system adapted for harsh open ocean aquaculture that can be further submerged during storms to avoid the strong surface movements. Another system uses the Shellfish Tower, a farming unit designed for oysters and macroalgae(7)(8)(9)
These multi-use concepts support the production of sustainably cultivated marine organisms, reducing Germany’s dependence on imports, ensuring food security as per FAO guidelines, and ensuring alignment with at least seven UN sustainability goals.

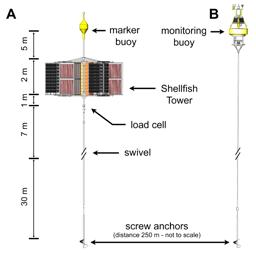


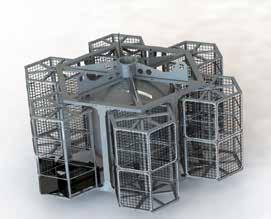
SUSTAINABLE MARITIME INFRASTRUCTURE
AN ECOSYSTEM APPROACH AND NATURE-INCLUSIVE DESIGN
The Blue Cluster’s ecosystem approach integrates marine ecosystem considerations into sea-based economic activities such as essential services like water purification, food provision, and coastal protection. A healthy marine ecosystem is vital for a sustainable blue economy. Essential energy infrastructure can act as a catalyst for restoring and promoting marine ecosystems. Advocating for a systemic approach, the Blue Cluster therefore views the seas and their human and natural functions as interconnected systems which contribute to the marine environment’s balance; the seas and human ambitions are viewed as a synergistic system.
Ecosystem-supporting approaches, such as nature-inclusive design (NID), can be implemented to enhance natural marine environments. Measures and approaches of this kind are aimed at reducing the ecological footprint of offshore infrastructure and boosting biodiversity during both the construction and operation phases of different projects.
Elia Transmission Belgium has adopted an NID approach to the development of the Princess Elisabeth Island, meaning that the very design of the island will foster biodiversity and encourage marine life to flourish around it. Over the course of six workshops held throughout 2022, Elia set up a co-creation process with experts from 16 nature conservation and marine environment organisations, universities, consultancies and non-governmental organisations to develop an NID approach to the island. Together, they adopted six NID measures which will have a positive influence on the marine ecosystem around the island. Elia’s approach was awarded a Blue Innovation Swell Award during the Blue Innovation Awards 2024 which were hosted by the Blue Cluster.


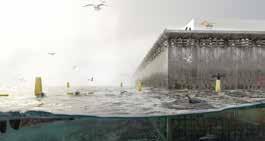
The Alfred Wegener Institute, Helmholtz Center for Polar and Marine Research (AWI) is a German research institute which specialises in the exploration of the polar regions and the seas surrounding them, as well as the North Sea and the German coastal regions. It covers many areas of the earth’s system from its atmosphere to the ocean floor in its research. Prof. Dr Bela H. Buck, AWI, Germany
OVERVIEW OF COMPENSATION MEASURES
2K CRITERION FOR SUBSEA CABLES
What is the 2K criterion?
Avoidance measure
Compensation measure
Avoidance principle: Significant adverse effects must be avoided as a matter of priority Noise protection, 2K criterion
Measure that compensates for the impact in a comparable way and where there is a close spatial connection between the impact site and the compensation site
Intrusion in a reef biotope → local compensation through a reef measure
Substitute measure
Monetary compensation
Avoidance measure
Coherence assurance measure
Avoidance measure
Measure that compensates for the impact in an equivalent manner with less of a spatial connection between the impact site and the compensation site, e.g. same natural area
Damage to a soft-bottom biotope → compensation through a reef measure
Dedicated payment for nature conservation and landscape management measures if the intervention can neither be avoided nor compensated for
Avoidance measure directly related to protected area; impairment of the habitat should be kept below the significance threshold
Part of an exemption procedure in case of significant expected impact on a target habitat; requirement for project authorisation despite adverse effects
Avoidance measure intending to reliably prevent a prohibition under species protection law
Ecology Function – temporally advanced compensation measure; projects can only be realised once measure is operational
Conservation Status - measure to ensure the conservation status of the species
German national regulatory framework
Amount of the payment is based on the average costs of the compensation measures that cannot be implemented
Restoration of the seabed to regenerate the affected habitat inside the protected area European protection measures for interventions in Natura2000 sites
Creation of a similar habitat outside the protected area setting and subsequent integration into Natura2000
protection for harbour porpoises
The 2K criterion was established by the German authorities as a precautionary measure to protect benthic life (organisims whch live in the water just above the sea bed) by limiting the warming of near-seabed environments in EEZs and coastal seas by submarine cables to a maximum of 2 kelvin.
Why is it being monitored?
HVDC transmission cables generate heat and electromagnetic fields during their operation. This can affect the metabolism of living organisms and change the composition of the soil biocoenosis in the sediment (i.e. the interacting organisms living together) which surrounds these subsea cable. The 2 kelvin boundary is based on the assumption that any warming of up to 2K is still considered tolerable in terms of its impact on benthic organisms, while any warming above 2K can have adverse effects on the latter.
Which actors must respect the 2K criterion?
In Germany, transmission system operators must take the 2K criterion into account throughout the tendering, construction and operation phases of a cable.
protection measures


CREATING AN ARTIFICIAL STONE REEF IN THE BALTIC SEA
In accordance with §15 of the BNatSchG (German Law on Nature Conservation and Landscape Management), unavoidable significant negative impacts on nature and landscapes must be offset by compensation or replacement measures.
Therefore, interventions in the German EEZ such as the installed subsea cable systems of Ostwind 1 (OST1-1, OST-1-2 and OST-1-3, which connect the Arkona and Wikinger offshore wind farms to the grid) and the subsea cable systems of Ostwind 2 (OST-2-1, OST-2-2 and OST-2-3 which are the Arcadis Ost 1 and Baltic Eagle grid connections) must be compensated for via the creation of artificial stone reefs.
The selected areas for the implementation of these compensation measures are located on the western flank of Rønnebank, to the southwest of Arkona and within its 500-metre-wide protection corridor. They can be divided into two zones – “West” (west) and “Ost” (east) – and stretch across a combined area of 34 ha. Approximately 12.6 ha of this are suitable for the reef-building measures identified in the preliminary studies. The boundaries of surrounding nature reserves, submarine cables, shipping lanes and the Arkona wind farm were considered as part of this.
The actual execution of the project will begin with the installation of geogenic hard substrates on the seabed, with the aim of creating a near-natural reef as a habitat for numerous animal species. This will be achieved by placing natural boulders of various sizes on the seabed.
Nordic boulders (‘erratic blocks’) will be used, as they are found in the distribution area of the glaciers of the Ice Age in this region.
The measures are due to be installed from October 2024 onwards.
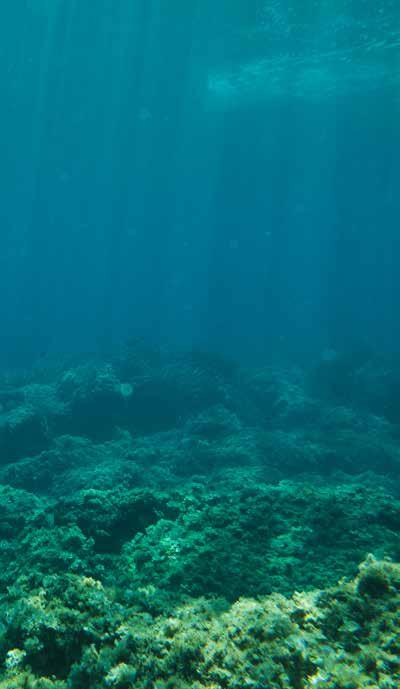
Schematic heat dissipation around a sea cable
Offshore energy is a key element for decarbonising the energy system. The associated strong expansion targets for offshore wind energy highlight the importance of planning and cooperation between countries to achieve a robust offshore energy system which is wellintegrated into the mainland, to get the electricity where it is needed.

Dr Serafin von Roon Managing Director, FfE
VALIDATION OF FINDINGS
The findings related to total cable corridor lengths are intended as indicative values only. While such measures serve as a good first estimation of the necessary future work, the grid’s layout (including the function and design of offshore platforms and onshore landing points) was greatly simplified in the analysis. The findings were compared to the calculated cable lengths of ENTSO-E’s ONDP. In comparison with the ONDP total for the North Sea and Baltic Sea, the analysis reveals longer corridors. This can be explained by the higher level of detail that was adopted for this study (as part of which spatial routing was performed; it was intentionally not undertaken for the ONDP). The increases in corridor lengths are commonly around 20%, which corresponds to these calculations10
Moreover, this analysis neglects the potential challenges that will accompany the operation of the future offshore grid. Whilst this study assumes that HVDC standard transmission systems are aligned with current trends in offshore wind development, the level of interoperability and operational feasibility that a highly interconnected grid of wind farms and countries will involve has not yet been reached. For a deeper exploration of this topic, refer to Information Box 13 on failure detections as well as Information Box 14 on HVDC technology and offshore system operation.
The identification of an optimal level of redundancy for the future offshore grid is also important. Whilst the failure rates of offshore assets such as cables or wind farms are rather low, the impact of failures can be significant, given the fact that response times for offshore maintenance settings are longer (see Information Box 13 on the pinpointing of cable failures). In addition, the rising number of offshore wind farms will likely be accompanied by an increased concentration of power infeed into onshore grid connection points.
While the GIS analysis did not assess the operational implications of failures and a rising concentration of infeed, the results can provide an indication of what an additional level of resilience for the offshore grid would mean if the latter were to be achieved differently, with a higher level of redundancy. The ‘business as usual’ scenario reflects the current planning principle of grouping subsea cable corridors where possible and connecting wind farms to the
shore via one transmission system only (i.e. not applying the n-1 criterion of the onshore grid, where at least one redundant connection must be achieved at all times). Using a ‘high resilience level’ sensitivity for this scenario, wind farms whose connections to the shore crossed through areas with a lot of other cables were assigned a second corridor connection to shore. This mimicked a hypothetical planning regime in which cable bundling is no longer the paramount objective: redundancy and resilience carry some weight too. In this scenario, the extra cabling needed amounts to 16%, as outlined in Figure 2.9.
This result should facilitate future discussions about where protected areas need to be avoided and where the sharing of space with other marine activities should be chosen. Refer to information box 15 by the World Wide Fund for Nature for their view on this topic.
IMPROVING CABLE FAILURE DETECTION THROUGH PRECISE PINPOINTING
The failure rate of subsea AC/DC cables is rather low. However, when a defect does occur, its repair entails enormous costs and long downtimes, which threaten the stability of the grid and (in severe cases) even resource adequacy. The anticipated grid expansion in the North Sea and Baltic Sea will require many more kilometres of submarine cables to be installed, thereby increasing the overall risk of cable failures.
At present, there is no standardised procedure for localising failures in the AC/DC subsea cables that are used. Elia Group therefore aims to establish a technique that will allow maintenance staff to precisely pinpoint the location of failures, saving money and reducing downtime. Its pinpointing project is currently investigating different technologies that could be used to accelerate the location of failures along subsea cables.
An example of how pinpointing could be made more efficient involves the combination of existing pinpointing techniques with recent advancements in remotely operated vehicle (ROV) technology.
Pinpointing with ROV- or towfish-mounted hydrophone and electromagnetic sensors
Different faults require different pinpointing techniques. It is not always easy to predict which technique will perform better in different situations. Combining multiple techniques with one ROV therefore seems to be an excellent way of performing all tests at the same time, so reducing their complexity and maximising learning. One example of this could involve mounting a hydrophone and electromagnetic sensors onto a towfish. The benefits of such a solution would be the ability to dive underwater with a simple device; being very close to the cable; and the carrying of several types of sensors at the same time, allowing several measurements to be taken at once.
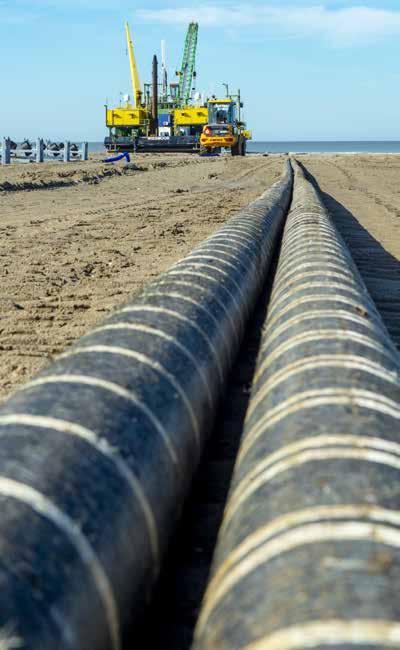
HVDC TECHNOLOGY IS A KEY ENABLER FOR OFFSHORE WIND
CURRENT AND FUTURE CHANGES
▶ HVDC is (in many cases) the only viable solution for connecting large offshore wind farms or onshore grids across large distances. While AC infrastructure will still remain an important technology for projects which are close to the shore, DC infrastructure will facilitate offshore integration and the development of new interconnectors.
▶ Point-to-point HVDC projects are well understood, and more are currently being constructed. Multiterminal approaches are the next big step in system development. Mastering multi-vendor approaches are necessary for achieving the full potential of cross-border collaboration and avoiding a lock-in from single suppliers.
▶ Interoperability will be key for ensuring a safe integration of DC infrastructure and allowing multivendor systems, both within DC components and between AC and DC systems.
▶ Standards are key for ensuring the compatibility of products made by different vendors, accelerating the delivery of projects and allowing simplified future extensions.
▶ Previous and ongoing DC projects have been undertaken across strong grids with minimal interaction risks; risks will steadily increase with future DC projects, increasing integration challenges.
▶ Simulation techniques to de-risk projects are being performed by vendors for their systems, but the integration between systems is not being addressed.
▶ The fact that lots of different systems are being integrated near each other is making our future grid more complex, meaning that the need for simulation is even more critical.
▶ Current optimisers which are used to operate our grid are limited to point-to-point systems. On a broader scale, we’re exploring DC grid optimisers (software for the grid) as a promising approach.
Elia Group is a member of several working groups which are focused on co-creating the future of HVDC. HVDC technology is not yet its full potential.


station Converter station
Interoperability between DC components. Standards play a critical role in this. Integration of systems on the AC side.
systems need to be compatible with each other.
OFFSHORE SYSTEM OPERATION
ELIA GROUP MOONSHOT 1.0 – OPTIMISER
Modular software to operate new offshore assets with capabilities that will be developed over time both internally and externally
▶ To reach Europe’s offshore objectives, increasingly complex assets such as energy island(s) and hybrid interconnectors will be built
▶ These assets cannot be operated via static models or via entirely manual approaches
▶ Digital tools that can be used by the operator to support automation and decision-making therefore need to be developed
▶ Combine increased grid complexity with technology and digital tools
▶ Make use of artificial intelligence and machine learning
▶ Modular approach → reusability for increased efficiency embedded in future modular control centre system
▶ Collaborative approach with internal and external teams Why?
▶ Dynamic optimiser based on real-time data and predictive planning engine → optimising flow, voltage and capacity
▶ Maximising the use of asset capacities (RES generation, forecasts, outages, market behaviour,...
Germany is in a crucial phase of its energy transition. To address the climate and biodiversity crises, we need to accelerate the nature-friendly deployment of renewable energies and rapidly phase out fossil fuels. Protecting and restoring our marine ecosystems is just as important since nature is our biggest ally when it comes to mitigating the consequences of climate change.

STATEMENT FROM WWF REGARDING WIND ENERGY AND MARINE PROTECTION
Climate protection is marine protection –and vice versa
Germany is in a crucial phase of its energy transition. Carbon dioxide (CO2 emissions must be reduced significantly by 2030 to curb the consequences of the climate crisis for people and nature. Swift action is needed to protect our children and grandchildren as per the ruling of Germany’s Federal Constitutional Court in 2021.
To succeed, we need to expand renewable energies and rapidly phase out fossil fuels. We must increase energy efficiency and ensure that investments benefit the transition instead of delaying it. It is also essential to protect and restore our ecosystems – such as our oceans.
The International Tribunal for the Law of the Sea confirmed that CO is polluting the oceans and that governments are obliged to increase their efforts to reduce emissions to protect both climate and marine ecosystems. Our oceans have already absorbed a large proportion of human-made temperature increases. As a result, their capacity to function as a buffer against the climate crisis is being increasingly impaired. The oceans suffer from excessive amounts of CO2 in the atmosphere.
We must care for our oceans’ limits
Measures to address the climate and biodiversity crises need to be developed hand in hand. The expansion of offshore wind energy is crucial for achieving Germany’s transition to a fully renewable electricity system by 2035. At the same time, healthy oceans are vital for global oxygen production. Healthy fish populations contribute to food security and healthy seagrass meadows are important carbon sinks and protect our coasts from extreme weather events caused by climate change.
The deployment of offshore wind energy is occurring in an ecosystem that has already been weakened by many human interventions. There are plans for further industrial and infrastructural development. However, our oceans are under a lot of strain: they are overheated, noisy, overfished, very busy, full of plastic and harmful substances. They lack oxygen and full intact habitats. The scale of these human interventions is causing a rapid loss of marine biodiversity. Over the next twenty years, around a quarter of Germany’s EEZ will be used for the deployment of wind turbines. It is therefore paramount that offshore expansion takes place in an environmentally friendly way.
Over-exploitation is a serious problem
Offshore wind energyis often the subject of heated debates in which climate and marine protection are pitted against each other – a phenomenon that benefits neither our ecosystems nor the energy transition. The root cause is over-exploitation caused by numerous large-scale human interventions in the oceans.
The rules for these interventions are defined through many national and international legal regimes. However, these regulations are not coordinated effectively. Undoubtedly, it a better approach to coordination must be adopted to monitor the cumulative extent of the impacts. Ultimately, the question is: what can and must our oceans cope with, and where do we need to define limits?
We need space for wind energy in the sea since an energy system based on renewables mitigates the harmful impacts of the climate crisis to people and nature. However, the massive deployment of wind turbines also requires strict environmental standards for planning, approval, and construction procedures. While we need to drastically accelerate the deployment of renewables, we must not lose sight of this. The rushed implementation of the Renewable Energy Directive (RED III) is one example
of how environmental standards are being weakened without speeding up the development of offshore wind energy. The regulation exempts projects in so-called acceleration areas from the environmental impact assessment and the species assessments – even though they are well-integrated into the planning and permitting procedures and deliver important environmental data. Even some project developers have publicly spoken out in favour of maintaining environmental standards.
Reducing harmful activities creates space for what is necessary
Just as the carrying capacity of our oceans is limited, maritime space is also finite. Therefore cross-border cooperation and ecosystem-wide spatial planning will be even more important in the future. In parallel, we must drastically reduce existing harmful activities: subsidies must no longer contribute to overfishing and we need fair agreements with third countries to promote sustainable fishing.
The North Sea is highly frequented by ships and the noise stemming from this traffic is a stress factor for many marine species. It impairs, for instance, the echolocation of harbour porpoises. In addition, oil and gas extraction has a devastating effect on both our oceans and our climate and must be phased out urgently. However, when it comes to liquefied natural gas (LNG), we are currently observing the opposite in Germany. Instead of moving away from fossil fuels, the country has invested in oversized LNG infrastructure that was built precipitately while being exempted from environmental assessments.
Protecting and restoring habitats, ecosystems and species is vital

In addition, Germany plans to store CO in the oceans through carbon capture and storage (CCS). Instead of restricting the use of CCS to unabated emissions, Germany’s carbon management strategy paves the way for using CCS in gas plants. This could lead to new path dependencies that keep fossil fuels in the energy system and harm the oceans’ ecosystem services. Against this background, the debates on deep-sea mining should be viewed highly critically. There are undoubtedly more environmentally friendly strategies, namely using alternative materials and establishing a circular economy based on the principle of reduce, reuse, recycle.
It is not only the reduction of harmful interventions in the marine environment that can contribute to a more environmentally friendly deployment of offshore wind energy. The tender design also carries opportunities for this. Germany’s Federal Maritime and Hydrographic Agency (BSH) collects large amounts of data through the pre-investigation of areas. The findings can be factored in to improve the deployment of wind turbines. In tenders, so-called qualitative criteria can be used to implement social and ecological standards. Ultimately, only the company that demonstrates compliance with these criteria will be able to build a wind farm. In addition, the financial resources from the components for marine conservation and sustainable fishing must be secured and specifically designated to improve our oceans’ environmental status.
Nevertheless, more action is needed to ensure that the oceans can recover. In line with the Montreal Agreement, at least 30 percent of the world’s marine areas must be protected by 2030. Half of these areas must then be free from human activities. Moreover, CO2 sinks such as seagrass meadows must be restored. Finally, by establishing green infrastructure, a network of protected habitats and areas, it will become possible to address climate change and safeguard marine biodiversity as well as the oceans’ ecosystem services that are crucial to humans.
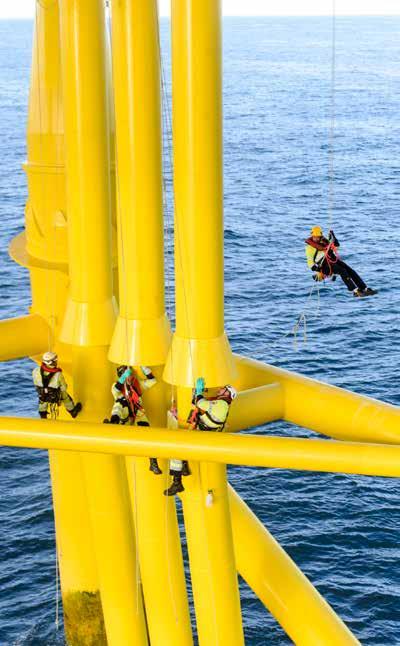
III. SUPPLY CHAINS
The previous sections demonstrate the importance of longterm cross-border planning to achieve a realistic view of the shape of the future offshore grid – in other words, where wind farms will be placed and how they can be connected together and to our shores. This section assesses the implications of this planning on the required asset stack, including materials, and considers these with regard to manufacturing capabilities.
This section outlines how offshore wind farms are being connected to each other and different countries via increasingly complex transmission systems that employ cutting-edge technology for platforms, cables, and their operation. Achieving these connections must involve
international cooperation, since their supply chain spreads across many countries – which is both efficient and challenging. Two challenging areas exist in relation to this: the supply of raw materials and the fact that it needs to be expanded; and the manufacturing and logistics capacities of large and smaller subcontracting firms.
This section concludes by highlighting that, despite all of these inherent challenges, Europe is facing the opportunity to capitalise on its know-how and technological leadership in the (offshore) wind sector and is facing a clear opportunity to stimulate economic growth via employment creation in the sector over the next few decades.
MAIN BUILDING BLOCKS STANDING IN THE WAY OF OFFSHORE WIND FARM AND GRID INFRASTRUCTURE DEVELOPMENT
The harvesting of wind power from marine environments requires the use of a range of special components and heavy assets. Figure 2.10 provides an overview of the main building blocks and materials required to generate the electricity via a turbine, bundle this together at an offshore station and transport it to shore via subsea cables. Offshore wind turbines are very similar to their onshore counterparts. They consist of towers, nacelles, and blades. However, their foundations are different, since they need to be firmly installed on the seabed. Additionally, they require a special coating as protection against corrosion in the salty air. The many wind turbines belonging to one offshore wind farm are connected to their central offshore platform via inter-array cables. This platform collects the wind power that the turbines generate and exports it back to shore. The platform either hosts an AC substation or a DC converter station, depending on whether the generated electricity will be transported back to shore via HVAC cables, or if it needs to be transported across a longer distance via HVDC cables. Once it reaches the shore, the electricity then passes through an onshore AC substation or DC converter station again, before being injected into the onshore grid.

Carina Brehm Vice President Strategy for
The offshore wind industry in Europe presents a tremendous opportunity for all stakeholders involved. In recent months, we have seen an increasing focus on the grid connection in particular. Leveraging the established presence in Europe, we expect further investments in the grid supply chain to enhance the execution capabilities and ensure the realization of the vast offshore potential.
MAIN BUILDING BLOCKS
MATERIALS FOR OFFSHORE WIND FARMS
INFRASTRUCTURE
PROJECT LIFE CYCLES
Offshore wind farm and grid infrastructure projects are long-term, complex undertakings that carry significant lead times of up to 10 years (between the planning phase and their commercial operation). Each project involves a number of phases that range from their design and development through to their manufacturing, installation, operation and maintenance, and decommissioning (see Figure 2.11). The design and planning phases require TSOs to collaborate with regulatory and governmental authorities,
offshore wind developers, suppliers, and, where applicable, third party investors. Once the project initiation phase has been completed and the tenders for different parts of each project have been awarded, manufacturing begins. From the installation of the infrastructure onwards, having access to sufficient port infrastructure is key. Furthermore, highly specialised vessels for the transport and heavy lifting of assets and cable laying are required to build the foundations of a wind farm, install its turbines, mount the topsides of its
platforms, and install its transmission cables. After a wind farm’s commissioning, operation and maintenance activities have to be carried out in a structured and reliable manner. At the same time, unexpected events can mean rapid response teams need to be called upon to manage unplanned faults and carry out unexpected maintenance work. When the end of an asset’s lifetime is reached, its decommissioning begins (see Information Box 16 on decommissioning work in Belgium).
BUILDING BRIDGES FOR SUSTAINABLE DECOMMISSIONING
COLLABORATIVE EFFORTS BEING UNDERTAKEN BY BELGIUM’S OFFSHORE WIND SECTOR
▶ The knowledge required for offshore wind turbine decommissioning is often scattered among various experts. There is a need for a unified and sustainable decommissioning strategy that minimises its environmental impact and maximises opportunities for reuse and recycling. Result
▶ We will eventually develop a unified decommissioning plan for Belgium enhanced by a knowledge compendium and a digital simulation tool. This plan will serve as the cornerstone for strategic policy decisions and the efficient, optimised, and sustainable decommissioning of the industry.
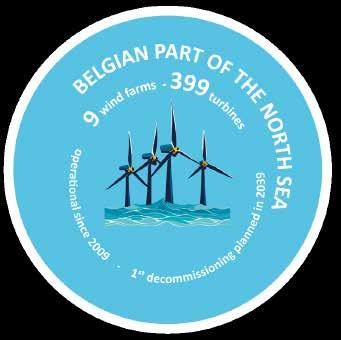


POM West-Vlaanderen is a provincial agency with a passion for entrepreneurs. Together with our partners, we aim to make West Flanders a province where businesses can grow sustainably. Rebecca Verhaeghe, POM West-Vlaanderen, Belgium
We need offshore wind energy in order to achieve the climate targets set for Germany and Europe. By 2050, more than 300 gigawatts of offshore wind energy will be installed in the North Sea, a large proportion of which will be in Germany. Thanks to the stable wind conditions at sea, Germany will have access to a reliable supply of climate-friendly electricity - which we will consume across borders. For this plan to work, we need a smart political framework and the necessary infrastructure, such as ports.

One recurring question that emerges in any national, European or global discussion related to supply chains is whether or not local value creation should be prioritised over imports. Although Europe is dependent on raw material imports, European suppliers exist for almost all of the important offshore wind asset components which are present in current markets. Mature offshore wind sectors exist in the UK, Denmark and Germany, which are vanguards in the sector. Other markets like Belgium and the Netherlands have followed suit. Today, a new wave of European countries which are undertaking their first offshore wind projects is emerging (such as the Baltic States, Poland
and Greece). In order to fulfil Europe’s offshore ambitions, mature and emerging markets must complement each other. Evidence from existing projects is demonstrating that this is already happening. Several players from many different countries are already working together to realise single offshore projects, as demonstrated by the Arcadis Ost 1 project in Germany and Princess Elisabeth Island project in Belgium (see Figure 2.12 and Figure 2.13). While these are only snapshots of individual projects, they serve as a good illustration of how global and European cooperation, alongside local specialisation, are needed for the efficient buildout of offshore wind infrastructure.
As part of 50Hertz’s Arcadis Ost 1 project in the Baltic Sea, the components were manufactured across the continent as illustrated in Figure 2.12. The components of Elia’s Princess Elisabeth Island are also being sourced from multiple countries and partners (see Figure 2.13). While the elements of the offshore wind farms that will be connected to the island have not yet been defined, the export cables for the island are being sourced from South Korea - highlighting the importance of globally interconnected supply chains for offshore wind development.
Future projects are also expected to rely on international cooperation, with supply chains becoming even more global. The section that follows and Information Box 17 by the German Energy Agency explore the challenges that today’s offshore wind supply chains are facing and the steps which must be achieved to fulfil Europe’s ambitious goals.
OVERVIEW OF SUPPLY CHAIN LOCATIONS WHICH FORM PART OF BELGIUM’S PRINCESS ELISABETH ISLAND PROJECT IN THE NORTH SEA
Gas-insulated switchgear (GIS) 220 kV from Siemens in Berlin, Germany
offshore platform built by Steelwind in Nordnham, Germany
Offshore wind energy will be a central cornerstone of the future energy system. The turbine and grid technology manufacturers and suppliers of engineering equipment in Europe are ready to deliver on the ambitious expansion. For this to succeed, political objectives must lead to a reliable project pipeline. This is only possible if the right energy and industrial policy impulses are intertwined and project implementation is a political priority.

cables inside the wind farm built by JDR in Hartlepool, UK Blades for the V174 9,5 MW
Non-exhaustive information provided for illustrative purposes.
laying ship “Ndurance”
the Netherlands Heavy lift crane (‘Gulliver’) lifted the platform, operated by DEME, Belgium
The wind turbines were assembled in Rønne (Bornholm, Denmark) before they were shipped out to sea and installed as a single piece (nacelles and blades attached) on top of the towers
The topside steel enclosure for the offshore platform was produced in Gdańsk, Poland. The transition piece that lies between the monopile and topside was manufactured in Gdynia.
Position of the Ostwind 2 area with the Arcadis Ost wind farm
AC Power transformers and shunt reactors built by Smit Transformers in Nijmegen, the Netherlands
Construction yard for the AC offshore modules located in the Netherlands
The caissons for the artificial island are being manufactured by the Belgian consortium TM Edison (DEME & Jan de Nul)
Cable laying ship with cables from Hellenic Cable by DEME and from LS Cable by Jan de Nul, Belgium
Position of MOG 2 area with energy island
Gas-insulated switchgear (GIS) 66 kV from General Electric in Aix-Les-Bains, France
AC power transformers built by Siemens in Zagreb, Croatia
AC export cables built by Hellenic Cables in Loutraki, Greece
Elements of offshore wind farms not yet defined
AC export cables from LS Cable & System in Donghae, South Korea
llustrative and non-exhaustive information for the HVAC-part of the Island. Information about HVDC parts and wind turbines is not yet available
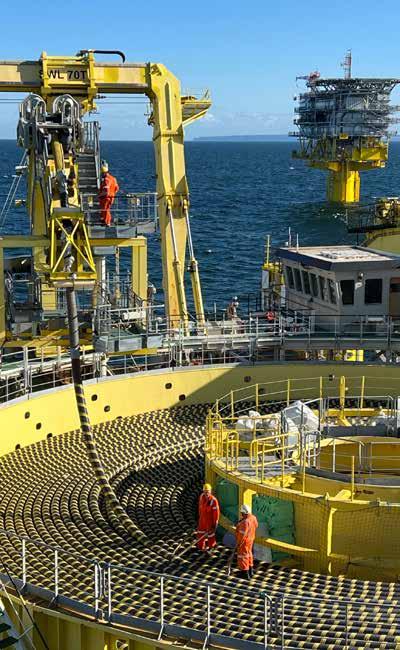
Dr Dennis Rendschmidt Managing Director
Mechanical & Plant Engineering Association VDMA Power Systems
Stefan Thimm Managing Director, Federal Association for Windenergy Offshore e.V., BWO OVERVIEW OF SUPPLY CHAIN LOCATIONS WHICH FORM PART OF THE 50HERTZ ARCADIS OST 1 PROJECT IN THE BALTIC SEA
turbines built by Vestas in Newport, UK
operated by Boskalis,
FIGURE 2.13
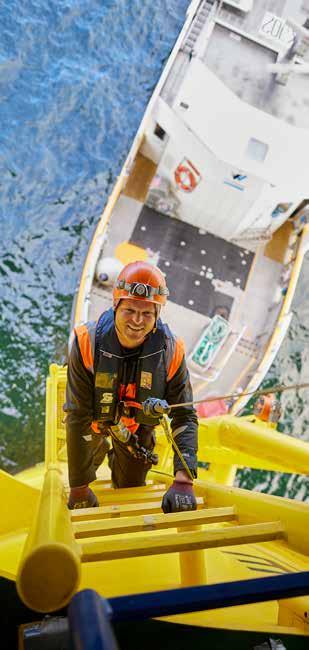
SUPPLY CHAIN AND MANUFACTURING CHALLENGES (1/2)
A contribution from:

CHALLENGE I: RAW MATERIAL SUPPLIES
Meeting the ambitious offshore wind targets requires addressing a diverse set of barriers. Potential bottlenecks include, a shortage of skilled workers needed for the timely construction and operation of infrastructure, a lack of necessary port infrastructure and installation vessels, regulatory and demand-side uncertainties, and delays due to lengthy planning and permitting procedures. The German Energy Agency (dena) addresses these challenges via a variety of projects and studies. In addition, a topic of primary concern that is being is addressing is European production capacities and supply chain vulnerabilities related to components for offshore wind turbines and grid infrastructure.
Supply chains for offshore wind turbines and grid infrastructure are complex and globalised, which makes them vulnerable to a wide range of risks, such as geopolitical tensions, natural disasters, dumping practices, tariffs and trade barriers, or armed conflict.
European turbine and grid manufacturers are dependent on raw materials and components that are often sourced from outside the EU and, at times, only from a few suppliers. High single-source dependencies exist, for instance, for the rare earths dysprosium and neodymium, which are needed to produce permanent magnets for generators and are primarily sourced from China. Other strong dependencies on single countries exist for magnesium (China) or bauxite (Guinea). Both are vital for the production of steel and aluminium, which are mainly used for mainly used for wind turbine bases, transition pieces, secondary structures and towers, and (in the case of aluminium) inter-array and export cables.
To lessen high single-source dependencies and ensure that political offshore ambitions will be met, a fast ramp-up of overall manufacturing capacity is needed. Retaining and expanding these capacities for turbines and grid components within the EU and diversifying sources of key materials and components are important steps in this regard. Furthermore, this will strengthen European resilience, preserve know-how regarding key technologies needed for the energy transition, and create and secure valuable domestic jobs.
Although the wind power industry in Europe is growing, it is not yet strong enough to supply the equipment needed to reach the ambitious political targets. As the energy transition is a time-sensitive undertaking, it is necessary to quickly expand manufacturing capacities for offshore wind turbines and grids. To achieve this, a number of challenges need to be addressed, e.g.:
▶ demand uncertainty;
▶ the highly competitive business environments for new production facilities;
▶ the limited access to finance;
▶ the long duration of permitting procedures for grid connections;
▶ the complex transportation and logistical arrangements related to material components.
For a closer look at raw material needs for the offshore grid, an analysis was carried out on the basis of ENTSO-E’s 2024 ONDP11 It is one of the first documents to provide a comprehensive overview of the specific grid asset needs which must be met to provide the offshore wind transmission infrastructure of tomorrow. Even though some uncertainties remain regarding the ONDP’s input data and its corresponding results, the document has helped to increase transparency about Europe’s asset needs in the lead-up to 2050.
This analysis was split into three steps. Since it is difficult to predict the exact raw material requirements for DC circuit breakers, the ONDP scenario without DC circuit breakers was selected for the calculations undertaken in this study. Building on this approach, the quantified grid asset needs and predicted offshore wind capacity based on the ONDP were used to calculate the raw material needs for the main components. This led to being able to predict the expected increase in demand for raw materials compared with today. As part of a next step, current supply chain capacities were compared with the forecasted ONDP asset needs in the lead-up to 2050.
WHAT ARE THE ASSET NEEDS?
As explained previously, building an offshore wind farm and its corresponding grid connection requires many different asset types. The ONDP provides a high-level overview of the infrastructure needs and related components for such projects (see Figure 2.14). The ONDP is based on non-binding agreements related to offshore goals from January 2023 onwards that have been signed by Member States. Transmission equipment needs cover both radial links and offshore hybrid transmission infrastructure.
The ONDP and analysis carried out for this study (outlined in previous chapters) lead to the conclusion that around 450-500 GW offshore wind could be built in Europe (EU + UK + Norway) in the lead-up to 2050. This number was used as basis to calculate the raw materials for the offshore wind farms. According to the ONDP, connecting these capacities
will require almost 50,000 km of subsea cable corridors and several hundred onshore and offshore converter stations as well as offshore AC substations before 2050. As stated above, uncertainties regarding the ONDP input data and the corresponding results remain. These numbers do not include inter-array cable needs or other interconnector projects that will be built. However, the results from the GIS analysis in this study’s previous chapter predict that around 50,000 km of cable corridors will indeed be needed, so backing the results of the ONDP.

A robust and reliable legal framework is essential for the expansion of Europe’s offshore wind energy and grid infrastructure. Strengthening the supply chain now can prevent future bottlenecks and help us to reach our ambitious offshore wind targets. Philine Wedell Team Lead renewable energies, German Energy Agency (dena)
Offshore capacity GW
450-500 Offshore converster stations
172
Offshore AC substations
137 Onshore converter stations
167
Subsea cable routes (in km)
48,292
HOW DO ASSET NEEDS TRANSLATE INTO RAW MATERIAL NEEDS?
This study’s analysis went one step further by translating asset needs into raw material needs, which then led to clear numbers for raw material needs. This additional step increases transparency and hints at dependencies with other sectors (e.g. solar PV or storage) and potential bottlenecks. Furthermore, to complete the picture, based on the asset need calculated from the ONDP results, the overall necessary increase in demand for the different raw materials was calculated compared with today. The predicted amounts of material tonnage needed to build offshore wind turbines and their associated grid infrastructure in the lead-up to 2050 are displayed in Figure 15.
Figure 15 demonstrates that steel will be most in demand in the lead-up to 2050. While steel is used for core parts of the construction of offshore platforms and equipment, the biggest steel demand originates from the components of wind turbines like nacelles, tower, and foundations. The need for approximately 60 million metric tonnes of steel can be put into perspective by comparing this figure to the existing oil and gas infrastructure in the North Sea and Baltic Sea. This infrastructure, of which steel forms a large part, currently comprises over 1,000 platforms of various shapes and sizes as well as over 45,000 km of pipelines for the transport of gas and oil transport12 Using publicly available geodata relating to common diameters and thicknesses of these pipelines, it is possible to estimate that the total steel tonnage of the pipeline network today (without the platforms) amounts to over 50 million metric tonnes of steel13 Considering that the vast majority of these assets was built over a period of 25 to 30 years14 installing almost 60 million tonnes of steel over the next 25 years will be challenging – but is possible.
As outlined in Figure 2.15, copper will be the second most in-demand material. Unlike steel, copper is mainly needed to produce the cables that are used to connect offshore wind farms to shore. Polymers are used for a wide range of purposes in the manufacturing of cables, turbines and platforms (eg. isolation and coating). Fibreglass is mainly used as part of the manufacture of blades. Other important raw materials include cast iron (used in nacelles), zinc (needed as coating for offshore erosion protection), aluminium (in cables and wind turbines), manganese (as a steel component), and rare earth metals15 Need for the latter heavily depends on the type of offshore turbines being constructed and whether they include a gearbox or not. As part of the analysis carried out for this study, a mix of gearbox and direct drive turbines was considered, each with permanent magnet synchronous generators. The direct drive turbines rely quite significantly on rare earth metals.
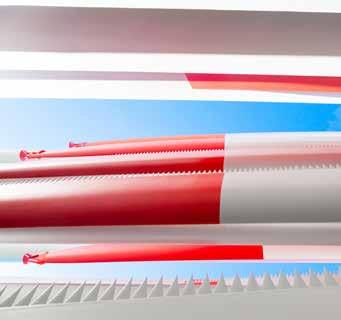
Raw material
Demand Increase relative to 2022 Criticality ranking(1) Comments
Steel and Iron 8x ▶ Global supply is large
High recycling rates Copper 8x
▶ Global demand increase, mining shortages ▶ High import dependency
▶ Other sectors will require a lot as well (Solar PV, storage, grid) Fibreglass
▶ Global supply is large but price uncertainty increases
▶ Global supply is large and diverse
▶ Global supply is large and diverse
▶ Global demand increase, but rising recycling rates
▶ Strong import dependency (China)
▶ Other sectors will require a lot as well (Solar PV)
Manganese 5x
Nickel 5x
Rare earth metals 8x
▶ Global supply is large and diverse
▶ Shortages already exist currently
▶ Russia is significant supplier
▶ Other sectors will require a lot as well (storage)
▶ Extreme import dependency (China)
▶ Larger shares of direct drive nacelles lead to increased shortages not significant medium substantial
(1) Based on an assessment of reliability of supply (diversity of suppliers, origin of materials, resilience of Europe against disruptions), affordability (price, fluctuations and diversity of offers) and overall importance for the sector relative to the demand increase.”
Table 2.1 outlines how the total demand for key materials will change in 2050 compared with today’s levels. Naturally, raw material needs will heavily increase alongside the strong increase in offshore wind development. This will mainly be driven by the construction of wind turbines, followed by the construction of cables and offshore platforms.
However, this rise in demand does not indicate how challenging it will be to meet it. Whilst steel shortages are not expected in the short term, the situation regarding copper and aluminium is more critical, partly because of a stark increase in the demand for these materials from other sectors, and partly due to a strong import dependency. The same applies for nickel, which is already experiencing supply
shortages. Supplies of rare earth metals are also critical, with Europe having an almost 100% import dependency on China16
Whilst Europe has a high level of dependency regarding its raw materials supplies, the material intensity per GW of connected offshore wind was reduced in the past. The Joined Research Center (JRC) calculated the following for historical capacity doublings (i.e. 100% more generation capacity, from 2 to 4 MW turbines): a 13% increase for steel and polymer; a 6% decreas for aluminum and copper, and a 30% decrease for glass/carbon composites17 Along with improved recycling means and longer wind farm operational lifetimes (e.g. stretching their lifetimes beyond 25 years) this material intensity can be further reduced18
Additionally, substitutions for some materials are possible. According to the same report by the JRC, traditional steel is already being increasingly replaced by high-strength steel, which reduces the material’s intensity to support the same level of strength in wind turbine towers, for example. Moreover, the use of aluminium and carbon fibre will increase in future to reduce mechanical forces and weight in turbines or to replace copper conductors in cables. Also, rare earth metals for permanent magnets can be replaced by smarium-cobald or strontium-iron combinations. However, both carry higher costs and lower levels of efficiency, which increases material needs for stronger support structures on other parts. Also, copper can be replaced by aluminium, for example in transformers in the nacelles or in the towers, which also reduces costs but decreases physical stability and increases component fatigue.
Another means of moderating the material demand and stress in the supply chain for offshore wind farms is a higher degree of standardisation for wind turbine sizes and parts. This could simplify the manufacturing process and reduce risks for investments19 Also, logistics for transportation and installation could be adapted more effectively for a larger number of projects as less specialised crane ships would be needed for instance. Ultimately, this is an optimisation challenge, where expected energy yield, material intensity and logistical challenges are only some of the parameters that need to be balanced out20
16. Consolidated insights from: Rystad Energy (2023). ‘The State of the European Wind Energy Supply Chain’, https://windeurope.org/intelligence-platform/product/the-state-of-the-european-wind-energy-supply-chain/ (last accessed on 18/09/24) and further internal analyses carried out by Elia Group
17. Carrara et al. (2020). ‘Raw materials demand for wind and solar PV technologies in the transition towards a decarbonised energy system’, https://doi.org/10.2760/160859
18. Chen Li et al. (2022). ‘Future material requirements for global sustainable offshore wind energy development’, https://doi.org/10.1016/j.rser.2022.112603
19. Fostering the the standardisation of key grid components to lower their cost, accelerate their deployment and increase manufacturer output by encouraging economies of scale and interoperability is also seen as a key lever in the following: Mario Draghi (2024). ‘The future of European competitiveness’, https://commission.europa.eu/topics/strengthening-european-competitiveness/eu-competitiveness-looking-ahead_en (last accessed on 20/09/24)
20. Refer to the trade association ‘NedZero’ for more information: https://www.nedzero.nl/en/news/the-north-seas-standard-enable-growth-with-wind-turbine-standardization#0
CHALLENGE II: MANUFACTURING
CAPACITIES FOR MAIN ASSET GROUPS
Europe is one of the leading offshore wind markets in the world. As Europe’s demand for raw materials increases in line with the pace and number of offshore wind projects, so its manufacturing capacity will need to increase. Table 2.1 provides an overview of three important asset classes that need to be traced.
As of today, Europe’s current offshore wind turbine manufacturing capacity amounts to 8-9 GW per year21 However, the annual need for offshore wind turbine installations in Europe between 2030 and 2050 will amount to at least 18 GW per year. While parts of this demand may well be satisfied by non-European factories, this gap illustrates the challenge that lies ahead.
In terms of HVDC cables, the current European production capacity of about 4,000 km per year needs to be upscaled to be able to meet the average annual demand for cables between 2030 and 2050. Depending on the technical design of future HVDC transmission systems, this demand will rise to between 5,000 to 7,500 km per year. Standardised 2 GW 525 kV HVDC cable systems can consist of up to 3 cables that need to be installed (they comprise two pole cables and one metallic return). A project with a corridor length of around 200 km will therefore require a total cable length of up to 600 km. In addition to this, the number of projects will be frontloaded, with annual demand peaks of up to 9,000 km before and after the year 2030. Another complex challenge is linked to the logistics for large HVDC cables. Given their size, storing them in larger quantities over longer periods is logistically challenging. The production and installation of cables therefore needs to be properly planned and organised since stocking up on manufactured cables ahead of time is not an option. Moreover, production capacities will not necessarily exclusively being used for European projects, since offshore projects are being accelerated across the globe.
Data: WindEurope, and Elia Group calculations
(1) for a point-to-point HVDC connection for a wind farm, two converters are required; in addition, for offshore converters, the jacket manufacturing capacity is another bottleneck
(2) Depending on the installed capacity until 2030 the demand can increase to more than 20 GW annually
(3) Depending on the technical design (metallic return or not)
These numbers also do not cover inter-array cable needs or other interconnector projects that will be built. A positive trend towards higher production capacities overall could be that other global manufacturers are also increasing their presence in the European market, leading to a more diverse manufacturer landscape and higher production capacities.
Another even more striking challenge exists in terms of the production capacities of onshore and offshore HVDC converter stations. European needs between 2030 to 2050 for these will reach approximately 20 GW per year. This is several times higher than the available production capacities in Europe today, considering that the current speed of project delivery is about 3-4 projects per year, leading to a capacity of around 6-8 GW. Additionally, shipyards which are able to manufacture the spacious platforms to host such converters are also scarce. Just like for cables or wind farms, some of this demand may well be satisfied by non-European suppliers in the future. However, it should be noted that converters in particular will be a critical grid element for the reliable
future operation of offshore infrastructure. These are also referred to as ‘active’ grid elements since they actively steer and influence power flows across connected lines. Their operation and reliability are therefore of particular relevance for the security of Europe’s power grid. Not all international manufacturers will be able to fulfil the technical and operational requirements needed to qualify as suppliers in Europe.
Beyond mere material and manufacturing needs, supply chains are subject to further risks. These relate to the availability of highly specialised vessels for different purposes such as cable laying, the installation of foundations and the installation of turbines (especially for large turbines with capacities above 12 MW). Moreover, crane ships that can lift heavy offshore platform topsides that weigh more than 15 kt are scarce and their manufacturers are facing increasing competition from international suppliers. Spatial needs in harbours for handling these large assets in an efficient manner are also increasing22

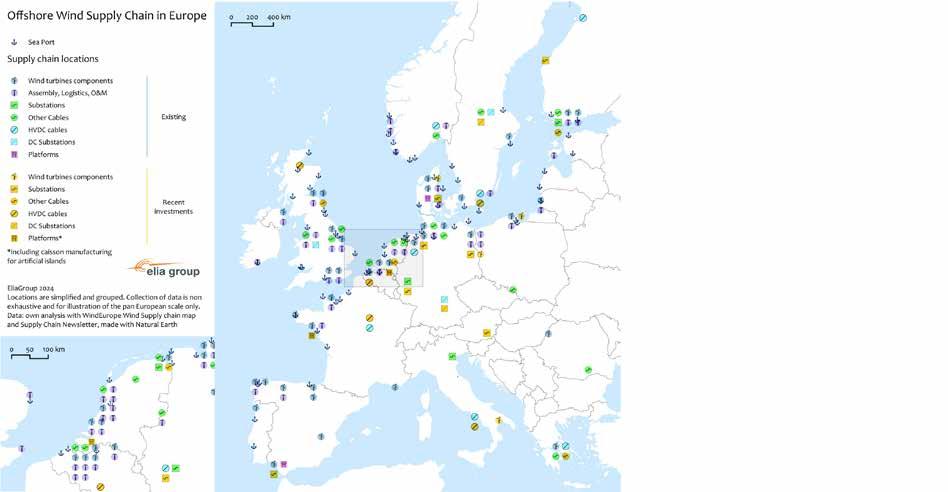
As can be seen from this stock-taking huge supply chain challenges exist in terms of meeting Europe’s offshore wind ambitions and integrating higher levels of offshore capacity into the grid. Beyond the mere demand for raw materials and assets, challenges regarding high levels of inflation and commodity prices, slow and complex permitting processes, the financing of new factories and increased pressure from international competitors also exist (please see Information Box 18 for a statement from the German Offshore Wind
Energy Foundation). In response to these challenges, the European Commission launched the Wind Power Package in 2023. This aims to accelerate (offshore) wind energy development in Europe and strengthen the competitiveness of European wind energy manufacturing.
The map in Figure 2.16 illustrates how the effects of this package are already emerging. Indeed, in recent months, investments have been made in upscaling vital supply chain
Offshore wind is one of the key elements for Belgium’s industrial decarbonisation, but unlocking its full potential requires innovation both in product & service development as well as in manufacturing. We urge governments to make innovation central to industrial policy, ensuring offshore wind not only helps to meet climate targets but also fosters sustainable growth and technological leadership for the entire Belgian value chain.
parts across the continent. As indicated by the yellow icons in the figure, transmission infrastructure in particular is experiencing a development boost: HVDC converters and HVDC cable manufacturing sites, which have remained very limited in number until now, are being expanded. Other investments being made in grid infrastructure cover new capacities for AC cables (such as inter-array cables) and AC substations. Also, shipyards are being geared up to be able to produce and assemble the required offshore platforms, or - as is the case for Belgium’s Princess Elisabeth Islandthe manufacturing of caissons. Ultimately, the manufacture of wind turbines is being scaled up across the value chain (foundations, towers, nacelles, blades).
One notable factor as part of this development is that investments are being undertaken in both established markets and existing sites, as well as emerging offshore development regions such as Scotland, Greece or Italy. Poland is a particular example of this trend. Recently, the suppliers of various offshore wind turbine components such as blades, nacelles and towers announced that they would be expanding their activities and announced the establishment of new manufacturing sites both in Szczecin and Gdańsk. By 2040, Poland wants to install 18 GW of offshore wind capacity. With no offshore wind capacity currently installed off the coast of Poland, this marks a new trend in the region that illustrates how offshore wind can boost local economies and create new jobs.
EXISTING AND FUTURE SUPPLY CHAIN LOCATIONS FOR OFFSHORE WIND AND OFFSHORE GRID ASSETS IN EUROPE FIGURE 2.16
Pieter-Jan Provoost Director, Energy Technology Club, Agoria
THE OFFSHORE WIND DEVELOPMENT INDUSTRY AS AN OPPORTUNITY FOR EUROPEAN JOB CREATION
Offshore wind supply chains hold a great amount of potential in terms of the creation of new jobs, economic growth and local European value creation, since scaling up manufacturing capacities will not be possible without scaling up Europe’s workforce. Educating and finding highly skilled staff will also be challenging. In 2022, the wind energy industry counted 300,000 jobs in the EU with the number of people employed in the industry having remained stable over the last few years23 This included workers in the onshore and offshore wind sector. Building a 2 GW offshore wind farm requires approximately 35,000 full-time equivalents (FTEs)24 Figure 2.17 outlines that more than 50% of FTEs are required for manufacturing the components. Almost 30% of FTEs are involved in operation and maintenance activities, whilst another 10% of FTEs are involved in the installation of assets. The upfront and final steps of the project life cycle (design and development; and decommissioning) require a comparably small FTE percentage (1% and 4% respectively) of the total workforce to build a 2 GW offshore wind farm25
Given that the historic pace of installation for offshore wind farms in Europe has been 3-5 GW per year (with a current increase towards 8-9 GW per year), this corresponds to 87,000 FTEs currently being used to support offshore development. This number is also supported by the Ostend Offshore Renewable Industry Declaration from 202325 Still, as previously demonstrated, reaching Europe’s 496 GW target (EU27 + NO + UK) requires an annual installation rate of at least 18 GW to be reached from 2030 onwards. If
23. WindEurope (2023). ‘Wind energy and the economy’, https://windeurope.org/ intelligence-platform/product/wind-energy-and-the-economy/ (last accessed on 18/09/24)
24. Global Wind Energy Council (2021). ‘Wind Power and Green Recovery.’ gwec. net/wp-content/uploads/2021/04/Jobs-Note-April-2021-2.pdf (last accessed on 18/09/24)
25. Ostend Offshore Renewable Industry Declaration (2023). 20230424-OffshoreRenewable-Industry-Declaration.pdf (windeurope.org) (last accessed on 18/09/24)
26. This will require a new European skills policy as layed out by Mario Draghi (2024). ‘The future of European competitiveness’, https://commission.europa. eu/topics/strengthening-european-competitiveness/eu-competitivenesslooking-ahead_en (last accessed on 20/09/24), or the establishment of a European Offshore Academy as mentioned in the Offshore TSO Collaboration expert paper II: https://issuu.com/eliagroup/docs/expert_paper_ii_offshore_tso_ collaboration?fr=sYzY1YzczMzM1NTc
all project components are provided by European supply chains, this translates into a job creation potential of 300,000 new full-time jobs (c.f. Figure 2.18)26
At the same time, it is clear that transparency regarding European offshore grid asset needs and job creation potentials alone will not convince manufacturers to upscale their production capacities. Instead, tangible steps will need to be taken by national and European policymakers to overcome the analysed challenges of this chapter and transform the positive elements into project deliveries (see Information Box 19 (part II) by the German Energy Agency). Following a recent statement by the German Offshore Wind Energy Foundation, this must include small and mediumsized manufacturers as they make an indispensable contribution to the entire offshore wind supply chain (see Information Box 18 for a statement by the German Offshore Wind Energy Foundation).

The Offshore Wind Energy supply chain (in Germany) has suffered severely due to poor political decisionmaking in the past. It is crucial now that the German government sets up a coherent financing strategy that supplements efforts at a European level to address the various needs and situation of the industry segments. This will enable companies to invest, scale-up and create value, jobs, and the much-needed production for achieving Europe’s offshore wind targets.
TAILORED FINANCING INSTRUMENTS FOR THE OFFSHORE ENERGY TRANSITION
WHAT IS NEEDED TO FOSTER INVESTMENTS IN THE SUPPLY CHAIN
Observation
▶ Unprecedented amounts of wind farms will need to be installed by the 2030s
▶ Main parts of the supply chain are made up of SMEs and are facing problems to invest in the upscaling of services and manufacturing capacities
▶ Current financing regime and increased project sizes exacerbate the challenge
from:
Measures for a holistic financing strategy of the supply chain
Amend the KfW programme with a properly quipped corporate financing facility
Establish a programme for hybrid capital and for KfW guarantees towards commercial banks to secure the risks of larger projects
Adjustment of the federal government’s guarantee programme and, if necessary, the KfW instruments to include contract fulfilment guarantees
Find out more
Mummert
SUPPLY CHAIN AND MANUFACTURING CHALLENGES (2/2)
For part one, please refer to information box 11.
RECENT POLITICAL DEVELOPMENTS
The latest legislative developments show a strengthened political commitment towards addressing the barriers on the way to reaching the new offshore wind targets. At the EU level, the European Wind Power Action Plan, published in October 2023, makes an important contribution to enhancing the competitiveness of European wind power manufacturers. In this, the European Commission defines actions that should be taken in 6 key areas: accelerating deployment; auction design; access to finance; a fair and competitive international environment; skills; industrial engagement; and Member State commitment.
The Net Zero Industry Act (NZIA) which was adopted in June 2024, aims to strengthen, amongst amongst other things, the European offshore wind industry by improving current practices. Its four pillars focus on:
▶ Regulatory environment and permitting processes
▶ Investments in and financing of net-zero industries
▶ Skills development
▶ Diversifying supply chains for critical raw materials
Notably, NZIA(1) requires EU countries to accelerate permit-granting processes for wind power and grid manufacturing projects. Furthermore, it formulates new rules for renewable energy auctions, asking public authorities to consider non-price criteria to a certain extent such as sustainability, resilience, cybersecurity, and other qualitative factors in tenders. Until March 2025, the European Commission will further specify these criteria in an implementing act.
Another relevant piece of legislation is the Critical Raw Materials Act (CRMA)(2) which entered into force in May 2024. The Act sets out benchmarks for the consumption of critical raw materials, underscoring the EU’s will to diversify primary sourcing. By 2030, at least 40% of the strategic critical raw materials consumed in the EU must be processed within the Union. Besides increasing domestic mining activities, CRMA establishes a recycling quota, requiring 25% of consumption to be derived from recycling. Furthermore, CRMA introduces a cap on imports, stating that no more than 65% of any strategic raw material shall be sourced from one single third country.
In addition to policy changes at the EU level, multilateral cooperation relating to offshore wind deployment has intensified, as the work of the North Sea Energy Cooperation (NSEC) or the Baltic Energy Market Interconnection Plan (BEMIP) shows.
POLICY RECOMMENDATIONS
The political actions described above are important elements for strengthening European manufacturers of offshore turbines and grid components, thereby increasing the chance of meeting offshore deployment targets. However, NZIA and CRMA, in parts, still have to be implemented by EU countries and prove their effectiveness accordingly. For example, implementation with regard to the auction design in national law is still. Generally, a thorough evaluation of these new regulations and possible adaptations in the future are recommended. Additionally, it is of utmost importance that the EU stays on course in terms of its commitment to the energy transition in the long run.
(1). European Parliament and Council (202). ‘Regulation (EU) 2024/1735 of the European Parliament and of the Council on establishing a framework of measures for strengthening Europe’s net-zero technology manufacturing ecosystem and amending Regulation (EU) 2018/1724’, URL (last accessed on 27/09/24) http://data. europa.eu/eli/reg/2024/1735/oj
(2). European Parliament and Council (2024). ‘Regulation (EU) 2024/1252 of the European parliament and of the Council establishing a framework for ensuring a secure and sustainable supply of critical raw materials and amending Regulations (EU) No 168/2013, (EU) 2018/858, (EU) 2018/1724 and (EU) 2019/1020’, URL (last accessed on 27/09/24) http://data.europa.eu/eli/reg/2024/1252/oj
(3). WindSeeG - Gesetz zur Entwicklung und Förderung der Windenergie auf See (gesetze-im-internet.de)
A contribution from:

The German Wind Energy at Sea Act recast (WindSeeG) (3) from 2023 can be seen as an important basis for offshore wind expansion. The increased number of auctions involves high volumes and participation rates. Besides accelerating planning and permitting procedures, speeding up the commissioning of grid connections, and increasing the number of areas to be tendered, the recast introduced new auctioning procedures, including non-price criteria for centrally pre-investigated sites. Additional points are awarded to bidders who (for example) secure a share of trainees and ensure a high proportion of renewable electricity in manufacturing wind turbines (WindSeeG § 53). Including further pre-qualification and award criteria in auctions in accordance with NZIA could be evaluated. However, to avoid excluding too many bidders at the beginning, initial entry barriers should be modest but increase over time. It is also important to ensure that the expansion of renewable energies is not hindered and that costs do not rise significantly.
Overall, to expand the domestic production of offshore turbines and grid infrastructure, it is fundamental to ensure high predictability and stability in the demand for offshore wind. This can be achieved by enhancing planning certainty, providing sufficient space at sea and streamlining approval procedures. The political targets set for the North Sea at the Ostend Summit in 2023 are certainly a step in the right direction. Therefore the NSEC tender planning provides transparency and as much visibility as possible on project demand. Now it is essential to deliver on these targets, e.g. by enabling the development of further bilateral and multilateral cooperation projects like Bornholm Energy Island. The next North Sea Summit in 2025, hosted by Germany, could be a key enabler in this regard and position the energy cooperation in the North Sea as a best practice example for other European sea basins.
KEEPING IT BANKABLE: SHARED COSTS AND RISKS FOR SHARED BENEFITS
The previous chapters of this study demonstrate how crucial offshore wind is for Europe’s current and future energy mix. Coordinated planning will be essential for maximising the societal benefits of offshore wind and deploying it in the most effective way possible. This chapter focuses on the challenge of raising sufficient financial resources for offshore wind projects and how their costs and benefits can be shared in such a way that the projects can actually be realised and the full benefits of offshore development (which are highlighted in this study) can materialise. No efficient and coordinated planning can take place without clear funding strategies in place, and vice versa. This chapter explores the essential nature of their relationship, and proposes the introduction of a framework and an Offshore Investment Bank, to address these challenges.
Offshore Investment Bank
Fund together what we plan together and plan together what we fund together
An efficient and coordinated approach to the planning of offshore wind projects goes hand in hand with their funding. Project contributors should participate in this planning process, with agreed upon plans being accompanied by a commitment to put the funding strategy into action. The Offshore Investment Bank will bring different funding sources together, such as EU funding, contributions from Member States and private investments.
Fair cost and benefit allocation
Offshore hybrid interconnector projects have distributional effects that extend beyond the borders of the countries that host them. A fair and adequate distribution of costs and benefits takes these into account. A multi-country approach that addresses a set of projects at the same time should should be facilitated. This includes all sea basin countries, and should be opened up to other countries participating in the process on a voluntary basis. Allocation rules must provide parties with longterm confidence whilst being flexible enough to adapt to unexpected changes in the market.
Efficient risk allocation and de-risking
The sea basin scope of the Offshore Investment Bank will allow for risks to be spread across different projects in the same sea basin.. However, further de-risking of projects will be key for raising investor confidence. Risks should be allocated to parties that are best equipped to manage them.
I. COLLABORATION IS KEY FOR UNLOCKING THE FULL VALUE OF OFFSHORE WIND IN EUROPE
The simulations outlined in Chapter 1 relating to the future European energy system demonstrate that, as it is transformed, an increasing number of cross-border electricity exchanges will occur. This is particularly true in the case of offshore wind energy, as there is an overall mismatch between the offshore renewable energy potential carried by each country and the actual demand in these countries (see Figure 3.1). As a consequence, countries with a limited amount of offshore renewable energy potential may be forced to over-exploit their domestic options, to the detriment of their production efficiency (see section on wake losses in Chapter 2). Alternatively, they may have to explore the possibility of connecting their grids to non-domestic offshore wind farms that are based in countries which carry vast amounts of offshore energy potential (see simulation results related to the effectiveness of cross-border cooperation across Europe in Chapter 1). This situation calls for new offshore grid solutions, such as hybrid interconnectors or the crossborder radial connection of wind farms to the shore, to be employed. However, these solutions are accompanied by new challenges related to the sharing of project costs, benefits and risks, since they no longer fall within a single market area, instead, they affect a larger number of countries and interested parties.
The key question underlying these new approaches is: how can coordinated planning and funding be set up to ensure the long-term, efficient development of offshore generation and transmission projects? The goal is to undertake offshore development in an optimal way, by adopting a European and holistic approach to projects, while avoiding the inefficiencies and barriers caused by the individual perspectives of different market areas – and recognising the
distributional effects of groups of projects on each individual country. Given the sheer size of the investments involved in such projects, maximising the use of and efficiently operating the infrastructure is necessary to ensure that the energy transition remains cost efficient. This means that artificial barriers that stand in the way of the operation of this infrastructure need to be tackled. Moreover, the remaining risks need to be efficiently allocated amongst the parties which are best equipped to manage them.

PRIORITISING INTERCONNECTORS THAT CAN DELIVER VALUE FOR EUROPE AS A WHOLE
The current approach to offshore development, which involves the bottom-up consolidation of individual interconnector projects and/or national plans, will not lead to an optimal buildout of the grid, as described in Chapter 1. To adopt an efficient approach to offshore development on a European level, we must move away from the current, individual approach to a more collaborative one. Part of this approach involves taking a holistic view of all projects in the same sea basin and their risks, benefits and costs (including the benefits for all countries located around the same sea basin). This approach will help to establish an efficient offshore grid. If this approach is adopted, TSOs located in the areas surrounding the sea basin will seek to jointly identify the projects which carry the highest amount of benefits based on the electricity demand and the offshore potential that each country carries. This will involve determining the value of each project for the European power sector and ensuring that the value they generate finds its way to investors and contributors
DISTRIBUTION OF EFFECTS ACROSS COUNTRIES AND ACROSS THE VALUE CHAIN
Hybrid interconnectors carry effects that extend far beyond the borders of their hosting countries (i.e. the countries which act as their landing points, as explained in Chapter 1).
They also have effects that surpass socioeconomic welfare benefits, such as the integration of RES into energy mixes and the bolstering of energy system adequacy. Recognising these effects is essential for ensuring that the value they generate finds its way to project investors and contributors.
At an individual project level, these effects can be either positive or negative, depending on a country’s RES balance, generation mix, and role in the European power sector (as a net importer or exporter of electricity). These effects will also be influenced by the future design and layout of offshore bidding zones (OBZs), which will impact the distribution of socioeconomic welfare and renewable energy. To ensure buy-in from all European partners, and ensure that the energy transition is efficient both in terms of the production of renewables and the buildout of the grid - these effects need to be recognised, and project costs and benefits need to be shared appropriately among all participants. This process should begin with balanced portfolios, meaning that participating countries will benefit from increased socioeconomic welfare thanks to the combined implementation of projects within the considered portfolios. The allocation of costs and benefits related to each set of projects is a key aspect in this regard, since this must ensure that all impacted countries contribute and benefit from the projects in a proportional manner.

Wessel Bakker Business Director Offshore Power Grids, Energy Systems at DNV
This study emphasizes the importance of close cooperation among member states in spatial and grid planning, financing, and governance of offshore projects. DNV views Europe’s power grid as a single, unified system. Collaborative planning, development, and the equitable sharing of costs and benefits are key to a successful and affordable energy transition.
3. Elia Group and Ørsted (2024). ‘Making Hybrids Happen – Enabling offshore hybrid projects
BARRIERS AND RISKS RELATED TO THE DEVELOPMENT OF HYBRID OFFSHORE GRIDS AND GENERATION ASSETS
Given the sheer size of the investments involved in offshore development, maximising the use of infrastructure and efficiently operating it is vital for ensuring that the energy transition is cost efficient. The efficient operation (from a dispatch point of view) of offshore (hybrid) interconnectors requires the development of an appropriate framework for both grid infrastructure and generation assets in order to also ensure that investments are made in them. An efficient market mechanism with the right design must form an integral part of this framework for both generation assets and grid infrastructure.
The development of grid infrastructure requires a longterm, stable regulatory environment, since grid projects (particularly offshore projects) have long lead times and (typically) involve long periods before returns on investment are made. Regarding the integration of offshore hybrid interconnectors into the grid, price coupling is an essential feature of optimal market arrangements, since this ensures that prices are set in an efficient and correct manner.
Removing this feature will result in the suboptimal operation of the market, creating additional artificial uncertainties that will influence investment decisions, and will thus hinder offshore development.
This issue is particularly challenging along the EU’s borders, since political agreements need to be reached with third countries; however, price coupling is the only market mechanism that can lead to the optimal development of an offshore grid in the North Sea (see Information Box 20). The efficient exchange of electricity across EU borders is further complicated by the Carbon Border Adjustment Mechanism (CBAM), as part of which certain risks arise during the setting of the value of embedded emissions (see Information Box 21).
BOX 20 RETURN TO PRICE COUPLING BETWEEN EU AND GB
Europe has set itself a binding commitment under the European Climate Law: it wants to become the first climate-neutral continent in the world. The new UK government has communicated similar ambitions, with the UK Prime Minister and Welsh First Minister stating that they wish to “make Britain a clean energy superpower” One crucial point that the EU and UK must address regarding their relationship relates to the adoption of more efficient electricity market arrangements between both areas. This will help to achieve renewable energy goals in the North Sea and will be key for investors seeking to invest in offshore generation and transmission infrastructure.
Following Brexit, Great Britain is no longer part of the European Internal Energy Market. Instead, the capacity of interconnectors that link the EU to GB is allocated using explicit capacity rights. However, this is a very inefficient mechanism for operating grid infrastructure – and hybrid interconnectors in particular. This regulatory and market barrier needs to be addressed in order to unlock the needed investments mentioned above.
An alternative solution, called Multi-Regional Loose Volume Coupling (MRLVC), is currently being investigated. This was identified in the Trade and Cooperation Agreement that was signed between the EU and UK, and was originally conceived of 15 years ago. It therefore doesn’t take into account recent offshore wind developments – particularly with regard to hybrid interconnectors. Even regarding simple cross-border interconnectors, it falls very short of supporting an efficient infrastructure buildout.
As long as electricity continues to be exchanged via the use of suboptimal market mechanisms, the EU and GB are at risk of falling short of their objective to fully develop the North Sea’s renewable potential. Without an assurance that the infrastructure will be used efficiently, critical investment in it may be shelved – or, even worse, cancelled. Price coupling is the only market mechanism that will be able to support the goal of harnessing the North Sea’s offshore potential.
CBAM AND HYBRID INTERCONNECTORS
The Carbon Border Adjustment Mechanism (CBAM) is part of the Fit for 55 Package It entered into force on 17 May 2023 and will be in a transitional phase until the end of 2025. It is meant as a complementary system to the EU Emission Trading Scheme (EU ETS) and is aimed at mitigating to the risk of carbon leakage. Its aim is to ensure equivalent carbon pricing for imports and domestic goods by requiring EU importers to purchase and surrender CBAM certificates to level out the difference in carbon price between the country of origin of the imported good and the EU. Currently, CBAM applies to cement, electricity, fertilisers, iron and steel, aluminum, and hydrogen. It is likely to cover other products in the future.
Electricity that is being exchanged through traditional and hybrid interconnectors with third countries is already subject to the CBAM regulation. Despite its intention to avoid carbon leakage, CBAM does have some unintended negative side effects, which require it to be revised The following points have been identified that could lead to several negative impacts on the 2050 objectives and on the electricity market:
▶ Offshore wind produced in the Member State EEZs is currently subject to CBAM and treated as carbon intensive energy. The reason is that the EEZs of EU Member States are not part of the Customs Territory of the Union (UCT) and thus are considered as a ‘third’ country. Therefore, CBAM applies to the green energy coming from the EEZs, even though this is produced within the EU and is intrinsic part of the EU strategy for decarbonisation.
▶ Importers of grey power can claim a reduction in the amount of CBAM certificates they must surrender by proving that they have already paid for the carbon in the product’s country of origin. However, this does not apply to green power in instances where default carbon emission values apply, as they do in the UK for example. Therefore, there is a potential risk of double taxation as importers have no way to prove taxes have been paid in a third country.
Producers have to cover CO emissions with ETS allowances
CBAM certificates
Eu importer has to buy CBAM certificates to cover price difference
1. Prime Minister’s office, 10 Downing Street and The RT Hon Sir Keir Starmer KCB KX MP (2024). Prime Minister and Welsh First Minister: Together we will “supercharge” mission to make Britain a clean energy superpower, https://www.gov.uk/government/news/prime-minister-andwelsh-first-minister-together-we-will-supercharge-mission-to-make-britain-a-clean-energy-superpower#:~:text=Great%20British%20Energy%20 is%20part (last accessed on 18/09/24)
1. European Council and Council of the EU (2024). ‘Fit for 55’, https://www.consilium.europa.eu/en/policies/green-deal/fit-for-55/ (last accessed on 18/09/24)
2. Offshore TSO Collaboration (OTC) (2024). ‘Offshore TSO Collaboration - Unlocking the potential of the North Seas’, https://issuu.com/eliagroup/docs/expert_paper_ii_offshore_tso_ collaboration (last accessed on 18/09/24)
3. AFRY (2024). ‘EU CBAM impact study focused on electricity imports from Great Britain’, https://afry.com/sites/default/files/2024-03/ afry_eu_cbam_impact_study_summary_report_mar_2024_v300.pdf (last accessed on 18/09/24)
▶ Overall, CBAM causes power trades to lose their economic attractiveness, triggering a related reduction in market liquidity. Indeed, power exchanges between the EU and UK have already been observed from 2026 onwards which may lead to higher power prices. This could increase the dispatching of less efficient fossil fuel power plants in the EU, or lead to increased renewable energy curtailment, and affect the buildout of renewable energy sources. Power trades might also become less efficient, due to incorrect temporal price signals. One study by AFRY3 concluded that CBAM will be counterproductive for both the EU and the UK given their shared carbon reduction ambitions.
Elia Group therefore recommends the following to mitigate risks and any unintended effects of CBAM on (hybrid) interconnectors and energy trading more widely:
▶ Supporting and securing the goal of reaching net zero by 2050 by explicitly excluding offshore wind energy produced in EEZs from CBAM. The renewable energy produced within Member State EEZs should be considered as originating from the EU and should not fall within the scope of CBAM.
▶ Taking into consideration the North Sea and Baltic Sea projects that are in the pipeline and the number of existing interconnectors, the UK should be fully exempted from CBAM. As an alternative:
▶ an agreement linking the UK ETS to the EU ETS should be agreed on;
▶ market coupling arrangements and steps should be delivered in support of a return to implicit price coupling in order to fulfil the cumulative conditions for exemption as foreseen in CBAM. ETS allowances
ACHIEVING A BALANCED ALLOCATION OF RISKS
Risks related to the development of offshore transmission infrastructure
In some jurisdictions, interconnectors are partly financed through the congestion rents they collect; however, given that the energy landscape is undergoing a series of profound and rapid changes, estimating the amount of congestion income for a single interconnector will become increasingly challenging. Since uncertainties arise regarding demand and its flexibility, congestion rents as a financing model will become increasingly uncertain, and, as a consequence, increasingly risky. The introduction of a stable, long-term regulated revenue model is an appropriate way to cover this increased risk, ensure that renewable energy integration targets are met and ensure that the required level of grid buildout is reached.
Risks related to the development of offshore generation assets
The integration of hybrid interconnectors into electricity markets could be carried out by creating specific offshore bidding zones (OBZs), throughout which local price setting and volume allocation could take place. These bidding zones should be linked to (classic) onshore bidding zones through advanced hybrid coupling. This situation would be most optimal from a market welfare and congestion management perspective; however, it could exacerbate specific risks linked to offshore power generators, including those mentioned in Figure 3.24
Price risks
▶ Structural price level and price spread risks: Offshore wind is put in direct competition with imports and exports from other bidding zones for interconnector capacity. This typically pushes the price down when compared to a home market approach.
▶ Volatility and uncertainty risks: The target market model in the EU includes the implementation of advanced hybrid coupling. For the OBZ, this means that the price formation will in reality depend on what will be happening in and within many more bidding zones than just the surrounding markets. This will likely increase price volatility and uncertainty in the OBZ.
Volume risks
▶ Competition for interconnector capacity: Competition with neighbouring bidding zones (cf. structural price level) is key in the allocation of interconnector capacity. This competition is organised through the market coupling algorithm, which doesn’t include priority access for offshore wind. However, due to the low marginal cost of wind, the energy is expected to be competitive, and this risk might be relatively limited.
▶ Competition related to onshore grid capacity: This can also limit the allocated amount of energy which can be exported by the OBZ generator. This can happen due to other (onshore) trades that generate more socioeconomic welfare than clearing additional offshore wind volumes.
▶ Unavailability of capacity: Due to the sensitivity to competition related to the grid capacity, offshore wind farms are strongly affected by reductions in the availability of grid capacity.
Buildout risks
▶ Buildout risks Power prices in OBZ are susceptible to changes as the grid is built out; such a risk is also present when an existing wind farm moves from a radial to a hybrid interconnector set-up.
Hybrid projects are large infrastructure projects which have lead times that last several years and involve big upfront investments. Investment decisions are taken amidst changing regulatory conditions (such as a potential move to offshore bidding zones), which exacerbate the risks for project developers, who, in turn, expect increased returns. The fair and efficient allocation of risks is needed to increase the creditworthiness of such projects, reduce the cost of capital by reducing the risk premium, and reduce the total cost for the energy system.
The efficient allocation of risks should involve the latter being carried by parties which are most equipped to manage them, via a model that extends beyond individual projects alone. This translates into a privileged model that could involve two steps, with the transmission infrastructure being included in a revenue regulated model; and the risk allocation and value related to offshore wind allocation following one of 2 possible approaches: capability-based two-sided contracts for difference (CfDs), or a ‘Commercial+’ model (as introduced in ‘Making Hybrids Happen’).
Capability-based two-sided CfDs guarantee a fixed price for generators, and, instead of the injection itself, the potential for injection or a synthetic profile are used as the settlement volume The price is determined through a competitive bidding process, as part of which the concession for the exploitation of the offshore zone is tendered based on a set of criteria. Usually, the strike price is the main criterion, with the developer committing to reimbursing the central counterparty (generally the government) for any excess revenue that is generated by a market price which is superior to the strike price. Moreover, the central counterparty commits to topping up the developer’s revenue when prices are lower than the strike price, as represented in Figure 3.3. Also refer to Information Box 22 for further elaboration.
However, non-price criteria can also be considered. These include requirements regarding citizen participation (as applied as part of the tendering of the concession of the Princess Elisabeth Zone in Belgium in 2024); nature protection and conservation (such as the biodiversity protection criterion included in the tendering of the Alpha site in the Netherlands in 2024); and system integration (as applied for the Beta site in the Netherlands in 2024). Including this kind of non-price criteria in tenders fosters innovation and gives developers an incentive to go beyond the minimal requirements (such as those outlined in tender requirements or environmental permits); however, the evaluation of non-price criteria can be difficult when winning bids have to be selected. See Information Box 23, which includes a statement from Deutsche Umwelthilfe, a German NGO, for a closer look at non-price criteria.
Alternatively, Commercial+ models could be adopted for the allocation of risks and benefits that are associated with wind generation projects. These involve targeted measures being designed and implemented to tackle the most significant risks (such as the structural price level, internal grid capacity, buildout risks, etc.). These improve the possibility of offshore wind projects being directly financed, for example by enabling hedging via power purchase agreements (PPAs). An example of such a PPA was recently concluded from the Nordlicht 1 wind farm with a partner from the steel industry. The risks assumed by each party should be transparently assessed in such a way that the achievement of offshore ambitions (both generation and infrastructure) is helped rather than being hindered.
Under de-risking approaches, particularly CfDs, a central counterparty acts as a guarantor, intervening to support the development of the project(s) when necessary. This transfers part of the risk to the balance sheet of this central counterparty, which can be impacted in a positive way (in situations where the market price is superior to the strike price), or negatively (in situations where the market price is inferior to the strike price). The risk associated with price volatility (see Figure 3.2) is thus transferred to the central counterparty. The central counterparty can mitigate this risk by aggregating the
volumes that are contracted under capability-based two-sided CfDs and tendering them out as virtual consumer PPAs. This reduces the (positive or negative) impact on the central counterparty’s budget and mitigates the price volatility risk. At the same time, the central counterparty offers up a product to address consumer hedging needs and increases the liquidity in forward markets (see Information Box 22).
These risk allocation approaches have to be formalised and standardised in order to ensure they can be replicated and
to ensure a level playing field across the European power market. Furthermore, formalising them will provide potential investors with an idea of the long-term development of offshore activities, allowing them to factor this into their business models. This, in turn, will provide stability in the pipeline for suppliers, the manufacturing industry and other parties, creating the confidence needed to scale up their activities to the required level (see Chapter 2).
TWO-WAY CONTRACTS FOR DIFFERENCE AS THE DIRECT SUPPORT SCHEME FOR NEW LOW-CARBON INVESTMENTS
1. Contract RES under CfD
2. Can offer hedged & clean power to consumers
RES Developer Central counterparty Consumers

SUCCESSFUL OFFSHORE EXPANSION REQUIRES A DIVERSE RANGE OF PLAYERS
CONSIDERATIONS
FOR AN OFFSHORE AREA’S ASSIGNMENT ACCORDING TO SOCIAL
AND ECOLOGICAL CRITERIA
1. The RES is contracted by the central counterparty through a competitive bidding process, setting the strike price in a 2-sided, capability based CfD. Risk is allocated in a more efficient way, providing increased clarity for the business case of RES developers.
2. The central counterparty can aggregate and repackage (part of) the contracted volume, in order to tender this out to consumers as financial PPAs of different volumes and durations. The design of these financial (or virtual PPAs), should keep incentives for flexibility, in order to avoid market distortions.
3. In this way, the exposure of the central counterparty to the volatility of CfD payments is reduced, and makes the impact more predictable, all the while providing a product to address consumer hedging needs.
▶ The current auction design under the Wind at Sea Act 2022 in Germany is built around the price criterion. This only enables giant corporations with vast financial means to outbid project developers which hold decades of project experience. Consequently, these offshore developers cannot obtain new sites. This negatively impacts a diverse landscape of developers. Many different developers secure the security of the rollout and supply. The price paid for offshore wind sites in Germany is now the highest across the globe. However, high site prices are passed onto the supply chain, so increasing the levelized cost of electricity and lowering the investment incentive.
▶ Instead, the allocation of offshore wind sites must be based on socio-ecological criteria. Currently, nature conservation and working conditions play almost no role in the allocation of sites. Environmental NGOs and workers’ unions are calling for the Federal Government to include at least six socio-ecological criteria in the allocation process. These include a high recycling rate, climate-friendly shipping and sustainable propulsion technologies, nature-inclusive design, good working conditions for employees, and resilience criteria for Europe’s industrial transformation.
▶ In conclusion, the design of Germany’s offshore wind auctions must be reformed and Europeanised to ensure a diversity of actors, ensure fair low offshore wind prices, and ensure a socio-ecologically sound allocation of areas for offshore wind energy projects – as called for in the EU Wind Power Action Plan.
Statement by:
II. FUNDING THE FUTURE GRID: ADOPTING A SEA BASIN APPROACH TO OFFSHORE COOPERATION TO REACH AN OPTIMAL GRID BUILDOUT
A NEW APPROACH TO REACHING EUROPE’S OFFSHORE AMBITIONS
Developing offshore wind generation capacity across Europe will require a significant step-up in annual installations as indicated in Figure 3.4. In addition, the connection of (hybrid) interconnectors and direct radial connections will need to be developed as well. Until today, such interconnector projects have most commonly been established through bilateral negotiations and agreements between their hosting countries. Since their effects extend beyond the borders of their hosting countries, the approach to their funding and the allocation of their costs and benefits should be extended beyond these borders too, so that they include all involved parties. Moreover, since hybrid interconnectors comprise both transmission and generation assets, their development brings together a number of parties with different perspectives and interests. These must be united in order for the projects to go ahead. A new approach is therefore needed. The section below explores key design aspects of a proposed Sea Basin Offshore Cooperation approach, alongside the concept of an Offshore Investment Bank (OIB)
Every project counts.
De-risking the investment into offshore wind is pivotal for unlocking the necessary project portfolio to yield the European social welfare gains.

Dr Barbara Praetorius Professor for Sustainability, environmental and energy economics, and energy policy at HTW Berlin


Raising capital goes hand in hand with a significant cost of capital (interest rate and equity returns), as the sheer size of projects, their lead times and changing regulatory and market conditions lead to uncertainty and risks. An adequate and balanced risk management and allocation approach is required to control this cost of capital. A framework is needed that can increase the level of financial institutional trust, reduce the risk for investors, improve credit worthiness, and reduce project financing costs (see Information Box 24 for a calculation example). A Sea Basin Offshore Cooperation approach (see Information Box 25) is one possible solution here.
This would involve a broad collaborative and coordinated approach being taken for entire sea basin areas, allowing different stakeholders from across the value chain to join forces and giving confidence to different stakeholders from across the value chain about the realisation of offshore ambitions. This regional scope, along with the use of diverse types of financial funds, will deliver tangible benefits. Additionally, the OIB (that forms part of this approach; see Information Box 25) will facilitate it.
If adopted, the OIB will act as an intermediary between public and private investors on the one hand and TSOs and wind developers on the other, aggregating funding and financing and allocating costs and benefits to different parties across each sea basin area.
REDUCING THE COST OF CAPITAL THROUGH AN ENHANCED APPROACH TO FUNDING AND COST ALLOCATION
The ONDP estimates that around €400 billion of investments in the grid are needed in order to fulfil Europe’s offshore RES capacity targets: 450-500 GW in the EU27 along with the UK and Norway (see Figure 4). Adding the required capital expenditure to build this generation capacity – which amounts to around €1,300 billion (based on a CAPEX estimate of €2.5 million per MW for offshore wind DC connections, as in the TYNDP 2024)this amounts to a total investment of €1,700 billion by 2050. This volume will be challenging to reach, even with debt leverage and EU funding. Allowing private investors to take part in offshore projects is key for reaching these investment volumes. Furthermore, given the risks associated with these decisions, and the dynamic market conditions amidst which they are taken, the cost of capital needs to be managed.
As an example, targeted de-risking measures (such as Capability-based two-sided CfDs, or commercial+ models), could reduce the Weighted Average Cost of Capital for generation from a high-WACC scenario (10%) to the reference scenario (7%, not accounting for inflation) for generation assets. Under the presented CAPEX estimates, this would result in the
WACC assumptions under different scenarios
cost of capital being reduced by around €250 billion (bearing in mind that, in the simulation described in Chapter 1, these de-risking mechanisms are included, and this is considered as a minimum requirement for the efficient buildout of the offshore grid). These de-risking mechanisms can be allocated on a project-by-project basis (which is current practice), or through a joint framework. Joint funding is a critical enabler for joint planning, and this joint framework is needed to ensure the link between them. It will also ensure coherence between the related allocation of costs and benefits. Channelling funding and financing (both public and private) through this framework will allow investments to be made in a set of projects across the same sea basin (and could lead to sea basin network plans). Furthermore, this framework should be backed by support from the EU and Member States, further increasing the trust of financial institutions and reducing the cost of debt. This is translates into an assumed gain in creditworthiness of notch (25 basis points). This results in an assumed additional reduction in the cost of capital of around €35 billion(1) These reduced costs of debt have a direct impact on the grid fees which are borne by consumers.
PLANNING, FUNDING AND BENEFITTING TOGETHER
The (proposed) Sea Basin Offshore Cooperation approach consists of joining together the planning, funding and cost and benefit allocation streams of offshore projects – all of which are essential for the long-term development of offshore systems. However, ultimately, politicians will need to decide what the depth and shape of this increased collaboration and related cost and benefit sharing framework will resemble. The following section explores this in more detail, outlining how the political decision-making process can be facilitated, and highlighting preferable options.
A political ambition and commitment to putting this framework into place will be an essential first step towards the long-term development of offshore systems, after which different details will need to be negotiated at a political level. The agreement that results from these negotiations, and support for the planned offshore grid, must come with political backing; this will ensure that the market and stakeholders are provided with the clarity they need to apply and abide by the improved mechanism that is decided upon. The improved mechanism, for which there is a clear need, will have to include a number of key principles; a non-exhaustive list of these is proposed below for the funding and financing streams and the allocation of costs and benefits. This mechanism also implies that approval for the stated projects included in this planned grid will be granted. This means that the relevant permitting and approval procedures must be brought up during the initial discussion phase. This consistency will be crucial for ensuring investor confidence in the stability of the framework and to ensure that the improved risk allocation process is maintained.
INFORMATION BOX 25
SEA BASIN OFFSHORE COOPERATION AND OFFSHORE INVESTMENT BANK
Accelerating the deployment of transnational offshore grids and generation assets will only be achieved through a collaborative and coordinated approach. In order to achieve and organise this target model for the long-term development of offshore systems, a framework called the Sea Basin Offshore Cooperation is proposed.
This target model involves a holistic and wide approach being taken to the planning of offshore projects. It involves the establishment of a clear organisational structure and governance system, integrates funding from public support schemes and private investments, and supports the sharing of project costs and benefits amongst different parties.
If adopted, this approach will involve projects being planned at sea basin level (see step 1 in the figure to the right), meaning that decisions will be jointly taken by all concerned parties around the same sea basin, including essential parties outside of the EU (such as the UK and Norway). As regulated entities, TSOs will take the lead in planning and governance matters, cooperating and taking joint decisions for the sea basins. Main project responsibilities, including project design, construction, operations and maintenance, etc. will remain with each relevant TSO. Based on the system needs identified in the ONDP and joint assessments and studies (including offshore grid blueprint studies and an OWF development plan), this collaborative approach will help to identify concrete projects that carry benefits for the whole of Europe by fulfilling its needs. All TSOs based around the same sea basin will jointly coordinate
this approach (step 2) and will be supported by their governments. This will culminate in multilateral project validation at an EU level and at the level of individual countries (step 3). These public guarantees contribute to the de-risking of long term loans, and tackle risks related to the long economic lifetime of these assets6 Whilst project planning will remain with the TSOs (just as their realisation will too, in most cases) local conditions – such as local regulatory frameworks, financial and technical resources, and the ability to execute projects - may result in private partners being involved in the execution of projects. Cooperation with these private entities will need to be organised through a non-discriminatory access approach for private competitors.
In line with the Elia Group and Ørsted study entitled ‘Making Hybrids Happen’ this study endorses the establishment of an OIB (step 4): a dedicated mechanism that will manage funding pools and the sharing of costs and benefits amongst all involved parties relating to identified projects across each sea basin (see Figure 5). If established, the OIB will be an institution that acts as intermediary between public funds and private investors on the one hand and TSOs and wind developers on the other. As such, it can integrate dedicated financial products to support grid investments, but also encourage participation from private financial investors8 The OIB will act as an intermediary between the de-risking schemes funded by different countries or institutions and the developers of a group of projects, and, at the same time, provide possibilities for pooled and aggregated PPAs (see Information Box 22), contributing to an improved
allocation of risk. Channelling both public and private money to TSOs and (hybrid) interconnector projects in particular, the OIB will give private investors the certainty that their money is being used for projects that benefit from governmental support and will offer investors a common framework that covers several projects with differing regulatory regimes within the same sea basin, so aligning with the recommendations set out in the report on EU competitiveness6 Private investors will be pleased to benefit from stable regulatory environments and invest in projects that: support the energy transition; are backed by public support, funding and guarantees; and do not require them to enter into direct negotiations with individual TSOs. Furthermore, investing through the OIB in a set of projects will carry the added benefit of spreading out the investment risks.
Sea basin countries will make up most of the OIB participants, although other countries could take part in the mechanism on a voluntary basis. The OIB will also integrate public support from individual countries or the EU. As an example, country-level support could be used to facilitate project coordination and implementation and the inclusion of voluntary countries seeking to receive renewable energy certificates from sea basin countries, so that the RES they have invested in can contribute to meeting their own renewable energy national targets. Financial contributions from private investors, the EU or individual countries will subscribe to the funding costs. Thirdly, the OIB will facilitate the participation of private, financial investors in project funding, including mechanisms that lower the related risks and reduce the cost of financing.
KEY ASPECTS REGARDING THE FINANCING AND FUNDING
FRAMEWORK OVERSEEN BY THE OIB
As an intermediary between private investors, TSOs and public support, the (proposed) OIB will play an important role in overseeing the framework that combines different sources of financing and funding. TSOs face huge capital needs related to investments in the development of offshore grids across the North Sea and Baltic Sea, which require innovative financial solutions and synergies and cooperation in order to attract this capital on a regional level.
This section explores some of the key design aspects of this financing and funding framework in relation to the concept of an OIB.
OIB FRAMEWORK WITH LOW COMPLEXITY AND HIGH REPLICABILITY
The framework of the OIB will allow private partners, sea basin countries and other countries to invest in the right projects. These frameworks will need to strike a balance between the sufficient mobilisation of additional financing on the one hand and innovative solutions and complex financial engineering that will combine different financing sources on the other.
A certain degree of standardisation will be required so that the financing framework can be replicated across other groups of projects, and so that the investments can be gradually scaled up as the project pool increases. Frontloading some of the complexity by agreeing to a framework beforehand could prove to be challenging, since legislative and regulatory arrangements regarding investments in infrastructure differ across countries. However, moving towards a more uniform approach will be necessary to attract the capital that is required to fast track the rollout of projects.
MINIMISING THE IMPACT ON GRID TARIFFS AS MUCH AS POSSIBLE
The share of the financial load that is carried by TSOs will need to take into account the investments in hybrid interconnectors and the funds required to sustain their other financial operations. The impact on grid tariffs triggered by the buildout of the offshore grid (in revenue regulated models) will therefore be controlled. Striking a balance between investments in the buildout of the offshore grid and the impact on consumer bills is crucial for the political and public acceptance of such projects.
HIGH PROJECT BANKABILITY AND SUFFICIENT RETURNS FOR INVESTORS
In order to ensure that projects are highly bankable, and make sure that investors acquire sufficient returns on their investments, the structure of the financing and funding framework should take into account the needs and expectations of the market in order to attract (private) capital. This can be achieved through an appropriate mechanism that shares and allocates the risks amongst different parties, providing a sufficient level of security in order to attract investment. This will make use of the security that elements such as public funding and guarantees (e.g. through the European Investment Bank) can offer. Confidence in these mechanisms can be increased by presenting a structure that is familiar to market parties, and comprises building blocks that already exist and are successful in the current market.
STREAMLINING GOVERNANCE STRUCTURES THAT COVER OWNERSHIP AND OPERATIONAL CONTROL
The security and guarantees that are offered to external investors should not compromise the ability of TSOs to control strategic assets. Ultimately, TSOs should remain
KEY ASPECTS REGARDING THE COST AND BENEFIT SHARING FRAMEWORK OVERSEEN BY THE OIB
responsible for the operation of their transmission grids and must thus retain operational control over their grid assets. This will also allow national control to be kept over offshore development in territorial waters through governance by national TSO(s) and oversight by national regulators. In this way, the risks associated to privately owned critical infrastructure can be managed8 This will also allow a quick move away from the current framework and will facilitate the smooth integration of grid assets under different governance regimes (the current regime, and the regime as part of the new framework). The financing approach should favour a TSO-led governance, as part of which TSOs initially have ownership of the offshore assets and keep control of their operation. In situations where TSOs are not willing or (from a regulatory perspective) not allowed to develop, own and operate the grid assets third parties should be allowed to step in.
COMPATIBILITY WITH DIFFERENT NATIONAL (TSO) REGULATORY FRAMEWORKS
An international, multi-country approach to collaboration means that different national legal frameworks and regulatory regimes will apply to a single (set of) project(s). These different national legal frameworks and regulatory regimes should be factored into the design of the OIB structure. Participating TSOs should be able to align on an approach that respects each of their national regulatory frameworks and does not disadvantage any of the participants. Possible issues to be covered could include limitations on the activities that are allowed to be performed by a TSO (see footnote above) or requirements regarding the debt/equity ratio that TSOs are allowed to apply. Standardisation is key for replicability and scalability, and national or European regulatory changes should allow for more harmonisation. However, a sufficient level of flexibility must be factored in to account for and adjust for differences in these national regulatory frameworks.
The OIB will act as an intermediary between private investors, TSOs and public support. A key aspect of this role will be the fair and adequate allocation of costs and benefits. This section examines the changes that the current cost sharing framework needs to undergo to successfully encompass offshore hybrid projects and multi-country participants, and highlights some key allocation method features10
CURRENT FRAMEWORK
Currently, the Cross-Border Cost Allocation (CBCA) is already in place across Europe. This tool is defined in the TransEuropean Networks for Energy (TEN-E) regulation11 and complemented by recommendations from the Agency for the Cooperation of Energy Regulators (ACER) on CostBenefit Analysis (CBA)12 As part of the CBCA, cost sharing with non-hosting countries can be arranged when one of the hosting countries is a net cost bearer for an interconnector project. Financial participation is not paired with ownership rights or governance implications.
These arrangements result in a high administrative burden, as all processes are carried out on an ad hoc project level, and all negotiations occur bilaterally. This approach cannot be adopted for offshore hybrid projects or projects that involve more than two participants, since, given the different issues and delays that offshore hybrid projects often entail, investments might be put on hold or (even worse) cancelled. In short, the CBCA was not designed for and thus will not be able to deliver offshore hybrid projects, or meshed grids.
The new framework for cross-border cost and benefit sharing should aim to facilitate multi-country participation and coordination for a set of projects identified through a joint planning process. It should aim to streamline this approach to ensure that the rollout of projects can be accelerated. This new framework should also accommodate the participation of (third party) financial investors and the private sector; this will be beneficial in that they don’t have limitations on debt/ equity ratios (as is the case for TSOs), meaning that they can thus provide access to additional debt financing (loans).
This should go hand in hand with enlarging the scope of the benefits considered by the allocation method, including the sharing of RES, congestion rents, the ownership and usufruct of assets, etc. Front-loading some of the complexity in a multi-party context should occur via an ex ante definition of the allocation rules that form part of this new framework. Such front-loading will allow the process to be accelerated afterwards. Compare this with current practices, where discussions are initially only carried out by a limited set of project parties, and where bilaterally negotiated projects are at risk of stranding, since involving other parties later on in a project leads to low success rates. However, front-loading all complexity and aiming for total clarity from the start of each project will evidently not be feasible either. Some flexibility will therefore remain necessary to be able to review projects based on pre-defined mechanisms or triggers caused by changes or differences which break the fair distribution of cost and benefits.
KEY DESIGN CONSIDERATIONS
To define the framework for cross-border cost and benefit allocation, choices need to be made regarding different design options whilst keeping in mind the target of a streamlined rollout of projects through multi-country participation and coordination. Some of these options can be seen as natural changes to the current framework, whilst others might be more disruptive. Either way, the final decision will involve a compromise between the political ambitions of the different countries involved. The non-exhaustive list of design considerations outlined below aims to support this political decision-making process.
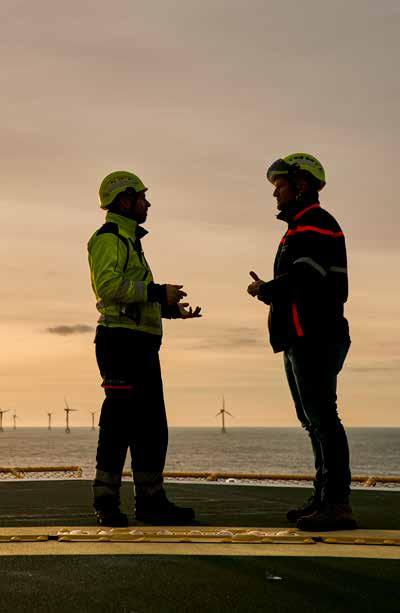
10. Mario Draghi (2024). ‘The future of European competitiveness’, https://commission.europa.eu/topics/strengthening-european-competitiveness/eu-competitiveness-looking-ahead_en#paragraph_47059 (last accessed on 24/09/24) 11. European Commission (2022). ‘TEN-E Regulation’, http://data.europa.eu/eli/reg/2022/869/oj (last accessed on 23/08/24)
12. ACER (2023). ‘Recommendation for the cooperation of energy regulators’, https://acer.europa.eu/sites/default/files/documents/Recommendations/ACER_Recommendation_02-2023_CBCA.pdf
Scope of projects
SCOPE OF PROJECTS
Geographical scope
GEOGRAPHICAL
Temporality
Sharing rules and principles
SHARING KEYS AND PRINCIPLES FIGURE 3.9
An essential change that the current framework needs to undergo involves moving away from a project-by-project scope to one that comprises a whole group of projects at the same time. As part of this, the initial group of projects should be a subset of all projects to be developed across the same sea basin; it could then eventually encompass all projects across the same sea basin. Rather than adopting a siloed approach to each project, a full sea basin network plan should be used to assess the costs and benefits associated with each set of projects that are to be completed alongside each other. This means a review clause needs to be included in the new framework so that the allocation rules can be adjusted in case certain projects are called into question or abandoned.
As demonstrated in Chapter 1, (hybrid) interconnector projects have a positive effect on Europe’s socioeconomic welfare. However, individual projects have clear beneficiaries, and (potential) net cost bearers. Assessing the sea basin offshore network plan as a whole will allow the socioeconomic welfare that is created to be distributed across all relevant countries. Therefore, even though they might prove to be net cost bearers in terms of individual projects, all involved countries will benefit from increased socioeconomic welfare in relation to the set of projects outlined in the sea basin network plan. Instead of having to fight for compensation with regard to individual projects, participants will be sure to benefit overall from a set of projects. A sea-basin-wide framework will ensure coherence across the network plan, and thus reduce the need for repeated complex negotiations for each project.
Under the current CBCA, discussions for each project take place between their two hosting countries, or, if one of the hosting countries is a net cost bearer, discussions can involve another Member State that has been identified as an entity that will significantly benefit from the project. This results in repeated negotiations that are complex and often slow and carry high administrative burdens. In a situation where all sea basin countries are involved by default, a more streamlined process will be achieved after a single initial negotiation is held at the beginning of the process. Involving a wider range of countries will highlight how the benefits of interconnectors are felt beyond its hosting countries and will formalise participant access to these benefits. By showing that the benefits of a project can be fairly allocated amongst several Member States, EU support can be more easily obtained. Even more importantly, projects will also contribute to Europe’s net zero targets. Furthermore, participation in such projects should be opened up to other countries (which lie beyond the sea basin) on a voluntary basis. This will enable these countries to reap additional benefits, such as a project’s contribution to their national RES targets through statistical transfers.
Hybrid interconnector projects are subject to variations in the energy market. This means that static allocation rules that are defined ex ante are unfit for purpose. The current, static and ex ante determination of rules needs to be changed to a dynamic ex ante allocation of rules, allowing them to be re-examined. This will mean that a fixed set of sharing rules (or a set of rules that is adjusted in a minor way, based on a select few parameters) will be applied when the market operates under ‘normal’ predictable conditions; however, if market conditions exceed certain predefined boundaries or thresholds, this will trigger the reopening of the negotiation concerning (certain aspects of) the allocation rules. A balance needs to be struck between the simplicity of the rules and the negotiations, whilst allowing for sufficient flexibility to absorb changes in market conditions. This mechanism is needed to ensure that the allocation rules remain fair for all participants, even under extreme changes in circumstances.
Since projects are subject to changing conditions, opportunities to update the allocation rules need to be included. However, if the conditions vary in such a way that they fall outside the boundaries of what is considered to be reasonable, renegotiations might be needed, contributing to further uncertainty. This will lead to initial negotiations which are complex, with significant risks in terms of opposition; however, the added flexibility should lower this risk compared to other rules and principles.
Pro rata and territorial allocation Allocation based on benefits Allocation based on benefits considering hybrid interconnectors + OWF as a whole Allocation splitting SEW and OWF connection
Allocation rules are a central element of cost and benefit sharing frameworks. These principles need to move beyond the current pro rata allocation (simple 50/50 or split possibly based on the distribution of socioeconomic welfare) or territorial allocation to an approach in which the cost and benefits of the multi-purpose (hybrid) interconnectors are considered as a whole, meaning that the framework will also include the offshore generation assets and cross-border exchanges. This is key because there is no transmission without generation and vice versa. Traditional evaluations of interconnector project benefits are solely based on the increase in socioeconomic welfare - and the definition of the latter in the cost-benefit methodology for grid development projects is currently the sum of the economic surpluses of electricity consumers, producers and transmission owners13 However, this approach is too limited for hybrid interconnector projects, since these involve the creation of additional benefits (such as RES integration, contributions to adequacy, etc.), which should be included in the cost-benefit analysis.
Methodologies for putting this into practice are already available13 however, this approach involves an additional layer of complexity, since the assessment of combined benefits is multi-faceted, especially regarding non-monetary benefits. These non-monetary benefits include the possibility of the statistical transfer of RES, where a country that contributes to a specific project includes (a share of) the capacity installed in another country’s EEZ into its own RES capacity (which it then uses to meet its own targets). This means that countries which lack RES potential can increase it. An example of where this practice is being applied is the Bornholm Energy Island project. As part of this, Germany and Denmark have agreed to share the RES capacity of the project’s 3 GW wind generation asset in an equal way. This means Germany will receive a statistical RES transfer of 1.5 GW14
Furthermore, this approach could also involve a hybrid interconnector contributing to the adequacy of the system in a non-hosting country. This contribution could even be improved thanks to the pooling of renewable energy through an increased level of interconnection. The reduced correlation of the injection profiles reduces volatility (as shown in Chapter 1), thus reducing the amount of additional generation capacity that is needed to meet demand. Other benefits can be harder to quantify, such as an increase in market liquidity as additional (cross-border) products become available, or the benefits of a more efficient and integrated European energy market, due to increased cross-border trading opportunities.
Given that the energy system will change over time, and that clear decision-making in this context will be challenging, the estimated total benefits (compared with the total costs) of this new approach will be strongly connected to the level of risk in this varying environment, and the evaluation of this risk by potential contributors. However, the benefits will not be limited to hybrid interconnector projects. Statistical transfers, reduced volatility and increased market liquidity can also be
13. ENTSO-E (2024). 4th ENTSO-E Guideline for cost-benefit analysis of grid development projects’, (last accessed on 23/08/24) 14. https://www.bmwk.de/Redaktion/DE/Downloads/J-L/joint-project-bornholm-energy-island-for-the-generation-and-transmission-of-offshore-renewable-energy.html
achieved with cross-border radial wind farm connections, where one country is linked to wind farms located in another country’s territory. Such systems do not exist today, although, as demonstrated in Chapter 1, they are viable in many cases. Either way, this new framework will require strong coordination and alignment in terms of objectives, planning and cost implications. It should also lead to a higher level of political acceptance, especially in situations where benefits are unevenly shared, due to an alignment with the cost sharing. Ultimately, cost and benefit allocation solutions should align the interests of all involved parties to realise the integrated offshore network, as set out in joint plans.
One key aspect of the allocation rules will be the need to link the costs to the benefits - specifically the benefits of RES integration and their contribution to EU targets. For example, statistical RES transfers could be linked to the de-risking support schemes (eg. two-sided CfDs) offered up by contributing countries. This could, in turn, be linked to the volume that is tendered back to the market as an (aggregated) PPA, when setting up a back-to-back tender, as described in Information Box 22.
ANNEXE
ENERGY SYSTEM STUDY FOR A NET-ZERO ENERGY SYSTEM IN 2050
The study uses the European sector coupled energy system model of the TYNDP 2024 covering 27 EU Countries, Norway, Switzerland, UK and the five non-EU Balkan countries (Albania, Bosnia, Montenegro, North Macedonia, and Serbia).
It determines the cost minimal investment for power generation, flexibility technologies including electrolysis and storage, and the expansion of electricity and hydrogen infrastructure. The investment decisions are co-optimised with the operation of the energy system (dispatch of generators, flexible loads and imports) in an hourly resolution for five-year periods starting in 2035 towards a carbon neutral energy system in 2050.
A Net Transfer Capacity (NTC) approach was adopted, and the expansion of infrastructure included cross-zonal electricity lines as well as hydrogen pipelines. The simulations were run in an hourly resolution for one historical climate year (2009, being the year with the largest weighting in TYNDP).
SCENARIO DEVELOPMENT
The study deploys four scenario as introduced in chapter 1. A more detailed description is provided in figure A1. The scenarios are investigating the effects of increasing levels for collaboration and technology innovation on the future European energy system and the offshore buildout. A “no-offshore buildout past 2030” scenario is compared as a counter factual to the three other scenarios where offshore development is optimised. They range from a national offshore buildout via a cross border collaboration involving only point-to-point connections towards a full collaboration involving hybrid interconnectors and offshore hubs. Notably, Scenario 2 has been computed in two steps. The first step denotes an initialisation step that finds a country-focused offshore wind deployment. Only in a second step that point to point (P2P) connections and the onshore transmission infrastructure are optimised.
▶ We fix the target levels of offshore wind to the optimal levels for each country based on the results of the initialisation run
▶ For decarbonisation, local solutions (onshore wind, PV, batteries, etc.), are co-optimized with the respective expansion of P2P infrastructure for electricity and hydrogen.
▶ We perform an initialisation run to find out the optimal capacities of offshore wind farms in case of a country-focused deployment. For this, we determine in a first step the offshore wind expansion without allowing transmission infrastructure expansion.
▶ Key output of this step is the offshore wind deployment in the hosting countries that is optimal for the domestic system integration and the existing cross-zonal infrastructure in 2030
▶ We fix the target levels of offshore wind and infrastructure deployment at the target levels for 2030 for each hosting country (baseline) ▶ For decarbonization, local solutions (onshore wind, PV, batteries, etc.), are co-optimized with the respective expansion of P2P infrastructure for electricity and hydrogen.
SCENARIOS AND THEIR DEVELOPMENT. THE SCENARIO “COUNTRY-FOCUSED DEPLOYMENT” IS CALCULATED IN TWO STEPS.
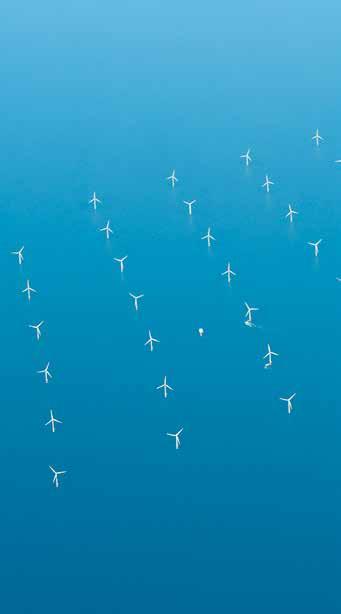
OFFSHORE WIND POTENTIALS AND THEIR DEVELOPMENT
The combined theoretical potentials for the build-out of offshore wind energy in the EU 27, Norway, and UK are reaching 800 GW (denoted as high trajectory in TYNDP). The current offshore targets of the countries amount to just below 500 GW. The Figure A3 shows in relation to the targets and the theoretical offshore potential, how much offshore wind capacity is developed in the four scenarios.
SIMULATION FACILITY FOR A 2023 CASE STUDY ON A HYBRID INTERCONNECTOR
The simulation facility being used in this study employed the Euphemia algorithm. It is used for day-ahead market coupling in most European countries to maximize pan-EU socioeconomic welfare, including producer surplus, consumer surplus, and congestion rent, while respecting the physical constraints of the network. Euphemia supports net transfer capacity, flow-based, and hybrid exchange models, each with different grid constraints depending on the capacity calculation method.
Market participants submit their bids to power exchanges, which aggregate and anonymize them into bid curves before sending the collected orders to Euphemia. The algorithm finds an initial solution and then seeks to improve socioeconomic welfare. The algorithm runs daily, matching supply and demand, and returns market clearing prices, net positions, accepted volumes for each bidding zone, and interconnector flows in each hour.
This study replicates the historical trades of 2023. In addition to the data representing the bids made on the European electricity exchanges that are used for the zonal balancing
of supply and demand in electricity system in 2023, the offshore weather time series of 2023 from the Copernicus dataset1 was used for the mapping of available generation potential in the Baltic Sea region after a transformation to fit realistic wind farm availability of about 50%. Figure A4 shows the weekly availabilities that would have been experienced in 2023 for an offshore wind farm in the Baltics with the capacity of 2 GW installed power and the typical seasonal pattern.
KEBA METHOD FOR THE WAKE ANALYSIS.
The KEBA method uses the kinetic energy budget of the atmosphere around wind farms to diagnose wind speed reductions and estimate energy yields. This involves a rectangular box with a cross-sectional width W, height H, and downwind length L (calibrated to the three boxes of the countries’ EEZs). A drag coefficient Cd of 0.001 is used.
The areas where the boxes adjoin each other were set at a width of 170 kilometres and the length is used to represent
different area sizes as is visualized in Figure A5. The height of the boxes is 700 meters as in Kleidon and Miller (2020) where an impact of wind turbines on the air flow above 700 meters is expected to be negligible.
In this study KEBA is not only used for a single country’s EEZ but also between zones. The method used here to track coupling effects between countries connects adjacent areas in the main wind direction by transferring residual kinetic energy from one box to the next in the main wind direction.
The output of the analysis is in time series formats that contain the total yield of electricity as well as the wind speed reduction. It then allows to assess for the wake losses against a simulation run, where wake was not modelled.
SCHEMATIC VISUALISATION OF THE REPRESENTATION OF OFFSHORE WIND AREAS IN THE NORTH SEA FOR THE ANALYSIS OF EXPECTED WAKE EFFECTS.
FIGURE A5
FIGURE A4
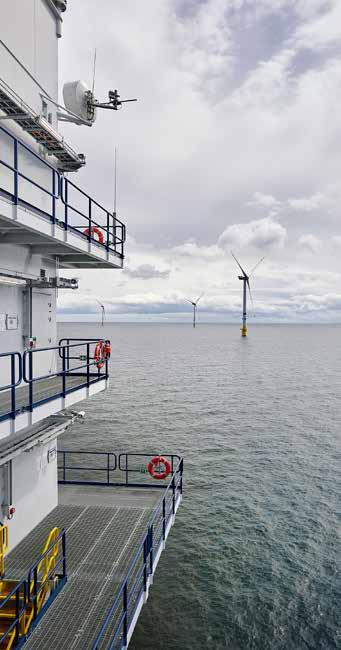
DATA
The length of the boxes is adjusted such that the boxes represent different deployment areas. Two settings are considered for the available areas for wind turbines in the national territorial waters of the three countries bordering the German Bay, i.e. Denmark, Germany and The Netherlands in the North Sea.
The first setting assumes an area equivalent to the size of the wind farm designation areas in the respective countries (see
figure A7). And the second setting assumes the availability of the entire area of the exclusive economic zones (deducted by some exclusion areas). The Table below summarizes the size of the areas available in the two settings.
The wind resource is simulated based on 10 years of observed wind velocities from the years 2000 to 2009 for a representative area covering 100.000 km2 in the Southern North Sea collected by the Copernicus data platform3
CORRELATION AND FOURIER ANALYSIS
DATA PROCESSING
Correlation and Fourier analysis is performed following the steps outlined in figure A6. The input data is based on the wind resource data from the Copernicus database4 at a height of 100m, for the period 1979-2023 at the centroid coordinates of each offshore wind farm identified as shown in figure A7. The expected yield of each of these wind farms is then calculated by multiple interpolations of the results
of idealised mesoscale simulations of wind farm wake This interpolation is done based on the capacity density (see also table 2), and the size of the wind farms. For each identified offshore wind farm this results in a capability profile, meaning that it’s the capacity profile of the wind farm, disregarding maintenance (planned or unplanned) and curtailment.
WORKFLOW FOR THE CORRELATION AND FOURIER ANALYSIS
FOURIER ANALYSIS
The Fourier analysis then consists of decomposing the capability profiles into its different time components. The first step is transforming the incoming profile to the frequency domain. In this frequency domain, the spectrum is sliced, to isolate the different time components. An inverse Fourier transform then yields the profiles of each of the selected timescales. Where hourly and even daily variations could be attributed to local, variable weather conditions, and will be much more randomly distributed over the geographical space and over time, monthly up to seasonal variations, are attributed to the seasons, which are relatively homogeneous over the continent. Weekly (up to monthly) variations can be associated to moving weather fronts across the continent. It’s on this timescale that pooling of appropriate wind farms and their profiles, can have a structural contribution to reducing the volatility of the infeed. It is thus the latter where the focus of the analysis lay.
STATISTICAL ANALYSIS
The profiles of the identified wind farm locations are then analysed on the weekly timescale. A reduction of the correlation, as the distance between wind farms increases. This reduced correlation can have a positive effect on system integration, as pooling the infeed from such wind farms reduces the volatility of the infeed. This, in turn, reduces the need for medium term flexibility, often delivered by dispatchable generation. In the study the correlation is expressed by the Pearson correlation coefficient.
Additionally, pooling across a sea basin, for example across the southern North Sea basin significantly reduces the occurrences of low wind infeed (“dunkelflaute”). In the study these events are defined as the instances where the rolling average over 24 hours of the wind farm capability falls below 20% of the installed capacity.
This reduced correlation can also be leveraged across different sea basins, countries such as Germany and Denmark, having access to both the Baltic and the North Sea, can reduce these occurrences, as the profiles are sufficiently different to have a low number of simultaneous occurrences of low wind in both sea basins. The occurrences referred to in this report are the yearly averages over the 45 studied years (1979-2023).

GIS ANALYSIS FOR THE CONNECTION OF WIND FARMS UNDER TWO DIFFERENT SPATIAL
PLANNING PRIORITIES
The analysis was done for the Baltic and North Sea region for the target year 2050 with a high degree of collaboration assumed (i.e. calibrated to the scenario number 4 of the system study of chapter 1). The year 2030 was used as a starting point of analysis, i.e. the expansion targets were assumed for this year with a (mainly) radial connection of offshore wind farms by then. Table A2 summarises the assumed capacities along with the power densities.
OFFSHORE WIND EXPANSION TARGETS IN BALTIC AND NORTH SEA ALONG WITH AVERAGE FUTURE POWER DENSITIES. (FOR UK, ALSO IRISH SEA AND CHANNEL INCLUDED IN THE VALUES)
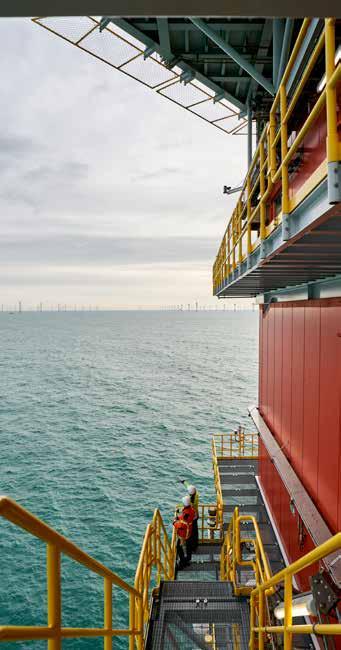
spatial planning data is based on last official reports, with amendments being made with respect to planning data on offshore areas as of 2024. The state of data and links to sources are provided in table A3.
The spatial planning categories were consolidated among all countries and simplified into common groups of primary uses. Dual uses were not explicitly enforced but implicitly allowed, when one or more designated uses in the data were overlapping. Non-designated areas were denoted “open sea” and intersected with land cover and islands. The simplified categories are as follows:
https://www.marineatlas.be/en/marine-spatial-plan and https://www.marineatlas. be/en/view
Germany 2021 2024
https://www.geoseaportal.de/mapapps/resources/apps/meeresnutzung/index. html?lang=en&stateId=ccc6b704-81ae-42e0-86b7-0481aef2e09c and https://www.bsh.de/EN/TOPICS/Offshore/Sectoral_planning/Ongoing_update_ Site_development_plan/_Anlagen/Downloads/Geodaten_zu_Stellungnahme_BSH. html;jsessionid=E4747B4F2AAAF170628CAE768B10D496.live11314
Denmark 2021 2024 https://havplan.dk/en/page/info
Estonia 2022 2024 https://mereala.hendrikson.ee/kaardirakendus-en.html
Finland 2020 2024
https://meriskenaariot.info/merialuesuunnitelma/wp-content/uploads/2020/10/ Finnish-Maritime-Spatial-Plan-2030-Marking-Card-Library.pdf and https://meriskenaariot.info/merialuesuunnitelma/en/suunnitelma-johdanto-eng/
United Kingdom* 2014 2024
https://crown-estate-scotland-spatial-hub-coregis.hub.arcgis.com/ and https://opendata-thecrownestate.opendata.arcgis.com/datasets/ thecrownestate::wind-site-agreements-england-wales-ni-the-crown-estate/about and https://www.gov.uk/government/collections/marine-planning-in-england
Lithuania 2021 2021 https://www.bendrasisplanas.lt/2019/12/13/en/#%20
Latvia 2019 2022 GEO (geolatvija.lv)
The Netherlands 2022 2024
https://www.noordzeeloket.nl/en/policy/north-sea-programme-2022-2027/ and https://english.rvo.nl/topics/offshore-wind-energy/new-offshore-wind-farms
Norway 2020 2020
https://www.regjeringen.no/contentassets/5570db2543234b8a9834606c33caa900/ en-gb/pdfs/stm201920200020000engpdfs.pdf and https://temakart.nve.no/tema/vindkraftverk
Poland 2021 2021 https://sipam.gov.pl/geoportal?m=g856
Sweden 2022 2024
https://www.havochvatten.se/data-kartor-och-rapporter/data-och-statistik/ havskatten/visa-datamangd.html#esc_entry=651&esc_context=1
6. Natural Earth (2024). ‘Free vector and raster map data‘, https://www.naturalearthdata.com/ (last accessed 25/09/24)
material, oil extraction
Apart from spatial planning data, geographic base information such as landcover6 and bathymetry7 (water depths) were considered, as well as locational information on nearshore substations8 for the transmission grid (points of connection, POC) and interconnectors. For the sake of this analysis only nearshore POC were included in the scope of analysis, simplifying from reality, where some offshore transmission systems are planned to be connected deeper into the countries (as is the case in Germany for instance ).
All spatial planning data was translated into a hexagon grid with spatial resolution is 25 km². For the optimisation of the routing each line segment in the hexagon grid got assigned a penalty cost value. This was computed with help of the Analytic Hierarchy Process as implemented by Goepel10 The Analytic Hierarchy Process (AHP) is a decision-making technique that prioritizes criteria and alternatives based on structured pairwise comparisons in a multilevel hierarchy. Two penalty cost structures were created, one for each scenario (nature first and business as usual).
7. European Marine Observation and Data Network (EMODnet) (2022). ‘EMODnet Digital Bathymetry’, https://emodnet.ec.europa.eu/geonetwork/srv/eng/catalog.search#/metadata/ff3aff8a-cff1-44a3-a2c8-1910bf109f85 (last accessed 25/09/24)
8. https://openinframap.org/#4.18/58.11/11.25
9. Netzentwicklungsplan Version 2023: https://www.netzentwicklungsplan.de/nep-aktuell/netzentwicklungsplan-20372045-2023
10. Goepel (2013). ‘Implementing the Analytic Hierarchy Process as a standard method for multi-criteria decision making in corporate enterprises‘, https://doi.org/10.13033/isahp.y2013.047 (last accessed 25/09/24)

Apart from spatial planning data, geographic base information such as landcover and bathymetry (water depths) were considered, as well as locational information on nearshore substations for the transmission grid (points of connection, POC) and interconnectors. For the sake of this analysis only nearshore POC were included in the scope of analysis, simplifying from reality, where some offshore transmission systems are planned to be connected deeper into the countries (as is the case in Germany for instance ).
All spatial planning data was translated into a hexagon grid with spatial resolution is 25 km². For the optimisation of the routing each line segment in the hexagon grid got assigned a penalty cost value. This was computed with help of the Analytic Hierarchy Process as implemented by Goepel.
The Analytic Hierarchy Process (AHP) is a decision-making technique that prioritizes criteria and alternatives based on structured pairwise comparisons in a multilevel hierarchy.
11. Danish Energy Agency (2024). ‘Technology Catalogues’; https://ens.dk/en/our-services/technology-catalogues (last accessed 25/09/24)
Two penalty cost structures were created, one for each scenario (nature first and business as usual).
The objective for the analysis was to minimise the cost of connection (CAPEX + penalty cost), while satisfying the offshore targets and point of connection targets per country. In other words, no full system simulation with (economic) dispatch of power plants were performed but purely a geographical analysis with the optimisation of transmission corridors in the sea.
Objective function: minimization of the costs of the entire system
The model could freely choose to either connect wind farms radially to shore (cross border or nationally) or to interconnect several wind farms into hybrid and meshed layouts. The analysis was conducted with standard cost assumptions as found in the Danish Energy Agency technology catalogue11 with cost mark ups for deep waters:
SUPPLY CHAIN ANALYSIS
In order to assess how the forecasted offshore wind asset demand up to 2050 translate into raw material demand, this study’s analysis based itself on the ONDP 2024 by ENTSO-E and amends these numbers with the GIS analysis from chapter 2 as well as other reports as cited below. The raw material needs were calculated with a set of assumptions being listed below:
Cables
Offshore wind turbines
SUPPLY CHAIN EFFICIENCY GAINS
The supply chain for offshore wind will evolve significantly in the decades to come. Various studies assess potential cost reduction potentials due to an increased level of established technology standards in the sector, higher volumes of manufacturing, improvements in the processes, and maintenance. On the contrary there are also counter trends such as inflation, material shortages and not least
importantly the fact that we are currently having a sellers’ market with high prices due to shortages in supply. With these reflections in mind the calculation example being used in this study is rather conservative and only tackles the period past 2035 for potential cost reductions in the supply chain. The assumptions and calculations are shown in the tables.
Savings potential of offshore wind farms
▶ Material needs are estimated via linear tonnages per km based on data sheets12 and the Rystad report13
▶ AC cable demand resulting from inter-array cables needed for the connection of wind turbines within wind farms is not included in this study.
▶ Assumption for proportion of AC vs. DC cables routes was made based on BEMIP14 and North Sea15 shares (we took the average) from ONDP reports.
▶ With regards to monopolar vs. bipolar it was assumed that all systems are bipolar systems.
Offshore Platform (structure)
▶ The tonnage of offshore substations varies greatly. For reasons of simplicity, the material need was estimated via the shares of main materials, based on a total tonnage of the topsides.
▶ For Jacket and Topside steel was assumed as single material (for simplicity).
▶ Assumptions for material needs of offshore wind turbines are based on EC JRC16
▶ Where applicable, values have been grouped (e.g. for rare earth metals).
▶ Concrete (Cement) was not assessed in this analysis
▶ For reasons of simplicity, an equal share of Direct Drive (DD-PMSG) and Gearbox based (GB-PMSG) permanent magnet synchronous generators in the offshore wind turbine nacelles was assumed for this analysis.
12. Prysmian (2023). ‘525 kV HVDC New cables systems fort he energy transition‘, 525 kV HVDC (prysmian.com) (last accessed on 27/09/24)
13. Rystad (2023). ‘The State of the European Wind Energy Supply Chain‘, The State of the European Wind Energy Supply Chain WindEurope (last accessed on 27/09/24)
14. ENTSO-E (2024). ‘Sea-Basin ONDP Report –Bemip’, ENTSO-E TYNDP 2024 Sea-Basin ONDP Report – BEMIP Offshore Grids (eepublicdownloads.blob.core.windows.net) (last accessed on 27/09/24)
15. ETNSO-E (2024). ‘Sea-Basin ONDP Report – North Seas’, ENTSO-E TYNDP 2024 Sea-Basin ONDP Report – Northern Seas Offshore Grids (eepublicdownloads.blob.core. windows.net) (last accessed on 27/09/24)
16. EC JRC (2020). ‘Raw materials demand for wind and solar PV technologies in the transition towards a decarbonised energy system’, https://op.europa.eu/publicationdetail/-/publication/19aae047-7f88-11ea-aea8-01aa75ed71a1 (last accessed on 27/09/24)
▶ Assumption that CAPEX savings can be realised for offshore wind farms of 15% in the period 2035 till 2040 with decreasing savings of 10%, 5% and 3% in subsequent five-year segments17
Savings potential for offshore transmission assets
▶ Assumption that the costs of ONDP can be reduced by up to 20% for converters and 5% for cables based on expert interviews.
GLOSSARY
day before it is actually produced and delivered
EEZ Exclusive Economic Zone The offshore area of a given country, where offshore wind farms are typically placed
ENTSO-E/ ENTSO-G European network of transmission system operators for electricity and gas
ETS Emission Trading system A trading system to trade the carbon
GOING LIKE THE WIND – THE VIRTUOUS CIRCLE OF OFFSHORE WIND BENEFITS IN EUROPE
Contact
Felix Jakob Fliegner
felixjakob.fliegner@50Hertz.com
Concept and editorial staff
Communication & Reputation
Elia Grid International
European Affairs
Grid Planning & Development
Innovation
Market Grid & Offshore concepts
Offshore
Procurement
Regulatory Affairs
Strategy & Corporate Development
System management concepts & analyses
System of the Future
WindGrid
An online version of this study, alongside an interactive map, can be accessed here: https://www.eliagroup.eu/goinglikethewind
Elia Group
Boulevard de l’Empereur 20, B-1000 Bruxelles
Heidestr 2, 10557 Berlin Graphic Design
www.chriscom.be
Editors
Catherine Vandenborre
Frédéric Dunon
Stefan Kapferer