60 minute read
The Fundamental Series: CPD Learning


Metering & Monitoring
“ Energy in Buildings and Industry and the Energy Instituteindications suggesting retail 2017. are delighted to have teamed up to bring you thismargins will be 2.5 per cent net, A number of the large existing Continuing Professional Development initiative ”straightforward price discounts companies have made it clear they MARK THROWER MANAGING EDITORwill offer relatively thin pickings. intend to compete, but even here, in SERIES 18 | MODULE 06 | METERING & MONITORING SERIES 14 | MODULE 08 | Metering & MonitoringSaving money through better water management should be exactly what form remains to be seen. United Utilities and Severn Trent, for
Advertisement
considered in addition to simple
instance, have made it known they will This month's CPD module sponsored byvolumetric discounts. There could be taking an active role for the last few
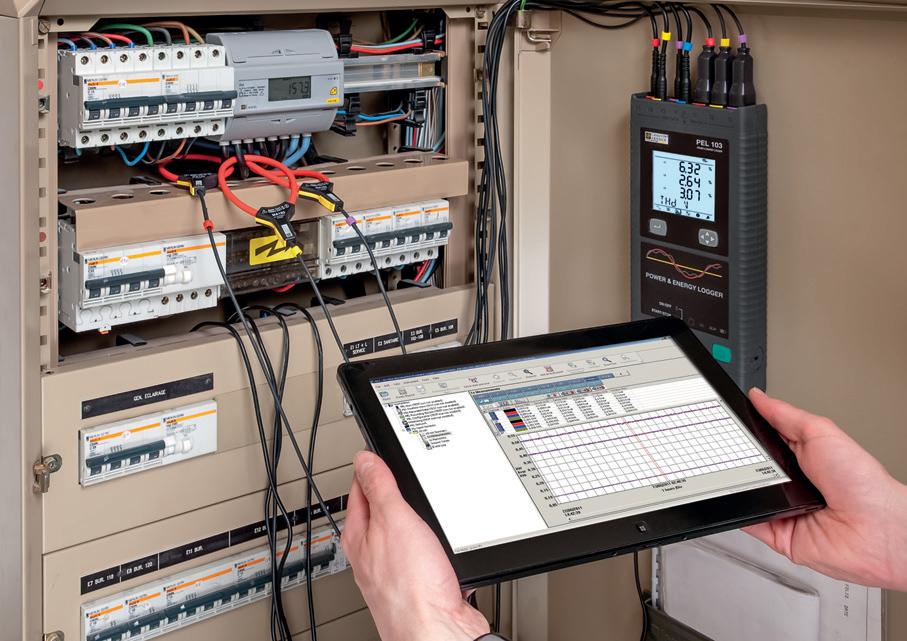
Among the issues to watch over the use. The system accuracy depends also be efficiency savings to be energy used daily, weekly and monthly years, but it was only in the last few coming months are: very much on the specification and and methods to allow comparison Energy metering and installation of the metering. If the wrong size or type of meter is specified or if the meters are wrongly installed then against the previous year’s data. Where possible it should include some typical key ratio’s to allow the the system accuracy will suffer badly. consumption to be compared against monitoring It is estimated that over 30 per cent of all installed meters are either wrongly sized or wrongly installed. In most cases key operating parameters such as for example; outside temperature using kWh/degree day, production in kW/ the monitoring system has to interface unit of production, sales in kWh/unit with existing meters many of which are of turnover, occupancy in kWh/man by Chris Burgess, trainer and technical adviser, Energy Institute wrongly specified but are uneconomic hours or kWh/unit of floor area. If used to replace. correctly, these key ratios can produce
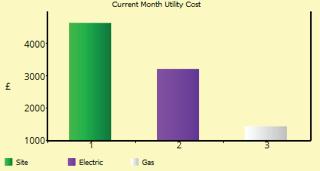
Energy monitoring and Three phase electricity meters useful information about how well the targeting (M&T) is one of the fundamental techniques that require that the L1, L2 and L3 phase currents and voltages are correctly identified and wired to the meter Fig. 6 Display of site cost breakdown by energy type energy is being used compared with previous years and other facilities or departments within the organisation. an energy manager can use correctly in phase. This is often not Normally various graphs can for the long-term management of the case as the cable colours do not sized at 1000A which will give very value in the energy monitoring system be produced to show the increase energy consumption and to highlight guarantee that the phases are in the poor accuracy at the actual working or energy dashboard read the same. or decrease in corrected energy potential improvements in the correct sequence as the phases. The load of 100A. In these circumstances This is especially important when a new consumption. efficiency of energy use. Monitoring is essentially aimed cable colours can be swapped within the wiring network with colours not matching the phases resulting in the a compromise should be reached to improve accuracy. The switch should be metered with a smaller range replacement meter is fitted or a meter value rolls over back to zero. If you need to add a number of In many systems it is also possible to produce graphs and key ratios using carbon and cost as the criteria as well at establishing the existing pattern electricity meters reading low. metering system rated at say 250A with meters to get to a total then the as kWh. This is becoming more popular of energy consumption, whereas Meters with a pulsed output have alarm levels set within the metering percentage accuracy of each meter and gives some interesting information targeting is the identification of a additional potential problems with systems such that if the actual demand will also be added. If poorly specified when comparing fuel types. level of energy consumption which contact bounce or missed pulses. This approaches the 250A level in the future or installed this overall accuracy could Once some historical data has been can be set as a goal for the energy can be avoided if modbus or similar multi register meters are used where then an alarm would be instigated and new 1000A metering CT’s could be be very poor. It is not recommended to add meters together to get to a total. It is accumulated then it is possible to start looking at energy use using statistical management strategy. the actual meter register is read back fitted. Unfortunately, most electrical better to measure the main supply and methods; such as regression analysis
Monitoring and targeting should and pulses are not counted. and fluid metering systems are installed split the main meter output in relation and CUSUM to identify trends. Most form an essential part of the energy In the case of mechanical meters to meter the maximum capacity of the to the percentage of the total supply systems have this capability and also strategy for any size or type of such as water or gas the meters are required for performance standards with the meter - typically, electricity, allow the user to set targets. These installation and not the actual load on by each sub meter. By doing this the organisation, whether industrial, almost always oversized or of the such as ISO50001 and organisational natural gas, water or heat meters energy targets can be very simple such the system giving large inaccuracies. system accuracy is maintained as the commercial or public sector. The wrong type resulting in poor accuracy. Some mechanical meters are good for carbon footprints compiled in Another potential problem is meter zeroing and rollover. If there is a small with a digital interface, commonly as using the best historical typical week or typical month’s data as the ongoing accuracy of the main meter. This is true for electrical and fluid metering. primary objective of M&T is to gain continuous flow but very inaccurate compliance with ISO14064; and number of available meter register a simple pulsed output. Then an Once you have installed your target. Whatever targeting method is a better understanding of how when the flow is intermittent. Correct • provide visible feedback to support automatic meter reading (AMR) digits on the meter relative to the actual metering system and have started used the accuracy and repeatability of energy is used. When correctly meter specification and installation is staff awareness campaigns. load, then the numbers will rollover system which reads the metered collecting your data the next objective the metering system data is essential to applied M&T helps identify signs of essential if the best accuracy is to be Smart meters may benefit very quickly as the register is filled. It is consumption (typically over must be to make the best use of the data. the success of the system. avoidable energy waste and other opportunities to reduce energy achieved. Electrical and mechanical system metering accuracy is generally a domestic energy consumers by increasing the visibility of energy important to use the largest numerical register available. Some monitoring systems allow the 30-minute periods) and stores the data ready to be analysed. Meters It is now very economic to install intelligent metering systems which allow the user control their energy In order to do this you must have specified the metering and metering system correctly and also built in to the consumption, but energy savings are problem as the metering system costs and their consumption profile. can be hard wired to the meter user to manually enter the actual meter software requirement the necessary use by knowing exactly how they are achieved only if appropriate actions accuracy is normally described as a In the non-domestic sector devices values if required, in order that the reader, but wireless technology targeting and data management using their energy and how much it are taken based on the correct percentage of full scale. This means with communication capability actual physical meter and the displayed is often more practical and cost routines. These should include total is costing across the various areas of interpretation of the M&T results. that if the meter is oversized then the together with analysis software effective. their business. It is always wise to start
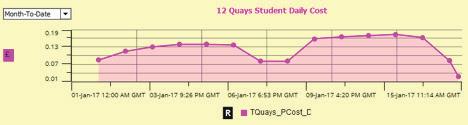
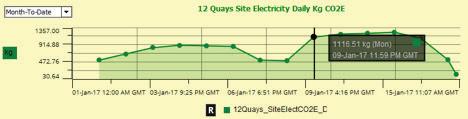
The output from a well-designed M&T scheme will enable the energy accuracy will be low. For example, a 3 per cent error on a meter sized for 100m3/hour of flow will be 3m3/hr. If the are now commonplace, enabling systems to be configured to Third, there are sensors or other data input facilities to record the small and build up the system by adding meters when they are required to get the best results and not metering for the Fig. 5 Display of site daily Co2 generated by electricity consumption. manager to: actual flow rate is only 10m3/hr then the automatically measure, analyse and parameter that “drives” energy sake of it. These systems are generally • detect avoidable energy waste that meter accuracy will be 30 per cent of report energy consumption. consumption, such as external easy to expand and provided they are might otherwise remain hidden; the actual flow rate. Most meters are not Checking fiscal energy meters and temperature or production specified and installed correctly will • identify areas for investigation and truly linear and if operating out with the utility bills as a cost control measure throughput in a manufacturing supply many years of reliable data action prompted by unexpected linear band they will be very inaccurate. In many cases the existing system might once have been considered environment. about their business in a simple to understand manner. It is best to select patterns of energy consumption; load is very low relative to the installed a basic form of monitoring but now The final part is analysis software appropriate systems for appropriate • quantify the savings achieved by capacity of the installation especially automatic M&T has evolved into a Fig. 7 Display of site energy costs per student - there is a variety of software uses. A mixture of metering systems can energy-saving projects in a manner where the system has been designed mature area of business with a wide available with different levels of sometimes be advantageous. that accounts for factors such as for future expansion. The metering range of products and services from sophistication in terms of the depth variations in external temperature or system installed is usually rated at different suppliers. of analysis and facilities such as Acknowledgements levels of production output; • improve energy or carbon budget the maximum capacity of the system even though the load is much smaller. For example a1000A electrical switch Four parts of an aM&T scheme energy dashboards using real-time data displays, cost and carbon • CIBSE for technical information in tables • Scotia Energy Ltd for the use of graphs; setting; board with a 100A load on it. The There are four parts making up an reporting and databases to record and • improve the collection of data metering system would normally be automatic M&T scheme starting energy reduction projects. Often • The Carbon Trust for use of data.
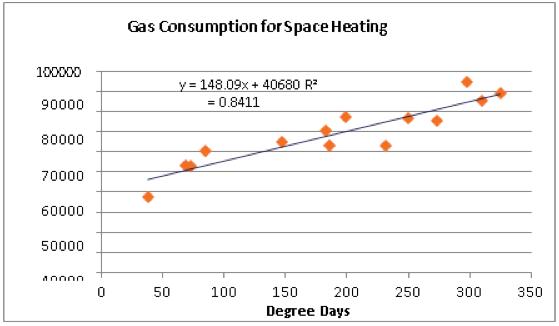
the software sits in the cloud and is 08 | Metering & Monitoring accessible via the web which means the user only requires an internetenabled PC. In a manufacturing setting, where processes and site services are often controlled using a SCADA system, it is worth investigating the possibility of integrating metering into the existing control system - additional energy analysis software may be required. The fundamental step in the M&T analysis is carried out to establish the relationship between the dependent variable (i.e. energy consumption) and the independent variable (i.e. variables that influence energy consumption - sometimes referred to as the energy driving factor). A standard statistical technique called regression can be used to establish the relationship if there is a single independent variable for each consumption stream to be monitored. Any measurable independent variable can be used provided there is a genuine relationship between it and energy consumption. Typical energy driving factors are production output for energyintensive manufacturing processes, degree days for space heating or mileage for a vehicle fleet. To illustrate the analysis, data can be shown graphically. Generally, when energy consumption is plotted against an appropriate driving factor, a straight-line relationship normally exists. This can be represented by an equation of the form: y = m x + c where ‘m’ is the gradient of the line and ‘c’ is the intercept with the y-axis. The values of ‘m’ and ‘c‘ are cheaper bills. But with current competing for business come April indications suggesting retail 2017. margins will be 2.5 per cent net, A number of the large existing SERIES 18 | MODULE 06 | METERING & MONITORINGstraightforward price discounts companies have made it clear they will offer relatively thin pickings. intend to compete, but even here, in Saving money through better exactly what form remains to be seen. future period using the relevant degree day value. SERIES 14 | MODULE 08 | Metering & Monitoringwater management should be United Utilities and Severn Trent, for considered in addition to simple So once established, the instance, have made it known they will volumetric discounts. There could characteristic line can be used as a ‘performance target’ for the future be taking an active role for the last few use. The system accuracy depends very much on the specification and also be efficiency savings to be operation of the heating system by comparing the predicted value with years, but it was only in the last few installation of the metering. If the wrong the actual metered consumption size or type of meter is specified or if to determine whether an over or the meters are wrongly installed then under consumption has occurred. the system accuracy will suffer badly. Any significant deviation in fuel It is estimated that over 30 per cent of consumption should be investigated all installed meters are either wrongly and prompt corrective action sized or wrongly installed. In most cases the monitoring system has to interface taken as necessary to maintain the with existing meters many of which are performance of the system. wrongly specified but are uneconomic The same type of calculation can to replace. be performed to establish an annual Three phase electricity meters budget for space heating energy, require that the L1, L2 and L3 phase by using the number of degree currents and voltages are correctly identified and wired to the meter correctly in phase. This is often not days for an average datum year in the formula. Or to establish an Fig. 6 Display of site cost breakdown by energy type significant as can be seen by using The value where the line intercepts annual budget for process energy the case as the cable colours do not sized at 1000A which will give very value in the energy monitoring system space heating as an example. Gas the vertical axis, is the value ‘c’ in the consumption by using the annual guarantee that the phases are in the poor accuracy at the actual working or energy dashboard read the same. consumption for space heating equation, and represents the fixed production output figure in the correct sequence as the phases. The load of 100A. In these circumstances This is especially important when a new will normally exhibit a straight-line demand or base load consumption formula.cable colours can be swapped within a compromise should be reached to replacement meter is fitted or a meter relationship with heating degree i.e. gas used at zero-degree days the wiring network with colours not improve accuracy. The switch should value rolls over back to zero. days. The gas consumption and when the space heating load should Correlation coe icientmatching the phases resulting in the electricity meters reading low. be metered with a smaller range metering system rated at say 250A with If you need to add a number of meters to get to a total then the degree day data can be plotted as be zero. Meters with a pulsed output have Regression analysis is typically alarm levels set within the metering percentage accuracy of each meter a graph. Each point on the graph The base load consumption could evaluated using a correlation additional potential problems with systems such that if the actual demand will also be added. If poorly specified is gas consumption during the be the result of boiler standing coefficient (R2) which is a measure contact bounce or missed pulses. This approaches the 250A level in the future or installed this overall accuracy could monitoring period (i.e. day, week or losses or other loads which are of the degree scatter of the energy can be avoided if modbus or similar then an alarm would be instigated and be very poor. It is not recommended to month) shown on the vertical (y) axis included in the metering data, but data points from the line of best fit multi register meters are used where new 1000A metering CT’s could be add meters together to get to a total. It is and the number of degree days for the identical period shown on the which are not dependent upon external temperature such as and is calculated by the spreadsheet software. The range is 0 to 1, with the actual meter register is read back and pulses are not counted. In the case of mechanical meters fitted. Unfortunately, most electrical and fluid metering systems are installed to meter the maximum capacity of the better to measure the main supply and split the main meter output in relation to the percentage of the total supply horizontal (x) axis. gas used for domestic hot water 0 representing no relationship and such as water or gas the meters are installation and not the actual load on by each sub meter. By doing this the
The mathematical functions within heating or catering. The slope of the 1 meaning an exact fit (the model almost always oversized or of the the system giving large inaccuracies. system accuracy is maintained as the spread sheet software include a characteristic line (the value of ‘m’ in explains all the variability). For wrong type resulting in poor accuracy. Another potential problem is meter accuracy of the main meter. This is true statistical analysis tool called ‘least the equation) indicates the increase in energy analysis an R2 above 0.8 is Some mechanical meters are good for zeroing and rollover. If there is a small for electrical and fluid metering. squares linear regression’ and this gas consumption for each degree day. generally regarded as evidence of a continuous flow but very inaccurate number of available meter register Once you have installed your can be used to calculate the formula for the ‘best fit’ line to represent The formula for the ch aracteristic line represents the heating energy reasonable relationship. A wide scatter of points can be due when the flow is intermittent. Correct meter specification and installation is essential if the best accuracy is to be digits on the meter relative to the actual load, then the numbers will rollover very quickly as the register is filled. It is metering system and have started collecting your data the next objective must be to make the best use of the data. the relationship between gas achieved. performance over a historical time to poor quality or inconsistent data important to use the largest numerical In order to do this you must have consumption and degree days. The period that is analysed and can be Electrical and mechanical system register available. but could be due to inadequacy or specified the metering and metering best fit line is often referred to as the used to calculate an estimate of malfunction of the heating system metering accuracy is generally a Some monitoring systems allow the system correctly and also built in to the characteristic line. the expected consumption for any controls. The correlation may also be problem as the metering system user to manually enter the actual meter software requirement the necessary accuracy is normally described as a values if required, in order that the targeting and data management percentage of full scale. This means actual physical meter and the displayed routines. These should include total Figure 1: shows an example set of energy consumption and degree day data and the graphical results of the linear regression analysis. that if the meter is oversized then the accuracy will be low. For example, a 3 per cent error on a meter sized for Fig. 5 Display of site daily Co2 generated by electricity consumption. 100m3/hour of flow will be 3m3/hr. If the actual flow rate is only 10m3/hr then the Month Degree day Gas kWh meter accuracy will be 30 per cent of Apr 199 77,558 the actual flow rate. Most meters are not May 147 64,663 truly linear and if operating out with the Jun 69 53,222 linear band they will be very inaccurate. Jul 73 53,034 In many cases the existing system Aug 38 37,701 load is very low relative to the installed Sep 85 60,443 capacity of the installation especially Oct 183 Fig. 7 Display of site energy costs per student 70,551 where the system has been designed Nov 250 76,352 for future expansion. The metering Dec 325 89,394 system installed is usually rated at Jan 298 94,679 the maximum capacity of the system Feb 310 85,368 even though the load is much smaller. Mar 274 81,874 For example a1000A electrical switch Apr 232 75,502 board with a 100A load on it. The May 186 63,155 metering system would normally be
provision for businesses to self-supply, Saving money through better exactly what form remains to be seen. should they wish to. proprietary M&T software packages available, not all of them are poor if heating accounts for only a small proportion of the fuel demand. What are degree days and how do you SERIES 14 | MODULE 08 | Metering & Monitoringwater management should be United Utilities and Severn Trent, for The pace of activity as the market designed to provide full M&T analysis. Some software supplied with automatic meter reading A reasonable characteristic line can, however, usually be produced but this does not mean that the heating calculate them?considered in addition to simple volumetric discounts. There could instance, have made it known they will be taking an active role for the last few gears up for competition is hectic. Among the issues to watch over the hardware may do little more than display demand-profile charts and system is operating efficiently, merely that its performance is Degree days can be described as the summation of temperature differences over time and a reflection of the duration and extremity of outdoor temperatures. use. The system accuracy depends very much on the specification and energy used daily, weekly and monthly and methods to allow comparison also be efficiency savings to be years, but it was only in the last few coming months are: consistent with the analysis period. installation of the metering. If the wrong The temperature difference used is that between a fixed reference other energy accounting software against the previous year’s data.
To monitor trends in performance size or type of meter is specified or if temperature and the varying outdoor air temperature. This reference may lack the analytical and target-Where possible it should include a simple bar chart can help to make the meters are wrongly installed then temperature is known as the base temperature which, for buildings, is setting functions discussed above.some typical key ratio’s to allow the comparisons against the previous the system accuracy will suffer badly. the balance point temperature i.e. the outdoor temperature at which the consumption to be compared against year’s consumption patterns, It is estimated that over 30 per cent of heating (or cooling) systems do not need to run in order to maintain comfort Turnkey solutions on o er key operating parameters such as for although this does not account for different weather between the two years if looking at space heating or different production outputs if all installed meters are either wrongly sized or wrongly installed. In most cases the monitoring system has to interface with existing meters many of which are wrongly specified but are uneconomic conditions. Published degree day figures are calculated from daily maximum and minimum air temperatures, using the daily difference between the mean and base temperatures. The daily temperature deficits (for heating) or excess (for cooling) are aggregated over each day, week or month to give a total for Some M&T companies offer turnkey solutions to supply and install all the aM&T components whilst others provide single components example; outside temperature using kWh/degree day, production in kW/ unit of production, sales in kWh/unit of turnover, occupancy in kWh/man hours or kWh/unit of floor area. If used looking at a production process. to replace. the period. The formulae are adjusted to allow for days when the outside air and the end-user assembles the correctly, these key ratios can produce
A better method to represent the Three phase electricity meters temperature falls either side of the base temperature. complete system. This can require a useful information about how well the data to show energy consumption require that the L1, L2 and L3 phase degree of metering and IT expertise energy is being used compared with trends more clearly is to use what is known as CUSUM analysis. CUSUM currents and voltages are correctly identified and wired to the meter correctly in phase. This is often not Fig. 6 Display of site cost breakdown by energy type to piece it all together and there are obvious installation risks and cost previous years and other facilities or departments within the organisation. Normally various graphs can is the usual abbreviation for the the case as the cable colours do not paper invoices. sized at 1000A which will give very be confirmed. value in the energy monitoring system implications to consider. To ensure be produced to show the increase
CUmulative SUM deviation analysis. guarantee that the phases are in the The most basic metering strategy poor accuracy at the actual working Within industry and or energy dashboard read the same. continued meter data integrity the or decrease in corrected energy
CUSUM analysis can also be used correct sequence as the phases. The would be to obtain data from load of 100A. In these circumstances system must be maintained. This manufacturing environments, where consumption.This is especially important when a new to calculate energy targets and cable colours can be swapped within the fiscal meters. However, the a compromise should be reached to processes and site services are often replacement meter is fitted or a meter is typically done through a service In many systems it is also possible savings for energy projects which the wiring network with colours not granularity of this data only provides improve accuracy. The switch should controlled using a SCADA system, it value rolls over back to zero. contract often with additional costs to produce graphs and key ratios using are normalised for factors such as matching the phases resulting in the electricity meters reading low. insights at a site-wide level. For be metered with a smaller range metering system rated at say 250A with for important software updates. is worth investigating the possibility carbon and cost as the criteria as well as kWh. This is becoming more popular If you need to add a number of meters to get to a total then the different weather or production Meters with a pulsed output have smaller premises or sites this might alarm levels set within the metering of integrating metering into the percentage accuracy of each meter An alternative is to outsource the and gives some interesting information figures. There are several references additional potential problems with be as deep as M&T needs to go but systems such that if the actual demand existing SCADA system although will also be added. If poorly specified entire or part of the M&T activity to when comparing fuel types. available which explain in detail contact bounce or missed pulses. This there are advantages to be gained approaches the 250A level in the future additional energy analysis software or installed this overall accuracy could a bureau or energy management Once some historical data has been
CUSUM so this is not covered here. can be avoided if modbus or similar in automating the M&T process and then an alarm would be instigated and is likely to be required. be very poor. It is not recommended to specialist company. These accumulated then it is possible to start
Numerous energy suppliers multi register meters are used where collecting data from additional subnew 1000A metering CT’s could be As noted above for simple add meters together to get to a total. It is providers offer a range of additional looking at energy use using statistical provide online energy monitoring and reporting tools. Using these can the actual meter register is read back and pulses are not counted. In the case of mechanical meters meters to improve coverage and data granularity down to individual fitted. Unfortunately, most electrical and fluid metering systems are installed to meter the maximum capacity of the situations it is feasible to develop M&T software in-house, using the better to measure the main supply and split the main meter output in relation to the percentage of the total supply services beyond energy M&T and carbon reporting such as invoice methods; such as regression analysis and CUSUM to identify trends. Most systems have this capability and also offer a cost-effective first step to such as water or gas the meters are services to give a clearer picture of installation and not the actual load on type of basic spread-sheet analysis by each sub meter. By doing this the validation, tenant billing and energy allow the user to set targets. These identify potential savings to justify almost always oversized or of the how energy is consumed. the system giving large inaccuracies. discussed above. system accuracy is maintained as the procurement. energy targets can be very simple such further investment in a larger M&T wrong type resulting in poor accuracy. In this case the sub-metering Another potential problem is meter However, since proprietary accuracy of the main meter. This is true Monitoring and targeting as using the best historical typical week programme. Some mechanical meters are good for strategy needs to be developed zeroing and rollover. If there is a small software is readily available it may for electrical and fluid metering. provides mechanisms for the long-or typical month’s data as the ongoing continuous flow but very inaccurate to account for areas of significant number of available meter register not be considered cost effective to Once you have installed your term management of energy and target. Whatever targeting method is
Start with spreadsheet For small single sites or buildings, when the flow is intermittent. Correct meter specification and installation is essential if the best accuracy is to be consumption particularly where a clear ‘driving factor’ can be digits on the meter relative to the actual load, then the numbers will rollover very quickly as the register is filled. It is develop bespoke in-house systems. The number of metering points and metering system and have started collecting your data the next objective must be to make the best use of the data. if correctly applied can help save energy and cut costs. However, it is used the accuracy and repeatability of the metering system data is essential to the success of the system. those responsible for energy could achieved. established. For example: important to use the largest numerical the way information is collected In order to do this you must have important to adopt the appropriate It is now very economic to install start with their own spreadsheet Electrical and mechanical system • buildings: sub-metering boilers, register available. does, however, need to be carefully specified the metering and metering level of M&T whether the choice is intelligent metering systems which analysis using electricity supplier metering accuracy is generally a lighting, HVAC and across individual Some monitoring systems allow the considered to avoid the system system correctly and also built in to the bespoke in-house M&T, a turnkey allow the user control their energy half-hourly data or even manual problem as the metering system floor consumption; user to manually enter the actual meter being under-utilised, especially if it software requirement the necessary system or a bureau service. use by knowing exactly how they are meter readings. If proprietary M&T accuracy is normally described as a • industry/manufacturing: subvalues if required, in order that the requires excessive amounts of data targeting and data management The effective application of M&T using their energy and how much it software or an integrated system percentage of full scale. This means that if the meter is oversized then the metering of hot water and steam actual physical meter and the displayed when a few important indicators routines. These should include total provides the cornerstone of any is costing across the various areas of their business. It is always wise to start is preferred it is important to select software that suits the level accuracy will be low. For example, a 3 per cent error on a meter sized for boilers, condensate return, compressed air, ventilation, chilling would suffice. Over-detailed reporting can cause staff to miss or Fig. 5 Display of site daily Co2 generated by electricity consumption. energy management strategy by allowing the energy manager to: small and build up the system by adding meters when they are required to get of analysis and features needed; 100m3/hour of flow will be 3m3/hr. If the as well as process lines; and ignore vital information. • monitor energy consumption and the best results and not metering for the unnecessary sophistication means actual flow rate is only 10m3/hr then the • multi-site portfolios: monitoring The ability to respond quickly is detect avoidable energy waste; sake of it. These systems are generally additional complexity and cost for meter accuracy will be 30 per cent of building services across sites. an important factor in the success • identify unexpected energy use and easy to expand and provided they are the user. The initial challenge for an energy the actual flow rate. Most meters are not truly linear and if operating out with the linear band they will be very inaccurate. A typical building energy management system will to enable responsive and effective remedial action; of any M&T system. Data collection and input should be as near real-time specified and installed correctly will supply many years of reliable data about their business in a simple to manager wishing to implement In many cases the existing system incorporate some form of • help quantify the resulting savings;as feasible and practical. Exception understand manner. It is best to select wide scope M&T is to evaluate the load is very low relative to the installed monitoring function with reports indicating excessive • identify further productive lines of appropriate systems for appropriate availability of data and to develop a capacity of the installation especially customisable dashboard and Fig. 7 Display of site energy costs per student consumption should be generated investigation; uses. A mixture of metering systems can metering strategy. Energy data for where the system has been designed graphical interface alongside the speedily to allow early action and it • provide feedback for staff sometimes be advantageous. a site or organisation might be held in a variety of different locations, systems and formats - spreadsheets, for future expansion. The metering system installed is usually rated at the maximum capacity of the system even though the load is much smaller. real time monitoring and control of building services plant. This could offer a cost-effective M&T solution awareness; • improve target and budget setting; and is necessary for the energy manager to establish how the organisation will respond to whatever the M&T Acknowledgements • CIBSE for technical information in tables building management systems, For example a1000A electrical switch but the ability to perform analytical process highlights. • undertake meaningful • Scotia Energy Ltd for the use of graphs; internet connected devices or even board with a 100A load on it. The functions such as regression should Although there are many and benchmarking. metering system would normally be • The Carbon Trust for use of data.
key dependency, how much water cheaper bills. But with current competing for business come April you use, how many sites you have, SERIES 18 | MODULE 06 | JANUARY 2021 Please mark your answers below by placing a cross in the box. Don't forget that some questions might have more than one correct answer. You may find it helpful to mark the answers in pencil first before filling in the final answers in ink. Once you have completed the answer sheet, return it to the address below. Photocopies are acceptable. METERING & MONITORING ENTRY FORM Energy in Buildings and Industry and the Energy Institute are delighted to have How to obtain a CPD accreditation from the Energy Institute SERIES 18 | MODULE 03 | SEPTEMBER 2020 Please mark your answers below by placing a cross in the box. Don't forget that some questions might have more than one correct answer. You may find it helpful to mark the answers in pencil first before filling in the final answers in ink. Once you have completed the answer sheet, return it to the address below. Photocopies are acceptable. SMART GRIDS ENTRY FORM Energy in Buildings and Industry and the Energy Institute are delighted to have teamed up to bring you this Continuing Professional Development How to obtain a CPD accreditation from the Energy Institute SERIES 17 | MODULE 09 | MARCH2020 Please mark your answers below by placing a cross in the box. Don't forget that some questions might have more than one correct answer. You may find it helpful to mark the answers in pencil first before filling in the final answers in ink. Once you have completed the answer sheet, return it to the address below. Photocopies are acceptable. SPACE HEATING ENTRY FORM Energy in Buildings and Industry and the Energy Institute are delighted to have teamed up to bring you this Continuing Professional Development How to obtain a CPD accreditation from the Energy Institute Metering & Monitoring SERIES 14 | MODULE 08 | Metering & Monitoring indications suggesting retail margins will be 2.5 per cent net, straightforward price discounts will offer relatively thin pickings. Saving money through better water management should be 2017. A number of the large existing companies have made it clear they intend to compete, but even here, in exactly what form remains to be seen. United Utilities and Severn Trent, for how much wastewater you discharge, where you are geographically and many other factors. There is even provision for businesses to self-supply, should they wish to. The pace of activity as the market ■ To monitor every energy stream ■ To produce complicated reports that no-one reads ■ To estimate expected consumption vs actual consumption to identify over or under consumption. 7) Which of the following is not a key component of aM&T? ■ Energy meters ■ Automatic meter reading systems ■ Data analysis and reporting software ■ Hardwired connection between each meter and the PC running the software 8) Which of the following is not likely to be the most important driving factor for linear regression analysis? ■ Number of staff employed in a plastic extrusion plant. ■ Production output in tonnes per day for an aluminium production facility ■ Number of heating degree days for a space heating boiler ■ Hours of darkness for a large external lighting scheme. 9) In the formula describing the characteristic line what does the constant ‘c’ represent? ■ Increase in consumption per unit increase in the driving factor ■ Energy base load ■ Number of degree days ■ Monthly energy consumption. 10) What is the significance of factors such as production volume or number of degree days for activity-based M&T? ■ They introduce noise into the data which impedes analysis ■ Raw consumption data must be adjusted to eliminate their distorting effect ■ They are normally the factor driving energy consumption ■ They can usually be ignored. 1) What step in the M&T process achieves energy savings? ■ Collection energy consumption data ■ Reporting the consumption data ■ Taking action based on the output results from M&T ■ Analysing the data to determine results. 2) Output from the M&T process will help the energy manager in several ways. Which of the following is not one of the most direct benefits? ■ Detecting avoidable energy waste that might otherwise remain hidden. ■ Prompting action by identifying unexpected patterns of consumption. ■ Improving energy budget setting ■ Developing the energy policy 3) Which of the following is not one of the four basic stages in the M&T process? ■ Data collection ■ Data analysis ■ Calculating an energy benchmark ■ Communicating results 4) What is aM&T? ■ Automatic collection of data ■ Automatic setting of targets ■ Automatic analysis of data ■ Automatic collection and analysis of data. 5) What does AMR stand for? ■ Automatic monthly reading ■ Automatic metering reading ■ Automatic metering ratio ■ Accredited meter register 6) Which of the following is a fundamental requirement of any M&T scheme? ■ To interface with fiscal meters only QUESTIONS teamed up to bring you this Continuing Professional Development initiative. This is the sixth module in the eighteenth series and focuses on Metering & Monitoring. It is accompanied by a set of multiple-choice questions. To qualify for a CPD certificate readers must submit at least eight of the ten sets of questions from this series of modules to EiBI for the Energy Institute to mark. Anyone achieving at least eight out of ten correct answers on eight separate articles qualifies for an Energy Institute CPD certificate. This can be obtained, on successful completion of the course and notification by the Energy Institute, free of charge for both Energy Institute members and non-members. The articles, written by a qualified member of the Energy Institute, will appeal to those new to energy management and those with more experience of the subject. Modules from the past 17 series can be obtained free of charge. Send your request to editor@eibi.co.uk. Alternatively, they can be downloaded from the EiBI website: www.eibi.co.uk SERIES 17 MAY 2019 - APR 2020 1 Batteries & Storage 2 Energy as a Service 3 Water Management 4 Demand Side Response 5 Drives & Motors 6 Blockchain Technology 7 Compressed Air 8 Energy Purchasing 9 Space Heating 10 Data Centre Management SERIES 18 MAY / JUNE 2020 - MAY 2021 1 Energy Efficiency Legislation 2 Building Controls 3 Smart Grids 4 Lighting Technology 5 Heat Pumps 6 Metering & Monitoring 7 Air Conditioning* 8 Boilers & Burners* 9 Behaviour Change* 10 Combined Heat & Power* * ONLY available to download from the website after publication date Terms: in submitting your completed answers you are indicating consent to EiBI’s holding and processing the personal data you have provided to us, in accordance with legal bases set out under data protection law. Further to this, EiBI will share your details with the Energy Institute (EI) with whom this CPD series is run in contractual partnership. The EI will process your details for the purposes of marking your answers and issuing your CPD certificate. Your details will be kept securely at all times and in a manner complaint with all relevant data protection laws. For full ■ Facilitate the connection of distributed renewable generation and variable loads such as electric vehicles and heat pumps 7) What does the abbreviation VPP stand for? ■ Volume purchase programme ■ Voluntary protection programme ■ Virtual power plant 8) Electricity cannot be stored in large quantities by householders? ■ False as only large utilities and industrial/ commercial energy providers can provide storage facilities ■ False ■ True as householders can store electricity in standalone batteries or when charging their electric vehicles 9) What is the main benefit of smart meters? ■ They avoid the need for meter readers ■ They provide accurate and timely information on power flows across the smart grid ■ They facilitate the export of surplus electricity from household solar PV panels 10) What does the technology VtG represent? ■ Variable Geometry Turbochargers - designed to allow the effective aspect ratio of a turbocharger to be altered as conditions change ■ Volume of Trapped Gas associated with respiration ■ Vehicle to Grid enabling EV batteries to discharge to the grid to ‘smooth’ high electricity peak demand profiles. 1) The establishment of the main transmission grid began in which decade? ■ 1940s ■ 1930s ■ 1960s 2) Which key parameters need to be controlled by smart grids? ■ Voltage and frequency ■ Frequency and current ■ Voltage, current and frequency 3) What’s the main source of large-scale renewable generation connecting to the grid? ■ Biomass ■ Wind farms ■ Solar farms 4) What are the main forms of variable electrical loads connecting at the household level? ■ Electric vehicles and heat pumps ■ Smart meters ■ Home automation devices 5) What is the main threat to smart grids? ■ Cost of implementation ■ Cyber attacks ■ Lack of experience and expertise 6) What are the main benefits of smart grids? ■ Reduce the need for centralised power generation ■ Encourage connection of electric vehicles QUESTIONS initiative. This is the third module in the eighteenth series and focuses on Smart Grids. It is accompanied by a set of multiple-choice questions. To qualify for a CPD certificate readers must submit at least eight of the ten sets of questions from this series of modules to EiBI for the Energy Institute to mark. Anyone achieving at least eight out of ten correct answers on eight separate articles qualifies for an Energy Institute CPD certificate. This can be obtained, on successful completion of the course and notification by the Energy Institute, free of charge for both Energy Institute members and non-members. The articles, written by a qualified member of the Energy Institute, will appeal to those new to energy management and those with more experience of the subject. Modules from the past 16 series can be obtained free of charge. Send your request to editor@eibi.co.uk. Alternatively, they can be downloaded from the EiBI website: www.eibi.co.uk SERIES 17 MAY 2019 - APR 2020 1 Batteries & Storage 2 Energy as a Service 3 Water Management 4 Demand Side Response 5 Drives & Motors 6 Blockchain Technology 7 Compressed Air 8 Energy Purchasing 9 Space Heating 10 Data Centre Management SERIES 18 MAY / JUNE 2020 - MAY 2021 1 Energy Efficiency Legislation 2 Building Controls 3 Smart Grids 4 Lighting Technology* 5 Heat Pumps* 6 Metering & Monitoring* 7 Air Conditioning* 8 Boilers & Burners* 9 Behaviour Change* 10 Combined Heat & Power* * ONLY available to download from the website after publication date Name ......................................................................................................................................................................... (Mr. Mrs, Ms) .................................... Business.................................................................................................................................................................................................................................... Please complete your details below in block capitals Terms: in submitting your completed answers you are indicating consent to EiBI’s holding and processing the personal data you have provided to us, in accordance with legal bases set out under data protection law. Further to this, EiBI will share your details with the Energy Institute (EI) with whom this CPD series is run in contractual partnership. The EI will process your details for the purposes of marking your answers and issuing your CPD certificate. Your details will be kept securely at all times and in a manner complaint with all relevant data protection laws. For full 6. Which is the ‘delivery end’ of a vapour compression heat pump system? ■ The evaporator ■ The condenser ■ The compressor ■ The slinky 7. Which of these factors is used by a weather compensation control system? ■ Building thermal inertia ■ Time of day ■ Outside air temperature ■ Date 8. Which of these factors is used by an optimum start control system? ■ Level of building occupancy ■ Outside air temperature ■ Boiler capacity ■ Boiler flow temperature 9. Which types of space heating system can building management systems be used to control? ■ Any ■ Wet systems ■ Air handling plant ■ Boilers 10. What is a thermostat? ■ A temperature sensitive switch ■ A temperature sensor ■ A proportional control device ■ A digital display device 1. Which is the most common heating media in wet systems? ■ High temperature hot water ■ Steam ■ Low temperature hot water ■ Cold water 2. What is the most common space heating fuel in the UK? ■ Fuel oil ■ Electricity ■ Natural gas ■ Coal 3. What is a typical dry bulb space temperature for a home? ■ 160C ■ 190C ■ 220C ■ 240C 4. What is currently the most common construction material for panel radiators? ■ Cast iron ■ Pressed steel ■ Cast aluminium ■ Copper 5. Which of these is a key component of a mechanical ventilation system? ■ A fan ■ An atrium ■ A chimney ■ Opening windows QUESTIONS initiative. This is the ninth module in the seventeenth series and focuses on Space Heating. It is accompanied by a set of multiple-choice questions. To qualify for a CPD certificate readers must submit at least eight of the ten sets of questions from this series of modules to EiBI for the Energy Institute to mark. Anyone achieving at least eight out of ten correct answers on eight separate articles qualifies for an Energy Institute CPD certificate. This can be obtained, on successful completion of the course and notification by the Energy Institute, free of charge for both Energy Institute members and non-members. The articles, written by a qualified member of the Energy Institute, will appeal to those new to energy management and those with more experience of the subject. Modules from the past 16 series can be obtained free of charge. Send your request to editor@eibi.co.uk. Alternatively, they can be downloaded from the EiBI website: www.eibi.co.uk SERIES 16 MAY 2018 - APR 2019 1 BEMS 2 Refrigeration 3 LED Technology 4 District Heating 5 Air Conditioning 6 Behaviour Change 7 Thermal Imaging 8 Solar Thermal 9 Smart Buildings 10 Biomass Boilers SERIES 17 MAY 2019 - APR 2020 1 Batteries & Storage 2 Energy as a Service 3 Water Management 4 Demand Side Response 5 Drives & Motors 6 Blockchain Technology 7 Compressed Air 8 Energy Purchasing 9 Space Heating 10 Data Centre Management* * ONLY available to download from the website after publication date Name ......................................................................................................................................................................... (Mr. Mrs, Ms) .................................... Business.................................................................................................................................................................................................................................... Please complete your details below in block capitals Terms: in submitting your completed answers you are indicating consent to EiBI’s holding and processing the personal data you have provided to us, in accordance with legal bases set out under data protection law. Further to this, EiBI will share your details with the Energy Institute (EI) with whom this CPD series is run in contractual partnership. The EI will process your details for the purposes of marking your answers and issuing your CPD certificate. Your details will be kept securely at all times and in a manner complaint with all relevant data protection laws. For full use. The system accuracy depends very much on the specification and installation of the metering. If the wrong size or type of meter is specified or if the meters are wrongly installed then the system accuracy will suffer badly. It is estimated that over 30 per cent of all installed meters are either wrongly sized or wrongly installed. In most cases the monitoring system has to interface with existing meters many of which are wrongly specified but are uneconomic to replace. Three phase electricity meters require that the L1, L2 and L3 phase currents and voltages are correctly identified and wired to the meter correctly in phase. This is often not the case as the cable colours do not guarantee that the phases are in the correct sequence as the phases. The cable colours can be swapped within the wiring network with colours not matching the phases resulting in the electricity meters reading low. Meters with a pulsed output have additional potential problems with contact bounce or missed pulses. This can be avoided if modbus or similar multi register meters are used where the actual meter register is read back and pulses are not counted. In the case of mechanical meters such as water or gas the meters are almost always oversized or of the wrong type resulting in poor accuracy. Some mechanical meters are good for continuous flow but very inaccurate when the flow is intermittent. Correct meter specification and installation is essential if the best accuracy is to be achieved. energy used daily, weekly and monthly and methods to allow comparison against the previous year’s data. Where possible it should include some typical key ratio’s to allow the consumption to be compared against key operating parameters such as for example; outside temperature using kWh/degree day, production in kW/ unit of production, sales in kWh/unit of turnover, occupancy in kWh/man hours or kWh/unit of floor area. If used correctly, these key ratios can produce useful information about how well the energy is being used compared with previous years and other facilities or departments within the organisation. Normally various graphs can be produced to show the increase or decrease in corrected energy consumption. In many systems it is also possible to produce graphs and key ratios using carbon and cost as the criteria as well as kWh. This is becoming more popular and gives some interesting information when comparing fuel types. Once some historical data has been accumulated then it is possible to start looking at energy use using statistical methods; such as regression analysis and CUSUM to identify trends. Most systems have this capability and also allow the user to set targets. These energy targets can be very simple such as using the best historical typical week or typical month’s data as the ongoing target. Whatever targeting method is used the accuracy and repeatability of the metering system data is essential to the success of the system. It is now very economic to install sized at 1000A which will give very poor accuracy at the actual working load of 100A. In these circumstances a compromise should be reached to improve accuracy. The switch should be metered with a smaller range metering system rated at say 250A with alarm levels set within the metering systems such that if the actual demand approaches the 250A level in the future then an alarm would be instigated and new 1000A metering CT’s could be fitted. Unfortunately, most electrical and fluid metering systems are installed to meter the maximum capacity of the installation and not the actual load on the system giving large inaccuracies. Another potential problem is meter zeroing and rollover. If there is a small number of available meter register digits on the meter relative to the actual load, then the numbers will rollover very quickly as the register is filled. It is important to use the largest numerical value in the energy monitoring system or energy dashboard read the same. This is especially important when a new replacement meter is fitted or a meter value rolls over back to zero. If you need to add a number of meters to get to a total then the percentage accuracy of each meter will also be added. If poorly specified or installed this overall accuracy could be very poor. It is not recommended to add meters together to get to a total. It is better to measure the main supply and split the main meter output in relation to the percentage of the total supply by each sub meter. By doing this the system accuracy is maintained as the accuracy of the main meter. This is true for electrical and fluid metering. Once you have installed your metering system and have started collecting your data the next objective must be to make the best use of the data. In order to do this you must have Fig. 6 Display of site cost breakdown by energy type considered in addition to simple volumetric discounts. There could also be efficiency savings to be instance, have made it known they will be taking an active role for the last few years, but it was only in the last few gears up for competition is hectic. Among the issues to watch over the coming months are: PLEASE COMPLETE YOUR DETAILS BELOW IN BLOCK CAPITALS Business Address .................................................................................................................................................................................................................Business Address ................................................................................................................................................................................................................. Electrical and mechanical system details on the EI’s privacy policy please visit www.energyinst.org/privacy. details on the EI’s privacy policy please visit www.energyinst.org/privacy. details on the EI’s privacy policy please visit www.energyinst.org/privacy.register available. specified the metering and metering intelligent metering systems which Name ......................................................................................................................................................................... (Mr. Mrs, Ms) ............................................................................................................................................................................................................................................................................................ ........................................................................................................................................................................................................................................................ metering accuracy is generally a problem as the metering system accuracy is normally described as a • To hear more from the EI subscribe to our mailing list: visit https://myprofile. energyinst.org/EmailPreferences/Subscribe • To hear more from the EI subscribe to our mailing list: visit https://myprofile. energyinst.org/EmailPreferences/Subscribe • To hear more from the EI subscribe to our mailing list: visit https://myprofile. energyinst.org/EmailPreferences/Subscribe allow the user control their energy use by knowing exactly how they are using their energy and how much it Some monitoring systems allow the user to manually enter the actual meter values if required, in order that the system correctly and also built in to the software requirement the necessary targeting and data management Business.................................................................................................................................................................................................................................... ........................................................................................................................................................................................................................................................ ........................................................................................................................................................................................................................................................ percentage of full scale. This means that if the meter is oversized then the actual physical meter and the displayed routines. These should include total is costing across the various areas of their business. It is always wise to start Business Address ................................................................................................................................................................................................................. .................................................................................................................................. Post Code .............................................................................................. .................................................................................................................................. Post Code .............................................................................................. accuracy will be low. For example, a 3 per cent error on a meter sized for Fig. 5 Display of site daily Co2 generated by electricity consumption. small and build up the system by adding meters when they are required to get 100m3/hour of flow will be 3m3/hr. If the the best results and not metering for the ........................................................................................................................................................................................................................................................ email address .........................................................................................................................................................................................................................email address ......................................................................................................................................................................................................................... actual flow rate is only 10m3/hr then the sake of it. These systems are generally meter accuracy will be 30 per cent of easy to expand and provided they are ........................................................................................................................................................................................................................................................ Tel No. .........................................................................................................................................................................................................................................Tel No. .........................................................................................................................................................................................................................................the actual flow rate. Most meters are not specified and installed correctly will truly linear and if operating out with the supply many years of reliable data linear band they will be very inaccurate. about their business in a simple to .................................................................................................................................. Post Code ..............................................................................................Completed answers should be mailed to: Completed answers should be mailed to:In many cases the existing system understand manner. It is best to select The Education Department, Energy in Buildings & Industry, P.O. Box The Education Department, Energy in Buildings & Industry, P.O. Box load is very low relative to the installed appropriate systems for appropriate email address .........................................................................................................................................................................................................................825, GUILDFORD, GU4 8WQ. Or scan and e-mail to editor@eibi.co.uk. All 825, GUILDFORD, GU4 8WQ. Or scan and e-mail to editor@eibi.co.uk. All capacity of the installation especially Fig. 7 Display of site energy costs per student uses. A mixture of metering systems can modules will then be supplied to the Energy Institute for marking modules will then be supplied to the Energy Institute for markingwhere the system has been designed sometimes be advantageous. Tel No. ......................................................................................................................................................................................................................................... for future expansion. The metering system installed is usually rated at Acknowledgements COMPLETED ANSWERS SHOULD BE MAILED TO: the maximum capacity of the system • CIBSE for technical information in The Education Department, Energy in Buildings & Industry, P.O. Box 825, GUILDFORD, GU4 8WQ. Or scan and e-mail to editor@eibi.co.uk. All modules will Produced in Association with Produced in Association with even though the load is much smaller. For example a1000A electrical switch tables • Scotia Energy Ltd for the use of graphs; then be supplied to the Energy Institute for markingboard with a 100A load on it. The and metering system would normally be • The Carbon Trust for use of data.

20 | ENERGY IN BUILDINGS & INDUSTRY | SEPTEMBER 202024 | ENERGY IN BUILDINGS & INDUSTRY | MARCH 2020 Produced in Association with
Stuart Bratton is applications manager at Danfoss Drives
Drives & Motors
For further information on Danfoss Drives visitwww.eibi.co.uk/enquiriesand enter ENQUIRY No. 128
Why harmonics matter so much
With electrical systems come harmonics. But what are harmonics, where do they come from and why should we be so concerned about them? Stuart Bratton has the answers
In a perfect world, if you looked at the current and voltage waveforms in the electrical supply network, they would be perfect sine waves at the supply frequency, which is usually either 50Hz or 60Hz, depending on where in the world you live. In reality however, those waveforms are almost never perfect sine waves – they are almost always distorted to a greater or lesser extent.
And that distortion, provided that it’s periodic, can be described in terms of harmonics.
In fact, any repetitive waveform can be built up from a sine wave at the fundamental frequency, to which
‘harmonics’ are added. These are simply sine waves with frequencies that are whole-number multiples of the fundamental frequency.
In electrical power systems, the fundamental frequency is the supply frequency. For simplicity we’ll take that to be 50Hz, but all of the arguments work just as well for 60Hz or any other supply frequency.
So any distorted waveform on a 50Hz system can be described as a sine wave at 50Hz, which is the fundamental, plus another at 100Hz (2 x 50Hz), which is the second order harmonic; another at 150Hz (3 x 50Hz), which is the third order harmonic; another at 200Hz (4 x 50Hz), which is the fourth order harmonic; and so on.
In theory, the harmonic orders go on forever but, in practice, as the harmonic order increases the level of the harmonic usually falls so high order harmonics can often be ignored. But not always! There are circumstances where it may be necessary to take account of harmonics up to the 100th order, e.g. 100 x 50Hz or 5000Hz.
It is, of course, impossible to look at a supply waveform and decide ‘by eye’ which harmonics are present, except in a very approximate way, and only then after much practice.
Fortunately, there is a mathematical technique – known as a Fourier
Transform – which changes the familiar waveform display into a frequency spectrum.
On the screen of an instrument used for measuring harmonics, this spectrum typically looks like a series of spikes, one for each harmonic. The height of the spike shows the level of the harmonic that’s present in the waveform under investigation. Some instruments also provide a digital readout of the level of each harmonic, either as a percentage or as a voltage or current.
The origin of harmonics Where do harmonics come from? The short answer is that they’re produced by non-linear loads connected to the supply system. A non-linear load is any load that draws a non-sinusoidal current from the supply. There are many examples including office equipment such as power supplies for computers and printers, fluorescent lighting, battery chargers, welding equipment and variable speed drives.
Typically, you can expect any piece of equipment that produces DC from an AC supply to produce harmonics, but the mix of harmonics depends on the type of load. An unbalanced non-linear three-phase load generates even-order harmonics (second, fourth, sixth, eighth and so on), whereas single-phase non-linear loads like computer power supplies generate harmonics with orders that are odd multiples of three (third, ninth, fifteenth and so on). These are often called the ‘triplen’ or ‘zero sequence’ harmonics.
Balanced three-phase non-linear loads like variable speed drives generate odd-order harmonics but those that are multiples of three cancel out. This leaves harmonics of the fifth, seventh, eleventh, thirteenth, seventeenth orders etc.
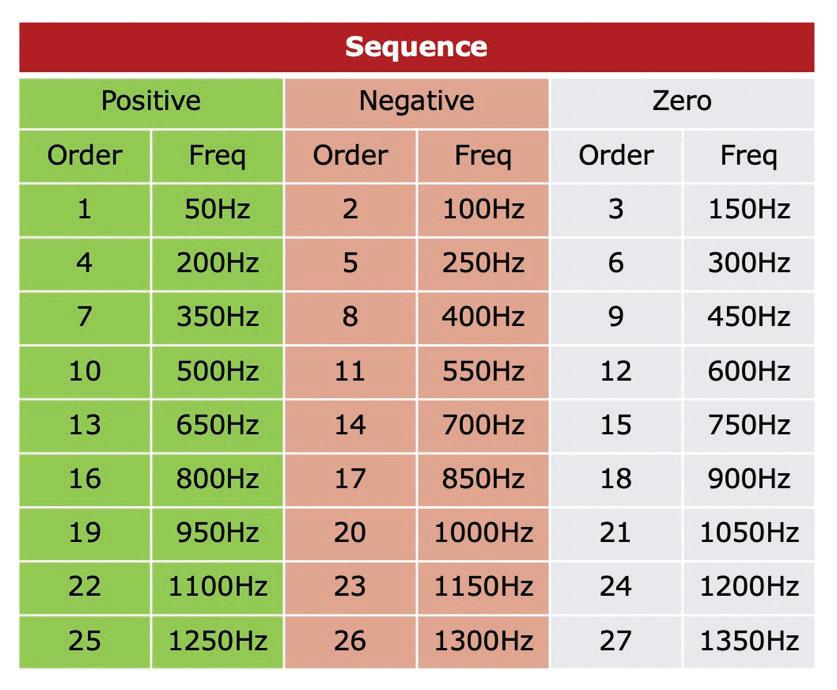
In three-phase systems, harmonics ‘rotate’ just like the supply phases. They can rotate in the same direction as the supply phases, when they are known as positive sequence harmonics; in the opposite direction to the supply phases, when they are known as negative sequence harmonics; or they can be stationary (not rotating at all) when they are known as zero sequence harmonics. The table below shows the directions of rotation for harmonic orders up to the 27th.
Depending on their direction of rotation, harmonics produce very different effects. For example, negative sequence harmonics tend to reduce the torque of three-phase motors, which can lead to problems if a heavily loaded motor is started direct on line. Positive and negative sequence harmonics sum to zero and produce no current in the neutral of a three-phase installation, but zero-sequence harmonics add to each other, producing a neutral current that is three times that of the harmonic current in each of the phases. This is a common cause of unexpected and, of course, unwanted heating in neutral conductors.
So why do they matter? In fact, we have already mentioned two reasons: they can reduce the torque capacity of motors and they can lead to excessive heating in neutral conductors. They can also have many other deleterious effects such as preventing the correct operation of electronic equipment, reducing the working capacity or potentially overloading power transformers, tripping circuit breakers, making lights flicker and even increasing energy bills.
The important takeaway message is that in power systems, harmonics are always undesirable.
Drives & Motors
For further information on products and services visit www.eibi.co.uk/enquiries and enter the appropriate online enquiry number
Research into 3D printing to lead to lighter motors
VTT Technical Research Centre of Finland is leading a European consortium 3DREMAG which is developing a new material suitable for 3D printing of permanent magnets, which can be utilised in electric and hybrid vehicle motors. The aim in the long run is to develop a fully 3D printable electric motor, one that would be approximately 30 per cent lighter than today’s motors.
The new permanent magnet material being developed for this purpose will promote cleaner traffic and help reduce the environmental impact of traffic. The global number of electric cars is expected to reach 125m by 2030.
More than 90 per cent of electric vehicle motors are based on permanent magnets, which provide high power in small volume. Unlike electromagnets which require continuous electrical current in order to maintain their magnetism, permanent magnets do not require an external magnetic field. The strongest permanent magnets are based on a combination of neodymium, iron and boron (Nd-Fe-B). Today, the production of fully dense permanent magnets is limited to simple shapes. The Nd-Fe-B powder developed under the 3DREMAG project will enable the production of magnets through 3D printing. 3D printing can be used to optimize the size of magnets and to improve resource efficiency. This is important because neodymium is a rare raw material with limited availability. Nd-Fe-B powder can be used to produce fully dense metallic and resource-efficient permanent magnets for electric and hybrid vehicle motors, electric bicycles and consumer electronics, as well as for wind turbine generators.
“In the long run, our goal is to construct a fully 3D printable electric motor that would be approximately 30 per cent lighter than today’s motors. Achieving this goal requires multidisciplinary cooperation and combining different technologies,” says Joni Reijonen, research scientist and project manager at VTT.
VSDs offer ventilation specifiers a holistic solution
Ventilation specifiers can access fully compliant high-temperature fan packages complete with a variable speed drive (VSD), according to Elta Fans’ Applied Technology division.
By testing its high-performance smoke fans alongside various VSDs in accordance with BS EN12101-3:2015, the division aims to offer the market a more competitive holistic solution.
Elta Fans is hoping to develop highly efficient impellers that provide an economic way of moving high volumes of air at low to medium pressures. By incorporating the VSD with the fan itself, system specifiers and designers are offered a streamlined approach to compliance.
The highly fans were tested at BSRIA’s testing facility in Bracknell, for F300 (300°C 2Hr) and F400 (400°C 2Hr). Having the fans running with VSD during the test means that the fans and VSD can be used together without the need for bypassing or fitting filters to the VSD in fire mode.
Bradley Crisp, applied technology sales engineer at Elta Fans Applied Technology said: “With urbanisation becoming an unrelenting trend across Europe, the limitation for space is leading to the construction of more midrise to high-rise buildings. In turn, this is driving an increase in demand for highperformance equipment compliant with stringent government regulations to ensure the safety of people and property. While there are different ways to ensure the systems are compliant, the most effective and optimal way for our customers is for our fans and VSDs to be tested together, hence why we have sought the BSI accreditation.”
ONLINE ENQUIRY 129
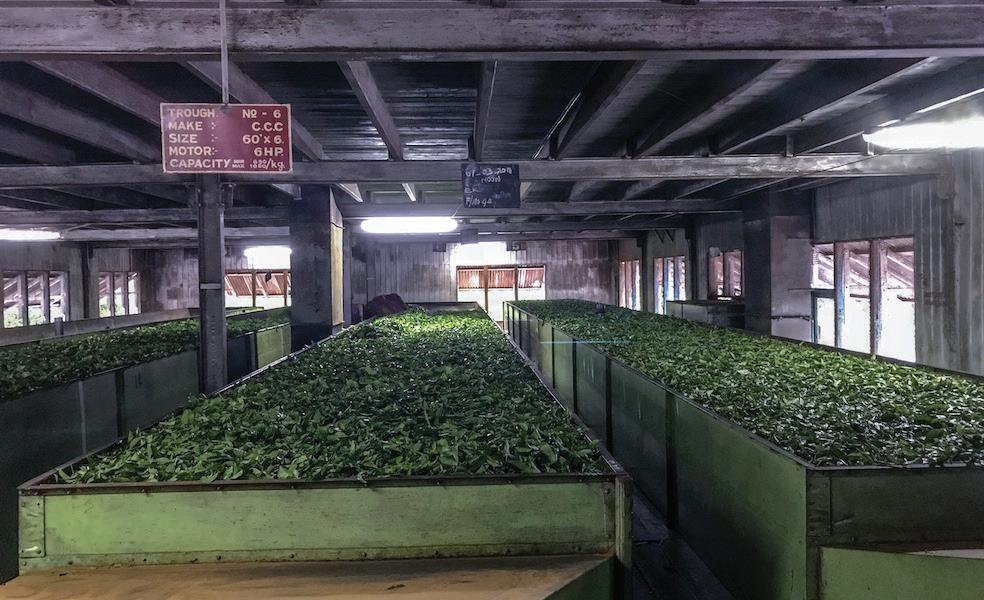
Drives help cut costs for Sri Lanka’s tea production process
Nearly 50 per cent of energy consumption in Sri Lanka’s tea manufacturing is through the withering process – the method used for drying tea leaves.
The costs of this process have been almost halved in many cases, along with the industry’s impact on the environment, thanks to the use of variable frequency drive technology.
In 2018 hundreds of Invertek’s Optidrive Eco drives were installed and commissioned in many tea plantations throughout the country as part of a project, led by the Sri Lanka Sustainable Energy Authority, to reduce greenhouse gas emissions through greater efficiencies.
Tea withering uses fans to remove moisture from the black tea leaves, drying them up to 40 or 50 per cent during a 12 to 18-hour period.
Previously, fans would run at a constant speed blowing air through dampers to dry the leaves. The dampers would be manually controlled to adjust the airflow. The introduction of the drives meant the airflow could be controlled more accurately and efficiently by varying the fan speed rather than adjusting the dampers. This considerably reduced energy usage.
Working with Invertek’s sales partner in Sri Lanka, Hayleys Aventura Pvt. Ltd, the existing starters were replaced with the Optidrive Eco drives.
“The quality of the produced tea will mainly depend on the withering process. Withering troughs use DOL or Star/Delta Starters to start its fan and use dampers to control the air flow to obtain the withering of tea leaf in the existing system,” said Anushka Chandrasoma, assistant manager, Hayleys Aventura Pvt. Ltd.
“While replacing the traditional starter with VFDs, operators can control the airflow by reducing the fan speed through a VFD, which enables savings of around 20-25 per cent of the energy used in the withering process. We used Optidrive Eco VFD’s with IP66 enclosures, which have the maximum protection against dust and water.”